UNITED STATES
SECURITIES AND EXCHANGE COMMISSION
Washington, D.C. 20549
FORM N-CSR
CERTIFIED SHAREHOLDER REPORT OF REGISTERED
MANAGEMENT INVESTMENT COMPANIES
Investment Company Act file number | 811-04347 | ||||||
| |||||||
GMO Trust | |||||||
(Exact name of registrant as specified in charter) | |||||||
| |||||||
40 Rowes Wharf, Boston, MA |
| 02110 | |||||
(Address of principal executive offices) |
| (Zip code) | |||||
| |||||||
Scott E. Eston, Chief Executive Officer, 40 Rowes Wharf, Boston, MA 02110 | |||||||
(Name and address of agent for service) | |||||||
| |||||||
Registrant’s telephone number, including area code: | 617-346-7646 |
| |||||
| |||||||
Date of fiscal year end: | 02/29/08 |
| |||||
| |||||||
Date of reporting period: | 02/29/08 |
| |||||
Item 1. Reports to Stockholders.
The annual reports for each series of the registrant for the periods ended February 29, 2008 are filed herewith.
GMO Developed World Stock Fund
(A Series of GMO Trust)
Annual Report
February 29, 2008
For a free copy of the Fund's proxy voting guidelines, shareholders may call 1-617-346-7646 (collect), visit our website at www.gmo.com, or visit the Securities and Exchange Commission's website at www.sec.gov. Information regarding how the Fund voted proxies relating to portfolio securities during the most recent 12-month period ended June 30 is available on our website at www.gmo.com, or on the Securities and Exchange Commission's website at www.sec.gov.
The Fund files its complete schedule of portfolio holdings with the Securities and Exchange Commission for the first and third quarter of each fiscal year on Form N-Q, which is available on the Commission's website at www.sec.gov. The Fund's Form N-Q may be reviewed and copied at the Commission's Public Reference Room in Washington, D.C. Information on the operation of the Public Reference Room may be obtained by calling 1-800-SEC-0330. The Fund has a policy with respect to disclosure of portfolio holdings under which it may also make available on GMO's website (www.gmo.com) a complete schedule of portfolio holdings.
This report is prepared for the general information of shareholders. It is authorized for distribution to prospective investors only when preceded or accompanied by a prospectus for the GMO Trust.
GMO Developed World Stock Fund
(A Series of GMO Trust)
Portfolio Managers
Day-to-day management of the Fund's portfolio is the responsibility of the International Quantitative team at Grantham, Mayo, Van Otterloo & Co. LLC.
Management Discussion and Analysis of Fund Performance
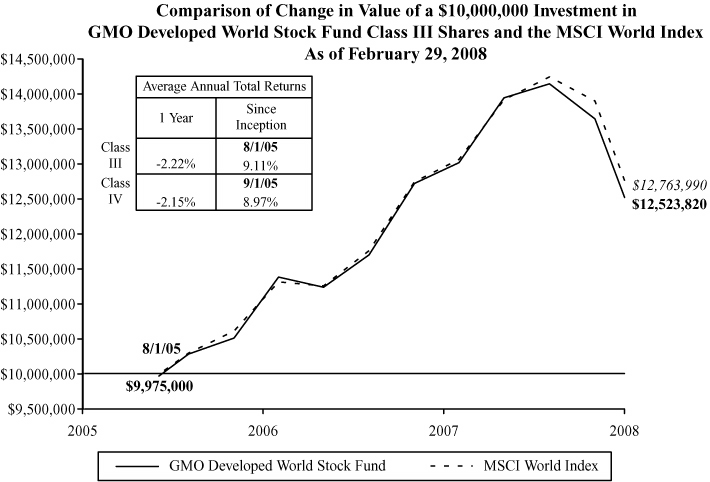
The Class III shares of the GMO Developed World Stock Fund returned -1.7% for the fiscal year ended February 29, 2008, as compared to -0.5% for the MSCI World Index. The Fund was invested substantially in global equity securities throughout the period.
Stock selection had a negative impact on relative performance. Holdings Royal Bank of Scotland, U.S.-based Countrywide Financial, and Home Depot underperformed and were among the most significant detractors from returns. Among the contributors were holdings in U.S. oil companies ConocoPhillips and Chevron, and German automaker Volkswagen, all of which outperformed.
Among GMO's global quantitative stock selection disciplines, only stocks ranked highly by momentum outperformed significantly. Those stocks favored by quality-adjusted value or intrinsic value underperformed.
Country allocation had minimal impact on relative performance. Among country positions, the positive impact of our overweight to Germany was largely offset by the negative impact from our underweight to Canada.
Currency allocation had a positive impact on relative performance as an underweight in the U.S. dollar and an overweight in the Swiss franc added value. The U.S. dollar weakened relative to most foreign currencies, which boosted returns for U.S. investors. The MSCI World Index returned almost 6% more in U.S. dollar terms than in local currency.
Sector weightings had a slight positive impact on performance relative to the index. During the period, an overweight to Energy and an underweight to Financials helped while underweights to Consumer Staples and Materials detracted.
The views expressed herein are exclusively those of Grantham, Mayo, Van Otterloo & Co. LLC Management as of the date of this report and are subject to change. GMO disclaims any responsibility to update such views. They are not meant as investment advice. References to specific securities are not recommendations of such securities and may not be representative of any GMO portfolio's current or future investments.
Performance data quoted represents past performance and is not indicative of future results. The investment return and principal value of an investment will fluctuate so that an investor's shares, when redeemed, may be worth more or less than their original cost. Current performance data may be lower or higher than the performance data provided herein. To obtain performance information to the most recent month-end, visit www.gmo.com. Performance shown is net of all fees after reimbursement from the Manager. Each performance figure assumes a purchase at the beginning and redemption at the end of the stated period and reflects a transaction fee of .25% on the purchase and .25% on the redemption. Transaction fees are retained by the Fund to cover trading costs. Returns would have been lower had certain expenses not been reimbursed during the periods shown and do not include the effect of taxes on distributions and redemptions. All information is unaudited. Performance for Class IV will vary due to different fees.
GMO Developed World Stock Fund
(A Series of GMO Trust)
Investments Concentration Summary
February 29, 2008 (Unaudited)
| Asset Class Summary | % of Total Net Assets | ||||||
| Common Stocks | 95.0 | % | |||||
| Short-Term Investments | 4.2 | ||||||
| Preferred Stocks | 0.5 | ||||||
| Forward Currency Contracts | 0.4 | ||||||
| Futures | (0.5 | ) | |||||
| Other | 0.4 | ||||||
| 100.0 | % | ||||||
| Country Summary | % of Equity Investments | ||||||
| United States | 47.9 | % | |||||
| United Kingdom | 12.0 | ||||||
| Japan | 9.7 | ||||||
| France | 7.3 | ||||||
| Germany | 5.9 | ||||||
| Singapore | 3.1 | ||||||
| Italy | 2.3 | ||||||
| Netherlands | 2.1 | ||||||
| Switzerland | 1.9 | ||||||
| Finland | 1.5 | ||||||
| Hong Kong | 1.4 | ||||||
| Australia | 1.4 | ||||||
| Canada | 1.3 | ||||||
| Belgium | 0.8 | ||||||
| Norway | 0.6 | ||||||
| Spain | 0.4 | ||||||
| Sweden | 0.2 | ||||||
| Ireland | 0.2 | ||||||
| 100.0 | % | ||||||
1
GMO Developed World Stock Fund
(A Series of GMO Trust)
Investments Concentration Summary — (Continued)
February 29, 2008 (Unaudited)
| Industry Sector Summary | % of Equity Investments | ||||||
| Financials | 18.3 | % | |||||
| Energy | 13.9 | ||||||
| Health Care | 13.5 | ||||||
| Industrials | 12.0 | ||||||
| Consumer Discretionary | 10.7 | ||||||
| Information Technology | 9.4 | ||||||
| Consumer Staples | 7.8 | ||||||
| Materials | 7.4 | ||||||
| Utilities | 4.1 | ||||||
| Telecommunication Services | 2.9 | ||||||
| 100.0 | % | ||||||
2
GMO Developed World Stock Fund
(A Series of GMO Trust)
Schedule of Investments
(showing percentage of total net assets)
February 29, 2008
| Shares | Description | Value ($) | |||||||||||||
| COMMON STOCKS — 95.0% | |||||||||||||||
| Australia — 1.3% | |||||||||||||||
| 52,039 | BHP Billiton Ltd | 1,882,917 | |||||||||||||
| 12,925 | Commonwealth Bank of Australia | 500,506 | |||||||||||||
| 196,337 | Qantas Airways Ltd | 763,598 | |||||||||||||
| 482,886 | Telstra Corp Ltd | 2,170,757 | |||||||||||||
| 27,889 | Woodside Petroleum Ltd | 1,458,359 | |||||||||||||
| Total Australia | 6,776,137 | ||||||||||||||
| Belgium — 0.8% | |||||||||||||||
| 5,499 | Belgacom SA | 263,358 | |||||||||||||
| 65,157 | Dexia | 1,531,846 | |||||||||||||
| 59,770 | Fortis | 1,320,464 | |||||||||||||
| 11,684 | Inbev NV | 1,056,014 | |||||||||||||
| Total Belgium | 4,171,682 | ||||||||||||||
| Canada — 1.2% | |||||||||||||||
| 17,464 | BCE Inc | 632,909 | |||||||||||||
| 16,700 | Canadian Natural Resources | 1,251,503 | |||||||||||||
| 12,500 | Canadian Pacific Railway Ltd | 908,560 | |||||||||||||
| 12,300 | EnCana Corp | 937,637 | |||||||||||||
| 10,000 | Potash Corp of Saskatchewan Inc | 1,589,840 | |||||||||||||
| 8,000 | Research In Motion Ltd * | 833,366 | |||||||||||||
| Total Canada | 6,153,815 | ||||||||||||||
| Finland — 1.5% | |||||||||||||||
| 23,739 | Fortum Oyj | 991,165 | |||||||||||||
| 7,000 | Metso Oyj | 364,196 | |||||||||||||
| 162,226 | Nokia Oyj | 5,828,395 | |||||||||||||
| 7,904 | Rautaruukki Oyj | 344,617 | |||||||||||||
| Total Finland | 7,528,373 | ||||||||||||||
See accompanying notes to the financial statements.
3
GMO Developed World Stock Fund
(A Series of GMO Trust)
Schedule of Investments — (Continued)
(showing percentage of total net assets)
February 29, 2008
| Shares | Description | Value ($) | |||||||||||||
| France — 7.0% | |||||||||||||||
| 5,400 | Alstom | 1,134,861 | |||||||||||||
| 34,089 | Arcelor Mittal | 2,588,325 | |||||||||||||
| 56,561 | BNP Paribas | 5,056,548 | |||||||||||||
| 8,560 | Bouygues | 584,650 | |||||||||||||
| 12,745 | Casino Guichard-Perrachon SA | 1,441,551 | |||||||||||||
| 22,577 | Cie de Saint-Gobain | 1,764,944 | |||||||||||||
| 4,686 | CNP Assurances | 515,628 | |||||||||||||
| 13,591 | Credit Agricole SA | 368,653 | |||||||||||||
| 19,898 | Electricite de France | 1,855,886 | |||||||||||||
| 31,938 | France Telecom SA | 1,072,128 | |||||||||||||
| 3,795 | Lafarge SA | 656,045 | |||||||||||||
| 3,825 | Michelin SA Class B | 376,725 | |||||||||||||
| 22,493 | Peugeot SA | 1,709,901 | |||||||||||||
| 6,543 | Renault SA | 699,097 | |||||||||||||
| 61,155 | Sanofi-Aventis | 4,520,128 | |||||||||||||
| 10,892 | Societe Generale | 1,165,435 | |||||||||||||
| 2,723 | Societe Generale NV (New Shares) * | 299,213 | |||||||||||||
| 129,891 | Total SA | 9,781,317 | |||||||||||||
| 8,534 | Vinci SA | 589,279 | |||||||||||||
| Total France | 36,180,314 | ||||||||||||||
| Germany — 5.2% | |||||||||||||||
| 34,795 | Altana AG | 810,521 | |||||||||||||
| 18,294 | BASF AG | 2,339,356 | |||||||||||||
| 15,278 | Bayer AG | 1,175,786 | |||||||||||||
| 2,027 | Beiresdorf AG (Bearer) | 160,471 | |||||||||||||
| 27,064 | Daimler AG (Registered) (a) | 2,253,720 | |||||||||||||
| 9,696 | Deutsche Boerse AG | 1,542,876 | |||||||||||||
| 24,593 | Deutsche Post AG (Registered) | 814,822 | |||||||||||||
| 14,335 | E.ON AG | 2,698,934 | |||||||||||||
| 27,825 | Hannover Rueckversicherungs AG (Registered) (a) | 1,328,350 | |||||||||||||
| 13,134 | MAN AG | 1,732,391 | |||||||||||||
| 10,243 | Muenchener Rueckversicherungs AG (Registered) | 1,802,249 | |||||||||||||
| 5,973 | RWE AG | 723,123 | |||||||||||||
| 6,785 | Salzgitter AG | 1,189,288 | |||||||||||||
See accompanying notes to the financial statements.
4
GMO Developed World Stock Fund
(A Series of GMO Trust)
Schedule of Investments — (Continued)
(showing percentage of total net assets)
February 29, 2008
| Shares | Description | Value ($) | |||||||||||||
| Germany — continued | |||||||||||||||
| 14,665 | Siemens AG (Registered) | 1,870,142 | |||||||||||||
| 41,771 | Suedzucker AG | 920,876 | |||||||||||||
| 38,793 | ThyssenKrupp AG | 2,230,883 | |||||||||||||
| 14,178 | Volkswagen AG | 3,228,256 | |||||||||||||
| Total Germany | 26,822,044 | ||||||||||||||
| Hong Kong — 1.3% | |||||||||||||||
| 37,200 | Bank of East Asia Ltd | 199,807 | |||||||||||||
| 232,500 | CLP Holdings Ltd | 1,817,482 | |||||||||||||
| 61,100 | Esprit Holdings Ltd | 767,845 | |||||||||||||
| 101,000 | Hang Seng Bank Ltd | 1,911,746 | |||||||||||||
| 180,500 | Hong Kong Electric Holdings Ltd | 1,022,213 | |||||||||||||
| 59,000 | Hong Kong Exchanges and Clearing Ltd | 1,120,827 | |||||||||||||
| Total Hong Kong | 6,839,920 | ||||||||||||||
| Ireland — 0.2% | |||||||||||||||
| 54,236 | Bank of Ireland | 762,948 | |||||||||||||
| Italy — 2.2% | |||||||||||||||
| 67,700 | Enel SPA | 730,510 | |||||||||||||
| 284,772 | ENI SPA | 9,833,528 | |||||||||||||
| 46,728 | Fiat SPA | 987,657 | |||||||||||||
| Total Italy | 11,551,695 | ||||||||||||||
| Japan — 9.2% | |||||||||||||||
| 23,900 | Alps Electric Co Ltd | 279,277 | |||||||||||||
| 157,000 | Cosmo Oil Co Ltd | 518,801 | |||||||||||||
| 8,700 | Eisai Co Ltd | 313,761 | |||||||||||||
| 139,000 | Fuji Heavy Industries Ltd | 606,384 | |||||||||||||
| 110,600 | Honda Motor Co Ltd | 3,376,102 | |||||||||||||
| 31,100 | Hoya Corp | 789,098 | |||||||||||||
| 127,000 | Isuzu Motors Ltd | 578,325 | |||||||||||||
| 192,000 | Itochu Corp | 2,021,829 | |||||||||||||
| 18,800 | JFE Holdings Inc | 837,686 | |||||||||||||
See accompanying notes to the financial statements.
5
GMO Developed World Stock Fund
(A Series of GMO Trust)
Schedule of Investments — (Continued)
(showing percentage of total net assets)
February 29, 2008
| Shares | Description | Value ($) | |||||||||||||
| Japan — continued | |||||||||||||||
| 84,000 | Kawasaki Kisen Kaisha Ltd | 852,097 | |||||||||||||
| 3,400 | Keyence Corp | 793,325 | |||||||||||||
| 36,400 | Komatsu Ltd | 924,724 | |||||||||||||
| 28,000 | Konica Minolta Holdings Inc | 396,680 | |||||||||||||
| 265,000 | Marubeni Corp | 2,006,342 | |||||||||||||
| 75,800 | Mitsubishi Corp | 2,312,695 | |||||||||||||
| 35,000 | Mitsubishi Estate Co Ltd | 852,967 | |||||||||||||
| 82,000 | Mitsui & Co | 1,783,290 | |||||||||||||
| 27,000 | Mitsui Chemicals Inc | 191,447 | |||||||||||||
| 59,000 | Mitsui OSK Lines Ltd | 766,285 | |||||||||||||
| 6,200 | Nintendo Co Ltd | 3,086,953 | |||||||||||||
| 91,500 | Nippon Mining Holdings Inc | 541,941 | |||||||||||||
| 202,000 | Nippon Oil Corp | 1,377,978 | |||||||||||||
| 63,000 | Nippon Yusen KK | 582,147 | |||||||||||||
| 246,000 | Nissan Motor Co | 2,212,271 | |||||||||||||
| 520 | NTT Docomo Inc | 761,836 | |||||||||||||
| 13,000 | Olympus Corp | 380,661 | |||||||||||||
| 339,000 | Osaka Gas Co Ltd | 1,360,186 | |||||||||||||
| 40,000 | Ricoh Company Ltd | 642,405 | |||||||||||||
| 86,000 | Seven & I Holdings Co Ltd | 2,138,413 | |||||||||||||
| 33,600 | Shin-Etsu Chemical Co Ltd | 1,813,270 | |||||||||||||
| 72,200 | Showa Shell Sekiyu KK | 732,486 | |||||||||||||
| 234,200 | Sojitz Corp | 877,905 | |||||||||||||
| 30,600 | SUMCO Corp | 676,676 | |||||||||||||
| 83,300 | Sumitomo Corp | 1,197,954 | |||||||||||||
| 114,000 | Sumitomo Metal Industries Ltd | 482,913 | |||||||||||||
| 168,000 | Taisei Corp | 442,944 | |||||||||||||
| 32,000 | Taisho Pharmaceutical Co Ltd | 652,108 | |||||||||||||
| 49,600 | Takeda Pharmaceutical Co Ltd | 2,767,632 | |||||||||||||
| 8,300 | TDK Corp | 589,987 | |||||||||||||
| 19,100 | Tokyo Electric Power Co Inc | 490,719 | |||||||||||||
| 245,000 | Tokyo Gas Co Ltd | 1,099,015 | |||||||||||||
| 80,000 | TonenGeneral Sekiyu KK | 759,477 | |||||||||||||
| 97,000 | Toshiba Corp | 727,571 | |||||||||||||
| 40,000 | Toyota Tsusho Kaisha | 1,015,457 | |||||||||||||
| Total Japan | 47,612,020 | ||||||||||||||
See accompanying notes to the financial statements.
6
GMO Developed World Stock Fund
(A Series of GMO Trust)
Schedule of Investments — (Continued)
(showing percentage of total net assets)
February 29, 2008
| Shares | Description | Value ($) | |||||||||||||
| Netherlands — 2.0% | |||||||||||||||
| 126,570 | Aegon NV | 1,890,259 | |||||||||||||
| 40,344 | Heineken NV | 2,275,421 | |||||||||||||
| 168,039 | ING Groep NV | 5,584,221 | |||||||||||||
| 12,819 | Koninklijke DSM | 564,119 | |||||||||||||
| Total Netherlands | 10,314,020 | ||||||||||||||
| Norway — 0.6% | |||||||||||||||
| 99,850 | StatoilHydro ASA | 3,042,560 | |||||||||||||
| Singapore — 2.9% | |||||||||||||||
| 312,000 | Capitaland Ltd | 1,378,423 | |||||||||||||
| 116,000 | City Developments Ltd | 973,563 | |||||||||||||
| 161,000 | Keppel Corp Ltd | 1,213,161 | |||||||||||||
| 296,000 | Oversea-Chinese Banking Corp | 1,596,775 | |||||||||||||
| 269,000 | Sembcorp Industries Ltd | 904,464 | |||||||||||||
| 133,200 | Singapore Airlines Ltd | 1,444,813 | |||||||||||||
| 187,000 | Singapore Exchange Ltd | 1,088,083 | |||||||||||||
| 400,000 | Singapore Technologies Engineering Ltd | 967,180 | |||||||||||||
| 1,383,600 | Singapore Telecommunications | 3,743,625 | |||||||||||||
| 138,000 | United Overseas Bank Ltd | 1,749,758 | |||||||||||||
| Total Singapore | 15,059,845 | ||||||||||||||
| Spain — 0.3% | |||||||||||||||
| 19,586 | Repsol YPF SA | 675,651 | |||||||||||||
| 37,691 | Telefonica SA | 1,090,647 | |||||||||||||
| Total Spain | 1,766,298 | ||||||||||||||
| Sweden — 0.2% | |||||||||||||||
| 18,900 | Electrolux AB Series B | 303,253 | |||||||||||||
| 50,700 | Svenska Cellulosa AB Class B | 832,226 | |||||||||||||
| Total Sweden | 1,135,479 | ||||||||||||||
See accompanying notes to the financial statements.
7
GMO Developed World Stock Fund
(A Series of GMO Trust)
Schedule of Investments — (Continued)
(showing percentage of total net assets)
February 29, 2008
| Shares | Description | Value ($) | |||||||||||||
| Switzerland — 1.8% | |||||||||||||||
| 88,709 | ABB Ltd | 2,210,124 | |||||||||||||
| 1,800 | Alcon Inc | 260,514 | |||||||||||||
| 91,629 | Novartis AG (Registered) | 4,525,812 | |||||||||||||
| 7,273 | Zurich Financial Services AG | 2,273,621 | |||||||||||||
| Total Switzerland | 9,270,071 | ||||||||||||||
| United Kingdom — 11.5% | |||||||||||||||
| 97,050 | AstraZeneca Plc | 3,627,477 | |||||||||||||
| 130,007 | Aviva Plc | 1,567,032 | |||||||||||||
| 457,988 | Barclays Plc | 4,292,410 | |||||||||||||
| 58,859 | Barratt Developments Plc | 476,197 | |||||||||||||
| 57,472 | BG Group Plc | 1,354,672 | |||||||||||||
| 42,552 | BHP Billiton Plc | 1,361,243 | |||||||||||||
| 31,369 | Centrica Plc | 200,285 | |||||||||||||
| 195,072 | DSG International Plc | 243,850 | |||||||||||||
| 273,298 | GlaxoSmithKline Plc | 5,965,696 | |||||||||||||
| 298,628 | HBOS Plc | 3,548,584 | |||||||||||||
| 138,286 | HSBC Holdings Plc | 2,090,508 | |||||||||||||
| 34,535 | J Sainsbury Plc | 242,122 | |||||||||||||
| 79,468 | Kesa Electricals Plc | 335,726 | |||||||||||||
| 115,877 | Kingfisher Plc | 299,122 | |||||||||||||
| 416,960 | Lloyds TSB Group Plc | 3,726,933 | |||||||||||||
| 30,540 | Next Plc | 774,553 | |||||||||||||
| 513,016 | Old Mutual Plc | 1,267,202 | |||||||||||||
| 41,797 | Persimmon Plc | 607,273 | |||||||||||||
| 18,811 | Reckitt Benckiser Group Plc | 1,014,689 | |||||||||||||
| 29,714 | Reed Elsevier Plc | 373,980 | |||||||||||||
| 40,264 | Rio Tinto Plc | 4,530,005 | |||||||||||||
| 1,005,778 | Royal Bank of Scotland Group | 7,604,211 | |||||||||||||
| 42,206 | Royal Dutch Shell Group Class A (Amsterdam) | 1,509,268 | |||||||||||||
| 138,376 | Royal Dutch Shell Plc A Shares (London) | 4,947,823 | |||||||||||||
| 140,677 | Taylor Woodrow Plc | 476,015 | |||||||||||||
| 191,171 | Tomkins Plc | 640,949 | |||||||||||||
| 34,562 | Unilever Plc | 1,088,920 | |||||||||||||
See accompanying notes to the financial statements.
8
GMO Developed World Stock Fund
(A Series of GMO Trust)
Schedule of Investments — (Continued)
(showing percentage of total net assets)
February 29, 2008
| Shares | Description | Value ($) | |||||||||||||
| United Kingdom — continued | |||||||||||||||
| 17,316 | United Utilities Plc | 237,111 | |||||||||||||
| 1,043,762 | Vodafone Group Inc | 3,360,307 | |||||||||||||
| 41,001 | Wolseley Plc | 501,731 | |||||||||||||
| 11,111 | Xstrata Plc | 866,773 | |||||||||||||
| Total United Kingdom | 59,132,667 | ||||||||||||||
| United States — 45.8% | |||||||||||||||
| 30,700 | 3M Co. | 2,406,880 | |||||||||||||
| 21,400 | Abbott Laboratories | 1,145,970 | |||||||||||||
| 15,000 | Abercrombie & Fitch Co.-Class A | 1,162,950 | |||||||||||||
| 17,700 | Accenture Ltd. | 623,925 | |||||||||||||
| 13,700 | ACE Ltd. | 770,488 | |||||||||||||
| 17,200 | Adobe Systems, Inc. * | 578,780 | |||||||||||||
| 11,800 | Aflac, Inc. | 736,438 | |||||||||||||
| 38,200 | Allstate Corp. (The) | 1,823,286 | |||||||||||||
| 63,000 | Altria Group, Inc. | 4,607,820 | |||||||||||||
| 13,600 | Amazon.com, Inc. * | 876,792 | |||||||||||||
| 30,700 | American International Group, Inc. | 1,438,602 | |||||||||||||
| 4,000 | AmerisourceBergen Corp. | 166,880 | |||||||||||||
| 14,600 | Amphenol Corp.-Class A | 539,762 | |||||||||||||
| 7,600 | Anadarko Petroleum Corp. | 484,424 | |||||||||||||
| 11,600 | Apache Corp. | 1,330,636 | |||||||||||||
| 14,200 | Apollo Group, Inc.-Class A * | 871,596 | |||||||||||||
| 37,900 | Apple, Inc. * | 4,738,258 | |||||||||||||
| 9,900 | Ashland, Inc. | 437,283 | |||||||||||||
| 17,954 | AT&T, Inc. | 625,338 | |||||||||||||
| 42,200 | Automatic Data Processing, Inc. | 1,685,890 | |||||||||||||
| 29,500 | AutoNation, Inc. * | 429,815 | |||||||||||||
| 18,300 | Avon Products, Inc. | 696,498 | |||||||||||||
| 121,783 | Bank of America Corp. | 4,839,656 | |||||||||||||
| 7,600 | Bard (C.R.), Inc. | 720,404 | |||||||||||||
| 12,500 | Baxter International, Inc. | 737,750 | |||||||||||||
| 7,400 | Bear Stearns Cos. (The), Inc. | 590,964 | |||||||||||||
| 14,100 | Becton Dickinson & Co. | 1,274,922 | |||||||||||||
See accompanying notes to the financial statements.
9
GMO Developed World Stock Fund
(A Series of GMO Trust)
Schedule of Investments — (Continued)
(showing percentage of total net assets)
February 29, 2008
| Shares | Description | Value ($) | |||||||||||||
| United States — continued | |||||||||||||||
| 39,000 | Bed Bath & Beyond, Inc. * | 1,105,260 | |||||||||||||
| 41,200 | Best Buy Co., Inc. | 1,772,012 | |||||||||||||
| 51,300 | Boston Scientific Corp. * | 645,867 | |||||||||||||
| 4,300 | Bunge Ltd. | 476,612 | |||||||||||||
| 32,800 | Capital One Financial Corp. | 1,509,784 | |||||||||||||
| 42,700 | Centerpoint Energy, Inc. | 626,836 | |||||||||||||
| 18,000 | CH Robinson Worldwide, Inc. | 913,860 | |||||||||||||
| 70,305 | Chevron Corp. | 6,092,631 | |||||||||||||
| 14,700 | Cigna Corp. | 655,326 | |||||||||||||
| 117,900 | Citigroup, Inc. | 2,795,409 | |||||||||||||
| 22,800 | Citrix Systems, Inc. * | 750,804 | |||||||||||||
| 1,100 | CME Group, Inc. | 564,630 | |||||||||||||
| 11,600 | CNA Financial Corp. | 309,140 | |||||||||||||
| 41,200 | Coach, Inc. * | 1,249,184 | |||||||||||||
| 88,600 | Coca-Cola Co. (The) | 5,179,556 | |||||||||||||
| 26,800 | Computer Sciences Corp. * | 1,164,460 | |||||||||||||
| 20,000 | Compuware Corp. * | 159,200 | |||||||||||||
| 102,453 | ConocoPhillips | 8,473,888 | |||||||||||||
| 22,000 | Convergys Corp. * | 317,680 | |||||||||||||
| 25,400 | Corning, Inc. | 590,042 | |||||||||||||
| 77,500 | Countrywide Financial Corp. | 489,025 | |||||||||||||
| 12,000 | CSX Corp. | 582,240 | |||||||||||||
| 9,600 | Cummins, Inc. | 483,648 | |||||||||||||
| 60,800 | D.R. Horton, Inc. | 853,024 | |||||||||||||
| 10,200 | Danaher Corp. | 756,330 | |||||||||||||
| 22,200 | Deere & Co. | 1,891,662 | |||||||||||||
| 14,900 | Dow Chemical Co. (The) | 561,581 | |||||||||||||
| 22,800 | DTE Energy Co. | 907,668 | |||||||||||||
| 30,300 | Duke Energy Corp. | 531,462 | |||||||||||||
| 6,100 | Eaton Corp. | 491,843 | |||||||||||||
| 13,300 | Ecolab, Inc. | 622,307 | |||||||||||||
| 12,300 | Eli Lilly & Co. | 615,246 | |||||||||||||
| 78,500 | EMC Corp. * | 1,219,890 | |||||||||||||
| 10,600 | Emerson Electric Co. | 540,176 | |||||||||||||
See accompanying notes to the financial statements.
10
GMO Developed World Stock Fund
(A Series of GMO Trust)
Schedule of Investments — (Continued)
(showing percentage of total net assets)
February 29, 2008
| Shares | Description | Value ($) | |||||||||||||
| United States — continued | |||||||||||||||
| 22,700 | Energy East Corp. | 604,955 | |||||||||||||
| 1,600 | Everest Re Group Ltd. | 155,008 | |||||||||||||
| 20,600 | Expeditors International of Washington, Inc. | 809,992 | |||||||||||||
| 8,600 | Express Scripts, Inc. * | 508,260 | |||||||||||||
| 57,900 | Exxon Mobil Corp. | 5,037,879 | |||||||||||||
| 31,300 | Fannie Mae | 865,445 | |||||||||||||
| 14,600 | Fastenal Co. | 593,636 | |||||||||||||
| 31,192 | Fidelity National Title Group, Inc.-Class A | 549,291 | |||||||||||||
| 20,100 | First American Corp. | 700,083 | |||||||||||||
| 37,850 | First Marblehead Corp. (The) | 455,336 | |||||||||||||
| 6,000 | First Solar, Inc. * | 1,231,200 | |||||||||||||
| 18,200 | Fiserv, Inc. * | 957,684 | |||||||||||||
| 5,600 | Fluor Corp. | 779,800 | |||||||||||||
| 14,500 | Forest Laboratories, Inc. * | 576,665 | |||||||||||||
| 11,100 | FPL Group, Inc. | 669,219 | |||||||||||||
| 7,000 | Franklin Resources, Inc. | 660,590 | |||||||||||||
| 10,600 | Freeport-McMoRan Copper & Gold, Inc. | 1,069,116 | |||||||||||||
| 30,100 | Gannett Co., Inc. | 907,515 | |||||||||||||
| 8,200 | Garmin Ltd. | 481,422 | |||||||||||||
| 14,300 | General Dynamics Corp. | 1,170,455 | |||||||||||||
| 13,700 | Genuine Parts Co. | 565,125 | |||||||||||||
| 33,800 | Genworth Financial, Inc.-Class A | 783,484 | |||||||||||||
| 7,300 | Goodrich Corp. | 432,379 | |||||||||||||
| 7,600 | Google, Inc.-Class A * | 3,580,968 | |||||||||||||
| 26,700 | Harley-Davidson, Inc. | 992,172 | |||||||||||||
| 13,200 | Hartford Financial Services Group, Inc. | 922,680 | |||||||||||||
| 16,800 | Hess Corp. | 1,565,424 | |||||||||||||
| 43,000 | Hewlett-Packard Co. | 2,054,110 | |||||||||||||
| 172,800 | Home Depot, Inc. | 4,587,840 | |||||||||||||
| 19,100 | Honeywell International, Inc. | 1,099,014 | |||||||||||||
| 32,300 | Illinois Tool Works, Inc. | 1,584,961 | |||||||||||||
| 102,100 | Intel Corp. | 2,036,895 | |||||||||||||
| 15,100 | International Business Machines Corp. | 1,719,286 | |||||||||||||
| 6,200 | Jacobs Engineering Group, Inc. * | 497,798 | |||||||||||||
See accompanying notes to the financial statements.
11
GMO Developed World Stock Fund
(A Series of GMO Trust)
Schedule of Investments — (Continued)
(showing percentage of total net assets)
February 29, 2008
| Shares | Description | Value ($) | |||||||||||||
| United States — continued | |||||||||||||||
| 24,100 | Janus Capital Group, Inc. | 583,702 | |||||||||||||
| 246,400 | Johnson & Johnson | 15,266,944 | |||||||||||||
| 14,400 | Johnson Controls, Inc. | 473,184 | |||||||||||||
| 22,300 | Juniper Networks, Inc. * | 598,086 | |||||||||||||
| 16,700 | KB Home | 399,631 | |||||||||||||
| 42,400 | Kimberly-Clark Corp. | 2,763,632 | |||||||||||||
| 14,500 | Kohl's Corp. * | 644,380 | |||||||||||||
| 53,335 | Kraft Foods, Inc. | 1,662,452 | |||||||||||||
| 32,800 | Lennar Corp.-Class A | 610,408 | |||||||||||||
| 13,100 | Lexmark International, Inc. * | 432,693 | |||||||||||||
| 11,200 | Lincare Holdings, Inc. * | 364,000 | |||||||||||||
| 7,400 | Loews Corp. - Carolina Group | 557,146 | |||||||||||||
| 140,400 | Lowe's Cos., Inc. | 3,365,388 | |||||||||||||
| 14,000 | Marathon Oil Corp. | 744,240 | |||||||||||||
| 4,400 | Mastercard, Inc.-Class A | 836,000 | |||||||||||||
| 41,400 | McDonald's Corp. | 2,240,154 | |||||||||||||
| 27,300 | McGraw-Hill Cos., Inc. | 1,117,389 | |||||||||||||
| 15,200 | Medco Health Solutions, Inc. * | 673,512 | |||||||||||||
| 30,700 | Medtronic, Inc. | 1,515,352 | |||||||||||||
| 10,200 | MEMC Electronic Materials, Inc. * | 778,056 | |||||||||||||
| 112,400 | Merck & Co., Inc. | 4,979,320 | |||||||||||||
| 12,600 | Merrill Lynch & Co., Inc. | 624,456 | |||||||||||||
| 16,300 | MGIC Investment Corp. | 241,403 | |||||||||||||
| 59,500 | Microsoft Corp. | 1,619,590 | |||||||||||||
| 14,700 | Mirant Corp. * | 543,900 | |||||||||||||
| 22,400 | Monsanto Co. | 2,591,232 | |||||||||||||
| 16,700 | Morgan Stanley | 703,404 | |||||||||||||
| 16,200 | Mosaic Company (The) * | 1,803,060 | |||||||||||||
| 68,900 | National City Corp. | 1,092,754 | |||||||||||||
| 9,400 | National Oilwell Varco, Inc. * | 585,620 | |||||||||||||
| 26,200 | Nike, Inc.-Class B | 1,577,240 | |||||||||||||
| 36,700 | NiSource, Inc. | 630,873 | |||||||||||||
| 1,000 | NVR, Inc. * | 540,680 | |||||||||||||
| 31,700 | Occidental Petroleum Corp. | 2,452,629 | |||||||||||||
See accompanying notes to the financial statements.
12
GMO Developed World Stock Fund
(A Series of GMO Trust)
Schedule of Investments — (Continued)
(showing percentage of total net assets)
February 29, 2008
| Shares | Description | Value ($) | |||||||||||||
| United States — continued | |||||||||||||||
| 49,725 | Old Republic International Corp. | 682,227 | |||||||||||||
| 163,500 | Oracle Corp. * | 3,073,800 | |||||||||||||
| 13,550 | Paccar, Inc. | 587,799 | |||||||||||||
| 8,300 | Parker-Hannifin Corp. | 536,429 | |||||||||||||
| 36,200 | Paychex, Inc. | 1,138,852 | |||||||||||||
| 22,300 | Pepco Holdings, Inc. | 563,521 | |||||||||||||
| 57,800 | PepsiCo, Inc. | 4,020,568 | |||||||||||||
| 394,100 | Pfizer, Inc. | 8,780,548 | |||||||||||||
| 7,200 | PPG Industries, Inc. | 446,256 | |||||||||||||
| 10,600 | PPL Corp. | 481,028 | |||||||||||||
| 17,300 | Praxair, Inc. | 1,388,844 | |||||||||||||
| 11,300 | Precision Castparts Corp. | 1,247,407 | |||||||||||||
| 18,600 | Progress Energy, Inc. | 779,526 | |||||||||||||
| 7,000 | Prudential Financial, Inc. | 510,790 | |||||||||||||
| 9,100 | Rockwell Collins, Inc. | 535,990 | |||||||||||||
| 10,400 | Ryder Systems, Inc. | 599,144 | |||||||||||||
| 17,300 | Schlumberger Ltd. | 1,495,585 | |||||||||||||
| 21,500 | Seagate Technology | 463,755 | |||||||||||||
| 25,300 | SEI Investment Co. | 632,753 | |||||||||||||
| 12,700 | Southern Copper Corp. | 1,449,197 | |||||||||||||
| 9,500 | SPX Corp. | 971,850 | |||||||||||||
| 5,900 | State Street Corp. | 463,445 | |||||||||||||
| 28,700 | Stryker Corp. | 1,868,657 | |||||||||||||
| 14,942 | Supervalu, Inc. | 392,228 | |||||||||||||
| 40,100 | Sysco Corp. | 1,125,206 | |||||||||||||
| 7,900 | Textron, Inc. | 427,943 | |||||||||||||
| 43,400 | TJX Cos., Inc. | 1,388,800 | |||||||||||||
| 10,900 | Torchmark Corp. | 656,834 | |||||||||||||
| 31,900 | United Parcel Service, Inc.-Class B | 2,240,656 | |||||||||||||
| 34,400 | United Technologies Corp. | 2,425,544 | |||||||||||||
| 33,300 | UnitedHealth Group, Inc. | 1,547,784 | |||||||||||||
| 36,000 | Unum Group | 824,760 | |||||||||||||
| 21,800 | Valero Energy Corp. | 1,259,386 | |||||||||||||
| 11,500 | VF Corp. | 874,460 | |||||||||||||
See accompanying notes to the financial statements.
13
GMO Developed World Stock Fund
(A Series of GMO Trust)
Schedule of Investments — (Continued)
(showing percentage of total net assets)
February 29, 2008
| Shares / Par Value ($) | Description | Value ($) | |||||||||||||
| United States — continued | |||||||||||||||
| 7,000 | W.W. Grainger, Inc. | 515,620 | |||||||||||||
| 64,400 | Walgreen Co. | 2,351,244 | |||||||||||||
| 75,700 | Wal-Mart Stores, Inc. | 3,753,964 | |||||||||||||
| 55,949 | Washington Mutual, Inc. | 828,045 | |||||||||||||
| 9,600 | Wells Fargo & Co. | 280,608 | |||||||||||||
| 7,100 | Whirlpool Corp. | 599,027 | |||||||||||||
| 13,900 | WM Wrigley Jr. Co. | 832,054 | |||||||||||||
| 36,400 | Xcel Energy, Inc. | 721,448 | |||||||||||||
| 18,700 | Zimmer Holdings, Inc. * | 1,407,923 | |||||||||||||
| Total United States | 236,229,992 | ||||||||||||||
| TOTAL COMMON STOCKS (COST $505,064,881) | 490,349,880 | ||||||||||||||
| PREFERRED STOCKS — 0.5% | |||||||||||||||
| Germany — 0.5% | |||||||||||||||
| 397 | Porsche AG (Non Voting) 0.06% | 688,350 | |||||||||||||
| 12,445 | Volkswagen AG 2.02% | 1,734,062 | |||||||||||||
| Total Germany | 2,422,412 | ||||||||||||||
| TOTAL PREFERRED STOCKS (COST $1,464,743) | 2,422,412 | ||||||||||||||
| SHORT-TERM INVESTMENTS — 4.2% | |||||||||||||||
| 3,664,337 | Bank of New York Mellon Institutional Cash Reserves Fund (b) | 3,664,337 | |||||||||||||
| 18,200,000 | BNP Paribas Time Deposit, 3.19%, due 03/03/08 | 18,200,000 | |||||||||||||
| TOTAL SHORT-TERM INVESTMENTS (COST $21,864,337) | 21,864,337 | ||||||||||||||
| TOTAL INVESTMENTS — 99.7% (Cost $528,393,961) | 514,636,629 | ||||||||||||||
| Other Assets and Liabilities (net) — 0.3% | 1,379,859 | ||||||||||||||
| TOTAL NET ASSETS — 100.0% | $ | 516,016,488 | |||||||||||||
See accompanying notes to the financial statements.
14
GMO Developed World Stock Fund
(A Series of GMO Trust)
Schedule of Investments — (Continued)
February 29, 2008
A summary of outstanding financial instruments at February 29, 2008 is as follows:
Forward Currency Contracts
| Settlement Date | Deliver/ Receive | Units of Currency | Value | Net Unrealized Appreciation (Depreciation) | |||||||||||||||
| Buys | |||||||||||||||||||
| 5/23/08 | CAD | 11,386,244 | $ | 11,549,935 | $ | 253,644 | |||||||||||||
| 5/23/08 | CAD | 11,386,244 | 11,549,935 | 305,928 | |||||||||||||||
| 5/23/08 | CAD | 11,731,281 | 11,899,933 | 306,475 | |||||||||||||||
| 5/23/08 | CHF | 13,428,537 | 12,899,073 | 612,173 | |||||||||||||||
| 5/23/08 | CHF | 13,428,537 | 12,899,073 | 615,714 | |||||||||||||||
| 5/23/08 | CHF | 13,835,462 | 13,289,954 | 635,761 | |||||||||||||||
| 5/23/08 | GBP | 1,597,000 | 3,154,825 | 39,701 | |||||||||||||||
| 5/23/08 | JPY | 1,381,165,892 | 13,357,022 | 424,272 | |||||||||||||||
| 5/23/08 | JPY | 1,381,165,892 | 13,357,022 | 429,235 | |||||||||||||||
| 5/23/08 | JPY | 1,423,019,404 | 13,761,780 | 483,084 | |||||||||||||||
| 5/23/08 | NZD | 2,032,059 | 1,603,413 | (2,320 | ) | ||||||||||||||
| 5/23/08 | NZD | 2,032,059 | 1,603,413 | (1,519 | ) | ||||||||||||||
| 5/23/08 | NZD | 2,093,637 | 1,652,002 | 4,958 | |||||||||||||||
| 5/23/08 | SEK | 43,040,623 | 6,953,972 | 167,385 | |||||||||||||||
| 5/23/08 | SEK | 43,040,623 | 6,953,972 | 164,384 | |||||||||||||||
| 5/23/08 | SEK | 44,344,884 | 7,164,698 | 170,938 | |||||||||||||||
| 5/23/08 | SGD | 2,420,610 | 1,741,185 | 20,768 | |||||||||||||||
| 5/23/08 | SGD | 2,420,610 | 1,741,185 | 18,454 | |||||||||||||||
| 5/23/08 | SGD | 2,493,962 | 1,793,948 | 20,212 | |||||||||||||||
| $ | 148,926,340 | $ | 4,669,247 | ||||||||||||||||
| Sales | |||||||||||||||||||
| 5/23/08 | AUD | 1,486,701 | $ | 1,370,089 | $ | (17,890 | ) | ||||||||||||
| 5/23/08 | AUD | 1,486,701 | 1,370,089 | (16,463 | ) | ||||||||||||||
| 5/23/08 | AUD | 1,531,753 | 1,411,607 | (15,462 | ) | ||||||||||||||
| 5/23/08 | CAD | 2,357,000 | 2,390,885 | (56,701 | ) | ||||||||||||||
| 5/23/08 | CHF | 3,376,000 | 3,242,890 | (168,545 | ) | ||||||||||||||
| 5/23/08 | EUR | 1,346,000 | 2,037,566 | (71,906 | ) | ||||||||||||||
| 5/23/08 | EUR | 7,239,691 | 10,959,396 | (321,901 | ) | ||||||||||||||
| 5/23/08 | EUR | 7,239,691 | 10,959,396 | (320,482 | ) | ||||||||||||||
| 5/23/08 | EUR | 7,239,691 | 10,959,396 | (325,702 | ) | ||||||||||||||
| 5/23/08 | EUR | 7,239,691 | 10,959,396 | (321,249 | ) | ||||||||||||||
See accompanying notes to the financial statements.
15
GMO Developed World Stock Fund
(A Series of GMO Trust)
Schedule of Investments — (Continued)
February 29, 2008
Forward Currency Contracts — continued
| Settlement Date | Deliver/ Receive | Units of Currency | Value | Net Unrealized Appreciation (Depreciation) | |||||||||||||||
| 5/23/08 | GBP | 6,539,892 | $ | 12,919,361 | $ | (233,736 | ) | ||||||||||||
| 5/23/08 | GBP | 6,539,892 | 12,919,361 | (243,676 | ) | ||||||||||||||
| 5/23/08 | GBP | 6,738,071 | 13,310,857 | (250,852 | ) | ||||||||||||||
| 5/23/08 | HKD | 12,808,014 | 1,648,346 | (3,404 | ) | ||||||||||||||
| 5/23/08 | HKD | 12,808,014 | 1,648,346 | (3,220 | ) | ||||||||||||||
| 5/23/08 | HKD | 13,196,136 | 1,698,296 | (3,355 | ) | ||||||||||||||
| 5/23/08 | JPY | 306,239,000 | 2,961,586 | (74,145 | ) | ||||||||||||||
| 5/23/08 | NOK | 4,995,763 | 951,997 | (23,796 | ) | ||||||||||||||
| 5/23/08 | NOK | 4,995,763 | 951,997 | (22,289 | ) | ||||||||||||||
| 5/23/08 | NZD | 1,007,667 | 795,108 | (18,000 | ) | ||||||||||||||
| 5/23/08 | NZD | 1,007,667 | 795,108 | (17,945 | ) | ||||||||||||||
| 5/23/08 | NZD | 1,007,667 | 795,108 | (17,804 | ) | ||||||||||||||
| $ | 107,056,181 | $ | (2,548,523 | ) | |||||||||||||||
Futures Contracts
| Number of Contracts | Type | Expiration Date | Contract Value | Net Unrealized Appreciation (Depreciation) | |||||||||||||||
| Buys | |||||||||||||||||||
| 3 | CAC40 | March 2008 | $ | 218,500 | $ | (530 | ) | ||||||||||||
| 41 | DAX | March 2008 | 10,501,366 | (1,491,873 | ) | ||||||||||||||
| 47 | MSCI Singapore | March 2008 | 2,510,216 | (71,077 | ) | ||||||||||||||
| 62 | TOPIX | March 2008 | 7,880,546 | (947,286 | ) | ||||||||||||||
| $ | 21,110,628 | $ | (2,510,766 | ) | |||||||||||||||
| Sales | |||||||||||||||||||
| 23 | FTSE 100 | March 2008 | $ | 2,665,349 | $ | 193,492 | |||||||||||||
| 5 | IBEX 35 | March 2008 | 1,002,359 | 1,568 | |||||||||||||||
| 68 | S&P 500 E-Mini | March 2008 | 4,526,420 | (21,556 | ) | ||||||||||||||
| $ | 8,194,128 | $ | 173,504 | ||||||||||||||||
As of February 29, 2008, for the futures contracts held, the Fund had sufficient cash and/or securities to cover any commitments or margin requirements of the relevant broker or exchange.
See accompanying notes to the financial statements.
16
GMO Developed World Stock Fund
(A Series of GMO Trust)
Schedule of Investments — (Continued)
February 29, 2008
Notes to Schedule of Investments:
* Non-income producing security.
(a) All or a portion of this security is out on loan (Note 2).
(b) All or a portion of this security represents investment of security lending collateral (Note 2).
As of February 29, 2008, 47.55% of the Net Assets of the Fund were valued using fair value prices based on models used by a third party vendor (Note 2).
Currency Abbreviations:
AUD - Australian Dollar
CAD - Canadian Dollar
CHF - Swiss Franc
EUR - Euro
GBP - British Pound
HKD - Hong Kong Dollar
JPY - Japanese Yen
NOK - Norwegian Krone
NZD - New Zealand Dollar
SEK - Swedish Krona
SGD - Singapore Dollar
See accompanying notes to the financial statements.
17
GMO Developed World Stock Fund
(A Series of GMO Trust)
Statement of Assets and Liabilities — February 29, 2008
| Assets: | |||||||
| Investments, at value, including securities on loan of $3,402,753 (cost $528,393,961) (Note 2) | $ | 514,636,629 | |||||
| Cash | 17,419 | ||||||
| Foreign currency, at value (cost $236,938) (Note 2) | 242,707 | ||||||
| Receivable for investments sold | 196,362 | ||||||
| Receivable for Fund shares sold | 2,841 | ||||||
| Dividends and interest receivable | 1,013,244 | ||||||
| Foreign taxes receivable | 35,770 | ||||||
| Unrealized appreciation on open forward currency contracts (Note 2) | 4,673,086 | ||||||
| Receivable for collateral on open futures contracts (Note 2) | 2,455,000 | ||||||
| Receivable for expenses reimbursed by Manager (Note 3) | 43,790 | ||||||
| Total assets | 523,316,848 | ||||||
| Liabilities: | |||||||
| Collateral on securities loaned, at value (Note 2) | 3,664,337 | ||||||
| Payable for investments purchased | 392,833 | ||||||
| Payable to affiliate for (Note 3): | |||||||
| Management fee | 191,505 | ||||||
| Shareholder service fee | 52,963 | ||||||
| Trustees and Chief Compliance Officer of GMO Trust fees | 570 | ||||||
| Unrealized depreciation on open forward currency contracts (Note 2) | 2,552,362 | ||||||
| Payable for variation margin on open futures contracts (Note 2) | 242,516 | ||||||
| Accrued expenses | 203,274 | ||||||
| Total liabilities | 7,300,360 | ||||||
| Net assets | $ | 516,016,488 | |||||
See accompanying notes to the financial statements.
18
GMO Developed World Stock Fund
(A Series of GMO Trust)
Statement of Assets and Liabilities — February 29, 2008 — (Continued)
| Net assets consist of: | |||||||
| Paid-in capital | $ | 521,124,328 | |||||
| Accumulated undistributed net investment income | 4,927,285 | ||||||
| Accumulated net realized gain | 3,928,946 | ||||||
| Net unrealized depreciation | (13,964,071 | ) | |||||
| $ | 516,016,488 | ||||||
| Net assets attributable to: | |||||||
| Class III shares | $ | 309,608,755 | |||||
| Class IV shares | $ | 206,407,733 | |||||
| Shares outstanding: | |||||||
| Class III | 14,151,927 | ||||||
| Class IV | 9,425,247 | ||||||
| Net asset value per share: | |||||||
| Class III | $ | 21.88 | |||||
| Class IV | $ | 21.90 | |||||
See accompanying notes to the financial statements.
19
GMO Developed World Stock Fund
(A Series of GMO Trust)
Statement of Operations — Year Ended February 29, 2008
| Investment Income: | |||||||
| Dividends (net of withholding taxes of $814,721) | $ | 13,076,931 | |||||
| Interest | 925,879 | ||||||
| Securities lending income | 314,855 | ||||||
| Total investment income | 14,317,665 | ||||||
| Expenses: | |||||||
| Management fee (Note 3) | 2,420,497 | ||||||
| Shareholder service fee – Class III (Note 3) | 439,267 | ||||||
| Shareholder service fee – Class IV (Note 3) | 222,155 | ||||||
| Custodian and fund accounting agent fees | 407,631 | ||||||
| Transfer agent fees | 41,758 | ||||||
| Audit and tax fees | 69,471 | ||||||
| Legal fees | 11,033 | ||||||
| Trustees fees and related expenses (Note 3) | 4,925 | ||||||
| Registration fees | 4,313 | ||||||
| Miscellaneous | 8,352 | ||||||
| Total expenses | 3,629,402 | ||||||
| Fees and expenses reimbursed by Manager (Note 3) | (540,514 | ) | |||||
| Expense reductions (Note 2) | (3,647 | ) | |||||
| Net expenses | 3,085,241 | ||||||
| Net investment income (loss) | 11,232,424 | ||||||
| Realized and unrealized gain (loss): | |||||||
| Net realized gain (loss) on: | |||||||
| Investments | 29,387,939 | ||||||
| Closed futures contracts | 2,042,708 | ||||||
| Foreign currency, forward contracts and foreign currency related transactions | 8,114,385 | ||||||
| Net realized gain (loss) | 39,545,032 | ||||||
| Change in net unrealized appreciation (depreciation) on: | |||||||
| Investments | (62,574,177 | ) | |||||
| Open futures contracts | (2,880,405 | ) | |||||
| Foreign currency, forward contracts and foreign currency related transactions | 1,870,606 | ||||||
| Net unrealized gain (loss) | (63,583,976 | ) | |||||
| Net realized and unrealized gain (loss) | (24,038,944 | ) | |||||
| Net increase (decrease) in net assets resulting from operations | $ | (12,806,520 | ) | ||||
See accompanying notes to the financial statements.
20
GMO Developed World Stock Fund
(A Series of GMO Trust)
Statement of Changes in Net Assets
| Year Ended February 29, 2008 | Year Ended February 28, 2007 | ||||||||||
| Increase (decrease) in net assets: | |||||||||||
| Operations: | |||||||||||
| Net investment income (loss) | $ | 11,232,424 | $ | 6,739,059 | |||||||
| Net realized gain (loss) | 39,545,032 | 15,932,679 | |||||||||
| Change in net unrealized appreciation (depreciation) | (63,583,976 | ) | 26,314,621 | ||||||||
| Net increase (decrease) in net assets from operations | (12,806,520 | ) | 48,986,359 | ||||||||
| Distributions to shareholders from: | |||||||||||
| Net investment income | |||||||||||
| Class III | (8,471,254 | ) | (3,430,167 | ) | |||||||
| Class IV | (5,941,447 | ) | (1,996,536 | ) | |||||||
| Total distributions from net investment income | (14,412,701 | ) | (5,426,703 | ) | |||||||
| Net realized gains | |||||||||||
| Class III | (22,082,339 | ) | (6,179,695 | ) | |||||||
| Class IV | (15,851,765 | ) | (3,819,305 | ) | |||||||
| Total distributions from net realized gains | (37,934,104 | ) | (9,999,000 | ) | |||||||
| (52,346,805 | ) | (15,425,703 | ) | ||||||||
| Net share transactions (Note 7): | |||||||||||
| Class III | 66,739,553 | 83,907,560 | |||||||||
| Class IV | 21,793,212 | 57,645,131 | |||||||||
| Increase (decrease) in net assets resulting from net share transactions | 88,532,765 | 141,552,691 | |||||||||
| Purchase premiums and redemption fees (Notes 2 and 7): | |||||||||||
| Class III | 253,528 | 239,083 | |||||||||
| Class IV | — | 156,000 | |||||||||
| Increase in net assets resulting from purchase premiums and redemption fees | 253,528 | 395,083 | |||||||||
| Total increase (decrease) in net assets resulting from net share transactions, purchase premiums and redemption fees | 88,786,293 | 141,947,774 | |||||||||
| Total increase (decrease) in net assets | 23,632,968 | 175,508,430 | |||||||||
| Net assets: | |||||||||||
| Beginning of period | 492,383,520 | 316,875,090 | |||||||||
| End of period (including accumulated undistributed net investment income of $4,927,285 and distributions in excess of net investment income of $413,847, respectively) | $ | 516,016,488 | $ | 492,383,520 | |||||||
See accompanying notes to the financial statements.
21
GMO Developed World Stock Fund
(A Series of GMO Trust)
Financial Highlights
(For a Class III share outstanding throughout each period)
| Year Ended February 28/29, | |||||||||||||||
| 2008 | 2007 | 2006(a) | |||||||||||||
| Net asset value, beginning of period | $ | 24.58 | $ | 22.24 | $ | 20.00 | |||||||||
| Income (loss) from investment operations: | |||||||||||||||
| Net investment income (loss)† | 0.54 | 0.43 | 0.15 | ||||||||||||
| Net realized and unrealized gain (loss) | (0.74 | ) | 2.84 | 2.15 | |||||||||||
| Total from investment operations | (0.20 | ) | 3.27 | 2.30 | |||||||||||
| Less distributions to shareholders: | |||||||||||||||
| From net investment income | (0.67 | ) | (0.32 | ) | (0.06 | ) | |||||||||
| From net realized gains | (1.83 | ) | (0.61 | ) | — | ||||||||||
| Total distributions | (2.50 | ) | (0.93 | ) | (0.06 | ) | |||||||||
| Net asset value, end of period | $ | 21.88 | $ | 24.58 | $ | 22.24 | |||||||||
| Total Return(b) | (1.73 | )% | 14.87 | % | 11.51 | %** | |||||||||
| Ratios/Supplemental Data: | |||||||||||||||
| Net assets, end of period (000's) | $ | 309,609 | $ | 282,446 | $ | 179,466 | |||||||||
| Net expenses to average daily net assets | 0.62 | %(c) | 0.62 | % | 0.62 | %* | |||||||||
| Net investment income to average daily net assets | 2.15 | % | 1.83 | % | 1.27 | %* | |||||||||
| Portfolio turnover rate | 53 | % | 43 | % | 15 | %**†† | |||||||||
| Fees and expenses reimbursed by the Manager to average daily net assets: | 0.11 | % | 0.12 | % | 0.20 | %* | |||||||||
| Purchase premiums and redemption fees consisted of the following per share amounts:† | $ | 0.02 | $ | 0.03 | $ | 0.07 | |||||||||
† Calculated using average shares outstanding throughout the period.
(a) Period from August 1, 2005 (commencement of operations) through February 28, 2006.
(b) The total return would have been lower had certain expenses not been reimbursed during the period shown and assumes the effect of reinvested distributions. Calculations exclude purchase premiums and redemption fees which are borne by the shareholder.
(c) The net expense ratio does not include the effect of expense reductions.
* Annualized.
** Not annualized.
†† Calculation represents portfolio turnover rate of the Fund for the period August 1, 2005 through February 28, 2006.
See accompanying notes to the financial statements.
22
GMO Developed World Stock Fund
(A Series of GMO Trust)
Financial Highlights
(For a Class IV share outstanding throughout each period)
| Year Ended February 28/29, | |||||||||||||||
| 2008 | 2007 | 2006(a) | |||||||||||||
| Net asset value, beginning of period | $ | 24.59 | $ | 22.25 | $ | 20.24 | |||||||||
| Income (loss) from investment operations: | |||||||||||||||
| Net investment income (loss)† | 0.56 | 0.45 | 0.12 | ||||||||||||
| Net realized and unrealized gain (loss) | (0.74 | ) | 2.82 | 1.95 | |||||||||||
| Total from investment operations | (0.18 | ) | 3.27 | 2.07 | |||||||||||
| Less distributions to shareholders: | |||||||||||||||
| From net investment income | (0.68 | ) | (0.32 | ) | (0.06 | ) | |||||||||
| From net realized gains | (1.83 | ) | (0.61 | ) | — | ||||||||||
| Total distributions | (2.51 | ) | (0.93 | ) | (0.06 | ) | |||||||||
| Net asset value, end of period | $ | 21.90 | $ | 24.59 | $ | 22.25 | |||||||||
| Total Return(b) | (1.66 | )% | 14.88 | % | 10.23 | %** | |||||||||
| Ratios/Supplemental Data: | |||||||||||||||
| Net assets, end of period (000's) | $ | 206,408 | $ | 209,937 | $ | 137,409 | |||||||||
| Net expenses to average daily net assets | 0.57 | %(c) | 0.57 | % | 0.57 | %* | |||||||||
| Net investment income to average daily net assets | 2.22 | % | 1.93 | % | 1.20 | %* | |||||||||
| Portfolio turnover rate | 53 | % | 43 | % | 15 | %**†† | |||||||||
| Fees and expenses reimbursed by the Manager to average daily net assets: | 0.11 | % | 0.12 | % | 0.17 | %* | |||||||||
| Purchase premiums and redemption fees consisted of the following per share amounts:† | — | (d) | $ | 0.02 | $ | 0.06 | |||||||||
† Calculated using average shares outstanding throughout the period.
(a) Period from September 1, 2005 (commencement of operations) through February 28, 2006.
(b) The total return would have been lower had certain expenses not been reimbursed during the period shown and assumes the effect of reinvested distributions. Calculations exclude purchase premiums and redemption fees which are borne by the shareholder.
(c) The net expense ratio does not include the effect of expense reductions.
(d) For the year ended February 29, 2008, the class received no purchase premiums or redemption fees.
* Annualized.
** Not annualized.
†† Calculation represents portfolio turnover rate of the Fund for the period August 1, 2005 through February 28, 2006.
See accompanying notes to the financial statements.
23
GMO Developed World Stock Fund
(A Series of GMO Trust)
Notes to Financial Statements
February 29, 2008
1. Organization
GMO Developed World Stock Fund (the "Fund"), which commenced operations on August 1, 2005, is a series of GMO Trust (the "Trust"). The Fund is registered under the Investment Company Act of 1940, as amended, as an open-end, non-diversified management investment company. The Fund is advised and managed by Grantham, Mayo, Van Otterloo & Co. LLC (the "Manager" or "GMO"). The Trust was established as a Massachusetts business trust under the laws of the Commonwealth of Massachusetts on June 24, 1985. The Declaration of Trust permits the Trustees of the Trust ("Trustees") to create an unlimited number of series of shares ("Funds") and to subdivide Funds into classes.
The Fund seeks high total return. The Fund seeks to achieve its investment objective by outperforming the MSCI World Index. The Fund typically makes equity investments in companies from the world's developed markets, including the U.S.
Throughout the year ended February 29, 2008, the Fund had two classes of shares outstanding: Class III and Class IV. Each class of shares bears a different level of shareholder service fees.
2. Significant accounting policies
The following is a summary of significant accounting policies which are in conformity with accounting principles generally accepted in the United States of America ("U.S. GAAP") and which are consistently followed by the Fund in the preparation of its financial statements. The preparation of financial statements in accordance with U.S. GAAP requires management to make estimates and assumptions that affect the reported amounts and disclosures in the financial statements. Actual results could differ from those estimates. The accounting records of the Fund are maintained in U.S. dollars.
Portfolio valuation
Securities listed on a securities exchange for which market quotations are readily available are valued at the last sale price or official closing price on each business day, or if there is no such reported sale or official closing price, at the most recent quoted bid price. Unlisted securities for which market quotations are readily available are generally valued at the most recent quoted bid price. Short-term investments with a remaining maturity of sixty days or less are generally valued at amortized cost, which approximates fair value. Shares of investment funds are valued at their net asset value. Securities for which quotations are not readily available or whose values the Manager has determined to be unreliable are valued at fair value as determined in good faith by the Trustees or other persons acting at their direction pursuant to procedures approved by the Trustees. By its nature, a fair value price is a good faith est imate of the value of a security at a given point in time and may not reflect the value that would be realized if the security was sold and the differences could be material. Because many foreign equity securities markets and exchanges close prior to the close of the New York Stock Exchange ("NYSE"), closing prices for foreign securities in those markets or on those exchanges do not reflect the events that occur after that close but before the close of the NYSE. As a result, foreign equity securities are generally valued using fair value prices supplied by a third party vendor based on models to the extent that these fair value prices are available.
24
GMO Developed World Stock Fund
(A Series of GMO Trust)
Notes to Financial Statements — (Continued)
February 29, 2008
Foreign currency translation
The market values of foreign securities, currency holdings and other assets and liabilities are translated to U.S. dollars based on the current exchange rates each business day. Income and expenses denominated in foreign currencies are translated at current exchange rates when accrued or incurred. The Fund does not isolate realized and unrealized gains and losses attributable to changes in exchange rates from gains and losses that arise from changes in the market value of investments. Such fluctuations are included with net realized and unrealized gain or loss on investments. Net realized gains and losses on foreign currency transactions represent gains and losses on disposition of currencies and forward currency contracts, currency gains and losses realized between the trade and settlement dates on securities transactions, and the difference between the amount of investment income and foreign withholding taxes recorded on the F und's accounting records and the U.S. dollar equivalent amounts actually received or paid.
Forward currency contracts
The Fund may enter into forward currency contracts including forward cross currency contracts. A forward currency contract is an agreement between two parties to buy and sell a currency at a set price on a future date. The market value of a forward currency contract fluctuates with changes in forward currency exchange rates. Forward currency contracts are marked to market daily using rates supplied by a quotation service and changes in value are recorded by the Fund as an unrealized gain or loss. Realized gains or losses equal to the difference between the value of the contract at the time it was opened and the value at the time it was closed are recorded upon delivery or receipt of the currency or, if a forward currency contract is offset by entering into another forward currency contract with the same broker, upon settlement of the net gain or loss. These contracts may involve market risk in excess of the unrealized gain or lo ss reflected in the Fund's Statement of Assets and Liabilities. In addition, the Fund could be exposed to risk if the counterparties are unable to meet the terms of the contracts or if there are movements in currency values that are unfavorable to the Fund. Forward currency contracts outstanding at the end of the period are listed in the Fund's Schedule of Investments.
Futures contracts
The Fund may purchase and sell futures contracts. Upon entering into a futures contract, the Fund is required to deposit with the futures clearing broker an amount of cash, U.S. government and agency obligations, or other liquid assets in accordance with the initial margin requirements of the broker or exchange. In addition, the Fund maintains cash or securities in an amount that at least equals the net amount payable in the event the Fund must deliver the full amount of the contracts. Futures contracts are marked to market daily and an appropriate payable or receivable for the change in value ("variation margin") is recorded by the Fund. The payable or receivable is liquidated on the following business day. Gains or losses are recognized but not considered realized until the contracts expire or are closed. Futures contracts involve, to varying degrees, risk of loss in excess of the variation margin disclosed in the Statement of Assets and Liabilities. Under certain circumstances, futures exchanges may establish daily limits on the amount that the price of a futures contract can vary from the previous day's settlement price, thereby effectively preventing liquidation of unfavorable positions. Losses may arise from changes in the value of the underlying instrument if the Fund is unable to liquidate a futures position due to an illiquid secondary market for the contracts or the imposition of price
25
GMO Developed World Stock Fund
(A Series of GMO Trust)
Notes to Financial Statements — (Continued)
February 29, 2008
limits, or if counterparties do not perform under the contract terms. Futures contracts are generally valued at the settlement price established each day by the board of trade or exchange on which they are traded. Futures contracts outstanding at the end of the period are listed in the Fund's Schedule of Investments.
Options
The Fund may write call and put options. Writing options increases the Fund's exposure to the underlying instrument by, in the case of a call option, obligating the Fund to sell the underlying instrument at a set price to the option-holder and, in the case of a put option, obligating the Fund to purchase the underlying instrument at a set price from the option-holder. When the Fund writes a call or put option, an amount equal to the premium received is recorded as a liability and subsequently marked to market to reflect the current value of the option written. Premiums received from writing options which expire are treated as realized gains. Premiums received from writing options which are exercised or closed are added to the proceeds or offset against the amounts paid on the underlying future, security or currency transaction to determine the realized gain or loss. The Fund as a writer of an option has no control over whether t he underlying future, security or currency may be sold (call) or purchased (put) and as a result bears the market risk of an unfavorable change in the price of the future, security or currency underlying the written option. In the event that the Fund writes uncovered call options (i.e. options for investments that the Fund does not own), it bears the risk of incurring substantial losses if the price of the underlying instrument increases during the term of the option. There is the risk the Fund may not be able to enter into a closing transaction because of an illiquid market. There were no open written option contracts during the period.
The Fund may also purchase put and call options. Purchasing options alters the Fund's exposure to the underlying instrument by, in the case of a call option, entitling the Fund to purchase the underlying instrument at a set price from the writer of the option and, in the case of a put option, entitling the Fund to sell the underlying instrument at a set price to the writer of the option. The Fund pays a premium as a cost for a purchased option disclosed in the Schedule of Investments which is subsequently marked to market to reflect the current value of the option. Premiums paid for purchasing options which expire are treated as realized losses. Premiums paid for purchasing options which are exercised or closed are added to the amounts paid or offset against the proceeds on the closing transaction to determine the realized gain or loss. The risk associated with purchasing put and call options is limited to the premium paid. Ther e were no purchased option contracts outstanding at the end of the period.
Exchange traded options are valued at the last sale price, or if no sale is reported, the last bid price for purchased options and the last ask price for written options. Options traded over-the-counter are valued using prices supplied by a primary pricing source chosen by the Manager.
Swap agreements
The Fund may enter into swap agreements. A swap is an agreement to exchange the return generated by one instrument for the return generated by another instrument. Interest rate swap agreements involve the exchange by one party with another party of their respective commitments to pay or receive interest, e.g., an exchange of floating rate payments for fixed rate payments with respect to a notional amount of
26
GMO Developed World Stock Fund
(A Series of GMO Trust)
Notes to Financial Statements — (Continued)
February 29, 2008
principal. Total return swap agreements involve a commitment by one party in the agreement to pay interest in exchange for a market-linked return, both based on notional amounts. To the extent the total return of the security or index underlying the transaction exceeds or falls short of the offsetting interest rate obligation, the party will receive a payment from or make a payment to the counterparty, respectively. Forward spread lock swap agreements involve commitments to pay or receive a settlement amount calculated as the difference between the swap spread and a fixed spread, multiplied by the notional amount times the duration of the swap rate. The swap spread is the difference between the benchmark swap rate (market rate) and the specific treasury rate. Variance swap agreements involve commitments to pay or receive a settlement amount calculated as the difference between the annualized realized variance of returns on the u nderlying price and a fixed quantity, also known as the variance strike, over a period of time. In connection with these agreements, cash or securities may be set aside as collateral by the Fund's custodian or brokers in accordance with the terms of the swap agreement. The Fund earns or pays interest on cash set aside as collateral.
Swaps are marked to market daily using models that incorporate quotations from market makers and the change in value, if any, is recorded as unrealized gain or loss in the Statement of Operations. Payments received or made on swap contracts are recorded as realized gain or loss in the Statement of Operations. Gains or losses are realized upon early termination of the swap agreements. These financial instruments are not actively traded on financial markets. The values assigned to these instruments are based upon the best available information and because of the uncertainty of the valuation, these values may differ significantly from the values that would have been realized had a ready market for these instruments existed, and the differences could be material. Entering into these agreements involves, to varying degrees, elements of credit, legal, market and documentation risk in excess of the amounts recognized in the Statement o f Assets and Liabilities. Such risks involve the possibility that there will be no liquid market for these agreements, that the counterparties to the agreements may default on their obligations to perform or disagree as to the meaning of contractual terms in the agreements, or that there may be unfavorable changes in interest rates or the price of the index or security underlying these transactions. There were no swap agreements outstanding at the end of the period.
Repurchase agreements
The Fund may enter into repurchase agreements with banks and broker-dealers whereby the Fund acquires a security for cash and obtains a simultaneous commitment from the seller to repurchase the security at an agreed upon price and date. The Fund, through its custodian, takes possession of securities collateralizing the repurchase agreement. The collateral is marked to market daily to ensure that the market value of the underlying assets remains sufficient to protect the Fund in the event of default by the seller. Collateral for certain tri-party repurchase agreements is held at the counterparty's custodian in a segregated account for the benefit of the Fund and the counterparty. In connection with transactions in repurchase agreements, if the seller defaults or enters into insolvency proceedings and the value of the collateral declines, recovery of cash by the Fund may be delayed or limited. There were no repurchase agreements o utstanding at the end of the period.
27
GMO Developed World Stock Fund
(A Series of GMO Trust)
Notes to Financial Statements — (Continued)
February 29, 2008
Securities lending
The Fund may lend its securities to certain qualified broker-dealers. The loans are collateralized with cash or liquid securities with a market value at least equal to the market value of the securities on loan. As with other extensions of credit, the Fund may bear the risk of loss with respect to the investment of the collateral, the risk of delay in and/or inability to exercise its rights with respect to the collateral, and the risk of delay in recovery or loss of rights in the loaned securities should the borrower of the securities fail financially. If a loan is collateralized by U.S. government securities, the Fund receives a fee from the borrower. If a loan is collateralized by cash, the Fund typically invests the cash collateral for its own account in interest-bearing, short-term securities and pays a fee to the borrower that normally represents a portion of the Fund's earnings on the collateral. As of February 29, 2008, t he Fund had loaned securities valued by the Fund at $3,402,753, collateralized by cash in the amount of $3,664,337, which was invested in the Bank of New York Mellon Institutional Cash Reserves Fund.
Taxes and distributions
The Fund intends to qualify each tax year as a regulated investment company under Subchapter M of the Internal Revenue Code of 1986, as amended (the "Code"). The Fund intends to distribute substantially all of its net investment income and net realized short-term and long-term capital gains, if any, after giving effect to any available capital loss carryovers for U.S. federal income tax purposes. Therefore, no provision for U.S. federal income or excise tax is necessary. Taxes on foreign interest and dividend income are generally withheld in accordance with the applicable country's tax treaty with the United States. The foreign withholding rates applicable to a Fund's investments in certain foreign jurisdictions may be higher if a significant portion of the Fund is held by non-U.S. shareholders.
The Fund's policy is to declare and pay distributions from net investment income, if any, semiannually, and from net realized short-term and long-term capital gains, if any, at least annually. All distributions are paid in shares of the Fund, at net asset value, unless the shareholder elects to receive cash distributions. Distributions to shareholders are recorded by the Fund on the ex-dividend date.
Dividends received by shareholders of the Fund which are derived from foreign source income and foreign taxes paid by the Fund may be treated, to the extent allowable under the Code, as if received and paid by the shareholders of the Fund.
The Fund may be subject to capital gains and repatriation taxes imposed by certain countries in which it invests.
Income and capital gain distributions are determined in accordance with U.S. federal income tax regulations, which may differ from U.S. GAAP. Certain capital accounts in the financial statements are periodically adjusted for permanent differences in order to reflect their tax character. These adjustments have no impact on net assets or net asset value per share. Temporary differences which arise from recognizing certain items of income, expense, gain or loss in different periods for financial statement and tax purposes will reverse at some time in the future. Distributions in excess of net investment income or net
28
GMO Developed World Stock Fund
(A Series of GMO Trust)
Notes to Financial Statements — (Continued)
February 29, 2008
realized gains are temporary over distributions for financial statement purposes resulting from differences in the recognition or classification of income or distributions for financial statement and tax purposes.
U.S. GAAP and tax accounting differences primarily relate to passive foreign investment company transactions, losses on wash sale transactions, foreign currency transactions and derivative contract tansactions.
The following reclassification represents the amount necessary to report the stated components of net assets on a tax basis, excluding certain temporary differences, as of February 29, 2008. The financial highlights exclude these adjustments.
| Accumulated Undistributed Net Investment Income | Accumulated Net Realized Gain | Paid-in Capital | |||||||||
| $ | 8,521,409 | $ | (8,521,408 | ) | $ | (1 | ) | ||||
The tax character of distributions declared to shareholders is as follows:
| 2/29/2008 | 2/28/2007 | ||||||||||
| Ordinary income (including any short-term capital gains) | $ | 22,308,523 | $ | 12,486,683 | |||||||
| Long-term capital gains | 30,038,282 | 2,939,020 | |||||||||
| Total distributions | $ | 52,346,805 | $ | 15,425,703 | |||||||
Distributions in excess of tax basis earnings and profits, if significant, are reported in the financial statements as a tax return of capital.
As of February 29, 2008, the components of distributable earnings on a tax basis consisted of the following:
| Undistributed ordinary income | $ | 7,001,488 | |||||
| Undistributed long-term capital gain | $ | 4,422,310 | |||||
As of February 29, 2008, the approximate cost for U.S. federal income tax purposes and gross and net unrealized appreciation and depreciation in value of investments were as follows:
| Aggregate Cost | Gross Unrealized Appreciation | Gross Unrealized (Depreciation) | Net Unrealized Appreciation (Depreciation) | ||||||||||||
| $ | 528,908,745 | $ | 42,886,550 | $ | (57,158,666 | ) | $ | (14,272,116 | ) | ||||||
29
GMO Developed World Stock Fund
(A Series of GMO Trust)
Notes to Financial Statements — (Continued)
February 29, 2008
Security transactions and related investment income
Security transactions are accounted for on trade date. Dividend income, net of applicable foreign withholding taxes, if any, is recorded on the ex-dividend date, or when the Fund is informed of the ex-dividend date, if later. Interest income is recorded on the accrual basis and is adjusted for the amortization of premiums and accretion of discounts. Interest income on inflation indexed securities, if any, is accrued daily based upon an inflation adjusted principal. Additionally, any increase or decrease in the principal or face amount of the securities adjusted for inflation is recorded as interest income or loss. Income is not recognized on securities for which collection is not expected. Non-cash dividends, if any, are recorded at the fair market value of the securities received. In determining the net gain or loss on securities sold, the cost of securities is determined on the identified cost basis.
Expenses
The majority of expenses of the Trust are directly identifiable to an individual fund. Expenses which are not readily identifiable to a specific fund are allocated taking into consideration, among other things, the nature and type of expense and the relative size of the funds. Investment income, common expenses and realized and unrealized gains and losses are allocated pro rata among the classes of shares of the Fund based on the relative net assets of each class. Shareholder service fees, which are directly attributable to a class of shares, are charged to that class's operations.
Brown Brothers Harriman & Co. ("BBH") serves as custodian and fund accounting agent of the Fund. State Street Bank and Trust Company ("State Street") serves as transfer agent of the Fund. BBH and State Street's fees may be reduced by credits that are an earnings allowance calculated on the average daily cash balances the Fund maintains with each agent. Credit balances or expense reimbursements used to reduce fees, if any, are reported as a reduction of expenses in the Statement of Operations.
Purchase and redemption of Fund shares
As of February 29, 2008, the premium on cash purchases and fee on cash redemptions of Fund shares were each 0.25% of the amount invested or redeemed. An additional purchase premium and redemption fee of 0.005% is charged for any purchases/redemptions (or any portion of a purchase/redemption) effected in a currency other than the U.S. dollar. If the Manager determines that any portion of a cash purchase or redemption is offset by a corresponding cash redemption or purchase occurring on the same day, it will waive the purchase premium or redemption fee in an amount approximately equal to the fee with respect to that portion. In addition, the purchase premium or redemption fee charged by the Fund may be waived in extraordinary circumstances if the Fund will not incur transaction costs. All purchase premiums and redemption fees are paid to and recorded by the Fund as paid-in-capital. The Manager will waive the purchase premium relat ing to the in-kind portion of a purchase transaction except to the extent of certain estimated or known transaction costs (e.g. stamp duties and transfer taxes) incurred by the Fund in connection with the transfer of the purchasing shareholder's securities to the Fund. In-kind redemption transactions are generally not subject to redemption fees except to the extent those transactions include a cash component. However, when a substantial portion of a Fund is being redeemed, the Fund may assess estimated or known transaction costs. There is no premium for reinvested distributions.
30
GMO Developed World Stock Fund
(A Series of GMO Trust)
Notes to Financial Statements — (Continued)
February 29, 2008
Investment risks
There are certain additional risks involved in investing in foreign securities that are not inherent in investments in U.S. securities. These risks may involve adverse political and economic developments including the possible imposition of capital controls or other foreign governmental laws or restrictions. In addition, the securities of some foreign companies and securities markets are less liquid and at times may be more volatile than securities of comparable U.S. companies and U.S. securities markets.
Recently issued accounting pronouncements
In June 2006, the Financial Accounting Standards Board ("FASB") issued FASB Interpretation No. 48, Accounting for Uncertainty in Income Taxes – an Interpretation of FASB Statement No. 109 ("FIN 48"). FIN 48 clarifies the accounting for uncertainty in income taxes recognized in accordance with FASB Statement No. 109, Accounting for Income Taxes. FIN 48 prescribes a recognition threshold and measurement attribute for a tax position taken or expected to be taken in the tax return that could impact the Fund's financial statements. It also provides guidance in relation to the Fund's financial statements on classification of tax benefits or liabilities, interest and penalties, accounting in interim periods, disclosure, and transition. FIN 48 is effective for fiscal years beginning after December 15, 2006 for registered investment companies. Management has evaluated the effects of applying the various provisions of FIN 48 and has determined that the adoption of FIN 48 does not have a material effect on the Fund's financial statements. The Fund's federal tax returns for the prior three fiscal years remain subject to examination by the Internal Revenue Service. Management will continue to monitor the rules and guidance pertaining to FIN 48 and will take action if appropriate.
In September 2006, the FASB issued Statement of Financial Accounting Standards No. 157 ("FAS 157"), "Fair Value Measurements." FAS 157 defines fair value, establishes a framework for measuring fair value in accordance with generally accepted accounting principles and expands disclosure about fair value measurements. FAS 157 is effective for fiscal years beginning after November 15, 2007. Management is currently evaluating the impact the adoption of FAS 157 will have on the Fund's financial statement disclosures.
3. Fees and other transactions with affiliates
GMO earns a management fee paid monthly at the annual rate of 0.47% of average daily net assets. The Fund has adopted a Shareholder Service Plan under which the Fund pays GMO a shareholder service fee for client and shareholder service, reporting, and other support. Pursuant to the Shareholder Service Plan, the shareholder service fee is calculated based on average daily net assets at the annual rate of 0.15% for Class III shares and 0.10% for Class IV shares.
The Manager has contractually agreed to reimburse the Fund for Fund expenses through at least June 30, 2008 to the extent the Fund's total annual operating expenses (excluding shareholder service fees, fees and
31
GMO Developed World Stock Fund
(A Series of GMO Trust)
Notes to Financial Statements — (Continued)
February 29, 2008
expenses of the independent Trustees of the Trust, fees and expenses for legal services not approved by the Manager for the Trust, compensation and expenses of the Trust's Chief Compliance Officer ("CCO") (excluding any employee benefits), brokerage commissions, securities lending fees and expenses, interest expense, transfer taxes, and other investment-related costs (including expenses associated with investments in any company that is an investment company or would be an investment company under the 1940 Act, but for the exceptions to the definition of investment company provided in Section 3(c)(1) and 3(c)(7) of the 1940 Act), hedging transaction fees, extraordinary, non-recurring and certain other unusual expenses (including taxes)) exceed 0.47% of the Fund's average daily net assets.
The Fund's portion of the fees paid by the Trust to the independent Trustees and CCO during the year ended February 29, 2008, was $4,281 and $2,036, respectively. The compensation and expenses of the CCO are included in miscellaneous expenses in the Statement of Operations. No remuneration was paid by the Fund to any other officer of the Trust.
4. Purchases and sales of securities
Cost of purchases and proceeds from sales of securities, excluding short-term investments, for the year ended February 29, 2008 aggregated $333,949,767 and $260,206,165, respectively.
5. Guarantees
In the normal course of business the Fund enters into contracts with third-party service providers that contain a variety of representations and warranties and which provide general indemnifications. The Fund's maximum exposure under these arrangements is unknown, as this would involve future claims that may be made against the Fund that have not yet occurred. Based on experience, management is of the view that the risk of loss in connection with these potential indemnification obligations is remote; however, there can be no assurance that material liabilities related to such obligations will not arise in the future that could adversely impact the Fund.
6. Principal shareholders and related parties
As of February 29, 2008, 39.98% of the outstanding shares of the Fund were held by two shareholders, each holding in excess of 10% of the Fund's outstanding shares. No other shareholder owned in excess of 10% of the outstanding shares of the Fund. Investment activities of these shareholders may have a material effect on the Fund.
As of February 29, 2008, there were no shares held by related parties.
32
GMO Developed World Stock Fund
(A Series of GMO Trust)
Notes to Financial Statements — (Continued)
February 29, 2008
7. Share transactions
The Declaration of Trust permits the Trustees to issue an unlimited number of shares of beneficial interest (without par value). Transactions in Fund shares were as follows:
| Year Ended February 29, 2008 | Year Ended February 28, 2007 | ||||||||||||||||||
| Class III: | Shares | Amount | Shares | Amount | |||||||||||||||
| Shares sold | 2,679,838 | $ | 67,974,333 | 3,144,280 | $ | 77,151,938 | |||||||||||||
| Shares issued to shareholders in reinvestment of distributions | 1,157,471 | 28,331,295 | 380,037 | 9,070,500 | |||||||||||||||
| Shares repurchased | (1,177,880 | ) | (29,566,075 | ) | (99,934 | ) | (2,314,878 | ) | |||||||||||
| Purchase premiums | — | 170,362 | — | 232,152 | |||||||||||||||
| Redemption fees | — | 83,166 | — | 6,931 | |||||||||||||||
| Net increase (decrease) | 2,659,429 | $ | 66,993,081 | 3,424,383 | $ | 84,146,643 | |||||||||||||
| Year Ended February 29, 2008 | Year Ended February 28, 2007 | ||||||||||||||||||
| Class IV: | Shares | Amount | Shares | Amount | |||||||||||||||
| Shares sold | — | $ | — | 2,117,902 | $ | 51,844,000 | |||||||||||||
| Shares issued to shareholders in reinvestment of distributions | 889,056 | 21,793,212 | 243,970 | 5,801,131 | |||||||||||||||
| Shares repurchased | — | — | — | — | |||||||||||||||
| Purchase premiums | — | — | — | 156,000 | |||||||||||||||
| Redemption fees | — | — | — | — | |||||||||||||||
| Net increase (decrease) | 889,056 | $ | 21,793,212 | 2,361,872 | $ | 57,801,131 | |||||||||||||
33
Report of Independent Registered Public Accounting Firm
To the Trustees of GMO Trust and the Shareholders of
GMO Developed World Stock Fund
In our opinion, the accompanying statement of assets and liabilities, including the schedule of investments, and the related statements of operations and of changes in net assets and the financial highlights present fairly, in all material respects, the financial position of GMO Developed World Stock Fund (the "Fund") at February 29, 2008, the results of its operations for the year then ended, the changes in its net assets for each of the two years in the period then ended and the financial highlights for each of the periods indicated, in conformity with accounting principles generally accepted in the United States of America. These financial statements and financial highlights (hereafter referred to as "financial statements") are the responsibility of the Fund's management; our responsibility is to express an opinion on these financial statements based on our audits. We conducted our audits of these financial statements in acco rdance with the standards of the Public Company Accounting Oversight Board (United States). Those standards require that we plan and perform the audit to obtain reasonable assurance about whether the financial statements are free of material misstatement. An audit includes examining, on a test basis, evidence supporting the amounts and disclosures in the financial statements, assessing the accounting principles used and significant estimates made by management, and evaluating the overall financial statement presentation. We believe that our audits, which included confirmation of securities at February 29, 2008 by correspondence with the custodian and brokers, provide a reasonable basis for our opinion.
PricewaterhouseCoopers LLP
Boston, Massachusetts
April 29, 2008
34
GMO Developed World Stock Fund
(A Series of GMO Trust)
Fund Expenses
February 29, 2008 (Unaudited)
Expense Examples: The following information is in relation to expenses for the six month period ended February 29, 2008.
As a shareholder of the Fund, you may incur two types of costs: (1) transaction costs, including purchase premiums and redemption fees; and (2) ongoing costs, including management fees, shareholder service fees, and other Fund expenses. This example is intended to help you understand your ongoing costs (in dollars) of investing in the Fund and to compare these costs with the ongoing costs of investing in other mutual funds.
These examples are based on an investment of $1,000 invested at the beginning of the period and held for the entire period, September 1, 2007 through February 29, 2008.
Actual Expenses
The first line of the table below provides information about actual account values and actual expenses. You may use the information in this line, together with the amount you invested, to estimate the expenses that you paid over the period. Simply divide your account value by $1,000 (for example, a $10,000,000 account value divided by $1,000 = 10,000), then multiply the result by the number in the first line under the heading entitled "Net Expense Incurred" to estimate the expenses you paid on your account during this period.
Hypothetical Example for Comparison Purposes
The second line of the table below provides information about hypothetical account values and hypothetical expenses based on the Fund's actual expense ratio and an assumed rate of return of 5% per year before expenses, which is not the Fund's actual return. The hypothetical account values and expenses may not be used to estimate the actual ending account balance or expenses you paid for the period. You may use this information to compare the ongoing costs of investing in the Fund with other funds. To do so, compare this 5% hypothetical example with the 5% hypothetical examples that appear in the shareholder reports of other funds.
Please note that the expenses shown in the table are meant to highlight your ongoing costs only and do not reflect any transactional costs, such as purchase premiums and redemption fees. Therefore, the second line of the table is useful in comparing ongoing costs only, and will not help you determine the relative total costs of owning different funds. In addition, if these transactional costs were included, your costs would have been higher.
| Annualized Net Expense Ratio | Beginning Account Value | Ending Account Value | Net Expense Incurred* | ||||||||||||||||
| Class III | |||||||||||||||||||
| 1) Actual | 0.62 | % | $ | 1,000.00 | $ | 929.00 | $ | 2.97 | |||||||||||
| 2) Hypothetical | 0.62 | % | $ | 1,000.00 | $ | 1,021.78 | $ | 3.12 | |||||||||||
| Class IV | |||||||||||||||||||
| 1) Actual | 0.57 | % | $ | 1,000.00 | $ | 929.00 | $ | 2.73 | |||||||||||
| 2) Hypothetical | 0.57 | % | $ | 1,000.00 | $ | 1,022.03 | $ | 2.87 | |||||||||||
* Expenses are calculated using each Class's annualized net expense ratio for the six months ended February 29, 2008, multiplied by the average account value over the period, multiplied by 182 days in the period, divided by 366 days in the year.
35
GMO Developed World Stock Fund
(A Series of GMO Trust)
Tax Information for the Tax Year Ended February 29, 2008 (Unaudited)
The Fund will notify shareholders of amounts for use in preparing 2008 income tax forms in January 2009.
The Fund's distributions to shareholders include $30,038,282 from long-term capital gains.
For taxable, non-corporate shareholders, 44.98% of the Fund's income and short-term capital gains, if any, distributed in the Fund's fiscal year ended February 29, 2008 represents qualified dividend income subject to the 15% rate category.
For corporate shareholders, 20.04% of the income and short-term capital gains, if any, distributed in the Fund's fiscal year ended February 29, 2008 qualified for the dividends-received deduction.
The Fund hereby designates as qualified short-term capital gains with respect to its taxable year ended February 29, 2008, $7,895,822 or if determined to be different, the qualified short-term gains of such year.
36
Trustees and Officers (Unaudited)
The following tables list the Trust's Trustees and Officers as of the date of this report; their address and date of birth ("DOB"); their position with the Trust; the length of time holding that position with the Trust; their principal occupation(s) during the past five years; the number of portfolios in the fund complex they oversee; and other directorships they hold in companies subject to registration or reporting requirements of the Securities Exchange Act of 1934 (generally called "public companies") or in registered investment companies. The Trust's Statement of Additional Information ("SAI") includes additional information about the Trust's trustees, including changes subsequent to the date of the report. The SAI is available, without charge, upon request by writing GMO, c/o GMO Trust, 40 Rowes Wharf, Boston, MA 02110.
Independent Trustees:
| Name, Address, and DOB | Position(s) Held with Trust | Term of Office1 and Length of Time Served | Principal Occupation(s) During Past Five Years | Number of Portfolios in Fund Complex Overseen by Trustee | Other Directorships Held by Trustee | ||||||||||||||||||
| Donald W. Glazer, Esq. c/o GMO Trust 40 Rowes Wharf Boston, MA 02110 DOB: 07/26/1944 | Chairman of the Board of Trustees | Chairman of the Board of Trustees since March 2005; Lead Independent Trustee (September 2004 – March 2005); Trustee since December 2000. | Consultant – Law and Business2; Vice Chair (since 2002) and Secretary, Provant, Inc. (provider of personnel performance improvement services and training products); Author of Legal Treatises. | 47 | None. | ||||||||||||||||||
1 Each Trustee is elected to serve during the continued lifetime of the Trust until he/she dies, resigns or is removed, or if sooner, until the next meeting of Shareholders called for the purpose of electing Trustees and until the election and qualification of his/her successor.
2 As part of Mr. Glazer's work as a consultant, he provides part-time consulting services to Goodwin Procter LLP ("Goodwin"). Goodwin has provided legal services to Renewable Resources, LLC, an affiliate of GMO; GMO, in connection with its relationship with Renewable Resources; and funds managed by Renewable Resources. Mr. Glazer has represented that he has no financial interest in, and is not involved in the provision of, such legal services. In the calendar years ended December 31, 2006 and December 31, 2007, these entities paid $825,738 and $291,721 respectively, in legal fees and disbursements to Goodwin.
37
Independent Trustees — (Continued)
| Name, Address, and DOB | Position(s) Held with Trust | Term of Office1 and Length of Time Served | Principal Occupation(s) During Past Five Years | Number of Portfolios in Fund Complex Overseen by Trustee | Other Directorships Held by Trustee | ||||||||||||||||||
| Jay O. Light c/o GMO Trust 40 Rowes Wharf Boston, MA 02110 DOB: 10/03/1941 | Trustee | Since May 1996. | Dean (since April 2006), Acting Dean (August 2005 – April 2006), Senior Associate Dean (1998 – 2005), and Professor of Business Administration, Harvard Business School. | 47 | Director of Harvard Management Company, Inc.3 and Verde, Inc.; Director of Partners HealthCare System, Inc. and Chair of its Investment Committee.4 | ||||||||||||||||||
| W. Nicholas Thorndike c/o GMO Trust 40 Rowes Wharf Boston, MA 02110 DOB: 03/28/1933 | Trustee | Since March 2005. | Director or trustee of various corporations and charitable organizations, including Courier Corporation (a book publisher and manufacturer) (July 1989 – present); Putnam Funds (December 1992 – June 2004); and Providence Journal (a newspaper publisher) (December 1986 – December 2003). | 47 | Director of Courier Corporation (a book publisher and manufacturer); Member of the Investment Committee of Partners HealthCare System, Inc.4 | ||||||||||||||||||
1 Each Trustee is elected to serve during the continued lifetime of the Trust until he/she dies, resigns or is removed, or if sooner, until the next meeting of Shareholders called for the purpose of electing Trustees and until the election and qualification of his/her successor.
3 Harvard Management Company, Inc. is a client of the Manager.
4 Partners HealthCare System, Inc. is a client of the Manager.
38
Principal Officers:
| Name, Address, and DOB | Position(s) Held with Trust | Term of Office5 and Length of Time Served | Principal Occupation(s) During Past Five Years | ||||||||||||
| Scott Eston c/o GMO Trust 40 Rowes Wharf Boston, MA 02110 DOB: 01/20/1956 | President and Chief Executive Officer | President and Chief Executive Officer since October 2002; Chief Financial Officer, November 2006 – February 2007. | Chief Financial Officer, Chief Operating Officer and Member, Grantham, Mayo, Van Otterloo & Co. LLC. | ||||||||||||
| Sheppard N. Burnett c/o GMO Trust 40 Rowes Wharf Boston, MA 02110 DOB: 10/24/1968 | Treasurer and Chief Financial Officer | Chief Financial Officer since March 2007; Treasurer since November 2006; Assistant Treasurer, September 2004 – November 2006. | Fund Administration Staff, Grantham, Mayo, Van Otterloo & Co. LLC (June 2004 – present); Vice President, Director of Tax, Columbia Management Group (2002 – 2004). | ||||||||||||
| Brent C. Arvidson c/o GMO Trust 40 Rowes Wharf Boston, MA 02110 DOB: 06/26/1969 | Assistant Treasurer | Since August 1998. | Senior Fund Administrator, Grantham, Mayo, Van Otterloo & Co. LLC. | ||||||||||||
| John L. Nasrah c/o GMO Trust 40 Rowes Wharf Boston, MA 02110 DOB: 05/27/1977 | Assistant Treasurer | Since March 2007. | Fund Administrator, Grantham, Mayo, Van Otterloo & Co. LLC (September 2004 – present); Tax Analyst, Bain & Company, Inc (June 2003 – September 2004); Senior Tax Associate, PricewaterhouseCoopers LLP (2001 – 2003). | ||||||||||||
| Mahmoodur Rahman c/o GMO Trust 40 Rowes Wharf Boston, MA 02110 DOB: 11/30/1967 | Assistant Treasurer | Since September 2007. | Fund Administrator, Grantham, Mayo, Van Otterloo & Co. (April 2007 – present); Vice President and Senior Tax Manager, Massachusetts Financial Services Company (January 2000 – April 2007). | ||||||||||||
5 Officers are elected to hold such office until their successor is elected and qualified to carry out the duties and responsibilities of their office, or until he or she resigns or is removed from office.
39
Principal Officers — (Continued)
| Name, Address, and DOB | Position(s) Held with Trust | Term of Office5 and Length of Time Served | Principal Occupation(s) During Past Five Years | ||||||||||||
| Michael E. Gillespie c/o GMO Trust 40 Rowes Wharf Boston, MA 02110 DOB: 02/18/1958 | Chief Compliance Officer | Since March 2005. | Vice President of Compliance (June 2004 – February 2005) and Director of Domestic Compliance (March 2002 – June 2004), Fidelity Investments; Vice President and Senior Counsel, State Street Bank and Trust Company (May 1998 – March 2002). | ||||||||||||
| Jason B. Harrison c/o GMO Trust 40 Rowes Wharf Boston, MA 02110 DOB: 01/29/1977 | Vice President and Clerk | Vice President since November 2006; Clerk since March 2006. | Legal Counsel, Grantham, Mayo, Van Otterloo & Co. LLC (since February 2006) and Attorney, Ropes & Gray LLP (September 2002 – February 2006). | ||||||||||||
| David L. Bohan c/o GMO Trust 40 Rowes Wharf Boston, MA 02110 DOB: 06/21/1964 | Vice President and Assistant Clerk | Vice President since March 2005; Assistant Clerk since March 2006. | Legal Counsel, Grantham, Mayo, Van Otterloo & Co. LLC (September 2003 – present); Attorney, Goodwin Procter LLP (September 1996 – September 2003). | ||||||||||||
| Gregory L. Pottle c/o GMO Trust 40 Rowes Wharf Boston, MA 02110 DOB: 07/09/1971 | Vice President and Assistant Clerk | Since November 2006. | Legal Counsel, Grantham, Mayo, Van Otterloo & Co. LLC. | ||||||||||||
| Anne K. Trinque c/o GMO Trust 40 Rowes Wharf Boston, MA 02110 DOB: 04/15/1978 | Vice President and Assistant Clerk | Since September 2007. | Legal Counsel, Grantham, Mayo, Van Otterloo & Co. LLC (since January 2007); Attorney, Goodwin Procter LLP (September 2003 – January 2007). | ||||||||||||
| Cheryl Wakeham c/o GMO Trust 40 Rowes Wharf Boston, MA 02110 DOB: 10/29/1958 | Anti-Money Laundering Officer | Since December 2004. | Manager, Client Service Administration, Grantham, Mayo, Van Otterloo & Co. LLC. | ||||||||||||
5 Officers are elected to hold such office until their successor is elected and qualified to carry out the duties and responsibilities of their office, or until he or she resigns or is removed from office.
40
GMO Emerging Countries Fund
(A Series of GMO Trust)
Annual Report
February 29, 2008
For a free copy of the Fund's proxy voting guidelines, shareholders may call 1-617-346-7646 (collect), visit our website at www.gmo.com, or visit the Securities and Exchange Commission's website at www.sec.gov. Information regarding how the Fund voted proxies relating to portfolio securities during the most recent 12-month period ended June 30 is available on our website at www.gmo.com, or on the Securities and Exchange Commission's website at www.sec.gov.
The Fund files its complete schedule of portfolio holdings with the Securities and Exchange Commission for the first and third quarter of each fiscal year on Form N-Q, which is available on the Commission's website at www.sec.gov. The Fund's Form N-Q may be reviewed and copied at the Commission's Public Reference Room in Washington, D.C. Information on the operation of the Public Reference Room may be obtained by calling 1-800-SEC-0330. The Fund has a policy with respect to disclosure of portfolio holdings under which it may also make available on GMO's website (www.gmo.com) a complete schedule of portfolio holdings.
This report is prepared for the general information of shareholders. It is authorized for distribution to prospective investors only when preceded or accompanied by a prospectus for the GMO Trust.
GMO Emerging Countries Fund
(A Series of GMO Trust)
Portfolio Management
Day-to-day management of the Fund's portfolio is the responsibility of the Emerging Markets Division at Grantham, Mayo, Van Otterloo & Co. LLC.
Management Discussion and Analysis of Fund Performance
The Class III shares of the GMO Emerging Countries Fund returned +30.7% for the fiscal year ended February 29, 2008, as compared to +32.9% for the S&P/IFC (Investable) Composite Index. The Fund was invested substantially in emerging markets equities throughout the fiscal year.
Country selection detracted 2.2% from performance during the period. The Fund's overweight in Brazil and underweights in Russia and South Africa contributed to performance. The Fund's underweight in India and overweights in Korea and Taiwan detracted from performance.
Stock selection was flat during the fiscal year. Stock selection was successful in China, India, Indonesia, and Taiwan. Stock selection in Korea detracted from performance.
The views expressed herein are exclusively those of Grantham, Mayo, Van Otterloo & Co. LLC Management as of the date of this report and are subject to change. GMO disclaims any responsibility to update such views. They are not meant as investment advice.
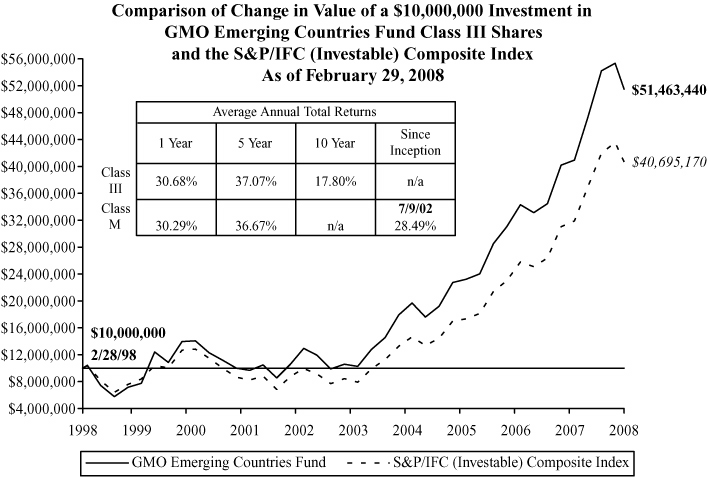
Performance data quoted represents past performance and is not indicative of future results. The investment return and principal value of an investment will fluctuate so that an investor's shares, when redeemed, may be worth more or less than their original cost. Current performance data may be lower or higher than the performance data provided herein. To obtain performance information to the most recent month-end, visit www.gmo.com. Performance shown is net of all fees after reimbursement from the Manager. Returns would have been lower had certain expenses not been reimbursed during the periods shown and do not include the effect of taxes on distributions and redemptions. All information is unaudited. Performance for Class M shares will vary due to different fees.
GMO Emerging Countries Fund
(A Series of GMO Trust)
Investments Concentration Summary
February 29, 2008 (Unaudited)
| Asset Class Summary | % of Total Net Assets | ||||||
| Common Stocks | 83.0 | % | |||||
| Preferred Stocks | 12.5 | ||||||
| Short-Term Investments | 3.5 | ||||||
| Rights and Warrants | 0.0 | ||||||
| Other | 1.0 | ||||||
| 100.0 | % | ||||||
| Country Summary | % of Equity Investments | ||||||
| Brazil | 19.3 | % | |||||
| South Korea | 16.4 | ||||||
| Taiwan | 12.6 | ||||||
| Russia | 11.2 | ||||||
| China | 9.5 | ||||||
| Thailand | 5.4 | ||||||
| India | 5.4 | ||||||
| Malaysia | 4.6 | ||||||
| South Africa | 4.0 | ||||||
| Turkey | 3.2 | ||||||
| Indonesia | 1.9 | ||||||
| Israel | 1.6 | ||||||
| Philippines | 1.2 | ||||||
| Hungary | 1.2 | ||||||
| Poland | 1.1 | ||||||
| Chile | 0.7 | ||||||
| Mexico | 0.6 | ||||||
| Pakistan | 0.1 | ||||||
| 100.0 | % | ||||||
1
GMO Emerging Countries Fund
(A Series of GMO Trust)
Investments Concentration Summary — (Continued)
February 29, 2008 (Unaudited)
| Industry Sector Summary | % of Equity Investments | ||||||
| Energy | 24.0 | % | |||||
| Financials | 20.3 | ||||||
| Materials | 16.5 | ||||||
| Information Technology | 10.4 | ||||||
| Telecommunication Services | 9.0 | ||||||
| Industrials | 9.0 | ||||||
| Consumer Discretionary | 4.7 | ||||||
| Consumer Staples | 3.1 | ||||||
| Utilities | 2.0 | ||||||
| Health Care | 1.0 | ||||||
| 100.0 | % | ||||||
2
GMO Emerging Countries Fund
(A Series of GMO Trust)
Schedule of Investments
(showing percentage of total net assets)
February 29, 2008
| Shares | Description | Value ($) | |||||||||||||
| COMMON STOCKS — 83.0% | |||||||||||||||
| Brazil — 7.0% | |||||||||||||||
| 24,400 | B2W Companhia Global do Varejo | 1,024,422 | |||||||||||||
| 7,880 | Banco Bradesco SA Sponsored ADR | 247,353 | |||||||||||||
| 102,440 | Banco do Brasil SA | 1,712,482 | |||||||||||||
| 60,100 | Bolsa de Mercadorias e Futuros | 640,768 | |||||||||||||
| 6,500 | Bovespa Holding SA | 101,857 | |||||||||||||
| 2,734 | Companhia de Bebidas das Americas | 206,937 | |||||||||||||
| 1,920 | Companhia Energetica de Minas Gerais Sponsored ADR | 36,538 | |||||||||||||
| 41,309 | Companhia Saneamento Basico Sao Paulo | 981,977 | |||||||||||||
| 34,314 | Companhia Siderurgica Nacional SA | 1,280,358 | |||||||||||||
| 83,000 | Companhia Vale do Rio Doce | 2,879,061 | |||||||||||||
| 68,370 | Companhia Vale do Rio Doce ADR | 2,382,011 | |||||||||||||
| 24,700 | Cyrela Brazil Realty SA | 394,359 | |||||||||||||
| 25,400 | Electrobras (Centro) | 373,543 | |||||||||||||
| 9,100 | Empresa Brasileira de Aeronautica SA Sponsored ADR | 403,312 | |||||||||||||
| 49,100 | Investimentos Itau SA | 522,328 | |||||||||||||
| 93,670 | Petroleo Brasileiro SA (Petrobras) | 5,411,601 | |||||||||||||
| 47,830 | Petroleo Brasileiro SA (Petrobras) ADR | 5,612,372 | |||||||||||||
| 22,023 | Souza Cruz SA | 641,117 | |||||||||||||
| 7,100 | Tele Norte Leste Participacoes SA | 268,281 | |||||||||||||
| 35,620 | Uniao de Bancos Brasileiros SA | 482,348 | |||||||||||||
| 12,400 | Unibanco-Uniao de Bancos Brasileiros SA GDR | 1,681,688 | |||||||||||||
| 17,650 | Usinas Siderurgicas de Minas Gerais SA | 1,059,355 | |||||||||||||
| Total Brazil | 28,344,068 | ||||||||||||||
| Chile — 0.7% | |||||||||||||||
| 9,802 | Banco de Chile ADR | 554,499 | |||||||||||||
| 12,490 | Banco Santander Chile SA ADR | 646,482 | |||||||||||||
| 11,050 | Compania Cervecerias Unidas ADR | 367,081 | |||||||||||||
| 25,820 | Compania de Telecommunicaciones de Chile ADR | 206,818 | |||||||||||||
| 12,610 | Distribucion y Servicio ADR | 325,464 | |||||||||||||
| 41,660 | Lan Airlines SA Sponsored ADR | 557,411 | |||||||||||||
| Total Chile | 2,657,755 | ||||||||||||||
See accompanying notes to the financial statements.
3
GMO Emerging Countries Fund
(A Series of GMO Trust)
Schedule of Investments — (Continued)
(showing percentage of total net assets)
February 29, 2008
| Shares | Description | Value ($) | |||||||||||||
| China — 9.1% | |||||||||||||||
| 474,000 | Air China Ltd Class H | 444,480 | |||||||||||||
| 366,000 | Aluminum Corp of China Ltd | 709,973 | |||||||||||||
| 60,000 | Anhui Conch Cement Co Ltd Class H | 462,459 | |||||||||||||
| 2,200 | Baidu.com Inc Sponsored ADR * | 552,926 | |||||||||||||
| 3,218,000 | Bank of China Ltd Class H | 1,347,943 | |||||||||||||
| 196,000 | China Communications Construction Co Ltd Class H | 507,842 | |||||||||||||
| 2,628,000 | China Construction Bank Class H | 1,991,137 | |||||||||||||
| 232,200 | China Cosco Holdings Co Ltd | 676,123 | |||||||||||||
| 178,897 | China International Marine Containers Co Ltd Class B | 320,000 | |||||||||||||
| 154,000 | China Life Insurance Co Ltd Class H | 598,024 | |||||||||||||
| 456,500 | China Merchants Bank Co Ltd Class H | 1,584,647 | |||||||||||||
| 140,000 | China Merchants Holdings International Co Ltd | 751,471 | |||||||||||||
| 407,964 | China Mobile Ltd | 6,108,502 | |||||||||||||
| 3,872 | China Mobile Ltd Sponsored ADR | 288,929 | |||||||||||||
| 144,600 | China Netcom Group | 445,754 | |||||||||||||
| 1,833,883 | China Petroleum & Chemical Corp Class H | 2,004,255 | |||||||||||||
| 178,000 | China Resources Enterprise Ltd | 631,929 | |||||||||||||
| 2,460 | China Telecom Corp Ltd ADR | 180,589 | |||||||||||||
| 249,400 | China Telecom Corp Ltd Class H | 183,676 | |||||||||||||
| 1,294,000 | China Travel International Investment Hong Kong Ltd | 696,947 | |||||||||||||
| 1,822,000 | CNOOC Ltd | 3,025,888 | |||||||||||||
| 172,000 | Cosco Pacific Ltd | 370,985 | |||||||||||||
| 1,024,890 | Denway Motors Ltd | 518,049 | |||||||||||||
| 11,020 | Focus Media Holding Ltd ADR * | 555,077 | |||||||||||||
| 215,586 | Fountain Set Holdings Ltd | 43,418 | |||||||||||||
| 376,100 | Guangdong Investments Ltd | 199,319 | |||||||||||||
| 452,000 | Huaneng Power International Inc Class H | 369,323 | |||||||||||||
| 1,964,000 | Industrial and Commercial Bank of China Ltd Class H | 1,362,531 | |||||||||||||
| 132,000 | Kingboard Chemical Holdings Ltd | 586,717 | |||||||||||||
| 190,000 | Parkson Retail Group Ltd | 1,977,880 | |||||||||||||
| 2,529,553 | PetroChina Co Ltd Class H | 3,702,705 | |||||||||||||
| 234,000 | PICC Property & Casualty Co Ltd Class H | 245,367 | |||||||||||||
| 85,000 | Ping An Insurance (Group) Co of China Ltd Class H | 643,788 | |||||||||||||
| 3,510,000 | Semiconductor Manufacturing International Corp * | 281,610 | |||||||||||||
See accompanying notes to the financial statements.
4
GMO Emerging Countries Fund
(A Series of GMO Trust)
Schedule of Investments — (Continued)
(showing percentage of total net assets)
February 29, 2008
| Shares | Description | Value ($) | |||||||||||||
| China — continued | |||||||||||||||
| 308,400 | Shanghai Industrial Holdings Ltd | 1,257,622 | |||||||||||||
| 436,000 | Sinofert Holdings Ltd | 434,997 | |||||||||||||
| 492,000 | Sinopec Shanghai Petrochemical Co Ltd Class H | 230,348 | |||||||||||||
| 6,250 | Suntech Power Holdings Co Ltd ADR * | 232,312 | |||||||||||||
| Total China | 36,525,542 | ||||||||||||||
| Hungary — 1.1% | |||||||||||||||
| 18,240 | MOL Magyar Olaj es Gazipari Nyrt (New Shares) | 2,484,780 | |||||||||||||
| 33,140 | OTP Bank Nyrt | 1,339,100 | |||||||||||||
| 2,690 | Richter Gedeon Nyrt | 580,661 | |||||||||||||
| Total Hungary | 4,404,541 | ||||||||||||||
| India — 5.1% | |||||||||||||||
| 11,400 | Axis Bank Ltd | 286,446 | |||||||||||||
| 1,160 | BF Utilities Ltd * | 34,334 | |||||||||||||
| 6,340 | Bharat Heavy Electricals Ltd | 356,094 | |||||||||||||
| 26,820 | Bharti Airtel Ltd * | 546,661 | |||||||||||||
| 38,220 | Canara Bank Ltd | 259,019 | |||||||||||||
| 78,690 | GAIL India Ltd | 819,148 | |||||||||||||
| 74,430 | Hindalco Industries Ltd | 370,754 | |||||||||||||
| 5,000 | Hindalco Industries Ltd GDR 144A | 24,150 | |||||||||||||
| 53,950 | Hindalco Industries Ltd GDR 144A (Registered Shares) (Luxembourg Exchange) | 260,578 | |||||||||||||
| 28,511 | Hindustan Zinc Ltd | 461,608 | |||||||||||||
| 2,740 | Housing Development Finance Corp Ltd | 188,431 | |||||||||||||
| 16,670 | ICICI Bank Ltd | 444,290 | |||||||||||||
| 23,600 | Indiabulls Financial Services Ltd | 354,169 | |||||||||||||
| 14,180 | Indiabulls Real Estate Ltd * | 221,432 | |||||||||||||
| 17,500 | Indiabulls Securities Ltd | 164,460 | |||||||||||||
| 41,550 | Indian Oil Corp Ltd | 572,587 | |||||||||||||
| 7,180 | Infosys Technologies Ltd | 274,089 | |||||||||||||
| 17,162 | Jaiprakash Associates Ltd | 110,933 | |||||||||||||
| 5,080 | Jindal Steel & Power Ltd | 287,188 | |||||||||||||
| 13,310 | JSW Steel Ltd | 347,805 | |||||||||||||
| 26,670 | Larsen & Toubro Ltd | 2,314,385 | |||||||||||||
See accompanying notes to the financial statements.
5
GMO Emerging Countries Fund
(A Series of GMO Trust)
Schedule of Investments — (Continued)
(showing percentage of total net assets)
February 29, 2008
| Shares | Description | Value ($) | |||||||||||||
| India — continued | |||||||||||||||
| 20,047 | LIC Housing Finance Ltd | 152,722 | |||||||||||||
| 57,830 | Oil & Natural Gas Corp Ltd | 1,446,177 | |||||||||||||
| 48,660 | Power Finance Corp | 223,975 | |||||||||||||
| 17,710 | Reliance Capital Ltd | 793,899 | |||||||||||||
| 25,940 | Reliance Communications Ltd | 367,451 | |||||||||||||
| 14,910 | Reliance Energy Ltd | 575,504 | |||||||||||||
| 37,626 | Reliance Industries Ltd | 2,293,934 | |||||||||||||
| 107,000 | Reliance Natural Resources Ltd * | 348,755 | |||||||||||||
| 122,660 | Reliance Petroleum Ltd * | 530,993 | |||||||||||||
| 41,118 | Satyam Computer Services Ltd | 442,364 | |||||||||||||
| 4,680 | State Bank of India Ltd | 243,805 | |||||||||||||
| 7,794 | State Bank of India Ltd GDR | 848,030 | |||||||||||||
| 278,830 | Steel Authority of India Ltd | 1,742,102 | |||||||||||||
| 62,828 | Tata Steel Ltd | 1,240,833 | |||||||||||||
| 63,704 | Wipro Ltd | 686,597 | |||||||||||||
| Total India | 20,635,702 | ||||||||||||||
| Indonesia — 1.8% | |||||||||||||||
| 283,500 | Astra International Tbk PT | 850,643 | |||||||||||||
| 22,217,000 | Bakrie & Brothers Tbk PT * | 822,767 | |||||||||||||
| 5,040,000 | Bumi Resources Tbk PT | 4,158,347 | |||||||||||||
| 56,390 | Infrastructure Development Finance Co Ltd | 270,966 | |||||||||||||
| 7,008,620 | Matahari Putra Prima Tbk PT | 463,225 | |||||||||||||
| 710,500 | Telekomunikasi Indonesia Tbk PT | 752,105 | |||||||||||||
| Total Indonesia | 7,318,053 | ||||||||||||||
| Israel — 1.5% | |||||||||||||||
| 241,200 | Bank Hapoalim BM | 1,030,578 | |||||||||||||
| 270,930 | Bank Leumi Le | 1,244,815 | |||||||||||||
| 13,200 | Check Point Software Technologies Ltd * | 289,344 | |||||||||||||
| 35,620 | Israel Chemicals Ltd | 483,490 | |||||||||||||
| 29,430 | Machteshim Agan Industries Ltd * | 245,307 | |||||||||||||
| 400 | Teva Pharmaceutical Industries Ltd | 19,533 | |||||||||||||
| 51,570 | Teva Pharmaceutical Industries Ltd Sponsored ADR | 2,530,540 | |||||||||||||
See accompanying notes to the financial statements.
6
GMO Emerging Countries Fund
(A Series of GMO Trust)
Schedule of Investments — (Continued)
(showing percentage of total net assets)
February 29, 2008
| Shares | Description | Value ($) | |||||||||||||
| Israel — continued | |||||||||||||||
| 205 | The Israel Corp Ltd | 219,029 | |||||||||||||
| Total Israel | 6,062,636 | ||||||||||||||
| Malaysia — 4.4% | |||||||||||||||
| 71,700 | Digi.com Berhad | 532,858 | |||||||||||||
| 667,800 | Genting Berhad | 1,412,634 | |||||||||||||
| 182,700 | Hong Leong Bank Berhad | 317,181 | |||||||||||||
| 1,085,790 | IOI Corp Berhad | 2,700,590 | |||||||||||||
| 177,500 | KNM Group Berhad | 333,902 | |||||||||||||
| 104,050 | Kuala Lumpur Kepong Berhad | 596,702 | |||||||||||||
| 447,750 | Malayan Banking Berhad | 1,263,890 | |||||||||||||
| 229,200 | MISC Berhad | 640,648 | |||||||||||||
| 257,300 | MISC Berhad (Foreign Registered) | 704,154 | |||||||||||||
| 256,385 | Public Bank Berhad | 837,567 | |||||||||||||
| 1,810,500 | Resorts World Berhad | 2,093,991 | |||||||||||||
| 775,900 | RHB Capital Berhad | 1,190,264 | |||||||||||||
| 665,152 | Sime Darby Berhad * | 2,415,327 | |||||||||||||
| 152,009 | Tanjong Plc | 755,201 | |||||||||||||
| 344,400 | Telekom Malaysia Berhad | 1,215,841 | |||||||||||||
| 190,100 | Tenaga Nasional Berhad | 533,381 | |||||||||||||
| Total Malaysia | 17,544,131 | ||||||||||||||
| Mexico — 0.5% | |||||||||||||||
| 66,100 | Alfa SA de CV Class A | 413,511 | |||||||||||||
| 625,238 | Cemex SA de CV CPO * | 1,716,340 | |||||||||||||
| Total Mexico | 2,129,851 | ||||||||||||||
| Pakistan — 0.1% | |||||||||||||||
| 20,650 | Attock Refinery Ltd | 90,162 | |||||||||||||
| 20,500 | Engro Chemical Pakistan Ltd | 104,595 | |||||||||||||
| 80 | Kot Addu Power Co Ltd | 69 | |||||||||||||
| 18,260 | MCB Bank Ltd | 126,879 | |||||||||||||
| 69,180 | Oil & Gas Development Co Ltd | 142,379 | |||||||||||||
| Total Pakistan | 464,084 | ||||||||||||||
See accompanying notes to the financial statements.
7
GMO Emerging Countries Fund
(A Series of GMO Trust)
Schedule of Investments — (Continued)
(showing percentage of total net assets)
February 29, 2008
| Shares | Description | Value ($) | |||||||||||||
| Philippines — 1.2% | |||||||||||||||
| 76,160 | Ayala Corp | 802,158 | |||||||||||||
| 2,659,344 | Ayala Land Inc | 755,730 | |||||||||||||
| 617,600 | Bank of the Philippine Islands | 833,605 | |||||||||||||
| 26,680 | Philippine Long Distance Telephone Co | 1,882,498 | |||||||||||||
| 6,390 | Philippine Long Distance Telephone Co Sponsored ADR (a) | 453,370 | |||||||||||||
| Total Philippines | 4,727,361 | ||||||||||||||
| Poland — 1.1% | |||||||||||||||
| 6,100 | Bank Handlowy W Warszawie SA | 208,402 | |||||||||||||
| 22,380 | KGHM Polska Miedz SA | 1,035,627 | |||||||||||||
| 69,800 | Polski Koncern Naftowy Orlen SA * | 1,184,072 | |||||||||||||
| 56,470 | Powszechna Kasa Oszczednosci Bank Polski SA | 1,012,321 | |||||||||||||
| 100,720 | Telekomunikacja Polska SA | 938,286 | |||||||||||||
| Total Poland | 4,378,708 | ||||||||||||||
| Russia — 10.5% | |||||||||||||||
| 13,750 | AvtoVAZ | 24,750 | |||||||||||||
| 9,480 | Cherepovets MK Severstal | 246,480 | |||||||||||||
| 34,770 | Cherepovets MK Severstal GDR (Registered Shares) | 886,635 | |||||||||||||
| 10,800 | Evraz Group SA GDR | 1,015,200 | |||||||||||||
| 23,200 | Gazprom Neft | 135,720 | |||||||||||||
| 66,100 | Gazprom Neft Sponsored ADR | 2,082,150 | |||||||||||||
| 57,000 | JSC Mining & Smelting Co ADR | 1,664,400 | |||||||||||||
| 42,900 | KamAZ * | 248,820 | |||||||||||||
| 4,100 | Lukoil ADR 144A | 303,400 | |||||||||||||
| 33,880 | Lukoil Sponsored ADR | 2,507,120 | |||||||||||||
| 31,110 | Mobile Telesystems Sponsored ADR | 2,552,887 | |||||||||||||
| 3,300 | NovaTek OAO Sponsored GDR | 251,460 | |||||||||||||
| 13,200 | Novolipetsk Steel GDR (Registered Shares) | 604,824 | |||||||||||||
| 330,744 | OAO Gazprom Sponsored GDR | 16,801,795 | |||||||||||||
| 15,917 | OAO Mechel ADR | 2,101,840 | |||||||||||||
| 9,450 | OAO Tatneft Sponsored GDR (Registered Shares) | 1,185,975 | |||||||||||||
| 1,678,590 | Sberbank RF | 5,589,705 | |||||||||||||
| 16,800 | Surgutneftegaz Sponsored ADR | 772,800 | |||||||||||||
See accompanying notes to the financial statements.
8
GMO Emerging Countries Fund
(A Series of GMO Trust)
Schedule of Investments — (Continued)
(showing percentage of total net assets)
February 29, 2008
| Shares | Description | Value ($) | |||||||||||||
| Russia — continued | |||||||||||||||
| 55,130 | Vimpel-Communications Sponsored ADR | 1,914,665 | |||||||||||||
| 11,620 | Wimm-Bill-Dann Foods ADR | 1,223,121 | |||||||||||||
| 9,500 | X5 Retail Group NV GDR (Registered Shares) * | 320,150 | |||||||||||||
| Total Russia | 42,433,897 | ||||||||||||||
| South Africa — 3.8% | |||||||||||||||
| 34,052 | Absa Group Ltd | 481,996 | |||||||||||||
| 102,900 | African Bank Investments Ltd | 405,373 | |||||||||||||
| 57,067 | ArcelorMittal South Africa Ltd | 1,353,321 | |||||||||||||
| 40,167 | Aveng Ltd | 315,730 | |||||||||||||
| 37,500 | Barloworld Ltd | 451,549 | |||||||||||||
| 19,200 | Bidvest Group Ltd | 283,131 | |||||||||||||
| 385,500 | FirstRand Ltd | 912,323 | |||||||||||||
| 37,500 | Foschini Ltd | 198,007 | |||||||||||||
| 57,900 | Freeworld Coatings Ltd * | 72,378 | |||||||||||||
| 10,200 | Impala Platinum Holdings Ltd | 422,084 | |||||||||||||
| 18,600 | Imperial Holdings Ltd | 188,159 | |||||||||||||
| 117,700 | MTN Group Ltd | 1,843,098 | |||||||||||||
| 103,300 | Murray & Roberts Holdings Ltd | 1,292,286 | |||||||||||||
| 34,307 | Remgro Ltd | 884,964 | |||||||||||||
| 39,200 | Reunert Ltd | 285,763 | |||||||||||||
| 92,800 | RMB Holdings Ltd | 328,394 | |||||||||||||
| 298,600 | Sanlam Ltd | 709,617 | |||||||||||||
| 53,800 | Sasol Ltd | 2,751,439 | |||||||||||||
| 89,068 | Standard Bank Group Ltd | 1,111,601 | |||||||||||||
| 168,000 | Steinhoff International Holdings Ltd | 385,853 | |||||||||||||
| 23,100 | Telkom South Africa Ltd | 411,909 | |||||||||||||
| 24,024 | Tiger Brands Ltd | 427,610 | |||||||||||||
| Total South Africa | 15,516,585 | ||||||||||||||
| South Korea — 14.8% | |||||||||||||||
| 750 | CJ CheilJedang Corp * | 214,445 | |||||||||||||
| 9,390 | Daelim Industrial Co Ltd | 1,461,157 | |||||||||||||
| 10,366 | Daewoo Engineering & Construction Co Ltd | 221,886 | |||||||||||||
See accompanying notes to the financial statements.
9
GMO Emerging Countries Fund
(A Series of GMO Trust)
Schedule of Investments — (Continued)
(showing percentage of total net assets)
February 29, 2008
| Shares | Description | Value ($) | |||||||||||||
| South Korea — continued | |||||||||||||||
| 11,700 | Daewoo International Corp | 441,694 | |||||||||||||
| 4,240 | DC Chemical Co Ltd | 1,517,313 | |||||||||||||
| 15,939 | Dongbu Insurance Co Ltd | 631,074 | |||||||||||||
| 12,380 | Dongkuk Steel Mill Co Ltd | 553,782 | |||||||||||||
| 6,850 | Doosan Heavy Industries and Construction Co | 989,424 | |||||||||||||
| 7,540 | GS Holdings Corp | 365,552 | |||||||||||||
| 14,820 | Hana Financial Group Inc | 657,608 | |||||||||||||
| 14,218 | Hanjin Heavy Industries & Construction Co Ltd | 871,038 | |||||||||||||
| 12,811 | Hanjin Heavy Industries & Construction Holdings Co Ltd * | 453,598 | |||||||||||||
| 9,486 | Hanwha Corp | 576,990 | |||||||||||||
| 2,098 | Honam Petrochemical Corp | 204,037 | |||||||||||||
| 33,760 | Hynix Semiconductor Inc * | 868,151 | |||||||||||||
| 10,739 | Hyundai Engineering & Construction | 965,857 | |||||||||||||
| 5,020 | Hyundai Heavy Industries | 1,988,022 | |||||||||||||
| 30,800 | Hyundai Marine & Fire Insurance Co Ltd | 688,867 | |||||||||||||
| 1,135 | Hyundai Mipo Dockyard | 319,375 | |||||||||||||
| 17,380 | Hyundai Mobis | 1,334,071 | |||||||||||||
| 30,280 | Hyundai Motor Co | 2,123,147 | |||||||||||||
| 15,140 | Hyundai Steel Co | 1,171,359 | |||||||||||||
| 34,940 | Industrial Bank of Korea | 563,328 | |||||||||||||
| 8,810 | Kangwon Land Inc | 192,867 | |||||||||||||
| 2,280 | KCC Corp | 1,344,221 | |||||||||||||
| 30,280 | Kookmin Bank | 1,866,144 | |||||||||||||
| 800 | Kookmin Bank ADR * | 48,984 | |||||||||||||
| 52,310 | Korea Exchange Bank | 731,497 | |||||||||||||
| 8,677 | Korea Gas Corp | 647,216 | |||||||||||||
| 412 | Korea Iron & Steel Co Ltd | 33,385 | |||||||||||||
| 40 | Korea Zinc Co Ltd | 6,040 | |||||||||||||
| 8,116 | Korean Air Lines Co Ltd | 613,199 | |||||||||||||
| 840 | KT Corp | 41,301 | |||||||||||||
| 34,000 | KT Corp ADR * | 825,860 | |||||||||||||
| 7,150 | KT Freetel Co Ltd * | 186,476 | |||||||||||||
| 32,914 | KT&G Corp | 2,715,616 | |||||||||||||
| 14,500 | KT&G Corp GDR 144A * | 594,645 | |||||||||||||
See accompanying notes to the financial statements.
10
GMO Emerging Countries Fund
(A Series of GMO Trust)
Schedule of Investments — (Continued)
(showing percentage of total net assets)
February 29, 2008
| Shares | Description | Value ($) | |||||||||||||
| South Korea — continued | |||||||||||||||
| 606 | Kumho Industrial Co Ltd | 29,434 | |||||||||||||
| 8,180 | LG Chemicals Ltd | 683,690 | |||||||||||||
| 13,860 | LG Corp | 963,987 | |||||||||||||
| 14,060 | LG Electronics Inc | 1,514,311 | |||||||||||||
| 58,010 | LG Philips LCD Co Ltd | 2,756,031 | |||||||||||||
| 2,810 | Mirae Asset Securities Co Ltd | 400,677 | |||||||||||||
| 12,989 | NHN Corp * | 2,882,739 | |||||||||||||
| 1,890 | Oriental Brewery Co Ltd * | 362,153 | |||||||||||||
| 6,240 | POSCO | 3,432,144 | |||||||||||||
| 19,980 | Samsung Corp | 1,218,870 | |||||||||||||
| 7,228 | Samsung Electronics Co Ltd | 4,236,853 | |||||||||||||
| 9,220 | Samsung Fire & Marine Insurance Co Ltd | 1,822,540 | |||||||||||||
| 12,270 | Samsung Heavy Industries Co Ltd | 406,749 | |||||||||||||
| 6,350 | Samsung Securities | 440,926 | |||||||||||||
| 59,775 | Shinhan Financial Group Co Ltd | 3,220,008 | |||||||||||||
| 2,080 | Shinsegae Co Ltd | 1,291,519 | |||||||||||||
| 11,881 | SK Energy Co Ltd | 1,613,121 | |||||||||||||
| 54,740 | SK Telecom Co Ltd ADR | 1,226,176 | |||||||||||||
| 4,290 | S-Oil Corp | 303,119 | |||||||||||||
| 5,410 | STX Shipping Co Ltd | 213,713 | |||||||||||||
| 18,160 | Taihan Electric Wire Co Ltd | 884,830 | |||||||||||||
| 32,881 | Woori Finance Holdings Co Ltd | 588,815 | |||||||||||||
| Total South Korea | 59,521,631 | ||||||||||||||
| Taiwan — 12.1% | |||||||||||||||
| 459,516 | Asustek Computer Inc | 1,268,608 | |||||||||||||
| 1,006,863 | AU Optronics Corp | 1,920,478 | |||||||||||||
| 412,000 | Cathay Financial Holding Co Ltd | 1,032,282 | |||||||||||||
| 1,612,080 | Chi Mei Optoelectronics Corp | 2,120,395 | |||||||||||||
| 2,460,429 | China Development Financial Holding Corp | 1,007,499 | |||||||||||||
| 763,723 | China Steel Corp | 1,128,388 | |||||||||||||
| 1,709,604 | Chinatrust Financial Holding Co Ltd * | 1,528,402 | |||||||||||||
| 1,307,327 | Chunghwa Telecom Co Ltd | 3,250,442 | |||||||||||||
| 7,240 | Chungwa Telecom Co Ltd ADR | 177,670 | |||||||||||||
See accompanying notes to the financial statements.
11
GMO Emerging Countries Fund
(A Series of GMO Trust)
Schedule of Investments — (Continued)
(showing percentage of total net assets)
February 29, 2008
| Shares | Description | Value ($) | |||||||||||||
| Taiwan — continued | |||||||||||||||
| 940,799 | Compal Electronics Inc | 847,924 | |||||||||||||
| 213,028 | D-Link Corp | 338,441 | |||||||||||||
| 1,099,549 | Far Eastern Textile Co Ltd | 1,791,427 | |||||||||||||
| 1,254,486 | First Financial Holding Co Ltd | 1,119,940 | |||||||||||||
| 989,039 | Formosa Chemicals & Fibre Co | 2,403,530 | |||||||||||||
| 131,000 | Formosa Petrochemical Corp | 362,480 | |||||||||||||
| 1,037,178 | Formosa Plastics Corp | 2,795,905 | |||||||||||||
| 134,320 | Foxconn Technology Co Ltd | 876,281 | |||||||||||||
| 777,000 | Hannstar Display Corp * | 334,224 | |||||||||||||
| 95,800 | High Tech Computer Corp | 1,977,668 | |||||||||||||
| 555,557 | Hon Hai Precision Industry Co Ltd | 3,314,520 | |||||||||||||
| 414,443 | Lite-On Technology Corp | 566,143 | |||||||||||||
| 233,334 | MediaTek Inc | 2,616,961 | |||||||||||||
| 1,553,417 | Nan Ya Plastics Corp | 3,658,376 | |||||||||||||
| 149,339 | Novatek Microelectronics Corp Ltd | 525,496 | |||||||||||||
| 669,914 | Quanta Computer Inc | 878,223 | |||||||||||||
| 474,341 | Siliconware Precision Industries Co | 772,988 | |||||||||||||
| 1,201,805 | Taiwan Cement Corp | 2,138,097 | |||||||||||||
| 64,000 | Taiwan Fertilizer Co Ltd | 249,624 | |||||||||||||
| 475,787 | Taiwan Mobile Co Ltd | 806,048 | |||||||||||||
| 1,759,455 | Taiwan Semiconductor Manufacturing Co Ltd | 3,437,172 | |||||||||||||
| 17,450 | Taiwan Semiconductor Manufacturing Co Ltd Sponsored ADR | 169,963 | |||||||||||||
| 191,000 | U-Ming Marine Transport Co | 525,150 | |||||||||||||
| 187,000 | Unimicron Technology Corp | 282,168 | |||||||||||||
| 479,000 | Wistron Corp | 791,005 | |||||||||||||
| 1,875,000 | Yuanta Financial Holding Co Ltd * | 1,643,808 | |||||||||||||
| Total Taiwan | 48,657,726 | ||||||||||||||
| Thailand — 5.2% | |||||||||||||||
| 338,690 | Advanced Info Service Pcl (Foreign Registered) (b) | 1,115,365 | |||||||||||||
| 225,440 | Bangkok Bank Pcl NVDR (b) | 920,459 | |||||||||||||
| 261,300 | Bangkok Dusit Medical Service Pcl (Foreign Registered) (b) | 276,243 | |||||||||||||
| 914,780 | Bank of Ayudhya Pcl NVDR (b) | 707,041 | |||||||||||||
| 81,340 | Banpu Pcl (Foreign Registered) (b) | 1,218,689 | |||||||||||||
See accompanying notes to the financial statements.
12
GMO Emerging Countries Fund
(A Series of GMO Trust)
Schedule of Investments — (Continued)
(showing percentage of total net assets)
February 29, 2008
| Shares | Description | Value ($) | |||||||||||||
| Thailand — continued | |||||||||||||||
| 50,000 | Banpu Pcl NVDR (b) | 749,133 | |||||||||||||
| 993,640 | BEC World Pcl (Foreign Registered) (b) | 859,029 | |||||||||||||
| 3,608,950 | IRPC Pcl (Foreign Registered) (b) | 679,446 | |||||||||||||
| 2,212,670 | Italian Thai Development Pcl (Foreign Registered) * (b) | 624,005 | |||||||||||||
| 327,000 | Kasikornbank Pcl (Foreign Registered) (b) | 916,660 | |||||||||||||
| 176,560 | Kasikornbank Pcl NVDR (b) | 486,645 | |||||||||||||
| 1,020,000 | Krung Thai Bank Pcl (Foreign Registered) (b) | 346,751 | |||||||||||||
| 615,054 | PTT Aromatics & Refining Pcl (Foreign Registered) * (b) | 825,609 | |||||||||||||
| 390,000 | PTT Exploration & Production Pcl (Foreign Registered) (b) | 1,963,023 | |||||||||||||
| 508,222 | PTT Pcl (Foreign Registered) (b) | 5,435,053 | |||||||||||||
| 77,039 | Siam Cement Pcl NVDR (b) | 523,591 | |||||||||||||
| 466,000 | Siam Commercial Bank Pcl (Foreign Registered) (b) | 1,277,256 | |||||||||||||
| 297,400 | Thai Airways International Pcl (Foreign Registered) (b) | 301,585 | |||||||||||||
| 515,770 | Thai Oil Pcl (Foreign Registered) (b) | 1,275,365 | |||||||||||||
| 254,240 | Thoresen Thai Agencies Pcl (Foreign Registered) (b) | 379,742 | |||||||||||||
| Total Thailand | 20,880,690 | ||||||||||||||
| Turkey — 3.0% | |||||||||||||||
| 211,158 | Akbank TAS | 1,117,797 | |||||||||||||
| 246,970 | Dogan Sirketler Grubu Holdings AS * | 310,731 | |||||||||||||
| 160,618 | Eregli Demir ve Celik Fabrikalari TAS | 1,129,393 | |||||||||||||
| 165,730 | KOC Holding AS * | 624,166 | |||||||||||||
| 61,834 | Tupras-Turkiye Petrol Rafineriler AS | 1,567,681 | |||||||||||||
| 41,720 | Turk Hava Yollari Anonim Ortakligi * | 247,879 | |||||||||||||
| 192,897 | Turkcell Iletisim Hizmet AS | 1,905,895 | |||||||||||||
| 464,070 | Turkiye Garanti Bankasi | 2,752,177 | |||||||||||||
| 52,650 | Turkiye Halk Bankasi AS * | 333,160 | |||||||||||||
| 277,830 | Turkiye IS Bankasi Class C | 1,274,330 | |||||||||||||
| 256,110 | Turkiye Vakiflar Bankasi TAO Class D | 598,716 | |||||||||||||
| 190,010 | Yapi Ve Kredi Bankasi AS * | 429,496 | |||||||||||||
| Total Turkey | 12,291,421 | ||||||||||||||
| TOTAL COMMON STOCKS (COST $284,841,600) | 334,494,382 | ||||||||||||||
See accompanying notes to the financial statements.
13
GMO Emerging Countries Fund
(A Series of GMO Trust)
Schedule of Investments — (Continued)
(showing percentage of total net assets)
February 29, 2008
| Shares | Description | Value ($) | |||||||||||||
| PREFERRED STOCKS — 12.5% | |||||||||||||||
| Brazil — 11.4% | |||||||||||||||
| 53,500 | Aracruz SA Class B (Registered) 5.55% | 386,911 | |||||||||||||
| 68,364 | Banco Bradesco SA 0.32% | 2,134,480 | |||||||||||||
| 116,300 | Banco Itau Holding Financeira SA 2.81% | 2,929,679 | |||||||||||||
| 29,600 | Bradespar SA 0.28% | 770,150 | |||||||||||||
| 13,600 | Brasil Telecom Participacoes SA 4.46% | 189,794 | |||||||||||||
| 28,932 | Brasil Telecom SA 3.98% | 321,296 | |||||||||||||
| 63,509 | Companhia Energetica de Minas Gerais 2.29% | 1,209,266 | |||||||||||||
| 26,200 | Companhia Paranaense de Energia Class B 2.20% | 426,209 | |||||||||||||
| 245,956 | Companhia Vale do Rio Doce Class A 0.05% | 7,251,710 | |||||||||||||
| 26,800 | Electrobras (Centro) SA Class B 6.09% | 393,022 | |||||||||||||
| 31,900 | Gerdau Metalurgica SA 2.65% | 1,405,328 | |||||||||||||
| 90,004 | Gerdau SA 2.11% | 2,941,057 | |||||||||||||
| 429,269 | Itausa-Investimentos Itau SA 0.11% | 2,728,781 | |||||||||||||
| 29,600 | Net Servicos de Comunicacoa SA * | 325,738 | |||||||||||||
| 300,612 | Petroleo Brasileiro SA (Petrobras) 0.43% | 14,478,651 | |||||||||||||
| 16,730 | Petroleo Brasileiro SA Sponsored ADR 0.38% | 1,638,369 | |||||||||||||
| 143,700 | Sadia SA 3.09% | 812,354 | |||||||||||||
| 21,220 | Tele Norte Leste Participacoes ADR 3.52% | 531,137 | |||||||||||||
| 62,700 | Tele Norte Leste Participacoes SA 0.19% | 1,564,997 | |||||||||||||
| 16,100 | Telecomunicacoes de Sao Paulo SA 6.72% | 460,027 | |||||||||||||
| 21,100 | Telemar Norte Leste SA Class A 3.67% | 1,135,415 | |||||||||||||
| 34,400 | Usinas Siderrurgicas de Minas Gerais SA Class A 2.26% | 1,993,495 | |||||||||||||
| Total Brazil | 46,027,866 | ||||||||||||||
| India — 0.0% | |||||||||||||||
| 48,141 | Tata Steel Ltd * | 151,587 | |||||||||||||
| Russia — 0.2% | |||||||||||||||
| 560 | Transneft 0.66% | 814,800 | |||||||||||||
See accompanying notes to the financial statements.
14
GMO Emerging Countries Fund
(A Series of GMO Trust)
Schedule of Investments — (Continued)
(showing percentage of total net assets)
February 29, 2008
| Shares / Par Value ($) | Description | Value ($) | |||||||||||||
| South Korea — 0.9% | |||||||||||||||
| 8,600 | Hyundai Motor Co 3.86% | 245,918 | |||||||||||||
| 14,660 | Hyundai Motor Co 4.03% | 422,155 | |||||||||||||
| 6,362 | Samsung Electronics Co Ltd (Non Voting) 3.69% | 2,731,083 | |||||||||||||
| Total South Korea | 3,399,156 | ||||||||||||||
| TOTAL PREFERRED STOCKS (COST $26,826,473) | 50,393,409 | ||||||||||||||
| RIGHTS AND WARRANTS — 0.0% | |||||||||||||||
| Brazil — 0.0% | |||||||||||||||
| 978 | Banco Bradesco SA Rights, Expires 02/22/08 * (c) | 2,573 | |||||||||||||
| 325 | Net Servicos de Comunicacao SA Right, Expires 03/07/08 * | 23 | |||||||||||||
| Total Brazil | 2,596 | ||||||||||||||
| India — 0.0% | |||||||||||||||
| 936 | State Bank of India Rights, Expires 03/18/08 * | 10,496 | |||||||||||||
| Thailand — 0.0% | |||||||||||||||
| 116,526 | True Corp Pcl Warrants, Expires 04/03/08 * (b) | — | |||||||||||||
| TOTAL RIGHTS AND WARRANTS (COST $10,481) | 13,092 | ||||||||||||||
| SHORT-TERM INVESTMENTS — 3.5% | |||||||||||||||
| 13,400,000 | Bank of America Time Deposit, 3.05%, due 03/03/08 | 13,400,000 | |||||||||||||
| 442,500 | Bank of New York Mellon Institutional Cash Reserves Fund (d) | 442,500 | |||||||||||||
| TOTAL SHORT-TERM INVESTMENTS (COST $13,842,500) | 13,842,500 | ||||||||||||||
| TOTAL INVESTMENTS — 99.0% (Cost $325,521,054) | 398,743,383 | ||||||||||||||
| Other Assets and Liabilities (net) — 1.0% | 4,182,564 | ||||||||||||||
| TOTAL NET ASSETS — 100.0% | $ | 402,925,947 | |||||||||||||
See accompanying notes to the financial statements.
15
GMO Emerging Countries Fund
(A Series of GMO Trust)
Schedule of Investments — (Continued)
February 29, 2008
Notes to Schedule of Investments:
144A - Securities exempt from registration under Rule 144A of the Securities Act of 1933. These securities may be resold in transactions exempt from registration, normally to qualified institutional investors.
ADR - American Depositary Receipt
CPO - Ordinary Participation Certificate (Certificado de Participacion Ordinares), representing a bundle of shares of the multiple series of one issuer that trade together as a unit.
Foreign Registered - Shares issued to foreign investors in markets that have foreign ownership limits.
GDR - Global Depository Receipt
NVDR - Non-Voting Depository Receipt
* Non-income producing security.
(a) All or a portion of this security is out on loan (Note 2).
(b) Security valued at fair value using methods determined in good faith by or at the direction of the Trustees of GMO Trust (Note 2).
(c) As of February 29, 2008, these rights have been exercised but shares have not yet been credited to the Fund.
(d) All or a portion of this security represents investment of security lending collateral (Note 2).
As of February 29, 2008, 60.01% of the Net Assets of the Fund were valued using fair value prices based on models used by a third party vendor (Note 2).
See accompanying notes to the financial statements.
16
GMO Emerging Countries Fund
(A Series of GMO Trust)
Statement of Assets and Liabilities — February 29, 2008
| Assets: | |||||||
| Investments, at value, including securities on loan of $425,700 (cost $325,521,054) (Note 2) | $ | 398,743,383 | |||||
| Cash | 21,285 | ||||||
| Foreign currency, at value (cost $3,602,523) (Note 2) | 3,604,346 | ||||||
| Receivable for investments sold | 1,675,730 | ||||||
| Receivable for Fund shares sold | 4,022,753 | ||||||
| Dividends and interest receivable | 1,484,199 | ||||||
| Foreign taxes receivable | 261,778 | ||||||
| Receivable for expenses reimbursed by Manager (Note 3) | 121,364 | ||||||
| Total assets | 409,934,838 | ||||||
| Liabilities: | |||||||
| Collateral on securities loaned, at value (Note 2) | 442,500 | ||||||
| Payable for investments purchased | 1,657,378 | ||||||
| Payable for Fund shares repurchased | 4,069,009 | ||||||
| Accrued capital gain and repatriation taxes payable (Note 2) | 35,921 | ||||||
| Payable to affiliate for (Note 3): | |||||||
| Management fee | 203,528 | ||||||
| Shareholder service fee | 43,333 | ||||||
| Administration fee – Class M | 4,848 | ||||||
| Trustees and Chief Compliance Officer of GMO Trust fees | 481 | ||||||
| Payable for 12b-1 fee – Class M | 12,926 | ||||||
| Accrued expenses | 538,967 | ||||||
| Total liabilities | 7,008,891 | ||||||
| Net assets | $ | 402,925,947 | |||||
See accompanying notes to the financial statements.
17
GMO Emerging Countries Fund
(A Series of GMO Trust)
Statement of Assets and Liabilities — February 29, 2008 — (Continued)
| Net assets consist of: | |||||||
| Paid-in capital | $ | 287,496,404 | |||||
| Distributions in excess of net investment income | (1,034,768 | ) | |||||
| Accumulated net realized gain | 43,228,643 | ||||||
| Net unrealized appreciation | 73,235,668 | ||||||
| $ | 402,925,947 | ||||||
| Net assets attributable to: | |||||||
| Class III shares | $ | 371,540,398 | |||||
| Class M shares | $ | 31,385,549 | |||||
| Shares outstanding: | |||||||
| Class III | 24,344,633 | ||||||
| Class M | 2,082,814 | ||||||
| Net asset value per share: | |||||||
| Class III | $ | 15.26 | |||||
| Class M | $ | 15.07 | |||||
See accompanying notes to the financial statements.
18
GMO Emerging Countries Fund
(A Series of GMO Trust)
Statement of Operations — Year Ended February 29, 2008
| Investment Income: | |||||||
| Dividends (net of withholding taxes of $1,319,123) | $ | 9,673,520 | |||||
| Interest | 487,137 | ||||||
| Securities lending income | 31,044 | ||||||
| Total investment income | 10,191,701 | ||||||
| Expenses: | |||||||
| Management fee (Note 3) | 2,738,143 | ||||||
| Shareholder service fee – Class III (Note 3) | 580,553 | ||||||
| 12b-1 fee – Class M (Note 3) | 85,544 | ||||||
| Administration fee – Class M (Note 3) | 68,435 | ||||||
| Custodian and fund accounting agent fees | 1,270,760 | ||||||
| Transfer agent fees | 47,979 | ||||||
| Audit and tax fees | 82,405 | ||||||
| Legal fees | 10,540 | ||||||
| Trustees fees and related expenses (Note 3) | 4,110 | ||||||
| Registration fees | 19,903 | ||||||
| Miscellaneous | 8,202 | ||||||
| Total expenses | 4,916,574 | ||||||
| Fees and expenses reimbursed by Manager (Note 3) | (131,074 | ) | |||||
| Expense reductions (Note 2) | (2,623 | ) | |||||
| Net expenses | 4,782,877 | ||||||
| Net investment income (loss) | 5,408,824 | ||||||
| Realized and unrealized gain (loss): | |||||||
| Net realized gain (loss) on: | |||||||
| Investments (net of foreign capital gains tax of $348,376) (Note 2) | 119,077,558 | ||||||
| Foreign currency, forward contracts and foreign currency related transactions (net of CPMF tax of $5,493) (Note 2) | (330,903 | ) | |||||
| Net realized gain (loss) | 118,746,655 | ||||||
| Change in net unrealized appreciation (depreciation) on: | |||||||
| Investments (net of change in foreign capital gains tax accrual of $17,159) (Note 2) | (14,535,972 | ) | |||||
| Foreign currency, forward contracts and foreign currency related transactions | 41,730 | ||||||
| Net unrealized gain (loss) | (14,494,242 | ) | |||||
| Net realized and unrealized gain (loss) | 104,252,413 | ||||||
| Net increase (decrease) in net assets resulting from operations | $ | 109,661,237 | |||||
See accompanying notes to the financial statements.
19
GMO Emerging Countries Fund
(A Series of GMO Trust)
Statement of Changes in Net Assets
| Year Ended February 29, 2008 | Year Ended February 28, 2007 | ||||||||||
| Increase (decrease) in net assets: | |||||||||||
| Operations: | |||||||||||
| Net investment income (loss) | $ | 5,408,824 | $ | 6,550,482 | |||||||
| Net realized gain (loss) | 118,746,655 | 124,974,708 | |||||||||
| Change in net unrealized appreciation (depreciation) | (14,494,242 | ) | (76,541,791 | ) | |||||||
| Net increase (decrease) in net assets from operations | 109,661,237 | 54,983,399 | |||||||||
| Distributions to shareholders from: | |||||||||||
| Net investment income | |||||||||||
| Class III | (6,266,144 | ) | (6,274,494 | ) | |||||||
| Class M | (465,425 | ) | (451,963 | ) | |||||||
| Total distributions from net investment income | (6,731,569 | ) | (6,726,457 | ) | |||||||
| Net realized gains | |||||||||||
| Class III | (113,812,595 | ) | (97,439,141 | ) | |||||||
| Class M | (10,207,292 | ) | (9,313,319 | ) | |||||||
| Total distributions from net realized gains | (124,019,887 | ) | (106,752,460 | ) | |||||||
| (130,751,456 | ) | (113,478,917 | ) | ||||||||
| Net share transactions (Note 7): | |||||||||||
| Class III | 51,505,212 | 46,234,476 | |||||||||
| Class M | 3,819,194 | (22,200,886 | ) | ||||||||
| Increase (decrease) in net assets resulting from net share transactions | 55,324,406 | 24,033,590 | |||||||||
| Total increase (decrease) in net assets | 34,234,187 | (34,461,928 | ) | ||||||||
| Net assets: | |||||||||||
| Beginning of period | 368,691,760 | 403,153,688 | |||||||||
| End of period (including distributions in excess of net investment income of $1,034,768 and $1,208,158, respectively) | $ | 402,925,947 | $ | 368,691,760 | |||||||
See accompanying notes to the financial statements.
20
GMO Emerging Countries Fund
(A Series of GMO Trust)
Financial Highlights
(For a Class III share outstanding throughout each period)
| Year Ended February 28/29, | |||||||||||||||||||||||
| 2008 | 2007 | 2006 | 2005 | 2004 | |||||||||||||||||||
| Net asset value, beginning of period | $ | 16.04 | $ | 19.20 | $ | 15.99 | $ | 14.99 | $ | 8.54 | |||||||||||||
| Income (loss) from investment operations: | |||||||||||||||||||||||
| Net investment income (loss) | 0.23 | † | 0.32 | † | 0.28 | † | 0.30 | † | 0.18 | ||||||||||||||
| Net realized and unrealized gain (loss) | 4.87 | 2.50 | 5.09 | 3.43 | 6.71 | ||||||||||||||||||
| Total from investment operations | 5.10 | 2.82 | 5.37 | 3.73 | 6.89 | ||||||||||||||||||
| Less distributions to shareholders: | |||||||||||||||||||||||
| From net investment income | (0.30 | ) | (0.36 | ) | (0.35 | ) | (0.31 | ) | (0.22 | ) | |||||||||||||
| From net realized gains | (5.58 | ) | (5.62 | ) | (1.81 | ) | (2.42 | ) | (0.22 | ) | |||||||||||||
| Total distributions | (5.88 | ) | (5.98 | ) | (2.16 | ) | (2.73 | ) | (0.44 | ) | |||||||||||||
| Net asset value, end of period | $ | 15.26 | $ | 16.04 | $ | 19.20 | $ | 15.99 | $ | 14.99 | |||||||||||||
| Total Return | 30.68 | %(a) | 16.20 | % | 36.38 | %(a) | 28.76 | %(a) | 81.45 | %(a) | |||||||||||||
| Ratios/Supplemental Data: | |||||||||||||||||||||||
| Net assets, end of period (000's) | $ | 371,540 | $ | 339,268 | $ | 346,018 | $ | 249,005 | $ | 249,844 | |||||||||||||
| Net expenses to average daily net assets | 1.11 | %(b) | 1.06 | % | 1.10 | % | 1.10 | % | 1.16 | % | |||||||||||||
| Net investment income to average daily net assets | 1.31 | % | 1.74 | % | 1.68 | % | 2.12 | % | 1.82 | % | |||||||||||||
| Portfolio turnover rate | 72 | % | 58 | % | 35 | % | 53 | % | 57 | % | |||||||||||||
| Fees and expenses reimbursed by the Manager to average daily net assets: | 0.03 | % | — | 0.01 | % | 0.05 | % | 0.06 | % | ||||||||||||||
(a) The total returns would have been lower had certain expenses not been reimbursed during the periods shown and assumes the effect of reinvested distributions.
(b) The net expense ratio does not include the effect of expense reductions.
† Calculated using average shares outstanding throughout the period.
See accompanying notes to the financial statements.
21
GMO Emerging Countries Fund
(A Series of GMO Trust)
Financial Highlights
(For a Class M share outstanding throughout each period)
| Year Ended February 28/29, | |||||||||||||||||||||||
| 2008 | 2007 | 2006 | 2005 | 2004 | |||||||||||||||||||
| Net asset value, beginning of period | $ | 15.90 | $ | 19.05 | $ | 15.87 | $ | 14.91 | $ | 8.51 | |||||||||||||
| Income (loss) from investment operations: | |||||||||||||||||||||||
| Net investment income (loss) | 0.18 | † | 0.30 | † | 0.27 | † | 0.26 | † | 0.11 | ||||||||||||||
| Net realized and unrealized gain (loss) | 4.82 | 2.44 | 5.00 | 3.39 | 6.71 | ||||||||||||||||||
| Total from investment operations | 5.00 | 2.74 | 5.27 | 3.65 | 6.82 | ||||||||||||||||||
| Less distributions to shareholders: | |||||||||||||||||||||||
| From net investment income | (0.25 | ) | (0.27 | ) | (0.28 | ) | (0.27 | ) | (0.20 | ) | |||||||||||||
| From net realized gains | (5.58 | ) | (5.62 | ) | (1.81 | ) | (2.42 | ) | (0.22 | ) | |||||||||||||
| Total distributions | (5.83 | ) | (5.89 | ) | (2.09 | ) | (2.69 | ) | (0.42 | ) | |||||||||||||
| Net asset value, end of period | $ | 15.07 | $ | 15.90 | $ | 19.05 | $ | 15.87 | $ | 14.91 | |||||||||||||
| Total Return | 30.29 | %(a) | 15.89 | % | 35.99 | %(a) | 28.30 | %(a) | 80.98 | %(a) | |||||||||||||
| Ratios/Supplemental Data: | |||||||||||||||||||||||
| Net assets, end of period (000's) | $ | 31,386 | $ | 29,423 | $ | 57,136 | $ | 69,109 | $ | 58,346 | |||||||||||||
| Net expenses to average daily net assets | 1.41 | %(b) | 1.36 | % | 1.39 | % | 1.40 | % | 1.45 | % | |||||||||||||
| Net investment income to average daily net assets | 0.99 | % | 1.63 | % | 1.65 | % | 1.82 | % | 1.27 | % | |||||||||||||
| Portfolio turnover rate | 72 | % | 58 | % | 35 | % | 53 | % | 57 | % | |||||||||||||
| Fees and expenses reimbursed by the Manager to average daily net assets: | 0.03 | % | — | 0.01 | % | 0.05 | % | 0.06 | % | ||||||||||||||
(a) The total returns would have been lower had certain expenses not been reimbursed during the periods shown and assumes the effect of reinvested distributions.
(b) The net expense ratio does not include the effect of expense reductions.
† Calculated using average shares outstanding during the period.
See accompanying notes to the financial statements.
22
GMO Emerging Countries Fund
(A Series of GMO Trust)
Notes to Financial Statements
February 29, 2008
1. Organization
GMO Emerging Countries Fund (the "Fund") is a series of GMO Trust (the "Trust"). The Fund is registered under the Investment Company Act of 1940, as amended, as an open-end, non-diversified management investment company. The Fund is advised and managed by Grantham, Mayo, Van Otterloo & Co. LLC (the "Manager" or "GMO"). The Trust was established as a Massachusetts business trust under the laws of the Commonwealth of Massachusetts on June 24, 1985. The Declaration of Trust permits the Trustees of the Trust ("Trustees") to create an unlimited number of series of shares ("Funds") and to subdivide Funds into classes.
The Fund seeks high total return. The Fund seeks to achieve its investment objective by outperforming the S&P/IFC (Investable) Composite Index. The Fund typically makes equity investments in companies whose stocks are traded in the securities markets of the world's non-developed countries, which excludes countries that are included in the MSCI EAFE Index.
Throughout the year ended February 29, 2008, the Fund had two classes of shares outstanding: Class III and Class M. Class M shares bear an administration fee and a 12b-1 fee while Class III shares bear a shareholder service fee (See Note 3). The principal economic difference between the classes of shares is the type and level of fees.
The Fund currently limits subscriptions due to capacity considerations.
2. Significant accounting policies
The following is a summary of significant accounting policies which are in conformity with accounting principles generally accepted in the United States of America ("U.S. GAAP") and which are consistently followed by the Fund in the preparation of its financial statements. The preparation of financial statements in accordance with U.S. GAAP requires management to make estimates and assumptions that affect the reported amounts and disclosures in the financial statements. Actual results could differ from those estimates. The accounting records of the Fund are maintained in U.S. dollars.
Portfolio valuation
Securities listed on a securities exchange for which market quotations are readily available are valued at the last sale price or official closing price on each business day, or if there is no such reported sale or official closing price, at the most recent quoted bid price. Unlisted securities for which market quotations are readily available are generally valued at the most recent quoted bid price. Short-term investments with a remaining maturity of sixty days or less are generally valued at amortized cost, which approximates fair value. Shares of investment funds are valued at their net asset value. Securities for which quotations are not readily available or whose values the Manager has determined to be unreliable are valued at fair value as determined in good faith by the Trustees or other persons acting at their direction pursuant to
23
GMO Emerging Countries Fund
(A Series of GMO Trust)
Notes to Financial Statements — (Continued)
February 29, 2008
procedures approved by the Trustees. By its nature, a fair value price is a good faith estimate of the value of a security at a given point in time and may not reflect the value that would be realized if the security was sold and the differences could be material. Because many foreign equity securities markets and exchanges close prior to the close of the New York Stock Exchange ("NYSE"), closing prices for foreign securities in those markets or on those exchanges do not reflect the events that occur after that close but before the close of the NYSE. As a result, foreign equity securities are generally valued using fair value prices supplied by a third party vendor based on models to the extent that these fair value prices are available.
Foreign currency translation
The market values of foreign securities, currency holdings and other assets and liabilities are translated to U.S. dollars based on the current exchange rates each business day. Income and expenses denominated in foreign currencies are translated at current exchange rates when accrued or incurred. The Fund does not isolate realized and unrealized gains and losses attributable to changes in exchange rates from gains and losses that arise from changes in the market value of investments. Such fluctuations are included with net realized and unrealized gain or loss on investments. Net realized gains and losses on foreign currency transactions represent gains and losses on disposition of currencies and forward currency contracts, currency gains and losses realized between the trade and settlement dates on securities transactions, and the difference between the amount of investment income and foreign withholding taxes recorded on the F und's accounting records and the U.S. dollar equivalent amounts actually received or paid.
Forward currency contracts
The Fund may enter into forward currency contracts including forward cross currency contracts. A forward currency contract is an agreement between two parties to buy and sell a currency at a set price on a future date. The market value of a forward currency contract fluctuates with changes in forward currency exchange rates. Forward currency contracts are marked to market daily using rates supplied by a quotation service and changes in value are recorded by the Fund as an unrealized gain or loss. Realized gains or losses equal to the difference between the value of the contract at the time it was opened and the value at the time it was closed are recorded upon delivery or receipt of the currency or, if a forward currency contract is offset by entering into another forward currency contract with the same broker, upon settlement of the net gain or loss. These contracts may involve market risk in excess of the unrealized gain or lo ss reflected in the Fund's Statement of Assets and Liabilities. In addition, the Fund could be exposed to risk if the counterparties are unable to meet the terms of the contracts or if there are movements in currency values that are unfavorable to the Fund. There were no forward currency contracts outstanding at the end of the period.
Futures contracts
The Fund may purchase and sell futures contracts. Upon entering into a futures contract, the Fund is required to deposit with the futures clearing broker an amount of cash, U.S. government and agency obligations, or other liquid assets in accordance with the initial margin requirements of the broker or
24
GMO Emerging Countries Fund
(A Series of GMO Trust)
Notes to Financial Statements — (Continued)
February 29, 2008
exchange. In addition, the Fund maintains cash or securities in an amount that at least equals the net amount payable in the event the Fund must deliver the full amount of the contracts. Futures contracts are marked to market daily and an appropriate payable or receivable for the change in value ("variation margin") is recorded by the Fund. The payable or receivable is liquidated on the following business day. Gains or losses are recognized but not considered realized until the contracts expire or are closed. Futures contracts involve, to varying degrees, risk of loss in excess of the variation margin disclosed in the Statement of Assets and Liabilities. Under certain circumstances, futures exchanges may establish daily limits on the amount that the price of a futures contract can vary from the previous day's settlement price, thereby effectively preventing liquidation of unfavorable positions. Losses may arise from changes in t he value of the underlying instrument if the Fund is unable to liquidate a futures position due to an illiquid secondary market for the contracts or the imposition of price limits, or if counterparties do not perform under the contract terms. Futures contracts are generally valued at the settlement price established each day by the board of trade or exchange on which they are traded. There were no futures contracts outstanding at the end of the period.
Options
The Fund may write call and put options. Writing options increases the Fund's exposure to the underlying instrument by, in the case of a call option, obligating the Fund to sell the underlying instrument at a set price to the option-holder and, in the case of a put option, obligating the Fund to purchase the underlying instrument at a set price from the option-holder. When the Fund writes a call or put option, an amount equal to the premium received is recorded as a liability and subsequently marked to market to reflect the current value of the option written. Premiums received from writing options which expire are treated as realized gains. Premiums received from writing options which are exercised or closed are added to the proceeds or offset against the amounts paid on the underlying future, security or currency transaction to determine the realized gain or loss. The Fund as a writer of an option has no control over whether t he underlying future, security or currency may be sold (call) or purchased (put) and as a result bears the market risk of an unfavorable change in the price of the future, security or currency underlying the written option. In the event that the Fund writes uncovered call options (i.e. options for investments that the Fund does not own), it bears the risk of incurring substantial losses if the price of the underlying instrument increases during the term of the option. There is the risk the Fund may not be able to enter into a closing transaction because of an illiquid market. There were no open written option contracts during the period.
The Fund may also purchase put and call options. Purchasing options alters the Fund's exposure to the underlying instrument by, in the case of a call option, entitling the Fund to purchase the underlying instrument at a set price from the writer of the option and, in the case of a put option, entitling the Fund to sell the underlying instrument at a set price to the writer of the option. The Fund pays a premium as a cost for a purchased option disclosed in the Schedule of Investments which is subsequently marked to market to reflect the current value of the option. Premiums paid for purchasing options which expire are treated as realized losses. Premiums paid for purchasing options which are exercised or closed are added to the amounts paid or offset against the proceeds on the closing transaction to determine the realized gain or
25
GMO Emerging Countries Fund
(A Series of GMO Trust)
Notes to Financial Statements — (Continued)
February 29, 2008
loss. The risk associated with purchasing put and call options is limited to the premium paid. There were no purchased option contracts outstanding at the end of the period.
Exchange traded options are valued at the last sale price, or if no sale is reported, the last bid price for purchased options and the last ask price for written options. Options traded over-the-counter are valued using prices supplied by a primary pricing source chosen by the Manager.
Indexed securities
The Fund may invest in indexed securities where the redemption values and/or coupons are linked to the prices of a specific instrument or financial statistic. The Fund uses indexed securities to increase or decrease its exposure to different underlying instruments and to gain exposure to markets in which it may be difficult to invest through conventional securities. Indexed securities may be more volatile than their underlying instruments, but any loss is limited to the amount of the original investment. There were no indexed securities held by the Fund at the end of the period.
Swap agreements
The Fund may enter into swap agreements. A swap is an agreement to exchange the return generated by one instrument for the return generated by another instrument. Interest rate swap agreements involve the exchange by one party with another party of their respective commitments to pay or receive interest, e.g., an exchange of floating rate payments for fixed rate payments with respect to a notional amount of principal. Total return swap agreements involve a commitment by one party in the agreement to pay interest in exchange for a market-linked return, both based on notional amounts. To the extent the total return of the security or index underlying the transaction exceeds or falls short of the offsetting interest rate obligation, the party will receive a payment from or make a payment to the counterparty, respectively. Forward spread lock swap agreements involve commitments to pay or receive a settlement amount calculated as the difference between the swap spread and a fixed spread, multiplied by the notional amount times the duration of the swap rate. The swap spread is the difference between the benchmark swap rate (market rate) and the specific treasury rate. Variance swap agreements involve commitments to pay or receive a settlement amount calculated as the difference between the annualized realized variance of returns on the underlying price and a fixed quantity, also known as the variance strike, over a period of time. In connection with these agreements, cash or securities may be set aside as collateral by the Fund's custodian or brokers in accordance with the terms of the swap agreement. The Fund earns or pays interest on cash set aside as collateral.
Swaps are marked to market daily using models that incorporate quotations from market makers and the change in value, if any, is recorded as unrealized gain or loss in the Statement of Operations. Payments received or made on swap contracts are recorded as realized gain or loss in the Statement of Operations. Gains or losses are realized upon early termination of the swap agreements. These financial instruments are not actively traded on financial markets. The values assigned to these instruments are based upon the best available information and because of the uncertainty of the valuation, these values may differ
26
GMO Emerging Countries Fund
(A Series of GMO Trust)
Notes to Financial Statements — (Continued)
February 29, 2008
significantly from the values that would have been realized had a ready market for these instruments existed, and the differences could be material. Entering into these agreements involves, to varying degrees, elements of credit, legal, market and documentation risk in excess of the amounts recognized in the Statement of Assets and Liabilities. Such risks involve the possibility that there will be no liquid market for these agreements, that the counterparties to the agreements may default on their obligations to perform or disagree as to the meaning of contractual terms in the agreements, or that there may be unfavorable changes in interest rates or the price of the index or security underlying these transactions. There were no swap agreements outstanding at the end of the period.
Securities lending
The Fund may lend its securities to certain qualified broker-dealers. The loans are collateralized with cash or liquid securities with a market value at least equal to the market value of the securities on loan. As with other extensions of credit, the Fund may bear the risk of loss with respect to the investment of the collateral, the risk of delay in and/or inability to exercise its rights with respect to the collateral, and the risk of delay in recovery or loss of rights in the loaned securities should the borrower of the securities fail financially. If a loan is collateralized by U.S. government securities, the Fund receives a fee from the borrower. If a loan is collateralized by cash, the Fund typically invests the cash collateral for its own account in interest-bearing, short-term securities and pays a fee to the borrower that normally represents a portion of the Fund's earnings on the collateral. As of February 29, 2008, t he Fund had loaned securities valued by the Fund at $425,700, collateralized by cash in the amount of $442,500, which was invested in the Bank of New York Mellon Institutional Cash Reserves Fund.
Taxes and distributions
The Fund intends to qualify each tax year as a regulated investment company under Subchapter M of the Internal Revenue Code of 1986, as amended (the "Code"). The Fund intends to distribute substantially all of its net investment income and net realized short-term and long-term capital gains, if any, after giving effect to any available capital loss carryovers for U.S. federal income tax purposes. Therefore, no provision for U.S. federal income or excise tax is necessary. Taxes on foreign interest and dividend income are generally withheld in accordance with the applicable country's tax treaty with the United States. The foreign withholding rates applicable to a Fund's investments in certain foreign jurisdictions may be higher if a significant portion of the Fund is held by non-U.S. shareholders.
The Fund's policy is to declare and pay distributions from net investment income, if any, semiannually, and from net realized short-term and long-term capital gains, if any, at least annually. All distributions are paid in shares of the Fund, at net asset value, unless the shareholder elects to receive cash distributions. Distributions to shareholders are recorded by the Fund on the ex-dividend date.
Dividends received by shareholders of the Fund which are derived from foreign source income and foreign taxes paid by the Fund may be treated, to the extent allowable under the Code, as if received and paid by the shareholders of the Fund.
27
GMO Emerging Countries Fund
(A Series of GMO Trust)
Notes to Financial Statements — (Continued)
February 29, 2008
The Fund may be subject to capital gains and repatriation taxes imposed by certain countries in which it invests. The accrual for capital gains and repatriation taxes is included in net unrealized gain (loss) in the Statement of Operations. For the year ended February 29, 2008, the Fund incurred $348,376 in capital gains taxes which is included in net realized gain (loss) in the Statement of Operations.
The Fund is currently subject to a Taiwanese security transaction tax of 0.3% of the transaction amount on equities and 0.1% of the transaction amount on corporate bonds and mutual fund shares, which must be paid by the Fund upon the sale or transfer of any portfolio securities subject to such tax.
The Fund is subject to a Contribuição Provisória sobre Movimentações Financiera ("CPMF") tax which is applied to foreign exchange transactions representing capital inflows or outflows to/from the Brazilian market. The CPMF tax has been included in the net realized gain (loss) on investments throughout the year. For the year ended February 29, 2008, the Fund incurred $5,493 in CPMF tax which is included in net realized gain (loss) on foreign currency, forward contracts and foreign currency related transactions in the Statement of Operations.
Income and capital gain distributions are determined in accordance with U.S. federal income tax regulations, which may differ from U.S. GAAP. Certain capital accounts in the financial statements are periodically adjusted for permanent differences in order to reflect their tax character. These adjustments have no impact on net assets or net asset value per share. Temporary differences which arise from recognizing certain items of income, expense, gain or loss in different periods for financial statement and tax purposes will reverse at some time in the future. Distributions in excess of net investment income or net realized gains are temporary over distributions for financial statement purposes resulting from differences in the recognition or classification of income or distributions for financial statement and tax purposes.
U.S. GAAP and tax accounting differences primarily relate to passive foreign investment company transactions, losses on wash sale transactions, post-October currency losses and foreign currency transactions.
The following reclassification represents the amount necessary to report the stated components of net assets on a tax basis, excluding certain temporary differences, as of February 29, 2008. The financial highlights exclude these adjustments.
| Distributions In Excess Of Net Investment Income | Accumulated Net Realized Gain | Paid-in Capital | |||||||||
| $ | 1,496,135 | $ | (1,634,115 | ) | $ | 137,980 | |||||
28
GMO Emerging Countries Fund
(A Series of GMO Trust)
Notes to Financial Statements — (Continued)
February 29, 2008
The tax character of distributions declared to shareholders is as follows:
| 2/29/2008 | 2/28/2007 | ||||||||||
| Ordinary income (including any short-term capital gains) | $ | 22,711,741 | $ | 17,374,220 | |||||||
| Long-term capital gains | 108,039,715 | 96,104,697 | |||||||||
| Total distributions | $ | 130,751,456 | $ | 113,478,917 | |||||||
Distributions in excess of tax basis earnings and profits, if significant, are reported in the financial statements as a tax return of capital.
As of February 29, 2008, the components of distributable earnings on a tax basis consisted of the following:
| Undistributed ordinary income | $ | 3,982,667 | |||||
| Undistributed long-term capital gain | $ | 40,961,616 | |||||
As of February 29, 2008, the Fund elected to defer to March 1, 2008 post-October currency losses of $594,300.
As of February 29, 2008, the approximate cost for U.S. federal income tax purposes and gross and net unrealized appreciation and depreciation in value of investments were as follows:
| Aggregate Cost | Gross Unrealized Appreciation | Gross Unrealized (Depreciation) | Net Unrealized Appreciation (Depreciation) | ||||||||||||
| $ | 327,673,328 | $ | 86,549,365 | $ | (15,479,310 | ) | $ | 71,070,055 | |||||||
Security transactions and related investment income
Security transactions are accounted for on trade date. Dividend income, net of applicable foreign withholding taxes, if any, is recorded on the ex-dividend date, or when the Fund is informed of the ex-dividend date, if later. Interest income is recorded on the accrual basis and is adjusted for the amortization of premiums and accretion of discounts. Interest income on inflation indexed securities, if any, is accrued daily based upon an inflation adjusted principal. Additionally, any increase or decrease in the principal or face amount of the securities adjusted for inflation is recorded as interest income or loss. Income is not recognized on securities for which collection is not expected. Non-cash dividends, if any, are recorded at the fair market value of the securities received. In determining the net gain or loss on securities sold, the cost of securities is determined on the identified cost basis.
29
GMO Emerging Countries Fund
(A Series of GMO Trust)
Notes to Financial Statements — (Continued)
February 29, 2008
Expenses
The majority of expenses of the Trust are directly identifiable to an individual fund. Expenses which are not readily identifiable to a specific fund are allocated taking into consideration, among other things, the nature and type of expense and the relative size of the funds. Investment income, common expenses and realized and unrealized gains and losses are allocated pro rata among the classes of shares of the Fund based on the relative net assets of each class. Shareholder service, 12b-1, and administration fees, which are directly attributable to a class of shares, are charged to that class's operations.
Brown Brothers Harriman & Co. ("BBH") serves as custodian and fund accounting agent of the Fund. State Street Bank and Trust Company ("State Street") serves as transfer agent of the Fund. BBH and State Street's fees may be reduced by credits that are an earnings allowance calculated on the average daily cash balances the Fund maintains with each agent. Credit balances or expense reimbursements used to reduce fees, if any, are reported as a reduction of expenses in the Statement of Operations.
Investment risks
Investments in securities of issuers in emerging countries present certain risks that are not inherent in many other investments. Many emerging countries present elements of political and/or economic instability. The securities markets of emerging countries are generally smaller and less developed than the securities markets of the U.S. and developed foreign markets. Further, countries may impose various types of foreign currency regulations or controls which may impede the Fund's ability to repatriate amounts it receives. The Fund may acquire interests in securities in anticipation of improving conditions in the related countries. These factors may result in significant volatility in the values of its holdings. The markets in emerging countries are typically less liquid than those of developed markets. Accordingly, the Fund may not be able to realize in an actual sale amounts approximating those used to value its holdings.
Recently issued accounting pronouncements
In June 2006, the Financial Accounting Standards Board ("FASB") issued FASB Interpretation No. 48, Accounting for Uncertainty in Income Taxes – an Interpretation of FASB Statement No. 109 ("FIN 48"). FIN 48 clarifies the accounting for uncertainty in income taxes recognized in accordance with FASB Statement No. 109, Accounting for Income Taxes. FIN 48 prescribes a recognition threshold and measurement attribute for a tax position taken or expected to be taken in the tax return that could impact the Fund's financial statements. It also provides guidance in relation to the Fund's financial statements on classification of tax benefits or liabilities, interest and penalties, accounting in interim periods, disclosure, and transition. FIN 48 is effective for fiscal years beginning after December 15, 2006 for registered investment companies. Management has evaluated the effects of applying the various provisions of FIN 48 and has determined that the adoption of FIN 48 does not have a material effect on the Fund's financial statements. The Fund's federal tax returns for the prior three fiscal years remain subject to examination by the Internal Revenue Service. Management will continue to monitor the rules and guidance pertaining to FIN 48 and will take action if appropriate.
30
GMO Emerging Countries Fund
(A Series of GMO Trust)
Notes to Financial Statements — (Continued)
February 29, 2008
In September 2006, the FASB issued Statement of Financial Accounting Standards No. 157 ("FAS 157"), "Fair Value Measurements." FAS 157 defines fair value, establishes a framework for measuring fair value in accordance with generally accepted accounting principles and expands disclosure about fair value measurements. FAS 157 is effective for fiscal years beginning after November 15, 2007. Management is currently evaluating the impact the adoption of FAS 157 will have on the Fund's financial statement disclosures.
3. Fees and other transactions with affiliates
GMO earns a management fee paid monthly at the annual rate of 0.65% of average daily net assets. The Fund has adopted a Shareholder Service Plan under which the Fund pays GMO a shareholder service fee for client and shareholder service, reporting, and other support. Pursuant to the Shareholder Service Plan, the shareholder service fee is calculated based on average daily net assets at the annual rate of 0.15% for Class III shares.
Class M shares of the Fund pay GMO an administration fee monthly at an annual rate of 0.20% of average daily Class M net assets for support services provided to Class M shareholders.
Pursuant to a Rule 12b-1 distribution and service plan adopted by the Fund, Class M shares of the Fund may pay a fee, at the annual rate of up to 1.00% of average daily Class M net assets for any activities or expenses primarily intended to result in the sale of Class M shares of the Fund and/or the provision of certain other services incidental thereto. The Trustees currently limit payments on Class M shares to 0.25% of the Fund's average daily Class M net assets. This fee may be spent on personal services rendered to Class M shareholders of the Fund and/or maintenance of Class M shareholder accounts.
The Manager has contractually agreed to reimburse the Fund for Fund expenses through at least June 30, 2008 to the extent the Fund's total annual operating expenses (excluding the administration fee (Class M only), distribution (12b-1) fee (Class M only), shareholder service fees (Class III only), fees and expenses of the independent Trustees of the Trust, fees and expenses for legal services not approved by the Manager for the Trust, compensation and expenses of the Trust's Chief Compliance Officer ("CCO") (excluding any employee benefits), brokerage commissions, securities lending fees and expenses, transfer taxes, and other investment-related costs (including expenses associated with investments in any company that is an investment company or would be an investment company under the 1940 Act, but for the exceptions to the definition of investment company provided in Section 3(c)(1) and 3(c)(7) of the 1940 Act), hedging transa ction fees, extraordinary, non-recurring and certain other unusual expenses (including taxes)) exceed 1.00% of the Fund's average daily net assets.
The Fund's portion of the fees paid by the Trust to the independent Trustees and CCO during the year ended February 29, 2008 was $3,558 and $1,859 respectively. The compensation and expenses of the CCO
31
GMO Emerging Countries Fund
(A Series of GMO Trust)
Notes to Financial Statements — (Continued)
February 29, 2008
are included in miscellaneous expenses in the Statement of Operations. No remuneration was paid by the Fund to any other officer of the Trust.
4. Purchases and sales of securities
Cost of purchases and proceeds from sales of securities, excluding short-term investments, for the year ended February 29, 2008 aggregated $292,284,768 and $374,390,380, respectively.
5. Guarantees
In the normal course of business the Fund enters into contracts with third-party service providers that contain a variety of representations and warranties and which provide general indemnifications. The Fund's maximum exposure under these arrangements is unknown, as this would involve future claims that may be made against the Fund that have not yet occurred. Based on experience, management is of the view that the risk of loss in connection with these potential indemnification obligations is remote; however, there can be no assurance that material liabilities related to such obligations will not arise in the future that could adversely impact the Fund.
6. Principal shareholders and related parties
As of February 29, 2008, 27.33% of the outstanding shares of the Fund were held by two shareholders, each holding in excess of 10% of the Fund's outstanding shares. No other shareholder owned in excess of 10% of the outstanding shares of the Fund. Investment activities of this shareholder may have a material effect on the Fund.
As of February 29, 2008, 0.10% of the Fund's shares were held by eight related parties comprised of certain GMO employee accounts, and 18.26% of the Fund's shares were held by accounts for which the Manager has investment discretion.
32
GMO Emerging Countries Fund
(A Series of GMO Trust)
Notes to Financial Statements — (Continued)
February 29, 2008
7. Share transactions
The Declaration of Trust permits the Trustees to issue an unlimited number of shares of beneficial interest (without par value). Transactions in Fund shares were as follows:
| Year Ended February 29, 2008 | Year Ended February 28, 2007 | ||||||||||||||||||
| Class III: | Shares | Amount | Shares | Amount | |||||||||||||||
| Shares sold | 957,007 | $ | 16,034,781 | 1,442,762 | $ | 27,694,596 | |||||||||||||
| Shares issued to shareholders in reinvestment of distributions | 6,663,042 | 113,483,330 | 5,918,651 | 97,273,044 | |||||||||||||||
| Shares repurchased | (4,425,134 | ) | (78,012,899 | ) | (4,234,129 | ) | (78,733,164 | ) | |||||||||||
| Net increase (decrease) | 3,194,915 | $ | 51,505,212 | 3,127,284 | $ | 46,234,476 | |||||||||||||
| Year Ended February 29, 2008 | Year Ended February 28, 2007 | ||||||||||||||||||
| Class M: | Shares | Amount | Shares | Amount | |||||||||||||||
| Shares sold | 628,963 | $ | 10,927,518 | 917,075 | $ | 16,897,698 | |||||||||||||
| Shares issued to shareholders in reinvestment of distributions | 634,368 | 10,672,717 | 598,918 | 9,765,282 | |||||||||||||||
| Shares repurchased | (1,031,321 | ) | (17,781,041 | ) | (2,664,680 | ) | (48,863,866 | ) | |||||||||||
| Net increase (decrease) | 232,010 | $ | 3,819,194 | (1,148,687 | ) | $ | (22,200,886 | ) | |||||||||||
33
Report of Independent Registered Public Accounting Firm
To the Trustees of GMO Trust and the Shareholders of
GMO Emerging Countries Fund
In our opinion, the accompanying statement of assets and liabilities, including the schedule of investments, and the related statements of operations and of changes in net assets and the financial highlights present fairly, in all material respects, the financial position of GMO Emerging Countries Fund (the "Fund") at February 29, 2008, the results of its operations for the year then ended, the changes in its net assets for each of the two years in the period then ended and the financial highlights for each of the five years in the period then ended, in conformity with accounting principles generally accepted in the United States of America. These financial statements and financial highlights (hereafter referred to as "financial statements") are the responsibility of the Fund's management; our responsibility is to express an opinion on these financial statements based on our audits. We conducted our audits of these financial sta tements in accordance with the standards of the Public Company Accounting Oversight Board (United States). Those standards require that we plan and perform the audit to obtain reasonable assurance about whether the financial statements are free of material misstatement. An audit includes examining, on a test basis, evidence supporting the amounts and disclosures in the financial statements, assessing the accounting principles used and significant estimates made by management, and evaluating the overall financial statement presentation. We believe that our audits, which included confirmation of securities at February 29, 2008 by correspondence with the custodian, provide a reasonable basis for our opinion.
PricewaterhouseCoopers LLP
Boston, Massachusetts
April 29, 2008
34
GMO Emerging Countries Fund
(A Series of GMO Trust)
Fund Expenses
February 29, 2008 (Unaudited)
Expense Examples: The following information is in relation to expenses for the six month period ended February 29, 2008.
As a shareholder of the Fund, you may incur two types of costs: (1) transaction costs; and (2) ongoing costs, including management fees, shareholder service fees, distribution (12b-1) and/or administration fees, and other Fund expenses. This example is intended to help you understand your ongoing costs (in dollars) of investing in the Fund and to compare these costs with the ongoing costs of investing in other mutual funds.
This example is based on an investment of $1,000 invested at the beginning of the period and held for the entire period, September 1, 2007 though February 29, 2008.
Actual Expenses
The first line of the table for each class below provides information about actual account values and actual expenses. You may use the information in this line, together with the amount you invested, to estimate the expenses that you paid over the period. Simply divide your account value by $1,000 (for example, an $10,000,000 account value divided by $1,000 = 10,000), then multiply the result by the number in the first line under the heading entitled "Net Expense Incurred" to estimate the expenses you paid on your account during this period.
Hypothetical Example for Comparison Purposes
The second line of the table for each class below provides information about hypothetical account values and hypothetical expenses based on the Fund's actual expense ratio and an assumed rate of return of 5% per year before expenses, which is not the Fund's actual return. The hypothetical account values and expenses may not be used to estimate the actual ending account balance or expenses you paid for the period. You may use this information to compare the ongoing costs of investing in the Fund with other funds. To do so, compare this 5% hypothetical example with the 5% hypothetical examples that appear in the shareholder reports of other funds.
Please note that the expenses shown in the table are meant to highlight your ongoing costs only and do not reflect any transactional costs, such as purchase premiums and redemption fees. Therefore, the second line of the table is useful in comparing ongoing costs only, and will not help you determine the relative total costs of owning different funds. In addition, if these transactional costs were included, your costs would have been higher.
| Annualized Expense Ratio | Beginning Account Value | Ending Account Value | Net Expense Incurred* | ||||||||||||||||
| Class III | |||||||||||||||||||
| 1) Actual | 1.12 | % | $ | 1,000.00 | $ | 1,048.00 | $ | 5.70 | |||||||||||
| 2) Hypothetical | 1.12 | % | $ | 1,000.00 | $ | 1,019.29 | $ | 5.62 | |||||||||||
| Class M | |||||||||||||||||||
| 1) Actual | 1.42 | % | $ | 1,000.00 | $ | 1,046.60 | $ | 7.23 | |||||||||||
| 2) Hypothetical | 1.42 | % | $ | 1,000.00 | $ | 1,017.80 | $ | 7.12 | |||||||||||
* Expenses are calculated using each Class's annualized expense ratio for the six months ended February 29, 2008, multiplied by the average account value over the period, multiplied by 182 days in the period, divided by 366 days in the year.
35
GMO Emerging Countries Fund
(A Series of GMO Trust)
Tax Information for the Tax Year Ended February 29, 2008 (Unaudited)
The Fund will notify shareholders of amounts for use in preparing 2008 income tax forms in January 2009.
The Fund's distributions to shareholders include $108,039,715 from long-term capital gains.
During the year ended February 29, 2008, the Fund paid foreign taxes of $1,317,663 and recognized foreign source income of $10,992,643.
For taxable, non-corporate shareholders, 17.55% of the income and short-term capital gains, if any, distributed in the Fund's fiscal year ended February 29, 2008 represents qualified dividend income subject to the 15% rate category.
The Fund hereby designates as qualified interest income and qualified short-term capital gains with respect to its taxable year ended February 29, 2008, $70,408 and $15,980,172, respectively, or if determined to be different, the qualified interest income and qualified short-term gains of such year.
36
Trustees and Officers (Unaudited)
The following tables list the Trust's Trustees and Officers as of the date of this report; their address and date of birth ("DOB"); their position with the Trust; the length of time holding that position with the Trust; their principal occupation(s) during the past five years; the number of portfolios in the fund complex they oversee; and other directorships they hold in companies subject to registration or reporting requirements of the Securities Exchange Act of 1934 (generally called "public companies") or in registered investment companies. The Trust's Statement of Additional Information ("SAI") includes additional information about the Trust's trustees, including changes subsequent to the date of the report. The SAI is available, without charge, upon request by writing GMO, c/o GMO Trust, 40 Rowes Wharf, Boston, MA 02110.
Independent Trustees:
| Name, Address, and DOB | Position(s) Held with Trust | Term of Office1 and Length of Time Served | Principal Occupation(s) During Past Five Years | Number of Portfolios in Fund Complex Overseen by Trustee | Other Directorships Held by Trustee | ||||||||||||||||||
| Donald W. Glazer, Esq. c/o GMO Trust 40 Rowes Wharf Boston, MA 02110 DOB: 07/26/1944 | Chairman of the Board of Trustees | Chairman of the Board of Trustees since March 2005; Lead Independent Trustee (September 2004 – March 2005); Trustee since December 2000. | Consultant – Law and Business2; Vice Chair (since 2002) and Secretary, Provant, Inc. (provider of personnel performance improvement services and training products); Author of Legal Treatises. | 47 | None. | ||||||||||||||||||
1 Each Trustee is elected to serve during the continued lifetime of the Trust until he/she dies, resigns or is removed, or if sooner, until the next meeting of Shareholders called for the purpose of electing Trustees and until the election and qualification of his/her successor.
2 As part of Mr. Glazer's work as a consultant, he provides part-time consulting services to Goodwin Procter LLP ("Goodwin"). Goodwin has provided legal services to Renewable Resources, LLC, an affiliate of GMO; GMO, in connection with its relationship with Renewable Resources; and funds managed by Renewable Resources. Mr. Glazer has represented that he has no financial interest in, and is not involved in the provision of, such legal services. In the calendar years ended December 31, 2006 and December 31, 2007, these entities paid $825,738 and $291,721 respectively, in legal fees and disbursements to Goodwin.
37
Independent Trustees — (Continued)
| Name, Address, and DOB | Position(s) Held with Trust | Term of Office1 and Length of Time Served | Principal Occupation(s) During Past Five Years | Number of Portfolios in Fund Complex Overseen by Trustee | Other Directorships Held by Trustee | ||||||||||||||||||
| Jay O. Light c/o GMO Trust 40 Rowes Wharf Boston, MA 02110 DOB: 10/03/1941 | Trustee | Since May 1996. | Dean (since April 2006), Acting Dean (August 2005 – April 2006), Senior Associate Dean (1998 – 2005), and Professor of Business Administration, Harvard Business School. | 47 | Director of Harvard Management Company, Inc.3 and Verde, Inc.; Director of Partners HealthCare System, Inc. and Chair of its Investment Committee.4 | ||||||||||||||||||
| W. Nicholas Thorndike c/o GMO Trust 40 Rowes Wharf Boston, MA 02110 DOB: 03/28/1933 | Trustee | Since March 2005. | Director or trustee of various corporations and charitable organizations, including Courier Corporation (a book publisher and manufacturer) (July 1989 – present); Putnam Funds (December 1992 – June 2004); and Providence Journal (a newspaper publisher) (December 1986 – December 2003). | 47 | Director of Courier Corporation (a book publisher and manufacturer); Member of the Investment Committee of Partners HealthCare System, Inc.4 | ||||||||||||||||||
1 Each Trustee is elected to serve during the continued lifetime of the Trust until he/she dies, resigns or is removed, or if sooner, until the next meeting of Shareholders called for the purpose of electing Trustees and until the election and qualification of his/her successor.
3 Harvard Management Company, Inc. is a client of the Manager.
4 Partners HealthCare System, Inc. is a client of the Manager.
38
Principal Officers:
| Name, Address, and DOB | Position(s) Held with Trust | Term of Office5 and Length of Time Served | Principal Occupation(s) During Past Five Years | ||||||||||||
| Scott Eston c/o GMO Trust 40 Rowes Wharf Boston, MA 02110 DOB: 01/20/1956 | President and Chief Executive Officer | President and Chief Executive Officer since October 2002; Chief Financial Officer, November 2006 – February 2007. | Chief Financial Officer, Chief Operating Officer and Member, Grantham, Mayo, Van Otterloo & Co. LLC. | ||||||||||||
| Sheppard N. Burnett c/o GMO Trust 40 Rowes Wharf Boston, MA 02110 DOB: 10/24/1968 | Treasurer and Chief Financial Officer | Chief Financial Officer since March 2007; Treasurer since November 2006; Assistant Treasurer, September 2004 – November 2006. | Fund Administration Staff, Grantham, Mayo, Van Otterloo & Co. LLC (June 2004 – present); Vice President, Director of Tax, Columbia Management Group (2002-2004). | ||||||||||||
| Brent C. Arvidson c/o GMO Trust 40 Rowes Wharf Boston, MA 02110 DOB: 06/26/1969 | Assistant Treasurer | Since August 1998. | Senior Fund Administrator, Grantham, Mayo, Van Otterloo & Co. LLC. | ||||||||||||
| John L. Nasrah c/o GMO Trust 40 Rowes Wharf Boston, MA 02110 DOB: 05/27/1977 | Assistant Treasurer | Since March 2007. | Fund Administrator, Grantham, Mayo, Van Otterloo & Co. LLC (September 2004 – present); Tax Analyst, Bain & Company, Inc (June 2003 – September 2004); Senior Tax Associate, PricewaterhouseCoopers LLP (2001 – 2003). | ||||||||||||
| Mahmoodur Rahman c/o GMO Trust 40 Rowes Wharf Boston, MA 02110 DOB: 11/30/1967 | Assistant Treasurer | Since September 2007. | Fund Administrator, Grantham, Mayo, Van Otterloo & Co. (April 2007 – present); Vice President and Senior Tax Manager, Massachusetts Financial Services Company (January 2000 – April 2007). | ||||||||||||
5 Officers are elected to hold such office until their successor is elected and qualified to carry out the duties and responsibilities of their office, or until he or she resigns or is removed from office.
39
Principal Officers — (Continued)
| Name, Address, and DOB | Position(s) Held with Trust | Term of Office5 and Length of Time Served | Principal Occupation(s) During Past Five Years | ||||||||||||
| Michael E. Gillespie c/o GMO Trust 40 Rowes Wharf Boston, MA 02110 DOB: 02/18/1958 | Chief Compliance Officer | Since March 2005. | Vice President of Compliance (June 2004 – February 2005) and Director of Domestic Compliance (March 2002 – June 2004), Fidelity Investments; Vice President and Senior Counsel, State Street Bank and Trust Company (May 1998 – March 2002). | ||||||||||||
| Jason B. Harrison c/o GMO Trust 40 Rowes Wharf Boston, MA 02110 DOB: 01/29/1977 | Vice President and Clerk | Vice President since November 2006; Clerk since March 2006. | Legal Counsel, Grantham, Mayo, Van Otterloo & Co. LLC (since February 2006) and Attorney, Ropes & Gray LLP (September 2002 – February 2006). | ||||||||||||
| David L. Bohan c/o GMO Trust 40 Rowes Wharf Boston, MA 02110 DOB: 06/21/1964 | Vice President and Assistant Clerk | Vice President since March 2005; Assistant Clerk since March 2006. | Legal Counsel, Grantham, Mayo, Van Otterloo & Co. LLC (September 2003 – present); Attorney, Goodwin Procter LLP (September 1996 – September 2003). | ||||||||||||
| Gregory L. Pottle c/o GMO Trust 40 Rowes Wharf Boston, MA 02110 DOB: 07/09/1971 | Vice President and Assistant Clerk | Since November 2006. | Legal Counsel, Grantham, Mayo, Van Otterloo & Co. LLC. | ||||||||||||
| Anne K. Trinque c/o GMO Trust 40 Rowes Wharf Boston, MA 02110 DOB: 04/15/1978 | Vice President and Assistant Clerk | Since September 2007. | Legal Counsel, Grantham, Mayo, Van Otterloo & Co. LLC (since January 2007); Attorney, Goodwin Procter LLP (September 2003 – January 2007). | ||||||||||||
| Cheryl Wakeham c/o GMO Trust 40 Rowes Wharf Boston, MA 02110 DOB: 10/29/1958 | Anti-Money Laundering Officer | Since December 2004. | Manager, Client Service Administration, Grantham, Mayo, Van Otterloo & Co. LLC. | ||||||||||||
5 Officers are elected to hold such office until their successor is elected and qualified to carry out the duties and responsibilities of their office, or until he or she resigns or is removed from office.
40
GMO Global Growth Fund
(A Series of GMO Trust)
Annual Report
February 29, 2008
For a free copy of the Fund's proxy voting guidelines, shareholders may call 1-617-346-7646 (collect), visit our website at www.gmo.com, or visit the Securities and Exchange Commission's website at www.sec.gov. Information regarding how the Fund voted proxies relating to portfolio securities during the most recent 12-month period ended June 30 is available on our website at www.gmo.com, or on the Securities and Exchange Commission's website at www.sec.gov.
The Fund files its complete schedule of portfolio holdings with the Securities and Exchange Commission for the first and third quarter of each fiscal year on Form N-Q, which is available on the Commission's website at www.sec.gov. The Fund's Form N-Q may be reviewed and copied at the Commission's Public Reference Room in Washington, D.C. Information on the operation of the Public Reference Room may be obtained by calling 1-800-SEC-0330. The Fund has a policy with respect to disclosure of portfolio holdings under which it may also make available on GMO's website (www.gmo.com) a complete schedule of portfolio holdings.
This report is prepared for the general information of shareholders. It is authorized for distribution to prospective investors only when preceded or accompanied by a prospectus for the GMO Trust.
GMO Global Growth Fund
(A Series of GMO Trust)
Portfolio Managers
Day-to-day management of the Fund's portfolio is the responsibility of the International Quantitative team at Grantham, Mayo, Van Otterloo & Co. LLC.
Management Discussion and Analysis of Fund Performance
The GMO Global Growth Fund returned +3.1% for the fiscal year ended February 29, 2008, as compared to -0.5% for the MSCI World Index and +3.5% for the S&P/Citigroup PMI World Growth Index. The Fund was invested substantially in global equity securities throughout the period.
Country allocation had minimal impact on relative performance. Among country positions, the positive impact of our underweight to Japan was largely offset by the negative impact from our underweight to Canada.
Sector weightings had a negative impact on performance relative to the Growth index. During the period, an overweight position in Consumer Discretionary and an underweight position in Consumer Staples detracted.
Currency allocation had a positive impact on relative performance as our underweight in the U.S. dollar and overweight in the Swiss franc added value. The U.S. dollar weakened relative to most foreign currencies, which boosted returns for U.S. investors. The MSCI World Index returned almost 6% more in U.S. dollar terms than in local currency.
Among GMO's global quantitative stock selection disciplines, only stocks ranked highly by momentum outperformed significantly (and price momentum did much better than earnings revision momentum). Those stocks favored by intrinsic value underperformed.
Stock selection had a positive impact on relative performance. Among the most significant contributors were holdings in German automaker Volkswagen and Hong Kong Exchanges & Clearing, both of which outperformed. Holdings in Royal Bank of Scotland and Fannie Mae underperformed, which hurt returns.
The views expressed herein are exclusively those of Grantham, Mayo, Van Otterloo & Co. LLC Management as of the date of this report and are subject to change. GMO disclaims any responsibility to update such views. They are not meant as investment advice. References to specific securities are not recommendations of such securities and may not be representative of any GMO portfolio's current or future investments.
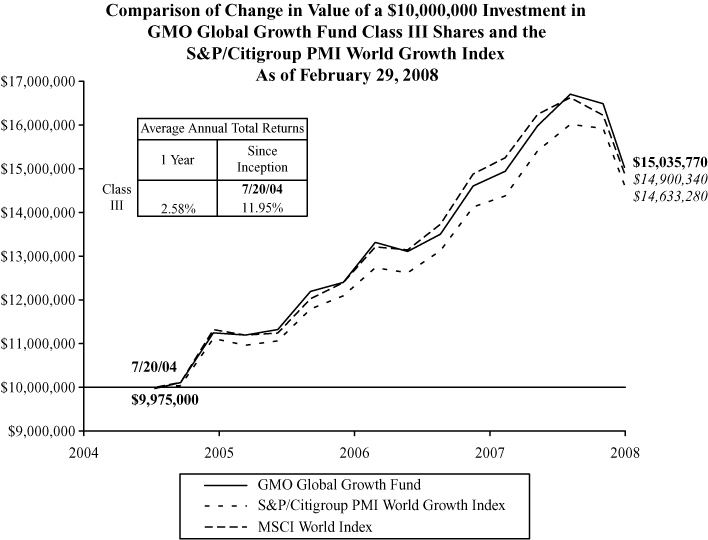
Performance data quoted represents past performance and is not indicative of future results. The investment return and principal value of an investment will fluctuate so that an investor's shares, when redeemed, may be worth more or less than their original cost. Current performance data may be lower or higher than the performance data provided herein. To obtain performance information to the most recent month-end, visit www.gmo.com. Performance shown is net of all fees after reimbursement from the Manager. Each performance figure assumes a purchase at the beginning and redemption at the end of the stated period and reflects a transaction fee of .25% on the purchase and .25% on the redemption. Transaction fees are retained by the Fund to cover trading costs. Returns would have been lower had certain expenses not been reimbursed during the periods shown and do not include the effect of taxes on distributions and redemptions. All information is unaudited.
GMO Global Growth Fund
(A Series of GMO Trust)
Investments Concentration Summary
February 29, 2008 (Unaudited)
| Asset Class Summary | % of Total Net Assets | ||||||
| Common Stocks | 97.9 | % | |||||
| Short-Term Investments | 1.4 | ||||||
| Preferred Stocks | 0.6 | ||||||
| Forward Currency Contracts | 0.2 | ||||||
| Rights and Warrants | 0.0 | ||||||
| Other | (0.1 | ) | |||||
| 100.0 | % | ||||||
| Country Summary | % of Equity Investments | ||||||
| United States | 45.3 | % | |||||
| United Kingdom | 9.0 | ||||||
| Japan | 7.0 | ||||||
| Germany | 6.5 | ||||||
| France | 5.0 | ||||||
| Finland | 4.0 | ||||||
| Hong Kong | 3.5 | ||||||
| Singapore | 3.1 | ||||||
| Canada | 3.1 | ||||||
| Australia | 2.9 | ||||||
| Switzerland | 2.5 | ||||||
| Denmark | 1.6 | ||||||
| Norway | 1.3 | ||||||
| Spain | 1.2 | ||||||
| Italy | 1.1 | ||||||
| Netherlands | 1.0 | ||||||
| Sweden | 1.0 | ||||||
| Belgium | 0.4 | ||||||
| Ireland | 0.3 | ||||||
| Austria | 0.2 | ||||||
| 100.0 | % | ||||||
1
GMO Global Growth Fund
(A Series of GMO Trust)
Investments Concentration Summary — (Continued)
February 29, 2008 (Unaudited)
| Industry Sector Summary | % of Equity Investments | ||||||
| Information Technology | 14.5 | % | |||||
| Energy | 14.3 | ||||||
| Financials | 13.7 | ||||||
| Health Care | 13.5 | ||||||
| Industrials | 11.3 | ||||||
| Consumer Discretionary | 9.3 | ||||||
| Materials | 9.2 | ||||||
| Consumer Staples | 8.0 | ||||||
| Utilities | 3.9 | ||||||
| Telecommunication Services | 2.3 | ||||||
| 100.0 | % | ||||||
2
GMO Global Growth Fund
(A Series of GMO Trust)
Schedule of Investments
(showing percentage of total net assets)
February 29, 2008
| Shares | Description | Value ($) | |||||||||||||
| COMMON STOCKS — 97.9% | |||||||||||||||
| Australia — 2.8% | |||||||||||||||
| 9,762 | BHP Billiton Ltd | 353,216 | |||||||||||||
| 1,580 | Commonwealth Bank of Australia | 61,184 | |||||||||||||
| 2,324 | CSL Ltd | 77,946 | |||||||||||||
| 694 | Macquarie Group Ltd | 34,659 | |||||||||||||
| 3,104 | QBE Insurance Group Ltd | 64,202 | |||||||||||||
| 827 | Rio Tinto Ltd | 103,048 | |||||||||||||
| 15,616 | Telstra Corp Ltd | 70,200 | |||||||||||||
| 3,028 | Woodside Petroleum Ltd | 158,339 | |||||||||||||
| 2,326 | Woolworths Ltd | 62,121 | |||||||||||||
| Total Australia | 984,915 | ||||||||||||||
| Austria — 0.2% | |||||||||||||||
| 234 | Oesterreichische Elektrizitaetswirtschafts AG Class A | 17,319 | |||||||||||||
| 886 | OMV AG | 64,018 | |||||||||||||
| Total Austria | 81,337 | ||||||||||||||
| Belgium — 0.4% | |||||||||||||||
| 2,924 | Fortis | 64,598 | |||||||||||||
| 743 | Inbev NV | 67,153 | |||||||||||||
| 67 | UCB SA | 3,176 | |||||||||||||
| Total Belgium | 134,927 | ||||||||||||||
| Canada — 3.0% | |||||||||||||||
| 700 | Bank of Nova Scotia | 33,988 | |||||||||||||
| 1,400 | Canadian Natural Resources | 104,916 | |||||||||||||
| 1,100 | Canadian Pacific Railway Ltd | 79,953 | |||||||||||||
| 1,700 | EnCana Corp | 129,592 | |||||||||||||
| 1,200 | Husky Energy Inc | 50,841 | |||||||||||||
| 500 | Imperial Oil Ltd | 28,118 | |||||||||||||
| 1,800 | Potash Corp of Saskatchewan Inc | 286,171 | |||||||||||||
| 2,100 | Research In Motion Ltd * | 218,758 | |||||||||||||
| 700 | Suncor Energy Inc | 72,187 | |||||||||||||
See accompanying notes to the financial statements.
3
GMO Global Growth Fund
(A Series of GMO Trust)
Schedule of Investments — (Continued)
(showing percentage of total net assets)
February 29, 2008
| Shares | Description | Value ($) | |||||||||||||
| Canada — continued | |||||||||||||||
| 500 | Toronto Dominion Bank | 33,477 | |||||||||||||
| Total Canada | 1,038,001 | ||||||||||||||
| Denmark — 1.5% | |||||||||||||||
| 7 | AP Moller-Maersk A/S | 71,931 | |||||||||||||
| 800 | Danske Bank A/S | 30,559 | |||||||||||||
| 564 | FLSmidth & Co A/S | 52,659 | |||||||||||||
| 3,900 | Novo-Nordisk A/S | 266,793 | |||||||||||||
| 1,100 | Vestas Wind Systems A/S * | 111,516 | |||||||||||||
| Total Denmark | 533,458 | ||||||||||||||
| Finland — 4.0% | |||||||||||||||
| 3,710 | Fortum Oyj | 154,902 | |||||||||||||
| 1,858 | Kone Oyj | 65,011 | |||||||||||||
| 1,015 | Metso Oyj | 52,808 | |||||||||||||
| 21,978 | Nokia Oyj | 789,617 | |||||||||||||
| 1,531 | Nokian Renkaat Oyj | 62,944 | |||||||||||||
| 1,406 | Rautaruukki Oyj | 61,302 | |||||||||||||
| 4,225 | Sampo Oyj Class A | 114,668 | |||||||||||||
| 1,085 | Wartsila Oyj Class B | 74,167 | |||||||||||||
| Total Finland | 1,375,419 | ||||||||||||||
| France — 4.9% | |||||||||||||||
| 530 | Alstom | 111,385 | |||||||||||||
| 3,232 | Arcelor Mittal | 245,401 | |||||||||||||
| 2,098 | BNP Paribas | 187,561 | |||||||||||||
| 3,039 | Electricite de France | 283,447 | |||||||||||||
| 1,091 | Peugeot SA | 82,937 | |||||||||||||
| 5,675 | Sanofi-Aventis | 419,454 | |||||||||||||
| 513 | Societe Generale | 54,891 | |||||||||||||
| 128 | Societe Generale NV (New Shares) * | 14,065 | |||||||||||||
| 3,801 | Total SA | 286,231 | |||||||||||||
| Total France | 1,685,372 | ||||||||||||||
See accompanying notes to the financial statements.
4
GMO Global Growth Fund
(A Series of GMO Trust)
Schedule of Investments — (Continued)
(showing percentage of total net assets)
February 29, 2008
| Shares | Description | Value ($) | |||||||||||||
| Germany — 5.9% | |||||||||||||||
| 345 | Allianz SE (Registered) | 59,476 | |||||||||||||
| 1,325 | Altana AG | 30,865 | |||||||||||||
| 1,634 | BASF AG | 208,949 | |||||||||||||
| 1,846 | Bayer AG | 142,067 | |||||||||||||
| 2,028 | Daimler AG (Registered) (a) | 168,879 | |||||||||||||
| 1,008 | Deutsche Boerse AG | 160,398 | |||||||||||||
| 1,750 | E.ON AG | 329,483 | |||||||||||||
| 219 | K&S AG | 63,723 | |||||||||||||
| 762 | MAN AG | 100,509 | |||||||||||||
| 21 | Merck KGaA | 2,611 | |||||||||||||
| 774 | Metro AG | 64,194 | |||||||||||||
| 652 | Q-Cells AG * | 52,560 | |||||||||||||
| 1,317 | Siemens AG (Registered) | 167,949 | |||||||||||||
| 996 | Solarworld AG | 45,018 | |||||||||||||
| 2,014 | ThyssenKrupp AG | 115,820 | |||||||||||||
| 1,186 | Volkswagen AG | 270,046 | |||||||||||||
| 192 | Wacker-Chemie AG | 40,784 | |||||||||||||
| Total Germany | 2,023,331 | ||||||||||||||
| Hong Kong — 3.4% | |||||||||||||||
| 4,800 | Bank of East Asia Ltd | 25,782 | |||||||||||||
| 8,000 | Cheung Kong Holdings Ltd | 119,499 | |||||||||||||
| 18,500 | CLP Holdings Ltd | 144,617 | |||||||||||||
| 8,600 | Esprit Holdings Ltd | 108,076 | |||||||||||||
| 24,000 | Hang Lung Properties Ltd | 86,180 | |||||||||||||
| 6,300 | Hang Seng Bank Ltd | 119,248 | |||||||||||||
| 32,000 | Hong Kong & China Gas | 93,185 | |||||||||||||
| 500 | Hong Kong Electric Holdings Ltd | 2,832 | |||||||||||||
| 10,000 | Hong Kong Exchanges and Clearing Ltd | 189,971 | |||||||||||||
| 18,000 | Li & Fung Ltd | 65,472 | |||||||||||||
| 23,000 | New World Development Co Ltd | 61,824 | |||||||||||||
| 9,000 | Sun Hung Kai Properties Ltd | 156,838 | |||||||||||||
| Total Hong Kong | 1,173,524 | ||||||||||||||
See accompanying notes to the financial statements.
5
GMO Global Growth Fund
(A Series of GMO Trust)
Schedule of Investments — (Continued)
(showing percentage of total net assets)
February 29, 2008
| Shares | Description | Value ($) | |||||||||||||
| Ireland — 0.3% | |||||||||||||||
| 1,734 | Allied Irish Banks Plc | 35,102 | |||||||||||||
| 5,593 | Bank of Ireland | 78,678 | |||||||||||||
| Total Ireland | 113,780 | ||||||||||||||
| Italy — 1.1% | |||||||||||||||
| 10,640 | ENI SPA | 367,412 | |||||||||||||
| Japan — 6.9% | |||||||||||||||
| 700 | Astellas Pharma Inc | 30,594 | |||||||||||||
| 1,200 | Canon Inc | 53,790 | |||||||||||||
| 700 | Daikin Industries Ltd | 31,498 | |||||||||||||
| 700 | Daito Trust Construction Co Ltd | 37,975 | |||||||||||||
| 7,000 | Fuji Heavy Industries Ltd | 30,537 | |||||||||||||
| 8,000 | Honda Motor Co Ltd | 244,203 | |||||||||||||
| 700 | JFE Holdings Inc | 31,190 | |||||||||||||
| 3,200 | Komatsu Ltd | 81,294 | |||||||||||||
| 15,000 | Marubeni Corp | 113,567 | |||||||||||||
| 2,900 | Mitsubishi Corp | 88,480 | |||||||||||||
| 2,000 | Mitsubishi Estate Co Ltd | 48,741 | |||||||||||||
| 5,000 | Mitsui & Co | 108,737 | |||||||||||||
| 2,000 | Mitsui Fudosan Co Ltd | 40,608 | |||||||||||||
| 5,000 | Mitsui OSK Lines Ltd | 64,939 | |||||||||||||
| 1,000 | Nikon Corp | 28,010 | |||||||||||||
| 800 | Nintendo Co Ltd | 398,317 | |||||||||||||
| 10,500 | Nippon Mining Holdings Inc | 62,190 | |||||||||||||
| 12,000 | Nippon Oil Corp | 81,860 | |||||||||||||
| 10,000 | Nippon Steel Corp | 52,612 | |||||||||||||
| 5,000 | Nippon Yusen KK | 46,202 | |||||||||||||
| 11,200 | Nissan Motor Co | 100,721 | |||||||||||||
| 7 | NTT Data Corp | 32,757 | |||||||||||||
| 15,000 | Osaka Gas Co Ltd | 60,185 | |||||||||||||
| 4,700 | Seven & I Holdings Co Ltd | 116,867 | |||||||||||||
| 1,900 | Shin-Etsu Chemical Co Ltd | 102,536 | |||||||||||||
| 900 | SUMCO Corp | 19,902 | |||||||||||||
| 3,200 | Takeda Pharmaceutical Co Ltd | 178,557 | |||||||||||||
See accompanying notes to the financial statements.
6
GMO Global Growth Fund
(A Series of GMO Trust)
Schedule of Investments — (Continued)
(showing percentage of total net assets)
February 29, 2008
| Shares | Description | Value ($) | |||||||||||||
| Japan — continued | |||||||||||||||
| 5,000 | Tokyo Gas Co Ltd | 22,429 | |||||||||||||
| 2,000 | TonenGeneral Sekiyu KK | 18,987 | |||||||||||||
| 5,000 | Toshiba Corp | 37,504 | |||||||||||||
| Total Japan | 2,365,789 | ||||||||||||||
| Netherlands — 1.0% | |||||||||||||||
| 2,145 | Heineken NV | 120,979 | |||||||||||||
| 6,658 | ING Groep NV | 221,257 | |||||||||||||
| Total Netherlands | 342,236 | ||||||||||||||
| Norway — 1.3% | |||||||||||||||
| 3,700 | DnB NOR ASA | 54,122 | |||||||||||||
| 3,200 | Orkla ASA | 39,779 | |||||||||||||
| 10,138 | StatoilHydro ASA | 308,918 | |||||||||||||
| 2,100 | Telenor ASA * | 43,001 | |||||||||||||
| Total Norway | 445,820 | ||||||||||||||
| Singapore — 3.0% | |||||||||||||||
| 26,000 | Capitaland Ltd | 114,869 | |||||||||||||
| 9,000 | City Developments Ltd | 75,535 | |||||||||||||
| 18,000 | Keppel Corp Ltd | 135,633 | |||||||||||||
| 19,000 | Oversea-Chinese Banking Corp | 102,496 | |||||||||||||
| 6,800 | Singapore Airlines Ltd | 73,759 | |||||||||||||
| 11,000 | Singapore Exchange Ltd | 64,005 | |||||||||||||
| 43,000 | Singapore Technologies Engineering Ltd | 103,972 | |||||||||||||
| 85,320 | Singapore Telecommunications | 230,852 | |||||||||||||
| 11,000 | United Overseas Bank Ltd | 139,473 | |||||||||||||
| Total Singapore | 1,040,594 | ||||||||||||||
| Spain — 1.2% | |||||||||||||||
| 137 | Acciona SA | 34,803 | |||||||||||||
| 1,239 | Gas Natural SDG SA | 75,076 | |||||||||||||
| 701 | Inditex SA | 36,139 | |||||||||||||
| 2,174 | Repsol YPF SA | 74,996 | |||||||||||||
See accompanying notes to the financial statements.
7
GMO Global Growth Fund
(A Series of GMO Trust)
Schedule of Investments — (Continued)
(showing percentage of total net assets)
February 29, 2008
| Shares | Description | Value ($) | |||||||||||||
| Spain — continued | |||||||||||||||
| 6,937 | Telefonica SA | 200,733 | |||||||||||||
| Total Spain | 421,747 | ||||||||||||||
| Sweden — 1.0% | |||||||||||||||
| 475 | Alfa Laval AB | 25,507 | |||||||||||||
| 1,125 | Hennes & Mauritz AB Class B | 63,099 | |||||||||||||
| 3,900 | Sandvik AB | 65,762 | |||||||||||||
| 1,200 | Scania AB Class B | 28,950 | |||||||||||||
| 400 | SSAB Svenskt Stal AB Series A | 11,200 | |||||||||||||
| 2,000 | Svenska Cellulosa AB Class B | 32,829 | |||||||||||||
| 1,700 | Swedbank AB | 45,947 | |||||||||||||
| 1,500 | Tele2 AB Class B | 26,365 | |||||||||||||
| 2,800 | Volvo AB Class B | 41,569 | |||||||||||||
| Total Sweden | 341,228 | ||||||||||||||
| Switzerland — 2.5% | |||||||||||||||
| 6,440 | ABB Ltd | 160,448 | |||||||||||||
| 800 | Alcon Inc | 115,784 | |||||||||||||
| 178 | Nestle SA (Registered) | 84,957 | |||||||||||||
| 7,319 | Novartis AG (Registered) | 361,506 | |||||||||||||
| 416 | Zurich Financial Services AG | 130,046 | |||||||||||||
| Total Switzerland | 852,741 | ||||||||||||||
| United Kingdom — 8.9% | |||||||||||||||
| 5,245 | AstraZeneca Plc | 196,045 | |||||||||||||
| 18,666 | Barclays Plc | 174,944 | |||||||||||||
| 9,030 | BG Group Plc | 212,846 | |||||||||||||
| 7,049 | BHP Billiton Plc | 225,498 | |||||||||||||
| 2,825 | British American Tobacco Plc | 105,929 | |||||||||||||
| 407 | Cairn Energy Plc * | 21,836 | |||||||||||||
| 9,639 | Centrica Plc | 61,543 | |||||||||||||
| 6,214 | GlaxoSmithKline Plc | 135,643 | |||||||||||||
| 13,769 | HBOS Plc | 163,616 | |||||||||||||
| 4,475 | HSBC Holdings Plc | 67,650 | |||||||||||||
See accompanying notes to the financial statements.
8
GMO Global Growth Fund
(A Series of GMO Trust)
Schedule of Investments — (Continued)
(showing percentage of total net assets)
February 29, 2008
| Shares | Description | Value ($) | |||||||||||||
| United Kingdom — continued | |||||||||||||||
| 2,255 | Imperial Tobacco Group Plc | 104,389 | |||||||||||||
| 5,929 | J Sainsbury Plc | 41,568 | |||||||||||||
| 522 | London Stock Exchange | 13,998 | |||||||||||||
| 1,622 | Next Plc | 41,137 | |||||||||||||
| 29,796 | Old Mutual Plc | 73,599 | |||||||||||||
| 3,152 | Rio Tinto Plc | 354,624 | |||||||||||||
| 51,044 | Royal Bank of Scotland Group | 385,920 | |||||||||||||
| 2,317 | Royal Dutch Shell Group Class A (Amsterdam) | 82,855 | |||||||||||||
| 3,258 | Royal Dutch Shell Plc A Shares (London) | 116,494 | |||||||||||||
| 2,755 | SABMiller Breweries Plc | 57,237 | |||||||||||||
| 2,715 | Unilever Plc | 85,540 | |||||||||||||
| 1,390 | Vedanta Resources Plc | 59,800 | |||||||||||||
| 68,742 | Vodafone Group Inc | 221,309 | |||||||||||||
| 12,410 | William Morrison Supermarkets Plc | 72,747 | |||||||||||||
| Total United Kingdom | 3,076,767 | ||||||||||||||
| United States — 44.6% | |||||||||||||||
| 3,100 | 3M Co. | 243,040 | |||||||||||||
| 1,900 | Abbott Laboratories | 101,745 | |||||||||||||
| 1,000 | Abercrombie & Fitch Co.-Class A | 77,530 | |||||||||||||
| 1,800 | Accenture Ltd. | 63,450 | |||||||||||||
| 800 | ACE Ltd. | 44,992 | |||||||||||||
| 1,000 | Adobe Systems, Inc. * | 33,650 | |||||||||||||
| 1,000 | Aetna, Inc. | 49,600 | |||||||||||||
| 500 | Air Products & Chemicals, Inc. | 45,665 | |||||||||||||
| 1,200 | Amazon.com, Inc. * | 77,364 | |||||||||||||
| 1,000 | American Express Co. | 42,300 | |||||||||||||
| 3,300 | American International Group, Inc. | 154,638 | |||||||||||||
| 200 | AmerisourceBergen Corp. | 8,344 | |||||||||||||
| 1,200 | Amgen, Inc. * | 54,624 | |||||||||||||
| 1,700 | Anadarko Petroleum Corp. | 108,358 | |||||||||||||
| 700 | Apache Corp. | 80,297 | |||||||||||||
| 4,500 | Apple, Inc. * | 562,590 | |||||||||||||
| 800 | Archer-Daniels-Midland Co. | 36,080 | |||||||||||||
See accompanying notes to the financial statements.
9
GMO Global Growth Fund
(A Series of GMO Trust)
Schedule of Investments — (Continued)
(showing percentage of total net assets)
February 29, 2008
| Shares | Description | Value ($) | |||||||||||||
| United States — continued | |||||||||||||||
| 700 | Autodesk, Inc. * | 21,763 | |||||||||||||
| 2,700 | Automatic Data Processing, Inc. | 107,865 | |||||||||||||
| 1,500 | Avon Products, Inc. | 57,090 | |||||||||||||
| 1,700 | Bank of New York Mellon Corp. (The) | 74,579 | |||||||||||||
| 700 | Bard (C.R.), Inc. | 66,353 | |||||||||||||
| 2,300 | Baxter International, Inc. | 135,746 | |||||||||||||
| 1,200 | Becton Dickinson & Co. | 108,504 | |||||||||||||
| 2,400 | Bed Bath & Beyond, Inc. * | 68,016 | |||||||||||||
| 2,900 | Best Buy Co., Inc. | 124,729 | |||||||||||||
| 2,400 | Boston Scientific Corp. * | 30,216 | |||||||||||||
| 700 | Bunge Ltd. | 77,588 | |||||||||||||
| 500 | Caterpillar, Inc. | 36,165 | |||||||||||||
| 1,200 | CH Robinson Worldwide, Inc. | 60,924 | |||||||||||||
| 4,100 | Chevron Corp. | 355,306 | |||||||||||||
| 1,500 | Chubb Corp. | 76,350 | |||||||||||||
| 1,500 | Citrix Systems, Inc. * | 49,395 | |||||||||||||
| 100 | CME Group, Inc. | 51,330 | |||||||||||||
| 2,600 | Coach, Inc. * | 78,832 | |||||||||||||
| 1,500 | Coca Cola Enterprises, Inc. | 36,645 | |||||||||||||
| 6,500 | Coca-Cola Co. (The) | 379,990 | |||||||||||||
| 1,500 | Cognizant Technologies Solutions Corp.-Class A * | 45,315 | |||||||||||||
| 400 | Colgate-Palmolive Co. | 30,436 | |||||||||||||
| 3,942 | ConocoPhillips | 326,043 | |||||||||||||
| 500 | Constellation Energy Group, Inc. | 44,175 | |||||||||||||
| 1,500 | Corning, Inc. | 34,845 | |||||||||||||
| 700 | CSX Corp. | 33,964 | |||||||||||||
| 700 | Danaher Corp. | 51,905 | |||||||||||||
| 1,500 | Deere & Co. | 127,815 | |||||||||||||
| 2,900 | Dell, Inc. * | 57,565 | |||||||||||||
| 600 | Diamond Offshore Drilling, Inc. | 72,498 | |||||||||||||
| 3,400 | eBay, Inc. * | 89,624 | |||||||||||||
| 1,000 | Ecolab, Inc. | 46,790 | |||||||||||||
| 7,600 | EMC Corp. * | 118,104 | |||||||||||||
| 700 | Emerson Electric Co. | 35,672 | |||||||||||||
See accompanying notes to the financial statements.
10
GMO Global Growth Fund
(A Series of GMO Trust)
Schedule of Investments — (Continued)
(showing percentage of total net assets)
February 29, 2008
| Shares | Description | Value ($) | |||||||||||||
| United States — continued | |||||||||||||||
| 500 | Energizer Holdings, Inc. * | 46,415 | |||||||||||||
| 200 | Entergy Corp. | 20,548 | |||||||||||||
| 200 | Everest Re Group Ltd. | 19,376 | |||||||||||||
| 1,400 | Expeditors International of Washington, Inc. | 55,048 | |||||||||||||
| 1,000 | Express Scripts, Inc. * | 59,100 | |||||||||||||
| 8,000 | Exxon Mobil Corp. | 696,080 | |||||||||||||
| 800 | Fastenal Co. | 32,528 | |||||||||||||
| 200 | Fluor Corp. | 27,850 | |||||||||||||
| 2,200 | Forest Laboratories, Inc. * | 87,494 | |||||||||||||
| 700 | Franklin Resources, Inc. | 66,059 | |||||||||||||
| 700 | Freeport-McMoRan Copper & Gold, Inc. | 70,602 | |||||||||||||
| 2,600 | Gap (The), Inc. | 52,442 | |||||||||||||
| 500 | Garmin Ltd. | 29,355 | |||||||||||||
| 700 | General Dynamics Corp. | 57,295 | |||||||||||||
| 400 | Genzyme Corp. * | 28,368 | |||||||||||||
| 1,700 | Gilead Sciences, Inc. * | 80,444 | |||||||||||||
| 200 | Goldman Sachs Group, Inc. | 33,926 | |||||||||||||
| 800 | Google, Inc.-Class A * | 376,944 | |||||||||||||
| 1,900 | Harley-Davidson, Inc. | 70,604 | |||||||||||||
| 700 | Hess Corp. | 65,226 | |||||||||||||
| 6,400 | Hewlett-Packard Co. | 305,728 | |||||||||||||
| 6,900 | Home Depot, Inc. | 183,195 | |||||||||||||
| 1,000 | Honeywell International, Inc. | 57,540 | |||||||||||||
| 1,700 | Illinois Tool Works, Inc. | 83,419 | |||||||||||||
| 6,100 | Intel Corp. | 121,695 | |||||||||||||
| 3,100 | International Business Machines Corp. | 352,966 | |||||||||||||
| 400 | Jacobs Engineering Group, Inc. * | 32,116 | |||||||||||||
| 15,400 | Johnson & Johnson | 954,184 | |||||||||||||
| 700 | Johnson Controls, Inc. | 23,002 | |||||||||||||
| 1,700 | JPMorgan Chase & Co. | 69,105 | |||||||||||||
| 1,400 | Juniper Networks, Inc. * | 37,548 | |||||||||||||
| 1,500 | Kroger Co. | 36,375 | |||||||||||||
| 700 | Lockheed Martin Corp. | 72,240 | |||||||||||||
| 8,500 | Lowe's Cos., Inc. | 203,745 | |||||||||||||
See accompanying notes to the financial statements.
11
GMO Global Growth Fund
(A Series of GMO Trust)
Schedule of Investments — (Continued)
(showing percentage of total net assets)
February 29, 2008
| Shares | Description | Value ($) | |||||||||||||
| United States — continued | |||||||||||||||
| 1,000 | Marathon Oil Corp. | 53,160 | |||||||||||||
| 500 | Mastercard, Inc.-Class A | 95,000 | |||||||||||||
| 4,300 | McDonald's Corp. | 232,673 | |||||||||||||
| 2,100 | McGraw-Hill Cos., Inc. | 85,953 | |||||||||||||
| 500 | McKesson Corp. | 29,380 | |||||||||||||
| 2,000 | Medco Health Solutions, Inc. * | 88,620 | |||||||||||||
| 1,700 | Medtronic, Inc. | 83,912 | |||||||||||||
| 400 | MEMC Electronic Materials, Inc. * | 30,512 | |||||||||||||
| 5,100 | Merck & Co., Inc. | 225,930 | |||||||||||||
| 1,200 | MetLife, Inc. | 69,912 | |||||||||||||
| 424 | MGM Mirage * | 26,114 | |||||||||||||
| 9,900 | Microsoft Corp. | 269,478 | |||||||||||||
| 700 | Molson Coors Brewing Co.-Class B | 37,772 | |||||||||||||
| 2,400 | Monsanto Co. | 277,632 | |||||||||||||
| 1,800 | National Oilwell Varco, Inc. * | 112,140 | |||||||||||||
| 2,200 | Nike, Inc.-Class B | 132,440 | |||||||||||||
| 600 | Northern Trust Corp. | 40,578 | |||||||||||||
| 2,200 | Nvidia Corp. * | 47,058 | |||||||||||||
| 2,700 | Occidental Petroleum Corp. | 208,899 | |||||||||||||
| 12,200 | Oracle Corp. * | 229,360 | |||||||||||||
| 700 | Paccar, Inc. | 30,366 | |||||||||||||
| 3,000 | Paychex, Inc. | 94,380 | |||||||||||||
| 700 | Pepsi Bottling Group, Inc. | 23,807 | |||||||||||||
| 7,500 | PepsiCo, Inc. | 521,700 | |||||||||||||
| 6,900 | Pfizer, Inc. | 153,732 | |||||||||||||
| 700 | Praxair, Inc. | 56,196 | |||||||||||||
| 700 | Precision Castparts Corp. | 77,273 | |||||||||||||
| 1,000 | Prudential Financial, Inc. | 72,970 | |||||||||||||
| 1,800 | Qualcomm, Inc. | 76,266 | |||||||||||||
| 800 | Rockwell Collins, Inc. | 47,120 | |||||||||||||
| 2,400 | Schering-Plough Corp. | 52,080 | |||||||||||||
| 3,300 | Schlumberger Ltd. | 285,285 | |||||||||||||
| 1,700 | Seagate Technology | 36,669 | |||||||||||||
| 800 | Smith International, Inc. | 50,424 | |||||||||||||
See accompanying notes to the financial statements.
12
GMO Global Growth Fund
(A Series of GMO Trust)
Schedule of Investments — (Continued)
(showing percentage of total net assets)
February 29, 2008
| Shares | Description | Value ($) | |||||||||||||
| United States — continued | |||||||||||||||
| 900 | Southern Copper Corp. | 102,699 | |||||||||||||
| 600 | SPX Corp. | 61,380 | |||||||||||||
| 1,200 | State Street Corp. | 94,260 | |||||||||||||
| 2,200 | Stryker Corp. | 143,242 | |||||||||||||
| 3,600 | Symantec Corp. * | 60,624 | |||||||||||||
| 3,300 | Sysco Corp. | 92,598 | |||||||||||||
| 2,100 | TD Ameritrade Holding Corp. * | 38,430 | |||||||||||||
| 1,900 | Texas Instruments, Inc. | 56,924 | |||||||||||||
| 1,000 | Thermo Fisher Scientific, Inc. * | 55,930 | |||||||||||||
| 2,500 | TJX Cos., Inc. | 80,000 | |||||||||||||
| 769 | Transocean, Inc. * | 108,052 | |||||||||||||
| 2,700 | United Parcel Service, Inc.-Class B | 189,648 | |||||||||||||
| 2,700 | United Technologies Corp. | 190,377 | |||||||||||||
| 2,900 | UnitedHealth Group, Inc. | 134,792 | |||||||||||||
| 1,000 | Valero Energy Corp. | 57,770 | |||||||||||||
| 5,600 | Walgreen Co. | 204,456 | |||||||||||||
| 3,400 | Wal-Mart Stores, Inc. | 168,606 | |||||||||||||
| 1,900 | Walt Disney Co. (The) | 61,579 | |||||||||||||
| 700 | Weatherford International Ltd. * | 48,244 | |||||||||||||
| 1,200 | Zimmer Holdings, Inc. * | 90,348 | |||||||||||||
| Total United States | 15,399,716 | ||||||||||||||
| TOTAL COMMON STOCKS (COST $34,505,524) | 33,798,114 | ||||||||||||||
| PREFERRED STOCKS — 0.6% | |||||||||||||||
| Germany — 0.6% | |||||||||||||||
| 39 | Porsche AG (Non Voting) 0.06% | 67,621 | |||||||||||||
| 979 | Volkswagen AG 2.02% | 136,412 | |||||||||||||
| Total Germany | 204,033 | ||||||||||||||
| TOTAL PREFERRED STOCKS (COST $167,554) | 204,033 | ||||||||||||||
See accompanying notes to the financial statements.
13
GMO Global Growth Fund
(A Series of GMO Trust)
Schedule of Investments — (Continued)
(showing percentage of total net assets)
February 29, 2008
| Shares / Par Value ($) | Description | Value ($) | |||||||||||||
| RIGHTS AND WARRANTS — 0.0% | |||||||||||||||
| France — 0.0% | |||||||||||||||
| 1 | Societe Generale Rights, Expires 02/29/08 *(b) | 9 | |||||||||||||
| TOTAL RIGHTS AND WARRANTS (COST $7) | 9 | ||||||||||||||
| SHORT-TERM INVESTMENTS — 1.4% | |||||||||||||||
| 174,110 | Bank of New York Mellon Institutional Cash Reserves Fund (c) | 174,110 | |||||||||||||
| 300,000 | BNP Paribas Time Deposit, 3.19%, due 03/03/08 | 300,000 | |||||||||||||
| TOTAL SHORT-TERM INVESTMENTS (COST $474,110) | 474,110 | ||||||||||||||
| TOTAL INVESTMENTS — 99.9% (Cost $35,147,195) | 34,476,266 | ||||||||||||||
| Other Assets and Liabilities (net) — 0.1% | 42,308 | ||||||||||||||
| TOTAL NET ASSETS — 100.0% | $ | 34,518,574 | |||||||||||||
See accompanying notes to the financial statements.
14
GMO Global Growth Fund
(A Series of GMO Trust)
Schedule of Investments — (Continued)
February 29, 2008
A summary of outstanding financial instruments at February 29, 2008 is as follows:
Forward Currency Contracts
| Settlement Date | Deliver/Receive | Units of Currency | Value | Net Unrealized Appreciation (Depreciation) | |||||||||||||||
| Buys | |||||||||||||||||||
| 5/23/08 | CAD | 964,963 | $ | 978,836 | $ | 26,137 | |||||||||||||
| 5/23/08 | CHF | 1,377,295 | 1,322,991 | 63,702 | |||||||||||||||
| 5/23/08 | JPY | 149,403,527 | 1,444,856 | 49,588 | |||||||||||||||
| 5/23/08 | JPY | 149,403,527 | 1,444,856 | 50,719 | |||||||||||||||
| 5/23/08 | NZD | 89,533 | 70,647 | (102 | ) | ||||||||||||||
| 5/23/08 | SEK | 4,827,584 | 779,981 | 20,726 | |||||||||||||||
| 5/23/08 | SGD | 801,899 | 576,819 | 6,864 | |||||||||||||||
| $ | 6,618,986 | $ | 217,634 | ||||||||||||||||
| Sales | |||||||||||||||||||
| 5/23/08 | AUD | 742,190 | $ | 683,975 | $ | (8,931 | ) | ||||||||||||
| 5/23/08 | DKK | 1,975,842 | 401,398 | (11,939 | ) | ||||||||||||||
| 5/23/08 | EUR | 857,349 | 1,297,849 | (38,164 | ) | ||||||||||||||
| 5/23/08 | EUR | 857,349 | 1,297,849 | (38,468 | ) | ||||||||||||||
| 5/23/08 | GBP | 677,386 | 1,338,156 | (24,864 | ) | ||||||||||||||
| 5/23/08 | HKD | 1,082,641 | 139,332 | (272 | ) | ||||||||||||||
| 5/23/08 | JPY | 23,820,000 | 230,359 | (5,767 | ) | ||||||||||||||
| 5/23/08 | NOK | 2,151,420 | 409,977 | (10,248 | ) | ||||||||||||||
| 5/23/08 | SGD | 160,000 | 115,091 | (1,840 | ) | ||||||||||||||
| $ | 5,913,986 | $ | (140,493 | ) | |||||||||||||||
See accompanying notes to the financial statements.
15
GMO Global Growth Fund
(A Series of GMO Trust)
Schedule of Investments — (Continued)
February 29, 2008
Notes to Schedule of Investments:
* Non-income producing security.
(a) All or a portion of this security is out on loan (Note 2).
(b) As of February 29, 2008, the Fund elected to sell these rights but the sale did not occur until after the Fund's year end.
(c) All or a portion of this security represents investment of security lending collateral (Note 2).
As of February 29, 2008, 49.38% of the Net Assets of the Fund were valued using fair value prices based on models used by a third party vendor (Note 2).
Currency Abbreviations:
AUD - Australian Dollar
CAD - Canadian Dollar
CHF - Swiss Franc
DKK - Danish Krone
EUR - Euro
GBP - British Pound
HKD - Hong Kong Dollar
JPY - Japanese Yen
NOK - Norwegian Krone
NZD - New Zealand Dollar
SEK - Swedish Krona
SGD - Singapore Dollar
See accompanying notes to the financial statements.
16
GMO Global Growth Fund
(A Series of GMO Trust)
Statement of Assets and Liabilities — February 29, 2008
| Assets: | |||||||
| Investments, at value, including securities on loan of $160,380 (cost $35,147,195) (Note 2) | $ | 34,476,266 | |||||
| Cash | 97,159 | ||||||
| Foreign currency, at value (cost $83,145) (Note 2) | 84,548 | ||||||
| Receivable for investments sold | 9,230 | ||||||
| Receivable for Fund shares sold | 1,799 | ||||||
| Dividends and interest receivable | 55,164 | ||||||
| Foreign taxes receivable | 5,917 | ||||||
| Unrealized appreciation on open forward currency contracts (Note 2) | 217,736 | ||||||
| Receivable for expenses reimbursed by Manager (Note 3) | 31,465 | ||||||
| Total assets | 34,979,284 | ||||||
| Liabilities: | |||||||
| Collateral on securities loaned, at value (Note 2) | 174,110 | ||||||
| Payable for investments purchased | 18,466 | ||||||
| Payable to affiliate for (Note 3): | |||||||
| Management fee | 11,684 | ||||||
| Shareholder service fee | 3,729 | ||||||
| Trustees and Chief Compliance Officer of GMO Trust fees | 27 | ||||||
| Unrealized depreciation on open forward currency contracts (Note 2) | 140,595 | ||||||
| Accrued expenses | 112,099 | ||||||
| Total liabilities | 460,710 | ||||||
| Net assets | $ | 34,518,574 | |||||
| Net assets consist of: | |||||||
| Paid-in capital | $ | 35,088,965 | |||||
| Distributions in excess of net investment income | (89,207 | ) | |||||
| Accumulated net realized gain | 109,793 | ||||||
| Net unrealized depreciation | (590,977 | ) | |||||
| $ | 34,518,574 | ||||||
| Net assets attributable to: | |||||||
| Class III shares | $ | 34,518,574 | |||||
| Shares outstanding: | |||||||
| Class III | 1,448,880 | ||||||
| Net asset value per share: | |||||||
| Class III | $ | 23.82 | |||||
See accompanying notes to the financial statements.
17
GMO Global Growth Fund
(A Series of GMO Trust)
Statement of Operations — Year Ended February 29, 2008
| Investment Income: | |||||||
| Dividends (net of withholding taxes of $26,386) | $ | 334,441 | |||||
| Interest | 33,661 | ||||||
| Securities lending income | 3,385 | ||||||
| Total investment income | 371,487 | ||||||
| Expenses: | |||||||
| Management fee (Note 3) | 79,674 | ||||||
| Shareholder service fee – Class III (Note 3) | 25,428 | ||||||
| Custodian and fund accounting agent fees | 129,338 | ||||||
| Transfer agent fees | 26,751 | ||||||
| Audit and tax fees | 72,707 | ||||||
| Legal fees | 1,813 | ||||||
| Trustees fees and related expenses (Note 3) | 135 | ||||||
| Registration fees | 92 | ||||||
| Miscellaneous | 1,811 | ||||||
| Total expenses | 337,749 | ||||||
| Fees and expenses reimbursed by Manager (Note 3) | (232,542 | ) | |||||
| Expense reductions (Note 2) | (1,551 | ) | |||||
| Net expenses | 103,656 | ||||||
| Net investment income (loss) | 267,831 | ||||||
| Realized and unrealized gain (loss): | |||||||
| Net realized gain (loss) on: | |||||||
| Investments | 9,893,105 | ||||||
| Closed futures contracts | 46,321 | ||||||
| Foreign currency, forward contracts and foreign currency related transactions | 226,168 | ||||||
| Net realized gain (loss) | 10,165,594 | ||||||
| Change in net unrealized appreciation (depreciation) on: | |||||||
| Investments | (12,245,557 | ) | |||||
| Open futures contracts | (102,607 | ) | |||||
| Foreign currency, forward contracts and foreign currency related transactions | 58,426 | ||||||
| Net unrealized gain (loss) | (12,289,738 | ) | |||||
| Net realized and unrealized gain (loss) | (2,124,144 | ) | |||||
| Net increase (decrease) in net assets resulting from operations | $ | (1,856,313 | ) | ||||
See accompanying notes to the financial statements.
18
GMO Global Growth Fund
(A Series of GMO Trust)
Statement of Changes in Net Assets
| Year Ended February 29, 2008 | Year Ended February 28, 2007 | ||||||||||
| Increase (decrease) in net assets: | |||||||||||
| Operations: | |||||||||||
| Net investment income (loss) | $ | 267,831 | $ | 794,292 | |||||||
| Net realized gain (loss) | 10,165,594 | 3,889,761 | |||||||||
| Change in net unrealized appreciation (depreciation) | (12,289,738 | ) | 3,319,656 | ||||||||
| Net increase (decrease) in net assets from operations | (1,856,313 | ) | 8,003,709 | ||||||||
| Distributions to shareholders from: | |||||||||||
| Net investment income | |||||||||||
| Class III | (576,031 | ) | (474,914 | ) | |||||||
| Net realized gains | |||||||||||
| Class III | (1,987,132 | ) | (8,279,516 | ) | |||||||
| (2,563,163 | ) | (8,754,430 | ) | ||||||||
| Net share transactions (Note 7): | |||||||||||
| Class III | (31,353,712 | ) | 18,749,599 | ||||||||
| Purchase premiums and redemption fees (Notes 2 and 7): | |||||||||||
| Class III | 67,093 | 30,368 | |||||||||
| Total increase (decrease) in net assets resulting from net share transactions, purchase premiums and redemption fees | (31,286,619 | ) | 18,779,967 | ||||||||
| Total increase (decrease) in net assets | (35,706,095 | ) | 18,029,246 | ||||||||
| Net assets: | |||||||||||
| Beginning of period | 70,224,669 | 52,195,423 | |||||||||
| End of period (including distributions in excess of net investment income of $89,207 and $75,436, respectively) | $ | 34,518,574 | $ | 70,224,669 | |||||||
See accompanying notes to the financial statements.
19
GMO Global Growth Fund
(A Series of GMO Trust)
Financial Highlights
(For a Class III share outstanding throughout each period)
| Year Ended February 28/29, | |||||||||||||||||||
| 2008 | 2007 | 2006 | 2005(a) | ||||||||||||||||
| Net asset value, beginning of period | $ | 24.59 | $ | 25.13 | $ | 22.67 | $ | 20.00 | |||||||||||
| Income (loss) from investment operations: | |||||||||||||||||||
| Net investment income (loss)† | 0.40 | 0.31 | 0.33 | 0.15 | |||||||||||||||
| Net realized and unrealized gain (loss) | 0.45 | (b) | 2.56 | 2.72 | 2.79 | ||||||||||||||
| Total from investment operations | 0.85 | 2.87 | 3.05 | 2.94 | |||||||||||||||
| Less distributions to shareholders: | |||||||||||||||||||
| From net investment income | (0.49 | ) | (0.17 | ) | (0.10 | ) | (0.27 | ) | |||||||||||
| From net realized gains | (1.13 | ) | (3.24 | ) | (0.49 | ) | — | ||||||||||||
| Total distributions | (1.62 | ) | (3.41 | ) | (0.59 | ) | (0.27 | ) | |||||||||||
| Net asset value, end of period | $ | 23.82 | $ | 24.59 | $ | 25.13 | $ | 22.67 | |||||||||||
| Total Return(c) | 3.10 | % | 12.45 | % | 13.61 | % | 14.72 | %** | |||||||||||
| Ratios/Supplemental Data: | |||||||||||||||||||
| Net assets, end of period (000's) | $ | 34,519 | $ | 70,225 | $ | 52,195 | $ | 57,960 | |||||||||||
| Net expenses to average daily net assets | 0.62 | %(d) | 0.62 | % | 0.62 | % | 0.62 | %* | |||||||||||
| Net investment income to average daily net assets | 1.58 | % | 1.27 | % | 1.40 | % | 1.17 | %* | |||||||||||
| Portfolio turnover rate | 158 | % | 43 | % | 53 | % | 40 | %** | |||||||||||
| Fees and expenses reimbursed by the Manager to average daily net assets: | 1.37 | % | 0.37 | % | 0.34 | % | 0.51 | %* | |||||||||||
| Purchase premiums and redemption fees consisted of the following per share amounts:† | $ | 0.10 | $ | 0.01 | $ | 0.02 | — | (e) | |||||||||||
(a) Period from July 20, 2004 (commencement of operations) through February 28, 2005.
(b) The amount shown for a share outstanding does not correspond with the aggregate realized and unrealized gain (loss) on investments due to the timing of purchases and redemptions of Fund shares in relation to fluctuating market values of the investments of the Fund.
(c) The total return would have been lower had certain expenses not been reimbursed during the periods shown and assumes the effect of reinvested distributions. Calculation excludes purchase premiums and redemption fees which are borne by the shareholder.
(d) The net expense ratio does not include the effect of expense reductions.
(e) For the period ended February 28, 2005, the Fund received no purchase premiums or redemption fees.
† Calculated using average shares outstanding throughout the period.
* Annualized.
** Not annualized.
See accompanying notes to the financial statements.
20
GMO Global Growth Fund
(A Series of GMO Trust)
Notes to Financial Statements
February 29, 2008
1. Organization
GMO Global Growth Fund (the "Fund") is a series of GMO Trust (the "Trust"). The Fund is registered under the Investment Company Act of 1940, as amended, as an open-end, non-diversified management investment company. The Fund is advised and managed by Grantham, Mayo, Van Otterloo & Co. LLC (the "Manager" or "GMO"). The Trust was established as a Massachusetts business trust under the laws of the Commonwealth of Massachusetts on June 24, 1985. The Declaration of Trust permits the Trustees of the Trust ("Trustees") to create an unlimited number of series of shares ("Funds") and to subdivide Funds into classes.
The Fund seeks high total return. The Fund seeks to achieve its objective by outperforming the S&P/Citigroup Primary Market Index ("PMI") World Growth Index. The Fund typically makes equity investments in companies from the world's developed countries, including the U.S.
2. Significant accounting policies
The following is a summary of significant accounting policies which are in conformity with accounting principles generally accepted in the United States of America ("U.S. GAAP") and which are consistently followed by the Fund in the preparation of its financial statements. The preparation of financial statements in accordance with U.S. GAAP requires management to make estimates and assumptions that affect the reported amounts and disclosures in the financial statements. Actual results could differ from those estimates. The accounting records of the Fund are maintained in U.S. dollars.
Portfolio valuation
Securities listed on a securities exchange for which market quotations are readily available are valued at the last sale price or official closing price on each business day, or if there is no such reported sale or official closing price, at the most recent quoted bid price. Unlisted securities for which market quotations are readily available are generally valued at the most recent quoted bid price. Short-term investments with a remaining maturity of sixty days or less are generally valued at amortized cost, which approximates fair value. Shares of investment funds are valued at their net asset value. Securities for which quotations are not readily available or whose values the Manager has determined to be unreliable are valued at fair value as determined in good faith by the Trustees or other persons acting at their direction pursuant to procedures approved by the Trustees. By its nature, a fair value price is a good faith est imate of the value of a security at a given point in time and may not reflect the value that would be realized if the security was sold and the differences could be material. Because many foreign equity securities markets and exchanges close prior to the close of the New York Stock Exchange ("NYSE"), closing prices for foreign securities in those markets or on those exchanges do not reflect the events that occur after that close but before the close of the NYSE. As a result, foreign equity securities are generally valued using fair value prices supplied by a third party vendor based on models to the extent that these fair value prices are available.
21
GMO Global Growth Fund
(A Series of GMO Trust)
Notes to Financial Statements — (Continued)
February 29, 2008
Foreign currency translation
The market values of foreign securities, currency holdings and other assets and liabilities are translated to U.S. dollars based on the current exchange rates each business day. Income and expenses denominated in foreign currencies are translated at current exchange rates when accrued or incurred. The Fund does not isolate realized and unrealized gains and losses attributable to changes in exchange rates from gains and losses that arise from changes in the market value of investments. Such fluctuations are included with net realized and unrealized gain or loss on investments. Net realized gains and losses on foreign currency transactions represent gains and losses on disposition of currencies and forward currency contracts, currency gains and losses realized between the trade and settlement dates on securities transactions, and the difference between the amount of investment income and foreign withholding taxes recorded on the F und's accounting records and the U.S. dollar equivalent amounts actually received or paid.
Forward currency contracts
The Fund may enter into forward currency contracts including forward cross currency contracts. A forward currency contract is an agreement between two parties to buy and sell a currency at a set price on a future date. The market value of a forward currency contract fluctuates with changes in forward currency exchange rates. Forward currency contracts are marked to market daily using rates supplied by a quotation service and changes in value are recorded by the Fund as an unrealized gain or loss. Realized gains or losses equal to the difference between the value of the contract at the time it was opened and the value at the time it was closed are recorded upon delivery or receipt of the currency or, if a forward currency contract is offset by entering into another forward currency contract with the same broker, upon settlement of the net gain or loss. These contracts may involve market risk in excess of the unrealized gain or lo ss reflected in the Fund's Statement of Assets and Liabilities. In addition, the Fund could be exposed to risk if the counterparties are unable to meet the terms of the contracts or if there are movements in currency values that are unfavorable to the Fund. Forward currency contracts outstanding at the end of the period are listed in the Fund's Schedule of Investments.
Futures contracts
The Fund may purchase and sell futures contracts. Upon entering into a futures contract, the Fund is required to deposit with the futures clearing broker an amount of cash, U.S. government and agency obligations, or other liquid assets in accordance with the initial margin requirements of the broker or exchange. In addition, the Fund maintains cash or securities in an amount that at least equals the net amount payable in the event the Fund must deliver the full amount of the contracts. Futures contracts are marked to market daily and an appropriate payable or receivable for the change in value ("variation margin") is recorded by the Fund. The payable or receivable is liquidated on the following business day. Gains or losses are recognized but not considered realized until the contracts expire or are closed. Futures contracts involve, to varying degrees, risk of loss in excess of the variation margin disclosed in the Statement of Assets and Liabilities. Under certain circumstances, futures exchanges may establish daily limits on the amount that the price of a futures contract can vary from the previous day's settlement price, thereby effectively preventing liquidation of unfavorable positions. Losses may arise from changes in the
22
GMO Global Growth Fund
(A Series of GMO Trust)
Notes to Financial Statements — (Continued)
February 29, 2008
value of the underlying instrument if the Fund is unable to liquidate a futures position due to an illiquid secondary market for the contracts or the imposition of price limits, or if counterparties do not perform under the contract terms. Futures contracts are generally valued at the settlement price established each day by the board of trade or exchange on which they are traded. There were no futures contracts outstanding at the end of the period.
Options
The Fund may write call and put options. Writing options increases the Fund's exposure to the underlying instrument by, in the case of a call option, obligating the Fund to sell the underlying instrument at a set price to the option-holder and, in the case of a put option, obligating the Fund to purchase the underlying instrument at a set price from the option-holder. When the Fund writes a call or put option, an amount equal to the premium received is recorded as a liability and subsequently marked to market to reflect the current value of the option written. Premiums received from writing options which expire are treated as realized gains. Premiums received from writing options which are exercised or closed are added to the proceeds or offset against the amounts paid on the underlying future, security or currency transaction to determine the realized gain or loss. The Fund as a writer of an option has no control over whether t he underlying future, security or currency may be sold (call) or purchased (put) and as a result bears the market risk of an unfavorable change in the price of the future, security or currency underlying the written option. In the event that the Fund writes uncovered call options (i.e. options for investments that the Fund does not own), it bears the risk of incurring substantial losses if the price of the underlying instrument increases during the term of the option. There is the risk the Fund may not be able to enter into a closing transaction because of an illiquid market. There were no open written option contracts during the period.
The Fund may also purchase put and call options. Purchasing options alters the Fund's exposure to the underlying instrument by, in the case of a call option, entitling the Fund to purchase the underlying instrument at a set price from the writer of the option and, in the case of a put option, entitling the Fund to sell the underlying instrument at a set price to the writer of the option. The Fund pays a premium as a cost for a purchased option disclosed in the Schedule of Investments which is subsequently marked to market to reflect the current value of the option. Premiums paid for purchasing options which expire are treated as realized losses. Premiums paid for purchasing options which are exercised or closed are added to the amounts paid or offset against the proceeds on the closing transaction to determine the realized gain or loss. The risk associated with purchasing put and call options is limited to the premium paid. Ther e were no purchased option contracts outstanding at the end of the period.
Exchange traded options are valued at the last sale price, or if no sale is reported, the last bid price for purchased options and the last ask price for written options. Options traded over-the-counter are valued using prices supplied by a primary pricing source chosen by the Manager.
23
GMO Global Growth Fund
(A Series of GMO Trust)
Notes to Financial Statements — (Continued)
February 29, 2008
Swap agreements
The Fund may enter into swap agreements. A swap is an agreement to exchange the return generated by one instrument for the return generated by another instrument. Interest rate swap agreements involve the exchange by one party with another party of their respective commitments to pay or receive interest, e.g., an exchange of floating rate payments for fixed rate payments with respect to a notional amount of principal. Total return swap agreements involve a commitment by one party in the agreement to pay interest in exchange for a market-linked return, both based on notional amounts. To the extent the total return of the security or index underlying the transaction exceeds or falls short of the offsetting interest rate obligation, the party will receive a payment from or make a payment to the counterparty, respectively. Forward spread lock swap agreements involve commitments to pay or receive a settlement amount calculated as the difference between the swap spread and a fixed spread, multiplied by the notional amount times the duration of the swap rate. The swap spread is the difference between the benchmark swap rate (market rate) and the specific treasury rate. Variance swap agreements involve commitments to pay or receive a settlement amount calculated as the difference between the annualized realized variance of returns on the underlying price and a fixed quantity, also known as the variance strike, over a period of time. In connection with these agreements, cash or securities may be set aside as collateral by the Fund's custodian or brokers in accordance with the terms of the swap agreement. The Fund earns or pays interest on cash set aside as collateral.
Swaps are marked to market daily using models that incorporate quotations from market makers and the change in value, if any, is recorded as unrealized gain or loss in the Statement of Operations. Payments received or made on swap contracts are recorded as realized gain or loss in the Statement of Operations. Gains or losses are realized upon early termination of the swap agreements. These financial instruments are not actively traded on financial markets. The values assigned to these instruments are based upon the best available information and because of the uncertainty of the valuation, these values may differ significantly from the values that would have been realized had a ready market for these instruments existed, and the differences could be material. Entering into these agreements involves, to varying degrees, elements of credit, legal, market and documentation risk in excess of the amounts recognized in the Statement o f Assets and Liabilities. Such risks involve the possibility that there will be no liquid market for these agreements, that the counterparties to the agreements may default on their obligations to perform or disagree as to the meaning of contractual terms in the agreements, or that there may be unfavorable changes in interest rates or the price of the index or security underlying these transactions. There were no swap agreements outstanding at the end of the period.
Repurchase agreements
The Fund may enter into repurchase agreements with banks and broker-dealers whereby the Fund acquires a security for cash and obtains a simultaneous commitment from the seller to repurchase the security at an agreed upon price and date. The Fund, through its custodian, takes possession of securities collateralizing the repurchase agreement. The collateral is marked to market daily to ensure that the market value of the underlying assets remains sufficient to protect the Fund in the event of default by the seller. Collateral for
24
GMO Global Growth Fund
(A Series of GMO Trust)
Notes to Financial Statements — (Continued)
February 29, 2008
certain tri-party repurchase agreements is held at the counterparty's custodian in a segregated account for the benefit of the Fund and the counterparty. In connection with transactions in repurchase agreements, if the seller defaults or enters into insolvency proceedings and the value of the collateral declines, recovery of cash by the Fund may be delayed or limited. There were no repurchase agreements outstanding at the end of the period.
Securities lending
The Fund may lend its securities to certain qualified broker-dealers. The loans are collateralized with cash or liquid securities with a market value at least equal to the market value of the securities on loan. As with other extensions of credit, the Fund may bear the risk of loss with respect to the investment of the collateral, the risk of delay in and/or inability to exercise its rights with respect to the collateral, and the risk of delay in recovery or loss of rights in the loaned securities should the borrower of the securities fail financially. If a loan is collateralized by U.S. government securities, the Fund receives a fee from the borrower. If a loan is collateralized by cash, the Fund typically invests the cash collateral for its own account in interest-bearing, short-term securities and pays a fee to the borrower that normally represents a portion of the Fund's earnings on the collateral. As of February 29, 2008, t he Fund had loaned securities valued by the Fund at $160,380, collateralized by cash in the amount of $174,110, which was invested in the Bank of New York Mellon Institutional Cash Reserves Fund.
Taxes and distributions
The Fund intends to qualify each tax year as a regulated investment company under Subchapter M of the Internal Revenue Code of 1986, as amended (the "Code"). The Fund intends to distribute substantially all of its net investment income and net realized short-term and long-term capital gains, if any, after giving effect to any available capital loss carryovers for U.S. federal income tax purposes. Therefore, no provision for U.S. federal income or excise tax is necessary. Taxes on foreign interest and dividend income are generally withheld in accordance with the applicable country's tax treaty with the United States. The foreign withholding rates applicable to a Fund's investments in certain foreign jurisdictions may be higher if a significant portion of the Fund is held by non-U.S. shareholders.
The Fund's policy is to declare and pay distributions from net investment income, if any, semiannually, and from net realized short-term and long-term capital gains, if any, at least annually. All distributions are paid in shares of the Fund, at net asset value, unless the shareholder elects to receive cash distributions. Distributions to shareholders are recorded by the Fund on the ex-dividend date.
Dividends received by shareholders of the Fund which are derived from foreign source income and foreign taxes paid by the Fund may be treated, to the extent allowable under the Code, as if received and paid by the shareholders of the Fund.
The Fund may be subject to capital gains and repatriation taxes imposed by certain countries in which it invests.
25
GMO Global Growth Fund
(A Series of GMO Trust)
Notes to Financial Statements — (Continued)
February 29, 2008
Income and capital gain distributions are determined in accordance with U.S. federal income tax regulations, which may differ from U.S. GAAP. Certain capital accounts in the financial statements are periodically adjusted for permanent differences in order to reflect their tax character. These adjustments have no impact on net assets or net asset value per share. Temporary differences which arise from recognizing certain items of income, expense, gain or loss in different periods for financial statement and tax purposes will reverse at some time in the future. Distributions in excess of net investment income or net realized gains are temporary over distributions for financial statement purposes resulting from differences in the recognition or classification of income or distributions for financial statement and tax purposes.
U.S. GAAP and tax accounting differences primarily relate to passive foreign investment company transactions, losses on wash sale transactions, foreign currency transactions, derivative contract transactions, redemption in-kind transactions, and post-October capital losses.
The following reclassification represents the amount necessary to report the stated components of net assets on a tax basis, excluding certain temporary differences, as of February 29, 2008. The financial highlights exclude these adjustments.
| Distributions In Excess Of Net Investment Income | Accumulated Net Realized Gain | Paid-in Capital | |||||||||
| $ | 294,429 | $ | (9,375,293 | ) | $ | 9,080,864 | |||||
The tax character of distributions declared to shareholders is as follows:
| 2/29/2008 | 2/28/2007 | ||||||||||
| Ordinary income (including any short-term capital gains | $ | 680,833 | $ | 1,480,945 | |||||||
| Long-term capital gains | 1,882,330 | 7,273,485 | |||||||||
| Total distributions | $ | 2,563,163 | $ | 8,754,430 | |||||||
Distributions in excess of tax basis earnings and profits, if significant, are reported in the financial statements as a tax return of capital.
As of February 29, 2008, the components of distributable earnings on a tax basis consisted of the following:
| Undistributed ordinary income | $ | 236,745 | |||||
26
GMO Global Growth Fund
(A Series of GMO Trust)
Notes to Financial Statements — (Continued)
February 29, 2008
As of February 29, 2008, the Fund elected to defer to March 1, 2008 post-October capital losses of $52,121.
As of February 29, 2008, the approximate cost for U.S. federal income tax purposes and gross and net unrealized appreciation and depreciation in value of investments were as follows:
| Aggregate Cost | Gross Unrealized Appreciation | Gross Unrealized (Depreciation) | Net Unrealized Appreciation (Depreciation) | ||||||||||||
| $ | 35,219,026 | $ | 1,385,959 | $ | (2,128,719 | ) | $ | (742,760 | ) | ||||||
For the period ended February 29, 2008, the Fund had net realized gains attributed to redemption in-kind transactions of $9,129,486.
Security transactions and related investment income
Security transactions are accounted for on trade date. Dividend income, net of applicable foreign withholding taxes, if any, is recorded on the ex-dividend date, or when the Fund is informed of the ex-dividend date, if later. Interest income is recorded on the accrual basis and is adjusted for the amortization of premiums and accretion of discounts. Interest income on inflation indexed securities, if any, is accrued daily based upon an inflation adjusted principal. Additionally, any increase or decrease in the principal or face amount of the securities adjusted for inflation is recorded as interest income or loss. Income is not recognized on securities for which collection is not expected. Non-cash dividends, if any, are recorded at the fair market value of the securities received. In determining the net gain or loss on securities sold, the cost of securities is determined on the identified cost basis.
Expenses
The majority of expenses of the Trust are directly identifiable to an individual fund. Expenses which are not readily identifiable to a specific fund are allocated taking into consideration, among other things, the nature and type of expense and the relative size of the funds.
Brown Brothers Harriman & Co. ("BBH") serves as custodian and fund accounting agent of the Fund. State Street Bank and Trust Company ("State Street") serves as transfer agent of the Fund. BBH and State Street's fees may be reduced by credits that are an earnings allowance calculated on the average daily cash balances the Fund maintains with each agent. Credit balances or expense reimbursements used to reduce fees, if any, are reported as a reduction of expenses in the Statement of Operations.
Purchase and redemption of Fund shares
As of February 29, 2008, the premium on cash purchases and fee on cash redemptions of Fund shares were each 0.25% of the amount invested or redeemed. An additional purchase premium and redemption fee of 0.005% is charged for any purchases/redemptions (or any portion of a purchase/redemption)
27
GMO Global Growth Fund
(A Series of GMO Trust)
Notes to Financial Statements — (Continued)
February 29, 2008
effected in a currency other than the U.S. dollar. If the Manager determines that any portion of a cash purchase or redemption is offset by a corresponding cash redemption or purchase occurring on the same day, it will waive the purchase premium or redemption fee in an amount approximately equal to the fee with respect to that portion. In addition, the purchase premium or redemption fee charged by the Fund may be waived in extraordinary circumstances if the Fund will not incur transaction costs. All purchase premiums and redemption fees are paid to and recorded by the Fund as paid-in-capital. The Manager will waive the purchase premium relating to the in-kind portion of a purchase transaction except to the extent of certain estimated or known transaction costs (e.g. stamp duties and transfer taxes) incurred by the Fund in connection with the transfer of the purchasing shareholder's securities to the Fund. In-kind redemption tran sactions are generally not subject to redemption fees except to the extent those transactions include a cash component. However, when a substantial portion of a Fund is being redeemed, the Fund may assess estimated or known transaction costs. There is no premium for reinvested distributions.
Investment risks
There are certain additional risks involved in investing in foreign securities that are not inherent in investments in U.S. securities. These risks may involve adverse political and economic developments including the possible imposition of capital controls or other foreign governmental laws or restrictions. In addition, the securities of some foreign companies and securities markets are less liquid and at times may be more volatile than securities of comparable U.S. companies and U.S. securities markets.
Recently issued accounting pronouncements
In June 2006, the Financial Accounting Standards Board ("FASB") issued FASB Interpretation No. 48, Accounting for Uncertainty in Income Taxes - an Interpretation of FASB Statement No. 109 ("FIN 48"). FIN 48 clarifies the accounting for uncertainty in income taxes recognized in accordance with FASB Statement No. 109, Accounting for Income Taxes. FIN 48 prescribes a recognition threshold and measurement attribute for a tax position taken or expected to be taken in the tax return that could impact the Fund's financial statements. It also provides guidance in relation to the Fund's financial statements on classification of tax benefits or liabilities, interest and penalties, accounting in interim periods, disclosure, and transition. FIN 48 is effective for fiscal years beginning after December 15, 2006 for registered investment companies. Management has evaluated the effects of applying the various provisions of FIN 48 and has deter mined that the adoption of FIN 48 does not have a material effect on the Fund's financial statements. The Fund's federal tax returns for the prior three fiscal years remain subject to examination by the Internal Revenue Service. Management will continue to monitor the rules and guidance pertaining to FIN 48 and will take action if appropriate.
In September 2006, the FASB issued Statement of Financial Accounting Standards No. 157 ("FAS 157"), "Fair Value Measurements." FAS 157 defines fair value, establishes a framework for measuring fair value in accordance with generally accepted accounting principles and expands disclosure about fair value measurements. FAS 157 is effective for fiscal years beginning after November 15, 2007. Management is currently evaluating the impact the adoption of FAS 157 will have on the Fund's financial statement disclosures.
28
GMO Global Growth Fund
(A Series of GMO Trust)
Notes to Financial Statements — (Continued)
February 29, 2008
3. Fees and other transactions with affiliates
GMO earns a management fee paid monthly at the annual rate of 0.47% of average daily net assets. The Fund has adopted a Shareholder Service Plan under which the Fund pays GMO a shareholder service fee for client and shareholder service, reporting, and other support. Pursuant to the Shareholder Service Plan, the shareholder service fee is calculated based on average daily net assets at the annual rate of 0.15% for Class III shares.
The Manager has contractually agreed to reimburse the Fund for Fund expenses through at least June 30, 2008 to the extent the Fund's total annual operating expenses (excluding shareholder service fees, fees and expenses of the independent Trustees of the Trust, fees and expenses for legal services not approved by the Manager for the Trust, compensation and expenses of the Trust's Chief Compliance Officer ("CCO") (excluding any employee benefits), brokerage commissions, securities lending fees and expenses, interest expense, transfer taxes, and other investment-related costs (including expenses associated with investments in any company that is an investment company or would be an investment company under the 1940 Act, but for the exceptions to the definition of investment company provided in Section 3(c)(1) and 3(c)(7) of the 1940 Act), hedging transaction fees, extraordinary, non-recurring and certain other unusual expenses (in cluding taxes)) exceed 0.47% of the Fund's average daily net assets.
The Fund's portion of the fees paid by the Trust to the independent Trustees and CCO during the year ended February 29, 2008 was $135 and $0, respectively. The compensation and expenses of the CCO are included in miscellaneous expenses in the Statement of Operations. No remuneration was paid by the Fund to any other officer of the Trust.
4. Purchases and sales of securities
Cost of purchases and proceeds from sales of securities, excluding short-term investments, for the year ended February 29, 2008 aggregated $33,470,839 and $66,153,492, respectively.
5. Guarantees
In the normal course of business the Fund enters into contracts with third-party service providers that contain a variety of representations and warranties and which provide general indemnifications. The Fund's maximum exposure under these arrangements is unknown, as this would involve future claims that may be made against the Fund that have not yet occurred. Based on experience, management is of the view that the risk of loss in connection with these potential indemnification obligations is remote; however, there can be no assurance that material liabilities related to such obligations will not arise in the future that could adversely impact the Fund.
29
GMO Global Growth Fund
(A Series of GMO Trust)
Notes to Financial Statements — (Continued)
February 29, 2008
6. Principal shareholders and related parties
As of February 29, 2008, 99.58% of the outstanding shares of the Fund were held by three shareholders, each holding in excess of 10% of the Fund's outstanding shares. No other shareholder owned in excess of 10% of the outstanding shares of the Fund. Investment activities of these shareholders may have a material effect on the Fund.
As of February 29, 2008, 0.03% of the Fund's shares were held by two related parties comprised of certain GMO employee accounts.
7. Share transactions
The Declaration of Trust permits the Trustees to issue an unlimited number of shares of beneficial interest (without par value). Transactions in Fund shares were as follows:
| Year Ended February 29, 2008 | Year Ended February 28, 2007 | ||||||||||||||||||
| Class III: | Shares | Amount | Shares | Amount | |||||||||||||||
| Shares sold | 920,964 | $ | 23,778,708 | 411,925 | $ | 10,092,340 | |||||||||||||
| Shares issued to shareholders in reinvestment of distributions | 102,111 | 2,562,902 | 367,063 | 8,657,259 | |||||||||||||||
| Shares repurchased | (2,430,110 | ) | (57,695,322 | ) | — | — | |||||||||||||
| Purchase premiums | — | 59,409 | — | 30,368 | |||||||||||||||
| Redemption fees | — | 7,684 | — | — | |||||||||||||||
| Net increase (decrease) | (1,407,035 | ) | $ | (31,286,619 | ) | 778,988 | $ | 18,779,967 | |||||||||||
30
Report of Independent Registered Public Accounting Firm
To the Trustees of GMO Trust and the Shareholders of
GMO Global Growth Fund
In our opinion, the accompanying statement of assets and liabilities, including the schedule of investments, and the related statements of operations and of changes in net assets and the financial highlights present fairly, in all material respects, the financial position of GMO Global Growth Fund (the "Fund") at February 29, 2008, the results of its operations for the year then ended, the changes in its net assets for each of the two years in the period then ended and the financial highlights for each of the periods indicated, in conformity with accounting principles generally accepted in the United States of America. These financial statements and financial highlights (hereafter referred to as "financial statements") are the responsibility of the Fund's management; our responsibility is to express an opinion on these financial statements based on our audits. We conducted our audits of these financial statements in accordance w ith the standards of the Public Company Accounting Oversight Board (United States). Those standards require that we plan and perform the audit to obtain reasonable assurance about whether the financial statements are free of material misstatement. An audit includes examining, on a test basis, evidence supporting the amounts and disclosures in the financial statements, assessing the accounting principles used and significant estimates made by management, and evaluating the overall financial statement presentation. We believe that our audits, which included confirmation of securities at February 29, 2008 by correspondence with the custodian and brokers, provide a reasonable basis for our opinion.
PricewaterhouseCoopers LLP
Boston, Massachusetts
April 29, 2008
31
GMO Global Growth Fund
(A Series of GMO Trust)
Fund Expenses
February 29, 2008 (Unaudited)
Expense Examples: The following information is in relation to expenses for the six month period ended February 29, 2008.
As a shareholder of the Fund, you may incur two types of costs: (1) transaction costs, including purchase premiums and redemption fees; and (2) ongoing costs, including management fees, shareholder service fees, and other Fund expenses. This example is intended to help you understand your ongoing costs (in dollars) of investing in the Fund and to compare these costs with the ongoing costs of investing in other mutual funds.
These examples are based on an investment of $1,000 invested at the beginning of the period and held for the entire period, September 1, 2007 through February 29, 2008.
Actual Expenses
The first line of the table below provides information about actual account values and actual expenses. You may use the information in this line, together with the amount you invested, to estimate the expenses that you paid over the period. Simply divide your account value by $1,000 (for example, a $10,000,000 account value divided by $1,000 = 10,000), then multiply the result by the number in the first line under the heading entitled "Net Expense Incurred" to estimate the expenses you paid on your account during this period.
Hypothetical Example for Comparison Purposes
The second line of the table below provides information about hypothetical account values and hypothetical expenses based on the Fund's actual expense ratio and an assumed rate of return of 5% per year before expenses, which is not the Fund's actual return. The hypothetical account values and expenses may not be used to estimate the actual ending account balance or expenses you paid for the period. You may use this information to compare the ongoing costs of investing in the Fund with other funds. To do so, compare this 5% hypothetical example with the 5% hypothetical examples that appear in the shareholder reports of other funds.
Please note that the expenses shown in the table are meant to highlight your ongoing costs only and do not reflect any transactional costs. Therefore, the second line of the table is useful in comparing ongoing costs only, and will not help you determine the relative total costs of owning different funds. In addition, if these transactional costs were included, your costs would have been higher.
| Annualized Net Expense Ratio | Beginning Account Value | Ending Account Value | Net Expense Incurred * | ||||||||||||||||
| Class III | |||||||||||||||||||
| 1) Actual | 0.62 | % | $ | 1,000.00 | $ | 954.60 | $ | 3.01 | |||||||||||
| 2) Hypothetical | 0.62 | % | $ | 1,000.00 | $ | 1,021.78 | $ | 3.12 | |||||||||||
* Expenses are calculated using the Class's annualized expense ratio for the six months ended February 29, 2008, multiplied by the average account value over the period, multiplied by 182 days in the period, divided by 366 days in the year.
32
GMO Global Growth Fund
(A Series of GMO Trust)
Tax Information for the Tax Year Ended February 29, 2008 (Unaudited)
The Fund will notify shareholders of amounts for use in preparing 2008 income tax forms in January 2009.
The Fund's distributions to shareholders include $1,882,330 from long-term capital gains.
For taxable, non-corporate shareholders, 52.89% of the income and short-term capital gains, if any, distributed in the Fund's fiscal year ended February 29, 2008 represents qualified dividend income subject to the 15% rate category.
For corporate shareholders, 17.26% of the income and short-term capital gains, if any, distributed in the Fund's fiscal year ended February 29, 2008 qualified for the dividends-received deduction.
The Fund hereby designates as qualified short-term capital gains with respect to its taxable year ended February 29, 2008, $53,168 or if determined to be different, the qualified short-term gains of such year.
33
GMO Global Growth Fund
(A Series of GMO Trust)
Note Concerning Distributions (Unaudited)
The Fund previously reported estimated sources of any dividends, short-term capital gains, and long-term capital gains distributions paid on a per share basis. Pursuant to Rule 19a-1(e) of the Investment Company Act, the following serves as a correction of such estimates. 6.75% of distributions to shareholders declared from net investment income during the Fund's fiscal year were reclassified to distributions from net realized gains and are reflected as such in the Statement of Changes in Net Assets.
34
Trustees and Officers (Unaudited)
The following tables list the Trust's Trustees and Officers as of the date of this report; their address and date of birth ("DOB"); their position with the Trust; the length of time holding that position with the Trust; their principal occupation(s) during the past five years; the number of portfolios in the fund complex they oversee; and other directorships they hold in companies subject to registration or reporting requirements of the Securities Exchange Act of 1934 (generally called "public companies") or in registered investment companies. The Trust's Statement of Additional Information ("SAI") includes additional information about the Trust's trustees, including changes subsequent to the date of the report. The SAI is available, without charge, upon request by writing GMO, c/o GMO Trust, 40 Rowes Wharf, Boston, MA 02110.
Independent Trustees:
| Name, Address, and DOB | Position(s) Held with Trust | Term of Office1 and Length of Time Served | Principal Occupation(s) During Past Five Years | Number of Portfolios in Fund Complex Overseen by Trustee | Other Directorships Held by Trustee | ||||||||||||||||||
| Donald W. Glazer, Esq. c/o GMO Trust 40 Rowes Wharf Boston, MA 02110 DOB: 07/26/1944 | Chairman of the Board of Trustees | Chairman of the Board of Trustees since March 2005; Lead Independent Trustee (September 2004 – March 2005); Trustee since December 2000. | Consultant – Law and Business2; Vice Chair (since 2002) and Secretary, Provant, Inc. (provider of personnel performance improvement services and training products); Author of Legal Treatises. | 47 | None. | ||||||||||||||||||
| Jay O. Light c/o GMO Trust 40 Rowes Wharf Boston, MA 02110 DOB: 10/03/1941 | Trustee | Since May 1996. | Dean (since April 2006), Acting Dean (August 2005 – April 2006), Senior Associate Dean (1998 – 2005), and Professor of Business Administration, Harvard Business School. | 47 | Director of Harvard Management Company, Inc.3 and Verde, Inc.; Director of Partners HealthCare System, Inc. and Chair of its Investment Committee.4 | ||||||||||||||||||
1 Each Trustee is elected to serve during the continued lifetime of the Trust until he/she dies, resigns or is removed, or if sooner, until the next meeting of Shareholders called for the purpose of electing Trustees and until the election and qualification of his/her successor.
2 As part of Mr. Glazer's work as a consultant, he provides part-time consulting services to Goodwin Procter LLP ("Goodwin"). Goodwin has provided legal services to Renewable Resources, LLC, an affiliate of GMO; GMO, in connection with its relationship with Renewable Resources; and funds managed by Renewable Resources. Mr. Glazer has represented that he has no financial interest in, and is not involved in the provision of, such legal services. In the calendar years ended December 31, 2006 and December 31, 2007, these entities paid $825,738 and $291,721 respectively, in legal fees and disbursements to Goodwin.
3 Harvard Management Company, Inc. is a client of the Manager.
4 Partners HealthCare System, Inc. is a client of the Manager.
35
Independent Trustees — (Continued)
| Name, Address, and DOB | Position(s) Held with Trust | Term of Office1 and Length of Time Served | Principal Occupation(s) During Past Five Years | Number of Portfolios in Fund Complex Overseen by Trustee | Other Directorships Held by Trustee | ||||||||||||||||||
| W. Nicholas Thorndike c/o GMO Trust 40 Rowes Wharf Boston, MA 02110 DOB: 03/28/1933 | Trustee | Since March 2005. | Director or trustee of various corporations and charitable organizations, including Courier Corporation (a book publisher and manufacturer) (July 1989 – present); Putnam Funds (December 1992 – June 2004); and Providence Journal (a newspaper publisher) (December 1986 – December 2003). | 47 | Director of Courier Corporation (a book publisher and manufacturer); Member of the Investment Committee of Partners HealthCare System, Inc.4 | ||||||||||||||||||
1 Each Trustee is elected to serve during the continued lifetime of the Trust until he/she dies, resigns or is removed, or if sooner, until the next meeting of Shareholders called for the purpose of electing Trustees and until the election and qualification of his/her successor.
4 Partners HealthCare System, Inc. is a client of the Manager.
36
Principal Officers:
| Name, Address, and DOB | Position(s) Held with Trust | Term of Office5 and Length of Time Served | Principal Occupation(s) During Past Five Years | ||||||||||||
| Scott Eston c/o GMO Trust 40 Rowes Wharf Boston, MA 02110 DOB: 01/20/1956 | President and Chief Executive Officer | President and Chief Executive Officer since October 2002; Chief Financial Officer, November 2006 – February 2007. | Chief Financial Officer, Chief Operating Officer and Member, Grantham, Mayo, Van Otterloo & Co. LLC. | ||||||||||||
| Sheppard N. Burnett c/o GMO Trust 40 Rowes Wharf Boston, MA 02110 DOB: 10/24/1968 | Treasurer and Chief Financial Officer | Chief Financial Officer since March 2007; Treasurer since November 2006; Assistant Treasurer, September 2004 – November 2006. | Fund Administration Staff, Grantham, Mayo, Van Otterloo & Co. LLC (June 2004 – present); Vice President, Director of Tax, Columbia Management Group (2002 – 2004). | ||||||||||||
| Brent C. Arvidson c/o GMO Trust 40 Rowes Wharf Boston, MA 02110 DOB: 06/26/1969 | Assistant Treasurer | Since August 1998. | Senior Fund Administrator, Grantham, Mayo, Van Otterloo & Co. LLC. | ||||||||||||
| John L. Nasrah c/o GMO Trust 40 Rowes Wharf Boston, MA 02110 DOB: 05/27/1977 | Assistant Treasurer | Since March 2007. | Fund Administrator, Grantham, Mayo, Van Otterloo & Co. LLC (September 2004 – present); Tax Analyst, Bain & Company, Inc (June 2003 – September 2004); Senior Tax Associate, PricewaterhouseCoopers LLP (2001 – 2003). | ||||||||||||
| Mahmoodur Rahman c/o GMO Trust 40 Rowes Wharf Boston, MA 02110 DOB: 11/30/1967 | Assistant Treasurer | Since September 2007. | Fund Administrator, Grantham, Mayo, Van Otterloo & Co. (April 2007 – present); Vice President and Senior Tax Manager, Massachusetts Financial Services Company (January 2000 – April 2007). | ||||||||||||
| Michael E. Gillespie c/o GMO Trust 40 Rowes Wharf Boston, MA 02110 DOB: 02/18/1958 | Chief Compliance Officer | Since March 2005. | Vice President of Compliance (June 2004 – February 2005) and Director of Domestic Compliance (March 2002 – June 2004), Fidelity Investments; Vice President and Senior Counsel, State Street Bank and Trust Company (May 1998 – March 2002). | ||||||||||||
5 Officers are elected to hold such office until their successor is elected and qualified to carry out the duties and responsibilities of their office, or until he or she resigns or is removed from office.
37
Principal Officers — (Continued)
| Name, Address, and DOB | Position(s) Held with Trust | Term of Office5 and Length of Time Served | Principal Occupation(s) During Past Five Years | ||||||||||||
| Jason B. Harrison c/o GMO Trust 40 Rowes Wharf Boston, MA 02110 DOB: 01/29/1977 | Vice President and Clerk | Vice President since November 2006; Clerk since March 2006. | Legal Counsel, Grantham, Mayo, Van Otterloo & Co. LLC (since February 2006) and Attorney, Ropes & Gray LLP (September 2002 – February 2006). | ||||||||||||
| David L. Bohan c/o GMO Trust 40 Rowes Wharf Boston, MA 02110 DOB: 06/21/1964 | Vice President and Assistant Clerk | Vice President since March 2005; Assistant Clerk since March 2006. | Legal Counsel, Grantham, Mayo, Van Otterloo & Co. LLC (September 2003 – present); Attorney, Goodwin Procter LLP (September 1996 – September 2003). | ||||||||||||
| Gregory L. Pottle c/o GMO Trust 40 Rowes Wharf Boston, MA 02110 DOB: 07/09/1971 | Vice President and Assistant Clerk | Since November 2006. | Legal Counsel, Grantham, Mayo, Van Otterloo & Co. LLC. | ||||||||||||
| Anne K. Trinque c/o GMO Trust 40 Rowes Wharf Boston, MA 02110 DOB: 04/15/1978 | Vice President and Assistant Clerk | Since September 2007. | Legal Counsel, Grantham, Mayo, Van Otterloo & Co. LLC (since January 2007); Attorney, Goodwin Procter LLP (September 2003 – January 2007). | ||||||||||||
| Cheryl Wakeham c/o GMO Trust 40 Rowes Wharf Boston, MA 02110 DOB: 10/29/1958 | Anti-Money Laundering Officer | Since December 2004. | Manager, Client Service Administration, Grantham, Mayo, Van Otterloo & Co. LLC. | ||||||||||||
5 Officers are elected to hold such office until their successor is elected and qualified to carry out the duties and responsibilities of their office, or until he or she resigns or is removed from office.
38
GMO Foreign Small Companies Fund
(A Series of GMO Trust)
Annual Report
February 29, 2008
For a free copy of the Fund's proxy voting guidelines, shareholders may call 1-617-346-7646 (collect), visit our website at www.gmo.com, or visit the Securities and Exchange Commission's website at www.sec.gov. Information regarding how the Fund voted proxies relating to portfolio securities during the most recent 12-month period ended June 30 is available on our website at www.gmo.com, or on the Securities and Exchange Commission's website at www.sec.gov.
The Fund files its complete schedule of portfolio holdings with the Securities and Exchange Commission for the first and third quarter of each fiscal year on Form N-Q, which is available on the Commission's website at www.sec.gov. The Fund's Form N-Q may be reviewed and copied at the Commission's Public Reference Room in Washington, D.C. Information on the operation of the Public Reference Room may be obtained by calling 1-800-SEC-0330. The Fund has a policy with respect to disclosure of portfolio holdings under which it may also make available on GMO's website (www.gmo.com) a complete schedule of portfolio holdings.
This report is prepared for the general information of shareholders. It is authorized for distribution to prospective investors only when preceded or accompanied by a prospectus for the GMO Trust.
GMO Foreign Small Companies Fund
(A Series of GMO Trust)
Portfolio Managers
Day-to-day management of the Fund's portfolio is the responsibility of the International Active Division at Grantham, Mayo, Van Otterloo & Co. LLC.
Management Discussion and Analysis of Fund Performance
The Class III shares of the GMO Foreign Small Companies Fund returned -2.0% for the fiscal year ended February 29, 2008, as compared to -1.9% for the S&P/Citigroup EMI World ex-U.S. Index. The Fund was invested substantially in equity securities of small companies in countries outside of the U.S. throughout the period.
Fair value pricing of the Fund subtracted 0.7% from returns versus the benchmark, which utilizes local close prices. Using the local close, which we do for attribution, the Fund returned -1.2% for the fiscal year.
Stock selection added 1.1% to returns for the fiscal year. Stock selection outperformed in the United Kingdom, Japan, Spain, and the emerging markets. Stock selection underperformed in Germany and Canada.
Country selection subtracted 0.4% from performance for the fiscal year. The largest negative impact came from an underweight position in Canada, which subtracted 0.5% from returns.
The views expressed herein are exclusively those of Grantham, Mayo, Van Otterloo & Co. LLC Management as of the date of this report and are subject to change. GMO disclaims any responsibility to update such views. They are not meant as investment advice.
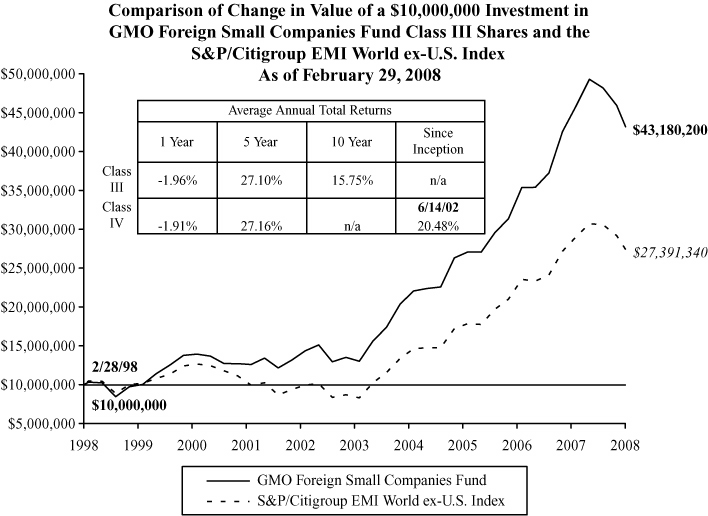
Performance data quoted represents past performance and is not indicative of future results. The investment return and principal value of an investment will fluctuate so that an investor's shares, when redeemed, may be worth more or less than their original cost. Current performance data may be lower or higher than the performance data provided herein. To obtain performance information to the most recent month-end, visit www.gmo.com. Performance shown is net of all fees after reimbursement from the Manager. Returns would have been lower had certain expenses not been reimbursed during the periods shown and do not include the effect of taxes on distributions and redemptions. The Fund commenced operations on June 30, 2000 subsequent to a transaction involving, in essence, the reorganization of the GMO Small Cap Active Pool of the Common Fund for Non-Profit Organizati ons (the "GMO Pool") as the GMO Foreign Small Companies Fund. All information relating to the time periods prior to June 30, 2000 relates to the GMO Pool. All information is unaudited. Performance for Class IV shares will vary due to different fees.
GMO Foreign Small Companies Fund
(A Series of GMO Trust)
Investments Concentration Summary
February 29, 2008 (Unaudited)
| Asset Class Summary | % of Total Net Assets | ||||||
| Common Stocks | 93.2 | % | |||||
| Short-Term Investments | 7.5 | ||||||
| Preferred Stocks | 1.3 | ||||||
| Other | (2.0 | ) | |||||
| 100.0 | % | ||||||
| Country Summary | % of Equity Investments | ||||||
| United Kingdom | 19.7 | % | |||||
| Japan | 11.3 | ||||||
| Germany | 11.1 | ||||||
| Canada | 6.1 | ||||||
| Finland | 6.0 | ||||||
| Italy | 6.0 | ||||||
| Switzerland | 5.9 | ||||||
| France | 5.4 | ||||||
| South Korea | 4.1 | ||||||
| Brazil | 2.8 | ||||||
| Hong Kong | 2.7 | ||||||
| Netherlands | 2.5 | ||||||
| Spain | 2.3 | ||||||
| Taiwan | 2.3 | ||||||
| Norway | 2.2 | ||||||
| Australia | 1.4 | ||||||
| Singapore | 1.4 | ||||||
| Ireland | 1.0 | ||||||
| Mexico | 0.8 | ||||||
| Sweden | 0.8 | ||||||
| Austria | 0.8 | ||||||
| Belgium | 0.7 | ||||||
| Philippines | 0.7 | ||||||
| China | 0.6 | ||||||
| Malaysia | 0.4 | ||||||
| Greece | 0.3 | ||||||
| India | 0.2 | ||||||
| Thailand | 0.2 | ||||||
| Egypt | 0.2 | ||||||
| New Zealand | 0.1 | ||||||
| 100.0 | % | ||||||
1
GMO Foreign Small Companies Fund
(A Series of GMO Trust)
Investments Concentration Summary — (Continued)
February 29, 2008 (Unaudited)
| Industry Sector Summary | % of Equity Investments | ||||||
| Consumer Discretionary | 21.0 | % | |||||
| Industrials | 20.4 | ||||||
| Financials | 19.8 | ||||||
| Information Technology | 8.6 | ||||||
| Consumer Staples | 7.7 | ||||||
| Materials | 7.1 | ||||||
| Energy | 6.9 | ||||||
| Utilities | 3.6 | ||||||
| Health Care | 3.5 | ||||||
| Telecommunication Services | 1.4 | ||||||
| 100.0 | % | ||||||
2
GMO Foreign Small Companies Fund
(A Series of GMO Trust)
Schedule of Investments
(showing percentage of total net assets)
February 29, 2008
| Shares | Description | Value ($) | |||||||||||||
| COMMON STOCKS — 93.2% | |||||||||||||||
| Australia — 1.4% | |||||||||||||||
| 658,714 | Australian Vintage Ltd * | 884,970 | |||||||||||||
| 283,000 | Billabong International Ltd | 3,286,237 | |||||||||||||
| 421,897 | Consolidated Rutile Ltd | 208,182 | |||||||||||||
| 500,000 | Macquarie Communications Group (a) | 2,144,661 | |||||||||||||
| 525,000 | Metcash Ltd | 2,020,714 | |||||||||||||
| 438,800 | PMP Ltd | 662,402 | |||||||||||||
| 239,716 | Santos Ltd | 2,841,431 | |||||||||||||
| 1,500,000 | SP AusNet | 1,726,675 | |||||||||||||
| Total Australia | 13,775,272 | ||||||||||||||
| Austria — 0.7% | |||||||||||||||
| 11,900 | Agrana Beteiligungs AG | 1,302,671 | |||||||||||||
| 15,400 | EVN AG | 2,003,771 | |||||||||||||
| 20,677 | Flughafen Wien AG | 2,364,304 | |||||||||||||
| 35,000 | Wienerberger AG | 1,689,302 | |||||||||||||
| Total Austria | 7,360,048 | ||||||||||||||
| Belgium — 0.6% | |||||||||||||||
| 102,000 | AGFA-Gevaert NV (a) | 984,018 | |||||||||||||
| 25,278 | Bekaert NV | 3,329,181 | |||||||||||||
| 64,200 | Fortis VVPR Strip * | 975 | |||||||||||||
| 26,964 | Omega Pharma SA | 1,279,776 | |||||||||||||
| 5,006 | Unibra SA | 758,613 | |||||||||||||
| Total Belgium | 6,352,563 | ||||||||||||||
| Brazil — 2.7% | |||||||||||||||
| 103,100 | Banco Sofisa SA | 688,918 | |||||||||||||
| 630,000 | Cia Hering | 3,539,117 | |||||||||||||
| 450,000 | Helbor Empreendimentos SA | 2,980,309 | |||||||||||||
| 758,500 | Industrias Romi SA | 7,580,066 | |||||||||||||
| 586,000 | JHSF Participacoes SA * | 2,262,776 | |||||||||||||
| 12,000 | MPX Mineracao e Energia SA * | 7,223,701 | |||||||||||||
| 75,000 | Porto Seguro SA | 2,825,084 | |||||||||||||
| Total Brazil | 27,099,971 | ||||||||||||||
See accompanying notes to the financial statements.
3
GMO Foreign Small Companies Fund
(A Series of GMO Trust)
Schedule of Investments — (Continued)
(showing percentage of total net assets)
February 29, 2008
| Shares | Description | Value ($) | |||||||||||||
| Canada — 5.8% | |||||||||||||||
| 330,300 | Air Canada Class A * (a) | 3,080,675 | |||||||||||||
| 1,152,300 | Breakwater Resources Ltd * | 1,639,035 | |||||||||||||
| 299,300 | CHC Helicopter Corp Class A | 9,381,158 | |||||||||||||
| 272,800 | Flint Energy Services Ltd * | 5,485,102 | |||||||||||||
| 412,100 | Gammon Gold Inc * | 3,571,464 | |||||||||||||
| 138,900 | ING Canada Inc | 5,644,907 | |||||||||||||
| 90,600 | KAP Resources Ltd * (b) (c) | 921 | |||||||||||||
| 291,800 | Kingsway Financial Services Inc | 3,868,926 | |||||||||||||
| 333,500 | Linamar Corp | 4,743,714 | |||||||||||||
| 225,000 | Penn West Energy Trust | 6,350,521 | |||||||||||||
| 316,900 | Precision Drilling Trust | 7,035,067 | |||||||||||||
| 316,200 | RONA Inc * | 4,468,724 | |||||||||||||
| 949,300 | Western Canadian Coal Corp * (a) | 2,594,480 | |||||||||||||
| Total Canada | 57,864,694 | ||||||||||||||
| China — 0.6% | |||||||||||||||
| 5,000,000 | Franshion Properties China Ltd * | 1,966,766 | |||||||||||||
| 6,900,000 | Uni-President China Holding Ltd * | 3,830,722 | |||||||||||||
| Total China | 5,797,488 | ||||||||||||||
| Egypt — 0.1% | |||||||||||||||
| 31,578 | Lecico Egypt SAE GDR | 347,358 | |||||||||||||
| 100,000 | Lecico Egypt SAE GDR 144A | 1,100,000 | |||||||||||||
| Total Egypt | 1,447,358 | ||||||||||||||
| Finland — 5.6% | |||||||||||||||
| 112,500 | Atria Group Plc | 2,638,649 | |||||||||||||
| 243,000 | Hk-Ruokatalo Oyj Class A | 3,067,121 | |||||||||||||
| 127,133 | KCI Konecranes Oyj | 4,615,916 | |||||||||||||
| 356,768 | Marimekko Oyj | 7,695,170 | |||||||||||||
| 411,979 | Nokian Renkaat Oyj | 16,937,763 | |||||||||||||
| 224,200 | Poyry Oyj | 5,504,860 | |||||||||||||
| 146,170 | Ramirent Oyj | 2,530,683 | |||||||||||||
| 220,000 | Tietoenator Oyj (a) | 4,129,690 | |||||||||||||
See accompanying notes to the financial statements.
4
GMO Foreign Small Companies Fund
(A Series of GMO Trust)
Schedule of Investments — (Continued)
(showing percentage of total net assets)
February 29, 2008
| Shares | Description | Value ($) | |||||||||||||
| Finland — continued | |||||||||||||||
| 207,800 | Uponor Oyj (a) | 5,427,594 | |||||||||||||
| 170,050 | YIT Oyj (a) | 4,224,553 | |||||||||||||
| Total Finland | 56,771,999 | ||||||||||||||
| France — 5.0% | |||||||||||||||
| 3,700 | Casino Guichard-Perrachon SA | 418,497 | |||||||||||||
| 23,271 | Christian Dalloz | 2,236,883 | |||||||||||||
| 51,420 | Clarins (a) | 3,609,177 | |||||||||||||
| 6,450 | Damartex SA | 179,916 | |||||||||||||
| 77,200 | Essilor International SA | 4,583,961 | |||||||||||||
| 43,962 | Eurazeo | 5,302,752 | |||||||||||||
| 142,100 | Fimatex * (a) | 1,524,169 | |||||||||||||
| 6,300 | Gaumont SA (a) | 562,071 | |||||||||||||
| 48,200 | GFI Industries SA (a) | 4,428,665 | |||||||||||||
| 9,000 | Guyenne et Gascogne SA | 1,316,518 | |||||||||||||
| 53,100 | Klepierre | 3,100,962 | |||||||||||||
| 75,000 | M6-Metropole Television | 1,768,015 | |||||||||||||
| 94,070 | Natixis | 1,376,740 | |||||||||||||
| 34,800 | Peugeot SA | 2,645,469 | |||||||||||||
| 45,000 | Publicis Groupe | 1,625,078 | |||||||||||||
| 1,351 | SAGA | 119,780 | |||||||||||||
| 20,350 | Seb SA | 3,528,345 | |||||||||||||
| 12,881 | Sequana Capital | 317,447 | |||||||||||||
| 7,250 | Somfy SA | 1,640,883 | |||||||||||||
| 21,000 | Thales SA | 1,285,011 | |||||||||||||
| 45,472 | Virbac SA | 4,230,134 | |||||||||||||
| 87,141 | Zodiac SA | 4,534,399 | |||||||||||||
| Total France | 50,334,872 | ||||||||||||||
| Germany — 9.7% | |||||||||||||||
| 86,080 | Aareal Bank AG | 2,927,664 | |||||||||||||
| 74,864 | Adidas AG | 4,751,690 | |||||||||||||
| 15,200 | Axel Springer AG | 1,890,722 | |||||||||||||
| 55,800 | Beiersdorf AG (Bearer) | 4,417,508 | |||||||||||||
See accompanying notes to the financial statements.
5
GMO Foreign Small Companies Fund
(A Series of GMO Trust)
Schedule of Investments — (Continued)
(showing percentage of total net assets)
February 29, 2008
| Shares | Description | Value ($) | |||||||||||||
| Germany — continued | |||||||||||||||
| 140,655 | Cat Oil AG * (a) | 3,022,764 | |||||||||||||
| 29,100 | Celesio AG | 1,668,168 | |||||||||||||
| 81,700 | Commerzbank AG | 2,456,247 | |||||||||||||
| 30,900 | Continental AG | 3,047,117 | |||||||||||||
| 98,000 | DIC Asset AG | 3,015,581 | |||||||||||||
| 61,100 | Douglas Holdings AG | 3,242,408 | |||||||||||||
| 162,216 | Eurocastle Investment (a) | 4,170,478 | |||||||||||||
| 200,000 | Francotyp-Postalia Holdings AG * (a) | 1,404,532 | |||||||||||||
| 68,000 | Fresenius Medical Care AG & Co | 3,560,217 | |||||||||||||
| 127,500 | Gagfah SA (a) | 2,140,800 | |||||||||||||
| 80,000 | Gerresheimer AG * | 3,938,858 | |||||||||||||
| 114,367 | Grenkeleasing AG | 4,151,977 | |||||||||||||
| 60,000 | Hannover Rueckversicherungs AG (Registered) (a) | 2,864,366 | |||||||||||||
| 87,220 | Heidelberger Druckmaschinen | 2,130,142 | |||||||||||||
| 29,057 | Hypo Real Estate Holding AG (a) | 836,738 | |||||||||||||
| 615,000 | Infineon Technologies AG * | 4,973,712 | |||||||||||||
| 95,000 | IVG Immobilien AG | 3,331,075 | |||||||||||||
| 40,090 | Leonische Drahtwerke AG | 1,668,933 | |||||||||||||
| 34,700 | Metro AG | 2,877,929 | |||||||||||||
| 47,080 | MTU Aero Engines Holding | 2,389,757 | |||||||||||||
| 65,146 | Nemetschek AG | 1,952,027 | |||||||||||||
| 368,600 | Patrizia Immobilien AG (a) | 2,321,460 | |||||||||||||
| 297,184 | Praktiker Bau-Und Heim | 7,345,136 | |||||||||||||
| 5,588 | Puma AG Rudolf Dassler Sport | 1,988,227 | |||||||||||||
| 375,000 | Symrise AG * | 10,223,203 | |||||||||||||
| 41,800 | Tognum AG * | 1,019,057 | |||||||||||||
| 100,000 | Wacker Construction Equipment AG * | 2,046,011 | |||||||||||||
| Total Germany | 97,774,504 | ||||||||||||||
| Greece — 0.2% | |||||||||||||||
| 29,718 | Folli-Follie Abee | 946,731 | |||||||||||||
| 50,000 | Piraeus Bank SA | 1,488,227 | |||||||||||||
| Total Greece | 2,434,958 | ||||||||||||||
See accompanying notes to the financial statements.
6
GMO Foreign Small Companies Fund
(A Series of GMO Trust)
Schedule of Investments — (Continued)
(showing percentage of total net assets)
February 29, 2008
| Shares | Description | Value ($) | |||||||||||||
| Hong Kong — 2.6% | |||||||||||||||
| 3,953,579 | Hong Kong & Shanghai Hotels | 6,367,603 | |||||||||||||
| 2,607,702 | Industrial & Commercial Bank of China | 5,659,645 | |||||||||||||
| 9,972,000 | TPV Technology Ltd | 5,976,305 | |||||||||||||
| 624,900 | Wing Lung Bank | 7,710,307 | |||||||||||||
| Total Hong Kong | 25,713,860 | ||||||||||||||
| India — 0.2% | |||||||||||||||
| 200,000 | Welspun Gujarat Stahl Ltd | 2,162,024 | |||||||||||||
| Ireland — 0.9% | |||||||||||||||
| 66,346 | Anglo Irish Bank Corp | 939,636 | |||||||||||||
| 507,600 | Blackrock International * | 253,069 | |||||||||||||
| 67,019 | CRH Plc | 2,490,796 | |||||||||||||
| 41,500 | DCC Plc | 1,044,152 | |||||||||||||
| 55,000 | FBD Holdings Plc | 2,418,218 | |||||||||||||
| 46,000 | Grafton Group Plc * | 373,295 | |||||||||||||
| 379,440 | IFG Group Plc | 999,326 | |||||||||||||
| 9,500 | Irish Life & Permanent Plc | 154,528 | |||||||||||||
| 25,000 | Kerry Group Plc | 784,424 | |||||||||||||
| Total Ireland | 9,457,444 | ||||||||||||||
| Italy — 5.6% | |||||||||||||||
| 355,000 | Arnoldo Mondadori Editore SPA (a) | 2,869,873 | |||||||||||||
| 107,000 | Banco Popolare Scarl * | 2,023,264 | |||||||||||||
| 157,000 | Brembo SPA | 2,360,971 | |||||||||||||
| 179,200 | Buzzi Unicem SPA | 4,396,450 | |||||||||||||
| 436,100 | Campari | 3,744,972 | |||||||||||||
| 232,700 | Finmeccanica SPA | 7,156,332 | |||||||||||||
| 307,716 | Grouppo Editoriale L'Espresso (a) | 1,265,020 | |||||||||||||
| 1,228,700 | IFIL SPA | 9,526,347 | |||||||||||||
| 300,300 | Indesit Company SPA | 3,746,772 | |||||||||||||
| 621,425 | Intesa San Paolo | 4,173,768 | |||||||||||||
| 100,000 | Italcementi SPA | 2,034,184 | |||||||||||||
| 600,000 | Snam Rete Gas SPA | 4,172,332 | |||||||||||||
| 2,359,364 | Telecom Italia SPA-Di RISP | 4,552,197 | |||||||||||||
| 187,500 | Unione di Banche Italiane ScpA | 4,408,309 | |||||||||||||
| Total Italy | 56,430,791 | ||||||||||||||
See accompanying notes to the financial statements.
7
GMO Foreign Small Companies Fund
(A Series of GMO Trust)
Schedule of Investments — (Continued)
(showing percentage of total net assets)
February 29, 2008
| Shares | Description | Value ($) | |||||||||||||
| Japan — 10.7% | |||||||||||||||
| 500,000 | Asics Corp | 5,827,381 | |||||||||||||
| 600,000 | Capcom (a) | 16,455,128 | |||||||||||||
| 140,800 | Daiei Inc * | 894,761 | |||||||||||||
| 120,000 | Diamond Lease Co Ltd | 4,315,723 | |||||||||||||
| 275,000 | Hisamitsu Pharmaceutical Co Inc | 8,769,340 | |||||||||||||
| 450,000 | Hitachi Chemical Co Ltd | 8,575,064 | |||||||||||||
| 300,000 | Hitachi Koki Co Ltd | 4,191,066 | |||||||||||||
| 3,700 | Hitachi Transport System Ltd | 45,277 | |||||||||||||
| 300,000 | Izumi Co Ltd (a) | 4,302,397 | |||||||||||||
| 600 | Japan Retail Fund Investment Corp | 3,614,002 | |||||||||||||
| 160,000 | Keihin Corp | 2,581,818 | |||||||||||||
| 600,000 | Keiyo Bank Ltd (The) | 3,374,181 | |||||||||||||
| 90,000 | Micronics Japan Co Ltd | 2,898,699 | |||||||||||||
| 600,000 | Nabtesco Corp | 7,958,768 | |||||||||||||
| 650,000 | NHK Spring Co Ltd | 5,052,979 | |||||||||||||
| 260,000 | Nippon System Development Co Ltd | 3,652,550 | |||||||||||||
| 450,000 | Sanwa Shutter Corp | 2,184,383 | |||||||||||||
| 35 | Seven Bank Ltd * | 58,620 | |||||||||||||
| 675,000 | Shimadzu Corp | 6,330,121 | |||||||||||||
| 130,000 | Sumitomo Rubber Industries | 1,001,802 | |||||||||||||
| 20,100 | Tachihi Enterprise Co Ltd | 1,292,199 | |||||||||||||
| 200,000 | Taiyo Ink Manufacturing Co Ltd | 4,824,473 | |||||||||||||
| 491,000 | Tokyu Land Corp | 3,309,375 | |||||||||||||
| 325,000 | Toyo Suisan Kaisha Ltd | 5,297,368 | |||||||||||||
| 1,254 | USJ Co Ltd (a) | 818,671 | |||||||||||||
| Total Japan | 107,626,146 | ||||||||||||||
| Malaysia — 0.4% | |||||||||||||||
| 3,000,000 | E&O Property Development * | 2,133,855 | |||||||||||||
| 480,900 | Eastern & Oriental Berhad | 340,717 | |||||||||||||
| 700,000 | IJM Corp Berhad | 1,571,730 | |||||||||||||
| Total Malaysia | 4,046,302 | ||||||||||||||
See accompanying notes to the financial statements.
8
GMO Foreign Small Companies Fund
(A Series of GMO Trust)
Schedule of Investments — (Continued)
(showing percentage of total net assets)
February 29, 2008
| Shares | Description | Value ($) | |||||||||||||
| Mexico — 0.8% | |||||||||||||||
| 1,000,000 | Controladora Comercial Mexicana SA de CV | 2,567,694 | |||||||||||||
| 1,096,400 | Megacable Holdings SAB de CV * | 3,086,504 | |||||||||||||
| 1,700,000 | Sare Holding SA de CV * | 2,412,698 | |||||||||||||
| Total Mexico | 8,066,896 | ||||||||||||||
| Netherlands — 2.4% | |||||||||||||||
| 288,097 | Corporate Express (a) | 3,411,652 | |||||||||||||
| 173,345 | CSM (a) | 5,345,855 | |||||||||||||
| 43,200 | Fortis NV | 952,353 | |||||||||||||
| 131,100 | Imtech NV | 3,100,202 | |||||||||||||
| 15,000 | Koninklijke Ten Cate NV | 506,801 | |||||||||||||
| 170,000 | Koninklijke Wessanen NV | 2,274,895 | |||||||||||||
| 286,136 | Reed Elsevier NV | 5,315,851 | |||||||||||||
| 124,000 | Vedior NV | 3,105,871 | |||||||||||||
| Total Netherlands | 24,013,480 | ||||||||||||||
| New Zealand — 0.1% | |||||||||||||||
| 485,400 | Air New Zealand | 644,249 | |||||||||||||
| Norway — 2.1% | |||||||||||||||
| 1,442,334 | Ability Drilling ASA * | 3,682,771 | |||||||||||||
| 174,890 | Ekornes ASA (a) | 3,152,703 | |||||||||||||
| 810,285 | Prosafe ASA | 13,879,068 | |||||||||||||
| Total Norway | 20,714,542 | ||||||||||||||
| Philippines — 0.6% | |||||||||||||||
| 17,000,000 | Aboitiz Power Corp | 1,986,771 | |||||||||||||
| 5,100,000 | Alliance Global Group Inc * | 539,769 | |||||||||||||
| 37,838,000 | Filinvest Land Inc * | 967,059 | |||||||||||||
| 1,147,500 | First Gen Corp | 1,133,106 | |||||||||||||
| 23,400,000 | Pepsi-Cola Products Philippines Inc * | 1,705,919 | |||||||||||||
| Total Philippines | 6,332,624 | ||||||||||||||
See accompanying notes to the financial statements.
9
GMO Foreign Small Companies Fund
(A Series of GMO Trust)
Schedule of Investments — (Continued)
(showing percentage of total net assets)
February 29, 2008
| Shares | Description | Value ($) | |||||||||||||
| Singapore — 1.3% | |||||||||||||||
| 17,296,000 | Anwell Technologies Ltd * | 843,163 | |||||||||||||
| 375,000 | ARA Asset Management Ltd 144A * | 216,413 | |||||||||||||
| 575,000 | Banyan Tree Holdings Inc | 526,936 | |||||||||||||
| 2,800,000 | Chemoil Energy Ltd | 1,061,200 | |||||||||||||
| 2,307,000 | Financial One Corp * | 1,040,623 | |||||||||||||
| 3,250,000 | First Ship Lease Trust | 2,586,207 | |||||||||||||
| 4,083,000 | Huan Hsin Holdings Ltd | 1,599,070 | |||||||||||||
| 2,962,000 | LMA International NV * | 535,534 | |||||||||||||
| 1,097,000 | People's Food Holdings Ltd | 838,105 | |||||||||||||
| 2,000,000 | Petra Foods Ltd | 1,762,277 | |||||||||||||
| 350,000 | SembCorp Marine Ltd | 896,365 | |||||||||||||
| 1,585,937 | Unisteel Technology Ltd | 1,578,206 | |||||||||||||
| Total Singapore | 13,484,099 | ||||||||||||||
| South Korea — 3.5% | |||||||||||||||
| 38,980 | Asia Cement Co Ltd | 2,532,255 | |||||||||||||
| 20,000 | Cheil Industries Inc | 897,112 | |||||||||||||
| 42,040 | Hana Financial Group Inc | 1,865,441 | |||||||||||||
| 298,849 | Handsome Corp | 3,436,602 | |||||||||||||
| 79,440 | Handsome P&D Corp * | 1,124,333 | |||||||||||||
| 10,000 | Hite Brewery Co Ltd | 1,242,792 | |||||||||||||
| 10,000 | KCC Engineering & Construction Co | 584,529 | |||||||||||||
| 144,000 | Kooksoondang Co Ltd | 802,413 | |||||||||||||
| 81,100 | Korea Electric Terminal Co | 1,809,974 | |||||||||||||
| 320,963 | Kortek Corp | 2,550,455 | |||||||||||||
| 76,110 | Kumho Tire Co Inc | 895,080 | |||||||||||||
| 22,000 | Nong Shim Co Ltd | 4,473,065 | |||||||||||||
| 61,000 | Pulmuone Co Ltd | 2,972,667 | |||||||||||||
| 134,800 | Pusan Bank | 1,783,819 | |||||||||||||
| 78,000 | Samsung Card Co Ltd | 4,138,488 | |||||||||||||
| 60,000 | Samsung Techwin Co Ltd | 3,063,717 | |||||||||||||
| 25,000 | Samwhan Corp | 568,032 | |||||||||||||
| Total South Korea | 34,740,774 | ||||||||||||||
See accompanying notes to the financial statements.
10
GMO Foreign Small Companies Fund
(A Series of GMO Trust)
Schedule of Investments — (Continued)
(showing percentage of total net assets)
February 29, 2008
| Shares | Description | Value ($) | |||||||||||||
| Spain — 2.2% | |||||||||||||||
| 32,000 | ACS Actividades de Construccion y Servicios SA | 1,634,365 | |||||||||||||
| 38,296 | Cia de Distribucion Integral Logista SA | 3,051,348 | |||||||||||||
| 65,000 | Corp Dermoestetica * | 612,939 | |||||||||||||
| 30,000 | Fomento de Construcciones y Contratas SA | 1,808,918 | |||||||||||||
| 15,597 | Gas Natural SDG SA | 945,079 | |||||||||||||
| 35,000 | Generale de Alquiler * | 1,049,655 | |||||||||||||
| 15,000 | Grupo Ferrovial SA | 981,639 | |||||||||||||
| 209,000 | Mapfre SA | 942,361 | |||||||||||||
| 30,000 | Red Electrica de Espana | 1,871,688 | |||||||||||||
| 45,000 | Sogecable SA * | 1,887,954 | |||||||||||||
| 65,000 | Tecnicas Reunidas SA | 4,404,225 | |||||||||||||
| 43,864 | Union Fenosa SA | 2,890,165 | |||||||||||||
| Total Spain | 22,080,336 | ||||||||||||||
| Sweden — 0.8% | |||||||||||||||
| 68,750 | Autoliv Inc SDR | 3,431,586 | |||||||||||||
| 183,100 | SAAB AB Class B | 4,481,358 | |||||||||||||
| Total Sweden | 7,912,944 | ||||||||||||||
| Switzerland — 5.5% | |||||||||||||||
| 2,131 | Bank Sarasin & Cie AG Class B (Registered) | 9,556,865 | |||||||||||||
| 14,450 | Bobst Group AG (Registered) | 1,032,071 | |||||||||||||
| 86,286 | Charles Voegele Holding AG * | 7,689,175 | |||||||||||||
| 700 | Eichhof Holding AG | 1,254,797 | |||||||||||||
| 2,389 | Forbo Holdings AG (Registered) * (a) | 1,197,005 | |||||||||||||
| 18,940 | Geberit AG (Registered) | 2,786,492 | |||||||||||||
| 17,510 | Helvetia Patria Holding (Registered) | 6,656,169 | |||||||||||||
| 1,000 | Jelmoli Holding AG (Bearer) | 2,556,763 | |||||||||||||
| 3,250 | Jelmoli Holding AG (Registered) | 1,629,342 | |||||||||||||
| 200,309 | Kardex AG * | 9,986,586 | |||||||||||||
| 552 | SGS SA (Registered) | 741,409 | |||||||||||||
| 18,000 | Swatch Group AG | 5,283,450 | |||||||||||||
| 17,908 | Valiant Holding (Registered) | 3,206,002 | |||||||||||||
| 9,350 | Valora Holding AG | 2,175,040 | |||||||||||||
| Total Switzerland | 55,751,166 | ||||||||||||||
See accompanying notes to the financial statements.
11
GMO Foreign Small Companies Fund
(A Series of GMO Trust)
Schedule of Investments — (Continued)
(showing percentage of total net assets)
February 29, 2008
| Shares | Description | Value ($) | |||||||||||||
| Taiwan — 2.2% | |||||||||||||||
| 160,000 | 104 Corp | 590,949 | |||||||||||||
| 1,550,000 | Advanced Semiconductor Engineering Inc | 1,421,041 | |||||||||||||
| 4,319,000 | Arima Computer Corp * | 767,026 | |||||||||||||
| 263,900 | Catcher Technology Co | 978,757 | |||||||||||||
| 2,040,150 | China Motor Corp Ltd | 1,527,318 | |||||||||||||
| 1,000,000 | Continental Engineering Corp | 680,194 | |||||||||||||
| 427,380 | E.Sun Financial Holdings Co Ltd * | 245,704 | |||||||||||||
| 4,416,000 | Gold Circuit Electronics Ltd | 3,148,437 | |||||||||||||
| 418,000 | Kinsus Interconnect Technology Corp | 1,090,247 | |||||||||||||
| 270,000 | Novatek Microelectronics Corp Ltd | 950,080 | |||||||||||||
| 1,507,434 | Phoenix Precision Technology Corp | 1,026,094 | |||||||||||||
| 1,641,000 | Phoenixtec Power Co Ltd | 2,481,140 | |||||||||||||
| 1,785,300 | Qisda Corp * | 1,663,756 | |||||||||||||
| 52,125 | Sunplus Technology Co Ltd | 58,217 | |||||||||||||
| 2,417,940 | Tsann Kuen Enterprises Co Ltd * | 3,210,507 | |||||||||||||
| 1,319,356 | Yulon Motor Co Ltd | 1,782,789 | |||||||||||||
| Total Taiwan | 21,622,256 | ||||||||||||||
| Thailand — 0.2% | |||||||||||||||
| 1,513,000 | Asian Property Development Pcl (Foreign Registered) (c) | 302,763 | |||||||||||||
| 11,100,000 | Home Product Center Pcl (Foreign Registered) (c) | 1,748,422 | |||||||||||||
| Total Thailand | 2,051,185 | ||||||||||||||
| United Kingdom — 18.7% | |||||||||||||||
| 145,000 | Alliance & Leicester Plc | 1,608,154 | |||||||||||||
| 145,000 | AMEC Plc | 2,211,886 | |||||||||||||
| 150,000 | Aquarius Platinum Ltd | 2,250,662 | |||||||||||||
| 488,989 | Balfour Beatty Plc | 4,290,690 | |||||||||||||
| 360,327 | BBA Aviation Plc | 1,311,045 | |||||||||||||
| 103,633 | Biffa Plc | 711,282 | |||||||||||||
| 687,250 | Bodycote International Plc | 2,544,113 | |||||||||||||
| 533,333 | Brit Insurance Holdings Plc | 2,450,588 | |||||||||||||
| 438,800 | British Airways Plc * | 2,224,349 | |||||||||||||
| 105,000 | British Energy Group Plc | 1,169,721 | |||||||||||||
See accompanying notes to the financial statements.
12
GMO Foreign Small Companies Fund
(A Series of GMO Trust)
Schedule of Investments — (Continued)
(showing percentage of total net assets)
February 29, 2008
| Shares | Description | Value ($) | |||||||||||||
| United Kingdom — continued | |||||||||||||||
| 339,100 | Carphone Warehouse Group Plc (a) | 2,054,847 | |||||||||||||
| 573,403 | Cattle's Plc | 2,640,514 | |||||||||||||
| 269,000 | Centrica Plc | 1,717,508 | |||||||||||||
| 144,888 | Chemring Group | 7,028,294 | |||||||||||||
| 550,000 | Cobham Plc | 1,978,655 | |||||||||||||
| 742,000 | Compass Group Plc | 4,782,630 | |||||||||||||
| 106,951 | Computacenter Plc | 380,235 | |||||||||||||
| 200,000 | Davis Service Group (Ordinary) | 1,979,221 | |||||||||||||
| 1,500,000 | Dawnay Day Treveria Plc | 1,729,552 | |||||||||||||
| 132,333 | De La Rue Plc | 2,367,386 | |||||||||||||
| 3,300,000 | Dimension Data Holdings Plc | 3,355,353 | |||||||||||||
| 11,400 | Experian Group | 95,833 | |||||||||||||
| 106,250 | Fiberweb Plc | 140,609 | |||||||||||||
| 95,200 | Filtrona Plc | 356,523 | |||||||||||||
| 696,493 | FKI Plc | 1,001,576 | |||||||||||||
| 307,600 | Fyffes Plc (a) | 424,062 | |||||||||||||
| 703,000 | Galliford Try Plc | 966,233 | |||||||||||||
| 50,000 | Go-Ahead Group Plc | 1,777,605 | |||||||||||||
| 621,109 | Group 4 Securicor Plc | 2,678,653 | |||||||||||||
| 171,747 | Hays Plc | 369,254 | |||||||||||||
| 386,049 | ICAP Plc | 4,806,870 | |||||||||||||
| 600,000 | Inmarsat Plc | 5,860,049 | |||||||||||||
| 97,777 | Intermediate Capital Group Plc | 2,893,256 | |||||||||||||
| 115,000 | International Personal Finance | 464,859 | |||||||||||||
| 114,600 | Interserve Plc | 972,620 | |||||||||||||
| 175,000 | ITV Plc | 231,312 | |||||||||||||
| 225,000 | JJB Sports Plc | 543,478 | |||||||||||||
| 115,000 | Johnson Matthey Plc | 4,421,157 | |||||||||||||
| 104,929 | Kazakhmys Plc | 3,196,209 | |||||||||||||
| 160,000 | Kesa Electricals Plc | 675,947 | |||||||||||||
| 153,149 | Kier Group Plc | 4,225,562 | |||||||||||||
| 166,000 | Lamprell Plc | 1,394,871 | |||||||||||||
| 146,000 | Misys Plc | 429,971 | |||||||||||||
| 252,652 | Mitie Group Plc | 1,287,461 | |||||||||||||
See accompanying notes to the financial statements.
13
GMO Foreign Small Companies Fund
(A Series of GMO Trust)
Schedule of Investments — (Continued)
(showing percentage of total net assets)
February 29, 2008
| Shares | Description | Value ($) | |||||||||||||
| United Kingdom — continued | |||||||||||||||
| 207,142 | N Brown Group | 1,023,900 | |||||||||||||
| 55,000 | Next Plc | 1,394,905 | |||||||||||||
| 1,100,000 | Northgate Info Solutions Plc | 2,054,391 | |||||||||||||
| 497,357 | �� | Pennon Group Plc | 6,297,277 | ||||||||||||
| 196,076 | Petrofac Ltd | 2,137,650 | |||||||||||||
| 305,555 | Playtech Ltd | 2,432,559 | |||||||||||||
| 57,500 | Provident Financial Plc | 910,970 | |||||||||||||
| 75,000 | Punch Taverns Plc | 954,663 | |||||||||||||
| 600,000 | Qinetiq Plc | 2,345,236 | |||||||||||||
| 200,000 | Record Plc * | 409,332 | |||||||||||||
| 506,254 | Resolution Plc | 6,931,814 | |||||||||||||
| 375,736 | Rexam Plc | 3,270,957 | |||||||||||||
| 750,000 | RM Plc | 3,241,822 | |||||||||||||
| 1,091,496 | Royal & Sun Alliance Insurance Group | 2,845,541 | |||||||||||||
| 1,000,000 | Sage Group Plc | 3,898,393 | |||||||||||||
| 100,000 | Savills Plc | 673,193 | |||||||||||||
| 50,000 | Schroders Plc | 944,038 | |||||||||||||
| 398,769 | Segro Plc | 4,077,160 | |||||||||||||
| 417,109 | Serco Group Plc | 3,585,460 | |||||||||||||
| 50,000 | Severn Trent (Ordinary Shares) | 1,403,473 | |||||||||||||
| 144,000 | Shire Plc | 2,810,964 | |||||||||||||
| 755,160 | Smith (David S.) Holdings Plc | 2,364,702 | |||||||||||||
| 115,600 | Smith News Plc | 231,334 | |||||||||||||
| 50,000 | Smiths Group Plc | 982,189 | |||||||||||||
| 100,000 | Smurfit Kappa Plc * | 1,426,788 | |||||||||||||
| 23,796 | Soco International Plc * | 914,701 | |||||||||||||
| 145,000 | Spice Plc | 1,336,858 | |||||||||||||
| 58,600 | Tate & Lyle Plc | 606,786 | |||||||||||||
| 64,300 | Tomkins Plc | 215,582 | |||||||||||||
| 307,600 | Total Produce Plc | 265,207 | |||||||||||||
| 62,181 | Travis Perkins Plc | 1,329,285 | |||||||||||||
| 220,000 | Trinity Mirror Plc | 1,236,219 | |||||||||||||
| 1,080,000 | TT Group Plc | 2,016,395 | |||||||||||||
| 155,700 | Ultra Electronics Holdings | 3,690,390 | |||||||||||||
See accompanying notes to the financial statements.
14
GMO Foreign Small Companies Fund
(A Series of GMO Trust)
Schedule of Investments — (Continued)
(showing percentage of total net assets)
February 29, 2008
| Shares | Description | Value ($) | |||||||||||||
| United Kingdom — continued | |||||||||||||||
| 75,000 | United Business Media Plc | 790,136 | |||||||||||||
| 91,179 | Venture Production (Ordinary Shares) | 1,297,990 | |||||||||||||
| 100,495 | VT Group Plc | 1,320,361 | |||||||||||||
| 177,097 | WH Smith Plc | 1,309,809 | |||||||||||||
| 270,366 | William Hill Plc | 2,010,908 | |||||||||||||
| 1,036,882 | William Morrison Supermarkets Plc | 6,078,198 | |||||||||||||
| 137,800 | Wolseley Plc | 1,686,265 | |||||||||||||
| 850,000 | Wood Group (John) Plc | 6,945,644 | |||||||||||||
| 60,588 | Xstrata Plc | 4,726,494 | |||||||||||||
| 275,000 | Yell Group Plc | 1,186,264 | |||||||||||||
| Total United Kingdom | 187,612,858 | ||||||||||||||
| TOTAL COMMON STOCKS (COST $755,160,040) | 937,477,703 | ||||||||||||||
| PREFERRED STOCKS — 1.3% | |||||||||||||||
| France — 0.1% | |||||||||||||||
| 6,800 | Casino Guichard-Perrachon SA 4.06% (a) | 553,850 | |||||||||||||
| Germany — 0.8% | |||||||||||||||
| 55,400 | Henkel KGaA 1.81% | 2,462,719 | |||||||||||||
| 260 | Porsche AG (Non Voting) 0.06% | 450,809 | |||||||||||||
| 200,000 | ProSiebenSat.1 Media AG 6.24% | 4,328,914 | |||||||||||||
| 5,200 | Volkswagen AG 2.02% | 724,558 | |||||||||||||
| Total Germany | 7,967,000 | ||||||||||||||
| Italy — 0.0% | |||||||||||||||
| 10,000 | IFI Istituto Finanziario Industries * | 282,546 | |||||||||||||
| South Korea — 0.4% | |||||||||||||||
| 320,000 | Daishin Securities Co * | 4,259,624 | |||||||||||||
| TOTAL PREFERRED STOCKS (COST $12,099,680) | 13,063,020 | ||||||||||||||
See accompanying notes to the financial statements.
15
GMO Foreign Small Companies Fund
(A Series of GMO Trust)
Schedule of Investments — (Continued)
(showing percentage of total net assets)
February 29, 2008
| Shares / Par Value ($) | Description | Value ($) | |||||||||||||
| SHORT-TERM INVESTMENTS — 7.5% | |||||||||||||||
| 61,047,577 | Bank of New York Mellon Institutional Cash Reserves Fund (d) | 61,047,577 | |||||||||||||
| 14,400,000 | ING Bank Time Deposit, 3.13%, due 03/03/08 | 14,400,000 | |||||||||||||
| TOTAL SHORT-TERM INVESTMENTS (COST $75,447,577) | 75,447,577 | ||||||||||||||
| TOTAL INVESTMENTS — 102.0% (Cost $842,707,297) | 1,025,988,300 | ||||||||||||||
| Other Assets and Liabilities (net) — (2.0%) | (20,192,684 | ) | |||||||||||||
| TOTAL NET ASSETS — 100.0% | $ | 1,005,795,616 | |||||||||||||
Notes to Schedule of Investments:
144A - Securities exempt from registration under Rule 144A of the Securities Act of 1933. These securities may be resold in transactions exempt from registration, normally to qualified institutional investors.
Foreign Registered - Shares issued to foreign investors in markets that have foreign ownership limits.
GDR - Global Depository Receipt
SDR - Swedish Depository Receipt
* Non-income producing security.
(a) All or a portion of this security is out on loan (Note 2).
(b) Bankrupt issuer.
(c) Security valued at fair value using methods determined in good faith by or at the direction of the Trustees of GMO Trust (Note 2).
(d) All or a portion of this security represents investment of security lending collateral (Note 2).
As of February 29, 2008, 83.51% of the Net Assets of the Fund were valued using fair value prices based on models used by a third party vendor (Note 2).
See accompanying notes to the financial statements.
16
GMO Foreign Small Companies Fund
(A Series of GMO Trust)
Statement of Assets and Liabilities — February 29, 2008
| Assets: | |||||||
| Investments, at value, including securities on loan of $57,018,879 (cost $842,707,297) (Note 2) | $ | 1,025,988,300 | |||||
| Cash | 29,462 | ||||||
| Foreign currency, at value (cost $42,986,355) (Note 2) | 44,023,694 | ||||||
| Receivable for investments sold | 4,686,324 | ||||||
| Dividends and interest receivable | 1,500,965 | ||||||
| Foreign taxes receivable | 90,308 | ||||||
| Receivable for expenses reimbursed by Manager (Note 3) | 93,119 | ||||||
| Total assets | 1,076,412,172 | ||||||
| Liabilities: | |||||||
| Collateral on securities loaned, at value (Note 2) | 61,047,577 | ||||||
| Payable for investments purchased | �� | 8,548,116 | |||||
| Payable to affiliate for (Note 3): | |||||||
| Management fee | 543,404 | ||||||
| Shareholder service fee | 90,647 | ||||||
| Trustees and Chief Compliance Officer of GMO Trust fees | 1,211 | ||||||
| Accrued expenses | 385,601 | ||||||
| Total liabilities | 70,616,556 | ||||||
| Net assets | $ | 1,005,795,616 | |||||
| Net assets consist of: | |||||||
| Paid-in capital | $ | 785,045,129 | |||||
| Distributions in excess of net investment income | (7,212,762 | ) | |||||
| Accumulated net realized gain | 43,618,598 | ||||||
| Net unrealized appreciation | 184,344,651 | ||||||
| $ | 1,005,795,616 | ||||||
| Net assets attributable to: | |||||||
| Class III shares | $ | 338,804,403 | |||||
| Class IV shares | $ | 666,991,213 | |||||
| Shares outstanding: | |||||||
| Class III | 23,157,877 | ||||||
| Class IV | 45,558,027 | ||||||
| Net asset value per share: | |||||||
| Class III | $ | 14.63 | |||||
| Class IV | $ | 14.64 | |||||
See accompanying notes to the financial statements.
17
GMO Foreign Small Companies Fund
(A Series of GMO Trust)
Statement of Operations — Year Ended February 29, 2008
| Investment Income: | |||||||
| Dividends (net of withholding taxes of $2,344,108) | $ | 25,640,444 | |||||
| Interest | 1,770,309 | ||||||
| Securities lending income | 1,328,440 | ||||||
| Total investment income | 28,739,193 | ||||||
| Expenses: | |||||||
| Management fee (Note 3) | 7,988,182 | ||||||
| Shareholder service fee – Class III (Note 3) | 578,188 | ||||||
| Shareholder service fee – Class IV (Note 3) | 755,710 | ||||||
| Custodian and fund accounting agent fees | 861,276 | ||||||
| Transfer agent fees | 43,036 | ||||||
| Audit and tax fees | 128,189 | ||||||
| Legal fees | 26,525 | ||||||
| Trustees fees and related expenses (Note 3) | 13,171 | ||||||
| Registration fees | 920 | ||||||
| Miscellaneous | 14,486 | ||||||
| Total expenses | 10,409,683 | ||||||
| Fees and expenses reimbursed by Manager (Note 3) | (1,013,127 | ) | |||||
| Expense reductions (Note 2) | (23,772 | ) | |||||
| Net expenses | 9,372,784 | ||||||
| Net investment income (loss) | 19,366,409 | ||||||
| Realized and unrealized gain (loss): | |||||||
| Net realized gain (loss) on: | |||||||
| Investments | 174,233,675 | ||||||
| Foreign currency, forward contracts and foreign currency related transactions (net of CPMF tax of $3,988) (Note2) | 2,863,328 | ||||||
| Net realized gain (loss) | 177,097,003 | ||||||
| Change in net unrealized appreciation (depreciation) on: | |||||||
| Investments | (211,273,296 | ) | |||||
| Foreign currency, forward contracts and foreign currency related transactions | 722,780 | ||||||
| Net unrealized gain (loss) | (210,550,516 | ) | |||||
| Net realized and unrealized gain (loss) | (33,453,513 | ) | |||||
| Net increase (decrease) in net assets resulting from operations | $ | (14,087,104 | ) | ||||
See accompanying notes to the financial statements.
18
GMO Foreign Small Companies Fund
(A Series of GMO Trust)
Statement of Changes in Net Assets
| Year Ended February 29, 2008 | Year Ended February 28, 2007 | ||||||||||
| Increase (decrease) in net assets: | |||||||||||
| Operations: | |||||||||||
| Net investment income (loss) | $ | 19,366,409 | $ | 15,757,304 | |||||||
| Net realized gain (loss) | 177,097,003 | 188,024,465 | |||||||||
| Change in net unrealized appreciation (depreciation) | (210,550,516 | ) | 68,834,451 | ||||||||
| Net increase (decrease) in net assets from operations | (14,087,104 | ) | 272,616,220 | ||||||||
| Distributions to shareholders from: | |||||||||||
| Net investment income | |||||||||||
| Class III | (8,928,275 | ) | (8,607,715 | ) | |||||||
| Class IV | (16,347,910 | ) | (15,899,492 | ) | |||||||
| Total distributions from net investment income | (25,276,185 | ) | (24,507,207 | ) | |||||||
| Net realized gains | |||||||||||
| Class III | (71,469,472 | ) | (75,878,065 | ) | |||||||
| Class IV | (126,085,967 | ) | (133,631,353 | ) | |||||||
| Total distributions from net realized gains | (197,555,439 | ) | (209,509,418 | ) | |||||||
| (222,831,624 | ) | (234,016,625 | ) | ||||||||
| Net share transactions (Note 7): | |||||||||||
| Class III | 46,586,423 | (3,415,505 | ) | ||||||||
| Class IV | 79,691,450 | 78,067,756 | |||||||||
| Increase (decrease) in net assets resulting from net share transactions | 126,277,873 | 74,652,251 | |||||||||
| Total increase (decrease) in net assets | (110,640,855 | ) | 113,251,846 | ||||||||
| Net assets: | |||||||||||
| Beginning of period | 1,116,436,471 | 1,003,184,625 | |||||||||
| End of period (including distributions in excess of net investment income of $7,212,762 and $7,065,273, respectively) | $ | 1,005,795,616 | $ | 1,116,436,471 | |||||||
See accompanying notes to the financial statements.
19
GMO Foreign Small Companies Fund
(A Series of GMO Trust)
Financial Highlights
(For a Class III share outstanding throughout each period)
| Year Ended February 28/29, | |||||||||||||||||||||||
| 2008 | 2007 | 2006 | 2005 | 2004 | |||||||||||||||||||
| Net asset value, beginning of period | $ | 18.38 | $ | 17.98 | $ | 17.19 | $ | 14.79 | $ | 9.13 | |||||||||||||
| Income (loss) from investment operations: | |||||||||||||||||||||||
| Net investment income (loss)† | 0.31 | 0.28 | 0.26 | 0.26 | 0.20 | ||||||||||||||||||
| Net realized and unrealized gain (loss) | (0.36 | ) | 4.51 | 3.19 | 3.76 | 5.77 | |||||||||||||||||
| Total from investment operations | (0.05 | ) | 4.79 | 3.45 | 4.02 | 5.97 | |||||||||||||||||
| Less distributions to shareholders: | |||||||||||||||||||||||
| From net investment income | (0.41 | ) | (0.44 | ) | (0.32 | ) | (0.38 | ) | (0.31 | ) | |||||||||||||
| From net realized gains | (3.29 | ) | (3.95 | ) | (2.34 | ) | (1.24 | ) | — | ||||||||||||||
| Total distributions | (3.70 | ) | (4.39 | ) | (2.66 | ) | (1.62 | ) | (0.31 | ) | |||||||||||||
| Net asset value, end of period | $ | 14.63 | $ | 18.38 | $ | 17.98 | $ | 17.19 | $ | 14.79 | |||||||||||||
| Total Return(a) | (1.96 | )% | 29.94 | % | 22.32 | % | 28.40 | % | 65.76 | % | |||||||||||||
| Ratios/Supplemental Data: | |||||||||||||||||||||||
| Net assets, end of period (000's) | $ | 338,804 | $ | 375,565 | $ | 364,551 | $ | 426,758 | $ | 480,966 | |||||||||||||
| Net expenses to average daily net assets | 0.86 | %(b) | 0.86 | % | 0.85 | % | 0.85 | % | 0.85 | % | |||||||||||||
| Net investment income to average daily net assets | 1.69 | % | 1.53 | % | 1.52 | % | 1.71 | % | 1.71 | % | |||||||||||||
| Portfolio turnover rate | 42 | % | 37 | % | 40 | % | 25 | % | 31 | % | |||||||||||||
| Fees and expenses reimbursed by the Manager to average daily net assets: | 0.09 | % | 0.09 | % | 0.09 | % | 0.09 | % | 0.11 | % | |||||||||||||
(a) Total returns would have been lower had certain expenses not been reimbursed during the periods shown and assumes the effect of reinvested distributions.
(b) The net expense ratio does not include the effect of expense reductions.
† Calculated using average shares outstanding throughout the period.
See accompanying notes to the financial statements.
20
GMO Foreign Small Companies Fund
(A Series of GMO Trust)
Financial Highlights
(For a Class IV share outstanding throughout each period)
| Year Ended February 28/29, | |||||||||||||||||||||||
| 2008 | 2007 | 2006 | 2005 | 2004 | |||||||||||||||||||
| Net asset value, beginning of period | $ | 18.39 | $ | 17.99 | $ | 17.20 | $ | 14.80 | $ | 9.13 | |||||||||||||
| Income (loss) from investment operations: | |||||||||||||||||||||||
| Net investment income (loss)† | 0.31 | 0.28 | 0.26 | 0.26 | 0.21 | ||||||||||||||||||
| Net realized and unrealized gain (loss) | (0.35 | ) | 4.52 | 3.20 | 3.76 | 5.77 | |||||||||||||||||
| Total from investment operations | (0.04 | ) | 4.80 | 3.46 | 4.02 | 5.98 | |||||||||||||||||
| Less distributions to shareholders: | |||||||||||||||||||||||
| From net investment income | (0.42 | ) | (0.45 | ) | (0.33 | ) | (0.38 | ) | (0.31 | ) | |||||||||||||
| From net realized gains | (3.29 | ) | (3.95 | ) | (2.34 | ) | (1.24 | ) | — | ||||||||||||||
| Total distributions | (3.71 | ) | (4.40 | ) | (2.67 | ) | (1.62 | ) | (0.31 | ) | |||||||||||||
| Net asset value, end of period | $ | 14.64 | $ | 18.39 | $ | 17.99 | $ | 17.20 | $ | 14.80 | |||||||||||||
| Total Return(a) | (1.91 | )% | 30.00 | % | 22.37 | % | 28.44 | % | 65.92 | % | |||||||||||||
| Ratios/Supplemental Data: | |||||||||||||||||||||||
| Net assets, end of period (000's) | $ | 666,991 | $ | 740,872 | $ | 638,634 | $ | 567,048 | $ | 333,731 | |||||||||||||
| Net expenses to average daily net assets | 0.81 | %(b) | 0.81 | % | 0.80 | % | 0.81 | % | 0.80 | % | |||||||||||||
| Net investment income to average daily net assets | 1.70 | % | 1.54 | % | 1.55 | % | 1.69 | % | 1.78 | % | |||||||||||||
| Portfolio turnover rate | 42 | % | 37 | % | 40 | % | 25 | % | 31 | % | |||||||||||||
| Fees and expenses reimbursed by the Manager to average daily net assets: | 0.09 | % | 0.09 | % | 0.09 | % | �� | 0.09 | % | 0.11 | % | ||||||||||||
(a) Total returns would have been lower had certain expenses not been reimbursed during the periods shown and assumes the effect of reinvested distributions.
(b) The net expense ratio does not include the effect of expense reductions.
† Calculated using average shares outstanding throughout the period.
See accompanying notes to the financial statements.
21
GMO Foreign Small Companies Fund
(A Series of GMO Trust)
Notes to Financial Statements
February 29, 2008
1. Organization
GMO Foreign Small Companies Fund (the "Fund") is a series of GMO Trust (the "Trust"). The Fund is registered under the Investment Company Act of 1940, as amended, as an open-end, diversified management investment company. The Fund is advised and managed by Grantham, Mayo, Van Otterloo & Co. LLC (the "Manager" or "GMO"). The Trust was established as a Massachusetts business trust under the laws of the Commonwealth of Massachusetts on June 24, 1985. The Declaration of Trust permits the Trustees of the Trust ("Trustees") to create an unlimited number of series of shares ("Funds") and to subdivide Funds into classes.
The Fund seeks total return in excess of that of its benchmark, the S&P/Citigroup Extended Market Index World ex-U.S. Index. The Fund typically makes equity investments in companies located or doing business outside of the U.S. that are in the smallest 30% of companies in a particular country as measured by total float-adjusted market capitalization. The Fund generally seeks to be fully invested and generally will not take temporary defensive positions, but may hold up to 10% of its total assets in cash and other high quality investments in order to manage cash inflows and outflows as a result of shareholder purchases and redemptions. The Fund may make investments in emerging countries, but these investments (excluding investments in companies from emerging countries included in the Fund's benchmark) generally will represent 10% or less of the Fund's total assets.
Throughout the year ended February 29, 2008, the Fund had two classes of shares outstanding: Class III and Class IV. Each class of shares bears a different level of shareholder servicing fees.
The Fund currently limits subscriptions due to capacity considerations.
2. Significant accounting policies
The following is a summary of significant accounting policies which are in conformity with accounting principles generally accepted in the United States of America ("U.S. GAAP") and which are consistently followed by the Fund in the preparation of its financial statements. The preparation of financial statements in accordance with U.S. GAAP requires management to make estimates and assumptions that affect the reported amounts and disclosures in the financial statements. Actual results could differ from those estimates. The accounting records of the Fund are maintained in U.S. dollars.
Portfolio valuation
Securities listed on a securities exchange for which market quotations are readily available are valued at the last sale price or official closing price on each business day, or if there is no such reported sale or official closing price, at the most recent quoted bid price. Unlisted securities for which market quotations are readily available are generally valued at the most recent quoted bid price. Short-term investments with a remaining maturity of sixty days or less are generally valued at amortized cost, which approximates fair value.
22
GMO Foreign Small Companies Fund
(A Series of GMO Trust)
Notes to Financial Statements — (Continued)
February 29, 2008
Shares of investment funds are valued at their net asset value. Securities for which quotations are not readily available or whose values the Manager has determined to be unreliable are valued at fair value as determined in good faith by the Trustees or other persons acting at their direction pursuant to procedures approved by the Trustees. By its nature, a fair value price is a good faith estimate of the value of a security at a given point in time and may not reflect the value that would be realized if the security was sold and the differences could be material. Because many foreign equity securities markets and exchanges close prior to the close of the New York Stock Exchange ("NYSE"), closing prices for foreign securities in those markets or on those exchanges do not reflect the events that occur after that close but before the close of the NYSE. As a result, foreign equity securities are generally valued using fair value pr ices supplied by a third party vendor based on models to the extent that these fair value prices are available.
Foreign currency translation
The market values of foreign securities, currency holdings and other assets and liabilities are translated to U.S. dollars based on the current exchange rates each business day. Income and expenses denominated in foreign currencies are translated at current exchange rates when accrued or incurred. The Fund does not isolate realized and unrealized gains and losses attributable to changes in exchange rates from gains and losses that arise from changes in the market value of investments. Such fluctuations are included with net realized and unrealized gain or loss on investments. Net realized gains and losses on foreign currency transactions represent gains and losses on disposition of currencies and forward currency contracts, currency gains and losses realized between the trade and settlement dates on securities transactions, and the difference between the amount of investment income and foreign withholding taxes recorded on the F und's accounting records and the U.S. dollar equivalent amounts actually received or paid.
Forward currency contracts
The Fund may enter into forward currency contracts including forward cross currency contracts. A forward currency contract is an agreement between two parties to buy and sell a currency at a set price on a future date. The market value of a forward currency contract fluctuates with changes in forward currency exchange rates. Forward currency contracts are marked to market daily using rates supplied by a quotation service and changes in value are recorded by the Fund as an unrealized gain or loss. Realized gains or losses equal to the difference between the value of the contract at the time it was opened and the value at the time it was closed are recorded upon delivery or receipt of the currency or, if a forward currency contract is offset by entering into another forward currency contract with the same broker, upon settlement of the net gain or loss. These contracts may involve market risk in excess of the unrealized gain or lo ss reflected in the Fund's Statement of Assets and Liabilities. In addition, the Fund could be exposed to risk if the counterparties are unable to meet the terms of the contracts or if there are movements in currency values that are unfavorable to the Fund. There were no forward currency contracts outstanding at the end of the period.
23
GMO Foreign Small Companies Fund
(A Series of GMO Trust)
Notes to Financial Statements — (Continued)
February 29, 2008
Futures contracts
The Fund may purchase and sell futures contracts. Upon entering into a futures contract, the Fund is required to deposit with the futures clearing broker an amount of cash, U.S. government and agency obligations, or other liquid assets in accordance with the initial margin requirements of the broker or exchange. In addition, the Fund maintains cash or securities in an amount that at least equals the net amount payable in the event the Fund must deliver the full amount of the contracts. Futures contracts are marked to market daily and an appropriate payable or receivable for the change in value ("variation margin") is recorded by the Fund. The payable or receivable is liquidated on the following business day. Gains or losses are recognized but not considered realized until the contracts expire or are closed. Futures contracts involve, to varying degrees, risk of loss in excess of the variation margin disclosed in the Statement of Assets and Liabilities. Under certain circumstances, futures exchanges may establish daily limits on the amount that the price of a futures contract can vary from the previous day's settlement price, thereby effectively preventing liquidation of unfavorable positions. Losses may arise from changes in the value of the underlying instrument if the Fund is unable to liquidate a futures position due to an illiquid secondary market for the contracts or the imposition of price limits, or if counterparties do not perform under the contract terms. Futures contracts are generally valued at the settlement price established each day by the board of trade or exchange on which they are traded. There were no futures contracts outstanding at the end of the period.
Options
The Fund may write call and put options. Writing options increases the Fund's exposure to the underlying instrument by, in the case of a call option, obligating the Fund to sell the underlying instrument at a set price to the option-holder and, in the case of a put option, obligating the Fund to purchase the underlying instrument at a set price from the option-holder. When the Fund writes a call or put option, an amount equal to the premium received is recorded as a liability and subsequently marked to market to reflect the current value of the option written. Premiums received from writing options which expire are treated as realized gains. Premiums received from writing options which are exercised or closed are added to the proceeds or offset against the amounts paid on the underlying future, security or currency transaction to determine the realized gain or loss. The Fund as a writer of an option has no control over whether t he underlying future, security or currency may be sold (call) or purchased (put) and as a result bears the market risk of an unfavorable change in the price of the future, security or currency underlying the written option. In the event that the Fund writes uncovered call options (i.e. options for investments that the Fund does not own), it bears the risk of incurring substantial losses if the price of the underlying instrument increases during the term of the option. There is the risk the Fund may not be able to enter into a closing transaction because of an illiquid market. There were no open written option contracts during the period.
The Fund may also purchase put and call options. Purchasing options alters the Fund's exposure to the underlying instrument by, in the case of a call option, entitling the Fund to purchase the underlying instrument at a set price from the writer of the option and, in the case of a put option, entitling the Fund to sell the underlying instrument at a set price to the writer of the option. The Fund pays a premium as a cost
24
GMO Foreign Small Companies Fund
(A Series of GMO Trust)
Notes to Financial Statements — (Continued)
February 29, 2008
for a purchased option disclosed in the Schedule of Investments which is subsequently marked to market to reflect the current value of the option. Premiums paid for purchasing options which expire are treated as realized losses. Premiums paid for purchasing options which are exercised or closed are added to the amounts paid or offset against the proceeds on the closing transaction to determine the realized gain or loss. The risk associated with purchasing put and call options is limited to the premium paid. There were no purchased option contracts outstanding at the end of the period.
Exchange traded options are valued at the last sale price, or if no sale is reported, the last bid price for purchased options and the last ask price for written options. Options traded over-the-counter are valued using prices supplied by a primary pricing source chosen by the Manager.
Securities lending
The Fund may lend its securities to certain qualified broker-dealers. The loans are collateralized with cash or liquid securities with a market value at least equal to the market value of the securities on loan. As with other extensions of credit, the Fund may bear the risk of loss with respect to the investment of the collateral, the risk of delay in and/or inability to exercise its rights with respect to the collateral, and the risk of delay in recovery or loss of rights in the loaned securities should the borrower of the securities fail financially. If a loan is collateralized by U.S. government securities, the Fund receives a fee from the borrower. If a loan is collateralized by cash, the Fund typically invests the cash collateral for its own account in interest-bearing, short-term securities and pays a fee to the borrower that normally represents a portion of the Fund's earnings on the collateral. As of February 29, 2008, t he Fund had loaned securities valued by the Fund at $57,018,879, collateralized by cash in the amount of $61,047,577, which was invested in the Bank of New York Mellon Institutional Cash Reserves Fund.
Taxes and distributions
The Fund intends to qualify each tax year as a regulated investment company under Subchapter M of the Internal Revenue Code of 1986, as amended (the "Code"). The Fund intends to distribute substantially all of its net investment income and net realized short-term and long-term capital gains, if any, after giving effect to any available capital loss carryovers for U.S. federal income tax purposes. Therefore, no provision for U.S. federal income or excise tax is necessary. Taxes on foreign interest and dividend income are generally withheld in accordance with the applicable country's tax treaty with the United States. The foreign withholding rates applicable to a Fund's investments in certain foreign jurisdictions may be higher if a significant portion of the Fund is held by non-U.S. shareholders.
The Fund's policy is to declare and pay distributions from net investment income, if any, semiannually, and from net realized short-term and long-term capital gains, if any, at least annually. All distributions are paid in shares of the Fund, at net asset value, unless the shareholder elects to receive cash distributions. Distributions to shareholders are recorded by the Fund on the ex-dividend date.
25
GMO Foreign Small Companies Fund
(A Series of GMO Trust)
Notes to Financial Statements — (Continued)
February 29, 2008
Dividends received by shareholders of the Fund which are derived from foreign source income and foreign taxes paid by the Fund may be treated, to the extent allowable under the Code, as if received and paid by the shareholders of the Fund.
The Fund may be subject to capital gains and repatriation taxes imposed by certain countries in which it invests.
The Fund is subject to a Contribuição Provisória sobre Movimentações Financiera ("CPMF") tax which is applied to foreign exchange transactions representing capital inflows or outflows to/from the Brazilian market. For the year ended February 29, 2008, the Fund incurred $3,988 in CPMF tax which is included in the net realized gain (loss) on foreign currency, forward contracts and foreign currency related transactions in the Statement of Operations.
Income and capital gain distributions are determined in accordance with U.S. federal income tax regulations, which may differ from U.S. GAAP. Certain capital accounts in the financial statements are periodically adjusted for permanent differences in order to reflect their tax character. These adjustments have no impact on net assets or net asset value per share. Temporary differences which arise from recognizing certain items of income, expense, gain or loss in different periods for financial statement and tax purposes will reverse at some time in the future. Distributions in excess of net investment income or net realized gains are temporary over distributions for financial statement purposes resulting from differences in the recognition or classification of income or distributions for financial statement and tax purposes.
U.S. GAAP and tax accounting differences primarily relate to passive foreign investment company transactions, foreign currency transactions, differing treatment on security sales and post-October currency losses.
The following reclassification represents the amount necessary to report the stated components of net assets on a tax basis, excluding certain temporary differences, as of February 29, 2008. The financial highlights exclude these adjustments.
| Distributions In Excess Of Net Investment Income | Accumulated Net Realized Gain | Paid-in Capital | |||||||||
| $ | 5,762,287 | $ | (4,686,864 | ) | $ | (1,075,423 | ) | ||||
26
GMO Foreign Small Companies Fund
(A Series of GMO Trust)
Notes to Financial Statements — (Continued)
February 29, 2008
The tax character of distributions declared to shareholders is as follows:
| 2/29/2008 | 2/28/2007 | ||||||||||
| Ordinary income (including any short-term capital gains) | $ | 68,579,611 | $ | 63,849,039 | |||||||
| Long-term capital gains | 154,252,013 | 170,167,586 | |||||||||
| Total distributions | $ | 222,831,624 | $ | 234,016,625 | |||||||
Distributions in excess of tax basis earnings and profits, if significant, are reported in the financial statements as a tax return of capital.
As of February 29, 2008, the components of distributable earnings on a tax basis consisted of the following:
| Undistributed long-term capital gain | $ | 43,909,538 | |||||
As of February 29, 2008, the Fund elected to defer to March 1, 2008 post-October currency losses of $1,310,798.
As of February 29, 2008, the approximate cost for U.S. federal income tax purposes and gross and net unrealized appreciation and depreciation in value of investments were as follows:
Aggregate Cost | Gross Unrealized Appreciation | Gross Unrealized (Depreciation) | Net Unrealized Appreciation (Depreciation) | ||||||||||||
| $ | 848,763,293 | $ | 246,446,336 | $ | (69,221,329 | ) | $ | 177,225,007 | |||||||
Security transactions and related investment income
Security transactions are accounted for on trade date. Dividend income, net of applicable foreign withholding taxes, if any, is recorded on the ex-dividend date, or when the Fund is informed of the ex-dividend date, if later. Interest income is recorded on the accrual basis and is adjusted for the amortization of premiums and accretion of discounts. Interest income on inflation indexed securities, if any, is accrued daily based upon an inflation adjusted principal. Additionally, any increase or decrease in the principal or face amount of the securities adjusted for inflation is recorded as interest income or loss. Income is not recognized on securities for which collection is not expected. Non-cash dividends, if any, are recorded at the fair market value of the securities received. In determining the net gain or loss on securities sold, the cost of securities is determined on the identified cost basis.
27
GMO Foreign Small Companies Fund
(A Series of GMO Trust)
Notes to Financial Statements — (Continued)
February 29, 2008
Expenses
The majority of expenses of the Trust are directly identifiable to an individual fund. Expenses which are not readily identifiable to a specific fund are allocated taking into consideration, among other things, the nature and type of expense and the relative size of the funds. Investment income, common expenses and realized and unrealized gains and losses are allocated pro rata among the classes of shares of the Fund based on the relative net assets of each class. Shareholder service fees, which are directly attributable to a class of shares, are charged to that class's operations.
Brown Brothers Harriman & Co. ("BBH") serves as custodian and fund accounting agent of the Fund. State Street Bank and Trust Company ("State Street") serves as transfer agent of the Fund. BBH and State Street's fees may be reduced by credits that are an earnings allowance calculated on the average daily cash balances the Fund maintains with each agent. Credit balances or expense reimbursements used to reduce fees, if any, are reported as a reduction of expenses in the Statement of Operations.
Investment risks
There are certain additional risks involved in investing in foreign securities that are not inherent in investments in U.S. securities. These risks may involve adverse political and economic developments including the possible imposition of capital controls or other foreign governmental laws or restrictions. In addition, the securities of some foreign companies and securities markets are less liquid and at times may be more volatile than securities of comparable U.S. companies and U.S. securities markets.
Recently issued accounting pronouncements
In June 2006, the Financial Accounting Standards Board ("FASB") issued FASB Interpretation No. 48, Accounting for Uncertainty in Income Taxes – an Interpretation of FASB Statement No. 109 ("FIN 48"). FIN 48 clarifies the accounting for uncertainty in income taxes recognized in accordance with FASB Statement No. 109, Accounting for Income Taxes. FIN 48 prescribes a recognition threshold and measurement attribute for a tax position taken or expected to be taken in the tax return that could impact the Fund's financial statements. It also provides guidance in relation to the Fund's financial statements on classification of tax benefits or liabilities, interest and penalties, accounting in interim periods, disclosure, and transition. FIN 48 is effective for fiscal years beginning after December 15, 2006 for registered investment companies. Management has evaluated the effects of applying the various provisions of FIN 48 and has determined that the adoption of FIN 48 does not have a material effect on the Fund's financial statements. The Fund's federal tax returns for the prior three fiscal years remain subject to examination by the Internal Revenue Service. Management will continue to monitor the rules and guidance pertaining to FIN 48 and will take action if appropriate.
In September 2006, the FASB issued Statement of Financial Accounting Standards No. 157 ("FAS 157"), "Fair Value Measurements." FAS 157 defines fair value, establishes a framework for measuring fair value in accordance with generally accepted accounting principles and expands disclosure about fair value measurements. FAS 157 is effective for fiscal years beginning after November 15, 2007. Management is
28
GMO Foreign Small Companies Fund
(A Series of GMO Trust)
Notes to Financial Statements — (Continued)
February 29, 2008
currently evaluating the impact the adoption of FAS 157 will have on the Fund's financial statement disclosures.
3. Fees and other transactions with affiliates
GMO earns a management fee paid monthly at the annual rate of 0.70% of average daily net assets. The Fund has adopted a Shareholder Service Plan under which the Fund pays GMO a shareholder service fee for client and shareholder service, reporting, and other support. Pursuant to the Shareholder Service Plan, the shareholder service fee is calculated based on average daily net assets of each class at the annual rate of 0.15% for Class III shares and 0.10% for Class IV shares.
The Manager has contractually agreed to reimburse the Fund for Fund expenses through at least June 30, 2008 to the extent the Fund's total annual operating expenses (excluding shareholder service fees, fees and expenses of the independent Trustees of the Trust, fees and expenses for legal services not approved by the Manager for the Trust, compensation and expenses of the Trust's Chief Compliance Officer ("CCO") (excluding any employee benefits), brokerage commissions, securities lending fees and expenses, interest expense, transfer taxes, and other investment-related costs (including expenses associated with investments in any company that is an investment company or would be an investment company under the 1940 Act, but for the exceptions to the definition of investment company provided in Section 3(c)(1) and 3(c)(7) of the 1940 Act), hedging transaction fees, extraordinary, non-recurring and certain other unusual expenses (in cluding taxes)) exceed 0.70% of the Fund's average daily net assets.
The Fund's portion of the fees paid by the Trust to the independent Trustees and CCO during the year ended February 29, 2008 was $11,515 and $4,513, respectively. The compensation and expenses of the CCO are included in miscellaneous expenses in the Statement of Operations. No remuneration was paid by the Fund to any other officer of the Trust.
4. Purchases and sales of securities
Cost of purchases and proceeds from sales of securities, excluding short-term investments, for the year ended February 29, 2008 aggregated $461,939,067 and $542,485,703, respectively.
5. Guarantees
In the normal course of business the Fund enters into contracts with third-party service providers that contain a variety of representations and warranties and which provide general indemnifications. The Fund's maximum exposure under these arrangements is unknown, as this would involve future claims that may be made against the Fund that have not yet occurred. Based on experience, management is of the view that the risk of loss in connection with these potential indemnification obligations is remote; however, there can be no assurance that material liabilities related to such obligations will not arise in the future that could adversely impact the Fund.
29
GMO Foreign Small Companies Fund
(A Series of GMO Trust)
Notes to Financial Statements — (Continued)
February 29, 2008
6. Principal shareholders and related parties
As of February 29, 2008, 57.09% of the outstanding shares of the Fund were held by two shareholders, each holding in excess of 10% of the Fund's outstanding shares. No other shareholder owned in excess of 10% of the outstanding shares of the Fund. Investment activities of these shareholders may have a material effect on the Fund.
As of February 29, 2008, 0.01% of the Fund's shares were held by four related parties comprised of certain GMO employee accounts.
7. Share transactions
The Declaration of Trust permits the Trustees to issue an unlimited number of shares of beneficial interest (without par value). Transactions in Fund shares were as follows:
| Year Ended February 29, 2008 | Year Ended February 28, 2007 | ||||||||||||||||||
| Class III: | Shares | Amount | Shares | Amount | |||||||||||||||
| Shares sold | 8,563,923 | $ | 166,900,000 | 423,166 | $ | 8,100,000 | |||||||||||||
| Shares issued to shareholders in reinvestment of distributions | 4,631,692 | 78,154,241 | 4,723,975 | 81,261,068 | |||||||||||||||
| Shares repurchased | (10,469,794 | ) | (198,467,818 | ) | (4,994,827 | ) | (92,776,573 | ) | |||||||||||
| Net increase (decrease) | 2,725,821 | $ | 46,586,423 | 152,314 | $ | (3,415,505 | ) | ||||||||||||
| Year Ended February 29, 2008 | Year Ended February 28, 2007 | ||||||||||||||||||
| Class IV: | Shares | Amount | Shares | Amount | |||||||||||||||
| Shares sold | 6,619,129 | $ | 126,292,990 | — | $ | — | |||||||||||||
| Shares issued to shareholders in reinvestment of distributions | 8,449,525 | 140,398,460 | 8,605,233 | 148,279,756 | |||||||||||||||
| Shares repurchased | (9,792,130 | ) | (187,000,000 | ) | (3,829,731 | ) | (70,212,000 | ) | |||||||||||
| Net increase (decrease) | 5,276,524 | $ | 79,691,450 | 4,775,502 | $ | 78,067,756 | |||||||||||||
30
Report of Independent Registered Public Accounting Firm
To the Trustees of GMO Trust and the Shareholders of
GMO Foreign Small Companies Fund
In our opinion, the accompanying statement of assets and liabilities, including the schedule of investments, and the related statements of operations and of changes in net assets and the financial highlights present fairly, in all material respects, the financial position of GMO Foreign Small Companies Fund (the "Fund") at February 29, 2008, the results of its operations for the year then ended, the changes in its net assets for each of the two years in the period then ended and the financial highlights for each of the five years in the period then ended, in conformity with accounting principles generally accepted in the United States of America. These financial statements and financial highlights (hereafter referred to as "financial statements") are the responsibility of the Fund's management; our responsibility is to express an opinion on these financial statements based on our audits. We conducted our audits of these financia l statements in accordance with the standards of the Public Company Accounting Oversight Board (United States). Those standards require that we plan and perform the audit to obtain reasonable assurance about whether the financial statements are free of material misstatement. An audit includes examining, on a test basis, evidence supporting the amounts and disclosures in the financial statements, assessing the accounting principles used and significant estimates made by management, and evaluating the overall financial statement presentation. We believe that our audits, which included confirmation of securities at February 29, 2008 by correspondence with the custodian, provide a reasonable basis for our opinion.
PricewaterhouseCoopers LLP
Boston, Massachusetts
April 29, 2008
31
GMO Foreign Small Companies Fund
(A Series of GMO Trust)
Fund Expenses
February 29, 2008 (Unaudited)
Expense Examples: The following information is in relation to expenses for the six month period ended February 29, 2008.
As a shareholder of the Fund, you may incur two types of costs: (1) transaction costs, and (2) ongoing costs, including management fees, shareholder service fees and other Fund expenses. This example is intended to help you understand your ongoing costs (in dollars) of investing in the Fund and to compare these costs with the ongoing costs of investing in other mutual funds.
These examples are based on an investment of $1,000 invested at the beginning of the period and held for the entire period, September 1, 2007 through February 29, 2008.
Actual Expenses
The first line of the table for each class below provides information about actual account values and actual expenses. You may use the information in this line, together with the amount you invested, to estimate the expenses that you paid over the period. Simply divide your account value by $1,000 (for example, a $10,000,000 account value divided by $1,000 = 10,000), then multiply the result by the number in the first line under the heading entitled "Net Expense Incurred" to estimate the expenses you paid on your account during this period.
Hypothetical Example for Comparison Purposes
The second line of the table for each class below provides information about hypothetical account values and hypothetical expenses based on the Fund's actual expense ratio and an assumed rate of return of 5% per year before expenses, which is not the Fund's actual return. The hypothetical account values and expenses may not be used to estimate the actual ending account balance or expenses you paid for the period. You may use this information to compare the ongoing costs of investing in the Fund with other funds. To do so, compare this 5% hypothetical example with the 5% hypothetical examples that appear in the shareholder reports of other funds.
Please note that the expenses shown in the table are meant to highlight your ongoing costs only and do not reflect any transactional costs. Therefore, the second line of the table is useful in comparing ongoing costs only, and will not help you determine the relative total costs of owning different funds. In addition, if these transactional costs were included, your costs would have been higher.
| Annualized Net Expense Ratio | Beginning Account Value | Ending Account Value | Net Expense Incurred* | ||||||||||||||||
| Class III | |||||||||||||||||||
| 1) Actual | 0.86 | % | $ | 1,000.00 | $ | 916.60 | $ | 4.10 | |||||||||||
| 2) Hypothetical | 0.86 | % | $ | 1,000.00 | $ | 1,020.59 | $ | 4.32 | |||||||||||
| Class IV | |||||||||||||||||||
| 1) Actual | 0.81 | % | $ | 1,000.00 | $ | 916.60 | $ | 3.86 | |||||||||||
| 2) Hypothetical | 0.81 | % | $ | 1,000.00 | $ | 1,020.84 | $ | 4.07 | |||||||||||
* Expenses are calculated using each Class's annualized net expense ratio for the six months ended February 29, 2008, multiplied by the average account value over the period, multiplied by 182 days in the period, divided by 366 days in the year.
32
GMO Foreign Small Companies Fund
(A Series of GMO Trust)
Tax Information for the Tax Year Ended February 29, 2008 (Unaudited)
The Fund will notify shareholders of amounts for use in preparing 2008 income tax forms in January 2009.
The Fund's distributions to shareholders include $154,252,013 from long-term capital gains.
During the year ended February 29, 2008, the Fund paid foreign taxes of $2,344,033 and recognized foreign source income of $27,984,552.
For taxable, non-corporate shareholders, 25.51% of the income and short-term capital gains, if any, distributed in the Fund's fiscal year ended February 29, 2008 represents qualified dividend income subject to the 15% rate category.
The Fund hereby designates as qualified interest income and qualified short-term capital gains with respect to its taxable year ended February 29, 2008, $2,774,419 and $43,303,425, respectively, or if determined to be different, the qualified interest income and qualified short-term gains of such year.
33
Trustees and Officers (Unaudited)
The following tables list the Trust's Trustees and Officers as of the date of this report; their address and date of birth ("DOB"); their position with the Trust; the length of time holding that position with the Trust; their principal occupation(s) during the past five years; the number of portfolios in the fund complex they oversee; and other directorships they hold in companies subject to registration or reporting requirements of the Securities Exchange Act of 1934 (generally called "public companies") or in registered investment companies. The Trust's Statement of Additional Information ("SAI") includes additional information about the Trust's trustees, including changes subsequent to the date of the report. The SAI is available, without charge, upon request by writing GMO, c/o GMO Trust, 40 Rowes Wharf, Boston, MA 02110.
Independent Trustees:
| Name, Address, and DOB | Position(s) Held with Trust | Term of Office1 and Length of Time Served | Principal Occupation(s) During Past Five Years | Number of Portfolios in Fund Complex Overseen by Trustee | Other Directorships Held by Trustee | ||||||||||||||||||
| Donald W. Glazer, Esq. c/o GMO Trust 40 Rowes Wharf Boston, MA 02110 DOB: 07/26/1944 | Chairman of the Board of Trustees | Chairman of the Board of Trustees since March 2005; Lead Independent Trustee (September 2004 – March 2005); Trustee since December 2000. | Consultant – Law and Business2; Vice Chair (since 2002) and Secretary, Provant, Inc. (provider of personnel performance improvement services and training products); Author of Legal Treatises. | 47 | None. | ||||||||||||||||||
1 Each Trustee is elected to serve during the continued lifetime of the Trust until he/she dies, resigns or is removed, or if sooner, until the next meeting of Shareholders called for the purpose of electing Trustees and until the election and qualification of his/her successor.
2 As part of Mr. Glazer's work as a consultant, he provides part-time consulting services to Goodwin Procter LLP ("Goodwin"). Goodwin has provided legal services to Renewable Resources, LLC, an affiliate of GMO; GMO, in connection with its relationship with Renewable Resources; and funds managed by Renewable Resources. Mr. Glazer has represented that he has no financial interest in, and is not involved in the provision of, such legal services. In the calendar years ended December 31, 2006 and December 31, 2007, these entities paid $825,738 and $291,721 respectively, in legal fees and disbursements to Goodwin.
34
Independent Trustees — (Continued)
| Name, Address, and DOB | Position(s) Held with Trust | Term of Office1 and Length of Time Served | Principal Occupation(s) During Past Five Years | Number of Portfolios in Fund Complex Overseen by Trustee | Other Directorships Held by Trustee | ||||||||||||||||||
| Jay O. Light c/o GMO Trust 40 Rowes Wharf Boston, MA 02110 DOB: 10/03/1941 | Trustee | Since May 1996. | Dean (since April 2006), Acting Dean (August 2005 – April 2006), Senior Associate Dean (1998 – 2005), and Professor of Business Administration, Harvard Business School. | 47 | Director of Harvard Management Company, Inc.3 and Verde, Inc.; Director of Partners HealthCare System, Inc. and Chair of its Investment Committee.4 | ||||||||||||||||||
| W. Nicholas Thorndike c/o GMO Trust 40 Rowes Wharf Boston, MA 02110 DOB: 03/28/1933 | Trustee | Since March 2005 | Director or trustee of various corporations and charitable organizations, including Courier Corporation (a book publisher and manufacturer) (July 1989 – present); Putnam Funds (December 1992 – June 2004); and Providence Journal (a newspaper publisher) (December 1986 – December 2003). | 47 | Director of Courier Corporation (a book publisher and manufacturer); Member of the Investment Committee of Partners HealthCare System, Inc.4 | ||||||||||||||||||
1 Each Trustee is elected to serve during the continued lifetime of the Trust until he/she dies, resigns or is removed, or if sooner, until the next meeting of Shareholders called for the purpose of electing Trustees and until the election and qualification of his/her successor.
3 Harvard Management Company, Inc. is a client of the Manager.
4 Partners HealthCare System, Inc. is a client of the Manager.
35
Principal Officers:
| Name, Address, and DOB | Position(s) Held with Trust | Term of Office5 and Length of Time Served | Principal Occupation(s) During Past Five Years | ||||||||||||
| Scott Eston c/o GMO Trust 40 Rowes Wharf Boston, MA 02110 DOB: 01/20/1956 | President and Chief Executive Officer | President and Chief Executive Officer since October 2002; Chief Financial Officer, November 2006 – February 2007. | Chief Financial Officer, Chief Operating Officer and Member, Grantham, Mayo, Van Otterloo & Co. LLC. | ||||||||||||
| Sheppard N. Burnett c/o GMO Trust 40 Rowes Wharf Boston, MA 02110 DOB: 10/24/1968 | Treasurer and Chief Financial Officer | Chief Financial Officer since March 2007; Treasurer since November 2006; Assistant Treasurer, September 2004 – November 2006. | Fund Administration Staff, Grantham, Mayo, Van Otterloo & Co. LLC (June 2004 – present); Vice President, Director of Tax, Columbia Management Group (2002 – 2004). | ||||||||||||
| Brent C. Arvidson c/o GMO Trust 40 Rowes Wharf Boston, MA 02110 DOB: 06/26/1969 | Assistant Treasurer | Since August 1998. | Senior Fund Administrator, Grantham, Mayo, Van Otterloo & Co. LLC. | ||||||||||||
| John L. Nasrah c/o GMO Trust 40 Rowes Wharf Boston, MA 02110 DOB: 05/27/1977 | Assistant Treasurer | Since March 2007. | Fund Administrator, Grantham, Mayo, Van Otterloo & Co. LLC (September 2004 – present); Tax Analyst, Bain & Company, Inc (June 2003 – September 2004); Senior Tax Associate, PricewaterhouseCoopers LLP (2001 – 2003). | ||||||||||||
| Mahmoodur Rahman c/o GMO Trust 40 Rowes Wharf Boston, MA 02110 DOB: 11/30/1967 | Assistant Treasurer | Since September 2007. | Fund Administrator, Grantham, Mayo, Van Otterloo & Co. (April 2007 – present); Vice President and Senior Tax Manager, Massachusetts Financial Services Company (January 2000 – April 2007). | ||||||||||||
5 Officers are elected to hold such office until their successor is elected and qualified to carry out the duties and responsibilities of their office, or until he or she resigns or is removed from office.
36
Principal Officers — (Continued)
| Name, Address, and DOB | Position(s) Held with Trust | Term of Office5 and Length of Time Served | Principal Occupation(s) During Past Five Years | ||||||||||||
| Michael E. Gillespie c/o GMO Trust 40 Rowes Wharf Boston, MA 02110 DOB: 02/18/1958 | Chief Compliance Officer | Since March 2005. | Vice President of Compliance (June 2004 – February 2005) and Director of Domestic Compliance (March 2002 – June 2004), Fidelity Investments; Vice President and Senior Counsel, State Street Bank and Trust Company (May 1998 – March 2002). | ||||||||||||
| Jason B. Harrison c/o GMO Trust 40 Rowes Wharf Boston, MA 02110 DOB: 01/29/1977 | Vice President and Clerk | Vice President since November 2006; Clerk since March 2006. | Legal Counsel, Grantham, Mayo, Van Otterloo & Co. LLC (since February 2006) and Attorney, Ropes & Gray LLP (September 2002 – February 2006). | ||||||||||||
| David L. Bohan c/o GMO Trust 40 Rowes Wharf Boston, MA 02110 DOB: 06/21/1964 | Vice President and Assistant Clerk | Vice President since March 2005; Assistant Clerk since March 2006. | Legal Counsel, Grantham, Mayo, Van Otterloo & Co. LLC (September 2003 – present); Attorney, Goodwin Procter LLP (September 1996 – September 2003). | ||||||||||||
| Gregory L. Pottle c/o GMO Trust 40 Rowes Wharf Boston, MA 02110 DOB: 07/09/1971 | Vice President and Assistant Clerk | Since November 2006. | Legal Counsel, Grantham, Mayo, Van Otterloo & Co. LLC. | ||||||||||||
| Anne K. Trinque c/o GMO Trust 40 Rowes Wharf Boston, MA 02110 DOB: 04/15/1978 | Vice President and Assistant Clerk | Since September 2007. | Legal Counsel, Grantham, Mayo, Van Otterloo & Co. LLC (since January 2007); Attorney, Goodwin Procter LLP (September 2003 – January 2007). | ||||||||||||
| Cheryl Wakeham c/o GMO Trust 40 Rowes Wharf Boston, MA 02110 DOB: 10/29/1958 | Anti-Money Laundering Officer | Since December 2004. | Manager, Client Service Administration, Grantham, Mayo, Van Otterloo & Co. LLC. | ||||||||||||
5 Officers are elected to hold such office until their successor is elected and qualified to carry out the duties and responsibilities of their office, or until he or she resigns or is removed from office.
37
GMO U.S. Intrinsic Value Fund
(A Series of GMO Trust)
Annual Report
February 29, 2008
For a free copy of the Fund's proxy voting guidelines, shareholders may call 1-617-346-7646 (collect), visit our website at www.gmo.com, or visit the Securities and Exchange Commission's website at www.sec.gov. Information regarding how the Fund voted proxies relating to portfolio securities during the most recent 12-month period ended June 30 is available on our website at www.gmo.com, or on the Securities and Exchange Commission's website at www.sec.gov.
The Fund files its complete schedule of portfolio holdings with the Securities and Exchange Commission for the first and third quarter of each fiscal year on Form N-Q, which is available on the Commission's website at www.sec.gov. The Fund's Form N-Q may be reviewed and copied at the Commission's Public Reference Room in Washington, D.C. Information on the operation of the Public Reference Room may be obtained by calling 1-800-SEC-0330. The Fund has a policy with respect to disclosure of portfolio holdings under which it may also make available on GMO's website (www.gmo.com) a complete schedule of portfolio holdings.
This report is prepared for the general information of shareholders. It is authorized for distribution to prospective investors only when preceded or accompanied by a prospectus for the GMO Trust.
GMO U.S. Intrinsic Value Fund
(A Series of GMO Trust)
Portfolio Management
Day-to-day management of the Fund's portfolio is the responsibility of the U.S. Quantitative team at Grantham, Mayo, Van Otterloo & Co. LLC.
Management Discussion and Analysis of Fund Performance
The GMO U.S. Intrinsic Value Fund returned -11.9% for the fiscal year ended February 29, 2008, as compared to -7.9% for the Russell 1000 Value Index. The Fund was invested substantially in U.S. equity securities throughout the period.
Stock selection detracted from returns relative to the Russell 1000 Value Index. Selections in Information Technology, Telecommunication Services, and Utilities added to relative returns while selections in Financials, Consumer Discretionary, and Energy detracted. Overweight positions in Exxon Mobil and Merck and an underweight in Wachovia were among the individual names adding to relative returns. Overweight positions in Citigroup, Fannie Mae, and National City Corp. were among the detractors.
Sector selection detracted slightly from returns relative to the Russell 1000 Value Index. Sector weightings positively impacting relative performance included underweight positions in Financials and Telecommunication Services and an overweight in Health Care. Sector weightings negatively impacting relative performance included overweight positions in Consumer Discretionary and Information Technology and an underweight in Industrials.
The views expressed herein are exclusively those of Grantham, Mayo, Van Otterloo & Co. LLC Management as of the date of this report and are subject to change. GMO disclaims any responsibility to update such views. They are not meant as investment advice. References to specific securities are not recommendations of such securities and may not be representative of any GMO portfolio's current or future investments.
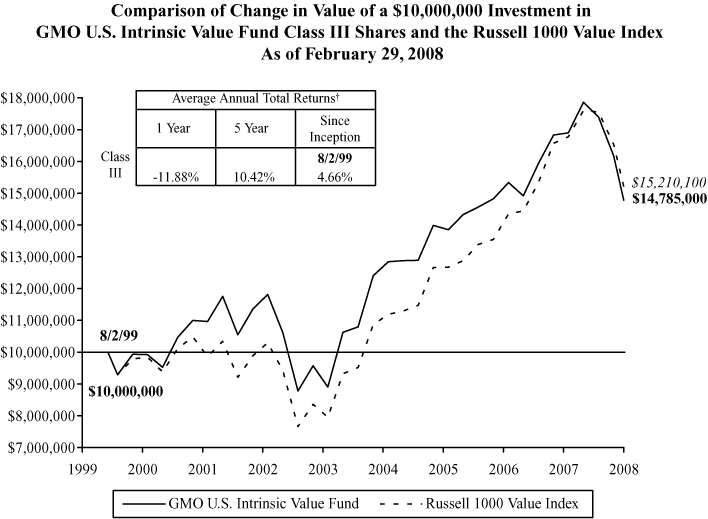
Performance data quoted represents past performance and is not indicative of future results. The investment return and principal value of an investment will fluctuate so that an investor's shares, when redeemed, may be worth more or less than their original cost. Current performance data may be lower or higher than the performance data provided herein. To obtain performance information to the most recent month-end, visit www.gmo.com. Performance shown is net of all fees after reimbursement from the Manager. Returns would have been lower had certain expenses not been reimbursed during the periods shown and do not include the effect of taxes on distributions and redemptions. All information is unaudited.
† The Fund is the successor to the GMO Intrinsic Value Fund, therefore, performance for the periods prior to September 16, 2005 is that of GMO Intrinsic Value Fund.
GMO U.S. Intrinsic Value Fund
(A Series of GMO Trust)
Investments Concentration Summary
February 29, 2008 (Unaudited)
| Asset Class Summary | % of Total Net Assets | ||||||
| Common Stocks | 96.6 | % | |||||
| Short-Term Investments | 3.3 | ||||||
| Rights and Warrants | 0.0 | ||||||
| Futures | (0.2 | ) | |||||
| Other | 0.3 | ||||||
| 100.0 | % | ||||||
| Industry Sector Summary | % of Equity Investments | ||||||
| Energy | 22.6 | % | |||||
| Health Care | 17.4 | ||||||
| Financials | 15.7 | ||||||
| Consumer Staples | 10.8 | ||||||
| Consumer Discretionary | 10.6 | ||||||
| Information Technology | 9.6 | ||||||
| Industrials | 8.2 | ||||||
| Telecommunication Services | 2.0 | ||||||
| Utilities | 1.7 | ||||||
| Materials | 1.4 | ||||||
| 100.0 | % | ||||||
1
GMO U.S. Intrinsic Value Fund
(A Series of GMO Trust)
Schedule of Investments
(showing percentage of total net assets)
February 29, 2008
| Shares | Description | Value ($) | |||||||||||||
| COMMON STOCKS — 96.6% | |||||||||||||||
| Consumer Discretionary — 10.3% | |||||||||||||||
| 500 | Abercrombie & Fitch Co. – Class A | 38,765 | |||||||||||||
| 600 | Advance Auto Parts, Inc. | 20,124 | |||||||||||||
| 500 | American Eagle Outfitters, Inc. | 10,685 | |||||||||||||
| 500 | Apollo Group, Inc. – Class A * | 30,690 | |||||||||||||
| 100 | Autoliv, Inc. | 4,990 | |||||||||||||
| 3,100 | AutoNation, Inc. * | 45,167 | |||||||||||||
| 300 | AutoZone, Inc. * | 34,524 | |||||||||||||
| 1,500 | Bed Bath & Beyond, Inc. * | 42,510 | |||||||||||||
| 300 | Best Buy Co., Inc. | 12,903 | |||||||||||||
| 400 | BorgWarner, Inc. | 17,244 | |||||||||||||
| 600 | Brunswick Corp. | 9,774 | |||||||||||||
| 1,300 | Career Education Corp. * | 19,305 | |||||||||||||
| 900 | Centex Corp. | 19,971 | |||||||||||||
| 1,300 | Coach, Inc. * | 39,416 | |||||||||||||
| 2,400 | D.R. Horton, Inc. | 33,672 | |||||||||||||
| 1,100 | Discovery Holding Co. – Class A * | 24,827 | |||||||||||||
| 1,500 | Dollar Tree Stores, Inc. * | 40,245 | |||||||||||||
| 1,000 | Expedia, Inc. * | 22,930 | |||||||||||||
| 1,400 | Family Dollar Stores, Inc. | 26,810 | |||||||||||||
| 17,554 | Ford Motor Co. * | 114,628 | |||||||||||||
| 3,400 | Gannett Co., Inc. | 102,510 | |||||||||||||
| 2,300 | General Motors Corp. | 53,544 | |||||||||||||
| 1,200 | Harley-Davidson, Inc. | 44,592 | |||||||||||||
| 900 | Hasbro, Inc. | 23,193 | |||||||||||||
| 26,700 | Home Depot, Inc. | 708,885 | |||||||||||||
| 500 | ITT Educational Services, Inc. * | 27,610 | |||||||||||||
| 3,700 | Johnson Controls, Inc. | 121,582 | |||||||||||||
| 200 | Jones Apparel Group, Inc. | 2,822 | |||||||||||||
| 600 | KB Home | 14,358 | |||||||||||||
| 1,700 | Kohl's Corp. * | 75,548 | |||||||||||||
| 1,300 | Lennar Corp. – Class A | 24,193 | |||||||||||||
| 700 | Liberty Global, Inc. – Class A * | 26,320 | |||||||||||||
See accompanying notes to the financial statements.
2
GMO U.S. Intrinsic Value Fund
(A Series of GMO Trust)
Schedule of Investments — (Continued)
(showing percentage of total net assets)
February 29, 2008
| Shares | Description | Value ($) | |||||||||||||
| Consumer Discretionary — continued | |||||||||||||||
| 1,700 | Liz Claiborne, Inc. | 30,226 | |||||||||||||
| 16,900 | Lowe's Cos., Inc. | 405,093 | |||||||||||||
| 1,300 | Mattel Co. | 25,116 | |||||||||||||
| 3,300 | McDonald's Corp. | 178,563 | |||||||||||||
| 400 | McGraw-Hill Cos., Inc. | 16,372 | |||||||||||||
| 431 | MDC Holdings, Inc. | 18,050 | |||||||||||||
| 400 | Mohawk Industries, Inc. * | 28,564 | |||||||||||||
| 600 | Nike, Inc. – Class B | 36,120 | |||||||||||||
| 1,600 | Office Depot, Inc. * | 18,192 | |||||||||||||
| 1,000 | O'Reilly Automotive, Inc. * | 26,960 | |||||||||||||
| 800 | Penske Auto Group, Inc. | 14,432 | |||||||||||||
| 3,200 | Staples, Inc. | 71,200 | |||||||||||||
| 3,800 | Target Corp. | 199,918 | |||||||||||||
| 400 | Tiffany & Co. | 15,056 | |||||||||||||
| 1,400 | Toll Brothers, Inc. * | 29,694 | |||||||||||||
| 900 | TRW Automotive Holdings Corp. * | 19,872 | |||||||||||||
| 600 | VF Corp. | 45,624 | |||||||||||||
| Total Consumer Discretionary | 3,013,389 | ||||||||||||||
| Consumer Staples — 10.4% | |||||||||||||||
| 400 | Alberto-Culver Co. | 10,720 | |||||||||||||
| 5,500 | Altria Group, Inc. | 402,270 | |||||||||||||
| 800 | Anheuser-Busch Cos., Inc. | 37,672 | |||||||||||||
| 600 | BJ's Wholesale Club, Inc. * | 18,936 | |||||||||||||
| 500 | Coca Cola Enterprises, Inc. | 12,215 | |||||||||||||
| 10,100 | Coca-Cola Co. (The) | 590,446 | |||||||||||||
| 500 | Colgate-Palmolive Co. | 38,045 | |||||||||||||
| 300 | Costco Wholesale Corp. | 18,576 | |||||||||||||
| 1,500 | CVS Caremark Corp. | 60,570 | |||||||||||||
| 300 | Energizer Holdings, Inc. * | 27,849 | |||||||||||||
| 600 | Kimberly-Clark Corp. | 39,108 | |||||||||||||
| 1,907 | Kraft Foods, Inc. | 59,441 | |||||||||||||
| 1,600 | Kroger Co. | 38,800 | |||||||||||||
| 600 | PepsiAmericas, Inc. | 15,180 | |||||||||||||
| 4,200 | PepsiCo, Inc. | 292,152 | |||||||||||||
See accompanying notes to the financial statements.
3
GMO U.S. Intrinsic Value Fund
(A Series of GMO Trust)
Schedule of Investments — (Continued)
(showing percentage of total net assets)
February 29, 2008
| Shares | Description | Value ($) | |||||||||||||
| Consumer Staples — continued | |||||||||||||||
| 600 | Pilgrim's Pride Corp. | 14,076 | |||||||||||||
| 3,000 | Procter & Gamble Co. (The) | 198,540 | |||||||||||||
| 1,675 | Supervalu, Inc. | 43,969 | |||||||||||||
| 3,124 | Tyson Foods, Inc. – Class A | 45,017 | |||||||||||||
| 2,300 | Walgreen Co. | 83,973 | |||||||||||||
| 20,300 | Wal-Mart Stores, Inc. | 1,006,677 | |||||||||||||
| Total Consumer Staples | 3,054,232 | ||||||||||||||
| Energy — 21.8% | |||||||||||||||
| 1,800 | Anadarko Petroleum Corp. | 114,732 | |||||||||||||
| 1,700 | Apache Corp. | 195,007 | |||||||||||||
| 19,300 | Chevron Corp. | 1,672,538 | |||||||||||||
| 300 | Cimarex Energy Co. | 15,810 | |||||||||||||
| 12,329 | ConocoPhillips | 1,019,732 | |||||||||||||
| 700 | Devon Energy Corp. | 71,904 | |||||||||||||
| 26,700 | Exxon Mobil Corp. | 2,323,167 | |||||||||||||
| 300 | Forest Oil Corp. * | 14,799 | |||||||||||||
| 300 | Helix Energy Solutions Group, Inc. * | 10,566 | |||||||||||||
| 700 | Helmerich & Payne, Inc. | 31,381 | |||||||||||||
| 800 | Hess Corp. | 74,544 | |||||||||||||
| 400 | Murphy Oil Corp. | 32,152 | |||||||||||||
| 200 | Noble Corp. | 9,830 | |||||||||||||
| 5,000 | Occidental Petroleum Corp. | 386,850 | |||||||||||||
| 200 | Overseas Shipholding Group, Inc. | 12,544 | |||||||||||||
| 600 | Patterson-UTI Energy, Inc. | 14,238 | |||||||||||||
| 300 | Rowan Cos., Inc. | 12,093 | |||||||||||||
| 500 | Sunoco, Inc. | 30,540 | |||||||||||||
| 500 | Tidewater, Inc. | 28,075 | |||||||||||||
| 300 | Unit Corp. * | 16,545 | |||||||||||||
| 5,000 | Valero Energy Corp. | 288,850 | |||||||||||||
| 600 | Weatherford International Ltd. * | 41,352 | |||||||||||||
| Total Energy | 6,417,249 | ||||||||||||||
See accompanying notes to the financial statements.
4
GMO U.S. Intrinsic Value Fund
(A Series of GMO Trust)
Schedule of Investments — (Continued)
(showing percentage of total net assets)
February 29, 2008
| Shares | Description | Value ($) | |||||||||||||
| Financials — 15.2% | |||||||||||||||
| 1,600 | ACE Ltd. | 89,984 | |||||||||||||
| 2,000 | Aflac, Inc. | 124,820 | |||||||||||||
| 8,100 | Allstate Corp. (The) | 386,613 | |||||||||||||
| 1,000 | AMBAC Financial Group, Inc. | 11,140 | |||||||||||||
| 9,900 | American International Group, Inc. | 463,914 | |||||||||||||
| 1,500 | Annaly Capital Management, Inc. | 31,035 | |||||||||||||
| 1,400 | AON Corp. | 58,254 | |||||||||||||
| 12,876 | Bank of America Corp. | 511,692 | |||||||||||||
| 2,100 | BB&T Corp. | 65,373 | |||||||||||||
| 300 | Capital One Financial Corp. | 13,809 | |||||||||||||
| 2,000 | Chubb Corp. | 101,800 | |||||||||||||
| 34,700 | Citigroup, Inc. | 822,737 | |||||||||||||
| 600 | CNA Financial Corp. | 15,990 | |||||||||||||
| 1,600 | Comerica, Inc. | 57,984 | |||||||||||||
| 900 | Commerce Group, Inc. | 32,616 | |||||||||||||
| 1,600 | Countrywide Financial Corp. | 10,096 | |||||||||||||
| 300 | Endurance Specialty Holdings Ltd. | 11,790 | |||||||||||||
| 100 | Everest Re Group Ltd. | 9,688 | |||||||||||||
| 11,400 | Fannie Mae | 315,210 | |||||||||||||
| 900 | Fidelity National Title Group, Inc. – Class A | 15,849 | |||||||||||||
| 1,000 | Fifth Third Bancorp | 22,900 | |||||||||||||
| 800 | First American Corp. | 27,864 | |||||||||||||
| 1,200 | First Horizon National Corp. | 19,488 | |||||||||||||
| 600 | Freddie Mac | 15,108 | |||||||||||||
| 900 | Hartford Financial Services Group, Inc. | 62,910 | |||||||||||||
| 400 | HCC Insurance Holdings, Inc. | 9,624 | |||||||||||||
| 600 | Janus Capital Group, Inc. | 14,532 | |||||||||||||
| 500 | KeyCorp | 11,025 | |||||||||||||
| 600 | Leucadia National Corp. | 27,156 | |||||||||||||
| 1,200 | MBIA, Inc. | 15,564 | |||||||||||||
| 1,200 | MGIC Investment Corp. | 17,772 | |||||||||||||
| 5,172 | National City Corp. | 82,028 | |||||||||||||
| 2,575 | Old Republic International Corp. | 35,329 | |||||||||||||
See accompanying notes to the financial statements.
5
GMO U.S. Intrinsic Value Fund
(A Series of GMO Trust)
Schedule of Investments — (Continued)
(showing percentage of total net assets)
February 29, 2008
| Shares | Description | Value ($) | |||||||||||||
| Financials — continued | |||||||||||||||
| 1,600 | Popular, Inc. | 17,664 | |||||||||||||
| 4,400 | Progressive Corp. (The) | 80,652 | |||||||||||||
| 800 | Protective Life Corp. | 30,872 | |||||||||||||
| 1,300 | Prudential Financial, Inc. | 94,861 | |||||||||||||
| 300 | Reinsurance Group of America, Inc. | 16,413 | |||||||||||||
| 700 | Safeco Corp. | 32,382 | |||||||||||||
| 600 | SLM Corp. | 11,766 | |||||||||||||
| 400 | T. Rowe Price Group, Inc. | 20,212 | |||||||||||||
| 1,100 | Thornburg Mortgage, Inc. REIT | 9,790 | |||||||||||||
| 900 | Torchmark Corp. | 54,234 | |||||||||||||
| 5,300 | Travelers Cos. (The), Inc. | 245,973 | |||||||||||||
| 800 | UnionBanCal Corp. | 37,256 | |||||||||||||
| 2,900 | Unum Group | 66,439 | |||||||||||||
| 4,600 | US Bancorp | 147,292 | |||||||||||||
| 800 | W.R. Berkley Corp. | 23,032 | |||||||||||||
| 3,684 | Washington Mutual, Inc. | 54,523 | |||||||||||||
| Total Financials | 4,455,055 | ||||||||||||||
| Health Care — 16.8% | |||||||||||||||
| 2,200 | Abbott Laboratories | 117,810 | |||||||||||||
| 2,300 | Aetna, Inc. | 114,080 | |||||||||||||
| 2,700 | AmerisourceBergen Corp. | 112,644 | |||||||||||||
| 1,000 | Amgen, Inc. * | 45,520 | |||||||||||||
| 1,200 | Biogen Idec, Inc. * | 70,032 | |||||||||||||
| 1,200 | Bristol-Myers Squibb Co. | 27,132 | |||||||||||||
| 2,000 | Cardinal Health, Inc. | 118,280 | |||||||||||||
| 400 | Charles River Laboratories International, Inc. * | 23,432 | |||||||||||||
| 1,200 | Cigna Corp. | 53,496 | |||||||||||||
| 1,400 | Coventry Health Care, Inc. * | 72,618 | |||||||||||||
| 1,700 | Eli Lilly & Co. | 85,034 | |||||||||||||
| 1,700 | Express Scripts, Inc. * | 100,470 | |||||||||||||
| 2,000 | Forest Laboratories, Inc. * | 79,540 | |||||||||||||
| 900 | Gilead Sciences, Inc. * | 42,588 | |||||||||||||
See accompanying notes to the financial statements.
6
GMO U.S. Intrinsic Value Fund
(A Series of GMO Trust)
Schedule of Investments — (Continued)
(showing percentage of total net assets)
February 29, 2008
| Shares | Description | Value ($) | |||||||||||||
| Health Care — continued | |||||||||||||||
| 200 | Invitrogen Corp. * | 16,898 | |||||||||||||
| 8,500 | Johnson & Johnson | 526,660 | |||||||||||||
| 1,900 | King Pharmaceuticals, Inc. * | 20,140 | |||||||||||||
| 4,600 | McKesson Corp. | 270,296 | |||||||||||||
| 3,200 | Medco Health Solutions, Inc. * | 141,792 | |||||||||||||
| 1,600 | Medtronic, Inc. | 78,976 | |||||||||||||
| 13,300 | Merck & Co., Inc. | 589,190 | |||||||||||||
| 400 | Patterson Cos., Inc. * | 14,080 | |||||||||||||
| 600 | PerkinElmer, Inc. | 14,892 | |||||||||||||
| 38,900 | Pfizer, Inc. | 866,692 | |||||||||||||
| 800 | Quest Diagnostics, Inc. | 38,136 | |||||||||||||
| 1,900 | Stryker Corp. | 123,709 | |||||||||||||
| 14,200 | UnitedHealth Group, Inc. | 660,016 | |||||||||||||
| 800 | Watson Pharmaceuticals, Inc. * | 22,248 | |||||||||||||
| 3,100 | WellPoint, Inc. * | 217,248 | |||||||||||||
| 1,700 | Wyeth | 74,154 | |||||||||||||
| 2,500 | Zimmer Holdings, Inc. * | 188,225 | |||||||||||||
| Total Health Care | 4,926,028 | ||||||||||||||
| Industrials — 7.9% | |||||||||||||||
| 2,600 | 3M Co. | 203,840 | |||||||||||||
| 400 | AGCO Corp. * | 25,944 | |||||||||||||
| 200 | Alliant Techsystems, Inc. * | 20,988 | |||||||||||||
| 1,700 | Avis Budget Group, Inc. * | 19,431 | |||||||||||||
| 600 | Cummins, Inc. | 30,228 | |||||||||||||
| 1,200 | Danaher Corp. | 88,980 | |||||||||||||
| 2,600 | Deere & Co. | 221,546 | |||||||||||||
| 400 | Eaton Corp. | 32,252 | |||||||||||||
| 700 | FedEx Corp. | 61,691 | |||||||||||||
| 800 | General Dynamics Corp. | 65,480 | |||||||||||||
| 15,100 | General Electric Co. | 500,414 | |||||||||||||
| 200 | Goodrich Corp. | 11,846 | |||||||||||||
| 1,500 | Honeywell International, Inc. | 86,310 | |||||||||||||
See accompanying notes to the financial statements.
7
GMO U.S. Intrinsic Value Fund
(A Series of GMO Trust)
Schedule of Investments — (Continued)
(showing percentage of total net assets)
February 29, 2008
| Shares | Description | Value ($) | |||||||||||||
| Industrials — continued | |||||||||||||||
| 400 | Illinois Tool Works, Inc. | 19,628 | |||||||||||||
| 1,200 | Ingersoll-Rand | 50,232 | |||||||||||||
| 400 | ITT Industries, Inc. | 22,496 | |||||||||||||
| 400 | Kennametal, Inc. | 12,148 | |||||||||||||
| 800 | L-3 Communications Holdings, Inc. | 85,032 | |||||||||||||
| 400 | Lennox International, Inc. | 15,056 | |||||||||||||
| 1,200 | Masco Corp. | 22,428 | |||||||||||||
| 500 | Northrop Grumman Corp. | 39,305 | |||||||||||||
| 2,300 | Paccar, Inc. | 99,774 | |||||||||||||
| 700 | Pall Corp. | 27,559 | |||||||||||||
| 1,150 | Parker-Hannifin Corp. | 74,324 | |||||||||||||
| 400 | Pentair, Inc. | 13,048 | |||||||||||||
| 1,100 | Quanta Services, Inc. * | 26,268 | |||||||||||||
| 400 | Rockwell Collins, Inc. | 23,560 | |||||||||||||
| 700 | RR Donnelley & Sons Co. | 22,281 | |||||||||||||
| 300 | Shaw Group (The), Inc. * | 19,314 | |||||||||||||
| 200 | SPX Corp. | 20,460 | |||||||||||||
| 200 | Teleflex, Inc. | 11,310 | |||||||||||||
| 300 | Thomas & Betts Corp. * | 12,045 | |||||||||||||
| 400 | Trane, Inc. | 18,020 | |||||||||||||
| 1,475 | Tyco International Ltd. | 59,088 | |||||||||||||
| 600 | Union Pacific Corp. | 74,856 | |||||||||||||
| 500 | United Parcel Service, Inc. – Class B | 35,120 | |||||||||||||
| 700 | United Rentals, Inc. * | 14,070 | |||||||||||||
| 1,500 | United Technologies Corp. | 105,765 | |||||||||||||
| 200 | URS Corp. * | 8,056 | |||||||||||||
| 200 | W.W. Grainger, Inc. | 14,732 | |||||||||||||
| 400 | YRC Worldwide, Inc. * | 5,504 | |||||||||||||
| Total Industrials | 2,320,429 | ||||||||||||||
| Information Technology — 9.2% | |||||||||||||||
| 700 | ADC Telecommunications, Inc. * | 9,569 | |||||||||||||
| 600 | Affiliated Computer Services, Inc. – Class A * | 30,450 | |||||||||||||
See accompanying notes to the financial statements.
8
GMO U.S. Intrinsic Value Fund
(A Series of GMO Trust)
Schedule of Investments — (Continued)
(showing percentage of total net assets)
February 29, 2008
| Shares | Description | Value ($) | |||||||||||||
| Information Technology — continued | |||||||||||||||
| 500 | Arrow Electronics, Inc. * | 16,305 | |||||||||||||
| 700 | Avnet, Inc. * | 23,597 | |||||||||||||
| 1,700 | CA, Inc. | 38,896 | |||||||||||||
| 700 | Cadence Design Systems, Inc. * | 7,434 | |||||||||||||
| 14,500 | Cisco Systems, Inc. * | 353,365 | |||||||||||||
| 2,300 | Compuware Corp. * | 18,308 | |||||||||||||
| 400 | Cypress Semiconductor Corp. * | 8,696 | |||||||||||||
| 9,000 | Dell, Inc. * | 178,650 | |||||||||||||
| 4,400 | eBay, Inc. * | 115,984 | |||||||||||||
| 8,900 | EMC Corp. * | 138,306 | |||||||||||||
| 200 | Factset Research Systems, Inc. | 10,528 | |||||||||||||
| 1,400 | Fiserv, Inc. * | 73,668 | |||||||||||||
| 600 | Foundry Networks, Inc. * | 7,122 | |||||||||||||
| 100 | Google, Inc. – Class A * | 47,118 | |||||||||||||
| 300 | Hewitt Associates, Inc. – Class A * | 11,838 | |||||||||||||
| 1,300 | Hewlett-Packard Co. | 62,101 | |||||||||||||
| 1,700 | Ingram Micro, Inc. – Class A * | 25,959 | |||||||||||||
| 2,400 | Intel Corp. | 47,880 | |||||||||||||
| 2,000 | International Business Machines Corp. | 227,720 | |||||||||||||
| 900 | Intersil Corp. – Class A | 20,943 | |||||||||||||
| 600 | Intuit, Inc. * | 15,936 | |||||||||||||
| 1,200 | Juniper Networks, Inc. * | 32,184 | |||||||||||||
| 500 | KLA-Tencor Corp. | 21,005 | |||||||||||||
| 500 | Lexmark International, Inc. * | 16,515 | |||||||||||||
| 700 | McAfee, Inc. * | 23,289 | |||||||||||||
| 19,100 | Microsoft Corp. | 519,902 | |||||||||||||
| 700 | NCR Corp. * | 15,512 | |||||||||||||
| 1,800 | Novell, Inc. * | 13,410 | |||||||||||||
| 7,800 | Oracle Corp. * | 146,640 | |||||||||||||
| 6,100 | Qualcomm, Inc. | 258,457 | |||||||||||||
| 300 | Silicon Laboratories, Inc. * | 9,285 | |||||||||||||
| 800 | Synopsys, Inc. * | 18,568 | |||||||||||||
| 1,000 | Tech Data Corp. * | 33,350 | |||||||||||||
| 1,000 | Teradyne, Inc. * | 11,990 | |||||||||||||
See accompanying notes to the financial statements.
9
GMO U.S. Intrinsic Value Fund
(A Series of GMO Trust)
Schedule of Investments — (Continued)
(showing percentage of total net assets)
February 29, 2008
| Shares | Description | Value ($) | |||||||||||||
| Information Technology — continued | |||||||||||||||
| 1,600 | VeriSign, Inc. * | 55,680 | |||||||||||||
| 1,400 | Western Digital Corp. * | 43,218 | |||||||||||||
| Total Information Technology | 2,709,378 | ||||||||||||||
| Materials — 1.4% | |||||||||||||||
| 500 | Air Products & Chemicals, Inc. | 45,665 | |||||||||||||
| 2,800 | Alcoa, Inc. | 103,992 | |||||||||||||
| 600 | AptarGroup, Inc. | 22,488 | |||||||||||||
| 600 | Cabot Corp. | 16,440 | |||||||||||||
| 300 | Celanese Corp. – Class A | 11,670 | |||||||||||||
| 200 | Cytec Industries, Inc. | 11,456 | |||||||||||||
| 1,600 | Dow Chemical Co. (The) | 60,304 | |||||||||||||
| 400 | FMC Corp. | 22,644 | |||||||||||||
| 500 | Lubrizol Corp. | 29,150 | |||||||||||||
| 400 | Reliance Steel & Aluminum Co. | 22,204 | |||||||||||||
| 1,100 | Smurfit-Stone Container Corp. * | 8,745 | |||||||||||||
| 200 | Temple-Inland, Inc. | 2,746 | |||||||||||||
| 900 | Weyerhaeuser Co. | 55,080 | |||||||||||||
| Total Materials | 412,584 | ||||||||||||||
| Telecommunication Services — 2.0% | |||||||||||||||
| 4,858 | AT&T, Inc. | 169,204 | |||||||||||||
| 1,600 | Sprint Corp. | 11,376 | |||||||||||||
| 11,252 | Verizon Communications, Inc. | 408,673 | |||||||||||||
| Total Telecommunication Services | 589,253 | ||||||||||||||
| Utilities — 1.6% | |||||||||||||||
| 1,000 | American Electric Power Co., Inc. | 40,920 | |||||||||||||
| 500 | Constellation Energy Group, Inc. | 44,175 | |||||||||||||
| 1,200 | Edison International | 59,280 | |||||||||||||
| 500 | Entergy Corp. | 51,370 | |||||||||||||
| 900 | FPL Group, Inc. | 54,261 | |||||||||||||
| 600 | Mirant Corp. * | 22,200 | |||||||||||||
See accompanying notes to the financial statements.
10
GMO U.S. Intrinsic Value Fund
(A Series of GMO Trust)
Schedule of Investments — (Continued)
(showing percentage of total net assets)
February 29, 2008
| Shares / Par Value ($) | Description | Value ($) | |||||||||||||
| Utilities — continued | |||||||||||||||
| 900 | NRG Energy, Inc. * | 37,143 | |||||||||||||
| 500 | PPL Corp. | 22,690 | |||||||||||||
| 2,200 | Public Service Enterprise Group, Inc. | 97,020 | |||||||||||||
| 1,800 | Reliant Energy, Inc. * | 41,040 | |||||||||||||
| Total Utilities | 470,099 | ||||||||||||||
| TOTAL COMMON STOCKS (COST $31,866,346) | 28,367,696 | ||||||||||||||
| RIGHTS AND WARRANTS — 0.0% | |||||||||||||||
| Information Technology — 0.0% | |||||||||||||||
| 800 | Seagate Technology, Inc. Rights * (a) | 8 | |||||||||||||
| TOTAL RIGHTS AND WARRANTS (COST $0) | 8 | ||||||||||||||
| SHORT-TERM INVESTMENTS — 3.3% | |||||||||||||||
| 399,325 | Citigroup Global Markets Repurchase Agreement, dated 02/29/08, due 03/03/08, with a maturity value of $399,350 and an effective yield of 0.75%, collateralized by a U.S. Treasury Bond with a rate of 8.13%, maturity date of 08/15/19 and a market value, including accrued interest, of $403,126. | 399,325 | |||||||||||||
| 580,000 | U.S. Treasury Bill, 1.79%, due 07/24/08 (b) | 575,899 | |||||||||||||
| TOTAL SHORT-TERM INVESTMENTS (COST $974,022) | 975,224 | ||||||||||||||
| TOTAL INVESTMENTS — 99.9% (Cost $32,840,368) | 29,342,928 | ||||||||||||||
| Other Assets and Liabilities (net) — 0.1% | 15,090 | ||||||||||||||
| TOTAL NET ASSETS — 100.0% | $ | 29,358,018 | |||||||||||||
See accompanying notes to the financial statements.
11
GMO U.S. Intrinsic Value Fund
(A Series of GMO Trust)
Schedule of Investments — (Continued)
February 29, 2008
A summary of outstanding financial instruments at February 29, 2008 is as follows:
Futures Contracts
| Number of Contracts | Type | Expiration Date | Contract Value | Net Unrealized Appreciation (Depreciation) | |||||||||||||||
| Buys | |||||||||||||||||||
| 9 | S&P 500 E-Mini | March 2008 | $ | 599,085 | $ | (44,937 | ) | ||||||||||||
As of February 29, 2008, for the futures contracts held, the Fund had sufficient cash and/or securities to cover any commitments or margin requirements of the relevant broker or exchange.
Notes to Schedule of Investments:
REIT - Real Estate Investment Trust
* Non-income producing security.
(a) Security valued at fair value using methods determined in good faith by or at the direction of the Trustees of GMO Trust (Note 2).
(b) Rate shown represents yield-to-maturity.
See accompanying notes to the financial statements.
12
GMO U.S. Intrinsic Value Fund
(A Series of GMO Trust)
Statement of Assets and Liabilities — February 29, 2008
| Assets: | |||||||
| Investments, at value (cost $32,840,368) (Note 2) | $ | 29,342,928 | |||||
| Dividends and interest receivable | 65,706 | ||||||
| Receivable for collateral on open futures contracts (Note 2) | 32,400 | ||||||
| Receivable for expenses reimbursed by Manager (Note 3) | 3,480 | ||||||
| Total assets | 29,444,514 | ||||||
| Liabilities: | |||||||
| Payable to affiliate for (Note 3): | |||||||
| Management fee | 7,332 | ||||||
| Shareholder service fee | 3,547 | ||||||
| Trustees and Chief Compliance Officer of GMO Trust fees | 34 | ||||||
| Payable for variation margin on open futures contracts (Note 2) | 15,525 | ||||||
| Accrued expenses | 60,058 | ||||||
| Total liabilities | 86,496 | ||||||
| Net assets | $ | 29,358,018 | |||||
| Net assets consist of: | |||||||
| Paid-in capital | $ | 34,548,391 | |||||
| Accumulated undistributed net investment income | 49,547 | ||||||
| Distributions in excess of net realized gains | (1,697,543 | ) | |||||
| Net unrealized depreciation | (3,542,377 | ) | |||||
| $ | 29,358,018 | ||||||
| Net assets attributable to: | |||||||
| Class III shares | $ | 29,358,018 | |||||
| Shares outstanding: | |||||||
| Class III | 3,734,671 | ||||||
| Net asset value per share: | |||||||
| Class III | $ | 7.86 | |||||
See accompanying notes to the financial statements.
13
GMO U.S. Intrinsic Value Fund
(A Series of GMO Trust)
Statement of Operations — Year Ended February 29, 2008
| Investment Income: | |||||||
| Dividends | $ | 771,798 | |||||
| Interest | 47,715 | ||||||
| Securities lending income | 2,125 | ||||||
| Total investment income | 821,638 | ||||||
| Expenses: | |||||||
| Management fee (Note 3) | 106,597 | ||||||
| Shareholder service fee – Class III (Note 3) | 51,579 | ||||||
| Custodian, fund accounting agent and transfer agent fees | 29,176 | ||||||
| Audit and tax fees | 48,721 | ||||||
| Legal fees | 954 | ||||||
| Trustees fees and related expenses (Note 3) | 383 | ||||||
| Registration fees | 92 | ||||||
| Miscellaneous | 1,615 | ||||||
| Total expenses | 239,117 | ||||||
| Fees and expenses reimbursed by Manager (Note 3) | (80,462 | ) | |||||
| Net expenses | 158,655 | ||||||
| Net investment income (loss) | 662,983 | ||||||
| Realized and unrealized gain (loss): | |||||||
| Net realized gain (loss) on: | |||||||
| Investments | 656,096 | ||||||
| Closed futures contracts | (49,132 | ) | |||||
| Net realized gain (loss) | 606,964 | ||||||
| Change in net unrealized appreciation (depreciation) on: | |||||||
| Investments | (5,030,104 | ) | |||||
| Open futures contracts | (44,937 | ) | |||||
| Net unrealized gain (loss) | (5,075,041 | ) | |||||
| Net realized and unrealized gain (loss) | (4,468,077 | ) | |||||
| Net increase (decrease) in net assets resulting from operations | $ | (3,805,094 | ) | ||||
See accompanying notes to the financial statements.
14
GMO U.S. Intrinsic Value Fund
(A Series of GMO Trust)
Statement of Changes in Net Assets
| Year Ended February 29, 2008 | Year Ended February 28, 2007 | ||||||||||
| Increase (decrease) in net assets: | |||||||||||
| Operations: | |||||||||||
| Net investment income (loss) | $ | 662,983 | $ | 1,723,568 | |||||||
| Net realized gain (loss) | 606,964 | 12,682,583 | |||||||||
| Change in net unrealized appreciation (depreciation) | (5,075,041 | ) | (5,467,234 | ) | |||||||
| Net increase (decrease) in net assets from operations | (3,805,094 | ) | 8,938,917 | ||||||||
| Distributions to shareholders from: | |||||||||||
| Net investment income | |||||||||||
| Class III | (613,306 | ) | (1,952,221 | ) | |||||||
| Net realized gains | |||||||||||
| Class III | (2,010,274 | ) | (13,723,856 | ) | |||||||
| (2,623,580 | ) | (15,676,077 | ) | ||||||||
| Net share transactions (Note 7): | |||||||||||
| Class III | 60,351 | (53,141,064 | ) | ||||||||
| Total increase (decrease) in net assets | (6,368,323 | ) | (59,878,224 | ) | |||||||
| Net assets: | |||||||||||
| Beginning of period | 35,726,341 | 95,604,565 | |||||||||
| End of period (including accumulated undistributed net investment income of $49,547 and $0, respectively) | $ | 29,358,018 | $ | 35,726,341 | �� | ||||||
See accompanying notes to the financial statements.
15
GMO U.S. Intrinsic Value Fund
(A Series of GMO Trust)
Financial Highlights
(For a Class III share outstanding throughout each period)
| Year Ended February 28/29, | |||||||||||||||||||||||
| 2008 | 2007 | 2006 | 2005 | 2004 | |||||||||||||||||||
| Net asset value, beginning of period | $ | 9.68 | $ | 10.78 | $ | 11.71 | $ | 11.36 | $ | 8.05 | |||||||||||||
| Income (loss) from investment operations: | |||||||||||||||||||||||
| Net investment income (loss)† | 0.18 | 0.21 | 0.26 | 0.20 | 0.17 | ||||||||||||||||||
| Net realized and unrealized gain (loss) | (1.23 | ) | 0.80 | 0.58 | 0.86 | 3.31 | |||||||||||||||||
| Total from investment operations | (1.05 | ) | 1.01 | 0.84 | 1.06 | 3.48 | |||||||||||||||||
| Less distributions to shareholders: | |||||||||||||||||||||||
| From net investment income | (0.18 | ) | (0.23 | ) | (0.28 | ) | (0.19 | ) | (0.17 | ) | |||||||||||||
| From net realized gains | (0.59 | ) | (1.88 | ) | (1.49 | ) | (0.52 | ) | — | ||||||||||||||
| Total distributions | (0.77 | ) | (2.11 | ) | (1.77 | ) | (0.71 | ) | (0.17 | ) | |||||||||||||
| Net asset value, end of period | $ | 7.86 | $ | 9.68 | $ | 10.78 | $ | 11.71 | $ | 11.36 | |||||||||||||
| Total Return(a) | (11.88 | )% | 9.80 | % | 7.73 | % | 9.59 | % | 43.68 | % | |||||||||||||
| Ratios/Supplemental Data: | |||||||||||||||||||||||
| Net assets, end of period (000's) | $ | 29,358 | $ | 35,726 | $ | 95,605 | $ | 112,411 | $ | 71,931 | |||||||||||||
| Net expenses to average daily net assets | 0.46 | % | 0.46 | % | 0.48 | % | 0.48 | % | 0.48 | % | |||||||||||||
| Net investment income to average daily net assets | 1.93 | % | 1.91 | % | 2.31 | % | 1.79 | % | 1.77 | % | |||||||||||||
| Portfolio turnover rate | 75 | % | 72 | % | 62 | % | 60 | % | 65 | % | |||||||||||||
| Fees and expenses reimbursed by the Manager to average daily net assets: | 0.23 | % | 0.13 | % | 0.12 | % | 0.10 | % | 0.14 | % | |||||||||||||
(a) The total returns would have been lower had certain expenses not been reimbursed during the periods shown and assumes the effect of reinvested distributions.
† Calculated using average shares outstanding throughout the period.
See accompanying notes to the financial statements.
16
GMO U.S. Intrinsic Value Fund
(A Series of GMO Trust)
Notes to Financial Statements
February 29, 2008
1. Organization
GMO U.S. Intrinsic Value Fund (the "Fund") is a series of GMO Trust (the "Trust"). The Fund is registered under the Investment Company Act of 1940, as amended, as an open-end, non-diversified management investment company. The Fund is advised and managed by Grantham, Mayo, Van Otterloo & Co. LLC (the "Manager" or "GMO"). The Trust was established as a Massachusetts business trust under the laws of the Commonwealth of Massachusetts on June 24, 1985. The Declaration of Trust permits the Trustees of the Trust ("Trustees") to create an unlimited number of series of shares ("Funds") and to subdivide Funds into classes.
The Fund seeks long-term capital growth. The Fund seeks to achieve its objective by outperforming the Russell 1000 Value Index. The Fund typically makes equity investments in U.S. companies that issue stocks included in the Russell 1000 Index, and companies with similar market capitalizations.
2. Significant accounting policies
The following is a summary of significant accounting policies which are in conformity with accounting principles generally accepted in the United States of America ("U.S. GAAP") and which are consistently followed by the Fund in the preparation of its financial statements. The preparation of financial statements in accordance with U.S. GAAP requires management to make estimates and assumptions that affect the reported amounts and disclosures in the financial statements. Actual results could differ from those estimates. The accounting records of the Fund are maintained in U.S. dollars.
Portfolio valuation
Securities listed on a securities exchange for which market quotations are readily available are valued at the last sale price or official closing price on each business day, or if there is no such reported sale or official closing price, at the most recent quoted bid price. Unlisted securities for which market quotations are readily available are generally valued at the most recent quoted bid price. Short-term investments with a remaining maturity of sixty days or less are generally valued at amortized cost, which approximates fair value. Shares of investment funds are valued at their net asset value. Securities for which quotations are not readily available or whose values the Manager has determined to be unreliable are valued at fair value as determined in good faith by the Trustees or other persons acting at their direction pursuant to procedures approved by the Trustees. By its nature, a fair value price is a good faith est imate of the value of a security at a given point in time and may not reflect the value that would be realized if the security was sold and the differences could be material.
Futures contracts
The Fund may purchase and sell futures contracts. Upon entering into a futures contract, the Fund is required to deposit with the futures clearing broker an amount of cash, U.S. government and agency obligations, or other liquid assets in accordance with the initial margin requirements of the broker or
17
GMO U.S. Intrinsic Value Fund
(A Series of GMO Trust)
Notes to Financial Statements — (Continued)
February 29, 2008
exchange. In addition, the Fund maintains cash or securities in an amount that at least equals the net amount payable in the event the Fund must deliver the full amount of the contracts. Futures contracts are marked to market daily and an appropriate payable or receivable for the change in value ("variation margin") is recorded by the Fund. The payable or receivable is liquidated on the following business day. Gains or losses are recognized but not considered realized until the contracts expire or are closed. Futures contracts involve, to varying degrees, risk of loss in excess of the variation margin disclosed in the Statement of Assets and Liabilities. Under certain circumstances, futures exchanges may establish daily limits on the amount that the price of a futures contract can vary from the previous day's settlement price, thereby effectively preventing liquidation of unfavorable positions. Losses may arise from changes in t he value of the underlying instrument if the Fund is unable to liquidate a futures position due to an illiquid secondary market for the contracts or the imposition of price limits, or if counterparties do not perform under the contract terms. Futures contracts are generally valued at the settlement price established each day by the board of trade or exchange on which they are traded. Futures contracts outstanding at the end of the period are listed in the Fund's Schedule of Investments.
Swap agreements
The Fund may enter into swap agreements. A swap is an agreement to exchange the return generated by one instrument for the return generated by another instrument. Interest rate swap agreements involve the exchange by one party with another party of their respective commitments to pay or receive interest, e.g., an exchange of floating rate payments for fixed rate payments with respect to a notional amount of principal. Total return swap agreements involve a commitment by one party in the agreement to pay interest in exchange for a market-linked return, both based on notional amounts. To the extent the total return of the security or index underlying the transaction exceeds or falls short of the offsetting interest rate obligation, the party will receive a payment from or make a payment to the counterparty, respectively. Forward spread lock swap agreements involve commitments to pay or receive a settlement amount calculated as the difference between the swap spread and a fixed spread, multiplied by the notional amount times the duration of the swap rate. The swap spread is the difference between the benchmark swap rate (market rate) and the specific treasury rate. Variance swap agreements involve commitments to pay or receive a settlement amount calculated as the difference between the annualized realized variance of returns on the underlying price and a fixed quantity, also known as the variance strike, over a period of time. In connection with these agreements, cash or securities may be set aside as collateral by the Fund's custodian or brokers in accordance with the terms of the swap agreement. The Fund earns or pays interest on cash set aside as collateral.
Swaps are marked to market daily using models that incorporate quotations from market makers and the change in value, if any, is recorded as unrealized gain or loss in the Statement of Operations. Payments received or made on swap contracts are recorded as realized gain or loss in the Statement of Operations. Gains or losses are realized upon early termination of the swap agreements. These financial instruments are not actively traded on financial markets. The values assigned to these instruments are based upon the best available information and because of the uncertainty of the valuation, these values may differ
18
GMO U.S. Intrinsic Value Fund
(A Series of GMO Trust)
Notes to Financial Statements — (Continued)
February 29, 2008
significantly from the values that would have been realized had a ready market for these instruments existed, and the differences could be material. Entering into these agreements involves, to varying degrees, elements of credit, legal, market and documentation risk in excess of the amounts recognized in the Statement of Assets and Liabilities. Such risks involve the possibility that there will be no liquid market for these agreements, that the counterparties to the agreements may default on their obligations to perform or disagree as to the meaning of contractual terms in the agreements, or that there may be unfavorable changes in interest rates or the price of the index or security underlying these transactions. There were no swap agreements outstanding at the end of the period.
Repurchase agreements
The Fund may enter into repurchase agreements with banks and broker-dealers whereby the Fund acquires a security for cash and obtains a simultaneous commitment from the seller to repurchase the security at an agreed upon price and date. The Fund, through its custodian, takes possession of securities collateralizing the repurchase agreement. The collateral is marked to market daily to ensure that the market value of the underlying assets remains sufficient to protect the Fund in the event of default by the seller. Collateral for certain tri-party repurchase agreements is held at the counterparty's custodian in a segregated account for the benefit of the Fund and the counterparty. In connection with transactions in repurchase agreements, if the seller defaults or enters into insolvency proceedings and the value of the collateral declines, recovery of cash by the Fund may be delayed or limited. Repurchase agreements outstanding at the end of the period are listed in the Fund's Schedule of Investments.
Securities lending
The Fund may lend its securities to certain qualified broker-dealers. The loans are collateralized with cash or liquid securities with a market value at least equal to the market value of the securities on loan. As with other extensions of credit, the Fund may bear the risk of loss with respect to the investment of the collateral, the risk of delay in and/or inability to exercise its rights with respect to the collateral, and the risk of delay in recovery or loss of rights in the loaned securities should the borrower of the securities fail financially. If a loan is collateralized by U.S. government securities, the Fund receives a fee from the borrower. If a loan is collateralized by cash, the Fund typically invests the cash collateral for its own account in interest-bearing, short-term securities and pays a fee to the borrower that normally represents a portion of the Fund's earnings on the collateral. As of February 29, 2008, t he Fund had no securities on loan.
Taxes and distributions
The Fund intends to qualify each tax year as a regulated investment company under Subchapter M of the Internal Revenue Code of 1986, as amended (the "Code"). The Fund intends to distribute substantially all of its net investment income and net realized short-term and long-term capital gains, if any, after giving effect to any available capital loss carryovers for U.S. federal income tax purposes. Therefore, no provision for U.S. federal income or excise tax is necessary.
19
GMO U.S. Intrinsic Value Fund
(A Series of GMO Trust)
Notes to Financial Statements — (Continued)
February 29, 2008
The Fund's policy is to declare and pay distributions from net investment income, if any, quarterly, and from net realized short-term and long-term capital gains, if any, at least annually. All distributions are paid in shares of the Fund, at net asset value, unless the shareholder elects to receive cash distributions. Distributions to shareholders are recorded by the Fund on the ex-dividend date.
Income and capital gain distributions are determined in accordance with U.S. federal income tax regulations, which may differ from U.S. GAAP. Certain capital accounts in the financial statements are periodically adjusted for permanent differences in order to reflect their tax character. These adjustments have no impact on net assets or net asset value per share. Temporary differences which arise from recognizing certain items of income, expense, gain or loss in different periods for financial statement and tax purposes will reverse at some time in the future. Distributions in excess of net investment income or net realized gains are temporary over distributions for financial statement purposes resulting from differences in the recognition or classification of income or distributions for financial statement and tax purposes.
U.S. GAAP and tax accounting differences primarily relate to losses on wash sale transactions, derivative contract transactions and post-October capital losses.
The following reclassification represents the amount necessary to report the stated components of net assets on a tax basis, excluding certain temporary differences, as of February 29, 2008. The financial highlights exclude these adjustments.
| Accumulated Undistributed Net Investment Income | Distributions In Excess Of Net Realized Gains | Paid-in Capital | |||||||||
| $ | (130 | ) | $ | 130 | $ | — | |||||
The tax character of distributions declared to shareholders is as follows:
| 2/29/2008 | 2/28/2007 | ||||||||||
| Ordinary income (including any short-term capital gains) | $ | 1,421,484 | $ | 5,722,969 | |||||||
| Long-term capital gains | 1,202,096 | 9,953,108 | |||||||||
| Total distributions | $ | 2,623,580 | $ | 15,676,077 | |||||||
Distributions in excess of tax basis earnings and profits, if significant, are reported in the financial statements as a tax return of capital.
As of February 29, 2008, the components of distributable earnings on a tax basis consisted of the following:
Undistributed ordinary income $49,547
20
GMO U.S. Intrinsic Value Fund
(A Series of GMO Trust)
Notes to Financial Statements — (Continued)
February 29, 2008
As of February 29, 2008, the Fund elected to defer to March 1, 2008 post-October capital losses of $1,341,682.
As of February 29, 2008, the approximate cost for U.S. federal income tax purposes and gross and net unrealized appreciation and depreciation in value of investments were as follows:
| Aggregate Cost | Gross Unrealized Appreciation | Gross Unrealized (Depreciation) | Net Unrealized Appreciation (Depreciation) | ||||||||||||
| $ | 33,241,165 | $ | 939,605 | $ | (4,837,842 | ) | $ | (3,898,237 | ) | ||||||
Security transactions and related investment income
Security transactions are accounted for on trade date. Dividend income, net of applicable foreign withholding taxes, if any, is recorded on the ex-dividend date, or when the Fund is informed of the ex-dividend date, if later. Interest income is recorded on the accrual basis and is adjusted for the amortization of premiums and accretion of discounts. Interest income on inflation indexed securities, if any, is accrued daily based upon an inflation adjusted principal. Additionally, any increase or decrease in the principal or face amount of the securities adjusted for inflation is recorded as interest income or loss. Income is not recognized on securities for which collection is not expected. Non-cash dividends, if any, are recorded at the fair market value of the securities received. In determining the net gain or loss on securities sold, the cost of securities is determined on the identified cost basis.
Expenses
The majority of expenses of the Trust are directly identifiable to an individual fund. Expenses which are not readily identifiable to a specific fund are allocated taking into consideration, among other things, the nature and type of expense and the relative size of the funds.
State Street Bank and Trust Company ("State Street") serves as custodian, fund accounting agent and transfer agent of the Fund. State Street's fee may be reduced by credits that are an earnings allowance calculated on the average daily cash balances the Fund maintains with State Street. Credit balances used to reduce the fee paid to State Street, if any, are reported as a reduction of expenses in the Statement of Operations.
Recently issued accounting pronouncements
In June 2006, the Financial Accounting Standards Board ("FASB") issued FASB Interpretation No. 48, Accounting for Uncertainty in Income Taxes – an Interpretation of FASB Statement No. 109 ("FIN 48"). FIN 48 clarifies the accounting for uncertainty in income taxes recognized in accordance with FASB Statement No. 109, Accounting for Income Taxes. FIN 48 prescribes a recognition threshold and measurement attribute for a tax position taken or expected to be taken in the tax return that could impact the Fund's financial statements. It also provides guidance in relation to the Fund's financial statements on classification of tax benefits or liabilities, interest and penalties, accounting in interim periods, disclosure, and transition. FIN 48 is effective for fiscal years beginning after December 15, 2006 for registered
21
GMO U.S. Intrinsic Value Fund
(A Series of GMO Trust)
Notes to Financial Statements — (Continued)
February 29, 2008
investment companies. Management has evaluated the effects of applying the various provisions of FIN 48 and has determined that the adoption of FIN 48 does not have a material effect on the Fund's financial statements. The Fund's federal tax returns for the prior three fiscal years remain subject to examination by the Internal Revenue Service. Management will continue to monitor the rules and guidance pertaining to FIN 48 and will take action if appropriate.
In September 2006, the FASB issued Statement of Financial Accounting Standards No. 157 ("FAS 157"), "Fair Value Measurements." FAS 157 defines fair value, establishes a framework for measuring fair value in accordance with generally accepted accounting principles and expands disclosure about fair value measurements. FAS 157 is effective for fiscal years beginning after November 15, 2007. Management is currently evaluating the impact the adoption of FAS 157 will have on the Fund's financial statement disclosures.
3. Fees and other transactions with affiliates
GMO earns a management fee paid monthly at the annual rate of 0.31% of average daily net assets. The Fund has adopted a Shareholder Service Plan under which the Fund pays GMO a shareholder service fee for client and shareholder service, reporting, and other support. Pursuant to the Shareholder Service Plan, the shareholder service fee is calculated based on average daily net assets at the annual rate of 0.15% for Class III shares.
The Manager has contractually agreed to reimburse the Fund for Fund expenses through at least June 30, 2008 to the extent the Fund's total annual operating expenses (excluding shareholder service fees, fees and expenses of the independent Trustees of the Trust, fees and expenses for legal services not approved by the Manager for the Trust, compensation and expenses of the Trust's Chief Compliance Officer ("CCO") (excluding any employee benefits), brokerage commissions, securities lending fees and expenses, interest expense, transfer taxes, and other investment-related costs (including expenses associated with investments in any company that is an investment company or would be an investment company under the 1940 Act, but for the exceptions to the definition of investment company provided in Section 3(c)(1) and 3(c)(7) of the 1940 Act), hedging transaction fees, extraordinary, non-recurring and certain other unusual expenses (in cluding taxes)) exceed 0.31% of the Fund's average daily net assets.
The Fund's portion of the fees paid by the Trust to the independent Trustees and CCO during the year ended February 29, 2008 was $291 and $95, respectively. The compensation and expenses of the CCO are included in miscellaneous expenses in the Statement of Operations. No remuneration was paid by the Fund to any other officer of the Trust.
4. Purchases and sales of securities
Cost of purchases and proceeds from sales of securities, excluding short-term investments, for the year ended February 29, 2008 aggregated 24,829,180 and $27,110,694, respectively.
22
GMO U.S. Intrinsic Value Fund
(A Series of GMO Trust)
Notes to Financial Statements — (Continued)
February 29, 2008
5. Guarantees
In the normal course of business the Fund enters into contracts with third-party service providers that contain a variety of representations and warranties and which provide general indemnifications. The Fund's maximum exposure under these arrangements is unknown, as this would involve future claims that may be made against the Fund that have not yet occurred. Based on experience, management is of the view that the risk of loss in connection with these potential indemnification obligations is remote; however, there can be no assurance that material liabilities related to such obligations will not arise in the future that could adversely impact the Fund.
6. Principal shareholders and related parties
As of February 29, 2008, 90.57% of the outstanding shares of the Fund were held by two shareholders, each holding in excess of 10% of the Fund's outstanding shares. No other shareholder owned in excess of 10% of the outstanding shares of the Fund. Investment activities of these shareholders may have a material effect on the Fund.
As of February 29, 2008, 0.09% of the Fund's shares were held by two related parties comprised of certain GMO employee accounts, and 0.14% of the Fund's shares were held by accounts for which the Manager has investment discretion.
7. Share transactions
The Declaration of Trust permits the Trustees to issue an unlimited number of shares of beneficial interest (without par value). Transactions in Fund shares were as follows:
| Year Ended February 29, 2008 | Year Ended February 28, 2007 | ||||||||||||||||||
| Class III: | Shares | Amount | Shares | Amount | |||||||||||||||
| Shares sold | 183,699 | $ | 1,585,009 | 909,979 | $ | 10,011,363 | |||||||||||||
| Shares issued to shareholders in reinvestment of distributions | 279,714 | 2,550,763 | 1,544,864 | 15,522,367 | |||||||||||||||
| Shares repurchased | (421,121 | ) | (4,075,421 | ) | (7,627,314 | ) | (78,674,794 | ) | |||||||||||
| Net increase (decrease) | 42,292 | $ | 60,351 | (5,172,471 | ) | $ | (53,141,064 | ) | |||||||||||
23
Report of Independent Registered Public Accounting Firm
To the Trustees of GMO Trust and the Shareholders of
GMO U.S. Intrinsic Value Fund
In our opinion, the accompanying statement of assets and liabilities, including the schedule of investments, and the related statements of operations and of changes in net assets and the financial highlights present fairly, in all material respects, the financial position of GMO U.S. Intrinsic Value Fund (the "Fund") at February 29, 2008, the results of its operations for the year then ended, the changes in its net assets for each of the two years in the period then ended and the financial highlights for each of the five years in the period then ended, in conformity with accounting principles generally accepted in the United States of America. These financial statements and financial highlights (hereafter referred to as "financial statements") are the responsibility of the Fund's management; our responsibility is to express an opinion on these financial statements based on our audits. We conducted our audits of these financial s tatements in accordance with the standards of the Public Company Accounting Oversight Board (United States). Those standards require that we plan and perform the audit to obtain reasonable assurance about whether the financial statements are free of material misstatement. An audit includes examining, on a test basis, evidence supporting the amounts and disclosures in the financial statements, assessing the accounting principles used and significant estimates made by management, and evaluating the overall financial statement presentation. We believe that our audits, which included confirmation of securities at February 29, 2008 by correspondence with the custodian and brokers, provide a reasonable basis for our opinion.
PricewaterhouseCoopers LLP
Boston, Massachusetts
April 29, 2008
24
GMO U.S. Intrinsic Value Fund
(A Series of GMO Trust)
Fund Expenses
February 29, 2008 (Unaudited)
Expense Examples: The following information is in relation to expenses for the six month period ended February 29, 2008.
As a shareholder of the Fund, you may incur two types of costs: (1) transaction costs, and (2) ongoing costs, including management fees, shareholder service fees, and other Fund expenses. This example is intended to help you understand your ongoing costs (in dollars) of investing in the Fund and to compare these costs with the ongoing costs of investing in other mutual funds.
These examples are based on an investment of $1,000 invested at the beginning of the period and held for the entire period, September 1, 2007 through February 29, 2008.
Actual Expenses
The first line of the table below provides information about actual account values and actual expenses. You may use the information in this line, together with the amount you invested, to estimate the expenses that you paid over the period. Simply divide your account value by $1,000 (for example, a $10,000,000 account value divided by $1,000 = 10,000), then multiply the result by the number in the first line under the heading entitled "Net Expense Incurred" to estimate the expenses you paid on your account during this period.
Hypothetical Example for Comparison Purposes
The second line of the table below provides information about hypothetical account values and hypothetical expenses based on the Fund's actual expense ratio and an assumed rate of return of 5% per year before expenses, which is not the Fund's actual return. The hypothetical account values and expenses may not be used to estimate the actual ending account balance or expenses you paid for the period. You may use this information to compare the ongoing costs of investing in the Fund with other funds. To do so, compare this 5% hypothetical example with the 5% hypothetical examples that appear in the shareholder reports of other funds.
Please note that the expenses shown in the table are meant to highlight your ongoing costs only and do not reflect any transactional costs. Therefore, the second line of the table is useful in comparing ongoing costs only, and will not help you determine the relative total costs of owning different funds. In addition, if these transactional costs were included, your costs would have been higher.
| Annualized Net Expense Ratio | Beginning Account Value | Ending Account Value | Net Expense Incurred* | ||||||||||||||||
| Class III | |||||||||||||||||||
| 1) Actual | 0.46 | % | $ | 1,000.00 | $ | 862.00 | $ | 2.13 | |||||||||||
| 2) Hypothetical | 0.46 | % | $ | 1,000.00 | $ | 1,022.58 | $ | 2.31 | |||||||||||
* Expenses are calculated using the Class's annualized net expense ratio for the six months ended February 29, 2008, multiplied by the average account value over the period, multiplied by 182 days in the period, divided by 366 days in the year.
25
GMO U.S. Intrinsic Value Fund
(A Series of GMO Trust)
Tax Information for the Tax Year Ended February 29, 2008 (Unaudited)
The Fund will notify shareholders of amounts for use in preparing 2008 income tax forms in January 2009.
The Fund's distributions to shareholders include $1,202,096 from long-term capital gains.
For taxable, non-corporate shareholders, 20.62% of the income and short-term capital gains, if any, distributed in the Fund's fiscal year ended February 29, 2008 represents qualified dividend income subject to the 15% rate category.
For corporate shareholders, 20.73% of the income and short-term capital gains, if any, distributed in the Fund's fiscal year ended February 29, 2008 qualified for the dividends-received deduction.
The Fund hereby designates as qualified interest income and qualified short-term capital gains with respect to its taxable year ended February 29, 2008, $23,800 and $825,281, respectively, or if determined to be different, the qualified interest income and qualified short-term gains of such year.
26
GMO U.S. Intrinsic Value Fund
(A Series of GMO Trust)
Note Concerning Distributions (Unaudited)
The Fund previously reported estimated sources of any dividends, short-term capital gains, and long-term capital gains distributions paid on a per share basis. Pursuant to Rule 19a-1(e) of the Investment Company Act, the following serves as a correction of such estimates. 1.27% of distributions to shareholders declared from net realized gains during the Fund's fiscal year were reclassified to distributions from net investment income and are reflected as such in the Statement of Changes in Net Assets.
27
Trustees and Officers (Unaudited)
The following tables list the Trust's Trustees and Officers as of the date of this report; their address and date of birth ("DOB"); their position with the Trust; the length of time holding that position with the Trust; their principal occupation(s) during the past five years; the number of portfolios in the fund complex they oversee; and other directorships they hold in companies subject to registration or reporting requirements of the Securities Exchange Act of 1934 (generally called "public companies") or in registered investment companies. The Trust's Statement of Additional Information ("SAI") includes additional information about the Trust's trustees, including changes subsequent to the date of the report. The SAI is available, without charge, upon request by writing GMO, c/o GMO Trust, 40 Rowes Wharf, Boston, MA 02110.
Independent Trustees:
| Name, Address, and DOB | Position(s) Held with Trust | Term of Office1 and Length of Time Served | Principal Occupation(s) During Past Five Years | Number of Portfolios in Fund Complex Overseen by Trustee | Other Directorships Held by Trustee | ||||||||||||||||||
| Donald W. Glazer, Esq. c/o GMO Trust 40 Rowes Wharf Boston, MA 02110 DOB: 07/26/1944 | Chairman of the Board of Trustees | Chairman of the Board of Trustees since March 2005; Lead Independent Trustee (September 2004 – March 2005); Trustee since December 2000. | Consultant – Law and Business2; Vice Chair (since 2002) and Secretary, Provant, Inc. (provider of personnel performance improvement services and training products); Author of Legal Treatises. | 47 | None. | ||||||||||||||||||
1 Each Trustee is elected to serve during the continued lifetime of the Trust until he/she dies, resigns or is removed, or if sooner, until the next meeting of Shareholders called for the purpose of electing Trustees and until the election and qualification of his/her successor.
2 As part of Mr. Glazer's work as a consultant, he provides part-time consulting services to Goodwin Procter LLP ("Goodwin"). Goodwin has provided legal services to Renewable Resources, LLC, an affiliate of GMO; GMO, in connection with its relationship with Renewable Resources; and funds managed by Renewable Resources. Mr. Glazer has represented that he has no financial interest in, and is not involved in the provision of, such legal services. In the calendar years ended December 31, 2006 and December 31, 2007, these entities paid $825,738 and $291,721 respectively, in legal fees and disbursements to Goodwin.
28
Independent Trustees — (Continued)
| Name, Address, and DOB | Position(s) Held with Trust | Term of Office1 and Length of Time Served | Principal Occupation(s) During Past Five Years | Number of Portfolios in Fund Complex Overseen by Trustee | Other Directorships Held by Trustee | ||||||||||||||||||
| Jay O. Light c/o GMO Trust 40 Rowes Wharf Boston, MA 02110 DOB: 10/03/1941 | Trustee | Since May 1996. | Dean (since April 2006), Acting Dean (August 2005 – April 2006), Senior Associate Dean (1998 – 2005), and Professor of Business Administration, Harvard Business School. | 47 | Director of Harvard Management Company, Inc.3 and Verde, Inc.; Director of Partners HealthCare System, Inc. and Chair of its Investment Committee.4 | ||||||||||||||||||
| W. Nicholas Thorndike c/o GMO Trust 40 Rowes Wharf Boston, MA 02110 DOB: 03/28/1933 | Trustee | Since March 2005. | Director or trustee of various corporations and charitable organizations, including Courier Corporation (a book publisher and manufacturer) (July 1989 – present); Putnam Funds (December 1992 – June 2004); and Providence Journal (a newspaper publisher) (December 1986 – December 2003). | 47 | Director of Courier Corporation (a book publisher and manufacturer); Member of the Investment Committee of Partners HealthCare System, Inc.4 | ||||||||||||||||||
1 Each Trustee is elected to serve during the continued lifetime of the Trust until he/she dies, resigns or is removed, or if sooner, until the next meeting of Shareholders called for the purpose of electing Trustees and until the election and qualification of his/her successor.
3 Harvard Management Company, Inc. is a client of the Manager.
4 Partners HealthCare System, Inc. is a client of the Manager.
29
Principal Officers:
| Name, Address, and DOB | Position(s) Held with Trust | Term of Office5 and Length of Time Served | Principal Occupation(s) During Past Five Years | ||||||||||||
| Scott Eston c/o GMO Trust 40 Rowes Wharf Boston, MA 02110 DOB: 01/20/1956 | President and Chief Executive Officer | President and Chief Executive Officer since October 2002; Chief Financial Officer, November 2006 – February 2007. | Chief Financial Officer, Chief Operating Officer and Member, Grantham, Mayo, Van Otterloo & Co. LLC. | ||||||||||||
| Sheppard N. Burnett c/o GMO Trust 40 Rowes Wharf Boston, MA 02110 DOB: 10/24/1968 | Treasurer and Chief Financial Officer | Chief Financial Officer since March 2007; Treasurer since November 2006; Assistant Treasurer, September 2004 – November 2006. | Fund Administration Staff, Grantham, Mayo, Van Otterloo & Co. LLC (June 2004 – present); Vice President, Director of Tax, Columbia Management Group (2002 – 2004). | ||||||||||||
| Brent C. Arvidson c/o GMO Trust 40 Rowes Wharf Boston, MA 02110 DOB: 06/26/1969 | Assistant Treasurer | Since August 1998. | Senior Fund Administrator, Grantham, Mayo, Van Otterloo & Co. LLC. | ||||||||||||
| John L. Nasrah c/o GMO Trust 40 Rowes Wharf Boston, MA 02110 DOB: 05/27/1977 | Assistant Treasurer | Since March 2007. | Fund Administrator, Grantham, Mayo, Van Otterloo & Co. LLC (September 2004 – present); Tax Analyst, Bain & Company, Inc (June 2003 – September 2004); Senior Tax Associate, PricewaterhouseCoopers LLP (2001 – 2003). | ||||||||||||
| Mahmoodur Rahman c/o GMO Trust 40 Rowes Wharf Boston, MA 02110 DOB: 11/30/1967 | Assistant Treasurer | Since September 2007. | Fund Administrator, Grantham, Mayo, Van Otterloo & Co. (April 2007 – present); Vice President and Senior Tax Manager, Massachusetts Financial Services Company (January 2000 – April 2007). | ||||||||||||
5 Officers are elected to hold such office until their successor is elected and qualified to carry out the duties and responsibilities of their office, or until he or she resigns or is removed from office.
30
Principal Officers — (Continued)
| Name, Address, and DOB | Position(s) Held with Trust | Term of Office5 and Length of Time Served | Principal Occupation(s) During Past Five Years | ||||||||||||
| Michael E. Gillespie c/o GMO Trust 40 Rowes Wharf Boston, MA 02110 DOB: 02/18/1958 | Chief Compliance Officer | Since March 2005. | Vice President of Compliance (June 2004 – February 2005) and Director of Domestic Compliance (March 2002 – June 2004), Fidelity Investments; Vice President and Senior Counsel, State Street Bank and Trust Company (May 1998 – March 2002). | ||||||||||||
| Jason B. Harrison c/o GMO Trust 40 Rowes Wharf Boston, MA 02110 DOB: 01/29/1977 | Vice President and Clerk | Vice President since November 2006; Clerk since March 2006. | Legal Counsel, Grantham, Mayo, Van Otterloo & Co. LLC (since February 2006) and Attorney, Ropes & Gray LLP (September 2002 – February 2006). | ||||||||||||
| David L. Bohan c/o GMO Trust 40 Rowes Wharf Boston, MA 02110 DOB: 06/21/1964 | Vice President and Assistant Clerk | Vice President since March 2005; Assistant Clerk since March 2006. | Legal Counsel, Grantham, Mayo, Van Otterloo & Co. LLC (September 2003 – present); Attorney, Goodwin Procter LLP (September 1996 – September 2003). | ||||||||||||
| Gregory L. Pottle c/o GMO Trust 40 Rowes Wharf Boston, MA 02110 DOB: 07/09/1971 | Vice President and Assistant Clerk | Since November 2006. | Legal Counsel, Grantham, Mayo, Van Otterloo & Co. LLC. | ||||||||||||
| Anne K. Trinque c/o GMO Trust 40 Rowes Wharf Boston, MA 02110 DOB: 04/15/1978 | Vice President and Assistant Clerk | Since September 2007. | Legal Counsel, Grantham, Mayo, Van Otterloo & Co. LLC (since January 2007); Attorney, Goodwin Procter LLP (September 2003 – January 2007). | ||||||||||||
| Cheryl Wakeham c/o GMO Trust 40 Rowes Wharf Boston, MA 02110 DOB: 10/29/1958 | Anti-Money Laundering Officer | Since December 2004. | Manager, Client Service Administration, Grantham, Mayo, Van Otterloo & Co. LLC. | ||||||||||||
5 Officers are elected to hold such office until their successor is elected and qualified to carry out the duties and responsibilities of their office, or until he or she resigns or is removed from office.
31
GMO Currency Hedged International Bond Fund
(A Series of GMO Trust)
Annual Report
February 29, 2008
For a free copy of the Fund's proxy voting guidelines, shareholders may call 1-617-346-7646 (collect), visit our website at www.gmo.com, or visit the Securities and Exchange Commission's website at www.sec.gov. Information regarding how the Fund voted proxies relating to portfolio securities during the most recent 12-month period ended June 30 is available on our website at www.gmo.com, or on the Securities and Exchange Commission's website at www.sec.gov.
The Fund files its complete schedule of portfolio holdings with the Securities and Exchange Commission for the first and third quarter of each fiscal year on Form N-Q, which is available on the Commission's website at www.sec.gov. The Fund's Form N-Q may be reviewed and copied at the Commission's Public Reference Room in Washington, D.C. Information on the operation of the Public Reference Room may be obtained by calling 1-800-SEC-0330. The Fund has a policy with respect to disclosure of portfolio holdings under which it may also make available on GMO's website (www.gmo.com) a complete schedule of portfolio holdings.
This report is prepared for the general information of shareholders. It is authorized for distribution to prospective investors only when preceded or accompanied by a prospectus for the GMO Trust.
GMO Currency Hedged International Bond Fund
(A Series of GMO Trust)
Portfolio Management
Day-to-day management of the Fund's portfolio is the responsibility of the Fixed Income Division at Grantham, Mayo, Van Otterloo & Co. LLC.
Management Discussion and Analysis of Fund Performance
The GMO Currency Hedged International Bond Fund returned -3.1% for the fiscal year ended February 29, 2008, compared with the +5.2% return for the JPMorgan Non-U.S. Government Bond Index (Hedged) (ex-Japan). The Fund's exposure to various issues is achieved directly and indirectly through its investment in certain underlying GMO mutual funds, including the GMO Emerging Country Debt Fund, the GMO World Opportunity Overlay Fund, and the GMO Short-Duration Collateral Fund.
The Fund underperformed the benchmark during the fiscal year by 8.3%. Cash management was the primary contributor to negative performance for the fiscal year, followed by interest-rate strategy, currency selection, and emerging debt exposure losses.
More than 70% of the fiscal year's underperformance was due to mark-to-market losses in the cash collateral pools of two funds in which the strategy invests a substantial portion of its total assets: the GMO Short Duration Collateral Fund (SDCF) and the GMO World Opportunity Overlay Fund (WOOF). SDCF and WOOF primarily invest cash in high quality U.S. and foreign floating-rate fixed income securities, mainly asset-backed securities, in order to earn a LIBOR-type return. The cash positions in SDCF and WOOF collateralize derivatives positions that seek to deliver the return of the benchmark as well as create active exposures in global interest-rate and currency markets.
With the extreme price volatility of AAA-credit quality asset-backed securities during the year, the cash pools in SDCF and WOOF underperformed LIBOR by nearly 700 bps, directly contributing to the Fund's underperformance given its 93% exposure to these two funds.
Further strategy underperformance was attributable to interest-rate and currency strategies. For much of the fiscal year, the strategy was overweight Australian, Euro-area, Swedish, Swiss, and Canadian interest-rate markets relative to Japanese, U.K., and U.S. markets. However, the U.S., U.K., and Japanese markets were among the top performers, detracting from performance. Similar results came out of two other cross-sectional models implemented in swaps. Further, the slope and volatility strategies also underperformed, leaving only the U.S. Eurodollar directional strategy and opportunistic trading with positive contributions for the year.
In currencies, the largest negative contributors were underweight positions in euros, yen, and Canadian dollars, as well as an overweight position in Australian dollars. Partially offsetting losses were gains from overweight positions in the Swiss franc, Norwegian krone, and sterling. A major risk aversion episode during the fiscal year, prompted by the turmoil in structured credit markets, persisted for much of the third and fourth quarters. Our choice of a defensive currency during this episode, the Swiss franc, was incorrect, as risk aversion manifested itself in a swift rise in the yen, in which the Fund remained underweight.
A relatively minor contribution to negative performance came from the small exposure to emerging debt, where spread widening on the asset class contributed negatively, as did negative contributions from country selection.
The views expressed herein are exclusively those of Grantham, Mayo, Van Otterloo & Co. LLC Management as of the date of this report and are subject to change. GMO disclaims any responsibility to update such views. They are not meant as investment advice. References to specific securities are not recommendations of such securities and may not be representative of any GMO portfolio's current or future investments.

Performance data quoted represents past performance and is not indicative of future results. The investment return and principal value of an investment will fluctuate so that an investor's shares, when redeemed, may be worth more or less than their original cost. Current performance data may be lower or higher than the performance data provided herein. To obtain performance information to the most recent month-end, visit www.gmo.com. Performance shown is net of all fees after reimbursement from the Manager. Returns would have been lower had certain expenses not been reimbursed during the periods shown and do not include the effect of taxes on distributions and redemptions. All information is unaudited.
* JPMorgan Non-U.S. Government Bond Index (Hedged) (ex-Japan)+ represents the JPMorgan Non-U.S. Government Bond Index (Hedged) prior to 12/31/03 and the JPMorgan Non-U.S. Government Bond Index (Hedged) (ex-Japan) thereafter.
GMO Currency Hedged International Bond Fund
(A Series of GMO Trust)
Investments Concentration Summary
February 29, 2008 (Unaudited)
| Asset Class Summary* | % of Total Net Assets | ||||||
| Debt Obligations | 88.6 | % | |||||
| Short-Term Investments | 11.2 | ||||||
| Futures | 1.6 | ||||||
| Options Purchased | 0.3 | ||||||
| Forward Currency Contracts | 0.3 | ||||||
| Loan Participations | 0.2 | ||||||
| Loan Assignments | 0.1 | ||||||
| Rights and Warrants | 0.0 | ||||||
| Promissory Notes | 0.0 | ||||||
| Written Options | (0.1 | ) | |||||
| Swaps | (0.2 | ) | |||||
| Reverse Repurchase Agreements | (0.6 | ) | |||||
| Other | (1.4 | ) | |||||
| 100.0 | % | ||||||
| Country/Region Summary** | % of Investments | ||||||
| Euro Region*** | 66.2 | % | |||||
| Japan | 7.1 | ||||||
| Canada | 7.0 | ||||||
| Australia | 6.4 | ||||||
| United States | 4.1 | ||||||
| United Kingdom | 3.5 | ||||||
| Switzerland | 3.1 | ||||||
| Emerging | 2.6 | ||||||
| 100.0 | % | ||||||
* The table above incorporates aggregate indirect asset class exposure associated with investments in other funds of GMO Trust ("underlying funds").
** The table above incorporates aggregate indirect country exposure associated with investments in the underlying funds. The table excludes short-term investments. The table includes exposure through the use of derivative contracts.
*** The "Euro Region" is comprised of Austria, Belgium, Finland, France, Germany, Greece, Ireland, Italy, Netherlands, Portugal and Spain.
1
GMO Currency Hedged International Bond Fund
(A Series of GMO Trust)
Schedule of Investments
(showing percentage of total net assets)
February 29, 2008
| Shares | Description | Value ($) | |||||||||||||
| MUTUAL FUNDS — 96.5% | |||||||||||||||
| United States — 96.5% | |||||||||||||||
| Affiliated Issuers | |||||||||||||||
| 464,947 | GMO Emerging Country Debt Fund, Class III | 4,677,363 | |||||||||||||
| 4,763,842 | GMO Short-Duration Collateral Fund | 114,475,125 | |||||||||||||
| 5,496 | GMO Special Purpose Holding Fund (a) (b) | 6,924 | |||||||||||||
| 1,217,947 | GMO World Opportunity Overlay Fund | 31,276,870 | |||||||||||||
| Total United States | 150,436,282 | ||||||||||||||
| TOTAL MUTUAL FUNDS (COST $157,523,933) | 150,436,282 | ||||||||||||||
| Shares / Par Value ($) | Description | Value ($) | |||||||||||||
| SHORT-TERM INVESTMENTS — 3.2% | |||||||||||||||
| Money Market Funds — 0.7% | |||||||||||||||
| 1,093,420 | State Street Institutional Liquid Reserves Fund-Institutional Class | 1,093,420 | |||||||||||||
| Other Short-Term Investments — 2.5% | |||||||||||||||
| 4,000,000 | U.S. Treasury Bill, 2.05%, due 04/17/08 (c) | 3,989,294 | |||||||||||||
| TOTAL SHORT-TERM INVESTMENTS (COST $5,082,714) | 5,082,714 | ||||||||||||||
| TOTAL INVESTMENTS — 99.7% (Cost $162,606,647) | 155,518,996 | ||||||||||||||
| Other Assets and Liabilities (net) — 0.3% | 432,799 | ||||||||||||||
| TOTAL NET ASSETS — 100.0% | $ | 155,951,795 | |||||||||||||
See accompanying notes to the financial statements.
2
GMO Currency Hedged International Bond Fund
(A Series of GMO Trust)
Schedule of Investments — (Continued)
February 29, 2008
A summary of outstanding financial instruments at February 29, 2008 is as follows:
Forward Currency Contracts
| Settlement Date | Deliver/ Receive | Units of Currency | Value | Net Unrealized Appreciation (Depreciation) | |||||||||||||||
| Buys | |||||||||||||||||||
| 3/04/08 | AUD | 4,000,000 | $ | 3,726,200 | $ | 189,068 | |||||||||||||
| 3/04/08 | AUD | 1,900,000 | 1,769,945 | 7,781 | |||||||||||||||
| 5/06/08 | AUD | 2,100,000 | 1,940,523 | (33,477 | ) | ||||||||||||||
| 5/06/08 | AUD | 2,000,000 | 1,848,117 | (8,923 | ) | ||||||||||||||
| 3/11/08 | CAD | 2,700,000 | 2,742,810 | 88,256 | |||||||||||||||
| 4/01/08 | CHF | 15,900,000 | 15,269,675 | 636,462 | |||||||||||||||
| 4/15/08 | EUR | 7,600,000 | 11,522,818 | 540,818 | |||||||||||||||
| 4/15/08 | EUR | 1,200,000 | 1,819,392 | 61,488 | |||||||||||||||
| 3/25/08 | GBP | 1,500,000 | 2,976,480 | 2,880 | |||||||||||||||
| 3/25/08 | GBP | 2,000,000 | 3,968,640 | 59,061 | |||||||||||||||
| 3/25/08 | GBP | 1,000,000 | 1,984,320 | 360 | |||||||||||||||
| 4/22/08 | JPY | 50,000,000 | 482,693 | 16,997 | |||||||||||||||
| 4/08/08 | NZD | 1,600,000 | 1,272,485 | 28,485 | |||||||||||||||
| 4/08/08 | NZD | 1,900,000 | 1,511,076 | (21,768 | ) | ||||||||||||||
| 4/08/08 | NZD | 2,200,000 | 1,749,667 | (30,969 | ) | ||||||||||||||
| $ | 54,584,841 | $ | 1,536,519 | ||||||||||||||||
| Sales | |||||||||||||||||||
| 3/04/08 | AUD | 3,800,000 | $ | 3,539,890 | $ | (224,466 | ) | ||||||||||||
| 3/04/08 | AUD | 2,100,000 | 1,956,255 | 33,789 | |||||||||||||||
| 3/11/08 | CAD | 5,400,000 | 5,485,620 | (11,427 | ) | ||||||||||||||
| 4/01/08 | CHF | 3,100,000 | 2,977,106 | (170,889 | ) | ||||||||||||||
| 4/01/08 | CHF | 10,100,000 | 9,699,605 | (304,118 | ) | ||||||||||||||
| 4/15/08 | EUR | 2,500,000 | 3,790,401 | (173,401 | ) | ||||||||||||||
| 4/15/08 | EUR | 1,500,000 | 2,274,240 | (7,020 | ) | ||||||||||||||
| 3/25/08 | GBP | 3,400,000 | 6,746,688 | (62,968 | ) | ||||||||||||||
| 4/22/08 | JPY | 235,000,000 | 2,268,659 | (84,238 | ) | ||||||||||||||
| 4/08/08 | NZD | 1,200,000 | 954,364 | (12,976 | ) | ||||||||||||||
| $ | 39,692,828 | $ | (1,017,714 | ) | |||||||||||||||
See accompanying notes to the financial statements.
3
GMO Currency Hedged International Bond Fund
(A Series of GMO Trust)
Schedule of Investments — (Continued)
February 29, 2008
Forward Cross Currency Contracts
| Settlement Date | Deliver/Units of Currency | Receive/In Exchange For | Net Unrealized Appreciation (Depreciation) | ||||||||||||
| 3/18/08 | EUR | 5,500,000 | SEK | 51,698,055 | $ | 33,110 | |||||||||
| 3/18/08 | SEK | 35,774,090 | EUR | 3,800,000 | (31,861 | ) | |||||||||
| 4/29/08 | EUR | 4,600,000 | NOK | 36,280,200 | (42,220 | ) | |||||||||
| 4/29/08 | NOK | 11,834,250 | EUR | 1,500,000 | 13,051 | ||||||||||
| $ | (27,920 | ) | |||||||||||||
Futures Contracts
| Number of Contracts | Type | Expiration Date | Contract Value | Net Unrealized Appreciation (Depreciation) | |||||||||||||||
| Buys | |||||||||||||||||||
| 16 | Australian Government Bond 10 Yr. | March 2008 | $ | 1,464,163 | $ | 469 | |||||||||||||
| 79 | Australian Government Bond 3 Yr. | March 2008 | 7,234,966 | 14,745 | |||||||||||||||
| 122 | Canadian Government Bond 10 Yr. | June 2008 | 14,613,970 | 294,548 | |||||||||||||||
| 240 | Euro BOBL | March 2008 | 40,569,219 | 907,718 | |||||||||||||||
| 516 | Euro Bund | March 2008 | 91,700,754 | 1,348,512 | |||||||||||||||
| 10 | Japanese Government Bond 10 Yr. (TSE) | March 2008 | 13,328,521 | 151,174 | |||||||||||||||
| 42 | UK Gilt Long Bond | June 2008 | 9,206,042 | 155,992 | |||||||||||||||
| $ | 178,117,635 | $ | 2,873,158 | ||||||||||||||||
| Sales | |||||||||||||||||||
| 15 | Euro Bund | March 2008 | $ | 2,665,720 | $ | (22,569 | ) | ||||||||||||
| 615 | Federal Fund 30 day | March 2008 | 249,440,891 | (38,535 | ) | ||||||||||||||
| 7 | U.S. Long Bond (CBT) | June 2008 | 830,375 | (18,828 | ) | ||||||||||||||
| 41 | U.S. Treasury Note 10 Yr. | June 2008 | 4,808,531 | (85,937 | ) | ||||||||||||||
| 106 | U.S. Treasury Note 2 Yr. (CBT) | June 2008 | 22,781,719 | (145,992 | ) | ||||||||||||||
| 10 | U.S. Treasury Note 5 Yr. (CBT) | June 2008 | 1,142,500 | (15,203 | ) | ||||||||||||||
| $ | 281,669,736 | $ | (327,064 | ) | |||||||||||||||
See accompanying notes to the financial statements.
4
GMO Currency Hedged International Bond Fund
(A Series of GMO Trust)
Schedule of Investments — (Continued)
February 29, 2008
Swap Agreements
Interest Rate Swaps
| Notional Amount | Expiration Date | Counterparty | Receive (Pay) | Fixed Rate | Variable Rate | Market Value | |||||||||||||||||||||||||
| 7,600,000 | CHF | 3/19/2013 | JP Morgan Chase Bank | Receive | 3.00 | % | 6 month CHF LIBOR | $ | 50,068 | ||||||||||||||||||||||
| 4,200,000 | AUD | 3/19/2018 | JP Morgan Chase Bank | Receive | 7.07 | % | 6 month AUD BBSW | (53,090 | ) | ||||||||||||||||||||||
| Premiums to (Pay) Receive | $ | 25,935 | $ | (3,022 | ) | ||||||||||||||||||||||||||
As of February 29, 2008, for the futures and/or swap contracts held, the Fund had sufficient cash and/or securities to cover any commitments or margin requirements of the relevant broker or exchange.
Notes to Schedule of Investments:
BBSW - Bank Bill Swap Reference Rate
LIBOR - London Interbank Offered Rate
(a) Security valued at fair value using methods determined in good faith by or at the direction of the Trustees of GMO Trust (Note 2).
(b) Underlying investment represents interests in defaulted securities.
(c) Rate shown represents yield-to-maturity.
Currency Abbreviations:
AUD - Australian Dollar
CAD - Canadian Dollar
CHF - Swiss Franc
EUR - Euro
GBP - British Pound
JPY - Japanese Yen
NOK - Norwegian Krone
NZD - New Zealand Dollar
SEK - Swedish Krona
See accompanying notes to the financial statements.
5
GMO Currency Hedged International Bond Fund
(A Series of GMO Trust)
Statement of Assets and Liabilities — February 29, 2008
| Assets: | |||||||
| Investments in unaffiliated issuers, at value (cost $5,082,714) (Note 2) | $ | 5,082,714 | |||||
| Investments in affiliated issuers, at value (cost $157,523,933) (Notes 2 and 8) | 150,436,282 | ||||||
| Interest receivable | 4,644 | ||||||
| Unrealized appreciation on open forward currency contracts (Note 2) | 1,711,606 | ||||||
| Receivable for variation margin on open futures contracts (Note 2) | 1,135,209 | ||||||
| Receivable for open swap contracts (Note 2) | 50,068 | ||||||
| Receivable for expenses reimbursed by Manager (Note 3) | 12,822 | ||||||
| Total assets | 158,433,345 | ||||||
| Liabilities: | |||||||
| Payable for investments purchased | 1,000,000 | ||||||
| Payable to broker for closed futures contracts | 68,655 | ||||||
| Payable to affiliate for (Note 3): | |||||||
| Management fee | 33,441 | ||||||
| Shareholder service fee | 20,065 | ||||||
| Trustees and Chief Compliance Officer of GMO Trust fees | 202 | ||||||
| Unrealized depreciation on open forward currency contracts (Note 2) | 1,220,721 | ||||||
| Payable for open swap contracts (Note 2) | 53,090 | ||||||
| Accrued expenses | 85,376 | ||||||
| Total liabilities | 2,481,550 | ||||||
| Net assets | $ | 155,951,795 | |||||
| Net assets consist of: | |||||||
| Paid-in capital | $ | 167,280,391 | |||||
| Distributions in excess of net investment income | (21,511,882 | ) | |||||
| Accumulated net realized gain | 14,212,060 | ||||||
| Net unrealized depreciation | (4,028,774 | ) | |||||
| $ | 155,951,795 | ||||||
| Net assets attributable to: | |||||||
| Class III shares | $ | 155,951,795 | |||||
| Shares outstanding: | |||||||
| Class III | 17,750,433 | ||||||
| Net asset value per share: | |||||||
| Class III | $ | 8.79 | |||||
See accompanying notes to the financial statements.
6
GMO Currency Hedged International Bond Fund
(A Series of GMO Trust)
Statement of Operations — Year Ended February 29, 2008
| Investment Income: | |||||||
| Dividends | $ | 69,492 | |||||
| Interest | 1,181,261 | ||||||
| Dividends from affiliated issuers (Note 8) | 7,557,704 | ||||||
| Total investment income | 8,808,457 | ||||||
| Expenses: | |||||||
| Management fee (Note 3) | 549,560 | ||||||
| Shareholder service fee – Class III (Note 3) | 329,736 | ||||||
| Custodian, fund accounting agent and transfer agent fees | 86,239 | ||||||
| Audit and tax fees | 61,386 | ||||||
| Legal fees | 8,080 | ||||||
| Trustees fees and related expenses (Note 3) | 2,113 | ||||||
| Registration fees | 736 | ||||||
| Miscellaneous | 1,965 | ||||||
| Total expenses | 1,039,815 | ||||||
| Fees and expenses reimbursed by Manager (Note 3) | (155,099 | ) | |||||
| Expense reductions (Note 2) | (7 | ) | |||||
| Indirectly incurred fees waived or borne by Manager (Note 3) | (29,299 | ) | |||||
| Shareholder service fee waived (Note 3) | (10,443 | ) | |||||
| Net expenses | 844,967 | ||||||
| Net investment income (loss) | 7,963,490 | ||||||
| Realized and unrealized gain (loss): | |||||||
| Net realized gain (loss) on: | |||||||
| Investments in affiliated issuers | (1,785,260 | ) | |||||
| Realized gains distributions from affiliated issuers (Note 8) | 327,724 | ||||||
| Closed futures contracts | (8,366,620 | ) | |||||
| Closed swap contracts | (1,151,270 | ) | |||||
| Foreign currency, forward contracts and foreign currency related transactions | (3,168,028 | ) | |||||
| Net realized gain (loss) | (14,143,454 | ) | |||||
| Change in net unrealized appreciation (depreciation) on: | |||||||
| Investments in unaffiliated issuers | 371,706 | ||||||
| Investments in affiliated issuers | (8,023,870 | ) | |||||
| Open futures contracts | 6,465,450 | ||||||
| Open swap contracts | (75,172 | ) | |||||
| Foreign currency, forward contracts and foreign currency related transactions | (43,340 | ) | |||||
| Net unrealized gain (loss) | (1,305,226 | ) | |||||
| Net realized and unrealized gain (loss) | (15,448,680 | ) | |||||
| Net increase (decrease) in net assets resulting from operations | $ | (7,485,190 | ) | ||||
See accompanying notes to the financial statements.
7
GMO Currency Hedged International Bond Fund
(A Series of GMO Trust)
Statement of Changes in Net Assets
| Year Ended February 29, 2008 | Year Ended February 28, 2007 | ||||||||||
| Increase (decrease) in net assets: | |||||||||||
| Operations: | |||||||||||
| Net investment income (loss) | $ | 7,963,490 | $ | 10,998,262 | |||||||
| Net realized gain (loss) | (14,143,454 | ) | 5,806,574 | ||||||||
| Change in net unrealized appreciation (depreciation) | (1,305,226 | ) | (5,959,340 | ) | |||||||
| Net increase (decrease) in net assets from operations | (7,485,190 | ) | 10,845,496 | ||||||||
| Distributions to shareholders from: | |||||||||||
| Net investment income | |||||||||||
| Class III | (315,341 | ) | — | ||||||||
| Net realized gains | |||||||||||
| Class III | — | (6,799,302 | ) | ||||||||
| Return of capital | |||||||||||
| Class III | (2,600,431 | ) | (239,876 | ) | |||||||
| (2,915,772 | ) | (7,039,178 | ) | ||||||||
| Net share transactions (Note 7): | |||||||||||
| Class III | (108,068,985 | ) | (683,279,021 | ) | |||||||
| Total increase (decrease) in net assets | (118,469,947 | ) | (679,472,703 | ) | |||||||
| Net assets: | |||||||||||
| Beginning of period | 274,421,742 | 953,894,445 | |||||||||
| End of period (including distributions in excess of net investment income of $21,511,882 and $19,300,442, respectively) | $ | 155,951,795 | $ | 274,421,742 | |||||||
See accompanying notes to the financial statements.
8
GMO Currency Hedged International Bond Fund
(A Series of GMO Trust)
Financial Highlights
(For a Class III share outstanding throughout each period)
| Year Ended February 28/29, | |||||||||||||||||||||||
| 2008 | 2007 | 2006 | 2005 | 2004 | |||||||||||||||||||
| Net asset value, beginning of period | $ | 9.21 | $ | 9.04 | $ | 9.59 | $ | 9.16 | $ | 8.85 | |||||||||||||
| Income (loss) from investment operations: | |||||||||||||||||||||||
| Net investment income (loss)(a)† | 0.33 | 0.17 | 0.18 | 0.14 | 0.06 | ||||||||||||||||||
| Net realized and unrealized gain (loss) | (0.62 | ) | 0.15 | 0.39 | 0.44 | 0.76 | |||||||||||||||||
| Total from investment operations | (0.29 | ) | 0.32 | 0.57 | 0.58 | 0.82 | |||||||||||||||||
| Less distributions to shareholders: | |||||||||||||||||||||||
| From net investment income | (0.01 | ) | — | (1.00 | )(b) | (0.15 | ) | (0.51 | ) | ||||||||||||||
| From net realized gains | — | (0.14 | ) | (0.12 | ) | — | — | ||||||||||||||||
| Return of capital | (0.12 | ) | (0.01 | ) | — | — | — | ||||||||||||||||
| Total distributions | (0.13 | ) | (0.15 | ) | (1.12 | ) | (0.15 | ) | (0.51 | ) | |||||||||||||
| Net asset value, end of period | $ | 8.79 | $ | 9.21 | $ | 9.04 | $ | 9.59 | $ | 9.16 | |||||||||||||
| Total Return(c) | (3.08 | )% | 3.58 | % | 6.01 | % | 6.35 | % | 9.53 | % | |||||||||||||
| Ratios/Supplemental Data: | |||||||||||||||||||||||
| Net assets, end of period (000's) | $ | 155,952 | $ | 274,422 | $ | 953,894 | $ | 1,015,009 | $ | 222,872 | |||||||||||||
| Net expenses to average daily net assets(d) | 0.38 | %(e) | 0.39 | % | 0.39 | % | 0.39 | % | 0.38 | % | |||||||||||||
| Net investment income to average daily net assets(a) | 3.62 | % | 1.93 | % | 1.91 | % | 1.51 | % | 0.68 | % | |||||||||||||
| Portfolio turnover rate | 55 | % | 25 | % | 49 | % | 44 | % | 36 | % | |||||||||||||
| Fees and expenses reimbursed and/or waived by the Manager to average daily net assets: | 0.09 | % | 0.06 | % | 0.06 | % | 0.09 | % | 0.24 | % | |||||||||||||
(a) Net investment income is affected by the timing of the declaration of dividends by the underlying funds in which the Fund invests.
(b) Distributions from net investment income include amounts (approximately $0.49 per share) from foreign currency transactions which are treated as realized capital gain for book purposes.
(c) The total returns would have been lower had certain expenses not been reimbursed and/or waived during the periods shown and assumes the effect of reinvested distributions.
(d) Net expenses exclude expenses incurred indirectly through investment in the underlying funds (See Note 3).
(e) The net expense ratio does not include the effect of expense reductions.
† Calculated using average shares outstanding throughout the period.
See accompanying notes to the financial statements.
9
GMO Currency Hedged International Bond Fund
(A Series of GMO Trust)
Notes to Financial Statements
February 29, 2008
1. Organization
GMO Currency Hedged International Bond Fund (the "Fund") is a series of GMO Trust (the "Trust"). The Fund is registered under the Investment Company Act of 1940, as amended, as an open-end, non-diversified management investment company. The Fund is advised and managed by Grantham, Mayo, Van Otterloo & Co. LLC (the "Manager" or "GMO"). The Trust was established as a Massachusetts business trust under the laws of the Commonwealth of Massachusetts on June 24, 1985. The Declaration of Trust permits the Trustees of the Trust ("Trustees") to create an unlimited number of series of shares ("Funds") and to subdivide Funds into classes.
The Fund seeks total return greater then that of the JPMorgan Non-U.S. Government Bond Index (Hedged) (ex-Japan). The Fund typically invests in bonds included in the JPMorgan Non-U.S. Government Bond Index (Hedged) (ex-Japan) and in securities and instruments with similar characteristics. The Fund seeks additional returns by investing in global interest rate, currency, and emerging country debt markets. The Fund may invest a substantial portion of its assets in shares of GMO Short-Duration Collateral Fund; futures contracts, currency options, currency forwards, swap contracts, and other types of derivatives; investment-grade bonds denominated in various currencies, including foreign and U.S. government securities and asset-backed securities issued by foreign governments and U.S. government agencies (including securities neither guaranteed nor insured by the U.S. government), corporate bonds, and mortgage-backed and other asset-b acked securities issued by private issuers; shares of GMO World Opportunity Overlay Fund; and up to 5% of the Fund's total assets in sovereign debt of emerging countries (including below investment grade securities), primarily through investment in shares of GMO Emerging Country Debt Fund ("ECDF"). The Fund generally attempts to hedge at least 75% of the Fund's net foreign currency exposure into the U.S. dollar.
The financial statements of the series of the Trust in which the Fund invests ("underlying funds") should be read in conjunction with the Fund's financial statements. These financial statements are available, without charge, upon request by calling (617) 346-7646 (collect). Shares of GMO Special Purpose Holding Fund, GMO World Opportunity Overlay Fund and GMO Short-Duration Collateral Fund are not publicly available.
2. Significant accounting policies
The following is a summary of significant accounting policies which are in conformity with accounting principles generally accepted in the United States of America ("U.S. GAAP") and which are consistently followed by the Fund in the preparation of its financial statements. The preparation of financial statements in accordance with U.S. GAAP requires management to make estimates and assumptions that affect the reported amounts and disclosures in the financial statements. Actual results could differ from those estimates. The accounting records of the Fund are maintained in U.S. dollars.
10
GMO Currency Hedged International Bond Fund
(A Series of GMO Trust)
Notes to Financial Statements — (Continued)
February 29, 2008
Portfolio valuation
Securities listed on a securities exchange for which market quotations are readily available are valued at the last sale price or official closing price on each business day, or if there is no such reported sale or official closing price, at the most recent quoted bid price. Unlisted securities for which market quotations are readily available are generally valued at the most recent quoted bid price. Short-term investments with a remaining maturity of sixty days or less are generally valued at amortized cost, which approximates fair value. Shares of investment funds are valued at their net asset value. Securities for which quotations are not readily available or whose values the Manager has determined to be unreliable are valued at fair value as determined in good faith by the Trustees or other persons acting at their direction pursuant to procedures approved by the Trustees. By its nature, a fair value price is a good faith est imate of the value of a security at a given point in time and may not reflect the value that would be realized if the security was sold and the differences could be material.
Fixed income securities held by the Fund or the underlying funds are typically valued pursuant to prices supplied by a primary pricing source chosen by the Manager. The Manager evaluates such primary pricing sources on an ongoing basis, and may change a pricing source should it deem it appropriate. The Manager, at its discretion, may override a price supplied by a primary source by using a price provided by another source if such action is deemed appropriate. The prices provided by such primary pricing sources may differ from the value that would be realized if the securities were sold and the differences could be material.
Certain securities held by the Fund or the underlying funds are valued on the basis of a price provided by a single source. The prices provided may differ from the value that would be realized if the securities were sold and the differences could be material. As of February 29, 2008, the total value of these securities represented 31.47% of net assets.
The Fund indirectly invests through underlying funds in securities with contractual cash flows, such as asset-backed securities, collateralized mortgage obligations and commercial mortgage backed securities, including securities backed by subprime mortgage loans. The value, liquidity and related income of these securities are sensitive to changes in economic conditions, including real estate values, delinquencies and/or defaults, and may be adversely affected by shifts in the market's perception of the securities' market values and changes in interest rates.
GMO Special Purpose Holding Fund ("SPHF"), an investment of the Fund, has litigation pending against various entities related to the default of certain asset-backed securities previously held by SPHF. For the year ended February 29, 2008, the Fund received $35,644 through SPHF in conjunction with settlement agreements related to the default of those securities.
Foreign currency translation
The market values of foreign securities, currency holdings and other assets and liabilities are translated to U.S. dollars based on the current exchange rates each business day. Income and expenses denominated in
11
GMO Currency Hedged International Bond Fund
(A Series of GMO Trust)
Notes to Financial Statements — (Continued)
February 29, 2008
foreign currencies are translated at current exchange rates when accrued or incurred. The Fund does not isolate realized and unrealized gains and losses attributable to changes in exchange rates from gains and losses that arise from changes in the market value of investments. Such fluctuations are included with net realized and unrealized gain or loss on investments. Net realized gains and losses on foreign currency transactions represent gains and losses on disposition of currencies and forward currency contracts, currency gains and losses realized between the trade and settlement dates on securities transactions, and the difference between the amount of investment income and foreign withholding taxes recorded on the Fund's accounting records and the U.S. dollar equivalent amounts actually received or paid.
Forward currency contracts
The Fund may enter into forward currency contracts including forward cross currency contracts. A forward currency contract is an agreement between two parties to buy and sell a currency at a set price on a future date. The market value of a forward currency contract fluctuates with changes in forward currency exchange rates. Forward currency contracts are marked to market daily using rates supplied by a quotation service and changes in value are recorded by the Fund as an unrealized gain or loss. Realized gains or losses equal to the difference between the value of the contract at the time it was opened and the value at the time it was closed are recorded upon delivery or receipt of the currency or, if a forward currency contract is offset by entering into another forward currency contract with the same broker, upon settlement of the net gain or loss. These contracts may involve market risk in excess of the unrealized gain or lo ss reflected in the Fund's Statement of Assets and Liabilities. In addition, the Fund could be exposed to risk if the counterparties are unable to meet the terms of the contracts or if there are movements in currency values that are unfavorable to the Fund. Forward currency contracts outstanding at the end of the period are listed in the Fund's Schedule of Investments.
Futures contracts
The Fund may purchase and sell futures contracts. Upon entering into a futures contract, the Fund is required to deposit with the futures clearing broker an amount of cash, U.S. government and agency obligations, or other liquid assets in accordance with the initial margin requirements of the broker or exchange. In addition, the Fund maintains cash or securities in an amount that at least equals the net amount payable in the event the Fund must deliver the full amount of the contracts. Futures contracts are marked to market daily and an appropriate payable or receivable for the change in value ("variation margin") is recorded by the Fund. The payable or receivable is liquidated on the following business day. Gains or losses are recognized but not considered realized until the contracts expire or are closed. Futures contracts involve, to varying degrees, risk of loss in excess of the variation margin disclosed in the Statement of Assets and Liabilities. Under certain circumstances, futures exchanges may establish daily limits on the amount that the price of a futures contract can vary from the previous day's settlement price, thereby effectively preventing liquidation of unfavorable positions. Losses may arise from changes in the value of the underlying instrument if the Fund is unable to liquidate a futures position due to an illiquid secondary market for the contracts or the imposition of price limits, or if counterparties do not perform under the contract terms. Futures contracts are generally valued at the settlement price established each
12
GMO Currency Hedged International Bond Fund
(A Series of GMO Trust)
Notes to Financial Statements — (Continued)
February 29, 2008
day by the board of trade or exchange on which they are traded. Futures contracts outstanding at the end of the period are listed in the Fund's Schedule of Investments.
Options
The Fund may write call and put options. Writing options increases the Fund's exposure to the underlying instrument by, in the case of a call option, obligating the Fund to sell the underlying instrument at a set price to the option-holder and, in the case of a put option, obligating the Fund to purchase the underlying instrument at a set price from the option-holder. When the Fund writes a call or put option, an amount equal to the premium received is recorded as a liability and subsequently marked to market to reflect the current value of the option written. Premiums received from writing options which expire are treated as realized gains. Premiums received from writing options which are exercised or closed are added to the proceeds or offset against the amounts paid on the underlying future, security or currency transaction to determine the realized gain or loss. The Fund as a writer of an option has no control over whether t he underlying future, security or currency may be sold (call) or purchased (put) and as a result bears the market risk of an unfavorable change in the price of the future, security or currency underlying the written option. In the event that the Fund writes uncovered call options (i.e. options for investments that the Fund does not own), it bears the risk of incurring substantial losses if the price of the underlying instrument increases during the term of the option. There is the risk the Fund may not be able to enter into a closing transaction because of an illiquid market. There were no open written option contracts during the period.
The Fund may also purchase put and call options. Purchasing options alters the Fund's exposure to the underlying instrument by, in the case of a call option, entitling the Fund to purchase the underlying instrument at a set price from the writer of the option and, in the case of a put option, entitling the Fund to sell the underlying instrument at a set price to the writer of the option. The Fund pays a premium as a cost for a purchased option disclosed in the Schedule of Investments which is subsequently marked to market to reflect the current value of the option. Premiums paid for purchasing options which expire are treated as realized losses. Premiums paid for purchasing options which are exercised or closed are added to the amounts paid or offset against the proceeds on the closing transaction to determine the realized gain or loss. The risk associated with purchasing put and call options is limited to the premium paid. Ther e were no purchased option contracts outstanding at the end of the period.
Exchange traded options are valued at the last sale price, or if no sale is reported, the last bid price for purchased options and the last ask price for written options. Options traded over-the-counter are valued using prices supplied by a primary pricing source chosen by the Manager.
Loan agreements
The Fund may invest in direct debt instruments which are interests in amounts owed by a corporate, governmental, or other borrower to lenders or lending syndicates. The Fund's investments in loans may be in the form of participations in loans or assignments of all or a portion of loans from third parties. A loan is often administered by a bank or other financial institution (the "lender") that acts as agent for all
13
GMO Currency Hedged International Bond Fund
(A Series of GMO Trust)
Notes to Financial Statements — (Continued)
February 29, 2008
holders. The agent administers the terms of the loan, as specified in the loan agreement. When investing in a loan participation, the Fund has the right to receive payments of principal, interest and any fees to which it is entitled only from the lender selling the loan agreement and only upon receipt by the lender of payments from the borrower. The Fund generally has no right to enforce compliance with the terms of the loan agreement with the borrower. As a result, the Fund may be subject to the credit risk of both the borrower and the lender that is selling the loan agreement. When the Fund purchases assignments from lenders it acquires direct rights against the borrower on the loan. There were no loan agreements outstanding at the end of the period.
Indexed securities
The Fund may invest in indexed securities where the redemption values and/or coupons are linked to the prices of a specific instrument or financial statistic. The Fund uses indexed securities to increase or decrease its exposure to different underlying instruments and to gain exposure to markets in which it may be difficult to invest through conventional securities. Indexed securities may be more volatile than their underlying instruments, but any loss is limited to the amount of the original investment. There were no indexed securities held by the Fund at the end of the period.
Swap agreements
The Fund may enter into swap agreements. A swap is an agreement to exchange the return generated by one instrument for the return generated by another instrument. Interest rate swap agreements involve the exchange by one party with another party of their respective commitments to pay or receive interest, e.g., an exchange of floating rate payments for fixed rate payments with respect to a notional amount of principal. Total return swap agreements involve a commitment by one party in the agreement to pay interest in exchange for a market-linked return, both based on notional amounts. To the extent the total return of the security or index underlying the transaction exceeds or falls short of the offsetting interest rate obligation, the party will receive a payment from or make a payment to the counterparty, respectively. Forward spread lock swap agreements involve commitments to pay or receive a settlement amount calculated as the difference between the swap spread and a fixed spread, multiplied by the notional amount times the duration of the swap rate. The swap spread is the difference between the benchmark swap rate (market rate) and the specific treasury rate. In a credit default swap, one party makes a stream of payments to another party in exchange for the right to receive a specified return in the event of a default by a third party on its obligation. Credit default swaps may be used to provide a measure of protection against defaults of sovereign or corporate issuers (i.e., to reduce risk where a party owns or has exposure to the issuer) or to take an active long or short position with respect to the likelihood of a particular issuer's default. Variance swap agreements involve commitments to pay or receive a settlement amount calculated as the difference between the annualized realized variance of returns on the underlying price and a fixed quantity, also known as the variance strike, over a period of time. In connection with these agreements, cash or securities may be set aside as collateral by the Fund's custodian or brokers in accordance with the terms of the swap agreement. The Fund earns or pays interest on cash set aside as collateral.
14
GMO Currency Hedged International Bond Fund
(A Series of GMO Trust)
Notes to Financial Statements — (Continued)
February 29, 2008
Swaps are marked to market daily using models that incorporate quotations from market makers and the change in value, if any, is recorded as unrealized gain or loss in the Statement of Operations. Payments received or made on swap contracts are recorded as realized gain or loss in the Statement of Operations. Gains or losses are realized upon early termination of the swap agreements. These financial instruments are not actively traded on financial markets. The values assigned to these instruments are based upon the best available information and because of the uncertainty of the valuation, these values may differ significantly from the values that would have been realized had a ready market for these instruments existed, and the differences could be material. Entering into these agreements involves, to varying degrees, elements of credit, legal, market and documentation risk in excess of the amounts recognized in the Statement o f Assets and Liabilities. Such risks involve the possibility that there will be no liquid market for these agreements, that the counterparties to the agreements may default on their obligations to perform or disagree as to the meaning of contractual terms in the agreements, or that there may be unfavorable changes in interest rates or the price of the index or security underlying these transactions. Swap agreements outstanding at the end of the period are listed in the Fund's Schedule of Investments.
Repurchase agreements
The Fund may enter into repurchase agreements with banks and broker-dealers whereby the Fund acquires a security for cash and obtains a simultaneous commitment from the seller to repurchase the security at an agreed upon price and date. The Fund, through its custodian, takes possession of securities collateralizing the repurchase agreement. The collateral is marked to market daily to ensure that the market value of the underlying assets remains sufficient to protect the Fund in the event of default by the seller. Collateral for certain tri-party repurchase agreements is held at the counterparty's custodian in a segregated account for the benefit of the Fund and the counterparty. In connection with transactions in repurchase agreements, if the seller defaults or enters into insolvency proceedings and the value of the collateral declines, recovery of cash by the Fund may be delayed or limited. There were no repurchase agreements o utstanding at the end of the period.
Reverse repurchase agreements
The Fund may enter into reverse repurchase agreements with banks and broker-dealers whereby the Fund sells portfolio assets concurrent with an agreement by the Fund to repurchase the same assets at a later date at a fixed price. In connection with these agreements, the Fund establishes segregated accounts with its custodian in which the Fund maintains cash, U.S. government securities or other assets equal in value to its obligations in respect of reverse repurchase agreements. Reverse repurchase agreements involve the risk that the market value of the securities the Fund has sold under the agreement may decline below the price at which the Fund is obligated to repurchase under the agreement. The market value of the securities the Fund has sold is determined daily and any additional required collateral is allocated to or sent by the Fund on the next business day. There were no reverse repurchase agreements outstanding at the end of the period.
15
GMO Currency Hedged International Bond Fund
(A Series of GMO Trust)
Notes to Financial Statements — (Continued)
February 29, 2008
Securities lending
The Fund may lend its securities to certain qualified broker-dealers. The loans are collateralized with cash or liquid securities with a market value at least equal to the market value of the securities on loan. As with other extensions of credit, the Fund may bear the risk of loss with respect to the investment of the collateral, the risk of delay in and/or inability to exercise its rights with respect to the collateral, and the risk of delay in recovery or loss of rights in the loaned securities should the borrower of the securities fail financially. If a loan is collateralized by U.S. government securities, the Fund receives a fee from the borrower. If a loan is collateralized by cash, the Fund typically invests the cash collateral for its own account in interest-bearing, short-term securities and pays a fee to the borrower that normally represents a portion of the Fund's earnings on the collateral. For the year ended Februar y 29, 2008, the Fund did not participate in securities lending.
Taxes and distributions
The Fund intends to qualify each tax year as a regulated investment company under Subchapter M of the Internal Revenue Code of 1986, as amended (the "Code"). The Fund intends to distribute substantially all of its net investment income and net realized short-term and long-term capital gains, if any, after giving effect to any available capital loss carryovers for U.S. federal income tax purposes. Therefore, no provision for U.S. federal income or excise tax is necessary.
The Fund's policy is to declare and pay distributions from net investment income, if any, semiannually, and from net realized short-term and long-term capital gains, if any, at least annually. All distributions are paid in shares of the Fund, at net asset value, unless the shareholder elects to receive cash distributions. Distributions to shareholders are recorded by the Fund on the ex-dividend date.
Income and capital gain distributions are determined in accordance with U.S. federal income tax regulations, which may differ from U.S. GAAP. Certain capital accounts in the financial statements are periodically adjusted for permanent differences in order to reflect their tax character. These adjustments have no impact on net assets or net asset value per share. Temporary differences which arise from recognizing certain items of income, expense, gain or loss in different periods for financial statement and tax purposes will reverse at some time in the future. Distributions in excess of net investment income or net realized gains are temporary over distributions for financial statement purposes resulting from differences in the recognition or classification of income or distributions for financial statement and tax purposes.
U.S. GAAP and tax accounting differences primarily relate to capital loss carryforwards, losses on wash sale transactions, derivative contract transactions, partnership interest tax allocations, foreign currency transactions and post-October capital losses.
16
GMO Currency Hedged International Bond Fund
(A Series of GMO Trust)
Notes to Financial Statements — (Continued)
February 29, 2008
The following reclassification represents the amount necessary to report the stated components of net assets on a tax basis, excluding certain temporary differences, as of February 29, 2008. The financial highlights exclude these adjustments.
| Distributions In Excess Of Net Investment Income | Accumulated Net Realized Gain | Paid-in Capital | |||||||||
| $ | (9,859,589 | ) | $ | 10,421,626 | $ | (562,037 | ) | ||||
The tax character of distributions declared to shareholders is as follows:
| 2/29/2008 | 2/28/2007 | ||||||||||
| Ordinary income (including any short-term capital gains) | $ | 315,341 | $ | 596,003 | |||||||
| Long-term capital gains | — | 6,203,299 | |||||||||
| $ | 315,341 | $ | 6,799,302 | ||||||||
| Tax return of capital | 2,600,431 | 239,876 | |||||||||
| Total distributions | $ | 2,915,772 | $ | 7,039,178 | |||||||
Distributions in excess of tax basis earnings and profits, if significant, are reported in the financial statements as a tax return of capital.
As of February 29, 2008, the Fund elected to defer to March 1, 2008 post-October capital losses of $2,100,592.
As of February 29, 2008, the Fund had capital loss carryforwards available to offset future realized gains if any, to the extent permitted by the Code. Utilization of the capital loss carryforwards could be subject to limitations imposed by the Code related to share ownership activity. Such losses expire as follows:
| 2/28/2009 | $ | (876,665 | ) | ||||
| Total | $ | (876,665 | ) |
17
GMO Currency Hedged International Bond Fund
(A Series of GMO Trust)
Notes to Financial Statements — (Continued)
February 29, 2008
As of February 29, 2008, the approximate cost for U.S. federal income tax purposes and gross and net unrealized appreciation and depreciation in value of investments were as follows:
| Aggregate Cost | Gross Unrealized Appreciation | Gross Unrealized (Depreciation) | Net Unrealized Appreciation (Depreciation) | ||||||||||||
| $ | 166,743,837 | $ | 6,924 | $ | (11,231,765 | ) | $ | (11,224,841 | ) | ||||||
Security transactions and related investment income
Security transactions are accounted for on trade date. Dividend income, net of applicable foreign withholding taxes, if any, is recorded on the ex-dividend date, or when the Fund is informed of the ex-dividend date, if later. Interest income is recorded on the accrual basis and is adjusted for the amortization of premiums and accretion of discounts. Interest income on inflation indexed securities, if any, is accrued daily based upon an inflation adjusted principal. Additionally, any increase or decrease in the principal or face amount of the securities adjusted for inflation is recorded as interest income or loss. Income is not recognized on securities for which collection is not expected. Non-cash dividends, if any, are recorded at the fair market value of the securities received. In determining the net gain or loss on securities sold, the cost of securities is determined on the identified cost basis.
Expenses
The majority of expenses of the Trust are directly identifiable to an individual fund. Expenses which are not readily identifiable to a specific fund are allocated taking into consideration, among other things, the nature and type of expense and the relative size of the funds. In addition, the Fund will also incur certain fees and expenses indirectly as a shareholder in the underlying funds. Because the underlying funds have varied expense and fee levels and the Fund may own different proportions of the underlying funds at different times, the amount of fees and expenses indirectly incurred by the Fund will vary (See Note 3).
State Street Bank and Trust Company ("State Street") serves as custodian, fund accounting agent and transfer agent of the Fund. State Street's fee may be reduced by credits that are an earnings allowance calculated on the average daily cash balances the Fund maintains with State Street. Credit balances used to reduce the fee paid to State Street, if any, are reported as a reduction of expenses in the Statement of Operations.
Investment risks
There are certain additional risks involved in investing in foreign securities that are not inherent in investments in U.S. securities. These risks may involve adverse political and economic developments including the possible imposition of capital controls or other foreign governmental laws or restrictions. In addition, the securities of some foreign companies and securities markets are less liquid and at times may be more volatile than securities of comparable U.S. companies and U.S. securities markets. The risks
18
GMO Currency Hedged International Bond Fund
(A Series of GMO Trust)
Notes to Financial Statements — (Continued)
February 29, 2008
described above apply to an even greater extent to investments in emerging markets. The securities markets of emerging countries are generally smaller, less developed, less liquid, and more volatile than the securities markets of the U.S. and developed foreign markets.
Recently issued accounting pronouncements
In June 2006, the Financial Accounting Standards Board ("FASB") issued FASB Interpretation No. 48, Accounting for Uncertainty in Income Taxes – an Interpretation of FASB Statement No. 109 ("FIN 48"). FIN 48 clarifies the accounting for uncertainty in income taxes recognized in accordance with FASB Statement No. 109, Accounting for Income Taxes. FIN 48 prescribes a recognition threshold and measurement attribute for a tax position taken or expected to be taken in the tax return that could impact the Fund's financial statements. It also provides guidance in relation to the Fund's financial statements on classification of tax benefits or liabilities, interest and penalties, accounting in interim periods, disclosure, and transition. FIN 48 is effective for fiscal years beginning after December 15, 2006 for registered investment companies. Management has evaluated the effects of applying the various provisions of FIN 48 and has determined that the adoption of FIN 48 does not have a material effect on the Fund's financial statements. The Fund's federal tax returns for the prior three fiscal years remain subject to examination by the Internal Revenue Service. Management will continue to monitor the rules and guidance pertaining to FIN 48 and will take action if appropriate.
In September 2006, the FASB issued Statement of Financial Accounting Standards No. 157 ("FAS 157"), "Fair Value Measurements." FAS 157 defines fair value, establishes a framework for measuring fair value in accordance with generally accepted accounting principles and expands disclosure about fair value measurements. FAS 157 is effective for fiscal years beginning after November 15, 2007. Management is currently evaluating the impact the adoption of FAS 157 will have on the Fund's financial statement disclosures.
3. Fees and other transactions with affiliates
GMO earns a management fee paid monthly at the annual rate of 0.25% of average daily net assets. The Fund has adopted a Shareholder Service Plan under which the Fund pays GMO a shareholder service fee for client and shareholder service, reporting, and other support. Pursuant to the Shareholder Service Plan, the shareholder service fee is calculated based on average daily net assets at the annual rate of 0.15% for Class III shares. The Manager will waive the Fund's shareholder service fee to the extent that the aggregate of any direct and indirect shareholder service fees borne by the Fund exceeds 0.15%; provided, however, that the amount of this waiver will not exceed 0.15%.
The Manager has contractually agreed to reimburse the Fund for Fund expenses through at least June 30, 2008 to the extent the Fund's total annual operating expenses (excluding shareholder service fees, expenses indirectly incurred by investment in the underlying funds, fees and expenses of the independent Trustees of the Trust, fees and expenses for legal services not approved by the Manager for the Trust,
19
GMO Currency Hedged International Bond Fund
(A Series of GMO Trust)
Notes to Financial Statements — (Continued)
February 29, 2008
compensation and expenses of the Trust's Chief Compliance Officer ("CCO") (excluding any employee benefits), brokerage commissions, securities lending fees and expenses, interest expense, transfer taxes, and other investment-related costs (including expenses associated with investments in any company that is an investment company or would be an investment company under the 1940 Act, but for the exceptions to the definition of investment company provided in Section 3(c)(1) and 3(c)(7) of the 1940 Act), hedging transaction fees, extraordinary, non-recurring and certain other unusual expenses (including taxes) (collectively, "Excluded Fund Fees and Expenses")) exceed 0.25% of the Fund's average daily net assets. In addition, the Manager has contractually agreed to reimburse the Fund through at least June 30, 2008 to the extent that the sum of (a) the Fund's total annual operating expenses (excluding Excluded Fund Fees and Expenses) and (b) the amount of fees and expenses incurred indirectly by the Fund through its investment in ECDF (excluding ECDF's Excluded Fund Fees and Expenses), exceeds 0.25% of the Fund's average daily net assets, subject to a maximum total reimbursement to the Fund equal to 0.25% of the Fund's average daily net assets.
The Fund incurs fees and expenses indirectly as a shareholder in the underlying funds. For the year ended February 29, 2008, these indirect fees and expenses expressed as an annualized percentage of the Fund's average daily net assets were as follows:
| Indirect Net Expenses (excluding shareholder service fees and interest expense) | Indirect Shareholder Service Fees | Indirect Interest Expense | Total Indirect Expenses | ||||||||||||
| 0.015 | % | 0.005 | % | 0.038 | % | 0.058 | % | ||||||||
The Fund's portion of the fees paid by the Trust to the independent Trustees and CCO during the year ended February 29, 2008 was $1,837 and $774, respectively. The compensation and expenses of the CCO are included in miscellaneous expenses in the Statement of Operations. No remuneration is paid by the Fund to any other officer of the Trust.
4. Purchases and sales of securities
For the year ended February 29, 2008, cost of purchases and proceeds from sales of investments, other than short-term obligations, were as follows:
| Purchases | Sales | ||||||||||
| U.S. Government securities | $ | 5,636,302 | $ | 30,601,160 | |||||||
| Investments (non-U.S. Government securities) | 114,903,288 | 202,986,665 | |||||||||
20
GMO Currency Hedged International Bond Fund
(A Series of GMO Trust)
Notes to Financial Statements — (Continued)
February 29, 2008
5. Guarantees
In the normal course of business the Fund enters into contracts with third-party service providers that contain a variety of representations and warranties and which provide general indemnifications. The Fund's maximum exposure under these arrangements is unknown, as this would involve future claims that may be made against the Fund that have not yet occurred. Based on experience, management is of the view that the risk of loss in connection with these potential indemnification obligations is remote; however, there can be no assurance that material liabilities related to such obligations will not arise in the future that could adversely impact the Fund.
6. Principal shareholders and related parties
As of February 29, 2008, 99.23% of the outstanding shares of the Fund were held by two shareholders, each holding in excess of 10% of the Fund's outstanding shares. No other shareholder owned in excess of 10% of the outstanding shares of the Fund. Investment activities of these shareholders may have a material effect on the Fund.
As of February 29, 2008, less than 0.01% of the Fund's shares were held by two related parties comprised of certain GMO employee accounts, and 99.23% of the Fund's shares were held by accounts for which the Manager has investment discretion.
7. Share transactions
The Declaration of Trust permits the Trustees to issue an unlimited number of shares of beneficial interest (without par value). Transactions in Fund shares were as follows:
| Year Ended February 29, 2008 | Year Ended February 28, 2007 | ||||||||||||||||||
| Class III: | Shares | Amount | Shares | Amount | |||||||||||||||
| Shares sold | 5,140,961 | $ | 46,315,270 | 3,950,878 | $ | 35,845,055 | |||||||||||||
| Shares issued to shareholders in reinvestment of distributions | 335,743 | 2,900,816 | 760,271 | 6,974,406 | |||||||||||||||
| Shares repurchased | (17,538,414 | ) | (157,285,071 | ) | (80,460,422 | ) | (726,098,482 | ) | |||||||||||
| Net increase (decrease) | (12,061,710 | ) | $ | (108,068,985 | ) | (75,749,273 | ) | $ | (683,279,021 | ) | |||||||||
21
GMO Currency Hedged International Bond Fund
(A Series of GMO Trust)
Notes to Financial Statements — (Continued)
February 29, 2008
8. Investments in affiliated issuers
A summary of the Fund's transactions in the shares of affiliated issuers during the year ended February 29, 2008 is set forth below:
| Affiliate | Value, beginning of period | Purchases | Sales Proceeds | Dividend Income | Distributions of Realized Gains | Value, end of period | |||||||||||||||||||||
| GMO Emerging Country Debt Fund, Class III | $ | 8,433,652 | $ | 752,104 | $ | 4,100,000 | $ | 460,024 | $ | 292,080 | $ | 4,677,363 | |||||||||||||||
| GMO Short-Duration Collateral Fund | 183,379,841 | 102,797,680 | 163,675,000 | 7,097,680 | — | 114,475,125 | |||||||||||||||||||||
| GMO Special Purpose Holding Fund | 7,749 | — | — | — | 35,644 | 6,924 | |||||||||||||||||||||
| GMO World Opportunity Overlay Fund | 55,039,560 | 11,250,000 | 34,575,000 | — | — | 31,276,870 | |||||||||||||||||||||
| Totals | $ | 246,860,802 | $ | 114,799,784 | $ | 202,350,000 | $ | 7,557,704 | $ | 327,724 | $ | 150,436,282 | |||||||||||||||
22
Report of Independent Registered Public Accounting Firm
To the Trustees of GMO Trust and the Shareholders of
GMO Currency Hedged International Bond Fund
In our opinion, the accompanying statement of assets and liabilities, including the schedule of investments, and the related statements of operations and of changes in net assets and the financial highlights present fairly, in all material respects, the financial position of GMO Currency Hedged International Bond Fund (the "Fund") at February 29, 2008, the results of its operations for the year then ended, the changes in its net assets for each of the two years in the period then ended and the financial highlights for each of the five years in the period then ended, in conformity with accounting principles generally accepted in the United States of America. These financial statements and financial highlights (hereafter referred to as "financial statements") are the responsibility of the Fund's management; our responsibility is to express an opinion on these financial statements based on our audits. We conducted our audits of the se financial statements in accordance with the standards of the Public Company Accounting Oversight Board (United States). Those standards require that we plan and perform the audit to obtain reasonable assurance about whether the financial statements are free of material misstatement. An audit includes examining, on a test basis, evidence supporting the amounts and disclosures in the financial statements, assessing the accounting principles used and significant estimates made by management, and evaluating the overall financial statement presentation. We believe that our audits, which included confirmation of securities at February 29, 2008 by correspondence with the custodian and brokers, provide a reasonable basis for our opinion.
PricewaterhouseCoopers LLP
Boston, Massachusetts
April 29, 2008
23
GMO Currency Hedged International Bond Fund
(A Series of GMO Trust)
Fund Expenses
February 29, 2008 (Unaudited)
Expense Examples: The following information is in relation to expenses for the six month period ended February 29, 2008.
As a shareholder of the Fund, you may incur two types of costs: (1) transaction costs, and (2) ongoing costs, including management fees, shareholder service fees and other Fund expenses. This example is intended to help you understand your ongoing costs (in dollars) of investing in the Fund and to compare these costs with the ongoing costs of investing in other mutual funds.
These examples are based on an investment of $1,000 invested at the beginning of the period and held for the entire period, September 1, 2007 through February 29, 2008.
Actual Expenses
The first line of the table below provides information about actual account values and actual expenses. You may use the information in this line, together with the amount you invested, to estimate the expenses that you paid over the period. Simply divide your account value by $1,000 (for example, a $10,000,000 account value divided by $1,000 = 10,000), then multiply the result by the number in the first line under the heading entitled "Net Expense Incurred" to estimate the expenses you paid on your account during this period.
Hypothetical Example for Comparison Purposes
The second line of the table below provides information about hypothetical account values and hypothetical expenses based on the Fund's actual expense ratio and an assumed rate of return of 5% per year before expenses, which is not the Fund's actual return. The hypothetical account values and expenses may not be used to estimate the actual ending account balance or expenses you paid for the period. You may use this information to compare the ongoing costs of investing in the Fund with other funds. To do so, compare this 5% hypothetical example with the 5% hypothetical examples that appear in the shareholder reports of other funds.
Please note that the expenses shown in the table are meant to highlight your ongoing costs only and do not reflect any transactional costs. Therefore, the second line of the table is useful in comparing ongoing costs only, and will not help you determine the relative total costs of owning different funds. In addition, if these transactional costs were included, your costs would have been higher.
| Annualized Net Expense Ratio | Beginning Account Value | Ending Account Value | Net Expense Incurred* | ||||||||||||||||
| Class III | |||||||||||||||||||
| 1) Actual | 0.43 | % | $ | 1,000.00 | $ | 989.60 | $ | 2.13 | |||||||||||
| 2) Hypothetical | 0.43 | % | $ | 1,000.00 | $ | 1,022.73 | $ | 2.16 | |||||||||||
* Expenses are calculated using the Class's annualized net expense ratio (including indirect expenses incurred) for the six months ended February 29, 2008, multiplied by the average account value over the period, multiplied by 182 days in the period, divided by 366 days in the year.
24
GMO Currency Hedged International Bond Fund
(A Series of GMO Trust)
Tax Information for the Tax Year Ended February 29, 2008 (Unaudited)
The Fund will notify shareholders of amounts for use in preparing 2008 income tax forms in January 2009.
The Fund hereby designates as qualified interest income with respect to its taxable year ended February 29, 2008, $315,341 or if determined to be different, the qualified interest income of such year.
25
GMO Currency Hedged International Bond Fund
(A Series of GMO Trust)
Note Concerning Distributions (Unaudited)
The Fund previously reported estimated sources of any dividends, short-term capital gains, and long-term capital gains distributions paid on a per share basis. Pursuant to Rule 19a-1(e) of the Investment Company Act, the following serves as a correction of such estimates. 89.18% of distributions to shareholders declared from net investment income during the Fund's fiscal year were reclassified to distributions from return of capital and are reflected as such in the Statement of Changes in Net Assets.
26
Trustees and Officers (Unaudited)
The following tables list the Trust's Trustees and Officers as of the date of this report; their address and date of birth ("DOB"); their position with the Trust; the length of time holding that position with the Trust; their principal occupation(s) during the past five years; the number of portfolios in the fund complex they oversee; and other directorships they hold in companies subject to registration or reporting requirements of the Securities Exchange Act of 1934 (generally called "public companies") or in registered investment companies. The Trust's Statement of Additional Information ("SAI") includes additional information about the Trust's trustees, including changes subsequent to the date of the report. The SAI is available, without charge, upon request by writing GMO, c/o GMO Trust, 40 Rowes Wharf, Boston, MA 02110.
Independent Trustees:
| Name, Address, and DOB | Position(s) Held with Trust | Term of Office1 and Length of Time Served | Principal Occupation(s) During Past Five Years | Number of Portfolios in Fund Complex Overseen by Trustee | Other Directorships Held by Trustee | ||||||||||||||||||
| Donald W. Glazer, Esq. c/o GMO Trust 40 Rowes Wharf Boston, MA 02110 DOB: 07/26/1944 | Chairman of the Board of Trustees | Chairman of the Board of Trustees since March 2005; Lead Independent Trustee (September 2004 – March 2005); Trustee since December 2000. | Consultant – Law and Business2; Vice Chair (since 2002) and Secretary, Provant, Inc. (provider of personnel performance improvement services and training products); Author of Legal Treatises. | 47 | None. | ||||||||||||||||||
1 Each Trustee is elected to serve during the continued lifetime of the Trust until he/she dies, resigns or is removed, or if sooner, until the next meeting of Shareholders called for the purpose of electing Trustees and until the election and qualification of his/her successor.
2 As part of Mr. Glazer's work as a consultant, he provides part-time consulting services to Goodwin Procter LLP ("Goodwin"). Goodwin has provided legal services to Renewable Resources, LLC, an affiliate of GMO; GMO, in connection with its relationship with Renewable Resources; and funds managed by Renewable Resources. Mr. Glazer has represented that he has no financial interest in, and is not involved in the provision of, such legal services. In the calendar years ended December 31, 2006 and December 31, 2007, these entities paid $825,738 and $291,721 respectively, in legal fees and disbursements to Goodwin.
27
Independent Trustees — (Continued)
| Name, Address, and DOB | Position(s) Held with Trust | Term of Office1 and Length of Time Served | Principal Occupation(s) During Past Five Years | Number of Portfolios in Fund Complex Overseen by Trustee | Other Directorships Held by Trustee | ||||||||||||||||||
| Jay O. Light c/o GMO Trust 40 Rowes Wharf Boston, MA 02110 DOB: 10/03/1941 | Trustee | Since May 1996. | Dean (since April 2006), Acting Dean (August 2005 – April 2006), Senior Associate Dean (1998 – 2005), and Professor of Business Administration, Harvard Business School. | 47 | Director of Harvard Management Company, Inc.3 and Verde, Inc.; Director of Partners HealthCare System, Inc. and Chair of its Investment Committee.4 | ||||||||||||||||||
| W. Nicholas Thorndike c/o GMO Trust 40 Rowes Wharf Boston, MA 02110 DOB: 03/28/1933 | Trustee | Since March 2005. | Director or trustee of various corporations and charitable organizations, including Courier Corporation (a book publisher and manufacturer) (July 1989 – present); Putnam Funds (December 1992 – June 2004); and Providence Journal (a newspaper publisher) (December 1986 – December 2003). | 47 | Director of Courier Corporation (a book publisher and manufacturer); Member of the Investment Committee of Partners HealthCare System, Inc.4 | ||||||||||||||||||
1 Each Trustee is elected to serve during the continued lifetime of the Trust until he/she dies, resigns or is removed, or if sooner, until the next meeting of Shareholders called for the purpose of electing Trustees and until the election and qualification of his/her successor.
3 Harvard Management Company, Inc. is a client of the Manager.
4 Partners HealthCare System, Inc. is a client of the Manager.
28
Principal Officers:
| Name, Address, and DOB | Position(s) Held with Trust | Term of Office5 and Length of Time Served | Principal Occupation(s) During Past Five Years | ||||||||||||
| Scott Eston c/o GMO Trust 40 Rowes Wharf Boston, MA 02110 DOB: 01/20/1956 | President and Chief Executive Officer | President and Chief Executive Officer since October 2002; Chief Financial Officer, November 2006 – February 2007. | Chief Financial Officer, Chief Operating Officer and Member, Grantham, Mayo, Van Otterloo & Co. LLC. | ||||||||||||
| Sheppard N. Burnett c/o GMO Trust 40 Rowes Wharf Boston, MA 02110 DOB: 10/24/1968 | Treasurer and Chief Financial Officer | Chief Financial Officer since March 2007; Treasurer since November 2006; Assistant Treasurer, September 2004 – November 2006. | Fund Administration Staff, Grantham, Mayo, Van Otterloo & Co. LLC (June 2004 – present); Vice President, Director of Tax, Columbia Management Group (2002–2004). | ||||||||||||
| Brent C. Arvidson c/o GMO Trust 40 Rowes Wharf Boston, MA 02110 DOB: 06/26/1969 | Assistant Treasurer | Since August 1998. | Senior Fund Administrator, Grantham, Mayo, Van Otterloo & Co. LLC. | ||||||||||||
| John L. Nasrah c/o GMO Trust 40 Rowes Wharf Boston, MA 02110 DOB: 05/27/1977 | Assistant Treasurer | Since March 2007. | Fund Administrator, Grantham, Mayo, Van Otterloo & Co. LLC (September 2004 – present); Tax Analyst, Bain & Company, Inc (June 2003 – September 2004); Senior Tax Associate, PricewaterhouseCoopers LLP (2001 – 2003). | ||||||||||||
| Mahmoodur Rahman c/o GMO Trust 40 Rowes Wharf Boston, MA 02110 DOB: 11/30/1967 | Assistant Treasurer | Since September 2007. | Fund Administrator, Grantham, Mayo, Van Otterloo & Co. (April 2007 – present); Vice President and Senior Tax Manager, Massachusetts Financial Services Company (January 2000 – April 2007). | ||||||||||||
5 Officers are elected to hold such office until their successor is elected and qualified to carry out the duties and responsibilities of their office, or until he or she resigns or is removed from office.
29
Principal Officers — (Continued)
| Name, Address, and DOB | Position(s) Held with Trust | Term of Office5 and Length of Time Served | Principal Occupation(s) During Past Five Years | ||||||||||||
| Michael E. Gillespie c/o GMO Trust 40 Rowes Wharf Boston, MA 02110 DOB: 02/18/1958 | Chief Compliance Officer | Since March 2005. | Vice President of Compliance (June 2004 – February 2005) and Director of Domestic Compliance (March 2002 – June 2004), Fidelity Investments; Vice President and Senior Counsel, State Street Bank and Trust Company (May 1998 – March 2002). | ||||||||||||
| Jason B. Harrison c/o GMO Trust 40 Rowes Wharf Boston, MA 02110 DOB: 01/29/1977 | Vice President and Clerk | Vice President since November 2006; Clerk since March 2006. | Legal Counsel, Grantham, Mayo, Van Otterloo & Co. LLC (since February 2006) and Attorney, Ropes & Gray LLP (September 2002 – February 2006). | ||||||||||||
| David L. Bohan c/o GMO Trust 40 Rowes Wharf Boston, MA 02110 DOB: 06/21/1964 | Vice President and Assistant Clerk | Vice President since March 2005; Assistant Clerk since March 2006. | Legal Counsel, Grantham, Mayo, Van Otterloo & Co. LLC (September 2003 – present); Attorney, Goodwin Procter LLP (September 1996 – September 2003). | ||||||||||||
| Gregory L. Pottle c/o GMO Trust 40 Rowes Wharf Boston, MA 02110 DOB: 07/09/1971 | Vice President and Assistant Clerk | Since November 2006. | Legal Counsel, Grantham, Mayo, Van Otterloo & Co. LLC. | ||||||||||||
| Anne K. Trinque c/o GMO Trust 40 Rowes Wharf Boston, MA 02110 DOB: 04/15/1978 | Vice President and Assistant Clerk | Since September 2007. | Legal Counsel, Grantham, Mayo, Van Otterloo & Co. LLC (since January 2007); Attorney, Goodwin Procter LLP (September 2003 – January 2007). | ||||||||||||
| Cheryl Wakeham c/o GMO Trust 40 Rowes Wharf Boston, MA 02110 DOB: 10/29/1958 | Anti-Money Laundering Officer | Since December 2004. | Manager, Client Service Administration, Grantham, Mayo, Van Otterloo & Co. LLC. | ||||||||||||
5 Officers are elected to hold such office until their successor is elected and qualified to carry out the duties and responsibilities of their office, or until he or she resigns or is removed from office.
30
GMO Special Purpose Holding Fund
(A Series of GMO Trust)
Consolidated Annual Report
February 29, 2008
For a free copy of the Fund's proxy voting guidelines, shareholders may call 1-617-346-7646 (collect), visit our website at www.gmo.com, or visit the Securities and Exchange Commission's website at www.sec.gov. Information regarding how the Fund voted proxies relating to portfolio securities during the most recent 12-month period ended June 30 is available on our website at www.gmo.com, or on the Securities and Exchange Commission's website at www.sec.gov.
The Fund files its complete schedule of portfolio holdings with the Securities and Exchange Commission for the first and third quarter of each fiscal year on Form N-Q, which is available on the Commission's website at www.sec.gov. The Fund's Form N-Q may be reviewed and copied at the Commission's Public Reference Room in Washington, D.C. Information on the operation of the Public Reference Room may be obtained by calling 1-800-SEC-0330.
This report is prepared for the general information of shareholders. It is authorized for distribution to prospective investors only when preceded or accompanied by a prospectus for the GMO Trust.
GMO Special Purpose Holding Fund
(A Series of GMO Trust)
Portfolio Management
Day-to-day management of the Fund's portfolio is the responsibility of the Fixed Income Division at Grantham, Mayo, Van Otterloo & Co. LLC.
Management Discussion and Analysis of Fund Performance
GMO Special Purpose Holding Fund returned +517.5% for the fiscal year ended February 29, 2008, compared with the +5.8% for the JPMorgan U.S. 3 Month Cash Index.
The Fund outperformed the benchmark during the fiscal year by +511.7%. The returns on the Fund were positive as trust administrators released a portion of principal to bondholders in two separate payments; the first payment was in March and the second, smaller payment occurred in October.
The views expressed herein are exclusively those of Grantham, Mayo, Van Otterloo & Co. LLC Management as of the date of this report and are subject to change. GMO disclaims any responsibility to update such views. They are not meant as investment advice.
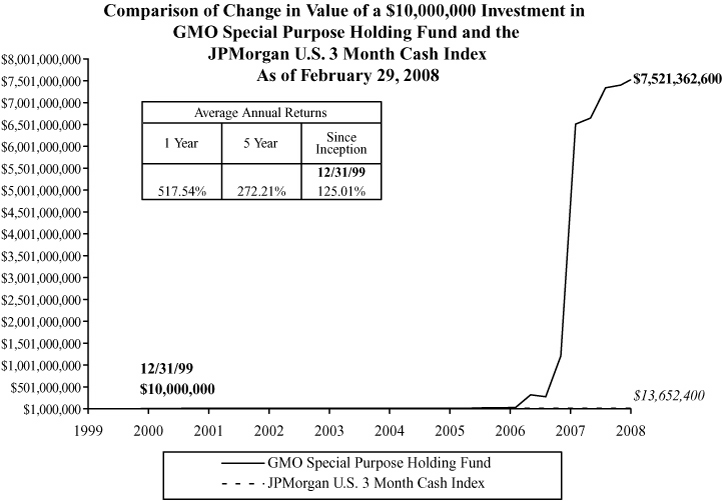
Performance data quoted represents past performance and is not indicative of future results. The investment return and principal value of an investment will fluctuate so that an investor's shares, when redeemed, may be worth more or less than their original cost. Current performance data may be lower or higher than the performance data provided herein. To obtain performance information to the most recent month-end, visit www.gmo.com. Performance shown is net of all fees after reimbursement from the Manager. Returns would have been lower had certain expenses not been reimbursed during the periods shown and do not include the effect of taxes on distributions and redemptions. All information is unaudited.
GMO Special Purpose Holding Fund
(A Series of GMO Trust)
Consolidated Investments Concentration Summary (a)
February 29, 2008 (Unaudited)
| Asset Class Summary | % of Total Net Assets | ||||||
| Debt Obligations | 0.0 | % | |||||
| Other | 100.0 | ||||||
| 100.0 | % | ||||||
(a) GMO SPV I, LLC is a 74.9% owned subsidiary of GMO Special Purpose Holding Fund.
1
GMO Special Purpose Holding Fund
(A Series of GMO Trust)
Consolidated Schedule of Investments
(showing percentage of total net assets)
February 29, 2008
| Description | Value ($) | ||||||
| DEBT OBLIGATIONS — 0.0% (a) | |||||||
| Asset-Backed Securities — 0.0% | |||||||
| Health Care Receivables — 0.0% | |||||||
| Interest related to the Bankruptcy Estate of NPF VI Inc. Series 02-1 Class A (b) (c) | — | ||||||
| Interest related to the Bankruptcy Estate of NPF XII Inc. Series 00-3 Class A (b) (c) | — | ||||||
| Interest related to the Bankruptcy Estate of NPF XII Inc. Series 02-1 Class A (b) (c) | — | ||||||
| — | |||||||
| Total Asset-Backed Securities | — | ||||||
| TOTAL DEBT OBLIGATIONS (COST $0) | — | ||||||
| TOTAL INVESTMENTS — 0.0% (Cost $0) | — | ||||||
| Other Assets and Liabilities (net) — 100.0% | 696,837 | ||||||
| TOTAL NET ASSETS — 100.0% | $ | 696,837 | |||||
Notes to Schedule of Investments:
(a) Owned by GMO SPV I, LLC. GMO SPV I, LLC is a 74.9% subsidiary of GMO Special Purpose
Holding Fund.
(b) Security in default.
(c) Security valued at fair value using methods determined in good faith by or at the direction of the
Trustees of GMO Trust (Note 2).
See accompanying notes to the financial statements.
2
GMO Special Purpose Holding Fund
(A Series of GMO Trust)
Consolidating Statement of Assets and Liabilities — February 29, 2008
| GMO Special Purpose Holding Fund | GMO SPV I, LLC | Minority Interest | Eliminations | Consolidated Totals | |||||||||||||||||||
| Assets: | |||||||||||||||||||||||
| Investments in affiliated issuers, at value (cost $0) (Note 2) | $ | 276,862 | $ | — | $ | — | $ | (276,862 | ) | $ | — | ||||||||||||
| Cash | 510,448 | 476,697 | — | — | 987,145 | ||||||||||||||||||
| Interest receivable | 667 | 625 | — | — | 1,292 | ||||||||||||||||||
| Receivable for expenses reimbursed by Manager (Note 3) | 493 | 8,587 | — | — | 9,080 | ||||||||||||||||||
| Total assets | 788,470 | 485,909 | — | (276,862 | ) | 997,517 | |||||||||||||||||
| Liabilities: | |||||||||||||||||||||||
| Payable to affiliate for (Note 3): | |||||||||||||||||||||||
| Trustees and Chief Compliance Officer of GMO Trust fees | 4 | — | — | — | 4 | ||||||||||||||||||
| Accrued expenses | 91,629 | 121,751 | — | — | 213,380 | ||||||||||||||||||
| Minority interest | — | — | 87,296 | — | 87,296 | ||||||||||||||||||
| Total liabilities | 91,633 | 121,751 | 87,296 | — | 300,680 | ||||||||||||||||||
| Net assets | $ | 696,837 | $ | 364,158 | $ | (87,296 | ) | $ | (276,862 | ) | $ | 696,837 | |||||||||||
| Shares outstanding | 554,071 | 554,071 | |||||||||||||||||||||
| Net asset value per share | $ | 1.26 | $ | 1.26 | |||||||||||||||||||
See accompanying notes to the financial statements.
3
GMO Special Purpose Holding Fund
(A Series of GMO Trust)
Consolidating Statement of Operations — Year Ended February 29, 2008
| GMO Special Purpose Holding Fund | GMO SPV I, LLC | Minority Interest | Eliminations | Consolidated Totals | |||||||||||||||||||
| Investment Income: | |||||||||||||||||||||||
| Interest | $ | 16,049 | $ | 20,508 | $ | — | $ | — | $ | 36,557 | |||||||||||||
| Total income | 16,049 | 20,508 | — | — | 36,557 | ||||||||||||||||||
| Expenses: | |||||||||||||||||||||||
| Custodian and transfer agent fees | 550 | 28,088 | — | — | 28,638 | ||||||||||||||||||
| Audit and tax fees | 39,885 | 10,466 | — | — | 50,351 | ||||||||||||||||||
| Trustees fees and related expenses (Note 3) | 1 | — | — | — | 1 | ||||||||||||||||||
| Miscellaneous | 1,484 | 538 | — | — | 2,022 | ||||||||||||||||||
| Total expenses | 41,920 | 39,092 | — | — | 81,012 | ||||||||||||||||||
| Fees and expenses reimbursed by Manager (Note 3) | (41,919 | ) | (39,092 | ) | — | — | (81,011 | ) | |||||||||||||||
| Net expenses | 1 | — | — | — | 1 | ||||||||||||||||||
| Net income (loss) | 16,048 | 20,508 | — | — | 36,556 | ||||||||||||||||||
| Minority Interest | — | — | (4,916 | ) | — | (4,916 | ) | ||||||||||||||||
| Net investment income (loss) after minority interest | 16,048 | 20,508 | (4,916 | ) | — | 31,640 | |||||||||||||||||
| Realized and unrealized gain (loss): | |||||||||||||||||||||||
| Net realized gain (loss) on: | |||||||||||||||||||||||
| Investments in unaffiliated issuers | — | 4,638,699 | — | — | 4,638,699 | ||||||||||||||||||
| Realized gains distributions from affiliated issuers | 3,593,689 | — | — | (3,593,689 | ) | — | |||||||||||||||||
| Net realized gain (loss) | 3,593,689 | 4,638,699 | — | (3,593,689 | ) | 4,638,699 | |||||||||||||||||
| Change in net unrealized appreciation (depreciation) on: | |||||||||||||||||||||||
| Investments | (98,880 | ) | — | — | 98,880 | — | |||||||||||||||||
| Net unrealized gain (loss) | (98,880 | ) | — | — | 98,880 | — | |||||||||||||||||
| Net realized and unrealized gain (loss) | 3,494,809 | 4,638,699 | — | (3,494,809 | ) | 4,638,699 | |||||||||||||||||
| Minority interest in realized and unrealized gain (loss) | — | — | (1,159,482 | ) | — | (1,159,482 | ) | ||||||||||||||||
| Net increase (decrease) in net assets resulting from operations | $ | 3,510,857 | $ | 4,659,207 | $ | (1,164,398 | ) | $ | (3,494,809 | ) | $ | 3,510,857 | |||||||||||
See accompanying notes to the financial statements.
4
GMO Special Purpose Holding Fund
(A Series of GMO Trust)
Consolidated Statement of Changes in Net Assets
| Year Ended February 29, 2008 | Year Ended February 28, 2007 | ||||||||||
| Increase (decrease) in net assets: | |||||||||||
| Operations: | |||||||||||
| Net investment income (loss) | $ | 36,556 | $ | 32,527 | |||||||
| Net realized gain (loss) | 4,638,699 | 34,577,048 | |||||||||
| Change in net unrealized appreciation (depreciation) | — | (4,162,820 | ) | ||||||||
| 4,675,255 | 30,446,755 | ||||||||||
| Minority Interest | (1,164,398 | ) | (7,632,005 | ) | |||||||
| Net increase (decrease) in net assets from operations | 3,510,857 | 22,814,750 | |||||||||
| Cash distributions to shareholders | (3,593,689 | ) | (26,587,616 | ) | |||||||
| (3,593,689 | ) | (26,587,616 | ) | ||||||||
| Fund share transactions: (Note 7) | |||||||||||
| Proceeds from sale of shares | — | 139,034 | |||||||||
| Cost of shares repurchased | — | (139,034 | ) | ||||||||
| Net increase (decrease) from Fund share transactions | — | — | |||||||||
| Total increase (decrease) in net assets | (82,832 | ) | (3,772,866 | ) | |||||||
| Net assets: | |||||||||||
| Beginning of period | 779,669 | 4,552,535 | |||||||||
| End of period | $ | 696,837 | $ | 779,669 | |||||||
See accompanying notes to the financial statements.
5
GMO Special Purpose Holding Fund
(A Series of GMO Trust)
Consolidated Financial Highlights
(For a share outstanding throughout each period)
| Year Ended February 28/29 | |||||||||||||||||||
| 2008 | 2007 | 2006 | 2005 | ||||||||||||||||
| Net asset value, beginning of period | $ | 1.41 | $ | 8.22 | $ | 15.51 | $ | 24.11 | |||||||||||
| Income from investment operations: | |||||||||||||||||||
| Net investment income (loss)† | 0.06 | 0.02 | (0.08 | ) | 0.41 | ||||||||||||||
| Net realized and unrealized gain (loss) | 6.28 | 41.16 | 8.57 | 9.08 | |||||||||||||||
| Total from investment operations | 6.34 | 41.18 | 8.49 | 9.49 | |||||||||||||||
| Less distributions to shareholders: | |||||||||||||||||||
| From net investment income | — | — | — | (0.74 | ) | ||||||||||||||
| From cash distributions | (6.49 | ) | (47.99 | ) | (15.78 | ) | (17.29 | ) | |||||||||||
| From return of capital | — | — | — | (0.06 | ) | ||||||||||||||
| Total distributions | (6.49 | ) | (47.99 | ) | (15.78 | ) | (18.09 | ) | |||||||||||
| Net asset value, end of period | $ | 1.26 | $ | 1.41 | $ | 8.22 | $ | 15.51 | |||||||||||
| Total Return(b) | 517.54 | %(c) | 3613.95 | %(c) | 124.75 | %(c) | 36.35 | %(c) | |||||||||||
| Ratios/Supplemental Data: | |||||||||||||||||||
| Net assets, end of period (000's) | $ | 697 | $ | 780 | $ | 4,553 | $ | 8,595 | |||||||||||
| Net operating expenses to average daily net assets | 0.00 | % | 0.85 | % | 1.26 | % | (0.01 | )% | |||||||||||
| Interest expense to average daily net assets | — | — | — | — | |||||||||||||||
| Total net expenses to average daily net assets | 0.00 | %(f) | 0.85 | % | 1.26 | % | (0.01 | )% | |||||||||||
| Net investment income to average daily net assets | 3.91 | % | 1.05 | % | (0.65 | )% | 1.83 | % | |||||||||||
| Portfolio turnover rate | 0 | % | 0 | % | 0 | % | 0 | % | |||||||||||
| Fees and expenses reimbursed by the Manager to average daily net assets: | 8.84 | % | 3.74 | % | 1.39 | % | 0.67 | % | |||||||||||
(a) The Fund changed its fiscal year end from November 30 to February 28.
(b) The total returns would have been lower had certain expenses not been reimbursed during the periods shown and assumes the effect of reinvested distributions.
(c) Had the effect of reinvested distributions not been assumed and income from investment operations been retained, the total returns would have been 7.61%, 97.84%, 25.27%, and 39.36% for the fiscal years ended 2008, 2007, 2006, and 2005, respectively.
(d) Interest expense incurred as a result of entering into reverse repurchase agreements is included in the Fund's net expenses. Income earned on investing proceeds from reverse repurchase agreements is included in interest income.
(e) Interest expense as a percentage of average daily net assets was less than 0.01%.
(f) Total net expenses as a percentage of average daily net assets was less than 0.01%.
† Calculated using average shares outstanding throughout the period.
* Annualized.
** Not annualized.
See accompanying notes to the financial statements.
6
GMO Special Purpose Holding Fund
(A Series of GMO Trust)
Consolidated Financial Highlights — (Continued)
(For a share outstanding throughout each period)
| Period from December 1, 2003 through | Year Ended | ||||||||||
| February 29, 2004(a) | November 30, 2003 | ||||||||||
| Net asset value, beginning of period | $ | 23.89 | $ | 23.77 | |||||||
| Income from investment operations: | |||||||||||
| Net investment income (loss)† | 0.13 | 0.75 | |||||||||
| Net realized and unrealized gain (loss) | 0.09 | (0.63 | ) | ||||||||
| Total from investment operations | 0.22 | 0.12 | |||||||||
| Less distributions to shareholders: | |||||||||||
| From net investment income | — | — | |||||||||
| From cash distributions | — | — | |||||||||
| From return of capital | — | — | |||||||||
| Total distributions | — | — | |||||||||
| Net asset value, end of period | $ | 24.11 | $ | 23.89 | |||||||
| Total Return(b) | 0.92 | %** | 0.50 | % | |||||||
| Ratios/Supplemental Data: | |||||||||||
| Net assets, end of period (000's) | $ | 225,727 | $ | 224,113 | |||||||
| Net operating expenses to average daily net assets | 0.08 | %* | 0.13 | % | |||||||
| Interest expense to average daily net assets | 0.04 | %(e)* | 0.00 | %(d)(e) | |||||||
| Total net expenses to average daily net assets | 0.12 | %* | 0.13 | % | |||||||
| Net investment income to average daily net assets | 0.49 | %* | 3.11 | % | |||||||
| Portfolio turnover rate | 4 | %** | 80 | % | |||||||
| Fees and expenses reimbursed by the Manager to average daily net assets: | 0.11 | %* | 0.10 | % | |||||||
See accompanying notes to the financial statements.
7
GMO Special Purpose Holding Fund
(A Series of GMO Trust)
Consolidated Notes to Financial Statements
February 29, 2008
1. Organization
GMO Special Purpose Holding Fund (the "Fund") is a series of GMO Trust (the "Trust"). The Fund is registered under the Investment Company Act of 1940, as amended, as an open-end, non-diversified management investment company. The Fund is advised and managed by Grantham, Mayo, Van Otterloo & Co. LLC (the "Manager" or "GMO"). The Trust was established as a Massachusetts business trust under the laws of the Commonwealth of Massachusetts on June 24, 1985. The Declaration of Trust permits the Trustees of the Trust ("Trustees") to create an unlimited number of series of shares ("Funds") and to subdivide Funds into classes.
The Fund seeks total return. The Fund's investments consist primarily of: (i) units of GMO SPV I, LLC ("SPV"), a special purpose vehicle that holds an interest in liquidating trusts related to certain defaulted asset-backed securities (the "NPF Securities") issued by NPF VI, Inc. and NPF XII, Inc., and (ii) cash and cash items.
Shares of the Fund are not publicly offered and are principally available only to other GMO Funds of the Trust and certain accredited investors. Presently the Fund is closed to new investment.
In April 2004, a plan of liquidation ("the Plan") was approved by the bankruptcy court with respect to National Century Financial Enterprises and the NPF Securities. Pursuant to the Plan, the Fund received a cash distribution, less expenses associated with the transaction and an interest in additional amounts recovered by the bankruptcy estate. The Fund, together with other creditors, are continuing to pursue various claims resulting from its holdings of the NPF Securities. The ultimate amount of losses and costs associated with the NPF Securities that may be recovered by the Fund (through its investment in SPV) is not known at this time.
The Fund has litigation pending against various entities related to the default of the NPF Securities. For the year ended February 29, 2008, the Fund indirectly received $3,593,689 in conjunction with a settlement agreement related to the default of those securities. The outcome of the lawsuits against the remaining defendants is not predictable and any potential recoveries are not reflected in the net asset value of the Fund. To the extent additional recoveries are realized, such recoveries may be material to the net asset value of the Fund.
2. Significant accounting policies
The following is a summary of significant accounting policies which are in conformity with accounting principles generally accepted in the United States of America ("U.S. GAAP") and which are consistently followed by the Fund in the preparation of its financial statements. The preparation of financial statements in accordance with U.S. GAAP requires management to make estimates and assumptions that affect the
8
GMO Special Purpose Holding Fund
(A Series of GMO Trust)
Consolidated Notes to Financial Statements — (Continued)
February 29, 2008
reported amounts and disclosures in the financial statements. Actual results could differ from those estimates. The accounting records of the Fund are maintained in U.S. dollars.
Basis of presentation and principles of consolidation
The accompanying consolidated financial statements include the accounts of the Fund and its majority owned investment in SPV. The consolidated financial statements include 100% of the assets and liabilities of SPV and the ownership interests of minority participants are recorded as "Minority Interest". All significant interfund accounts and transactions have been eliminated in consolidation.
Portfolio valuation
Securities listed on a securities exchange for which market quotations are readily available are valued at the last sale price or official closing price on each business day, or if there is no such reported sale or official closing price, at the most recent quoted bid price. Unlisted securities for which market quotations are readily available are generally valued at the most recent quoted bid price. Short-term investments with a remaining maturity of sixty days or less are generally valued at amortized cost, which approximates fair value. Shares of investment funds are valued at their net asset value. Securities for which quotations are not readily available or whose values the Manager has determined to be unreliable are valued at fair value as determined in good faith by the Trustees or other persons acting at their direction pursuant to procedures approved by the Trustees. By its nature, a fair value price is a good faith est imate of the value of a security at a given point in time and may not reflect the value that would be realized if the security was sold and the differences could be material.
Taxes
Effective April 1, 2004, the Fund elected to be taxed as a partnership for federal income tax purposes and, accordingly, the Fund is no longer a regulated investment company for federal income tax purposes. As a partnership, the Fund will not be subject to federal and state income tax. Instead, each shareholder is responsible for the tax liability or benefit related to his/her allocable share of taxable income or loss. Accordingly, no provision (benefit) for federal and state income taxes is reflected in the accompanying financial statements.
As of February 29, 2008, the approximate cost for U.S. federal income tax purposes and gross and net unrealized appreciation and depreciation in value of investments were as follows:
| Aggregate Cost | Gross Unrealized Appreciation | Gross Unrealized (Depreciation) | Net Unrealized Appreciation (Depreciation) | ||||||||||||
| $ | — | $ | — | $ | — | $ | — | ||||||||
SPV is also treated as a partnership for federal income tax purposes and subject to the same rules as the Fund with respect to the taxation of partnerships.
9
GMO Special Purpose Holding Fund
(A Series of GMO Trust)
Consolidated Notes to Financial Statements — (Continued)
February 29, 2008
Distributions
The Fund will distribute proceeds and other cash receipts received from its underlying investments. Distributions made by the Fund, other than a distribution in partial or complete redemption of a shareholder's interest in the Fund, are reported in the Fund's financial statements as cash distributions.
Security transactions and related investment income
Security transactions are accounted for on trade date. Interest income is recorded on the accrual basis and is adjusted for the amortization of premiums and accretion of discounts. Income is not recognized on securities for which collection is not expected. In determining the net gain or loss on securities sold, the cost of securities is determined on the identified cost basis.
Expenses
The majority of expenses of the Trust are directly identifiable to an individual fund. Expenses which are not readily identifiable to a specific fund are allocated taking into consideration, among other things, the nature and type of expense and the relative size of the funds.
State Street Bank and Trust Company ("State Street") serves as custodian, fund accounting agent and transfer agent of the Fund. State Street's fee may be reduced by credits that are an earnings allowance calculated on the average daily cash balances the Fund maintains with State Street. Credit balances used to reduce the fee paid to State Street, if any, are reported as a reduction of expenses in the Consolidating Statement of Operations.
Recently issued accounting pronouncements
In June 2006, the Financial Accounting Standards Board ("FASB") issued FASB Interpretation No. 48, Accounting for Uncertainty in Income Taxes – an Interpretation of FASB Statement No. 109 ("FIN 48"). FIN 48 clarifies the accounting for uncertainty in income taxes recognized in accordance with FASB Statement No. 109, Accounting for Income Taxes. FIN 48 prescribes a recognition threshold and measurement attribute for a tax position taken or expected to be taken in the tax return that could impact the Fund's financial statements. It also provides guidance in relation to the Fund's financial statements on classification of tax benefits or liabilities, interest and penalties, accounting in interim periods, disclosure, and transition. FIN 48 is effective for fiscal years beginning after December 15, 2006 for registered investment companies. Management has evaluated the effects of applying the various provisions of FIN 48 and has determined that the adoption of FIN 48 does not have a material effect on the Fund's financial statements. The Fund's federal tax returns for the prior three fiscal years, if applicable, remain subject to examination by the Internal Revenue Service. Management will continue to monitor the rules and guidance pertaining to FIN 48 and will take action if appropriate.
In September 2006, the FASB issued Statement of Financial Accounting Standards No. 157 ("FAS 157"), "Fair Value Measurements." FAS 157 defines fair value, establishes a framework for measuring fair value
10
GMO Special Purpose Holding Fund
(A Series of GMO Trust)
Consolidated Notes to Financial Statements — (Continued)
February 29, 2008
in accordance with generally accepted accounting principles and expands disclosure about fair value measurements. FAS 157 is effective for fiscal years beginning after November 15, 2007. Management is currently evaluating the impact the adoption of FAS 157 will have on the Fund's financial statement disclosures.
3. Fees and other transactions with affiliates
GMO does not charge the Fund any management or service fees for its services. In addition, the Manager has contractually agreed to reimburse the Fund for Fund expenses through at least June 30, 2008 (excluding expenses indirectly incurred by investment in underlying funds, fees and expenses of the independent Trustees of the Trust, fees and expenses for legal services not approved by the Manager for the Trust, compensation and expenses of the Trust's Chief Compliance Officer ("CCO") (excluding any employee benefits), brokerage commissions, securities lending fees and expenses, interest expense, transfer taxes, and other investment-related costs (including expenses associated with investments in any company that is an investment company or would be an investment company under the 1940 Act, but for the exceptions to the definition of investment company provided in Section 3(c)(1) and 3(c)(7) of the 1940 Act), hedging transaction f ees, extraordinary, non-recurring and certain other unusual expenses (including taxes). The costs incurred in connection with the Fund's pursuit of legal claims arising from the Fund's investment in the NPF securities are being treated for the purposes of the expense reimbursement as extraordinary expenses.
The Fund's portion of the fees paid by the Trust to the independent Trustees and CCO during the year ended February 29, 2008 was $1 and $0, respectively. The compensation and expenses of the CCO are included in miscellaneous expenses in the Consolidating Statement of Operations. No remuneration was paid by the Fund to any other officer of the Trust.
4. Purchases and sales of securities
There were no purchases or sales of securities, excluding short-term investments, for the year ended February 29, 2008.
5. Guarantees
In the normal course of business the Fund enters into contracts with third-party service providers that contain a variety of representations and warranties and which provide general indemnifications. The Fund's maximum exposure under these arrangements is unknown, as this would involve future claims that may be made against the Fund that have not yet occurred. Based on experience, management is of the view that the risk of loss in connection with these potential indemnification obligations is remote; however, there can be no assurance that material liabilities related to such obligations will not arise in the future that could adversely impact the Fund.
11
GMO Special Purpose Holding Fund
(A Series of GMO Trust)
Consolidated Notes to Financial Statements — (Continued)
February 29, 2008
6. Principal shareholders and related parties
At February 29, 2008, 61.72% of the outstanding shares of the Fund were held by three shareholders, each holding in excess of 10% of the Fund's outstanding shares. No other shareholder owned in excess of 10% of the outstanding shares of the Fund. One of the shareholders is another fund of the Trust. Investment activities of these shareholders may have a material effect on the Fund.
As of February 29, 2008, there were no shares held by related parties, and 100% of the Fund's shares were held by accounts for which the Manager has investment discretion.
7. Share transactions
The Declaration of Trust permits the Trustees to issue an unlimited number of shares of beneficial interest (without par value). Transactions in Fund shares were as follows:
| Year Ended February 29, 2008 | Year Ended February 28, 2007 | ||||||||||
| Shares sold | — | 28,918 | |||||||||
| Shares repurchased | — | (28,918 | ) | ||||||||
| Net decrease | — | — | |||||||||
| Fund shares: | |||||||||||
| Beginning of period | 554,071 | 554,071 | |||||||||
| End of period | 554,071 | 554,071 | |||||||||
12
Report of Independent Registered Public Accounting Firm
To the Trustees of GMO Trust and the Shareholders of
GMO Special Purpose Holding Fund
In our opinion, the accompanying consolidated statement of assets and liabilities, including the consolidated schedule of investments, and the related consolidated statements of operations and of changes in net assets and the financial highlights present fairly, in all material respects, the financial position of GMO Special Purpose Holding Fund (the "Fund") and subsidiary at February 29, 2008, the results of their operations for the year then ended, the changes in their net assets for each of the two years in the period then ended and the financial highlights for each of the periods indicated, in conformity with accounting principles generally accepted in the United States of America. These financial statements and financial highlights (hereafter referred to as "financial statements") are the responsibility of the Fund's management; our responsibility is to express an opinion on these financial statements based on our audits. W e conducted our audits of these financial statements in accordance with the standards of the Public Company Accounting Oversight Board (United States). Those standards require that we plan and perform the audit to obtain reasonable assurance about whether the financial statements are free of material misstatement. An audit includes examining, on a test basis, evidence supporting the amounts and disclosures in the financial statements, assessing the accounting principles used and significant estimates made by management, and evaluating the overall financial statement presentation. We believe that our audits, which included confirmation of securities at February 29, 2008 by correspondence with the custodian, provide a reasonable basis for our opinion.
PricewaterhouseCoopers LLP
Boston, Massachusetts
April 29, 2008
13
GMO Special Purpose Holding Fund
(A Series of GMO Trust)
Fund Expenses
February 29, 2008 (Unaudited)
Expense Examples: The following information is in relation to expenses for the six month period ended February 29, 2008.
As a shareholder of the Fund, you may incur two types of costs: (1) transaction costs, and (2) ongoing costs. This example is intended to help you understand your ongoing costs (in dollars) of investing in the Fund and to compare these costs with the ongoing costs of investing in other mutual funds.
These examples are based on an investment of $1,000 invested at the beginning of the period and held for the entire period, September 1, 2007 through February 29, 2008.
Actual Expenses
The first line of the table below provides information about actual account values and actual expenses. You may use the information in this line, together with the amount you invested, to estimate the expenses that you paid over the period. Simply divide your account value by $1,000 (for example, a $10,000,000 account value divided by $1,000 = 10,000), then multiply the result by the number in the first line under the heading entitled "Net Expense Incurred" to estimate the expenses you paid on your account during this period.
Hypothetical Example for Comparison Purposes
The second line of the table below provides information about hypothetical account values and hypothetical expenses based on the Fund's actual expense ratio and an assumed rate of return of 5% per year before expenses, which is not the Fund's actual return. The hypothetical account values and expenses may not be used to estimate the actual ending account balance or expenses you paid for the period. You may use this information to compare the ongoing costs of investing in the Fund with other funds. To do so, compare this 5% hypothetical example with the 5% hypothetical examples that appear in the shareholder reports of the other funds.
Please note that the expenses shown in the table are meant to highlight your ongoing costs only and do not reflect any transactional costs, such as purchase premiums and redemption fees. Therefore, the second line of the table is useful in comparing ongoing costs only, and will not help you determine the relative total costs of owning different funds. In addition, if these transactional costs were included, your costs would have been higher.
| Annualized Net Expense Ratio | Beginning Account Value | Ending Account Value | Net Expense Incurred* | ||||||||||||||||
| 1) Actual | 0.00 | % | $ | 1,000.00 | $ | 1,131.44 | $ | 0.00 | |||||||||||
| 2) Hypothetical | 0.00 | % | $ | 1,000.00 | $ | 1,024.86 | $ | 0.00 | |||||||||||
* Expenses are calculated using the annualized net expense ratio for the six months ended February 29, 2008, multiplied by the average account value over the period, multiplied by 182 days in the period, divided by 366 days in the year. Net expenses incurred were less than $0.01.
14
Trustees and Officers (Unaudited)
The following tables list the Trust's Trustees and Officers as of the date of this report; their address and date of birth ("DOB"); their position with the Trust; the length of time holding that position with the Trust; their principal occupation(s) during the past five years; the number of portfolios in the fund complex they oversee; and other directorships they hold in companies subject to registration or reporting requirements of the Securities Exchange Act of 1934 (generally called "public companies") or in registered investment companies. The Trust's Statement of Additional Information ("SAI") includes additional information about the Trust's trustees, including changes subsequent to the date of the report. The SAI is available, without charge, upon request by writing GMO, c/o GMO Trust, 40 Rowes Wharf, Boston, MA 02110.
Independent Trustees:
| Name, Address, and DOB | Position(s) Held with Trust | Term of Office1 and Length of Time Served | Principal Occupation(s) During Past Five Years | Number of Portfolios in Fund Complex Overseen by Trustee | Other Directorships Held by Trustee | ||||||||||||||||||
| Donald W. Glazer, Esq. c/o GMO Trust 40 Rowes Wharf Boston, MA 02110 DOB: 07/26/1944 | Chairman of the Board of Trustees | Chairman of the Board of Trustees since March 2005; Lead Independent Trustee (September 2004 – March 2005); Trustee since December 2000. | Consultant – Law and Business2; Vice Chair (since 2002) and Secretary, Provant, Inc. (provider of personnel performance improvement services and training products); Author of Legal Treatises. | 47 | None. | ||||||||||||||||||
1 Each Trustee is elected to serve during the continued lifetime of the Trust until he/she dies, resigns or is removed, or if sooner, until the next meeting of Shareholders called for the purpose of electing Trustees and until the election and qualification of his/her successor.
2 As part of Mr. Glazer's work as a consultant, he provides part-time consulting services to Goodwin Procter LLP ("Goodwin"). Goodwin has provided legal services to Renewable Resources, LLC, an affiliate of GMO; GMO, in connection with its relationship with Renewable Resources; and funds managed by Renewable Resources. Mr. Glazer has represented that he has no financial interest in, and is not involved in the provision of, such legal services. In the calendar years ended December 31, 2006 and December 31, 2007, these entities paid $825,738 and $291,721 respectively, in legal fees and disbursements to Goodwin.
15
Independent Trustees — (Continued)
| Name, Address, and DOB | Position(s) Held with Trust | Term of Office1 and Length of Time Served | Principal Occupation(s) During Past Five Years | Number of Portfolios in Fund Complex Overseen by Trustee | Other Directorships Held by Trustee | ||||||||||||||||||
| Jay O. Light c/o GMO Trust 40 Rowes Wharf Boston, MA 02110 DOB: 10/03/1941 | Trustee | Since May 1996. | Dean (since April 2006), Acting Dean (August 2005 – April 2006), Senior Associate Dean (1998 – 2005), and Professor of Business Administration, Harvard Business School. | 47 | Director of Harvard Management Company, Inc.3 and Verde, Inc.; Director of Partners HealthCare System, Inc. and Chair of its Investment Committee.4 | ||||||||||||||||||
| W. Nicholas Thorndike c/o GMO Trust 40 Rowes Wharf Boston, MA 02110 DOB: 03/28/1933 | Trustee | Since March 2005. | Director or trustee of various corporations and charitable organizations, including Courier Corporation (a book publisher and manufacturer) (July 1989 – present); Putnam Funds (December 1992 – June 2004); and Providence Journal (a newspaper publisher) (December 1986 – December 2003). | 47 | Director of Courier Corporation (a book publisher and manufacturer); Member of the Investment Committee of Partners HealthCare System, Inc.4 | ||||||||||||||||||
1 Each Trustee is elected to serve during the continued lifetime of the Trust until he/she dies, resigns or is removed, or if sooner, until the next meeting of Shareholders called for the purpose of electing Trustees and until the election and qualification of his/her successor.
3 Harvard Management Company, Inc. is a client of the Manager.
4 Partners HealthCare System, Inc. is a client of the Manager.
16
Principal Officers:
| Name, Address, and DOB | Position(s) Held with Trust | Term of Office5 and Length of Time Served | Principal Occupation(s) During Past Five Years | ||||||||||||
| Scott Eston c/o GMO Trust 40 Rowes Wharf Boston, MA 02110 DOB: 01/20/1956 | President and Chief Executive Officer | President and Chief Executive Officer since October 2002; Chief Financial Officer, November 2006 – February 2007. | Chief Financial Officer, Chief Operating Officer and Member, Grantham, Mayo, Van Otterloo & Co. LLC. | ||||||||||||
| Sheppard N. Burnett c/o GMO Trust 40 Rowes Wharf Boston, MA 02110 DOB: 10/24/1968 | Treasurer and Chief Financial Officer | Chief Financial Officer since March 2007; Treasurer since November 2006; Assistant Treasurer, September 2004 – November 2006. | Fund Administration Staff, Grantham, Mayo, Van Otterloo & Co. LLC (June 2004 – present); Vice President, Director of Tax, Columbia Management Group (2002 – 2004). | ||||||||||||
| Brent C. Arvidson c/o GMO Trust 40 Rowes Wharf Boston, MA 02110 DOB: 06/26/1969 | Assistant Treasurer | Since August 1998. | Senior Fund Administrator, Grantham, Mayo, Van Otterloo & Co. LLC. | ||||||||||||
| John L. Nasrah c/o GMO Trust 40 Rowes Wharf Boston, MA 02110 DOB: 05/27/1977 | Assistant Treasurer | Since March 2007. | Fund Administrator, Grantham, Mayo, Van Otterloo & Co. LLC (September 2004 – present); Tax Analyst, Bain & Company, Inc (June 2003 – September 2004); Senior Tax Associate, PricewaterhouseCoopers LLP (2001 – 2003). | ||||||||||||
| Mahmoodur Rahman c/o GMO Trust 40 Rowes Wharf Boston, MA 02110 DOB: 11/30/1967 | Assistant Treasurer | Since September 2007. | Fund Administrator, Grantham, Mayo, Van Otterloo & Co. (April 2007 – present); Vice President and Senior Tax Manager, Massachusetts Financial Services Company (January 2000 – April 2007). | ||||||||||||
5 Officers are elected to hold such office until their successor is elected and qualified to carry out the duties and responsibilities of their office, or until he or she resigns or is removed from office.
17
Principal Officers — (Continued)
| Name, Address, and DOB | Position(s) Held with Trust | Term of Office5 and Length of Time Served | Principal Occupation(s) During Past Five Years | ||||||||||||
| Michael E. Gillespie c/o GMO Trust 40 Rowes Wharf Boston, MA 02110 DOB: 02/18/1958 | Chief Compliance Officer | Since March 2005. | Vice President of Compliance (June 2004 – February 2005) and Director of Domestic Compliance (March 2002 – June 2004), Fidelity Investments; Vice President and Senior Counsel, State Street Bank and Trust Company (May 1998 – March 2002). | ||||||||||||
| Jason B. Harrison c/o GMO Trust 40 Rowes Wharf Boston, MA 02110 DOB: 01/29/1977 | Vice President and Clerk | Vice President since November 2006; Clerk since March 2006. | Legal Counsel, Grantham, Mayo, Van Otterloo & Co. LLC (since February 2006) and Attorney, Ropes & Gray LLP (September 2002 – February 2006). | ||||||||||||
| David L. Bohan c/o GMO Trust 40 Rowes Wharf Boston, MA 02110 DOB: 06/21/1964 | Vice President and Assistant Clerk | Vice President since March 2005; Assistant Clerk since March 2006. | Legal Counsel, Grantham, Mayo, Van Otterloo & Co. LLC (September 2003 – present); Attorney, Goodwin Procter LLP (September 1996 – September 2003). | ||||||||||||
| Gregory L. Pottle c/o GMO Trust 40 Rowes Wharf Boston, MA 02110 DOB: 07/09/1971 | Vice President and Assistant Clerk | Since November 2006. | Legal Counsel, Grantham, Mayo, Van Otterloo & Co. LLC. | ||||||||||||
| Anne K. Trinque c/o GMO Trust 40 Rowes Wharf Boston, MA 02110 DOB: 04/15/1978 | Vice President and Assistant Clerk | Since September 2007. | Legal Counsel, Grantham, Mayo, Van Otterloo & Co. LLC (since January 2007); Attorney, Goodwin Procter LLP (September 2003 – January 2007). | ||||||||||||
| Cheryl Wakeham c/o GMO Trust 40 Rowes Wharf Boston, MA 02110 DOB: 10/29/1958 | Anti-Money Laundering Officer | Since December 2004. | Manager, Client Service Administration, Grantham, Mayo, Van Otterloo & Co. LLC. | ||||||||||||
5 Officers are elected to hold such office until their successor is elected and qualified to carry out the duties and responsibilities of their office, or until he or she resigns or is removed from office.
18
GMO U.S. Quality Equity Fund
(A Series of GMO Trust)
Annual Report
February 29, 2008
For a free copy of the Fund's proxy voting guidelines, shareholders may call 1-617-346-7646 (collect), visit our website at www.gmo.com, or visit the Securities and Exchange Commission's website at www.sec.gov. Information regarding how the Fund voted proxies relating to portfolio securities during the most recent 12-month period ended June 30 is available on our website at www.gmo.com, or on the Securities and Exchange Commission's website at www.sec.gov.
The Fund files its complete schedule of portfolio holdings with the Securities and Exchange Commission for the first and third quarter of each fiscal year on Form N-Q, which is available on the Commission's website at www.sec.gov. The Fund's Form N-Q may be reviewed and copied at the Commission's Public Reference Room in Washington, D.C. Information on the operation of the Public Reference Room may be obtained by calling 1-800-SEC-0330. The Fund has a policy with respect to disclosure of portfolio holdings under which it may also make available on GMO's website (www.gmo.com) a complete schedule of portfolio holdings.
This report is prepared for the general information of shareholders. It is authorized for distribution to prospective investors only when preceded or accompanied by a prospectus for the GMO Trust.
GMO U.S. Quality Equity Fund
(A Series of GMO Trust)
Portfolio Management
Day-to-day management of the Fund's portfolio is the responsibility of the U.S. Quantitative team at Grantham, Mayo, Van Otterloo & Co. LLC.
Management Discussion and Analysis of Fund Performance
The Class III shares of the GMO U.S. Quality Equity Fund returned -1.8% for the fiscal year ended February 29, 2008, as compared to -3.6% for the S&P 500 Index. The Fund was invested substantially in U.S. equity securities throughout the period.
Stock selection detracted from returns relative to the S&P 500 Index. Selections in Telecommunication Services, Information Technology, and Consumer Staples added to relative returns while selections in Consumer Discretionary, Health Care, and Energy detracted. Overweight positions in Coca-Cola and Merck and an underweight in Citigroup added to relative returns. Overweight positions in Lowe's Companies, Home Depot, and Forest Laboratories detracted.
Sector selection added to returns relative to the S&P 500 Index. Sector weightings positively impacting relative performance included an underweight position in Financials and overweight positions in Consumer Staples and Health Care. Sector weightings negatively impacting relative performance included underweight positions in Energy, Materials, and Industrials.
The views expressed herein are exclusively those of Grantham, Mayo, Van Otterloo & Co. LLC Management as of the date of this report and are subject to change. GMO disclaims any responsibility to update such views. They are not meant as investment advice. References to specific securities are not recommendations of such securities and may not be representative of any GMO portfolio's current or future investments.

Performance data quoted represents past performance and is not indicative of future results. The investment return and principal value of an investment will fluctuate so that an investor's shares, when redeemed, may be worth more or less than their original cost. Current performance data may be lower or higher than the performance data provided herein. To obtain performance information to the most recent month-end, visit www.gmo.com. Performance shown is net of all fees after reimbursement from the Manager. Returns would have been lower had certain expenses not been reimbursed during the periods shown and do not include the effect of taxes on distributions and redemptions. All information is unaudited. Performance for Classes IV, V and VI will vary due to different fees.
GMO U.S. Quality Equity Fund
(A Series of GMO Trust)
Investments Concentration Summary
February 29, 2008 (Unaudited)
| Asset Class Summary | % of Total Net Assets | ||||||
| Common Stocks | 94.8 | % | |||||
| Short-Term Investments | 4.8 | ||||||
| Futures | (0.0 | ) | |||||
| Other | 0.4 | ||||||
| 100.0 | % | ||||||
| Industry Sector Summary | % of Equity Investments | ||||||
| Health Care | 31.2 | % | |||||
| Consumer Staples | 24.5 | ||||||
| Information Technology | 18.7 | ||||||
| Energy | 10.7 | ||||||
| Industrials | 5.7 | ||||||
| Consumer Discretionary | 4.8 | ||||||
| Telecommunication Services | 4.2 | ||||||
| Financials | 0.2 | ||||||
| 100.0 | % | ||||||
1
GMO U.S. Quality Equity Fund
(A Series of GMO Trust)
Schedule of Investments
(showing percentage of total net assets)
February 29, 2008
| Shares | Description | Value ($) | |||||||||||||
| COMMON STOCKS — 94.8% | |||||||||||||||
| Consumer Discretionary — 4.5% | |||||||||||||||
| 247,700 | Coach, Inc. * | 7,510,264 | |||||||||||||
| 7,188,600 | Home Depot, Inc. | 190,857,330 | |||||||||||||
| 3,540,400 | Lowe's Cos., Inc. | 84,863,388 | |||||||||||||
| 381,500 | McDonald's Corp. | 20,642,965 | |||||||||||||
| 220,300 | Nike, Inc.-Class B | 13,262,060 | |||||||||||||
| 379,200 | Target Corp. | 19,949,712 | |||||||||||||
| 531,800 | VF Corp. | 40,438,072 | |||||||||||||
| Total Consumer Discretionary | 377,523,791 | ||||||||||||||
| Consumer Staples — 23.2% | |||||||||||||||
| 1,306,200 | Anheuser-Busch Cos., Inc. | 61,508,958 | |||||||||||||
| 662,100 | Avon Products, Inc. | 25,199,526 | |||||||||||||
| 233,700 | Clorox Co. | 13,599,003 | |||||||||||||
| 8,782,300 | Coca-Cola Co. (The) | 513,413,258 | |||||||||||||
| 726,000 | Colgate-Palmolive Co. | 55,241,340 | |||||||||||||
| 299,800 | Energizer Holdings, Inc. * | 27,830,434 | |||||||||||||
| 477,200 | Estee Lauder Cos. (The), Inc.-Class A | 20,319,176 | |||||||||||||
| 267,800 | General Mills, Inc. | 14,994,122 | |||||||||||||
| 379,400 | Kellogg Co. | 19,243,168 | |||||||||||||
| 1,004,400 | Kimberly-Clark Corp. | 65,466,792 | |||||||||||||
| 1,219,800 | Kraft Foods, Inc. | 38,021,166 | |||||||||||||
| 4,168,600 | PepsiCo, Inc. | 289,967,816 | |||||||||||||
| 3,157,300 | Procter & Gamble Co. (The) | 208,950,114 | |||||||||||||
| 1,262,600 | Walgreen Co. | 46,097,526 | |||||||||||||
| 10,387,600 | Wal-Mart Stores, Inc. | 515,121,084 | |||||||||||||
| 397,300 | WM Wrigley Jr. Co. | 23,782,378 | |||||||||||||
| Total Consumer Staples | 1,938,755,861 | ||||||||||||||
| Energy — 10.1% | |||||||||||||||
| 3,525,100 | Chevron Corp. | 305,485,166 | |||||||||||||
| 6,185,500 | Exxon Mobil Corp. | 538,200,355 | |||||||||||||
| Total Energy | 843,685,521 | ||||||||||||||
See accompanying notes to the financial statements.
2
GMO U.S. Quality Equity Fund
(A Series of GMO Trust)
Schedule of Investments — (Continued)
(showing percentage of total net assets)
February 29, 2008
| Shares | Description | Value ($) | |||||||||||||
| Financials — 0.2% | |||||||||||||||
| 283,400 | Allstate Corp. (The) | 13,526,682 | |||||||||||||
| Health Care — 29.7% | |||||||||||||||
| 2,248,505 | Abbott Laboratories | 120,407,443 | |||||||||||||
| 1,224,860 | Amgen, Inc. * | 55,755,627 | |||||||||||||
| 684,600 | Coventry Health Care, Inc. * | 35,510,202 | |||||||||||||
| 2,058,873 | Eli Lilly & Co. | 102,984,828 | |||||||||||||
| 812,400 | Express Scripts, Inc. * | 48,012,840 | |||||||||||||
| 1,313,600 | Forest Laboratories, Inc. * | 52,241,872 | |||||||||||||
| 8,044,100 | Johnson & Johnson | 498,412,436 | |||||||||||||
| 1,844,130 | Medtronic, Inc. | 91,026,257 | |||||||||||||
| 7,303,000 | Merck & Co., Inc. | 323,522,900 | |||||||||||||
| 22,536,700 | Pfizer, Inc. | 502,117,676 | |||||||||||||
| 531,000 | Stryker Corp. | 34,573,410 | |||||||||||||
| 7,938,800 | UnitedHealth Group, Inc. | 368,995,424 | |||||||||||||
| 783,200 | WellPoint, Inc. * | 54,886,656 | |||||||||||||
| 1,941,320 | Wyeth | 84,680,378 | |||||||||||||
| 1,317,500 | Zimmer Holdings, Inc. * | 99,194,575 | |||||||||||||
| Total Health Care | 2,472,322,524 | ||||||||||||||
| Industrials — 5.4% | |||||||||||||||
| 2,607,100 | 3M Co. | 204,396,640 | |||||||||||||
| 673,600 | Danaher Corp. | 49,947,440 | |||||||||||||
| 203,300 | General Dynamics Corp. | 16,640,105 | |||||||||||||
| 257,600 | Illinois Tool Works, Inc. | 12,640,432 | |||||||||||||
| 303,600 | L-3 Communications Holdings, Inc. | 32,269,644 | |||||||||||||
| 731,800 | United Parcel Service, Inc.-Class B | 51,401,632 | |||||||||||||
| 1,196,000 | United Technologies Corp. | 84,329,960 | |||||||||||||
| Total Industrials | 451,625,853 | ||||||||||||||
| Information Technology — 17.7% | |||||||||||||||
| 9,456,700 | Cisco Systems, Inc. * | 230,459,779 | |||||||||||||
| 412,800 | Citrix Systems, Inc. * | 13,593,504 | |||||||||||||
| 3,193,900 | Dell, Inc. * | 63,398,915 | |||||||||||||
See accompanying notes to the financial statements.
3
GMO U.S. Quality Equity Fund
(A Series of GMO Trust)
Schedule of Investments — (Continued)
(showing percentage of total net assets)
February 29, 2008
| Shares/ Par Value ($) | Description | Value ($) | |||||||||||||
| Information Technology — continued | |||||||||||||||
| 3,935,273 | eBay, Inc. * | 103,733,796 | |||||||||||||
| 525,800 | Fiserv, Inc. * | 27,667,596 | |||||||||||||
| 164,000 | Google, Inc.-Class A * | 77,273,520 | |||||||||||||
| 1,520,300 | International Business Machines Corp. | 173,101,358 | |||||||||||||
| 15,011,100 | Microsoft Corp. | 408,602,142 | |||||||||||||
| 6,743,500 | Oracle Corp. * | 126,777,800 | |||||||||||||
| 5,961,500 | Qualcomm, Inc. | 252,588,755 | |||||||||||||
| Total Information Technology | 1,477,197,165 | ||||||||||||||
| Telecommunication Services — 4.0% | |||||||||||||||
| 2,970,895 | AT&T, Inc. | 103,476,273 | |||||||||||||
| 6,323,700 | Verizon Communications, Inc. | 229,676,784 | |||||||||||||
| Total Telecommunication Services | 333,153,057 | ||||||||||||||
| TOTAL COMMON STOCKS (COST $8,200,647,593) | 7,907,790,454 | ||||||||||||||
| SHORT-TERM INVESTMENTS — 4.8% | |||||||||||||||
| 183,516,374 | Citigroup Global Markets Repurchase Agreement, dated 02/29/08, due 03/03/08, with a maturity value of $183,527,844 and an effective yield of 0.75%, collateralized by various U.S. Treasury obligations with an interest rate range of 8.13% - 11.25%, maturity date range of 02/15/15 - 08/15/19, and an aggregate market value, including accrued interest, of $186,349,074. | 183,516,374 | |||||||||||||
| 215,910,000 | U.S. Treasury Bill, 1.79%, due 07/24/08 (a) | 214,383,300 | |||||||||||||
| TOTAL SHORT-TERM INVESTMENTS (COST $397,452,297) | 397,899,674 | ||||||||||||||
| TOTAL INVESTMENTS — 99.6% (Cost $8,598,099,890) | 8,305,690,128 | ||||||||||||||
| Other Assets and Liabilities (net) — 0.4% | 31,092,775 | ||||||||||||||
| TOTAL NET ASSETS — 100.0% | $ | 8,336,782,903 | |||||||||||||
See accompanying notes to the financial statements.
4
GMO U.S. Quality Equity Fund
(A Series of GMO Trust)
Schedule of Investments — (Continued)
February 29, 2008
A summary of outstanding financial instruments at February 29, 2008 is as follows:
Futures Contracts
| Number of Contracts | Type | Expiration Date | Contract Value | Net Unrealized Appreciation (Depreciation) | |||||||||||||||
| Buys | |||||||||||||||||||
| 1,230 | S&P 500 E-Mini | March 2008 | $ | 81,874,950 | $ | (1,766,065 | ) | ||||||||||||
As of February 29, 2008, for the futures contracts held, the Fund had sufficient cash and/or securities to cover any commitments or margin requirements of the relevant broker or exchange.
Notes to Schedule of Investments:
* Non-income producing security.
(a) Rate shown represents yield-to-maturity.
See accompanying notes to the financial statements.
5
GMO U.S. Quality Equity Fund
(A Series of GMO Trust)
Statement of Assets and Liabilities — February 29, 2008
| Assets: | |||||||
| Investments, at value (cost $8,598,099,890) (Note 2) | $ | 8,305,690,128 | |||||
| Receivable for Fund shares sold | 97,035,687 | ||||||
| Dividends and interest receivable | 22,666,729 | ||||||
| Receivable for collateral on open futures contracts (Note 2) | 4,428,000 | ||||||
| Receivable for expenses reimbursed by Manager (Note 3) | 164,285 | ||||||
| Total assets | 8,429,984,829 | ||||||
| Liabilities: | |||||||
| Payable for Fund shares repurchased | 87,945,435 | ||||||
| Payable to affiliate for (Note 3): | |||||||
| Management fee | 2,196,047 | ||||||
| Shareholder service fee | 553,196 | ||||||
| Trustees and Chief Compliance Officer of GMO Trust fees | 8,955 | ||||||
| Payable for variation margin on open futures contracts (Note 2) | 2,121,748 | ||||||
| Accrued expenses | 376,545 | ||||||
| Total liabilities | 93,201,926 | ||||||
| Net assets | $ | 8,336,782,903 | |||||
See accompanying notes to the financial statements.
6
GMO U.S. Quality Equity Fund
(A Series of GMO Trust)
Statement of Assets and Liabilities — February 29, 2008 — (Continued)
| Net assets consist of: | |||||||
| Paid-in capital | $ | 8,574,801,413 | |||||
| Accumulated undistributed net investment income | 25,580,711 | ||||||
| Accumulated net realized gain | 30,576,606 | ||||||
| Net unrealized depreciation | (294,175,827 | ) | |||||
| $ | 8,336,782,903 | ||||||
| Net assets attributable to: | |||||||
| Class III shares | $ | 2,003,758,269 | |||||
| Class IV shares | $ | 432,045,956 | |||||
| Class V shares | $ | 663,615,976 | |||||
| Class VI shares | $ | 5,237,362,702 | |||||
| Shares outstanding: | |||||||
| Class III | 97,449,407 | ||||||
| Class IV | 20,998,610 | ||||||
| Class V | 32,270,821 | ||||||
| Class VI | 254,660,700 | ||||||
| Net asset value per share: | |||||||
| Class III | $ | 20.56 | |||||
| Class IV | $ | 20.57 | |||||
| Class V | $ | 20.56 | |||||
| Class VI | $ | 20.57 | |||||
See accompanying notes to the financial statements.
7
GMO U.S. Quality Equity Fund
(A Series of GMO Trust)
Statement of Operations — Year Ended February 29, 2008
| Investment Income: | |||||||
| Dividends | $ | 137,598,045 | |||||
| Interest | 12,465,110 | ||||||
| Total investment income | 150,063,155 | ||||||
| Expenses: | |||||||
| Management fee (Note 3) | 22,252,931 | ||||||
| Shareholder service fee – Class III (Note 3) | 2,892,309 | ||||||
| Shareholder service fee – Class IV (Note 3) | 632,321 | ||||||
| Shareholder service fee – Class V (Note 3) | 408,693 | ||||||
| Shareholder service fee – Class VI (Note 3) | 2,052,644 | ||||||
| Custodian, fund accounting agent and transfer agent fees | 748,025 | ||||||
| Audit and tax fees | 53,573 | ||||||
| Legal fees | 136,229 | ||||||
| Trustees fees and related expenses (Note 3) | 62,944 | ||||||
| Registration fees | 109,170 | ||||||
| Miscellaneous | 66,994 | ||||||
| Total expenses | 29,415,833 | ||||||
| Fees and expenses reimbursed by Manager (Note 3) | (1,085,951 | ) | |||||
| Expense reductions (Note 2) | (131,388 | ) | |||||
| Net expenses | 28,198,494 | ||||||
| Net investment income (loss) | 121,864,661 | ||||||
| Realized and unrealized gain (loss): | |||||||
| Net realized gain (loss) on: | |||||||
| Investments | 188,799,858 | ||||||
| Closed futures contracts | (2,748,918 | ) | |||||
| Net realized gain (loss) | 186,050,940 | ||||||
| Change in net unrealized appreciation (depreciation) on: | |||||||
| Investments | (586,790,878 | ) | |||||
| Open futures contracts | (1,593,115 | ) | |||||
| Net unrealized gain (loss) | (588,383,993 | ) | |||||
| Net realized and unrealized gain (loss) | (402,333,053 | ) | |||||
| Net increase (decrease) in net assets resulting from operations | $ | (280,468,392 | ) | ||||
See accompanying notes to the financial statements.
8
GMO U.S. Quality Equity Fund
(A Series of GMO Trust)
Statement of Changes in Net Assets
| Year Ended February 29, 2008 | Year Ended February 28, 2007 | ||||||||||
| Increase (decrease) in net assets: | |||||||||||
| Operations: | |||||||||||
| Net investment income (loss) | $ | 121,864,661 | $ | 66,894,724 | |||||||
| Net realized gain (loss) | 186,050,940 | 67,446,920 | |||||||||
| Change in net unrealized appreciation (depreciation) | (588,383,993 | ) | 159,498,624 | ||||||||
| Net increase (decrease) in net assets from operations | (280,468,392 | ) | 293,840,268 | ||||||||
| Distributions to shareholders from: | |||||||||||
| Net investment income | |||||||||||
| Class III | (31,023,169 | ) | (19,080,483 | ) | |||||||
| Class IV | (11,111,773 | ) | (34,152,852 | ) | |||||||
| Class V | (7,018,463 | ) | (1,484,773 | ) | |||||||
| Class VI | (60,979,925 | ) | (9,870,862 | ) | |||||||
| Total distributions from net investment income | (110,133,330 | ) | (64,588,970 | ) | |||||||
| Net realized gains | |||||||||||
| Class III | (50,769,370 | ) | (10,201,001 | ) | |||||||
| Class IV | (13,927,910 | ) | (6,234,488 | ) | |||||||
| Class V | (12,819,629 | ) | (2,285,549 | ) | |||||||
| Class VI | (101,916,040 | ) | (15,025,646 | ) | |||||||
| Total distributions from net realized gains | (179,432,949 | ) | (33,746,684 | ) | |||||||
| (289,566,279 | ) | (98,335,654 | ) | ||||||||
| Net share transactions (Note 7): | |||||||||||
| Class III | 572,435,769 | 396,663,232 | |||||||||
| Class IV | (356,639,901 | ) | (1,347,093,160 | ) | |||||||
| Class V | 450,705,666 | 259,783,734 | |||||||||
| Class VI | 3,017,011,171 | 2,604,941,562 | |||||||||
| Increase (decrease) in net assets resulting from net share transactions | 3,683,512,705 | 1,914,295,368 | |||||||||
| Total increase (decrease) in net assets | 3,113,478,034 | 2,109,799,982 | |||||||||
| Net assets: | |||||||||||
| Beginning of period | 5,223,304,869 | 3,113,504,887 | |||||||||
| End of period (including accumulated undistributed net investment income of $25,580,711 and $13,849,380, respectively) | $ | 8,336,782,903 | $ | 5,223,304,869 | |||||||
See accompanying notes to the financial statements.
9
GMO U.S. Quality Equity Fund
(A Series of GMO Trust)
Financial Highlights
(For a Class III share outstanding throughout each period)
| Year Ended February 28/29, | |||||||||||||||||||||||
| 2008 | 2007 | 2006 | 2005 | 2004(a) | |||||||||||||||||||
| Net asset value, beginning of period | $ | 21.78 | $ | 20.81 | $ | 20.03 | $ | 19.93 | $ | 20.00 | |||||||||||||
| Income (loss) from investment operations: | |||||||||||||||||||||||
| Net investment income (loss)† | 0.39 | 0.35 | 0.32 | 0.39 | 0.01 | ||||||||||||||||||
| Net realized and unrealized gain (loss) | (0.70 | ) | 1.12 | 0.72 | (0.05 | ) | (0.08 | ) | |||||||||||||||
| Total from investment operations | (0.31 | ) | 1.47 | 1.04 | 0.34 | (0.07 | ) | ||||||||||||||||
| Less distributions to shareholders: | |||||||||||||||||||||||
| From net investment income | (0.36 | ) | (0.34 | ) | (0.22 | ) | (0.24 | ) | — | ||||||||||||||
| From net realized gains | (0.55 | ) | (0.16 | ) | (0.04 | ) | — | — | |||||||||||||||
| Total distributions | (0.91 | ) | (0.50 | ) | (0.26 | ) | (0.24 | ) | — | ||||||||||||||
| Net asset value, end of period | $ | 20.56 | $ | 21.78 | $ | 20.81 | $ | 20.03 | $ | 19.93 | |||||||||||||
| Total Return(b) | �� | (1.76 | )% | 7.18 | % | 5.28 | % | 1.72 | % | (0.35 | )%** | ||||||||||||
| Ratios/Supplemental Data: | |||||||||||||||||||||||
| Net assets, end of period (000's) | $ | 2,003,758 | $ | 1,575,300 | $ | 1,108,088 | $ | 463,848 | $ | 18,966 | |||||||||||||
| Net expenses to average daily net assets | 0.48 | %(c) | 0.48 | % | 0.48 | % | 0.48 | % | 0.47 | %* | |||||||||||||
| Net investment income to average daily net assets | 1.74 | % | 1.64 | % | 1.58 | % | 1.98 | % | 1.22 | %* | |||||||||||||
| Portfolio turnover rate | 46 | % | 50 | % | 52 | % | 66 | % | 2 | %** | |||||||||||||
| Fees and expenses reimbursed by the Manager to average daily net assets: | 0.02 | % | 0.02 | % | 0.02 | % | 0.04 | % | 1.59 | %* | |||||||||||||
(a) Period from February 6, 2004 (commencement of operations) through February 29, 2004.
(b) The total returns would have been lower had certain expenses not been reimbursed during the periods shown and assumes the effect of reinvested distributions.
(c) The net expense ratio does not include the effect of expense reductions.
† Calculated using average shares outstanding throughout the period.
* Annualized.
** Not annualized.
See accompanying notes to the financial statements.
10
GMO U.S. Quality Equity Fund
(A Series of GMO Trust)
Financial Highlights
(For a Class IV share outstanding throughout each period)
| Year Ended February 28/29, | |||||||||||||||||||||||
| 2008 | 2007 | 2006 | 2005 | 2004(a) | |||||||||||||||||||
| Net asset value, beginning of period | $ | 21.80 | $ | 20.82 | $ | 20.03 | $ | 19.93 | $ | 20.00 | |||||||||||||
| Income (loss) from investment operations: | |||||||||||||||||||||||
| Net investment income (loss)† | 0.40 | 0.37 | 0.32 | 0.38 | 0.01 | ||||||||||||||||||
| Net realized and unrealized gain (loss) | (0.71 | ) | 1.11 | 0.74 | (0.03 | ) | (0.08 | ) | |||||||||||||||
| Total from investment operations | (0.31 | ) | 1.48 | 1.06 | 0.35 | (0.07 | ) | ||||||||||||||||
| Less distributions to shareholders: | |||||||||||||||||||||||
| From net investment income | (0.37 | ) | (0.34 | ) | (0.23 | ) | (0.25 | ) | — | ||||||||||||||
| From net realized gains | (0.55 | ) | (0.16 | ) | (0.04 | ) | — | — | |||||||||||||||
| Total distributions | (0.92 | ) | (0.50 | ) | (0.27 | ) | (0.25 | ) | — | ||||||||||||||
| Net asset value, end of period | $ | 20.57 | $ | 21.80 | $ | 20.82 | $ | 20.03 | $ | 19.93 | |||||||||||||
| Total Return(b) | (1.77 | )% | 7.19 | % | 5.37 | % | 1.75 | % | (0.35 | )%** | |||||||||||||
| Ratios/Supplemental Data: | |||||||||||||||||||||||
| Net assets, end of period (000's) | $ | 432,046 | $ | 800,458 | $ | 2,005,417 | $ | 938,586 | $ | 137,835 | |||||||||||||
| Net expenses to average daily net assets | 0.44 | %(c) | 0.44 | % | 0.44 | % | 0.44 | % | 0.44 | %* | |||||||||||||
| Net investment income to average daily net assets | 1.78 | % | 1.79 | % | 1.62 | % | 1.92 | % | 0.99 | %* | |||||||||||||
| Portfolio turnover rate | 46 | % | 50 | % | 52 | % | 66 | % | 2 | %** | |||||||||||||
| Fees and expenses reimbursed by the Manager to average daily net assets: | 0.02 | % | 0.02 | % | 0.02 | % | 0.04 | % | 1.59 | %* | |||||||||||||
(a) Period from February 6, 2004 (commencement of operations) through February 29, 2004.
(b) The total returns would have been lower had certain expenses not been reimbursed during the periods shown and assumes the effect of reinvested distributions.
(c) The net expense ratio does not include the effect of expense reductions.
† Calculated using average shares outstanding throughout the period.
* Annualized.
** Not annualized.
See accompanying notes to the financial statements.
11
GMO U.S. Quality Equity Fund
(A Series of GMO Trust)
Financial Highlights
(For a Class V share outstanding throughout each period)
| Year Ended February 29, 2008 | Period from December 8, 2006 (commencement of operations) through February 28, 2007 | ||||||||||
| Net asset value, beginning of period | $ | 21.79 | $ | 21.91 | |||||||
| Income (loss) from investment operations: | |||||||||||
| Net investment income (loss)† | 0.41 | 0.07 | |||||||||
| Net realized and unrealized gain (loss) | (0.72 | ) | 0.04 | ||||||||
| Total from investment operations | (0.31 | ) | 0.11 | ||||||||
| Less distributions to shareholders: | |||||||||||
| From net investment income | (0.37 | ) | (0.09 | ) | |||||||
| From net realized gains | (0.55 | ) | (0.14 | ) | |||||||
| Total distributions | (0.92 | ) | (0.23 | ) | |||||||
| Net asset value, end of period | $ | 20.56 | $ | 21.79 | |||||||
| Total Return(a) | (1.75 | )% | 0.49 | %** | |||||||
| Ratios/Supplemental Data: | |||||||||||
| Net assets, end of period (000's) | $ | 663,616 | $ | 259,430 | |||||||
| Net expenses to average daily net assets | 0.42 | %(b) | 0.42 | %* | |||||||
| Net investment income to average daily net assets | 1.83 | % | 1.40 | %* | |||||||
| Portfolio turnover rate | 46 | % | 50 | %*** | |||||||
| Fees and expenses reimbursed by the Manager to average daily net assets: | 0.02 | % | 0.02 | %* | |||||||
(a) The total returns would have been lower had certain expenses not been reimbursed during the periods shown and assumes the effect of reinvested distributions.
(b) The net expense ratio does not include the effect of expense reductions.
† Calculated using average shares outstanding throughout the period.
* Annualized.
** Not annualized.
*** Calculation represents portfolio turnover rate of the Fund for the year ended February 28, 2007.
See accompanying notes to the financial statements.
12
GMO U.S. Quality Equity Fund
(A Series of GMO Trust)
Financial Highlights
(For a Class VI share outstanding throughout each period)
| Year Ended February 29, 2008 | Period from December 8, 2006 (commencement of operations) through February 28, 2007 | ||||||||||
| Net asset value, beginning of period | $ | 21.79 | $ | 21.91 | |||||||
| Income (loss) from investment operations: | |||||||||||
| Net investment income (loss)† | 0.41 | 0.07 | |||||||||
| Net realized and unrealized gain (loss) | (0.70 | ) | 0.04 | ||||||||
| Total from investment operations | (0.29 | ) | 0.11 | ||||||||
| Less distributions to shareholders: | |||||||||||
| From net investment income | (0.38 | ) | (0.09 | ) | |||||||
| From net realized gains | (0.55 | ) | (0.14 | ) | |||||||
| Total distributions | (0.93 | ) | (0.23 | ) | |||||||
| Net asset value, end of period | $ | 20.57 | $ | 21.79 | |||||||
| Total Return(a) | (1.67 | )% | 0.49 | %** | |||||||
| Ratios/Supplemental Data: | |||||||||||
| Net assets, end of period (000's) | $ | 5,237,363 | $ | 2,588,116 | |||||||
| Net expenses to average daily net assets | 0.39 | %(b) | 0.39 | %* | |||||||
| Net investment income to average daily net assets | 1.84 | % | 1.43 | %* | |||||||
| Portfolio turnover rate | 46 | % | 50 | %*** | |||||||
| Fees and expenses reimbursed by the Manager to average daily net assets: | 0.02 | % | 0.02 | %* | |||||||
(a) The total returns would have been lower had certain expenses not been reimbursed during the periods shown and assumes the effect of reinvested distributions.
(b) The net expense ratio does not include the effect of expense reductions.
† Calculated using average shares outstanding throughout the period.
* Annualized.
** Not annualized.
*** Calculation represents portfolio turnover rate of the Fund for the year ended February 28, 2007.
See accompanying notes to the financial statements.
13
GMO U.S. Quality Equity Fund
(A Series of GMO Trust)
Notes to Financial Statements
February 29, 2008
1. Organization
GMO U.S. Quality Equity Fund (the "Fund") is a series of GMO Trust (the "Trust"). The Fund is registered under the Investment Company Act of 1940, as amended, as an open-end, non-diversified management investment company. The Fund is advised and managed by Grantham, Mayo, Van Otterloo & Co. LLC (the "Manager" or "GMO"). The Trust was established as a Massachusetts business trust under the laws of the Commonwealth of Massachusetts on June 24, 1985. The Declaration of Trust permits the Trustees of the Trust ("Trustees") to create an unlimited number of series of shares ("Funds") and to subdivide Funds into classes.
The Fund seeks high total return. The Fund seeks to achieve its objective by outperforming the S&P 500 Index. The Fund typically makes equity investments in companies that issue stocks included in the S&P 500 Index and in companies with similar market capitalizations. The Fund may hold fewer than 100 stocks. The Fund reserves the right to make tactical allocations of up to 20% of its net assets to investments in cash and other high quality investments.
As of February 29, 2008, the Fund had four classes of shares outstanding: Class III, Class IV, Class V and Class VI. Each class of shares bears a different level of shareholder service fees.
2. Significant accounting policies
The following is a summary of significant accounting policies which are in conformity with accounting principles generally accepted in the United States of America ("U.S. GAAP") and which are consistently followed by the Fund in the preparation of its financial statements. The preparation of financial statements in accordance with U.S. GAAP requires management to make estimates and assumptions that affect the reported amounts and disclosures in the financial statements. Actual results could differ from those estimates. The accounting records of the Fund are maintained in U.S. dollars.
Portfolio valuation
Securities listed on a securities exchange for which market quotations are readily available are valued at the last sale price or official closing price on each business day, or if there is no such reported sale or official closing price, at the most recent quoted bid price. Unlisted securities for which market quotations are readily available are generally valued at the most recent quoted bid price. Short-term investments with a remaining maturity of sixty days or less are generally valued at amortized cost, which approximates fair value. Shares of investment funds are valued at their net asset value. Securities for which quotations are not readily available or whose values the Manager has determined to be unreliable are valued at fair value as determined in good faith by the Trustees or other persons acting at their direction pursuant to procedures approved by the Trustees. By its nature, a fair value price is a good faith est imate of the value of a security at a given point in time and may not reflect the value that would be realized if the security was sold and the differences could be material.
14
GMO U.S. Quality Equity Fund
(A Series of GMO Trust)
Notes to Financial Statements — (Continued)
February 29, 2008
Futures contracts
The Fund may purchase and sell futures contracts. Upon entering into a futures contract, the Fund is required to deposit with the futures clearing broker an amount of cash, U.S. government and agency obligations, or other liquid assets in accordance with the initial margin requirements of the broker or exchange. In addition, the Fund maintains cash or securities in an amount that at least equals the net amount payable in the event the Fund must deliver the full amount of the contracts. Futures contracts are marked to market daily and an appropriate payable or receivable for the change in value ("variation margin") is recorded by the Fund. The payable or receivable is liquidated on the following business day. Gains or losses are recognized but not considered realized until the contracts expire or are closed. Futures contracts involve, to varying degrees, risk of loss in excess of the variation margin disclosed in the Statement of Assets and Liabilities. Under certain circumstances, futures exchanges may establish daily limits on the amount that the price of a futures contract can vary from the previous day's settlement price, thereby effectively preventing liquidation of unfavorable positions. Losses may arise from changes in the value of the underlying instrument if the Fund is unable to liquidate a futures position due to an illiquid secondary market for the contracts or the imposition of price limits, or if counterparties do not perform under the contract terms. Futures contracts are generally valued at the settlement price established each day by the board of trade or exchange on which they are traded. Futures contracts outstanding at the end of the period are listed in the Fund's Schedule of Investments.
Swap agreements
The Fund may enter into swap agreements. A swap is an agreement to exchange the return generated by one instrument for the return generated by another instrument. Interest rate swap agreements involve the exchange by one party with another party of their respective commitments to pay or receive interest, e.g., an exchange of floating rate payments for fixed rate payments with respect to a notional amount of principal. Total return swap agreements involve a commitment by one party in the agreement to pay interest in exchange for a market-linked return, both based on notional amounts. To the extent the total return of the security or index underlying the transaction exceeds or falls short of the offsetting interest rate obligation, the party will receive a payment from or make a payment to the counterparty, respectively. Forward spread lock swap agreements involve commitments to pay or receive a settlement amount calculated as the difference between the swap spread and a fixed spread, multiplied by the notional amount times the duration of the swap rate. The swap spread is the difference between the benchmark swap rate (market rate) and the specific treasury rate. Variance swap agreements involve commitments to pay or receive a settlement amount calculated as the difference between the annualized realized variance of returns on the underlying price and a fixed quantity, also known as the variance strike, over a period of time. In connection with these agreements, cash or securities may be set aside as collateral by the Fund's custodian or brokers in accordance with the terms of the swap agreement. The Fund earns or pays interest on cash set aside as collateral.
15
GMO U.S. Quality Equity Fund
(A Series of GMO Trust)
Notes to Financial Statements — (Continued)
February 29, 2008
Swaps are marked to market daily using models that incorporate quotations from market makers and the change in value, if any, is recorded as unrealized gain or loss in the Statement of Operations. Payments received or made on swap contracts are recorded as realized gain or loss in the Statement of Operations. Gains or losses are realized upon early termination of the swap agreements. These financial instruments are not actively traded on financial markets. The values assigned to these instruments are based upon the best available information and because of the uncertainty of the valuation, these values may differ significantly from the values that would have been realized had a ready market for these instruments existed, and the differences could be material. Entering into these agreements involves, to varying degrees, elements of credit, legal, market and documentation risk in excess of the amounts recognized in the Statement o f Assets and Liabilities. Such risks involve the possibility that there will be no liquid market for these agreements, that the counterparties to the agreements may default on their obligations to perform or disagree as to the meaning of contractual terms in the agreements, or that there may be unfavorable changes in interest rates or the price of the index or security underlying these transactions. There were no swap agreements outstanding at the end of the period.
Repurchase agreements
The Fund may enter into repurchase agreements with banks and broker-dealers whereby the Fund acquires a security for cash and obtains a simultaneous commitment from the seller to repurchase the security at an agreed upon price and date. The Fund, through its custodian, takes possession of securities collateralizing the repurchase agreement. The collateral is marked to market daily to ensure that the market value of the underlying assets remains sufficient to protect the Fund in the event of default by the seller. Collateral for certain tri-party repurchase agreements is held at the counterparty's custodian in a segregated account for the benefit of the Fund and the counterparty. In connection with transactions in repurchase agreements, if the seller defaults or enters into insolvency proceedings and the value of the collateral declines, recovery of cash by the Fund may be delayed or limited. Repurchase agreements outstanding at the end of the period are listed in the Fund's Schedule of Investments.
Securities lending
The Fund may lend its securities to certain qualified broker-dealers. The loans are collateralized with cash or liquid securities with a market value at least equal to the market value of the securities on loan. As with other extensions of credit, the Fund may bear the risk of loss with respect to the investment of the collateral, the risk of delay in and/or inability to exercise its rights with respect to the collateral, and the risk of delay in recovery or loss of rights in the loaned securities should the borrower of the securities fail financially. If a loan is collateralized by U.S. government securities, the Fund receives a fee from the borrower. If a loan is collateralized by cash, the Fund typically invests the cash collateral for its own account in interest-bearing, short-term securities and pays a fee to the borrower that normally represents a portion of the Fund's earnings on the collateral. For the year ended Februar y 29, 2008, the Fund did not participate in securities lending.
16
GMO U.S. Quality Equity Fund
(A Series of GMO Trust)
Notes to Financial Statements — (Continued)
February 29, 2008
Taxes and distributions
The Fund intends to qualify each tax year as a regulated investment company under Subchapter M of the Internal Revenue Code of 1986, as amended (the "Code"). The Fund intends to distribute substantially all of its net investment income and net realized short-term and long-term capital gains, if any, after giving effect to any available capital loss carryovers for U.S. federal income tax purposes. Therefore, no provision for U.S. federal income or excise tax is necessary.
The Fund's policy is to declare and pay distributions from net investment income, if any, quarterly, and from net realized short-term and long-term capital gains, if any, at least annually. All distributions are paid in shares of the Fund, at net asset value, unless the shareholder elects to receive cash distributions. Distributions to shareholders are recorded by the Fund on the ex-dividend date.
Income and capital gain distributions are determined in accordance with U.S. federal income tax regulations, which may differ from U.S. GAAP. Certain capital accounts in the financial statements are periodically adjusted for permanent differences in order to reflect their tax character. These adjustments have no impact on net assets or net asset value per share. Temporary differences which arise from recognizing certain items of income, expense, gain or loss in different periods for financial statement and tax purposes will reverse at some time in the future. Distributions in excess of net investment income or net realized gains are temporary over distributions for financial statement purposes resulting from differences in the recognition or classification of income or distributions for financial statement and tax purposes.
U.S. GAAP and tax accounting differences primarily relate to losses on wash sale transactions and redemption in-kind transactions.
The following reclassification represents the amount necessary to report the stated components of net assets on a tax basis, excluding certain temporary differences, as of February 29, 2008. The financial highlights exclude these adjustments.
| Accumulated Undistributed Net Investment Income | Accumulated Net Realized Gain | Paid-in Capital | |||||||||
| $ | — | $ | (9,156,118 | ) | $ | 9,156,118 | |||||
The tax character of distributions declared to shareholders is as follows:
| 2/29/2008 | 2/28/2007 | ||||||||||
| Ordinary income (including any short-term capital gains) | $ | 110,133,330 | $ | 86,255,920 | |||||||
| Long-term capital gains | 179,432,949 | 12,079,734 | |||||||||
| Total distributions | $ | 289,566,279 | $ | 98,335,654 | |||||||
17
GMO U.S. Quality Equity Fund
(A Series of GMO Trust)
Notes to Financial Statements — (Continued)
February 29, 2008
Distributions in excess of tax basis earnings and profits, if significant, are reported in the financial statements as a tax return of capital.
As of February 29, 2008, the components of distributable earnings on a tax basis consisted of the following:
| Undistributed ordinary income | $ | 25,580,710 | |||||
| Undistributed long-term capital gain | $ | 52,051,934 | |||||
As of February 29, 2008, the approximate cost for U.S. federal income tax purposes and gross and net unrealized appreciation and depreciation in value of investments were as follows:
| Aggregate Cost | Gross Unrealized Appreciation | Gross Unrealized (Depreciation) | Net Unrealized Appreciation (Depreciation) | ||||||||||||
| $ | 8,621,341,282 | $ | 246,761,888 | $ | (562,413,042 | ) | $ | (315,651,154 | ) | ||||||
For the period ended February 29, 2008, the Fund had net realized gains attributed to redemption in-kind transactions of $9,197,517.
Security transactions and related investment income
Security transactions are accounted for on trade date. Dividend income, net of applicable foreign withholding taxes, if any, is recorded on the ex-dividend date, or when the Fund is informed of the ex-dividend date, if later. Interest income is recorded on the accrual basis and is adjusted for the amortization of premiums and accretion of discounts. Interest income on inflation indexed securities, if any, is accrued daily based upon an inflation adjusted principal. Additionally, any increase or decrease in the principal or face amount of the securities adjusted for inflation is recorded as interest income or loss. Income is not recognized on securities for which collection is not expected. Non-cash dividends, if any, are recorded at the fair market value of the securities received. In determining the net gain or loss on securities sold, the cost of securities is determined on the identified cost basis.
Expenses
The majority of expenses of the Trust are directly identifiable to an individual fund. Expenses which are not readily identifiable to a specific fund are allocated taking into consideration, among other things, the nature and type of expense and the relative size of the funds. Investment income, common expenses and realized and unrealized gains and losses are allocated pro rata among the classes of shares of the Fund based on the relative net assets of each class. Shareholder service fees, which are directly attributable to a class of shares, are charged to that class's operations.
State Street Bank and Trust Company ("State Street") serves as custodian, fund accounting agent and transfer agent of the Fund. State Street's fee may be reduced by credits that are an earnings allowance calculated on the average daily cash balances the Fund maintains with State Street. Credit balances used to reduce the fee paid to State Street, if any, are reported as a reduction of expenses in the Statement of Operations.
18
GMO U.S. Quality Equity Fund
(A Series of GMO Trust)
Notes to Financial Statements — (Continued)
February 29, 2008
Recently issued accounting pronouncements
In June 2006, the Financial Accounting Standards Board ("FASB") issued FASB Interpretation No. 48, Accounting for Uncertainty in Income Taxes – an Interpretation of FASB Statement No. 109 ("FIN 48"). FIN 48 clarifies the accounting for uncertainty in income taxes recognized in accordance with FASB Statement No. 109, Accounting for Income Taxes. FIN 48 prescribes a recognition threshold and measurement attribute for a tax position taken or expected to be taken in the tax return that could impact the Fund's financial statements. It also provides guidance in relation to the Fund's financial statements on classification of tax benefits or liabilities, interest and penalties, accounting in interim periods, disclosure, and transition. FIN 48 is effective for fiscal years beginning after December 15, 2006 for registered investment companies. Management has evaluated the effects of applying the various provisions of FIN 48 and has determined that the adoption of FIN 48 does not have a material effect on the Fund's financial statements. The Fund's federal tax returns for the prior three fiscal years remain subject to examination by the Internal Revenue Service. Management will continue to monitor the rules and guidance pertaining to FIN 48 and will take action if appropriate.
In September 2006, the FASB issued Statement of Financial Accounting Standards No. 157 ("FAS 157"), "Fair Value Measurements." FAS 157 defines fair value, establishes a framework for measuring fair value in accordance with generally accepted accounting principles and expands disclosure about fair value measurements. FAS 157 is effective for fiscal years beginning after November 15, 2007. Management is currently evaluating the impact the adoption of FAS 157 will have on the Fund's financial statement disclosures.
3. Fees and other transactions with affiliates
GMO earns a management fee paid monthly at the annual rate of 0.33% of average daily net assets. The Fund has adopted a Shareholder Service Plan under which the Fund pays GMO a shareholder service fee for client and shareholder service, reporting, and other support. Pursuant to the Shareholder Service Plan, the shareholder service fee is calculated based on average daily net assets of each class at the annual rate of 0.15% for Class III shares, 0.105% for Class IV shares, 0.085% for Class V shares and 0.055% for Class VI shares.
The Manager has contractually agreed to reimburse the Fund for Fund expenses through at least June 30, 2008 to the extent the Fund's total annual operating expenses, (excluding shareholder service fees, fees and expenses of the independent Trustees of the Trust, fees and expenses for legal services not approved by the Manager for the Trust, compensation and expenses of the Trust's Chief Compliance Officer ("CCO") (excluding any employee benefits), brokerage commissions, securities lending fees and expenses, interest expense, transfer taxes, and other investment-related costs (including expenses associated with investments in any company that is an investment company or would be an investment company under the 1940 Act, but for the exceptions to the definition of investment company provided in Section 3(c)(1) and 3(c)(7) of the 1940 Act), hedging transaction fees, extraordinary, non-recurring and certain other unusual expenses (i ncluding taxes)) exceed 0.33% of the Fund's average daily net assets.
19
GMO U.S. Quality Equity Fund
(A Series of GMO Trust)
Notes to Financial Statements — (Continued)
February 29, 2008
The Fund's portion of the fees paid by the Trust to the independent Trustees and CCO during the year ended February 29, 2008 was $54,940 and $27,951, respectively. The compensation and expenses of the CCO are included in miscellaneous expenses in the Statement of Operations. No remuneration was paid by the Fund to any other officer of the Trust.
4. Purchases and sales of securities
Cost of purchases and proceeds from sales of securities, excluding short-term investments, for the year ended February 29, 2008 aggregated $6,326,692,567 and $2,948,957,142, respectively.
5. Guarantees
In the normal course of business the Fund enters into contracts with third-party service providers that contain a variety of representations and warranties and which provide general indemnifications. The Fund's maximum exposure under these arrangements is unknown, as this would involve future claims that may be made against the Fund that have not yet occurred. Based on experience, management is of the view that the risk of loss in connection with these potential indemnification obligations is remote; however, there can be no assurance that material liabilities related to such obligations will not arise in the future that could adversely impact the Fund.
6. Principal shareholders and related parties
As of February 29, 2008, 22.32% of the outstanding shares of the Fund were held by one shareholder. No other shareholder owned in excess of 10% of the outstanding shares of the Fund. Investment activities of this shareholder may have a material effect on the Fund.
As of February 29, 2008, 0.29% of the Fund's shares were held by thirty related parties comprised of certain GMO employee accounts, and 57.51% of the Fund's shares were held by accounts for which the Manager has investment discretion.
7. Share transactions
The Declaration of Trust permits the Trustees to issue an unlimited number of shares of beneficial interest (without par value). Transactions in Fund shares were as follows:
| Year Ended February 29, 2008 | Year Ended February 28, 2007 | ||||||||||||||||||
| Class III: | Shares | Amount | Shares | Amount | |||||||||||||||
| Shares sold | 50,996,071 | $ | 1,139,966,142 | 45,988,997 | $ | 967,561,064 | |||||||||||||
| Shares issued to shareholders in reinvestment of distributions | 3,122,803 | 70,870,252 | 1,185,522 | 25,054,083 | |||||||||||||||
| Shares repurchased | (28,982,283 | ) | (638,400,625 | ) | (28,107,538 | ) | (595,951,915 | ) | |||||||||||
| Net increase (decrease) | 25,136,591 | $ | 572,435,769 | 19,066,981 | $ | 396,663,232 | |||||||||||||
20
GMO U.S. Quality Equity Fund
(A Series of GMO Trust)
Notes to Financial Statements — (Continued)
February 29, 2008
| Year Ended February 29, 2008 | Year Ended February 28, 2007 | ||||||||||||||||||
| Class IV: | Shares | Amount | Shares | Amount | |||||||||||||||
| Shares sold | 28,155,555 | $ | 619,378,521 | 70,184,522 | $ | 1,495,423,391 | |||||||||||||
| Shares issued to shareholders in reinvestment of distributions | 821,509 | 18,645,946 | 1,791,751 | 36,987,536 | |||||||||||||||
| Shares repurchased | (44,697,168 | ) | (994,664,368 | ) | (131,569,719 | ) | (2,879,504,087 | ) | |||||||||||
| Net increase (decrease) | (15,720,104 | ) | $ | (356,639,901 | ) | (59,593,446 | ) | $ | (1,347,093,160 | ) | |||||||||
| Year Ended February 29, 2008 | Period from December 8, 2006 (commencement of operations) through February 28, 2007 | ||||||||||||||||||
| Class V: | Shares | Amount | Shares | Amount | |||||||||||||||
| Shares sold | 32,154,927 | $ | 708,017,030 | 16,874,493 | $ | 369,964,791 | |||||||||||||
| Shares issued to shareholders in reinvestment of distributions | 832,035 | 18,891,284 | 165,675 | 3,600,116 | |||||||||||||||
| Shares repurchased | (12,624,095 | ) | (276,202,648 | ) | (5,132,214 | ) | (113,781,173 | ) | |||||||||||
| Net increase (decrease) | 20,362,867 | $ | 450,705,666 | 11,907,954 | $ | 259,783,734 | |||||||||||||
| Year Ended February 29, 2008 | Period from December 8, 2006 (commencement of operations) through February 28, 2007 | ||||||||||||||||||
| Class V1: | Shares | Amount | Shares | Amount | |||||||||||||||
| Shares sold | 143,722,533 | $ | 3,181,476,095 | 118,076,664 | $ | 2,589,720,510 | |||||||||||||
| Shares issued to shareholders in reinvestment of distributions | 6,951,875 | 157,780,829 | 1,096,229 | 23,821,052 | |||||||||||||||
| Shares repurchased | (14,796,108 | ) | (322,245,753 | ) | (390,493 | ) | (8,600,000 | ) | |||||||||||
| Net increase (decrease) | 135,878,300 | $ | 3,017,011,171 | 118,782,400 | $ | 2,604,941,562 | |||||||||||||
21
Report of Independent Registered Public Accounting Firm
To the Trustees of GMO Trust and the Shareholders of
GMO U.S. Quality Equity Fund
In our opinion, the accompanying statement of assets and liabilities, including the schedule of investments, and the related statements of operations and of changes in net assets and the financial highlights present fairly, in all material respects, the financial position of GMO U.S. Quality Equity Fund (the "Fund") at February 29, 2008, the results of its operations for the year then ended, the changes in its net assets for each of the two years in the period then ended and the financial highlights for each of the periods indicated, in conformity with accounting principles generally accepted in the United States of America. These financial statements and financial highlights (hereafter referred to as "financial statements") are the responsibility of the Fund's management; our responsibility is to express an opinion on these financial statements based on our audits. We conducted our audits of these financial statements in accord ance with the standards of the Public Company Accounting Oversight Board (United States). Those standards require that we plan and perform the audit to obtain reasonable assurance about whether the financial statements are free of material misstatement. An audit includes examining, on a test basis, evidence supporting the amounts and disclosures in the financial statements, assessing the accounting principles used and significant estimates made by management, and evaluating the overall financial statement presentation. We believe that our audits, which included confirmation of securities at February 29, 2008 by correspondence with the custodian and brokers, provide a reasonable basis for our opinion.
PricewaterhouseCoopers LLP
Boston, Massachusetts
April 29, 2008
22
GMO U.S. Quality Equity Fund
(A Series of GMO Trust)
Fund Expenses
February 29, 2008 (Unaudited)
Expense Examples: The following information is in relation to expenses for the six month period ended February 29, 2008.
As a shareholder of the Fund, you may incur two types of costs: (1) transaction costs, and (2) ongoing costs, including management fees, shareholder service fees and other Fund expenses. This example is intended to help you understand your ongoing costs (in dollars) of investing in the Fund and to compare these costs with the ongoing costs of investing in other mutual funds.
These examples are based on an investment of $1,000 invested at the beginning of the period and held for the entire period, September 1, 2007 through February 29, 2008.
Actual Expenses
The first line of the table for each class below provides information about actual account values and actual expenses. You may use the information in this line, together with the amount you invested, to estimate the expenses that you paid over the period. Simply divide your account value by $1,000 (for example, a $10,000,000 account value divided by $1,000 = 10,000), then multiply the result by the number in the first line under the heading entitled "Net Expense Incurred" to estimate the expenses you paid on your account during this period.
Hypothetical Example for Comparison Purposes
The second line of the table for each class below provides information about hypothetical account values and hypothetical expenses based on the Fund's actual expense ratio and an assumed rate of return of 5% per year before expenses, which is not the Fund's actual return. The hypothetical account values and expenses may not be used to estimate the actual ending account balance or expenses you paid for the period. You may use this information to compare the ongoing costs of investing in the Fund with other funds. To do so, compare this 5% hypothetical example with the 5% hypothetical examples that appear in the shareholder reports of other funds.
23
GMO U.S. Quality Equity Fund
(A Series of GMO Trust)
Fund Expenses — (Continued)
February 29, 2008 (Unaudited)
Please note that the expenses shown in the table are meant to highlight your ongoing costs only and do not reflect any transactional costs. Therefore, the second line of the table is useful in comparing ongoing costs only, and will not help you determine the relative total costs of owning different funds. In addition, if these transactional costs were included, your costs would have been higher.
| Annualized Net Expense Ratio | Beginning Account Value | Ending Account Value | Net Expense Incurred* | ||||||||||||||||
| Class III | |||||||||||||||||||
| 1) Actual | 0.48 | % | $ | 1,000.00 | $ | 944.60 | $ | 2.32 | |||||||||||
| 2) Hypothetical | 0.48 | % | $ | 1,000.00 | $ | 1,022.48 | $ | 2.41 | |||||||||||
| Class IV | |||||||||||||||||||
| 1) Actual | 0.44 | % | $ | 1,000.00 | $ | 944.70 | $ | 2.13 | |||||||||||
| 2) Hypothetical | 0.44 | % | $ | 1,000.00 | $ | 1,022.68 | $ | 2.21 | |||||||||||
| Class V | |||||||||||||||||||
| 1) Actual | 0.42 | % | $ | 1,000.00 | $ | 944.80 | $ | 2.03 | |||||||||||
| 2) Hypothetical | 0.42 | % | $ | 1,000.00 | $ | 1,022.77 | $ | 2.11 | |||||||||||
| Class VI | |||||||||||||||||||
| 1) Actual | 0.39 | % | $ | 1,000.00 | $ | 945.00 | $ | 1.89 | |||||||||||
| 2) Hypothetical | 0.39 | % | $ | 1,000.00 | $ | 1,022.92 | $ | 1.96 | |||||||||||
* Expenses are calculated using each Class's annualized expense ratio for the six months ended February 29, 2008, multiplied by the average account value over the period, multiplied by 182 days in the period, divided by 366 days in the year.
24
GMO U.S. Quality Equity Fund
(A Series of GMO Trust)
Tax Information for the Tax Year Ended February 29, 2008 (Unaudited)
The Fund will notify shareholders of amounts for use in preparing 2008 income tax forms in January 2009.
The Fund's distributions to shareholders include $179,432,949 from long-term capital gains.
For taxable, non-corporate shareholders, 99.91% of the income and short-term capital gains, if any, distributed in the Fund's fiscal year ended February 29, 2008 represents qualified dividend income subject to the 15% rate category.
For corporate shareholders, 99.91% of the income and short-term capital gains, if any, distributed in the Fund's fiscal year ended February 29, 2008 qualified for the dividends-received deduction.
The Fund hereby designates as qualified interest income with respect to its taxable year ended February 29, 2008, $9,847,844 or if determined to be different, the qualified interest income of such year.
25
Trustees and Officers (Unaudited)
The following tables list the Trust's Trustees and Officers as of the date of this report; their address and date of birth ("DOB"); their position with the Trust; the length of time holding that position with the Trust; their principal occupation(s) during the past five years; the number of portfolios in the fund complex they oversee; and other directorships they hold in companies subject to registration or reporting requirements of the Securities Exchange Act of 1934 (generally called "public companies") or in registered investment companies. The Trust's Statement of Additional Information ("SAI") includes additional information about the Trust's trustees, including changes subsequent to the date of the report. The SAI is available, without charge, upon request by writing GMO, c/o GMO Trust, 40 Rowes Wharf, Boston, MA 02110.
Independent Trustees:
| Name, Address, and DOB | Position(s) Held with Trust | Term of Office1 and Length of Time Served | Principal Occupation(s) During Past Five Years | Number of Portfolios in Fund Complex Overseen by Trustee | Other Directorships Held by Trustee | ||||||||||||||||||
| Donald W. Glazer, Esq. c/o GMO Trust 40 Rowes Wharf Boston, MA 02110 DOB: 07/26/1944 | Chairman of the Board of Trustees | Chairman of the Board of Trustees since March 2005; Lead Independent Trustee (September 2004 – March 2005); Trustee since December 2000. | Consultant – Law and Business2; Vice Chair (since 2002) and Secretary, Provant, Inc. (provider of personnel performance improvement services and training products); Author of Legal Treatises. | 47 | None. | ||||||||||||||||||
1 Each Trustee is elected to serve during the continued lifetime of the Trust until he/she dies, resigns or is removed, or if sooner, until the next meeting of Shareholders called for the purpose of electing Trustees and until the election and qualification of his/her successor.
2 As part of Mr. Glazer's work as a consultant, he provides part-time consulting services to Goodwin Procter LLP ("Goodwin"). Goodwin has provided legal services to Renewable Resources, LLC, an affiliate of GMO; GMO, in connection with its relationship with Renewable Resources; and funds managed by Renewable Resources. Mr. Glazer has represented that he has no financial interest in, and is not involved in the provision of, such legal services. In the calendar years ended December 31, 2006 and December 31, 2007, these entities paid $825,738 and $291,721 respectively, in legal fees and disbursements to Goodwin.
26
Independent Trustees — (Continued)
| Name, Address, and DOB | Position(s) Held with Trust | Term of Office1 and Length of Time Served | Principal Occupation(s) During Past Five Years | Number of Portfolios in Fund Complex Overseen by Trustee | Other Directorships Held by Trustee | ||||||||||||||||||
| Jay O. Light c/o GMO Trust 40 Rowes Wharf Boston, MA 02110 DOB: 10/03/1941 | Trustee | Since May 1996. | Dean (since April 2006), Acting Dean (August 2005 – April 2006), Senior Associate Dean (1998 – 2005), and Professor of Business Administration, Harvard Business School. | 47 | Director of Harvard Management Company, Inc.3 and Verde, Inc.; Director of Partners HealthCare System, Inc. and Chair of its Investment Committee.4 | ||||||||||||||||||
| W. Nicholas Thorndike c/o GMO Trust 40 Rowes Wharf Boston, MA 02110 DOB: 03/28/1933 | Trustee | Since March 2005. | Director or trustee of various corporations and charitable organizations, including Courier Corporation (a book publisher and manufacturer) (July 1989 – present); Putnam Funds (December 1992 – June 2004); and Providence Journal (a newspaper publisher) (December 1986 – December 2003). | 47 | Director of Courier Corporation (a book publisher and manufacturer); Member of the Investment Committee of Partners HealthCare System, Inc.4 | ||||||||||||||||||
1 Each Trustee is elected to serve during the continued lifetime of the Trust until he/she dies, resigns or is removed, or if sooner, until the next meeting of Shareholders called for the purpose of electing Trustees and until the election and qualification of his/her successor.
3 Harvard Management Company, Inc. is a client of the Manager.
4 Partners HealthCare System, Inc. is a client of the Manager.
27
Principal Officers:
| Name, Address, and DOB | Position(s) Held with Trust | Term of Office5 and Length of Time Served | Principal Occupation(s) During Past Five Years | ||||||||||||
| Scott Eston c/o GMO Trust 40 Rowes Wharf Boston, MA 02110 DOB: 01/20/1956 | President and Chief Executive Officer | President and Chief Executive Officer since October 2002; Chief Financial Officer, November 2006 – February 2007. | Chief Financial Officer, Chief Operating Officer and Member, Grantham, Mayo, Van Otterloo & Co. LLC. | ||||||||||||
| Sheppard N. Burnett c/o GMO Trust 40 Rowes Wharf Boston, MA 02110 DOB: 10/24/1968 | Treasurer and Chief Financial Officer | Chief Financial Officer since March 2007; Treasurer since November 2006; Assistant Treasurer, September 2004 – November 2006. | Fund Administration Staff, Grantham, Mayo, Van Otterloo & Co. LLC (June 2004 – present); Vice President, Director of Tax, Columbia Management Group (2002 – 2004). | ||||||||||||
| Brent C. Arvidson c/o GMO Trust 40 Rowes Wharf Boston, MA 02110 DOB: 06/26/1969 | Assistant Treasurer | Since August 1998. | Senior Fund Administrator, Grantham, Mayo, Van Otterloo & Co. LLC. | ||||||||||||
| John L. Nasrah c/o GMO Trust 40 Rowes Wharf Boston, MA 02110 DOB: 05/27/1977 | Assistant Treasurer | Since March 2007. | Fund Administrator, Grantham, Mayo, Van Otterloo & Co. LLC (September 2004 – present); Tax Analyst, Bain & Company, Inc (June 2003 – September 2004); Senior Tax Associate, PricewaterhouseCoopers LLP (2001 – 2003). | ||||||||||||
| Mahmoodur Rahman c/o GMO Trust 40 Rowes Wharf Boston, MA 02110 DOB: 11/30/1967 | Assistant Treasurer | Since September 2007. | Fund Administrator, Grantham, Mayo, Van Otterloo & Co. (April 2007 – present); Vice President and Senior Tax Manager, Massachusetts Financial Services Company (January 2000 – April 2007). | ||||||||||||
5 Officers are elected to hold such office until their successor is elected and qualified to carry out the duties and responsibilities of their office, or until he or she resigns or is removed from office.
28
Principal Officers — (Continued)
| Name, Address, and DOB | Position(s) Held with Trust | Term of Office5 and Length of Time Served | Principal Occupation(s) During Past Five Years | ||||||||||||
| Michael E. Gillespie c/o GMO Trust 40 Rowes Wharf Boston, MA 02110 DOB: 02/18/1958 | Chief Compliance Officer | Since March 2005. | Vice President of Compliance (June 2004 – February 2005) and Director of Domestic Compliance (March 2002 – June 2004), Fidelity Investments; Vice President and Senior Counsel, State Street Bank and Trust Company (May 1998 – March 2002). | ||||||||||||
| Jason B. Harrison c/o GMO Trust 40 Rowes Wharf Boston, MA 02110 DOB: 01/29/1977 | Vice President and Clerk | Vice President since November 2006; Clerk since March 2006. | Legal Counsel, Grantham, Mayo, Van Otterloo & Co. LLC (since February 2006) and Attorney, Ropes & Gray LLP (September 2002 – February 2006). | ||||||||||||
| David L. Bohan c/o GMO Trust 40 Rowes Wharf Boston, MA 02110 DOB: 06/21/1964 | Vice President and Assistant Clerk | Vice President since March 2005; Assistant Clerk since March 2006. | Legal Counsel, Grantham, Mayo, Van Otterloo & Co. LLC (September 2003 – present); Attorney, Goodwin Procter LLP (September 1996 – September 2003). | ||||||||||||
| Gregory L. Pottle c/o GMO Trust 40 Rowes Wharf Boston, MA 02110 DOB: 07/09/1971 | Vice President and Assistant Clerk | Since November 2006. | Legal Counsel, Grantham, Mayo, Van Otterloo & Co. LLC. | ||||||||||||
| Anne K. Trinque c/o GMO Trust 40 Rowes Wharf Boston, MA 02110 DOB: 04/15/1978 | Vice President and Assistant Clerk | Since September 2007. | Legal Counsel, Grantham, Mayo, Van Otterloo & Co. LLC (since January 2007); Attorney, Goodwin Procter LLP (September 2003 – January 2007). | ||||||||||||
| Cheryl Wakeham c/o GMO Trust 40 Rowes Wharf Boston, MA 02110 DOB: 10/29/1958 | Anti-Money Laundering Officer | Since December 2004. | Manager, Client Service Administration, Grantham, Mayo, Van Otterloo & Co. LLC. | ||||||||||||
5 Officers are elected to hold such office until their successor is elected and qualified to carry out the duties and responsibilities of their office, or until he or she resigns or is removed from office.
29
GMO Foreign Fund
(A Series of GMO Trust)
Annual Report
February 29, 2008
For a free copy of the Fund's proxy voting guidelines, shareholders may call 1-617-346-7646 (collect), visit our website at www.gmo.com, or visit the Securities and Exchange Commission's website at www.sec.gov. Information regarding how the Fund voted proxies relating to portfolio securities during the most recent 12-month period ended June 30 is available on our website at www.gmo.com, or on the Securities and Exchange Commission's website at www.sec.gov.
The Fund files its complete schedule of portfolio holdings with the Securities and Exchange Commission for the first and third quarter of each fiscal year on Form N-Q, which is available on the Commission's website at www.sec.gov. The Fund's Form N-Q may be reviewed and copied at the Commission's Public Reference Room in Washington, D.C. Information on the operation of the Public Reference Room may be obtained by calling 1-800-SEC-0330. The Fund has a policy with respect to disclosure of portfolio holdings under which it may also make available on GMO's website (www.gmo.com) a complete schedule of portfolio holdings.
This report is prepared for the general information of shareholders. It is authorized for distribution to prospective investors only when preceded or accompanied by a prospectus for the GMO Trust.
GMO Foreign Fund
(A Series of GMO Trust)
Portfolio Managers
Day-to-day management of the Fund's portfolio is the responsibility of the International Active Division at Grantham, Mayo, Van Otterloo & Co. LLC.
Management Discussion and Analysis of Fund Performance
The Class III shares of the GMO Foreign Fund returned -0.8% for the fiscal year ended February 28, 2008, as compared to +0.8% for the MSCI EAFE Index. The Fund was invested substantially in international equity securities throughout the period.
Fair value pricing of the Fund subtracted 1.1% from returns versus the benchmark, which utilizes local close prices. Using the local close, which we do for attribution, the Fund returned +0.3% for the fiscal year.
Stock selection subtracted 1.0% from returns for the fiscal year. Stock selection was negative in Germany and the United Kingdom.
Country selection was ahead of the MSCI EAFE Index by 0.5%. The largest positive contribution to country selection came from an overweight position in Germany, which added 0.6%.
The views expressed herein are exclusively those of Grantham, Mayo, Van Otterloo & Co. LLC Management as of the date of this report and are subject to change. GMO disclaims any responsibility to update such views. They are not meant as investment advice.
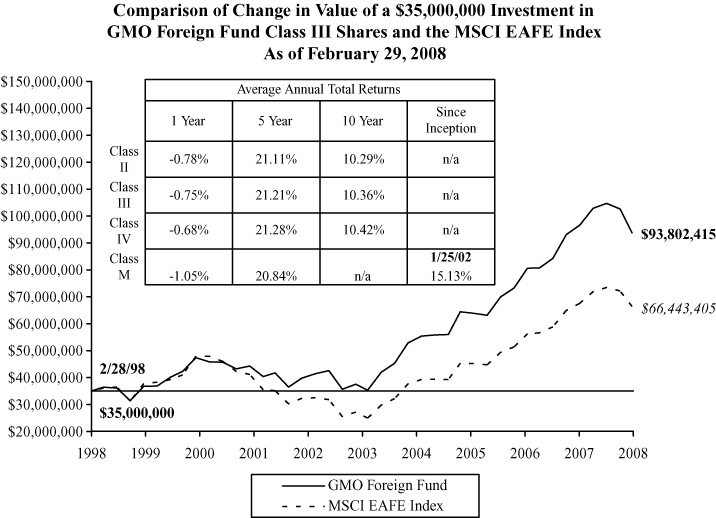
Performance data quoted represents past performance and is not indicative of future results. The investment return and principal value of an investment will fluctuate so that an investor's shares, when redeemed, may be worth more or less than their original cost. Current performance data may be lower or higher than the performance data provided herein. To obtain performance information to the most recent month-end, visit www.gmo.com. Performance shown is net of all fees after reimbursement from the Manager. Returns would have been lower had certain expenses not been reimbursed during the periods shown and do not include the effect of taxes on distributions and redemptions. The Fund commenced operations on June 28, 1996 subsequent to a transaction involving, in essence, the reorganization of the GMO International Equities Pool of the Common Fund for Non-Profit Orga nizations (the "GMO Pool") as the GMO Foreign Fund. All information relating to the time periods prior to June 28, 1996 relates to the GMO Pool. All information is unaudited. Performance for Class II, IV and M will vary due to different fees.
GMO Foreign Fund
(A Series of GMO Trust)
Investments Concentration Summary
February 29, 2008 (Unaudited)
| Asset Class Summary | % of Total Net Assets | ||||||
| Common Stocks | 95.0 | % | |||||
| Short-Term Investments | 3.3 | ||||||
| Preferred Stocks | 0.6 | ||||||
| Rights and Warrants | 0.0 | ||||||
| Other | 1.1 | ||||||
| 100.0 | % | ||||||
| Country Summary | % of Equity Investments | ||||||
| United Kingdom | 22.7 | % | |||||
| Japan | 19.5 | ||||||
| Germany | 12.1 | ||||||
| France | 8.1 | ||||||
| Finland | 5.9 | ||||||
| Netherlands | 5.3 | ||||||
| Italy | 4.7 | ||||||
| Hong Kong | 3.9 | ||||||
| Switzerland | 3.1 | ||||||
| Spain | 3.0 | ||||||
| Norway | 1.9 | ||||||
| Belgium | 1.4 | ||||||
| Singapore | 1.4 | ||||||
| Australia | 1.3 | ||||||
| Brazil | 1.1 | ||||||
| Taiwan | 1.0 | ||||||
| Ireland | 0.9 | ||||||
| South Korea | 0.7 | ||||||
| Sweden | 0.6 | ||||||
| Austria | 0.5 | ||||||
| Greece | 0.3 | ||||||
| Philippines | 0.2 | ||||||
| India | 0.1 | ||||||
| Mexico | 0.1 | ||||||
| Thailand | 0.1 | ||||||
| Malaysia | 0.1 | ||||||
| Argentina | 0.0 | ||||||
| Canada | 0.0 | ||||||
| New Zealand | 0.0 | ||||||
| 100.0 | % | ||||||
1
GMO Foreign Fund
(A Series of GMO Trust)
Investments Concentration Summary — (Continued)
February 29, 2008 (Unaudited)
| Industry Sector Summary | % of Equity Investments | ||||||
| Financials | 23.0 | % | |||||
| Industrials | 14.9 | ||||||
| Consumer Discretionary | 13.4 | ||||||
| Energy | 9.7 | ||||||
| Telecommunication Services | 8.6 | ||||||
| Information Technology | 7.2 | ||||||
| Utilities | 7.0 | ||||||
| Consumer Staples | 6.2 | ||||||
| Materials | 6.0 | ||||||
| Health Care | 4.0 | ||||||
| 100.0 | % | ||||||
2
GMO Foreign Fund
(A Series of GMO Trust)
Schedule of Investments
(showing percentage of total net assets)
February 29, 2008
| Shares | Description | Value ($) | |||||||||
| COMMON STOCKS — 95.0% | |||||||||||
| Argentina — 0.0% | |||||||||||
| 32,800 | Banco Patagonia SA * (a) | 676,715 | |||||||||
| Australia — 1.3% | |||||||||||
| 223,100 | Amcor Ltd | 1,459,561 | |||||||||
| 198,100 | Australia and New Zealand Banking Group Ltd | 3,997,544 | |||||||||
| 298,000 | Billabong International Ltd (b) | 3,460,419 | |||||||||
| 812,486 | Coca Cola Amatil Ltd | 7,211,621 | |||||||||
| 483,857 | Crown Ltd * | 5,228,549 | |||||||||
| 3,959,600 | Foster's Group Ltd | 19,508,453 | |||||||||
| 1,276,239 | Insurance Australia Group Ltd | 4,430,720 | |||||||||
| 1,234,100 | Metcash Ltd | 4,750,024 | |||||||||
| 166,788 | National Australia Bank Ltd | 4,408,491 | |||||||||
| 483,857 | Publishing & Broadcasting Ltd | 1,965,168 | |||||||||
| 276,200 | Santos Ltd | 3,273,887 | |||||||||
| 5,061,139 | SP AusNet | 5,825,960 | |||||||||
| 233,800 | Suncorp-Metway Ltd | 2,999,231 | |||||||||
| 855,351 | TABCORP Holdings Ltd | 12,058,088 | |||||||||
| 1,269,886 | Telstra Corp Ltd | 5,708,621 | |||||||||
| 2,920,743 | Telstra Corp-Installment Receipts | 8,814,635 | |||||||||
| 181,500 | Westfarmers Ltd | 6,288,506 | |||||||||
| 328,527 | Westpac Banking Corp | 7,026,755 | |||||||||
| Total Australia | 108,416,233 | ||||||||||
| Austria — 0.4% | |||||||||||
| 123,600 | Erste Bank Der Oesterreichischen Sparkassen AG (b) | 7,151,744 | |||||||||
| 29,330 | Flughafen Wien AG | 3,353,728 | |||||||||
| 179,200 | OMV AG | 12,948,093 | |||||||||
| 385,500 | Telekom Austria AG | 8,719,827 | |||||||||
| 128,030 | Wienerberger AG | 6,179,468 | |||||||||
| Total Austria | 38,352,860 | ||||||||||
See accompanying notes to the financial statements.
3
GMO Foreign Fund
(A Series of GMO Trust)
Schedule of Investments — (Continued)
(showing percentage of total net assets)
February 29, 2008
| Shares | Description | Value ($) | |||||||||
| Belgium — 1.3% | |||||||||||
| 260,170 | Belgacom SA (b) | 12,460,066 | |||||||||
| 432,998 | CIE Francois d' Enterprises | 39,832,284 | |||||||||
| 765,991 | Fortis | 16,922,597 | |||||||||
| 734,028 | Fortis VVPR Strip * | 11,144 | |||||||||
| 67,475 | Groupe Bruxelles Lambert SA | 8,082,610 | |||||||||
| 179,725 | KBC Groep NV (b) | 22,535,268 | |||||||||
| 54,437 | Solvay SA (b) | 6,841,157 | |||||||||
| 125,369 | UCB SA | 5,942,793 | |||||||||
| Total Belgium | 112,627,919 | ||||||||||
| Brazil — 0.9% | |||||||||||
| 605,800 | Banco ABC Brasil SA | 3,761,398 | |||||||||
| 1,391,000 | Banco Panamericano SA | 7,114,984 | |||||||||
| 13,400 | Brasil Brokers Participacoes SA * | 12,281,947 | |||||||||
| 517,600 | Cia Providencia Industria e Comercio SA * | 2,234,333 | |||||||||
| 110,100 | Cremer SA * | 943,379 | |||||||||
| 986,800 | Datasul SA | 10,415,930 | |||||||||
| 78,400 | M Dias Branco SA | 987,476 | |||||||||
| 781,700 | Marisa SA * | 3,097,032 | |||||||||
| 37,000 | MPX Mineracao e Energia SA * | 22,273,077 | |||||||||
| 316,100 | Sul America SA * | 5,044,964 | |||||||||
| 961,200 | Trisul SA * | 6,110,165 | |||||||||
| Total Brazil | 74,264,685 | ||||||||||
| Canada — 0.0% | |||||||||||
| 220,100 | KAP Resources Ltd * (a) (c) | 2,236 | |||||||||
| Finland — 5.6% | |||||||||||
| 572,600 | Neste Oil Oyj (b) | 20,034,762 | |||||||||
| 7,137,000 | Nokia Oyj | 256,415,474 | |||||||||
| 2,556,838 | Nokian Renkaat Oyj (b) | 105,119,720 | |||||||||
| 975,700 | Poyry Oyj | 23,956,697 | |||||||||
| 1,114,700 | Uponor Oyj (b) | 29,115,201 | |||||||||
| 1,660,951 | YIT Oyj (b) | 41,263,017 | |||||||||
| Total Finland | 475,904,871 | ||||||||||
See accompanying notes to the financial statements.
4
GMO Foreign Fund
(A Series of GMO Trust)
Schedule of Investments — (Continued)
(showing percentage of total net assets)
February 29, 2008
| Shares | Description | Value ($) | |||||||||
| France — 7.7% | |||||||||||
| 58,760 | Accor SA | 4,173,651 | |||||||||
| 256,771 | Arcelor Mittal | 19,496,224 | |||||||||
| 781,740 | AXA | 26,357,491 | |||||||||
| 123,105 | BIC SA | 7,783,784 | |||||||||
| 491,008 | BNP Paribas | 43,896,069 | |||||||||
| 35,210 | Casino Guichard-Perrachon SA | 3,982,504 | |||||||||
| 167,096 | Cie de Saint-Gobain | 13,062,630 | |||||||||
| 468,888 | Credit Agricole SA | 12,718,487 | |||||||||
| 1,804,192 | France Telecom SA | 60,564,974 | |||||||||
| 251,752 | Groupe Danone | 19,720,769 | |||||||||
| 17,475 | Guyenne et Gascogne SA | 2,556,240 | |||||||||
| 110,492 | Imerys SA | 9,267,388 | |||||||||
| 73,278 | Lafarge SA | 12,667,640 | |||||||||
| 148,066 | Lagardere SCA | 11,633,191 | |||||||||
| 139,000 | L'Oreal SA | 16,495,382 | |||||||||
| 102,100 | M6-Metropole Television | 2,406,857 | |||||||||
| 170,604 | Michelin SA Class B | 16,802,837 | |||||||||
| 84,438 | Pernod-Ricard | 8,932,402 | |||||||||
| 387,972 | Peugeot SA | 29,493,335 | |||||||||
| 121,700 | Publicis Groupe | 4,394,933 | |||||||||
| 54,000 | Renault SA | 5,769,710 | |||||||||
| 583,033 | Sanofi-Aventis | 43,093,515 | |||||||||
| 126,173 | Schneider Electric SA | 14,366,599 | |||||||||
| 13,667 | Sequana Capital | 336,818 | |||||||||
| 161,230 | Societe Generale (b) | 17,251,483 | |||||||||
| 40,307 | Societe Generale NV (New Shares) * | 4,429,082 | |||||||||
| 1,471,526 | Suez SA | 93,549,079 | |||||||||
| 137,852 | Suez SA VVPR Strip * | 2,093 | |||||||||
| 71,140 | Technip SA | 5,807,667 | |||||||||
| 124,414 | Thales SA | 7,613,018 | |||||||||
| 1,377,700 | Total SA | 103,746,370 | |||||||||
| 484,500 | Vivendi Universal SA | 19,147,673 | |||||||||
| 130,031 | Wendel Investissement (b) | 14,665,334 | |||||||||
| Total France | 656,185,229 | ||||||||||
See accompanying notes to the financial statements.
5
GMO Foreign Fund
(A Series of GMO Trust)
Schedule of Investments — (Continued)
(showing percentage of total net assets)
February 29, 2008
| Shares | Description | Value ($) | |||||||||
| Germany — 11.2% | |||||||||||
| 665,364 | Adidas AG (b) | 42,231,296 | |||||||||
| 418,576 | Allianz SE (Registered) | 72,159,664 | |||||||||
| 110,200 | Axel Springer AG | 13,707,736 | |||||||||
| 129,700 | BASF AG | 16,585,465 | |||||||||
| 797,599 | Bayer AG | 61,382,761 | |||||||||
| 422,800 | Bayerische Motoren Werke AG | 23,296,810 | |||||||||
| 582,501 | Commerzbank AG | 17,512,443 | |||||||||
| 216,820 | Continental AG | 21,381,096 | |||||||||
| 620,681 | Daimler AG (Registered) (b) | 51,686,413 | |||||||||
| 255,400 | Deutsche Bank AG (Registered) | 28,334,548 | |||||||||
| 1,787,800 | Deutsche Post AG (Registered) | 59,233,850 | |||||||||
| 4,236,438 | Deutsche Telekom (Registered) | 80,526,844 | |||||||||
| 363,810 | E.ON AG | 68,496,619 | |||||||||
| 330,400 | Fresenius Medical Care AG & Co | 17,298,467 | |||||||||
| 306,518 | Heidelberger Druckmaschinen | 7,485,976 | |||||||||
| 300,591 | Hypo Real Estate Holding AG (b) | 8,655,945 | |||||||||
| 1,211,500 | Infineon Technologies AG * | 9,797,809 | |||||||||
| 360,500 | Metro AG | 29,898,949 | |||||||||
| 55,600 | MTU Aero Engines Holding | 2,822,228 | |||||||||
| 418,674 | Muenchener Rueckversicherungs AG (Registered) | 73,665,412 | |||||||||
| 38,700 | Puma AG Rudolf Dassler Sport | 13,769,572 | |||||||||
| 537,900 | RWE AG | 65,121,039 | |||||||||
| 1,398,600 | SAP AG | 66,048,589 | |||||||||
| 740,037 | Siemens AG (Registered) | 94,372,585 | |||||||||
| 329,400 | Tognum AG * | 8,030,562 | |||||||||
| Total Germany | 953,502,678 | ||||||||||
| Greece — 0.3% | |||||||||||
| 525,990 | EFG Eurobank Ergasias | 15,151,980 | |||||||||
| 265,000 | Piraeus Bank SA | 7,887,605 | |||||||||
| Total Greece | 23,039,585 | ||||||||||
See accompanying notes to the financial statements.
6
GMO Foreign Fund
(A Series of GMO Trust)
Schedule of Investments — (Continued)
(showing percentage of total net assets)
February 29, 2008
| Shares | Description | Value ($) | |||||||||
| Hong Kong — 3.8% | |||||||||||
| 2,875,500 | CLP Holdings Ltd | 22,478,145 | |||||||||
| 2,361,900 | Hang Seng Bank Ltd | 44,706,454 | |||||||||
| 3,557,000 | Hutchison Whampoa Ltd | 33,335,270 | |||||||||
| 12,436,000 | Link REIT | 30,435,301 | |||||||||
| 11,685,000 | MTR Corp Ltd | 43,307,617 | |||||||||
| 17,283,564 | New World Development Co Ltd | 46,458,144 | |||||||||
| 11,281,000 | Shun Tak Holdings Ltd | 16,653,802 | |||||||||
| 15,764,092 | Sino Land | 39,390,072 | |||||||||
| 2,478,000 | Sun Hung Kai Properties Ltd | 43,182,764 | |||||||||
| Total Hong Kong | 319,947,569 | ||||||||||
| India — 0.1% | |||||||||||
| 900,000 | Satyam Computer Services Ltd | 9,682,561 | |||||||||
| Ireland — 0.8% | |||||||||||
| 1,573,540 | Allied Irish Banks Plc | 31,853,667 | |||||||||
| 1,516,249 | Bank of Ireland | 21,329,344 | |||||||||
| 368,637 | CRH Plc | 13,700,588 | |||||||||
| 8,800 | DCC Plc | 221,411 | |||||||||
| 49,400 | FBD Holdings Plc | 2,171,999 | |||||||||
| 235,500 | Grafton Group Plc * | 1,911,111 | |||||||||
| 81,800 | Irish Life & Permanent Plc | 1,330,564 | |||||||||
| Total Ireland | 72,518,684 | ||||||||||
| Italy — 4.4% | |||||||||||
| 827,100 | Alleanza Assicurazioni SPA | 10,627,671 | |||||||||
| 787,744 | Assicurazioni Generali SPA | 33,857,987 | |||||||||
| 1,240,723 | Banca Intesa SPA – Di RISP | 7,880,056 | |||||||||
| 1,187,324 | Banca Monte dei Paschi di Siena SPA (b) | 5,391,385 | |||||||||
| 343,854 | Buzzi Unicem SPA | 8,436,031 | |||||||||
| 4,700,335 | Enel SPA | 50,718,509 | |||||||||
| 2,423,521 | ENI SPA | 83,687,167 | |||||||||
| 1,086,410 | Fiat SPA | 22,962,679 | |||||||||
| 590,720 | Finmeccanica SPA | 18,166,689 | |||||||||
See accompanying notes to the financial statements.
7
GMO Foreign Fund
(A Series of GMO Trust)
Schedule of Investments — (Continued)
(showing percentage of total net assets)
February 29, 2008
| Shares | Description | Value ($) | |||||||||
| Italy — continued | |||||||||||
| 266,246 | Grouppo Editoriale L'Espresso (b) | 1,094,537 | |||||||||
| 1,926,128 | Intesa San Paolo | 12,936,737 | |||||||||
| 657,970 | Italcementi SPA-Di RISP | 10,006,652 | |||||||||
| 147,700 | Mediobanca SPA | 2,849,569 | |||||||||
| 2,851,000 | Pirelli & Co SPA * | 2,813,793 | |||||||||
| 1,329,200 | Snam Rete Gas SPA | 9,243,105 | |||||||||
| 15,420,198 | Telecom Italia SPA | 38,446,528 | |||||||||
| 15,823,176 | Telecom Italia SPA-Di RISP | 30,529,502 | |||||||||
| 3,646,982 | UniCredito Italiano SPA | 26,830,128 | |||||||||
| Total Italy | 376,478,725 | ||||||||||
| Japan — 18.7% | |||||||||||
| 534,500 | Asahi Breweries | 9,990,874 | |||||||||
| 1,194,000 | Asahi Glass Co Ltd | 13,599,561 | |||||||||
| 932,700 | Astellas Pharma Inc | 40,764,363 | |||||||||
| 1,289,600 | Bridgestone Corp | 21,215,086 | |||||||||
| 1,493,700 | Canon Inc | 66,955,522 | |||||||||
| 322,500 | Chubu Electric Power Co Inc | 8,123,652 | |||||||||
| 843,600 | Daiichi Sankyo Co Ltd | 26,179,860 | |||||||||
| 635,700 | Daiwa House Industry Co Ltd | 6,491,130 | |||||||||
| 3,865,000 | Daiwa Securities Group Inc | 35,837,363 | |||||||||
| 1,702,800 | Denso Corp | 63,568,150 | |||||||||
| 6,217 | East Japan Railway Co | 49,899,889 | |||||||||
| 179,400 | Eisai Co Ltd | 6,469,957 | |||||||||
| 2,591,500 | Haseko Corp * | 3,908,643 | |||||||||
| 2,439,900 | Honda Motor Co Ltd | 74,478,752 | |||||||||
| 22,000 | Ibiden Co Ltd | 1,050,517 | |||||||||
| 4,636,000 | Itochu Corp | 48,818,736 | |||||||||
| 786,200 | JFE Holdings Inc | 35,031,326 | |||||||||
| 868,400 | JSR Corp | 19,059,336 | |||||||||
| 3,740 | Jupiter Telecommunications Co Ltd * | 3,104,597 | |||||||||
| 821,000 | Kao Corp | 25,276,802 | |||||||||
| 8,018 | KDDI Corp | 48,713,560 | |||||||||
| 907,100 | Komatsu Ltd | 23,044,421 | |||||||||
See accompanying notes to the financial statements.
8
GMO Foreign Fund
(A Series of GMO Trust)
Schedule of Investments — (Continued)
(showing percentage of total net assets)
February 29, 2008
| Shares | Description | Value ($) | |||||||||
| Japan — continued | |||||||||||
| 904,000 | Kubota Corp | 6,132,415 | |||||||||
| 351,600 | Kyushu Electric Power Co Inc | 8,858,847 | |||||||||
| 346,200 | Lawson Inc | 13,232,995 | |||||||||
| 2,519,000 | Marubeni Corp | 19,071,609 | |||||||||
| 3,636,000 | Matsushita Electric Industrial Co Ltd | 76,579,249 | |||||||||
| 231,700 | Miraca Holdings Inc | 4,970,019 | |||||||||
| 1,797,500 | Mitsubishi Corp | 54,842,592 | |||||||||
| 8,727,000 | Mitsubishi Electric Corp | 79,934,565 | |||||||||
| 1,436,000 | Mitsui OSK Lines Ltd | 18,650,600 | |||||||||
| 201,000 | Murata Manufacturing Co Ltd | 10,905,845 | |||||||||
| 658,000 | NGK Spark Plug Co Ltd (b) | 10,285,849 | |||||||||
| 285,000 | Nihon Kohden Corp | 5,748,781 | |||||||||
| 68,900 | Nintendo Co Ltd | 34,305,014 | |||||||||
| 1,688 | Nippon Commercial Investment Corp (REIT) | 7,633,380 | |||||||||
| 1,647,000 | Nippon Express Co Ltd | 8,785,885 | |||||||||
| 132,500 | Nippon Mining Holdings Inc | 784,778 | |||||||||
| 4,363,000 | Nippon Steel Corp | 22,954,617 | |||||||||
| 279,300 | Nitto Denko Corp | 13,598,594 | |||||||||
| 940,600 | Nomura Holdings Inc | 14,770,853 | |||||||||
| 369 | Nomura Real Estate Office Fund (REIT) | 3,096,774 | |||||||||
| 23,019 | NTT Docomo Inc | 33,724,447 | |||||||||
| 56,720 | ORIX Corp | 8,480,149 | |||||||||
| 777 | Orix JREIT Inc | 4,421,172 | |||||||||
| 505,100 | Seven & I Holdings Co Ltd | 12,559,447 | |||||||||
| 487 | Seven Bank Ltd * | 815,651 | |||||||||
| 434,000 | Shionogi and Co Ltd | 7,440,131 | |||||||||
| 615,000 | Shiseido Co Ltd | 14,015,179 | |||||||||
| 918,800 | Sony Corp | 43,407,066 | |||||||||
| 1,600 | Sony Financial Holdings Inc * | 6,391,376 | |||||||||
| 3,913,000 | Sumitomo Chemical Co Ltd | 27,087,071 | |||||||||
| 3,375,900 | Sumitomo Electric Industries Ltd | 49,956,620 | |||||||||
| 1,709,000 | Sumitomo Heavy Industries Ltd | 13,630,041 | |||||||||
| 7,707 | Sumitomo Mitsui Financial Group Inc | 55,667,401 | |||||||||
| 998,000 | Sumitomo Realty & Development Co Ltd | 17,031,920 | |||||||||
See accompanying notes to the financial statements.
9
GMO Foreign Fund
(A Series of GMO Trust)
Schedule of Investments — (Continued)
(showing percentage of total net assets)
February 29, 2008
| Shares | Description | Value ($) | |||||||||
| Japan — continued | |||||||||||
| 354,400 | Takeda Pharmaceutical Co Ltd | 19,775,176 | |||||||||
| 5,544,000 | Tokyo Gas Co Ltd | 24,869,144 | |||||||||
| 1,941,000 | Tokyo Tatemono Co Ltd | 13,152,828 | |||||||||
| 1,375,000 | Tokyu Land Corp | 9,267,599 | |||||||||
| 3,363,000 | Toshiba Corp | 25,224,973 | |||||||||
| 2,407,900 | Toyota Motor Corp | 130,863,707 | |||||||||
| 110,300 | Uni-Charm Corp | 8,060,965 | |||||||||
| 3,143 | West Japan Railway Co | 14,379,166 | |||||||||
| Total Japan | 1,586,946,587 | ||||||||||
| Malaysia — 0.1% | |||||||||||
| 3,805,500 | IJM Corp Berhad | 8,544,595 | |||||||||
| Mexico — 0.1% | |||||||||||
| 870,600 | Megacable Holdings SAB de CV * | 2,450,849 | |||||||||
| 1,948,900 | Urbi Desarrollos Urbanos SAB de CV * | 6,823,880 | |||||||||
| Total Mexico | 9,274,729 | ||||||||||
| Netherlands — 5.1% | |||||||||||
| 3,024,985 | Aegon NV | 45,176,629 | |||||||||
| 447,702 | Akzo Nobel NV | 32,829,029 | |||||||||
| 276,782 | Fortis NV | 6,101,717 | |||||||||
| 133,232 | Fugro NV | 10,051,435 | |||||||||
| 139,274 | Hal Trust (Participating Units) | 15,728,934 | |||||||||
| 2,290,722 | ING Groep NV | 76,124,578 | |||||||||
| 302,570 | Koninklijke Ahold NV * | 3,976,196 | |||||||||
| 2,812,000 | Koninklijke KPN NV | 53,085,058 | |||||||||
| 148,310 | Koninklijke Vopak NV | 7,722,857 | |||||||||
| 392,897 | Koninklijke Wessanen NV | 5,257,643 | |||||||||
| 2,151,732 | Philips Electronics NV | 83,949,035 | |||||||||
| 92,391 | Philips Electronics NV ADR | 3,595,858 | |||||||||
| 1,372,695 | Reed Elsevier NV | 25,502,006 | |||||||||
| 133,440 | Royal Dutch Shell Group Class A (Amsterdam) | 4,771,757 | |||||||||
| 644,307 | TNT NV | 25,374,408 | |||||||||
See accompanying notes to the financial statements.
10
GMO Foreign Fund
(A Series of GMO Trust)
Schedule of Investments — (Continued)
(showing percentage of total net assets)
February 29, 2008
| Shares | Description | Value ($) | |||||||||
| Netherlands — continued | |||||||||||
| 682,160 | Unilever NV | 21,093,222 | |||||||||
| 78,987 | Wereldhave NV | 9,547,790 | |||||||||
| Total Netherlands | 429,888,152 | ||||||||||
| New Zealand — 0.0% | |||||||||||
| 389,777 | Air New Zealand | 517,333 | |||||||||
| 1,191,683 | Telecom Corp of New Zealand | 3,656,504 | |||||||||
| Total New Zealand | 4,173,837 | ||||||||||
| Norway — 1.8% | |||||||||||
| 4,689,420 | Prosafe ASA | 80,323,317 | |||||||||
| 1,292,300 | StatoilHydro ASA | 39,378,069 | |||||||||
| 1,504,700 | Telenor ASA * | 30,811,226 | |||||||||
| Total Norway | 150,512,612 | ||||||||||
| Philippines — 0.2% | |||||||||||
| 38,000,000 | Alliance Global Group Inc * | 4,021,811 | |||||||||
| 5,195,800 | First Gen Corp | 5,130,623 | |||||||||
| 55,280,000 | Vista Land & Lifescapes Inc * | 5,793,847 | |||||||||
| Total Philippines | 14,946,281 | ||||||||||
| Singapore — 1.3% | |||||||||||
| 2,997,380 | DBS Group Holdings Ltd | 36,492,011 | |||||||||
| 2,224,000 | Keppel Corp Ltd | 16,758,204 | |||||||||
| 9,244,000 | People's Food Holdings Ltd | 7,062,392 | |||||||||
| 1,357,600 | Singapore Airlines Ltd | 14,725,809 | |||||||||
| 4,930,000 | Singapore Technologies Engineering Ltd | 11,920,499 | |||||||||
| 8,496,710 | Singapore Telecommunications | 22,989,664 | |||||||||
| Total Singapore | 109,948,579 | ||||||||||
| South Korea — 0.6% | |||||||||||
| 99,300 | Hana Financial Group Inc | 4,406,238 | |||||||||
| 19,865 | Hansol Paper Co * | 233,692 | |||||||||
| 77,400 | Kookmin Bank | 4,770,130 | |||||||||
See accompanying notes to the financial statements.
11
GMO Foreign Fund
(A Series of GMO Trust)
Schedule of Investments — (Continued)
(showing percentage of total net assets)
February 29, 2008
| Shares | Description | Value ($) | |||||||||
| South Korea — continued | |||||||||||
| 143,100 | KT Corp ADR * | 3,475,899 | |||||||||
| 8,401 | Lotte Shopping Co Ltd | 2,843,352 | |||||||||
| 85,500 | Samsung Card Co Ltd | 4,536,420 | |||||||||
| 55,200 | Samsung Electronics Co Ltd | 32,356,708 | |||||||||
| 37,000 | Shinhan Financial Group Co Ltd | 1,993,146 | |||||||||
| Total South Korea | 54,615,585 | ||||||||||
| Spain — 2.9% | |||||||||||
| 120,040 | ACS Actividades de Construccion y Servicios SA | 6,130,912 | |||||||||
| 1,830,692 | Banco Bilbao Vizcaya Argentaria SA | 37,745,199 | |||||||||
| 196,315 | Banco Popular Espanol SA | 3,074,446 | |||||||||
| 2,206,032 | Banco Santander Central Hispano SA | 39,420,769 | |||||||||
| 27,700 | Cia de Distribucion Integral Logista SA | 2,207,080 | |||||||||
| 156,600 | Gas Natural SDG SA | 9,488,960 | |||||||||
| 39,200 | Grupo Ferrovial SA | 2,565,349 | |||||||||
| 2,041,772 | Iberdrola SA | 29,488,840 | |||||||||
| 132,100 | Inditex SA | 6,810,236 | |||||||||
| 635,000 | Mapfre SA | 2,863,155 | |||||||||
| 94,750 | Red Electrica de Espana | 5,911,414 | |||||||||
| 645,329 | Repsol YPF SA | 22,261,669 | |||||||||
| 2,410,161 | Telefonica SA | 69,741,735 | |||||||||
| 138,668 | Union Fenosa SA | 9,136,728 | |||||||||
| Total Spain | 246,846,492 | ||||||||||
| Sweden — 0.6% | |||||||||||
| 586,740 | Autoliv Inc SDR (b) | 29,286,529 | |||||||||
| 1,428,100 | Svenska Cellulosa AB Class B | 23,441,860 | |||||||||
| Total Sweden | 52,728,389 | ||||||||||
| Switzerland — 3.0% | |||||||||||
| 43,170 | Baloise Holding Ltd | 3,893,444 | |||||||||
| 1,620 | Bank Sarasin & Cie AG Class B (Registered) | 7,265,190 | |||||||||
| 2,822 | Banque Cantonale Vaudoise | 1,457,699 | |||||||||
| 2,666 | Belimo Holding AG (Registered) | 2,963,808 | |||||||||
See accompanying notes to the financial statements.
12
GMO Foreign Fund
(A Series of GMO Trust)
Schedule of Investments — (Continued)
(showing percentage of total net assets)
February 29, 2008
| Shares | Description | Value ($) | |||||||||
| Switzerland — continued | |||||||||||
| 20,560 | Bobst Group AG (Registered) | 1,468,469 | |||||||||
| 332,950 | Credit Suisse Group | 16,369,831 | |||||||||
| 9,335 | Energiedienst Holding AG (Registered) * | 6,086,942 | |||||||||
| 6,697 | Forbo Holdings AG (Registered) * (b) | 3,355,522 | |||||||||
| 32,820 | Geberit AG (Registered) | 4,828,546 | |||||||||
| 131,305 | Holcim Ltd | 13,389,719 | |||||||||
| 880 | Jelmoli Holding AG (Bearer) | 2,249,951 | |||||||||
| 4,836 | Jelmoli Holding AG (Registered) | 2,424,461 | |||||||||
| 120,510 | Nestle SA (Registered) | 57,518,018 | |||||||||
| 345,884 | Novartis AG (Registered) | 17,084,176 | |||||||||
| 585 | SGS SA (Registered) | 785,732 | |||||||||
| 75,300 | Swatch Group AG | 22,102,431 | |||||||||
| 19,900 | Swiss Life Holding * | 4,988,199 | |||||||||
| 504 | Swiss National Insurance Co (Registered) | 393,666 | |||||||||
| 365,441 | Swiss Reinsurance Co (Registered) | 29,291,378 | |||||||||
| 14,100 | Swisscom AG (Registered) | 5,362,754 | |||||||||
| 479,980 | UBS AG (Registered) | 15,661,084 | |||||||||
| 18,941 | Valora Holding AG | 4,406,142 | |||||||||
| 90,104 | Zurich Financial Services AG | 28,167,515 | |||||||||
| Total Switzerland | 251,514,677 | ||||||||||
| Taiwan — 1.0% | |||||||||||
| 5,119,608 | Asustek Computer Inc | 14,133,944 | |||||||||
| 5,998,320 | Chinatrust Financial Holding Co Ltd * | 5,362,554 | |||||||||
| 491,290 | Chungwa Telecom Co Ltd ADR | 12,056,257 | |||||||||
| 5,298,900 | E.Sun Financial Holdings Co Ltd * | 3,046,383 | |||||||||
| 2,780,000 | Far Eastone Telecommunications Co Ltd | 3,881,964 | |||||||||
| 812,000 | Hon Hai Precision Industry Co Ltd | 4,844,489 | |||||||||
| 937,000 | MediaTek Inc | 10,508,936 | |||||||||
| 1,483,000 | Novatek Microelectronics Corp Ltd | 5,218,404 | |||||||||
| 2,116,800 | Qisda Corp * | 1,972,688 | |||||||||
| 3,550,000 | Sinopac Holdings Co | 1,535,864 | |||||||||
| 646,070 | Standard Foods Corp | 353,603 | |||||||||
See accompanying notes to the financial statements.
13
GMO Foreign Fund
(A Series of GMO Trust)
Schedule of Investments — (Continued)
(showing percentage of total net assets)
February 29, 2008
| Shares | Description | Value ($) | |||||||||
| Taiwan — continued | |||||||||||
| 617,456 | Taiwan Semiconductor Manufacturing Co Ltd Sponsored ADR | 6,014,021 | |||||||||
| 22,103,890 | United Microelectronics Corp | 13,120,051 | |||||||||
| Total Taiwan | 82,049,158 | ||||||||||
| Thailand — 0.1% | |||||||||||
| 62,918,000 | Charoen Pokphand Foods Pcl (Foreign Registered) (a) | 9,177,932 | |||||||||
| United Kingdom — 21.7% | |||||||||||
| 629,273 | Anglo American Plc | 39,942,054 | |||||||||
| 450,945 | Associated British Foods Plc | 7,556,033 | |||||||||
| 787,600 | AstraZeneca Plc | 29,438,443 | |||||||||
| 3,380,175 | Aviva Plc | 40,742,755 | |||||||||
| 7,010,910 | BAE Systems Plc | 66,736,593 | |||||||||
| 5,615,204 | Barclays Plc | 52,627,482 | |||||||||
| 900,036 | BBA Aviation Plc | 3,274,770 | |||||||||
| 2,948,946 | BG Group Plc | 69,509,557 | |||||||||
| 867,147 | BHP Billiton Plc | 27,740,131 | |||||||||
| 398,363 | Biffa Plc | 2,734,152 | |||||||||
| 15,174,540 | BP Plc | 163,653,072 | |||||||||
| 540,000 | British Energy Group Plc | 6,015,706 | |||||||||
| 798,876 | British Sky Broadcasting Plc | 8,963,926 | |||||||||
| 8,142,101 | BT Group Plc | 36,643,278 | |||||||||
| 442,365 | Bunzl Plc | 6,079,437 | |||||||||
| 798,000 | Cadbury Schweppes Plc | 8,882,742 | |||||||||
| 1,014,249 | Cattle's Plc | 4,670,605 | |||||||||
| 2,861,457 | Centrica Plc | 18,269,799 | |||||||||
| 3,104,700 | Cobham Plc | 11,169,326 | |||||||||
| 2,652,700 | Compass Group Plc | 17,098,224 | |||||||||
| 2,099,810 | Diageo Plc | 42,909,244 | |||||||||
| 1,764,352 | DSG International Plc | 2,205,534 | |||||||||
| 108,534 | Experian Group | 912,382 | |||||||||
| 126,317 | Fiberweb Plc | 167,165 | |||||||||
| 831,981 | Filtrona Plc | 3,115,763 | |||||||||
| 632,398 | FKI Plc | 909,406 | |||||||||
See accompanying notes to the financial statements.
14
GMO Foreign Fund
(A Series of GMO Trust)
Schedule of Investments — (Continued)
(showing percentage of total net assets)
February 29, 2008
| Shares | Description | Value ($) | |||||||||
| United Kingdom — continued | |||||||||||
| 3,661,899 | GlaxoSmithKline Plc | 79,933,905 | |||||||||
| 1,216,971 | Group 4 Securicor Plc | 5,248,423 | |||||||||
| 1,132,961 | Hays Plc | 2,435,853 | |||||||||
| 3,187,596 | HBOS Plc | 37,878,064 | |||||||||
| 6,531,927 | HSBC Holdings Plc | 98,744,954 | |||||||||
| 1,015,670 | ICAP Plc | 12,646,566 | |||||||||
| 977,318 | Imperial Tobacco Group Plc | 45,242,302 | |||||||||
| 121,632 | InterContinental Hotels Group Plc | 1,851,240 | |||||||||
| 1,685,800 | International Power Plc | 12,665,141 | |||||||||
| 1,519,000 | ITV Plc | 2,007,792 | |||||||||
| 667,091 | J Sainsbury Plc | 4,676,914 | |||||||||
| 350,270 | Johnson Matthey Plc | 13,466,077 | |||||||||
| 403,803 | Kesa Electricals Plc | 1,705,933 | |||||||||
| 920,418 | Kingfisher Plc | 2,375,946 | |||||||||
| 973,158 | Ladbrokes Plc | 5,843,683 | |||||||||
| 845,000 | Lamprell Plc | 7,100,397 | |||||||||
| 129,400 | Land Securities Group Plc | 4,034,383 | |||||||||
| 9,781,744 | Legal & General Group Plc | 24,066,664 | |||||||||
| 3,394,020 | Lloyds TSB Group Plc | 30,336,929 | |||||||||
| 49,738 | Lonmin Plc | 3,245,086 | |||||||||
| 1,240,500 | Misys Plc | 3,653,281 | |||||||||
| 333,472 | Mitchells & Butler (Ordinary Shares) | 2,934,106 | |||||||||
| 66,744 | Mondi Ltd | 546,211 | |||||||||
| 68,761 | Mondi Plc | 530,417 | |||||||||
| 2,385,467 | National Grid Plc | 34,589,036 | |||||||||
| 245,132 | Next Plc | 6,217,016 | |||||||||
| 1,374,200 | Northern Foods Plc | 2,452,082 | |||||||||
| 4,403,034 | Old Mutual Plc | 10,875,942 | |||||||||
| 1,253,300 | Pearson Plc | 16,481,516 | |||||||||
| 2,553,417 | Prudential Plc | 30,636,929 | |||||||||
| 836,403 | Reed Elsevier Plc | 10,526,947 | |||||||||
| 2,905,011 | Rentokil Initial Plc | 4,785,321 | |||||||||
| 962,886 | Resolution Plc | 13,184,186 | |||||||||
| 621,169 | Reuters Group Plc | 7,336,026 | |||||||||
See accompanying notes to the financial statements.
15
GMO Foreign Fund
(A Series of GMO Trust)
Schedule of Investments — (Continued)
(showing percentage of total net assets)
February 29, 2008
| Shares | Description | Value ($) | |||||||||
| United Kingdom — continued | |||||||||||
| 605,836 | Rexam Plc | 5,274,084 | |||||||||
| 301,028 | Rio Tinto Plc | 33,867,928 | |||||||||
| 549,700 | Rolls-Royce Group Plc * | 4,712,430 | |||||||||
| 1,526,308 | Royal & Sun Alliance Insurance Group | 3,979,100 | |||||||||
| 9,738,014 | Royal Bank of Scotland Group | 73,624,513 | |||||||||
| 1,897,000 | Royal Dutch Shell Plc A Shares (London) | 67,829,831 | |||||||||
| 2,055,597 | Royal Dutch Shell Plc B Shares (London) | 72,114,380 | |||||||||
| 575,400 | SABMiller Breweries Plc | 11,954,281 | |||||||||
| 1,384,000 | Sage Group Plc | 5,395,376 | |||||||||
| 297,700 | Schroders Plc | 5,620,799 | |||||||||
| 820,521 | Scottish & Newcastle Plc | 12,834,311 | |||||||||
| 974,960 | Scottish & Southern Energy Plc | 28,508,448 | |||||||||
| 563,626 | Segro Plc | 5,762,718 | |||||||||
| 608,552 | Serco Group Plc | 5,231,100 | |||||||||
| 535,575 | Severn Trent (Ordinary Shares) | 15,033,304 | |||||||||
| 825,100 | Shire Plc | 16,106,431 | |||||||||
| 607,432 | Smith (David S.) Holdings Plc | 1,902,108 | |||||||||
| 290,270 | Standard Chartered Plc | 9,563,260 | |||||||||
| 2,543,200 | Standard Life Assurance Plc | 10,993,309 | |||||||||
| 2,543,277 | Tesco Plc | 20,097,736 | |||||||||
| 684,305 | Tomkins Plc | 2,294,303 | |||||||||
| 241,664 | Travis Perkins Plc | 5,166,215 | |||||||||
| 320,847 | Trinity Mirror Plc | 1,802,897 | |||||||||
| 637,539 | Unilever Plc | 20,086,474 | |||||||||
| 499,112 | United Utilities Plc | 6,834,420 | |||||||||
| 40,585,483 | Vodafone Group Inc | 130,661,651 | |||||||||
| 68,539 | WH Smith Plc | 506,914 | |||||||||
| 235,071 | Whitbread Plc | 5,882,023 | |||||||||
| 321,300 | William Hill Plc | 2,389,742 | |||||||||
| 1,239,836 | William Morrison Supermarkets Plc | 7,267,914 | |||||||||
| 728,321 | Wolseley Plc | 8,912,500 | |||||||||
| 2,266,250 | Wood Group (John) Plc | 18,518,312 | |||||||||
| 789,400 | WPP Group Plc | 9,317,976 | |||||||||
See accompanying notes to the financial statements.
16
GMO Foreign Fund
(A Series of GMO Trust)
Schedule of Investments — (Continued)
(showing percentage of total net assets)
February 29, 2008
| Shares | Description | Value ($) | |||||||||
| United Kingdom — continued | |||||||||||
| 54,500 | Xstrata Plc | 4,251,566 | |||||||||
| 248,700 | Yell Group Plc | 1,072,814 | |||||||||
| Total United Kingdom | 1,847,594,015 | ||||||||||
| TOTAL COMMON STOCKS (COST $6,413,298,274) | 8,080,362,170 | ||||||||||
| PREFERRED STOCKS — 0.6% | |||||||||||
| Brazil — 0.1% | |||||||||||
| 1,257,200 | Randon Participacoes SA 0.46% | 11,894,743 | |||||||||
| France — 0.0% | |||||||||||
| 24,058 | Casino Guichard-Perrachon SA 4.06% (b) | 1,959,490 | |||||||||
| Germany — 0.4% | |||||||||||
| 381,370 | Henkel KGaA 1.81% | 16,953,195 | |||||||||
| 2,830 | Porsche AG (Non Voting) 0.06% | 4,906,879 | |||||||||
| 54,806 | Volkswagen AG 2.02% | 7,636,563 | |||||||||
| Total Germany | 29,496,637 | ||||||||||
| Italy — 0.1% | |||||||||||
| 199,733 | Fiat SPA 3.57% | 3,372,798 | |||||||||
| 92,571 | IFI Istituto Finanziario Industries * | 2,615,556 | |||||||||
| Total Italy | 5,988,354 | ||||||||||
| TOTAL PREFERRED STOCKS (COST $30,583,867) | 49,339,224 | ||||||||||
| RIGHTS AND WARRANTS — 0.0% | |||||||||||
| France — 0.0% | |||||||||||
| 2 | Societe Generale Rights, Expires 02/29/08 * (b) (d) | 18 | |||||||||
| TOTAL RIGHTS AND WARRANTS (COST $22) | 18 | ||||||||||
See accompanying notes to the financial statements.
17
GMO Foreign Fund
(A Series of GMO Trust)
Schedule of Investments — (Continued)
(showing percentage of total net assets)
February 29, 2008
| Shares / Par Value ($) | Description | Value ($) | |||||||||
| SHORT-TERM INVESTMENTS — 3.3% | |||||||||||
| 191,307,524 | Bank of New York Mellon Institutional Cash Reserves Fund (e) | 191,307,524 | |||||||||
| 94,700,000 | Barclays Plc Time Deposit, 3.12%, due 03/03/08 | 94,700,000 | |||||||||
| TOTAL SHORT-TERM INVESTMENTS (COST $286,007,524) | 286,007,524 | ||||||||||
| TOTAL INVESTMENTS — 98.9% (Cost $6,729,889,687) | 8,415,708,936 | ||||||||||
| Other Assets and Liabilities (net) — 1.1% | 90,086,169 | ||||||||||
| TOTAL NET ASSETS — 100.0% | $ | 8,505,795,105 | |||||||||
Notes to Schedule of Investments:
ADR - American Depositary Receipt
Foreign Registered - Shares issued to foreign investors in markets that have foreign ownership limits.
REIT - Real Estate Investment Trust
SDR - Swedish Depository Receipt
* Non-income producing security.
(a) Security valued at fair value using methods determined in good faith by or at the direction of the Trustees of GMO Trust (Note 2).
(b) All or a portion of this security is out on loan (Note 2).
(c) Bankrupt issuer.
(d) As of February 29, 2008, the Fund elected to sell these rights but the sale did not occur until after the Fund's year end.
(e) All or a portion of this security represents investment of security lending collateral (Note 2).
As of February 29, 2008, 93.33% of the Net Assets of the Fund were valued using fair value prices based on models used by a third party vendor (Note 2).
See accompanying notes to the financial statements.
18
GMO Foreign Fund
(A Series of GMO Trust)
Statement of Assets and Liabilities — February 29, 2008
| Assets: | |||||||
| Investments, at value, including securities on loan of $173,252,546 (cost $6,729,889,687) (Note 2) | $ | 8,415,708,936 | |||||
| Cash | 81,583 | ||||||
| Foreign currency, at value (cost $316,741,913) (Note 2) | 324,026,921 | ||||||
| Receivable for investments sold | 65,654,276 | ||||||
| Receivable for Fund shares sold | 20,045,703 | ||||||
| Dividends and interest receivable | 12,591,170 | ||||||
| Foreign taxes receivable | 1,357,398 | ||||||
| Receivable for expenses reimbursed by Manager (Note 3) | 484,271 | ||||||
| Total assets | 8,839,950,258 | ||||||
| Liabilities: | |||||||
| Collateral on securities loaned, at value (Note 2) | 191,307,524 | ||||||
| Payable for investments purchased | 131,733,331 | ||||||
| Payable for Fund shares repurchased | 4,674,997 | ||||||
| Payable to affiliate for (Note 3): | |||||||
| Management fee | 4,013,995 | ||||||
| Shareholder service fee | 875,256 | ||||||
| Administration fee – Class M | 1,188 | ||||||
| Trustees and Chief Compliance Officer of GMO Trust fees | 10,707 | ||||||
| Payable for 12b-1 fee – Class M | 3,160 | ||||||
| Accrued expenses | 1,534,995 | ||||||
| Total liabilities | 334,155,153 | ||||||
| Net assets | $ | 8,505,795,105 | |||||
See accompanying notes to the financial statements.
19
GMO Foreign Fund
(A Series of GMO Trust)
Statement of Assets and Liabilities — February 29, 2008 — (Continued)
| Net assets consist of: | |||||||
| Paid-in capital | $ | 6,518,992,037 | |||||
| Distributions in excess of net investment income | (21,928,667 | ) | |||||
| Accumulated net realized gain | 315,136,035 | ||||||
| Net unrealized appreciation | 1,693,595,700 | ||||||
| $ | 8,505,795,105 | ||||||
| Net assets attributable to: | |||||||
| Class II shares | $ | 848,359,455 | |||||
| Class III shares | $ | 4,078,545,211 | |||||
| Class IV shares | $ | 3,571,515,655 | |||||
| Class M shares | $ | 7,374,784 | |||||
| Shares outstanding: | |||||||
| Class II | 51,367,985 | ||||||
| Class III | 245,876,088 | ||||||
| Class IV | 215,278,963 | ||||||
| Class M | 444,839 | ||||||
| Net asset value per share: | |||||||
| Class II | $ | 16.52 | |||||
| Class III | $ | 16.59 | |||||
| Class IV | $ | 16.59 | |||||
| Class M | $ | 16.58 | |||||
See accompanying notes to the financial statements.
20
GMO Foreign Fund
(A Series of GMO Trust)
Statement of Operations — Year Ended February 29, 2008
| Investment Income: | |||||||
| Dividends (net of withholding taxes of $21,696,191) | $ | 245,461,129 | |||||
| Interest | 13,850,994 | ||||||
| Securities lending income | 8,062,994 | ||||||
| Total investment income | 267,375,117 | ||||||
| Expenses: | |||||||
| Management fee (Note 3) | 56,099,105 | ||||||
| Shareholder service fee – Class II (Note 3) | 2,109,647 | ||||||
| Shareholder service fee – Class III (Note 3) | 6,903,074 | ||||||
| Shareholder service fee – Class IV (Note 3) | 3,402,058 | ||||||
| 12b-1 fee – Class M (Note 3) | 22,016 | ||||||
| Administration fee – Class M (Note 3) | 17,613 | ||||||
| Custodian and fund accounting agent fees | 3,923,858 | ||||||
| Transfer agent fees | 71,795 | ||||||
| Audit and tax fees | 102,005 | ||||||
| Legal fees | 200,883 | ||||||
| Trustees fees and related expenses (Note 3) | 95,783 | ||||||
| Registration fees | 49,675 | ||||||
| Miscellaneous | 120,826 | ||||||
| Total expenses | 73,118,338 | ||||||
| Fees and expenses reimbursed by Manager (Note 3) | (4,412,622 | ) | |||||
| Expense reductions (Note 2) | (66,219 | ) | |||||
| Net expenses | 68,639,497 | ||||||
| Net investment income (loss) | 198,735,620 | ||||||
| Realized and unrealized gain (loss): | |||||||
| Net realized gain (loss) on: | |||||||
| Investments | 917,311,384 | ||||||
| Foreign currency, forward contracts and foreign currency related transactions (net of CPMF tax of $2,276) (Note 2) | 18,899,322 | ||||||
| Net realized gain (loss) | 936,210,706 | ||||||
| Change in net unrealized appreciation (depreciation) on: | |||||||
| Investments | (1,182,696,725 | ) | |||||
| Foreign currency, forward contracts and foreign currency related transactions | 6,685,432 | ||||||
| Net unrealized gain (loss) | (1,176,011,293 | ) | |||||
| Net realized and unrealized gain (loss) | (239,800,587 | ) | |||||
| Net increase (decrease) in net assets resulting from operations | $ | (41,064,967 | ) | ||||
See accompanying notes to the financial statements.
21
GMO Foreign Fund
(A Series of GMO Trust)
Statement of Changes in Net Assets
| Year Ended February 29, 2008 | Year Ended February 28, 2007 | ||||||||||
| Increase (decrease) in net assets: | |||||||||||
| Operations: | |||||||||||
| Net investment income (loss) | $ | 198,735,620 | $ | 169,595,532 | |||||||
| Net realized gain (loss) | 936,210,706 | 611,671,466 | |||||||||
| Change in net unrealized appreciation (depreciation) | (1,176,011,293 | ) | 819,452,831 | ||||||||
| Net increase (decrease) in net assets from operations | (41,064,967 | ) | 1,600,719,829 | ||||||||
| Distributions to shareholders from: | |||||||||||
| Net investment income | |||||||||||
| Class II | (21,412,395 | ) | (25,692,710 | ) | |||||||
| Class III | (104,621,491 | ) | (104,807,051 | ) | |||||||
| Class IV | (96,288,052 | ) | (72,605,045 | ) | |||||||
| Class M | (177,321 | ) | (156,746 | ) | |||||||
| Total distributions from net investment income | (222,499,259 | ) | (203,261,552 | ) | |||||||
| Net realized gains | |||||||||||
| Class II | (81,212,536 | ) | (71,672,115 | ) | |||||||
| Class III | (384,092,710 | ) | (265,348,849 | ) | |||||||
| Class IV | (323,497,643 | ) | (179,509,192 | ) | |||||||
| Class M | (736,740 | ) | (450,682 | ) | |||||||
| Total distributions from net realized gains | (789,539,629 | ) | (516,980,838 | ) | |||||||
| (1,012,038,888 | ) | (720,242,390 | ) | ||||||||
| Net share transactions (Note 7): | |||||||||||
| Class II | (67,333,012 | ) | (335,623,499 | ) | |||||||
| Class III | (1,411,331 | ) | 277,446,603 | ||||||||
| Class IV | 620,525,429 | 1,156,698,945 | |||||||||
| Class M | 72,341 | 1,562,326 | |||||||||
| Increase (decrease) in net assets resulting from net share transactions | 551,853,427 | 1,100,084,375 | |||||||||
| Total increase (decrease) in net assets | (501,250,428 | ) | 1,980,561,814 | ||||||||
| Net assets: | |||||||||||
| Beginning of period | 9,007,045,533 | 7,026,483,719 | |||||||||
| End of period (including distributions in excess of net investment income of $21,928,667 and $44,311,300, respectively) | $ | 8,505,795,105 | $ | 9,007,045,533 | |||||||
See accompanying notes to the financial statements.
22
GMO Foreign Fund
(A Series of GMO Trust)
Financial Highlights
(For a Class II share outstanding throughout each period)
| Year Ended February 28/29, | |||||||||||||||||||||||
| 2008 | 2007 | 2006 | 2005 | 2004 | |||||||||||||||||||
| Net asset value, beginning of period | $ | 18.56 | $ | 16.70 | $ | 15.13 | $ | 13.29 | $ | 8.88 | |||||||||||||
| Income (loss) from investment operations: | |||||||||||||||||||||||
| Net investment income (loss)(a) | 0.40 | 0.38 | 0.28 | 0.26 | 0.17 | ||||||||||||||||||
| Net realized and unrealized gain (loss) | (0.36 | ) | 3.06 | 2.46 | 2.28 | 4.46 | |||||||||||||||||
| Total from investment operations | 0.04 | 3.44 | 2.74 | 2.54 | 4.63 | ||||||||||||||||||
| Less distributions to shareholders: | |||||||||||||||||||||||
| From net investment income | (0.44 | ) | (0.43 | ) | (0.33 | ) | (0.34 | ) | (0.22 | ) | |||||||||||||
| From net realized gains | (1.64 | ) | (1.15 | ) | (0.84 | ) | (0.36 | ) | — | ||||||||||||||
| Total distributions | (2.08 | ) | (1.58 | ) | (1.17 | ) | (0.70 | ) | (0.22 | ) | |||||||||||||
| Net asset value, end of period | $ | 16.52 | $ | 18.56 | $ | 16.70 | $ | 15.13 | $ | 13.29 | |||||||||||||
| Total Return(b) | (0.78 | )% | 21.21 | % | 19.01 | % | 19.40 | % | 52.49 | % | |||||||||||||
| Ratios/Supplemental Data: | |||||||||||||||||||||||
| Net assets, end of period (000's) | $ | 848,359 | $ | 1,018,021 | $ | 1,213,447 | $ | 808,149 | $ | 781,448 | |||||||||||||
| Net expenses to average daily net assets | 0.82 | %(c) | 0.82 | % | 0.82 | % | 0.82 | % | 0.82 | % | |||||||||||||
| Net investment income to average daily net assets | 2.10 | % | 2.17 | % | 1.82 | % | 1.92 | % | 1.47 | % | |||||||||||||
| Portfolio turnover rate | 29 | % | 23 | % | 25 | % | 23 | % | 25 | % | |||||||||||||
| Fees and expenses reimbursed by the Manager to average daily net assets: | 0.05 | % | 0.05 | % | 0.05 | % | 0.06 | % | 0.08 | % | |||||||||||||
(a) Calculated using average shares outstanding throughout the period.
(b) The total returns would have been lower had certain expenses not been reimbursed during the periods shown and assumes the effect of reinvested distributions.
(c) The net expense ratio does not include the effect of expense reductions.
See accompanying notes to the financial statements.
23
GMO Foreign Fund
(A Series of GMO Trust)
Financial Highlights
(For a Class III share outstanding throughout each period)
| Year Ended February 28/29, | |||||||||||||||||||||||
| 2008 | 2007 | 2006 | 2005 | 2004 | |||||||||||||||||||
| Net asset value, beginning of period | $ | 18.64 | $ | 16.76 | $ | 15.18 | $ | 13.34 | $ | 8.90 | |||||||||||||
| Income (loss) from investment operations: | |||||||||||||||||||||||
| Net investment income (loss)(a) | 0.41 | 0.38 | 0.30 | 0.26 | 0.19 | ||||||||||||||||||
| Net realized and unrealized gain (loss) | (0.36 | ) | 3.09 | 2.45 | 2.30 | 4.47 | |||||||||||||||||
| Total from investment operations | 0.05 | 3.47 | 2.75 | 2.56 | 4.66 | ||||||||||||||||||
| Less distributions to shareholders: | |||||||||||||||||||||||
| From net investment income | (0.46 | ) | (0.44 | ) | (0.33 | ) | (0.36 | ) | (0.22 | ) | |||||||||||||
| From net realized gains | (1.64 | ) | (1.15 | ) | (0.84 | ) | (0.36 | ) | — | ||||||||||||||
| Total distributions | (2.10 | ) | (1.59 | ) | (1.17 | ) | (0.72 | ) | (0.22 | ) | |||||||||||||
| Net asset value, end of period | $ | 16.59 | $ | 18.64 | $ | 16.76 | $ | 15.18 | $ | 13.34 | |||||||||||||
| Total Return(b) | (0.75 | )% | 21.36 | % | 19.07 | % | 19.41 | % | 52.76 | % | |||||||||||||
| Ratios/Supplemental Data: | |||||||||||||||||||||||
| Net assets, end of period (000's) | $ | 4,078,545 | $ | 4,556,742 | $ | 3,800,326 | $ | 3,663,370 | $ | 2,260,046 | |||||||||||||
| Net expenses to average daily net assets | 0.75 | %(c) | 0.75 | % | 0.75 | % | 0.75 | % | 0.75 | % | |||||||||||||
| Net investment income to average daily net assets | 2.16 | % | 2.11 | % | 1.97 | % | 1.87 | % | 1.67 | % | |||||||||||||
| Portfolio turnover rate | 29 | % | 23 | % | 25 | % | 23 | % | 25 | % | |||||||||||||
| Fees and expenses reimbursed by the Manager to average daily net assets: | 0.05 | % | 0.05 | % | 0.05 | % | 0.06 | % | 0.08 | % | |||||||||||||
(a) Calculated using average shares outstanding throughout the period.
(b) The total returns would have been lower had certain expenses not been reimbursed during the periods shown and assumes the effect of reinvested distributions.
(c) The net expense ratio does not include the effect of expense reductions.
See accompanying notes to the financial statements.
24
GMO Foreign Fund
(A Series of GMO Trust)
Financial Highlights
(For a Class IV share outstanding throughout each period)
| Year Ended February 28/29, | |||||||||||||||||||||||
| 2008 | 2007 | 2006 | 2005 | 2004 | |||||||||||||||||||
| Net asset value, beginning of period | $ | 18.64 | $ | 16.77 | $ | 15.18 | $ | 13.34 | $ | 8.90 | |||||||||||||
| Income (loss) from investment operations: | |||||||||||||||||||||||
| Net investment income (loss)(a) | 0.40 | 0.36 | 0.31 | 0.28 | 0.19 | ||||||||||||||||||
| Net realized and unrealized gain (loss) | (0.34 | ) | 3.11 | 2.47 | 2.28 | 4.48 | |||||||||||||||||
| Total from investment operations | 0.06 | 3.47 | 2.78 | 2.56 | 4.67 | ||||||||||||||||||
| Less distributions to shareholders: | |||||||||||||||||||||||
| From net investment income | (0.47 | ) | (0.45 | ) | (0.35 | ) | (0.36 | ) | (0.23 | ) | |||||||||||||
| From net realized gains | (1.64 | ) | (1.15 | ) | (0.84 | ) | (0.36 | ) | — | ||||||||||||||
| Total distributions | (2.11 | ) | (1.60 | ) | (1.19 | ) | (0.72 | ) | (0.23 | ) | |||||||||||||
| Net asset value, end of period | $ | 16.59 | $ | 18.64 | $ | 16.77 | $ | 15.18 | $ | 13.34 | |||||||||||||
| Total Return(b) | (0.68 | )% | 21.36 | % | 19.22 | % | 19.47 | % | 52.84 | % | |||||||||||||
| Ratios/Supplemental Data: | |||||||||||||||||||||||
| Net assets, end of period (000's) | $ | 3,571,516 | $ | 3,424,024 | $ | 2,007,037 | $ | 1,169,805 | $ | 923,221 | |||||||||||||
| Net expenses to average daily net assets | 0.69 | %(c) | 0.69 | % | 0.69 | % | 0.69 | % | 0.70 | % | |||||||||||||
| Net investment income to average daily net assets | 2.08 | % | 2.04 | % | 1.98 | % | 2.00 | % | 1.65 | % | |||||||||||||
| Portfolio turnover rate | 29 | % | 23 | % | 25 | % | 23 | % | 25 | % | |||||||||||||
| Fees and expenses reimbursed by the Manager to average daily net assets: | 0.05 | % | 0.05 | % | 0.05 | % | 0.06 | % | 0.09 | % | |||||||||||||
(a) Calculated using average shares outstanding throughout the period.
(b) The total returns would have been lower had certain expenses not been reimbursed during the periods shown and assumes the effect of reinvested distributions.
(c) The net expense ratio does not include the effect of expense reductions.
See accompanying notes to the financial statements.
25
GMO Foreign Fund
(A Series of GMO Trust)
Financial Highlights
(For a Class M share outstanding throughout each period)
| Year Ended February 28/29, | |||||||||||||||||||||||
| 2008 | 2007 | 2006 | 2005 | 2004 | |||||||||||||||||||
| Net asset value, beginning of period | $ | 18.63 | $ | 16.75 | $ | 15.19 | $ | 13.25 | $ | 8.86 | |||||||||||||
| Income (loss) from investment operations: | |||||||||||||||||||||||
| Net investment income (loss)(a) | 0.35 | 0.30 | 0.24 | 0.30 | 0.14 | ||||||||||||||||||
| Net realized and unrealized gain (loss) | (0.36 | ) | 3.12 | 2.46 | 2.21 | 4.45 | |||||||||||||||||
| Total from investment operations | (0.01 | ) | 3.42 | 2.70 | 2.51 | 4.59 | |||||||||||||||||
| Less distributions to shareholders: | |||||||||||||||||||||||
| From net investment income | (0.40 | ) | (0.39 | ) | (0.30 | ) | (0.21 | ) | (0.20 | ) | |||||||||||||
| From net realized gains | (1.64 | ) | (1.15 | ) | (0.84 | ) | (0.36 | ) | — | ||||||||||||||
| Total distributions | (2.04 | ) | (1.54 | ) | (1.14 | ) | (0.57 | ) | (0.20 | ) | |||||||||||||
| Net asset value, end of period | $ | 16.58 | $ | 18.63 | $ | 16.75 | $ | 15.19 | $ | 13.25 | |||||||||||||
| Total Return(b) | (1.05 | )% | 21.04 | % | 18.66 | % | 19.18 | % | 52.10 | % | |||||||||||||
| Ratios/Supplemental Data: | |||||||||||||||||||||||
| Net assets, end of period (000's) | $ | 7,375 | $ | 8,258 | $ | 5,673 | $ | 3,508 | $ | 12,878 | |||||||||||||
| Net expenses to average daily net assets | 1.05 | %(c) | 1.05 | % | 1.05 | % | 1.05 | % | 1.05 | % | |||||||||||||
| Net investment income to average daily net assets | 1.81 | % | 1.69 | % | 1.56 | % | 2.24 | % | 1.23 | % | |||||||||||||
| Portfolio turnover rate | 29 | % | 23 | % | 25 | % | 23 | % | 25 | % | |||||||||||||
| Fees and expenses reimbursed by the Manager to average daily net assets: | 0.05 | % | 0.05 | % | 0.05 | % | 0.06 | % | 0.08 | % | |||||||||||||
(a) Calculated using average shares outstanding throughout the period.
(b) The total returns would have been lower had certain expenses not been reimbursed during the periods shown and assumes the effect of reinvested distributions.
(c) The net expense ratio does not include the effect of expense reductions.
See accompanying notes to the financial statements.
26
GMO Foreign Fund
(A Series of GMO Trust)
Notes to Financial Statements
February 29, 2008
1. Organization
GMO Foreign Fund (the "Fund") is a series of GMO Trust (the "Trust"). The Fund is registered under the Investment Company Act of 1940, as amended, as an open-end, non-diversified management investment company. The Fund is advised and managed by Grantham, Mayo, Van Otterloo & Co. LLC (the "Manager" or "GMO"). The Trust was established as a Massachusetts business trust under the laws of the Commonwealth of Massachusetts on June 24, 1985. The Declaration of Trust permits the Trustees of the Trust ("Trustees") to create an unlimited number of series of shares ("Funds") and to subdivide Funds into classes.
The Fund seeks total return in excess of that of its benchmark, the MSCI EAFE Index (Europe, Australasia, and Far East). The Fund typically makes equity investments in non-U.S. companies, including the companies that issue stocks included in the MSCI international developed country universe (the universe of securities from which the MSCI EAFE Index is constructed) and companies in emerging countries. The Fund generally seeks to be fully invested and normally does not take temporary defensive positions, but may hold up to 10% of its total assets in cash and other high quality investments in order to manage cash inflows and outflows as a result of shareholder purchases and redemptions. The Fund may make investments in emerging countries, but these investments generally will represent 10% or less of the Fund's total assets.
Throughout the year ended February 29, 2008, the Fund had four classes of shares outstanding: Class II, Class III, Class IV, and Class M. Class M shares bear an administration fee and a 12b-1 fee while classes II, III, and IV bear a shareholder service fee (See Note 3). The principal economic difference among the classes of shares is the type and level of fees borne by the classes.
The Fund currently limits subscriptions due to capacity considerations.
2. Significant accounting policies
The following is a summary of significant accounting policies which are in conformity with accounting principles generally accepted in the United States of America ("U.S. GAAP") and which are consistently followed by the Fund in the preparation of its financial statements. The preparation of financial statements in accordance with U.S. GAAP requires management to make estimates and assumptions that affect the reported amounts and disclosures in the financial statements. Actual results could differ from those estimates. The accounting records of the Fund are maintained in U.S. dollars.
Portfolio valuation
Securities listed on a securities exchange for which market quotations are readily available are valued at the last sale price or official closing price on each business day, or if there is no such reported sale or official closing price, at the most recent quoted bid price. Unlisted securities for which market quotations
27
GMO Foreign Fund
(A Series of GMO Trust)
Notes to Financial Statements — (Continued)
February 29, 2008
are readily available are generally valued at the most recent quoted bid price. Short-term investments with a remaining maturity of sixty days or less are generally valued at amortized cost, which approximates fair value. Shares of investment funds are valued at their net asset value. Securities for which quotations are not readily available or whose values the Manager has determined to be unreliable are valued at fair value as determined in good faith by the Trustees or other persons acting at their direction pursuant to procedures approved by the Trustees. By its nature, a fair value price is a good faith estimate of the value of a security at a given point in time and may not reflect the value that would be realized if the security was sold and the differences could be material. Because many foreign equity securities markets and exchanges close prior to the close of the New York Stock Exchange ("NYSE"), closing prices for for eign securities in those markets or on those exchanges do not reflect the events that occur after that close but before the close of the NYSE. As a result, foreign equity securities are generally valued using fair value prices supplied by a third party vendor based on models to the extent that these fair value prices are available.
Foreign currency translation
The market values of foreign securities, currency holdings and other assets and liabilities are translated to U.S. dollars based on the current exchange rates each business day. Income and expenses denominated in foreign currencies are translated at current exchange rates when accrued or incurred. The Fund does not isolate realized and unrealized gains and losses attributable to changes in exchange rates from gains and losses that arise from changes in the market value of investments. Such fluctuations are included with net realized and unrealized gain or loss on investments. Net realized gains and losses on foreign currency transactions represent gains and losses on disposition of currencies and forward currency contracts, currency gains and losses realized between the trade and settlement dates on securities transactions, and the difference between the amount of investment income and foreign withholding taxes recorded on the F und's accounting records and the U.S. dollar equivalent amounts actually received or paid.
Forward currency contracts
The Fund may enter into forward currency contracts including forward cross currency contracts. A forward currency contract is an agreement between two parties to buy and sell a currency at a set price on a future date. The market value of a forward currency contract fluctuates with changes in forward currency exchange rates. Forward currency contracts are marked to market daily using rates supplied by a quotation service and changes in value are recorded by the Fund as an unrealized gain or loss. Realized gains or losses equal to the difference between the value of the contract at the time it was opened and the value at the time it was closed are recorded upon delivery or receipt of the currency or, if a forward currency contract is offset by entering into another forward currency contract with the same broker, upon settlement of the net gain or loss. These contracts may involve market risk in excess of the unrealized gain or lo ss reflected in the Fund's Statement of Assets and Liabilities. In addition, the Fund could be exposed to risk if the counterparties are unable to meet the terms of the contracts or if there are movements in currency values that are unfavorable to the Fund. There were no forward currency contracts outstanding at the end of the period.
28
GMO Foreign Fund
(A Series of GMO Trust)
Notes to Financial Statements — (Continued)
February 29, 2008
Futures contracts
The Fund may purchase and sell futures contracts. Upon entering into a futures contract, the Fund is required to deposit with the futures clearing broker an amount of cash, U.S. government and agency obligations, or other liquid assets in accordance with the initial margin requirements of the broker or exchange. In addition, the Fund maintains cash or securities in an amount that at least equals the net amount payable in the event the Fund must deliver the full amount of the contracts. Futures contracts are marked to market daily and an appropriate payable or receivable for the change in value ("variation margin") is recorded by the Fund. The payable or receivable is liquidated on the following business day. Gains or losses are recognized but not considered realized until the contracts expire or are closed. Futures contracts involve, to varying degrees, risk of loss in excess of the variation margin disclosed in the Statement of Assets and Liabilities. Under certain circumstances, futures exchanges may establish daily limits on the amount that the price of a futures contract can vary from the previous day's settlement price, thereby effectively preventing liquidation of unfavorable positions. Losses may arise from changes in the value of the underlying instrument if the Fund is unable to liquidate a futures position due to an illiquid secondary market for the contracts or the imposition of price limits, or if counterparties do not perform under the contract terms. Futures contracts are generally valued at the settlement price established each day by the board of trade or exchange on which they are traded. There were no futures contracts outstanding at the end of the period.
Options
The Fund may write call and put options. Writing options increases the Fund's exposure to the underlying instrument by, in the case of a call option, obligating the Fund to sell the underlying instrument at a set price to the option-holder and, in the case of a put option, obligating the Fund to purchase the underlying instrument at a set price from the option-holder. When the Fund writes a call or put option, an amount equal to the premium received is recorded as a liability and subsequently marked to market to reflect the current value of the option written. Premiums received from writing options which expire are treated as realized gains. Premiums received from writing options which are exercised or closed are added to the proceeds or offset against the amounts paid on the underlying future, security or currency transaction to determine the realized gain or loss. The Fund as a writer of an option has no control over whether t he underlying future, security or currency may be sold (call) or purchased (put) and as a result bears the market risk of an unfavorable change in the price of the future, security or currency underlying the written option. In the event that the Fund writes uncovered call options (i.e. options for investments that the Fund does not own), it bears the risk of incurring substantial losses if the price of the underlying instrument increases during the term of the option. There is the risk the Fund may not be able to enter into a closing transaction because of an illiquid market. There were no open written option contracts during the period.
The Fund may also purchase put and call options. Purchasing options alters the Fund's exposure to the underlying instrument by, in the case of a call option, entitling the Fund to purchase the underlying instrument at a set price from the writer of the option and, in the case of a put option, entitling the Fund to sell the underlying instrument at a set price to the writer of the option. The Fund pays a premium as a cost
29
GMO Foreign Fund
(A Series of GMO Trust)
Notes to Financial Statements — (Continued)
February 29, 2008
for a purchased option disclosed in the Schedule of Investments which is subsequently marked to market to reflect the current value of the option. Premiums paid for purchasing options which expire are treated as realized losses. Premiums paid for purchasing options which are exercised or closed are added to the amounts paid or offset against the proceeds on the closing transaction to determine the realized gain or loss. The risk associated with purchasing put and call options is limited to the premium paid. There were no purchased option contracts outstanding at the end of the period.
Exchange traded options are valued at the last sale price, or if no sale is reported, the last bid price for purchased options and the last ask price for written options. Options traded over-the-counter are valued using prices supplied by a primary pricing source chosen by the Manager.
Securities lending
The Fund may lend its securities to certain qualified broker-dealers. The loans are collateralized with cash or liquid securities with a market value at least equal to the market value of the securities on loan. As with other extensions of credit, the Fund may bear the risk of loss with respect to the investment of the collateral, the risk of delay in and/or inability to exercise its rights with respect to the collateral, and the risk of delay in recovery or loss of rights in the loaned securities should the borrower of the securities fail financially. If a loan is collateralized by U.S. government securities, the Fund receives a fee from the borrower. If a loan is collateralized by cash, the Fund typically invests the cash collateral for its own account in interest-bearing, short-term securities and pays a fee to the borrower that normally represents a portion of the Fund's earnings on the collateral. As of February 29, 2008, t he Fund had loaned securities valued by the Fund at $173,252,546, collateralized by cash in the amount of $191,307,524, which was invested in the Bank of New York Mellon Institutional Cash Reserves Fund.
Taxes and distributions
The Fund intends to qualify each tax year as a regulated investment company under Subchapter M of the Internal Revenue Code of 1986, as amended (the "Code"). The Fund intends to distribute substantially all of its net investment income and net realized short-term and long-term capital gains, if any, after giving effect to any available capital loss carryovers for U.S. federal income tax purposes. Therefore, no provision for U.S. federal income or excise tax is necessary. Taxes on foreign interest and dividend income are generally withheld in accordance with the applicable country's tax treaty with the United States. The foreign withholding rates applicable to a Fund's investments in certain foreign jurisdictions may be higher if a significant portion of the Fund is held by non-U.S. shareholders.
The Fund's policy is to declare and pay distributions from net investment income, if any, semiannually, and from net realized short-term and long-term capital gains, if any, at least annually. All distributions are paid in shares of the Fund, at net asset value, unless the shareholder elects to receive cash distributions. Distributions to shareholders are recorded by the Fund on the ex-dividend date.
30
GMO Foreign Fund
(A Series of GMO Trust)
Notes to Financial Statements — (Continued)
February 29, 2008
Dividends received by shareholders of the Fund which are derived from foreign source income and foreign taxes paid by the Fund may be treated, to the extent allowable under the Code, as if received and paid by the shareholders of the Fund.
The Fund may be subject to capital gains and repatriation taxes imposed by certain countries in which it invests.
The Fund is subject to a Contribuição Provisória sobre Movimentações Financiera ("CPMF") tax which is applied to foreign exchange transactions representing capital inflows or outflows to/from the Brazilian market. The CPMF tax has been included in the net realized gain (loss) on investments throughout the period. For the year ended February 29, 2008, the Fund incurred $2,276 in CPMF tax which is included in the net realized gain (loss) on foreign currency, forward contracts and foreign currency related transactions in the Statement of Operations.
Income and capital gain distributions are determined in accordance with U.S. federal income tax regulations, which may differ from U.S. GAAP. Certain capital accounts in the financial statements are periodically adjusted for permanent differences in order to reflect their tax character. These adjustments have no impact on net assets or net asset value per share. Temporary differences which arise from recognizing certain items of income, expense, gain or loss in different periods for financial statement and tax purposes will reverse at some time in the future. Distributions in excess of net investment income or net realized gains are temporary over distributions for financial statement purposes resulting from differences in the recognition or classification of income or distributions for financial statement and tax purposes.
U.S. GAAP and tax accounting differences primarily relate to passive foreign investment company transactions, foreign currency transactions, differing treatment on security sales, and redemption in-kind transactions.
The following reclassification represents the amount necessary to report the stated components of net assets on a tax basis, excluding certain temporary differences, as of February 29, 2008. The financial highlights exclude these adjustments.
31
GMO Foreign Fund
(A Series of GMO Trust)
Notes to Financial Statements — (Continued)
February 29, 2008
| Distributions In Excess Of Net Investment Income | Accumulated Net Realized Gain | Paid-in Capital | |||||||||
| $ | 46,146,272 | $ | (96,668,712 | ) | $ | 50,522,440 | |||||
The tax character of distributions declared to shareholders is as follows:
| 2/29/2008 | 2/28/2007 | ||||||||||
| Ordinary income (including any short-term capital gains) | $ | 294,640,270 | $ | 277,124,342 | |||||||
| Long-term capital gains | 717,398,618 | 443,118,048 | |||||||||
| Total distributions | $ | 1,012,038,888 | $ | 720,242,390 | |||||||
Distributions in excess of tax basis earnings and profits, if significant, are reported in the financial statements as a tax return of capital.
As of February 29, 2008, the components of distributable earnings on a tax basis consisted of the following:
| Undistributed ordinary income | $ | 4,508,772 | |||||
| Undistributed long–term capital gain | $ | 317,006,530 | |||||
As of February 29, 2008, the approximate cost for U.S. federal income tax purposes and gross and net unrealized appreciation and depreciation in value of investments were as follows:
| Aggregate Cost | Gross Unrealized Appreciation | Gross Unrealized (Depreciation) | Net Unrealized Appreciation (Depreciation) | ||||||||||||
| $ | 6,756,604,509 | $ | 1,932,154,787 | $ | (273,050,360 | ) | $ | 1,659,104,427 | |||||||
For the period ended February 29, 2008, the Fund had net realized gains attributed to redemption in-kind transactions of $54,590,446.
Security transactions and related investment income
Security transactions are accounted for on trade date. Dividend income, net of applicable foreign withholding taxes, if any, is recorded on the ex-dividend date, or when the Fund is informed of the ex-dividend date, if later. Interest income is recorded on the accrual basis and is adjusted for the amortization of premiums and accretion of discounts. Interest income on inflation indexed securities, if any, is accrued daily based upon an inflation adjusted principal. Additionally, any increase or decrease in
32
GMO Foreign Fund
(A Series of GMO Trust)
Notes to Financial Statements — (Continued)
February 29, 2008
the principal or face amount of the securities adjusted for inflation is recorded as interest income or loss. Income is not recognized on securities for which collection is not expected. Non-cash dividends, if any, are recorded at the fair market value of the securities received. In determining the net gain or loss on securities sold, the cost of securities is determined on the identified cost basis.
Expenses
The majority of expenses of the Trust are directly identifiable to an individual fund. Expenses which are not readily identifiable to a specific fund are allocated taking into consideration, among other things, the nature and type of expense and the relative size of the funds. Investment income, common expenses and realized and unrealized gains and losses are allocated pro rata among the classes of shares of the Fund based on the relative net assets of each class. Shareholder service, 12b-1, and administration fees, which are directly attributable to a class of shares, are charged to that class's operations.
Brown Brothers Harriman & Co. ("BBH") serves as custodian and fund accounting agent of the Fund. State Street Bank and Trust Company ("State Street") serves as transfer agent of the Fund. BBH and State Street's fees may be reduced by credits that are an earnings allowance calculated on the average daily cash balances the Fund maintains with each agent. Credit balances or expense reimbursements used to reduce fees, if any, are reported as a reduction of expenses in the Statement of Operations.
Investment risks
There are certain additional risks involved in investing in foreign securities that are not inherent in investments in U.S. securities. These risks may involve adverse political and economic developments including the possible imposition of capital controls or other foreign governmental laws or restrictions. In addition, the securities of some foreign companies and securities markets are less liquid and at times may be more volatile than securities of comparable U.S. companies and U.S. securities markets.
Recently issued accounting pronouncements
In June 2006, the Financial Accounting Standards Board ("FASB") issued FASB Interpretation No. 48, Accounting for Uncertainty in Income Taxes – an Interpretation of FASB Statement No. 109 ("FIN 48"). FIN 48 clarifies the accounting for uncertainty in income taxes recognized in accordance with FASB Statement No. 109, Accounting for Income Taxes. FIN 48 prescribes a recognition threshold and measurement attribute for a tax position taken or expected to be taken in the tax return that could impact the Fund's financial statements. It also provides guidance in relation to the Fund's financial statements on classification of tax benefits or liabilities, interest and penalties, accounting in interim periods, disclosure, and transition. FIN 48 is effective for fiscal years beginning after December 15, 2006 for registered investment companies. Management has evaluated the effects of applying the various provisions of FIN 48 and has determined that the adoption of FIN 48 does not have a material effect on the Fund's financial statements. The Fund's federal tax returns for the prior three fiscal years remain subject to examination by the Internal Revenue Service. Management will continue to monitor the rules and guidance pertaining to FIN 48 and will take action if appropriate.
33
GMO Foreign Fund
(A Series of GMO Trust)
Notes to Financial Statements — (Continued)
February 29, 2008
In September 2006, the FASB issued Statement of Financial Accounting Standards No. 157 ("FAS 157"), "Fair Value Measurements." FAS 157 defines fair value, establishes a framework for measuring fair value in accordance with generally accepted accounting principles and expands disclosure about fair value measurements. FAS 157 is effective for fiscal years beginning after November 15, 2007. Management is currently evaluating the impact the adoption of FAS 157 will have on the Fund's financial statement disclosures.
3. Fees and other transactions with affiliates
GMO earns a management fee paid monthly at the annual rate of 0.60% of average daily net assets. The Fund has adopted a Shareholder Service Plan under which the Fund pays GMO a shareholder service fee for client and shareholder service, reporting, and other support. Pursuant to the Shareholder Service Plan, the shareholder service fee is calculated based on average daily net assets of each class at the annual rate of 0.22% for Class II shares, 0.15% for Class III shares, and 0.09% for Class IV shares.
Class M shares of the Fund pay GMO an administration fee monthly at the annual rate of 0.20% of average daily Class M net assets for support services provided to Class M shareholders.
Pursuant to a Rule 12b-1 distribution and service plan adopted by the Fund, Class M shares of the Fund may pay a fee, at the annual rate of up to 1.00% of average daily Class M net assets for any activities or expenses primarily intended to result in the sale of Class M shares of the Fund and/or the provision of certain other services incidental thereto. The Trustees currently limit payments on Class M shares to 0.25% of the Fund's average daily Class M net assets. This fee may be spent on personal services rendered to Class M shareholders of the Fund and/or maintenance of Class M shareholder accounts.
The Manager has contractually agreed to reimburse the Fund for Fund expenses through at least June 30, 2008 to the extent the Fund's total annual operating expenses (excluding shareholder service fees, fees and expenses of the independent Trustees of the Trust, fees and expenses for legal services not approved by the Manager for the Trust, compensation and expenses of the Trust's Chief Compliance Officer ("CCO") (excluding any employee benefits), brokerage commissions, securities lending fees and expenses, interest expense, transfer taxes, and other investment-related costs (including expenses associated with investments in any company that is an investment company or would be an investment company under the 1940 Act, but for the exceptions to the definition of investment company provided in Section 3(c)(1) and 3(c)(7) of the 1940 Act), hedging transaction fees, extraordinary, non-recurring and certain other unusual expenses (in cluding taxes)) exceed 0.60% of the Fund's average daily net assets.
The Fund's portion of the fees paid by the Trust to the independent Trustees and CCO during the year ended February 29, 2008 was $82,627 and $37,494, respectively. The compensation and expenses of the CCO are included in miscellaneous expenses in the Statement of Operations. No remuneration is paid by the Fund to any other officer of the Trust.
34
GMO Foreign Fund
(A Series of GMO Trust)
Notes to Financial Statements — (Continued)
February 29, 2008
4. Purchases and sales of securities
Cost of purchases and proceeds from sales of securities, excluding short-term investments, for the year ended February 29, 2008 aggregated $2,631,811,703 and $2,994,835,477, respectively.
5. Guarantees
In the normal course of business the Fund enters into contracts with third-party service providers that contain a variety of representations and warranties and which provide general indemnifications. The Fund's maximum exposure under these arrangements is unknown, as this would involve future claims that may be made against the Fund that have not yet occurred. Based on experience, management is of the view that the risk of loss in connection with these potential indemnification obligations is remote; however, there can be no assurance that material liabilities related to such obligations will not arise in the future that could adversely impact the Fund.
6. Principal shareholders and related parties
As of February 29, 2008, there were no shareholders individually holding in excess of 10% of the Fund's outstanding shares.
As of February 29, 2008, 0.01% of the Fund's shares were held by fourteen related parties comprised of certain GMO employee accounts, and 0.55% of the Fund's shares were held by accounts for which the Manager has investment discretion.
7. Share transactions
The Declaration of Trust permits the Trustees to issue an unlimited number of shares of beneficial interest (without par value). Transactions in Fund shares were as follows:
| Year Ended February 29, 2008 | Year Ended February 28, 2007 | ||||||||||||||||||
| Class II: | Shares | Amount | Shares | Amount | |||||||||||||||
| Shares sold | 16,492,099 | $ | 297,811,599 | 13,449,914 | $ | 231,622,632 | |||||||||||||
| Shares issued to shareholders in reinvestment of distributions | 4,944,763 | 92,077,263 | 5,052,204 | 89,348,934 | |||||||||||||||
| Shares repurchased | (24,912,687 | ) | (457,221,874 | ) | (36,326,663 | ) | (656,595,065 | ) | |||||||||||
| Net increase (decrease) | (3,475,825 | ) | $ | (67,333,012 | ) | (17,824,545 | ) | $ | (335,623,499 | ) | |||||||||
35
GMO Foreign Fund
(A Series of GMO Trust)
Notes to Financial Statements — (Continued)
February 29, 2008
| Year Ended February 29, 2008 | Year Ended February 28, 2007 | ||||||||||||||||||
| Class III: | Shares | Amount | Shares | Amount | |||||||||||||||
| Shares sold | 40,267,613 | $ | 743,943,093 | 66,421,037 | $ | 1,188,616,078 | |||||||||||||
| Shares issued to shareholders in reinvestment of distributions | 24,148,643 | 451,660,303 | 18,923,124 | 337,090,707 | |||||||||||||||
| Shares repurchased | (63,056,039 | ) | (1,197,014,727 | ) | (67,564,953 | ) | (1,248,260,182 | ) | |||||||||||
| Net increase (decrease) | 1,360,217 | $ | (1,411,331 | ) | 17,779,208 | $ | 277,446,603 | ||||||||||||
| Year Ended February 29, 2008 | Year Ended February 28, 2007 | ||||||||||||||||||
| Class IV: | Shares | Amount | Shares | Amount | |||||||||||||||
| Shares sold | 35,986,533 | $ | 684,663,196 | 64,980,665 | $ | 1,177,635,350 | |||||||||||||
| Shares issued to shareholders in reinvestment of distributions | 20,380,015 | 379,339,109 | 12,035,673 | 214,006,988 | |||||||||||||||
| Shares repurchased | (24,769,071 | ) | (443,476,876 | ) | (13,038,899 | ) | (234,943,393 | ) | |||||||||||
| Net increase (decrease) | 31,597,477 | $ | 620,525,429 | 63,977,439 | $ | 1,156,698,945 | |||||||||||||
| Year Ended February 29, 2008 | Year Ended February 28, 2007 | ||||||||||||||||||
| Class M: | Shares | Amount | Shares | Amount | |||||||||||||||
| Shares sold | 90,342 | $ | 1,706,341 | 765,485 | $ | 13,963,575 | |||||||||||||
| Shares issued to shareholders in reinvestment of distributions | 48,969 | 914,061 | 34,107 | 607,428 | |||||||||||||||
| Shares repurchased | (137,839 | ) | (2,548,061 | ) | (694,804 | ) | (13,008,677 | ) | |||||||||||
| Net increase (decrease) | 1,472 | $ | 72,341 | 104,788 | $ | 1,562,326 | |||||||||||||
36
Report of Independent Registered Public Accounting Firm
To the Trustees of GMO Trust and the Shareholders of
GMO Foreign Fund
In our opinion, the accompanying statement of assets and liabilities, including the schedule of investments, and the related statements of operations and of changes in net assets and the financial highlights present fairly, in all material respects, the financial position of GMO Foreign Fund (the "Fund") at February 29, 2008, the results of its operations for the year then ended, the changes in its net assets for each of the two years in the period then ended and the financial highlights for each of the five years in the period then ended, in conformity with accounting principles generally accepted in the United States of America. These financial statements and financial highlights (hereafter referred to as "financial statements") are the responsibility of the Fund's management; our responsibility is to express an opinion on these financial statements based on our audits. We conducted our audits of these financial statements in accordance with the standards of the Public Company Accounting Oversight Board (United States). Those standards require that we plan and perform the audit to obtain reasonable assurance about whether the financial statements are free of material misstatement. An audit includes examining, on a test basis, evidence supporting the amounts and disclosures in the financial statements, assessing the accounting principles used and significant estimates made by management, and evaluating the overall financial statement presentation. We believe that our audits, which included confirmation of securities at February 29, 2008 by correspondence with the custodian, provide a reasonable basis for our opinion.
PricewaterhouseCoopers LLP
Boston, Massachusetts
April 29, 2008
37
GMO Foreign Fund
(A Series of GMO Trust)
Fund Expenses
February 29, 2008 (Unaudited)
Expense Examples: The following information is in relation to expenses for the six month period ended February 29, 2008.
As a shareholder of the Fund, you may incur two types of costs: (1) transaction costs; and (2) ongoing costs, including management fees, shareholder service fees, distribution (12b-1) and/or administration fees, and other Fund expenses. This example is intended to help you understand your ongoing costs (in dollars) of investing in the Fund and to compare these costs with the ongoing costs of investing in other mutual funds.
These examples are based on an investment of $1,000 invested at the beginning of the period and held for the entire period, September 1, 2007 through February 29, 2008.
Actual Expenses
The first line of the table for each class below provides information about actual account values and actual expenses. You may use the information in this line, together with the amount you invested, to estimate the expenses that you paid over the period. Simply divide your account value by $1,000 (for example, a $35,000,000 account value divided by $1,000 = 35,000), then multiply the result by the number in the first line under the heading entitled "Net Expense Incurred" to estimate the expenses you paid on your account during this period.
Hypothetical Example for Comparison Purposes
The second line of the table for each class below provides information about hypothetical account values and hypothetical expenses based on the Fund's actual expense ratio and an assumed rate of return of 5% per year before expenses, which is not the Fund's actual return. The hypothetical account values and expenses may not be used to estimate the actual ending account balance or expenses you paid for the period. You may use this information to compare the ongoing costs of investing in the Fund with other funds. To do so, compare this 5% hypothetical example with the 5% hypothetical examples that appear in the shareholder reports of other funds.
38
GMO Foreign Fund
(A Series of GMO Trust)
Fund Expenses — (Continued)
February 29, 2008 (Unaudited)
Please note that the expenses shown in the table are meant to highlight your ongoing costs only and do not reflect any transactional costs, such as purchase premiums and redemption fees. Therefore, the second line of the table is useful in comparing ongoing costs only, and will not help you determine the relative total costs of owning different funds. In addition, if these transactional costs were included, your costs would have been higher.
| Annualized Net Expense Ratio | Beginning Account Value | Ending Account Value | Net Expense Incurred* | ||||||||||||||||
| Class II | |||||||||||||||||||
| 1) Actual | 0.82 | % | $ | 1,000.00 | $ | 938.40 | $ | 3.95 | |||||||||||
| 2) Hypothetical | 0.82 | % | $ | 1,000.00 | $ | 1,020.79 | $ | 4.12 | |||||||||||
| Class III | |||||||||||||||||||
| 1) Actual | 0.75 | % | $ | 1,000.00 | $ | 938.60 | $ | 3.62 | |||||||||||
| 2) Hypothetical | 0.75 | % | $ | 1,000.00 | $ | 1,021.13 | $ | 3.77 | |||||||||||
| Class IV | |||||||||||||||||||
| 1) Actual | 0.69 | % | $ | 1,000.00 | $ | 938.80 | $ | 3.33 | |||||||||||
| 2) Hypothetical | 0.69 | % | $ | 1,000.00 | $ | 1,021.43 | $ | 3.47 | |||||||||||
| Class M | |||||||||||||||||||
| 1) Actual | 1.05 | % | $ | 1,000.00 | $ | 937.10 | $ | 5.06 | |||||||||||
| 2) Hypothetical | 1.05 | % | $ | 1,000.00 | $ | 1,019.64 | $ | 5.27 | |||||||||||
* Expenses are calculated using each Class's annualized net expense ratio for the six months ended February 29, 2008 multiplied by the average account value over the period, multiplied by 182 days in the period, divided by 366 days in the year.
39
GMO Foreign Fund
(A Series of GMO Trust)
Tax Information for the Tax Year Ended February 29, 2008 (Unaudited)
The Fund will notify shareholders of amounts for use in preparing 2008 income tax forms in January 2009.
The Fund's distributions to shareholders include $717,398,618 from long-term capital gains.
During the year ended February 29, 2008, the Fund paid foreign taxes of $21,682,149 and recognized foreign source income of $267,157,320.
For taxable, non-corporate shareholders, 63.08% of the income and short-term capital gains, if any, distributed in the Fund's fiscal year ended February 29, 2008 represents qualified dividend income subject to the 15% rate category.
The Fund hereby designates as qualified interest income and qualified short-term capital gains with respect to its taxable year ended February 29, 2008, $6,957,062 and $72,141,011, respectively, or if determined to be different, the qualified interest income and qualified short-term gains of such year.
40
Trustees and Officers (Unaudited)
The following tables list the Trust's Trustees and Officers as of the date of this report; their address and date of birth ("DOB"); their position with the Trust; the length of time holding that position with the Trust; their principal occupation(s) during the past five years; the number of portfolios in the fund complex they oversee; and other directorships they hold in companies subject to registration or reporting requirements of the Securities Exchange Act of 1934 (generally called "public companies") or in registered investment companies. The Trust's Statement of Additional Information ("SAI") includes additional information about the Trust's trustees, including changes subsequent to the date of the report. The SAI is available, without charge, upon request by writing GMO, c/o GMO Trust, 40 Rowes Wharf, Boston, MA 02110.
Independent Trustees:
| Name, Address, and DOB | Position(s) Held with Trust | Term of Office1 and Length of Time Served | Principal Occupation(s) During Past Five Years | Number of Portfolios in Fund Complex Overseen by Trustee | Other Directorships Held by Trustee | ||||||||||||||||||
| Donald W. Glazer, Esq. c/o GMO Trust 40 Rowes Wharf Boston, MA 02110 DOB: 07/26/1944 | Chairman of the Board of Trustees | Chairman of the Board of Trustees since March 2005; Lead Independent Trustee (September 2004 – March 2005); Trustee since December 2000. | Consultant – Law and Business2; Vice Chair (since 2002) and Secretary, Provant, Inc. (provider of personnel performance improvement services and training products); Author of Legal Treatises. | 47 | None. | ||||||||||||||||||
1 Each Trustee is elected to serve during the continued lifetime of the Trust until he/she dies, resigns or is removed, or if sooner, until the next meeting of Shareholders called for the purpose of electing Trustees and until the election and qualification of his/her successor.
2 As part of Mr. Glazer's work as a consultant, he provides part-time consulting services to Goodwin Procter LLP ("Goodwin"). Goodwin has provided legal services to Renewable Resources, LLC, an affiliate of GMO; GMO, in connection with its relationship with Renewable Resources; and funds managed by Renewable Resources. Mr. Glazer has represented that he has no financial interest in, and is not involved in the provision of, such legal services. In the calendar years ended December 31, 2006 and December 31, 2007, these entities paid $825,738 and $291,721 respectively, in legal fees and disbursements to Goodwin.
41
Independent Trustees — (Continued)
| Name, Address, and DOB | Position(s) Held with Trust | Term of Office1 and Length of Time Served | Principal Occupation(s) During Past Five Years | Number of Portfolios in Fund Complex Overseen by Trustee | Other Directorships Held by Trustee | ||||||||||||||||||
| Jay O. Light c/o GMO Trust 40 Rowes Wharf Boston, MA 02110 DOB: 10/03/1941 | Trustee | Since May 1996. | Dean (since April 2006), Acting Dean (August 2005 – April 2006), Senior Associate Dean (1998 – 2005), and Professor of Business Administration, Harvard Business School. | 47 | Director of Harvard Management Company, Inc.3 and Verde, Inc.; Director of Partners HealthCare System, Inc. and Chair of its Investment Committee.4 | ||||||||||||||||||
| W. Nicholas Thorndike c/o GMO Trust 40 Rowes Wharf Boston, MA 02110 DOB: 03/28/1933 | Trustee | Since March 2005. | Director or trustee of various corporations and charitable organizations, including Courier Corporation (a book publisher and manufacturer) (July 1989 – present); Putnam Funds (December 1992 – June 2004); and Providence Journal (a newspaper publisher) (December 1986 – December 2003). | 47 | Director of Courier Corporation (a book publisher and manufacturer); Member of the Investment Committee of Partners HealthCare System, Inc.4 | ||||||||||||||||||
1 Each Trustee is elected to serve during the continued lifetime of the Trust until he/she dies, resigns or is removed, or if sooner, until the next meeting of Shareholders called for the purpose of electing Trustees and until the election and qualification of his/her successor.
3 Harvard Management Company, Inc. is a client of the Manager.
4 Partners HealthCare System, Inc. is a client of the Manager.
42
Principal Officers:
| Name, Address, and DOB | Position(s) Held with Trust | Term of Office5 and Length of Time Served | Principal Occupation(s) During Past Five Years | ||||||||||||
| Scott Eston c/o GMO Trust 40 Rowes Wharf Boston, MA 02110 DOB: 01/20/1956 | President and Chief Executive Officer | President and Chief Executive Officer since October 2002; Chief Financial Officer, November 2006 – February 2007. | Chief Financial Officer, Chief Operating Officer and Member, Grantham, Mayo, Van Otterloo & Co. LLC. | ||||||||||||
| Sheppard N. Burnett c/o GMO Trust 40 Rowes Wharf Boston, MA 02110 DOB: 10/24/1968 | Treasurer and Chief Financial Officer | Chief Financial Officer since March 2007; Treasurer since November 2006; Assistant Treasurer, September 2004 – November 2006. | Fund Administration Staff, Grantham, Mayo, Van Otterloo & Co. LLC (June 2004 – present); Vice President, Director of Tax, Columbia Management Group (2002 – 2004). | ||||||||||||
| Brent C. Arvidson c/o GMO Trust 40 Rowes Wharf Boston, MA 02110 DOB: 06/26/1969 | Assistant Treasurer | Since August 1998. | Senior Fund Administrator, Grantham, Mayo, Van Otterloo & Co. LLC. | ||||||||||||
| John L. Nasrah c/o GMO Trust 40 Rowes Wharf Boston, MA 02110 DOB: 05/27/1977 | Assistant Treasurer | Since March 2007. | Fund Administrator, Grantham, Mayo, Van Otterloo & Co. LLC (September 2004 – present); Tax Analyst, Bain & Company, Inc (June 2003 – September 2004); Senior Tax Associate, PricewaterhouseCoopers LLP (2001 – 2003). | ||||||||||||
| Mahmoodur Rahman c/o GMO Trust 40 Rowes Wharf Boston, MA 02110 DOB: 11/30/1967 | Assistant Treasurer | Since September 2007. | Fund Administrator, Grantham, Mayo, Van Otterloo & Co. (April 2007 – present); Vice President and Senior Tax Manager, Massachusetts Financial Services Company (January 2000 – April 2007). | ||||||||||||
| Michael E. Gillespie c/o GMO Trust 40 Rowes Wharf Boston, MA 02110 DOB: 02/18/1958 | Chief Compliance Officer | Since March 2005. | Vice President of Compliance (June 2004 – February 2005) and Director of Domestic Compliance (March 2002 – June 2004), Fidelity Investments; Vice President and Senior Counsel, State Street Bank and Trust Company (May 1998 – March 2002). | ||||||||||||
5 Officers are elected to hold such office until their successor is elected and qualified to carry out the duties and responsibilities of their office, or until he or she resigns or is removed from office.
43
Principal Officers — (Continued)
| Name, Address, and DOB | Position(s) Held with Trust | Term of Office5 and Length of Time Served | Principal Occupation(s) During Past Five Years | ||||||||||||
| Jason B. Harrison c/o GMO Trust 40 Rowes Wharf Boston, MA 02110 DOB: 01/29/1977 | Vice President and Clerk | Vice President since November 2006; Clerk since March 2006. | Legal Counsel, Grantham, Mayo, Van Otterloo & Co. LLC (since February 2006) and Attorney, Ropes & Gray LLP (September 2002 – February 2006). | ||||||||||||
| David L. Bohan c/o GMO Trust 40 Rowes Wharf Boston, MA 02110 DOB: 06/21/1964 | Vice President and Assistant Clerk | Vice President since March 2005; Assistant Clerk since March 2006. | Legal Counsel, Grantham, Mayo, Van Otterloo & Co. LLC (September 2003 – present); Attorney, Goodwin Procter LLP (September 1996 – September 2003). | ||||||||||||
| Gregory L. Pottle c/o GMO Trust 40 Rowes Wharf Boston, MA 02110 DOB: 07/09/1971 | Vice President and Assistant Clerk | Since November 2006. | Legal Counsel, Grantham, Mayo, Van Otterloo & Co. LLC. | ||||||||||||
| Anne K. Trinque c/o GMO Trust 40 Rowes Wharf Boston, MA 02110 DOB: 04/15/1978 | Vice President and Assistant Clerk | Since September 2007. | Legal Counsel, Grantham, Mayo, Van Otterloo & Co. LLC (since January 2007); Attorney, Goodwin Procter LLP (September 2003 – January 2007). | ||||||||||||
| Cheryl Wakeham c/o GMO Trust 40 Rowes Wharf Boston, MA 02110 DOB: 10/29/1958 | Anti-Money Laundering Officer | Since December 2004. | Manager, Client Service Administration, Grantham, Mayo, Van Otterloo & Co. LLC. | ||||||||||||
5 Officers are elected to hold such office until their successor is elected and qualified to carry out the duties and responsibilities of their office, or until he or she resigns or is removed from office.
44
GMO Tax-Managed International Equities Fund
(A Series of GMO Trust)
Annual Report
February 29, 2008
For a free copy of the Fund's proxy voting guidelines, shareholders may call 1-617-346-7646 (collect), visit our website at www.gmo.com, or visit the Securities and Exchange Commission's website at www.sec.gov. Information regarding how the Fund voted proxies relating to portfolio securities during the most recent 12-month period ended June 30 is available on our website at www.gmo.com, or on the Securities and Exchange Commission's website at www.sec.gov.
The Fund files its complete schedule of portfolio holdings with the Securities and Exchange Commission for the first and third quarter of each fiscal year on Form N-Q, which is available on the Commission's website at www.sec.gov. The Fund's Form N-Q may be reviewed and copied at the Commission's Public Reference Room in Washington, D.C. Information on the operation of the Public Reference Room may be obtained by calling 1-800-SEC-0330. The Fund has a policy with respect to disclosure of portfolio holdings under which it may also make available on GMO's website (www.gmo.com) a complete schedule of portfolio holdings.
This report is prepared for the general information of shareholders. It is authorized for distribution to prospective investors only when preceded or accompanied by a prospectus for the GMO Trust.
GMO Tax-Managed International Equities Fund
(A Series of GMO Trust)
Portfolio Managers
Day-to-day management of the Fund's portfolio is the responsibility of the International Quantitative team at Grantham, Mayo, Van Otterloo & Co. LLC.
Management Discussion and Analysis of Fund Performance
The GMO Tax-Managed International Equities Fund returned +2.3% for the fiscal year ended February 29, 2008, as compared to +0.8% for the MSCI EAFE Index. On an after-tax basis, the Fund returned -0.3% compared to the benchmark's -0.7% for the same period. The Fund was invested substantially in international equity securities throughout the period.
Country selection was a positive factor for the period, due primarily to the portfolio's 6% weight in emerging markets equities, which significantly outpaced the developed markets. Overweight exposure to Canada added value, while an underweight exposure to Australia worked against the portfolio.
Sector selection was also a positive factor for the fiscal year. An overweight in Energy stocks, which outperformed for the 12-month period, and underweight exposure to Financial stocks, which stumbled, were the primary factors. An underweight in Consumer Staples, which also posted strong returns for the period, was the primary negative influence.
Stock selection was also a positive for the year, as both the intrinsic value and momentum strategies outpaced the market, while the quality-adjusted value strategy posted results similar to the benchmark's.
The views expressed herein are exclusively those of Grantham, Mayo, Van Otterloo & Co. LLC Management as of the date of this report and are subject to change. GMO disclaims any responsibility to update such views. They are not meant as investment advice.
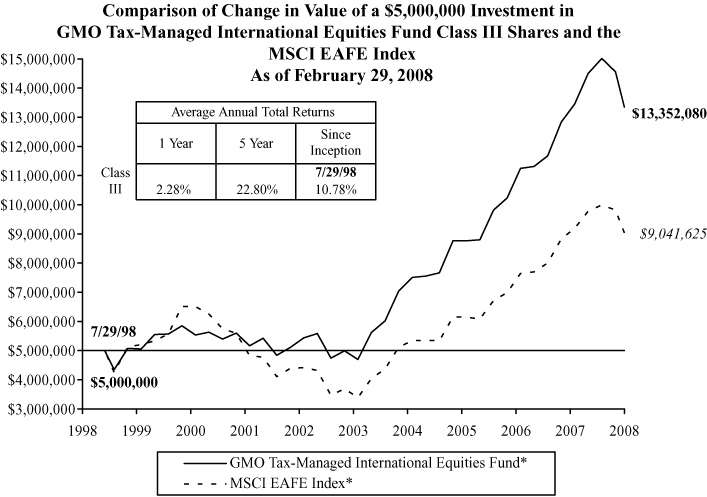
Performance data quoted represents past performance and is not indicative of future results. The investment return and principal value of an investment will fluctuate so that an investor's shares, when redeemed, may be worth more or less than their original cost. Current performance data may be lower or higher than the performance data provided herein. To obtain performance information to the most recent month-end, visit www.gmo.com. Performance shown is net of all fees after reimbursement from the Manager. Returns would have been lower had certain expenses not been reimbursed during the periods shown and do not include the effect of taxes on distributions and redemptions. All information is unaudited.
* Returns do not reflect the tax effect a shareholder would pay on Fund distributions or the redemption of Fund shares.
GMO Tax-Managed International Equities Fund
(A Series of GMO Trust)
Investments Concentration Summary
February 29, 2008 (Unaudited)
| Asset Class Summary | % of Total Net Assets | ||||||
| Common Stocks | 95.7 | % | |||||
| Preferred Stocks | 1.9 | ||||||
| Short-Term Investments | 0.4 | ||||||
| Rights and Warrants | 0.0 | ||||||
| Other | 2.0 | ||||||
| 100.0 | % | ||||||
| Country Summary | % of Equity Investments | ||||||
| United Kingdom | 19.5 | % | |||||
| Japan | 19.1 | ||||||
| Germany | 12.0 | ||||||
| France | 12.0 | ||||||
| Australia | 4.6 | ||||||
| Switzerland | 4.1 | ||||||
| Italy | 3.8 | ||||||
| Netherlands | 3.5 | ||||||
| Finland | 3.1 | ||||||
| Canada | 2.3 | ||||||
| Singapore | 1.8 | ||||||
| Hong Kong | 1.6 | ||||||
| Belgium | 1.4 | ||||||
| Brazil | 1.4 | ||||||
| Sweden | 1.2 | ||||||
| South Korea | 1.2 | ||||||
| Taiwan | 1.0 | ||||||
| Austria | 1.0 | ||||||
| Spain | 1.0 | ||||||
| Norway | 0.9 | ||||||
| China | 0.6 | ||||||
| Russia | 0.5 | ||||||
| Thailand | 0.4 | ||||||
| Ireland | 0.4 | ||||||
| India | 0.4 | ||||||
| Malaysia | 0.3 | ||||||
| Greece | 0.2 | ||||||
| Turkey | 0.2 | ||||||
| Philippines | 0.1 | ||||||
| South Africa | 0.1 | ||||||
| Indonesia | 0.1 | ||||||
| Israel | 0.1 | ||||||
| Poland | 0.1 | ||||||
| Hungary | 0.0 | ||||||
| 100.0 | % | ||||||
1
GMO Tax-Managed International Equities Fund
(A Series of GMO Trust)
Investments Concentration Summary — (Continued)
February 29, 2008 (Unaudited)
| Industry Sector Summary | % of Equity Investments | ||||||
| Financials | 20.4 | % | |||||
| Energy | 14.0 | ||||||
| Materials | 11.7 | ||||||
| Industrials | 10.8 | ||||||
| Health Care | 10.6 | ||||||
| Consumer Discretionary | 10.5 | ||||||
| Telecommunication Services | 7.2 | ||||||
| Information Technology | 5.9 | ||||||
| Consumer Staples | 5.4 | ||||||
| Utilities | 3.5 | ||||||
| 100.0 | % | ||||||
2
GMO Tax-Managed International Equities Fund
(A Series of GMO Trust)
Schedule of Investments
(showing percentage of total net assets)
February 29, 2008
| Shares | Description | Value ($) | |||||||||||||
| COMMON STOCKS — 95.7% | |||||||||||||||
| Australia — 4.5% | |||||||||||||||
| 208,107 | Australia and New Zealand Banking Group Ltd | 4,199,479 | |||||||||||||
| 166,815 | BHP Billiton Ltd | 6,035,834 | |||||||||||||
| 45,208 | Commonwealth Bank of Australia | 1,750,629 | |||||||||||||
| 38,524 | Macquarie Group Ltd | 1,923,904 | |||||||||||||
| 73,689 | QBE Insurance Group Ltd | 1,524,166 | |||||||||||||
| 20,217 | Rio Tinto Ltd | 2,519,125 | |||||||||||||
| 146,634 | Santos Ltd | 1,738,100 | |||||||||||||
| 554,480 | Stockland | 3,588,357 | |||||||||||||
| 352,754 | Suncorp-Metway Ltd | 4,525,195 | |||||||||||||
| 1,144,504 | Telstra Corp Ltd | 5,144,981 | |||||||||||||
| 213,322 | Westpac Banking Corp | 4,562,673 | |||||||||||||
| 146,465 | Woodside Petroleum Ltd | 7,658,880 | |||||||||||||
| 141,450 | Woolworths Ltd | 3,777,729 | |||||||||||||
| Total Australia | 48,949,052 | ||||||||||||||
| Austria — 0.9% | |||||||||||||||
| 438 | Lenzing AG | 240,225 | |||||||||||||
| 87,050 | OMV AG | 6,289,796 | |||||||||||||
| 59,780 | Voestalpine AG | 3,757,593 | |||||||||||||
| Total Austria | 10,287,614 | ||||||||||||||
| Belgium — 1.4% | |||||||||||||||
| 6,470 | Colruyt SA | 1,580,930 | |||||||||||||
| 23,154 | Delhaize Group | 1,753,509 | |||||||||||||
| 208,468 | Dexia | 4,901,097 | |||||||||||||
| 227,419 | Fortis | 5,024,237 | |||||||||||||
| 33,263 | UCB SA | 1,576,746 | |||||||||||||
| Total Belgium | 14,836,519 | ||||||||||||||
| Brazil — 0.3% | |||||||||||||||
| 26,157 | Banco do Brasil SA | 437,265 | |||||||||||||
| 15,984 | Electrobras (Centro) | 235,067 | |||||||||||||
See accompanying notes to the financial statements.
3
GMO Tax-Managed International Equities Fund
(A Series of GMO Trust)
Schedule of Investments — (Continued)
(showing percentage of total net assets)
February 29, 2008
| Shares | Description | Value ($) | |||||||||||||
| Brazil — continued | |||||||||||||||
| 5,800 | Petroleo Brasileiro SA (Petrobras) | 335,084 | |||||||||||||
| 8,320 | Petroleo Brasileiro SA (Petrobras) ADR | 976,269 | |||||||||||||
| 5,700 | Unibanco-Uniao de Bancos Brasileiros SA GDR | 773,034 | |||||||||||||
| Total Brazil | 2,756,719 | ||||||||||||||
| Canada — 2.3% | |||||||||||||||
| 21,900 | Canadian Imperial Bank of Commerce | 1,486,107 | |||||||||||||
| 64,264 | Canadian Natural Resources | 4,815,964 | |||||||||||||
| 44,171 | EnCana Corp | 3,367,183 | |||||||||||||
| 42,000 | National Bank of Canada | 2,073,010 | |||||||||||||
| 43,200 | Potash Corp of Saskatchewan Inc | 6,868,109 | |||||||||||||
| 62,100 | Research In Motion Ltd * | 6,469,000 | |||||||||||||
| Total Canada | 25,079,373 | ||||||||||||||
| China — 0.6% | |||||||||||||||
| 1,004,000 | Bank of China Ltd Class H | 420,552 | |||||||||||||
| 90,000 | China Merchants Bank Co Ltd Class H | 312,417 | |||||||||||||
| 514,000 | China Petroleum & Chemical Corp Class H | 561,752 | |||||||||||||
| 174,000 | China Shipping Development Co Ltd Class H | 538,176 | |||||||||||||
| 6,300 | China Telecom Corp Ltd ADR | 462,483 | |||||||||||||
| 138,300 | China Telecom Corp Ltd Class H | 101,854 | |||||||||||||
| 586,000 | CNOOC Ltd | 973,200 | |||||||||||||
| 300,000 | Datang International Power Generation Co Ltd | 201,267 | |||||||||||||
| 790,000 | Denway Motors Ltd | 399,320 | |||||||||||||
| 318,000 | Huaneng Power International Inc Class H | 259,834 | |||||||||||||
| 1,036,000 | Industrial and Commercial Bank of China Ltd Class H | 718,728 | |||||||||||||
| 148,000 | Jiangxi Copper Co Ltd Class H | 342,485 | |||||||||||||
| 290,000 | Maanshan Iron & Steel Co Ltd Class H | 180,459 | |||||||||||||
| 248,000 | PetroChina Co Ltd Class H | 363,017 | |||||||||||||
| 64,000 | Shanghai Industrial Holdings Ltd | 260,985 | |||||||||||||
| 198,000 | Yanzhou Coal Mining Co Ltd Class H | 323,012 | |||||||||||||
| Total China | 6,419,541 | ||||||||||||||
See accompanying notes to the financial statements.
4
GMO Tax-Managed International Equities Fund
(A Series of GMO Trust)
Schedule of Investments — (Continued)
(showing percentage of total net assets)
February 29, 2008
| Shares | Description | Value ($) | |||||||||||||
| Finland — 3.1% | |||||||||||||||
| 25,944 | Fortum Oyj | 1,083,230 | |||||||||||||
| 660,497 | Nokia Oyj | 23,730,090 | |||||||||||||
| 70,750 | Rautaruukki Oyj | 3,084,725 | |||||||||||||
| 208,062 | Sampo Oyj Class A | 5,646,859 | |||||||||||||
| Total Finland | 33,544,904 | ||||||||||||||
| France — 11.7% | |||||||||||||||
| 23,203 | Alstom | 4,876,330 | |||||||||||||
| 177,472 | Arcelor Mittal | 13,475,174 | |||||||||||||
| 145,451 | BNP Paribas | 13,003,306 | |||||||||||||
| 4,173 | Bongrain SA | 459,944 | |||||||||||||
| 18,695 | Bouygues | 1,276,872 | |||||||||||||
| 33,710 | Casino Guichard-Perrachon SA | 3,812,843 | |||||||||||||
| 5,024 | Chargeurs International SA | 105,540 | |||||||||||||
| 36,812 | Cie de Saint-Gobain | 2,877,756 | |||||||||||||
| 75,920 | Credit Agricole SA | 2,059,314 | |||||||||||||
| 2,228 | Esso SAF | 516,524 | |||||||||||||
| 101,435 | France Telecom SA | 3,405,074 | |||||||||||||
| 24,321 | Michelin SA Class B | 2,395,382 | |||||||||||||
| 4,045 | NYSE Euronext | 265,444 | |||||||||||||
| 86,816 | Peugeot SA | 6,599,686 | |||||||||||||
| 55,300 | Renault SA | 5,908,611 | |||||||||||||
| 373,149 | Sanofi-Aventis | 27,580,432 | |||||||||||||
| 22,762 | Societe Generale | 2,435,516 | |||||||||||||
| 5,690 | Societe Generale NV (New Shares) * | 625,238 | |||||||||||||
| 16,784 | Suez SA Class B | 1,068,303 | |||||||||||||
| 16,784 | Suez SA VVPR Strip * | 255 | |||||||||||||
| 693 | Total Gabon | 476,264 | |||||||||||||
| 462,855 | Total SA | 34,854,849 | |||||||||||||
| Total France | 128,078,657 | ||||||||||||||
| Germany — 10.9% | |||||||||||||||
| 41,494 | Adidas AG | 2,633,664 | |||||||||||||
| 36,900 | Allianz SE (Registered) | 6,361,310 | |||||||||||||
See accompanying notes to the financial statements.
5
GMO Tax-Managed International Equities Fund
(A Series of GMO Trust)
Schedule of Investments — (Continued)
(showing percentage of total net assets)
February 29, 2008
| Shares | Description | Value ($) | |||||||||||||
| Germany — continued | |||||||||||||||
| 71,124 | BASF AG | 9,095,024 | |||||||||||||
| 47,643 | Bayer AG | 3,666,578 | |||||||||||||
| 86,717 | Bayerische Motoren Werke AG | 4,778,215 | |||||||||||||
| 117,272 | Daimler AG (Registered) | 9,765,675 | |||||||||||||
| 63,382 | Deutsche Bank AG (Registered) | 7,031,716 | |||||||||||||
| 32,100 | Deutsche Boerse AG | 5,107,914 | |||||||||||||
| 108,148 | Deutsche Post AG (Registered) | 3,583,187 | |||||||||||||
| 32,559 | E.ON AG | 6,130,072 | |||||||||||||
| 49,900 | MAN AG | 6,581,874 | |||||||||||||
| 49,060 | Muenchener Rueckversicherungs AG (Registered) | 8,632,074 | |||||||||||||
| 15,287 | Q-Cells AG * | 1,232,347 | |||||||||||||
| 21,046 | RWE AG | 2,547,941 | |||||||||||||
| 38,020 | Salzgitter AG | 6,664,220 | |||||||||||||
| 69,800 | Siemens AG (Registered) | 8,901,185 | |||||||||||||
| 29,661 | Suedzucker AG | 653,901 | |||||||||||||
| 177,920 | ThyssenKrupp AG | 10,231,711 | |||||||||||||
| 67,374 | Volkswagen AG | 15,340,704 | |||||||||||||
| Total Germany | 118,939,312 | ||||||||||||||
| Greece — 0.2% | |||||||||||||||
| 38,391 | National Bank of Greece SA | 2,080,143 | |||||||||||||
| Hong Kong — 1.5% | |||||||||||||||
| 529,500 | BOC Hong Kong Holdings Ltd | 1,297,596 | |||||||||||||
| 52,000 | Citic Pacific Ltd | 281,186 | |||||||||||||
| 914,400 | CLP Holdings Ltd | 7,147,980 | |||||||||||||
| 99,000 | Hang Lung Group Ltd | 452,809 | |||||||||||||
| 704,000 | Hong Kong Electric Holdings Ltd | 3,986,915 | |||||||||||||
| 197,500 | Hong Kong Exchanges and Clearing Ltd | 3,751,921 | |||||||||||||
| Total Hong Kong | 16,918,407 | ||||||||||||||
See accompanying notes to the financial statements.
6
GMO Tax-Managed International Equities Fund
(A Series of GMO Trust)
Schedule of Investments — (Continued)
(showing percentage of total net assets)
February 29, 2008
| Shares | Description | Value ($) | |||||||||||||
| Hungary — 0.0% | |||||||||||||||
| 1,680 | MOL Magyar Olaj es Gazipari Nyrt (New Shares) | 228,861 | |||||||||||||
| 7,420 | OTP Bank Nyrt | 299,823 | |||||||||||||
| Total Hungary | 528,684 | ||||||||||||||
| India — 0.4% | |||||||||||||||
| 2,400 | Bajaj Auto Ltd Sponsored GDR | 133,200 | |||||||||||||
| 1,250 | HDFC Bank Ltd ADR | 136,388 | |||||||||||||
| 31,700 | Hindalco Industries Ltd GDR 144A | 153,111 | |||||||||||||
| 9,600 | ICICI Bank Ltd Sponsored ADR | 497,664 | |||||||||||||
| 11,830 | Infosys Technologies Sponsored ADR | 460,424 | |||||||||||||
| 34,500 | ITC Ltd GDR | 170,882 | |||||||||||||
| 8,100 | Mahindra & Mahindra Ltd Sponsored GDR | 136,561 | |||||||||||||
| 11,200 | Reliance Industries Ltd Sponsored GDR 144A | 1,363,600 | |||||||||||||
| 7,310 | Satyam Computer Services Ltd ADR | 182,604 | |||||||||||||
| 6,600 | State Bank of India Sponsored GDR | 721,050 | |||||||||||||
| 8,690 | Tata Motors Ltd Sponsored ADR | 152,249 | |||||||||||||
| Total India | 4,107,733 | ||||||||||||||
| Indonesia — 0.1% | |||||||||||||||
| 378,000 | Aneka Tambang Tbk PT | 165,432 | |||||||||||||
| 174,500 | Astra International Tbk PT | 523,588 | |||||||||||||
| 547,500 | Bumi Resources Tbk PT | 451,725 | |||||||||||||
| Total Indonesia | 1,140,745 | ||||||||||||||
| Ireland — 0.4% | |||||||||||||||
| 38,854 | Bank of Ireland | 546,566 | |||||||||||||
| 100,699 | CRH Plc | 3,742,531 | |||||||||||||
| Total Ireland | 4,289,097 | ||||||||||||||
| Israel — 0.1% | |||||||||||||||
| 62,820 | Bank Hapoalim BM | 268,412 | |||||||||||||
| 5,910 | Check Point Software Technologies Ltd * | 129,547 | |||||||||||||
| 4,530 | Teva Pharmaceutical Industries Ltd Sponsored ADR | 222,287 | |||||||||||||
| Total Israel | 620,246 | ||||||||||||||
See accompanying notes to the financial statements.
7
GMO Tax-Managed International Equities Fund
(A Series of GMO Trust)
Schedule of Investments — (Continued)
(showing percentage of total net assets)
February 29, 2008
| Shares | Description | Value ($) | |||||||||||||
| Italy — 3.7% | |||||||||||||||
| 482,848 | Enel SPA | 5,210,124 | |||||||||||||
| 937,601 | ENI SPA | 32,376,518 | |||||||||||||
| 158,878 | Fiat SPA | 3,358,092 | |||||||||||||
| Total Italy | 40,944,734 | ||||||||||||||
| Japan — 18.7% | |||||||||||||||
| 276,000 | Cosmo Oil Co Ltd | 912,032 | |||||||||||||
| 123,541 | Daiichi Sankyo Co Ltd | 3,833,910 | |||||||||||||
| 26,600 | Daikin Industries Ltd | 1,196,933 | |||||||||||||
| 63,700 | Eisai Co Ltd | 2,297,304 | |||||||||||||
| 322,000 | Fuji Heavy Industries Ltd | 1,404,717 | |||||||||||||
| 18,100 | Fuji Photo Film Co Ltd | 678,713 | |||||||||||||
| 619,500 | Honda Motor Co Ltd | 18,910,442 | |||||||||||||
| 88,000 | Hoya Corp | 2,232,818 | |||||||||||||
| 426,000 | Isuzu Motors Ltd | 1,939,893 | |||||||||||||
| 795,000 | Itochu Corp | 8,371,634 | |||||||||||||
| 73,800 | JFE Holdings Inc | 3,288,364 | |||||||||||||
| 58,000 | Kamigumi Co Ltd | 437,598 | |||||||||||||
| 100,000 | Kao Corp | 3,078,782 | |||||||||||||
| 308,000 | Kawasaki Kisen Kaisha Ltd | 3,124,357 | |||||||||||||
| 183,300 | Komatsu Ltd | 4,656,645 | |||||||||||||
| 36,000 | Kyudenko Corp | 181,342 | |||||||||||||
| 74,300 | Kyushu Electric Power Co Inc | 1,872,049 | |||||||||||||
| 899,000 | Marubeni Corp | 6,806,422 | |||||||||||||
| 383,000 | Mazda Motor Corp | 1,560,578 | |||||||||||||
| 421,200 | Mitsubishi Corp | 12,851,015 | |||||||||||||
| 143,000 | Mitsubishi Estate Co Ltd | 3,484,979 | |||||||||||||
| 326,000 | Mitsui & Co | 7,089,663 | |||||||||||||
| 329,000 | Mitsui OSK Lines Ltd | 4,273,014 | |||||||||||||
| 595,718 | Mitsui Trust Holding Inc | 4,106,543 | |||||||||||||
| 47,000 | Nagase & Co | 478,988 | |||||||||||||
| 93,000 | NGK Insulators Ltd | 2,111,836 | |||||||||||||
| 102,000 | Nikon Corp | 2,857,024 | |||||||||||||
| 27,500 | Nintendo Co Ltd | 13,692,132 | |||||||||||||
See accompanying notes to the financial statements.
8
GMO Tax-Managed International Equities Fund
(A Series of GMO Trust)
Schedule of Investments — (Continued)
(showing percentage of total net assets)
February 29, 2008
| Shares | Description | Value ($) | |||||||||||||
| Japan — continued | |||||||||||||||
| 137 | Nippon Building Fund Inc | 1,685,509 | |||||||||||||
| 26,000 | Nippon Corp | 170,973 | |||||||||||||
| 563,000 | Nippon Oil Corp | 3,840,602 | |||||||||||||
| 581,000 | Nippon Steel Corp | 3,056,757 | |||||||||||||
| 1,201 | Nippon Telegraph & Telephone Corp | 5,237,241 | |||||||||||||
| 411,000 | Nippon Yusen KK | 3,797,817 | |||||||||||||
| 982,100 | Nissan Motor Co | 8,831,998 | |||||||||||||
| 4,226 | NTT Docomo Inc | 6,191,386 | |||||||||||||
| 21,000 | Ono Pharmaceutical Co Ltd | 1,060,212 | |||||||||||||
| 3,349 | Resona Holdings Inc | 5,417,055 | |||||||||||||
| 298,400 | Ricoh Company Ltd | 4,792,343 | |||||||||||||
| 7,600 | Ryosan Co | 181,455 | |||||||||||||
| 275,700 | Seven & I Holdings Co Ltd | 6,855,355 | |||||||||||||
| 95,100 | Shin-Etsu Chemical Co Ltd | 5,132,203 | |||||||||||||
| 963,100 | Sojitz Corp | 3,610,208 | |||||||||||||
| 92,900 | SUMCO Corp | 2,054,354 | |||||||||||||
| 200,800 | Sumitomo Corp | 2,887,745 | |||||||||||||
| 63,000 | Taisho Pharmaceutical Co Ltd | 1,283,837 | |||||||||||||
| 234,500 | Takeda Pharmaceutical Co Ltd | 13,084,872 | |||||||||||||
| 72,590 | Takefuji Corp | 1,833,482 | |||||||||||||
| 68,400 | Tokyo Electric Power Co Inc | 1,757,338 | |||||||||||||
| 108,000 | TonenGeneral Sekiyu KK | 1,025,295 | |||||||||||||
| 340,000 | Toshiba Corp | 2,550,250 | |||||||||||||
| Total Japan | 204,068,014 | ||||||||||||||
| Malaysia — 0.3% | |||||||||||||||
| 219,600 | Gamuda Berhad | 266,998 | |||||||||||||
| 178,800 | Genting Berhad | 378,225 | |||||||||||||
| 201,200 | IOI Corp Berhad | 500,427 | |||||||||||||
| 176,750 | Malayan Banking Berhad | 498,922 | |||||||||||||
| 88,300 | MISC Berhad | 246,812 | |||||||||||||
| 67,300 | Public Bank Berhad | 219,858 | |||||||||||||
| 135,255 | Sime Darby Berhad * | 491,144 | |||||||||||||
| 106,000 | Telekom Malaysia Berhad | 374,214 | |||||||||||||
See accompanying notes to the financial statements.
9
GMO Tax-Managed International Equities Fund
(A Series of GMO Trust)
Schedule of Investments — (Continued)
(showing percentage of total net assets)
February 29, 2008
| Shares | Description | Value ($) | |||||||||||||
| Malaysia — continued | |||||||||||||||
| 46,800 | Tenaga Nasional Berhad | 131,311 | |||||||||||||
| Total Malaysia | 3,107,911 | ||||||||||||||
| Netherlands — 3.4% | |||||||||||||||
| 495,995 | Aegon NV | 7,407,436 | |||||||||||||
| 12,283 | Boskalis Westminster | 678,187 | |||||||||||||
| 2,671 | Gamma Holdings NV | 177,886 | |||||||||||||
| 120,207 | Heineken NV | 6,779,733 | |||||||||||||
| 493,931 | ING Groep NV | 16,414,165 | |||||||||||||
| 139,540 | Koninklijke Ahold NV * | 1,833,752 | |||||||||||||
| 45,860 | Koninklijke DSM | 2,018,136 | |||||||||||||
| 107,689 | Reed Elsevier NV | 2,000,652 | |||||||||||||
| Total Netherlands | 37,309,947 | ||||||||||||||
| Norway — 0.9% | |||||||||||||||
| 21,304 | Frontline Ltd | 971,684 | |||||||||||||
| 62,351 | Norsk Hydro ASA | 880,842 | |||||||||||||
| 228,300 | Orkla ASA | 2,837,999 | |||||||||||||
| 172,824 | StatoilHydro ASA | 5,266,173 | |||||||||||||
| Total Norway | 9,956,698 | ||||||||||||||
| Philippines — 0.1% | |||||||||||||||
| 12,000 | Ayala Corp | 126,391 | |||||||||||||
| 613,100 | Ayala Land Inc | 174,230 | |||||||||||||
| 3,400 | Globe Telecom Inc | 123,106 | |||||||||||||
| 84,500 | Manila Electric Co * | 161,891 | |||||||||||||
| 126,700 | Metropolitan Bank & Trust Co | 130,110 | |||||||||||||
| 7,240 | Philippine Long Distance Telephone Co | 510,843 | |||||||||||||
| 956,200 | PNOC Energy Development Corp | 148,973 | |||||||||||||
| Total Philippines | 1,375,544 | ||||||||||||||
See accompanying notes to the financial statements.
10
GMO Tax-Managed International Equities Fund
(A Series of GMO Trust)
Schedule of Investments — (Continued)
(showing percentage of total net assets)
February 29, 2008
| Shares | Description | Value ($) | |||||||||||||
| Poland — 0.0% | |||||||||||||||
| 3,270 | KGHM Polska Miedz SA | 151,318 | |||||||||||||
| 17,440 | Polski Koncern Naftowy Orlen SA * | 295,848 | |||||||||||||
| 12,680 | Telekomunikacja Polska SA | 118,124 | |||||||||||||
| Total Poland | 565,290 | ||||||||||||||
| Russia — 0.5% | |||||||||||||||
| 24,000 | JSC Mining & Smelting Co ADR | 700,800 | |||||||||||||
| 21,100 | Lukoil Sponsored ADR | 1,561,400 | |||||||||||||
| 12,240 | Mobile Telesystems Sponsored ADR | 1,004,414 | |||||||||||||
| 15,200 | OAO Gazprom Sponsored GDR | 772,160 | |||||||||||||
| 4,300 | OAO Tatneft Sponsored GDR (Registered Shares) | 539,650 | |||||||||||||
| 9,950 | Surgutneftegaz Sponsored ADR | 457,700 | |||||||||||||
| 28,540 | Tatneft | 175,171 | |||||||||||||
| 14,840 | Vimpel-Communications Sponsored ADR | 515,393 | |||||||||||||
| Total Russia | 5,726,688 | ||||||||||||||
| Singapore — 1.8% | |||||||||||||||
| 340,000 | Capitaland Ltd | 1,502,128 | |||||||||||||
| 161,500 | Fraser & Neave Ltd | 556,132 | |||||||||||||
| 527,000 | Oversea-Chinese Banking Corp | 2,842,906 | |||||||||||||
| 590,000 | SembCorp Marine Ltd | 1,511,016 | |||||||||||||
| 275,000 | Singapore Exchange Ltd | 1,600,122 | |||||||||||||
| 2,864,670 | Singapore Telecommunications | 7,750,977 | |||||||||||||
| 268,000 | United Overseas Bank Ltd | 3,398,080 | |||||||||||||
| Total Singapore | 19,161,361 | ||||||||||||||
| South Africa — 0.1% | |||||||||||||||
| 110,096 | FirstRand Ltd | 260,553 | |||||||||||||
| 13,816 | Nedbank Group Ltd | 203,782 | |||||||||||||
| 13,600 | Remgro Ltd | 350,818 | |||||||||||||
| 115,100 | Sanlam Ltd | 273,533 | |||||||||||||
| 105,100 | Steinhoff International Holdings Ltd | 241,388 | |||||||||||||
| Total South Africa | 1,330,074 | ||||||||||||||
See accompanying notes to the financial statements.
11
GMO Tax-Managed International Equities Fund
(A Series of GMO Trust)
Schedule of Investments — (Continued)
(showing percentage of total net assets)
February 29, 2008
| Shares | Description | Value ($) | |||||||||||||
| South Korea — 1.1% | |||||||||||||||
| 2,689 | Daelim Industrial Co Ltd | 418,429 | |||||||||||||
| 7,290 | Dongkuk Steel Mill Co Ltd | 326,096 | |||||||||||||
| 8,928 | Hana Financial Group Inc | 396,162 | |||||||||||||
| 5,630 | Hanjin Shipping | 213,103 | |||||||||||||
| 19,550 | Hynix Semiconductor Inc * | 502,735 | |||||||||||||
| 4,862 | Hyundai Development Co | 346,717 | |||||||||||||
| 6,550 | Hyundai Mobis | 502,771 | |||||||||||||
| 12,010 | Hyundai Motor Co | 842,107 | |||||||||||||
| 5,130 | Hyundai Steel Co | 396,900 | |||||||||||||
| 700 | KCC Corp | 412,700 | |||||||||||||
| 7,840 | Kookmin Bank | 483,176 | |||||||||||||
| 12,770 | Korea Electric Power Corp | 447,432 | |||||||||||||
| 5,351 | Korean Air Lines Co Ltd | 404,291 | |||||||||||||
| 1,900 | KT Corp | 93,419 | |||||||||||||
| 9,350 | KT Corp ADR * | 227,112 | |||||||||||||
| 8,630 | KT&G Corp | 712,030 | |||||||||||||
| 4,303 | LG Chemicals Ltd | 359,648 | |||||||||||||
| 6,520 | LG Corp | 453,477 | |||||||||||||
| 2,140 | POSCO | 1,177,049 | |||||||||||||
| 1,698 | Samsung Electronics Co Ltd | 995,321 | |||||||||||||
| 18,710 | Shinhan Financial Group Co Ltd | 1,007,885 | |||||||||||||
| 2,776 | SK Corp | 493,351 | |||||||||||||
| 5,084 | SK Energy Co Ltd | 690,271 | |||||||||||||
| 100 | SK Telecom Co Ltd | 20,327 | |||||||||||||
| 21,030 | SK Telecom Co Ltd ADR | 471,072 | |||||||||||||
| Total South Korea | 12,393,581 | ||||||||||||||
| Spain — 0.9% | |||||||||||||||
| 114,883 | Repsol YPF SA | 3,963,075 | |||||||||||||
| 216,970 | Telefonica SA | 6,278,362 | |||||||||||||
| Total Spain | 10,241,437 | ||||||||||||||
See accompanying notes to the financial statements.
12
GMO Tax-Managed International Equities Fund
(A Series of GMO Trust)
Schedule of Investments — (Continued)
(showing percentage of total net assets)
February 29, 2008
| Shares | Description | Value ($) | |||||||||||||
| Sweden — 1.2% | |||||||||||||||
| 57,900 | Electrolux AB Series B | 929,012 | |||||||||||||
| 40,075 | Hennes & Mauritz AB Class B | 2,247,732 | |||||||||||||
| 149,158 | Investor AB | 3,155,054 | |||||||||||||
| 178,000 | Scania AB Class B | 4,294,317 | |||||||||||||
| 124,900 | Tele2 AB Class B | 2,195,338 | |||||||||||||
| Total Sweden | 12,821,453 | ||||||||||||||
| Switzerland — 4.0% | |||||||||||||||
| 279,757 | ABB Ltd | 6,969,955 | |||||||||||||
| 6,497 | Bobst Group AG (Registered) | 464,039 | |||||||||||||
| 6,550 | Nestle SA (Registered) | 3,126,239 | |||||||||||||
| 351,880 | Novartis AG (Registered) | 17,380,335 | |||||||||||||
| 40,011 | Swiss Reinsurance Co (Registered) | 3,207,022 | |||||||||||||
| 40,794 | Zurich Financial Services AG | 12,752,659 | |||||||||||||
| Total Switzerland | 43,900,249 | ||||||||||||||
| Taiwan — 1.0% | |||||||||||||||
| 295,018 | Advanced Semiconductor Engineering Inc | 270,473 | |||||||||||||
| 131,508 | Asustek Computer Inc | 363,060 | |||||||||||||
| 670,488 | China Development Financial Holding Corp | 274,552 | |||||||||||||
| 669,841 | China Steel Corp | 989,679 | |||||||||||||
| 513,000 | Chinatrust Financial Holding Co Ltd * | 458,627 | |||||||||||||
| 277,440 | Chunghwa Telecom Co Ltd | 689,807 | |||||||||||||
| 390,383 | Compal Electronics Inc | 351,845 | |||||||||||||
| 55,960 | Delta Electronics Inc | 159,165 | |||||||||||||
| 291,247 | Far Eastern Textile Co Ltd | 474,511 | |||||||||||||
| 223,000 | Far Eastone Telecommunications Co Ltd | 311,395 | |||||||||||||
| 274,930 | Formosa Chemicals & Fibre Co | 668,126 | |||||||||||||
| 210,515 | Formosa Plastics Corp | 567,482 | |||||||||||||
| 45,558 | High Tech Computer Corp | 940,486 | |||||||||||||
| 171,694 | Lite-On Technology Corp | 234,540 | |||||||||||||
| 27,260 | MediaTek Inc | 305,735 | |||||||||||||
| 458,000 | Mega Financial Holdings Co Ltd | 327,043 | |||||||||||||
| 360,080 | Nan Ya Plastics Corp | 848,007 | |||||||||||||
See accompanying notes to the financial statements.
13
GMO Tax-Managed International Equities Fund
(A Series of GMO Trust)
Schedule of Investments — (Continued)
(showing percentage of total net assets)
February 29, 2008
| Shares | Description | Value ($) | |||||||||||||
| Taiwan — continued | |||||||||||||||
| 61,559 | Novatek Microelectronics Corp Ltd | 216,615 | |||||||||||||
| 157,290 | Quanta Computer Inc | 206,199 | |||||||||||||
| 241,677 | Siliconware Precision Industries Co | 393,838 | |||||||||||||
| 528,390 | Taishin Financial Holdings Co Ltd * | 245,842 | |||||||||||||
| 155,809 | Taiwan Mobile Co Ltd | 263,962 | |||||||||||||
| 65,000 | U-Ming Marine Transport Co | 178,716 | |||||||||||||
| 140,240 | Unimicron Technology Corp | 211,611 | |||||||||||||
| 481,742 | United Microelectronics Corp | 285,944 | |||||||||||||
| 152,579 | Wistron Corp | 251,964 | |||||||||||||
| Total Taiwan | 10,489,224 | ||||||||||||||
| Thailand — 0.4% | |||||||||||||||
| 91,150 | Bangkok Bank Pcl NVDR (a) | 372,160 | |||||||||||||
| 22,000 | Bangkok Dusit Medical Service Pcl (Foreign Registered) (a) | 23,258 | |||||||||||||
| 1,245,260 | IRPC Pcl (Foreign Registered) (a) | 234,441 | |||||||||||||
| 210,020 | Kasikornbank Pcl NVDR (a) | 578,870 | |||||||||||||
| 624,060 | Krung Thai Bank Pcl (Foreign Registered) (a) | 212,151 | |||||||||||||
| 163,180 | PTT Exploration & Production Pcl (Foreign Registered) (a) | 821,349 | |||||||||||||
| 102,780 | PTT Pcl (Foreign Registered) (a) | 1,099,155 | |||||||||||||
| 52,540 | Siam Cement Pcl NVDR (a) | 357,085 | |||||||||||||
| 172,200 | Siam Commercial Bank Pcl (Foreign Registered) (a) | 471,982 | |||||||||||||
| 120,380 | Thai Oil Pcl (Foreign Registered) (a) | 297,668 | |||||||||||||
| Total Thailand | 4,468,119 | ||||||||||||||
| Turkey — 0.2% | |||||||||||||||
| 9,410 | KOC Holding AS * | 35,440 | |||||||||||||
| 18,940 | Tupras-Turkiye Petrol Rafineriler AS | 480,187 | |||||||||||||
| 123,780 | Turkiye Garanti Bankasi | 734,080 | |||||||||||||
| 90,470 | Turkiye IS Bankasi Class C | 414,961 | |||||||||||||
| 61,060 | Turkiye Vakiflar Bankasi TAO Class D | 142,742 | |||||||||||||
| Total Turkey | 1,807,410 | ||||||||||||||
See accompanying notes to the financial statements.
14
GMO Tax-Managed International Equities Fund
(A Series of GMO Trust)
Schedule of Investments — (Continued)
(showing percentage of total net assets)
February 29, 2008
| Shares | Description | Value ($) | |||||||||||||
| United Kingdom — 19.0% | |||||||||||||||
| 245,549 | 3i Group Plc | 3,968,531 | |||||||||||||
| 98,685 | Alliance & Leicester Plc | 1,094,488 | |||||||||||||
| 246,300 | AstraZeneca Plc | 9,206,055 | |||||||||||||
| 316,479 | Aviva Plc | 3,814,662 | |||||||||||||
| 322,987 | Barclays Plc | 3,027,137 | |||||||||||||
| 243,355 | BG Group Plc | 5,736,117 | |||||||||||||
| 220,139 | BHP Billiton Plc | 7,042,272 | |||||||||||||
| 201,360 | Centrica Plc | 1,285,641 | |||||||||||||
| 1,611,247 | GlaxoSmithKline Plc | 35,171,168 | |||||||||||||
| 402,538 | HBOS Plc | 4,783,342 | |||||||||||||
| 363,898 | Home Retail Group | 1,858,831 | |||||||||||||
| 164,980 | Imperial Tobacco Group Plc | 7,637,304 | |||||||||||||
| 323,002 | J Sainsbury Plc | 2,264,537 | |||||||||||||
| 92,250 | Next Plc | 2,339,636 | |||||||||||||
| 870,317 | Old Mutual Plc | 2,149,772 | |||||||||||||
| 84,522 | Reckitt Benckiser Group Plc | 4,559,223 | |||||||||||||
| 201,330 | Rio Tinto Plc | 22,651,148 | |||||||||||||
| 2,648,185 | Royal Bank of Scotland Group | 20,021,673 | |||||||||||||
| 212,792 | Royal Dutch Shell Group Class A (Amsterdam) | 7,609,350 | |||||||||||||
| 249,000 | Royal Dutch Shell Plc A Shares (London) | 8,903,336 | |||||||||||||
| 102,049 | Royal Dutch Shell Plc B Shares (London) | 3,580,079 | |||||||||||||
| 63,741 | SABMiller Breweries Plc | 1,324,258 | |||||||||||||
| 91,642 | Scottish & Southern Energy Plc | 2,679,670 | |||||||||||||
| 870,228 | Taylor Woodrow Plc | 2,944,632 | |||||||||||||
| 391,446 | Tesco Plc | 3,093,323 | |||||||||||||
| 111,700 | Unilever Plc | 3,519,250 | |||||||||||||
| 10,195,489 | Vodafone Group Inc | 32,823,545 | |||||||||||||
| 27,585 | Whitbread Plc | 690,241 | |||||||||||||
| 154,391 | Wolseley Plc | 1,889,290 | |||||||||||||
| Total United Kingdom | 207,668,511 | ||||||||||||||
| TOTAL COMMON STOCKS (COST $860,936,632) | 1,045,912,991 | ||||||||||||||
See accompanying notes to the financial statements.
15
GMO Tax-Managed International Equities Fund
(A Series of GMO Trust)
Schedule of Investments — (Continued)
(showing percentage of total net assets)
February 29, 2008
| Shares | Description | Value ($) | |||||||||||||
| PREFERRED STOCKS — 1.9% | |||||||||||||||
| Brazil — 1.1% | |||||||||||||||
| 28,194 | Banco Bradesco SA 0.32% | 880,281 | |||||||||||||
| 30,100 | Banco Itau Holding Financeira SA 2.81% | 758,240 | |||||||||||||
| 14,700 | Bradespar SA 0.28% | 382,473 | |||||||||||||
| 17,648 | Brasil Telecom Participacoes SA 4.46% | 246,285 | |||||||||||||
| 33,078 | Companhia Energetica de Minas Gerais 2.29% | 629,834 | |||||||||||||
| 20,692 | Companhia Paranaense de Energia Class B 2.20% | 336,608 | |||||||||||||
| 50,500 | Companhia Vale do Rio Doce Class A 0.05% | 1,488,930 | |||||||||||||
| 27,302 | Electrobras (Centro) SA Class B 6.09% | 400,384 | |||||||||||||
| 18,550 | Gerdau Metalurgica SA 2.65% | 817,205 | |||||||||||||
| 27,600 | Gerdau SA 2.11% | 901,884 | |||||||||||||
| 123,857 | Itausa-Investimentos Itau SA 0.11% | 787,335 | |||||||||||||
| 45,424 | Petroleo Brasileiro SA (Petrobras) 0.43% | 2,187,798 | |||||||||||||
| 67,200 | Sadia SA 3.09% | 379,890 | |||||||||||||
| 34,280 | Tele Norte Leste Participacoes ADR 3.52% | 858,028 | |||||||||||||
| 15,400 | Usinas Siderrurgicas de Minas Gerais SA Class A 2.26% | 892,437 | |||||||||||||
| Total Brazil | 11,947,612 | ||||||||||||||
| Germany — 0.8% | |||||||||||||||
| 1,850 | Porsche AG (Non Voting) 0.06% | 3,207,677 | |||||||||||||
| 20,411 | Villeroy & Boch AG (Non Voting) 4.37% | 293,821 | |||||||||||||
| 40,841 | Volkswagen AG 2.02% | 5,690,707 | |||||||||||||
| Total Germany | 9,192,205 | ||||||||||||||
| TOTAL PREFERRED STOCKS (COST $9,944,850) | 21,139,817 | ||||||||||||||
| RIGHTS AND WARRANTS — 0.0% | |||||||||||||||
| Brazil — 0.0% | |||||||||||||||
| 335 | Banco Bradesco SA Rights, Expires 02/22/08 * (b) | 881 | |||||||||||||
See accompanying notes to the financial statements.
16
GMO Tax-Managed International Equities Fund
(A Series of GMO Trust)
Schedule of Investments — (Continued)
(showing percentage of total net assets)
February 29, 2008
| Shares / Par Value ($) | Description | Value ($) | |||||||||||||
| France — 0.0% | |||||||||||||||
| 2 | Societe Generale Rights, Expires 02/29/08 * (c) | 18 | |||||||||||||
| TOTAL RIGHTS AND WARRANTS (COST $219) | 899 | ||||||||||||||
| SHORT-TERM INVESTMENTS — 0.4% | |||||||||||||||
| 3,900,000 | Barclays Plc Time Deposit, 3.12%, due 03/03/08 | 3,900,000 | |||||||||||||
| TOTAL SHORT-TERM INVESTMENTS (COST $3,900,000) | 3,900,000 | ||||||||||||||
| TOTAL INVESTMENTS — 98.0% (Cost $874,781,701) | 1,070,953,707 | ||||||||||||||
| Other Assets and Liabilities (net) — 2.0% | 21,392,224 | ||||||||||||||
| TOTAL NET ASSETS — 100.0% | $ | 1,092,345,931 | |||||||||||||
See accompanying notes to the financial statements.
17
GMO Tax-Managed International Equities Fund
(A Series of GMO Trust)
Schedule of Investments — (Continued)
February 29, 2008
Notes to Schedule of Investments:
144A - Securities exempt from registration under Rule 144A of the Securities Act of 1933. These securities may be resold in transactions exempt from registration, normally to qualified institutional investors.
ADR - American Depositary Receipt
Foreign Registered - Shares issued to foreign investors in markets that have foreign ownership limits.
GDR - Global Depository Receipt
NVDR - Non-Voting Depository Receipt
* Non-income producing security.
(a) Security valued at fair value using methods determined in good faith by or at the direction of the Trustees of GMO Trust (Note 2).
(b) As of February 29, 2008, these rights have been exercised but shares have not yet been credited to the Fund.
(c) As of February 29, 2008, the Fund elected to sell these rights but the sale did not occur until after the Fund's year end.
As of February 29, 2008, 91.08% of the Net Assets of the Fund were valued using fair value prices based on models used by a third party vendor (Note 2).
See accompanying notes to the financial statements.
18
GMO Tax-Managed International Equities Fund
(A Series of GMO Trust)
Statement of Assets and Liabilities — February 29, 2008
| Assets: | |||||||
| Investments, at value (cost $874,781,701) (Note 2) | $ | 1,070,953,707 | |||||
| Cash | 71,774 | ||||||
| Foreign currency, at value (cost $19,889,129) (Note 2) | 20,340,309 | ||||||
| Receivable for investments sold | 111,374 | ||||||
| Receivable for Fund shares sold | 555 | ||||||
| Dividends and interest receivable | 2,085,850 | ||||||
| Foreign taxes receivable | 232,769 | ||||||
| Receivable for expenses reimbursed by Manager (Note 3) | 133,690 | ||||||
| Total assets | 1,093,930,028 | ||||||
| Liabilities: | |||||||
| Payable for investments purchased | 582,002 | ||||||
| Payable to affiliate for (Note 3): | |||||||
| Management fee | 468,464 | ||||||
| Shareholder service fee | 130,129 | ||||||
| Trustees and Chief Compliance Officer of GMO Trust fees | 1,289 | ||||||
| Accrued expenses | 402,213 | ||||||
| Total liabilities | 1,584,097 | ||||||
| Net assets | $ | 1,092,345,931 | |||||
| Net assets consist of: | |||||||
| Paid-in capital | $ | 873,132,342 | |||||
| Accumulated undistributed net investment income | 2,816,425 | ||||||
| Accumulated net realized gain | 19,709,630 | ||||||
| Net unrealized appreciation | 196,687,534 | ||||||
| $ | 1,092,345,931 | ||||||
| Net assets attributable to: | |||||||
| Class III shares | $ | 1,092,345,931 | |||||
| Shares outstanding: | |||||||
| Class III | 58,311,946 | ||||||
| Net asset value per share: | |||||||
| Class III | $ | 18.73 | |||||
See accompanying notes to the financial statements.
19
GMO Tax-Managed International Equities Fund
(A Series of GMO Trust)
Statement of Operations — Year Ended February 29, 2008
| Investment Income: | |||||||
| Dividends (net of withholding taxes of $3,697,099) | $ | 35,374,791 | |||||
| Interest | 1,091,974 | ||||||
| Total investment income | 36,466,765 | ||||||
| Expenses: | |||||||
| Management fee (Note 3) | 6,507,466 | ||||||
| Shareholder service fee – Class III (Note 3) | 1,807,629 | ||||||
| Custodian and fund accounting agent fees | 913,700 | ||||||
| Transfer agent fees | 33,973 | ||||||
| Audit and tax fees | 94,967 | ||||||
| Legal fees | 25,794 | ||||||
| Trustees fees and related expenses (Note 3) | 13,083 | ||||||
| Registration fees | 7,286 | ||||||
| Miscellaneous | 16,686 | ||||||
| Total expenses | 9,420,584 | ||||||
| Fees and expenses reimbursed by Manager (Note 3) | (1,066,284 | ) | |||||
| Expense reductions (Note 2) | (4,022 | ) | |||||
| Net expenses | 8,350,278 | ||||||
| Net investment income (loss) | 28,116,487 | ||||||
| Realized and unrealized gain (loss): | |||||||
| Net realized gain (loss) on: | |||||||
| Investments | 107,809,013 | ||||||
| Closed futures contracts | (700,603 | ) | |||||
| Foreign currency, forward contracts and foreign currency related transactions (net of CPMF tax of $1,722) (Note 2) | 3,903,738 | ||||||
| Net realized gain (loss) | 111,012,148 | ||||||
| Change in net unrealized appreciation (depreciation) on: | |||||||
| Investments | (112,630,704 | ) | |||||
| Foreign currency, forward contracts and foreign currency related transactions | 114,439 | ||||||
| Net unrealized gain (loss) | (112,516,265 | ) | |||||
| Net realized and unrealized gain (loss) | (1,504,117 | ) | |||||
| Net increase (decrease) in net assets resulting from operations | $ | 26,612,370 | |||||
See accompanying notes to the financial statements.
20
GMO Tax-Managed International Equities Fund
(A Series of GMO Trust)
Statement of Changes in Net Assets
| Year Ended February 29, 2008 | Year Ended February 28, 2007 | ||||||||||
| Increase (decrease) in net assets: | |||||||||||
| Operations: | |||||||||||
| Net investment income (loss) | $ | 28,116,487 | $ | 18,003,549 | |||||||
| Net realized gain (loss) | 111,012,148 | 55,122,662 | |||||||||
| Change in net unrealized appreciation (depreciation) | (112,516,265 | ) | 107,047,664 | ||||||||
| Net increase (decrease) in net assets from operations | 26,612,370 | 180,173,875 | |||||||||
| Distributions to shareholders from: | |||||||||||
| Net investment income | |||||||||||
| Class III | (31,165,537 | ) | (20,061,779 | ) | |||||||
| Net realized gains | |||||||||||
| Class III | (118,448,701 | ) | (39,922,774 | ) | |||||||
| (149,614,238 | ) | (59,984,553 | ) | ||||||||
| Net share transactions (Note 7): | |||||||||||
| Class III | 110,083,703 | 155,491,902 | |||||||||
| Total increase (decrease) in net assets | (12,918,165 | ) | 275,681,224 | ||||||||
| Net assets: | |||||||||||
| Beginning of period | 1,105,264,096 | 829,582,872 | |||||||||
| End of period (including accumulated undistributed net investment income of $2,816,425 and $354,337, respectively) | $ | 1,092,345,931 | $ | 1,105,264,096 | |||||||
See accompanying notes to the financial statements.
21
GMO Tax-Managed International Equities Fund
(A Series of GMO Trust)
Financial Highlights
(For a Class III share outstanding throughout each period)
| Year Ended February 28/29, | |||||||||||||||||||||||
| 2008 | 2007 | 2006 | 2005 | 2004 | |||||||||||||||||||
| Net asset value, beginning of period | $ | 20.76 | $ | 18.31 | $ | 15.78 | $ | 13.19 | $ | 8.73 | |||||||||||||
| Income (loss) from investment operations: | |||||||||||||||||||||||
| Net investment income (loss)† | 0.51 | 0.36 | 0.35 | 0.26 | 0.21 | ||||||||||||||||||
| Net realized and unrealized gain (loss) | 0.20 | (b) | 3.28 | 2.77 | 2.61 | 4.55 | |||||||||||||||||
| Total from investment operations | 0.71 | 3.64 | 3.12 | 2.87 | 4.76 | ||||||||||||||||||
| Less distributions to shareholders: | |||||||||||||||||||||||
| From net investment income | (0.57 | ) | (0.40 | ) | (0.31 | ) | (0.28 | ) | (0.30 | ) | |||||||||||||
| From net realized gains | (2.17 | ) | (0.79 | ) | (0.28 | ) | — | — | |||||||||||||||
| Total distributions | (2.74 | ) | (1.19 | ) | (0.59 | ) | (0.28 | ) | (0.30 | ) | |||||||||||||
| Net asset value, end of period | $ | 18.73 | $ | 20.76 | $ | 18.31 | $ | 15.78 | $ | 13.19 | |||||||||||||
| Total Return(a) | 2.28 | % | 20.33 | % | 20.04 | % | 21.94 | % | 54.99 | % | |||||||||||||
| Ratios/Supplemental Data: | |||||||||||||||||||||||
| Net assets, end of period (000's) | $ | 1,092,346 | $ | 1,105,264 | $ | 829,583 | $ | 559,912 | $ | 291,360 | |||||||||||||
| Net expenses to average daily net assets | 0.69 | %(c) | 0.69 | % | 0.69 | % | 0.69 | % | 0.69 | % | |||||||||||||
| Net investment income to average daily net assets | 2.33 | % | 1.83 | % | 2.10 | % | 1.91 | % | 1.87 | % | |||||||||||||
| Portfolio turnover rate | 41 | % | 34 | % | 39 | % | 44 | % | 36 | % | |||||||||||||
| Fees and expenses reimbursed by the Manager to average daily net assets: | 0.09 | % | 0.08 | % | 0.10 | % | 0.16 | % | 0.26 | % | |||||||||||||
(a) The total returns would have been lower had certain expenses not been reimbursed during the periods shown and assumes the effect of reinvested distributions.
(b) The amount shown for a share outstanding does not correspond with the aggregate net realized and unrealized gain (loss) on investments due to the timing of purchases and redemptions of Fund shares in relation to fluctuating market values of the investments of the Fund.
(c) The net expense ratio does not include the effect of expense reductions.
† Calculated using average shares outstanding throughout the period.
See accompanying notes to the financial statements.
22
GMO Tax-Managed International Equities Fund
(A Series of GMO Trust)
Notes to Financial Statements
February 29, 2008
1. Organization
GMO Tax-Managed International Equities Fund (the "Fund") is a series of GMO Trust (the "Trust"). The Fund is registered under the Investment Company Act of 1940, as amended, as an open-end, non-diversified management investment company. The Fund is advised and managed by Grantham, Mayo, Van Otterloo & Co. LLC (the "Manager" or "GMO"). The Trust was established as a Massachusetts business trust under the laws of the Commonwealth of Massachusetts on June 24, 1985. The Declaration of Trust permits the Trustees of the Trust ("Trustees") to create an unlimited number of series of shares ("Funds") and to subdivide Funds into classes.
The Fund seeks high after-tax total return. The Fund seeks to achieve its investment objective by outperforming the MSCI EAFE Index (after tax), which is computed by GMO by adjusting the return of the MSCI EAFE Index (Europe, Australasia, and Far East) by its tax cost. The Fund typically makes equity investments in non-U.S. companies that issue stocks included in the MSCI EAFE universe (which is larger than, but generally represented by, the MSCI EAFE Index), plus companies in Canada and emerging countries. GMO uses quantitative models integrated with tax management techniques to provide broad exposure to the international equity markets to investors subject to U.S. federal income tax. The Fund's investments in emerging countries generally will represent 15% or less of the Fund's total assets.
2. Significant accounting policies
The following is a summary of significant accounting policies which are in conformity with accounting principles generally accepted in the United States of America ("U.S. GAAP") and which are consistently followed by the Fund in the preparation of its financial statements. The preparation of financial statements in accordance with U.S. GAAP requires management to make estimates and assumptions that affect the reported amounts and disclosures in the financial statements. Actual results could differ from those estimates. The accounting records of the Fund are maintained in U.S. dollars.
Portfolio valuation
Securities listed on a securities exchange for which market quotations are readily available are valued at the last sale price or official closing price on each business day, or if there is no such reported sale or official closing price, at the most recent quoted bid price. Unlisted securities for which market quotations are readily available are generally valued at the most recent quoted bid price. Short-term investments with a remaining maturity of sixty days or less are generally valued at amortized cost, which approximates fair value. Shares of investment funds are valued at their net asset value. Securities for which quotations are not readily available or whose values the Manager has determined to be unreliable are valued at fair value as determined in good faith by the Trustees or other persons acting at their direction pursuant to procedures approved by the Trustees. By its nature, a fair value price is a good faith est imate of the value of a security at a given point in time and may not reflect the value that would be realized if the security was sold and the differences could be material. Because many foreign equity securities markets and exchanges close prior to
23
GMO Tax-Managed International Equities Fund
(A Series of GMO Trust)
Notes to Financial Statements — (Continued)
February 29, 2008
the close of the New York Stock Exchange ("NYSE"), closing prices for foreign securities in those markets or on those exchanges do not reflect the events that occur after that close but before the close of the NYSE. As a result, foreign equity securities are generally valued using fair value prices supplied by a third party vendor based on models to the extent that these fair value prices are available.
Foreign currency translation
The market values of foreign securities, currency holdings and other assets and liabilities are translated to U.S. dollars based on the current exchange rates each business day. Income and expenses denominated in foreign currencies are translated at current exchange rates when accrued or incurred. The Fund does not isolate realized and unrealized gains and losses attributable to changes in exchange rates from gains and losses that arise from changes in the market value of investments. Such fluctuations are included with net realized and unrealized gain or loss on investments. Net realized gains and losses on foreign currency transactions represent gains and losses on disposition of currencies and forward currency contracts, currency gains and losses realized between the trade and settlement dates on securities transactions, and the difference between the amount of investment income and foreign withholding taxes recorded on the F und's accounting records and the U.S. dollar equivalent amounts actually received or paid.
Forward currency contracts
The Fund may enter into forward currency contracts including forward cross currency contracts. A forward currency contract is an agreement between two parties to buy and sell a currency at a set price on a future date. The market value of a forward currency contract fluctuates with changes in forward currency exchange rates. Forward currency contracts are marked to market daily using rates supplied by a quotation service and changes in value are recorded by the Fund as an unrealized gain or loss. Realized gains or losses equal to the difference between the value of the contract at the time it was opened and the value at the time it was closed are recorded upon delivery or receipt of the currency or, if a forward currency contract is offset by entering into another forward currency contract with the same broker, upon settlement of the net gain or loss. These contracts may involve market risk in excess of the unrealized gain or lo ss reflected in the Fund's Statement of Assets and Liabilities. In addition, the Fund could be exposed to risk if the counterparties are unable to meet the terms of the contracts or if there are movements in currency values that are unfavorable to the Fund. There were no forward currency contracts outstanding at the end of the period.
Futures contracts
The Fund may purchase and sell futures contracts. Upon entering into a futures contract, the Fund is required to deposit with the futures clearing broker an amount of cash, U.S. government and agency obligations, or other liquid assets in accordance with the initial margin requirements of the broker or exchange. In addition, the Fund maintains cash or securities in an amount that at least equals the net amount payable in the event the Fund must deliver the full amount of the contracts. Futures contracts are marked to market daily and an appropriate payable or receivable for the change in value ("variation margin") is recorded by the Fund. The payable or receivable is liquidated on the following business day.
24
GMO Tax-Managed International Equities Fund
(A Series of GMO Trust)
Notes to Financial Statements — (Continued)
February 29, 2008
Gains or losses are recognized but not considered realized until the contracts expire or are closed. Futures contracts involve, to varying degrees, risk of loss in excess of the variation margin disclosed in the Statement of Assets and Liabilities. Under certain circumstances, futures exchanges may establish daily limits on the amount that the price of a futures contract can vary from the previous day's settlement price, thereby effectively preventing liquidation of unfavorable positions. Losses may arise from changes in the value of the underlying instrument if the Fund is unable to liquidate a futures position due to an illiquid secondary market for the contracts or the imposition of price limits, or if counterparties do not perform under the contract terms. Futures contracts are generally valued at the settlement price established each day by the board of trade or exchange on which they are traded. There were no futures contr acts outstanding at the end of the period.
Options
The Fund may write call and put options. Writing options increases the Fund's exposure to the underlying instrument by, in the case of a call option, obligating the Fund to sell the underlying instrument at a set price to the option-holder and, in the case of a put option, obligating the Fund to purchase the underlying instrument at a set price from the option-holder. When the Fund writes a call or put option, an amount equal to the premium received is recorded as a liability and subsequently marked to market to reflect the current value of the option written. Premiums received from writing options which expire are treated as realized gains. Premiums received from writing options which are exercised or closed are added to the proceeds or offset against the amounts paid on the underlying future, security or currency transaction to determine the realized gain or loss. The Fund as a writer of an option has no control over whether t he underlying future, security or currency may be sold (call) or purchased (put) and as a result bears the market risk of an unfavorable change in the price of the future, security or currency underlying the written option. In the event that the Fund writes uncovered call options (i.e. options for investments that the Fund does not own), it bears the risk of incurring substantial losses if the price of the underlying instrument increases during the term of the option. There is the risk the Fund may not be able to enter into a closing transaction because of an illiquid market. There were no open written option contracts during the period.
The Fund may also purchase put and call options. Purchasing options alters the Fund's exposure to the underlying instrument by, in the case of a call option, entitling the Fund to purchase the underlying instrument at a set price from the writer of the option and, in the case of a put option, entitling the Fund to sell the underlying instrument at a set price to the writer of the option. The Fund pays a premium as a cost for a purchased option disclosed in the Schedule of Investments which is subsequently marked to market to reflect the current value of the option. Premiums paid for purchasing options which expire are treated as realized losses. Premiums paid for purchasing options which are exercised or closed are added to the amounts paid or offset against the proceeds on the closing transaction to determine the realized gain or loss. The risk associated with purchasing put and call options is limited to the premium paid. Ther e were no purchased option contracts outstanding at the end of the period.
25
GMO Tax-Managed International Equities Fund
(A Series of GMO Trust)
Notes to Financial Statements — (Continued)
February 29, 2008
Exchange traded options are valued at the last sale price, or if no sale is reported, the last bid price for purchased options and the last ask price for written options. Options traded over-the-counter are valued using prices supplied by a primary pricing source chosen by the Manager.
Indexed securities
The Fund may invest in indexed securities where the redemption values and/or coupons are linked to the prices of a specific instrument or financial statistic. The Fund uses indexed securities to increase or decrease its exposure to different underlying instruments and to gain exposure to markets in which it may be difficult to invest through conventional securities. Indexed securities may be more volatile than their underlying instruments, but any loss is limited to the amount of the original investment. There were no indexed securities held by the Fund at the end of the period.
Swap agreements
The Fund may enter into swap agreements. A swap is an agreement to exchange the return generated by one instrument for the return generated by another instrument. Interest rate swap agreements involve the exchange by one party with another party of their respective commitments to pay or receive interest, e.g., an exchange of floating rate payments for fixed rate payments with respect to a notional amount of principal. Total return swap agreements involve a commitment by one party in the agreement to pay interest in exchange for a market-linked return, both based on notional amounts. To the extent the total return of the security or index underlying the transaction exceeds or falls short of the offsetting interest rate obligation, the party will receive a payment from or make a payment to the counterparty, respectively. Forward spread lock swap agreements involve commitments to pay or receive a settlement amount calculated as the difference between the swap spread and a fixed spread, multiplied by the notional amount times the duration of the swap rate. The swap spread is the difference between the benchmark swap rate (market rate) and the specific treasury rate. Variance swap agreements involve commitments to pay or receive a settlement amount calculated as the difference between the annualized realized variance of returns on the underlying price and a fixed quantity, also known as the variance strike, over a period of time. In connection with these agreements, cash or securities may be set aside as collateral by the Fund's custodian or brokers in accordance with the terms of the swap agreement. The Fund earns or pays interest on cash set aside as collateral.
Swaps are marked to market daily using models that incorporate quotations from market makers and the change in value, if any, is recorded as unrealized gain or loss in the Statement of Operations. Payments received or made on swap contracts are recorded as realized gain or loss in the Statement of Operations. Gains or losses are realized upon early termination of the swap agreements. These financial instruments are not actively traded on financial markets. The values assigned to these instruments are based upon the best available information and because of the uncertainty of the valuation, these values may differ significantly from the values that would have been realized had a ready market for these instruments existed, and the differences could be material. Entering into these agreements involves, to varying degrees, elements of credit, legal, market and documentation risk in excess of the amounts recognized in the
26
GMO Tax-Managed International Equities Fund
(A Series of GMO Trust)
Notes to Financial Statements — (Continued)
February 29, 2008
Statement of Assets and Liabilities. Such risks involve the possibility that there will be no liquid market for these agreements, that the counterparties to the agreements may default on their obligations to perform or disagree as to the meaning of contractual terms in the agreements, or that there may be unfavorable changes in interest rates or the price of the index or security underlying these transactions. There were no swap agreements outstanding at the end of the period.
Securities lending
The Fund may lend its securities to certain qualified broker-dealers. The loans are collateralized with cash or liquid securities with a market value at least equal to the market value of the securities on loan. As with other extensions of credit, the Fund may bear the risk of loss with respect to the investment of the collateral, the risk of delay in and/or inability to exercise its rights with respect to the collateral, and the risk of delay in recovery or loss of rights in the loaned securities should the borrower of the securities fail financially. If a loan is collateralized by U.S. government securities, the Fund receives a fee from the borrower. If a loan is collateralized by cash, the Fund typically invests the cash collateral for its own account in interest-bearing, short-term securities and pays a fee to the borrower that normally represents a portion of the Fund's earnings on the collateral. For the year ended Februar y 29, 2008, the Fund did not participate in securities lending.
Taxes and distributions
The Fund intends to qualify each tax year as a regulated investment company under Subchapter M of the Internal Revenue Code of 1986, as amended (the "Code"). The Fund intends to distribute substantially all of its net investment income and net realized short-term and long-term capital gains, if any, after giving effect to any available capital loss carryovers for U.S. federal income tax purposes. Therefore, no provision for U.S. federal income or excise tax is necessary. Taxes on foreign interest and dividend income are generally withheld in accordance with the applicable country's tax treaty with the United States. The foreign withholding rates applicable to a Fund's investments in certain foreign jurisdictions may be higher if a significant portion of the Fund is held by non-U.S. shareholders.
The Fund's policy is to declare and pay distributions from net investment income, if any, semiannually, and from net realized short-term and long-term capital gains, if any, at least annually. All distributions are paid in shares of the Fund, at net asset value, unless the shareholder elects to receive cash distributions. Distributions to shareholders are recorded by the Fund on the ex-dividend date.
Dividends received by shareholders of the Fund which are derived from foreign source income and foreign taxes paid by the Fund may be treated, to the extent allowable under the Code, as if received and paid by the shareholders of the Fund.
The Fund may be subject to capital gains and repatriation taxes imposed by certain countries in which it invests. The Fund is subject to a Contribuição Provisória sobre Movimentações Financiera ("CPMF") tax which is applied to foreign exchange transactions representing capital inflows or outflows to/from the
27
GMO Tax-Managed International Equities Fund
(A Series of GMO Trust)
Notes to Financial Statements — (Continued)
February 29, 2008
Brazilian market. For the year ended February 29, 2008, the Fund incurred $1,722 in CPMF tax which is included in the net realized gain (loss) on foreign currency, forward contracts and foreign currency related transactions in the Statement of Operations.
Income and capital gain distributions are determined in accordance with U.S. federal income tax regulations, which may differ from U.S. GAAP. Certain capital accounts in the financial statements are periodically adjusted for permanent differences in order to reflect their tax character. These adjustments have no impact on net assets or net asset value per share. Temporary differences which arise from recognizing certain items of income, expense, gain or loss in different periods for financial statement and tax purposes will reverse at some time in the future. Distributions in excess of net investment income or net realized gains are temporary over distributions for financial statement purposes resulting from differences in the recognition or classification of income or distributions for financial statement and tax purposes.
U.S. GAAP and tax accounting differences primarily relate to passive foreign investment company transactions and foreign currency transactions.
The following reclassification represents the amount necessary to report the stated components of net assets on a tax basis, excluding certain temporary differences, as of February 29, 2008. The financial highlights exclude these adjustments.
| Accumulated Undistributed Net Investment Income | Accumulated Net Realized Gain | Paid-in Capital | |||||||||
| $ | 5,511,138 | $ | (5,511,139 | ) | $ | 1 | |||||
The tax character of distributions declared to shareholders is as follows:
| 2/29/2008 | 2/28/2007 | ||||||||||
| Ordinary income (including any short-term capital gains) | $ | 42,430,962 | $ | 22,514,744 | |||||||
| Long-term capital gains | 107,183,276 | 37,469,809 | |||||||||
| Total distributions | $ | 149,614,238 | $ | 59,984,553 | |||||||
Distributions in excess of tax basis earnings and profits, if significant, are reported in the financial statements as a tax return of capital.
28
GMO Tax-Managed International Equities Fund
(A Series of GMO Trust)
Notes to Financial Statements — (Continued)
February 29, 2008
As of February 29, 2008, the components of distributable earnings on a tax basis consisted of the following:
| Undistributed ordinary income | $ | 3,263,708 | |||||
| Undistributed long–term capital gain | $ | 19,928,520 | |||||
As of February 29, 2008, the approximate cost for U.S. federal income tax purposes and gross and net unrealized appreciation and depreciation in value of investments were as follows:
| Aggregate Cost | Gross Unrealized Appreciation | Gross Unrealized (Depreciation) | Net Unrealized Appreciation (Depreciation) | ||||||||||||
| $ | 875,289,873 | $ | 257,249,887 | $ | (61,586,053 | ) | $ | 195,663,834 | |||||||
Security transactions and related investment income
Security transactions are accounted for on trade date. Dividend income, net of applicable foreign withholding taxes, if any, is recorded on the ex-dividend date, or when the Fund is informed of the ex-dividend date, if later. Interest income is recorded on the accrual basis and is adjusted for the amortization of premiums and accretion of discounts. Interest income on inflation indexed securities, if any, is accrued daily based upon an inflation adjusted principal. Additionally, any increase or decrease in the principal or face amount of the securities adjusted for inflation is recorded as interest income or loss. Income is not recognized on securities for which collection is not expected. Non-cash dividends, if any, are recorded at the fair market value of the securities received. In determining the net gain or loss on securities sold, the cost of securities is determined on the identified cost basis.
Expenses
The majority of expenses of the Trust are directly identifiable to an individual fund. Expenses which are not readily identifiable to a specific fund are allocated taking into consideration, among other things, the nature and type of expense and the relative size of the funds.
Brown Brothers Harriman & Co. ("BBH") serves as custodian and fund accounting agent of the Fund. State Street Bank and Trust Company ("State Street") serves as transfer agent of the Fund. BBH and State Street's fees may be reduced by credits that are an earnings allowance calculated on the average daily cash balances the Fund maintains with each agent. Credit balances or expense reimbursements used to reduce fees, if any, are reported as a reduction of expenses in the Statement of Operations.
29
GMO Tax-Managed International Equities Fund
(A Series of GMO Trust)
Notes to Financial Statements — (Continued)
February 29, 2008
Investment risks
There are certain additional risks involved in investing in foreign securities that are not inherent in investments in U.S. securities. These risks may involve adverse political and economic developments including the possible imposition of capital controls or other foreign governmental laws or restrictions. In addition, the securities of some foreign companies and securities markets are less liquid and at times may be more volatile than securities of comparable U.S. companies and U.S. securities markets. The risks described above apply to an even greater extent to investments in emerging markets. The securities markets of emerging countries are generally smaller, less developed, less liquid, and more volatile than the securities markets of the U.S. and developed foreign markets.
Recently issued accounting pronouncements
In June 2006, the Financial Accounting Standards Board ("FASB") issued FASB Interpretation No. 48, Accounting for Uncertainty in Income Taxes - an Interpretation of FASB Statement No. 109 ("FIN 48"). FIN 48 clarifies the accounting for uncertainty in income taxes recognized in accordance with FASB Statement No. 109, Accounting for Income Taxes. FIN 48 prescribes a recognition threshold and measurement attribute for a tax position taken or expected to be taken in the tax return that could impact the Fund's financial statements. It also provides guidance in relation to the Fund's financial statements on classification of tax benefits or liabilities, interest and penalties, accounting in interim periods, disclosure, and transition. FIN 48 is effective for fiscal years beginning after December 15, 2006 for registered investment companies. Management has evaluated the effects of applying the various provisions of FIN 48 and has deter mined that the adoption of FIN 48 does not have a material effect on the Fund's financial statements. The Fund's federal tax returns for the prior three fiscal years remain subject to examination by the Internal Revenue Service. Management will continue to monitor the rules and guidance pertaining to FIN 48 and will take action if appropriate.
In September 2006, the FASB issued Statement of Financial Accounting Standards No. 157 ("FAS 157"), "Fair Value Measurements." FAS 157 defines fair value, establishes a framework for measuring fair value in accordance with generally accepted accounting principles and expands disclosure about fair value measurements. FAS 157 is effective for fiscal years beginning after November 15, 2007. Management is currently evaluating the impact the adoption of FAS 157 will have on the Fund's financial statement disclosures.
3. Fees and other transactions with affiliates
GMO earns a management fee paid monthly at the annual rate of 0.54% of average daily net assets. The Fund has adopted a Shareholder Service Plan under which the Fund pays GMO a shareholder service fee for client and shareholder service, reporting, and other support. Pursuant to the Shareholder Service Plan, the shareholder service fee is calculated based on average daily net assets at the annual rate of 0.15% for Class III shares.
30
GMO Tax-Managed International Equities Fund
(A Series of GMO Trust)
Notes to Financial Statements — (Continued)
February 29, 2008
The Manager has contractually agreed to reimburse the Fund for Fund expenses through at least June 30, 2008 to the extent the Fund's total annual operating expenses (excluding shareholder service fees, fees and expenses of the independent Trustees of the Trust, fees and expenses for legal services not approved by the Manager for the Trust, compensation and expenses of the Trust's Chief Compliance Officer ("CCO") (excluding any employee benefits), brokerage commissions, securities lending fees and expenses, interest expense, transfer taxes, and other investment-related costs (including expenses associated with investments in any company that is an investment company or would be an investment company under the 1940 Act, but for the exceptions to the definition of investment company provided in Section 3(c)(1) and 3(c)(7) of the 1940 Act), hedging transaction fees, extraordinary, non-recurring and certain other unusual expenses (in cluding taxes)) exceed 0.54% of the Fund's average daily net assets.
The Fund's portion of the fees paid by the Trust to the independent Trustees and CCO during the year ended February 29, 2008 was $11,427 and $5,033, respectively. The compensation and expenses of the CCO are included in miscellaneous expenses in the Statement of Operations. No remuneration was paid by the Fund to any other officer of the Trust.
4. Purchases and sales of securities
Cost of purchases and proceeds from sales of securities, excluding short-term investments, for the year ended February 29, 2008 aggregated $479,386,884 and $485,084,624, respectively.
5. Guarantees
In the normal course of business the Fund enters into contracts with third-party service providers that contain a variety of representations and warranties and which provide general indemnifications. The Fund's maximum exposure under these arrangements is unknown, as this would involve future claims that may be made against the Fund that have not yet occurred. Based on experience, management is of the view that the risk of loss in connection with these potential indemnification obligations is remote; however, there can be no assurance that material liabilities related to such obligations will not arise in the future that could adversely impact the Fund.
6. Principal shareholders and related parties
As of February 29, 2008, there were no shareholders individually holding in excess of 10% of the Fund's outstanding shares.
As of February 29, 2008, 1.89% of the Fund's shares were held by ten related parties comprised of certain GMO employee accounts, and 0.12% of the Fund's shares were held by accounts for which the Manager has investment discretion.
31
GMO Tax-Managed International Equities Fund
(A Series of GMO Trust)
Notes to Financial Statements — (Continued)
February 29, 2008
7. Share transactions
The Declaration of Trust permits the Trustees to issue an unlimited number of shares of beneficial interest (without par value). Transactions in Fund shares were as follows:
| Year Ended February 29, 2008 | Year Ended February 28, 2007 | ||||||||||||||||||
| Class III: | Shares | Amount | Shares | Amount | |||||||||||||||
| Shares sold | 4,630,804 | $ | 96,384,502 | 8,725,835 | $ | 171,811,462 | |||||||||||||
| Shares issued to shareholders in reinvestment of distributions | 6,034,152 | 126,532,299 | 2,416,494 | 47,334,895 | |||||||||||||||
| Shares repurchased | (5,588,860 | ) | (112,833,098 | ) | (3,218,183 | ) | (63,654,455 | ) | |||||||||||
| Net increase (decrease) | 5,076,096 | $ | 110,083,703 | 7,924,146 | $ | 155,491,902 | |||||||||||||
32
Report of Independent Registered Public Accounting Firm
To the Trustees of GMO Trust and the Shareholders of
GMO Tax-Managed International Equities Fund
In our opinion, the accompanying statement of assets and liabilities, including the schedule of investments, and the related statements of operations and of changes in net assets and the financial highlights present fairly, in all material respects, the financial position of GMO Tax-Managed International Equities Fund (the "Fund") at February 29, 2008, the results of its operations for the year then ended, the changes in its net assets for each of the two years in the period then ended and the financial highlights for each of the five years in the period then ended, in conformity with accounting principles generally accepted in the United States of America. These financial statements and financial highlights (hereafter referred to as "financial statements") are the responsibility of the Fund's management; our responsibility is to express an opinion on these financial statements based on our audits. We conducted our audits of the se financial statements in accordance with the standards of the Public Company Accounting Oversight Board (United States). Those standards require that we plan and perform the audit to obtain reasonable assurance about whether the financial statements are free of material misstatement. An audit includes examining, on a test basis, evidence supporting the amounts and disclosures in the financial statements, assessing the accounting principles used and significant estimates made by management, and evaluating the overall financial statement presentation. We believe that our audits, which included confirmation of securities at February 29, 2008 by correspondence with the custodian, provide a reasonable basis for our opinion.
PricewaterhouseCoopers LLP
Boston, Massachusetts
April 29, 2008
33
GMO Tax-Managed International Equities Fund
(A Series of GMO Trust)
Fund Expenses
February 29, 2008 (Unaudited)
Expense Examples: The following information is in relation to expenses for the six month period ended February 29, 2008.
As a shareholder of the Fund, you may incur two types of costs: (1) transaction costs, and (2) ongoing costs, including management fees, shareholder service fees and other Fund expenses. This example is intended to help you understand your ongoing costs (in dollars) of investing in the Fund and to compare these costs with the ongoing costs of investing in other mutual funds.
These examples are based on an investment of $1,000 invested at the beginning of the period and held for the entire period, September 1, 2007 through February 29, 2008.
Actual Expenses
The first line of the table below provides information about actual account values and actual expenses. You may use the information in this line, together with the amount you invested, to estimate the expenses that you paid over the period. Simply divide your account value by $1,000 (for example, a $5,000,000 account value divided by $1,000 = 5,000), then multiply the result by the number in the first line under the heading entitled "Net Expense Incurred" to estimate the expenses you paid on your account during this period.
Hypothetical Example for Comparison Purposes
The second line of the table below provides information about hypothetical account values and hypothetical expenses based on the Fund's actual expense ratio and an assumed rate of return of 5% per year before expenses, which is not the Fund's actual return. The hypothetical account values and expenses may not be used to estimate the actual ending account balance or expenses you paid for the period. You may use this information to compare the ongoing costs of investing in the Fund with other funds. To do so, compare this 5% hypothetical example with the 5% hypothetical examples that appear in the shareholder reports of other funds.
Please note that the expenses shown in the table are meant to highlight your ongoing costs only and do not reflect any transactional costs. Therefore, the second line of the table is useful in comparing ongoing costs only, and will not help you determine the relative total costs of owning different funds. In addition, if these transactional costs were included, your costs would have been higher.
| Annualized Net Expense Ratio | Beginning Account Value | Ending Account Value | Net Expense Incurred* | ||||||||||||||||
| Class III | |||||||||||||||||||
| 1) Actual | 0.69 | % | $ | 1,000.00 | $ | 942.10 | $ | 3.33 | |||||||||||
| 2) Hypothetical | 0.69 | % | $ | 1,000.00 | $ | 1,021.43 | $ | 3.47 | |||||||||||
* Expenses are calculated using the Class's annualized net expense ratio for the six months ended February 29, 2008, multiplied by the average account value over the period, multiplied by 182 days in the period, divided by 366 days in the year.
34
GMO Tax-Managed International Equities Fund
(A Series of GMO Trust)
Tax Information for the Tax Year ended February 29, 2008 (Unaudited)
The Fund will notify shareholders of amounts for use in preparing 2008 income tax forms in January 2009.
The Fund's distributions to shareholders include $107,183,276 from long-term capital gains.
During the year ended February 29, 2008, the Fund paid foreign taxes of $3,690,227 and recognized foreign source income of $39,071,890.
For taxable, non-corporate shareholders, 76.51% of the income and short-term capital gains, if any, distributed in the Fund's fiscal year ended February 29, 2008 represents qualified dividend income subject to the 15% rate category.
The Fund hereby designates as qualified interest income and qualified short-term capital gains with respect to its taxable year ended February 29, 2008, $413,420 and $11,265,425, respectively, or if determined to be different, the qualified interest income and qualified short-term gains of such year.
35
Trustees and Officers (Unaudited)
The following tables list the Trust's Trustees and Officers as of the date of this report; their address and date of birth ("DOB"); their position with the Trust; the length of time holding that position with the Trust; their principal occupation(s) during the past five years; the number of portfolios in the fund complex they oversee; and other directorships they hold in companies subject to registration or reporting requirements of the Securities Exchange Act of 1934 (generally called "public companies") or in registered investment companies. The Trust's Statement of Additional Information ("SAI") includes additional information about the Trust's trustees, including changes subsequent to the date of the report. The SAI is available, without charge, upon request by writing GMO, c/o GMO Trust, 40 Rowes Wharf, Boston, MA 02110.
Independent Trustees:
| Name, Address, and DOB | Position(s) Held with Trust | Term of Office1 and Length of Time Served | Principal Occupation(s) During Past Five Years | Number of Portfolios in Fund Complex Overseen by Trustee | Other Directorships Held by Trustee | ||||||||||||||||||
| Donald W. Glazer, Esq. c/o GMO Trust 40 Rowes Wharf Boston, MA 02110 DOB: 07/26/1944 | Chairman of the Board of Trustees | Chairman of the Board of Trustees since March 2005; Lead Independent Trustee (September 2004 – March 2005); Trustee since December 2000. | Consultant – Law and Business2; Vice Chair (since 2002) and Secretary, Provant, Inc. (provider of personnel performance improvement services and training products); Author of Legal Treatises. | 47 | None. | ||||||||||||||||||
1 Each Trustee is elected to serve during the continued lifetime of the Trust until he/she dies, resigns or is removed, or if sooner, until the next meeting of Shareholders called for the purpose of electing Trustees and until the election and qualification of his/her successor.
2 As part of Mr. Glazer's work as a consultant, he provides part-time consulting services to Goodwin Procter LLP ("Goodwin"). Goodwin has provided legal services to Renewable Resources, LLC, an affiliate of GMO; GMO, in connection with its relationship with Renewable Resources; and funds managed by Renewable Resources. Mr. Glazer has represented that he has no financial interest in, and is not involved in the provision of, such legal services. In the calendar years ended December 31, 2006 and December 31, 2007, these entities paid $825,738 and $291,721 respectively, in legal fees and disbursements to Goodwin.
36
Independent Trustees — (Continued)
| Name, Address, and DOB | Position(s) Held with Trust | Term of Office1 and Length of Time Served | Principal Occupation(s) During Past Five Years | Number of Portfolios in Fund Complex Overseen by Trustee | Other Directorships Held by Trustee | ||||||||||||||||||
| Jay O. Light c/o GMO Trust 40 Rowes Wharf Boston, MA 02110 DOB: 10/03/1941 | Trustee | Since May 1996. | Dean (since April 2006), Acting Dean (August 2005 – April 2006), Senior Associate Dean (1998 – 2005), and Professor of Business Administration, Harvard Business School. | 47 | Director of Harvard Management Company, Inc.3 and Verde, Inc.; Director of Partners HealthCare System, Inc. and Chair of its Investment Committee.4 | ||||||||||||||||||
| W. Nicholas Thorndike c/o GMO Trust 40 Rowes Wharf Boston, MA 02110 DOB: 03/28/1933 | Trustee | Since March 2005. | Director or trustee of various corporations and charitable organizations, including Courier Corporation (a book publisher and manufacturer) (July 1989 – present); Putnam Funds (December 1992 – June 2004); and Providence Journal (a newspaper publisher) (December 1986 – December 2003). | 47 | Director of Courier Corporation (a book publisher and manufacturer); Member of the Investment Committee of Partners HealthCare System, Inc.4 | ||||||||||||||||||
1 Each Trustee is elected to serve during the continued lifetime of the Trust until he/she dies, resigns or is removed, or if sooner, until the next meeting of Shareholders called for the purpose of electing Trustees and until the election and qualification of his/her successor.
3 Harvard Management Company, Inc. is a client of the Manager.
4 Partners HealthCare System, Inc. is a client of the Manager.
37
Principal Officers:
| Name, Address, and DOB | Position(s) Held with Trust | Term of Office5 and Length of Time Served | Principal Occupation(s) During Past Five Years | ||||||||||||
| Scott Eston c/o GMO Trust 40 Rowes Wharf Boston, MA 02110 DOB: 01/20/1956 | President and Chief Executive Officer | President and Chief Executive Officer since October 2002; Chief Financial Officer, November 2006 – February 2007. | Chief Financial Officer, Chief Operating Officer and Member, Grantham, Mayo, Van Otterloo & Co. LLC. | ||||||||||||
| Sheppard N. Burnett c/o GMO Trust 40 Rowes Wharf Boston, MA 02110 DOB: 10/24/1968 | Treasurer and Chief Financial Officer | Chief Financial Officer since March 2007; Treasurer since November 2006; Assistant Treasurer, September 2004 – November 2006. | Fund Administration Staff, Grantham, Mayo, Van Otterloo & Co. LLC (June 2004 – present); Vice President, Director of Tax, Columbia Management Group (2002 – 2004). | ||||||||||||
| Brent C. Arvidson c/o GMO Trust 40 Rowes Wharf Boston, MA 02110 DOB: 06/26/1969 | Assistant Treasurer | Since August 1998. | Senior Fund Administrator, Grantham, Mayo, Van Otterloo & Co. LLC. | ||||||||||||
| John L. Nasrah c/o GMO Trust 40 Rowes Wharf Boston, MA 02110 DOB: 05/27/1977 | Assistant Treasurer | Since March 2007. | Fund Administrator, Grantham, Mayo, Van Otterloo & Co. LLC (September 2004 – present); Tax Analyst, Bain & Company, Inc (June 2003 – September 2004); Senior Tax Associate, PricewaterhouseCoopers LLP (2001 – 2003). | ||||||||||||
| Mahmoodur Rahman c/o GMO Trust 40 Rowes Wharf Boston, MA 02110 DOB: 11/30/1967 | Assistant Treasurer | Since September 2007. | Fund Administrator, Grantham, Mayo, Van Otterloo & Co. (April 2007 – present); Vice President and Senior Tax Manager, Massachusetts Financial Services Company (January 2000 – April 2007). | ||||||||||||
5 Officers are elected to hold such office until their successor is elected and qualified to carry out the duties and responsibilities of their office, or until he or she resigns or is removed from office.
38
Principal Officers — (Continued)
| Name, Address, and DOB | Position(s) Held with Trust | Term of Office5 and Length of Time Served | Principal Occupation(s) During Past Five Years | ||||||||||||
| Michael E. Gillespie c/o GMO Trust 40 Rowes Wharf Boston, MA 02110 DOB: 02/18/1958 | Chief Compliance Officer | Since March 2005. | Vice President of Compliance (June 2004 – February 2005) and Director of Domestic Compliance (March 2002 – June 2004), Fidelity Investments; Vice President and Senior Counsel, State Street Bank and Trust Company (May 1998 – March 2002). | ||||||||||||
| Jason B. Harrison c/o GMO Trust 40 Rowes Wharf Boston, MA 02110 DOB: 01/29/1977 | Vice President and Clerk | Vice President since November 2006; Clerk since March 2006. | Legal Counsel, Grantham, Mayo, Van Otterloo & Co. LLC (since February 2006) and Attorney, Ropes & Gray LLP (September 2002 – February 2006). | ||||||||||||
| David L. Bohan c/o GMO Trust 40 Rowes Wharf Boston, MA 02110 DOB: 06/21/1964 | Vice President and Assistant Clerk | Vice President since March 2005; Assistant Clerk since March 2006. | Legal Counsel, Grantham, Mayo, Van Otterloo & Co. LLC (September 2003-present); Attorney, Goodwin Procter LLP (September 1996 – September 2003). | ||||||||||||
| Gregory L. Pottle c/o GMO Trust 40 Rowes Wharf Boston, MA 02110 DOB: 07/09/1971 | Vice President and Assistant Clerk | Since November 2006. | Legal Counsel, Grantham, Mayo, Van Otterloo & Co. LLC. | ||||||||||||
| Anne K. Trinque c/o GMO Trust 40 Rowes Wharf Boston, MA 02110 DOB: 04/15/1978 | Vice President and Assistant Clerk | Since September 2007. | Legal Counsel, Grantham, Mayo, Van Otterloo & Co. LLC (since January 2007); Attorney, Goodwin Procter LLP (September 2003 – January 2007). | ||||||||||||
| Cheryl Wakeham c/o GMO Trust 40 Rowes Wharf Boston, MA 02110 DOB: 10/29/1958 | Anti-Money Laundering Officer | Since December 2004. | Manager, Client Service Administration, Grantham, Mayo, Van Otterloo & Co. LLC. | ||||||||||||
5 Officers are elected to hold such office until their successor is elected and qualified to carry out the duties and responsibilities of their office, or until he or she resigns or is removed from office.
39
GMO Domestic Bond Fund
(A Series of GMO Trust)
Annual Report
February 29, 2008
For a free copy of the Fund's proxy voting guidelines, shareholders may call 1-617-346-7646 (collect), visit our website at www.gmo.com, or visit the Securities and Exchange Commission's website at www.sec.gov. Information regarding how the Fund voted proxies relating to portfolio securities during the most recent 12-month period ended June 30 is available on our website at www.gmo.com, or on the Securities and Exchange Commission's website at www.sec.gov.
The Fund files its complete schedule of portfolio holdings with the Securities and Exchange Commission for the first and third quarter of each fiscal year on Form N-Q, which is available on the Commission's website at www.sec.gov. The Fund's Form N-Q may be reviewed and copied at the Commission's Public Reference Room in Washington, D.C. Information on the operation of the Public Reference Room may be obtained by calling 1-800-SEC-0330. The Fund has a policy with respect to disclosure of portfolio holdings under which it may also make available on GMO's website (www.gmo.com) a complete schedule of portfolio holdings.
This report is prepared for the general information of shareholders. It is authorized for distribution to prospective investors only when preceded or accompanied by a prospectus for the GMO Trust.
GMO Domestic Bond Fund
(A Series of GMO Trust)
Portfolio Management
Day-to-day management of the Fund's portfolio is the responsibility of the Fixed Income Division at Grantham, Mayo, Van Otterloo & Co. LLC.
Management Discussion and Analysis of Fund Performance
The Class III shares of the GMO Domestic Bond Fund returned +4.4% for the fiscal year ended February 29, 2008, as compared with the +10.7% return of the Lehman Brothers U.S. Government Index.
The Fund underperformed the benchmark during the fiscal year by 6.4%. The year's underperformance stemmed from mark-to-market losses in the cash collateral pool in which the strategy invests a substantial portion of its total assets, the GMO Short Duration Collateral Fund (SDCF). SDCF primarily invests in high quality U.S. and foreign floating-rate fixed income securities, mainly asset-backed securities, in order to earn a LIBOR-type return. The SDCF investment collateralizes derivatives positions, mainly U.S. Treasury bond futures and interest-rate swaps, which seek to deliver the price return of the benchmark, which has an approximately 5-year duration.
With the extreme price volatility of AAA-credit quality asset-backed securities during the year, SDCF underperformed LIBOR by nearly 700 bps, directly contributing to the Fund's underperformance, given the latter's 94% exposure to the former.
The views expressed herein are exclusively those of Grantham, Mayo, Van Otterloo & Co. LLC Management as of the date of this report and are subject to change. GMO disclaims any responsibility to update such views. They are not meant as investment advice.
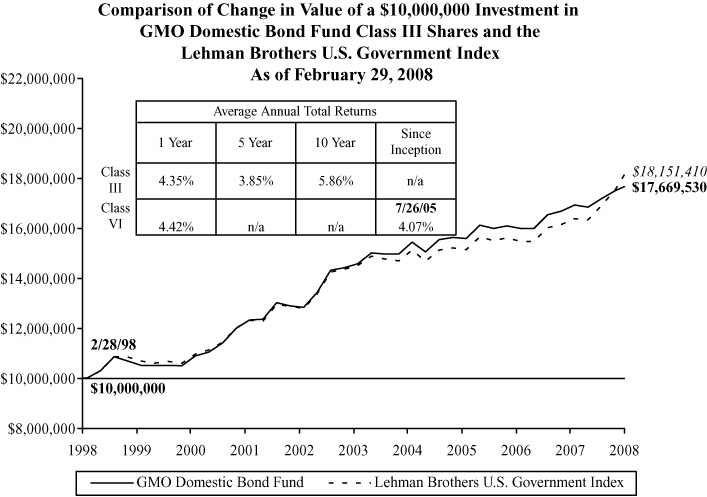
Performance data quoted represents past performance and is not indicative of future results. The investment return and principal value of an investment will fluctuate so that an investor's shares, when redeemed, may be worth more or less than their original cost. Current performance data may be lower or higher than the performance data provided herein. To obtain performance information to the most recent month-end, visit www.gmo.com. Performance shown is net of all fees after reimbursement from the Manager. Returns would have been lower had certain expenses not been reimbursed during the periods shown and do not include the effect of taxes on distributions and redemptions. All information is unaudited. Performance for Class VI shares will vary due to different fees.
GMO Domestic Bond Fund
(A Series of GMO Trust)
Investments Concentration Summary
February 29, 2008 (Unaudited)
| Asset Class Summary* | % of Total Net Assets | ||||||
| Debt Obligations | 89.6 | % | |||||
| Short-Term Investments | 9.6 | ||||||
| Futures | 0.6 | ||||||
| Swaps | 0.3 | ||||||
| Preferred Stocks | 0.2 | ||||||
| Forward Currency Contracts | (0.0 | ) | |||||
| Other | (0.3 | ) | |||||
| 100.0 | % | ||||||
* The table above incorporates aggregate indirect asset class exposure associated with investments in other funds of GMO Trust ("underlying funds").
1
GMO Domestic Bond Fund
(A Series of GMO Trust)
Schedule of Investments
(showing percentage of total net assets)
February 29, 2008
| Par Value ($) / Shares | Description | Value ($) | |||||||||||||
| DEBT OBLIGATIONS — 4.6% | |||||||||||||||
| Corporate Debt — 1.5% | |||||||||||||||
| 11,347,000 | Health Care Property Investors, Inc., Series G, MTN, 5.63%, due 02/28/13 | 10,480,770 | |||||||||||||
| U.S. Government Agency — 3.1% | |||||||||||||||
| 9,500,000 | Agency for International Development Floater (Support of India), Variable Rate, 3 mo. LIBOR + .10%, 3.34%, due 02/01/27 | 9,440,720 | |||||||||||||
| 3,500,000 | Agency for International Development Floater (Support of Jamaica), Variable Rate, 6 mo. LIBOR + .30%, 3.36%, due 12/01/14 | 3,508,785 | |||||||||||||
| 3,615,987 | Agency for International Development Floater (Support of Jamaica), Variable Rate, 6 mo. U.S. Treasury Bill + .75%, 2.88%, due 03/30/19 | 3,631,861 | |||||||||||||
| 3,127,500 | Agency for International Development Floater (Support of Sri Lanka), Variable Rate, 6 mo. LIBOR + .20%, 3.26%, due 06/15/12 | 3,123,622 | |||||||||||||
| 2,933,338 | Agency for International Development Floater (Support of Zimbabwe), Variable Rate, 3 mo. U.S. Treasury Bill x 115%, 4.04%, due 01/01/12 | 2,902,174 | |||||||||||||
| Total U.S. Government Agency | 22,607,162 | ||||||||||||||
| TOTAL DEBT OBLIGATIONS (COST $34,049,348) | 33,087,932 | ||||||||||||||
| PREFERRED STOCKS — 0.2% | |||||||||||||||
| Banking — 0.2% | |||||||||||||||
| 10,000 | Home Ownership Funding 2 Preferred 144A, 13.34% | 1,544,497 | |||||||||||||
| TOTAL PREFERRED STOCKS (COST $2,576,211) | 1,544,497 | ||||||||||||||
| MUTUAL FUNDS — 93.5% | |||||||||||||||
| Affiliated Issuers — 93.5% | |||||||||||||||
| 28,243,201 | GMO Short-Duration Collateral Fund | 678,684,117 | |||||||||||||
| 1,483 | GMO Special Purpose Holding Fund (a) (b) | 1,868 | |||||||||||||
| TOTAL MUTUAL FUNDS (COST $717,109,114) | 678,685,985 | ||||||||||||||
See accompanying notes to the financial statements.
2
GMO Domestic Bond Fund
(A Series of GMO Trust)
Schedule of Investments — (Continued)
(showing percentage of total net assets)
February 29, 2008
| Shares / Par Value ($) | Description | Value ($) | |||||||||||||
| SHORT-TERM INVESTMENTS — 1.2% | |||||||||||||||
| Money Market Funds — 0.2% | |||||||||||||||
| 1,624,043 | State Street Institutional Liquid Reserves Fund-Institutional Class | 1,624,043 | |||||||||||||
| Other Short-Term Investments — 1.0% | |||||||||||||||
| 7,000,000 | U.S. Treasury Bill, 2.05%, due 04/17/08 (c) (d) | 6,981,265 | |||||||||||||
| TOTAL SHORT-TERM INVESTMENTS (COST $8,605,308) | 8,605,308 | ||||||||||||||
| TOTAL INVESTMENTS — 99.5% (Cost $762,339,981) | 721,923,722 | ||||||||||||||
| Other Assets and Liabilities (net) — 0.5% | 3,888,055 | ||||||||||||||
| TOTAL NET ASSETS — 100.0% | $ | 725,811,777 | |||||||||||||
See accompanying notes to the financial statements.
3
GMO Domestic Bond Fund
(A Series of GMO Trust)
Schedule of Investments — (Continued)
February 29, 2008
A summary of outstanding financial instruments at February 29, 2008 is as follows:
Futures Contracts
| Number of Contracts | Type | Expiration Date | Contract Value | Net Unrealized Appreciation (Depreciation) | |||||||||||||||
| Buys | |||||||||||||||||||
| 514 | U.S. Long Bond (CBT) | June 2008 | $ | 60,973,250 | $ | 1,380,203 | |||||||||||||
| 733 | U.S. Treasury Note 10 Yr. | June 2008 | 85,967,156 | 1,533,047 | |||||||||||||||
| 260 | U.S. Treasury Note 2 Yr. (CBT) | June 2008 | 55,879,688 | 365,033 | |||||||||||||||
| 712 | U.S. Treasury Note 5 Yr. (CBT) | June 2008 | 81,346,000 | 1,094,189 | |||||||||||||||
| $ | 284,166,094 | $ | 4,372,472 | ||||||||||||||||
Swap Agreements
Credit Default Swaps
| Notional Amount | Expiration Date | Counterparty | Receive (Pay) | Annual Premium | Deliverable On Default | Market Value | |||||||||||||||||||||||||
| 11,500,000 | USD | 3/20/2013 | Barclays Bank PLC | (Pay) | 0.61 | % | Health Care Properties | $ | 1,670,597 | ||||||||||||||||||||||
| Premiums to (Pay) Receive | $ | — | $ | 1,670,597 | |||||||||||||||||||||||||||
Total Return Swaps
| Notional Amount | Expiration Date | Counterparty | Pay | Receive | Market Value | ||||||||||||||||||||||
| 75,000,000 | USD | 5/30/2008 | Lehman Brothers | 1 month | Return on Lehman | ||||||||||||||||||||||
| LIBOR - 0.06% | Brothers U.S. | ||||||||||||||||||||||||||
| Government Index | $ | 543,947 | |||||||||||||||||||||||||
| 75,000,000 | USD | 6/30/2008 | Lehman Brothers | 1 month LIBOR - 0.06% | Return on Lehman Brothers U.S. Government Index | 543,947 | |||||||||||||||||||||
| 175,000,000 | USD | 7/31/2008 | Lehman Brothers | 1 month LIBOR - 0.05% | Return on Lehman Brothers U.S. Government Index | 1,267,847 | |||||||||||||||||||||
| Premiums to (Pay) Receive | $ | — | $ | 2,355,741 | |||||||||||||||||||||||
As of February 29, 2008, for the futures and/or swap contracts held, the Fund had sufficient cash and/or securities to cover any commitments or margin requirements of the relevant broker or exchange.
See accompanying notes to the financial statements.
4
GMO Domestic Bond Fund
(A Series of GMO Trust)
Schedule of Investments — (Continued)
February 29, 2008
Notes to Schedule of Investments:
144A - Securities exempt from registration under Rule 144A of the Securities Act of 1933. These securities may be resold in transactions exempt from registration, normally to qualified institutional investors.
LIBOR - London Interbank Offered Rate
MTN - Medium Term Note
Variable rate - The rates shown on variable rate notes are the current interest rates at February 29, 2008, which are subject to change based on the terms of the security.
(a) Security valued at fair value using methods determined in good faith by or at the direction of the Trustees of GMO Trust (Note 2).
(b) Underlying investment represents interests in defaulted securities.
(c) Rate shown represents yield-to-maturity.
(d) All or a portion of this security has been segregated to cover margin requirements on open financial futures contracts and/or collateral on open swap contracts (Note 2).
Currency Abbreviations:
USD - United States Dollar
See accompanying notes to the financial statements.
5
GMO Domestic Bond Fund
(A Series of GMO Trust)
Statement of Assets and Liabilities — February 29, 2008
| Assets: | |||||||
| Investments in unaffiliated issuers, at value (cost $45,230,867) (Note 2) | $ | 43,237,737 | |||||
| Investments in affiliated issuers, at value (cost $717,109,114) (Notes 2 and 8) | 678,685,985 | ||||||
| Receivable for Fund shares sold | 7,226,835 | ||||||
| Interest receivable | 174,452 | ||||||
| Receivable for variation margin on open futures contracts (Note 2) | 3,151,391 | ||||||
| Receivable for open swap contracts (Note 2) | 4,026,338 | ||||||
| Receivable for expenses reimbursed by Manager (Note 3) | 24,795 | ||||||
| Total assets | 736,527,533 | ||||||
| Liabilities: | |||||||
| Payable for investments purchased | 3,200,000 | ||||||
| Payable for Fund shares repurchased | 7,325,536 | ||||||
| Payable to affiliate for (Note 3): | |||||||
| Management fee | 57,977 | ||||||
| Shareholder service fee | 42,253 | ||||||
| Trustees and Chief Compliance Officer of GMO Trust fees | 820 | ||||||
| Accrued expenses | 89,170 | ||||||
| Total liabilities | 10,715,756 | ||||||
| Net assets | $ | 725,811,777 | |||||
| Net assets consist of: | |||||||
| Paid-in capital | $ | 753,581,944 | |||||
| Accumulated undistributed net investment income | 8,256,225 | ||||||
| Accumulated net realized loss | (4,008,943 | ) | |||||
| Net unrealized depreciation | (32,017,449 | ) | |||||
| $ | 725,811,777 | ||||||
| Net assets attributable to: | |||||||
| Class III shares | $ | 144,285,975 | |||||
| Class VI shares | $ | 581,525,802 | |||||
| Shares outstanding: | |||||||
| Class III | 15,240,587 | ||||||
| Class VI | 61,345,803 | ||||||
| Net asset value per share: | |||||||
| Class III | $ | 9.47 | |||||
| Class VI | $ | 9.48 | |||||
See accompanying notes to the financial statements.
6
GMO Domestic Bond Fund
(A Series of GMO Trust)
Statement of Operations — Year Ended February 29, 2008
| Investment Income: | |||||||
| Dividends from affiliated issuers (Note 8) | $ | 30,714,141 | |||||
| Interest | 3,278,348 | ||||||
| Dividends | 176,922 | ||||||
| Total investment income | 34,169,411 | ||||||
| Expenses: | |||||||
| Management fee (Note 3) | 601,686 | ||||||
| Shareholder service fee – Class III (Note 3) | 209,135 | ||||||
| Shareholder service fee – Class VI (Note 3) | 254,244 | ||||||
| Custodian, fund accounting agent and transfer agent fees | 80,665 | ||||||
| Audit and tax fees | 59,732 | ||||||
| Legal fees | 14,778 | ||||||
| Trustees fees and related expenses (Note 3) | 5,572 | ||||||
| Registration fees | 11,433 | ||||||
| Miscellaneous | 8,642 | ||||||
| Total expenses | 1,245,887 | ||||||
| Fees and expenses reimbursed by Manager (Note 3) | (170,750 | ) | |||||
| Expense reductions (Note 2) | (13 | ) | |||||
| Net expenses | 1,075,124 | ||||||
| Net investment income (loss) | 33,094,287 | ||||||
| Realized and unrealized gain (loss): | |||||||
| Net realized gain (loss) on: | |||||||
| Investments in unaffiliated issuers | 1,131,740 | ||||||
| Investments in affiliated issuers | (1,557,671 | ) | |||||
| Realized gains distributions from affiliated issuers (Note 8) | 9,616 | ||||||
| Closed futures contracts | 4,008,720 | ||||||
| Closed swap contracts | 28,704,279 | ||||||
| Net realized gain (loss) | 32,296,684 | ||||||
| Change in net unrealized appreciation (depreciation) on: | |||||||
| Investments in unaffiliated issuers | (1,345,761 | ) | |||||
| Investments in affiliated issuers | (40,220,737 | ) | |||||
| Open futures contracts | 4,994,900 | ||||||
| Open swap contracts | (688,510 | ) | |||||
| Net unrealized gain (loss) | (37,260,108 | ) | |||||
| Net realized and unrealized gain (loss) | (4,963,424 | ) | |||||
| Net increase (decrease) in net assets resulting from operations | $ | 28,130,863 | |||||
See accompanying notes to the financial statements.
7
GMO Domestic Bond Fund
(A Series of GMO Trust)
Statement of Changes in Net Assets
| Year Ended February 29, 2008 | Year Ended February 28, 2007 | ||||||||||
| Increase (decrease) in net assets: | |||||||||||
| Operations: | |||||||||||
| Net investment income (loss) | $ | 33,094,287 | $ | 20,918,305 | |||||||
| Net realized gain (loss) | 32,296,684 | (3,832,373 | ) | ||||||||
| Change in net unrealized appreciation (depreciation) | (37,260,108 | ) | 4,109,168 | ||||||||
| Net increase (decrease) in net assets from operations | 28,130,863 | 21,195,100 | |||||||||
| Distributions to shareholders from: | |||||||||||
| Net investment income | |||||||||||
| Class III | (11,697,331 | ) | (4,864,279 | ) | |||||||
| Class VI | (41,858,762 | ) | (16,195,086 | ) | |||||||
| Total distributions from net investment income | (53,556,093 | ) | (21,059,365 | ) | |||||||
| Net share transactions (Note 7): | |||||||||||
| Class III | 55,468,188 | (31,467,198 | ) | ||||||||
| Class VI | 273,813,697 | (31,859,527 | ) | ||||||||
| Increase (decrease) in net assets resulting from net share transactions | 329,281,885 | (63,326,725 | ) | ||||||||
| Total increase (decrease) in net assets | 303,856,655 | (63,190,990 | ) | ||||||||
| Net assets: | |||||||||||
| Beginning of period | 421,955,122 | 485,146,112 | |||||||||
| End of period (including accumulated undistributed net investment income of $8,256,225 and $10,334, respectively) | $ | 725,811,777 | $ | 421,955,122 | |||||||
See accompanying notes to the financial statements.
8
GMO Domestic Bond Fund
(A Series of GMO Trust)
Financial Highlights
(For a Class III share outstanding throughout each period)
| Year Ended February 28/29, | |||||||||||||||||||||||
| 2008 | 2007 | 2006 | 2005 | 2004 | |||||||||||||||||||
| Net asset value, beginning of period | $ | 9.81 | $ | 9.81 | $ | 9.84 | $ | 10.07 | $ | 10.08 | |||||||||||||
| Income (loss) from investment operations: | |||||||||||||||||||||||
| Net investment income (loss)(a)† | 0.42 | 0.43 | 0.13 | 0.16 | 0.23 | ||||||||||||||||||
| Net realized and unrealized gain (loss) | (0.01 | ) | 0.06 | 0.16 | 0.04 | 0.24 | |||||||||||||||||
| Total from investment operations | 0.41 | 0.49 | 0.29 | 0.20 | 0.47 | ||||||||||||||||||
| Less distributions to shareholders: | |||||||||||||||||||||||
| From net investment income | (0.75 | ) | (0.49 | ) | (0.16 | ) | (0.16 | ) | (0.20 | ) | |||||||||||||
| From net realized gains | — | — | (0.16 | ) | (0.27 | ) | (0.28 | ) | |||||||||||||||
| Return of capital | — | — | — | (0.00 | )(b) | — | |||||||||||||||||
| Total distributions | (0.75 | ) | (0.49 | ) | (0.32 | ) | (0.43 | ) | (0.48 | ) | |||||||||||||
| Net asset value, end of period | $ | 9.47 | $ | 9.81 | $ | 9.81 | $ | 9.84 | $ | 10.07 | |||||||||||||
| Total Return(c) | 4.35 | % | 5.09 | % | 3.02 | % | 2.02 | % | 4.79 | % | |||||||||||||
| Ratios/Supplemental Data: | |||||||||||||||||||||||
| Net assets, end of period (000's) | $ | 144,286 | $ | 94,159 | $ | 125,188 | $ | 736,300 | $ | 373,277 | |||||||||||||
| Net expenses to average daily net assets(d) | 0.25 | %(e) | 0.25 | % | 0.25 | % | 0.25 | % | 0.25 | % | |||||||||||||
| Net investment income to average daily net assets(a) | 4.28 | % | 4.42 | % | 1.30 | % | 1.57 | % | 2.30 | % | |||||||||||||
| Portfolio turnover rate | 22 | % | 17 | % | 24 | % | 11 | % | 15 | % | |||||||||||||
| Fees and expenses reimbursed by the Manager to average daily net assets: | 0.03 | % | 0.03 | % | 0.02 | % | 0.03 | % | 0.06 | % | |||||||||||||
(a) Net investment income is affected by timing of the declaration of dividends by the underlying funds in which the Fund invests.
(b) Return of capital is less than $0.01.
(c) The total returns would have been lower had certain expenses not been reimbursed during the periods shown and assumes the effect of reinvested distributions.
(d) Net expenses exclude expenses incurred indirectly through investment in the underlying funds (See Note 3).
(e) The net expense ratio does not include the effect of expense reductions.
† Calculated using average shares outstanding throughout the period.
See accompanying notes to the financial statements.
9
GMO Domestic Bond Fund
(A Series of GMO Trust)
Financial Highlights
(For a Class VI share outstanding throughout each period)
| Year Ended February 28/29, | |||||||||||||||
| 2008 | 2007 | 2006(a) | |||||||||||||
| Net asset value, beginning of period | $ | 9.82 | $ | 9.82 | $ | 9.93 | |||||||||
| Income (loss) from investment operations: | |||||||||||||||
| Net investment income (loss)(b)† | 0.57 | 0.48 | 0.24 | ||||||||||||
| Net realized and unrealized gain (loss) | (0.15 | ) | 0.02 | (0.14 | )(c) | ||||||||||
| Total from investment operations | 0.42 | 0.50 | 0.10 | ||||||||||||
| Less distributions to shareholders: | |||||||||||||||
| From net investment income | (0.76 | ) | (0.50 | ) | (0.21 | ) | |||||||||
| Total distributions | (0.76 | ) | (0.50 | ) | (0.21 | ) | |||||||||
| Net asset value, end of period | $ | 9.48 | $ | 9.82 | $ | 9.82 | |||||||||
| Total Return(d) | 4.42 | % | 5.19 | % | 0.97 | %** | |||||||||
| Ratios/Supplemental Data: | |||||||||||||||
| Net assets, end of period (000's) | $ | 581,526 | $ | 327,796 | $ | 359,958 | |||||||||
| Net expenses to average daily net assets(e) | 0.16 | %(f) | 0.16 | % | 0.16 | %* | |||||||||
| Net investment income to average daily net assets(b) | 5.87 | % | 4.85 | % | 2.38 | %(g) | |||||||||
| Portfolio turnover rate | 22 | % | 17 | % | 24 | %†† | |||||||||
| Fees and expenses reimbursed by the Manager to average daily net assets: | 0.03 | % | 0.03 | % | 0.02 | %* | |||||||||
(a) Period from July 26, 2005 (commencement of operations) through February 28, 2006.
(b) Net investment income is affected by timing of the declaration of dividends by the underlying funds in which the Fund invests.
(c) The amount shown for a share outstanding does not correspond with the aggregate net realized and unrealized gain (loss) on investments due to the timing of purchases and redemptions of Fund shares in relation to fluctuating market values of the investments of the Fund.
(d) The total return would have been lower had certain expenses not been reimbursed during the periods shown and assumes the effect of reinvested distributions.
(e) Net expenses exclude expenses incurred indirectly through investment in the underlying funds (See Note 3).
(f) The net expense ratio does not include the effect of expense reductions.
(g) The ratio for the period ended February 28, 2006 has not been annualized since the Fund believes it would not be appropriate because the Fund's net income is not earned ratably throughout the fiscal year.
† Calculated using average shares outstanding throughout the period.
* Annualized.
** Not annualized.
†† Calculation represents portfolio turnover of the Fund for the year ended February 28, 2006.
See accompanying notes to the financial statements.
10
GMO Domestic Bond Fund
(A Series of GMO Trust)
Notes to Financial Statements
February 29, 2008
1. Organization
GMO Domestic Bond Fund (the "Fund") is a series of GMO Trust (the "Trust"). The Fund is registered under the Investment Company Act of 1940, as amended, as an open-end, non-diversified management investment company. The Fund is advised and managed by Grantham, Mayo, Van Otterloo & Co. LLC (the "Manager" or "GMO"). The Trust was established as a Massachusetts business trust under the laws of the Commonwealth of Massachusetts on June 24, 1985. The Declaration of Trust permits the Trustees of the Trust ("Trustees") to create an unlimited number of series of shares ("Funds") and to subdivide Funds into classes.
The Fund seeks total return in excess of that of the Lehman Brothers U.S. Government Index. The Fund invests a substantial portion of its assets in shares of GMO Short-Duration Collateral Fund; U.S. investment-grade bonds, including asset-backed securities and U.S. government securities; and derivatives (including synthetic debt instruments) whose value is related to U.S. investment-grade bonds. The Fund also may invest a portion of its assets in foreign bonds and lower-rated securities.
As of February 29, 2008, the Fund had two classes of shares outstanding: Class III and Class VI. Each class of shares bears a different level of shareholder servicing fees.
The financial statements of the series of the Trust in which the Fund invests ("underlying funds") should be read in conjunction with the Fund's financial statements. These financial statements are available, without charge, upon request, by calling (617) 346-7646 (collect). Shares of the GMO Short-Duration Collateral Fund and the GMO Special Purpose Holding Fund are not publicly available for direct purchase.
2. Significant accounting policies
The following is a summary of significant accounting policies which are in conformity with accounting principles generally accepted in the United States of America ("U.S. GAAP") and which are consistently followed by the Fund in the preparation of its financial statements. The preparation of financial statements in accordance with U.S. GAAP requires management to make estimates and assumptions that affect the reported amounts and disclosures in the financial statements. Actual results could differ from those estimates. The accounting records of the Fund are maintained in U.S. dollars.
Portfolio valuation
Securities listed on a securities exchange for which market quotations are readily available are valued at the last sale price or official closing price on each business day, or if there is no such reported sale or official closing price, at the most recent quoted bid price. Unlisted securities for which market quotations are readily available are generally valued at the most recent quoted bid price. Short-term investments with a remaining maturity of sixty days or less are generally valued at amortized cost, which approximates fair value. Shares of investment funds are valued at their net asset value. Securities for which quotations are
11
GMO Domestic Bond Fund
(A Series of GMO Trust)
Notes to Financial Statements — (Continued)
February 29, 2008
not readily available or whose values the Manager has determined to be unreliable are valued at fair value as determined in good faith by the Trustees or other persons acting at their direction pursuant to procedures approved by the Trustees. By its nature, a fair value price is a good faith estimate of the value of a security at a given point in time and may not reflect the value that would be realized if the security was sold and the differences could be material.
Fixed income securities held by the Fund or the underlying funds are typically valued pursuant to prices supplied by a primary pricing source chosen by the Manager. The Manager evaluates such primary pricing sources on an ongoing basis, and may change a pricing source should it deem it appropriate. The Manager, at its discretion, may override a price supplied by a primary source by using a price provided by another source if such action is deemed appropriate. The prices provided by such primary pricing sources may differ from the value that would be realized if the securities were sold and the differences could be material.
Certain securities held by the Fund or the underlying funds are valued on the basis of a price provided by a single source. The prices provided may differ from the value that would be realized if the securities were sold and the differences could be material. As of February 29, 2008, the total value of these securities represented 33.30% of net assets.
The Fund indirectly invests through underlying funds in securities with contractual cash flows, such as asset-backed securities, collateralized mortgage obligations and commercial mortgage backed securities, including securities backed by subprime mortgage loans. The value, liquidity and related income of these securities are sensitive to changes in economic conditions, including real estate values, delinquencies and/or defaults, and may be adversely affected by shifts in the market's perception of the securities' market values and changes in interest rates.
GMO Special Purpose Holding Fund ("SPHF"), an investment of the Fund, has litigation pending against various entities related to the default of certain asset-backed securities previously held by SPHF. For the year ended February 29, 2008, the Fund received $9,616 through SPHF in conjunction with settlement agreements related to the default of those securities.
Futures contracts
The Fund may purchase and sell futures contracts. Upon entering into a futures contract, the Fund is required to deposit with the futures clearing broker an amount of cash, U.S. government and agency obligations, or other liquid assets in accordance with the initial margin requirements of the broker or exchange. In addition, the Fund maintains cash or securities in an amount that at least equals the net amount payable in the event the Fund must deliver the full amount of the contracts. Futures contracts are marked to market daily and an appropriate payable or receivable for the change in value ("variation margin") is recorded by the Fund. The payable or receivable is liquidated on the following business day. Gains or losses are recognized but not considered realized until the contracts expire or are closed. Futures contracts involve, to varying degrees, risk of loss in excess of the variation margin disclosed in the
12
GMO Domestic Bond Fund
(A Series of GMO Trust)
Notes to Financial Statements — (Continued)
February 29, 2008
Statement of Assets and Liabilities. Under certain circumstances, futures exchanges may establish daily limits on the amount that the price of a futures contract can vary from the previous day's settlement price, thereby effectively preventing liquidation of unfavorable positions. Losses may arise from changes in the value of the underlying instrument if the Fund is unable to liquidate a futures position due to an illiquid secondary market for the contracts or the imposition of price limits, or if counterparties do not perform under the contract terms. Futures contracts are generally valued at the settlement price established each day by the board of trade or exchange on which they are traded. Futures contracts outstanding at the end of the period are listed in the Fund's Schedule of Investments.
Options
The Fund may write call and put options. Writing options increases the Fund's exposure to the underlying instrument by, in the case of a call option, obligating the Fund to sell the underlying instrument at a set price to the option-holder and, in the case of a put option, obligating the Fund to purchase the underlying instrument at a set price from the option-holder. When the Fund writes a call or put option, an amount equal to the premium received is recorded as a liability and subsequently marked to market to reflect the current value of the option written. Premiums received from writing options which expire are treated as realized gains. Premiums received from writing options which are exercised or closed are added to the proceeds or offset against the amounts paid on the underlying future, security or currency transaction to determine the realized gain or loss. The Fund as a writer of an option has no control over whether t he underlying future, security or currency may be sold (call) or purchased (put) and as a result bears the market risk of an unfavorable change in the price of the future, security or currency underlying the written option. In the event that the Fund writes uncovered call options (i.e. options for investments that the Fund does not own), it bears the risk of incurring substantial losses if the price of the underlying instrument increases during the term of the option. There is the risk the Fund may not be able to enter into a closing transaction because of an illiquid market. There were no open written option contracts during the period.
The Fund may also purchase put and call options. Purchasing options alters the Fund's exposure to the underlying instrument by, in the case of a call option, entitling the Fund to purchase the underlying instrument at a set price from the writer of the option and, in the case of a put option, entitling the Fund to sell the underlying instrument at a set price to the writer of the option. The Fund pays a premium as a cost for a purchased option disclosed in the Schedule of Investments which is subsequently marked to market to reflect the current value of the option. Premiums paid for purchasing options which expire are treated as realized losses. Premiums paid for purchasing options which are exercised or closed are added to the amounts paid or offset against the proceeds on the closing transaction to determine the realized gain or loss. The risk associated with purchasing put and call options is limited to the premium paid. Ther e were no purchased option contracts outstanding at the end of the period.
Exchange traded options are valued at the last sale price, or if no sale is reported, the last bid price for purchased options and the last ask price for written options. Options traded over-the-counter are valued using prices supplied by a primary pricing source chosen by the Manager.
13
GMO Domestic Bond Fund
(A Series of GMO Trust)
Notes to Financial Statements — (Continued)
February 29, 2008
Loan agreements
The Fund may invest in direct debt instruments which are interests in amounts owed by a corporate, governmental, or other borrower to lenders or lending syndicates. The Fund's investments in loans may be in the form of participations in loans or assignments of all or a portion of loans from third parties. A loan is often administered by a bank or other financial institution (the "lender") that acts as agent for all holders. The agent administers the terms of the loan, as specified in the loan agreement. When investing in a loan participation, the Fund has the right to receive payments of principal, interest and any fees to which it is entitled only from the lender selling the loan agreement and only upon receipt by the lender of payments from the borrower. The Fund generally has no right to enforce compliance with the terms of the loan agreement with the borrower. As a result, the Fund may be subject to the credit risk of both t he borrower and the lender that is selling the loan agreement. When the Fund purchases assignments from lenders it acquires direct rights against the borrower on the loan. There were no loan agreements outstanding at the end of the period.
Indexed securities
The Fund may invest in indexed securities where the redemption values and/or coupons are linked to the prices of a specific instrument or financial statistic. The Fund uses indexed securities to increase or decrease its exposure to different underlying instruments and to gain exposure to markets in which it may be difficult to invest through conventional securities. Indexed securities may be more volatile than their underlying instruments, but any loss is limited to the amount of the original investment. There were no indexed securities held by the Fund at the end of the period.
Swap agreements
The Fund may enter into swap agreements. A swap is an agreement to exchange the return generated by one instrument for the return generated by another instrument. Interest rate swap agreements involve the exchange by one party with another party of their respective commitments to pay or receive interest, e.g., an exchange of floating rate payments for fixed rate payments with respect to a notional amount of principal. Total return swap agreements involve a commitment by one party in the agreement to pay interest in exchange for a market-linked return, both based on notional amounts. To the extent the total return of the security or index underlying the transaction exceeds or falls short of the offsetting interest rate obligation, the party will receive a payment from or make a pay ment to the counterparty, respectively. Forward spread lock swap agreements involve commitments to pay or receive a settlement amount calculated as the difference between the swap spread and a fixed spread, multiplied by the notional amount times the duration of the swap rate. The swap spread is the difference between the benchmark swap rate (market rate) and the specific treasury rate. In a credit default swap, one party makes a stream of payments to another party in exchange for the right to receive a specified return in the event of a default by a third party on its obligation. Credit default swaps may be used to provide a measure of protection against defaults of sovereign or corporate issuers (i.e., to reduce risk where a party owns or has exposure to the issuer) or to take an active long or short position with respect to the likelihood of a particular is suer's default. Variance swap agreements involve commitments to pay or receive a settlement amount calculated as the difference between the annualized realized variance of returns on the underlying price and a fixed
14
GMO Domestic Bond Fund
(A Series of GMO Trust)
Notes to Financial Statements — (Continued)
February 29, 2008
quantity, also known as the variance strike, over a period of time. In connection with these agreements, cash or securities may be set aside as collateral by the Fund's custodian or brokers in accordance with the terms of the swap agreement. The Fund earns or pays interest on cash set aside as collateral.
Swaps are marked to market daily using models that incorporate quotations from market makers and the change in value, if any, is recorded as unrealized gain or loss in the Statement of Operations. Payments received or made on swap contracts are recorded as realized gain or loss in the Statement of Operations. Gains or losses are realized upon early termination of the swap agreements. These financial instruments are not actively traded on financial markets. The values assigned to these instruments are based upon the best available information and because of the uncertainty of the valuation, these values may differ significantly from the values that would have been realized had a ready market for these instruments existed, and the differences could be material. Entering into these agreements involves, to varying degrees, elements of credit, legal, market and documentation risk in excess of the amounts recognized in the Statement o f Assets and Liabilities. Such risks involve the possibility that there will be no liquid market for these agreements, that the counterparties to the agreements may default on their obligations to perform or disagree as to the meaning of contractual terms in the agreements, or that there may be unfavorable changes in interest rates or the price of the index or security underlying these transactions. Swap agreements outstanding at the end of the period are listed in the Fund's Schedule of Investments.
Repurchase agreements
The Fund may enter into repurchase agreements with banks and broker-dealers whereby the Fund acquires a security for cash and obtains a simultaneous commitment from the seller to repurchase the security at an agreed upon price and date. The Fund, through its custodian, takes possession of securities collateralizing the repurchase agreement. The collateral is marked to market daily to ensure that the market value of the underlying assets remains sufficient to protect the Fund in the event of default by the seller. Collateral for certain tri-party repurchase agreements is held at the counterparty's custodian in a segregated account for the benefit of the Fund and the counterparty. In connection with transactions in repurchase agreements, if the seller defaults or enters into insolvency proceedings and the value of the collateral declines, recovery of cash by the Fund may be delayed or limited. There were no repurchase agreements o utstanding at the end of the period.
Reverse repurchase agreements
The Fund may enter into reverse repurchase agreements with banks and broker-dealers whereby the Fund sells portfolio assets concurrent with an agreement by the Fund to repurchase the same assets at a later date at a fixed price. In connection with these agreements, the Fund establishes segregated accounts with its custodian in which the Fund maintains cash, U.S. government securities or other assets equal in value to its obligations in respect of reverse repurchase agreements. Reverse repurchase agreements involve the risk that the market value of the securities the Fund has sold under the agreement may decline below the price at which the Fund is obligated to repurchase under the agreement. The market value of the securities the Fund has sold is determined daily and any additional required collateral is allocated to or sent by the Fund on the next business day. There were no reverse repurchase agreements outstanding at the end of the period.
15
GMO Domestic Bond Fund
(A Series of GMO Trust)
Notes to Financial Statements — (Continued)
February 29, 2008
Securities lending
The Fund may lend its securities to certain qualified broker-dealers. The loans are collateralized with cash or liquid securities with a market value at least equal to the market value of the securities on loan. As with other extensions of credit, the Fund may bear the risk of loss with respect to the investment of the collateral, the risk of delay in and/or inability to exercise its rights with respect to the collateral, and the risk of delay in recovery or loss of rights in the loaned securities should the borrower of the securities fail financially. If a loan is collateralized by U.S. government securities, the Fund receives a fee from the borrower. If a loan is collateralized by cash, the Fund typically invests the cash collateral for its own account in interest-bearing, short-term securities and pays a fee to the borrower that normally represents a portion of the Fund's earnings on the collateral. For the year ended Februar y 29, 2008, the Fund did not participate in securities lending.
Taxes and distributions
The Fund intends to qualify each tax year as a regulated investment company under Subchapter M of the Internal Revenue Code of 1986, as amended (the "Code"). The Fund intends to distribute substantially all of its net investment income and net realized short-term and long-term capital gains, if any, after giving effect to any available capital loss carryovers for U.S. federal income tax purposes. Therefore, no provision for U.S. federal income or excise tax is necessary.
The Fund's policy is to declare and pay distributions from net investment income, if any, quarterly, and from net realized short-term and long-term capital gains, if any, at least annually. All distributions are paid in shares of the Fund, at net asset value, unless the shareholder elects to receive cash distributions. Distributions to shareholders are recorded by the Fund on the ex-dividend date.
Income and capital gain distributions are determined in accordance with U.S. federal income tax regulations, which may differ from U.S. GAAP. Certain capital accounts in the financial statements are periodically adjusted for permanent differences in order to reflect their tax character. These adjustments have no impact on net assets or net asset value per share. Temporary differences which arise from recognizing certain items of income, expense, gain or loss in different periods for financial statement and tax purposes will reverse at some time in the future. Distributions in excess of net investment income or net realized gains are temporary over distributions for financial statement purposes resulting from differences in the recognition or classification of income or distributions for financial statement and tax purposes.
U.S. GAAP and tax accounting differences primarily relate to losses on wash sale transactions and derivative contract transactions.
The following reclassification represents the amount necessary to report the stated components of net assets on a tax basis, excluding certain temporary differences, as of February 29, 2008. The financial highlights exclude these adjustments.
16
GMO Domestic Bond Fund
(A Series of GMO Trust)
Notes to Financial Statements — (Continued)
February 29, 2008
| Accumulated Undistributed Net Investment Income | Accumulated Net Realized Loss | Paid-in Capital | |||||||||
| $ | 28,707,697 | $ | (28,707,697 | ) | $ | — | |||||
The tax character of distributions declared to shareholders is as follows:
| 2/29/2008 | 2/28/2007 | ||||||||||
| Ordinary income (including any short-term capital gains) | $ | 53,556,093 | $ | 21,059,365 | |||||||
| Total distributions | $ | 53,556,093 | $ | 21,059,365 | |||||||
Distributions in excess of tax basis earnings and profits, if significant, are reported in the financial statements as a tax return of capital.
As of February 29, 2008, the components of distributable earnings on a tax basis consisted of the following:
| Undistributed ordinary income | $ | 10,493,293 | |||||
| Undistributed long-term capital gain | $ | 2,620,857 | |||||
As of February 29, 2008, the approximate cost for U.S. federal income tax purposes and gross and net unrealized appreciation and depreciation in value of investments were as follows:
| Aggregate Cost | Gross Unrealized Appreciation | Gross Unrealized (Depreciation) | Net Unrealized Appreciation (Depreciation) | ||||||||||||
| $ | 764,601,676 | $ | 17,511 | $ | (42,695,465 | ) | $ | (42,677,954 | ) | ||||||
Security transactions and related investment income
Security transactions are accounted for on trade date. Dividend income, net of applicable foreign withholding taxes, if any, is recorded on the ex-dividend date, or when the Fund is informed of the ex-dividend date, if later. Interest income is recorded on the accrual basis and is adjusted for the amortization of premiums and accretion of discounts. Interest income on inflation indexed securities, if any, is accrued daily based upon an inflation adjusted principal. Additionally, any increase or decrease in the principal or face amount of the securities adjusted for inflation is recorded as interest income or loss. Income is not recognized on securities for which collection is not expected. Non-cash dividends, if any, are recorded at the fair market value of the securities received. In determining the net gain or loss on securities sold, the cost of securities is determined on the identified cost basis.
17
GMO Domestic Bond Fund
(A Series of GMO Trust)
Notes to Financial Statements — (Continued)
February 29, 2008
Expenses
The majority of expenses of the Trust are directly identifiable to an individual fund. Expenses which are not readily identifiable to a specific fund are allocated taking into consideration, among other things, the nature and type of expense and the relative size of the funds. Investment income, common expenses and realized and unrealized gains and losses are allocated pro rata among the classes of shares of the Fund based on the relative net assets of each class. Shareholder service fees, which are directly attributable to a class of shares, are charged to that class's operations. In addition, the Fund will also incur certain fees and expenses indirectly as a shareholder in the underlying funds. Because the underlying funds have varied expense and fee levels and the Fund may own different proportions of the underlying funds at different times, the amount of fees and expenses indirectly incurred by the Fund will vary (See Note 3 ).
State Street Bank and Trust Company ("State Street") serves as custodian, fund accounting agent and transfer agent of the Fund. State Street's fee may be reduced by credits that are an earnings allowance calculated on the average daily cash balances the Fund maintains with State Street. Credit balances used to reduce the fee paid to State Street, if any, are reported as a reduction of expenses in the Statement of Operations.
Recently issued accounting pronouncements
In June 2006, the Financial Accounting Standards Board ("FASB") issued FASB Interpretation No. 48, Accounting for Uncertainty in Income Taxes – an Interpretation of FASB Statement No. 109 ("FIN 48"). FIN 48 clarifies the accounting for uncertainty in income taxes recognized in accordance with FASB Statement No. 109, Accounting for Income Taxes. FIN 48 prescribes a recognition threshold and measurement attribute for a tax position taken or expected to be taken in the tax return that could impact the Fund's financial statements. It also provides guidance in relation to the Fund's financial statements on classification of tax benefits or liabilities, interest and penalties, accounting in interim periods, disclosure, and transition. FIN 48 is effective for fiscal years beginning after December 15, 2006 for registered investment companies. Management has evaluated the effects of applying the various provisions of FIN 48 and has determined that the adoption of FIN 48 does not have a material effect on the Fund's financial statements. The Fund's federal tax returns for the prior three fiscal years remain subject to examination by the Internal Revenue Service. Management will continue to monitor the rules and guidance pertaining to FIN 48 and will take action if appropriate.
In September 2006, the FASB issued Statement of Financial Accounting Standards No. 157 ("FAS 157"), "Fair Value Measurements." FAS 157 defines fair value, establishes a framework for measuring fair value in accordance with generally accepted accounting principles and expands disclosure about fair value measurements. FAS 157 is effective for fiscal years beginning after November 15, 2007. Management is currently evaluating the impact the adoption of FAS 157 will have on the Fund's financial statement disclosures.
18
GMO Domestic Bond Fund
(A Series of GMO Trust)
Notes to Financial Statements — (Continued)
February 29, 2008
3. Fees and other transactions with affiliates
GMO earns a management fee paid monthly at the annual rate of 0.10% of average daily net assets. The Fund has adopted a Shareholder Service Plan under which the Fund pays GMO a shareholder service fee for client and shareholder service, reporting, and other support. Pursuant to the Shareholder Service Plan, the shareholder service fee is calculated based on average daily net assets at the annual rate of 0.15% for Class III shares and 0.055% for Class VI shares.
The Manager has contractually agreed to reimburse the Fund for Fund expenses through at least June 30, 2008 to the extent the Fund's total annual operating expenses (excluding shareholder service fees, expenses indirectly incurred by investment in the underlying funds, fees and expenses of the independent Trustees of the Trust, fees and expenses for legal services not approved by the Manager for the Trust, compensation and expenses of the Trust's Chief Compliance Officer ("CCO") (excluding any employee benefits), brokerage commissions, securities lending fees and expenses, interest expense, transfer taxes, and other investment-related costs (including expenses associated with investments in any company that is an investment company or would be an investment company under the 1940 Act, but for the exceptions to the definition of investment company provided in Section 3(c)(1) and 3(c)(7) of the 1940 Act), hedging transaction fees, extraordinary, non-recurring and certain other unusual expenses (including taxes)) exceed 0.10% of the Fund's average daily net assets.
The Fund incurs fees and expenses indirectly as a shareholder of the underlying funds. For the year ended February 29, 2008, these indirect fees and expenses expressed as an annualized percentage of the Fund's average daily net assets were as follows:
| Indirect Net Expenses (excluding shareholder service fees and interest expense) | Indirect Shareholder Service Fees | Indirect Interest Expense | Total Indirect Expenses | ||||||||||||
| 0.002 | % | 0.000 | % | 0.000 | % | 0.002 | % | ||||||||
The Fund's portion of the fees paid by the Trust to the independent Trustees and CCO during the year ended February 29, 2008 was $4,928 and $2,575, respectively. The compensation and expenses of the CCO are included in miscellaneous expenses in the Statement of Operations. No remuneration was paid by the Fund to any other officer of the Trust.
19
GMO Domestic Bond Fund
(A Series of GMO Trust)
Notes to Financial Statements — (Continued)
February 29, 2008
4. Purchases and sales of securities
For the year ended February 29, 2008, cost of purchases and proceeds from sales of investments, other than short-term obligations, were as follows:
| Purchases | Sales | ||||||||||
| U.S. Government securities | $ | 10,255,429 | $ | 22,476,819 | |||||||
| Investments (non-U.S. Government securities) | 446,364,141 | 95,022,517 | |||||||||
5. Guarantees
In the normal course of business the Fund enters into contracts with third-party service providers that contain a variety of representations and warranties and which provide general indemnifications. The Fund's maximum exposure under these arrangements is unknown, as this would involve future claims that may be made against the Fund that have not yet occurred. Based on experience, management is of the view that the risk of loss in connection with these potential indemnification obligations is remote; however, there can be no assurance that material liabilities related to such obligations will not arise in the future that could adversely impact the Fund.
6. Principal shareholders and related parties
As of February 29, 2008, 73.62% of the shares outstanding of the Fund were held by two shareholders, each holding in excess of 10% of the Fund's outstanding shares. No other shareholder owned in excess of 10% of the outstanding shares of the Fund. Investment activities of these shareholders may have a material effect on the Fund.
As of February 29, 2008, less than 0.01% of the Fund's shares were held by four related parties comprised of certain GMO employee accounts, and 96.19% of the Fund's shares were held by accounts for which the Manager has investment discretion.
20
GMO Domestic Bond Fund
(A Series of GMO Trust)
Notes to Financial Statements — (Continued)
February 29, 2008
7. Share transactions
The Declaration of Trust permits the Trustees to issue an unlimited number of shares of beneficial interest (without par value). Transactions in Fund shares were as follows:
| Year Ended February 29, 2008 | Year Ended February 28, 2007 | ||||||||||||||||||
| Class III: | Shares | Amount | Shares | Amount | |||||||||||||||
| Shares sold | 30,453,972 | $ | 298,824,097 | 2,560,718 | $ | 25,144,765 | |||||||||||||
| Shares issued to shareholders in reinvestment of distributions | 765,476 | 7,192,263 | 470,574 | 4,591,550 | |||||||||||||||
| Shares repurchased | (25,576,899 | ) | (250,548,172 | ) | (6,197,833 | ) | (61,203,513 | ) | |||||||||||
| Net increase (decrease) | 5,642,549 | $ | 55,468,188 | (3,166,541 | ) | $ | (31,467,198 | ) | |||||||||||
| Year Ended February 29, 2008 | Year Ended February 28, 2007 | ||||||||||||||||||
| Class VI: | Shares | Amount | Shares | Amount | |||||||||||||||
| Shares sold | 26,087,987 | $ | 256,617,471 | 142,221 | $ | 1,389,455 | |||||||||||||
| Shares issued to shareholders in reinvestment of distributions | 4,455,602 | 41,858,762 | 1,658,104 | 16,195,086 | |||||||||||||||
| Shares repurchased | (2,571,173 | ) | (24,662,536 | ) | (5,081,727 | ) | (49,444,068 | ) | |||||||||||
| Net increase (decrease) | 27,972,416 | $ | 273,813,697 | (3,281,402 | ) | $ | (31,859,527 | ) | |||||||||||
8. Investments in affiliated issuers
A summary of the Fund's transactions in the shares of affiliated issuers during the year ended February 29, 2008 is set forth below:
| Affiliate | Value, beginning of period | Purchases | Sales Proceeds | Dividend Income | Distributions of Realized Gains | Value, end of period | |||||||||||||||||||||
| GMO Short-Duration Collateral Fund | $ | 357,398,162 | $ | 446,364,141 | $ | 83,300,000 | $ | 30,714,141 | $ | — | $ | 678,684,117 | |||||||||||||||
| GMO Special Purpose Holding Fund | 2,090 | — | — | — | 9,616 | 1,868 | |||||||||||||||||||||
| Totals | $ | 357,400,252 | $ | 446,364,141 | $ | 83,300,000 | $ | 30,714,141 | $ | 9,616 | $ | 678,685,985 | |||||||||||||||
21
Report of Independent Registered Public Accounting Firm
To the Trustees of GMO Trust and the Shareholders of
GMO Domestic Bond Fund
In our opinion, the accompanying statement of assets and liabilities, including the schedule of investments, and the related statements of operations and of changes in net assets and the financial highlights present fairly, in all material respects, the financial position of GMO Domestic Bond Fund (the "Fund") at February 29, 2008, the results of its operations for the year then ended, the changes in its net assets for each of the two years in the period then ended and the financial highlights for each of the five years in the period then ended, in conformity with accounting principles generally accepted in the United States of America. These financial statements and financial highlights (hereafter referred to as "financial statements") are the responsibility of the Fund's management; our responsibility is to express an opinion on these financial statements based on our audits. We conducted our audits of these financial statemen ts in accordance with the standards of the Public Company Accounting Oversight Board (United States). Those standards require that we plan and perform the audit to obtain reasonable assurance about whether the financial statements are free of material misstatement. An audit includes examining, on a test basis, evidence supporting the amounts and disclosures in the financial statements, assessing the accounting principles used and significant estimates made by management, and evaluating the overall financial statement presentation. We believe that our audits, which included confirmation of securities at February 29, 2008 by correspondence with the custodian and brokers, provide a reasonable basis for our opinion.
PricewaterhouseCoopers LLP
Boston, Massachusetts
April 29, 2008
22
GMO Domestic Bond Fund
(A Series of GMO Trust)
Fund Expenses
February 29, 2008 (Unaudited)
Expense Examples: The following information is in relation to expenses for the six month period ended February 29, 2008.
As a shareholder of the Fund, you may incur two types of costs: (1) transaction costs, and (2) ongoing costs, including management fees, shareholder service fees and other Fund expenses. This example is intended to help you understand your ongoing costs (in dollars) of investing in the Fund and to compare these costs with the ongoing costs of investing in other mutual funds.
These examples are based on an investment of $1,000 invested at the beginning of the period and held for the entire period, September 1, 2007 through February 29, 2008.
Actual Expenses
The first line of the table for each class below provides information about actual account values and actual expenses. You may use the information in this line, together with the amount you invested, to estimate the expenses that you paid over the period. Simply divide your account value by $1,000 (for example, a $10,000,000 account value divided by $1,000 = 10,000), then multiply the result by the number in the first line under the heading entitled "Net Expense Incurred" to estimate the expenses you paid on your account during this period.
Hypothetical Example for Comparison Purposes
The second line of the table for each class below provides information about hypothetical account values and hypothetical expenses based on the Fund's actual expense ratio and an assumed rate of return of 5% per year before expenses, which is not the Fund's actual return. The hypothetical account values and expenses may not be used to estimate the actual ending account balance or expenses you paid for the period. You may use this information to compare the ongoing costs of investing in the Fund with other funds. To do so, compare this 5% hypothetical example with the 5% hypothetical examples that appear in the shareholder reports of other funds.
Please note that the expenses shown in the table are meant to highlight your ongoing costs only and do not reflect any transactional costs. Therefore, the second line of the table is useful in comparing ongoing costs only, and will not help you determine the relative total costs of owning different funds. In addition, if these transactional costs were included, your costs would have been higher.
| Annualized Net Expense Ratio | Beginning Account Value | Ending Account Value | Net Expense Incurred* | ||||||||||||||||
| Class III | |||||||||||||||||||
| 1) Actual | 0.25 | % | $ | 1,000.00 | $ | 1,030.40 | $ | 1.26 | |||||||||||
| 2) Hypothetical | 0.25 | % | $ | 1,000.00 | $ | 1,023.62 | $ | 1.26 | |||||||||||
| Class VI | |||||||||||||||||||
| 1) Actual | 0.16 | % | $ | 1,000.00 | $ | 1,030.90 | $ | 0.81 | |||||||||||
| 2) Hypothetical | 0.16 | % | $ | 1,000.00 | $ | 1,024.07 | $ | 0.81 | |||||||||||
* Expenses are calculated using each Class's annualized net expense ratio (including indirect expenses incurred) for the six months ended February 29, 2008, multiplied by the average account value over the period, multiplied by 182 days in the period, divided by 366 days in the year.
23
GMO Domestic Bond Fund
(A Series of GMO Trust)
Tax Information for the Tax Year Ended February 29, 2008 (Unaudited)
The Fund will notify shareholders of amounts for use in preparing 2008 income tax forms in January 2009.
The Fund hereby designates as qualified interest income with respect to its taxable year ended February 29, 2008, $19,944,915 or if determined to be different, the qualified interest income of such year.
24
Trustees and Officers (Unaudited)
The following tables list the Trust's Trustees and Officers as of the date of this report; their address and date of birth ("DOB"); their position with the Trust; the length of time holding that position with the Trust; their principal occupation(s) during the past five years; the number of portfolios in the fund complex they oversee; and other directorships they hold in companies subject to registration or reporting requirements of the Securities Exchange Act of 1934 (generally called "public companies") or in registered investment companies. The Trust's Statement of Additional Information ("SAI") includes additional information about the Trust's trustees, including changes subsequent to the date of the report. The SAI is available, without charge, upon request by writing GMO, c/o GMO Trust, 40 Rowes Wharf, Boston, MA 02110.
Independent Trustees:
| Name, Address, and DOB | Position(s) Held with Trust | Term of Office1 and Length of Time Served | Principal Occupation(s) During Past Five Years | Number of Portfolios in Fund Complex Overseen by Trustee | Other Directorships Held by Trustee | ||||||||||||||||||
| Donald W. Glazer, Esq. c/o GMO Trust 40 Rowes Wharf Boston, MA 02110 DOB: 07/26/1944 | Chairman of the Board of Trustees | Chairman of the Board of Trustees since March 2005; Lead Independent Trustee (September 2004 – March 2005); Trustee since December 2000. | Consultant – Law and Business2; Vice Chair (since 2002) and Secretary, Provant, Inc. (provider of personnel performance improvement services and training products); Author of Legal Treatises. | 47 | None. | ||||||||||||||||||
1 Each Trustee is elected to serve during the continued lifetime of the Trust until he/she dies, resigns or is removed, or if sooner, until the next meeting of Shareholders called for the purpose of electing Trustees and until the election and qualification of his/her successor.
2 As part of Mr. Glazer's work as a consultant, he provides part-time consulting services to Goodwin Procter LLP ("Goodwin"). Goodwin has provided legal services to Renewable Resources, LLC, an affiliate of GMO; GMO, in connection with its relationship with Renewable Resources; and funds managed by Renewable Resources. Mr. Glazer has represented that he has no financial interest in, and is not involved in the provision of, such legal services. In the calendar years ended December 31, 2006 and December 31, 2007, these entities paid $825,738 and $291,721 respectively, in legal fees and disbursements to Goodwin.
25
Independent Trustees — (Continued)
| Name, Address, and DOB | Position(s) Held with Trust | Term of Office1 and Length of Time Served | Principal Occupation(s) During Past Five Years | Number of Portfolios in Fund Complex Overseen by Trustee | Other Directorships Held by Trustee | ||||||||||||||||||
| Jay O. Light c/o GMO Trust 40 Rowes Wharf Boston, MA 02110 DOB: 10/03/1941 | Trustee | Since May 1996. | Dean (since April 2006), Acting Dean (August 2005 – April 2006), Senior Associate Dean (1998 – 2005), and Professor of Business Administration, Harvard Business School. | 47 | Director of Harvard Management Company, Inc.3 and Verde, Inc.; Director of Partners HealthCare System, Inc. and Chair of its Investment Committee.4 | ||||||||||||||||||
| W. Nicholas Thorndike c/o GMO Trust 40 Rowes Wharf Boston, MA 02110 DOB: 03/28/1933 | Trustee | Since March 2005. | Director or trustee of various corporations and charitable organizations, including Courier Corporation (a book publisher and manufacturer) (July 1989 – present); Putnam Funds (December 1992 – June 2004); and Providence Journal (a newspaper publisher) (December 1986 – December 2003). | 47 | Director of Courier Corporation (a book publisher and manufacturer); Member of the Investment Committee of Partners HealthCare System, Inc.4 | ||||||||||||||||||
1 Each Trustee is elected to serve during the continued lifetime of the Trust until he/she dies, resigns or is removed, or if sooner, until the next meeting of Shareholders called for the purpose of electing Trustees and until the election and qualification of his/her successor.
3 Harvard Management Company, Inc. is a client of the Manager.
4 Partners HealthCare System, Inc. is a client of the Manager.
26
Principal Officers:
| Name, Address, and DOB | Position(s) Held with Trust | Term of Office5 and Length of Time Served | Principal Occupation(s) During Past Five Years | ||||||||||||
| Scott Eston c/o GMO Trust 40 Rowes Wharf Boston, MA 02110 DOB: 01/20/1956 | President and Chief Executive Officer | President and Chief Executive Officer since October 2002; Chief Financial Officer, November 2006 – February 2007. | Chief Financial Officer, Chief Operating Officer and Member, Grantham, Mayo, Van Otterloo & Co. LLC. | ||||||||||||
| Sheppard N. Burnett c/o GMO Trust 40 Rowes Wharf Boston, MA 02110 DOB: 10/24/1968 | Treasurer and Chief Financial Officer | Chief Financial Officer since March 2007; Treasurer since November 2006; Assistant Treasurer, September 2004 – November 2006. | Fund Administration Staff, Grantham, Mayo, Van Otterloo & Co. LLC (June 2004 – present); Vice President, Director of Tax, Columbia Management Group (2002 – 2004). | ||||||||||||
| Brent C. Arvidson c/o GMO Trust 40 Rowes Wharf Boston, MA 02110 DOB: 06/26/1969 | Assistant Treasurer | Since August 1998. | Senior Fund Administrator, Grantham, Mayo, Van Otterloo & Co. LLC. | ||||||||||||
| John L. Nasrah c/o GMO Trust 40 Rowes Wharf Boston, MA 02110 DOB: 05/27/1977 | Assistant Treasurer | Since March 2007. | Fund Administrator, Grantham, Mayo, Van Otterloo & Co. LLC (September 2004 – present); Tax Analyst, Bain & Company, Inc (June 2003 – September 2004); Senior Tax Associate, PricewaterhouseCoopers LLP (2001 – 2003). | ||||||||||||
| Mahmoodur Rahman c/o GMO Trust 40 Rowes Wharf Boston, MA 02110 DOB: 11/30/1967 | Assistant Treasurer | Since September 2007. | Fund Administrator, Grantham, Mayo, Van Otterloo & Co. (April 2007 – present); Vice President and Senior Tax Manager, Massachusetts Financial Services Company (January 2000 – April 2007). | ||||||||||||
| Michael E. Gillespie c/o GMO Trust 40 Rowes Wharf Boston, MA 02110 DOB: 02/18/1958 | Chief Compliance Officer | Since March 2005. | Vice President of Compliance (June 2004 – February 2005) and Director of Domestic Compliance (March 2002 – June 2004), Fidelity Investments; Vice President and Senior Counsel, State Street Bank and Trust Company (May 1998 – March 2002). | ||||||||||||
5 Officers are elected to hold such office until their successor is elected and qualified to carry out the duties and responsibilities of their office, or until he or she resigns or is removed from office.
27
Principal Officers — (Continued)
| Name, Address, and DOB | Position(s) Held with Trust | Term of Office5 and Length of Time Served | Principal Occupation(s) During Past Five Years | ||||||||||||
| Jason B. Harrison c/o GMO Trust 40 Rowes Wharf Boston, MA 02110 DOB: 01/29/1977 | Vice President and Clerk | Vice President since November 2006; Clerk since March 2006. | Legal Counsel, Grantham, Mayo, Van Otterloo & Co. LLC (since February 2006) and Attorney, Ropes & Gray LLP (September 2002 – February 2006). | ||||||||||||
| David L. Bohan c/o GMO Trust 40 Rowes Wharf Boston, MA 02110 DOB: 06/21/1964 | Vice President and Assistant Clerk | Vice President since March 2005; Assistant Clerk since March 2006. | Legal Counsel, Grantham, Mayo, Van Otterloo & Co. LLC (September 2003 – present); Attorney, Goodwin Procter LLP (September 1996 – September 2003). | ||||||||||||
| Gregory L. Pottle c/o GMO Trust 40 Rowes Wharf Boston, MA 02110 DOB: 07/09/1971 | Vice President and Assistant Clerk | Since November 2006. | Legal Counsel, Grantham, Mayo, Van Otterloo & Co. LLC. | ||||||||||||
| Anne K. Trinque c/o GMO Trust 40 Rowes Wharf Boston, MA 02110 DOB: 04/15/1978 | Vice President and Assistant Clerk | Since September 2007. | Legal Counsel, Grantham, Mayo, Van Otterloo & Co. LLC (since January 2007); Attorney, Goodwin Procter LLP (September 2003 – January 2007). | ||||||||||||
| Cheryl Wakeham c/o GMO Trust 40 Rowes Wharf Boston, MA 02110 DOB: 10/29/1958 | Anti-Money Laundering Officer | Since December 2004. | Manager, Client Service Administration, Grantham, Mayo, Van Otterloo & Co. LLC. | ||||||||||||
5 Officers are elected to hold such office until their successor is elected and qualified to carry out the duties and responsibilities of their office, or until he or she resigns or is removed from office.
28
GMO World Opportunity Overlay Fund
(A Series of GMO Trust)
Annual Report
February 29, 2008
For a free copy of the Fund's proxy voting guidelines, shareholders may call 1-617-346-7646 (collect), visit our website at www.gmo.com, or visit the Securities and Exchange Commission's website at www.sec.gov. Information regarding how the Fund voted proxies relating to portfolio securities during the most recent 12-month period ended June 30 is available on our website at www.gmo.com, or on the Securities and Exchange Commission's website at www.sec.gov.
The Fund files its complete schedule of portfolio holdings with the Securities and Exchange Commission for the first and third quarter of each fiscal year on Form N-Q, which is available on the Commission's website at www.sec.gov. The Fund's Form N-Q may be reviewed and copied at the Commission's Public Reference Room in Washington, D.C. Information on the operation of the Public Reference Room may be obtained by calling 1-800-SEC-0330.
This report is prepared for the general information of shareholders. It is authorized for distribution to prospective investors only when preceded or accompanied by a prospectus for the GMO Trust.
GMO World Opportunity Overlay Fund
(A Series of GMO Trust)
Portfolio Management
Day-to-day management of the Fund's portfolio is the responsibility of the Fixed Income Division at Grantham, Mayo, Van Otterloo & Co. LLC.
Management Discussion and Analysis of Fund Performance
The GMO World Opportunity Overlay Fund returned -1.2% for the fiscal year ended February 29, 2008, as compared with +5.8% for the JPMorgan U.S. 3 Month Cash Index.
The Fund underperformed the benchmark during the fiscal year by -6.9%. During the time period, the overlay added about 0.9%, while cash management detracted about 7.8%. The Fund is comprised of overlay strategies involving investments in derivative transactions (largely interest-rate swaps and exchange-traded futures). These derivative transactions are backed by a collateral pool consisting of high quality U.S. and foreign floating-rate fixed income securities, mainly asset-backed securities, in order to earn a LIBOR-type return.
With the extreme price volatility of AAA-credit quality asset-backed securities during the year, the collateral pool underperformed LIBOR by nearly 800 bps, directly contributing to the Fund's underperformance.
In addition to collateral mark-to-market losses, the volatility, cross-market, and slope strategies also underperformed, leaving only the U.S. Eurodollar directional strategy and opportunistic trades with positive contributions for the year.
The Fund's duration at fiscal year-end was 0.2 years.
The views expressed herein are exclusively those of Grantham, Mayo, Van Otterloo & Co. LLC Management as of the date of this report and are subject to change. GMO disclaims any responsibility to update such views. They are not meant as investment advice.

Performance data quoted represents past performance and is not indicative of future results. The investment return and principal value of an investment will fluctuate so that an investor's shares, when redeemed, may be worth more or less than their original cost. Current performance data may be lower or higher than the performance data provided herein. To obtain performance information to the most recent month-end, visit www.gmo.com. Performance shown is net of all fees after reimbursement from the Manager. Returns would have been lower had certain expenses not been reimbursed during the periods shown and do not include the effect of taxes on distributions and redemptions. All information is unaudited.
GMO World Opportunity Overlay Fund
(A Series of GMO Trust)
Investments Concentration Summary
February 29, 2008 (Unaudited)
| Asset Class Summary | % of Total Net Assets | ||||||
| Debt Obligations | 93.1 | % | |||||
| Short-Term Investments | 6.0 | �� | |||||
| Options Purchased | 0.9 | ||||||
| Forward Currency Contracts | 0.0 | ||||||
| Futures | 0.0 | ||||||
| Written Options | (0.2 | ) | |||||
| Swaps | (0.3 | ) | |||||
| Other | 0.5 | ||||||
| 100.0 | % | ||||||
1
GMO World Opportunity Overlay Fund
(A Series of GMO Trust)
Schedule of Investments
(showing percentage of total net assets)
February 29, 2008
| Par Value ($) | Description | Value ($) | |||||||||||||
| DEBT OBLIGATIONS — 93.1% | |||||||||||||||
| Asset-Backed Securities — 92.3% | |||||||||||||||
| Auto Financing — 8.5% | |||||||||||||||
| 10,000,000 | BMW Vehicle Lease Trust, Series 07-1, Class A3B, Variable Rate, 1 mo. LIBOR + .24%, 3.36%, due 08/15/13 | 9,818,800 | |||||||||||||
| 7,000,000 | Capital Auto Receivable Asset Trust, Series 07-2, Class A4B, Variable Rate, 1 mo. LIBOR + .40%, 3.52%, due 02/18/14 | 6,785,100 | |||||||||||||
| 7,000,000 | Daimler Chrysler Master Owner Trust, Series 06-A, Class A, Variable Rate, 1 mo. LIBOR + .03%, 3.15%, due 11/15/11 | 6,875,610 | |||||||||||||
| 7,500,000 | Ford Credit Auto Owner Trust, Series 06-C, Class A4B, Variable Rate, 1 mo. LIBOR + .04%, 3.16%, due 02/15/12 | 7,297,650 | |||||||||||||
| 2,000,000 | Ford Credit Auto Owner Trust, Series 07-B, Class A4B, Variable Rate, 1 mo. LIBOR + .38%, 3.50%, due 07/15/12 | 1,948,909 | |||||||||||||
| 10,000,000 | Ford Credit Floorplan Master Owner Trust, Series 05-1, Class A, Variable Rate, 1 mo. LIBOR + .15%, 3.27%, due 05/15/10 | 9,954,000 | |||||||||||||
| 12,000,000 | Ford Credit Floorplan Master Owner Trust, Series 06-3, Class A, Variable Rate, 1 mo. LIBOR + .18%, 3.30%, due 06/15/11 | 11,577,233 | |||||||||||||
| 2,000,000 | Ford Credit Floorplan Master Owner Trust, Series 06-4, Class A, Variable Rate, 1 mo. LIBOR + .25%, 3.37%, due 06/15/13 | 1,849,276 | |||||||||||||
| 14,000,000 | Nissan Auto Receivables Owner Trust, Series 07-A, Class A4, Variable Rate, 1 mo. LIBOR, 3.12%, due 06/17/13 | 13,535,760 | |||||||||||||
| 15,000,000 | Sovereign Dealer Floor Plan Master Trust, Series 06-1, Class A, 144A, Variable Rate, 1 mo. LIBOR + .05%, 3.17%, due 08/15/11 | 14,586,000 | |||||||||||||
| 10,000,000 | Superior Wholesale Inventory Financing Trust, Series 04-A10, Class A, Variable Rate, 1 mo. LIBOR + .10%, 3.22%, due 09/15/11 | 9,571,400 | |||||||||||||
| 8,000,000 | Superior Wholesale Inventory Financing Trust, Series 05-A12, Class A, Variable Rate, 1 mo. LIBOR + .18%, 3.30%, due 06/15/10 | 7,936,136 | |||||||||||||
| 3,000,000 | Swift Master Auto Receivables Trust, Series 07-1, Class A, Variable Rate, 1 mo. LIBOR + .10%, 3.22%, due 06/15/12 | 2,839,860 | |||||||||||||
| 8,000,000 | Truck Retail Installment Paper Corp., Series 05-1A, Class A, 144A, Variable Rate, 1 mo. LIBOR + .27%, 3.39%, due 12/15/16 | 7,530,400 | |||||||||||||
| 14,000,000 | World Omni Auto Receivables Trust, Series 07-A, Class A4, Variable Rate, 1 mo. LIBOR, 3.12%, due 11/15/12 | 13,543,754 | |||||||||||||
| Total Auto Financing | 125,649,888 | ||||||||||||||
See accompanying notes to the financial statements.
2
GMO World Opportunity Overlay Fund
(A Series of GMO Trust)
Schedule of Investments — (Continued)
(showing percentage of total net assets)
February 29, 2008
| Par Value ($) | Description | Value ($) | |||||||||||||
| Bank Loan Collateralized Debt Obligations — 1.1% | |||||||||||||||
| 9,969,958 | Arran Corp. Loans No. 1 B.V., Series 06-1A, Class A3, 144A, Variable Rate, 3 mo. LIBOR + .17%, 5.10%, due 06/20/25 | 9,807,946 | |||||||||||||
| 7,200,000 | Omega Capital Europe Plc, Series GLOB-5A, Class A1, 144A, Variable Rate, 3 mo. LIBOR + .25%, 4.90%, due 07/05/11 | 6,978,168 | |||||||||||||
| Total Bank Loan Collateralized Debt Obligations | 16,786,114 | ||||||||||||||
| Business Loans — 5.3% | |||||||||||||||
| 2,262,941 | Bayview Commercial Asset Trust, Series 04-3, Class A1, 144A, Variable Rate, 1 mo. LIBOR + .37%, 3.49%, due 01/25/35 | 2,191,432 | |||||||||||||
| 4,577,203 | Bayview Commercial Asset Trust, Series 05-4A, Class A2, 144A, Variable Rate, 1 mo. LIBOR + .39%, 3.51%, due 01/25/36 | 4,244,440 | |||||||||||||
| 10,000,000 | Bayview Commercial Asset Trust, Series 07-6A, Class A2, 144A, Variable Rate, 1 mo. LIBOR + 1.30%, 4.42%, due 12/25/37 | 9,650,000 | |||||||||||||
| 2,399,706 | Capitalsource Commercial Loan Trust, Series 06-1A, Class A1, 144A, Variable Rate, 1 mo. LIBOR + .12%, 3.24%, due 08/22/16 | 2,352,432 | |||||||||||||
| 1,261,082 | GE Business Loan Trust, Series 05-1A, Class A1, 144A, Variable Rate, 1 mo. LIBOR + .07%, 3.19%, due 06/15/14 | 1,256,519 | |||||||||||||
| 2,381,582 | GE Business Loan Trust, Series 05-2A, Class A, 144A, Variable Rate, 1 mo. LIBOR + .24%, 3.36%, due 11/15/33 | 2,238,284 | |||||||||||||
| 1,938,683 | GE Commercial Loan Trust, Series 06-2, Class A1, 144A, Variable Rate, 3 mo. LIBOR + .06%, 3.95%, due 04/19/15 | 1,926,857 | |||||||||||||
| 4,000,000 | GE Dealer Floorplan Master Trust, Series 05-1, Class A, Variable Rate, 1 mo. LIBOR + .04%, 3.16%, due 04/20/10 | 3,994,800 | |||||||||||||
| 13,000,000 | GE Dealer Floorplan Master Trust, Series 07-2, Class A, Variable Rate, 1 mo. LIBOR + .01%, 3.13%, due 07/20/12 | 12,556,348 | |||||||||||||
| 2,869,113 | Lehman Brothers Small Balance Commercial, Series 05-1, Class A, 144A, Variable Rate, 1 mo. LIBOR + .25%, 3.37%, due 02/25/30 | 2,627,119 | |||||||||||||
| 2,109,720 | Lehman Brothers Small Balance Commercial, Series 05-2A, Class 1A, 144A, Variable Rate, 1 mo. LIBOR + .25%, 3.37%, due 09/25/30 | 1,911,657 | |||||||||||||
| 9,786,759 | Lehman Brothers Small Balance Commercial, Series 07-2A, Class 1A1, 144A, Variable Rate, 1 mo. LIBOR + .12%, 3.24%, due 06/25/37 | 9,538,950 | |||||||||||||
| 1,820,986 | Lehman Brothers Small Balance Commercial, Series 07-3A, Class 1A1, 144A, Variable Rate, 1 mo. LIBOR + .65%, 3.77%, due 10/25/37 | 1,781,015 | |||||||||||||
| 3,000,000 | Lehman Brothers Small Balance Commercial, Series 07-3A, Class 1A2, 144A, Variable Rate, 1 mo. LIBOR + .85%, 3.97%, due 10/25/37 | 2,778,227 | |||||||||||||
| 5,000,000 | Navistar Financial Dealer Note Master Trust, Series 05-1, Class A, Variable Rate, 1 mo. LIBOR + .11%, 3.23%, due 02/25/13 | 4,842,000 | |||||||||||||
See accompanying notes to the financial statements.
3
GMO World Opportunity Overlay Fund
(A Series of GMO Trust)
Schedule of Investments — (Continued)
(showing percentage of total net assets)
February 29, 2008
| Par Value ($) | Description | Value ($) | |||||||||||||
| Business Loans — continued | |||||||||||||||
| 11,000,000 | Navistar Financial Dealer Note Master Trust, Series 98-1, Class A, Variable Rate, 1 mo. LIBOR + .16%, 3.28%, due 07/25/11 | 10,959,190 | |||||||||||||
| 4,000,000 | Textron Financial Floorplan Master Note, Series 05-1A, Class A, 144A, Variable Rate, 1 mo. LIBOR + .12%, 3.24%, due 05/13/10 | 3,985,000 | |||||||||||||
| Total Business Loans | 78,834,270 | ||||||||||||||
| CMBS — 4.1% | |||||||||||||||
| 4,043,125 | Bear Stearns Commercial Mortgage Securities, Inc., Series 05-PW10, Class A1, 5.09%, due 12/11/40 | 4,017,411 | |||||||||||||
| 7,000,000 | Citigroup/Deutsche Bank Commercial Mortgage, Series 05-CD1, Class A2FL, Variable Rate, 1 mo. LIBOR + .12%, 3.24%, due 07/15/44 | 6,698,300 | |||||||||||||
| 13,000,000 | Commercial Mortgage Pass-Through Certificates, Series 06-FL12, Class AJ, 144A, Variable Rate, 1 mo. LIBOR + .13%, 3.25%, due 12/15/20 | 12,857,000 | |||||||||||||
| 7,000,000 | GE Capital Commercial Mortgage Corp., Series 05-C4, Class A2, 5.30%, due 11/10/45 | 7,030,625 | |||||||||||||
| 4,000,000 | GE Capital Commercial Mortgage Corp., Series 06-C1, Class A2, Variable Rate, 5.34%, due 03/10/44 | 4,027,500 | |||||||||||||
| 2,011,423 | Greenwich Capital Commercial Funding Corp., Series 06-FL4, Class A1, 144A, Variable Rate, 1 mo. LIBOR + .09%, 3.31%, due 11/05/21 | 1,933,481 | |||||||||||||
| 7,000,000 | GS Mortgage Securities Corp., Series 06-GG6, Class A2, 5.51%, due 04/10/38 | 6,920,977 | |||||||||||||
| 1,579,948 | Lehman Brothers Floating Rate Commercial, Series 06-LLFA, Class A1, 144A, Variable Rate, 1 mo. LIBOR + .08%, 3.20%, due 09/15/21 | 1,573,117 | |||||||||||||
| 6,000,000 | Merrill Lynch Mortgage Trust, Series 06-C1, Class A2, Variable Rate, 5.61%, due 05/12/39 | 5,974,922 | |||||||||||||
| 3,000,000 | Morgan Stanley Capital I, Series 06-IQ11, Class A3, 5.74%, due 10/15/42 | 2,855,820 | |||||||||||||
| 7,890,862 | Wachovia Bank Commercial Mortgage Trust, Series 06-WL7A, Class A1, 144A, Variable Rate, 1 mo. LIBOR + .09%, 3.21%, due 09/15/21 | 7,299,048 | |||||||||||||
| Total CMBS | 61,188,201 | ||||||||||||||
| CMBS Collateralized Debt Obligations — 1.2% | |||||||||||||||
| 7,480,000 | American Capital Strategies Ltd Commercial Real Estate CDO Trust, Series 07-1A, Class A, 144A, Variable Rate, 3 mo. LIBOR + .80%, 3.89%, due 11/23/52 | 4,549,931 | |||||||||||||
| 7,000,000 | Guggenheim Structured Real Estate Funding, Series 05-2A, Class A, 144A, Variable Rate, 1 mo. LIBOR + .32%, 3.44%, due 08/26/30 | 6,405,000 | |||||||||||||
See accompanying notes to the financial statements.
4
GMO World Opportunity Overlay Fund
(A Series of GMO Trust)
Schedule of Investments — (Continued)
(showing percentage of total net assets)
February 29, 2008
| Par Value ($) | Description | Value ($) | |||||||||||||
| CMBS Collateralized Debt Obligations — continued | |||||||||||||||
| 7,400,000 | Marathon Real Estate CDO, Series 06-1A, Class A1, 144A, Variable Rate, 1 mo. LIBOR + .33%, 3.45%, due 05/25/46 | 6,512,000 | |||||||||||||
| Total CMBS Collateralized Debt Obligations | 17,466,931 | ||||||||||||||
| Credit Cards — 19.0% | |||||||||||||||
| 7,150,000 | Advanta Business Card Master Trust, Series 01-A, Class A, Variable Rate, 1 mo. LIBOR + .30%, 3.42%, due 10/20/10 | 7,129,551 | |||||||||||||
| 6,500,000 | Advanta Business Card Master Trust, Series 05-A1, Class A1, Variable Rate, 1 mo. LIBOR + .07%, 3.19%, due 04/20/11 | 6,473,025 | |||||||||||||
| 2,000,000 | Advanta Business Card Master Trust, Series 05-A5, Class A5, Variable Rate, 1 mo. LIBOR + .06%, 3.18%, due 04/20/12 | 1,942,100 | |||||||||||||
| 6,000,000 | American Express Credit Account Master Trust, Series 04-1, Class A, Variable Rate, 1 mo. LIBOR + .08%, 3.20%, due 09/15/11 | 5,961,780 | |||||||||||||
| 5,000,000 | American Express Credit Account Master Trust, Series 04-4, Class A, Variable Rate, 1 mo. LIBOR + .09%, 3.21%, due 03/15/12 | 4,938,640 | |||||||||||||
| 5,000,000 | American Express Credit Account Master Trust, Series 05-3, Class A, Variable Rate, 1 mo. LIBOR, 3.12%, due 01/18/11 | 4,986,500 | |||||||||||||
| 10,000,000 | American Express Credit Account Master Trust, Series 05-5, Class A, Variable Rate, 1 mo. LIBOR + .04%, 3.16%, due 02/15/13 | 9,848,900 | |||||||||||||
| 4,500,000 | American Express Credit Account Master Trust, Series 06-1, Class A, Variable Rate, 1 mo. LIBOR + .03%, 3.15%, due 12/15/13 | 4,381,155 | |||||||||||||
| 5,000,000 | American Express Issuance Trust, Series 07-1, Class A, Variable Rate, 1 mo. LIBOR + .20%, 3.32%, due 09/15/11 | 4,905,950 | |||||||||||||
| 6,000,000 | Arran, Series 2005-A, Class A, Variable Rate, 1 mo. LIBOR + .02%, 3.14%, due 12/15/10 | 5,925,000 | |||||||||||||
| 1,000,000 | Bank One Issuance Trust, Series 03-A10, Class A10, Variable Rate, 1 mo. LIBOR + .11%, 3.23%, due 06/15/11 | 995,100 | |||||||||||||
| 5,760,000 | Bank One Issuance Trust, Series 03-A6, Class A6, Variable Rate, 1 mo. LIBOR + .11%, 3.23%, due 02/15/11 | 5,751,149 | |||||||||||||
| 5,000,000 | Capital One Master Trust, Series 02-1A, Class A, Variable Rate, 1 mo. LIBOR + .20%, 3.32%, due 11/15/11 | 4,976,367 | |||||||||||||
| 5,530,000 | Capital One Multi-Asset Execution Trust, Series 03-A3, Class A3, Variable Rate, 1 mo. LIBOR + .25%, 3.37%, due 05/16/11 | 5,491,981 | |||||||||||||
| 5,000,000 | Capital One Multi-Asset Execution Trust, Series 04-A7, Class A7, Variable Rate, 3 mo. LIBOR + .15%, 3.22%, due 06/16/14 | 4,821,752 | |||||||||||||
| 11,000,000 | Capital One Multi-Asset Execution Trust, Series 06-A14, Class A, Variable Rate, 1 mo. LIBOR + .01%, 3.13%, due 08/15/13 | 10,672,200 | |||||||||||||
See accompanying notes to the financial statements.
5
GMO World Opportunity Overlay Fund
(A Series of GMO Trust)
Schedule of Investments — (Continued)
(showing percentage of total net assets)
February 29, 2008
| Par Value ($) | Description | Value ($) | |||||||||||||
| Credit Cards — continued | |||||||||||||||
| 9,000,000 | Charming Shoppes Master Trust, Series 07-1A, Class A1, 144A, Variable Rate, 1 mo. LIBOR + 1.25%, 4.37%, due 09/15/17 | 8,556,210 | |||||||||||||
| 7,875,000 | Chase Credit Card Master Trust, Series 03-3, Class A, Variable Rate, 1 mo. LIBOR + .11%, 3.23%, due 10/15/10 | 7,868,464 | |||||||||||||
| 3,000,000 | Chase Credit Card Master Trust, Series 03-5, Class A, Variable Rate, 1 mo. LIBOR + .12%, 3.24%, due 01/17/11 | 2,991,510 | |||||||||||||
| 2,000,000 | Chase Issuance Trust, Series 05-A3, Class A, Variable Rate, 1 mo. LIBOR + .02%, 3.14%, due 10/17/11 | 1,987,080 | |||||||||||||
| 4,500,000 | Chase Issuance Trust, Series 07-A1, Class A1, Variable Rate, 1 mo. LIBOR + .02%, 3.14%, due 03/15/13 | 4,403,475 | |||||||||||||
| 11,000,000 | Chase Issuance Trust, Series 07-A11, Class A11, Variable Rate, 1 mo. LIBOR, 3.12%, due 07/16/12 | 10,824,035 | |||||||||||||
| 9,000,000 | Citibank Credit Card Issuance Trust, Series 01-A7, Class A7, Variable Rate, 3 mo. LIBOR + .14%, 3.20%, due 08/15/13 | 8,786,700 | |||||||||||||
| 2,000,000 | Citibank Credit Card Issuance Trust, Series 06-A6, Class A6, Variable Rate, 1 mo. LIBOR + .01%, 3.13%, due 05/24/12 | 1,966,400 | |||||||||||||
| 10,000,000 | Discover Card Master Trust I, Series 04-2, Class A2, Variable Rate, 1 mo. LIBOR + .07%, 3.19%, due 05/15/12 | 9,795,400 | |||||||||||||
| 5,000,000 | Discover Card Master Trust I, Series 05-3, Class A, Variable Rate, 1 mo. LIBOR + .02%, 3.14%, due 05/15/11 | 4,965,600 | |||||||||||||
| 5,000,000 | Discover Card Master Trust I, Series 05-4, Class A1, Variable Rate, 1 mo. LIBOR + .06%, 3.18%, due 06/18/13 | 4,868,750 | |||||||||||||
| 6,150,000 | Discover Card Master Trust I, Series 06-2, Class A1, Variable Rate, 1 mo. LIBOR, 3.12%, due 01/17/12 | 6,057,750 | |||||||||||||
| 12,000,000 | First National Master Note Trust, Series 07-2, Class A, Variable Rate, 1 mo. LIBOR + .75%, 3.87%, due 11/15/12 | 11,895,000 | |||||||||||||
| 7,000,000 | GE Capital Credit Card Master Note Trust, Series 05-1, Class A, Variable Rate, 1 mo. LIBOR + .04%, 3.16%, due 03/15/13 | 6,826,964 | |||||||||||||
| 5,000,000 | GE Capital Credit Card Master Note Trust, Series 07-3, Class A1, Variable Rate, 1 mo. LIBOR + .01%, 3.13%, due 06/15/13 | 4,906,250 | |||||||||||||
| 12,000,000 | Household Credit Card Master Note Trust I, Series 07-1, Class A, Variable Rate, 1 mo. LIBOR + .05%, 3.17%, due 04/15/13 | 11,737,500 | |||||||||||||
| 6,000,000 | Household Credit Card Master Note Trust I, Series 07-2, Class A, Variable Rate, 1 mo. LIBOR + .55%, 3.67%, due 07/15/13 | 5,889,141 | |||||||||||||
| 17,000,000 | HSBC Private Label Credit Card Master Note, Series 07-1, Class A, Variable Rate, 1 mo. LIBOR + .02%, 3.14%, due 12/16/13 | 16,763,594 | |||||||||||||
See accompanying notes to the financial statements.
6
GMO World Opportunity Overlay Fund
(A Series of GMO Trust)
Schedule of Investments — (Continued)
(showing percentage of total net assets)
February 29, 2008
| Par Value ($) | Description | Value ($) | |||||||||||||
| Credit Cards — continued | |||||||||||||||
| 7,500,000 | MBNA Credit Card Master Note Trust, Series 04-A8, Class A8, Variable Rate, 1 mo. LIBOR + .15%, 3.27%, due 01/15/14 | 7,304,850 | |||||||||||||
| 5,000,000 | MBNA Credit Card Master Note Trust, Series 05-A5, Class A5, Variable Rate, 1 mo. LIBOR, 3.12%, due 12/15/10 | 4,987,500 | |||||||||||||
| 7,000,000 | Pillar Funding Plc, Series 04-2, Class A, 144A, Variable Rate, 3 mo. LIBOR + .14%, 5.13%, due 09/15/11 | 6,760,180 | |||||||||||||
| 16,500,000 | Turquoise Card Backed Securities Plc, Series 06-1A, Class A, 144A, Variable Rate, 1 mo. LIBOR + .01%, 3.13%, due 05/16/11 | 16,306,641 | |||||||||||||
| 8,415,000 | World Financial Network Credit Card Master Trust, Series 03-A, Class A2, Variable Rate, 1 mo. LIBOR + .37%, 3.49%, due 05/15/12 | 8,372,925 | |||||||||||||
| 15,400,000 | World Financial Network Credit Card Master Trust, Series 04-A, Class A, Variable Rate, 1 mo. LIBOR + .18%, 3.30%, due 03/15/13 | 14,982,506 | |||||||||||||
| 2,000,000 | World Financial Network Credit Card Master Trust, Series 06-A, Class A, 144A, Variable Rate, 1 mo. LIBOR + .13%, 3.25%, due 02/15/17 | 1,787,140 | |||||||||||||
| Total Credit Cards | 280,792,715 | ||||||||||||||
| Emerging Markets Collateralized Debt Obligations — 0.2% | |||||||||||||||
| 4,000,000 | Santiago CDO Ltd., Series 05-1A, Class A, 144A, Variable Rate, 6 mo. LIBOR + .40%, 5.53%, due 04/18/17 | 3,680,000 | |||||||||||||
| Equipment Leases — 1.3% | |||||||||||||||
| 6,490,296 | CNH Equipment Trust, Series 05-A, Class A4A, Variable Rate, 1 mo. LIBOR + .04%, 3.16%, due 06/15/12 | 6,420,980 | |||||||||||||
| 4,500,000 | CNH Equipment Trust, Series 07-B, Class A3B, Variable Rate, 1 mo. LIBOR + .60%, 3.72%, due 10/17/11 | 4,435,380 | |||||||||||||
| 9,000,000 | GE Equipment Midticket LLC, Series 07-1, Class A3B, Variable Rate, 1 mo. LIBOR + .25%, 3.37%, due 06/14/11 | 8,786,250 | |||||||||||||
| Total Equipment Leases | 19,642,610 | ||||||||||||||
| Insurance Premiums — 0.9% | |||||||||||||||
| 3,000,000 | AICCO Premium Finance Master Trust, Series 05-1, Class A, Variable Rate, 1 mo. LIBOR + .08%, 3.20%, due 04/15/10 | 2,980,200 | |||||||||||||
| 10,000,000 | AICCO Premium Finance Master Trust, Series 07-AA, Class A, 144A, Variable Rate, 1 mo. LIBOR + .05%, 3.17%, due 12/15/11 | 9,781,250 | |||||||||||||
| Total Insurance Premiums | 12,761,450 | ||||||||||||||
See accompanying notes to the financial statements.
7
GMO World Opportunity Overlay Fund
(A Series of GMO Trust)
Schedule of Investments — (Continued)
(showing percentage of total net assets)
February 29, 2008
| Par Value ($) | Description | Value ($) | |||||||||||||
| Insured Auto Financing — 6.8% | |||||||||||||||
| 5,000,000 | Aesop Funding II LLC, Series 05-1A, Class A3, 144A, MBIA, Variable Rate, 1 mo. LIBOR + .12%, 3.24%, due 04/20/11 | 4,560,650 | |||||||||||||
| 7,000,000 | Aesop Funding II LLC, Series 06-1, Class A1, 144A, MBIA, Variable Rate, 1 mo. LIBOR + .22%, 3.34%, due 03/20/12 | 6,059,550 | |||||||||||||
| 6,000,000 | AmeriCredit Automobile Receivables Trust, Series 05-BM, Class A4, MBIA, Variable Rate, 1 mo. LIBOR + .08%, 3.27%, due 05/06/12 | 5,527,331 | |||||||||||||
| 1,270,518 | AmeriCredit Automobile Receivables Trust, Series 06-RM, Class A1, MBIA, 5.37%, due 10/06/09 | 1,267,869 | |||||||||||||
| 4,000,000 | AmeriCredit Automobile Receivables Trust, Series 07-AX, Class A4, XL, Variable Rate, 1 mo. LIBOR + .04%, 3.23%, due 10/06/13 | 3,550,000 | |||||||||||||
| 8,000,000 | AmeriCredit Automobile Receivables Trust, Series 07-CM, Class A3B, MBIA, Variable Rate, 1 mo. LIBOR + .03%, 3.22%, due 05/07/12 | 7,298,296 | |||||||||||||
| 3,000,000 | AmeriCredit Automobile Receivables Trust, Series 07-DF, Class A4B, FSA, Variable Rate, 1 mo. LIBOR + .80%, 3.99%, due 06/06/14 | 2,786,599 | |||||||||||||
| 7,000,000 | AmeriCredit Prime Automobile Receivables Trust, Series 07-2M, Class A4B, MBIA, Variable Rate, 1 mo. LIBOR + .50%, 3.69%, due 03/08/16 | 6,187,510 | |||||||||||||
| 7,000,000 | ARG Funding Corp., Series 05-2A, Class A3, 144A, AMBAC, Variable Rate, 1 mo. LIBOR + .14%, 3.26%, due 05/20/10 | 6,534,852 | |||||||||||||
| 6,000,000 | Capital One Auto Finance Trust, Series 06-B, Class A4, MBIA, Variable Rate, 1 mo. LIBOR + .02%, 3.14%, due 07/15/13 | 5,672,220 | |||||||||||||
| 12,000,000 | Capital One Auto Finance Trust, Series 07-A, Class A4, AMBAC, Variable Rate, 1 mo. LIBOR + .02%, 3.14%, due 11/15/13 | 10,662,360 | |||||||||||||
| 2,000,000 | Capital One Auto Finance Trust, Series 07-C, Class A3B, FGIC, Variable Rate, 1 mo. LIBOR + .51%, 3.63%, due 04/16/12 | 1,839,540 | |||||||||||||
| 3,000,000 | Hertz Vehicle Financing LLC, Series 05-1A, Class A1, 144A, MBIA, Variable Rate, 1 mo. LIBOR + .14%, 3.26%, due 02/25/10 | 2,849,694 | |||||||||||||
| 2,000,000 | Hertz Vehicle Financing LLC, Series 05-2A, Class A5, 144A, AMBAC, Variable Rate, 1 mo. LIBOR + .25%, 3.37%, due 11/25/11 | 1,695,442 | |||||||||||||
| 4,666,667 | Rental Car Finance Corp., Series 04-1A, Class A, 144A, AMBAC, Variable Rate, 1 mo. LIBOR + .20%, 3.32%, due 06/25/09 | 4,617,349 | |||||||||||||
| 13,000,000 | Santander Drive Auto Receivables Trust, Series 07-3, Class A4B, FGIC, Variable Rate, 1 mo. LIBOR + .65%, 3.77%, due 10/15/14 | 11,139,440 | |||||||||||||
| 13,000,000 | Triad Auto Receivables Owner Trust, Series 07-B, Class A4B, FSA, Variable Rate, 1 mo. LIBOR + 1.20%, 4.33%, due 07/14/14 | 12,849,200 | |||||||||||||
| 5,000,000 | UPFC Auto Receivables Trust, Series 06-B, Class A3, AMBAC, 5.01%, due 08/15/12 | 4,950,000 | |||||||||||||
| Total Insured Auto Financing | 100,047,902 | ||||||||||||||
See accompanying notes to the financial statements.
8
GMO World Opportunity Overlay Fund
(A Series of GMO Trust)
Schedule of Investments — (Continued)
(showing percentage of total net assets)
February 29, 2008
| Par Value ($) | Description | Value ($) | |||||||||||||
| Insured Credit Cards — 0.5% | |||||||||||||||
| 7,000,000 | Cabela's Master Credit Card Trust, Series 04-2A, Class A, 144A, AMBAC, Variable Rate, 1 mo. LIBOR + .12%, 3.24%, due 03/15/11 | 6,793,360 | |||||||||||||
| Insured Other — 1.3% | |||||||||||||||
| 5,500,000 | DB Master Finance LLC, Series 06-1, Class A2, 144A, AMBAC, 5.78%, due 06/20/31 | 4,857,124 | |||||||||||||
| 4,188,964 | Henderson Receivables LLC, Series 06-3A, Class A1, 144A, MBIA, Variable Rate, 1 mo. LIBOR + .20%, 3.32%, due 09/15/41 | 3,312,674 | |||||||||||||
| 4,206,746 | Henderson Receivables LLC, Series 06-4A, Class A1, 144A, MBIA, Variable Rate, 1 mo. LIBOR + .20%, 3.32%, due 12/15/41 | 3,334,099 | |||||||||||||
| 5,953,000 | TIB Card Receivables Fund, 144A, FGIC, Variable Rate, 3 mo. LIBOR + .25%, 4.90%, due 01/05/14 | 5,688,687 | |||||||||||||
| 10,200,000 | Toll Road Investment Part II, Series C, 144A, MBIA, Zero Coupon, due 02/15/37 | 1,291,932 | |||||||||||||
| Total Insured Other | 18,484,516 | ||||||||||||||
| Insured Residential Asset-Backed Securities (United States) — 0.9% | |||||||||||||||
| 14,917,025 | Ameriquest Mortgage Securities, Inc., Series 04-R6, Class A1, XL, Variable Rate, 1 mo. LIBOR + .21%, 3.33%, due 07/25/34 | 13,056,872 | |||||||||||||
| Insured Residential Mortgage-Backed Securities (United States) — 0.1% | |||||||||||||||
| 1,670,289 | SBI Heloc Trust, Series 05-HE1, Class 1A, 144A, FSA, Variable Rate, 1 mo. LIBOR + .19%, 3.31%, due 11/25/35 | 1,503,260 | |||||||||||||
| Insured Time Share — 0.7% | |||||||||||||||
| 1,914,276 | Cendant Timeshare Receivables Funding LLC, Series 05-1A, Class A2, 144A, FGIC, Variable Rate, 1 mo. LIBOR + .18%, 3.30%, due 05/20/17 | 1,755,152 | |||||||||||||
| 1,739,948 | Sierra Receivables Funding Co., Series 06-1A, Class A2, 144A, MBIA, Variable Rate, 1 mo. LIBOR + .15%, 3.27%, due 05/20/18 | 1,473,509 | |||||||||||||
| 9,097,199 | Sierra Receivables Funding Co., Series 07-2A, Class A2, 144A, MBIA, Variable Rate, 1 mo. LIBOR + 1.00%, 4.12%, due 09/20/19 | 7,840,430 | |||||||||||||
| Total Insured Time Share | 11,069,091 | ||||||||||||||
| Insured Transportation — 0.6% | |||||||||||||||
| 8,500,000 | CLI Funding LLC, Series 06-1A, Class A, 144A, AMBAC, Variable Rate, 1 mo. LIBOR + .18%, 3.29%, due 08/18/21 | 8,308,070 | |||||||||||||
See accompanying notes to the financial statements.
9
GMO World Opportunity Overlay Fund
(A Series of GMO Trust)
Schedule of Investments — (Continued)
(showing percentage of total net assets)
February 29, 2008
| Par Value ($) | Description | Value ($) | |||||||||||||
| Investment Grade Corporate Collateralized Debt Obligations — 3.8% | |||||||||||||||
| 2,000,000 | Morgan Stanley ACES SPC, Series 04-12, Class A, 144A, Variable Rate, 3 mo. LIBOR + .60%, 3.70%, due 08/05/09 | 1,883,000 | |||||||||||||
| 5,000,000 | Morgan Stanley ACES SPC, Series 04-15, Class II, 144A, Variable Rate, 3 mo. LIBOR + .65%, 5.58%, due 12/20/09 | 4,515,000 | |||||||||||||
| 3,000,000 | Morgan Stanley ACES SPC, Series 04-15, Class III, 144A, Variable Rate, 3 mo. LIBOR + .75%, 5.68%, due 12/20/09 | 2,595,000 | |||||||||||||
| 6,000,000 | Morgan Stanley ACES SPC, Series 04-16, Class I, 144A, Variable Rate, 3 mo. LIBOR + .40%, 3.50%, due 08/05/09 | 5,814,000 | |||||||||||||
| 3,000,000 | Morgan Stanley ACES SPC, Series 05-10, Class A1, 144A, Variable Rate, 3 mo. LIBOR + .52%, 5.45%, due 03/20/10 | 2,713,500 | |||||||||||||
| 6,000,000 | Morgan Stanley ACES SPC, Series 05-15, Class A, 144A, Variable Rate, 3 mo. LIBOR + .40%, 5.33%, due 12/20/10 | 5,520,000 | |||||||||||||
| 3,000,000 | Morgan Stanley ACES SPC, Series 05-2A, Class A, 144A, Variable Rate, 3 mo. LIBOR + .45%, 5.38%, due 03/20/10 | 2,761,500 | |||||||||||||
| 9,000,000 | Morgan Stanley ACES SPC, Series 06-13A, Class A, 144A, Variable Rate, 3 mo. LIBOR + .29%, 5.22%, due 06/20/13 | 6,510,600 | |||||||||||||
| 10,000,000 | Prism Orso Trust, Series 04-MAPL, Class CERT, 144A, Variable Rate, 3 mo. LIBOR + .70%, 5.63%, due 08/01/11 | 9,268,000 | |||||||||||||
| 9,000,000 | Reve SPC, 144A, Variable Rate, 3 mo. LIBOR + .22%, 5.15%, due 03/20/14 | 7,425,000 | |||||||||||||
| 7,000,000 | Salisbury International Investments Ltd., Series EMTN, Variable Rate, 3 mo. LIBOR + .42%, 5.35%, due 06/22/10 | 6,764,100 | |||||||||||||
| Total Investment Grade Corporate Collateralized Debt Obligations | 55,769,700 | ||||||||||||||
| Residential Asset-Backed Securities (United States) — 19.4% | |||||||||||||||
| 5,863,807 | Accredited Mortage Loan Trust, Series 07-1, Class A1, Variable Rate, 1 mo. LIBOR + .05%, 3.17%, due 02/25/37 | 5,643,760 | |||||||||||||
| 2,743,669 | ACE Securities Corp., Series 05-AG1, Class A2B, Variable Rate, 1 mo. LIBOR + .21%, 3.33%, due 08/25/35 | 2,596,142 | |||||||||||||
| 1,534,000 | ACE Securities Corp., Series 05-ASP1, Class A2C, Variable Rate, 1 mo. LIBOR + .27%, 3.39%, due 09/25/35 | 1,269,201 | |||||||||||||
| 824,647 | ACE Securities Corp., Series 05-SDI, Class A1, Variable Rate, 1 mo. LIBOR + .40%, 3.52%, due 11/25/50 | 657,953 | |||||||||||||
| 10,000,000 | ACE Securities Corp., Series 06-ASP5, Class A2C, Variable Rate, 1 mo. LIBOR + .18%, 3.30%, due 10/25/36 | 8,151,200 | |||||||||||||
| 1,727,252 | ACE Securities Corp., Series 06-CW1, Class A2A, Variable Rate, 1 mo. LIBOR + .05%, 3.17%, due 07/25/36 | 1,674,260 | |||||||||||||
See accompanying notes to the financial statements.
10
GMO World Opportunity Overlay Fund
(A Series of GMO Trust)
Schedule of Investments — (Continued)
(showing percentage of total net assets)
February 29, 2008
| Par Value ($) | Description | Value ($) | |||||||||||||
| Residential Asset-Backed Securities (United States) — continued | |||||||||||||||
| 5,000,000 | ACE Securities Corp., Series 06-CW1, Class A2B, Variable Rate, 1 mo. LIBOR + .10%, 3.22%, due 07/25/36 | 4,560,800 | |||||||||||||
| 13,000,000 | ACE Securities Corp., Series 06-HE2, Class A2C, Variable Rate, 1 mo. LIBOR + .16%, 3.28%, due 05/25/36 | 10,712,650 | |||||||||||||
| 3,500,000 | ACE Securities Corp., Series 06-HE3, Class A2B, Variable Rate, 1 mo. LIBOR + .09%, 3.21%, due 06/25/36 | 3,209,465 | |||||||||||||
| 1,472,265 | ACE Securities Corp., Series 06-SL1, Class A, Variable Rate, 1 mo. LIBOR + .16%, 3.28%, due 09/25/35 | 956,972 | |||||||||||||
| 2,842,284 | ACE Securities Corp., Series 06-SL3, Class A1, Variable Rate, 1 mo. LIBOR + .10%, 3.22%, due 06/25/36 | 1,136,913 | |||||||||||||
| 3,000,000 | ACE Securities Corp., Series 06-SL3, Class A2, Variable Rate, 1 mo. LIBOR + .17%, 3.29%, due 06/25/36 | 900,000 | |||||||||||||
| 2,068,367 | ACE Securities Corp., Series 06-SL4, Class A1, Variable Rate, 1 mo. LIBOR + .12%, 3.24%, due 09/25/36 | 1,034,184 | |||||||||||||
| 6,103,732 | ACE Securities Corp., Series 07-ASL1, Class A2, Variable Rate, 1 mo. LIBOR + .17%, 3.29%, due 12/25/36 | 2,563,568 | |||||||||||||
| 4,921,292 | ACE Securities Corp., Series 07-WM1, Class A2A, Variable Rate, 1 mo. LIBOR + .07%, 3.19%, due 11/25/36 | 4,603,328 | |||||||||||||
| 780,821 | Aegis Asset Backed Securities Trust, Series 05-5, Class 1A2, Variable Rate, 1 mo. LIBOR + .18%, 3.30%, due 12/25/35 | 778,502 | |||||||||||||
| 14,000,000 | Argent Securities, Inc., Series 06-M1, Class AC2, Variable Rate, 1 mo. LIBOR + .15%, 3.27%, due 07/25/36 | 10,396,400 | |||||||||||||
| 12,000,000 | Argent Securities, Inc., Series 06-M2, Class A2B, Variable Rate, 1 mo. LIBOR + .11%, 3.23%, due 09/25/36 | 11,183,880 | |||||||||||||
| 7,000,000 | Argent Securities, Inc., Series 06-M2, Class A2C, Variable Rate, 1 mo. LIBOR + .15%, 3.27%, due 09/25/36 | 5,348,280 | |||||||||||||
| 6,102,727 | Argent Securities, Inc., Series 06-W2, Class A2B, Variable Rate, 1 mo. LIBOR + .19%, 3.31%, due 03/25/36 | 5,672,485 | |||||||||||||
| 12,000,000 | Argent Securities, Inc., Series 06-W4, Class A2B, Variable Rate, 1 mo. LIBOR + .11%, 3.23%, due 05/25/36 | 11,599,320 | |||||||||||||
| 2,500,000 | Argent Securities, Inc., Series 06-W5, Class A2C, Variable Rate, 1 mo. LIBOR + .15%, 3.27%, due 06/25/36 | 2,091,016 | |||||||||||||
| 4,500,000 | Asset Backed Funding Certificates, Series 06-OPT2, Class A3B, Variable Rate, 1 mo. LIBOR + .11%, 3.23%, due 10/25/36 | 4,128,750 | |||||||||||||
| 3,000,000 | Asset Backed Funding Certificates, Series 06-OPT2, Class A3C, Variable Rate, 1 mo. LIBOR + .15%, 3.27%, due 10/25/36 | 2,475,937 | |||||||||||||
See accompanying notes to the financial statements.
11
GMO World Opportunity Overlay Fund
(A Series of GMO Trust)
Schedule of Investments — (Continued)
(showing percentage of total net assets)
February 29, 2008
| Par Value ($) | Description | Value ($) | |||||||||||||
| Residential Asset-Backed Securities (United States) — continued | |||||||||||||||
| 1,143,363 | Asset Backed Funding Certificates, Series 06-OPT3, Class A3A, Variable Rate, 1 mo. LIBOR + .06%, 3.18%, due 11/25/36 | 1,104,775 | |||||||||||||
| 12,437,350 | Asset Backed Funding Certificates, Series 07-NC1, Class A1, 144A, Variable Rate, 1 mo. LIBOR + .22%, 3.34%, due 05/25/37 | 11,590,056 | |||||||||||||
| 6,500,000 | Bayview Financial Acquisition Trust, Series 05-A, Class A1, 144A, Variable Rate, 1 mo. LIBOR + .50%, 3.62%, due 02/28/40 | 6,012,500 | |||||||||||||
| 5,523,951 | Bear Stearns Asset Backed Securities, Inc., Series 07-AQ1, Class A1, Variable Rate, 1 mo. LIBOR + .11%, 3.23%, due 11/25/36 | 5,284,819 | |||||||||||||
| 6,000,000 | Bear Stearns Asset Backed Securities, Inc., Series 07-AQ1, Class A2, Variable Rate, 1 mo. LIBOR + .20%, 3.32%, due 11/25/36 | 4,200,000 | |||||||||||||
| 4,031,325 | Bear Stearns Mortgage Funding Trust, Series 07-SL2, Class 1A, Variable Rate, 1 mo. LIBOR + .16%, 3.28%, due 02/25/37 | 1,693,156 | |||||||||||||
| 703,007 | Centex Home Equity, Series 05-C, Class AV3, Variable Rate, 1 mo. LIBOR + .23%, 3.35%, due 06/25/35 | 700,370 | |||||||||||||
| 3,000,000 | Centex Home Equity, Series 06-A, Class AV3, Variable Rate, 1 mo. LIBOR + .16%, 3.28%, due 06/25/36 | 2,597,400 | |||||||||||||
| 3,500,000 | Citigroup Mortgage Loan Trust, Inc., Series 06-HE3, Class A2C, Variable Rate, 1 mo. LIBOR + .16%, 3.28%, due 12/25/36 | 2,502,500 | |||||||||||||
| 8,000,000 | Citigroup Mortgage Loan Trust, Inc., Series 06-WFH4, Class A3, Variable Rate, 1 mo. LIBOR + .15%, 3.27%, due 11/25/36 | 6,829,600 | |||||||||||||
| 9,712,000 | Countrywide Asset-Backed Certificates, Series 06-BC3, Class 2A2, Variable Rate, 1 mo. LIBOR + .14%, 3.26%, due 02/25/37 | 8,665,685 | |||||||||||||
| 5,536,212 | Countrywide Asset-Backed Certificates, Series 06-BC5, Class 2A1, Variable Rate, 1 mo. LIBOR + .08%, 3.20%, due 03/25/37 | 5,341,553 | |||||||||||||
| 2,491,407 | Credit-Based Asset Servicing & Securitization, Series 06-RP1, Class A1, 144A, Variable Rate, 1 mo. LIBOR + .11%, 3.23%, due 04/25/36 | 2,413,551 | |||||||||||||
| 5,000,000 | Fremont Home Loan Trust, Series 06-B, Class 2A3, Variable Rate, 1 mo. LIBOR + .16%, 3.28%, due 08/25/36 | 3,475,000 | |||||||||||||
| 4,867,655 | GE-WMC Mortgage Securities, Series 05-2, Class A2B, Variable Rate, 1 mo. LIBOR + .17%, 3.29%, due 12/25/35 | 4,758,133 | |||||||||||||
| 10,000,000 | GE-WMC Mortgage Securities, Series 06-1, Class A2B, Variable Rate, 1 mo. LIBOR + .15%, 3.27%, due 08/25/36 | 7,909,000 | |||||||||||||
| 1,755,112 | Household Home Equity Loan Trust, Series 05-2, Class A2, Variable Rate, 1 mo. LIBOR + .31%, 3.43%, due 01/20/35 | 1,602,362 | |||||||||||||
| 1,268,723 | Household Home Equity Loan Trust, Series 05-3, Class A2, Variable Rate, 1 mo. LIBOR + .29%, 3.41%, due 01/20/35 | 1,144,824 | |||||||||||||
See accompanying notes to the financial statements.
12
GMO World Opportunity Overlay Fund
(A Series of GMO Trust)
Schedule of Investments — (Continued)
(showing percentage of total net assets)
February 29, 2008
| Par Value ($) | Description | Value ($) | |||||||||||||
| Residential Asset-Backed Securities (United States) — continued | |||||||||||||||
| 8,204,122 | Household Home Equity Loan Trust, Series 06-2, Class A1, Variable Rate, 1 mo. LIBOR + .15%, 3.27%, due 03/20/36 | 7,669,787 | |||||||||||||
| 9,000,000 | J.P. Morgan Mortgage Acquisition Corp., Series 06-WMC4, Class A3, Variable Rate, 1 mo. LIBOR + .12%, 3.24%, due 12/25/36 | 7,487,100 | |||||||||||||
| 2,100,000 | Master Asset-Backed Securities Trust, Series 05-FRE1, Class A4, Variable Rate, 1 mo. LIBOR + .25%, 3.37%, due 10/25/35 | 1,890,000 | |||||||||||||
| 5,000,000 | Master Asset-Backed Securities Trust, Series 06-FRE2, Class A4, Variable Rate, 1 mo. LIBOR + .15%, 3.27%, due 03/25/36 | 3,350,000 | |||||||||||||
| 3,000,000 | Master Asset-Backed Securities Trust, Series 06-HE2, Class A3, Variable Rate, 1 mo. LIBOR + .15%, 3.27%, due 06/25/36 | 2,070,000 | |||||||||||||
| 6,760,000 | Master Asset-Backed Securities Trust, Series 06-HE3, Class A3, Variable Rate, 1 mo. LIBOR + .15%, 3.27%, due 08/25/36 | 5,272,800 | |||||||||||||
| 4,000,000 | Master Asset-Backed Securities Trust, Series 06-NC3, Class A4, Variable Rate, 1 mo. LIBOR + .16%, 3.28%, due 10/25/36 | 2,720,000 | |||||||||||||
| 2,497,827 | Master Second Lien Trust, Series 06-1, Class A, Variable Rate, 1 mo. LIBOR + .16%, 3.28%, due 03/25/36 | 1,099,044 | |||||||||||||
| 5,498,533 | Merrill Lynch Mortgage Trust, Series 06-SD1, Class A, Variable Rate, 1 mo. LIBOR + .28%, 3.40%, due 01/25/47 | 4,879,089 | |||||||||||||
| 3,000,000 | Morgan Stanley Home Equity Loans, Series 06-3, Class A3, Variable Rate, 1 mo. LIBOR + .16%, 3.28%, due 04/25/36 | 2,325,000 | |||||||||||||
| 2,500,000 | Morgan Stanley IXIS Real Estate Capital Trust, Series 06-2, Class A3, Variable Rate, 1 mo. LIBOR + .15%, 3.27%, due 11/25/36 | 1,912,500 | |||||||||||||
| 10,000,000 | Nationstar Home Equity Loan Trust, Series 06-B, Class AV3, Variable Rate, 1 mo. LIBOR + .17%, 3.29%, due 09/25/36 | 8,550,000 | |||||||||||||
| 10,000,000 | Nomura Home Equity Loan, Inc., Series 06-HE3, Class 2A3, Variable Rate, 1 mo. LIBOR + .15%, 3.27%, due 07/25/36 | 7,650,000 | |||||||||||||
| 1,619,045 | Option One Mortgage Loan Trust, Series 05-3, Class A4, Variable Rate, 1 mo. LIBOR + .25%, 3.37%, due 08/25/35 | 1,555,548 | |||||||||||||
| 982,042 | People's Choice Home Loan Securities Trust, Series 05-3, Class 1A2, Variable Rate, 1 mo. LIBOR + .27%, 3.39%, due 08/25/35 | 933,048 | |||||||||||||
| 4,479,979 | People's Choice Home Loan Securities Trust, Series 05-4, Class 1A2, Variable Rate, 1 mo. LIBOR + .26%, 3.38%, due 12/25/35 | 4,009,582 | |||||||||||||
| 226,880 | RAAC Series Trust, Series 05-RP3, Class A1, 144A, Variable Rate, 1 mo. LIBOR + .23%, 3.35%, due 05/25/39 | 225,430 | |||||||||||||
| 1,916,060 | Residential Asset Mortgage Products, Inc., Series 05-RS4, Class A3, Variable Rate, 1 mo. LIBOR + .23%, 3.35%, due 04/25/35 | 1,754,692 | |||||||||||||
See accompanying notes to the financial statements.
13
GMO World Opportunity Overlay Fund
(A Series of GMO Trust)
Schedule of Investments — (Continued)
(showing percentage of total net assets)
February 29, 2008
| Par Value ($) | Description | Value ($) | |||||||||||||
| Residential Asset-Backed Securities (United States) — continued | |||||||||||||||
| 8,000,000 | Saxon Asset Securities Trust, Series 06-3, Class A2, Variable Rate, 1 mo. LIBOR + .11%, 3.23%, due 11/25/36 | 7,035,992 | |||||||||||||
| 10,000,000 | Securitized Asset-Backed Receivables LLC Trust, Series 06-HE1, Class A2C, Variable Rate, 1 mo. LIBOR + .16%, 3.28%, due 07/25/36 | 8,154,700 | |||||||||||||
| 1,982 | Security National Mortgage Loan Trust, Series 05-2A, Class A1, 144A, Variable Rate, 1 mo. LIBOR + .29%, 3.41%, due 02/25/36 | 1,966 | |||||||||||||
| 5,374,153 | Security National Mortgage Loan Trust, Series 06-2A, Class A1, 144A, Variable Rate, 1 mo. LIBOR + .29%, 3.41%, due 10/25/36 | 5,186,057 | |||||||||||||
| 1,383,973 | SG Mortgage Securities Trust, Series 05-OPT1, Class A2, Variable Rate, 1 mo. LIBOR + .26%, 3.38%, due 10/25/35 | 1,301,792 | |||||||||||||
| 10,020,997 | Soundview Home Equity Loan Trust, Series 07-NS1, Class A1, Variable Rate, 1 mo. LIBOR + .12%, 3.24%, due 01/25/37 | 9,516,815 | |||||||||||||
| 4,000,000 | Specialty Underwriting & Residential Finance, Series 06-BC3, Class A2C, Variable Rate, 1 mo. LIBOR + .15%, 3.27%, due 06/25/37 | 3,560,000 | |||||||||||||
| 3,000,000 | Structured Asset Investment Loan Trust, Series 06-1, Class A3, Variable Rate, 1 mo. LIBOR + .20%, 3.32%, due 01/25/36 | 2,611,244 | |||||||||||||
| 2,599,087 | Structured Asset Securities Corp., Series 05-S6, Class A2, Variable Rate, 1 mo. LIBOR + .29%, 3.41%, due 11/25/35 | 2,409,106 | |||||||||||||
| Total Residential Asset-Backed Securities (United States) | 286,301,542 | ||||||||||||||
| Residential Mortgage-Backed Securities (Australian) — 2.3% | |||||||||||||||
| 2,383,524 | Australian Mortgage Securities II, Series G3, Class A1A, Variable Rate, 3 mo. LIBOR + .21%, 4.72%, due 01/10/35 | 2,329,918 | |||||||||||||
| 2,925,867 | Crusade Global Trust, Series 04-2, Class A1, Variable Rate, 3 mo. LIBOR + .13%, 3.20%, due 11/19/37 | 2,523,882 | |||||||||||||
| 4,515,057 | Crusade Global Trust, Series 06-1, Class A1, 144A, Variable Rate, 3 mo. LIBOR + .06%, 3.95%, due 07/20/38 | 4,256,209 | |||||||||||||
| 6,466,942 | Interstar Millennium Trust, Series 05-1G, Class A, Variable Rate, 3 mo. LIBOR + .12%, 5.27%, due 12/08/36 | 5,807,120 | |||||||||||||
| 2,690,949 | Medallion Trust, Series 05-1G, Class A1, Variable Rate, 3 mo. LIBOR + .08%, 3.18%, due 05/10/36 | 2,581,751 | |||||||||||||
| 2,102,902 | National RMBS Trust, Series 04-1, Class A1, Variable Rate, 3 mo. LIBOR + .11%, 5.04%, due 03/20/34 | 2,007,430 | |||||||||||||
| 6,679,653 | National RMBS Trust, Series 06-3, Class A1, 144A, Variable Rate, 3 mo. LIBOR + .07%, 3.96%, due 10/20/37 | 6,328,704 | |||||||||||||
| 7,286,100 | Puma Finance Ltd., Series G5, Class A1, 144A, Variable Rate, 3 mo. LIBOR + .07%, 3.14%, due 02/21/38 | 6,684,268 | |||||||||||||
See accompanying notes to the financial statements.
14
GMO World Opportunity Overlay Fund
(A Series of GMO Trust)
Schedule of Investments — (Continued)
(showing percentage of total net assets)
February 29, 2008
| Par Value ($) | Description | Value ($) | |||||||||||||
| Residential Mortgage-Backed Securities (Australian) — continued | |||||||||||||||
| 1,755,673 | Westpac Securitization Trust, Series 05-1G, Class A1, Variable Rate, 3 mo. LIBOR + .07%, 4.95%, due 03/23/36 | 1,682,163 | |||||||||||||
| Total Residential Mortgage-Backed Securities (Australian) | 34,201,445 | ||||||||||||||
| Residential Mortgage-Backed Securities (European) — 6.7% | |||||||||||||||
| 11,000,000 | Aire Valley Mortgages, Series 06-1A, Class 1A, 144A, Variable Rate, 3 mo. LIBOR + .11%, 5.04%, due 09/20/66 | 10,759,100 | |||||||||||||
| 4,000,000 | Arkle Master Issuer Plc, Series 06-1A, Class 3A, 144A, Variable Rate, 3 mo. LIBOR + .05%, 3.12%, due 08/17/11 | 3,890,040 | |||||||||||||
| 3,500,000 | Arkle Master Issuer Plc, Series 06-1A, Class 4A1, 144A, Variable Rate, 3 mo. LIBOR + .09%, 3.16%, due 02/17/52 | 3,318,000 | |||||||||||||
| 10,000,000 | Arran Residential Mortgages Funding Plc, Series 06-2A, Class A2B, 144A, Variable Rate, 3 mo. LIBOR + .05%, 4.98%, due 09/20/56 | 9,875,000 | |||||||||||||
| 7,000,000 | Brunel Residential Mortgages, Series 07-1A, Class A4C, 144A, Variable Rate, 3 mo. LIBOR + .10%, 4.48%, due 01/13/39 | 6,555,500 | |||||||||||||
| 2,121,833 | Gracechurch Mortgage Financing Plc, Series 06-1, Class A1, 144A, Variable Rate, 3 mo. LIBOR + .03%, 3.10%, due 11/20/31 | 2,109,526 | |||||||||||||
| 1,755,027 | Gracechurch Mortgage Funding Plc, Series 1A, Class A2B, 144A, Variable Rate, 3 mo. LIBOR + .07%, 4.51%, due 10/11/41 | 1,708,256 | |||||||||||||
| 7,500,000 | Granite Master Issuer Plc, Series 06-3, Class A3, Variable Rate, 3 mo. LIBOR + .04%, 3.93%, due 12/20/54 | 7,241,250 | |||||||||||||
| 10,000,000 | Holmes Financing Plc, Series 10A, Class 4A1, 144A, Variable Rate, 3 mo. LIBOR + .08%, 4.34%, due 07/15/40 | 9,636,100 | |||||||||||||
| 14,000,000 | Kildare Securities Ltd., Series 07-1A, Class A2, 144A, Variable Rate, 3 mo. LIBOR + .06%, 3.05%, due 12/10/43 | 13,826,400 | |||||||||||||
| 2,026,850 | Leek Finance Plc, Series 15A, Class AB, 144A, Variable Rate, 3 mo. LIBOR + .14%, 5.05%, due 03/21/37 | 1,991,380 | |||||||||||||
| 6,459,300 | Leek Finance Plc, Series 16A, Class A2B, 144A, Variable Rate, 3 mo. LIBOR + .16%, 5.07%, due 09/21/37 | 6,138,079 | |||||||||||||
| 3,000,000 | Mound Financing Plc, Series 5A, Class 2A, 144A, Variable Rate, 3 mo. LIBOR + .04%, 3.17%, due 05/08/16 | 2,921,250 | |||||||||||||
| 4,422,976 | Paragon Mortgages Plc, Series 12A, Class A2C, 144A, Variable Rate, 3 mo. LIBOR + .11%, 3.18%, due 11/15/38 | 3,943,127 | |||||||||||||
| 3,821,048 | Paragon Mortgages Plc, Series 14A, Class A2C, 144A, Variable Rate, 3 mo. LIBOR, 5.09%, due 09/15/39 | 3,415,368 | |||||||||||||
| 5,000,000 | Permanent Master Issuer Plc, Series 07-1, Class 4A, Variable Rate, 3 mo. LIBOR + .08%, 4.34%, due 10/15/33 | 4,743,500 | |||||||||||||
See accompanying notes to the financial statements.
15
GMO World Opportunity Overlay Fund
(A Series of GMO Trust)
Schedule of Investments — (Continued)
(showing percentage of total net assets)
February 29, 2008
| Par Value ($) | Description | Value ($) | |||||||||||||
| Residential Mortgage-Backed Securities (European) — continued | |||||||||||||||
| 6,870,981 | RMAC Securities Plc, Series 06-NS4A, Class A1B, 144A, Variable Rate, 3 mo. LIBOR + .07%, 5.20%, due 06/12/25 | 6,850,368 | |||||||||||||
| Total Residential Mortgage-Backed Securities (European) | 98,922,244 | ||||||||||||||
| Residential Mortgage-Backed Securities (United States) — 0.0% | |||||||||||||||
| 643,097 | GreenPoint Mortgage Funding Trust, Series 05-HE4, Class 2A3C, Variable Rate, 1 mo. LIBOR + .25%, 3.37%, due 07/25/30 | 633,451 | |||||||||||||
| Student Loans — 6.7% | |||||||||||||||
| 5,000,000 | College Loan Corp. Trust, Series 04-1, Class A2, Variable Rate, 3 mo. LIBOR + .11%, 3.44%, due 04/25/16 | 4,982,031 | |||||||||||||
| 7,720,000 | College Loan Corp. Trust, Series 07-1, Class A1, Variable Rate, 3 mo. LIBOR + .01%, 3.34%, due 01/25/23 | 7,593,392 | |||||||||||||
| 4,000,000 | College Loan Corp. Trust, Series 07-2, Class A1, Variable Rate, 3 mo. LIBOR + .25%, 3.58%, due 01/25/24 | 3,961,250 | |||||||||||||
| 271,926 | Collegiate Funding Services Education Loan Trust I, Series 05-A, Class A1, Variable Rate, 3 mo. LIBOR + .02%, 4.86%, due 09/29/14 | 271,883 | |||||||||||||
| 2,114,790 | Goal Capital Funding Trust, Series 06-1, Class A1, Variable Rate, 3 mo. LIBOR, 3.09%, due 08/25/20 | 2,098,972 | |||||||||||||
| 1,964,779 | Keycorp Student Loan Trust, Series 05-A, Class 2A1, Variable Rate, 3 mo. LIBOR + .05%, 4.91%, due 09/27/21 | 1,932,459 | |||||||||||||
| 2,485,319 | Montana Higher Education Student Assistance Corp., Series 05-1, Class A, Variable Rate, 3 mo. LIBOR + .04%, 4.97%, due 06/20/15 | 2,455,247 | |||||||||||||
| 8,000,000 | National Collegiate Student Loan Trust, Series 05-2, Class A2, Variable Rate, 1 mo. LIBOR + .15%, 3.27%, due 02/25/26 | 7,715,440 | |||||||||||||
| 2,000,000 | National Collegiate Student Loan Trust, Series 06-1, Class A2, Variable Rate, 1 mo. LIBOR + .14%, 3.26%, due 08/25/23 | 1,912,813 | |||||||||||||
| 4,720,777 | National Collegiate Student Loan Trust, Series 06-A, Class A1, 144A, Variable Rate, 1 mo. LIBOR + .08%, 3.20%, due 08/26/19 | 4,564,991 | |||||||||||||
| 7,000,000 | Nelnet Education Loan Funding, Inc., Series 04-2A, Class A3, Variable Rate, 3 mo. LIBOR + .10%, 3.19%, due 11/25/15 | 6,927,410 | |||||||||||||
| 9,000,000 | Nelnet Student Loan Trust, Series 05-3, Class A3, Variable Rate, 3 mo. LIBOR + .05%, 4.93%, due 06/22/17 | 8,936,719 | |||||||||||||
| 8,000,000 | SLM Student Loan Trust, Series 05-3, Class A4, Variable Rate, 3 mo. LIBOR + .07%, 3.40%, due 04/27/20 | 7,780,000 | |||||||||||||
| 1,452,891 | SLM Student Loan Trust, Series 05-4, Class A1, Variable Rate, 3 mo. LIBOR + .01%, 3.34%, due 10/26/15 | 1,441,558 | |||||||||||||
See accompanying notes to the financial statements.
16
GMO World Opportunity Overlay Fund
(A Series of GMO Trust)
Schedule of Investments — (Continued)
(showing percentage of total net assets)
February 29, 2008
| Par Value ($) | Description | Value ($) | |||||||||||||
| Student Loans — continued | |||||||||||||||
| 8,500,000 | SLM Student Loan Trust, Series 06-A, Class A2, Variable Rate, 3 mo. LIBOR + .03%, 4.29%, due 10/15/15 | 8,415,000 | |||||||||||||
| 14,000,000 | SLM Student Loan Trust, Series 07-2, Class A2, Variable Rate, 3 mo. LIBOR, 3.33%, due 07/25/17 | 13,737,500 | |||||||||||||
| 6,375,109 | SLM Student Loan Trust, Series 07-5, Class A1, Variable Rate, 3 mo. LIBOR - .01%, 3.32%, due 07/25/13 | 6,340,245 | |||||||||||||
| 7,500,000 | SLM Student Loan Trust, Series 07-6, Class A2, Variable Rate, 3 mo. LIBOR + .25%, 3.58%, due 01/25/19 | 7,311,000 | |||||||||||||
| Total Student Loans | 98,377,910 | ||||||||||||||
| Trade Receivables — 0.9% | |||||||||||||||
| 14,000,000 | ABS Global Finance Plc, Series 06-1A, Class A1, 144A, Variable Rate, 1 mo. LIBOR + .10%, 2.92%, due 12/17/10 | 13,767,600 | |||||||||||||
| Total Asset-Backed Securities | 1,364,039,142 | ||||||||||||||
| Corporate Debt — 0.6% | |||||||||||||||
| JPY | 500,000,000 | MBIA Global Funding LLC, Series EMTN, Variable Rate, JPY LIBOR, 1.03%, due 06/30/08 | 4,767,061 | ||||||||||||
| 5,000,000 | TIAA Global Markets, 144A, Variable Rate, 3 mo. LIBOR + .10%, 4.48%, due 01/12/11 | 4,952,057 | |||||||||||||
| Total Corporate Debt | 9,719,118 | ||||||||||||||
| U.S. Government Agency — 0.2% | |||||||||||||||
| 2,129,342 | Agency for International Development Floater (Support of Jamaica), Variable Rate, 4 mo. LIBOR + .30%, 3.37%, due 10/01/18 | 2,129,342 | |||||||||||||
| 1,000,000 | U.S. Department of Transportation, 144A, 6.00%, due 12/07/21 | 1,109,000 | |||||||||||||
| Total U.S. Government Agency | 3,238,342 | ||||||||||||||
| TOTAL DEBT OBLIGATIONS (COST $1,483,588,974) | 1,376,996,602 | ||||||||||||||
See accompanying notes to the financial statements.
17
GMO World Opportunity Overlay Fund
(A Series of GMO Trust)
Schedule of Investments — (Continued)
(showing percentage of total net assets)
February 29, 2008
| Principal Amount | Description | Value ($) | |||||||||||||
| OPTIONS PURCHASED — 0.9% | |||||||||||||||
| Options on Interest Rates — 0.1% | |||||||||||||||
| EUR | 325,000,000 | EUR 6 Month LIBOR Cap Call, Expires 02/16/17, Strike 10.00% | 337,279 | ||||||||||||
| EUR | 650,000,000 | EUR 6 Month LIBOR Cap Call, Expires 02/27/17, Strike 10.00% | 682,975 | ||||||||||||
| 1,020,254 | |||||||||||||||
| Options on Interest Rate Swaps — 0.8% | |||||||||||||||
| EUR | 225,000,000 | EUR Swaption Call, Expires 01/07/09, Strike 4.10% | 2,605,430 | ||||||||||||
| EUR | 225,000,000 | EUR Swaption Call, Expires 01/14/09, Strike 3.91% | 2,163,233 | ||||||||||||
| EUR | 150,000,000 | EUR Swaption Call, Expires 02/12/10, Strike 3.85% | 992,606 | ||||||||||||
| EUR | 150,000,000 | EUR Swaption Call, Expires 02/22/10, Strike 3.95% | 1,105,308 | ||||||||||||
| EUR | 225,000,000 | EUR Swaption Put, Expires 01/07/09, Strike 4.10% | 296,849 | ||||||||||||
| EUR | 225,000,000 | EUR Swaption Put, Expires 01/14/09, Strike 3.91% | 401,087 | ||||||||||||
| GBP | 14,000,000 | GBP Swaption Call, Expires 02/28/11, Strike 5.17% | 949,033 | ||||||||||||
| GBP | 40,000,000 | GBP Swaption Call, Expires 04/11/08, Strike 5.86% | 368,936 | ||||||||||||
| GBP | 40,000,000 | GBP Swaption Call, Expires 04/14/08, Strike 5.86% | 367,794 | ||||||||||||
| GBP | 40,000,000 | GBP Swaption Call, Expires 04/17/08, Strike 5.97% | 448,753 | ||||||||||||
| GBP | 60,000,000 | GBP Swaption Call, Expires 04/28/08, Strike 5.91% | 672,716 | ||||||||||||
| GBP | 60,000,000 | GBP Swaption Call, Expires 05/08/08, Strike 5.96% | 772,274 | ||||||||||||
| GBP | 14,000,000 | GBP Swaption Put, Expires 02/28/11, Strike 5.17% | 712,430 | ||||||||||||
| GBP | 40,000,000 | GBP Swaption Put, Expires 04/11/08, Strike 5.86% | 29,087 | ||||||||||||
| GBP | 40,000,000 | GBP Swaption Put, Expires 04/14/08, Strike 5.86% | 32,309 | ||||||||||||
| GBP | 40,000,000 | GBP Swaption Put, Expires 04/17/08, Strike 5.97% | 22,691 | ||||||||||||
| GBP | 60,000,000 | GBP Swaption Put, Expires 04/28/08, Strike 5.91% | 50,257 | ||||||||||||
| GBP | 60,000,000 | GBP Swaption Put, Expires 05/08/08, Strike 5.96% | 48,722 | ||||||||||||
| 12,039,515 | |||||||||||||||
| TOTAL OPTIONS PURCHASED (COST $9,521,781) | 13,059,769 | ||||||||||||||
See accompanying notes to the financial statements.
18
GMO World Opportunity Overlay Fund
(A Series of GMO Trust)
Schedule of Investments — (Continued)
(showing percentage of total net assets)
February 29, 2008
| Shares / Par Value ($) | Description | Value ($) | |||||||||||||
| SHORT-TERM INVESTMENTS — 6.0% | |||||||||||||||
| Money Market Funds — 3.8% | |||||||||||||||
| 56,043,378 | State Street Institutional Liquid Reserves Fund-Institutional Class | 56,043,378 | |||||||||||||
| Other Short-Term Investments — 2.2% | |||||||||||||||
| 15,000,000 | Sheffield Receivables Commercial Paper, 3.30%, due 03/18/08 | 14,976,625 | |||||||||||||
| 6,000,000 | U.S. Treasury Bill, 1.78%, due 05/01/08 (a) (b) | 5,982,006 | |||||||||||||
| 6,500,000 | U.S. Treasury Bill, 1.78%, due 06/19/08 (a) (b) | 6,465,186 | |||||||||||||
| 5,000,000 | U.S. Treasury Bill, 1.79%, due 07/24/08 (a) (b) | 4,964,645 | |||||||||||||
| Total Other Short-Term Investments | 32,388,462 | ||||||||||||||
| TOTAL SHORT-TERM INVESTMENTS (COST $88,383,809) | 88,431,840 | ||||||||||||||
| TOTAL INVESTMENTS — 100.0% (Cost $1,581,494,564) | 1,478,488,211 | ||||||||||||||
| Other Assets and Liabilities (net) — (0.0%) | (312,477 | ) | |||||||||||||
| TOTAL NET ASSETS — 100.0% | $ | 1,478,175,734 | |||||||||||||
See accompanying notes to the financial statements.
19
GMO World Opportunity Overlay Fund
(A Series of GMO Trust)
Schedule of Investments — (Continued)
February 29, 2008
A summary of outstanding financial instruments at February 29, 2008 is as follows:
Forward Currency Contracts
| Settlement Date | Deliver/ Receive | Units of Currency | Value | Net Unrealized Appreciation (Depreciation) | |||||||||||||||
| Buys | |||||||||||||||||||
| 3/03/08 | GBP | 805,000 | $ | 1,599,575 | $ | 845 | |||||||||||||
| Sales | |||||||||||||||||||
| 4/22/08 | JPY | 500,000,000 | $ | 4,826,935 | $ | (179,230 | ) | ||||||||||||
Futures Contracts
| Number of Contracts | Type | Expiration Date | Contract Value | Net Unrealized Appreciation (Depreciation) | |||||||||||||||
| Buys | |||||||||||||||||||
| 4,585 | Eurodollar 90 Day | December 2008 | $ | 1,120,917,875 | $ | 2,224,138 | |||||||||||||
| Sales | |||||||||||||||||||
| 4,585 | Eurodollar 90 Day | December 2009 | $ | 1,113,409,938 | $ | (2,418,175 | ) | ||||||||||||
| 78 | U.S. Treasury Note 10 Yr. | June 2008 | 9,147,938 | (163,491 | ) | ||||||||||||||
| 51 | U.S. Treasury Note 5 Yr. (CBT) | June 2008 | 5,826,750 | (78,608 | ) | ||||||||||||||
| $ | 1,128,384,626 | $ | (2,660,274 | ) | |||||||||||||||
Reverse Repurchase Agreements
| Average balance outstanding | $ | (77,501,730 | ) | ||||
| Average interest rate | 1.44 | % | |||||
| Maximum balance outstanding | $ | (135,993,112 | ) | ||||
| Average shares outstanding | 52,540,106 | ||||||
| Average balance per share outstanding | $ | (1.48 | ) | ||||
| Days Outstanding | 97 | ||||||
Average balance outstanding was calculated based on daily balances outstanding during the period that the Fund had entered into reverse repurchase agreements. There were no reverse repurchase agreements outstanding at the end of the period.
See accompanying notes to the financial statements.
20
GMO World Opportunity Overlay Fund
(A Series of GMO Trust)
Schedule of Investments — (Continued)
February 29, 2008
Written Options
| Notional Amount | Expiration Date | Description | Premiums | Market Value | |||||||||||||||||||||||
| Call | $ | 150,000,000 | 02/12/2009 | EUR | Interest Rate Swaption, | ||||||||||||||||||||||
| Strike 3.50% | $ | (667,309 | ) | $ | (985,205 | ) | |||||||||||||||||||||
| Call | 150,000,000 | 02/20/2009 | EUR | Interest Rate Swaption, Strike 3.62% | (639,820 | ) | (1,201,113 | ) | |||||||||||||||||||
| Call | 40,000,000 | 04/11/2008 | GBP | Interest Rate Swaption, Strike 5.67% | (175,426 | ) | (252,166 | ) | |||||||||||||||||||
| Put | 40,000,000 | 04/11/2008 | GBP | Interest Rate Swaption, Strike 6.44% | (183,502 | ) | (1,963 | ) | |||||||||||||||||||
| Call | 40,000,000 | 04/14/2008 | GBP | Interest Rate Swaption, Strike 5.59% | (175,254 | ) | (218,093 | ) | |||||||||||||||||||
| Put | 40,000,000 | 04/14/2008 | GBP | Interest Rate Swaption, Strike 6.50% | (177,100 | ) | (1,831 | ) | |||||||||||||||||||
| Call | 40,000,000 | 04/17/2008 | GBP | Interest Rate Swaption, Strike 5.52% | (180,256 | ) | (191,684 | ) | |||||||||||||||||||
| Put | 40,000,000 | 04/17/2008 | GBP | Interest Rate Swaption, Strike 6.50% | (164,703 | ) | (2,180 | ) | |||||||||||||||||||
| Call | 60,000,000 | 04/28/2008 | GBP | Interest Rate Swaption, Strike 5.35% | (257,481 | ) | (232,364 | ) | |||||||||||||||||||
| Call | 60,000,000 | 05/08/2008 | GBP | Interest Rate Swaption, Strike 5.25% | (290,051 | ) | (217,382 | ) | |||||||||||||||||||
| $ | (2,910,902 | ) | $ | (3,303,981 | ) | ||||||||||||||||||||||
Swap Agreements
Credit Default Swaps
| Notional Amount | Expiration Date | Counterparty | Receive (Pay) | Annual Premium | Deliverable On Default | Market Value | |||||||||||||||||||||||||
| 13,000,000 | USD | 9/20/2010 | Morgan Stanley | Receive | 0.40 | % | Eagle Creek CDO | $ | (982,861 | ) | |||||||||||||||||||||
| 100,000,000 | USD | 12/20/2012 | Morgan Stanley | (Pay) | 1.20 | % | Reference security within CDX Index | (293,952 | ) | ||||||||||||||||||||||
| 500,000,000 | USD | 12/20/2012 | Morgan Stanley | Receive | 0.70 | % | Reference security within CDX Index | (17,768 | ) | ||||||||||||||||||||||
See accompanying notes to the financial statements.
21
GMO World Opportunity Overlay Fund
(A Series of GMO Trust)
Schedule of Investments — (Continued)
February 29, 2008
Credit Default Swaps — continued
| Notional Amount | Expiration Date | Counterparty | Receive (Pay) | Annual Premium | Deliverable On Default | Market Value | |||||||||||||||||||||||||
| 500,000,000 | USD | 12/20/2012 | Morgan Stanley | Receive | 0.71 | % | Reference security | ||||||||||||||||||||||||
| within CDX Index | $ | 202,434 | |||||||||||||||||||||||||||||
| 7,000,000 | USD | 3/20/2013 | Morgan Stanley | Receive | 0.25 | % | MS Synthetic 2006-1 | (1,005,663 | ) | ||||||||||||||||||||||
| 5,000,000 | USD | 3/20/2015 | Lehman Brothers | Receive | 0.88 | % | AAA CDO | (1,191,322 | ) | ||||||||||||||||||||||
| Premiums to (Pay) Receive | $ | — | $ | (3,289,132 | ) | ||||||||||||||||||||||||||
Interest Rate Swaps
| Notional Amount | Expiration Date | Counterparty | Receive (Pay) | Fixed Rate | Variable Rate | Market Value | |||||||||||||||||||||||||
| 1,000,000,000 | NOK | 3/14/2009 | Morgan Stanley | Receive | 5.33 | % | 3 month | ||||||||||||||||||||||||
| NOK NIBOR | $ | (1,016,169 | ) | ||||||||||||||||||||||||||||
| 665,000,000 | USD | 3/4/2010 | Morgan Stanley | (Pay) | 2.57 | % | 3 month LIBOR | (636,923 | ) | ||||||||||||||||||||||
| 1,059,000,000 | NOK | 3/15/2010 | Morgan Stanley | (Pay) | 5.17 | % | 3 month NOK NIBOR | 141,486 | |||||||||||||||||||||||
| 176,000,000 | AUD | 6/18/2010 | Barclays Bank PLC | Receive | 7.40 | % | 3 month AUD BBSW | (468,117 | ) | ||||||||||||||||||||||
| 133,000,000 | AUD | 6/18/2010 | Deutsche Bank AG | Receive | 7.40 | % | 3 month AUD BBSW | (353,747 | ) | ||||||||||||||||||||||
| 181,000,000 | CAD | 6/18/2010 | JP Morgan Chase Bank | Receive | 4.40 | % | 3 month CDOR | 3,634,009 | |||||||||||||||||||||||
| 2,390,000,000 | SEK | 6/18/2010 | Morgan Stanley | (Pay) | 4.40 | % | 3 month SEK STIBOR | (1,275,935 | ) | ||||||||||||||||||||||
| 314,000,000 | CHF | 6/18/2010 | Morgan Stanley | (Pay) | 3.00 | % | 6 month CHF LIBOR | (2,854,478 | ) | ||||||||||||||||||||||
| 37,700,000,000 | JPY | 6/18/2010 | Citigroup | (Pay) | 1.00 | % | 6 month JPY LIBOR | (822,055 | ) | ||||||||||||||||||||||
| 25,200,000,000 | JPY | 6/18/2010 | JP Morgan Chase Bank | (Pay) | 1.00 | % | 6 month JPY LIBOR | (549,490 | ) | ||||||||||||||||||||||
| 5,000,000 | USD | 2/7/2012 | Deutsche Bank AG | (Pay) | 4.33 | % | 3 month LIBOR | (230,651 | ) | ||||||||||||||||||||||
| 280,000,000 | USD | 3/4/2013 | Morgan Stanley | Receive | 3.40 | % | 3 month LIBOR | 386,589 | |||||||||||||||||||||||
| 15,000,000 | USD | 2/8/2015 | JP Morgan Chase Bank | (Pay) | 4.47 | % | 3 month LIBOR | (620,351 | ) | ||||||||||||||||||||||
| 43,000,000 | CAD | 6/18/2018 | JP Morgan Chase Bank | (Pay) | 4.80 | % | 3 month CDOR | (1,614,461 | ) | ||||||||||||||||||||||
| 569,000,000 | SEK | 6/18/2018 | Morgan Stanley | Receive | 4.80 | % | 3 month SEK STIBOR | 778,099 | |||||||||||||||||||||||
See accompanying notes to the financial statements.
22
GMO World Opportunity Overlay Fund
(A Series of GMO Trust)
Schedule of Investments — (Continued)
February 29, 2008
Interest Rate Swaps — continued
| Notional Amount | Expiration Date | Counterparty | Receive (Pay) | Fixed Rate | Variable Rate | Market Value | |||||||||||||||||||||||||
| 46,000,000 | AUD | 6/18/2018 | Barclays Bank PLC | (Pay) | 7.10 | % | 6 month | ||||||||||||||||||||||||
| AUD BBSW | $ | 574,053 | |||||||||||||||||||||||||||||
| 35,000,000 | AUD | 6/18/2018 | Deutsche Bank AG | (Pay) | 7.10 | % | 6 month AUD BBSW | 436,873 | |||||||||||||||||||||||
| 71,000,000 | CHF | 6/18/2018 | Morgan Stanley | Receive | 3.50 | % | 6 month CHF LIBOR | 1,033,936 | |||||||||||||||||||||||
| 7,900,000,000 | JPY | 6/18/2018 | Citigroup | Receive | 1.75 | % | 6 month JPY LIBOR | 933,420 | |||||||||||||||||||||||
| 5,300,000,000 | JPY | 6/18/2018 | JP Morgan Chase Bank | Receive | 1.75 | % | 6 month JPY LIBOR | 626,218 | |||||||||||||||||||||||
| Premiums to (Pay) Receive | $ | 717,873 | $ | (1,897,694 | ) | ||||||||||||||||||||||||||
As of February 29, 2008, for the futures and/or swap contracts held, the Fund had sufficient cash and/or securities to cover any commitments or margin requirements of the relevant broker or exchange.
Notes to Schedule of Investments:
144A - Securities exempt from registration under Rule 144A of the Securities Act of 1933. These securities may be resold in transactions exempt from registration, normally to qualified institutional investors.
AMBAC - Insured as to the payment of principal and interest by AMBAC Assurance Corporation.
BBSW - Bank Bill Swap Reference Rate
CDO - Collateralized Debt Obligation
CDOR - Canadian Dollar Offered Rate
CMBS - Collateralized Mortgage Backed Security
EMTN - Euromarket Medium Term Note
FGIC - Insured as to the payment of principal and interest by Financial Guaranty Insurance Corporation.
FSA - Insured as to the payment of principal and interest by Financial Security Assurance.
LIBOR - London Interbank Offered Rate
MBIA - Insured as to the payment of principal and interest by MBIA Insurance Corp.
NIBOR - Norwegian Interbank Offered Rate
RMBS - Residential Mortgage Backed Security
STIBOR - Stockholm Interbank Offered Rate
See accompanying notes to the financial statements.
23
GMO World Opportunity Overlay Fund
(A Series of GMO Trust)
Schedule of Investments — (Continued)
February 29, 2008
Variable rate - The rates shown on variable rate notes are the current interest rates at February 29, 2008, which are subject to change based on the terms of the security.
XL - Insured as to the payment of principal and interest by XL Capital Assurance.
(a) Rate shown represents yield-to-maturity.
(b) All or a portion of this security has been segregated to cover margin requirements on open financial futures contracts and/or collateral on open swap contracts (Note 2).
Currency Abbreviations:
AUD - Australian Dollar
CAD - Canadian Dollar
CHF - Swiss Franc
EUR - Euro
GBP - British Pound
JPY - Japanese Yen
NOK - Norwegian Krone
SEK - Swedish Krona
USD - United States Dollar
See accompanying notes to the financial statements.
24
GMO World Opportunity Overlay Fund
(A Series of GMO Trust)
Statement of Assets and Liabilities — February 29, 2008
| Assets: | |||||||
| Investments, at value (cost $1,581,494,564) (Note 2) | $ | 1,478,488,211 | |||||
| Interest receivable | 3,832,333 | ||||||
| Unrealized appreciation on open forward currency contracts (Note 2) | 845 | ||||||
| Receivable for variation margin on open futures contracts (Note 2) | 6,622,796 | ||||||
| Receivable for open swap contracts (Note 2) | 8,747,117 | ||||||
| Receivable for expenses reimbursed by Manager (Note 3) | 48,923 | ||||||
| Total assets | 1,497,740,225 | ||||||
| Liabilities: | |||||||
| Payable for investments purchased | 1,964,075 | ||||||
| Written options outstanding, at value (premiums $2,910,902) (Note 2) | 3,303,981 | ||||||
| Payable to affiliate for (Note 3): | |||||||
| Trustees and Chief Compliance Officer of GMO Trust fees | 1,767 | ||||||
| Unrealized depreciation on open forward currency contracts (Note 2) | 179,230 | ||||||
| Interest payable for open swap contracts | 16,068 | ||||||
| Payable for open swap contracts (Note 2) | 13,933,943 | ||||||
| Accrued expenses | 165,427 | ||||||
| Total liabilities | 19,564,491 | ||||||
| Net assets | $ | 1,478,175,734 | |||||
| Shares outstanding: | 57,557,153 | ||||||
| Net asset value per share: | $ | 25.68 | |||||
See accompanying notes to the financial statements.
25
GMO World Opportunity Overlay Fund
(A Series of GMO Trust)
Statement of Operations — Year Ended February 29, 2008
| Investment Income: | |||||||
| Interest | $ | 84,344,012 | |||||
| Dividends | 1,208,206 | ||||||
| Total investment income | 85,552,218 | ||||||
| Expenses: | |||||||
| Custodian, fund accounting agent and transfer agent fees | 222,547 | ||||||
| Audit and tax fees | 100,553 | ||||||
| Legal fees | 43,009 | ||||||
| Trustees fees and related expenses (Note 3) | 15,095 | ||||||
| Interest expense (Note 2) | 1,117,209 | ||||||
| Miscellaneous | 14,212 | ||||||
| Total expenses | 1,512,625 | ||||||
| Fees and expenses reimbursed by Manager (Note 3) | (365,140 | ) | |||||
| Net expenses | 1,147,485 | ||||||
| Net investment income (loss) | 84,404,733 | ||||||
| Realized and unrealized gain (loss): | |||||||
| Net realized gain (loss) on: | |||||||
| Investments | 9,206,735 | ||||||
| Closed futures contracts | 30,234,990 | ||||||
| Closed swap contracts | (34,191,364 | ) | |||||
| Written options | (4,669,140 | ) | |||||
| Foreign currency, forward contracts and foreign currency related transactions | (182,755 | ) | |||||
| Net realized gain (loss) | 398,466 | ||||||
| Change in net unrealized appreciation (depreciation) on: | |||||||
| Investments | (105,271,062 | ) | |||||
| Open futures contracts | (201,411 | ) | |||||
| Open swap contracts | (5,685,946 | ) | |||||
| Written options | 647,335 | ||||||
| Foreign currency, forward contracts and foreign currency related transactions | (178,782 | ) | |||||
| Net unrealized gain (loss) | (110,689,866 | ) | |||||
| Net realized and unrealized gain (loss) | (110,291,400 | ) | |||||
| Net increase (decrease) in net assets resulting from operations | $ | (25,886,667 | ) | ||||
See accompanying notes to the financial statements.
26
GMO World Opportunity Overlay Fund
(A Series of GMO Trust)
Statement of Changes in Net Assets
| Year Ended February 29, 2008 | Year Ended February 28, 2007 | ||||||||||
| Increase (decrease) in net assets: | |||||||||||
| Operations: | |||||||||||
| Net investment income (loss) | $ | 84,404,733 | $ | 71,699,954 | |||||||
| Net realized gain (loss) | 398,466 | (41,675,218 | ) | ||||||||
| Change in net unrealized appreciation (depreciation) | (110,689,866 | ) | 11,010,275 | ||||||||
| Net increase (decrease) in net assets from operations | (25,886,667 | ) | 41,035,011 | ||||||||
| Net share transactions (Note 7): | (246,005,000 | ) | 696,755,000 | ||||||||
| Total increase (decrease) in net assets | (271,891,667 | ) | 737,790,011 | ||||||||
| Net assets: | |||||||||||
| Beginning of period | 1,750,067,401 | 1,012,277,390 | |||||||||
| End of period | $ | 1,478,175,734 | $ | 1,750,067,401 | |||||||
See accompanying notes to the financial statements.
27
GMO World Opportunity Overlay Fund
(A Series of GMO Trust)
Financial Highlights
(For a share outstanding throughout each period)
| Year Ended February 28/29, | |||||||||||||||||||
| 2008 | 2007 | 2006 | 2005(a) | ||||||||||||||||
| Net asset value, beginning of period | $ | 25.99 | $ | 25.23 | $ | 25.17 | $ | 25.00 | |||||||||||
| Income (loss) from investment operations: | |||||||||||||||||||
| Net investment income (loss)† | 1.41 | 1.36 | 0.96 | 0.15 | |||||||||||||||
| Net realized and unrealized gain (loss) | (1.72 | ) | (0.60 | ) | (0.90 | ) | 0.02 | ||||||||||||
| Total from investment operations | (0.31 | ) | 0.76 | 0.06 | 0.17 | ||||||||||||||
| Net asset value, end of period | $ | 25.68 | $ | 25.99 | $ | 25.23 | $ | 25.17 | |||||||||||
| Total Return(b) | (1.19 | )% | 3.01 | % | 0.24 | % | 0.68 | %** | |||||||||||
| Ratios/Supplemental Data: | |||||||||||||||||||
| Net assets, end of period (000's) | $ | 1,478,176 | $ | 1,750,067 | $ | 1,012,277 | $ | 582,279 | |||||||||||
| Net operating expenses to average daily net assets | 0.00 | %(c) | 0.00 | %(c) | 0.00 | %(c) | 0.01 | %* | |||||||||||
| Interest expense to average daily net assets | 0.07 | % | 0.00 | %(c) | — | — | |||||||||||||
| Total net expenses to average daily net assets | 0.07 | % | 0.00 | %(c) | 0.00 | %(c) | 0.01 | %* | |||||||||||
| Net investment income to average daily net assets | 5.38 | % | 5.36 | % | 3.84 | % | 2.21 | %* | |||||||||||
| Portfolio turnover rate | 41 | % | 93 | % | 31 | % | 8 | %** | |||||||||||
| Fees and expenses reimbursed by the Manager to average daily net assets: | 0.02 | % | 0.03 | % | 0.03 | % | 0.06 | %* | |||||||||||
(a) Period from November 22, 2004 (commencement of operations) through February 28, 2005.
(b) The total returns would have been lower had certain expenses not been reimbursed during the periods shown.
(c) Ratio is less than 0.01%.
† Calculated using average shares outstanding throughout the period.
* Annualized.
** Not annualized.
See accompanying notes to the financial statements.
28
GMO World Opportunity Overlay Fund
(A Series of GMO Trust)
Notes to Financial Statements
February 29, 2008
1. Organization
GMO World Opportunity Overlay Fund (the "Fund") is a series of GMO Trust (the "Trust"). The Fund is registered under the Investment Company Act of 1940, as amended, as an open-end, non-diversified management investment company. The Fund is advised and managed by Grantham, Mayo, Van Otterloo & Co. LLC (the "Manager" or "GMO"). The Trust was established as a Massachusetts business trust under the laws of the Commonwealth of Massachusetts on June 24, 1985. The Declaration of Trust permits the Trustees of the Trust ("Trustees") to create an unlimited number of series of shares ("Funds") and to subdivide Funds into classes.
The Fund seeks total return greater than that of the JPMorgan U.S. 3 Month Cash Index. The Fund's investment program has two principal components. One component of the Fund's investment program involves the use of derivatives, primarily interest rate swap contracts and/or futures contracts, to seek to exploit misvaluations in world interest rates and to add value relative to the JPMorgan U.S. 3 Month Cash Index. The other component of the Fund's investment program involves making direct investments primarily in high quality U.S. and foreign fixed income securities, in particular asset-backed securities, to gain exposure to the JPMorgan U.S. 3 Month Cash Index (and to securities with similar characteristics to those in the benchmark) and to generate a core return.
Shares of the Fund are not publicly offered and are principally available only to other funds of the Trust and certain accredited investors.
2. Significant accounting policies
The following is a summary of significant accounting policies which are in conformity with accounting principles generally accepted in the United States of America ("U.S. GAAP") and which are consistently followed by the Fund in the preparation of its financial statements. The preparation of financial statements in accordance with U.S. GAAP requires management to make estimates and assumptions that affect the reported amounts and disclosures in the financial statements. Actual results could differ from those estimates. The accounting records of the Fund are maintained in U.S. dollars.
Portfolio valuation
Securities listed on a securities exchange for which market quotations are readily available are valued at the last sale price or official closing price on each business day, or if there is no such reported sale or official closing price, at the most recent quoted bid price. Unlisted securities for which market quotations are readily available are generally valued at the most recent quoted bid price. Short-term investments with a remaining maturity of sixty days or less are generally valued at amortized cost, which approximates fair value. Shares of investment funds are valued at their net asset value. Securities for which quotations are not readily available or whose values the Manager has determined to be unreliable are valued at fair value as determined in good faith by the Trustees or other persons acting at their direction pursuant to
29
GMO World Opportunity Overlay Fund
(A Series of GMO Trust)
Notes to Financial Statements — (Continued)
February 29, 2008
procedures approved by the Trustees. By its nature, a fair value price is a good faith estimate of the value of a security at a given point in time and may not reflect the value that would be realized if the security was sold and the differences could be material.
Fixed income securities held by the Fund or the underlying funds are typically valued pursuant to prices supplied by a primary pricing source chosen by the Manager. The Manager evaluates such primary pricing sources on an ongoing basis, and may change a pricing source should it deem it appropriate. The Manager, at its discretion, may override a price supplied by a primary source by using a price provided by another source if such action is deemed appropriate. The prices provided by such primary pricing sources may differ from the value that would be realized if the securities were sold and the differences could be material.
Certain securities held by the Fund are valued on the basis of a price provided by a single source. The prices provided may differ from the value that would be realized if the securities were sold and the differences could be material. As of February 29, 2008, the total value of these securities represented 34.69% of net assets.
The Fund invests in securities with contractual cash flows, such as asset-backed securities, collateralized mortgage obligations and commercial mortgage backed securities, including securities backed by subprime mortgage loans. The value, liquidity and related income of these securities are sensitive to changes in economic conditions, including real estate values, delinquencies and/or defaults, and may be adversely affected by shifts in the market's perception of the securities' market values and changes in interest rates.
Foreign currency translation
The market values of foreign securities, currency holdings and other assets and liabilities are translated to U.S. dollars based on the current exchange rates each business day. Income and expenses denominated in foreign currencies are translated at current exchange rates when accrued or incurred. The Fund does not isolate realized and unrealized gains and losses attributable to changes in exchange rates from gains and losses that arise from changes in the market value of investments. Such fluctuations are included with net realized and unrealized gain or loss on investments. Net realized gains and losses on foreign currency transactions represent gains and losses on disposition of currencies and forward currency contracts, currency gains and losses realized between the trade and settlement dates on securities transactions, and the difference between the amount of investment income and foreign withholding taxes recorded on the F und's accounting records and the U.S. dollar equivalent amounts actually received or paid.
Forward currency contracts
The Fund may enter into forward currency contracts including forward cross currency contracts. A forward currency contract is an agreement between two parties to buy and sell a currency at a set price on a future date. The market value of a forward currency contract fluctuates with changes in forward currency
30
GMO World Opportunity Overlay Fund
(A Series of GMO Trust)
Notes to Financial Statements — (Continued)
February 29, 2008
exchange rates. Forward currency contracts are marked to market daily using rates supplied by a quotation service and changes in value are recorded by the Fund as an unrealized gain or loss. Realized gains or losses equal to the difference between the value of the contract at the time it was opened and the value at the time it was closed are recorded upon delivery or receipt of the currency or, if a forward currency contract is offset by entering into another forward currency contract with the same broker, upon settlement of the net gain or loss. These contracts may involve market risk in excess of the unrealized gain or loss reflected in the Fund's Statement of Assets and Liabilities. In addition, the Fund could be exposed to risk if the counterparties are unable to meet the terms of the contracts or if there are movements in currency values that are unfavorable to the Fund. Forward currency contracts outstanding at the end of the period are listed in the Fund's Schedule of Investments.
Futures contracts
The Fund may purchase and sell futures contracts. Upon entering into a futures contract, the Fund is required to deposit with the futures clearing broker an amount of cash, U.S. government and agency obligations, or other liquid assets in accordance with the initial margin requirements of the broker or exchange. In addition, the Fund maintains cash or securities in an amount that at least equals the net amount payable in the event the Fund must deliver the full amount of the contracts. Futures contracts are marked to market daily and an appropriate payable or receivable for the change in value ("variation margin") is recorded by the Fund. The payable or receivable is liquidated on the following business day. Gains or losses are recognized but not considered realized until the contracts expire or are closed. Futures contracts involve, to varying degrees, risk of loss in excess of the variation margin disclosed in the Statement of Assets and Liabilities. Under certain circumstances, futures exchanges may establish daily limits on the amount that the price of a futures contract can vary from the previous day's settlement price, thereby effectively preventing liquidation of unfavorable positions. Losses may arise from changes in the value of the underlying instrument if the Fund is unable to liquidate a futures position due to an illiquid secondary market for the contracts or the imposition of price limits, or if counterparties do not perform under the contract terms. Futures contracts are generally valued at the settlement price established each day by the board of trade or exchange on which they are traded. Futures contracts outstanding at the end of the period are listed in the Fund's Schedule of Investments.
Options
The Fund may write call and put options. Writing options increases the Fund's exposure to the underlying instrument by, in the case of a call option, obligating the Fund to sell the underlying instrument at a set price to the option-holder and, in the case of a put option, obligating the Fund to purchase the underlying instrument at a set price from the option-holder. When the Fund writes a call or put option, an amount equal to the premium received is recorded as a liability and subsequently marked to market to reflect the current value of the option written. Premiums received from writing options which expire are treated as realized gains. Premiums received from writing options which are exercised or closed are added to the proceeds or offset against the amounts paid on the underlying future, security or currency transaction to determine the realized gain or loss. The Fund as a writer of an option has no control over whether t he
31
GMO World Opportunity Overlay Fund
(A Series of GMO Trust)
Notes to Financial Statements — (Continued)
February 29, 2008
underlying future, security or currency may be sold (call) or purchased (put) and as a result bears the market risk of an unfavorable change in the price of the future, security or currency underlying the written option. In the event that the Fund writes uncovered call options (i.e. options for investments that the Fund does not own), it bears the risk of incurring substantial losses if the price of the underlying instrument increases during the term of the option. There is the risk the Fund may not be able to enter into a closing transaction because of an illiquid market. Written options outstanding at the end of the period are listed in the Fund's Schedule of Investments.
For the year ended February 29, 2008, the Fund's investment activity in written option contracts was as follows:
| Puts | Calls | ||||||||||||||||||
| Principal Amount of Contracts | Premiums | Principal Amount of Contracts | Premiums | ||||||||||||||||
| Outstanding, beginning of period | $ | (810,000,000 | ) | $ | (2,766,300 | ) | $ | (485,000,000 | ) | $ | (2,750,050 | ) | |||||||
| Options written | (6,318,009,776 | ) | (42,176,990 | ) | (33,938,004,900 | ) | (44,213,933 | ) | |||||||||||
| Options exercised | 1,884,000,000 | 13,161,944 | 3,628,000,000 | 26,594,606 | |||||||||||||||
| Options expired | 4,578,000,000 | 28,094,198 | 30,069,000,000 | 15,178,580 | |||||||||||||||
| Options sold | 546,009,776 | 3,161,843 | 186,004,900 | 2,805,200 | |||||||||||||||
| $ | (120,000,000 | ) | $ | (525,305 | ) | $ | (540,000,000 | ) | $ | (2,385,597 | ) | ||||||||
The Fund may also purchase put and call options. Purchasing options alters the Fund's exposure to the underlying instrument by, in the case of a call option, entitling the Fund to purchase the underlying instrument at a set price from the writer of the option and, in the case of a put option, entitling the Fund to sell the underlying instrument at a set price to the writer of the option. The Fund pays a premium as a cost for a purchased option disclosed in the Schedule of Investments which is subsequently marked to market to reflect the current value of the option. Premiums paid for purchasing options which expire are treated as realized losses. Premiums paid for purchasing options which are exercised or closed are added to the amounts paid or offset against the proceeds on the closing transaction to determine the realized gain or loss. The risk associated with purchasing put and call options is limited to the premium paid. Purc hased options outstanding at the end of the period are listed in the Fund's Schedule of Investments.
Exchange traded options are valued at the last sale price, or if no sale is reported, the last bid price for purchased options and the last ask price for written options. Options traded over-the-counter are valued using prices supplied by a primary pricing source chosen by the Manager.
32
GMO World Opportunity Overlay Fund
(A Series of GMO Trust)
Notes to Financial Statements — (Continued)
February 29, 2008
Loan agreements
The Fund may invest in direct debt instruments which are interests in amounts owed by a corporate, governmental, or other borrower to lenders or lending syndicates. The Fund's investments in loans may be in the form of participations in loans or assignments of all or a portion of loans from third parties. A loan is often administered by a bank or other financial institution (the "lender") that acts as agent for all holders. The agent administers the terms of the loan, as specified in the loan agreement. When investing in a loan participation, the Fund has the right to receive payments of principal, interest and any fees to which it is entitled only from the lender selling the loan agreement and only upon receipt by the lender of payments from the borrower. The Fund generally has no right to enforce compliance with the terms of the loan agreement with the borrower. As a result, the Fund may be subject to the credit risk of both t he borrower and the lender that is selling the loan agreement. When the Fund purchases assignments from lenders it acquires direct rights against the borrower on the loan. There were no loan agreements outstanding at the end of the period.
Indexed securities
The Fund may invest in indexed securities where the redemption values and/or coupons are linked to the prices of a specific instrument or financial statistic. The Fund uses indexed securities to increase or decrease its exposure to different underlying instruments and to gain exposure to markets in which it may be difficult to invest through conventional securities. Indexed securities may be more volatile than their underlying instruments, but any loss is limited to the amount of the original investment. There were no indexed securities held by the Fund at the end of the period.
Swap agreements
The Fund may enter into swap agreements. A swap is an agreement to exchange the return generated by one instrument for the return generated by another instrument. Interest rate swap agreements involve the exchange by one party with another party of their respective commitments to pay or receive interest, e.g., an exchange of floating rate payments for fixed rate payments with respect to a notional amount of principal. Total return swap agreements involve a commitment by one party in the agreement to pay interest in exchange for a market-linked return, both based on notional amounts. To the extent the total return of the security or index underlying the transaction exceeds or falls short of the offsetting interest rate obligation, the party will receive a payment from or make a payment to the counterparty, respectively. Forward spread lock swap agreements involve commitments to pay or receive a settlement amount calculated as the difference between the swap spread and a fixed spread, multiplied by the notional amount times the duration of the swap rate. The swap spread is the difference between the benchmark swap rate (market rate) and the specific treasury rate. In a credit default swap, one party makes a stream of payments to another party in exchange for the right to receive a specified return in the event of a default by a third party on its obligation. Credit default swaps may be used to provide a measure of protection against defaults of sovereign or corporate issuers (i.e., to reduce risk where a party owns or has exposure to the issuer) or to take an active long or short position with respect to the likelihood of a particular issuer's default. Variance swap agreements involve commitments to pay or receive a settlement amount calculated
33
GMO World Opportunity Overlay Fund
(A Series of GMO Trust)
Notes to Financial Statements — (Continued)
February 29, 2008
as the difference between the annualized realized variance of returns on the underlying price and a fixed quantity, also known as the variance strike, over a period of time. In connection with these agreements, cash or securities may be set aside as collateral by the Fund's custodian or brokers in accordance with the terms of the swap agreement. The Fund earns or pays interest on cash set aside as collateral.
Swaps are marked to market daily using models that incorporate quotations from market makers and the change in value, if any, is recorded as unrealized gain or loss in the Statement of Operations. Payments received or made on swap contracts are recorded as realized gain or loss in the Statement of Operations. Gains or losses are realized upon early termination of the swap agreements. These financial instruments are not actively traded on financial markets. The values assigned to these instruments are based upon the best available information and because of the uncertainty of the valuation, these values may differ significantly from the values that would have been realized had a ready market for these instruments existed, and the differences could be material. Entering into these agreements involves, to varying degrees, elements of credit, legal, market and documentation risk in excess of the amounts recognized in the Statement o f Assets and Liabilities. Such risks involve the possibility that there will be no liquid market for these agreements, that the counterparties to the agreements may default on their obligations to perform or disagree as to the meaning of contractual terms in the agreements, or that there may be unfavorable changes in interest rates or the price of the index or security underlying these transactions. Swap agreements outstanding at the end of the period are listed in the Fund's Schedule of Investments.
Repurchase agreements
The Fund may enter into repurchase agreements with banks and broker-dealers whereby the Fund acquires a security for cash and obtains a simultaneous commitment from the seller to repurchase the security at an agreed upon price and date. The Fund, through its custodian, takes possession of securities collateralizing the repurchase agreement. The collateral is marked to market daily to ensure that the market value of the underlying assets remains sufficient to protect the Fund in the event of default by the seller. Collateral for certain tri-party repurchase agreements is held at the counterparty's custodian in a segregated account for the benefit of the Fund and the counterparty. In connection with transactions in repurchase agreements, if the seller defaults or enters into insolvency proceedings and the value of the collateral declines, recovery of cash by the Fund may be delayed or limited. There were no repurchase agreements o utstanding at the end of the period.
Reverse repurchase agreements
The Fund may enter into reverse repurchase agreements with banks and broker-dealers whereby the Fund sells portfolio assets concurrent with an agreement by the Fund to repurchase the same assets at a later date at a fixed price. In connection with these agreements, the Fund establishes segregated accounts with its custodian in which the Fund maintains cash, U.S. government securities or other assets equal in value to its obligations in respect of reverse repurchase agreements. Reverse repurchase agreements involve the risk that the market value of the securities the Fund has sold under the agreement may decline below the price at which the Fund is obligated to repurchase under the agreement. The market value of the securities
34
GMO World Opportunity Overlay Fund
(A Series of GMO Trust)
Notes to Financial Statements — (Continued)
February 29, 2008
the Fund has sold is determined daily and any additional required collateral is allocated to or sent by the Fund on the next business day. There were no reverse repurchase agreements outstanding at the end of the period.
Securities lending
The Fund may lend its securities to certain qualified broker-dealers. The loans are collateralized with cash or liquid securities with a market value at least equal to the market value of the securities on loan. As with other extensions of credit, the Fund may bear the risk of loss with respect to the investment of the collateral, the risk of delay in and/or inability to exercise its rights with respect to the collateral, and the risk of delay in recovery or loss of rights in the loaned securities should the borrower of the securities fail financially. If a loan is collateralized by U.S. government securities, the Fund receives a fee from the borrower. If a loan is collateralized by cash, the Fund typically invests the cash collateral for its own account in interest-bearing, short-term securities and pays a fee to the borrower that normally represents a portion of the Fund's earnings on the collateral. For the year ended Februar y 29, 2008, the Fund did not participate in securities lending.
Taxes
The Fund elected to be taxed as a partnership for federal income tax purposes. As a partnership, the Fund will not be subject to federal and state income tax. Instead, each shareholder is responsible for the tax liability or benefit related to his/her allocable share of taxable income or loss. Accordingly, no provision (benefit) for federal and state income taxes is reflected in the accompanying financial statements.
As of February 29, 2008, the approximate cost for U.S. federal income tax purposes and gross and net unrealized appreciation and depreciation in value of investments were as follows:
| Aggregate Cost | Gross Unrealized Appreciation | Gross Unrealized (Depreciation) | Net Unrealized Appreciation (Depreciation) | ||||||||||||
| $ | 1,581,587,197 | $ | 6,024,169 | $ | (109,123,155 | ) | $ | (103,098,986 | ) | ||||||
Distributions
The Fund does not intend to make any distributions to its shareholders but may do so in the sole discretion of the Trustees.
Security transactions and related investment income
Security transactions are accounted for on trade date. Dividend income, net of applicable foreign withholding taxes, if any, is recorded on the ex-dividend date, or when the Fund is informed of the ex-dividend date, if later. Interest income is recorded on the accrual basis and is adjusted for the amortization of premiums and accretion of discounts. Interest income on inflation indexed securities, if any, is accrued
35
GMO World Opportunity Overlay Fund
(A Series of GMO Trust)
Notes to Financial Statements — (Continued)
February 29, 2008
daily based upon an inflation adjusted principal. Additionally, any increase or decrease in the principal or face amount of the securities adjusted for inflation is recorded as interest income or loss. Income is not recognized on securities for which collection is not expected. Non-cash dividends, if any, are recorded at the fair market value of the securities received. In determining the net gain or loss on securities sold, the cost of securities is determined on the identified cost basis.
Expenses
The majority of expenses of the Trust are directly identifiable to an individual fund. Expenses which are not readily identifiable to a specific fund are allocated taking into consideration, among other things, the nature and type of expense and the relative size of the funds.
State Street Bank and Trust Company ("State Street") serves as custodian, fund accounting agent and transfer agent of the Fund. State Street's fee may be reduced by credits that are an earnings allowance calculated on the average daily cash balances the Fund maintains with State Street. Credit balances used to reduce the fee paid to State Street, if any, are reported as a reduction of expenses in the Statement of Operations.
Recently issued accounting pronouncements
In June 2006, the Financial Accounting Standards Board ("FASB") issued FASB Interpretation No. 48, Accounting for Uncertainty in Income Taxes – an Interpretation of FASB Statement No. 109 ("FIN 48"). FIN 48 clarifies the accounting for uncertainty in income taxes recognized in accordance with FASB Statement No. 109, Accounting for Income Taxes. FIN 48 prescribes a recognition threshold and measurement attribute for a tax position taken or expected to be taken in the tax return that could impact the Fund's financial statements. It also provides guidance in relation to the Fund's financial statements on classification of tax benefits or liabilities, interest and penalties, accounting in interim periods, disclosure, and transition. FIN 48 is effective for fiscal years beginning after December 15, 2006 for registered investment companies. Management has evaluated the effects of applying the various provisions of FIN 48 and has determined that the adoption of FIN 48 does not have a material effect on the Fund's financial statements. The Fund's federal tax returns for the prior three fiscal years remain subject to examination by the Internal Revenue Service. Management will continue to monitor the rules and guidance pertaining to FIN 48 and will take action if appropriate.
In September 2006, the FASB issued Statement of Financial Accounting Standards No. 157 ("FAS 157"), "Fair Value Measurements." FAS 157 defines fair value, establishes a framework for measuring fair value in accordance with generally accepted accounting principles and expands disclosure about fair value measurements. FAS 157 is effective for fiscal years beginning after November 15, 2007. Management is currently evaluating the impact the adoption of FAS 157 will have on the Fund's financial statement disclosures.
36
GMO World Opportunity Overlay Fund
(A Series of GMO Trust)
Notes to Financial Statements — (Continued)
February 29, 2008
3. Fees and other transactions with affiliates
GMO does not charge the Fund any management or service fees for its services. In addition, the Manager has contractually agreed to reimburse the Fund for Fund expenses through at least June 30, 2008 (excluding fees and expenses of the independent Trustees of the Trust, fees and expenses for legal services not approved by the Manager for the Trust, compensation and expenses of the Trust's Chief Compliance Officer ("CCO") (excluding any employee benefits), brokerage commissions, securities lending fees and expenses, interest expense, transfer taxes, and other investment-related costs (including expenses associated with investments in any company that is an investment company or would be an investment company under the 1940 Act, but for the exceptions to the definition of investment company provided in Section 3(c)(1) and 3(c)(7) of the 1940 Act), hedging transaction fees, extraordinary, non-recurring and certain other unusual expe nses (including taxes)).
The Fund's portion of the fees paid by the Trust to the independent Trustees and CCO during the year ended February 29, 2008 was $12,979 and $6,238, respectively. The compensation and expenses of the CCO are included in miscellaneous expenses in the Statement of Operations. No remuneration was paid by the Fund to any other officer of the Trust.
4. Purchases and sales of securities
For the year ended February 29, 2008, cost of purchases and proceeds from sales of investments, other than short-term obligations, were as follows:
| Purchases | Sales | ||||||||||
| U.S. Government securities | $ | — | $ | 31,895,400 | |||||||
| Investments (non-U.S. Government securities) | 617,025,927 | 762,614,823 | |||||||||
5. Guarantees
In the normal course of business the Fund enters into contracts with third-party service providers that contain a variety of representations and warranties and which provide general indemnifications. The Fund's maximum exposure under these arrangements is unknown, as this would involve future claims that may be made against the Fund that have not yet occurred. Based on experience, management is of the view that the risk of loss in connection with these potential indemnification obligations is remote; however, there can be no assurance that material liabilities related to such obligations will not arise in the future that could adversely impact the Fund.
37
GMO World Opportunity Overlay Fund
(A Series of GMO Trust)
Notes to Financial Statements — (Continued)
February 29, 2008
6. Principal shareholders and related parties
As of February 29, 2008, 71.31% of the outstanding shares of the Fund were held by two shareholders, each holding in excess of 10% of the Fund's outstanding shares. No other shareholder owned in excess of 10% of the outstanding shares of the Fund. Each of the shareholders are other funds of the Trust. Investment activities of these shareholders may have a material effect on the Fund.
As of February 29, 2008, there were no shares held by related parties, and all of the Fund's shares were held by accounts for which the Manager has investment discretion.
7. Share transactions
The Declaration of Trust permits the Trustees to issue an unlimited number of shares of beneficial interest (without par value). Transactions in Fund shares were as follows:
| Year Ended February 29, 2008 | Year Ended February 28, 2007 | ||||||||||||||||||
| Shares | Amount | Shares | Amount | ||||||||||||||||
| Shares sold | 53,723,671 | $ | 1,403,880,000 | 47,430,776 | $ | 1,214,765,000 | |||||||||||||
| Shares repurchased | (63,507,548 | ) | (1,649,885,000 | ) | (20,215,136 | ) | (518,010,000 | ) | |||||||||||
| Net increase (decrease) | (9,783,877 | ) | $ | (246,005,000 | ) | 27,215,640 | $ | 696,755,000 | |||||||||||
38
Report of Independent Registered Public Accounting Firm
To the Trustees of GMO Trust and the Shareholders of
GMO World Opportunity Overlay Fund
In our opinion, the accompanying statement of assets and liabilities, including the schedule of investments, and the related statements of operations and of changes in net assets and the financial highlights present fairly, in all material respects, the financial position of GMO World Opportunity Overlay Fund (the "Fund") at February 29, 2008, the results of its operations for the year then ended, the changes in its net assets for each of the two years in the period then ended and the financial highlights for each the periods indicated, in conformity with accounting principles generally accepted in the United States of America. These financial statements and financial highlights (hereafter referred to as "financial statements") are the responsibility of the Fund's management; our responsibility is to express an opinion on these financial statements based on our audits. We conducted our audits of these financial statements in acc ordance with the standards of the Public Company Accounting Oversight Board (United States). Those standards require that we plan and perform the audit to obtain reasonable assurance about whether the financial statements are free of material misstatement. An audit includes examining, on a test basis, evidence supporting the amounts and disclosures in the financial statements, assessing the accounting principles used and significant estimates made by management, and evaluating the overall financial statement presentation. We believe that our audits, which included confirmation of securities at February 29, 2008 by correspondence with the custodian and brokers, provide a reasonable basis for our opinion.
PricewaterhouseCoopers LLP
Boston, Massachusetts
April 29, 2008
39
GMO World Opportunity Overlay Fund
(A Series of GMO Trust)
Fund Expenses
February 29, 2008 (Unaudited)
Expense Examples: The following information is in relation to expenses for the six month period ended February 29, 2008.
As a shareholder of the Fund, you may incur two types of costs: (1) transaction costs, and (2) ongoing costs. This example is intended to help you understand your ongoing costs (in dollars) of investing in the Fund and to compare these costs with the ongoing costs of investing in other mutual funds.
These examples are based on an investment of $1,000 invested at the beginning of the period and held for the entire period, September 1, 2007 through February 29, 2008.
Actual Expenses
The first line of the table below provides information about actual account values and actual expenses. You may use the information in this line, together with the amount you invested, to estimate the expenses that you paid over the period. Simply divide your account value by $1,000 (for example, a $10,000,000 account value divided by $1,000 = 10,000), then multiply the result by the number in the first line under the heading entitled "Net Expense Incurred" to estimate the expenses you paid on your account during this period.
Hypothetical Example for Comparison Purposes
The second line of the table below provides information about hypothetical account values and hypothetical expenses based on the Fund's actual expense ratio and an assumed rate of return of 5% per year before expenses, which is not the Fund's actual return. The hypothetical account values and expenses may not be used to estimate the actual ending account balance or expenses you paid for the period. You may use this information to compare the ongoing costs of investing in the Fund with other funds. To do so, compare this 5% hypothetical example with the 5% hypothetical examples that appear in the shareholder reports of the other funds.
Please note that the expenses shown in the table are meant to highlight your ongoing costs only and do not reflect any transactional costs. Therefore, the second line of the table is useful in comparing ongoing costs only, and will not help you determine the relative total costs of owning different funds. In addition, if these transactional costs were included, your costs would have been higher.
| Annualized Net Expense Ratio | Beginning Account Value | Ending Account Value | Net Expense Incurred* | ||||||||||||||||
| 1) Actual | 0.00 | %** | $ | 1,000.00 | $ | 974.20 | $ | 0.01 | |||||||||||
| 2) Hypothetical | 0.00 | %** | $ | 1,000.00 | $ | 1,024.86 | $ | 0.01 | |||||||||||
* Expenses are calculated using the annualized expense ratio for the six months ended February 29, 2008, multiplied by the average account value over the period, multiplied by 182 days in the period, divided by 366 days in the year.
** Annualized net expense ratios are less than 0.01%.
40
Trustees and Officers (Unaudited)
The following tables list the Trust's Trustees and Officers as of the date of this report; their address and date of birth ("DOB"); their position with the Trust; the length of time holding that position with the Trust; their principal occupation(s) during the past five years; the number of portfolios in the fund complex they oversee; and other directorships they hold in companies subject to registration or reporting requirements of the Securities Exchange Act of 1934 (generally called "public companies") or in registered investment companies. The Trust's Statement of Additional Information ("SAI") includes additional information about the Trust's trustees, including changes subsequent to the date of the report. The SAI is available, without charge, upon request by writing GMO, c/o GMO Trust, 40 Rowes Wharf, Boston, MA 02110.
Independent Trustees:
| Name, Address, and DOB | Position(s) Held with Trust | Term of Office1 and Length of Time Served | Principal Occupation(s) During Past Five Years | Number of Portfolios in Fund Complex Overseen by Trustee | Other Directorships Held by Trustee | ||||||||||||||||||
| Donald W. Glazer, Esq. c/o GMO Trust 40 Rowes Wharf Boston, MA 02110 DOB: 07/26/1944 | Chairman of the Board of Trustees | Chairman of the Board of Trustees since March 2005; Lead Independent Trustee (September 2004 – March 2005); Trustee since December 2000. | Consultant – Law and Business2; Vice Chair (since 2002) and Secretary, Provant, Inc. (provider of personnel performance improvement services and training products); Author of Legal Treatises. | 47 | None. | ||||||||||||||||||
1 Each Trustee is elected to serve during the continued lifetime of the Trust until he/she dies, resigns or is removed, or if sooner, until the next meeting of Shareholders called for the purpose of electing Trustees and until the election and qualification of his/her successor.
2 As part of Mr. Glazer's work as a consultant, he provides part-time consulting services to Goodwin Procter LLP ("Goodwin"). Goodwin has provided legal services to Renewable Resources, LLC, an affiliate of GMO; GMO, in connection with its relationship with Renewable Resources; and funds managed by Renewable Resources. Mr. Glazer has represented that he has no financial interest in, and is not involved in the provision of, such legal services. In the calendar years ended December 31, 2006 and December 31, 2007, these entities paid $825,738 and $291,721 respectively, in legal fees and disbursements to Goodwin.
41
Independent Trustees — (Continued)
| Name, Address, and DOB | Position(s) Held with Trust | Term of Office1 and Length of Time Served | Principal Occupation(s) During Past Five Years | Number of Portfolios in Fund Complex Overseen by Trustee | Other Directorships Held by Trustee | ||||||||||||||||||
| Jay O. Light c/o GMO Trust 40 Rowes Wharf Boston, MA 02110 DOB: 10/03/1941 | Trustee | Since May 1996. | Dean (since April 2006), Acting Dean (August 2005 – April 2006), Senior Associate Dean (1998 – 2005), and Professor of Business Administration, Harvard Business School. | 47 | Director of Harvard Management Company, Inc.3 and Verde, Inc.; Director of Partners HealthCare System, Inc. and Chair of its Investment Committee.4 | ||||||||||||||||||
| W. Nicholas Thorndike c/o GMO Trust 40 Rowes Wharf Boston, MA 02110 DOB: 03/28/1933 | Trustee | Since March 2005. | Director or trustee of various corporations and charitable organizations, including Courier Corporation (a book publisher and manufacturer) (July 1989 – present); Putnam Funds (December 1992 – June 2004); and Providence Journal (a newspaper publisher) (December 1986 – December 2003). | 47 | Director of Courier Corporation (a book publisher and manufacturer); Member of the Investment Committee of Partners HealthCare System, Inc.4 | ||||||||||||||||||
1 Each Trustee is elected to serve during the continued lifetime of the Trust until he/she dies, resigns or is removed, or if sooner, until the next meeting of Shareholders called for the purpose of electing Trustees and until the election and qualification of his/her successor.
3 Harvard Management Company, Inc. is a client of the Manager.
4 Partners HealthCare System, Inc. is a client of the Manager.
42
Principal Officers:
| Name, Address, and DOB | Position(s) Held with Trust | Term of Office5 and Length of Time Served | Principal Occupation(s) During Past Five Years | ||||||||||||
| Scott Eston c/o GMO Trust 40 Rowes Wharf Boston, MA 02110 DOB: 01/20/1956 | President and Chief Executive Officer | President and Chief Executive Officer since October 2002; Chief Financial Officer, November 2006 – February 2007. | Chief Financial Officer, Chief Operating Officer and Member, Grantham, Mayo, Van Otterloo & Co. LLC. | ||||||||||||
| Sheppard N. Burnett c/o GMO Trust 40 Rowes Wharf Boston, MA 02110 DOB: 10/24/1968 | Treasurer and Chief Financial Officer | Chief Financial Officer since March 2007; Treasurer since November 2006; Assistant Treasurer, September 2004 – November 2006. | Fund Administration Staff, Grantham, Mayo, Van Otterloo & Co. LLC (June 2004 – present); Vice President, Director of Tax, Columbia Management Group (2002 – 2004). | ||||||||||||
| Brent C. Arvidson c/o GMO Trust 40 Rowes Wharf Boston, MA 02110 DOB: 06/26/1969 | Assistant Treasurer | Since August 1998. | Senior Fund Administrator, Grantham, Mayo, Van Otterloo & Co. LLC. | ||||||||||||
| John L. Nasrah c/o GMO Trust 40 Rowes Wharf Boston, MA 02110 DOB: 05/27/1977 | Assistant Treasurer | Since March 2007. | Fund Administrator, Grantham, Mayo, Van Otterloo & Co. LLC (September 2004 – present); Tax Analyst, Bain & Company, Inc (June 2003 – September 2004); Senior Tax Associate, PricewaterhouseCoopers LLP (2001 – 2003). | ||||||||||||
| Mahmoodur Rahman c/o GMO Trust 40 Rowes Wharf Boston, MA 02110 DOB: 11/30/1967 | Assistant Treasurer | Since September 2007. | Fund Administrator, Grantham, Mayo, Van Otterloo & Co. (April 2007 – present); Vice President and Senior Tax Manager, Massachusetts Financial Services Company (January 2000 – April 2007). | ||||||||||||
5 Officers are elected to hold such office until their successor is elected and qualified to carry out the duties and responsibilities of their office, or until he or she resigns or is removed from office.
43
Principal Officers — (Continued)
| Name, Address, and DOB | Position(s) Held with Trust | Term of Office5 and Length of Time Served | Principal Occupation(s) During Past Five Years | ||||||||||||
| Michael E. Gillespie c/o GMO Trust 40 Rowes Wharf Boston, MA 02110 DOB: 02/18/1958 | Chief Compliance Officer | Since March 2005. | Vice President of Compliance (June 2004 – February 2005) and Director of Domestic Compliance (March 2002 – June 2004), Fidelity Investments; Vice President and Senior Counsel, State Street Bank and Trust Company (May 1998 – March 2002). | ||||||||||||
| Jason B. Harrison c/o GMO Trust 40 Rowes Wharf Boston, MA 02110 DOB: 01/29/1977 | Vice President and Clerk | Vice President since November 2006; Clerk since March 2006. | Legal Counsel, Grantham, Mayo, Van Otterloo & Co. LLC (since February 2006) and Attorney, Ropes & Gray LLP (September 2002 – February 2006). | ||||||||||||
| David L. Bohan c/o GMO Trust 40 Rowes Wharf Boston, MA 02110 DOB: 06/21/1964 | Vice President and Assistant Clerk | Vice President since March 2005; Assistant Clerk since March 2006. | Legal Counsel, Grantham, Mayo, Van Otterloo & Co. LLC (September 2003 – present); Attorney, Goodwin Procter LLP (September 1996 – September 2003). | ||||||||||||
| Gregory L. Pottle c/o GMO Trust 40 Rowes Wharf Boston, MA 02110 DOB: 07/09/1971 | Vice President and Assistant Clerk | Since November 2006. | Legal Counsel, Grantham, Mayo, Van Otterloo & Co. LLC. | ||||||||||||
| Anne K. Trinque c/o GMO Trust 40 Rowes Wharf Boston, MA 02110 DOB: 04/15/1978 | Vice President and Assistant Clerk | Since September 2007. | Legal Counsel, Grantham, Mayo, Van Otterloo & Co. LLC (since January 2007); Attorney, Goodwin Procter LLP (September 2003 – January 2007). | ||||||||||||
| Cheryl Wakeham c/o GMO Trust 40 Rowes Wharf Boston, MA 02110 DOB: 10/29/1958 | Anti-Money Laundering Officer | Since December 2004. | Manager, Client Service Administration, Grantham, Mayo, Van Otterloo & Co. LLC. | ||||||||||||
5 Officers are elected to hold such office until their successor is elected and qualified to carry out the duties and responsibilities of their office, or until he or she resigns or is removed from office.
44
GMO Tax-Managed U.S. Equities Fund
(A Series of GMO Trust)
Annual Report
February 29, 2008
For a free copy of the Fund's proxy voting guidelines, shareholders may call 1-617-346-7646 (collect), visit our website at www.gmo.com, or visit the Securities and Exchange Commission's website at www.sec.gov. Information regarding how the Fund voted proxies relating to portfolio securities during the most recent 12-month period ended June 30 is available on our website at www.gmo.com, or on the Securities and Exchange Commission's website at www.sec.gov.
The Fund files its complete schedule of portfolio holdings with the Securities and Exchange Commission for the first and third quarter of each fiscal year on Form N-Q, which is available on the Commission's website at www.sec.gov. The Fund's Form N-Q may be reviewed and copied at the Commission's Public Reference Room in Washington, D.C. Information on the operation of the Public Reference Room may be obtained by calling 1-800-SEC-0330. The Fund has a policy with respect to disclosure of portfolio holdings under which it may also make available on GMO's website (www.gmo.com) a complete schedule of portfolio holdings.
This report is prepared for the general information of shareholders. It is authorized for distribution to prospective investors only when preceded or accompanied by a prospectus for the GMO Trust.
GMO Tax-Managed U.S. Equities Fund
(A Series of GMO Trust)
Portfolio Managers
Day-to-day management of the Fund's portfolio is the responsibility of the U.S. Quantitative team at Grantham, Mayo, Van Otterloo & Co. LLC.
Management Discussion and Analysis of Fund Performance
The GMO Tax-Managed U.S. Equities Fund returned -6.8% for the fiscal year ended February 29, 2008, as compared to -3.8% for the Russell 3000 Index+. On an after-tax basis, the Fund returned -7.5% compared to the benchmark's -4.1% for the same period. The Fund was invested substantially in U.S. equity securities throughout the period.
The portfolio's underperformance for the fiscal year is attributed primarily to stock selection. Sector selection had a neutral effect. The portfolio benefited from being underweight in Financials, the weakest sector for the period. Overweight exposure to Consumer Discretionary stocks, the next weakest sector, worked against the portfolio.
Stock selection accounted for the majority of the portfolio's underperformance in the period. Selections within Financials and Consumer Discretionary stocks accounted for the lion's share of the deficit. Overweight exposure to Citigroup and Fannie Mae worked against the portfolio. Within Consumer Discretionary stocks, overweight exposure to Home Depot and Lowes were the chief disappointments.
For the fiscal year, the crux of the underperformance came from poor returns from the valuation-based stock selection strategy. While the portfolio's valuation strategy gives explicit credit to companies with strong financial quality (high, stable profitability and low debt), this approach worked poorly for the majority of the period. The momentum-based strategy was more successful, finishing in positive territory after a lackluster start to the fiscal year.
Note: Russell 3000 Index+ represents the S&P 500 Index prior to 10/15/2007 and the Russell 3000 Index thereafter.
The views expressed herein are exclusively those of Grantham, Mayo, Van Otterloo & Co. LLC Management as of the date of this report and are subject to change. GMO disclaims any responsibility to update such views. They are not meant as investment advice. References to specific securities are not recommendations of such securities and may not be representative of any GMO portfolio's current or future investments.
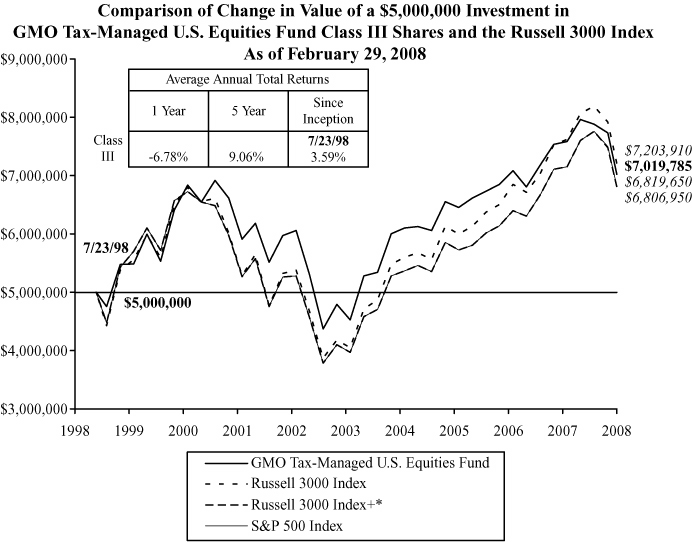
Performance data quoted represents past performance and is not indicative of future results. The investment return and principal value of an investment will fluctuate so that an investor's shares, when redeemed, may be worth more or less than their original cost. Current performance data may be lower or higher than the performance data provided herein. To obtain performance information to the most recent month-end, visit www.gmo.com. Performance shown is net of all fees after reimbursement from the Manager. Returns would have been lower had certain expenses not been reimbursed during the periods shown and do not include the effect of taxes on distributions and redemptions. All information is unaudited.
* Russell 3000 Index+ represents the S&P 500 Index prior to 10/15/2007 and the Russell 3000 Index thereafter. Fund returns do not reflect the tax effect a shareholder would pay on Fund distributions or the redemption of Fund shares.
GMO Tax-Managed U.S. Equities Fund
(A Series of GMO Trust)
Investments Concentration Summary
February 29, 2008 (Unaudited)
| Asset Class Summary | % of Total Net Assets | ||||||
| Common Stocks | 97.8 | % | |||||
| Short-Term Investments | 2.1 | ||||||
| Other | 0.1 | ||||||
| 100.0 | % | ||||||
| Industry Sector Summary | % of Equity Investments | ||||||
| Health Care | 22.6 | % | |||||
| Energy | 16.4 | ||||||
| Information Technology | 16.4 | ||||||
| Consumer Staples | 16.0 | ||||||
| Consumer Discretionary | 10.0 | ||||||
| Industrials | 6.7 | ||||||
| Financials | 5.9 | ||||||
| Telecommunication Services | 2.7 | ||||||
| Materials | 2.3 | ||||||
| Utilities | 1.0 | ||||||
| 100.0 | % | ||||||
1
GMO Tax-Managed U.S. Equities Fund
(A Series of GMO Trust)
Schedule of Investments
(showing percentage of total net assets)
February 29, 2008
| Shares | Description | Value ($) | |||||||||||||
| COMMON STOCKS — 97.8% | |||||||||||||||
| Consumer Discretionary — 9.8% | |||||||||||||||
| 900 | Abercrombie & Fitch Co.-Class A | 69,777 | |||||||||||||
| 7,600 | Amazon.com, Inc. * | 489,972 | |||||||||||||
| 2,850 | American Eagle Outfitters, Inc. | 60,904 | |||||||||||||
| 8,300 | Apollo Group, Inc.-Class A * | 509,454 | |||||||||||||
| 5,800 | AutoNation, Inc. * | 84,506 | |||||||||||||
| 1,800 | AutoZone, Inc. * | 207,144 | |||||||||||||
| 5,600 | Bed Bath & Beyond, Inc. * | 158,704 | |||||||||||||
| 1,600 | Carnival Corp. | 62,960 | |||||||||||||
| 5,200 | Coach, Inc. * | 157,664 | |||||||||||||
| 2,600 | Discovery Holding Co.-Class A * | 58,682 | |||||||||||||
| 600 | Dollar Tree Stores, Inc. * | 16,098 | |||||||||||||
| 3,500 | Expedia, Inc. * | 80,255 | |||||||||||||
| 2,700 | Family Dollar Stores, Inc. | 51,705 | |||||||||||||
| 26,069 | Ford Motor Co. * | 170,231 | |||||||||||||
| 900 | GameStop Corp.-Class A * | 38,124 | |||||||||||||
| 4,600 | Gannett Co., Inc. | 138,690 | |||||||||||||
| 800 | General Motors Corp. | 18,624 | |||||||||||||
| 4,000 | Goodyear Tire & Rubber Co. (The) * | 108,400 | |||||||||||||
| 4,300 | Harley-Davidson, Inc. | 159,788 | |||||||||||||
| 3,900 | Hasbro, Inc. | 100,503 | |||||||||||||
| 69,700 | Home Depot, Inc. | 1,850,535 | |||||||||||||
| 1,700 | IAC/InterActive Corp. * | 33,830 | |||||||||||||
| 1,500 | ITT Educational Services, Inc. * | 82,830 | |||||||||||||
| 7,200 | Johnson Controls, Inc. | 236,592 | |||||||||||||
| 5,600 | Kohl's Corp. * | 248,864 | |||||||||||||
| 1,100 | Liberty Global, Inc.-Class A * | 41,360 | |||||||||||||
| 700 | Liberty Media Holding Corp. Capital-Class A * | 81,277 | |||||||||||||
| 2,300 | Liz Claiborne, Inc. | 40,894 | |||||||||||||
| 40,300 | Lowe's Cos., Inc. | 965,991 | |||||||||||||
| 4,800 | Mattel Co. | 92,736 | |||||||||||||
| 9,400 | McDonald's Corp. | 508,634 | |||||||||||||
| 1,952 | MGM Mirage * | 120,224 | |||||||||||||
| 4,300 | Nike, Inc.-Class B | 258,860 | |||||||||||||
| 1,800 | Nordstrom, Inc. | 66,654 | |||||||||||||
See accompanying notes to the financial statements.
2
GMO Tax-Managed U.S. Equities Fund
(A Series of GMO Trust)
Schedule of Investments — (Continued)
(showing percentage of total net assets)
February 29, 2008
| Shares | Description | Value ($) | |||||||||||||
| Consumer Discretionary — continued | |||||||||||||||
| 500 | Polo Ralph Lauren Corp. | 31,095 | |||||||||||||
| 1,100 | RadioShack Corp. | 19,195 | |||||||||||||
| 1,100 | Ross Stores, Inc. | 30,635 | |||||||||||||
| 600 | Sherwin-Williams Co. (The) | 31,068 | |||||||||||||
| 8,200 | Staples, Inc. | 182,450 | |||||||||||||
| 1,300 | Starbucks Corp. * | 23,361 | |||||||||||||
| 9,600 | Target Corp. | 505,056 | |||||||||||||
| 2,600 | Tiffany & Co. | 97,864 | |||||||||||||
| 3,200 | VF Corp. | 243,328 | |||||||||||||
| 4,300 | Yum! Brands, Inc. | 148,135 | |||||||||||||
| Total Consumer Discretionary | 8,683,653 | ||||||||||||||
| Consumer Staples — 15.6% | |||||||||||||||
| 20,600 | Altria Group, Inc. | 1,506,684 | |||||||||||||
| 7,100 | Anheuser-Busch Cos., Inc. | 334,339 | |||||||||||||
| 4,000 | Avon Products, Inc. | 152,240 | |||||||||||||
| 48,700 | Coca-Cola Co. (The) | 2,847,002 | |||||||||||||
| 2,100 | Colgate-Palmolive Co. | 159,789 | |||||||||||||
| 1,800 | Costco Wholesale Corp. | 111,456 | |||||||||||||
| 1,000 | CVS Caremark Corp. | 40,380 | |||||||||||||
| 2,000 | Energizer Holdings, Inc. * | 185,660 | |||||||||||||
| 1,800 | Estee Lauder Cos. (The), Inc.-Class A | 76,644 | |||||||||||||
| 5,100 | Kimberly-Clark Corp. | 332,418 | |||||||||||||
| 8,237 | Kraft Foods, Inc. | 256,747 | |||||||||||||
| 4,700 | Kroger Co. (The) | 113,975 | |||||||||||||
| 21,600 | PepsiCo, Inc. | 1,502,496 | |||||||||||||
| 15,200 | Procter & Gamble Co. (The) | 1,005,936 | |||||||||||||
| 3,000 | Safeway, Inc. | 86,220 | |||||||||||||
| 1,757 | Supervalu, Inc. | 46,121 | |||||||||||||
| 9,100 | Tyson Foods, Inc.-Class A | 131,131 | |||||||||||||
| 2,100 | UST, Inc. | 114,009 | |||||||||||||
| 11,500 | Walgreen Co. | 419,865 | |||||||||||||
| 88,500 | Wal-Mart Stores, Inc. | 4,388,715 | |||||||||||||
| 300 | WM Wrigley Jr. Co. | 17,958 | |||||||||||||
| Total Consumer Staples | 13,829,785 | ||||||||||||||
See accompanying notes to the financial statements.
3
GMO Tax-Managed U.S. Equities Fund
(A Series of GMO Trust)
Schedule of Investments — (Continued)
(showing percentage of total net assets)
February 29, 2008
| Shares | Description | Value ($) | |||||||||||||
| Energy — 16.0% | |||||||||||||||
| 2,300 | Anadarko Petroleum Corp. | 146,602 | |||||||||||||
| 2,900 | Apache Corp. | 332,659 | |||||||||||||
| 2,300 | Cameron International Corp. * | 97,704 | |||||||||||||
| 39,900 | Chevron Corp. | 3,457,734 | |||||||||||||
| 14,574 | ConocoPhillips | 1,205,416 | |||||||||||||
| 1,200 | Devon Energy Corp. | 123,264 | |||||||||||||
| 1,000 | Diamond Offshore Drilling, Inc. | 120,830 | |||||||||||||
| 56,900 | Exxon Mobil Corp. | 4,950,869 | |||||||||||||
| 300 | FMC Technologies, Inc. * | 16,998 | |||||||||||||
| 2,100 | Halliburton Co. | 80,430 | |||||||||||||
| 1,100 | Hess Corp. | 102,498 | |||||||||||||
| 3,400 | Marathon Oil Corp. | 180,744 | |||||||||||||
| 700 | Murphy Oil Corp. | 56,266 | |||||||||||||
| 800 | Noble Corp. | 39,320 | |||||||||||||
| 9,600 | Occidental Petroleum Corp. | 742,752 | |||||||||||||
| 14,900 | Schlumberger Ltd. | 1,288,105 | |||||||||||||
| 2,200 | Smith International, Inc. | 138,666 | |||||||||||||
| 300 | Sunoco, Inc. | 18,324 | |||||||||||||
| 4,189 | Transocean, Inc. * | 588,596 | |||||||||||||
| 7,500 | Valero Energy Corp. | 433,275 | |||||||||||||
| 1,500 | Weatherford International Ltd. * | 103,380 | |||||||||||||
| Total Energy | 14,224,432 | ||||||||||||||
| Financials — 5.8% | |||||||||||||||
| 700 | ACE Ltd. | 39,368 | |||||||||||||
| 2,900 | Aflac, Inc. | 180,989 | |||||||||||||
| 12,000 | Allstate Corp. (The) | 572,760 | |||||||||||||
| 11,100 | American International Group, Inc. | 520,146 | |||||||||||||
| 1,800 | AON Corp. | 74,898 | |||||||||||||
| 17,108 | Bank of America Corp. | 679,872 | |||||||||||||
| 1,000 | BB&T Corp. | 31,130 | |||||||||||||
| 800 | Brown & Brown, Inc. | 14,264 | |||||||||||||
| 1,200 | Chubb Corp. | 61,080 | |||||||||||||
| 47,800 | Citigroup, Inc. | 1,133,338 | |||||||||||||
See accompanying notes to the financial statements.
4
GMO Tax-Managed U.S. Equities Fund
(A Series of GMO Trust)
Schedule of Investments — (Continued)
(showing percentage of total net assets)
February 29, 2008
| Shares | Description | Value ($) | |||||||||||||
| Financials — continued | |||||||||||||||
| 600 | CNA Financial Corp. | 15,990 | |||||||||||||
| 1,100 | Comerica, Inc. | 39,864 | |||||||||||||
| 900 | Eaton Vance Corp. | 28,665 | |||||||||||||
| 4,300 | Fannie Mae | 118,895 | |||||||||||||
| 400 | First American Corp. | 13,932 | |||||||||||||
| 1,300 | Franklin Resources, Inc. | 122,681 | |||||||||||||
| 400 | Goldman Sachs Group, Inc. | 67,852 | |||||||||||||
| 1,200 | Leucadia National Corp. | 54,312 | |||||||||||||
| 100 | Markel Corp. * | 46,475 | |||||||||||||
| 500 | MetLife, Inc. | 29,130 | |||||||||||||
| 800 | Moody's Corp. | 30,384 | |||||||||||||
| 500 | Morgan Stanley | 21,060 | |||||||||||||
| 7,100 | National City Corp. | 112,606 | |||||||||||||
| 4,387 | Old Republic International Corp. | 60,190 | |||||||||||||
| 4,500 | Progressive Corp. (The) | 82,485 | |||||||||||||
| 2,300 | Prudential Financial, Inc. | 167,831 | |||||||||||||
| 800 | Safeco Corp. | 37,008 | |||||||||||||
| 1,200 | SEI Investment Co. | 30,012 | |||||||||||||
| 2,100 | Torchmark Corp. | 126,546 | |||||||||||||
| 7,000 | Travelers Cos. (The), Inc. | 324,870 | |||||||||||||
| 5,400 | Unum Group | 123,714 | |||||||||||||
| 4,600 | US Bancorp | 147,292 | |||||||||||||
| 1,250 | W.R. Berkley Corp. | 35,988 | |||||||||||||
| Total Financials | 5,145,627 | ||||||||||||||
| Health Care — 22.1% | |||||||||||||||
| 12,300 | Abbott Laboratories | 658,665 | |||||||||||||
| 5,600 | Aetna, Inc. | 277,760 | |||||||||||||
| 5,800 | AmerisourceBergen Corp. | 241,976 | |||||||||||||
| 3,900 | Amgen, Inc. * | 177,528 | |||||||||||||
| 200 | Bard (C.R.), Inc. | 18,958 | |||||||||||||
| 2,700 | Baxter International, Inc. | 159,354 | |||||||||||||
| 2,100 | Biogen Idec, Inc. * | 122,556 | |||||||||||||
| 6,000 | Bristol-Myers Squibb Co. | 135,660 | |||||||||||||
See accompanying notes to the financial statements.
5
GMO Tax-Managed U.S. Equities Fund
(A Series of GMO Trust)
Schedule of Investments — (Continued)
(showing percentage of total net assets)
February 29, 2008
| Shares | Description | Value ($) | |||||||||||||
| Health Care — continued | |||||||||||||||
| 4,600 | Cardinal Health, Inc. | 272,044 | |||||||||||||
| 4,600 | Cigna Corp. | 205,068 | |||||||||||||
| 3,300 | Coventry Health Care, Inc. * | 171,171 | |||||||||||||
| 700 | DENTSPLY International, Inc. | 27,328 | |||||||||||||
| 8,500 | Eli Lilly & Co. | 425,170 | |||||||||||||
| 13,400 | Express Scripts, Inc. * | 791,940 | |||||||||||||
| 9,200 | Forest Laboratories, Inc. * | 365,884 | |||||||||||||
| 1,000 | Gilead Sciences, Inc. * | 47,320 | |||||||||||||
| 900 | Health Net, Inc. * | 39,546 | |||||||||||||
| 600 | Intuitive Surgical, Inc. * | 169,152 | |||||||||||||
| 300 | Invitrogen Corp. * | 25,347 | |||||||||||||
| 42,500 | Johnson & Johnson | 2,633,300 | |||||||||||||
| 4,700 | King Pharmaceuticals, Inc. * | 49,820 | |||||||||||||
| 8,000 | McKesson Corp. | 470,080 | |||||||||||||
| 8,526 | Medco Health Solutions, Inc. * | 377,787 | |||||||||||||
| 9,200 | Medtronic, Inc. | 454,112 | |||||||||||||
| 54,200 | Merck & Co., Inc. | 2,401,060 | |||||||||||||
| 157,230 | Pfizer, Inc. | 3,503,084 | |||||||||||||
| 2,600 | Quest Diagnostics, Inc. | 123,942 | |||||||||||||
| 11,400 | Schering-Plough Corp. | 247,380 | |||||||||||||
| 1,800 | St. Jude Medical, Inc. * | 77,364 | |||||||||||||
| 9,500 | Stryker Corp. | 618,545 | |||||||||||||
| 58,400 | UnitedHealth Group, Inc. | 2,714,432 | |||||||||||||
| 1,000 | Waters Corp. * | 59,610 | |||||||||||||
| 6,600 | WellPoint, Inc. * | 462,528 | |||||||||||||
| 7,500 | Wyeth | 327,150 | |||||||||||||
| 10,500 | Zimmer Holdings, Inc. * | 790,545 | |||||||||||||
| Total Health Care | 19,643,166 | ||||||||||||||
| Industrials — 6.6% | |||||||||||||||
| 14,900 | 3M Co. | 1,168,160 | |||||||||||||
| 4,000 | Caterpillar, Inc. | 289,320 | |||||||||||||
| 900 | CH Robinson Worldwide, Inc. | 45,693 | |||||||||||||
| 3,000 | CSX Corp. | 145,560 | |||||||||||||
| 400 | Cummins, Inc. | 20,152 | |||||||||||||
See accompanying notes to the financial statements.
6
GMO Tax-Managed U.S. Equities Fund
(A Series of GMO Trust)
Schedule of Investments — (Continued)
(showing percentage of total net assets)
February 29, 2008
| Shares | Description | Value ($) | |||||||||||||
| Industrials — continued | |||||||||||||||
| 4,800 | Danaher Corp. | 355,920 | |||||||||||||
| 5,900 | Deere & Co. | 502,739 | |||||||||||||
| 200 | Eaton Corp. | 16,126 | |||||||||||||
| 300 | Emerson Electric Co. | 15,288 | |||||||||||||
| 1,100 | FedEx Corp. | 96,943 | |||||||||||||
| 300 | Flowserve Corp. | 32,670 | |||||||||||||
| 1,300 | Fluor Corp. | 181,025 | |||||||||||||
| 600 | General Dynamics Corp. | 49,110 | |||||||||||||
| 1,100 | Goodrich Corp. | 65,153 | |||||||||||||
| 8,100 | Honeywell International, Inc. | 466,074 | |||||||||||||
| 2,900 | Illinois Tool Works, Inc. | 142,303 | |||||||||||||
| 1,400 | Ingersoll-Rand | 58,604 | |||||||||||||
| 1,100 | ITT Industries, Inc. | 61,864 | |||||||||||||
| 1,900 | Jacobs Engineering Group, Inc. * | 152,551 | |||||||||||||
| 1,700 | L-3 Communications Holdings, Inc. | 180,693 | |||||||||||||
| 1,500 | Masco Corp. | 28,035 | |||||||||||||
| 1,300 | Northrop Grumman Corp. | 102,193 | |||||||||||||
| 9,025 | Paccar, Inc. | 391,505 | |||||||||||||
| 1,300 | Pall Corp. | 51,181 | |||||||||||||
| 1,700 | Parker-Hannifin Corp. | 109,871 | |||||||||||||
| 800 | Pitney Bowes, Inc. | 28,624 | |||||||||||||
| 2,200 | Precision Castparts Corp. | 242,858 | |||||||||||||
| 1,700 | Textron, Inc. | 92,089 | |||||||||||||
| 500 | Union Pacific Corp. | 62,380 | |||||||||||||
| 1,900 | United Parcel Service, Inc.-Class B | 133,456 | |||||||||||||
| 6,200 | United Technologies Corp. | 437,162 | |||||||||||||
| 1,400 | W.W. Grainger, Inc. | 103,124 | |||||||||||||
| Total Industrials | 5,828,426 | ||||||||||||||
| Information Technology — 16.0% | |||||||||||||||
| 600 | Adobe Systems, Inc. * | 20,190 | |||||||||||||
| 1,500 | Affiliated Computer Services, Inc.-Class A * | 76,125 | |||||||||||||
| 1,700 | Analog Devices, Inc. | 45,764 | |||||||||||||
| 9,000 | Apple, Inc. * | 1,125,180 | |||||||||||||
| 1,100 | Arrow Electronics, Inc. * | 35,871 | |||||||||||||
See accompanying notes to the financial statements.
7
GMO Tax-Managed U.S. Equities Fund
(A Series of GMO Trust)
Schedule of Investments — (Continued)
(showing percentage of total net assets)
February 29, 2008
| Shares | Description | Value ($) | |||||||||||||
| Information Technology — continued | |||||||||||||||
| 2,700 | Avnet, Inc. * | 91,017 | |||||||||||||
| 300 | BMC Software, Inc. * | 9,684 | |||||||||||||
| 2,100 | CA, Inc. | 48,048 | |||||||||||||
| 1,700 | Cadence Design Systems, Inc. * | 18,054 | |||||||||||||
| 61,200 | Cisco Systems, Inc. * | 1,491,444 | |||||||||||||
| 500 | Citrix Systems, Inc. * | 16,465 | |||||||||||||
| 4,600 | Corning, Inc. | 106,858 | |||||||||||||
| 1,000 | Cypress Semiconductor Corp. * | 21,740 | |||||||||||||
| 49,100 | Dell, Inc. * | 974,635 | |||||||||||||
| 27,661 | eBay, Inc. * | 729,144 | |||||||||||||
| 38,600 | EMC Corp. * | 599,844 | |||||||||||||
| 4,900 | Fiserv, Inc. * | 257,838 | |||||||||||||
| 900 | FLIR Systems, Inc. * | 25,614 | |||||||||||||
| 1,700 | Google, Inc.-Class A * | 801,006 | |||||||||||||
| 5,500 | Hewlett-Packard Co. | 262,735 | |||||||||||||
| 22,100 | Intel Corp. | 440,895 | |||||||||||||
| 13,500 | International Business Machines Corp. | 1,537,110 | |||||||||||||
| 1,700 | Juniper Networks, Inc. * | 45,594 | |||||||||||||
| 1,900 | KLA-Tencor Corp. | 79,819 | |||||||||||||
| 2,300 | Lexmark International, Inc. * | 75,969 | |||||||||||||
| 2,400 | McAfee, Inc. * | 79,848 | |||||||||||||
| 90,200 | Microsoft Corp. | 2,455,244 | |||||||||||||
| 1,000 | NCR Corp. * | 22,160 | |||||||||||||
| 35,800 | Oracle Corp. * | 673,040 | |||||||||||||
| 43,800 | Qualcomm, Inc. | 1,855,806 | |||||||||||||
| 600 | Texas Instruments, Inc. | 17,976 | |||||||||||||
| 900 | Total System Services, Inc. | 20,007 | |||||||||||||
| 2,000 | VeriSign, Inc. * | 69,600 | |||||||||||||
| 3,200 | Xilinx, Inc. | 71,552 | |||||||||||||
| Total Information Technology | 14,201,876 | ||||||||||||||
| Materials — 2.3% | |||||||||||||||
| 900 | Air Products & Chemicals, Inc. | 82,197 | |||||||||||||
| 3,800 | Alcoa, Inc. | 141,132 | |||||||||||||
| 500 | Ball Corp. | 22,050 | |||||||||||||
See accompanying notes to the financial statements.
8
GMO Tax-Managed U.S. Equities Fund
(A Series of GMO Trust)
Schedule of Investments — (Continued)
(showing percentage of total net assets)
February 29, 2008
| Shares | Description | Value ($) | |||||||||||||
| Materials — continued | |||||||||||||||
| 1,300 | Celanese Corp.-Class A | 50,570 | |||||||||||||
| 2,700 | Dow Chemical Co. (The) | 101,763 | |||||||||||||
| 200 | Eastman Chemical Co. | 13,162 | |||||||||||||
| 1,200 | Lubrizol Corp. | 69,960 | |||||||||||||
| 400 | Martin Marietta Materials, Inc. | 43,040 | |||||||||||||
| 8,500 | Monsanto Co. | 983,280 | |||||||||||||
| 2,000 | Owens-IIlinois, Inc. * | 112,900 | |||||||||||||
| 1,500 | PPG Industries, Inc. | 92,970 | |||||||||||||
| 1,600 | Praxair, Inc. | 128,448 | |||||||||||||
| 500 | Sealed Air Corp. | 12,105 | |||||||||||||
| 200 | Vulcan Materials Co. | 14,020 | |||||||||||||
| 2,100 | Weyerhaeuser Co. | 128,520 | |||||||||||||
| Total Materials | 1,996,117 | ||||||||||||||
| Telecommunication Services — 2.6% | |||||||||||||||
| 21,763 | AT&T, Inc. | 758,005 | |||||||||||||
| 600 | CenturyTel, Inc. | 21,714 | |||||||||||||
| 42,642 | Verizon Communications, Inc. | 1,548,757 | |||||||||||||
| Total Telecommunication Services | 2,328,476 | ||||||||||||||
| Utilities — 1.0% | |||||||||||||||
| 3,200 | American Electric Power Co., Inc. | 130,944 | |||||||||||||
| 1,200 | Centerpoint Energy, Inc. | 17,616 | |||||||||||||
| 1,100 | Constellation Energy Group, Inc. | 97,185 | |||||||||||||
| 1,800 | Edison International | 88,920 | |||||||||||||
| 1,400 | Entergy Corp. | 143,836 | |||||||||||||
| 1,300 | FPL Group, Inc. | 78,377 | |||||||||||||
| 1,000 | Mirant Corp. * | 37,000 | |||||||||||||
| 1,700 | NRG Energy, Inc. * | 70,159 | |||||||||||||
| 2,800 | Public Service Enterprise Group, Inc. | 123,480 | |||||||||||||
| 2,900 | Reliant Energy, Inc. * | 66,120 | |||||||||||||
| Total Utilities | 853,637 | ||||||||||||||
| TOTAL COMMON STOCKS (COST $86,982,840) | 86,735,195 | ||||||||||||||
See accompanying notes to the financial statements.
9
GMO Tax-Managed U.S. Equities Fund
(A Series of GMO Trust)
Schedule of Investments — (Continued)
(showing percentage of total net assets)
February 29, 2008
| Par Value ($) | Description | Value ($) | |||||||||||||
| SHORT-TERM INVESTMENTS — 2.1% | |||||||||||||||
| 1,621,799 | Citigroup Global Markets Repurchase Agreement, dated 02/29/08, due 03/03/08, with a maturity value of $1,621,900 and an effective yield of 0.75%, collateralized by a U.S. Treasury Bond with a rate of 11.25%, maturity date of 02/15/15, and a market value, including accrued interest, of $1,651,245. | 1,621,799 | |||||||||||||
| 200,000 | U.S. Treasury Bill, 1.79%, due 07/24/08 (a) | 198,586 | |||||||||||||
| TOTAL SHORT-TERM INVESTMENTS (COST $1,819,970) | 1,820,385 | ||||||||||||||
| TOTAL INVESTMENTS — 99.9% (Cost $88,802,810) | 88,555,580 | ||||||||||||||
| Other Assets and Liabilities (net) — 0.1% | 130,018 | ||||||||||||||
| TOTAL NET ASSETS — 100.0% | $ | 88,685,598 | |||||||||||||
Notes to Schedule of Investments:
* Non-income producing security.
(a) Rate shown represents yield-to-maturity.
See accompanying notes to the financial statements.
10
GMO Tax-Managed U.S. Equities Fund
(A Series of GMO Trust)
Statement of Assets and Liabilities — February 29, 2008
| Assets: | |||||||
| Investments, at value (cost $88,802,810) (Note 2) | $ | 88,555,580 | |||||
| Dividends and interest receivable | 194,508 | ||||||
| Receivable for expenses reimbursed by Manager (Note 3) | 31,270 | ||||||
| Total assets | 88,781,358 | ||||||
| Liabilities: | |||||||
| Payable to affiliate for (Note 3): | |||||||
| Management fee | 23,532 | ||||||
| Shareholder service fee | 10,696 | ||||||
| Trustees and Chief Compliance Officer of GMO Trust fees | 98 | ||||||
| Accrued expenses | 61,434 | ||||||
| Total liabilities | 95,760 | ||||||
| Net assets | $ | 88,685,598 | |||||
| Net assets consist of: | |||||||
| Paid-in capital | $ | 88,928,493 | |||||
| Accumulated undistributed net investment income | 213,290 | ||||||
| Distributions in excess of net realized gain | (208,955 | ) | |||||
| Net unrealized depreciation | (247,230 | ) | |||||
| $ | 88,685,598 | ||||||
| Net assets attributable to: | |||||||
| Class III shares | $ | 88,685,598 | |||||
| Shares outstanding: | |||||||
| Class III | 7,266,167 | ||||||
| Net asset value per share: | |||||||
| Class III | $ | 12.21 | |||||
See accompanying notes to the financial statements.
11
GMO Tax-Managed U.S. Equities Fund
(A Series of GMO Trust)
Statement of Operations — Year Ended February 29, 2008
| Investment Income: | |||||||
| Dividends | $ | 2,167,892 | |||||
| Interest | 84,900 | ||||||
| Total investment income | 2,252,792 | ||||||
| Expenses: | |||||||
| Management fee (Note 3) | 366,235 | ||||||
| Shareholder service fee – Class III (Note 3) | 166,471 | ||||||
| Custodian, fund accounting agent and transfer agent fees | 38,349 | ||||||
| Audit and tax fees | 48,602 | ||||||
| Legal fees | 23,608 | ||||||
| Trustees fees and related expenses (Note 3) | 23,220 | ||||||
| Registration fees | 184 | ||||||
| Miscellaneous | 2,185 | ||||||
| Total expenses | 668,854 | ||||||
| Fees and expenses reimbursed by Manager (Note 3) | (134,700 | ) | |||||
| Expense reductions (Note 2) | (9 | ) | |||||
| Net expenses | 534,145 | ||||||
| Net investment income (loss) | 1,718,647 | ||||||
| Realized and unrealized gain (loss): | |||||||
| Net realized gain (loss) on: | |||||||
| Investments | 6,146,177 | ||||||
| Closed futures contracts | (60,668 | ) | |||||
| Net realized gain (loss) | 6,085,509 | ||||||
| Change in net unrealized appreciation (depreciation) on investments | (13,115,568 | ) | |||||
| Net realized and unrealized gain (loss) | (7,030,059 | ) | |||||
| Net increase (decrease) in net assets resulting from operations | $ | (5,311,412 | ) | ||||
See accompanying notes to the financial statements.
12
GMO Tax-Managed U.S. Equities Fund
(A Series of GMO Trust)
Statement of Changes in Net Assets
| Year Ended February 29, 2008 | Year Ended February 28, 2007 | ||||||||||
| Increase (decrease) in net assets: | |||||||||||
| Operations: | |||||||||||
| Net investment income (loss) | $ | 1,718,647 | $ | 1,733,783 | |||||||
| Net realized gain (loss) | 6,085,509 | 3,529,504 | |||||||||
| Change in net unrealized appreciation (depreciation) | (13,115,568 | ) | 2,169,764 | ||||||||
| Net increase (decrease) in net assets from operations | (5,311,412 | ) | 7,433,051 | ||||||||
| Distributions to shareholders from: | |||||||||||
| Net investment income | |||||||||||
| Class III | (1,800,557 | ) | (1,642,938 | ) | |||||||
| Net realized gains | |||||||||||
| Class III | (1,256,863 | ) | — | ||||||||
| (3,057,420 | ) | (1,642,938 | ) | ||||||||
| Net share transactions (Note 7): | |||||||||||
| Class III | (19,670,155 | ) | (10,404,882 | ) | |||||||
| Total increase (decrease) in net assets | (28,038,987 | ) | (4,614,769 | ) | |||||||
| Net assets: | |||||||||||
| Beginning of period | 116,724,585 | 121,339,354 | |||||||||
| End of period (including accumulated undistributed net investment income of $213,290 and $306,453, respectively) | $ | 88,685,598 | $ | 116,724,585 | |||||||
See accompanying notes to the financial statements.
13
GMO Tax-Managed U.S. Equities Fund
(A Series of GMO Trust)
Financial Highlights
(For a Class III share outstanding throughout each period)
| Year Ended February 28/29, | |||||||||||||||||||||||
| 2008 | 2007 | 2006 | 2005 | 2004 | |||||||||||||||||||
| Net asset value, beginning of period | $ | 13.48 | $ | 12.83 | $ | 12.14 | $ | 11.58 | $ | 8.62 | |||||||||||||
| Income (loss) from investment operations: | |||||||||||||||||||||||
| Net investment income (loss)† | 0.21 | 0.19 | 0.20 | 0.16 | 0.14 | ||||||||||||||||||
| Net realized and unrealized gain (loss) | (1.08 | ) | 0.64 | 0.69 | 0.54 | 2.96 | |||||||||||||||||
| Total from investment operations | (0.87 | ) | 0.83 | 0.89 | 0.70 | 3.10 | |||||||||||||||||
| Less distributions to shareholders: | |||||||||||||||||||||||
| From net investment income | (0.22 | ) | (0.18 | ) | (0.20 | ) | (0.14 | ) | (0.14 | ) | |||||||||||||
| From net realized gains | (0.18 | ) | — | — | — | — | |||||||||||||||||
| Total distributions | (0.40 | ) | (0.18 | ) | (0.20 | ) | (0.14 | ) | (0.14 | ) | |||||||||||||
| Net asset value, end of period | $ | 12.21 | $ | 13.48 | $ | 12.83 | $ | 12.14 | $ | 11.58 | |||||||||||||
| Total Return(a) | (6.78 | )% | 6.53 | % | 7.46 | % | 6.12 | %(b) | 36.21 | % | |||||||||||||
| Ratios/Supplemental Data: | |||||||||||||||||||||||
| Net assets, end of period (000's) | $ | 88,686 | $ | 116,725 | $ | 121,339 | $ | 81,374 | $ | 62,027 | |||||||||||||
| Net expenses to average daily net assets | 0.48 | %(c) | 0.48 | % | 0.48 | % | 0.48 | % | 0.48 | % | |||||||||||||
| Net investment income to average daily net assets | 1.55 | % | 1.46 | % | 1.65 | % | 1.39 | % | 1.34 | % | |||||||||||||
| Portfolio turnover rate | 62 | % | 67 | % | 62 | % | 87 | % | 70 | % | |||||||||||||
| Fees and expenses reimbursed by the Manager to average daily net assets: | 0.12 | % | 0.11 | % | 0.08 | % | 0.08 | % | 0.13 | % | |||||||||||||
(a) The total returns would have been lower had certain expenses not been reimbursed during the periods shown and assumes the effect of reinvested distributions.
(b) The effect of losses in the amount of $15,989 resulting from compliance violations and the Manager's reimbursement of such losses had no effect on total return.
(c) The net expense ratio does not include the effect of expense reductions.
† Calculated using average shares outstanding throughout the period.
See accompanying notes to the financial statements.
14
GMO Tax-Managed U.S. Equities Fund
(A Series of GMO Trust)
Notes to Financial Statements
February 29, 2008
1. Organization
GMO Tax-Managed U.S. Equities Fund (the "Fund") is a series of GMO Trust (the "Trust"). The Fund is registered under the Investment Company Act of 1940, as amended, as an open-end, non-diversified management investment company. The Fund is advised and managed by Grantham, Mayo, Van Otterloo & Co. LLC (the "Manager" or "GMO"). The Trust was established as a Massachusetts business trust under the laws of the Commonwealth of Massachusetts on June 24, 1985. The Declaration of Trust permits the Trustees of the Trust ("Trustees") to create an unlimited number of series of shares ("Funds") and to subdivide Funds into classes.
The Fund seeks high after-tax total return. The Fund seeks to achieve its objective by outperforming the Russell 3000 Index. The Fund typically makes equity investments in companies that issue stocks included in the Russell 3000 Index and companies with similar market capitalizations, and uses quantitative models integrated with tax management techniques to provide broad exposure to the U.S. equity market to investors subject to U.S. federal income tax.
2. Significant accounting policies
The following is a summary of significant accounting policies which are in conformity with accounting principles generally accepted in the United States of America ("U.S. GAAP") and which are consistently followed by the Fund in the preparation of its financial statements. The preparation of financial statements in accordance with U.S. GAAP requires management to make estimates and assumptions that affect the reported amounts and disclosures in the financial statements. Actual results could differ from those estimates. The accounting records of the Fund are maintained in U.S. dollars.
Portfolio valuation
Securities listed on a securities exchange for which market quotations are readily available are valued at the last sale price or official closing price on each business day, or if there is no such reported sale or official closing price, at the most recent quoted bid price. Unlisted securities for which market quotations are readily available are generally valued at the most recent quoted bid price. Short-term investments with a remaining maturity of sixty days or less are generally valued at amortized cost, which approximates fair value. Shares of investment funds are valued at their net asset value. Securities for which quotations are not readily available or whose values the Manager has determined to be unreliable are valued at fair value as determined in good faith by the Trustees or other persons acting at their direction pursuant to procedures approved by the Trustees. By its nature, a fair value price is a good faith est imate of the value of a security at a given point in time and may not reflect the value that would be realized if the security was sold and the differences could be material.
15
GMO Tax-Managed U.S. Equities Fund
(A Series of GMO Trust)
Notes to Financial Statements — (Continued)
February 29, 2008
Futures contracts
The Fund may purchase and sell futures contracts. Upon entering into a futures contract, the Fund is required to deposit with the futures clearing broker an amount of cash, U.S. government and agency obligations, or other liquid assets in accordance with the initial margin requirements of the broker or exchange. In addition, the Fund maintains cash or securities in an amount that at least equals the net amount payable in the event the Fund must deliver the full amount of the contracts. Futures contracts are marked to market daily and an appropriate payable or receivable for the change in value ("variation margin") is recorded by the Fund. The payable or receivable is liquidated on the following business day. Gains or losses are recognized but not considered realized until the contracts expire or are closed. Futures contracts involve, to varying degrees, risk of loss in excess of the variation margin disclosed in the Statement of Assets and Liabilities. Under certain circumstances, futures exchanges may establish daily limits on the amount that the price of a futures contract can vary from the previous day's settlement price, thereby effectively preventing liquidation of unfavorable positions. Losses may arise from changes in the value of the underlying instrument if the Fund is unable to liquidate a futures position due to an illiquid secondary market for the contracts or the imposition of price limits, or if counterparties do not perform under the contract terms. Futures contracts are generally valued at the settlement price established each day by the board of trade or exchange on which they are traded. There were no futures contracts outstanding at the end of the period.
Swap agreements
The Fund may enter into swap agreements. A swap is an agreement to exchange the return generated by one instrument for the return generated by another instrument. Interest rate swap agreements involve the exchange by one party with another party of their respective commitments to pay or receive interest, e.g., an exchange of floating rate payments for fixed rate payments with respect to a notional amount of principal. Total return swap agreements involve a commitment by one party in the agreement to pay interest in exchange for a market-linked return, both based on notional amounts. To the extent the total return of the security or index underlying the transaction exceeds or falls short of the offsetting interest rate obligation, the party will receive a payment from or make a payment to the counterparty, respectively. Forward spread lock swap agreements involve commitments to pay or receive a settlement amount calculated as the difference between the swap spread and a fixed spread, multiplied by the notional amount times the duration of the swap rate. The swap spread is the difference between the benchmark swap rate (market rate) and the specific treasury rate. Variance swap agreements involve commitments to pay or receive a settlement amount calculated as the difference between the annualized realized variance of returns on the underlying price and a fixed quantity, also known as the variance strike, over a period of time. In connection with these agreements, cash or securities may be set aside as collateral by the Fund's custodian or brokers in accordance with the terms of the swap agreement. The Fund earns or pays interest on cash set aside as collateral.
16
GMO Tax-Managed U.S. Equities Fund
(A Series of GMO Trust)
Notes to Financial Statements — (Continued)
February 29, 2008
Swaps are marked to market daily using models that incorporate quotations from market makers and the change in value, if any, is recorded as unrealized gain or loss in the Statement of Operations. Payments received or made on swap contracts are recorded as realized gain or loss in the Statement of Operations. Gains or losses are realized upon early termination of the swap agreements. These financial instruments are not actively traded on financial markets. The values assigned to these instruments are based upon the best available information and because of the uncertainty of the valuation, these values may differ significantly from the values that would have been realized had a ready market for these instruments existed, and the differences could be material. Entering into these agreements involves, to varying degrees, elements of credit, legal, market and documentation risk in excess of the amounts recognized in the Statement o f Assets and Liabilities. Such risks involve the possibility that there will be no liquid market for these agreements, that the counterparties to the agreements may default on their obligations to perform or disagree as to the meaning of contractual terms in the agreements, or that there may be unfavorable changes in interest rates or the price of the index or security underlying these transactions. There were no swap agreements outstanding at the end of the period.
Repurchase agreements
The Fund may enter into repurchase agreements with banks and broker-dealers whereby the Fund acquires a security for cash and obtains a simultaneous commitment from the seller to repurchase the security at an agreed upon price and date. The Fund, through its custodian, takes possession of securities collateralizing the repurchase agreement. The collateral is marked to market daily to ensure that the market value of the underlying assets remains sufficient to protect the Fund in the event of default by the seller. Collateral for certain tri-party repurchase agreements is held at the counterparty's custodian in a segregated account for the benefit of the Fund and the counterparty. In connection with transactions in repurchase agreements, if the seller defaults or enters into insolvency proceedings and the value of the collateral declines, recovery of cash by the Fund may be delayed or limited. Repurchase agreements outstanding at the end of the period are listed in the Fund's Schedule of Investments.
Securities lending
The Fund may lend its securities to certain qualified broker-dealers. The loans are collateralized with cash or liquid securities with a market value at least equal to the market value of the securities on loan. As with other extensions of credit, the Fund may bear the risk of loss with respect to the investment of the collateral, the risk of delay in and/or inability to exercise its rights with respect to the collateral, and the risk of delay in recovery or loss of rights in the loaned securities should the borrower of the securities fail financially. If a loan is collateralized by U.S. government securities, the Fund receives a fee from the borrower. If a loan is collateralized by cash, the Fund typically invests the cash collateral for its own account in interest-bearing, short-term securities and pays a fee to the borrower that normally represents a portion of the Fund's earnings on the collateral. For the year ended Februar y 29, 2008, the Fund did not participate in securities lending.
17
GMO Tax-Managed U.S. Equities Fund
(A Series of GMO Trust)
Notes to Financial Statements — (Continued)
February 29, 2008
Taxes and distributions
The Fund intends to qualify each tax year as a regulated investment company under Subchapter M of the Internal Revenue Code of 1986, as amended (the "Code"). The Fund intends to distribute substantially all of its net investment income and net realized short-term and long-term capital gains, if any, after giving effect to any available capital loss carryovers for U.S. federal income tax purposes. Therefore, no provision for U.S. federal income or excise tax is necessary.
The Fund's policy is to declare and pay distributions from net investment income, if any, quarterly, and from net realized short-term and long-term capital gains, if any, at least annually. All distributions are paid in shares of the Fund, at net asset value, unless the shareholder elects to receive cash distributions. Distributions to shareholders are recorded by the Fund on the ex-dividend date.
Income and capital gain distributions are determined in accordance with U.S. federal income tax regulations, which may differ from U.S. GAAP. Certain capital accounts in the financial statements are periodically adjusted for permanent differences in order to reflect their tax character. These adjustments have no impact on net assets or net asset value per share. Temporary differences which arise from recognizing certain items of income, expense, gain or loss in different periods for financial statement and tax purposes will reverse at some time in the future. Distributions in excess of net investment income or net realized gains are temporary over distributions for financial statement purposes resulting from differences in the recognition or classification of income or distributions for financial statement and tax purposes.
U.S. GAAP and tax accounting differences primarily relate to post-October capital losses and redemption in-kind transactions.
The following reclassification represents the amount necessary to report the stated components of net assets on a tax basis, excluding certain temporary differences, as of February 29, 2008. The financial highlights exclude these adjustments.
| Accumulated Undistributed Net Investment Income | Distributions In Excess Of Net Realized Gain | Paid-in Capital | |||||||||
| $ | (11,253 | ) | $ | (2,972,571 | ) | $ | 2,983,824 | ||||
The tax character of distributions declared to shareholders is as follows:
| 2/29/2008 | 2/28/2007 | ||||||||||
| Ordinary income (including any short-term capital gains) | $ | 1,811,810 | $ | 1,642,938 | |||||||
| Long-term capital gains | 1,245,610 | — | |||||||||
| Total Distributions | $ | 3,057,420 | $ | 1,642,938 | |||||||
18
GMO Tax-Managed U.S. Equities Fund
(A Series of GMO Trust)
Notes to Financial Statements — (Continued)
February 29, 2008
Distributions in excess of tax basis earnings and profits, if significant, are reported in the Fund's financial statements as a tax return of capital.
As of February 29, 2008, the components of distributable earnings on a tax basis consisted of the following:
| Undistributed ordinary income | $ | 213,290 | |||||
As of February 29, 2008, the Fund elected to defer to March 1, 2008 post-October capital losses of $206,290.
As of February 29, 2008, the approximate cost for U.S. federal income tax purposes and gross and net unrealized appreciation and depreciation in value of investments were as follows:
| Aggregate Cost | Gross Unrealized Appreciation | Gross Unrealized (Depreciation) | Net Unrealized Appreciation (Depreciation) | ||||||||||||
| $ | 88,805,475 | $ | 6,735,698 | $ | (6,985,593 | ) | $ | (249,895 | ) | ||||||
For the period ended February 29, 2008, the Fund had net realized gains attributed to redemption in-kind transactions of $2,983,824.
Security transactions and related investment income
Security transactions are accounted for on trade date. Dividend income, net of applicable foreign withholding taxes, if any, is recorded on the ex-dividend date, or when the Fund is informed of the ex-dividend date, if later. Interest income is recorded on the accrual basis and is adjusted for the amortization of premiums and accretion of discounts. Interest income on inflation indexed securities, if any, is accrued daily based upon an inflation adjusted principal. Additionally, any increase or decrease in the principal or face amount of the securities adjusted for inflation is recorded as interest income or loss. Income is not recognized on securities for which collection is not expected. Non-cash dividends, if any, are recorded at the fair market value of the securities received. In determining the net gain or loss on securities sold, the cost of securities is determined on the identified cost basis.
Expenses
The majority of expenses of the Trust are directly identifiable to an individual fund. Expenses which are not readily identifiable to a specific fund are allocated taking into consideration, among other things, the nature and type of expense and the relative size of the funds.
State Street Bank and Trust Company ("State Street") serves as custodian, fund accounting agent and transfer agent of the Fund. State Street's fee may be reduced by credits that are an earnings allowance calculated on the average daily cash balances the Fund maintains with State Street. Credit balances used to reduce the fee paid to State Street, if any, are reported as a reduction of expenses in the Statement of Operations.
19
GMO Tax-Managed U.S. Equities Fund
(A Series of GMO Trust)
Notes to Financial Statements — (Continued)
February 29, 2008
Recently issued accounting pronouncements
In June 2006, the Financial Accounting Standards Board ("FASB") issued FASB Interpretation No. 48, Accounting for Uncertainty in Income Taxes – an Interpretation of FASB Statement No. 109 ("FIN 48"). FIN 48 clarifies the accounting for uncertainty in income taxes recognized in accordance with FASB Statement No. 109, Accounting for Income Taxes. FIN 48 prescribes a recognition threshold and measurement attribute for a tax position taken or expected to be taken in the tax return that could impact the Fund's financial statements. It also provides guidance in relation to the Fund's financial statements on classification of tax benefits or liabilities, interest and penalties, accounting in interim periods, disclosure, and transition. FIN 48 is effective for fiscal years beginning after December 15, 2006 for registered investment companies. Management has evaluated the effects of applying the various provisions of FIN 48 and has determined that the adoption of FIN 48 does not have a material effect on the Fund's financial statements. The Fund's federal tax returns for the prior three fiscal years remain subject to examination by the Internal Revenue Service. Management will continue to monitor the rules and guidance pertaining to FIN 48 and will take action if appropriate.
In September 2006, the FASB issued Statement of Financial Accounting Standards No. 157 ("FAS 157"), "Fair Value Measurements." FAS 157 defines fair value, establishes a framework for measuring fair value in accordance with generally accepted accounting principles and expands disclosure about fair value measurements. FAS 157 is effective for fiscal years beginning after November 15, 2007. Management is currently evaluating the impact the adoption of FAS 157 will have on the Fund's financial statement disclosures.
3. Fees and other transactions with affiliates
GMO earns a management fee paid monthly at the annual rate of 0.33% of average daily net assets. The Fund has adopted a Shareholder Service Plan under which the Fund pays GMO a shareholder service fee for client and shareholder service, reporting, and other support. Pursuant to the Shareholder Service Plan, the shareholder service fee is calculated based on average daily net assets at the annual rate of 0.15% for Class III shares.
The Manager has contractually agreed to reimburse the Fund for Fund expenses through at least June 30, 2008 to the extent the Fund's total annual operating expenses (excluding shareholder service fees, fees and expenses of the independent Trustees of the Trust, fees and expenses for legal services not approved by the Manager for the Trust, compensation and expenses of the Trust's Chief Compliance Officer ("CCO") (excluding any employee benefits), brokerage commissions, securities lending fees and expenses, interest expense, transfer taxes, and other investment-related costs (including expenses associated with investments in any company that is an investment company or would be an investment company under the 1940 Act, but for the exceptions to the definition of investment company provided in Section 3(c)(1) and 3(c)(7) of the 1940 Act), hedging transaction fees, extraordinary, non-recurring and certain other unusual expenses (in cluding taxes)) exceed 0.33% of the Fund's average daily net assets.
The Fund's portion of the fees paid by the Trust to the independent Trustees and CCO during the year ended February 29, 2008 was $23,036 and $390, respectively. The compensation and expenses of the CCO
20
GMO Tax-Managed U.S. Equities Fund
(A Series of GMO Trust)
Notes to Financial Statements — (Continued)
February 29, 2008
are included in miscellaneous expenses in the Statement of Operations. No remuneration was paid by the Fund to any other officer of the Trust.
4. Purchases and sales of securities
Cost of purchases and proceeds from sales of securities, excluding short-term investments, for the year ended February 29, 2008 aggregated $66,813,804 and $87,512,328, respectively.
5. Guarantees
In the normal course of business the Fund enters into contracts with third-party service providers that contain a variety of representations and warranties and which provide general indemnifications. The Fund's maximum exposure under these arrangements is unknown, as this would involve future claims that may be made against the Fund that have not yet occurred. Based on experience, management is of the view that the risk of loss in connection with these potential indemnification obligations is remote; however, there can be no assurance that material liabilities related to such obligations will not arise in the future that could adversely impact the Fund.
6. Principal shareholders and related parties
As of February 29, 2008, 77.11% of the outstanding shares of the Fund were held by two shareholders, each holding in excess of 10% of the Fund's outstanding shares. No other shareholder owned in excess of 10% of the outstanding shares of the Fund. Investment activities of these shareholders may have a material effect on the Fund.
As of February 29, 2008, 0.05% of the Fund's shares were held by one related party comprised of a certain GMO employee account, and 2.63% of the Fund's shares were held by accounts for which the Manager has investment discretion.
7. Share transactions
The Declaration of Trust permits the Trustees to issue an unlimited number of shares of beneficial interest (without par value). Transactions in Fund shares were as follows:
| Year Ended February 29, 2008 | Year Ended February 28, 2007 | ||||||||||||||||||
| Class III: | Shares | Amount | Shares | Amount | |||||||||||||||
| Shares sold | 76,039 | $ | 1,022,306 | 182,327 | $ | 2,335,000 | |||||||||||||
| Shares issued to shareholders in reinvestment of distributions | 196,167 | 2,702,024 | 93,323 | 1,204,619 | |||||||||||||||
| Shares repurchased | (1,667,621 | ) | (23,394,485 | ) | (1,072,199 | ) | (13,944,501 | ) | |||||||||||
| Net increase (decrease) | (1,395,415 | ) | $ | (19,670,155 | ) | (796,549 | ) | $ | (10,404,882 | ) | |||||||||
21
Report of Independent Registered Public Accounting Firm
To the Trustees of GMO Trust and the Shareholders of
GMO Tax-Managed U.S. Equities Fund
In our opinion, the accompanying statement of assets and liabilities, including the schedule of investments, and the related statements of operations and of changes in net assets and the financial highlights present fairly, in all material respects, the financial position of GMO Tax-Managed U.S. Equities Fund (the "Fund") at February 29, 2008, the results of its operations for the year then ended, the changes in its net assets for each of the two years in the period then ended and the financial highlights for each of the five years in the period then ended, in conformity with accounting principles generally accepted in the United States of America. These financial statements and financial highlights (hereafter referred to as "financial statements") are the responsibility of the Fund's management; our responsibility is to express an opinion on these financial statements based on our audits. We conducted our audits of these financ ial statements in accordance with the standards of the Public Company Accounting Oversight Board (United States). Those standards require that we plan and perform the audit to obtain reasonable assurance about whether the financial statements are free of material misstatement. An audit includes examining, on a test basis, evidence supporting the amounts and disclosures in the financial statements, assessing the accounting principles used and significant estimates made by management, and evaluating the overall financial statement presentation. We believe that our audits, which included confirmation of securities at February 29, 2008 by correspondence with the custodian, provide a reasonable basis for our opinion.
PricewaterhouseCoopers LLP
Boston, Massachusetts
April 29, 2008
22
GMO Tax-Managed U.S. Equities Fund
(A Series of GMO Trust)
Fund Expenses
February 29, 2008 (Unaudited)
Expense Examples: The following information is in relation to expenses for the six month period ended February 29, 2008.
As a shareholder of the Fund, you may incur two types of costs: (1) transaction costs, and (2) ongoing costs, including management fees, shareholder service fees and other Fund expenses. This example is intended to help you understand your ongoing costs (in dollars) of investing in the Fund and to compare these costs with the ongoing costs of investing in other mutual funds.
These examples are based on an investment of $1,000 invested at the beginning of the period and held for the entire period, September 1, 2007 through February 29, 2008.
Actual Expenses
The first line of the table below provides information about actual account values and actual expenses. You may use the information in this line, together with the amount you invested, to estimate the expenses that you paid over the period. Simply divide your account value by $1,000 (for example, a $5,000,000 account value divided by $1,000 = 5,000), then multiply the result by the number in the first line under the heading entitled "Net Expense Incurred" to estimate the expenses you paid on your account during this period.
Hypothetical Example for Comparison Purposes
The second line of the table below provides information about hypothetical account values and hypothetical expenses based on the Fund's actual expense ratio and an assumed rate of return of 5% per year before expenses, which is not the Fund's actual return. The hypothetical account values and expenses may not be used to estimate the actual ending account balance or expenses you paid for the period. You may use this information to compare the ongoing costs of investing in the Fund with other funds. To do so, compare this 5% hypothetical example with the 5% hypothetical examples that appear in the shareholder reports of other funds.
Please note that the expenses shown in the table are meant to highlight your ongoing costs only and do not reflect any transactional costs. Therefore, the second line of the table is useful in comparing ongoing costs only, and will not help you determine the relative total costs of owning different funds. In addition, if these transactional costs were included, your costs would have been higher.
| Annualized Net Expense Ratio | Beginning Account Value | Ending Account Value | Net Expense Incurred* | ||||||||||||||||
| Class III | |||||||||||||||||||
| 1 | ) Actual | 0.48 | % | $ | 1,000.00 | $ | 906.30 | $ | 2.28 | ||||||||||
| 2 | ) Hypothetical | 0.48 | % | $ | 1,000.00 | $ | 1,022.48 | $ | 2.41 | ||||||||||
* Expenses are calculated using the Class's annualized net expense ratio for the six months ended February 29, 2008, multiplied by the average account value over the period, multiplied by 182 days in the period, divided by 366 days in the year.
23
GMO Tax-Managed U.S. Equities Fund
(A Series of GMO Trust)
Tax Information for the Tax Year Ended February 29, 2008 (Unaudited)
The Fund will notify shareholders of amounts for use in preparing 2008 income tax forms in January 2009.
The Fund's distributions to shareholders include $1,245,610 from long-term capital gains.
For taxable, non-corporate shareholders, 100.00% of the income and short-term capital gains, if any, distributed in the Fund's fiscal year ended February 29, 2008 represents qualified dividend income subject to the 15% rate category.
For corporate shareholders, 100.00% of the income and short-term capital gains, if any, distributed in the Fund's fiscal year ended February 29, 2008 qualified for the dividends-received deduction.
The Fund hereby designates as qualified interest income with respect to its taxable year ended February 29, 2008, $66,417 or if determined to be different, the qualified interest income of such year.
24
Trustees and Officers (Unaudited)
The following tables list the Trust's Trustees and Officers as of the date of this report; their address and date of birth ("DOB"); their position with the Trust; the length of time holding that position with the Trust; their principal occupation(s) during the past five years; the number of portfolios in the fund complex they oversee; and other directorships they hold in companies subject to registration or reporting requirements of the Securities Exchange Act of 1934 (generally called "public companies") or in registered investment companies. The Trust's Statement of Additional Information ("SAI") includes additional information about the Trust's trustees, including changes subsequent to the date of the report. The SAI is available, without charge, upon request by writing GMO, c/o GMO Trust, 40 Rowes Wharf, Boston, MA 02110.
Independent Trustees:
| Name, Address, and DOB | Position(s) Held with Trust | Term of Office1 and Length of Time Served | Principal Occupation(s) During Past Five Years | Number of Portfolios in Fund Complex Overseen by Trustee | Other Directorships Held by Trustee | ||||||||||||||||||
| Donald W. Glazer, Esq. c/o GMO Trust 40 Rowes Wharf Boston, MA 02110 DOB: 07/26/1944 | Chairman of the Board of Trustees | Chairman of the Board of Trustees since March 2005; Lead Independent Trustee (September 2004 – March 2005); Trustee since December 2000. | Consultant – Law and Business2; Vice Chair (since 2002) and Secretary, Provant, Inc. (provider of personnel performance improvement services and training products); Author of Legal Treatises. | 47 | None. | ||||||||||||||||||
1 Each Trustee is elected to serve during the continued lifetime of the Trust until he/she dies, resigns or is removed, or if sooner, until the next meeting of Shareholders called for the purpose of electing Trustees and until the election and qualification of his/her successor.
2 As part of Mr. Glazer's work as a consultant, he provides part-time consulting services to Goodwin Procter LLP ("Goodwin"). Goodwin has provided legal services to Renewable Resources, LLC, an affiliate of GMO; GMO, in connection with its relationship with Renewable Resources; and funds managed by Renewable Resources. Mr. Glazer has represented that he has no financial interest in, and is not involved in the provision of, such legal services. In the calendar years ended December 31, 2006 and December 31, 2007, these entities paid $825,738 and $291,721 respectively, in legal fees and disbursements to Goodwin.
25
Independent Trustees — (Continued)
| Name, Address, and DOB | Position(s) Held with Trust | Term of Office1 and Length of Time Served | Principal Occupation(s) During Past Five Years | Number of Portfolios in Fund Complex Overseen by Trustee | Other Directorships Held by Trustee | ||||||||||||||||||
| Jay O. Light c/o GMO Trust 40 Rowes Wharf Boston, MA 02110 DOB: 10/03/1941 | Trustee | Since May 1996. | Dean (since April 2006), Acting Dean (August 2005 – April 2006), Senior Associate Dean (1998 – 2005), and Professor of Business Administration, Harvard Business School. | 47 | Director of Harvard Management Company, Inc.3 and Verde, Inc.; Director of Partners HealthCare System, Inc. and Chair of its Investment Committee.4 | ||||||||||||||||||
| W. Nicholas Thorndike c/o GMO Trust 40 Rowes Wharf Boston, MA 02110 DOB: 03/28/1933 | Trustee | Since March 2005. | Director or trustee of various corporations and charitable organizations, including Courier Corporation (a book publisher and manufacturer) (July 1989 – present); Putnam Funds (December 1992 – June 2004); and Providence Journal (a newspaper publisher) (December 1986 – December 2003). | 47 | Director of Courier Corporation (a book publisher and manufacturer); Member of the Investment Committee of Partners HealthCare System, Inc.4 | ||||||||||||||||||
1 Each Trustee is elected to serve during the continued lifetime of the Trust until he/she dies, resigns or is removed, or if sooner, until the next meeting of Shareholders called for the purpose of electing Trustees and until the election and qualification of his/her successor.
3 Harvard Management Company, Inc. is a client of the Manager.
4 Partners HealthCare System, Inc. is a client of the Manager.
26
Principal Officers:
| Name, Address, and DOB | Position(s) Held with Trust | Term of Office5 and Length of Time Served | Principal Occupation(s) During Past Five Years | ||||||||||||
| Scott Eston c/o GMO Trust 40 Rowes Wharf Boston, MA 02110 DOB: 01/20/1956 | President and Chief Executive Officer | President and Chief Executive Officer since October 2002; Chief Financial Officer, November 2006 – February 2007. | Chief Financial Officer, Chief Operating Officer and Member, Grantham, Mayo, Van Otterloo & Co. LLC. | ||||||||||||
| Sheppard N. Burnett c/o GMO Trust 40 Rowes Wharf Boston, MA 02110 DOB: 10/24/1968 | Treasurer and Chief Financial Officer | Chief Financial Officer since March 2007; Treasurer since November 2006; Assistant Treasurer, September 2004 – November 2006. | Fund Administration Staff, Grantham, Mayo, Van Otterloo & Co. LLC (June 2004 – present); Vice President, Director of Tax, Columbia Management Group (2002-2004). | ||||||||||||
| Brent C. Arvidson c/o GMO Trust 40 Rowes Wharf Boston, MA 02110 DOB: 06/26/1969 | Assistant Treasurer | Since August 1998. | Senior Fund Administrator, Grantham, Mayo, Van Otterloo & Co. LLC. | ||||||||||||
| John L. Nasrah c/o GMO Trust 40 Rowes Wharf Boston, MA 02110 DOB: 05/27/1977 | Assistant Treasurer | Since March 2007. | Fund Administrator, Grantham, Mayo, Van Otterloo & Co. LLC (September 2004 – present); Tax Analyst, Bain & Company, Inc (June 2003 – September 2004); Senior Tax Associate, PricewaterhouseCoopers LLP (2001 – 2003). | ||||||||||||
| Mahmoodur Rahman c/o GMO Trust 40 Rowes Wharf Boston, MA 02110 DOB: 11/30/1967 | Assistant Treasurer | Since September 2007. | Fund Administrator, Grantham, Mayo, Van Otterloo & Co. (April 2007 – present); Vice President and Senior Tax Manager, Massachusetts Financial Services Company (January 2000 – April 2007). | ||||||||||||
5 Officers are elected to hold such office until their successor is elected and qualified to carry out the duties and responsibilities of their office, or until he or she resigns or is removed from office.
27
Principal Officers — (Continued)
| Name, Address, and DOB | Position(s) Held with Trust | Term of Office5 and Length of Time Served | Principal Occupation(s) During Past Five Years | ||||||||||||
| Michael E. Gillespie c/o GMO Trust 40 Rowes Wharf Boston, MA 02110 DOB: 02/18/1958 | Chief Compliance Officer | Since March 2005. | Vice President of Compliance (June 2004 – February 2005) and Director of Domestic Compliance (March 2002 – June 2004), Fidelity Investments; Vice President and Senior Counsel, State Street Bank and Trust Company (May 1998 – March 2002). | ||||||||||||
| Jason B. Harrison c/o GMO Trust 40 Rowes Wharf Boston, MA 02110 DOB: 01/29/1977 | Vice President and Clerk | Vice President since November 2006; Clerk since March 2006. | Legal Counsel, Grantham, Mayo, Van Otterloo & Co. LLC (since February 2006) and Attorney, Ropes & Gray LLP (September 2002 – February 2006). | ||||||||||||
| David L. Bohan c/o GMO Trust 40 Rowes Wharf Boston, MA 02110 DOB: 06/21/1964 | Vice President and Assistant Clerk | Vice President since March 2005; Assistant Clerk since March 2006. | Legal Counsel, Grantham, Mayo, Van Otterloo & Co. LLC (September 2003 – present); Attorney, Goodwin Procter LLP (September 1996 – September 2003). | ||||||||||||
| Gregory L. Pottle c/o GMO Trust 40 Rowes Wharf Boston, MA 02110 DOB: 07/09/1971 | Vice President and Assistant Clerk | Since November 2006. | Legal Counsel, Grantham, Mayo, Van Otterloo & Co. LLC. | ||||||||||||
| Anne K. Trinque c/o GMO Trust 40 Rowes Wharf Boston, MA 02110 DOB: 04/15/1978 | Vice President and Assistant Clerk | Since September 2007. | Legal Counsel, Grantham, Mayo, Van Otterloo & Co. LLC (since January 2007); Attorney, Goodwin Procter LLP (September 2003 – January 2007). | ||||||||||||
| Cheryl Wakeham c/o GMO Trust 40 Rowes Wharf Boston, MA 02110 DOB: 10/29/1958 | Anti-Money Laundering Officer | Since December 2004. | Manager, Client Service Administration, Grantham, Mayo, Van Otterloo & Co. LLC. | ||||||||||||
5 Officers are elected to hold such office until their successor is elected and qualified to carry out the duties and responsibilities of their office, or until he or she resigns or is removed from office.
28
GMO Tobacco-Free Core Fund
(A Series of GMO Trust)
Annual Report
February 29, 2008
For a free copy of the Fund's proxy voting guidelines, shareholders may call 1-617-346-7646 (collect), visit our website at www.gmo.com, or visit the Securities and Exchange Commission's website at www.sec.gov. Information regarding how the Fund voted proxies relating to portfolio securities during the most recent 12-month period ended June 30 is available on our website at www.gmo.com, or on the Securities and Exchange Commission's website at www.sec.gov.
The Fund files its complete schedule of portfolio holdings with the Securities and Exchange Commission for the first and third quarter of each fiscal year on Form N-Q, which is available on the Commission's website at www.sec.gov. The Fund's Form N-Q may be reviewed and copied at the Commission's Public Reference Room in Washington, D.C. Information on the operation of the Public Reference Room may be obtained by calling 1-800-SEC-0330. The Fund has a policy with respect to disclosure of portfolio holdings under which it may also make available on GMO's website (www.gmo.com) a complete schedule of portfolio holdings.
This report is prepared for the general information of shareholders. It is authorized for distribution to prospective investors only when preceded or accompanied by a prospectus for the GMO Trust.
GMO Tobacco-Free Core Fund
(A Series of GMO Trust)
Portfolio Management
Day-to-day management of the Fund's portfolio is the responsibility of the U.S. Quantitative team at Grantham, Mayo, Van Otterloo & Co. LLC.
Management Discussion and Analysis of Fund Performance
The Class III shares of the GMO Tobacco-Free Core Fund returned -7.3% for the fiscal year ended February 29, 2008, as compared to -3.6% for the S&P 500 Index. The Fund was invested substantially in U.S. equity securities throughout the period.
Stock selection detracted from returns relative to the S&P 500 Index. Selections in Telecommunication Services and Information Technology added to relative returns while selections in Consumer Discretionary, Financials, and Energy detracted. Individual names adding to relative returns included overweight positions in Exxon Mobil and Merck and an underweight in Wachovia. Names detracting from relative returns included overweight positions in Home Depot, Citigroup, and Lowe's Companies.
Sector selection added to returns relative to the S&P 500 Index. Sector weightings positively impacting relative performance included an underweight position in Financials and overweight positions in Health Care and Telecommunication Services. Sector weightings negatively impacting relative performance included an overweight in Consumer Discretionary and underweight positions in Industrials and Materials.
The views expressed herein are exclusively those of Grantham, Mayo, Van Otterloo & Co. LLC Management as of the date of this report and are subject to change. GMO disclaims any responsibility to update such views. They are not meant as investment advice. References to specific securities are not recommendations of such securities and may not be representative of any GMO portfolio's current or future investments.
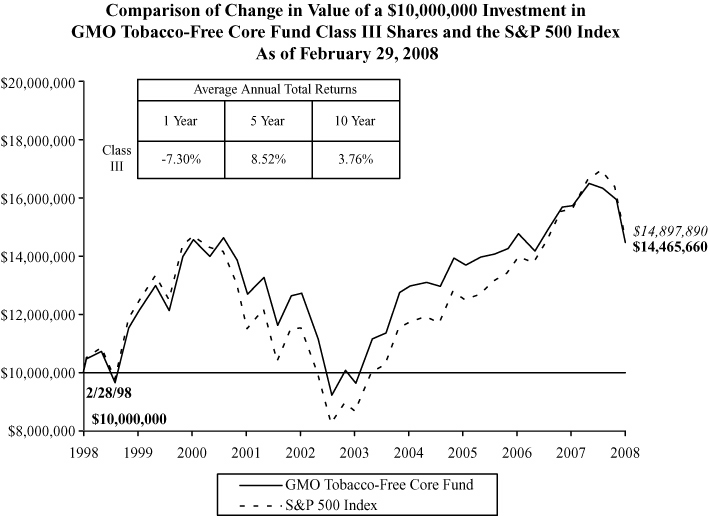
Performance data quoted represents past performance and is not indicative of future results. The investment return and principal value of an investment will fluctuate so that an investor's shares, when redeemed, may be worth more or less than their original cost. Current performance data may be lower or higher than the performance data provided herein. To obtain performance information to the most recent month-end, visit www.gmo.com. Performance shown is net of all fees after reimbursement from the Manager. Returns would have been lower had certain expenses not been reimbursed during the periods shown and do not include the effect of taxes on distributions and redemptions. All information is unaudited.
GMO Tobacco-Free Core Fund
(A Series of GMO Trust)
Investments Concentration Summary
February 29, 2008 (Unaudited)
| Asset Class Summary | % of Total Net Assets | ||||||
| Common Stocks | 96.4 | % | |||||
| Short-Term Investments | 3.5 | ||||||
| Other | 0.1 | ||||||
| 100.0 | % | ||||||
| Industry Sector Summary | % of Equity Investments | ||||||
| Health Care | 23.3 | % | |||||
| Energy | 17.5 | ||||||
| Information Technology | 17.1 | ||||||
| Consumer Staples | 13.7 | ||||||
| Consumer Discretionary | 9.3 | ||||||
| Industrials | 7.1 | ||||||
| Financials | 6.3 | ||||||
| Materials | 2.4 | ||||||
| Telecommunication Services | 2.3 | ||||||
| Utilities | 1.0 | ||||||
| 100.0 | % | ||||||
1
GMO Tobacco-Free Core Fund
(A Series of GMO Trust)
Schedule of Investments
(showing percentage of total net assets)
February 29, 2008
| Shares | Description | Value ($) | |||||||||||||
| COMMON STOCKS — 96.4% | |||||||||||||||
| Consumer Discretionary — 9.0% | |||||||||||||||
| 900 | Abercrombie & Fitch Co.-Class A | 69,777 | |||||||||||||
| 3,900 | Amazon.com, Inc. * | 251,433 | |||||||||||||
| 3,050 | American Eagle Outfitters, Inc. | 65,179 | |||||||||||||
| 4,300 | Apollo Group, Inc.-Class A * | 263,934 | |||||||||||||
| 300 | Autoliv, Inc. | 14,970 | |||||||||||||
| 2,100 | AutoNation, Inc. * | 30,597 | |||||||||||||
| 600 | AutoZone, Inc. * | 69,048 | |||||||||||||
| 2,800 | Bed Bath & Beyond, Inc. * | 79,352 | |||||||||||||
| 100 | Best Buy Co., Inc. | 4,301 | |||||||||||||
| 300 | BorgWarner, Inc. | 12,933 | |||||||||||||
| 100 | Carnival Corp. | 3,935 | |||||||||||||
| 4,500 | Coach, Inc. * | 136,440 | |||||||||||||
| 1,800 | Discovery Holding Co.-Class A * | 40,626 | |||||||||||||
| 2,100 | Expedia, Inc. * | 48,153 | |||||||||||||
| 900 | Family Dollar Stores, Inc. | 17,235 | |||||||||||||
| 12,793 | Ford Motor Co. * | 83,538 | |||||||||||||
| 800 | GameStop Corp.-Class A * | 33,888 | |||||||||||||
| 2,600 | Gannett Co., Inc. | 78,390 | |||||||||||||
| 1,400 | General Motors Corp. | 32,592 | |||||||||||||
| 800 | Goodyear Tire & Rubber Co. (The) * | 21,680 | |||||||||||||
| 1,800 | Harley-Davidson, Inc. | 66,888 | |||||||||||||
| 1,200 | Hasbro, Inc. | 30,924 | |||||||||||||
| 33,300 | Home Depot, Inc. | 884,115 | |||||||||||||
| 400 | IAC/InterActive Corp. * | 7,960 | |||||||||||||
| 1,300 | ITT Educational Services, Inc. * | 71,786 | |||||||||||||
| 3,700 | Johnson Controls, Inc. | 121,582 | |||||||||||||
| 2,800 | Kohl's Corp. * | 124,432 | |||||||||||||
| 800 | Liberty Global, Inc.-Class A * | 30,080 | |||||||||||||
| 200 | Liberty Media Holding Corp. Capital-Class A * | 23,222 | |||||||||||||
| 1,400 | Liz Claiborne, Inc. | 24,892 | |||||||||||||
| 18,400 | Lowe's Cos., Inc. | 441,048 | |||||||||||||
| 500 | Mattel Co. | 9,660 | |||||||||||||
See accompanying notes to the financial statements.
2
GMO Tobacco-Free Core Fund
(A Series of GMO Trust)
Schedule of Investments — (Continued)
(showing percentage of total net assets)
February 29, 2008
| Shares | Description | Value ($) | |||||||||||||
| Consumer Discretionary — continued | |||||||||||||||
| 3,400 | McDonald's Corp. | 183,974 | |||||||||||||
| 200 | McGraw-Hill Cos., Inc. | 8,186 | |||||||||||||
| 934 | MGM Mirage * | 57,525 | |||||||||||||
| 100 | Mohawk Industries, Inc. * | 7,141 | |||||||||||||
| 1,600 | Nike, Inc.-Class B | 96,320 | |||||||||||||
| 300 | Nordstrom, Inc. | 11,109 | |||||||||||||
| 6,200 | Office Depot, Inc. * | 70,494 | |||||||||||||
| 300 | Polo Ralph Lauren Corp. | 18,657 | |||||||||||||
| 300 | R.H. Donnelley Corp. * | 2,127 | |||||||||||||
| 400 | RadioShack Corp. | 6,980 | |||||||||||||
| 3,400 | Staples, Inc. | 75,650 | |||||||||||||
| 200 | Starbucks Corp. * | 3,594 | |||||||||||||
| 3,600 | Target Corp. | 189,396 | |||||||||||||
| 900 | Tiffany & Co. | 33,876 | |||||||||||||
| 400 | Toll Brothers, Inc. * | 8,484 | |||||||||||||
| 1,000 | VF Corp. | 76,040 | |||||||||||||
| 100 | Wynn Resorts Ltd. | 10,070 | |||||||||||||
| 500 | Yum! Brands, Inc. | 17,225 | |||||||||||||
| Total Consumer Discretionary | 4,071,438 | ||||||||||||||
| Consumer Staples — 13.2% | |||||||||||||||
| 3,100 | Anheuser-Busch Cos., Inc. | 145,979 | |||||||||||||
| 1,400 | Avon Products, Inc. | 53,284 | |||||||||||||
| 200 | Clorox Co. | 11,638 | |||||||||||||
| 600 | Coca Cola Enterprises, Inc. | 14,658 | |||||||||||||
| 26,100 | Coca-Cola Co. (The) | 1,525,806 | |||||||||||||
| 1,600 | Colgate-Palmolive Co. | 121,744 | |||||||||||||
| 300 | Costco Wholesale Corp. | 18,576 | |||||||||||||
| 800 | CVS Caremark Corp. | 32,304 | |||||||||||||
| 1,100 | Energizer Holdings, Inc. * | 102,113 | |||||||||||||
| 700 | Estee Lauder Cos. (The), Inc.-Class A | 29,806 | |||||||||||||
| 300 | Kellogg Co. | 15,216 | |||||||||||||
| 2,600 | Kimberly-Clark Corp. | 169,468 | |||||||||||||
| 3,600 | Kraft Foods, Inc. | 112,212 | |||||||||||||
See accompanying notes to the financial statements.
3
GMO Tobacco-Free Core Fund
(A Series of GMO Trust)
Schedule of Investments — (Continued)
(showing percentage of total net assets)
February 29, 2008
| Shares | Description | Value ($) | |||||||||||||
| Consumer Staples — continued | |||||||||||||||
| 2,300 | Kroger Co. | 55,775 | |||||||||||||
| 12,800 | PepsiCo, Inc. | 890,368 | |||||||||||||
| 7,900 | Procter & Gamble Co. (The) | 522,822 | |||||||||||||
| 1,700 | Safeway, Inc. | 48,858 | |||||||||||||
| 1,265 | Supervalu, Inc. | 33,206 | |||||||||||||
| 1,400 | Tyson Foods, Inc.-Class A | 20,174 | |||||||||||||
| 7,200 | Walgreen Co. | 262,872 | |||||||||||||
| 34,900 | Wal-Mart Stores, Inc. | 1,730,691 | |||||||||||||
| 700 | WM Wrigley Jr. Co. | 41,902 | |||||||||||||
| Total Consumer Staples | 5,959,472 | ||||||||||||||
| Energy — 16.8% | |||||||||||||||
| 1,500 | Anadarko Petroleum Corp. | 95,610 | |||||||||||||
| 1,700 | Apache Corp. | 195,007 | |||||||||||||
| 200 | Baker Hughes, Inc. | 13,458 | |||||||||||||
| 1,600 | Cameron International Corp. * | 67,968 | |||||||||||||
| 19,800 | Chevron Corp. | 1,715,868 | |||||||||||||
| 7,451 | ConocoPhillips | 616,272 | |||||||||||||
| 500 | Denbury Resources, Inc. * | 15,945 | |||||||||||||
| 1,100 | Devon Energy Corp. | 112,992 | |||||||||||||
| 600 | Diamond Offshore Drilling, Inc. | 72,498 | |||||||||||||
| 30,500 | Exxon Mobil Corp. | 2,653,805 | |||||||||||||
| 600 | FMC Technologies, Inc. * | 33,996 | |||||||||||||
| 1,300 | Halliburton Co. | 49,790 | |||||||||||||
| 700 | Hess Corp. | 65,226 | |||||||||||||
| 400 | Marathon Oil Corp. | 21,264 | |||||||||||||
| 600 | Murphy Oil Corp. | 48,228 | |||||||||||||
| 700 | Noble Corp. | 34,405 | |||||||||||||
| 5,000 | Occidental Petroleum Corp. | 386,850 | |||||||||||||
| 200 | Rowan Cos., Inc. | 8,062 | |||||||||||||
| 7,300 | Schlumberger Ltd. | 631,085 | |||||||||||||
| 1,300 | Smith International, Inc. | 81,939 | |||||||||||||
| 600 | Sunoco, Inc. | 36,648 | |||||||||||||
| 2,129 | Transocean, Inc. * | 299,146 | |||||||||||||
See accompanying notes to the financial statements.
4
GMO Tobacco-Free Core Fund
(A Series of GMO Trust)
Schedule of Investments — (Continued)
(showing percentage of total net assets)
February 29, 2008
| Shares | Description | Value ($) | |||||||||||||
| Energy — continued | |||||||||||||||
| 4,000 | Valero Energy Corp. | 231,080 | |||||||||||||
| 1,700 | Weatherford International Ltd. * | 117,164 | |||||||||||||
| Total Energy | 7,604,306 | ||||||||||||||
| Financials — 6.1% | |||||||||||||||
| 1,000 | ACE Ltd. | 56,240 | |||||||||||||
| 1,700 | Aflac, Inc. | 106,097 | |||||||||||||
| 5,300 | Allstate Corp. (The) | 252,969 | |||||||||||||
| 7,100 | American International Group, Inc. | 332,706 | |||||||||||||
| 1,400 | AON Corp. | 58,254 | |||||||||||||
| 10,288 | Bank of America Corp. | 408,845 | |||||||||||||
| 1,200 | BB&T Corp. | 37,356 | |||||||||||||
| 800 | Brown & Brown, Inc. | 14,264 | |||||||||||||
| 600 | Charles Schwab Corp. (The) | 11,766 | |||||||||||||
| 1,300 | Chubb Corp. | 66,170 | |||||||||||||
| 26,500 | Citigroup, Inc. | 628,315 | |||||||||||||
| 500 | CNA Financial Corp. | 13,325 | |||||||||||||
| 600 | Comerica, Inc. | 21,744 | |||||||||||||
| 500 | Eaton Vance Corp. | 15,925 | |||||||||||||
| 200 | Fifth Third Bancorp | 4,580 | |||||||||||||
| 400 | First American Corp. | 13,932 | |||||||||||||
| 400 | Franklin Resources, Inc. | 37,748 | |||||||||||||
| 500 | Hartford Financial Services Group, Inc. | 34,950 | |||||||||||||
| 1,000 | Leucadia National Corp. | 45,260 | |||||||||||||
| 100 | Markel Corp. * | 46,475 | |||||||||||||
| 100 | Moody's Corp. | 3,798 | |||||||||||||
| 1,200 | Morgan Stanley | 50,544 | |||||||||||||
| 3,900 | National City Corp. | 61,854 | |||||||||||||
| 725 | Old Republic International Corp. | 9,947 | |||||||||||||
| 2,400 | Progressive Corp. (The) | 43,992 | |||||||||||||
| 600 | Prudential Financial, Inc. | 43,782 | |||||||||||||
| 200 | Safeco Corp. | 9,252 | |||||||||||||
| 400 | SEI Investment Co. | 10,004 | |||||||||||||
| 500 | Torchmark Corp. | 30,130 | |||||||||||||
See accompanying notes to the financial statements.
5
GMO Tobacco-Free Core Fund
(A Series of GMO Trust)
Schedule of Investments — (Continued)
(showing percentage of total net assets)
February 29, 2008
| Shares | Description | Value ($) | |||||||||||||
| Financials — continued | |||||||||||||||
| 3,300 | Travelers Cos. (The), Inc. | 153,153 | |||||||||||||
| 2,400 | Unum Group | 54,984 | |||||||||||||
| 1,800 | US Bancorp | 57,636 | |||||||||||||
| 1,866 | Washington Mutual, Inc. | 27,617 | |||||||||||||
| Total Financials | 2,763,614 | ||||||||||||||
| Health Care — 22.5% | |||||||||||||||
| 5,800 | Abbott Laboratories | 310,590 | |||||||||||||
| 1,700 | Aetna, Inc. | 84,320 | |||||||||||||
| 2,000 | AmerisourceBergen Corp. | 83,440 | |||||||||||||
| 3,700 | Amgen, Inc. * | 168,424 | |||||||||||||
| 200 | Baxter International, Inc. | 11,804 | |||||||||||||
| 1,400 | Biogen Idec, Inc. * | 81,704 | |||||||||||||
| 800 | Bristol-Myers Squibb Co. | 18,088 | |||||||||||||
| 2,100 | Cardinal Health, Inc. | 124,194 | |||||||||||||
| 200 | Cerner Corp. * | 8,690 | |||||||||||||
| 1,200 | Cigna Corp. | 53,496 | |||||||||||||
| 200 | Covance, Inc. * | 16,882 | |||||||||||||
| 3,000 | Coventry Health Care, Inc. * | 155,610 | |||||||||||||
| 4,900 | Eli Lilly & Co. | 245,098 | |||||||||||||
| 6,800 | Express Scripts, Inc. * | 401,880 | |||||||||||||
| 3,800 | Forest Laboratories, Inc. * | 151,126 | |||||||||||||
| 1,300 | Gilead Sciences, Inc. * | 61,516 | |||||||||||||
| 300 | Intuitive Surgical, Inc. * | 84,576 | |||||||||||||
| 200 | Invitrogen Corp. * | 16,898 | |||||||||||||
| 22,920 | Johnson & Johnson | 1,420,123 | |||||||||||||
| 1,000 | King Pharmaceuticals, Inc. * | 10,600 | |||||||||||||
| 3,200 | McKesson Corp. | 188,032 | |||||||||||||
| 4,400 | Medco Health Solutions, Inc. * | 194,964 | |||||||||||||
| 5,500 | Medtronic, Inc. | 271,480 | |||||||||||||
| 27,200 | Merck & Co., Inc. | 1,204,960 | |||||||||||||
| 1,800 | Patterson Cos., Inc. * | 63,360 | |||||||||||||
| 76,390 | Pfizer, Inc. | 1,701,969 | |||||||||||||
| 1,000 | Quest Diagnostics, Inc. | 47,670 | |||||||||||||
See accompanying notes to the financial statements.
6
GMO Tobacco-Free Core Fund
(A Series of GMO Trust)
Schedule of Investments — (Continued)
(showing percentage of total net assets)
February 29, 2008
| Shares | Description | Value ($) | |||||||||||||
| Health Care — continued | |||||||||||||||
| 5,100 | Schering-Plough Corp. | 110,670 | |||||||||||||
| 900 | St. Jude Medical, Inc. * | 38,682 | |||||||||||||
| 4,400 | Stryker Corp. | 286,484 | |||||||||||||
| 29,824 | UnitedHealth Group, Inc. | 1,386,220 | |||||||||||||
| 100 | Waters Corp. * | 5,961 | |||||||||||||
| 4,600 | WellPoint, Inc. * | 322,368 | |||||||||||||
| 5,000 | Wyeth | 218,100 | |||||||||||||
| 8,000 | Zimmer Holdings, Inc. * | 602,320 | |||||||||||||
| Total Health Care | 10,152,299 | ||||||||||||||
| Industrials — 6.8% | |||||||||||||||
| 7,800 | 3M Co. | 611,520 | |||||||||||||
| 2,100 | Caterpillar, Inc. | 151,893 | |||||||||||||
| 100 | CH Robinson Worldwide, Inc. | 5,077 | |||||||||||||
| 300 | CSX Corp. | 14,556 | |||||||||||||
| 2,700 | Danaher Corp. | 200,205 | |||||||||||||
| 3,000 | Deere & Co. | 255,630 | |||||||||||||
| 200 | Eaton Corp. | 16,126 | |||||||||||||
| 500 | Emerson Electric Co. | 25,480 | |||||||||||||
| 300 | Fastenal Co. | 12,198 | |||||||||||||
| 300 | FedEx Corp. | 26,439 | |||||||||||||
| 200 | Flowserve Corp. | 21,780 | |||||||||||||
| 800 | Fluor Corp. | 111,400 | |||||||||||||
| 200 | General Dynamics Corp. | 16,370 | |||||||||||||
| 900 | Goodrich Corp. | 53,307 | |||||||||||||
| 100 | Harsco Corp. | 5,649 | |||||||||||||
| 4,000 | Honeywell International, Inc. | 230,160 | |||||||||||||
| 200 | Illinois Tool Works, Inc. | 9,814 | |||||||||||||
| 1,100 | Ingersoll-Rand | 46,046 | |||||||||||||
| 600 | ITT Industries, Inc. | 33,744 | |||||||||||||
| 1,200 | Jacobs Engineering Group, Inc. * | 96,348 | |||||||||||||
| 1,200 | L-3 Communications Holdings, Inc. | 127,548 | |||||||||||||
| 200 | Manpower, Inc. | 11,340 | |||||||||||||
| 700 | Masco Corp. | 13,083 | |||||||||||||
See accompanying notes to the financial statements.
7
GMO Tobacco-Free Core Fund
(A Series of GMO Trust)
Schedule of Investments — (Continued)
(showing percentage of total net assets)
February 29, 2008
| Shares | Description | Value ($) | |||||||||||||
| Industrials — continued | |||||||||||||||
| 800 | McDermott International, Inc. * | 41,776 | |||||||||||||
| 4,050 | Paccar, Inc. | 175,689 | |||||||||||||
| 400 | Pall Corp. | 15,748 | |||||||||||||
| 1,200 | Parker-Hannifin Corp. | 77,556 | |||||||||||||
| 1,100 | Precision Castparts Corp. | 121,429 | |||||||||||||
| 300 | Rockwell Collins, Inc. | 17,670 | |||||||||||||
| 200 | RR Donnelley & Sons Co. | 6,366 | |||||||||||||
| 200 | SPX Corp. | 20,460 | |||||||||||||
| 100 | Stericycle, Inc. * | 5,389 | |||||||||||||
| 1,100 | Textron, Inc. | 59,587 | |||||||||||||
| 500 | Trane, Inc. | 22,525 | |||||||||||||
| 600 | Tyco International Ltd. | 24,036 | |||||||||||||
| 300 | Union Pacific Corp. | 37,428 | |||||||||||||
| 1,500 | United Parcel Service, Inc.-Class B | 105,360 | |||||||||||||
| 3,500 | United Technologies Corp. | 246,785 | |||||||||||||
| 100 | W.W. Grainger, Inc. | 7,366 | |||||||||||||
| Total Industrials | 3,080,883 | ||||||||||||||
| Information Technology — 16.5% | |||||||||||||||
| 500 | Activision, Inc. * | 13,625 | |||||||||||||
| 200 | Adobe Systems, Inc. * | 6,730 | |||||||||||||
| 1,500 | Affiliated Computer Services, Inc.-Class A * | 76,125 | |||||||||||||
| 300 | Analog Devices, Inc. | 8,076 | |||||||||||||
| 5,100 | Apple, Inc. * | 637,602 | |||||||||||||
| 400 | Arrow Electronics, Inc. * | 13,044 | |||||||||||||
| 200 | Autodesk, Inc. * | 6,218 | |||||||||||||
| 900 | Avnet, Inc. * | 30,339 | |||||||||||||
| 1,100 | CA, Inc. | 25,168 | |||||||||||||
| 800 | Cadence Design Systems, Inc. * | 8,496 | |||||||||||||
| 33,200 | Cisco Systems, Inc. * | 809,084 | |||||||||||||
| 1,500 | Citrix Systems, Inc. * | 49,395 | |||||||||||||
| 400 | Cognizant Technologies Solutions Corp.-Class A * | 12,084 | |||||||||||||
| 2,900 | Corning, Inc. | 67,367 | |||||||||||||
| 23,800 | Dell, Inc. * | 472,430 | |||||||||||||
See accompanying notes to the financial statements.
8
GMO Tobacco-Free Core Fund
(A Series of GMO Trust)
Schedule of Investments — (Continued)
(showing percentage of total net assets)
February 29, 2008
| Shares | Description | Value ($) | |||||||||||||
| Information Technology — continued | |||||||||||||||
| 100 | DST Systems, Inc. * | 7,026 | |||||||||||||
| 15,000 | eBay, Inc. * | 395,400 | |||||||||||||
| 21,900 | EMC Corp. * | 340,326 | |||||||||||||
| 3,300 | Fiserv, Inc. * | 173,646 | |||||||||||||
| 400 | FLIR Systems, Inc. * | 11,384 | |||||||||||||
| 1,000 | Google, Inc.-Class A * | 471,180 | |||||||||||||
| 1,700 | Hewlett-Packard Co. | 81,209 | |||||||||||||
| 12,300 | Intel Corp. | 245,385 | |||||||||||||
| 6,100 | International Business Machines Corp. | 694,546 | |||||||||||||
| 100 | Intersil Corp.-Class A | 2,327 | |||||||||||||
| 500 | Intuit, Inc. * | 13,280 | |||||||||||||
| 1,500 | Juniper Networks, Inc. * | 40,230 | |||||||||||||
| 600 | KLA-Tencor Corp. | 25,206 | |||||||||||||
| 600 | Lexmark International, Inc. * | 19,818 | |||||||||||||
| 400 | McAfee, Inc. * | 13,308 | |||||||||||||
| 44,500 | Microsoft Corp. | 1,211,290 | |||||||||||||
| 100 | National Semiconductor Corp. | 1,647 | |||||||||||||
| 100 | NAVTEQ Corp. * | 7,495 | |||||||||||||
| 200 | NCR Corp. * | 4,432 | |||||||||||||
| 23,800 | Oracle Corp. * | 447,440 | |||||||||||||
| 21,300 | Qualcomm, Inc. | 902,481 | |||||||||||||
| 700 | Texas Instruments, Inc. | 20,972 | |||||||||||||
| 700 | Total System Services, Inc. | 15,561 | |||||||||||||
| 1,000 | VeriSign, Inc. * | 34,800 | |||||||||||||
| 1,000 | Western Digital Corp. * | 30,870 | |||||||||||||
| 800 | Xilinx, Inc. | 17,888 | |||||||||||||
| Total Information Technology | 7,464,930 | ||||||||||||||
| Materials — 2.3% | |||||||||||||||
| 600 | Air Products & Chemicals, Inc. | 54,798 | |||||||||||||
| 2,400 | Alcoa, Inc. | 89,136 | |||||||||||||
| 1,000 | Celanese Corp.-Class A | 38,900 | |||||||||||||
| 200 | Crown Holdings, Inc. * | 4,982 | |||||||||||||
| 600 | Dow Chemical Co. (The) | 22,614 | |||||||||||||
See accompanying notes to the financial statements.
9
GMO Tobacco-Free Core Fund
(A Series of GMO Trust)
Schedule of Investments — (Continued)
(showing percentage of total net assets)
February 29, 2008
| Shares | Description | Value ($) | |||||||||||||
| Materials — continued | |||||||||||||||
| 800 | Freeport-McMoRan Copper & Gold, Inc. | 80,688 | |||||||||||||
| 200 | Lubrizol Corp. | 11,660 | |||||||||||||
| 200 | Martin Marietta Materials, Inc. | 21,520 | |||||||||||||
| 4,300 | Monsanto Co. | 497,424 | |||||||||||||
| 1,600 | Owens-IIlinois, Inc. * | 90,320 | |||||||||||||
| 1,000 | Praxair, Inc. | 80,280 | |||||||||||||
| 400 | Temple-Inland, Inc. | 5,492 | |||||||||||||
| 200 | Vulcan Materials Co. | 14,020 | |||||||||||||
| 700 | Weyerhaeuser Co. | 42,840 | |||||||||||||
| Total Materials | 1,054,674 | ||||||||||||||
| Telecommunication Services — 2.2% | |||||||||||||||
| 8,039 | AT&T, Inc. | 279,998 | |||||||||||||
| 19,684 | Verizon Communications, Inc. | 714,923 | |||||||||||||
| Total Telecommunication Services | 994,921 | ||||||||||||||
| Utilities — 1.0% | |||||||||||||||
| 400 | American Electric Power Co., Inc. | 16,368 | |||||||||||||
| 300 | Centerpoint Energy, Inc. | 4,404 | |||||||||||||
| 600 | Constellation Energy Group, Inc. | 53,010 | |||||||||||||
| 2,900 | Duke Energy Corp. | 50,866 | |||||||||||||
| 300 | Dynegy, Inc.-Class A * | 2,220 | |||||||||||||
| 700 | Edison International | 34,580 | |||||||||||||
| 300 | Entergy Corp. | 30,822 | |||||||||||||
| 100 | Equitable Resources, Inc. | 6,162 | |||||||||||||
| 500 | FPL Group, Inc. | 30,145 | |||||||||||||
| 600 | Mirant Corp. * | 22,200 | |||||||||||||
| 900 | NRG Energy, Inc. * | 37,143 | |||||||||||||
| 400 | PPL Corp. | 18,152 | |||||||||||||
| 1,800 | Public Service Enterprise Group, Inc. | 79,380 | |||||||||||||
| 2,000 | Reliant Energy, Inc. * | 45,600 | |||||||||||||
| Total Utilities | 431,052 | ||||||||||||||
| TOTAL COMMON STOCKS (COST $47,155,206) | 43,577,589 | ||||||||||||||
See accompanying notes to the financial statements.
10
GMO Tobacco-Free Core Fund
(A Series of GMO Trust)
Schedule of Investments — (Continued)
(showing percentage of total net assets)
February 29, 2008
| Par Value ($) | Description | Value ($) | |||||||||||||
| SHORT-TERM INVESTMENTS — 3.5% | |||||||||||||||
| 665,435 | Citigroup Global Markets Repurchase Agreement, dated 02/29/2008, due 03/03/2008, with a maturity value of $665,477 and an effective yield of 0.75%, collateralized by a U.S. Treasury Bond with a rate of 11.25%, maturity date of 02/15/15 and a market value, including accrued interest, of $681,707. | 665,435 | |||||||||||||
| 900,000 | U.S. Treasury Bill, 1.79%, due 07/24/08 (a) | 893,636 | |||||||||||||
| TOTAL SHORT-TERM INVESTMENTS (COST $1,557,206) | 1,559,071 | ||||||||||||||
| TOTAL INVESTMENTS — 99.9% (Cost $48,712,412) | 45,136,660 | ||||||||||||||
| Other Assets and Liabilities (net) — 0.1% | 60,173 | ||||||||||||||
| TOTAL NET ASSETS — 100.0% | $ | 45,196,833 | |||||||||||||
See accompanying notes to the financial statements.
11
GMO Tobacco-Free Core Fund
(A Series of GMO Trust)
Schedule of Investments — (Continued)
February 29, 2008
A summary of outstanding financial instruments at February 29, 2008 is as follows:
Futures Contracts
| Number of Contracts | Type | Expiration Date | Contract Value | Net Unrealized Appreciation (Depreciation) | |||||||||||||||
| Buys | |||||||||||||||||||
| 14 | S&P 500 E-Mini | March 2008 | $ | 931,910 | $ | (77,166 | ) | ||||||||||||
As of February 29, 2008, for the futures contracts held, the Fund had sufficient cash and/or securities to cover any commitments or margin requirements of the relevant broker or exchange.
Notes to Schedule of Investments:
* Non-income producing security.
(a) Rate shown represents yield-to-maturity.
See accompanying notes to the financial statements.
12
GMO Tobacco-Free Core Fund
(A Series of GMO Trust)
Statement of Assets and Liabilities — February 29, 2008
| Assets: | |||||||
| Investments, at value (cost $48,712,412) (Note 2) | $ | 45,136,660 | |||||
| Dividends and interest receivable | 97,164 | ||||||
| Receivable for collateral on open futures contracts (Note 2) | 50,400 | ||||||
| Receivable for expenses reimbursed by Manager (Note 3) | 22,968 | ||||||
| Total assets | 45,307,192 | ||||||
| Liabilities: | |||||||
| Payable to affiliate for (Note 3): | |||||||
| Management fee | 11,986 | ||||||
| Shareholder service fee | 5,447 | ||||||
| Trustees and Chief Compliance Officer of GMO Trust fees | 58 | ||||||
| Payable for variation margin on open futures contracts (Note 2) | 24,150 | ||||||
| Accrued expenses | 68,718 | ||||||
| Total liabilities | 110,359 | ||||||
| Net assets | $ | 45,196,833 | |||||
| Net assets consist of: | |||||||
| Paid-in capital | $ | 52,560,460 | |||||
| Accumulated undistributed net investment income | 66,409 | ||||||
| Accumulated net realized loss | (3,777,118 | ) | |||||
| Net unrealized depreciation | (3,652,918 | ) | |||||
| $ | 45,196,833 | ||||||
| Net assets attributable to: | |||||||
| Class III shares | $ | 45,196,833 | |||||
| Shares outstanding: | |||||||
| Class III | 4,505,462 | ||||||
| Net asset value per share: | |||||||
| Class III | $ | 10.03 | |||||
See accompanying notes to the financial statements.
13
GMO Tobacco-Free Core Fund
(A Series of GMO Trust)
Statement of Operations — Year Ended February 29, 2008
| Investment Income: | |||||||
| Dividends | $ | 3,261,564 | |||||
| Interest | 204,990 | ||||||
| Securities lending income | 10,870 | ||||||
| Total investment income | 3,477,424 | ||||||
| Expenses: | |||||||
| Management fee (Note 3) | 569,374 | ||||||
| Shareholder service fee – Class III (Note 3) | 191,691 | ||||||
| Shareholder service fee – Class IV (Note 3) | 46,558 | ||||||
| Custodian, fund accounting agent and transfer agent fees | 75,040 | ||||||
| Audit and tax fees | 47,271 | ||||||
| Legal fees | 5,573 | ||||||
| Trustees fees and related expenses (Note 3) | 1,845 | ||||||
| Registration fees | 674 | ||||||
| Miscellaneous | 1,613 | ||||||
| Total expenses | 939,639 | ||||||
| Fees and expenses reimbursed by Manager (Note 3) | (129,843 | ) | |||||
| Expense reductions (Note 2) | (91 | ) | |||||
| Net expenses | 809,705 | ||||||
| Net investment income (loss) | 2,667,719 | ||||||
| Realized and unrealized gain (loss): | |||||||
| Net realized gain (loss) on: | |||||||
| Investments | 26,798,875 | ||||||
| Closed futures contracts | (129,908 | ) | |||||
| Net realized gain (loss) | 26,668,967 | ||||||
| Change in net unrealized appreciation (depreciation) on: | |||||||
| Investments | (21,996,291 | ) | |||||
| Open futures contracts | 33,429 | ||||||
| Net unrealized gain (loss) | (21,962,862 | ) | |||||
| Net realized and unrealized gain (loss) | 4,706,105 | ||||||
| Net increase (decrease) in net assets resulting from operations | $ | 7,373,824 | |||||
See accompanying notes to the financial statements.
14
GMO Tobacco-Free Core Fund
(A Series of GMO Trust)
Statement of Changes in Net Assets
| Year Ended February 29, 2008 | Year Ended February 28, 2007 | ||||||||||
| Increase (decrease) in net assets: | |||||||||||
| Operations: | |||||||||||
| Net investment income (loss) | $ | 2,667,719 | $ | 5,036,433 | |||||||
| Net realized gain (loss) | 26,668,967 | 22,105,528 | |||||||||
| Change in net unrealized appreciation (depreciation) | (21,962,862 | ) | (8,455,438 | ) | |||||||
| Net increase (decrease) in net assets from operations | 7,373,824 | 18,686,523 | |||||||||
| Distributions to shareholders from: | |||||||||||
| Net investment income | |||||||||||
| Class III | (2,382,432 | ) | (3,755,673 | ) | |||||||
| Class IV | (1,169,636 | ) | (2,760,919 | ) | |||||||
| Total distributions from net investment income | (3,552,068 | ) | (6,516,592 | ) | |||||||
| Net realized gains | |||||||||||
| Class III | (15,985,212 | ) | (912,017 | ) | |||||||
| Class IV | (5,014,664 | ) | (637,651 | ) | |||||||
| Total distributions from net realized gains | (20,999,876 | ) | (1,549,668 | ) | |||||||
| (24,551,944 | ) | (8,066,260 | ) | ||||||||
| Net share transactions (Note 7): | |||||||||||
| Class III | (122,744,412 | ) | (41,436,981 | ) | |||||||
| Class IV | (141,183,947 | ) | (16,601,430 | ) | |||||||
| Increase (decrease) in net assets resulting from net share transactions | (263,928,359 | ) | (58,038,411 | ) | |||||||
| Total increase (decrease) in net assets | (281,106,479 | ) | (47,418,148 | ) | |||||||
| Net assets: | |||||||||||
| Beginning of period | 326,303,312 | 373,721,460 | |||||||||
| End of period (including accumulated undistributed net investment income of $66,409 and $950,757, respectively) | $ | 45,196,833 | $ | 326,303,312 | |||||||
See accompanying notes to the financial statements.
15
GMO Tobacco-Free Core Fund
(A Series of GMO Trust)
Financial Highlights
(For a Class III share outstanding throughout each period)
| Year Ended February 28/29, | |||||||||||||||||||||||
| 2008 | 2007 | 2006 | 2005 | 2004 | |||||||||||||||||||
| Net asset value, beginning of period | $ | 12.88 | $ | 12.45 | $ | 12.24 | $ | 11.76 | $ | 8.69 | |||||||||||||
| Income (loss) from investment operations: | |||||||||||||||||||||||
| Net investment income (loss)† | 0.19 | 0.18 | 0.20 | 0.17 | 0.13 | ||||||||||||||||||
| Net realized and unrealized gain (loss) | (0.96 | )(a) | 0.54 | 0.44 | 0.54 | 3.07 | |||||||||||||||||
| Total from investment operations | (0.77 | ) | 0.72 | 0.64 | 0.71 | 3.20 | |||||||||||||||||
| Less distributions to shareholders: | |||||||||||||||||||||||
| From net investment income | (0.22 | ) | (0.23 | ) | (0.15 | ) | (0.18 | ) | (0.13 | ) | |||||||||||||
| From net realized gains | (1.86 | ) | (0.06 | ) | (0.28 | ) | (0.05 | ) | — | ||||||||||||||
| Total distributions | (2.08 | ) | (0.29 | ) | (0.43 | ) | (0.23 | ) | (0.13 | ) | |||||||||||||
| Net asset value, end of period | $ | 10.03 | $ | 12.88 | $ | 12.45 | $ | 12.24 | $ | 11.76 | |||||||||||||
| Total Return(b) | (7.30 | )% | 5.87 | % | 5.40 | % | 6.16 | % | 37.06 | % | |||||||||||||
| Ratios/Supplemental Data: | |||||||||||||||||||||||
| Net assets, end of period (000's) | $ | 45,197 | $ | 188,133 | $ | 224,097 | $ | 221,661 | $ | 188,370 | |||||||||||||
| Net expenses to average daily net assets | 0.48 | %(c) | 0.48 | % | 0.48 | % | 0.48 | % | 0.48 | % | |||||||||||||
| Net investment income to average daily net assets | 1.52 | % | 1.46 | % | 1.68 | % | 1.43 | % | 1.26 | % | |||||||||||||
| Portfolio turnover rate | 74 | % | 73 | % | 63 | % | 68 | % | 63 | % | |||||||||||||
| Fees and expenses reimbursed by the Manager to average daily net assets: | 0.08 | % | 0.06 | % | 0.04 | % | 0.04 | % | 0.04 | % | |||||||||||||
(a) The amount shown for a share outstanding does not correspond with the aggregate net realized and unrealized gain (loss) on investments due to the timing of purchases and redemptions of Fund shares in relation to fluctuating market values of the investments of the Fund.
(b) The total returns would have been lower had certain expenses not been reimbursed during the periods shown and assumes the effect of reinvested distributions.
(c) The net expense ratio does not include the effect of expense reductions.
† Calculated using average shares outstanding throughout the period.
See accompanying notes to the financial statements.
16
GMO Tobacco-Free Core Fund
(A Series of GMO Trust)
Financial Highlights
(For a Class IV share outstanding throughout each period)
| Period from March 1, 2007 through | Year Ended February 28/29, | ||||||||||||||||||||||||||
| June 21, 2007 | 2007 | 2006 | 2005 | 2004 | 2003 | ||||||||||||||||||||||
| Net asset value, beginning of period | $ | 12.89 | $ | 12.46 | $ | 12.25 | $ | 11.76 | $ | 8.69 | $ | 11.23 | |||||||||||||||
| Income (loss) from investment operations: | |||||||||||||||||||||||||||
| Net investment income (loss)† | 0.07 | 0.19 | 0.21 | 0.16 | 0.13 | 0.13 | |||||||||||||||||||||
| Net realized and unrealized gain (loss) | 0.79 | 0.54 | 0.44 | 0.56 | 3.07 | (2.55 | ) | ||||||||||||||||||||
| Total from investment operations | 0.86 | 0.73 | 0.65 | 0.72 | 3.20 | (2.42 | ) | ||||||||||||||||||||
| Less distributions to shareholders: | |||||||||||||||||||||||||||
| From net investment income | (0.11 | ) | (0.24 | ) | (0.16 | ) | (0.18 | ) | (0.13 | ) | (0.12 | ) | |||||||||||||||
| From net realized gains | (0.47 | ) | (0.06 | ) | (0.28 | ) | (0.05 | ) | — | — | |||||||||||||||||
| Total distributions | (0.58 | ) | (0.30 | ) | (0.44 | ) | (0.23 | ) | (0.13 | ) | (0.12 | ) | |||||||||||||||
| Net asset value, end of period | $ | 13.17 | (b) | $ | 12.89 | $ | 12.46 | $ | 12.25 | $ | 11.76 | $ | 8.69 | ||||||||||||||
| Total Return(a) | 6.65 | %** | 5.91 | % | 5.44 | % | 6.25 | % | 37.12 | % | (21.65 | )% | |||||||||||||||
| Ratios/Supplemental Data: | |||||||||||||||||||||||||||
| Net assets, end of period (000's) | $ | 147,368 | (b) | $ | 138,170 | $ | 149,624 | $ | 141,900 | $ | 394,454 | $ | 308,001 | ||||||||||||||
| Net expenses to average daily net assets | 0.44 | %* | 0.44 | % | 0.44 | % | 0.44 | % | 0.44 | % | 0.44 | % | |||||||||||||||
| Net investment income to average daily net assets | 1.65 | %* | 1.49 | % | 1.72 | % | 1.37 | % | 1.31 | % | 1.35 | % | |||||||||||||||
| Portfolio turnover rate | 34 | %††** | 73 | % | 63 | % | 68 | % | 63 | % | 62 | % | |||||||||||||||
| Fees and expenses reimbursed by the Manager to average daily net assets: | 0.05 | %* | 0.06 | % | 0.04 | % | 0.04 | % | 0.04 | % | 0.04 | % | |||||||||||||||
(a) The total returns would have been lower had certain expenses not been reimbursed during the periods shown and assumes the effect of reinvested distributions.
(b) Represents the ending net asset value per share and net assets upon the liquidation of the class.
† Calculated using average shares outstanding throughout the period.
†† Calculation represents portfolio turnover of the Fund for the period from March 1, 2007 through August 31, 2007.
* Annualized.
** Not annualized.
See accompanying notes to the financial statements.
17
GMO Tobacco-Free Core Fund
(A Series of GMO Trust)
Notes to Financial Statements
February 29, 2008
1. Organization
GMO Tobacco-Free Core Fund (the "Fund") is a series of GMO Trust (the "Trust"). The Fund is registered under the Investment Company Act of 1940, as amended, as an open-end, diversified management investment company. The Fund is advised and managed by Grantham, Mayo, Van Otterloo & Co. LLC (the "Manager" or "GMO"). The Trust was established as a Massachusetts business trust under the laws of the Commonwealth of Massachusetts on June 24, 1985. The Declaration of Trust permits the Trustees of the Trust ("Trustees") to create an unlimited number of series of shares ("Funds") and to subdivide Funds into classes.
The Fund seeks high total return. The Fund seeks to achieve its objective by outperforming the S&P 500 Index. The Fund typically makes equity investments in companies that issue stocks included in the S&P 500 Index, and companies with similar market capitalizations, other than tobacco-producing companies.
As of February 29, 2008, the Fund had one class of shares outstanding: Class III. Class IV shares were liquidated on June 21, 2007.
2. Significant accounting policies
The following is a summary of significant accounting policies which are in conformity with accounting principles generally accepted in the United States of America ("U.S. GAAP") and which are consistently followed by the Fund in the preparation of its financial statements. The preparation of financial statements in accordance with U.S. GAAP requires management to make estimates and assumptions that affect the reported amounts and disclosures in the financial statements. Actual results could differ from those estimates. The accounting records of the Fund are maintained in U.S. dollars.
Portfolio valuation
Securities listed on a securities exchange for which market quotations are readily available are valued at the last sale price or official closing price on each business day, or if there is no such reported sale or official closing price, at the most recent quoted bid price. Unlisted securities for which market quotations are readily available are generally valued at the most recent quoted bid price. Short-term investments with a remaining maturity of sixty days or less are generally valued at amortized cost, which approximates fair value. Shares of investment funds are valued at their net asset value. Securities for which quotations are not readily available or whose values the Manager has determined to be unreliable are valued at fair value as determined in good faith by the Trustees or other persons acting at their direction pursuant to procedures approved by the Trustees. By its nature, a fair value price is a good faith est imate of the value of a security at a given point in time and may not reflect the value that would be realized if the security was sold and the differences could be material.
18
GMO Tobacco-Free Core Fund
(A Series of GMO Trust)
Notes to Financial Statements — (Continued)
February 29, 2008
Futures contracts
The Fund may purchase and sell futures contracts. Upon entering into a futures contract, the Fund is required to deposit with the futures clearing broker an amount of cash, U.S. government and agency obligations, or other liquid assets in accordance with the initial margin requirements of the broker or exchange. In addition, the Fund maintains cash or securities in an amount that at least equals the net amount payable in the event the Fund must deliver the full amount of the contracts. Futures contracts are marked to market daily and an appropriate payable or receivable for the change in value ("variation margin") is recorded by the Fund. The payable or receivable is liquidated on the following business day. Gains or losses are recognized but not considered realized until the contracts expire or are closed. Futures contracts involve, to varying degrees, risk of loss in excess of the variation margin disclosed in the Statement of Assets and Liabilities. Under certain circumstances, futures exchanges may establish daily limits on the amount that the price of a futures contract can vary from the previous day's settlement price, thereby effectively preventing liquidation of unfavorable positions. Losses may arise from changes in the value of the underlying instrument if the Fund is unable to liquidate a futures position due to an illiquid secondary market for the contracts or the imposition of price limits, or if counterparties do not perform under the contract terms. Futures contracts are generally valued at the settlement price established each day by the board of trade or exchange on which they are traded. Futures contracts outstanding at the end of the period are listed in the Fund's Schedule of Investments.
Swap agreements
The Fund may enter into swap agreements. A swap is an agreement to exchange the return generated by one instrument for the return generated by another instrument. Interest rate swap agreements involve the exchange by one party with another party of their respective commitments to pay or receive interest, e.g., an exchange of floating rate payments for fixed rate payments with respect to a notional amount of principal. Total return swap agreements involve a commitment by one party in the agreement to pay interest in exchange for a market-linked return, both based on notional amounts. To the extent the total return of the security or index underlying the transaction exceeds or falls short of the offsetting interest rate obligation, the party will receive a payment from or make a pay ment to the counterparty, respectively. Forward spread lock swap agreements involve commitments to pay or receive a settlement amount calculated as the difference between the swap spread and a fixed spread, multiplied by the notional amount times the duration of the swap rate. The swap spread is the difference between the benchmark swap rate (market rate) and the specific treasury rate. Variance swap agreements involve commitments to pay or receive a settlement amount calculated as the difference between the annualized realized variance of returns on the underlying price and a fixed quantity, also known as the variance strike, over a period of time. In connection with these agreements, cash or securities may be set aside as collateral by the Fund's custodian or brokers in accordance with the terms of the swap agreement. The Fund earns or pays interest on cash set aside as collateral.
Swaps are marked to market daily using models that incorporate quotations from market makers and the change in value, if any, is recorded as unrealized gain or loss in the Statement of Operations. Payments
19
GMO Tobacco-Free Core Fund
(A Series of GMO Trust)
Notes to Financial Statements — (Continued)
February 29, 2008
received or made on swap contracts are recorded as realized gain or loss in the Statement of Operations. Gains or losses are realized upon early termination of the swap agreements. These financial instruments are not actively traded on financial markets. The values assigned to these instruments are based upon the best available information and because of the uncertainty of the valuation, these values may differ significantly from the values that would have been realized had a ready market for these instruments existed, and the differences could be material. Entering into these agreements involves, to varying degrees, elements of credit, legal, market and documentation risk in excess of the amounts recognized in the Statement of Assets and Liabilities. Such risks involve the possibility that there will be no liquid market for these agreements, that the counterparties to the agreements may default on their obligations to perform o r disagree as to the meaning of contractual terms in the agreements, or that there may be unfavorable changes in interest rates or the price of the index or security underlying these transactions.There were no swap agreements outstanding at the end of the period.
Repurchase agreements
The Fund may enter into repurchase agreements with banks and broker-dealers whereby the Fund acquires a security for cash and obtains a simultaneous commitment from the seller to repurchase the security at an agreed upon price and date. The Fund, through its custodian, takes possession of securities collateralizing the repurchase agreement. The collateral is marked to market daily to ensure that the market value of the underlying assets remains sufficient to protect the Fund in the event of default by the seller. Collateral for certain tri-party repurchase agreements is held at the counterparty's custodian in a segregated account for the benefit of the Fund and the counterparty. In connection with transactions in repurchase agreements, if the seller defaults or enters into insolvency proceedings and the value of the collateral declines, recovery of cash by the Fund may be delayed or limited. Repurchase agreements outstanding at the end of the period are listed in the Fund's Schedule of Investments.
Securities lending
The Fund may lend its securities to certain qualified broker-dealers. The loans are collateralized with cash or liquid securities with a market value at least equal to the market value of the securities on loan. As with other extensions of credit, the Fund may bear the risk of loss with respect to the investment of the collateral, the risk of delay in and/or inability to exercise its rights with respect to the collateral, and the risk of delay in recovery or loss of rights in the loaned securities should the borrower of the securities fail financially. If a loan is collateralized by U.S. government securities, the Fund receives a fee from the borrower. If a loan is collateralized by cash, the Fund typically invests the cash collateral for its own account in interest-bearing, short-term securities and pays a fee to the borrower that normally represents a portion of the Fund's earnings on the collateral. As of February 29, 2008, t he Fund had no securities on loan.
Taxes and distributions
The Fund intends to qualify each tax year as a regulated investment company under Subchapter M of the Internal Revenue Code of 1986, as amended (the "Code"). The Fund intends to distribute substantially all
20
GMO Tobacco-Free Core Fund
(A Series of GMO Trust)
Notes to Financial Statements — (Continued)
February 29, 2008
of its net investment income and net realized short-term and long-term capital gains, if any, after giving effect to any available capital loss carryovers for U.S. federal income tax purposes. Therefore, no provision for U.S. federal income or excise tax is necessary.
The Fund's policy is to declare and pay distributions from net investment income, if any, quarterly, and from net realized short-term and long-term capital gains, if any, at least annually. All distributions are paid in shares of the Fund, at net asset value, unless the shareholder elects to receive cash distributions. Distributions to shareholders are recorded by the Fund on the ex-dividend date.
Income and capital gain distributions are determined in accordance with U.S. federal income tax regulations, which may differ from U.S. GAAP. Certain capital accounts in the financial statements are periodically adjusted for permanent differences in order to reflect their tax character. These adjustments have no impact on net assets or net asset value per share. Temporary differences which arise from recognizing certain items of income, expense, gain or loss in different periods for financial statement and tax purposes will reverse at some time in the future. Distributions in excess of net investment income or net realized gains are temporary over distributions for financial statement purposes resulting from differences in the recognition or classification of income or distributions for financial statement and tax purposes.
U.S. GAAP and tax accounting differences primarily relate to losses on wash sale transactions, derivative contract transactions, redemption in-kind transactions and post-October capital losses.
The following reclassification represents the amount necessary to report the stated components of net assets on a tax basis, excluding certain temporary differences, as of February 29, 2008. The financial highlights exclude these adjustments.
| Accumulated Undistributed Net Investment Income | Accumulated Net Realized Loss | Paid-in Capital | |||||||||
| $ | 1 | $ | (14,701,225 | ) | $ | 14,701,224 | |||||
The tax character of distributions declared to shareholders is as follows:
| 2/29/2008 | 2/28/2007 | ||||||||||
| Ordinary income (including any short-term capital gains) | $ | 8,717,495 | $ | 6,516,592 | |||||||
| Long-term capital gains | 15,834,449 | 1,549,668 | |||||||||
| Total distributions | $ | 24,551,944 | $ | 8,066,260 | |||||||
21
GMO Tobacco-Free Core Fund
(A Series of GMO Trust)
Notes to Financial Statements — (Continued)
February 29, 2008
Distributions in excess of tax basis earnings and profits, if significant, are reported in the financial statements as a tax return of capital.
As of February 29, 2008, the components of distributable earnings on a tax basis consisted of the following:
Undistributed ordinary income $66,409
As of February 29, 2008, the Fund elected to defer to March 1, 2008 post-October capital losses of $1,736,434.
As of February 29, 2008, the approximate cost for U.S. federal income tax purposes and gross and net unrealized appreciation and depreciation in value of investments were as follows:
| Aggregate Cost | Gross Unrealized Appreciation | Gross Unrealized (Depreciation) | Net Unrealized Appreciation (Depreciation) | ||||||||||||
| $ | 50,830,262 | $ | 968,822 | $ | (6,662,424 | ) | $ | (5,693,602 | ) | ||||||
For the year ended February 29, 2008, the Fund had net realized gains attributed to redemption in-kind transactions of $15,578,803.
Security transactions and related investment income
Security transactions are accounted for on trade date. Dividend income, net of applicable foreign withholding taxes, if any, is recorded on the ex-dividend date, or when the Fund is informed of the ex-dividend date, if later. Interest income is recorded on the accrual basis and is adjusted for the amortization of premiums and accretion of discounts. Interest income on inflation indexed securities, if any, is accrued daily based upon an inflation adjusted principal. Additionally, any increase or decrease in the principal or face amount of the securities adjusted for inflation is recorded as interest income or loss. Income is not recognized on securities for which collection is not expected. Non-cash dividends, if any, are recorded at the fair market value of the securities received. In determining the net gain or loss on securities sold, the cost of securities is determined on the identified cost basis.
Expenses
The majority of expenses of the Trust are directly identifiable to an individual fund. Expenses which are not readily identifiable to a specific fund are allocated taking into consideration, among other things, the nature and type of expense and the relative size of the funds. Investment income, common expenses and realized and unrealized gains and losses are allocated pro rata among the classes of shares of the Fund based on the relative net assets of each class. Shareholder service fees, which are directly attributable to a class of shares, are charged to that class's operations.
22
GMO Tobacco-Free Core Fund
(A Series of GMO Trust)
Notes to Financial Statements — (Continued)
February 29, 2008
State Street Bank and Trust Company ("State Street") serves as custodian, fund accounting agent and transfer agent of the Fund. State Street's fee may be reduced by credits that are an earnings allowance calculated on the average daily cash balances the Fund maintains with State Street. Credit balances used to reduce the fee paid to State Street, if any, are reported as a reduction of expenses in the Statement of Operations.
Recently issued accounting pronouncements
In June 2006, the Financial Accounting Standards Board ("FASB") issued FASB Interpretation No. 48, Accounting for Uncertainty in Income Taxes – an Interpretation of FASB Statement No. 109 ("FIN 48"). FIN 48 clarifies the accounting for uncertainty in income taxes recognized in accordance with FASB Statement No. 109, Accounting for Income Taxes. FIN 48 prescribes a recognition threshold and measurement attribute for a tax position taken or expected to be taken in the tax return that could impact the Fund's financial statements. It also provides guidance in relation to the Fund's financial statements on classification of tax benefits or liabilities, interest and penalties, accounting in interim periods, disclosure, and transition. FIN 48 is effective for fiscal years beginning after December 15, 2006 for registered investment companies. Management has evaluated the effects of applying the various provisions of FIN 48 and has determined that the adoption of FIN 48 does not have a material effect on the Fund's financial statements. The Fund's Federal tax returns for the prior three fiscal years remain subject to examination by the Internal Revenue Service. Management will continue to monitor the rules and guidance pertaining to FIN 48 and will take action if appropriate.
In September 2006, the FASB issued Statement of Financial Accounting Standards No. 157 ("FAS 157"), "Fair Value Measurements." FAS 157 defines fair value, establishes a framework for measuring fair value in accordance with generally accepted accounting principles and expands disclosure about fair value measurements. FAS 157 is effective for fiscal years beginning after November 15, 2007. Management is currently evaluating the impact the adoption of FAS 157 will have on the Fund's financial statement disclosures.
3. Fees and other transactions with affiliates
GMO earns a management fee paid monthly at the annual rate of 0.33% of average daily net assets. The Fund has adopted a Shareholder Service Plan under which the Fund pays GMO a shareholder service fee for client and shareholder service, reporting, and other support. Pursuant to the Shareholder Service Plan, the shareholder service fee is calculated based on average daily net assets of each class at the annual rate of 0.15% for Class III shares and 0.105% for Class IV shares.
The Manager has contractually agreed to reimburse the Fund for Fund expenses through at least June 30, 2008 to the extent the Fund's total annual operating expenses (excluding shareholder service fees, fees and expenses of the independent trustees of the Trust, fees and expenses for legal services not approved by the Manager for the Trust, compensation and expenses of the Trust's Chief Compliance Officer ("CCO")
23
GMO Tobacco-Free Core Fund
(A Series of GMO Trust)
Notes to Financial Statements — (Continued)
February 29, 2008
(excluding any employee benefits), brokerage commissions, securities lending fees and expenses, interest expense, transfer taxes, and other investment-related costs (including expenses associated with investments in any company that is an investment company or would be an investment company under the 1940 Act, but for the exceptions to the definition of investment company provided in Section 3(c)(1) and 3(c)(7) of the 1940 Act), hedging transaction fees, extraordinary, non-recurring and certain other unusual expenses (including taxes)) exceed 0.33% of the Fund's average daily net assets.
The Fund's portion of the fees paid by the Trust to the independent Trustees and CCO during the year ended February 29, 2008 was $1,509 and $323, respectively. The compensation and expenses of the CCO are included in miscellaneous expenses in the Statement of Operations. No remuneration was paid by the Fund to any other officer of the Trust.
4. Purchases and sales of securities
Cost of purchases and proceeds from sales of securities, excluding short-term investments, for the year ended February 29, 2008 aggregated $119,396,819 and $394,383,231, respectively.
5. Guarantees
In the normal course of business the Fund enters into contracts with third-party service providers that contain a variety of representations and warranties and which provide general indemnifications. The Fund's maximum exposure under these arrangements is unknown, as this would involve future claims that may be made against the Fund that have not yet occurred. Based on experience, management is of the view that the risk of loss in connection with these potential indemnification obligations is remote; however, there can be no assurance that material liabilities related to such obligations will not arise in the future that could adversely impact the Fund.
6. Principal shareholders and related parties
As of February 29, 2008, 73.72% of the outstanding shares of the Fund were held by three shareholders, each holding in excess of 10% of the Fund's outstanding shares. No other shareholder owned in excess of 10% of the outstanding shares of the Fund. Investment activities of these shareholders may have a material effect on the Fund.
As of February 29, 2008, there were no shares held by related parties, and 5.89% of the Fund's shares were held by accounts for which the Manager has investment discretion.
24
GMO Tobacco-Free Core Fund
(A Series of GMO Trust)
Notes to Financial Statements — (Continued)
February 29, 2008
7. Share transactions
The Declaration of Trust permits the Trustees to issue an unlimited number of shares of beneficial interest (without par value). Transactions in Fund shares were as follows:
| Year Ended February 29, 2008 | Year Ended February 28, 2007 | ||||||||||||||||||
| Class III: | Shares | Amount | Shares | Amount | |||||||||||||||
| Shares sold | 443,012 | $ | 4,612,176 | 531,589 | $ | 6,422,165 | |||||||||||||
| Shares issued to shareholders in reinvestment of distributions | 1,466,326 | 17,114,056 | 341,736 | 4,275,315 | |||||||||||||||
| Shares repurchased | (12,009,243 | ) | (144,470,644 | ) | (4,269,224 | ) | (52,134,461 | ) | |||||||||||
| Net increase (decrease) | (10,099,905 | ) | $ | (122,744,412 | ) | (3,395,899 | ) | $ | (41,436,981 | ) | |||||||||
| Period Ended June 21, 2007* | Year Ended February 28, 2007 | ||||||||||||||||||
| Class IV: | Shares | Amount | Shares | Amount | |||||||||||||||
| Shares sold | — | $ | — | — | $ | — | |||||||||||||
| Shares issued to shareholders in reinvestment of distributions | 469,828 | 6,184,300 | 271,906 | 3,398,570 | |||||||||||||||
| Shares repurchased | (11,190,045 | ) | (147,368,247 | ) | (1,563,722 | ) | (20,000,000 | ) | |||||||||||
| Net increase (decrease) | (10,720,217 | ) | $ | (141,183,947 | ) | (1,291,816 | ) | $ | (16,601,430 | ) | |||||||||
* Effective June 21, 2007, all shareholders redeemed or exchanged out of Class IV.
8. Subsequent Event
Subsequent to February 29, 2008, the Fund received redemption requests in the amount of $14,243,830.
25
Report of Independent Registered Public Accounting Firm
To the Trustees of GMO Trust and the Shareholders of
GMO Tobacco-Free Core Fund
In our opinion, the accompanying statement of assets and liabilities, including the schedule of investments, and the related statements of operations and of changes in net assets and the financial highlights present fairly, in all material respects, the financial position of GMO Tobacco-Free Core Fund (the "Fund") at February 29, 2008, the results of its operations for the year then ended, the changes in its net assets for each of the two years in the period then ended and the financial highlights for each of the five years in the period then ended, in conformity with accounting principles generally accepted in the United States of America. These financial statements and financial highlights (hereafter referred to as "financial statements") are the responsibility of the Fund's management; our responsibility is to express an opinion on these financial statements based on our audits. We conducted our audits of these financial stat ements in accordance with the standards of the Public Company Accounting Oversight Board (United States). Those standards require that we plan and perform the audit to obtain reasonable assurance about whether the financial statements are free of material misstatement. An audit includes examining, on a test basis, evidence supporting the amounts and disclosures in the financial statements, assessing the accounting principles used and significant estimates made by management, and evaluating the overall financial statement presentation. We believe that our audits, which included confirmation of securities at February 29, 2008 by correspondence with the custodian and brokers, provide a reasonable basis for our opinion.
PricewaterhouseCoopers LLP
Boston, Massachusetts
April 29, 2008
26
GMO Tobacco-Free Core Fund
(A Series of GMO Trust)
Fund Expenses
February 29, 2008 (Unaudited)
Expense Examples: The following information is in relation to expenses for the six month period ended February 29, 2008.
As a shareholder of the Fund, you may incur two types of costs: (1) transaction costs, and (2) ongoing costs, including management fees, shareholder service fees and other Fund expenses. This example is intended to help you understand your ongoing costs (in dollars) of investing in the Fund and to compare these costs with the ongoing costs of investing in other mutual funds.
These examples are based on an investment of $1,000 invested at the beginning of the period and held for the entire period, September 1, 2007 through February 29, 2008.
Actual Expenses
The first line of the table for each class below provides information about actual account values and actual expenses. You may use the information in this line, together with the amount you invested, to estimate the expenses that you paid over the period. Simply divide your account value by $1,000 (for example, a $10,000,000 account value divided by $1,000 = 10,000), then multiply the result by the number in the first line under the heading entitled "Net Expense Incurred" to estimate the expenses you paid on your account during this period.
Hypothetical Example for Comparison Purposes
The second line of the table for each class below provides information about hypothetical account values and hypothetical expenses based on the Fund's actual expense ratio and an assumed rate of return of 5% per year before expenses, which is not the Fund's actual return. The hypothetical account values and expenses may not be used to estimate the actual ending account balance or expenses you paid for the period. You may use this information to compare the ongoing costs of investing in the Fund with other funds. To do so, compare this 5% hypothetical example with the 5% hypothetical examples that appear in the shareholder reports of other funds.
Please note that the expenses shown in the table are meant to highlight your ongoing costs only and do not reflect any transactional costs. Therefore, the second line of the table is useful in comparing ongoing costs only, and will not help you determine the relative total costs of owning different funds. In addition, if these transactional costs were included, your costs would have been higher.
| Annualized Net Expense Ratio | Beginning Account Value | Ending Account Value | Net Expense Incurred* | ||||||||||||||||
| Class III | |||||||||||||||||||
| 1) Actual | 0.48 | % | $ | 1,000.00 | $ | 901.50 | $ | 2.27 | |||||||||||
| 2) Hypothetical | 0.48 | % | $ | 1,000.00 | $ | 1,022.48 | $ | 2.41 | |||||||||||
* Expenses are calculated using the Class's annualized net expense ratio for the six months ended February 29, 2008, multiplied by the average account value over the period, multiplied by 182 days in the period, divided by 366 days in the year.
27
GMO Tobacco-Free Core Fund
(A Series of GMO Trust)
Tax Information for the Tax Year Ended February 29, 2008 (Unaudited)
The Fund will notify shareholders of amounts for use in preparing 2008 income tax forms in January 2009.
The Fund's distributions to shareholders include $15,834,449 from long-term capital gains.
For taxable, non-corporate shareholders, 48.89% of the income and short-term capital gains, if any, distributed in the Fund's fiscal year ended February 29, 2008 represents qualified dividend income subject to the 15% rate category.
For corporate shareholders, 48.92% of the income and short-term capital gains, if any, distributed in the Fund's fiscal year ended February 29, 2008 qualified for the dividends-received deduction.
The Fund hereby designates as qualified interest income and qualified short-term capital gains with respect to its taxable year ended February 29, 2008, $164,688 and $5,166,132, respectively, or if determined to be different, the qualified interest income and qualified short-term gains of such year.
28
GMO Tobacco-Free Core Fund
(A Series of GMO Trust)
Note Concerning Distributions (Unaudited)
The Fund previously reported estimated sources of any dividends, short-term capital gains, and long-term capital gains distributions paid on a per share basis. Pursuant to Rule 19a-1(e) of the Investment Company Act, the following serves as a correction of such estimates. 0.11% of distributions to shareholders declared from net realized gains during the Fund's fiscal year were reclassified to distributions from net investment income and are reflected as such in the Statement of Changes in Net Assets.
29
Trustees and Officers (Unaudited)
The following tables list the Trust's Trustees and Officers as of the date of this report; their address and date of birth ("DOB"); their position with the Trust; the length of time holding that position with the Trust; their principal occupation(s) during the past five years; the number of portfolios in the fund complex they oversee; and other directorships they hold in companies subject to registration or reporting requirements of the Securities Exchange Act of 1934 (generally called "public companies") or in registered investment companies. The Trust's Statement of Additional Information ("SAI") includes additional information about the Trust's trustees, including changes subsequent to the date of the report. The SAI is available, without charge, upon request by writing GMO, c/o GMO Trust, 40 Rowes Wharf, Boston, MA 02110.
Independent Trustees:
| Name, Address, and DOB | Position(s) Held with Trust | Term of Office1 and Length of Time Served | Principal Occupation(s) During Past Five Years | Number of Portfolios in Fund Complex Overseen by Trustee | Other Directorships Held by Trustee | ||||||||||||||||||
| Donald W. Glazer, Esq. c/o GMO Trust 40 Rowes Wharf Boston, MA 02110 DOB: 07/26/1944 | Chairman of the Board of Trustees | Chairman of the Board of Trustees since March 2005; Lead Independent Trustee (September 2004 – March 2005); Trustee since December 2000. | Consultant – Law and Business2; Vice Chair (since 2002) and Secretary, Provant, Inc. (provider of personnel performance improvement services and training products); Author of Legal Treatises. | 47 | None. | ||||||||||||||||||
1 Each Trustee is elected to serve during the continued lifetime of the Trust until he/she dies, resigns or is removed, or if sooner, until the next meeting of Shareholders called for the purpose of electing Trustees and until the election and qualification of his/her successor.
2 As part of Mr. Glazer's work as a consultant, he provides part-time consulting services to Goodwin Procter LLP ("Goodwin"). Goodwin has provided legal services to Renewable Resources, LLC, an affiliate of GMO; GMO, in connection with its relationship with Renewable Resources; and funds managed by Renewable Resources. Mr. Glazer has represented that he has no financial interest in, and is not involved in the provision of, such legal services. In the calendar years ended December 31, 2006 and December 31, 2007, these entities paid $825,738 and $291,721 respectively, in legal fees and disbursements to Goodwin.
30
Independent Trustees — (Continued)
| Name, Address, and DOB | Position(s) Held with Trust | Term of Office1 and Length of Time Served | Principal Occupation(s) During Past Five Years | Number of Portfolios in Fund Complex Overseen by Trustee | Other Directorships Held by Trustee | ||||||||||||||||||
| Jay O. Light c/o GMO Trust 40 Rowes Wharf Boston, MA 02110 DOB: 10/03/1941 | Trustee | Since May 1996. | Dean (since April 2006), Acting Dean (August 2005 – April 2006), Senior Associate Dean (1998 – 2005), and Professor of Business Administration, Harvard Business School. | 47 | Director of Harvard Management Company, Inc.3 and Verde, Inc.; Director of Partners HealthCare System, Inc. and Chair of its Investment Committee.4 | ||||||||||||||||||
| W. Nicholas Thorndike c/o GMO Trust 40 Rowes Wharf Boston, MA 02110 DOB: 03/28/1933 | Trustee | Since March 2005. | Director or trustee of various corporations and charitable organizations, including Courier Corporation (a book publisher and manufacturer) (July 1989 – present); Putnam Funds (December 1992 – June 2004); and Providence Journal (a newspaper publisher) (December 1986 – December 2003). | 47 | Director of Courier Corporation (a book publisher and manufacturer); Member of the Investment Committee of Partners HealthCare System, Inc.4 | ||||||||||||||||||
1 Each Trustee is elected to serve during the continued lifetime of the Trust until he/she dies, resigns or is removed, or if sooner, until the next meeting of Shareholders called for the purpose of electing Trustees and until the election and qualification of his/her successor.
3 Harvard Management Company, Inc. is a client of the Manager.
4 Partners HealthCare System, Inc. is a client of the Manager.
31
Principal Officers:
| Name, Address, and DOB | Position(s) Held with Trust | Term of Office5 and Length of Time Served | Principal Occupation(s) During Past Five Years | ||||||||||||
| Scott Eston c/o GMO Trust 40 Rowes Wharf Boston, MA 02110 DOB: 01/20/1956 | President and Chief Executive Officer | President and Chief Executive Officer since October 2002; Chief Financial Officer, November 2006 – February 2007. | Chief Financial Officer, Chief Operating Officer and Member, Grantham, Mayo, Van Otterloo & Co. LLC. | ||||||||||||
| Sheppard N. Burnett c/o GMO Trust 40 Rowes Wharf Boston, MA 02110 DOB: 10/24/1968 | Treasurer and Chief Financial Officer | Chief Financial Officer since March 2007; Treasurer since November 2006; Assistant Treasurer, September 2004 – November 2006. | Fund Administration Staff, Grantham, Mayo, Van Otterloo & Co. LLC (June 2004 – present); Vice President, Director of Tax, Columbia Management Group (2002 – 2004). | ||||||||||||
| Brent C. Arvidson c/o GMO Trust 40 Rowes Wharf Boston, MA 02110 DOB: 06/26/1969 | Assistant Treasurer | Since August 1998. | Senior Fund Administrator, Grantham, Mayo, Van Otterloo & Co. LLC. | ||||||||||||
| John L. Nasrah c/o GMO Trust 40 Rowes Wharf Boston, MA 02110 DOB: 05/27/1977 | Assistant Treasurer | Since March 2007. | Fund Administrator, Grantham, Mayo, Van Otterloo & Co. LLC (September 2004 – present); Tax Analyst, Bain & Company, Inc (June 2003 – September 2004); Senior Tax Associate, PricewaterhouseCoopers LLP (2001 – 2003). | ||||||||||||
| Mahmoodur Rahman c/o GMO Trust 40 Rowes Wharf Boston, MA 02110 DOB: 11/30/1967 | Assistant Treasurer | Since September 2007. | Fund Administrator, Grantham, Mayo, Van Otterloo & Co. (April 2007 – present); Vice President and Senior Tax Manager, Massachusetts Financial Services Company (January 2000 – April 2007). | ||||||||||||
5 Officers are elected to hold such office until their successor is elected and qualified to carry out the duties and responsibilities of their office, or until he or she resigns or is removed from office.
32
Principal Officers — (Continued)
| Name, Address, and DOB | Position(s) Held with Trust | Term of Office5 and Length of Time Served | Principal Occupation(s) During Past Five Years | ||||||||||||
| Michael E. Gillespie c/o GMO Trust 40 Rowes Wharf Boston, MA 02110 DOB: 02/18/1958 | Chief Compliance Officer | Since March 2005. | Vice President of Compliance (June 2004 – February 2005) and Director of Domestic Compliance (March 2002 – June 2004), Fidelity Investments; Vice President and Senior Counsel, State Street Bank and Trust Company (May 1998 – March 2002). | ||||||||||||
| Jason B. Harrison c/o GMO Trust 40 Rowes Wharf Boston, MA 02110 DOB: 01/29/1977 | Vice President and Clerk | Vice President since November 2006; Clerk since March 2006. | Legal Counsel, Grantham, Mayo, Van Otterloo & Co. LLC (since February 2006) and Attorney, Ropes & Gray LLP (September 2002 – February 2006). | ||||||||||||
| David L. Bohan c/o GMO Trust 40 Rowes Wharf Boston, MA 02110 DOB: 06/21/1964 | Vice President and Assistant Clerk | Vice President since March 2005; Assistant Clerk since March 2006. | Legal Counsel, Grantham, Mayo, Van Otterloo & Co. LLC (September 2003 – present); Attorney, Goodwin Procter LLP (September 1996 – September 2003). | ||||||||||||
| Gregory L. Pottle c/o GMO Trust 40 Rowes Wharf Boston, MA 02110 DOB: 07/09/1971 | Vice President and Assistant Clerk | Since November 2006. | Legal Counsel, Grantham, Mayo, Van Otterloo & Co. LLC. | ||||||||||||
| Anne K. Trinque c/o GMO Trust 40 Rowes Wharf Boston, MA 02110 DOB: 04/15/1978 | Vice President and Assistant Clerk | Since September 2007. | Legal Counsel, Grantham, Mayo, Van Otterloo & Co. LLC (since January 2007); Attorney, Goodwin Procter LLP (September 2003 – January 2007). | ||||||||||||
| Cheryl Wakeham c/o GMO Trust 40 Rowes Wharf Boston, MA 02110 DOB: 10/29/1958 | Anti-Money Laundering Officer | Since December 2004. | Manager, Client Service Administration, Grantham, Mayo, Van Otterloo & Co. LLC. | ||||||||||||
5 Officers are elected to hold such office until their successor is elected and qualified to carry out the duties and responsibilities of their office, or until he or she resigns or is removed from office.
33
GMO U.S. Growth Fund
(A Series of GMO Trust)
Annual Report
February 29, 2008
For a free copy of the Fund's proxy voting guidelines, shareholders may call 1-617-346-7646 (collect), visit our website at www.gmo.com, or visit the Securities and Exchange Commission's website at www.sec.gov. Information regarding how the Fund voted proxies relating to portfolio securities during the most recent 12-month period ended June 30 is available on our website at www.gmo.com, or on the Securities and Exchange Commission's website at www.sec.gov.
The Fund files its complete schedule of portfolio holdings with the Securities and Exchange Commission for the first and third quarter of each fiscal year on Form N-Q, which is available on the Commission's website at www.sec.gov. The Fund's Form N-Q may be reviewed and copied at the Commission's Public Reference Room in Washington, D.C. Information on the operation of the Public Reference Room may be obtained by calling 1-800-SEC-0330. The Fund has a policy with respect to disclosure of portfolio holdings under which it may also make available on GMO's website (www.gmo.com) a complete schedule of portfolio holdings.
This report is prepared for the general information of shareholders. It is authorized for distribution to prospective investors only when preceded or accompanied by a prospectus for the GMO Trust.
GMO U.S. Growth Fund
(A Series of GMO Trust)
Portfolio Management
Day-to-day management of the Fund's portfolio is the responsibility of the U.S. Quantitative team at Grantham, Mayo, Van Otterloo & Co. LLC.
Management Discussion and Analysis of Fund Performance
The Class III shares of the GMO U.S. Growth Fund returned -5.5% for the fiscal year ended February 29, 2008, as compared to +0.4% for the Russell 1000 Growth Index. The Fund was invested substantially in U.S. equity securities throughout the period.
Stock selection detracted from returns relative to the Russell 1000 Growth Index. Selections in the Telecommunication Services sector added to relative returns while selections in Consumer Discretionary, Financials, and Energy detracted. In terms of individual stocks, overweight positions in Exxon Mobil, Chevron, and McDonald's were among the positions adding to relative returns. Overweight positions in Home Depot and Kohl's and an underweight in Google were among the positions detracting from relative returns.
Sector selection detracted from returns relative to the Russell 1000 Growth Index. Sector weightings positively impacting relative performance included an overweight position in Energy and underweight positions in Financials and Utilities. Sector weightings negatively impacting relative performance included an overweight in Consumer Discretionary and underweight positions in Industrials and Information Technology.
The views expressed herein are exclusively those of Grantham, Mayo, Van Otterloo & Co. LLC Management as of the date of this report and are subject to change. GMO disclaims any responsibility to update such views. They are not meant as investment advice. References to specific securities are not recommendations of such securities and may not be representative of any GMO portfolio's current or future investments.
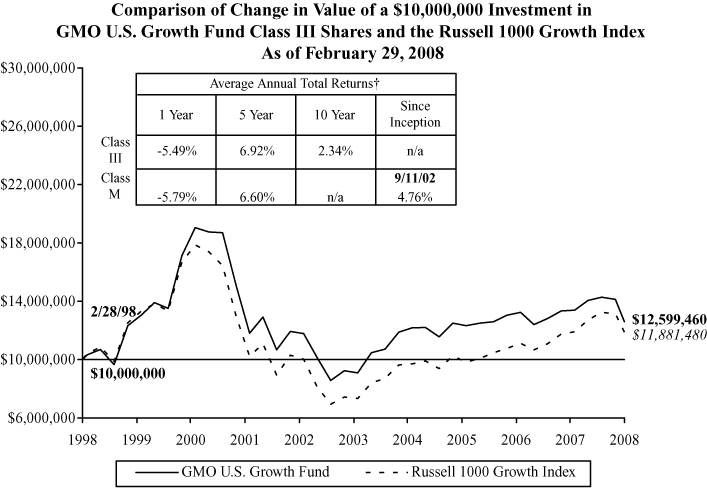
Performance data quoted represents past performance and is not indicative of future results. The investment return and principal value of an investment will fluctuate so that an investor's shares, when redeemed, may be worth more or less than their original cost. Current performance data may be lower or higher than the performance data provided herein. To obtain performance information to the most recent month-end, visit www.gmo.com. Performance shown is net of all fees after reimbursement from the Manager. Returns would have been lower had certain expenses not been reimbursed during the periods shown and do not include the effect of taxes on distributions and redemptions. All information is unaudited. Performance for Class M shares will vary due to different fees.
† The Fund is the successor to the GMO Growth Fund, therefore, performance for the periods prior to September 16, 2005 is that of GMO Growth Fund.
GMO U.S. Growth Fund
(A Series of GMO Trust)
Investments Concentration Summary
February 29, 2008 (Unaudited)
| Asset Class Summary | % of Total Net Assets | ||||||
| Common Stocks | 96.4 | % | |||||
| Short-Term Investments | 3.5 | ||||||
| Futures | (0.1 | ) | |||||
| Other | 0.2 | ||||||
| 100.0 | % | ||||||
| Industry Sector Summary | % of Equity Investments | ||||||
| Information Technology | 22.3 | % | |||||
| Health Care | 19.3 | ||||||
| Consumer Staples | 16.9 | ||||||
| Energy | 14.7 | ||||||
| Consumer Discretionary | 10.5 | ||||||
| Industrials | 9.0 | ||||||
| Materials | 3.2 | ||||||
| Financials | 2.3 | ||||||
| Telecommunication Services | 1.0 | ||||||
| Utilities | 0.8 | ||||||
| 100.0 | % | ||||||
1
GMO U.S. Growth Fund
(A Series of GMO Trust)
Schedule of Investments
(showing percentage of total net assets)
February 29, 2008
| Shares | Description | Value ($) | |||||||||||||
| COMMON STOCKS — 96.4% | |||||||||||||||
| Consumer Discretionary — 10.1% | |||||||||||||||
| 4,000 | Abercrombie & Fitch Co.-Class A | 310,120 | |||||||||||||
| 6,300 | Advance Auto Parts, Inc. | 211,302 | |||||||||||||
| 28,000 | Amazon.com, Inc. * | 1,805,160 | |||||||||||||
| 8,100 | American Eagle Outfitters, Inc. | 173,097 | |||||||||||||
| 13,900 | Apollo Group, Inc.-Class A * | 853,182 | |||||||||||||
| 9,400 | AutoNation, Inc. * | 136,958 | |||||||||||||
| 2,200 | AutoZone, Inc. * | 253,176 | |||||||||||||
| 10,900 | Bed Bath & Beyond, Inc. * | 308,906 | |||||||||||||
| 5,900 | Best Buy Co., Inc. | 253,759 | |||||||||||||
| 3,100 | Big Lots, Inc. * | 52,235 | |||||||||||||
| 400 | BorgWarner, Inc. | 17,244 | |||||||||||||
| 7,800 | Career Education Corp. * | 115,830 | |||||||||||||
| 2,400 | CarMax, Inc. * | 44,064 | |||||||||||||
| 14,300 | Coach, Inc. * | 433,576 | |||||||||||||
| 2,750 | Comcast Corp.-Class A * | 53,735 | |||||||||||||
| 3,800 | D.R. Horton, Inc. | 53,314 | |||||||||||||
| 900 | DeVry, Inc. | 39,546 | |||||||||||||
| 2,200 | Direct TV Group (The) * | 55,110 | |||||||||||||
| 13,000 | Discovery Holding Co.-Class A * | 293,410 | |||||||||||||
| 6,800 | Dollar Tree Stores, Inc. * | 182,444 | |||||||||||||
| 10,100 | Expedia, Inc. * | 231,593 | |||||||||||||
| 2,600 | Family Dollar Stores, Inc. | 49,790 | |||||||||||||
| 6,300 | GameStop Corp.-Class A * | 266,868 | |||||||||||||
| 1,300 | Gannett Co., Inc. | 39,195 | |||||||||||||
| 500 | Garmin Ltd. | 29,355 | |||||||||||||
| 1,100 | Genuine Parts Co. | 45,375 | |||||||||||||
| 9,500 | Goodyear Tire & Rubber Co. (The) * | 257,450 | |||||||||||||
| 10,700 | Harley-Davidson, Inc. | 397,612 | |||||||||||||
| 4,200 | Hasbro, Inc. | 108,234 | |||||||||||||
| 97,500 | Home Depot, Inc. | 2,588,625 | |||||||||||||
| 1,900 | IAC/InterActive Corp. * | 37,810 | |||||||||||||
| 6,600 | Interpublic Group of Cos., Inc. * | 56,892 | |||||||||||||
See accompanying notes to the financial statements.
2
GMO U.S. Growth Fund
(A Series of GMO Trust)
Schedule of Investments — (Continued)
(showing percentage of total net assets)
February 29, 2008
| Shares | Description | Value ($) | |||||||||||||
| Consumer Discretionary — continued | |||||||||||||||
| 5,300 | ITT Educational Services, Inc. * | 292,666 | |||||||||||||
| 1,900 | Jack in the Box, Inc. * | 49,913 | |||||||||||||
| 19,900 | Johnson Controls, Inc. | 653,914 | |||||||||||||
| 13,600 | Kohl's Corp. * | 604,384 | |||||||||||||
| 5,100 | Liberty Global, Inc.-Class A * | 191,760 | |||||||||||||
| 700 | Liberty Media Holding Corp. Capital-Class A * | 81,277 | |||||||||||||
| 2,500 | Liz Claiborne, Inc. | 44,450 | |||||||||||||
| 88,968 | Lowe's Cos., Inc. | 2,132,563 | |||||||||||||
| 1,500 | Marriott International, Inc.-Class A | 51,150 | |||||||||||||
| 4,700 | Mattel Co. | 90,804 | |||||||||||||
| 10,700 | McDonald's Corp. | 578,977 | |||||||||||||
| 5,400 | McGraw-Hill Cos., Inc. | 221,022 | |||||||||||||
| 5,601 | MGM Mirage * | 344,966 | |||||||||||||
| 2,100 | Mohawk Industries, Inc. * | 149,961 | |||||||||||||
| 9,600 | Nike, Inc.-Class B | 577,920 | |||||||||||||
| 2,000 | Nordstrom, Inc. | 74,060 | |||||||||||||
| 4,200 | Omnicom Group, Inc. | 187,614 | |||||||||||||
| 6,600 | O'Reilly Automotive, Inc. * | 177,936 | |||||||||||||
| 2,800 | Polo Ralph Lauren Corp. | 174,132 | |||||||||||||
| 900 | Priceline.com, Inc. * | 102,618 | |||||||||||||
| 9,700 | RadioShack Corp. | 169,265 | |||||||||||||
| 900 | Sherwin-Williams Co. (The) | 46,602 | |||||||||||||
| 23,200 | Staples, Inc. | 516,200 | |||||||||||||
| 10,000 | Starbucks Corp. * | 179,700 | |||||||||||||
| 34,300 | Target Corp. | 1,804,523 | |||||||||||||
| 1,900 | Tempur-Pedic International, Inc. | 33,098 | |||||||||||||
| 4,700 | Thor Industries, Inc. | 143,256 | |||||||||||||
| 6,700 | Tiffany & Co. | 252,188 | |||||||||||||
| 3,000 | Time Warner, Inc. | 46,830 | |||||||||||||
| 5,260 | TJX Cos., Inc. | 168,320 | |||||||||||||
| 700 | VF Corp. | 53,228 | |||||||||||||
| 400 | Wynn Resorts Ltd. | 40,280 | |||||||||||||
| 1,300 | Yum! Brands, Inc. | 44,785 | |||||||||||||
| Total Consumer Discretionary | 20,035,329 | ||||||||||||||
See accompanying notes to the financial statements.
3
GMO U.S. Growth Fund
(A Series of GMO Trust)
Schedule of Investments — (Continued)
(showing percentage of total net assets)
February 29, 2008
| Shares | Description | Value ($) | |||||||||||||
| Consumer Staples — 16.3% | |||||||||||||||
| 63,084 | Altria Group, Inc. | 4,613,964 | |||||||||||||
| 21,300 | Anheuser-Busch Cos., Inc. | 1,003,017 | |||||||||||||
| 5,900 | Avon Products, Inc. | 224,554 | |||||||||||||
| 800 | Church & Dwight Co., Inc. | 42,768 | |||||||||||||
| 94,500 | Coca-Cola Co. (The) | 5,524,470 | |||||||||||||
| 14,000 | Colgate-Palmolive Co. | 1,065,260 | |||||||||||||
| 3,100 | Costco Wholesale Corp. | 191,952 | |||||||||||||
| 13,600 | CVS Caremark Corp. | 549,168 | |||||||||||||
| 4,300 | Energizer Holdings, Inc. * | 399,169 | |||||||||||||
| 4,100 | General Mills, Inc. | 229,559 | |||||||||||||
| 1,400 | HJ Heinz Co. | 61,754 | |||||||||||||
| 1,500 | Kellogg Co. | 76,080 | |||||||||||||
| 13,900 | Kimberly-Clark Corp. | 906,002 | |||||||||||||
| 10,744 | Kraft Foods, Inc. | 334,890 | |||||||||||||
| 8,600 | Kroger Co. | 208,550 | |||||||||||||
| 52,300 | PepsiCo, Inc. | 3,637,988 | |||||||||||||
| 64,800 | Procter & Gamble Co. (The) | 4,288,464 | |||||||||||||
| 1,500 | Safeway, Inc. | 43,110 | |||||||||||||
| 10,000 | Sara Lee Corp. | 126,300 | |||||||||||||
| 1,400 | Supervalu, Inc. | 36,750 | |||||||||||||
| 6,700 | Sysco Corp. | 188,002 | |||||||||||||
| 900 | UST, Inc. | 48,861 | |||||||||||||
| 42,900 | Walgreen Co. | 1,566,279 | |||||||||||||
| 137,000 | Wal-Mart Stores, Inc. | 6,793,830 | |||||||||||||
| 2,100 | WM Wrigley Jr. Co. | 125,706 | |||||||||||||
| Total Consumer Staples | 32,286,447 | ||||||||||||||
| Energy — 14.1% | |||||||||||||||
| 2,600 | Anadarko Petroleum Corp. | 165,724 | |||||||||||||
| 4,300 | Apache Corp. | 493,253 | |||||||||||||
| 700 | Baker Hughes, Inc. | 47,103 | |||||||||||||
| 12,000 | Cameron International Corp. * | 509,760 | |||||||||||||
| 38,200 | Chevron Corp. | 3,310,412 | |||||||||||||
| 16,129 | ConocoPhillips | 1,334,030 | |||||||||||||
See accompanying notes to the financial statements.
4
GMO U.S. Growth Fund
(A Series of GMO Trust)
Schedule of Investments — (Continued)
(showing percentage of total net assets)
February 29, 2008
| Shares | Description | Value ($) | |||||||||||||
| Energy — continued | |||||||||||||||
| 2,100 | Denbury Resources, Inc. * | 66,969 | |||||||||||||
| 200 | Devon Energy Corp. | 20,544 | |||||||||||||
| 4,400 | Diamond Offshore Drilling, Inc. | 531,652 | |||||||||||||
| 3,000 | Dresser-Rand Group, Inc. * | 102,210 | |||||||||||||
| 112,900 | Exxon Mobil Corp. | 9,823,429 | |||||||||||||
| 3,800 | FMC Technologies, Inc. * | 215,308 | |||||||||||||
| 3,100 | Halliburton Co. | 118,730 | |||||||||||||
| 900 | Hess Corp. | 83,862 | |||||||||||||
| 300 | Murphy Oil Corp. | 24,114 | |||||||||||||
| 6,400 | Noble Corp. | 314,560 | |||||||||||||
| 16,400 | Occidental Petroleum Corp. | 1,268,868 | |||||||||||||
| 54,700 | Schlumberger Ltd. | 4,728,815 | |||||||||||||
| 10,200 | Smith International, Inc. | 642,906 | |||||||||||||
| 5,000 | Sunoco, Inc. | 305,400 | |||||||||||||
| 2,900 | Tidewater, Inc. | 162,835 | |||||||||||||
| 15,103 | Transocean, Inc. * | 2,122,123 | |||||||||||||
| 20,300 | Valero Energy Corp. | 1,172,731 | |||||||||||||
| 6,300 | Weatherford International Ltd. * | 434,196 | |||||||||||||
| 1,600 | XTO Energy, Inc. | 98,736 | |||||||||||||
| Total Energy | 28,098,270 | ||||||||||||||
| Financials — 2.2% | |||||||||||||||
| 10,100 | Aflac, Inc. | 630,341 | |||||||||||||
| 1,000 | Allstate Corp. (The) | 47,730 | |||||||||||||
| 1,900 | AMBAC Financial Group, Inc. | 21,166 | |||||||||||||
| 11,000 | American International Group, Inc. | 515,460 | |||||||||||||
| 400 | Bank of America Corp. | 15,896 | |||||||||||||
| 7,900 | Brown & Brown, Inc. | 140,857 | |||||||||||||
| 2,100 | Charles Schwab Corp. (The) | 41,181 | |||||||||||||
| 26,800 | Citigroup, Inc. | 635,428 | |||||||||||||
| 6,500 | Eaton Vance Corp. | 207,025 | |||||||||||||
| 3,200 | First Marblehead Corp. (The) | 38,496 | |||||||||||||
| 2,500 | Franklin Resources, Inc. | 235,925 | |||||||||||||
| 2,000 | General Growth Properties, Inc. REIT | 70,620 | |||||||||||||
See accompanying notes to the financial statements.
5
GMO U.S. Growth Fund
(A Series of GMO Trust)
Schedule of Investments — (Continued)
(showing percentage of total net assets)
February 29, 2008
| Shares | Description | Value ($) | |||||||||||||
| Financials — continued | |||||||||||||||
| 2,100 | Goldman Sachs Group, Inc. | 356,223 | |||||||||||||
| 600 | Hartford Financial Services Group, Inc. | 41,940 | |||||||||||||
| 1,500 | Janus Capital Group, Inc. | 36,330 | |||||||||||||
| 100 | Markel Corp. * | 46,475 | |||||||||||||
| 2,600 | MBIA, Inc. | 33,722 | |||||||||||||
| 1,500 | Merrill Lynch & Co., Inc. | 74,340 | |||||||||||||
| 4,300 | Moody's Corp. | 163,314 | |||||||||||||
| 1,500 | Morgan Stanley | 63,180 | |||||||||||||
| 2,300 | Philadelphia Consolidated Holding Corp. * | 78,016 | |||||||||||||
| 3,200 | Prudential Financial, Inc. | 233,504 | |||||||||||||
| 1,100 | Reinsurance Group of America, Inc. | 60,181 | |||||||||||||
| 6,700 | SEI Investment Co. | 167,567 | |||||||||||||
| 900 | SLM Corp. | 17,649 | |||||||||||||
| 2,500 | T. Rowe Price Group, Inc. | 126,325 | |||||||||||||
| 7,200 | Travelers Cos. (The), Inc. | 334,152 | |||||||||||||
| Total Financials | 4,433,043 | ||||||||||||||
| Health Care — 18.6% | |||||||||||||||
| 40,500 | Abbott Laboratories | 2,168,775 | |||||||||||||
| 9,900 | Aetna, Inc. | 491,040 | |||||||||||||
| 1,700 | Allergan, Inc. | 100,691 | |||||||||||||
| 7,600 | Amgen, Inc. * | 345,952 | |||||||||||||
| 10,000 | Baxter International, Inc. | 590,200 | |||||||||||||
| 1,900 | Becton Dickinson & Co. | 171,798 | |||||||||||||
| 5,200 | Biogen Idec, Inc. * | 303,472 | |||||||||||||
| 19,300 | Bristol-Myers Squibb Co. | 436,373 | |||||||||||||
| 10,500 | Cardinal Health, Inc. | 620,970 | |||||||||||||
| 7,600 | Cigna Corp. | 338,808 | |||||||||||||
| 1,100 | Covance, Inc. * | 92,851 | |||||||||||||
| 7,600 | Coventry Health Care, Inc. * | 394,212 | |||||||||||||
| 500 | DENTSPLY International, Inc. | 19,520 | |||||||||||||
| 18,700 | Eli Lilly & Co. | 935,374 | |||||||||||||
| 30,600 | Express Scripts, Inc. * | 1,808,460 | |||||||||||||
| 15,900 | Forest Laboratories, Inc. * | 632,343 | |||||||||||||
See accompanying notes to the financial statements.
6
GMO U.S. Growth Fund
(A Series of GMO Trust)
Schedule of Investments — (Continued)
(showing percentage of total net assets)
February 29, 2008
| Shares | Description | Value ($) | |||||||||||||
| Health Care — continued | |||||||||||||||
| 2,600 | Genentech, Inc. * | 196,950 | |||||||||||||
| 300 | Gen-Probe, Inc. * | 14,343 | |||||||||||||
| 13,400 | Gilead Sciences, Inc. * | 634,088 | |||||||||||||
| 2,900 | Idexx Laboratories, Inc. * | 160,863 | |||||||||||||
| 2,700 | Immucor, Inc. * | 80,460 | |||||||||||||
| 2,500 | Intuitive Surgical, Inc. * | 704,800 | |||||||||||||
| 400 | Invitrogen Corp. * | 33,796 | |||||||||||||
| 62,064 | Johnson & Johnson | 3,845,485 | |||||||||||||
| 4,500 | Kinetic Concepts, Inc. * | 231,255 | |||||||||||||
| 2,000 | Lincare Holdings, Inc. * | 65,000 | |||||||||||||
| 5,100 | McKesson Corp. | 299,676 | |||||||||||||
| 30,800 | Medco Health Solutions, Inc. * | 1,364,748 | |||||||||||||
| 35,700 | Medtronic, Inc. | 1,762,152 | |||||||||||||
| 76,300 | Merck & Co., Inc. | 3,380,090 | |||||||||||||
| 5,700 | Patterson Cos., Inc. * | 200,640 | |||||||||||||
| 137,776 | Pfizer, Inc. | 3,069,649 | |||||||||||||
| 1,100 | Pharmaceutical Product Development, Inc. | 49,577 | |||||||||||||
| 5,500 | Quest Diagnostics, Inc. | 262,185 | |||||||||||||
| 3,100 | Respironics, Inc. * | 203,608 | |||||||||||||
| 27,700 | Schering-Plough Corp. | 601,090 | |||||||||||||
| 7,000 | St. Jude Medical, Inc. * | 300,860 | |||||||||||||
| 20,800 | Stryker Corp. | 1,354,288 | |||||||||||||
| 1,300 | Techne Corp. * | 88,907 | |||||||||||||
| 108,200 | UnitedHealth Group, Inc. | 5,029,136 | |||||||||||||
| 2,800 | Waters Corp. * | 166,908 | |||||||||||||
| 1,500 | WellCare Health Plans, Inc. * | 71,610 | |||||||||||||
| 10,600 | WellPoint, Inc. * | 742,848 | |||||||||||||
| 12,400 | Wyeth | 540,888 | |||||||||||||
| 26,500 | Zimmer Holdings, Inc. * | 1,995,185 | |||||||||||||
| Total Health Care | 36,901,924 | ||||||||||||||
| Industrials — 8.7% | |||||||||||||||
| 28,600 | 3M Co. | 2,242,241 | |||||||||||||
| 500 | Alliant Techsystems, Inc. * | 52,470 | |||||||||||||
See accompanying notes to the financial statements.
7
GMO U.S. Growth Fund
(A Series of GMO Trust)
Schedule of Investments — (Continued)
(showing percentage of total net assets)
February 29, 2008
| Shares | Description | Value ($) | |||||||||||||
| Industrials — continued | |||||||||||||||
| 14,100 | Caterpillar, Inc. | 1,019,853 | |||||||||||||
| 2,600 | CH Robinson Worldwide, Inc. | 132,002 | |||||||||||||
| 500 | Copart, Inc. * | 20,830 | |||||||||||||
| 8,500 | Cummins, Inc. | 428,230 | |||||||||||||
| 8,100 | Danaher Corp. | 600,615 | |||||||||||||
| 18,300 | Deere & Co. | 1,559,343 | |||||||||||||
| 10,700 | Emerson Electric Co. | 545,272 | |||||||||||||
| 500 | Fastenal Co. | 20,330 | |||||||||||||
| 3,200 | FedEx Corp. | 282,016 | |||||||||||||
| 2,000 | Flowserve Corp. | 217,800 | |||||||||||||
| 5,900 | Fluor Corp. | 821,575 | |||||||||||||
| 3,000 | General Dynamics Corp. | 245,550 | |||||||||||||
| 7,600 | Goodrich Corp. | 450,148 | |||||||||||||
| 700 | Harsco Corp. | 39,543 | |||||||||||||
| 24,800 | Honeywell International, Inc. | 1,426,992 | |||||||||||||
| 2,200 | Illinois Tool Works, Inc. | 107,954 | |||||||||||||
| 5,700 | ITT Industries, Inc. | 320,568 | |||||||||||||
| 8,000 | Jacobs Engineering Group, Inc. * | 642,320 | |||||||||||||
| 1,700 | L-3 Communications Holdings, Inc. | 180,693 | |||||||||||||
| 500 | Lockheed Martin Corp. | 51,600 | |||||||||||||
| 2,300 | Masco Corp. | 42,987 | |||||||||||||
| 400 | McDermott International, Inc. * | 20,888 | |||||||||||||
| 600 | Northrop Grumman Corp. | 47,166 | |||||||||||||
| 15,275 | Paccar, Inc. | 662,629 | |||||||||||||
| 6,900 | Pall Corp. | 271,653 | |||||||||||||
| 2,200 | Parker-Hannifin Corp. | 142,186 | |||||||||||||
| 1,300 | Pitney Bowes, Inc. | 46,514 | |||||||||||||
| 6,400 | Precision Castparts Corp. | 706,496 | |||||||||||||
| 9,900 | Quanta Services, Inc. * | 236,412 | |||||||||||||
| 2,400 | Rockwell Collins, Inc. | 141,360 | |||||||||||||
| 1,300 | RR Donnelley & Sons Co. | 41,379 | |||||||||||||
| 800 | Stericycle, Inc. * | 43,112 | |||||||||||||
| 3,900 | TeleTech Holdings, Inc. * | 88,023 | |||||||||||||
| 4,700 | Textron, Inc. | 254,599 | |||||||||||||
See accompanying notes to the financial statements.
8
GMO U.S. Growth Fund
(A Series of GMO Trust)
Schedule of Investments — (Continued)
(showing percentage of total net assets)
February 29, 2008
| Shares | Description | Value ($) | |||||||||||||
| Industrials — continued | |||||||||||||||
| 5,500 | Trane, Inc. | 247,775 | |||||||||||||
| 1,200 | Tyco International Ltd. | 48,072 | |||||||||||||
| 500 | Union Pacific Corp. | 62,380 | |||||||||||||
| 16,400 | United Parcel Service, Inc.-Class B | 1,151,936 | |||||||||||||
| 21,700 | United Technologies Corp. | 1,530,067 | |||||||||||||
| 2,100 | W.W. Grainger, Inc. | 154,686 | |||||||||||||
| Total Industrials | 17,348,265 | ||||||||||||||
| Information Technology — 21.5% | |||||||||||||||
| 5,000 | Accenture Ltd. | 176,250 | |||||||||||||
| 3,000 | Activision, Inc. * | 81,750 | |||||||||||||
| 7,300 | Adobe Systems, Inc. * | 245,645 | |||||||||||||
| 700 | Affiliated Computer Services, Inc.-Class A * | 35,525 | |||||||||||||
| 38,600 | Apple, Inc. * | 4,825,772 | |||||||||||||
| 2,500 | Arrow Electronics, Inc. * | 81,525 | |||||||||||||
| 4,700 | Autodesk, Inc. * | 146,123 | |||||||||||||
| 6,200 | Automatic Data Processing, Inc. | 247,690 | |||||||||||||
| 7,800 | Avnet, Inc. * | 262,938 | |||||||||||||
| 1,800 | BMC Software, Inc. * | 58,104 | |||||||||||||
| 4,200 | CA, Inc. | 96,096 | |||||||||||||
| 190,800 | Cisco Systems, Inc. * | 4,649,796 | |||||||||||||
| 4,300 | Citrix Systems, Inc. * | 141,599 | |||||||||||||
| 6,000 | Cognizant Technologies Solutions Corp.-Class A * | 181,260 | |||||||||||||
| 500 | CommScope, Inc. * | 20,940 | |||||||||||||
| 12,700 | Compuware Corp. * | 101,092 | |||||||||||||
| 14,500 | Corning, Inc. | 336,835 | |||||||||||||
| 600 | Cypress Semiconductor Corp. * | 13,044 | |||||||||||||
| 109,400 | Dell, Inc. * | 2,171,590 | |||||||||||||
| 69,700 | eBay, Inc. * | 1,837,292 | |||||||||||||
| 132,300 | EMC Corp. * | 2,055,942 | |||||||||||||
| 2,400 | Factset Research Systems, Inc. | 126,336 | |||||||||||||
| 9,100 | Fiserv, Inc. * | 478,842 | |||||||||||||
| 8,300 | FLIR Systems, Inc. * | 236,218 | |||||||||||||
| 6,700 | Google, Inc.-Class A * | 3,156,906 | |||||||||||||
See accompanying notes to the financial statements.
9
GMO U.S. Growth Fund
(A Series of GMO Trust)
Schedule of Investments — (Continued)
(showing percentage of total net assets)
February 29, 2008
| Shares | Description | Value ($) | |||||||||||||
| Information Technology — continued | |||||||||||||||
| 19,800 | Hewlett-Packard Co. | 945,846 | |||||||||||||
| 4,300 | Ingram Micro, Inc.-Class A * | 65,661 | |||||||||||||
| 42,608 | Intel Corp. | 850,030 | |||||||||||||
| 35,900 | International Business Machines Corp. | 4,087,574 | |||||||||||||
| 8,000 | Intersil Corp.-Class A | 186,160 | |||||||||||||
| 5,400 | Intuit, Inc. * | 143,424 | |||||||||||||
| 12,100 | Juniper Networks, Inc. * | 324,522 | |||||||||||||
| 4,000 | KLA-Tencor Corp. | 168,040 | |||||||||||||
| 3,900 | Lexmark International, Inc. * | 128,817 | |||||||||||||
| 100 | Mastercard, Inc.-Class A | 19,000 | |||||||||||||
| 5,700 | McAfee, Inc. * | 189,639 | |||||||||||||
| 2,000 | Mettler-Toledo International, Inc. * | 195,400 | |||||||||||||
| 228,100 | Microsoft Corp. | 6,208,882 | |||||||||||||
| 4,700 | National Semiconductor Corp. | 77,409 | |||||||||||||
| 2,100 | NAVTEQ Corp. * | 157,395 | |||||||||||||
| 5,700 | NCR Corp. * | 126,312 | |||||||||||||
| 127,900 | Oracle Corp. * | 2,404,520 | |||||||||||||
| 85,600 | Qualcomm, Inc. | 3,626,872 | |||||||||||||
| 3,200 | Synopsys, Inc. * | 74,272 | |||||||||||||
| 1,400 | Texas Instruments, Inc. | 41,944 | |||||||||||||
| 8,800 | Total System Services, Inc. | 195,624 | |||||||||||||
| 7,900 | VeriSign, Inc. * | 274,920 | |||||||||||||
| 5,800 | Western Digital Corp. * | 179,046 | |||||||||||||
| 7,800 | Xilinx, Inc. | 174,408 | |||||||||||||
| Total Information Technology | 42,610,827 | ||||||||||||||
| Materials — 3.1% | |||||||||||||||
| 2,200 | Air Products & Chemicals, Inc. | 200,926 | |||||||||||||
| 2,100 | Albemarle Corp. | 79,674 | |||||||||||||
| 5,200 | Alcoa, Inc. | 193,128 | |||||||||||||
| 9,900 | Celanese Corp.-Class A | 385,110 | |||||||||||||
| 200 | Cleveland-Cliffs, Inc. | 23,892 | |||||||||||||
| 4,000 | Crown Holdings, Inc. * | 99,640 | |||||||||||||
| 2,600 | Hercules, Inc. | 47,632 | |||||||||||||
See accompanying notes to the financial statements.
10
GMO U.S. Growth Fund
(A Series of GMO Trust)
Schedule of Investments — (Continued)
(showing percentage of total net assets)
February 29, 2008
| Shares | Description | Value ($) | |||||||||||||
| Materials — continued | |||||||||||||||
| 1,000 | International Flavors & Fragrances, Inc. | 43,130 | |||||||||||||
| 2,300 | Martin Marietta Materials, Inc. | 247,480 | |||||||||||||
| 30,300 | Monsanto Co. | 3,505,104 | |||||||||||||
| 5,200 | Nalco Holding Co. | 112,320 | |||||||||||||
| 9,500 | Owens-IIlinois, Inc. * | 536,275 | |||||||||||||
| 4,600 | Praxair, Inc. | 369,288 | |||||||||||||
| 500 | Southern Copper Corp. | 57,055 | |||||||||||||
| 2,600 | Vulcan Materials Co. | 182,260 | |||||||||||||
| Total Materials | 6,082,914 | ||||||||||||||
| Telecommunication Services — 1.0% | |||||||||||||||
| 13,945 | AT&T, Inc. | 485,704 | |||||||||||||
| 800 | Telephone & Data Systems, Inc. | 37,520 | |||||||||||||
| 39,000 | Verizon Communications, Inc. | 1,416,480 | |||||||||||||
| Total Telecommunication Services | 1,939,704 | ||||||||||||||
| Utilities — 0.8% | |||||||||||||||
| 1,100 | American Electric Power Co., Inc. | 45,012 | |||||||||||||
| 3,600 | Centerpoint Energy, Inc. | 52,848 | |||||||||||||
| 3,100 | Constellation Energy Group, Inc. | 273,885 | |||||||||||||
| 6,600 | Dynegy, Inc.-Class A * | 48,840 | |||||||||||||
| 700 | Entergy Corp. | 71,918 | |||||||||||||
| 1,200 | FPL Group, Inc. | 72,348 | |||||||||||||
| 5,400 | Mirant Corp. * | 199,800 | |||||||||||||
| 8,200 | NRG Energy, Inc. * | 338,414 | |||||||||||||
| 2,200 | PPL Corp. | 99,836 | |||||||||||||
| 6,000 | Public Service Enterprise Group, Inc. | 264,600 | |||||||||||||
| 4,700 | Reliant Energy, Inc. * | 107,160 | |||||||||||||
| 800 | Sempra Energy | 42,504 | |||||||||||||
| Total Utilities | 1,617,165 | ||||||||||||||
| TOTAL COMMON STOCKS (COST $205,725,408) | 191,353,888 | ||||||||||||||
See accompanying notes to the financial statements.
11
GMO U.S. Growth Fund
(A Series of GMO Trust)
Schedule of Investments — (Continued)
(showing percentage of total net assets)
February 29, 2008
| Par Value ($) | Description | Value ($) | |||||||||||||
| SHORT-TERM INVESTMENTS — 3.5% | |||||||||||||||
| 3,284,729 | Citigroup Global Markets Repurchase Agreement, dated 02/29/2008, due 03/03/2008, with a maturity value of $3,284,934 and an effective yield of 0.75%, collateralized by a U.S. Treasury Bond with a rate of 8.13%, maturity date of 08/15/19 and a market value, including accrued interest, of $3,316,437. | 3,284,729 | |||||||||||||
| 3,670,000 | U.S. Treasury Bill, 1.79%, due 07/24/08 (a) | 3,644,049 | |||||||||||||
| TOTAL SHORT-TERM INVESTMENTS (COST $6,922,060) | 6,928,778 | ||||||||||||||
| TOTAL INVESTMENTS — 99.9% (Cost $212,647,468) | 198,282,666 | ||||||||||||||
| Other Assets and Liabilities (net) — 0.1% | 114,878 | ||||||||||||||
| TOTAL NET ASSETS — 100.0% | $ | 198,397,544 | |||||||||||||
See accompanying notes to the financial statements.
12
GMO U.S. Growth Fund
(A Series of GMO Trust)
Schedule of Investments — (Continued)
February 29, 2008
A summary of outstanding financial instruments at February 29, 2008 is as follows:
Futures Contracts
| Number of Contracts | Type | Expiration Date | Contract Value | Net Unrealized Appreciation (Depreciation) | |||||||||||||||
| Buys | |||||||||||||||||||
| 66 | S&P 500 E-Mini | March 2008 | $ | 4,393,290 | $ | (132,821 | ) | ||||||||||||
As of February 29, 2008, for the futures contracts held, the Fund had sufficient cash and/or securities to cover any commitments or margin requirements of the relevant broker or exchange.
Notes to Schedule of Investments:
REIT - Real Estate Investment Trust
* Non-income producing security.
(a) Rate shown represents yield-to-maturity.
See accompanying notes to the financial statements.
13
GMO U.S. Growth Fund
(A Series of GMO Trust)
Statement of Assets and Liabilities — February 29, 2008
| Assets: | |||||||
| Investments, at value (cost $212,647,468) (Note 2) | $ | 198,282,666 | |||||
| Receivable for Fund shares sold | 5,033 | ||||||
| Dividends and interest receivable | 317,957 | ||||||
| Receivable for collateral on open futures contracts (Note 2) | 237,600 | ||||||
| Receivable for expenses reimbursed by Manager (Note 3) | 15,312 | ||||||
| Total assets | 198,858,568 | ||||||
| Liabilities: | |||||||
| Payable for Fund shares repurchased | 151,198 | ||||||
| Payable to affiliate for (Note 3): | |||||||
| Management fee | 49,153 | ||||||
| Shareholder service fee – Class III | 15,432 | ||||||
| Administration fee – Class M | 11,135 | ||||||
| Trustees and Chief Compliance Officer of GMO Trust fees | 225 | ||||||
| Payable for 12b-1 fee – Class M | 29,795 | ||||||
| Payable for variation margin on open futures contracts (Note 2) | 113,850 | ||||||
| Accrued expenses | 90,236 | ||||||
| Total liabilities | 461,024 | ||||||
| Net assets | $ | 198,397,544 | |||||
| Net assets consist of: | |||||||
| Paid-in capital | $ | 217,217,568 | |||||
| Accumulated undistributed net investment income | 244,055 | ||||||
| Distributions in excess of net realized gain | (4,566,456 | ) | |||||
| Net unrealized depreciation | (14,497,623 | ) | |||||
| $ | 198,397,544 | ||||||
| Net assets attributable to: | |||||||
| Class III shares | $ | 129,665,986 | |||||
| Class M shares | $ | 68,731,558 | |||||
| Shares outstanding: | |||||||
| Class III | 8,197,221 | ||||||
| Class M | 4,360,434 | ||||||
| Net asset value per share: | |||||||
| Class III | $ | 15.82 | |||||
| Class M | $ | 15.76 | |||||
See accompanying notes to the financial statements.
14
GMO U.S. Growth Fund
(A Series of GMO Trust)
Statement of Operations — Year Ended February 29, 2008
| Investment Income: | |||||||
| Dividends | $ | 3,458,646 | |||||
| Interest | 337,117 | ||||||
| Securities lending income | 7,062 | ||||||
| Total investment income | 3,802,825 | ||||||
| Expenses: | |||||||
| Management fee (Note 3) | 839,865 | ||||||
| Shareholder service fee – Class III (Note 3) | 286,199 | ||||||
| 12b-1 fee – Class M (Note 3) | 200,312 | ||||||
| Administration fee – Class M (Note 3) | 160,250 | ||||||
| Custodian, fund accounting agent and transfer agent fees | 114,606 | ||||||
| Audit and tax fees | 48,359 | ||||||
| Legal fees | 9,223 | ||||||
| Trustees fees and related expenses (Note 3) | 2,623 | ||||||
| Registration fees | 9,752 | ||||||
| Miscellaneous | 2,896 | ||||||
| Total expenses | 1,674,085 | ||||||
| Fees and expenses reimbursed by Manager (Note 3) | (184,081 | ) | |||||
| Expense reductions (Note 2) | (228 | ) | |||||
| Net expenses | 1,489,776 | ||||||
| Net investment income (loss) | 2,313,049 | ||||||
| Realized and unrealized gain (loss): | |||||||
| Net realized gain (loss) on: | |||||||
| Investments | 16,276,421 | ||||||
| Closed futures contracts | (371,994 | ) | |||||
| Net realized gain (loss) | 15,904,427 | ||||||
| Change in net unrealized appreciation (depreciation) on: | |||||||
| Investments | (25,840,734 | ) | |||||
| Open futures contracts | (42,027 | ) | |||||
| Net unrealized gain (loss) | (25,882,761 | ) | |||||
| Net realized and unrealized gain (loss) | (9,978,334 | ) | |||||
| Net increase (decrease) in net assets resulting from operations | $ | (7,665,285 | ) | ||||
See accompanying notes to the financial statements.
15
GMO U.S. Growth Fund
(A Series of GMO Trust)
Statement of Changes in Net Assets
| Year Ended February 29, 2008 | Year Ended February 28, 2007 | ||||||||||
| Increase (decrease) in net assets: | |||||||||||
| Operations: | |||||||||||
| Net investment income (loss) | $ | 2,313,049 | $ | 3,817,594 | |||||||
| Net realized gain (loss) | 15,904,427 | 35,381,461 | |||||||||
| Change in net unrealized appreciation (depreciation) | (25,882,761 | ) | (29,476,407 | ) | |||||||
| Net increase (decrease) in net assets from operations | (7,665,285 | ) | 9,722,648 | ||||||||
| Distributions to shareholders from: | |||||||||||
| Net investment income | |||||||||||
| Class III | (1,963,020 | ) | (2,359,398 | ) | |||||||
| Class M | (451,426 | ) | (1,415,597 | ) | |||||||
| Total distributions from net investment income | (2,414,446 | ) | (3,774,995 | ) | |||||||
| Net realized gains | |||||||||||
| Class III | (3,938,829 | ) | (13,846,929 | ) | |||||||
| Class M | (1,625,736 | ) | (15,063,597 | ) | |||||||
| Total distributions from net realized gains | (5,564,565 | ) | (28,910,526 | ) | |||||||
| (7,979,011 | ) | (32,685,521 | ) | ||||||||
| Net share transactions (Note 7): | |||||||||||
| Class III | (85,518,384 | ) | (101,707,215 | ) | |||||||
| Class M | (10,707,607 | ) | (160,597,536 | ) | |||||||
| Increase (decrease) in net assets resulting from net share transactions | (96,225,991 | ) | (262,304,751 | ) | |||||||
| Total increase (decrease) in net assets | (111,870,287 | ) | (285,267,624 | ) | |||||||
| Net assets: | |||||||||||
| Beginning of period | 310,267,831 | 595,535,455 | |||||||||
| End of period (including accumulated undistributed net investment income of $244,055 and $358,671, respectively) | $ | 198,397,544 | $ | 310,267,831 | |||||||
See accompanying notes to the financial statements.
16
GMO U.S. Growth Fund
(A Series of GMO Trust)
Financial Highlights
(For a Class III share outstanding throughout each period)
| Year Ended February 28/29, | |||||||||||||||||||||||
| 2008 | 2007 | 2006 | 2005 | 2004 | |||||||||||||||||||
| Net asset value, beginning of period | $ | 17.24 | $ | 18.17 | $ | 18.26 | $ | 19.03 | $ | 14.29 | |||||||||||||
| Income (loss) from investment operations: | |||||||||||||||||||||||
| Net investment income (loss) | 0.17 | † | 0.15 | † | 0.15 | † | 0.16 | † | 0.10 | ||||||||||||||
| Net realized and unrealized gain (loss) | (1.06 | ) | 0.07 | 0.86 | (0.02 | )(a) | 5.14 | ||||||||||||||||
| Total from investment operations | (0.89 | ) | 0.22 | 1.01 | 0.14 | 5.24 | |||||||||||||||||
| Less distributions to shareholders: | |||||||||||||||||||||||
| From net investment income | (0.17 | ) | (0.15 | ) | (0.16 | ) | (0.14 | ) | (0.14 | ) | |||||||||||||
| From net realized gains | (0.36 | ) | (1.00 | ) | (0.94 | ) | (0.77 | ) | (0.36 | ) | |||||||||||||
| Total distributions | (0.53 | ) | (1.15 | ) | (1.10 | ) | (0.91 | ) | (0.50 | ) | |||||||||||||
| Net asset value, end of period | $ | 15.82 | $ | 17.24 | $ | 18.17 | $ | 18.26 | $ | 19.03 | |||||||||||||
| Total Return(b) | (5.49 | )% | 1.24 | % | 5.64 | % | 0.94 | % | 36.93 | % | |||||||||||||
| Ratios/Supplemental Data: | |||||||||||||||||||||||
| Net assets, end of period (000's) | $ | 129,666 | $ | 224,554 | $ | 342,203 | $ | 357,499 | $ | 437,200 | |||||||||||||
| Net expenses to average daily net assets | 0.46 | %(c) | 0.46 | % | 0.48 | % | 0.48 | % | 0.48 | % | |||||||||||||
| Net investment income to average daily net assets | 0.94 | % | 0.85 | % | 0.84 | % | 0.89 | % | 0.62 | % | |||||||||||||
| Portfolio turnover rate | 97 | % | 111 | % | 94 | % | 136 | % | 97 | % | |||||||||||||
| Fees and expenses reimbursed by the Manager to average daily net assets: | 0.07 | % | 0.05 | % | 0.04 | % | 0.04 | % | 0.05 | % | |||||||||||||
(a) The amount shown for a share outstanding does not correspond with the aggregate net realized and unrealized gain (loss) on investments due to the timing of purchases and redemptions of Fund shares in relation to fluctuating market values of the investments of the Fund.
(b) The total returns would have been lower had certain expenses not been reimbursed during the periods shown and assumes the effect of reinvested distributions.
(c) The net expense ratio does not include the effect of expense reductions.
† Calculated using average shares outstanding throughout the period.
See accompanying notes to the financial statements.
17
GMO U.S. Growth Fund
(A Series of GMO Trust)
Financial Highlights
(For a Class M share outstanding throughout each period)
| Year Ended February 28/29, | |||||||||||||||||||||||
| 2008 | 2007 | 2006 | 2005 | 2004 | |||||||||||||||||||
| Net asset value, beginning of period | $ | 17.16 | $ | 18.10 | $ | 18.19 | $ | 18.97 | $ | 14.25 | |||||||||||||
| Income (loss) from investment operations: | |||||||||||||||||||||||
| Net investment income (loss) | 0.11 | † | 0.10 | † | 0.10 | † | 0.11 | † | 0.09 | ||||||||||||||
| Net realized and unrealized gain (loss) | (1.05 | ) | 0.06 | 0.85 | (0.02 | )(a) | 5.09 | ||||||||||||||||
| Total from investment operations | (0.94 | ) | 0.16 | 0.95 | 0.09 | 5.18 | |||||||||||||||||
| Less distributions to shareholders: | |||||||||||||||||||||||
| From net investment income | (0.10 | ) | (0.10 | ) | (0.10 | ) | (0.10 | ) | (0.10 | ) | |||||||||||||
| From net realized gains | (0.36 | ) | (1.00 | ) | (0.94 | ) | (0.77 | ) | (0.36 | ) | |||||||||||||
| Total distributions | (0.46 | ) | (1.10 | ) | (1.04 | ) | (0.87 | ) | (0.46 | ) | |||||||||||||
| Net asset value, end of period | $ | 15.76 | $ | 17.16 | $ | 18.10 | $ | 18.19 | $ | 18.97 | |||||||||||||
| Total Return(b) | (5.79 | )% | 0.91 | % | 5.33 | % | 0.65 | % | 36.58 | % | |||||||||||||
| Ratios/Supplemental Data: | |||||||||||||||||||||||
| Net assets, end of period (000's) | $ | 68,732 | $ | 85,714 | $ | 253,332 | $ | 269,227 | $ | 199,865 | |||||||||||||
| Net expenses to average daily net assets | 0.76 | %(c) | 0.76 | % | 0.77 | % | 0.78 | % | 0.78 | % | |||||||||||||
| Net investment income to average daily net assets | 0.64 | % | 0.56 | % | 0.54 | % | 0.61 | % | 0.29 | % | |||||||||||||
| Portfolio turnover rate | 97 | % | 111 | % | 94 | % | 136 | % | 97 | % | |||||||||||||
| Fees and expenses reimbursed by the Manager to average daily net assets: | 0.07 | % | 0.05 | % | 0.04 | % | 0.04 | % | 0.05 | % | |||||||||||||
(a) The amount shown for a share outstanding does not correspond with the aggregate net realized and unrealized gain (loss) on investments due to the timing of purchases and redemptions of Fund shares in relation to fluctuating market values of the investments of the Fund.
(b) The total returns would have been lower had certain expenses not been reimbursed during the periods shown and assumes the effect of reinvested distributions.
(c) The net expense ratio does not include the effect of expense reductions.
† Calculated using average shares outstanding throughout the period.
See accompanying notes to the financial statements.
18
GMO U.S. Growth Fund
(A Series of GMO Trust)
Notes to Financial Statements
February 29, 2008
1. Organization
GMO U.S. Growth Fund (the "Fund") is a series of GMO Trust (the "Trust"). The Fund is registered under the Investment Company Act of 1940, as amended, as an open-end, non-diversified management investment company. The Fund is advised and managed by Grantham, Mayo, Van Otterloo & Co. LLC (the "Manager" or "GMO"). The Trust was established as a Massachusetts business trust under the laws of the Commonwealth of Massachusetts on June 24, 1985. The Declaration of Trust permits the Trustees of the Trust ("Trustees") to create an unlimited number of series of shares ("Funds") and to subdivide Funds into classes.
The Fund seeks long-term capital growth. The Fund seeks to achieve its objective by outperforming the Russell 1000 Growth Index. The Fund typically makes equity investments in U.S. companies that issue stocks included in the Russell 1000 Index, and companies with similar market capitalizations.
Throughout the year ended February 29, 2008, the Fund had two classes of shares outstanding: Class III and Class M. Class M shares bear an administration fee and a 12b-1 fee, while Class III shares bear a shareholder service fee (See Note 3). The principal economic difference between the classes of shares is the type and level of fees.
2. Significant accounting policies
The following is a summary of significant accounting policies which are in conformity with accounting principles generally accepted in the United States of America ("U.S. GAAP") and which are consistently followed by the Fund in the preparation of its financial statements. The preparation of financial statements in accordance with U.S. GAAP requires management to make estimates and assumptions that affect the reported amounts and disclosures in the financial statements. Actual results could differ from those estimates. The accounting records of the Fund are maintained in U.S. dollars.
Portfolio valuation
Securities listed on a securities exchange for which market quotations are readily available are valued at the last sale price or official closing price on each business day, or if there is no such reported sale or official closing price, at the most recent quoted bid price. Unlisted securities for which market quotations are readily available are generally valued at the most recent quoted bid price. Short-term investments with a remaining maturity of sixty days or less are generally valued at amortized cost, which approximates fair value. Shares of investment funds are valued at their net asset value. Securities for which quotations are not readily available or whose values the Manager has determined to be unreliable are valued at fair value as determined in good faith by the Trustees or other persons acting at their direction pursuant to procedures approved by the Trustees. By its nature, a fair value price is a good faith est imate of the value of a security at a given point in time and may not reflect the value that would be realized if the security was sold and the differences could be material.
19
GMO U.S. Growth Fund
(A Series of GMO Trust)
Notes to Financial Statements — (Continued)
February 29, 2008
Futures contracts
The Fund may purchase and sell futures contracts. Upon entering into a futures contract, the Fund is required to deposit with the futures clearing broker an amount of cash, U.S. government and agency obligations, or other liquid assets in accordance with the initial margin requirements of the broker or exchange. In addition, the Fund maintains cash or securities in an amount that at least equals the net amount payable in the event the Fund must deliver the full amount of the contracts. Futures contracts are marked to market daily and an appropriate payable or receivable for the change in value ("variation margin") is recorded by the Fund. The payable or receivable is liquidated on the following business day. Gains or losses are recognized but not considered realized until the contracts expire or are closed. Futures contracts involve, to varying degrees, risk of loss in excess of the variation margin disclosed in the Statement of Assets and Liabilities. Under certain circumstances, futures exchanges may establish daily limits on the amount that the price of a futures contract can vary from the previous day's settlement price, thereby effectively preventing liquidation of unfavorable positions. Losses may arise from changes in the value of the underlying instrument if the Fund is unable to liquidate a futures position due to an illiquid secondary market for the contracts or the imposition of price limits, or if counterparties do not perform under the contract terms. Futures contracts are generally valued at the settlement price established each day by the board of trade or exchange on which they are traded. Futures contracts outstanding at the end of the period are listed in the Fund's Schedule of Investments.
Swap agreements
The Fund may enter into swap agreements. A swap is an agreement to exchange the return generated by one instrument for the return generated by another instrument. Interest rate swap agreements involve the exchange by one party with another party of their respective commitments to pay or receive interest, e.g., an exchange of floating rate payments for fixed rate payments with respect to a notional amount of principal. Total return swap agreements involve a commitment by one party in the agreement to pay interest in exchange for a market-linked return, both based on notional amounts. To the extent the total return of the security or index underlying the transaction exceeds or falls short of the offsetting interest rate obligation, the party will receive a payment from or make a payment to the counterparty, respectively. Forward spread lock swap agreements involve commitments to pay or receive a settlement amount calculated as the difference between the swap spread and a fixed spread, multiplied by the notional amount times the duration of the swap rate. The swap spread is the difference between the benchmark swap rate (market rate) and the specific treasury rate. Variance swap agreements involve commitments to pay or receive a settlement amount calculated as the difference between the annualized realized variance of returns on the underlying price and a fixed quantity, also known as the variance strike, over a period of time. In connection with these agreements, cash or securities may be set aside as collateral by the Fund's custodian or brokers in accordance with the terms of the swap agreement. The Fund earns or pays interest on cash set aside as collateral.
Swaps are marked to market daily using models that incorporate quotations from market makers and the change in value, if any, is recorded as unrealized gain or loss in the Statement of Operations. Payments received or made on swap contracts are recorded as realized gain or loss in the Statement of Operations.
20
GMO U.S. Growth Fund
(A Series of GMO Trust)
Notes to Financial Statements — (Continued)
February 29, 2008
Gains or losses are realized upon early termination of the swap agreements. These financial instruments are not actively traded on financial markets. The values assigned to these instruments are based upon the best available information and because of the uncertainty of the valuation, these values may differ significantly from the values that would have been realized had a ready market for these instruments existed, and the differences could be material. Entering into these agreements involves, to varying degrees, elements of credit, legal, market and documentation risk in excess of the amounts recognized in the Statement of Assets and Liabilities. Such risks involve the possibility that there will be no liquid market for these agreements, that the counterparties to the agreements may default on their obligations to perform or disagree as to the meaning of contractual terms in the agreements, or that there may be unfavorable cha nges in interest rates or the price of the index or security underlying these transactions. There were no swap agreements outstanding at the end of the period.
Repurchase agreements
The Fund may enter into repurchase agreements with banks and broker-dealers whereby the Fund acquires a security for cash and obtains a simultaneous commitment from the seller to repurchase the security at an agreed upon price and date. The Fund, through its custodian, takes possession of securities collateralizing the repurchase agreement. The collateral is marked to market daily to ensure that the market value of the underlying assets remains sufficient to protect the Fund in the event of default by the seller. Collateral for certain tri-party repurchase agreements is held at the counterparty's custodian in a segregated account for the benefit of the Fund and the counterparty. In connection with transactions in repurchase agreements, if the seller defaults or enters into insolvency proceedings and the value of the collateral declines, recovery of cash by the Fund may be delayed or limited. Repurchase agreements outstanding at the end of the period are listed in the Fund's Schedule of Investments.
Securities lending
The Fund may lend its securities to certain qualified broker-dealers. The loans are collateralized with cash or liquid securities with a market value at least equal to the market value of the securities on loan. As with other extensions of credit, the Fund may bear the risk of loss with respect to the investment of the collateral, the risk of delay in and/or inability to exercise its rights with respect to the collateral, and the risk of delay in recovery or loss of rights in the loaned securities should the borrower of the securities fail financially. If a loan is collateralized by U.S. government securities, the Fund receives a fee from the borrower. If a loan is collateralized by cash, the Fund typically invests the cash collateral for its own account in interest-bearing, short-term securities and pays a fee to the borrower that normally represents a portion of the Fund's earnings on the collateral. As of February 29, 2008, t he Fund had no securities on loan.
Taxes and distributions
The Fund intends to qualify each tax year as a regulated investment company under Subchapter M of the Internal Revenue Code of 1986, as amended (the "Code"). The Fund intends to distribute substantially all of its net investment income and net realized short-term and long-term capital gains, if any, after giving
21
GMO U.S. Growth Fund
(A Series of GMO Trust)
Notes to Financial Statements — (Continued)
February 29, 2008
effect to any available capital loss carryovers for U.S. federal income tax purposes. Therefore, no provision for U.S. federal income or excise tax is necessary.
The Fund's policy is to declare and pay distributions from net investment income, if any, quarterly, and from net realized short-term and long-term capital gains, if any, at least annually. All distributions are paid in shares of the Fund, at net asset value, unless the shareholder elects to receive cash distributions. Distributions to shareholders are recorded by the Fund on the ex-dividend date.
Income and capital gain distributions are determined in accordance with U.S. federal income tax regulations, which may differ from U.S. GAAP. Certain capital accounts in the financial statements are periodically adjusted for permanent differences in order to reflect their tax character. These adjustments have no impact on net assets or net asset value per share. Temporary differences which arise from recognizing certain items of income, expense, gain or loss in different periods for financial statement and tax purposes will reverse at some time in the future. Distributions in excess of net investment income or net realized gains are temporary over distributions for financial statement purposes resulting from differences in the recognition or classification of income or distributions for financial statement and tax purposes.
U.S. GAAP and tax accounting differences primarily relate to capital loss carryforwards, losses on wash sale transactions, post-October capital losses and derivative contract transactions.
The following reclassification represents the amount necessary to report the stated components of net assets on a tax basis, excluding certain temporary differences, as of February 29, 2008. The financial highlights exclude these adjustments.
| Accumulated Undistributed Net Investment Income | Distributions In Excess Of Net Realized Gain | Paid-in Capital | |||||||||
| $ | (13,219 | ) | $ | 13,219 | $ | — | |||||
The tax character of distributions declared to shareholders is as follows:
| 2/29/2008 | 2/28/2007 | ||||||||||
| Ordinary income (including any short-term capital gains) | $ | 2,427,666 | $ | 7,693,260 | |||||||
| Long-term capital gains | 5,551,345 | 24,992,261 | |||||||||
| Total distributions | $ | 7,979,011 | $ | 32,685,521 | |||||||
Distributions in excess of tax basis earnings and profits, if significant, are reported in the financial statements as a tax return of capital.
22
GMO U.S. Growth Fund
(A Series of GMO Trust)
Notes to Financial Statements — (Continued)
February 29, 2008
As of February 29, 2008, the components of distributable earnings on a tax basis consisted of the following:
| Undistributed ordinary income | $ | 242,636 | |||||
As of February 29, 2008, the Fund elected to defer to March 1, 2008 post-October capital losses of $215,010.
As of February 29, 2008, the Fund had capital loss carryforwards available to offset future realized gains if any, to the extent permitted by the Code. Utilization of the capital loss carryforwards could be subject to limitations imposed by the Code related to share ownership activity. Such losses expire as follows:
| 2/28/2011 | $ | (2,843,668 | ) | ||||
| 2/29/2012 | (782,016 | ) | |||||
| Total | $ | (3,625,684 | ) | ||||
As of February 29, 2008, the approximate cost for U.S. federal income tax purposes and gross and net unrealized appreciation and depreciation in value of investments were as follows:
Aggregate Cost | Gross Unrealized Appreciation | Gross Unrealized (Depreciation) | Net Unrealized Appreciation (Depreciation) | ||||||||||||
| $ | 213,504,631 | $ | 5,855,927 | $ | (21,077,892 | ) | $ | (15,221,965 | ) | ||||||
Security transactions and related investment income
Security transactions are accounted for on trade date. Dividend income, net of applicable foreign withholding taxes, if any, is recorded on the ex-dividend date, or when the Fund is informed of the ex-dividend date, if later. Interest income is recorded on the accrual basis and is adjusted for the amortization of premiums and accretion of discounts. Interest income on inflation indexed securities, if any, is accrued daily based upon an inflation adjusted principal. Additionally, any increase or decrease in the principal or face amount of the securities adjusted for inflation is recorded as interest income or loss. Income is not recognized on securities for which collection is not expected. Non-cash dividends, if any, are recorded at the fair market value of the securities received. In determining the net gain or loss on securities sold, the cost of securities is determined on the identified cost basis.
Expenses
The majority of expenses of the Trust are directly identifiable to an individual fund. Expenses which are not readily identifiable to a specific fund are allocated taking into consideration, among other things, the nature and type of expense and the relative size of the funds. Investment income, common expenses and realized and unrealized gains and losses are allocated pro rata among the classes of shares of the Fund
23
GMO U.S. Growth Fund
(A Series of GMO Trust)
Notes to Financial Statements — (Continued)
February 29, 2008
based on the relative net assets of each class. Shareholder service, 12b-1, and administration fees, which are directly attributable to a class of shares, are charged to that class's operations.
State Street Bank and Trust Company ("State Street") serves as custodian, fund accounting agent and transfer agent of the Fund. State Street's fee may be reduced by credits that are an earnings allowance calculated on the average daily cash balances the Fund maintains with State Street. Credit balances used to reduce the fee paid to State Street, if any, are reported as a reduction of expenses in the Statement of Operations.
Recently issued accounting pronouncements
In June 2006, the Financial Accounting Standards Board ("FASB") issued FASB Interpretation No. 48, Accounting for Uncertainty in Income Taxes – an Interpretation of FASB Statement No. 109 ("FIN 48"). FIN 48 clarifies the accounting for uncertainty in income taxes recognized in accordance with FASB Statement No. 109, Accounting for Income Taxes. FIN 48 prescribes a recognition threshold and measurement attribute for a tax position taken or expected to be taken in the tax return that could impact the Fund's financial statements. It also provides guidance in relation to the Fund's financial statements on classification of tax benefits or liabilities, interest and penalties, accounting in interim periods, disclosure, and transition. FIN 48 is effective for fiscal years beginning after December 15, 2006 for registered investment companies. Management has evaluated the effects of applying the various provisions of FIN 48 and has determined that the adoption of FIN 48 does not have a material effect on the Fund's financial statements. The Fund's federal tax returns for the prior three fiscal years remain subject to examination by the Internal Revenue Service. Management will continue to monitor the rules and guidance pertaining to FIN 48 and will take action if appropriate.
In September 2006, the FASB issued Statement of Financial Accounting Standards No. 157 ("FAS 157"), "Fair Value Measurements." FAS 157 defines fair value, establishes a framework for measuring fair value in accordance with generally accepted accounting principles and expands disclosure about fair value measurements. FAS 157 is effective for fiscal years beginning after November 15, 2007. Management is currently evaluating the impact the adoption of FAS 157 will have on the Fund's financial statement disclosures.
3. Fees and other transactions with affiliates
GMO earns a management fee paid monthly at the annual rate of 0.31% of average daily net assets. The Fund has adopted a Shareholder Service Plan under which the Fund pays GMO a shareholder service fee for client and shareholder service, reporting, and other support. Pursuant to the Shareholder Service Plan, the shareholder service fee is calculated based on average daily net assets at the annual rate of 0.15% for Class III shares.
24
GMO U.S. Growth Fund
(A Series of GMO Trust)
Notes to Financial Statements — (Continued)
February 29, 2008
Class M shares of the Fund pay GMO an administration fee monthly at the annual rate of 0.20% of the average daily Class M net assets for support services provided to Class M shareholders.
Pursuant to a Rule 12b-1 distribution plan adopted by the Fund, Class M shares of the Fund may pay a fee, at the annual rate of up to 1.00% of average daily Class M net assets, for any activities or expenses primarily intended to result in the sale of Class M shares of the Fund. The Trustees currently limit payments on Class M shares to 0.25% of the Funds average daily Class M net assets. This fee may be spent on personal services rendered to Class M shareholders of the Fund and/or maintenance of Class M shareholder accounts.
The Manager has contractually agreed to reimburse the Fund for Fund expenses through at least June 30, 2008 to the extent the Fund's total annual operating expenses (excluding shareholder service fees, fees and expenses of the independent Trustees of the Trust, fees and expenses for legal services not approved by the Manager for the Trust, compensation and expenses of the Trust's Chief Compliance Officer ("CCO") (excluding any employee benefits), brokerage commissions, securities lending fees and expenses, interest expense, transfer taxes, and other investment-related costs (including expenses associated with investments in any company that is an investment company or would be an investment company under the 1940 Act, but for the exceptions to the definition of investment company provided in Section 3(c)(1) and 3(c)(7) of the 1940 Act), hedging transaction fees, extraordinary, non-recurring and certain other unusual expenses (in cluding taxes)) exceed 0.31% of the Fund's average daily net assets.
The Fund's portion of the fees paid by the Trust to the independent Trustees and CCO during the year ended February 29, 2008 was $2,163 and $750, respectively. The compensation and expenses of the CCO are included in miscellaneous expenses in the Statement of Operations. No remuneration was paid by the Fund to any other officer of the Trust.
4. Purchases and sales of securities
Cost of purchases and proceeds from sales of securities, excluding short-term investments, for the year ended February 29, 2008 aggregated $252,287,441 and $351,299,126, respectively.
5. Guarantees
In the normal course of business the Fund enters into contracts with third-party service providers that contain a variety of representations and warranties and which provide general indemnifications. The Fund's maximum exposure under these arrangements is unknown, as this would involve future claims that may be made against the Fund that have not yet occurred. Based on experience, management is of the view that the risk of loss in connection with these potential indemnification obligations is remote; however, there can be no assurance that material liabilities related to such obligations will not arise in the future that could adversely impact the Fund.
25
GMO U.S. Growth Fund
(A Series of GMO Trust)
Notes to Financial Statements — (Continued)
February 29, 2008
6. Principal shareholders and related parties
As of February 29, 2008, 86.74% of the outstanding shares of the Fund were held by four shareholders, each holding in excess of 10% of the Fund's outstanding shares. No other shareholder owned in excess of 10% of the outstanding shares of the Fund. Investment activities of these shareholders may have a material effect on the Fund.
As of February 29, 2008, less than 0.01% of the Fund's shares were held by one related party comprised of a certain GMO employee account, and 0.02% of the Fund's shares were held by accounts for which the Manager has investment discretion.
7. Share transactions
The Declaration of Trust permits the Trustees to issue an unlimited number of shares of beneficial interest (without par value). Transactions in Fund shares were as follows:
| Year Ended February 29, 2008 | Year Ended February 28, 2007 | ||||||||||||||||||
| Class III: | Shares | Amount | Shares | Amount | |||||||||||||||
| Shares sold | 302,944 | $ | 5,156,583 | 581,512 | $ | 10,177,303 | |||||||||||||
| Shares issued to shareholders in reinvestment of distributions | 327,572 | 5,900,873 | 931,773 | 16,163,150 | |||||||||||||||
| Shares repurchased | (5,457,694 | ) | (96,575,840 | ) | (7,324,024 | ) | (128,047,668 | ) | |||||||||||
| Net increase (decrease) | (4,827,178 | ) | $ | (85,518,384 | ) | (5,810,739 | ) | $ | (101,707,215 | ) | |||||||||
| Year Ended February 29, 2008 | Year Ended February 28, 2007 | ||||||||||||||||||
| Class M: | Shares | Amount | Shares | Amount | |||||||||||||||
| Shares sold | 290,213 | $ | 5,119,051 | 4,457,973 | $ | 77,513,557 | |||||||||||||
| Shares issued to shareholders in reinvestment of distributions | 115,575 | 2,077,162 | 949,423 | 16,479,194 | |||||||||||||||
| Shares repurchased | (1,039,952 | ) | (17,903,820 | ) | (14,412,085 | ) | (254,590,287 | ) | |||||||||||
| Net increase (decrease) | (634,164 | ) | $ | (10,707,607 | ) | (9,004,689 | ) | $ | (160,597,536 | ) | |||||||||
26
Report of Independent Registered Public Accounting Firm
To the Trustees of GMO Trust and the Shareholders of
GMO U.S. Growth Fund
In our opinion, the accompanying statement of assets and liabilities, including the schedule of investments, and the related statements of operations and of changes in net assets and the financial highlights present fairly, in all material respects, the financial position of GMO U.S. Growth Fund (the "Fund") at February 29, 2008, the results of its operations for the year then ended, the changes in its net assets for each of the two years in the period then ended and the financial highlights for each of the five years in the period then ended, in conformity with accounting principles generally accepted in the United States of America. These financial statements and financial highlights (hereafter referred to as "financial statements") are the responsibility of the Fund's management; our responsibility is to express an opinion on these financial statements based on our audits. We conducted our audits of these financial statements in accordance with the standards of the Public Company Accounting Oversight Board (United States). Those standards require that we plan and perform the audit to obtain reasonable assurance about whether the financial statements are free of material misstatement. An audit includes examining, on a test basis, evidence supporting the amounts and disclosures in the financial statements, assessing the accounting principles used and significant estimates made by management, and evaluating the overall financial statement presentation. We believe that our audits, which included confirmation of securities at February 29, 2008 by correspondence with the custodian and brokers, provide a reasonable basis for our opinion.
PricewaterhouseCoopers LLP
Boston, Massachusetts
April 29, 2008
27
GMO U.S. Growth Fund
(A Series of GMO Trust)
Fund Expenses
February 29, 2008 (Unaudited)
Expense Examples: The following information is in relation to expenses for the six month period ended February 29, 2008.
As a shareholder of the Fund, you may incur two types of costs: (1) transaction costs; and (2) ongoing costs, including management fees, shareholder service fees, distribution (12b-1) and/or administration fees, and other Fund expenses. This example is intended to help you understand your ongoing costs (in dollars) of investing in the Fund and to compare these costs with the ongoing costs of investing in other mutual funds.
These examples are based on an investment of $1,000 invested at the beginning of the period and held for the entire period, September 1, 2007 through February 29, 2008.
Actual Expenses
The first line of the table for each class below provides information about actual account values and actual expenses. You may use the information in this line, together with the amount you invested, to estimate the expenses that you paid over the period. Simply divide your account value by $1,000 (for example, a $10,000,000 account value divided by $1,000 = 10,000), then multiply the result by the number in the first line under the heading entitled "Net Expense Incurred" to estimate the expenses you paid on your account during this period.
Hypothetical Example for Comparison Purposes
The second line of the table for each class below provides information about hypothetical account values and hypothetical expenses based on the Fund's actual expense ratio and an assumed rate of return of 5% per year before expenses, which is not the Fund's actual return. The hypothetical account values and expenses may not be used to estimate the actual ending account balance or expenses you paid for the period. You may use this information to compare the ongoing costs of investing in the Fund with other funds. To do so, compare this 5% hypothetical example with the 5% hypothetical examples that appear in the shareholder reports of other funds.
Please note that the expenses shown in the table are meant to highlight your ongoing costs only and do not reflect any transactional costs, such as purchase premiums and redemption fees. Therefore, the second line of the table is useful in comparing ongoing costs only, and will not help you determine the relative total costs of owning different funds. In addition, if these transactional costs were included, your costs would have been higher.
| Annualized Net Expense Ratio | Beginning Account Value | Ending Account Value | Net Expense Incurred* | ||||||||||||||||
| Class III | |||||||||||||||||||
| 1) Actual | 0.46 | % | $ | 1,000.00 | $ | 909.20 | $ | 2.18 | |||||||||||
| 2) Hypothetical | 0.46 | % | $ | 1,000.00 | $ | 1,022.58 | $ | 2.31 | |||||||||||
| Class M | |||||||||||||||||||
| 1) Actual | 0.76 | % | $ | 1,000.00 | $ | 907.60 | $ | 3.60 | |||||||||||
| 2) Hypothetical | 0.76 | % | $ | 1,000.00 | $ | 1,021.08 | $ | 3.82 | |||||||||||
* Expenses are calculated using each Class's annualized net expense ratio for the six months ended February 29, 2008, multiplied by the average account value over the period, multiplied by 182 days in the period, divided by 366 days in the year.
28
GMO U.S. Growth Fund
(A Series of GMO Trust)
Tax Information for the Tax Year Ended February 29, 2008 (Unaudited)
The Fund will notify shareholders of amounts for use in preparing 2008 income tax forms in January 2009.
The Fund's distributions to shareholders include $5,551,345 from long-term capital gains.
For taxable, non-corporate shareholders, 99.91% of the income and short-term capital gains, if any, distributed in the Fund's fiscal year ended February 29, 2008 represents qualified dividend income subject to the 15% rate category.
For corporate shareholders, 99.91% of the income and short-term capital gains, if any, distributed in the Fund's fiscal year ended February 29, 2008 qualified for the dividends-received deduction.
The Fund hereby designates as qualified interest income with respect to its taxable year ended February 29, 2008, $202,769 or if determined to be different, the qualified interest income of such year.
29
Trustees and Officers (Unaudited)
The following tables list the Trust's Trustees and Officers as of the date of this report; their address and date of birth ("DOB"); their position with the Trust; the length of time holding that position with the Trust; their principal occupation(s) during the past five years; the number of portfolios in the fund complex they oversee; and other directorships they hold in companies subject to registration or reporting requirements of the Securities Exchange Act of 1934 (generally called "public companies") or in registered investment companies. The Trust's Statement of Additional Information ("SAI") includes additional information about the Trust's trustees, including changes subsequent to the date of the report. The SAI is available, without charge, upon request by writing GMO, c/o GMO Trust, 40 Rowes Wharf, Boston, MA 02110.
Independent Trustees:
| Name, Address, and DOB | Position(s) Held with Trust | Term of Office1 and Length of Time Served | Principal Occupation(s) During Past Five Years | Number of Portfolios in Fund Complex Overseen by Trustee | Other Directorships Held by Trustee | ||||||||||||||||||
| Donald W. Glazer, Esq. c/o GMO Trust 40 Rowes Wharf Boston, MA 02110 DOB: 07/26/1944 | Chairman of the Board of Trustees | Chairman of the Board of Trustees since March 2005; Lead Independent Trustee (September 2004 – March 2005); Trustee since December 2000. | Consultant – Law and Business2; Vice Chair (since 2002) and Secretary, Provant, Inc. (provider of personnel performance improvement services and training products); Author of Legal Treatises. | 47 | None. | ||||||||||||||||||
1 Each Trustee is elected to serve during the continued lifetime of the Trust until he/she dies, resigns or is removed, or if sooner, until the next meeting of Shareholders called for the purpose of electing Trustees and until the election and qualification of his/her successor.
2 As part of Mr. Glazer's work as a consultant, he provides part-time consulting services to Goodwin Procter LLP ("Goodwin"). Goodwin has provided legal services to Renewable Resources, LLC, an affiliate of GMO; GMO, in connection with its relationship with Renewable Resources; and funds managed by Renewable Resources. Mr. Glazer has represented that he has no financial interest in, and is not involved in the provision of, such legal services. In the calendar years ended December 31, 2006 and December 31, 2007, these entities paid $825,738 and $291,721 respectively, in legal fees and disbursements to Goodwin.
30
Independent Trustees — (Continued)
| Name, Address, and DOB | Position(s) Held with Trust | Term of Office1 and Length of Time Served | Principal Occupation(s) During Past Five Years | Number of Portfolios in Fund Complex Overseen by Trustee | Other Directorships Held by Trustee | ||||||||||||||||||
| Jay O. Light c/o GMO Trust 40 Rowes Wharf Boston, MA 02110 DOB: 10/03/1941 | Trustee | Since May 1996. | Dean (since April 2006), Acting Dean (August 2005 – April 2006), Senior Associate Dean (1998 – 2005), and Professor of Business Administration, Harvard Business School. | 47 | Director of Harvard Management Company, Inc.3 and Verde, Inc.; Director of Partners HealthCare System, Inc. and Chair of its Investment Committee.4 | ||||||||||||||||||
| W. Nicholas Thorndike c/o GMO Trust 40 Rowes Wharf Boston, MA 02110 DOB: 03/28/1933 | Trustee | Since March 2005. | Director or trustee of various corporations and charitable organizations, including Courier Corporation (a book publisher and manufacturer) (July 1989 – present); Putnam Funds (December 1992 – June 2004); and Providence Journal (a newspaper publisher) (December 1986 – December 2003). | 47 | Director of Courier Corporation (a book publisher and manufacturer); Member of the Investment Committee of Partners HealthCare System, Inc.4 | ||||||||||||||||||
1 Each Trustee is elected to serve during the continued lifetime of the Trust until he/she dies, resigns or is removed, or if sooner, until the next meeting of Shareholders called for the purpose of electing Trustees and until the election and qualification of his/her successor.
3 Harvard Management Company, Inc. is a client of the Manager.
4 Partners HealthCare System, Inc. is a client of the Manager.
31
Principal Officers:
| Name, Address, and DOB | Position(s) Held with Trust | Term of Office5 and Length of Time Served | Principal Occupation(s) During Past Five Years | ||||||||||||
| Scott Eston c/o GMO Trust 40 Rowes Wharf Boston, MA 02110 DOB: 01/20/1956 | President and Chief Executive Officer | President and Chief Executive Officer since October 2002; Chief Financial Officer, November 2006 – February 2007. | Chief Financial Officer, Chief Operating Officer and Member, Grantham, Mayo, Van Otterloo & Co. LLC. | ||||||||||||
| Sheppard N. Burnett c/o GMO Trust 40 Rowes Wharf Boston, MA 02110 DOB: 10/24/1968 | Treasurer and Chief Financial Officer | Chief Financial Officer since March 2007; Treasurer since November 2006; Assistant Treasurer, September 2004 – November 2006. | Fund Administration Staff, Grantham, Mayo, Van Otterloo & Co. LLC (June 2004 – present); Vice President, Director of Tax, Columbia Management Group (2002 – 2004). | ||||||||||||
| Brent C. Arvidson c/o GMO Trust 40 Rowes Wharf Boston, MA 02110 DOB: 06/26/1969 | Assistant Treasurer | Since August 1998. | Senior Fund Administrator, Grantham, Mayo, Van Otterloo & Co. LLC. | ||||||||||||
| John L. Nasrah c/o GMO Trust 40 Rowes Wharf Boston, MA 02110 DOB: 05/27/1977 | Assistant Treasurer | Since March 2007. | Fund Administrator, Grantham, Mayo, Van Otterloo & Co. LLC (September 2004 – present); Tax Analyst, Bain & Company, Inc (June 2003 – September 2004); Senior Tax Associate, PricewaterhouseCoopers LLP (2001 – 2003). | ||||||||||||
| Mahmoodur Rahman c/o GMO Trust 40 Rowes Wharf Boston, MA 02110 DOB: 11/30/1967 | Assistant Treasurer | Since September 2007. | Fund Administrator, Grantham, Mayo, Van Otterloo & Co. (April 2007 – present); Vice President and Senior Tax Manager, Massachusetts Financial Services Company (January 2000 – April 2007). | ||||||||||||
5 Officers are elected to hold such office until their successor is elected and qualified to carry out the duties and responsibilities of their office, or until he or she resigns or is removed from office.
32
Principal Officers — (Continued)
| Name, Address, and DOB | Position(s) Held with Trust | Term of Office5 and Length of Time Served | Principal Occupation(s) During Past Five Years | ||||||||||||
| Michael E. Gillespie c/o GMO Trust 40 Rowes Wharf Boston, MA 02110 DOB: 02/18/1958 | Chief Compliance Officer | Since March 2005. | Vice President of Compliance (June 2004 – February 2005) and Director of Domestic Compliance (March 2002 – June 2004), Fidelity Investments; Vice President and Senior Counsel, State Street Bank and Trust Company (May 1998 – March 2002). | ||||||||||||
| Jason B. Harrison c/o GMO Trust 40 Rowes Wharf Boston, MA 02110 DOB: 01/29/1977 | Vice President and Clerk | Vice President since November 2006; Clerk since March 2006. | Legal Counsel, Grantham, Mayo, Van Otterloo & Co. LLC (since February 2006) and Attorney, Ropes & Gray LLP (September 2002 – February 2006). | ||||||||||||
| David L. Bohan c/o GMO Trust 40 Rowes Wharf Boston, MA 02110 DOB: 06/21/1964 | Vice President and Assistant Clerk | Vice President since March 2005; Assistant Clerk since March 2006. | Legal Counsel, Grantham, Mayo, Van Otterloo & Co. LLC (September 2003 – present); Attorney, Goodwin Procter LLP (September 1996 – September 2003). | ||||||||||||
| Gregory L. Pottle c/o GMO Trust 40 Rowes Wharf Boston, MA 02110 DOB: 07/09/1971 | Vice President and Assistant Clerk | Since November 2006. | Legal Counsel, Grantham, Mayo, Van Otterloo & Co. LLC. | ||||||||||||
| Anne K. Trinque c/o GMO Trust 40 Rowes Wharf Boston, MA 02110 DOB: 04/15/1978 | Vice President and Assistant Clerk | Since September 2007. | Legal Counsel, Grantham, Mayo, Van Otterloo & Co. LLC (since January 2007); Attorney, Goodwin Procter LLP (September 2003 – January 2007). | ||||||||||||
| Cheryl Wakeham c/o GMO Trust 40 Rowes Wharf Boston, MA 02110 DOB: 10/29/1958 | Anti-Money Laundering Officer | Since December 2004. | Manager, Client Service Administration, Grantham, Mayo, Van Otterloo & Co. LLC. | ||||||||||||
5 Officers are elected to hold such office until their successor is elected and qualified to carry out the duties and responsibilities of their office, or until he or she resigns or is removed from office.
33
GMO Real Estate Fund
(A Series of GMO Trust)
Annual Report
February 29, 2008
For a free copy of the Fund's proxy voting guidelines, shareholders may call 1-617-346-7646 (collect), visit our website at www.gmo.com, or visit the Securities and Exchange Commission's website at www.sec.gov. Information regarding how the Fund voted proxies relating to portfolio securities during the most recent 12-month period ended June 30 is available on our website at www.gmo.com, or on the Securities and Exchange Commission's website at www.sec.gov.
The Fund files its complete schedule of portfolio holdings with the Securities and Exchange Commission for the first and third quarter of each fiscal year on Form N-Q, which is available on the Commission's website at www.sec.gov. The Fund's Form N-Q may be reviewed and copied at the Commission's Public Reference Room in Washington, D.C. Information on the operation of the Public Reference Room may be obtained by calling 1-800-SEC-0330. The Fund has a policy with respect to disclosure of portfolio holdings under which it may also make available on GMO's website (www.gmo.com) a complete schedule of portfolio holdings.
This report is prepared for the general information of shareholders. It is authorized for distribution to prospective investors only when preceded or accompanied by a prospectus for the GMO Trust.
GMO Real Estate Fund
(A Series of GMO Trust)
Portfolio Management
Day-to-day management of the Fund's portfolio is the responsibility of the U.S. Quantitative team at Grantham, Mayo, Van Otterloo & Co. LLC.
Management Discussion and Analysis of Fund Performance
The GMO Real Estate Fund returned -24.0% for the fiscal year ended February 29, 2008, as compared to -24.8% for the MSCI U.S. REIT Index. The Fund was invested substantially in U.S. equity securities throughout the period.
Stock selection added to returns relative to the MSCI U.S. REIT Index. Selections in the Specialized and Retail GICS Sub-Industries added to relative returns while selections in the Diversified GICS Sub-Industry detracted. In terms of individual names, overweight positions in Public Storage and ProLogis and an underweight in General Growth Properties added to relative returns. An overweight position in Vornado Realty Trust, an underweight in Equity Residential and not owning Crescent Real Estate Equity detracted.
Sector selection detracted from returns relative to the MSCI U.S. REIT Index. GICS Sub-Industry sectors detracting from returns versus the benchmark included an overweight in Retail and an underweight in Residential while an overweight in Specialized added to relative returns.
The views expressed herein are exclusively those of Grantham, Mayo, Van Otterloo & Co. LLC Management as of the date of this report and are subject to change. GMO disclaims any responsibility to update such views. They are not meant as investment advice. References to specific securities are not recommendations of such securities and may not be representative of any GMO portfolio's current or future investments.
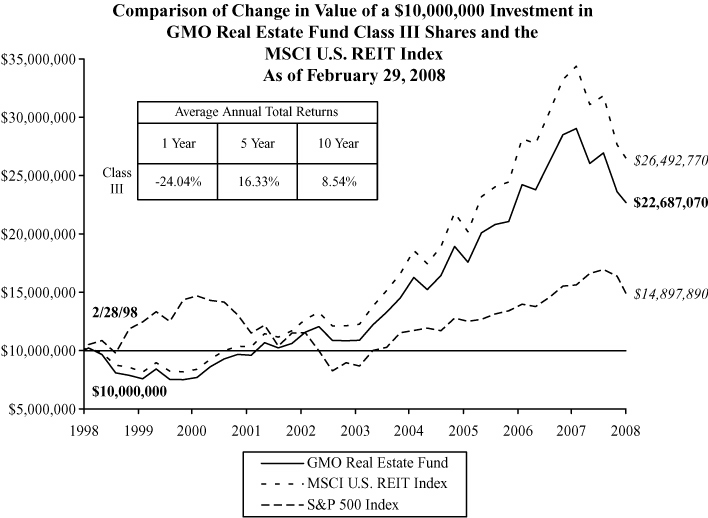
Performance data quoted represents past performance and is not indicative of future results. The investment return and principal value of an investment will fluctuate so that an investor's shares, when redeemed, may be worth more or less than their original cost. Current performance data may be lower or higher than the performance data provided herein. To obtain performance information to the most recent month-end, visit www.gmo.com. Performance shown is net of all fees after reimbursement from the Manager. Returns would have been lower had certain expenses not been reimbursed during the periods shown and do not include the effect of taxes on distributions and redemptions. All information is unaudited.
GMO Real Estate Fund
(A Series of GMO Trust)
Investments Concentration Summary
February 29, 2008 (Unaudited)
| Asset Class Summary | % of Total Net Assets | ||||||
| Real Estate Investments | 96.1 | % | |||||
| Short-Term Investments | 4.1 | ||||||
| Other | (0.2 | ) | |||||
| 100.0 | % | ||||||
| Industry Sector Summary | % of REIT Investments | ||||||
| Shopping Centers | 13.5 | % | |||||
| Regional Malls | 12.9 | ||||||
| Apartments | 11.1 | ||||||
| Industrial | 10.6 | ||||||
| Health Care | 10.2 | ||||||
| Office Suburban | 8.3 | ||||||
| Diversified | 7.6 | ||||||
| Office Central Business District | 7.4 | ||||||
| Storage | 6.9 | ||||||
| Hotels | 6.3 | ||||||
| Triple Net | 3.1 | ||||||
| Manufactured Housing | 1.7 | ||||||
| Outlets | 0.4 | ||||||
| 100.0 | % | ||||||
1
GMO Real Estate Fund
(A Series of GMO Trust)
Schedule of Investments
(showing percentage of total net assets)
February 29, 2008
| Shares | Description | Value ($) | |||||||||||||
| REAL ESTATE INVESTMENTS — 96.1% | |||||||||||||||
| REAL ESTATE INVESTMENT TRUSTS — 96.1% | |||||||||||||||
| Apartments — 10.6% | |||||||||||||||
| 5,900 | American Campus Communities, Inc. | 153,990 | |||||||||||||
| 5,207 | Apartment Investment & Management Co.-Class A | 179,381 | |||||||||||||
| 3,800 | Avalonbay Communities, Inc. | 351,234 | |||||||||||||
| 3,300 | BRE Properties, Inc.-Class A | 142,098 | |||||||||||||
| 4,000 | Camden Property Trust | 189,960 | |||||||||||||
| 7,500 | Education Realty Trust, Inc. | 95,550 | |||||||||||||
| 6,200 | Equity Residential Properties Trust | 236,716 | |||||||||||||
| 1,600 | Essex Property Trust, Inc. | 168,064 | |||||||||||||
| 2,900 | Home Properties of NY, Inc. | 133,458 | |||||||||||||
| 2,000 | Investors Real Estate Trust | 18,740 | |||||||||||||
| 2,300 | Mid-America Apartment Communities, Inc. | 111,527 | |||||||||||||
| 4,300 | Post Properties, Inc. | 180,858 | |||||||||||||
| 4,700 | UDR, Inc. | 105,045 | |||||||||||||
| Total Apartments | 2,066,621 | ||||||||||||||
| Diversified — 7.3% | |||||||||||||||
| 3,200 | Colonial Properties Trust | 77,952 | |||||||||||||
| 300 | Cousins Properties, Inc. | 7,278 | |||||||||||||
| 8,500 | Franklin Street Properties Corp. | 107,270 | |||||||||||||
| 1,000 | Pennslyvania Real Estate Investment Trust | 24,730 | |||||||||||||
| 14,100 | Vornado Realty Trust | 1,178,196 | |||||||||||||
| 1,000 | Washington Real Estate Investment Trust | 31,920 | |||||||||||||
| Total Diversified | 1,427,346 | ||||||||||||||
| Health Care — 9.8% | |||||||||||||||
| 14,300 | HCP, Inc. | 417,274 | |||||||||||||
| 7,100 | Health Care, Inc. | 292,236 | |||||||||||||
| 2,000 | LTC Properties, Inc. | 48,280 | |||||||||||||
| 5,000 | Medical Properties Trust, Inc. | 59,900 | |||||||||||||
| 3,000 | National Health Investors, Inc. | 90,390 | |||||||||||||
See accompanying notes to the financial statements.
2
GMO Real Estate Fund
(A Series of GMO Trust)
Schedule of Investments — (Continued)
(showing percentage of total net assets)
February 29, 2008
| Shares | Description | Value ($) | |||||||||||||
| Health Care — continued | |||||||||||||||
| 7,800 | Nationwide Health Properties | 236,574 | |||||||||||||
| 5,900 | Omega Healthcare Investors, Inc. | 100,064 | |||||||||||||
| 7,600 | Senior Housing Properties Trust | 161,652 | |||||||||||||
| 800 | Universal Health Realty Income Trust | 26,936 | |||||||||||||
| 11,500 | Ventas, Inc. | 480,930 | |||||||||||||
| Total Health Care | 1,914,236 | ||||||||||||||
| Hotels — 6.1% | |||||||||||||||
| 7,200 | DiamondRock Hospitality Co. | 89,928 | |||||||||||||
| 9,000 | Hospitality Properties Trust | 326,970 | |||||||||||||
| 43,900 | Host Marriott Corp. | 710,741 | |||||||||||||
| 1,100 | Lasalle Hotel Properties | 31,790 | |||||||||||||
| 1,200 | Sunstone Hotel Investors, Inc. | 18,792 | |||||||||||||
| Total Hotels | 1,178,221 | ||||||||||||||
| Industrial — 10.2% | |||||||||||||||
| 8,800 | AMB Property Corp. | 441,584 | |||||||||||||
| 4,800 | Digital Realty Trust, Inc. | 172,320 | |||||||||||||
| 600 | Eastgroup Properties, Inc. | 25,458 | |||||||||||||
| 1,100 | First Industrial Realty Trust, Inc. | 33,418 | |||||||||||||
| 24,438 | ProLogis | 1,316,719 | |||||||||||||
| Total Industrial | 1,989,499 | ||||||||||||||
| Manufactured Housing — 1.6% | |||||||||||||||
| 4,800 | Equity Lifestyle Properties, Inc. | 219,264 | |||||||||||||
| 4,600 | Sun Communities, Inc. | 93,748 | |||||||||||||
| Total Manufactured Housing | 313,012 | ||||||||||||||
| Office Central Business District — 7.1% | |||||||||||||||
| 7,500 | American Financial Realty Trust | 57,975 | |||||||||||||
| 5,300 | BioMed Realty Trust, Inc. | 116,176 | |||||||||||||
| 9,600 | Boston Properties, Inc. | 827,232 | |||||||||||||
| 3,700 | Douglas Emmett, Inc. | 78,403 | |||||||||||||
See accompanying notes to the financial statements.
3
GMO Real Estate Fund
(A Series of GMO Trust)
Schedule of Investments — (Continued)
(showing percentage of total net assets)
February 29, 2008
| Shares | Description | Value ($) | |||||||||||||
| Office Central Business District — continued | |||||||||||||||
| 700 | Maguire Properties, Inc. | 15,904 | |||||||||||||
| 3,223 | SL Green Realty Corp. | 294,905 | |||||||||||||
| Total Office Central Business District | 1,390,595 | ||||||||||||||
| Office Suburban — 8.0% | |||||||||||||||
| 3,100 | Alexandria Real Estate Equity, Inc. | 284,580 | |||||||||||||
| 2,889 | Brandywine Realty Trust | 48,362 | |||||||||||||
| 800 | Corporate Office Properties | 24,512 | |||||||||||||
| 15,300 | Duke Realty Investments | 350,676 | |||||||||||||
| 4,800 | Highwoods Properties, Inc. | 141,504 | |||||||||||||
| 26,600 | HRPT Properties Trust | 183,008 | |||||||||||||
| 1,800 | Kilroy Realty Corp. | 85,374 | |||||||||||||
| 8,100 | Liberty Property Trust | 240,651 | |||||||||||||
| 4,400 | Mack-Cali Realty Corp. | 151,756 | |||||||||||||
| 500 | Parkway Properties, Inc. | 17,875 | |||||||||||||
| 400 | PS Business Parks, Inc. | 19,420 | |||||||||||||
| Total Office Suburban | 1,547,718 | ||||||||||||||
| Outlets — 0.4% | |||||||||||||||
| 1,900 | Tanger Factory Outlet Centers, Inc. | 67,450 | |||||||||||||
| Regional Malls — 12.4% | |||||||||||||||
| 5,400 | CBL & Associates Properties, Inc. | 126,090 | |||||||||||||
| 14,400 | General Growth Properties | 508,464 | |||||||||||||
| 4,700 | Macerich Co. | 300,800 | |||||||||||||
| 15,700 | Simon Property Group, Inc. | 1,315,660 | |||||||||||||
| 3,300 | Taubman Centers, Inc. | 160,875 | |||||||||||||
| Total Regional Malls | 2,411,889 | ||||||||||||||
| Shopping Centers — 13.0% | |||||||||||||||
| 300 | Alexander's, Inc. * | 90,735 | |||||||||||||
| 10,900 | Developers Diversified Realty Corp. | 420,304 | |||||||||||||
| 5,900 | Equity One, Inc. | 126,260 | |||||||||||||
| 5,100 | Federal Realty Investment Trust | 365,568 | |||||||||||||
See accompanying notes to the financial statements.
4
GMO Real Estate Fund
(A Series of GMO Trust)
Schedule of Investments — (Continued)
(showing percentage of total net assets)
February 29, 2008
| Shares | Description | Value ($) | |||||||||||||
| Shopping Centers — continued | |||||||||||||||
| 4,400 | Inland Real Estate Corp. | 61,336 | |||||||||||||
| 22,758 | Kimco Realty Corp. | 768,538 | |||||||||||||
| 6,300 | Regency Centers Corp. | 373,905 | |||||||||||||
| 1,000 | Saul Centers, Inc. | 46,400 | |||||||||||||
| 1,600 | Urstadt Biddle Properties, Inc. | 23,504 | |||||||||||||
| 7,900 | Weingarten Realty Investors | 253,669 | |||||||||||||
| Total Shopping Centers | 2,530,219 | ||||||||||||||
| Storage — 6.6% | |||||||||||||||
| 5,000 | Extra Space Storage, Inc. | 75,350 | |||||||||||||
| 14,014 | Public Storage, Inc. | 1,140,179 | |||||||||||||
| 2,000 | Sovran Self Storage | 77,100 | |||||||||||||
| Total Storage | 1,292,629 | ||||||||||||||
| Triple Net — 3.0% | |||||||||||||||
| 2,400 | Entertainment Properties Trust | 112,488 | |||||||||||||
| 3,000 | Getty Realty Corp. | 80,580 | |||||||||||||
| 5,500 | Lexington Corporate Properties Trust | 79,585 | |||||||||||||
| 5,800 | National Retail Properties, Inc. | 120,060 | |||||||||||||
| 8,300 | Realty Income Corp. | 190,983 | |||||||||||||
| Total Triple Net | 583,696 | ||||||||||||||
| TOTAL REAL ESTATE INVESTMENT TRUSTS (COST $22,194,803) | 18,713,131 | ||||||||||||||
| TOTAL REAL ESTATE INVESTMENTS (COST $22,194,803) | 18,713,131 | ||||||||||||||
See accompanying notes to the financial statements.
5
GMO Real Estate Fund
(A Series of GMO Trust)
Schedule of Investments — (Continued)
(showing percentage of total net assets)
February 29, 2008
| Par Value ($) | Description | Value ($) | |||||||||||||
| SHORT-TERM INVESTMENTS — 4.1% | |||||||||||||||
| 402,845 | Citigroup Global Markets Repurchase Agreement, dated 02/29/08, due 03/03/08, with a maturity value of $402,870 and an effective yield of 0.75%, collateralized by a U.S. Treasury Bond with a rate of 11.25%, maturity date of 02/15/15 and a market value, including accrued interest, of $416,599. | 402,845 | |||||||||||||
| 400,000 | U.S. Treasury Bill, 1.79%, due 07/24/08 (a) | 397,171 | |||||||||||||
| TOTAL SHORT-TERM INVESTMENTS (COST $799,542) | 800,016 | ||||||||||||||
| TOTAL INVESTMENTS — 100.2% (Cost $22,994,345) | 19,513,147 | ||||||||||||||
| Other Assets and Liabilities (net) — (0.2%) | (47,862 | ) | |||||||||||||
| TOTAL NET ASSETS — 100.0% | $ | 19,465,285 | |||||||||||||
Notes to Schedule of Investments:
* Non-income producing security.
(a) Rate shown represents yield-to-maturity.
See accompanying notes to the financial statements.
6
GMO Real Estate Fund
(A Series of GMO Trust)
Statement of Assets and Liabilities — February 29, 2008
| Assets: | |||||||
| Investments, at value (cost $22,994,345) (Note 2) | $ | 19,513,147 | |||||
| Dividends and interest receivable | 16,812 | ||||||
| Receivable for expenses reimbursed by Manager (Note 3) | 4,234 | ||||||
| Total assets | 19,534,193 | ||||||
| Liabilities: | |||||||
| Payable for Fund shares repurchased | 10,000 | ||||||
| Payable to affiliate for (Note 3): | |||||||
| Management fee | 5,509 | ||||||
| Shareholder service fee | 2,504 | ||||||
| Trustees and Chief Compliance Officer of GMO Trust fees | 36 | ||||||
| Accrued expenses | 50,859 | ||||||
| Total liabilities | 68,908 | ||||||
| Net assets | $ | 19,465,285 | |||||
| Net assets consist of: | |||||||
| Paid-in capital | $ | 22,558,084 | |||||
| Accumulated undistributed net investment income | 319,064 | ||||||
| Accumulated net realized gain | 69,335 | ||||||
| Net unrealized depreciation | (3,481,198 | ) | |||||
| $ | 19,465,285 | ||||||
| Net assets attributable to: | |||||||
| Class III shares | $ | 19,465,285 | |||||
| Shares outstanding: | |||||||
| Class III | 2,480,396 | ||||||
| Net asset value per share: | |||||||
| Class III | $ | 7.85 | |||||
See accompanying notes to the financial statements.
7
GMO Real Estate Fund
(A Series of GMO Trust)
Statement of Operations — Year Ended February 29, 2008
| Investment Income: | |||||||
| Dividends | $ | 1,179,711 | |||||
| Interest | 38,242 | ||||||
| Securities lending income | 5,635 | ||||||
| Total investment income | 1,223,588 | ||||||
| Expenses: | |||||||
| Management fee (Note 3) | 94,838 | ||||||
| Shareholder service fee – Class III (Note 3) | 43,108 | ||||||
| Custodian, fund accounting agent and transfer agent fees | 12,951 | ||||||
| Audit and tax fees | 48,025 | ||||||
| Legal fees | 833 | ||||||
| Trustees fees and related expenses (Note 3) | 253 | ||||||
| Registration fees | 552 | ||||||
| Miscellaneous | 988 | ||||||
| Total expenses | 201,548 | ||||||
| Fees and expenses reimbursed by Manager (Note 3) | (63,305 | ) | |||||
| Net expenses | 138,243 | ||||||
| Net investment income (loss) | 1,085,345 | ||||||
| Realized and unrealized gain (loss): | |||||||
| Net realized gain (loss) on: | |||||||
| Investments | 2,263,639 | ||||||
| Change in net unrealized appreciation (depreciation) on investments | (11,549,632 | ) | |||||
| Net realized and unrealized gain (loss) | (9,285,993 | ) | |||||
| Net increase (decrease) in net assets resulting from operations | $ | (8,200,648 | ) | ||||
See accompanying notes to the financial statements.
8
GMO Real Estate Fund
(A Series of GMO Trust)
Statement of Changes in Net Assets
| Year Ended February 29, 2008 | Year Ended February 28, 2007 | ||||||||||
| Increase (decrease) in net assets: | |||||||||||
| Operations: | |||||||||||
| Net investment income (loss) | $ | 1,085,345 | $ | 1,167,931 | |||||||
| Net realized gain (loss) | 2,263,639 | 4,112,753 | |||||||||
| Change in net unrealized appreciation (depreciation) | (11,549,632 | ) | 4,229,092 | ||||||||
| Net increase (decrease) in net assets from operations | (8,200,648 | ) | 9,509,776 | ||||||||
| Distributions to shareholders from: | |||||||||||
| Net investment income | |||||||||||
| Class III | (360,012 | ) | (888,285 | ) | |||||||
| Net realized gains | |||||||||||
| Class III | (5,263,497 | ) | (7,162,158 | ) | |||||||
| (5,623,509 | ) | (8,050,443 | ) | ||||||||
| Net share transactions (Note 7): | |||||||||||
| Class III | (4,360,814 | ) | (5,200,133 | ) | |||||||
| Total increase (decrease) in net assets | (18,184,971 | ) | (3,740,800 | ) | |||||||
| Net assets: | |||||||||||
| Beginning of period | 37,650,256 | 41,391,056 | |||||||||
| End of period (including accumulated undistributed net investment income of $319,064 and $0, respectively) | $ | 19,465,285 | $ | 37,650,256 | |||||||
See accompanying notes to the financial statements.
9
GMO Real Estate Fund
(A Series of GMO Trust)
Financial Highlights
(For a Class III share outstanding throughout each period)
| Year Ended February 28/29, | |||||||||||||||||||||||
| 2008 | 2007 | 2006 | 2005 | 2004 | |||||||||||||||||||
| Net asset value, beginning of period | $ | 12.87 | $ | 12.27 | $ | 14.54 | $ | 14.65 | $ | 10.49 | |||||||||||||
| Income (loss) from investment operations: | |||||||||||||||||||||||
| Net investment income (loss)† | 0.40 | 0.38 | 0.61 | 0.59 | 0.58 | ||||||||||||||||||
| Net realized and unrealized gain (loss) | (3.29 | ) | 2.72 | 3.24 | 1.55 | 4.01 | |||||||||||||||||
| Total from investment operations | (2.89 | ) | 3.10 | 3.85 | 2.14 | 4.59 | |||||||||||||||||
| Less distributions to shareholders: | |||||||||||||||||||||||
| From net investment income | (0.14 | ) | (0.31 | ) | (0.40 | ) | (0.87 | ) | (0.43 | ) | |||||||||||||
| From net realized gains | (1.99 | ) | (2.19 | ) | (5.72 | ) | (1.38 | ) | — | ||||||||||||||
| Total distributions | (2.13 | ) | (2.50 | ) | (6.12 | ) | (2.25 | ) | (0.43 | ) | |||||||||||||
| Net asset value, end of period | $ | 7.85 | $ | 12.87 | $ | 12.27 | $ | 14.54 | $ | 14.65 | |||||||||||||
| Total Return(a) | (24.04 | )% | 29.76 | % | 28.89 | % | 16.01 | % | 44.56 | % | |||||||||||||
| Ratios/Supplemental Data: | |||||||||||||||||||||||
| Net assets, end of period (000's) | $ | 19,465 | $ | 37,650 | $ | 41,391 | $ | 235,837 | $ | 191,458 | |||||||||||||
| Net expenses to average daily net assets | 0.48 | % | 0.48 | % | 0.48 | % | 0.48 | % | 0.52 | % | |||||||||||||
| Net investment income to average daily net assets | 3.78 | % | 3.24 | % | 3.91 | % | 4.13 | % | 4.61 | % | |||||||||||||
| Portfolio turnover rate | 49 | % | 43 | % | 52 | % | 134 | % | 56 | % | |||||||||||||
| Fees and expenses reimbursed by the Manager to average daily net assets: | 0.22 | % | 0.28 | % | 0.25 | % | 0.25 | % | 0.24 | % | |||||||||||||
† Calculated using average shares outstanding throughout the period.
(a) The total returns would have been lower had certain expenses not been reimbursed and/or waived during the periods shown and assumes the effect of reinvested distributions.
See accompanying notes to the financial statements.
10
GMO Real Estate Fund
(A Series of GMO Trust)
Notes to Financial Statements
February 29, 2008
1. Organization
GMO Real Estate Fund (the "Fund") is a series of GMO Trust (the "Trust"). The Fund is registered under the Investment Company Act of 1940, as amended, as an open-end, non-diversified management investment company. The Fund is advised and managed by Grantham, Mayo, Van Otterloo & Co. LLC (the "Manager" or "GMO"). The Trust was established as a Massachusetts business trust under the laws of the Commonwealth of Massachusetts on June 24, 1985. The Declaration of Trust permits the Trustees of the Trust ("Trustees") to create an unlimited number of series of shares ("Funds") and to subdivide Funds into classes.
The Fund seeks high total return. The Fund seeks to achieve its objective by outperforming the MSCI U.S. REIT Index. The Fund typically makes equity investments in U.S. companies that issue stocks included in the MSCI U.S. REIT Index, and companies with similar characteristics.
2. Significant accounting policies
The following is a summary of significant accounting policies which are in conformity with accounting principles generally accepted in the United States of America ("U.S. GAAP") and which are consistently followed by the Fund in the preparation of its financial statements. The preparation of financial statements in accordance with U.S. GAAP requires management to make estimates and assumptions that affect the reported amounts and disclosures in the financial statements. Actual results could differ from those estimates. The accounting records of the Fund are maintained in U.S. dollars.
Portfolio valuation
Securities listed on a securities exchange for which market quotations are readily available are valued at the last sale price or official closing price on each business day, or if there is no such reported sale or official closing price, at the most recent quoted bid price. Unlisted securities for which market quotations are readily available are generally valued at the most recent quoted bid price. Short-term investments with a remaining maturity of sixty days or less are generally valued at amortized cost, which approximates fair value. Shares of investment funds are valued at their net asset value. Securities for which quotations are not readily available or whose values the Manager has determined to be unreliable are valued at fair value as determined in good faith by the Trustees or other persons acting at their direction pursuant to procedures approved by the Trustees. By its nature, a fair value price is a good faith est imate of the value of a security at a given point in time and may not reflect the value that would be realized if the security was sold and the differences could be material.
Futures contracts
The Fund may purchase and sell futures contracts. Upon entering into a futures contract, the Fund is required to deposit with the futures clearing broker an amount of cash, U.S. government and agency obligations, or other liquid assets in accordance with the initial margin requirements of the broker or
11
GMO Real Estate Fund
(A Series of GMO Trust)
Notes to Financial Statements — (Continued)
February 29, 2008
exchange. In addition, the Fund maintains cash or securities in an amount that at least equals the net amount payable in the event the Fund must deliver the full amount of the contracts. Futures contracts are marked to market daily and an appropriate payable or receivable for the change in value ("variation margin") is recorded by the Fund. The payable or receivable is liquidated on the following business day. Gains or losses are recognized but not considered realized until the contracts expire or are closed. Futures contracts involve, to varying degrees, risk of loss in excess of the variation margin disclosed in the Statement of Assets and Liabilities. Under certain circumstances, futures exchanges may establish daily limits on the amount that the price of a futures contract can vary from the previous day's settlement price, thereby effectively preventing liquidation of unfavorable positions. Losses may arise from changes in t he value of the underlying instrument if the Fund is unable to liquidate a futures position due to an illiquid secondary market for the contracts or the imposition of price limits, or if counterparties do not perform under the contract terms. Futures contracts are generally valued at the settlement price established each day by the board of trade or exchange on which they are traded. There were no futures contracts outstanding at the end of the period.
Repurchase agreements
The Fund may enter into repurchase agreements with banks and broker-dealers whereby the Fund acquires a security for cash and obtains a simultaneous commitment from the seller to repurchase the security at an agreed upon price and date. The Fund, through its custodian, takes possession of securities collateralizing the repurchase agreement. The collateral is marked to market daily to ensure that the market value of the underlying assets remains sufficient to protect the Fund in the event of default by the seller. Collateral for certain tri-party repurchase agreements is held at the counterparty's custodian in a segregated account for the benefit of the Fund and the counterparty. In connection with transactions in repurchase agreements, if the seller defaults or enters into insolvency proceedings and the value of the collateral declines, recovery of cash by the Fund may be delayed or limited. Repurchase agreements outstanding at the end of the period are listed in the Fund's Schedule of Investments.
Securities lending
The Fund may lend its securities to certain qualified broker-dealers. The loans are collateralized with cash or liquid securities with a market value at least equal to the market value of the securities on loan. As with other extensions of credit, the Fund may bear the risk of loss with respect to the investment of the collateral, the risk of delay in and/or inability to exercise its rights with respect to the collateral, and the risk of delay in recovery or loss of rights in the loaned securities should the borrower of the securities fail financially. If a loan is collateralized by U.S. government securities, the Fund receives a fee from the borrower. If a loan is collateralized by cash, the Fund typically invests the cash collateral for its own account in interest-bearing, short-term securities and pays a fee to the borrower that normally represents a portion of the Fund's earnings on the collateral. As of February 29, 2008, t he Fund had no securities on loan.
12
GMO Real Estate Fund
(A Series of GMO Trust)
Notes to Financial Statements — (Continued)
February 29, 2008
Taxes and distributions
The Fund intends to qualify each tax year as a regulated investment company under Subchapter M of the Internal Revenue Code of 1986, as amended (the "Code"). The Fund intends to distribute substantially all of its net investment income and net realized short-term and long-term capital gains, if any, after giving effect to any available capital loss carryovers for U.S. federal income tax purposes. Therefore, no provision for U.S. federal income or excise tax is necessary.
The Fund's policy is to declare and pay distributions from net investment income, if any, semiannually, and from net realized short-term and long-term capital gains, if any, at least annually. All distributions are paid in shares of the Fund, at net asset value, unless the shareholder elects to receive cash distributions. Distributions to shareholders are recorded by the Fund on the ex-dividend date.
Income and capital gain distributions are determined in accordance with U.S. federal income tax regulations, which may differ from U.S. GAAP. Certain capital accounts in the financial statements are periodically adjusted for permanent differences in order to reflect their tax character. These adjustments have no impact on net assets or net asset value per share. Temporary differences which arise from recognizing certain items of income, expense, gain or loss in different periods for financial statement and tax purposes will reverse at some time in the future. Distributions in excess of net investment income or net realized gains are temporary over distributions for financial statement purposes resulting from differences in the recognition or classification of income or distributions for financial statement and tax purposes.
U.S. GAAP and tax accounting differences primarily relate to adjustments related to real estate investment trust holdings, losses on wash sales transactions and post-October capital losses.
The following reclassification represents the amount necessary to report the stated components of net assets on a tax basis, excluding certain temporary differences, as of February 29, 2008. The financial highlights exclude these adjustments.
| Accumulated Undistributed Net Investment Income | Accumulated Net Realized Gain | Paid-in Capital | |||||||||
| $ | (406,269 | ) | $ | 406,269 | $ | — | |||||
13
GMO Real Estate Fund
(A Series of GMO Trust)
Notes to Financial Statements — (Continued)
February 29, 2008
The tax character of distributions declared to shareholders is as follows:
| 2/29/2008 | 2/28/2007 | ||||||||||
| Ordinary income (including any short-term capital gains) | $ | 725,652 | $ | 6,640,595 | |||||||
| Long-term capital gains | 4,897,857 | 1,409,848 | |||||||||
| Total distributions | $ | 5,623,509 | $ | 8,050,443 | |||||||
Distributions in excess of tax basis earnings and profits, if significant, are reported in the financial statements as a tax return of capital.
As of February 29, 2008, the components of distributable earnings on a tax basis consisted of the following:
| Undistributed ordinary income | $ | 339,820 | |||||
| Undistributed long-term capital gain | $ | 291,656 | |||||
As of February 29, 2008, the Fund elected to defer to March 1, 2008 post-October capital losses of $98,433.
As of February 29, 2008, the approximate cost for U.S. federal income tax purposes and gross and net unrealized appreciation and depreciation in value of investments were as follows:
| Aggregate Cost | Gross Unrealized Appreciation | Gross Unrealized (Depreciation) | Net Unrealized Appreciation (Depreciation) | ||||||||||||
| $ | 23,138,989 | $ | 205,304 | $ | (3,831,146 | ) | $ | (3,625,842 | ) | ||||||
Security transactions and related investment income
Security transactions are accounted for on trade date. Dividend income, net of applicable foreign withholding taxes, if any, is recorded on the ex-dividend date, or when the Fund is informed of the ex-dividend date, if later. Interest income is recorded on the accrual basis and is adjusted for the amortization of premiums and accretion of discounts. Interest income on inflation indexed securities, if any, is accrued daily based upon an inflation adjusted principal. Additionally, any increase or decrease in the principal or face amount of the securities adjusted for inflation is recorded as interest income or loss. Income is not recognized on securities for which collection is not expected. Non-cash dividends, if any, are recorded at the fair market value of the securities received. Distributions paid by real estate investment trusts ("REITs") in excess of their income are recorded as reductions of the cost of the related investm ents which increases/decreases the realized gains/losses as applicable. If the Fund no longer owns the applicable securities, any distributions received in excess of income are recorded as realized gains. Dividends representing a return of capital are reflected as a reduction of cost, when the amount of the
14
GMO Real Estate Fund
(A Series of GMO Trust)
Notes to Financial Statements — (Continued)
February 29, 2008
return of capital is conclusively determined. In determining the net gain or loss on securities sold, the cost of securities is determined on the identified cost basis.
Expenses
The majority of expenses of the Trust are directly identifiable to an individual fund. Expenses which are not readily identifiable to a specific fund are allocated taking into consideration, among other things, the nature and type of expense and the relative size of the funds.
State Street Bank and Trust Company ("State Street") serves as custodian, fund accounting agent and transfer agent of the Fund. State Street's fee may be reduced by credits that are an earnings allowance calculated on the average daily cash balances the Fund maintains with State Street. Credit balances used to reduce the fee paid to State Street, if any, are reported as a reduction of expenses in the Statement of Operations.
Investment risks
There are certain additional risks involved in investing in REITs rather than a more diversified portfolio of investments. Since the Fund's investments are concentrated in real-estate related securities, the value of its shares can be expected to change in light of factors affecting the real estate industry, including local or regional economic conditions, changes in zoning laws, changes in real estate value and property taxes, and changes in interest rates. The value of the Fund's shares may fluctuate more widely than the value of shares of a portfolio that invests in a broader range of industries.
Recently issued accounting pronouncements
In June 2006, the Financial Accounting Standards Board ("FASB") issued FASB Interpretation No. 48, Accounting for Uncertainty in Income Taxes – an Interpretation of FASB Statement No. 109 ("FIN 48"). FIN 48 clarifies the accounting for uncertainty in income taxes recognized in accordance with FASB Statement No. 109, Accounting for Income Taxes. FIN 48 prescribes a recognition threshold and measurement attribute for a tax position taken or expected to be taken in the tax return that could impact the Fund's financial statements. It also provides guidance in relation to the Fund's financial statements on classification of tax benefits or liabilities, interest and penalties, accounting in interim periods, disclosure, and transition. FIN 48 is effective for fiscal years beginning after December 15, 2006 for registered investment companies. Management has evaluated the effects of applying the various provisions of FIN 48 and has determined that the adoption of FIN 48 does not have a material effect on the Fund's financial statements. The Fund's federal tax returns for the prior three fiscal years, if applicable, remain subject to examination by the Internal Revenue Service. Management will continue to monitor the rules and guidance pertaining to FIN 48 and will take action if appropriate.
In September 2006, the FASB issued Statement of Financial Accounting Standards No. 157 ("FAS 157"), "Fair Value Measurements." FAS 157 defines fair value, establishes a framework for measuring fair value in accordance with generally accepted accounting principles and expands disclosure about fair value
15
GMO Real Estate Fund
(A Series of GMO Trust)
Notes to Financial Statements — (Continued)
February 29, 2008
measurements. FAS 157 is effective for fiscal years beginning after November 15, 2007. Management is currently evaluating the impact the adoption of FAS 157 will have on the Fund's financial statement disclosures.
3. Fees and other transactions with affiliates
GMO earns a management fee paid monthly at the annual rate of 0.33% of average daily net assets. The Fund has adopted a Shareholder Service Plan under which the Fund pays GMO a shareholder service fee for client and shareholder service, reporting, and other support. Pursuant to the Shareholder Service Plan, the shareholder service fee is calculated based on average daily net assets at the annual rate of 0.15% for Class III shares.
The Manager has contractually agreed to reimburse the Fund for Fund expenses through at least June 30, 2008 to the extent the Fund's total annual operating expenses (excluding shareholder service fees, fees and expenses of the independent Trustees of the Trust, fees and expenses for legal services not approved by the Manager for the Trust, compensation and expenses of the Trust's Chief Compliance Officer ("CCO") (excluding any employee benefits), brokerage commissions, securities lending fees and expenses, interest expense, transfer taxes, and other investment-related costs (including expenses associated with investments in any company that is an investment company or would be an investment company under the 1940 Act, but for the exceptions to the definition of investment company provided in Section 3(c)(1) and 3(c)(7) of the 1940 Act), hedging transaction fees, extraordinary, non-recurring and certain other unusual expenses (in cluding taxes)) exceed 0.33% of the Funds' average daily net assets.
The Fund's portion of the fees paid by the Trust to the independent Trustees and CCO during the year ended February 29, 2008 was $253 and $43, respectively. The compensation and expenses of the CCO are included in miscellaneous expenses in the Statement of Operations. No remuneration was paid by the Fund to any other officer of the Trust.
4. Purchases and sales of securities
Cost of purchases and proceeds from sales of securities, excluding short-term investments, for the year ended February 29, 2008 aggregated $13,776,123 and $21,956,147, respectively.
5. Guarantees
In the normal course of business the Fund enters into contracts with third-party service providers that contain a variety of representations and warranties and which provide general indemnifications. The Fund's maximum exposure under these arrangements is unknown, as this would involve future claims that may be made against the Fund that have not yet occurred. Based on experience, management is of the view that the risk of loss in connection with these potential indemnification obligations is remote;
16
GMO Real Estate Fund
(A Series of GMO Trust)
Notes to Financial Statements — (Continued)
February 29, 2008
however, there can be no assurance that material liabilities related to such obligations will not arise in the future that could adversely impact the Fund.
6. Principal shareholders and related parties
As of February 29, 2008, 86.25% of the outstanding shares of the Fund were held by two shareholders, each holding in excess of 10% of the Fund's outstanding shares. No other shareholder owned in excess of 10% of the outstanding shares of the Fund. Investment activities of these shareholders may have a material effect on the Fund.
As of February 29, 2008, 0.51% of the Fund's shares were held by six related parties comprised of certain GMO employee accounts, and 71.94% of the Fund's shares were held by accounts for which the Manager has investment discretion.
7. Share transactions
The Declaration of Trust permits the Trustees to issue an unlimited number of shares of beneficial interest (without par value). Transactions in Fund shares were as follows:
| Year Ended February 29, 2008 | Year Ended February 28, 2007 | ||||||||||||||||||
| Class III: | Shares | Amount | Shares | Amount | |||||||||||||||
| Shares sold | 12,826 | $ | 100,698 | 84,697 | $ | 914,263 | |||||||||||||
| Shares issued to shareholders in reinvestment of distributions | 514,775 | 4,830,216 | 644,533 | 7,044,489 | |||||||||||||||
| Shares repurchased | (973,250 | ) | (9,291,728 | ) | (1,176,570 | ) | (13,158,885 | ) | |||||||||||
| Net increase (decrease) | (445,649 | ) | $ | (4,360,814 | ) | (447,340 | ) | $ | (5,200,133 | ) | |||||||||
17
Report of Independent Registered Public Accounting Firm
To the Trustees of GMO Trust and the Shareholders of
GMO Real Estate Fund
In our opinion, the accompanying statement of assets and liabilities, including the schedule of investments, and the related statements of operations and of changes in net assets and the financial highlights present fairly, in all material respects, the financial position of GMO Real Estate Fund (the "Fund") at February 29, 2008, the results of its operations for the year then ended, the changes in its net assets for each of the two years in the period then ended and the financial highlights for each of the five years in the period then ended, in conformity with accounting principles generally accepted in the United States of America. These financial statements and financial highlights (hereafter referred to as "financial statements") are the responsibility of the Fund's management; our responsibility is to express an opinion on these financial statements based on our audits. We conducted our audits of these financial statements in accordance with the standards of the Public Company Accounting Oversight Board (United States). Those standards require that we plan and perform the audit to obtain reasonable assurance about whether the financial statements are free of material misstatement. An audit includes examining, on a test basis, evidence supporting the amounts and disclosures in the financial statements, assessing the accounting principles used and significant estimates made by management, and evaluating the overall financial statement presentation. We believe that our audits, which included confirmation of securities at February 29, 2008 by correspondence with the custodian, provide a reasonable basis for our opinion.
PricewaterhouseCoopers LLP
Boston, Massachusetts
April 29, 2008
18
GMO Real Estate Fund
(A Series of GMO Trust)
Fund Expenses
February 29, 2008 (Unaudited)
Expense Examples: The following information is in relation to expenses for the six month period ended February 29, 2008.
As a shareholder of the Fund, you may incur two types of costs: (1) transaction costs, and (2) ongoing costs, including management fees, shareholder service fees, and other Fund expenses. This example is intended to help you understand your ongoing costs (in dollars) of investing in the Fund and to compare these costs with the ongoing costs of investing in other mutual funds.
These examples are based on an investment of $1,000 invested at the beginning of the period and held for the entire period, September 1, 2007 through February 29, 2008.
Actual Expenses
The first line of the table below provides information about actual account values and actual expenses. You may use the information in this line, together with the amount you invested, to estimate the expenses that you paid over the period. Simply divide your account value by $1,000 (for example, a $10,000,000 account value divided by $1,000 = 10,000), then multiply the result by the number in the first line under the heading entitled "Net Expense Incurred" to estimate the expenses you paid on your account during this period.
Hypothetical Example for Comparison Purposes
The second line of the table below provides information about hypothetical account values and hypothetical expenses based on the Fund's actual expense ratio and an assumed rate of return of 5% per year before expenses, which is not the Fund's actual return. The hypothetical account values and expenses may not be used to estimate the actual ending account balance or expenses you paid for the period. You may use this information to compare the ongoing costs of investing in the Fund with other funds. To do so, compare this 5% hypothetical example with the 5% hypothetical examples that appear in the shareholder reports of other funds.
Please note that the expenses shown in the table are meant to highlight your ongoing costs only and do not reflect any transactional costs. Therefore, the second line of the table is useful in comparing ongoing costs only, and will not help you determine the relative total costs of owning different funds. In addition, if these transactional costs were included, your costs would have been higher.
| Annualized Net Expense Ratio | Beginning Account Value | Ending Account Value | Net Expense Incurred* | ||||||||||||||||
| Class III | |||||||||||||||||||
| 1) Actual | 0.48 | % | $ | 1,000.00 | $ | 879.50 | $ | 2.24 | |||||||||||
| 2) Hypothetical | 0.48 | % | $ | 1,000.00 | $ | 1,022.48 | $ | 2.41 | |||||||||||
* Expenses are calculated using the Class's annualized expense ratio for the six months ended February 29, 2008, multiplied by the average account value over the period, multiplied by 182 days in the period, divided by 366 days in the year.
19
GMO Real Estate Fund
(A Series of GMO Trust)
Tax Information for the Tax Year Ended February 29, 2008 (Unaudited)
The Fund will notify shareholders of amounts for use in preparing 2008 income tax forms in January 2009.
The Fund's distributions to shareholders include $4,897,857 from long-term capital gains.
The Fund hereby designates as qualified short-term capital gains with respect to its taxable year ended February 29, 2008, $365,640 or if determined to be different, the qualified short-term capital gains of such year.
20
Trustees and Officers (Unaudited)
The following tables list the Trust's Trustees and Officers as of the date of this report; their address and date of birth ("DOB"); their position with the Trust; the length of time holding that position with the Trust; their principal occupation(s) during the past five years; the number of portfolios in the fund complex they oversee; and other directorships they hold in companies subject to registration or reporting requirements of the Securities Exchange Act of 1934 (generally called "public companies") or in registered investment companies. The Trust's Statement of Additional Information ("SAI") includes additional information about the Trust's trustees, including changes subsequent to the date of the report. The SAI is available, without charge, upon request by writing GMO, c/o GMO Trust, 40 Rowes Wharf, Boston, MA 02110.
Independent Trustees:
| Name, Address, and DOB | Position(s) Held with Trust | Term of Office1 and Length of Time Served | Principal Occupation(s) During Past Five Years | Number of Portfolios in Fund Complex Overseen by Trustee | Other Directorships Held by Trustee | ||||||||||||||||||
| Donald W. Glazer, Esq. c/o GMO Trust 40 Rowes Wharf Boston, MA 02110 DOB: 07/26/1944 | Chairman of the Board of Trustees | Chairman of the Board of Trustees since March 2005; Lead Independent Trustee (September 2004 – March 2005); Trustee since December 2000. | Consultant – Law and Business2; Vice Chair (since 2002) and Secretary, Provant, Inc. (provider of personnel performance improvement services and training products); Author of Legal Treatises. | 47 | None. | ||||||||||||||||||
1 Each Trustee is elected to serve during the continued lifetime of the Trust until he/she dies, resigns or is removed, or if sooner, until the next meeting of Shareholders called for the purpose of electing Trustees and until the election and qualification of his/her successor.
2 As part of Mr. Glazer's work as a consultant, he provides part-time consulting services to Goodwin Procter LLP ("Goodwin"). Goodwin has provided legal services to Renewable Resources, LLC, an affiliate of GMO; GMO, in connection with its relationship with Renewable Resources; and funds managed by Renewable Resources. Mr. Glazer has represented that he has no financial interest in, and is not involved in the provision of, such legal services. In the calendar years ended December 31, 2006 and December 31, 2007, these entities paid $825,738 and $291,721 respectively, in legal fees and disbursements to Goodwin.
21
Independent Trustees — (Continued)
| Name, Address, and DOB | Position(s) Held with Trust | Term of Office1 and Length of Time Served | Principal Occupation(s) During Past Five Years | Number of Portfolios in Fund Complex Overseen by Trustee | Other Directorships Held by Trustee | ||||||||||||||||||
| Jay O. Light c/o GMO Trust 40 Rowes Wharf Boston, MA 02110 DOB: 10/03/1941 | Trustee | Since May 1996. | Dean (since April 2006), Acting Dean (August 2005 – April 2006), Senior Associate Dean (1998 – 2005), and Professor of Business Administration, Harvard Business School. | 47 | Director of Harvard Management Company, Inc.3 and Verde, Inc.; Director of Partners HealthCare System, Inc. and Chair of its Investment Committee.4 | ||||||||||||||||||
| W. Nicholas Thorndike c/o GMO Trust 40 Rowes Wharf Boston, MA 02110 DOB: 03/28/1933 | Trustee | Since March 2005. | Director or trustee of various corporations and charitable organizations, including Courier Corporation (a book publisher and manufacturer) (July 1989 – present); Putnam Funds (December 1992 – June 2004); and Providence Journal (a newspaper publisher) (December 1986 – December 2003). | 47 | Director of Courier Corporation (a book publisher and manufacturer); Member of the Investment Committee of Partners HealthCare System, Inc.4 | ||||||||||||||||||
1 Each Trustee is elected to serve during the continued lifetime of the Trust until he/she dies, resigns or is removed, or if sooner, until the next meeting of Shareholders called for the purpose of electing Trustees and until the election and qualification of his/her successor.
3 Harvard Management Company, Inc. is a client of the Manager.
4 Partners HealthCare System, Inc. is a client of the Manager.
22
Principal Officers:
| Name, Address, and DOB | Position(s) Held with Trust | Term of Office5 and Length of Time Served | Principal Occupation(s) During Past Five Years | ||||||||||||
| Scott Eston c/o GMO Trust 40 Rowes Wharf Boston, MA 02110 DOB: 01/20/1956 | President and Chief Executive Officer | President and Chief Executive Officer since October 2002; Chief Financial Officer, November 2006 – February 2007. | Chief Financial Officer, Chief Operating Officer and Member, Grantham, Mayo, Van Otterloo & Co. LLC. | ||||||||||||
| Sheppard N. Burnett c/o GMO Trust 40 Rowes Wharf Boston, MA 02110 DOB: 10/24/1968 | Treasurer and Chief Financial Officer | Chief Financial Officer since March 2007; Treasurer since November 2006; Assistant Treasurer, September 2004 – November 2006. | Fund Administration Staff, Grantham, Mayo, Van Otterloo & Co. LLC (June 2004 – present); Vice President, Director of Tax, Columbia Management Group (2002 – 2004). | ||||||||||||
| Brent C. Arvidson c/o GMO Trust 40 Rowes Wharf Boston, MA 02110 DOB: 06/26/1969 | Assistant Treasurer | Since August 1998. | Senior Fund Administrator, Grantham, Mayo, Van Otterloo & Co. LLC. | ||||||||||||
| John L. Nasrah c/o GMO Trust 40 Rowes Wharf Boston, MA 02110 DOB: 05/27/1977 | Assistant Treasurer | Since March 2007. | Fund Administrator, Grantham, Mayo, Van Otterloo & Co. LLC (September 2004 – present); Tax Analyst, Bain & Company, Inc (June 2003 – September 2004); Senior Tax Associate, PricewaterhouseCoopers LLP (2001 – 2003). | ||||||||||||
| Mahmoodur Rahman c/o GMO Trust 40 Rowes Wharf Boston, MA 02110 DOB: 11/30/1967 | Assistant Treasurer | Since September 2007. | Fund Administrator, Grantham, Mayo, Van Otterloo & Co. (April 2007 – present); Vice President and Senior Tax Manager, Massachusetts Financial Services Company (January 2000 – April 2007). | ||||||||||||
5 Officers are elected to hold such office until their successor is elected and qualified to carry out the duties and responsibilities of their office, or until he or she resigns or is removed from office.
23
Principal Officers — (Continued)
| Name, Address, and DOB | Position(s) Held with Trust | Term of Office5 and Length of Time Served | Principal Occupation(s) During Past Five Years | ||||||||||||
| Michael E. Gillespie c/o GMO Trust 40 Rowes Wharf Boston, MA 02110 DOB: 02/18/1958 | Chief Compliance Officer | Since March 2005. | Vice President of Compliance (June 2004 – February 2005) and Director of Domestic Compliance (March 2002 – June 2004), Fidelity Investments; Vice President and Senior Counsel, State Street Bank and Trust Company (May 1998 – March 2002). | ||||||||||||
| Jason B. Harrison c/o GMO Trust 40 Rowes Wharf Boston, MA 02110 DOB: 01/29/1977 | Vice President and Clerk | Vice President since November 2006; Clerk since March 2006. | Legal Counsel, Grantham, Mayo, Van Otterloo & Co. LLC (since February 2006) and Attorney, Ropes & Gray LLP (September 2002 – February 2006). | ||||||||||||
| David L. Bohan c/o GMO Trust 40 Rowes Wharf Boston, MA 02110 DOB: 06/21/1964 | Vice President and Assistant Clerk | Vice President since March 2005; Assistant Clerk since March 2006. | Legal Counsel, Grantham, Mayo, Van Otterloo & Co. LLC (September 2003 – present); Attorney, Goodwin Procter LLP (September 1996 – September 2003). | ||||||||||||
| Gregory L. Pottle c/o GMO Trust 40 Rowes Wharf Boston, MA 02110 DOB: 07/09/1971 | Vice President and Assistant Clerk | Since November 2006. | Legal Counsel, Grantham, Mayo, Van Otterloo & Co. LLC. | ||||||||||||
| Anne K. Trinque c/o GMO Trust 40 Rowes Wharf Boston, MA 02110 DOB: 04/15/1978 | Vice President and Assistant Clerk | Since September 2007. | Legal Counsel, Grantham, Mayo, Van Otterloo & Co. LLC (since January 2007); Attorney, Goodwin Procter LLP (September 2003 – January 2007). | ||||||||||||
| Cheryl Wakeham c/o GMO Trust 40 Rowes Wharf Boston, MA 02110 DOB: 10/29/1958 | Anti-Money Laundering Officer | Since December 2004. | Manager, Client Service Administration, Grantham, Mayo, Van Otterloo & Co. LLC. | ||||||||||||
5 Officers are elected to hold such office until their successor is elected and qualified to carry out the duties and responsibilities of their office, or until he or she resigns or is removed from office.
24
GMO Taiwan Fund
(A Series of GMO Trust)
Annual Report
February 29, 2008
For a free copy of the Fund's proxy voting guidelines, shareholders may call 1-617-346-7646 (collect), visit the Securities and Exchange Commission's website at www.sec.gov. Information regarding how the Fund voted proxies relating to portfolio securities during the most recent 12-month period ended June 30 is available on the Securities and Exchange Commission's website at www.sec.gov.
The Fund files its complete schedule of portfolio holdings with the Securities and Exchange Commission for the first and third quarter of each fiscal year on Form N-Q, which is available on the Commission's website at www.sec.gov. The Fund's Form N-Q may be reviewed and copied at the Commission's Public Reference Room in Washington, D.C. Information on the operation of the Public Reference Room may be obtained by calling 1-800-SEC-0330.
This report is prepared for the general information of shareholders. It is authorized for distribution to prospective investors only when preceded or accompanied by a prospectus for the GMO Trust.
GMO Taiwan Fund
(A Series of GMO Trust)
Portfolio Management
Day-to-day management of the Fund's portfolio is the responsibility of the Emerging Markets Division at Grantham, Mayo, Van Otterloo & Co. LLC.
Management Discussion and Analysis of Fund Performance
The GMO Taiwan Fund returned +7.0% for the fiscal year ended February 29, 2008, as compared to +12.5% for the MSCI Taiwan Index. The Fund was invested substantially in emerging markets equities tied economically to Taiwan.
Performance was helped by an overweight in the Materials sector and by an underweight in the Information Technology sector. Stock selection in the Consumer Discretionary sector added to performance while stock selection in the Information Technology and Materials sectors detracted from performance.
The views expressed herein are exclusively those of Grantham, Mayo, Van Otterloo & Co. LLC Management as of the date of this report and are subject to change. GMO disclaims any responsibility to update such views. They are not meant as investment advice.
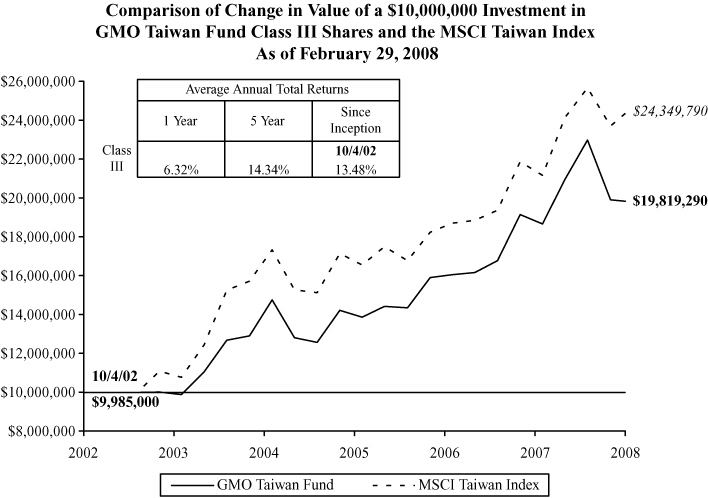
Performance data quoted represents past performance and is not indicative of future results. The investment return and principal value of an investment will fluctuate so that an investor's shares, when redeemed, may be worth more or less than their original cost. Current performance data may be lower or higher than the performance data provided herein. To obtain performance information to the most recent month-end, visit www.gmo.com. Performance shown is net of all fees after reimbursement from the Manager. Each performance figure assumes a purchase at the beginning and redemption at the end of the stated period and reflects a transaction fee of .15% on the purchase and .45% on the redemption. Transaction fees are retained by the Fund to cover trading costs. Returns would have been lower had certain expenses not been reimbursed during the periods shown and do not include the effect of taxes on distributions and redemptions. All information is unaudited.
GMO Taiwan Fund
(A Series of GMO Trust)
Investments Concentration Summary
February 29, 2008 (Unaudited)
| Asset Class Summary | % of Total Net Assets | ||||||
| Common Stocks | 97.0 | % | |||||
| Short-Term Investments | 2.1 | ||||||
| Other | 0.9 | ||||||
| 100.0 | % | ||||||
| Industry Sector Summary | % of Equity Investments | ||||||
| Information Technology | 47.6 | % | |||||
| Materials | 21.8 | ||||||
| Financials | 13.8 | ||||||
| Telecommunication Services | 9.0 | ||||||
| Industrials | 5.0 | ||||||
| Consumer Discretionary | 1.7 | ||||||
| Consumer Staples | 0.6 | ||||||
| Energy | 0.5 | ||||||
| 100.0 | % | ||||||
1
GMO Taiwan Fund
(A Series of GMO Trust)
Schedule of Investments
(showing percentage of total net assets)
February 29, 2008
| Shares | Description | Value ($) | |||||||||||||
| COMMON STOCKS — 97.0% | |||||||||||||||
| Taiwan — 97.0% | |||||||||||||||
| 6,337 | Altek Corp | 8,570 | |||||||||||||
| 9,000 | Arima Computer Corp * | 1,598 | |||||||||||||
| 1,886,452 | Asustek Computer Inc | 5,208,017 | |||||||||||||
| 4,862,000 | AU Optronics Corp | 9,273,720 | |||||||||||||
| 1,862,000 | Cathay Financial Holding Co Ltd | 4,665,311 | |||||||||||||
| 4,978,280 | Chi Mei Optoelectronics Corp | 6,548,012 | |||||||||||||
| 5,710,000 | China Bills Finance Corp * | 1,349,492 | |||||||||||||
| 8,094,153 | China Development Financial Holding Corp | 3,314,401 | |||||||||||||
| 4,530 | China Motor Corp | 3,391 | |||||||||||||
| 5,481,290 | China Steel Corp | 8,098,515 | |||||||||||||
| 6,409,000 | Chinatrust Financial Holding Co Ltd * | 5,729,706 | |||||||||||||
| 7,000 | Chunghwa Picture Tubes Ltd * | 2,343 | |||||||||||||
| 5,104,620 | Chunghwa Telecom Co Ltd | 12,691,755 | |||||||||||||
| 5,405 | Chungwa Telecom Co Ltd ADR | 132,639 | |||||||||||||
| 2,702,375 | Compal Electronics Inc | 2,435,599 | |||||||||||||
| 5,700 | Continental Engineering Corp | 3,877 | |||||||||||||
| 378,000 | Delta Electronics Inc | 1,075,129 | |||||||||||||
| 270,302 | DFI Inc | 631,527 | |||||||||||||
| 1,149,173 | Dimerco Express Taiwan Corp | 1,462,016 | |||||||||||||
| 824,728 | D-Link Corp | 1,310,257 | |||||||||||||
| 6,570 | Elite Semiconductor Memory Technology Inc | 10,678 | |||||||||||||
| 1,182,840 | Far Eastern Department Stores Ltd | 2,163,149 | |||||||||||||
| 3,673,025 | Far Eastern Textile Co Ltd | 5,984,233 | |||||||||||||
| 1,799,000 | Far Eastone Telecommunications Co Ltd | 2,512,106 | |||||||||||||
| 2,422,000 | First Financial Holding Co Ltd | 2,162,235 | |||||||||||||
| 3,334,169 | Formosa Chemicals & Fibre Co | 8,102,586 | |||||||||||||
| 366,077 | Formosa Petrochemical Corp | 1,012,942 | |||||||||||||
| 2,884,424 | Formosa Plastics Corp | 7,775,498 | |||||||||||||
| 444,000 | Foxconn Technology Co Ltd | 2,896,581 | |||||||||||||
| 3,442,000 | Fubon Financial Holding Co Ltd | 3,745,996 | |||||||||||||
| 2,000 | Gigabyte Technology Co Ltd | 1,248 | |||||||||||||
| 667,700 | Gloria Material Technology Corp | 1,000,097 | |||||||||||||
See accompanying notes to the financial statements.
2
GMO Taiwan Fund
(A Series of GMO Trust)
Schedule of Investments — (Continued)
(showing percentage of total net assets)
February 29, 2008
| Shares | Description | Value ($) | |||||||||||||
| Taiwan — continued | |||||||||||||||
| 2,262,000 | Hannstar Display Corp * | 972,993 | |||||||||||||
| 424,965 | High Tech Computer Corp | 8,772,856 | |||||||||||||
| 3,349,553 | Hon Hai Precision Industry Co Ltd | 19,983,835 | |||||||||||||
| 147,000 | Hotai Motor Company Ltd | 415,182 | |||||||||||||
| 379,620 | Innolux Display Corp | 1,047,506 | |||||||||||||
| 25,093 | Kinpo Electronics | 8,328 | |||||||||||||
| 1,300,555 | Les Enphants Co Ltd | 937,237 | |||||||||||||
| 1,550,052 | Lite-On Technology Corp | 2,117,422 | |||||||||||||
| 771,789 | MediaTek Inc | 8,656,010 | |||||||||||||
| 2,345,000 | Mega Financial Holdings Co Ltd | 1,674,489 | |||||||||||||
| 5,000 | Mercuries & Associates Ltd | 3,481 | |||||||||||||
| 1,038 | Micro-Star International Co Ltd | 826 | |||||||||||||
| 810 | Mosel Vitelic Inc | 614 | |||||||||||||
| 4,481,000 | Nan Ya Plastics Corp | 10,552,983 | |||||||||||||
| 1,000 | Nien Hsing Textile Co Ltd | 644 | |||||||||||||
| 559,000 | Novatek Microelectronics Corp Ltd | 1,967,018 | |||||||||||||
| 8,931 | Oriental Union Chemical | 8,686 | |||||||||||||
| 17,000 | Prodisc Technology Inc * | 2,795 | |||||||||||||
| 170 | Promos Technologies Inc | 44 | |||||||||||||
| 10,000 | Qisda Corp * | 9,319 | |||||||||||||
| 2,631 | Quanta Computer Inc | 3,449 | |||||||||||||
| 218,150 | Richtek Technology Corp | 1,924,936 | |||||||||||||
| 14,802 | Sampo Corp * | 3,174 | |||||||||||||
| 2,521 | Shinkong Synthetic Fibers * | 966 | |||||||||||||
| 2,088,738 | Siliconware Precision Industries Co | 3,403,815 | |||||||||||||
| 197 | Sino American Silicon Products Inc | 1,293 | |||||||||||||
| 2,670 | Systex Corp | 2,727 | |||||||||||||
| 5,689,889 | Taiwan Cement Corp | 10,122,720 | |||||||||||||
| 265,000 | Taiwan Fertilizer Co Ltd | 1,033,599 | |||||||||||||
| 2,250,539 | Taiwan Mobile Co Ltd | 3,812,718 | |||||||||||||
| 9,021,471 | Taiwan Semiconductor Manufacturing Co Ltd | 17,623,837 | |||||||||||||
| 85,118 | Taiwan Semiconductor Manufacturing Co Ltd Sponsored ADR | 829,049 | |||||||||||||
| 3,108 | Transcend Information Inc | 8,590 | |||||||||||||
| 7,607 | Tsann Kuen Enterprises Co Ltd * | 10,101 | |||||||||||||
See accompanying notes to the financial statements.
3
GMO Taiwan Fund
(A Series of GMO Trust)
Schedule of Investments — (Continued)
(showing percentage of total net assets)
February 29, 2008
| Shares / Par Value ($) | Description | Value ($) | |||||||||||||
| Taiwan — continued | |||||||||||||||
| 2,192 | TXC Corp | 3,227 | |||||||||||||
| 766,000 | U-Ming Marine Transport Co | 2,106,097 | |||||||||||||
| 748,900 | Unimicron Technology Corp | 1,130,031 | |||||||||||||
| 985,000 | Uni-President Enterprises Corp | 1,414,035 | |||||||||||||
| 16,000 | USI Corp | 9,836 | |||||||||||||
| 1,320,209 | Wan Hai Lines Ltd | 1,121,121 | |||||||||||||
| 4,209,620 | Waterland Financial Holdings | 1,608,752 | |||||||||||||
| 1,193,000 | Wintek Corp | 1,164,637 | |||||||||||||
| 1,677,000 | Wistron Corp | 2,769,342 | |||||||||||||
| 2,968,195 | Ya Hsin Industrial Co Ltd * (a) (b) | 960 | |||||||||||||
| 13,379 | Yang Ming Marine Transport | 8,824 | |||||||||||||
| 2,938 | Yieh Phui Enterprise | 1,341 | |||||||||||||
| 5,898,000 | Yuanta Financial Holding Co Ltd * | 5,170,761 | |||||||||||||
| 2,000 | Yungtay Engineering Co Ltd | 1,593 | |||||||||||||
| Total Taiwan | 213,737,023 | ||||||||||||||
| TOTAL COMMON STOCKS (COST $203,515,061) | 213,737,023 | ||||||||||||||
| SHORT-TERM INVESTMENTS — 2.1% | |||||||||||||||
| 4,700,000 | HSBC Bank USA Time Deposit, 2.94%, due 03/03/08 | 4,700,000 | |||||||||||||
| TOTAL SHORT-TERM INVESTMENTS (COST $4,700,000) | 4,700,000 | ||||||||||||||
| TOTAL INVESTMENTS — 99.1% (Cost $208,215,061) | 218,437,023 | ||||||||||||||
| Other Assets and Liabilities (net) — 0.9% | 1,922,107 | ||||||||||||||
| TOTAL NET ASSETS — 100.0% | $ | 220,359,130 | |||||||||||||
See accompanying notes to the financial statements.
4
GMO Taiwan Fund
(A Series of GMO Trust)
Schedule of Investments — (Continued)
February 29, 2008
Notes to Schedule of Investments:
ADR - American Depositary Receipt
* Non-income producing security.
(a) Bankrupt issuer.
(b) Security valued at fair value using methods determined in good faith by or at the direction of the Trustees of GMO Trust (Note 2).
As of February 29, 2008, 91.01% of the Net Assets of the Fund were valued using fair value prices based on models used by a third party vendor (Note 2).
See accompanying notes to the financial statements.
5
GMO Taiwan Fund
(A Series of GMO Trust)
Statement of Assets and Liabilities — February 29, 2008
| Assets: | |||||||
| Investments, at value (cost $208,215,061) (Note 2) | $ | 218,437,023 | |||||
| Cash | 248 | ||||||
| Foreign currency, at value (cost $2,298,253) (Note 2) | 2,326,164 | ||||||
| Receivable for investments sold | 104,056 | ||||||
| Interest receivable | 384 | ||||||
| Total assets | 220,867,875 | ||||||
| Liabilities: | |||||||
| Payable to affiliate for (Note 3): | |||||||
| Management fee | 132,415 | ||||||
| Shareholder service fee | 24,522 | ||||||
| Trustees and Chief Compliance Officer of GMO Trust fees | 210 | ||||||
| Accrued expenses | 351,598 | ||||||
| Total liabilities | 508,745 | ||||||
| Net assets | $ | 220,359,130 | |||||
| Net assets consist of: | |||||||
| Paid-in capital | $ | 203,790,228 | |||||
| Distributions in excess of net investment income | (134,693 | ) | |||||
| Accumulated net realized gain | 6,453,722 | ||||||
| Net unrealized appreciation | 10,249,873 | ||||||
| $ | 220,359,130 | ||||||
| Net assets attributable to: | |||||||
| Class III shares | $ | 220,359,130 | |||||
| Shares outstanding: | |||||||
| Class III | 9,828,062 | ||||||
| Net asset value per share: | |||||||
| Class III | $ | 22.42 | |||||
See accompanying notes to the financial statements.
6
GMO Taiwan Fund
(A Series of GMO Trust)
Statement of Operations — Year Ended February 29, 2008
| Investment Income: | |||||||
| Dividends (net of withholding taxes of $2,259,275) | $ | 9,326,615 | |||||
| Interest | 333,620 | ||||||
| Total investment income | 9,660,235 | ||||||
| Expenses: | |||||||
| Management fee (Note 3) | 2,395,136 | ||||||
| Shareholder service fee – Class III (Note 3) | 443,544 | ||||||
| Custodian and fund accounting agent fees | 840,211 | ||||||
| Transfer agent fees | 27,392 | ||||||
| Audit and tax fees | 77,416 | ||||||
| Legal fees | 6,405 | ||||||
| Trustees fees and related expenses (Note 3) | 8,940 | ||||||
| Miscellaneous | 4,147 | ||||||
| Total expenses | 3,803,191 | ||||||
| Expense reductions (Note 2) | (2,835 | ) | |||||
| Net expenses | 3,800,356 | ||||||
| Net investment income (loss) | 5,859,879 | ||||||
| Realized and unrealized gain (loss): | |||||||
| Net realized gain (loss) on: | |||||||
| Investments | 59,378,007 | ||||||
| Net increase from payments by affiliates (Note 3) | 56,687 | ||||||
| Foreign currency, forward contracts and foreign currency related transactions | 85,844 | ||||||
| Net realized gain (loss) | 59,520,538 | ||||||
| Change in net unrealized appreciation (depreciation) on: | |||||||
| Investments | (38,964,287 | ) | |||||
| Foreign currency, forward contracts and foreign currency related transactions | 27,906 | ||||||
| Net unrealized gain (loss) | (38,936,381 | ) | |||||
| Net realized and unrealized gain (loss) | 20,584,157 | ||||||
| Net increase (decrease) in net assets resulting from operations | $ | 26,444,036 | |||||
See accompanying notes to the financial statements.
7
GMO Taiwan Fund
(A Series of GMO Trust)
Statement of Changes in Net Assets
| Year Ended February 29, 2008 | Year Ended February 28, 2007 | ||||||||||
| Increase (decrease) in net assets: | |||||||||||
| Operations: | |||||||||||
| Net investment income (loss) | $ | 5,859,879 | $ | 4,701,705 | |||||||
| Net realized gain (loss) | 59,520,538 | 34,885,028 | |||||||||
| Change in net unrealized appreciation (depreciation) | (38,936,381 | ) | 9,642,412 | ||||||||
| Net increase (decrease) in net assets from operations | 26,444,036 | 49,229,145 | |||||||||
| Distributions to shareholders from: | |||||||||||
| Net investment income | |||||||||||
| Class III | (6,074,310 | ) | (4,289,930 | ) | |||||||
| Net realized gains | |||||||||||
| Class III | (75,886,885 | ) | (18,170,015 | ) | |||||||
| (81,961,195 | ) | (22,459,945 | ) | ||||||||
| Net share transactions (Note 7): | |||||||||||
| Class III | (41,624,038 | ) | (1,464,219 | ) | |||||||
| Purchase premiums and redemption fees (Notes 2 and 7): | |||||||||||
| Class III | 613,631 | 331,242 | |||||||||
| Total increase (decrease) in net assets resulting from net share transactions, purchase premiums and redemption fees | (41,010,407 | ) | (1,132,977 | ) | |||||||
| Total increase (decrease) in net assets | (96,527,566 | ) | 25,636,223 | ||||||||
| Net assets: | |||||||||||
| Beginning of period | 316,886,696 | 291,250,473 | |||||||||
| End of period (including distributions in excess of net investment income of $134,693 and $6,677, respectively) | $ | 220,359,130 | $ | 316,886,696 | |||||||
See accompanying notes to the financial statements.
8
GMO Taiwan Fund
(A Series of GMO Trust)
Financial Highlights
(For a Class III share outstanding throughout each period)
| Year Ended February 28/29, | |||||||||||||||||||||||
| 2008 | 2007 | 2006 | 2005 | 2004 | |||||||||||||||||||
| Net asset value, beginning of period | $ | 30.98 | $ | 28.34 | $ | 26.79 | $ | 29.67 | $ | 20.28 | |||||||||||||
| Income (loss) from investment operations: | |||||||||||||||||||||||
| Net investment income (loss)† | 0.61 | 0.46 | 0.52 | 0.13 | (0.10 | ) | |||||||||||||||||
| Net realized and unrealized gain (loss) | 1.50 | 4.32 | 1.91 | (1.45 | ) | 10.03 | |||||||||||||||||
| Total from investment operations | 2.11 | 4.78 | 2.43 | (1.32 | ) | 9.93 | |||||||||||||||||
| Less distributions to shareholders: | |||||||||||||||||||||||
| From net investment income | (0.85 | ) | (0.39 | ) | (0.59 | ) | — | (0.02 | ) | ||||||||||||||
| From net realized gains | (9.82 | ) | (1.75 | ) | (0.29 | ) | (1.56 | ) | (0.52 | ) | |||||||||||||
| Total distributions | (10.67 | ) | (2.14 | ) | (0.88 | ) | (1.56 | ) | (0.54 | ) | |||||||||||||
| Net asset value, end of period | $ | 22.42 | $ | 30.98 | $ | 28.34 | $ | 26.79 | $ | 29.67 | |||||||||||||
| Total Return(a) | 6.97 | %(b) | 17.12 | % | 9.13 | % | (3.82 | )% | 49.53 | % | |||||||||||||
| Ratios/Supplemental Data: | |||||||||||||||||||||||
| Net assets, end of period (000's) | $ | 220,359 | $ | 316,887 | $ | 291,250 | $ | 224,466 | $ | 181,313 | |||||||||||||
| Net expenses to average daily net assets | 1.29 | %(c) | 1.26 | % | 1.28 | % | 1.34 | % | 1.36 | % | |||||||||||||
| Net investment income to average daily net assets | 1.98 | % | 1.56 | % | 1.95 | % | 0.53 | % | (0.40 | )% | |||||||||||||
| Portfolio turnover rate | 94 | % | 41 | % | 31 | % | 88 | % | 86 | % | |||||||||||||
| Purchase premiums and redemption fees consisted of the following per share amounts:† | $ | 0.06 | $ | 0.03 | $ | 0.04 | $ | 0.05 | $ | 0.04 | |||||||||||||
(a) Calculation excludes purchase premiums and redemption fees which are borne by the shareholders and assumes the effect of reinvested distributions.
(b) The effect of losses in the amount of $56,687, resulting from compliance violations and the Manager's reimbursement of such losses, had no effect on the total return.
(c) The net expense ratio does not include the effect of expense reductions.
† Calculated using average shares outstanding throughout the period.
See accompanying notes to the financial statements.
9
GMO Taiwan Fund
(A Series of GMO Trust)
Notes to Financial Statements
February 29, 2008
1. Organization
GMO Taiwan Fund (the "Fund") is a series of GMO Trust (the "Trust"). The Fund is registered under the Investment Company Act of 1940, as amended, as an open-end, non-diversified management investment company. The Fund is advised and managed by Grantham, Mayo, Van Otterloo & Co. LLC (the "Manager" or "GMO"). The Trust was established as a Massachusetts business trust under the laws of the Commonwealth of Massachusetts on June 24, 1985. The Declaration of Trust permits the Trustees of the Trust ("Trustees") to create an unlimited number of series of shares ("Funds") and to subdivide Funds into classes.
The Fund seeks high total return. The Fund seeks to achieve its objective by outperforming the MSCI Taiwan Index. The Fund typically makes equity investments in companies doing business in, or otherwise tied economically to, Taiwan.
Shares of the Fund are not publicly offered and are principally available to other GMO funds and certain accredited investors.
2. Significant accounting policies
The following is a summary of significant accounting policies which are in conformity with accounting principles generally accepted in the United States of America ("U.S. GAAP") and which are consistently followed by the Fund in the preparation of its financial statements. The preparation of financial statements in accordance with U.S. GAAP requires management to make estimates and assumptions that affect the reported amounts and disclosures in the financial statements. Actual results could differ from those estimates. The accounting records of the Fund are maintained in U.S. dollars.
Portfolio valuation
Securities listed on a securities exchange for which market quotations are readily available are valued at the last sale price or official closing price on each business day, or if there is no such reported sale or official closing price, at the most recent quoted bid price. Unlisted securities for which market quotations are readily available are generally valued at the most recent quoted bid price. Short-term investments with a remaining maturity of sixty days or less are generally valued at amortized cost, which approximates fair value. Shares of investment funds are valued at their net asset value. Securities for which quotations are not readily available or whose values the Manager has determined to be unreliable are valued at fair value as determined in good faith by the Trustees or other persons acting at their direction pursuant to procedures approved by the Trustees. By its nature, a fair value price is a good faith est imate of the value of a security at a given point in time and may not reflect the value that would be realized if the security was sold and the differences could be material. Because many foreign equity securities markets and exchanges close prior to the close of the New York Stock Exchange ("NYSE"), closing prices for foreign securities in those markets or on those exchanges do not reflect the events that occur after that close but
10
GMO Taiwan Fund
(A Series of GMO Trust)
Notes to Financial Statements — (Continued)
February 29, 2008
before the close of the NYSE. As a result, foreign equity securities are generally valued using fair value prices supplied by a third party vendor based on models to the extent that these fair value prices are available.
Foreign currency translation
The market values of foreign securities, currency holdings and other assets and liabilities are translated to U.S. dollars based on the current exchange rates each business day. Income and expenses denominated in foreign currencies are translated at current exchange rates when accrued or incurred. The Fund does not isolate realized and unrealized gains and losses attributable to changes in exchange rates from gains and losses that arise from changes in the market value of investments. Such fluctuations are included with net realized and unrealized gain or loss on investments. Net realized gains and losses on foreign currency transactions represent gains and losses on disposition of currencies and forward currency contracts, currency gains and losses realized between the trade and settlement dates on securities transactions, and the difference between the amount of investment income and foreign withholding taxes recorded on the F und's accounting records and the U.S. dollar equivalent amounts actually received or paid.
Forward currency contracts
The Fund may enter into forward currency contracts including forward cross currency contracts. A forward currency contract is an agreement between two parties to buy and sell a currency at a set price on a future date. The market value of a forward currency contract fluctuates with changes in forward currency exchange rates. Forward currency contracts are marked to market daily using rates supplied by a quotation service and changes in value are recorded by the Fund as an unrealized gain or loss. Realized gains or losses equal to the difference between the value of the contract at the time it was opened and the value at the time it was closed are recorded upon delivery or receipt of the currency or, if a forward currency contract is offset by entering into another forward currency contract with the same broker, upon settlement of the net gain or loss. These contracts may involve market risk in excess of the unrealized gain or lo ss reflected in the Fund's Statement of Assets and Liabilities. In addition, the Fund could be exposed to risk if the counterparties are unable to meet the terms of the contracts or if there are movements in currency values that are unfavorable to the Fund. There were no forward currency contracts outstanding at the end of the period.
Futures contracts
The Fund may purchase and sell futures contracts. Upon entering into a futures contract, the Fund is required to deposit with the futures clearing broker an amount of cash, U.S. government and agency obligations, or other liquid assets in accordance with the initial margin requirements of the broker or exchange. In addition, the Fund maintains cash or securities in an amount that at least equals the net amount payable in the event the Fund must deliver the full amount of the contracts. Futures contracts are marked to market daily and an appropriate payable or receivable for the change in value ("variation margin") is recorded by the Fund. The payable or receivable is liquidated on the following business day. Gains or losses are recognized but not considered realized until the contracts expire or are closed. Futures
11
GMO Taiwan Fund
(A Series of GMO Trust)
Notes to Financial Statements — (Continued)
February 29, 2008
contracts involve, to varying degrees, risk of loss in excess of the variation margin disclosed in the Statement of Assets and Liabilities. Under certain circumstances, futures exchanges may establish daily limits on the amount that the price of a futures contract can vary from the previous day's settlement price, thereby effectively preventing liquidation of unfavorable positions. Losses may arise from changes in the value of the underlying instrument if the Fund is unable to liquidate a futures position due to an illiquid secondary market for the contracts or the imposition of price limits, or if counterparties do not perform under the contract terms. Futures contracts are generally valued at the settlement price established each day by the board of trade or exchange on which they are traded. There were no futures contracts outstanding at the end of the period.
Options
The Fund may write call and put options. Writing options increases the Fund's exposure to the underlying instrument by, in the case of a call option, obligating the Fund to sell the underlying instrument at a set price to the option-holder and, in the case of a put option, obligating the Fund to purchase the underlying instrument at a set price from the option-holder. When the Fund writes a call or put option, an amount equal to the premium received is recorded as a liability and subsequently marked to market to reflect the current value of the option written. Premiums received from writing options which expire are treated as realized gains. Premiums received from writing options which are exercised or closed are added to the proceeds or offset against the amounts paid on the underlying future, security or currency transaction to determine the realized gain or loss. The Fund as a writer of an option has no control over whether t he underlying future, security or currency may be sold (call) or purchased (put) and as a result bears the market risk of an unfavorable change in the price of the future, security or currency underlying the written option. In the event that the Fund writes uncovered call options (i.e. options for investments that the Fund does not own), it bears the risk of incurring substantial losses if the price of the underlying instrument increases during the term of the option. There is the risk the Fund may not be able to enter into a closing transaction because of an illiquid market. There were no open written option contracts during the period.
The Fund may also purchase put and call options. Purchasing options alters the Fund's exposure to the underlying instrument by, in the case of a call option, entitling the Fund to purchase the underlying instrument at a set price from the writer of the option and, in the case of a put option, entitling the Fund to sell the underlying instrument at a set price to the writer of the option. The Fund pays a premium as a cost for a purchased option disclosed in the Schedule of Investments which is subsequently marked to market to reflect the current value of the option. Premiums paid for purchasing options which expire are treated as realized losses. Premiums paid for purchasing options which are exercised or closed are added to the amounts paid or offset against the proceeds on the closing transaction to determine the realized gain or loss. The risk associated with purchasing put and call options is limited to the premium paid. Ther e were no purchased option contracts outstanding at the end of the period.
12
GMO Taiwan Fund
(A Series of GMO Trust)
Notes to Financial Statements — (Continued)
February 29, 2008
Exchange traded options are valued at the last sale price, or if no sale is reported, the last bid price for purchased options and the last ask price for written options. Options traded over-the-counter are valued using prices supplied by a primary pricing source chosen by the Manager.
Indexed securities
The Fund may invest in indexed securities where the redemption values and/or coupons are linked to the prices of a specific instrument or financial statistic. The Fund uses indexed securities to increase or decrease its exposure to different underlying instruments and to gain exposure to markets in which it may be difficult to invest through conventional securities. Indexed securities may be more volatile than their underlying instruments, but any loss is limited to the amount of the original investment. There were no indexed securities held by the Fund at the end of the period.
Swap agreements
The Fund may enter into swap agreements. A swap is an agreement to exchange the return generated by one instrument for the return generated by another instrument. Interest rate swap agreements involve the exchange by one party with another party of their respective commitments to pay or receive interest, e.g., an exchange of floating rate payments for fixed rate payments with respect to a notional amount of principal. Total return swap agreements involve a commitment by one party in the agreement to pay interest in exchange for a market-linked return, both based on notional amounts. To the extent the total return of the security or index underlying the transaction exceeds or falls short of the offsetting interest rate obligation, the party will receive a payment from or make a payment to the counterparty, respectively. Forward spread lock swap agreements involve commitments to pay or receive a settlement amount calculated as the difference between the swap spread and a fixed spread, multiplied by the notional amount times the duration of the swap rate. The swap spread is the difference between the benchmark swap rate (market rate) and the specific treasury rate. Variance swap agreements involve commitments to pay or receive a settlement amount calculated as the difference between the annualized realized variance of returns on the underlying price and a fixed quantity, also known as the variance strike, over a period of time. In connection with these agreements, cash or securities may be set aside as collateral by the Fund's custodian or brokers in accordance with the terms of the swap agreement. The Fund earns or pays interest on cash set aside as collateral.
Swaps are marked to market daily using models that incorporate quotations from market makers and the change in value, if any, is recorded as unrealized gain or loss in the Statement of Operations. Payments received or made on swap contracts are recorded as realized gain or loss in the Statement of Operations. Gains or losses are realized upon early termination of the swap agreements. These financial instruments are not actively traded on financial markets. The values assigned to these instruments are based upon the best available information and because of the uncertainty of the valuation, these values may differ significantly from the values that would have been realized had a ready market for these instruments existed, and the differences could be material. Entering into these agreements involves, to varying degrees, elements of credit, legal, market and documentation risk in excess of the amounts recognized in the
13
GMO Taiwan Fund
(A Series of GMO Trust)
Notes to Financial Statements — (Continued)
February 29, 2008
Statement of Assets and Liabilities. Such risks involve the possibility that there will be no liquid market for these agreements, that the counterparties to the agreements may default on their obligations to perform or disagree as to the meaning of contractual terms in the agreements, or that there may be unfavorable changes in interest rates or the price of the index or security underlying these transactions. There were no swap agreements outstanding at the end of the period.
Securities lending
The Fund may lend its securities to certain qualified broker-dealers. The loans are collateralized with cash or liquid securities with a market value at least equal to the market value of the securities on loan. As with other extensions of credit, the Fund may bear the risk of loss with respect to the investment of the collateral, the risk of delay in and/or inability to exercise its rights with respect to the collateral, and the risk of delay in recovery or loss of rights in the loaned securities should the borrower of the securities fail financially. If a loan is collateralized by U.S. government securities, the Fund receives a fee from the borrower. If a loan is collateralized by cash, the Fund typically invests the cash collateral for its own account in interest-bearing, short-term securities and pays a fee to the borrower that normally represents a portion of the Fund's earnings on the collateral. For the year ended Februar y 29, 2008, the Fund did not participate in securities lending.
Taxes and distributions
The Fund intends to qualify each tax year as a regulated investment company under Subchapter M of the Internal Revenue Code of 1986, as amended (the "Code"). The Fund intends to distribute substantially all of its net investment income and net realized short-term and long-term capital gains, if any, after giving effect to any available capital loss carryovers for U.S. federal income tax purposes. Therefore, no provision for U.S. federal income or excise tax is necessary. Taxes on foreign interest and dividend income are generally withheld in accordance with the applicable country's tax treaty with the United States. The foreign withholding rates applicable to a Fund's investments in certain foreign jurisdictions may be higher if a significant portion of the Fund is held by non-U.S. shareholders.
The Fund's policy is to declare and pay distributions from net investment income, if any, semiannually, and from net realized short-term and long-term capital gains, if any, at least annually. All distributions are paid in shares of the Fund, at net asset value, unless the shareholder elects to receive cash distributions. Distributions to shareholders are recorded by the Fund on the ex-dividend date.
Dividends received by shareholders of the Fund which are derived from foreign source income and foreign taxes paid by the Fund may be treated, to the extent allowable under the Code, as if received and paid by the shareholders of the Fund.
The Fund is currently subject to a Taiwanese security transaction tax of 0.3% of the transaction amount on equities, which must be paid by the Fund upon the sale or transfer of any portfolio securities subject to such tax.
14
GMO Taiwan Fund
(A Series of GMO Trust)
Notes to Financial Statements — (Continued)
February 29, 2008
Income and capital gain distributions are determined in accordance with U.S. federal income tax regulations, which may differ from U.S. GAAP. Certain capital accounts in the financial statements are periodically adjusted for permanent differences in order to reflect their tax character. These adjustments have no impact on net assets or net asset value per share. Temporary differences which arise from recognizing certain items of income, expense, gain or loss in different periods for financial statement and tax purposes will reverse at some time in the future. Distributions in excess of net investment income or net realized gains are temporary over distributions for financial statement purposes resulting from differences in the recognition or classification of income or distributions for financial statement and tax purposes.
U.S. GAAP and tax accounting differences primarily relate to passive foreign investment company transactions, losses on wash sale transactions and foreign currency transactions.
The following reclassification represents the amount necessary to report the stated components of net assets on a tax basis, excluding certain temporary differences, as of February 29, 2008. The financial highlights exclude these adjustments.
| Distributions In Excess Of Net Investment Income | Accumulated Net Realized Gain | Paid-in Capital | |||||||||
| $ | 86,415 | $ | (86,415 | ) | $ | — | |||||
The tax character of distributions declared to shareholders is as follows:
| 2/29/2008 | 2/28/2007 | ||||||||||
| Ordinary income (including any short-term capital gains) | $ | 16,985,992 | $ | 6,696,114 | |||||||
| Long-term capital gains | 64,975,203 | 15,763,831 | |||||||||
| Total distributions | $ | 81,961,195 | $ | 22,459,945 | |||||||
Distributions in excess of tax basis earnings and profits, if significant, are reported in the financial statements as a tax return of capital.
As of February 29, 2008, the components of distributable earnings on a tax basis consisted of the following:
| Undistributed long-term capital gain | $ | 7,921,022 | |||||
15
GMO Taiwan Fund
(A Series of GMO Trust)
Notes to Financial Statements — (Continued)
February 29, 2008
As of February 29, 2008, the approximate cost for U.S. federal income tax purposes and gross and net unrealized appreciation and depreciation in value of investments were as follows:
| Aggregate Cost | Gross Unrealized Appreciation | Gross Unrealized (Depreciation) | Net Unrealized Appreciation (Depreciation) | ||||||||||||
| $ | 209,817,054 | $ | 24,439,181 | $ | (15,819,212 | ) | $ | 8,619,969 | |||||||
Security transactions and related investment income
Security transactions are accounted for on trade date. Dividend income, net of applicable foreign withholding taxes, if any, is recorded on the ex-dividend date, or when the Fund is informed of the ex-dividend date, if later. Interest income is recorded on the accrual basis and is adjusted for the amortization of premiums and accretion of discounts. Interest income on inflation indexed securities, if any, is accrued daily based upon an inflation adjusted principal. Additionally, any increase or decrease in the principal or face amount of the securities adjusted for inflation is recorded as interest income or loss. Income is not recognized on securities for which collection is not expected. Non-cash dividends, if any, are recorded at the fair market value of the securities received. In determining the net gain or loss on securities sold, the cost of securities is determined on the identified cost basis.
Taiwanese companies typically declare dividends in the Fund's third calendar quarter of each year. As a result, the Fund receives substantially more dividend income in the first half of its fiscal year.
Dividend and interest income generated in Taiwan is subject to a 20% withholding tax. Stock dividends received (except those which have resulted from capitalization of capital surplus) are taxable at 20% of the par value of the stock dividends received.
Expenses
The majority of expenses of the Trust are directly identifiable to an individual fund. Expenses which are not readily identifiable to a specific fund are allocated taking into consideration, among other things, the nature and type of expense and the relative size of the funds.
Brown Brothers Harriman & Co. ("BBH") serves as custodian and fund accounting agent of the Fund. State Street Bank and Trust Company ("State Street") serves as transfer agent of the Fund. BBH and State Street's fees may be reduced by credits that are an earnings allowance calculated on the average daily cash balances the Fund maintains with each agent. Credit balances or expense reimbursements used to reduce fees, if any, are reported as a reduction of expenses in the Statement of Operations.
Purchases and redemptions of Fund shares
As of February 29, 2008, the premium on cash purchases of Fund shares was 0.15% of the amount invested. In the case of cash redemptions, the fee was 0.45% of the amount redeemed. If the Manager
16
GMO Taiwan Fund
(A Series of GMO Trust)
Notes to Financial Statements — (Continued)
February 29, 2008
determines that any portion of a cash purchase or redemption is offset by a corresponding cash redemption or purchase occurring on the same day, it will waive the purchase premium or redemption fee in the amount approximately equal to the fee with respect to that portion. In addition, the purchase premium or redemption fee charged by the Fund may be waived in extraordinary circumstances if the Fund will not incur transaction costs. All purchase premiums and redemption fees are paid to and recorded by the Fund as paid-in capital. The Manager will waive the purchase premium relating to the in-kind portion of a purchase transaction except to the extent of certain estimated or known transaction costs (e.g. stamp duties and transfer taxes) incurred by the Fund in connection with the transfer of the purchasing shareholder's securities to the Fund. In-kind redemption transactions are generally not subject to redemption fees except to t he extent those transactions include a cash component. However, when a substantial portion of a Fund is being redeemed, the Fund may assess estimated or known transaction costs. There is no premium for reinvested distributions.
Investment risks
Investments in emerging countries, such as Taiwan, present certain risks that are not inherent in many other securities. Many emerging countries present elements of political and/or economic instability. The securities markets of emerging countries are generally smaller and less developed than the securities markets of the U.S. and developed foreign markets. Further, countries may impose various types of foreign currency regulations or controls which may impede the Fund's ability to repatriate amounts it receives. The Fund may acquire interests in securities in anticipation of improving conditions in the related countries. These factors may result in significant volatility in the values of its holdings. The Taiwanese markets are relatively illiquid. Accordingly, the Fund may not be able to realize in an actual sale amounts approximating those used to value its holdings. The Fund may concentrate investments in the securities of a small number of issuers. As a result, the value of the Fund's shares can be expected to change in light of factors affecting those issuers and may fluctuate more widely than the value of shares of a portfolio that invests in a broader range of securities.
Recently issued accounting pronouncements
In June 2006, the Financial Accounting Standards Board ("FASB") issued FASB Interpretation No. 48, Accounting for Uncertainty in Income Taxes – an Interpretation of FASB Statement No. 109 ("FIN 48"). FIN 48 clarifies the accounting for uncertainty in income taxes recognized in accordance with FASB Statement No. 109, Accounting for Income Taxes. FIN 48 prescribes a recognition threshold and measurement attribute for a tax position taken or expected to be taken in the tax return that could impact the Fund's financial statements. It also provides guidance in relation to the Fund's financial statements on classification of tax benefits or liabilities, interest and penalties, accounting in interim periods, disclosure, and transition. FIN 48 is effective for fiscal years beginning after December 15, 2006 for registered investment companies. Management has evaluated the effects of applying the various provisions of FIN 48 and has determined that the adoption of FIN 48 does not have a material effect on the Fund's financial statements. The Fund's federal tax returns for the prior three fiscal years remain subject to examination by
17
GMO Taiwan Fund
(A Series of GMO Trust)
Notes to Financial Statements — (Continued)
February 29, 2008
the Internal Revenue Service. Management will continue to monitor the rules and guidance pertaining to FIN 48 and will take action if appropriate.
In September 2006, the FASB issued Statement of Financial Accounting Standards No. 157 ("FAS 157"), "Fair Value Measurements." FAS 157 defines fair value, establishes a framework for measuring fair value in accordance with generally accepted accounting principles and expands disclosure about fair value measurements. FAS 157 is effective for fiscal years beginning after November 15, 2007. Management is currently evaluating the impact the adoption of FAS 157 will have on the Fund's financial statement disclosures.
3. Fees and other transactions with affiliates
GMO earns a management fee paid monthly at the annual rate of 0.81% of average daily net assets. The Fund has adopted a Shareholder Service Plan under which the Fund pays GMO a shareholder service fee for client and shareholder service, reporting, and other support. Pursuant to the Shareholder Service Plan, the shareholder service fee is calculated based on average daily net assets at the annual rate of 0.15% for class III shares.
The Fund's portion of the fees paid by the Trust to the independent Trustees and the Chief Compliance Officer ("CCO") during the year ended February 29, 2008 was $8,480 and $1,114, respectively. The compensation and expenses of the CCO are included in miscellaneous expenses in the Statement of Operations. No remuneration was paid by the Fund to any other officer of the Trust.
The Manager compensated the Fund $56,687 in connection with a purchase of securities in excess of amounts permitted under the Fund's investment restrictions.
4. Purchases and sales of securities
Cost of purchase and proceeds from sales of securities, excluding short-term investments, for the year ended February 29, 2008 aggregated $267,938,877 and $381,850,473, respectively.
5. Guarantees
In the normal course of business the Fund enters into contracts with third-party service providers that contain a variety of representations and warranties and which provide general indemnifications. The Fund's maximum exposure under these arrangements is unknown, as this would involve future claims that may be made against the Fund that have not yet occurred. Based on experience, management is of the view that the risk of loss in connection with these potential indemnification obligations is remote; however, there can be no assurance that material liabilities related to such obligations will not arise in the future that could adversely impact the Fund.
18
GMO Taiwan Fund
(A Series of GMO Trust)
Notes to Financial Statements — (Continued)
February 29, 2008
6. Principal shareholders and related parties
As of February 29, 2008, 98.32% of the outstanding shares of the Fund were held by two shareholders, each holding in excess of 10% of the Fund's outstanding shares. No other shareholder owned in excess of 10% of the outstanding shares of the Fund. Investment activities of these shareholders may have a material effect on the Fund.
As of February 29, 2008, there were no shares held by related parties, and all of the Fund's shares were held by accounts for which the Manager has investment discretion.
7. Share transactions
The Declaration of Trust permits the Trustees to issue an unlimited number of shares of beneficial interest (without par value). Transactions in Fund shares were as follows:
| Year Ended February 29, 2008 | Year Ended February 28, 2007 | ||||||||||||||||||
| Class III: | Shares | Amount | Shares | Amount | |||||||||||||||
| Shares sold | 294,310 | $ | 9,579,509 | 1,278,137 | $ | 38,531,217 | |||||||||||||
| Shares issued to shareholders in reinvestment of distributions | 3,387,026 | 81,961,194 | 735,687 | 22,459,945 | |||||||||||||||
| Shares repurchased | (4,083,581 | ) | (133,164,741 | ) | (2,060,006 | ) | (62,455,381 | ) | |||||||||||
| Purchase premiums | — | 14,390 | — | 55,783 | |||||||||||||||
| Redemption fees | — | 599,241 | — | 275,459 | |||||||||||||||
| Net increase (decrease) | (402,245 | ) | $ | (41,010,407 | ) | (46,182 | ) | $ | (1,132,977 | ) | |||||||||
19
Report of Independent Registered Public Accounting Firm
To the Trustees of GMO Trust and the Shareholders of
GMO Taiwan Fund
In our opinion, the accompanying statement of assets and liabilities, including the schedule of investments, and the related statements of operations and of changes in net assets and the financial highlights present fairly, in all material respects, the financial position of GMO Taiwan Fund (the "Fund") at February 29, 2008, the results of its operations for the year then ended, the changes in its net assets for each of the two years in the period then ended and the financial highlights for each of the five years in the period then ended, in conformity with accounting principles generally accepted in the United States of America. These financial statements and financial highlights (hereafter referred to as "financial statements") are the responsibility of the Fund's management; our responsibility is to express an opinion on these financial statements based on our audits. We conducted our audits of these financial statements in a ccordance with the standards of the Public Company Accounting Oversight Board (United States). Those standards require that we plan and perform the audit to obtain reasonable assurance about whether the financial statements are free of material misstatement. An audit includes examining, on a test basis, evidence supporting the amounts and disclosures in the financial statements, assessing the accounting principles used and significant estimates made by management, and evaluating the overall financial statement presentation. We believe that our audits, which included confirmation of securities at February 29, 2008 by correspondence with the custodian, provide a reasonable basis for our opinion.
PricewaterhouseCoopers LLP
Boston, Massachusetts
April 29, 2008
20
GMO Taiwan Fund
(A Series of GMO Trust)
Fund Expenses
February 29, 2008 (Unaudited)
Expense Examples: The following information is in relation to expenses for the six month period ended February 29, 2008.
As a shareholder of the Fund, you may incur two types of costs: (1) transaction costs, including purchase premiums and redemption fees; and (2) ongoing costs, including management fees, shareholder service fees, and other Fund expenses. This example is intended to help you understand your ongoing costs (in dollars) of investing in the Fund and to compare these costs with the ongoing costs of investing in other mutual funds.
These examples are based on an investment of $1,000 invested at the beginning of the period and held for the entire period, September 1, 2007 through February 29, 2008.
Actual Expenses
The first line of the table below provides information about actual account values and actual expenses. You may use the information in this line, together with the amount you invested, to estimate the expenses that you paid over the period. Simply divide your account value by $1,000 (for example, a $10,000,000 account value divided by $1,000 = 10,000), then multiply the result by the number in the first line under the heading entitled "Net Expense Incurred" to estimate the expenses you paid on your account during this period.
Hypothetical Example for Comparison Purposes
The second line of the table below provides information about hypothetical account values and hypothetical expenses based on the Fund's actual expense ratio and an assumed rate of return of 5% per year before expenses, which is not the Fund's actual return. The hypothetical account values and expenses may not be used to estimate the actual ending account balance or expenses you paid for the period. You may use this information to compare the ongoing costs of investing in the Fund with other funds. To do so, compare this 5% hypothetical example with the 5% hypothetical examples that appear in the shareholder reports of other funds.
Please note that the expenses shown in the table are meant to highlight your ongoing costs only and do not reflect any transactional costs, such as purchase premiums and redemption fees. Therefore, the second line of the table is useful in comparing ongoing costs only, and will not help you determine the relative total costs of owning different funds. In addition, if these transactional costs were included, your costs would have been higher.
| Annualized Net Expense Ratio | Beginning Account Value | Ending Account Value | Net Expense Incurred* | ||||||||||||||||
| Class III | |||||||||||||||||||
| 1) Actual | 1.32 | % | $ | 1,000.00 | $ | 916.10 | $ | 6.29 | |||||||||||
| 2) Hypothetical | 1.32 | % | $ | 1,000.00 | $ | 1,018.30 | $ | 6.62 | |||||||||||
* Expenses are calculated using the Class's annualized net expense ratio for the six months ended February 29, 2008, multiplied by the average account value over the period, multiplied by 182 days in the period, divided by 366 days in the year.
21
GMO Taiwan Fund
(A Series of GMO Trust)
Tax Information for the Tax Year Ended February 29, 2008 (Unaudited)
The Fund will notify shareholders of amounts for use in preparing 2008 income tax forms in January 2009.
The Fund's distributions to shareholders include $64,975,203 from long-term capital gains.
During the year ended February 29, 2008, the Fund paid foreign taxes of $2,259,103 and recognized foreign source income of $11,585,890.
The Fund hereby designates as qualified short-term capital gain with respect to its taxable year ended February 29, 2008, $11,002,380 or if determined to be different, the qualified short-term gain of such year.
22
GMO Taiwan Fund
(A Series of GMO Trust)
Note Concerning Distributions (Unaudited)
The Fund previously reported estimated sources of any dividends, short-term capital gains, and long-term capital gains distributions paid on a per share basis. Pursuant to Rule 19a-1(e) of the Investment Company Act, the following serves as a correction of such estimates. 12% of distributions to shareholders declared from net investment income during the Fund's fiscal year were reclassified to distributions from net realized gains and are reflected as such in the Statement of Changes in Net Assets.
23
Trustees and Officers (Unaudited)
The following tables list the Trust's Trustees and Officers as of the date of this report; their address and date of birth ("DOB"); their position with the Trust; the length of time holding that position with the Trust; their principal occupation(s) during the past five years; the number of portfolios in the fund complex they oversee; and other directorships they hold in companies subject to registration or reporting requirements of the Securities Exchange Act of 1934 (generally called "public companies") or in registered investment companies. The Trust's Statement of Additional Information ("SAI") includes additional information about the Trust's trustees, including changes subsequent to the date of the report. The SAI is available, without charge, upon request by writing GMO, c/o GMO Trust, 40 Rowes Wharf, Boston, MA 02110.
Independent Trustees:
| Name, Address, and DOB | Position(s) Held with Trust | Term of Office1 and Length of Time Served | Principal Occupation(s) During Past Five Years | Number of Portfolios in Fund Complex Overseen by Trustee | Other Directorships Held by Trustee | ||||||||||||||||||
| Donald W. Glazer, Esq. c/o GMO Trust 40 Rowes Wharf Boston, MA 02110 DOB: 07/26/1944 | Chairman of the Board of Trustees | Chairman of the Board of Trustees since March 2005; Lead Independent Trustee (September 2004 – March 2005); Trustee since December 2000. | Consultant – Law and Business2; Vice Chair (since 2002) and Secretary, Provant, Inc. (provider of personnel performance improvement services and training products); Author of Legal Treatises. | 47 | None. | ||||||||||||||||||
1 Each Trustee is elected to serve during the continued lifetime of the Trust until he/she dies, resigns or is removed, or if sooner, until the next meeting of Shareholders called for the purpose of electing Trustees and until the election and qualification of his/her successor.
2 As part of Mr. Glazer's work as a consultant, he provides part-time consulting services to Goodwin Procter LLP ("Goodwin"). Goodwin has provided legal services to Renewable Resources, LLC, an affiliate of GMO; GMO, in connection with its relationship with Renewable Resources; and funds managed by Renewable Resources. Mr. Glazer has represented that he has no financial interest in, and is not involved in the provision of, such legal services. In the calendar years ended December 31, 2006 and December 31, 2007, these entities paid $825,738 and $291,721 respectively, in legal fees and disbursements to Goodwin.
24
Independent Trustees — (Continued)
| Name, Address, and DOB | Position(s) Held with Trust | Term of Office1 and Length of Time Served | Principal Occupation(s) During Past Five Years | Number of Portfolios in Fund Complex Overseen by Trustee | Other Directorships Held by Trustee | ||||||||||||||||||
| Jay O. Light c/o GMO Trust 40 Rowes Wharf Boston, MA 02110 DOB: 10/03/1941 | Trustee | Since May 1996. | Dean (since April 2006), Acting Dean (August 2005 – April 2006), Senior Associate Dean (1998 – 2005), and Professor of Business Administration, Harvard Business School. | 47 | Director of Harvard Management Company, Inc.3 and Verde, Inc.; Director of Partners HealthCare System, Inc. and Chair of its Investment Committee.4 | ||||||||||||||||||
| W. Nicholas Thorndike c/o GMO Trust 40 Rowes Wharf Boston, MA 02110 DOB: 03/28/1933 | Trustee | Since March 2005. | Director or trustee of various corporations and charitable organizations, including Courier Corporation (a book publisher and manufacturer) (July 1989 – present); Putnam Funds (December 1992 – June 2004); and Providence Journal (a newspaper publisher) (December 1986 – December 2003). | 47 | Director of Courier Corporation (a book publisher and manufacturer); Member of the Investment Committee of Partners HealthCare System, Inc.4 | ||||||||||||||||||
1 Each Trustee is elected to serve during the continued lifetime of the Trust until he/she dies, resigns or is removed, or if sooner, until the next meeting of Shareholders called for the purpose of electing Trustees and until the election and qualification of his/her successor.
3 Harvard Management Company, Inc. is a client of the Manager.
4 Partners HealthCare System, Inc. is a client of the Manager.
25
Principal Officers:
| Name, Address, and DOB | Position(s) Held with Trust | Term of Office5 and Length of Time Served | Principal Occupation(s) During Past Five Years | ||||||||||||
| Scott Eston c/o GMO Trust 40 Rowes Wharf Boston, MA 02110 DOB: 01/20/1956 | President and Chief Executive Officer | President and Chief Executive Officer since October 2002; Chief Financial Officer, November 2006 – February 2007. | Chief Financial Officer, Chief Operating Officer and Member, Grantham, Mayo, Van Otterloo & Co. LLC. | ||||||||||||
| Sheppard N. Burnett c/o GMO Trust 40 Rowes Wharf Boston, MA 02110 DOB: 10/24/1968 | Treasurer and Chief Financial Officer | Chief Financial Officer since March 2007; Treasurer since November 2006; Assistant Treasurer, September 2004 – November 2006. | Fund Administration Staff, Grantham, Mayo, Van Otterloo & Co. LLC (June 2004 – present); Vice President, Director of Tax, Columbia Management Group (2002 – 2004). | ||||||||||||
| Brent C. Arvidson c/o GMO Trust 40 Rowes Wharf Boston, MA 02110 DOB: 06/26/1969 | Assistant Treasurer | Since August 1998. | Senior Fund Administrator, Grantham, Mayo, Van Otterloo & Co. LLC. | ||||||||||||
| John L. Nasrah c/o GMO Trust 40 Rowes Wharf Boston, MA 02110 DOB: 05/27/1977 | Assistant Treasurer | Since March 2007. | Fund Administrator, Grantham, Mayo, Van Otterloo & Co. LLC (September 2004 – present); Tax Analyst, Bain & Company, Inc (June 2003 – September 2004); Senior Tax Associate, PricewaterhouseCoopers LLP (2001 – 2003). | ||||||||||||
| Mahmoodur Rahman c/o GMO Trust 40 Rowes Wharf Boston, MA 02110 DOB: 11/30/1967 | Assistant Treasurer | Since September 2007. | Fund Administrator, Grantham, Mayo, Van Otterloo & Co. (April 2007 – present); Vice President and Senior Tax Manager, Massachusetts Financial Services Company (January 2000 – April 2007). | ||||||||||||
5 Officers are elected to hold such office until their successor is elected and qualified to carry out the duties and responsibilities of their office, or until he or she resigns or is removed from office.
26
Principal Officers — (Continued)
| Name, Address, and DOB | Position(s) Held with Trust | Term of Office5 and Length of Time Served | Principal Occupation(s) During Past Five Years | ||||||||||||
| Michael E. Gillespie c/o GMO Trust 40 Rowes Wharf Boston, MA 02110 DOB: 02/18/1958 | Chief Compliance Officer | Since March 2005. | Vice President of Compliance (June 2004 – February 2005) and Director of Domestic Compliance (March 2002 – June 2004), Fidelity Investments; Vice President and Senior Counsel, State Street Bank and Trust Company (May 1998 – March 2002). | ||||||||||||
| Jason B. Harrison c/o GMO Trust 40 Rowes Wharf Boston, MA 02110 DOB: 01/29/1977 | Vice President and Clerk | Vice President since November 2006; Clerk since March 2006. | Legal Counsel, Grantham, Mayo, Van Otterloo & Co. LLC (since February 2006) and Attorney, Ropes & Gray LLP (September 2002 – February 2006). | ||||||||||||
| David L. Bohan c/o GMO Trust 40 Rowes Wharf Boston, MA 02110 DOB: 06/21/1964 | Vice President and Assistant Clerk | Vice President since March 2005; Assistant Clerk since March 2006. | Legal Counsel, Grantham, Mayo, Van Otterloo & Co. LLC (September 2003 – present); Attorney, Goodwin Procter LLP (September 1996 – September 2003). | ||||||||||||
| Gregory L. Pottle c/o GMO Trust 40 Rowes Wharf Boston, MA 02110 DOB: 07/09/1971 | Vice President and Assistant Clerk | Since November 2006. | Legal Counsel, Grantham, Mayo, Van Otterloo & Co. LLC. | ||||||||||||
| Anne K. Trinque c/o GMO Trust 40 Rowes Wharf Boston, MA 02110 DOB: 04/15/1978 | Vice President and Assistant Clerk | Since September 2007. | Legal Counsel, Grantham, Mayo, Van Otterloo & Co. LLC (since January 2007); Attorney, Goodwin Procter LLP (September 2003 – January 2007). | ||||||||||||
| Cheryl Wakeham c/o GMO Trust 40 Rowes Wharf Boston, MA 02110 DOB: 10/29/1958 | Anti-Money Laundering Officer | Since December 2004. | Manager, Client Service Administration, Grantham, Mayo, Van Otterloo & Co. LLC. | ||||||||||||
5 Officers are elected to hold such office until their successor is elected and qualified to carry out the duties and responsibilities of their office, or until he or she resigns or is removed from office.
27
GMO Emerging Markets Opportunities Fund
(formerly GMO Emerging Markets Quality Fund)
(A Series of GMO Trust)
Annual Report
February 29, 2008
For a free copy of the Fund's proxy voting guidelines, shareholders may call 1-617-346-7646 (collect), visit our website at www.gmo.com, or visit the Securities and Exchange Commission's website at www.sec.gov. Information regarding how the Fund voted proxies relating to portfolio securities during the most recent 12-month period ended June 30 is available on our website at www.gmo.com, or on the Securities and Exchange Commission's website at www.sec.gov.
The Fund files its complete schedule of portfolio holdings with the Securities and Exchange Commission for the first and third quarter of each fiscal year on Form N-Q, which is available on the Commission's website at www.sec.gov. The Fund's Form N-Q may be reviewed and copied at the Commission's Public Reference Room in Washington, D.C. Information on the operation of the Public Reference Room may be obtained by calling 1-800-SEC-0330. The Fund has a policy with respect to disclosure of portfolio holdings under which it may also make available on GMO's website (www.gmo.com) a complete schedule of portfolio holdings.
This report is prepared for the general information of shareholders. It is authorized for distribution to prospective investors only when preceded or accompanied by a prospectus for the GMO Trust.
GMO Emerging Markets Opportunities Fund
(formerly GMO Emerging Markets Quality Fund)
(A Series of GMO Trust)
Portfolio Management
Day-to-day management of the Fund's portfolio is the responsibility of the Emerging Markets Division at Grantham, Mayo, Van Otterloo & Co. LLC.
Management Discussion and Analysis of Fund Performance
The Class III shares of the GMO Emerging Markets Opportunities Fund (formerly GMO Emerging Markets Quality Fund) returned +26.7% for the fiscal year ended February 29, 2008, as compared to +32.9% for the S&P/IFC Investable Composite Index. Consistent with the Fund's investment objectives and policies, the Fund was invested substantially in emerging markets equities.
Country selection detracted 1.0% from performance during the period. The Fund did not invest in the smallest countries in the index like Egypt, Morocco, and Peru. Consequently, the Fund slightly overweighted the largest countries in the index. Peru and Egypt outperformed the benchmark. Overweights in Korea and Taiwan detracted from performance, while an overweight in Brazil contributed to performance.
Stock selection detracted 5.2% from performance. Quality was the only driver of stock selection. Stock selection added to performance in Brazil where quality fared well, while it detracted from performance in India, Indonesia, South Korea, Mexico, and South Africa, where quality underperformed.
The views expressed herein are exclusively those of Grantham, Mayo, Van Otterloo & Co. LLC Management as of the date of this report and are subject to change. GMO disclaims any responsibility to update such views. They are not meant as investment advice.
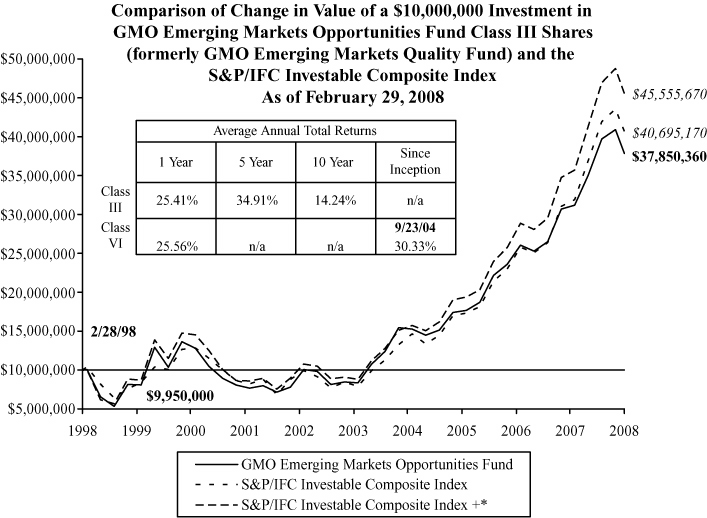
Performance data quoted represents past performance and is not indicative of future results. The investment return and principal value of an investment will fluctuate so that an investor's shares, when redeemed, may be worth more or less than their original cost. Current performance data may be lower or higher than the performance data provided herein. To obtain performance information to the most recent month-end, visit www.gmo.com. Performance shown is net of all fees after reimbursement from the Manager. Each performance figure assumes a purchase at the beginning and redemption at the end of the stated period and reflects a transaction fee of .50% on the purchase and .50% on the redemption. Transaction fees are retained by the Fund to cover trading costs. Returns would have been lower had certain expenses not been reimbursed during the periods shown and do not include the effect oftaxes on distributions and redemptions. All information is unaudited. Performance for Class VI will vary due to different fees.
† The S&P/IFC Investable Composite Index + represents the GMO Asia 7 Index prior to 9/22/04 and the S&P/IFC Investable Composite Index thereafter.
GMO Emerging Markets Opportunities Fund
(formerly GMO Emerging Markets Quality Fund)
(A Series of GMO Trust)
Investments Concentration Summary
February 29, 2008 (Unaudited)
| Asset Class Summary | % of Total Net Assets | ||||||
| Common Stocks | 87.9 | % | |||||
| Preferred Stocks | 9.9 | ||||||
| Rights and Warrants | 0.0 | ||||||
| Short-Term Investments | 1.9 | ||||||
| Other | 0.3 | ||||||
| 100.0 | % | ||||||
| Country Summary | % of Equity Investments | ||||||
| China | 15.4 | % | |||||
| Brazil | 15.2 | ||||||
| South Korea | 14.1 | ||||||
| Taiwan | 11.7 | ||||||
| Russia | 11.0 | ||||||
| India | 9.0 | ||||||
| South Africa | 6.2 | ||||||
| Mexico | 5.1 | ||||||
| Malaysia | 2.6 | ||||||
| Israel | 2.6 | ||||||
| Poland | 1.7 | ||||||
| Indonesia | 1.4 | ||||||
| Chile | 1.3 | ||||||
| Thailand | 1.0 | ||||||
| Philippines | 0.5 | ||||||
| Argentina | 0.5 | ||||||
| Hungary | 0.5 | ||||||
| Czech Republic | 0.2 | ||||||
| 100.0 | % | ||||||
1
GMO Emerging Markets Opportunities Fund
(formerly GMO Emerging Markets Quality Fund)
(A Series of GMO Trust)
Investments Concentration Summary — (Continued)
February 29, 2008 (Unaudited)
| Industry Sector Summary | % of Equity Investments | ||||||
| Information Technology | 19.7 | % | |||||
| Energy | 18.4 | ||||||
| Financials | 16.3 | ||||||
| Telecommunication Services | 15.8 | ||||||
| Materials | 12.7 | ||||||
| Consumer Staples | 5.6 | ||||||
| Industrials | 4.2 | ||||||
| Consumer Discretionary | 4.0 | ||||||
| Health Care | 2.3 | ||||||
| Utilities | 1.0 | ||||||
| 100.0 | % | ||||||
2
GMO Emerging Markets Opportunities Fund
(formerly GMO Emerging Markets Quality Fund)
(A Series of GMO Trust)
Schedule of Investments
(showing percentage of total net assets)
February 29, 2008
| Shares | Description | Value ($) | |||||||||||||
| COMMON STOCKS — 87.9% | |||||||||||||||
| Argentina — 0.5% | |||||||||||||||
| 125,000 | Tenaris SA ADR | 5,556,250 | |||||||||||||
| Brazil — 5.1% | |||||||||||||||
| 401,700 | Companhia Vale do Rio Doce | 13,933,961 | |||||||||||||
| 93,420 | Companhia Vale do Rio Doce ADR | 3,254,753 | |||||||||||||
| 657,900 | Petroleo Brasileiro SA (Petrobras) | 38,008,888 | |||||||||||||
| Total Brazil | 55,197,602 | ||||||||||||||
| Chile — 1.3% | |||||||||||||||
| 43,235 | Banco de Chile ADR | 2,445,804 | |||||||||||||
| 82,906 | Banco Santander Chile SA ADR | 4,291,215 | |||||||||||||
| 82,300 | Compania Cervecerias Unidas ADR | 2,734,006 | |||||||||||||
| 336,000 | Lan Airlines SA Sponsored ADR | 4,495,680 | |||||||||||||
| Total Chile | 13,966,705 | ||||||||||||||
| China — 15.1% | |||||||||||||||
| 806,420 | Angang Steel Co Ltd Class H | 2,109,607 | |||||||||||||
| 21,078,000 | China Construction Bank Class H | 15,970,012 | |||||||||||||
| 430,000 | China Mengniu Dairy Co Ltd | 1,159,850 | |||||||||||||
| 1,334,171 | China Merchants Holdings International Co Ltd | 7,161,364 | |||||||||||||
| 3,450,200 | China Mobile Ltd | 51,660,330 | |||||||||||||
| 2,708,000 | China Petroleum & Chemical Corp Class H | 2,959,579 | |||||||||||||
| 746,000 | China Resources Enterprise Ltd | 2,648,423 | |||||||||||||
| 944,000 | China Shenhua Energy Co Ltd Class H | 4,808,367 | |||||||||||||
| 2,906,000 | China Shipping Container Lines Co Ltd Class H | 1,288,659 | |||||||||||||
| 1,022,000 | China Shipping Development Co Ltd Class H | 3,161,012 | |||||||||||||
| 3,514,000 | China Telecom Corp Ltd Class H | 2,587,958 | |||||||||||||
| 4,196,000 | CNOOC Ltd | 6,968,510 | |||||||||||||
| 1,606,000 | Cosco Pacific Ltd | 3,463,964 | |||||||||||||
| 2,800,000 | Datang International Power Generation Co Ltd | 1,878,493 | |||||||||||||
| 9,268,592 | Denway Motors Ltd | 4,684,979 | |||||||||||||
See accompanying notes to the financial statements.
3
GMO Emerging Markets Opportunities Fund
(formerly GMO Emerging Markets Quality Fund)
(A Series of GMO Trust)
Schedule of Investments — (Continued)
(showing percentage of total net assets)
February 29, 2008
| Shares | Description | Value ($) | |||||||||||||
| China — continued | |||||||||||||||
| 2,778,000 | Dongfeng Motor Group Co Ltd | 1,693,940 | |||||||||||||
| 404,000 | Guangzhou R&F Properties Co Ltd Class H | 1,224,253 | |||||||||||||
| 3,644,000 | Huaneng Power International Inc Class H | 2,977,465 | |||||||||||||
| 12,828,000 | Industrial and Commercial Bank of China Ltd Class H | 8,899,463 | |||||||||||||
| 108,000 | Netease.Com Inc ADR * (a) | 2,316,600 | |||||||||||||
| 12,322,842 | PetroChina Co Ltd Class H | 18,037,912 | |||||||||||||
| 399,000 | Ping An Insurance (Group) Co of China Ltd Class H | 3,022,018 | |||||||||||||
| 98,470 | Sina.com * | 4,077,643 | |||||||||||||
| 56,000 | Sohu.Com, Inc. * | 2,524,480 | |||||||||||||
| 80,200 | Suntech Power Holdings Co Ltd ADR * | 2,981,034 | |||||||||||||
| 1,357,600 | Yanzhou Coal Mining Co Ltd Class H | 2,214,752 | |||||||||||||
| 1,670,000 | Zhejiang Expressway Co Ltd Class H | 1,639,653 | |||||||||||||
| Total China | 164,120,320 | ||||||||||||||
| Czech Republic — 0.1% | |||||||||||||||
| 22,300 | CEZ AS | 1,643,200 | |||||||||||||
| Hungary — 0.4% | |||||||||||||||
| 120,760 | OTP Bank Nyrt | 4,879,595 | |||||||||||||
| India — 8.8% | |||||||||||||||
| 229,350 | Bharti Airtel Ltd * | 4,674,747 | |||||||||||||
| 285,500 | Cipla Ltd | 1,461,044 | |||||||||||||
| 105,000 | GAIL India Ltd | 1,093,031 | |||||||||||||
| 10,400 | GAIL India Ltd GDR | 655,200 | |||||||||||||
| 78,140 | HDFC Bank Ltd | 2,798,972 | |||||||||||||
| 86,850 | Hero Honda Motors Ltd | 1,631,090 | |||||||||||||
| 1,164,770 | Hindustan Lever | 6,544,078 | |||||||||||||
| 189,906 | Housing Development Finance Corp Ltd | 13,059,923 | |||||||||||||
| 99,700 | ICICI Bank Ltd | 2,657,213 | |||||||||||||
| 633,800 | Infosys Technologies Ltd | 24,194,672 | |||||||||||||
| 1,322,390 | ITC Ltd | 6,601,487 | |||||||||||||
| 23,700 | Larsen & Toubro Ltd | 2,056,653 | |||||||||||||
| 191,970 | Oil & Natural Gas Corp Ltd | 4,800,668 | |||||||||||||
See accompanying notes to the financial statements.
4
GMO Emerging Markets Opportunities Fund
(formerly GMO Emerging Markets Quality Fund)
(A Series of GMO Trust)
Schedule of Investments — (Continued)
(showing percentage of total net assets)
February 29, 2008
| Shares | Description | Value ($) | |||||||||||||
| India — continued | |||||||||||||||
| 61,500 | Reliance Industries Ltd | 3,749,454 | |||||||||||||
| 474,400 | Satyam Computer Services Ltd | 5,103,785 | |||||||||||||
| 389,660 | Steel Authority of India Ltd | 2,434,557 | |||||||||||||
| 244,000 | Suzlon Energy Ltd | 1,693,556 | |||||||||||||
| 267,780 | Tata Consultancy Services Ltd | 5,807,835 | |||||||||||||
| 81,758 | Tata Motors Ltd | 1,409,357 | |||||||||||||
| 345,300 | Wipro Ltd | 3,721,615 | |||||||||||||
| Total India | 96,148,937 | ||||||||||||||
| Indonesia — 1.3% | |||||||||||||||
| 1,316,585 | Astra International Tbk PT | 3,950,421 | |||||||||||||
| 2,043,500 | Bank Rakyat Indonesia | 1,586,345 | |||||||||||||
| 7,312,000 | Telekomunikasi Indonesia Tbk PT | 7,740,171 | |||||||||||||
| 25,200 | Telekomunikasi Indonesia Tbk PT ADR | 1,075,032 | |||||||||||||
| Total Indonesia | 14,351,969 | ||||||||||||||
| Israel — 2.5% | |||||||||||||||
| 190,100 | Check Point Software Technologies Ltd * | 4,166,992 | |||||||||||||
| 56,900 | Teva Pharmaceutical Industries Ltd | 2,778,640 | |||||||||||||
| 415,600 | Teva Pharmaceutical Industries Ltd Sponsored ADR | 20,393,492 | |||||||||||||
| Total Israel | 27,339,124 | ||||||||||||||
| Malaysia — 2.6% | |||||||||||||||
| 103,000 | British American Tobacco Berhad | 1,379,504 | |||||||||||||
| 370,100 | Digi.com Berhad | 2,750,499 | |||||||||||||
| 1,915,000 | Genting Berhad | 4,050,904 | |||||||||||||
| 1,942,750 | IOI Corp Berhad | 4,832,032 | |||||||||||||
| 1,590,500 | Malayan Banking Berhad | 4,489,596 | |||||||||||||
| 917,400 | MISC Berhad (Foreign Registered) | 2,510,652 | |||||||||||||
| 555,500 | Public Bank Berhad | 1,814,726 | |||||||||||||
| 2,928,000 | Resorts World Berhad | 3,386,471 | |||||||||||||
| 281,400 | Tanjong Plc | 1,398,033 | |||||||||||||
| 1,821,024 | YTL Power International Berhad | 1,434,131 | |||||||||||||
| Total Malaysia | 28,046,548 | ||||||||||||||
See accompanying notes to the financial statements.
5
GMO Emerging Markets Opportunities Fund
(formerly GMO Emerging Markets Quality Fund)
(A Series of GMO Trust)
Schedule of Investments — (Continued)
(showing percentage of total net assets)
February 29, 2008
| Shares | Description | Value ($) | |||||||||||||
| Mexico — 5.0% | |||||||||||||||
| 106,600 | America Movil SA de CV Class L ADR | 6,445,036 | |||||||||||||
| 1,005,705 | America Movil SAB de CV Class L | 3,040,591 | |||||||||||||
| 1,820,273 | Cemex SA de CV CPO * | 4,996,828 | |||||||||||||
| 507,900 | Corporacion GEO SA de CV Series B * | 1,621,866 | |||||||||||||
| 924,000 | Fomento Economico Mexicano SA de CV | 3,701,176 | |||||||||||||
| 1,157,000 | Grupo Financiero Banorte SA de CV | 4,807,330 | |||||||||||||
| 487,400 | Grupo Mexico SA Class B | 3,390,411 | |||||||||||||
| 356,000 | Grupo Modelo SA de CV Class C | 1,628,426 | |||||||||||||
| 282,100 | Grupo Televisa SA-Series CPO | 1,246,929 | |||||||||||||
| 372,900 | Telefonos de Mexico SA de CV Sponsored ADR Class L | 12,380,280 | |||||||||||||
| 3,036,379 | Wal-Mart de Mexico SA de CV Class V | 11,068,183 | |||||||||||||
| Total Mexico | 54,327,056 | ||||||||||||||
| Philippines — 0.5% | |||||||||||||||
| 79,500 | Philippine Long Distance Telephone Co | 5,609,392 | |||||||||||||
| Poland — 1.6% | |||||||||||||||
| 57,300 | Bank Pekao SA | 4,298,332 | |||||||||||||
| 332,650 | Powszechna Kasa Oszczednosci Bank Polski SA | 5,963,319 | |||||||||||||
| 27,460 | Prokom Software SA | 1,456,811 | |||||||||||||
| 635,800 | Telekomunikacja Polska SA | 5,922,978 | |||||||||||||
| Total Poland | 17,641,440 | ||||||||||||||
| Russia — 10.7% | |||||||||||||||
| 227,000 | JSC Mining & Smelting Co ADR | 6,628,400 | |||||||||||||
| 461,503 | Lukoil Sponsored ADR | 34,151,222 | |||||||||||||
| 262,330 | Mobile Telesystems Sponsored ADR | 21,526,800 | |||||||||||||
| 304,950 | OAO Gazprom Sponsored GDR | 15,491,460 | |||||||||||||
| 553,000 | OAO Rosneft Oil Co GDR | 4,523,540 | |||||||||||||
| 5,910,000 | Sberbank RF | 19,680,300 | |||||||||||||
| 58,300 | Sistema JSFC Sponsored GDR | 2,081,473 | |||||||||||||
| 375,500 | Vimpel-Communications Sponsored ADR | 13,041,115 | |||||||||||||
| Total Russia | 117,124,310 | ||||||||||||||
See accompanying notes to the financial statements.
6
GMO Emerging Markets Opportunities Fund
(formerly GMO Emerging Markets Quality Fund)
(A Series of GMO Trust)
Schedule of Investments — (Continued)
(showing percentage of total net assets)
February 29, 2008
| Shares | Description | Value ($) | |||||||||||||
| South Africa — 6.1% | |||||||||||||||
| 197,300 | Absa Group Ltd | 2,792,722 | |||||||||||||
| 289,000 | African Bank Investments Ltd | 1,138,512 | |||||||||||||
| 18,000 | Anglo American Platinum Corp | 2,821,515 | |||||||||||||
| 99,800 | Barloworld Ltd | 1,201,722 | |||||||||||||
| 192,100 | Bidvest Group Ltd | 2,832,785 | |||||||||||||
| 3,381,504 | FirstRand Ltd | 8,002,653 | |||||||||||||
| 445,600 | Impala Platinum Holdings Ltd | 18,439,264 | |||||||||||||
| 116,367 | Imperial Holdings Ltd | 1,177,174 | |||||||||||||
| 247,300 | JD Group Ltd | 1,333,099 | |||||||||||||
| 238,600 | MTN Group Ltd | 3,736,306 | |||||||||||||
| 58,500 | Naspers Ltd Class N | 1,107,206 | |||||||||||||
| 250,379 | Pretoria Portland Cement Co Ltd | 1,359,501 | |||||||||||||
| 68,300 | Sasol Ltd | 3,492,998 | |||||||||||||
| 867,668 | Standard Bank Group Ltd | 10,828,811 | |||||||||||||
| 754,500 | Steinhoff International Holdings Ltd | 1,732,895 | |||||||||||||
| 82,200 | Telkom South Africa Ltd | 1,465,755 | |||||||||||||
| 102,176 | Tiger Brands Ltd | 1,818,662 | |||||||||||||
| 703,700 | Woolworths Holdings | 1,113,020 | |||||||||||||
| Total South Africa | 66,394,600 | ||||||||||||||
| South Korea — 13.8% | |||||||||||||||
| 59,900 | Doosan Infracore Co Ltd | 1,864,330 | |||||||||||||
| 83,700 | Hana Financial Group Inc | 3,714,019 | |||||||||||||
| 54,300 | Hynix Semiconductor Inc * | 1,396,344 | |||||||||||||
| 36,300 | Hyundai Engineering & Construction | 3,264,792 | |||||||||||||
| 74,800 | Hyundai Mobis | 5,741,573 | |||||||||||||
| 48,660 | Hyundai Motor Co | 3,411,900 | |||||||||||||
| 97,600 | KIA Motors Corp * | 998,077 | |||||||||||||
| 28,490 | Kookmin Bank | 1,755,827 | |||||||||||||
| 116,100 | KT Corp ADR * | 2,820,069 | |||||||||||||
| 84,700 | KT Freetel Co Ltd * | 2,209,023 | |||||||||||||
| 130,600 | KT&G Corp | 10,775,338 | |||||||||||||
| 47,300 | LG Chemicals Ltd | 3,953,368 | |||||||||||||
See accompanying notes to the financial statements.
7
GMO Emerging Markets Opportunities Fund
(formerly GMO Emerging Markets Quality Fund)
(A Series of GMO Trust)
Schedule of Investments — (Continued)
(showing percentage of total net assets)
February 29, 2008
| Shares | Description | Value ($) | |||||||||||||
| South Korea — continued | |||||||||||||||
| 19,560 | LG Electronics Inc | 2,106,681 | |||||||||||||
| 34,300 | NCSoft Corp * | 1,637,247 | |||||||||||||
| 35,400 | NHN Corp * | 7,856,567 | |||||||||||||
| 45,350 | POSCO | 24,943,543 | |||||||||||||
| 85,833 | Samsung Electronics Co Ltd | 50,312,923 | |||||||||||||
| 45,600 | Samsung Techwin Co Ltd | 2,328,425 | |||||||||||||
| 82,460 | Shinhan Financial Group Co Ltd | 4,442,022 | |||||||||||||
| 12,500 | Shinsegae Co Ltd | 7,761,534 | |||||||||||||
| 6,800 | SK Telecom Co Ltd | 1,382,217 | |||||||||||||
| 240,010 | SK Telecom Co Ltd ADR | 5,376,224 | |||||||||||||
| Total South Korea | 150,052,043 | ||||||||||||||
| Taiwan — 11.5% | |||||||||||||||
| 1,181,711 | Acer Inc | 2,143,994 | |||||||||||||
| 2,187,238 | Asustek Computer Inc | 6,038,411 | |||||||||||||
| 1,516,000 | Cathay Financial Holding Co Ltd | 3,798,395 | |||||||||||||
| 3,239,189 | China Steel Corp | 4,785,848 | |||||||||||||
| 1,627,000 | Chinatrust Financial Holding Co Ltd * | 1,454,553 | |||||||||||||
| 3,308,400 | Chunghwa Telecom Co Ltd | 8,225,764 | |||||||||||||
| 5,610 | Chungwa Telecom Co Ltd ADR | 137,669 | |||||||||||||
| 2,088,500 | Compal Electronics Inc | 1,882,325 | |||||||||||||
| 728,417 | Delta Electronics Inc | 2,071,805 | |||||||||||||
| 1,657,167 | Formosa Chemicals & Fibre Co | 4,027,192 | |||||||||||||
| 504,582 | Formosa Petrochemical Corp | 1,396,188 | |||||||||||||
| 1,242,869 | Formosa Plastics Corp | 3,350,383 | |||||||||||||
| 261,855 | Foxconn Technology Co Ltd | 1,708,297 | |||||||||||||
| 244,200 | High Tech Computer Corp | 5,041,195 | |||||||||||||
| 4,229,685 | Hon Hai Precision Industry Co Ltd | 25,234,808 | |||||||||||||
| 814,578 | Lite-On Technology Corp | 1,112,740 | |||||||||||||
| 922,593 | MediaTek Inc | 10,347,354 | |||||||||||||
| 1,616,444 | Nan Ya Plastics Corp | 3,806,808 | |||||||||||||
| 422,636 | Novatek Microelectronics Corp Ltd | 1,487,178 | |||||||||||||
| 2,146,547 | Quanta Computer Inc | 2,814,014 | |||||||||||||
See accompanying notes to the financial statements.
8
GMO Emerging Markets Opportunities Fund
(formerly GMO Emerging Markets Quality Fund)
(A Series of GMO Trust)
Schedule of Investments — (Continued)
(showing percentage of total net assets)
February 29, 2008
| Shares | Description | Value ($) | |||||||||||||
| Taiwan — continued | |||||||||||||||
| 870,250 | Taiwan Mobile Co Ltd | 1,474,321 | |||||||||||||
| 16,716,625 | Taiwan Semiconductor Manufacturing Co Ltd | 32,656,656 | |||||||||||||
| Total Taiwan | 124,995,898 | ||||||||||||||
| Thailand — 1.0% | |||||||||||||||
| 959,000 | Advanced Info Service Pcl (Foreign Registered) (b) | 3,158,152 | |||||||||||||
| 290,400 | PTT Exploration & Production Pcl (Foreign Registered) (b) | 1,461,697 | |||||||||||||
| 431,611 | PTT Pcl (Foreign Registered) (b) | 4,615,756 | |||||||||||||
| 48,000 | Siam Cement Pcl (Foreign Registered) (b) | 326,229 | |||||||||||||
| 149,000 | Siam Cement Pcl NVDR (b) | 1,012,669 | |||||||||||||
| Total Thailand | 10,574,503 | ||||||||||||||
| TOTAL COMMON STOCKS (COST $667,651,290) | 957,969,492 | ||||||||||||||
| PREFERRED STOCKS — 9.9% | |||||||||||||||
| Brazil — 9.7% | |||||||||||||||
| 202,248 | Banco Bradesco SA 0.32% | 6,314,644 | |||||||||||||
| 808,100 | Banco Itau Holding Financeira SA 2.81% | 20,356,608 | |||||||||||||
| 846,248 | Companhia Vale do Rio Doce Class A 0.05% | 24,950,580 | |||||||||||||
| 158,400 | Gerdau SA 2.11% | 5,176,030 | |||||||||||||
| 746,708 | Itausa-Investimentos Itau SA 0.11% | 4,746,680 | |||||||||||||
| 918,000 | Petroleo Brasileiro SA (Petrobras) 0.43% | 44,214,476 | |||||||||||||
| Total Brazil | 105,759,018 | ||||||||||||||
| South Korea — 0.2% | |||||||||||||||
| 6,200 | Samsung Electronics Co Ltd (Non Voting) 3.69% | 2,661,539 | |||||||||||||
| TOTAL PREFERRED STOCKS (COST $52,230,638) | 108,420,557 | ||||||||||||||
See accompanying notes to the financial statements.
9
GMO Emerging Markets Opportunities Fund
(formerly GMO Emerging Markets Quality Fund)
(A Series of GMO Trust)
Schedule of Investments — (Continued)
(showing percentage of total net assets)
February 29, 2008
| Shares / Par Value ($) | Description | Value ($) | |||||||||||||
| RIGHTS AND WARRANTS — 0.0% | |||||||||||||||
| Brazil — 0.0% | |||||||||||||||
| 2,795 | Banco Bradesco SA Rights, Expires 02/22/08 * (c) | 7,355 | |||||||||||||
| Thailand — 0.0% | |||||||||||||||
| 480,663 | True Corp Pcl Warrants, Expires 04/03/08 * (b) | — | |||||||||||||
| TOTAL RIGHTS AND WARRANTS (COST $8,704) | 7,355 | ||||||||||||||
| SHORT-TERM INVESTMENTS — 1.9% | |||||||||||||||
| 2,000,000 | ABN Amro Bank Time Deposit, 3.10%, due 03/03/08 | 2,000,000 | |||||||||||||
| 2,000,000 | Bank of America Time Deposit, 3.05%, due 03/03/08 | 2,000,000 | |||||||||||||
| 2,193,000 | Bank of New York Mellon Institutional Cash Reserves Fund (d) | 2,193,000 | |||||||||||||
| 2,000,000 | Barclays Plc Time Deposit, 3.12%, due 03/03/08 | 2,000,000 | |||||||||||||
| 8,500,000 | HSBC Bank USA Time Deposit, 2.94%, due 03/03/08 | 8,500,000 | |||||||||||||
| 2,000,000 | Rabobank Time Deposit, 3.00%, due 03/03/08 | 2,000,000 | |||||||||||||
| 2,000,000 | Royal Bank of Scotland Time Deposit, 3.10%, due 03/03/08 | 2,000,000 | |||||||||||||
| TOTAL SHORT-TERM INVESTMENTS (COST $20,693,000) | 20,693,000 | ||||||||||||||
| TOTAL INVESTMENTS — 99.7% (Cost $740,583,632) | 1,087,090,404 | ||||||||||||||
| Other Assets and Liabilities (net) — 0.3% | 3,181,426 | ||||||||||||||
| TOTAL NET ASSETS — 100.0% | $ | 1,090,271,830 | |||||||||||||
See accompanying notes to the financial statements.
10
GMO Emerging Markets Opportunities Fund
(formerly GMO Emerging Markets Quality Fund)
(A Series of GMO Trust)
Schedule of Investments — (Continued)
February 29, 2008
Notes to Schedule of Investments:
ADR - American Depositary Receipt
CPO - Ordinary Participation Certificate (Certificado de Participacion Ordinares), representing a bundle of shares of the multiple series of one issuer that trade together as a unit.
Foreign Registered - Shares issued to foreign investors in markets that have foreign ownership limits.
GDR - Global Depository Receipt
NVDR - Non-Voting Depository Receipt
* Non-income producing security.
(a) All or a portion of this security is out on loan (Note 2).
(b) Security valued at fair value using methods determined in good faith by or at the direction of the Trustees of GMO Trust (Note 2).
(c) As of February 29, 2008, these rights have been exercised but shares have not yet been credited to the Fund.
(d) All or a portion of this security represents investment of security lending collateral (Note 2).
As of February 29, 2008, 62.73% of the Net Assets of the Fund were valued using fair value prices based on models used by a third party vendor (Note 2).
See accompanying notes to the financial statements.
11
GMO Emerging Markets Opportunities Fund
(formerly GMO Emerging Markets Quality Fund)
(A Series of GMO Trust)
Statement of Assets and Liabilities — February 29, 2008
| Assets: | |||||||
| Investments, at value, including securities on loan of $2,187,900 (cost $740,583,632) (Note 2) | $ | 1,087,090,404 | |||||
| Cash | 65,764 | ||||||
| Foreign currency, at value (cost $1,372,479) (Note 2) | 1,375,952 | ||||||
| Receivable for investments sold | 2,267,516 | ||||||
| Receivable for Fund shares sold | 1,799 | ||||||
| Dividends and interest receivable | 3,130,418 | ||||||
| Receivable for expenses reimbursed by Manager (Note 3) | 17,574 | ||||||
| Total assets | 1,093,949,427 | ||||||
| Liabilities: | |||||||
| Collateral on securities loaned, at value (Note 2) | 2,193,000 | ||||||
| Payable for investments purchased | 390,373 | ||||||
| Payable for Fund shares repurchased | 17,594 | ||||||
| Payable to affiliate for (Note 3): | |||||||
| Management fee | 342,936 | ||||||
| Shareholder service fee | 73,718 | ||||||
| Trustees and Chief Compliance Officer of GMO Trust fees | 1,331 | ||||||
| Accrued expenses | 658,645 | ||||||
| Total liabilities | 3,677,597 | ||||||
| Net assets | $ | 1,090,271,830 | |||||
| Net assets consist of: | |||||||
| Paid-in capital | $ | 723,501,169 | |||||
| Distributions in excess of net investment income | (5,213,113 | ) | |||||
| Accumulated net realized gain | 25,423,921 | ||||||
| Net unrealized appreciation | 346,559,853 | ||||||
| $ | 1,090,271,830 | ||||||
| Net assets attributable to: | |||||||
| Class III shares | $ | 353,477,530 | |||||
| Class VI shares | $ | 736,794,300 | |||||
| Shares outstanding: | |||||||
| Class III | 26,617,368 | ||||||
| Class VI | 55,344,281 | ||||||
| Net asset value per share: | |||||||
| Class III | $ | 13.28 | |||||
| Class VI | $ | 13.31 | |||||
See accompanying notes to the financial statements.
12
GMO Emerging Markets Opportunities Fund
(formerly GMO Emerging Markets Quality Fund)
(A Series of GMO Trust)
Statement of Operations — Year Ended February 29, 2008
| Investment Income: | |||||||
| Dividends (net of withholding taxes of $2,269,127) | $ | 20,727,736 | |||||
| Interest | 1,172,978 | ||||||
| Securities lending income | 12,365 | ||||||
| Total investment income | 21,913,079 | ||||||
| Expenses: | |||||||
| Management fee (Note 3) | 4,107,482 | ||||||
| Shareholder service fee – Class III (Note 3) | 524,043 | ||||||
| Shareholder service fee – Class VI (Note 3) | 372,630 | ||||||
| Custodian and fund accounting agent fees | 1,580,264 | ||||||
| Transfer agent fees | 41,970 | ||||||
| Audit and tax fees | 80,235 | ||||||
| Legal fees | 28,830 | ||||||
| Trustees fees and related expenses (Note 3) | 9,893 | ||||||
| Registration fees | 4,310 | ||||||
| Miscellaneous | 16,127 | ||||||
| Total expenses | 6,765,784 | ||||||
| Fees and expenses reimbursed by Manager (Note 3) | (149,229 | ) | |||||
| Net expenses | 6,616,555 | ||||||
| Net investment income (loss) | 15,296,524 | ||||||
| Realized and unrealized gain (loss): | |||||||
| Net realized gain (loss) on: | |||||||
| Investments (net of foreign capital gains tax of $17,811) (Note 2) | 70,821,732 | ||||||
| Foreign currency, forward contracts and foreign currency related transactions (net of CPMF tax of $6,711) (Note 2) | 146,647 | ||||||
| Net realized gain (loss) | 70,968,379 | ||||||
| Change in net unrealized appreciation (depreciation) on: | |||||||
| Investments (net of change in foreign capital gains tax accrual of $2,039,078) (Note 2) | 138,085,305 | ||||||
| Foreign currency, forward contracts and foreign currency related transactions | 56,076 | ||||||
| Net unrealized gain (loss) | 138,141,381 | ||||||
| Net realized and unrealized gain (loss) | 209,109,760 | ||||||
| Net increase (decrease) in net assets resulting from operations | $ | 224,406,284 | |||||
See accompanying notes to the financial statements.
13
GMO Emerging Markets Opportunities Fund
(formerly GMO Emerging Markets Quality Fund)
(A Series of GMO Trust)
Statement of Changes in Net Assets
| Year Ended February 29, 2008 | Year Ended February 28, 2007 | ||||||||||
| Increase (decrease) in net assets: | |||||||||||
| Operations: | |||||||||||
| Net investment income (loss) | $ | 15,296,524 | $ | 12,620,530 | |||||||
| Net realized gain (loss) | 70,968,379 | 45,066,930 | |||||||||
| Change in net unrealized appreciation (depreciation) | 138,141,381 | 60,935,011 | |||||||||
| Net increase (decrease) in net assets from operations | 224,406,284 | 118,622,471 | |||||||||
| Distributions to shareholders from: | |||||||||||
| Net investment income | |||||||||||
| Class III | (6,966,010 | ) | (4,399,199 | ) | |||||||
| Class VI | (14,556,021 | ) | (8,242,433 | ) | |||||||
| Total distributions from net investment income | (21,522,031 | ) | (12,641,632 | ) | |||||||
| Net realized gains | |||||||||||
| Class III | (23,553,007 | ) | (13,817,514 | ) | |||||||
| Class VI | (44,940,537 | ) | (24,802,423 | ) | |||||||
| Total distributions from net realized gains | (68,493,544 | ) | (38,619,937 | ) | |||||||
| (90,015,575 | ) | (51,261,569 | ) | ||||||||
| Net share transactions (Note 7): | |||||||||||
| Class III | 11,905,376 | 70,136,125 | |||||||||
| Class VI | 111,032,810 | 104,030,228 | |||||||||
| Increase (decrease) in net assets resulting from net share transactions | 122,938,186 | 174,166,353 | |||||||||
| Purchase premiums and redemption fees (Notes 2 and 7): | |||||||||||
| Class III | 758,901 | 434,472 | |||||||||
| Class VI | 416,207 | 409,974 | |||||||||
| Increase in net assets resulting from purchase premiums and redemption fees | 1,175,108 | 844,446 | |||||||||
| Total increase (decrease) in net assets resulting from net share transactions, purchase premiums and redemption fees | 124,113,294 | 175,010,799 | |||||||||
| Total increase (decrease) in net assets | 258,504,003 | 242,371,701 | |||||||||
| Net assets: | |||||||||||
| Beginning of period | 831,767,827 | 589,396,126 | |||||||||
| End of period (including distributions in excess of net investment income of $5,213,113 and accumulated undistributed net investment income of $1,046,001, respectively) | $ | 1,090,271,830 | $ | 831,767,827 | |||||||
See accompanying notes to the financial statements.
14
GMO Emerging Markets Opportunities Fund
(formerly GMO Emerging Markets Quality Fund)
(A Series of GMO Trust)
Financial Highlights
(For a Class III share outstanding throughout each period)
| Year Ended February 28/29, | |||||||||||||||||||||||
| 2008 | 2007 | 2006 | 2005 | 2004 | |||||||||||||||||||
| Net asset value, beginning of period | $ | 11.36 | $ | 10.38 | $ | 7.71 | $ | 13.77 | $ | 7.25 | |||||||||||||
| Income (loss) from investment operations: | |||||||||||||||||||||||
| Net investment income (loss) | 0.20 | † | 0.18 | † | 0.15 | † | 0.17 | † | 0.23 | ||||||||||||||
| Net realized and unrealized gain (loss) | 2.89 | 1.57 | 2.67 | 0.19 | 6.35 | ||||||||||||||||||
| Total from investment operations | 3.09 | 1.75 | 2.82 | 0.36 | 6.58 | ||||||||||||||||||
| Less distributions to shareholders: | |||||||||||||||||||||||
| From net investment income | (0.27 | ) | (0.18 | ) | (0.11 | ) | (0.52 | ) | (0.06 | ) | |||||||||||||
| From net realized gains | (0.90 | ) | (0.59 | ) | (0.04 | ) | (5.90 | ) | — | ||||||||||||||
| Total distributions | (1.17 | ) | (0.77 | ) | (0.15 | ) | (6.42 | ) | (0.06 | ) | |||||||||||||
| Net asset value, end of period | $ | 13.28 | $ | 11.36 | $ | 10.38 | $ | 7.71 | $ | 13.77 | |||||||||||||
| Total Return(a) | 26.68 | % | 17.27 | % | 36.86 | % | 16.19 | % | 91.04 | % | |||||||||||||
| Ratios/Supplemental Data: | |||||||||||||||||||||||
| Net assets, end of period (000's) | $ | 353,478 | $ | 292,123 | $ | 197,026 | $ | 82,153 | $ | 141,614 | |||||||||||||
| Net expenses to average daily net assets | 0.71 | % | 0.70 | % | 0.73 | % | 1.22 | % | 1.25 | % | |||||||||||||
| Net investment income to average daily net assets | 1.46 | % | 1.70 | % | 1.71 | % | 1.84 | % | 1.76 | % | |||||||||||||
| Portfolio turnover rate | 17 | % | 17 | % | 18 | % | 141 | % | 39 | % | |||||||||||||
| Fees and expenses reimbursed by the Manager to average daily net assets: | 0.01 | % | 0.02 | % | 0.04 | % | 0.11 | % | 0.07 | % | |||||||||||||
| Purchase premiums and redemption fees consisted of the following per share amounts:† | $ | 0.03 | $ | 0.02 | $ | 0.04 | $ | 0.06 | $ | 0.02 | |||||||||||||
(a) The total returns would have been lower had certain expenses not been reimbursed during the periods shown and assumes the effect of reinvested distributions. Calculation excludes purchase premiums and redemption fees which are borne by the shareholder.
† Calculated using average shares outstanding throughout the period.
See accompanying notes to the financial statements.
15
GMO Emerging Markets Opportunities Fund
(formerly GMO Emerging Markets Quality Fund)
(A Series of GMO Trust)
Financial Highlights
(For a Class VI share outstanding throughout each period)
| Year Ended February 28/29, | |||||||||||||||||||
| 2008 | 2007 | 2006 | 2005(a) | ||||||||||||||||
| Net asset value, beginning of period | $ | 11.38 | $ | 10.39 | $ | 7.72 | $ | 6.52 | |||||||||||
| Income (loss) from investment operations: | |||||||||||||||||||
| Net investment income (loss)† | 0.20 | 0.20 | 0.15 | 0.03 | |||||||||||||||
| Net realized and unrealized gain (loss) | 2.91 | 1.57 | 2.67 | 1.44 | |||||||||||||||
| Total from investment operations | 3.11 | 1.77 | 2.82 | 1.47 | |||||||||||||||
| Less distributions to shareholders: | |||||||||||||||||||
| From net investment income | (0.28 | ) | (0.19 | ) | (0.11 | ) | (0.01 | ) | |||||||||||
| From net realized gains | (0.90 | ) | (0.59 | ) | (0.04 | ) | (0.26 | ) | |||||||||||
| Total distributions | (1.18 | ) | (0.78 | ) | (0.15 | ) | (0.27 | ) | |||||||||||
| Net asset value, end of period | $ | 13.31 | $ | 11.38 | $ | 10.39 | $ | 7.72 | |||||||||||
| Total Return(b) | 26.83 | % | 17.45 | % | 36.92 | % | 23.05 | %** | |||||||||||
| Ratios/Supplemental Data: | |||||||||||||||||||
| Net assets, end of period (000's) | $ | 736,794 | $ | 539,645 | $ | 392,370 | $ | 103,152 | |||||||||||
| Net expenses to average daily net assets | 0.61 | % | 0.61 | % | 0.64 | % | 0.71 | %* | |||||||||||
| Net investment income to average daily net assets | 1.50 | % | 1.82 | % | 1.66 | % | 0.99 | %* | |||||||||||
| Portfolio turnover rate | 17 | % | 17 | % | 18 | % | 141 | %†† | |||||||||||
| Fees and expenses reimbursed by the Manager to average daily net assets: | 0.01 | % | 0.02 | % | 0.04 | % | 0.16 | %* | |||||||||||
| Purchase premiums and redemption fees consisted of the following per share amounts:† | $ | 0.01 | $ | 0.01 | $ | 0.03 | $ | 0.04 | |||||||||||
(a) Period from September 23, 2004 (commencement of operations) through February 28, 2005.
(b) The total returns would have been lower had certain expenses not been reimbursed during the periods shown and assumes the effect of reinvested distributions. Calculation excludes purchase premiums and redemption fees which are borne by the shareholder.
† Calculated using average shares outstanding throughout the period.
†† Calculation represents portfolio turnover of the Fund for the year ended February 28, 2005.
* Annualized.
** Not annualized.
See accompanying notes to the financial statements.
16
GMO Emerging Markets Opportunities Fund
(formerly GMO Emerging Markets Quality Fund)
(A Series of GMO Trust)
Notes to Financial Statements
February 29, 2008
1. Organization
GMO Emerging Markets Opportunities Fund (formerly GMO Emerging Markets Quality Fund) (the "Fund") is a series of GMO Trust (the "Trust"). The Fund is registered under the Investment Company Act of 1940, as amended, as an open-end, non-diversified management investment company. The Fund is advised and managed by Grantham, Mayo, Van Otterloo & Co. LLC (the "Manager" or "GMO"). The Trust was established as a Massachusetts business trust under the laws of the Commonwealth of Massachusetts on June 24, 1985. The Declaration of Trust permits the Trustees of the Trust ("Trustees") to create an unlimited number of series of shares ("Funds") and to subdivide Funds into classes.
The Fund seeks high total return. The Fund seeks to achieve its investment objective by outperforming its benchmark, the S&P/IFCI (Investable) Composite Index. The Fund typically makes equity investments in companies whose stocks are traded in the securities markets of the world's non-developed markets, which excludes countries that are included in the MSCI EAFE Index.
For the year ended February 29, 2008, the Fund had two classes of shares outstanding: Class III and Class VI. Each class of shares bears a different level of shareholder service fees.
The Fund currently limits subscriptions due to capacity considerations.
2. Significant accounting policies
The following is a summary of significant accounting policies which are in conformity with accounting principles generally accepted in the United States of America ("U.S. GAAP") and which are consistently followed by the Fund in the preparation of its financial statements. The preparation of financial statements in accordance with U.S. GAAP requires management to make estimates and assumptions that affect the reported amounts and disclosures in the financial statements. Actual results could differ from those estimates. The accounting records of the Fund are maintained in U.S. dollars.
Portfolio valuation
Securities listed on a securities exchange for which market quotations are readily available are valued at the last sale price or official closing price on each business day, or if there is no such reported sale or official closing price, at the most recent quoted bid price. Unlisted securities for which market quotations are readily available are generally valued at the most recent quoted bid price. Short-term investments with a remaining maturity of sixty days or less are generally valued at amortized cost, which approximates fair value. Shares of investment funds are valued at their net asset value. Securities for which quotations are not readily available or whose values the Manager has determined to be unreliable are valued at fair value as determined in good faith by the Trustees or other persons acting at their direction pursuant to procedures approved by the Trustees. By its nature, a fair value price is a good faith est imate of the value of a security at a given point in time and may not reflect the value that would be realized if the security was sold and the differences could be material. Because many foreign equity securities markets and
17
GMO Emerging Markets Opportunities Fund
(formerly GMO Emerging Markets Quality Fund)
(A Series of GMO Trust)
Notes to Financial Statements — (Continued)
February 29, 2008
exchanges close prior to the close of the New York Stock Exchange ("NYSE"), closing prices for foreign securities in those markets or on those exchanges do not reflect the events that occur after that close but before the close of the NYSE. As a result, foreign equity securities are generally valued using fair value prices supplied by a third party vendor based on models to the extent that these fair value prices are available.
Foreign currency translation
The market values of foreign securities, currency holdings and other assets and liabilities are translated to U.S. dollars based on the current exchange rates each business day. Income and expenses denominated in foreign currencies are translated at current exchange rates when accrued or incurred. The Fund does not isolate realized and unrealized gains and losses attributable to changes in exchange rates from gains and losses that arise from changes in the market value of investments. Such fluctuations are included with net realized and unrealized gain or loss on investments. Net realized gains and losses on foreign currency transactions represent gains and losses on disposition of currencies and forward currency contracts, currency gains and losses realized between the trade and settlement dates on securities transactions, and the difference between the amount of investment income and foreign withholding taxes recorded on the F und's accounting records and the U.S. dollar equivalent amounts actually received or paid.
Forward currency contracts
The Fund may enter into forward currency contracts including forward cross currency contracts. A forward currency contract is an agreement between two parties to buy and sell a currency at a set price on a future date. The market value of a forward currency contract fluctuates with changes in forward currency exchange rates. Forward currency contracts are marked to market daily using rates supplied by a quotation service and changes in value are recorded by the Fund as an unrealized gain or loss. Realized gains or losses equal to the difference between the value of the contract at the time it was opened and the value at the time it was closed are recorded upon delivery or receipt of the currency or, if a forward currency contract is offset by entering into another forward currency contract with the same broker, upon settlement of the net gain or loss. These contracts may involve market risk in excess of the unrealized gain or lo ss reflected in the Fund's Statement of Assets and Liabilities. In addition, the Fund could be exposed to risk if the counterparties are unable to meet the terms of the contracts or if there are movements in currency values that are unfavorable to the Fund. There were no forward currency contracts outstanding at the end of the period.
Futures contracts
The Fund may purchase and sell futures contracts. Upon entering into a futures contract, the Fund is required to deposit with the futures clearing broker an amount of cash, U.S. government and agency obligations, or other liquid assets in accordance with the initial margin requirements of the broker or exchange. In addition, the Fund maintains cash or securities in an amount that at least equals the net amount payable in the event the Fund must deliver the full amount of the contracts. Futures contracts are marked to market daily and an appropriate payable or receivable for the change in value ("variation margin") is
18
GMO Emerging Markets Opportunities Fund
(formerly GMO Emerging Markets Quality Fund)
(A Series of GMO Trust)
Notes to Financial Statements — (Continued)
February 29, 2008
recorded by the Fund. The payable or receivable is liquidated on the following business day. Gains or losses are recognized but not considered realized until the contracts expire or are closed. Futures contracts involve, to varying degrees, risk of loss in excess of the variation margin disclosed in the Statement of Assets and Liabilities. Under certain circumstances, futures exchanges may establish daily limits on the amount that the price of a futures contract can vary from the previous day's settlement price, thereby effectively preventing liquidation of unfavorable positions. Losses may arise from changes in the value of the underlying instrument if the Fund is unable to liquidate a futures position due to an illiquid secondary market for the contracts or the imposition of price limits, or if counterparties do not perform under the contract terms. Futures contracts are generally valued at the settlement price established eac h day by the board of trade or exchange on which they are traded. There were no futures contracts outstanding at the end of the period.
Options
The Fund may write call and put options. Writing options increases the Fund's exposure to the underlying instrument by, in the case of a call option, obligating the Fund to sell the underlying instrument at a set price to the option-holder and, in the case of a put option, obligating the Fund to purchase the underlying instrument at a set price from the option-holder. When the Fund writes a call or put option, an amount equal to the premium received is recorded as a liability and subsequently marked to market to reflect the current value of the option written. Premiums received from writing options which expire are treated as realized gains. Premiums received from writing options which are exercised or closed are added to the proceeds or offset against the amounts paid on the underlying future, security or currency transaction to determine the realized gain or loss. The Fund as a writer of an option has no control over whether t he underlying future, security or currency may be sold (call) or purchased (put) and as a result bears the market risk of an unfavorable change in the price of the future, security or currency underlying the written option. In the event that the Fund writes uncovered call options (i.e. options for investments that the Fund does not own), it bears the risk of incurring substantial losses if the price of the underlying instrument increases during the term of the option. There is the risk the Fund may not be able to enter into a closing transaction because of an illiquid market. There were no open written option contracts during the period.
The Fund may also purchase put and call options. Purchasing options alters the Fund's exposure to the underlying instrument by, in the case of a call option, entitling the Fund to purchase the underlying instrument at a set price from the writer of the option and, in the case of a put option, entitling the Fund to sell the underlying instrument at a set price to the writer of the option. The Fund pays a premium as a cost for a purchased option disclosed in the Schedule of Investments which is subsequently marked to market to reflect the current value of the option. Premiums paid for purchasing options which expire are treated as realized losses. Premiums paid for purchasing options which are exercised or closed are added to the amounts paid or offset against the proceeds on the closing transaction to determine the realized gain or loss. The risk associated with purchasing put and call options is limited to the premium paid. Ther e were no purchased option contracts outstanding at the end of the period.
19
GMO Emerging Markets Opportunities Fund
(formerly GMO Emerging Markets Quality Fund)
(A Series of GMO Trust)
Notes to Financial Statements — (Continued)
February 29, 2008
Exchange traded options are valued at the last sale price, or if no sale is reported, the last bid price for purchased options and the last ask price for written options. Options traded over-the-counter are valued using prices supplied by a primary pricing source chosen by the Manager.
Indexed securities
The Fund may invest in indexed securities where the redemption values and/or coupons are linked to the prices of a specific instrument or financial statistic. The Fund uses indexed securities to increase or decrease its exposure to different underlying instruments and to gain exposure to markets in which it may be difficult to invest through conventional securities. Indexed securities may be more volatile than their underlying instruments, but any loss is limited to the amount of the original investment. There were no indexed securities held by the Fund at the end of the period.
Swap agreements
The Fund may enter into swap agreements. A swap is an agreement to exchange the return generated by one instrument for the return generated by another instrument. Interest rate swap agreements involve the exchange by one party with another party of their respective commitments to pay or receive interest, e.g., an exchange of floating rate payments for fixed rate payments with respect to a notional amount of principal. Total return swap agreements involve a commitment by one party in the agreement to pay interest in exchange for a market-linked return, both based on notional amounts. To the extent the total return of the security or index underlying the transaction exceeds or falls short of the offsetting interest rate obligation, the party will receive a payment from or make a payment to the counterparty, respectively. Forward spread lock swap agreements involve commitments to pay or receive a settlement amount calculated as the difference between the swap spread and a fixed spread, multiplied by the notional amount times the duration of the swap rate. The swap spread is the difference between the benchmark swap rate (market rate) and the specific treasury rate. Variance swap agreements involve commitments to pay or receive a settlement amount calculated as the difference between the annualized realized variance of returns on the underlying price and a fixed quantity, also known as the variance strike, over a period of time. In connection with these agreements, cash or securities may be set aside as collateral by the Fund's custodian or brokers in accordance with the terms of the swap agreement. The Fund earns or pays interest on cash set aside as collateral.
Swaps are marked to market daily using models that incorporate quotations from market makers and the change in value, if any, is recorded as unrealized gain or loss in the Statement of Operations. Payments received or made on swap contracts are recorded as realized gain or loss in the Statement of Operations. Gains or losses are realized upon early termination of the swap agreements. These financial instruments are not actively traded on financial markets. The values assigned to these instruments are based upon the best available information and because of the uncertainty of the valuation, these values may differ significantly from the values that would have been realized had a ready market for these instruments existed, and the differences could be material. Entering into these agreements involves, to varying degrees, elements of credit, legal, market and documentation risk in excess of the amounts recognized in the Statement o f Assets and Liabilities. Such risks involve the possibility that there will be no liquid market
20
GMO Emerging Markets Opportunities Fund
(formerly GMO Emerging Markets Quality Fund)
(A Series of GMO Trust)
Notes to Financial Statements — (Continued)
February 29, 2008
for these agreements, that the counterparties to the agreements may default on their obligations to perform or disagree as to the meaning of contractual terms in the agreements, or that there may be unfavorable changes in interest rates or the price of the index or security underlying these transactions. There were no swap agreements outstanding at the end of the period.
Securities lending
The Fund may lend its securities to certain qualified broker-dealers. The loans are collateralized with cash or liquid securities with a market value at least equal to the market value of the securities on loan. As with other extensions of credit, the Fund may bear the risk of loss with respect to the investment of the collateral, the risk of delay in and/or inability to exercise its rights with respect to the collateral, and the risk of delay in recovery or loss of rights in the loaned securities should the borrower of the securities fail financially. If a loan is collateralized by U.S. government securities, the Fund receives a fee from the borrower. If a loan is collateralized by cash, the Fund typically invests the cash collateral for its own account in interest-bearing, short-term securities and pays a fee to the borrower that normally represents a portion of the Fund's earnings on the collateral. As of February 29, 2008, t he Fund had loaned securities valued by the Fund at $2,187,900, collateralized by cash in the amount of $2,193,000, which was invested in the Bank of New York Mellon Institutional Cash Reserves Fund.
Taxes and distributions
The Fund intends to qualify each tax year as a regulated investment company under Subchapter M of the Internal Revenue Code of 1986, as amended (the "Code"). The Fund intends to distribute substantially all of its net investment income and net realized short-term and long-term capital gains, if any, after giving effect to any available capital loss carryovers for U.S. federal income tax purposes. Therefore, no provision for U.S. federal income or excise tax is necessary. Taxes on foreign interest and dividend income are generally withheld in accordance with the applicable country's tax treaty with the United States. The foreign withholding rates applicable to a Fund's investments in certain foreign jurisdictions may be higher if a significant portion of the Fund is held by non-U.S. shareholders.
The Fund's policy is to declare and pay distributions from net investment income, if any, semiannually, and from net realized short-term and long-term capital gains, if any, at least annually. All distributions are paid in shares of the Fund, at net asset value, unless the shareholder elects to receive cash distributions. Distributions to shareholders are recorded by the Fund on the ex-dividend date.
Dividends received by shareholders of the Fund which are derived from foreign source income and foreign taxes paid by the Fund may be treated, to the extent allowable under the Code, as if received and paid by the shareholders of the Fund.
The Fund may be subject to capital gains and repatriation taxes imposed by certain countries in which it invests. The Fund did not have a deferred tax liability in respect of unrealized appreciation on foreign securities for potential capital gains and repatriation taxes as of February 29, 2008. The accrual for capital gains and repatriation taxes is included in net unrealized gain (loss) in the Statement of Operations.
21
GMO Emerging Markets Opportunities Fund
(formerly GMO Emerging Markets Quality Fund)
(A Series of GMO Trust)
Notes to Financial Statements — (Continued)
February 29, 2008
For the year ended February 29, 2008, the Fund incurred $17,811 in capital gain taxes which is included in net realized gain (loss) in the Statement of Operations.
The Fund is subject to a Contribuição Provisória sobre Movimentações Financiera ("CPMF") tax which is applied to foreign exchange transactions representing capital inflows or outflows to/from the Brazilian market. For the year ended February 29, 2008, the Fund incurred $6,711 in CPMF tax which is included in the net realized gain (loss) on foreign currency, forward contracts and foreign currency related transactions in the Statement of Operations.
The Fund is currently subject to a Taiwanese security transaction tax of 0.30% of the transaction amount on equities and 0.10% of the transaction amount on mutual fund shares, which must be paid by the Fund upon the sale or transfer of any portfolio securities subject to such tax.
Income and capital gain distributions are determined in accordance with U.S. federal income tax regulations, which may differ from U.S. GAAP. Certain capital accounts in the financial statements are periodically adjusted for permanent differences in order to reflect their tax character. These adjustments have no impact on net assets or net asset value per share. Temporary differences which arise from recognizing certain items of income, expense, gain or loss in different periods for financial statement and tax purposes will reverse at some time in the future. Distributions in excess of net investment income or net realized gains are temporary over distributions for financial statement purposes resulting from differences in the recognition or classification of income or distributions for financial statement and tax purposes.
U.S. GAAP and tax accounting differences primarily relate to passive foreign investment company transactions.
The following reclassification represents the amount necessary to report the stated components of net assets on a tax basis, excluding certain temporary differences, as of February 29, 2008. The financial highlights exclude these adjustments.
| Distributions in Excess of Net Investment Income | Accumulated Net Realized Gain | Paid-in Capital | |||||||||
| $ | (33,607 | ) | $ | (23,671 | ) | $ | 57,278 | ||||
The tax character of distributions declared to shareholders is as follows:
| 2/29/2008 | 2/28/2007 | ||||||||||
| Ordinary income (including any short-term capital gains) | $ | 31,121,979 | $ | 16,533,932 | |||||||
| Long-term capital gains | 58,893,596 | 34,727,637 | |||||||||
| Total distributions | $ | 90,015,575 | $ | 51,261,569 | |||||||
22
GMO Emerging Markets Opportunities Fund
(formerly GMO Emerging Markets Quality Fund)
(A Series of GMO Trust)
Notes to Financial Statements — (Continued)
February 29, 2008
Distributions in excess of tax basis earnings and profits, if significant, are reported in the financial statements as a tax return of capital.
As of February 29, 2008, the components of distributable earnings on a tax basis consisted of the following:
| Undistributed ordinary income | $ | 999,240 | |||||
| Undistributed long-term capital gain | $ | 25,461,490 | |||||
As of February 29, 2008, the approximate cost for U.S. federal income tax purposes and gross and net unrealized appreciation and depreciation in value of investments were as follows:
| Aggregate Cost | Gross Unrealized Appreciation | Gross Unrealized (Depreciation) | Net Unrealized Appreciation (Depreciation) | ||||||||||||
| $ | 746,833,554 | $ | 354,189,961 | $ | (13,933,111 | ) | $ | 340,256,850 | |||||||
Security transactions and related investment income
Security transactions are accounted for on trade date. Dividend income, net of applicable foreign withholding taxes, if any, is recorded on the ex-dividend date, or when the Fund is informed of the ex-dividend date, if later. Interest income is recorded on the accrual basis and is adjusted for the amortization of premiums and accretion of discounts. Interest income on inflation indexed securities, if any, is accrued daily based upon an inflation adjusted principal. Additionally, any increase or decrease in the principal or face amount of the securities adjusted for inflation is recorded as interest income or loss. Income is not recognized on securities for which collection is not expected. Non-cash dividends, if any, are recorded at the fair market value of the securities received. In determining the net gain or loss on securities sold, the cost of securities is determined on the identified cost basis.
Expenses
The majority of expenses of the Trust are directly identifiable to an individual fund. Expenses which are not readily identifiable to a specific fund are allocated taking into consideration, among other things, the nature and type of expense and the relative size of the funds. Investment income, common expenses and realized and unrealized gains and losses are allocated pro rata among the classes of shares of the Fund based on the relative net assets of each class. Shareholder service fees, which are directly attributable to a class of shares, are charged to that class's operations.
Brown Brothers Harriman & Co. ("BBH") serves as custodian and fund accounting agent of the Fund. State Street Bank and Trust Company ("State Street") serves as transfer agent of the Fund. BBH and State Street's fees may be reduced by credits that are an earnings allowance calculated on the average daily cash balances the Fund maintains with each agent. Credit balances or expense reimbursements used to reduce fees, if any, are reported as a reduction of expenses in the Statement of Operations.
23
GMO Emerging Markets Opportunities Fund
(formerly GMO Emerging Markets Quality Fund)
(A Series of GMO Trust)
Notes to Financial Statements — (Continued)
February 29, 2008
Purchases and redemptions of Fund shares
As of February 29, 2008, the premium on cash purchases and fee on cash redemptions of Fund shares were each 0.50% of the amount invested or redeemed. If the Manager determines that any portion of a cash purchase or redemption is offset by a corresponding cash redemption or purchase occurring on the same day, it will waive the purchase premium or redemption fee in an amount approximately equal to the fee with respect to that portion. In addition, the purchase premium or redemption fee charged by the Fund may be waived in extraordinary circumstances if the Fund will not incur transaction costs. All purchase premiums and redemption fees are paid to and recorded by the Fund as paid-in capital. These fees are allocated relative to each class's net assets on the share transaction date. The Manager will waive the purchase premium relating to the in-kind portion of a purchase transaction except to the extent of certain estimated or know n transaction costs (e.g. stamp duties and transfer taxes) incurred by the Fund in connection with the transfer of the purchasing shareholder's securities to the Fund. In-kind redemption transactions are generally not subject to redemption fees except to the extent those transactions include a cash component. However, when a substantial portion of a Fund is being redeemed, the Fund may assess estimated or known transaction costs. There is no premium for reinvested distributions.
Investment risks
Investments in securities of issuers in emerging countries present certain risks that are not inherent in many other investments. Many emerging countries present elements of political and/or economic instability. The securities markets of emerging countries are generally smaller and less developed than the securities markets of the U.S. and developed foreign markets. Further, countries may impose various types of foreign currency regulations or controls which may impede the Fund's ability to repatriate amounts it receives. The Fund may acquire interests in securities in anticipation of improving conditions in the related countries. These factors may result in significant volatility in the values of its holdings. The markets in emerging countries are typically less liquid than those of developed markets. Accordingly, the Fund may not be able to realize in an actual sale amounts approximating those used to value its holdings.
Recently issued accounting pronouncements
In June 2006, the Financial Accounting Standards Board ("FASB") issued FASB Interpretation No. 48, Accounting for Uncertainty in Income Taxes – an Interpretation of FASB Statement No. 109 ("FIN 48"). FIN 48 clarifies the accounting for uncertainty in income taxes recognized in accordance with FASB Statement No. 109, Accounting for Income Taxes. FIN 48 prescribes a recognition threshold and measurement attribute for a tax position taken or expected to be taken in the tax return that could impact the Fund's financial statements. It also provides guidance in relation to the Fund's financial statements on classification of tax benefits or liabilities, interest and penalties, accounting in interim periods, disclosure, and transition. FIN 48 is effective for fiscal years beginning after December 15, 2006 for registered investment companies. Management has evaluated the effects of applying the various provisions of FIN 48 and has determined that the adoption of FIN 48 does not have a material effect on the Fund's financial statements. The Fund's federal tax returns for the prior three fiscal years, if applicable, remain subject to examination by the Internal Revenue Service. Management will continue to monitor the rules and guidance pertaining to FIN 48 and will take action if appropriate.
24
GMO Emerging Markets Opportunities Fund
(formerly GMO Emerging Markets Quality Fund)
(A Series of GMO Trust)
Notes to Financial Statements — (Continued)
February 29, 2008
In September 2006, the FASB issued Statement of Financial Accounting Standards No. 157 ("FAS 157"), "Fair Value Measurements." FAS 157 defines fair value, establishes a framework for measuring fair value in accordance with generally accepted accounting principles and expands disclosure about fair value measurements. FAS 157 is effective for fiscal years beginning after November 15, 2007. Management is currently evaluating the impact the adoption of FAS 157 will have on the Fund's financial statement disclosures.
3. Fees and other transactions with affiliates
GMO earns a management fee paid monthly at the annual rate of 0.40% of average daily net assets. The Fund has adopted a Shareholder Service Plan under which the Fund pays GMO a shareholder service fee for client and shareholder service, reporting and other support. Pursuant to the Shareholder Service Plan, the shareholder service fee is calculated based on average daily net assets of each class at the annual rate of 0.15% for Class III shares and 0.055% for Class VI shares.
The Manager has contractually agreed to reimburse the Fund for Fund expenses through at least June 30, 2008 to the extent the Fund's total annual operating expenses (excluding shareholder service fees, custodial fees, fees and expenses of the independent Trustees of the Trust, fees and expenses for legal services not approved by the Manager for the Trust, compensation and expenses of the Trust's Chief Compliance Officer ("CCO") (excluding any employee benefits), brokerage commissions, securities lending fees and expenses, interest expense, transfer taxes, and other investment-related costs (including expenses associated with investments in any company that is an investment company or would be an investment company under the 1940 Act, but for the exceptions to the definition of investment company provided in Section 3(c)(1) and 3(c)(7) of the 1940 Act), hedging transaction fees, extraordinary, non-recurring and certain other unus ual expenses (including taxes)) exceed 0.40% of the Fund's average daily net assets.
The Fund's portion of the fees paid by the Trust to the independent Trustees and CCO during the year ended February 29, 2008 was $8,605 and $4,537, respectively. The compensation and expenses of the CCO are included in miscellaneous expenses in the Statement of Operations. No remuneration was paid by the Fund to any other officer of the Trust.
4. Purchases and sales of securities
Cost of purchases and proceeds from sales of securities, excluding short-term investments, for the year ended February 29, 2008 aggregated $219,074,542 and $166,010,304, respectively.
5. Guarantees
In the normal course of business the Fund enters into contracts with third-party service providers that contain a variety of representations and warranties and which provide general indemnifications. The Fund's maximum exposure under these arrangements is unknown, as this would involve future claims that may be made against the Fund that have not yet occurred. Based on experience, management is of the view that the risk of loss in connection with these potential indemnification obligations is remote; however, there can be
25
GMO Emerging Markets Opportunities Fund
(formerly GMO Emerging Markets Quality Fund)
(A Series of GMO Trust)
Notes to Financial Statements — (Continued)
February 29, 2008
no assurance that material liabilities related to such obligations will not arise in the future that could adversely impact the Fund.
6. Principal shareholders and related parties
As of February 29, 2008, 45.76% of the outstanding shares of the Fund were held by one shareholder. No other shareholder owned in excess of 10% of the outstanding shares of the Fund. Investment activities of this shareholder may have a material effect on the Fund.
As of February 29, 2008, 0.09% of the Fund's shares were held by six related parties comprised of certain GMO employee accounts, and 97.85% of the Fund's shares were held by accounts for which the Manager has investment discretion.
7. Share transactions
The Declaration of Trust permits the Trustees to issue an unlimited number of shares of beneficial interest (without par value). Transactions in Fund shares were as follows:
| Year Ended February 29, 2008 | Year Ended February 28, 2007 | ||||||||||||||||||
| Class III: | Shares | Amount | Shares | Amount | |||||||||||||||
| Shares sold | 5,544,644 | $ | 72,929,163 | 6,699,064 | $ | 70,948,543 | |||||||||||||
| Shares issued to shareholders in reinvestment of distributions | 2,089,807 | 29,583,608 | 1,632,202 | 17,790,965 | |||||||||||||||
| Shares repurchased | (6,737,464 | ) | (90,607,395 | ) | (1,601,291 | ) | (18,603,383 | ) | |||||||||||
| Purchase premiums | — | 355,991 | — | 355,893 | |||||||||||||||
| Redemption fees | — | 402,910 | — | 78,579 | |||||||||||||||
| Net increase (decrease) | 896,987 | $ | 12,664,277 | 6,729,975 | $ | 70,570,597 | |||||||||||||
| Year Ended February 29, 2008 | Year Ended February 28, 2007 | ||||||||||||||||||
| Class VI: | Shares | Amount | Shares | Amount | |||||||||||||||
| Shares sold | 5,543,984 | $ | 74,667,359 | 7,184,647 | $ | 76,812,535 | |||||||||||||
| Shares issued to shareholders in reinvestment of distributions | 4,182,085 | 59,496,558 | 3,025,802 | 33,044,856 | |||||||||||||||
| Shares repurchased | (1,790,190 | ) | (23,131,107 | ) | (551,552 | ) | (5,827,163 | ) | |||||||||||
| Purchase premiums | — | 317,281 | — | 381,811 | |||||||||||||||
| Redemption fees | — | 98,926 | — | 28,163 | |||||||||||||||
| Net increase (decrease) | 7,935,879 | $ | 111,449,017 | 9,658,897 | $ | 104,440,202 | |||||||||||||
26
Report of Independent Registered Public Accounting Firm
To the Trustees of GMO Trust and the Shareholders of
GMO Emerging Markets Opportunities Fund
(formerly GMO Emerging Markets Quality Fund)
In our opinion, the accompanying statement of assets and liabilities, including the schedule of investments, and the related statements of operations and of changes in net assets and the financial highlights present fairly, in all material respects, the financial position of GMO Emerging Markets Opportunities Fund (formerly GMO Emerging Markets Quality Fund) (the "Fund") at February 29, 2008, the results of its operations for the year then ended, the changes in its net assets for each of the two years in the period then ended and the financial highlights for each of the five years in the period then ended, in conformity with accounting principles generally accepted in the United States of America. These financial statements and financial highlights (hereafter referred to as "financial statements") are the responsibility of the Fund's management; our responsibility is to express an opinion on these financial statements based on o ur audits. We conducted our audits of these financial statements in accordance with the standards of the Public Company Accounting Oversight Board (United States). Those standards require that we plan and perform the audit to obtain reasonable assurance about whether the financial statements are free of material misstatement. An audit includes examining, on a test basis, evidence supporting the amounts and disclosures in the financial statements, assessing the accounting principles used and significant estimates made by management, and evaluating the overall financial statement presentation. We believe that our audits, which included confirmation of securities at February 29, 2008 by correspondence with the custodian, provide a reasonable basis for our opinion.
PricewaterhouseCoopers LLP
Boston, Massachusetts
April 29, 2008
27
GMO Emerging Markets Opportunities Fund
(formerly GMO Emerging Markets Quality Fund)
(A Series of GMO Trust)
Fund Expenses
February 29, 2008 (Unaudited)
Expense Examples: The following information is in relation to expenses for the six month period ended February 29, 2008.
As a shareholder of the Fund, you may incur two types of costs: (1) transaction costs, including purchase premiums and redemption fees; and (2) ongoing costs, including management fees, shareholder service fees, and other Fund expenses. This example is intended to help you understand your ongoing costs (in dollars) of investing in the Fund and to compare these costs with the ongoing costs of investing in other mutual funds.
These examples are based on an investment of $1,000 invested at the beginning of the period and held for the entire period, September 1, 2007 through February 29, 2008.
Actual Expenses
The first line of the table for each class below provides information about actual account values and actual expenses. You may use the information in this line, together with the amount you invested, to estimate the expenses that you paid over the period. Simply divide your account value by $1,000 (for example, a $10,000,000 account value divided by $1,000 = 10,000), then multiply the result by the number in the first line under the heading entitled "Net Expense Incurred" to estimate the expenses you paid on your account during this period.
Hypothetical Example for Comparison Purposes
The second line of the table for each class below provides information about hypothetical account values and hypothetical expenses based on the Fund's actual expense ratio and an assumed rate of return of 5% per year before expenses, which is not the Fund's actual return. The hypothetical account values and expenses may not be used to estimate the actual ending account balance or expenses you paid for the period. You may use this information to compare the ongoing costs of investing in the Fund with other funds. To do so, compare this 5% hypothetical example with the 5% hypothetical examples that appear in the shareholder reports of other funds.
Please note that the expenses shown in the table are meant to highlight your ongoing costs only and do not reflect any transactional costs, such as purchase premiums and redemption fees. Therefore, the second line of the table is useful in comparing ongoing costs only, and will not help you determine the relative total costs of owning different funds. In addition, if these transactional costs were included, your costs would have been higher.
| Annualized Net Expense Ratio | Beginning Account Value | Ending Account Value | Net Expense Incurred* | ||||||||||||||||
| Class III | |||||||||||||||||||
| 1) Actual | 0.73 | % | $ | 1,000.00 | $ | 1,048.80 | $ | 3.72 | |||||||||||
| 2) Hypothetical | 0.73 | % | $ | 1,000.00 | $ | 1,021.23 | $ | 3.67 | |||||||||||
| Class VI | |||||||||||||||||||
| 1) Actual | 0.63 | % | $ | 1,000.00 | $ | 1,049.50 | $ | 3.21 | |||||||||||
| 2) Hypothetical | 0.63 | % | $ | 1,000.00 | $ | 1,021.73 | $ | 3.17 | |||||||||||
* Expenses are calculated using each Class's annualized net expense ratio for the six months ended February 29, 2008, multiplied by the average account value over the period, multiplied by 182 days in the period, divided by 366 days in the year.
28
GMO Emerging Markets Opportunities Fund
(formerly GMO Emerging Markets Quality Fund)
(A Series of GMO Trust)
Tax Information for the Tax Year Ended February 29, 2008 (Unaudited)
The Fund will notify shareholders of amounts for use in preparing 2008 income tax forms in January 2009.
The Fund's distributions to shareholders include $58,893,596 from long-term capital gains.
During the year ended February 29, 2008, the Fund paid foreign taxes of $2,269,127 and recognized foreign source income of $22,996,863.
For taxable, non-corporate shareholders, 32.28% of the income and short-term capital gains, if any, distributed in the Fund's fiscal year ended February 29, 2008 represents qualified dividend income subject to the 15% rate category.
The Fund hereby designates as qualified interest income and qualified short-term capital gains with respect to its taxable year ended February 29, 2008, $101,807 and $9,599,947, respectively, or if determined to be different, the qualified interest income and qualified short-term gains of such year.
29
Trustees and Officers (Unaudited)
The following tables list the Trust's Trustees and Officers as of the date of this report; their address and date of birth ("DOB"); their position with the Trust; the length of time holding that position with the Trust; their principal occupation(s) during the past five years; the number of portfolios in the fund complex they oversee; and other directorships they hold in companies subject to registration or reporting requirements of the Securities Exchange Act of 1934 (generally called "public companies") or in registered investment companies. The Trust's Statement of Additional Information ("SAI") includes additional information about the Trust's trustees, including changes subsequent to the date of the report. The SAI is available, without charge, upon request by writing GMO, c/o GMO Trust, 40 Rowes Wharf, Boston, MA 02110.
Independent Trustees:
| Name, Address, and DOB | Position(s) Held with Trust | Term of Office1 and Length of Time Served | Principal Occupation(s) During Past Five Years | Number of Portfolios in Fund Complex Overseen by Trustee | Other Directorships Held by Trustee | ||||||||||||||||||
| Donald W. Glazer, Esq. c/o GMO Trust 40 Rowes Wharf Boston, MA 02110 DOB: 07/26/1944 | Chairman of the Board of Trustees | Chairman of the Board of Trustees since March 2005; Lead Independent Trustee (September 2004 – March 2005); Trustee since December 2000. | Consultant – Law and Business2; Vice Chair (since 2002) and Secretary, Provant, Inc. (provider of personnel performance improvement services and training products); Author of Legal Treatises. | 47 | None. | ||||||||||||||||||
1 Each Trustee is elected to serve during the continued lifetime of the Trust until he/she dies, resigns or is removed, or if sooner, until the next meeting of Shareholders called for the purpose of electing Trustees and until the election and qualification of his/her successor.
2 As part of Mr. Glazer's work as a consultant, he provides part-time consulting services to Goodwin Procter LLP ("Goodwin"). Goodwin has provided legal services to Renewable Resources, LLC, an affiliate of GMO; GMO, in connection with its relationship with Renewable Resources; and funds managed by Renewable Resources. Mr. Glazer has represented that he has no financial interest in, and is not involved in the provision of, such legal services. In the calendar years ended December 31, 2006 and December 31, 2007, these entities paid $825,738 and $291,721 respectively, in legal fees and disbursements to Goodwin.
30
Independent Trustees — (Continued)
| Name, Address, and DOB | Position(s) Held with Trust | Term of Office1 and Length of Time Served | Principal Occupation(s) During Past Five Years | Number of Portfolios in Fund Complex Overseen by Trustee | Other Directorships Held by Trustee | ||||||||||||||||||
| Jay O. Light c/o GMO Trust 40 Rowes Wharf Boston, MA 02110 DOB: 10/03/1941 | Trustee | Since May 1996. | Dean (since April 2006), Acting Dean (August 2005 – April 2006), Senior Associate Dean (1998 – 2005), and Professor of Business Administration, Harvard Business School. | 47 | Director of Harvard Management Company, Inc.3 and Verde, Inc.; Director of Partners HealthCare System, Inc. and Chair of its Investment Committee.4 | ||||||||||||||||||
| W. Nicholas Thorndike c/o GMO Trust 40 Rowes Wharf Boston, MA 02110 DOB: 03/28/1933 | Trustee | Since March 2005. | Director or trustee of various corporations and charitable organizations, including Courier Corporation (a book publisher and manufacturer) (July 1989 – present); Putnam Funds (December 1992 – June 2004); and Providence Journal (a newspaper publisher) (December 1986 – December 2003). | 47 | Director of Courier Corporation (a book publisher and manufacturer); Member of the Investment Committee of Partners HealthCare System, Inc.4 | ||||||||||||||||||
1 Each Trustee is elected to serve during the continued lifetime of the Trust until he/she dies, resigns or is removed, or if sooner, until the next meeting of Shareholders called for the purpose of electing Trustees and until the election and qualification of his/her successor.
3 Harvard Management Company, Inc. is a client of the Manager.
4 Partners HealthCare System, Inc. is a client of the Manager.
31
Principal Officers:
| Name, Address, and DOB | Position(s) Held with Trust | Term of Office5 and Length of Time Served | Principal Occupation(s) During Past Five Years | ||||||||||||
| Scott Eston c/o GMO Trust 40 Rowes Wharf Boston, MA 02110 DOB: 01/20/1956 | President and Chief Executive Officer | President and Chief Executive Officer since October 2002; Chief Financial Officer, November 2006 – February 2007. | Chief Financial Officer, Chief Operating Officer and Member, Grantham, Mayo, Van Otterloo & Co. LLC. | ||||||||||||
| Sheppard N. Burnett c/o GMO Trust 40 Rowes Wharf Boston, MA 02110 DOB: 10/24/1968 | Treasurer and Chief Financial Officer | Chief Financial Officer since March 2007; Treasurer since November 2006; Assistant Treasurer, September 2004 – November 2006. | Fund Administration Staff, Grantham, Mayo, Van Otterloo & Co. LLC (June 2004 – present); Vice President, Director of Tax, Columbia Management Group (2002 – 2004). | ||||||||||||
| Brent C. Arvidson c/o GMO Trust 40 Rowes Wharf Boston, MA 02110 DOB: 06/26/1969 | Assistant Treasurer | Since August 1998. | Senior Fund Administrator, Grantham, Mayo, Van Otterloo & Co. LLC. | ||||||||||||
| John L. Nasrah c/o GMO Trust 40 Rowes Wharf Boston, MA 02110 DOB: 05/27/1977 | Assistant Treasurer | Since March 2007. | Fund Administrator, Grantham, Mayo, Van Otterloo & Co. LLC (September 2004 – present); Tax Analyst, Bain & Company, Inc (June 2003 – September 2004); Senior Tax Associate, PricewaterhouseCoopers LLP (2001 – 2003). | ||||||||||||
| Mahmoodur Rahman c/o GMO Trust 40 Rowes Wharf Boston, MA 02110 DOB: 11/30/1967 | Assistant Treasurer | Since September 2007. | Fund Administrator, Grantham, Mayo, Van Otterloo & Co. (April 2007 – present); Vice President and Senior Tax Manager, Massachusetts Financial Services Company (January 2000 – April 2007). | ||||||||||||
5 Officers are elected to hold such office until their successor is elected and qualified to carry out the duties and responsibilities of their office, or until he or she resigns or is removed from office.
32
Principal Officers — (Continued)
| Name, Address, and DOB | Position(s) Held with Trust | Term of Office5 and Length of Time Served | Principal Occupation(s) During Past Five Years | ||||||||||||
| Michael E. Gillespie c/o GMO Trust 40 Rowes Wharf Boston, MA 02110 DOB: 02/18/1958 | Chief Compliance Officer | Since March 2005. | Vice President of Compliance (June 2004 – February 2005) and Director of Domestic Compliance (March 2002 – June 2004), Fidelity Investments; Vice President and Senior Counsel, State Street Bank and Trust Company (May 1998 – March 2002). | ||||||||||||
| Jason B. Harrison c/o GMO Trust 40 Rowes Wharf Boston, MA 02110 DOB: 01/29/1977 | Vice President and Clerk | Vice President since November 2006; Clerk since March 2006. | Legal Counsel, Grantham, Mayo, Van Otterloo & Co. LLC (since February 2006) and Attorney, Ropes & Gray LLP (September 2002 – February 2006). | ||||||||||||
| David L. Bohan c/o GMO Trust 40 Rowes Wharf Boston, MA 02110 DOB: 06/21/1964 | Vice President and Assistant Clerk | Vice President since March 2005; Assistant Clerk since March 2006. | Legal Counsel, Grantham, Mayo, Van Otterloo & Co. LLC (September 2003 – present); Attorney, Goodwin Procter LLP (September 1996 – September 2003). | ||||||||||||
| Gregory L. Pottle c/o GMO Trust 40 Rowes Wharf Boston, MA 02110 DOB: 07/09/1971 | Vice President and Assistant Clerk | Since November 2006. | Legal Counsel, Grantham, Mayo, Van Otterloo & Co. LLC. | ||||||||||||
| Anne K. Trinque c/o GMO Trust 40 Rowes Wharf Boston, MA 02110 DOB: 04/15/1978 | Vice President and Assistant Clerk | Since September 2007. | Legal Counsel, Grantham, Mayo, Van Otterloo & Co. LLC (since January 2007); Attorney, Goodwin Procter LLP (September 2003 – January 2007). | ||||||||||||
| Cheryl Wakeham c/o GMO Trust 40 Rowes Wharf Boston, MA 02110 DOB: 10/29/1958 | Anti-Money Laundering Officer | Since December 2004. | Manager, Client Service Administration, Grantham, Mayo, Van Otterloo & Co. LLC. | ||||||||||||
5 Officers are elected to hold such office until their successor is elected and qualified to carry out the duties and responsibilities of their office, or until he or she resigns or is removed from office.
33
GMO International Intrinsic Value Fund
(A Series of GMO Trust)
Annual Report
February 29, 2008
For a free copy of the Fund's proxy voting guidelines, shareholders may call 1-617-346-7646 (collect), visit our website at www.gmo.com, or visit the Securities and Exchange Commission's website at www.sec.gov. Information regarding how the Fund voted proxies relating to portfolio securities during the most recent 12-month period ended June 30 is available on our website at www.gmo.com, or on the Securities and Exchange Commission's website at www.sec.gov.
The Fund files its complete schedule of portfolio holdings with the Securities and Exchange Commission for the first and third quarter of each fiscal year on Form N-Q, which is available on the Commission's website at www.sec.gov. The Fund's Form N-Q may be reviewed and copied at the Commission's Public Reference Room in Washington, D.C. Information on the operation of the Public Reference Room may be obtained by calling 1-800-SEC-0330. The Fund has a policy with respect to disclosure of portfolio holdings under which it may also make available on GMO's website (www.gmo.com) a complete schedule of portfolio holdings.
This report is prepared for the general information of shareholders. It is authorized for distribution to prospective investors only when preceded or accompanied by a prospectus for the GMO Trust.
GMO International Intrinsic Value Fund
(A Series of GMO Trust)
Portfolio Management
Day-to-day management of the Fund's portfolio is the responsibility of the International Quantitative team at Grantham, Mayo, Van Otterloo & Co. LLC.
Management Discussion and Analysis of Fund Performance
The Class III shares of the GMO International Intrinsic Value Fund returned -1.1% for the fiscal year ended February 29, 2008, as compared to +0.8% for the MSCI EAFE Index and +1.1% for the S&P/Citigroup PMI EPAC Value Index. Consistent with the Fund's investment objectives and policies, the Fund was invested substantially in international equity securities throughout the period.
Stock selection had the biggest negative impact on relative performance. Holdings in British bank Royal Bank of Scotland, British pharmaceutical GlaxoSmithKline, and Japanese auto maker Honda Motor were the most significant detractors. On the positive side were holdings in Australian mining company Rio Tinto, Dutch bank ABN AMRO, and French steel maker ArcelorMittal, all of which outperformed strongly.
Country allocation had minimal impact on relative performance. Overweights to Germany and the Netherlands helped, while an overweight to Belgium hurt. In addition, not holding Korea, which GMO classifies as an emerging market but S&P/Citigroup considers developed, reduced returns against the value index.
Currency allocation had a positive impact as our underweight to the British pound and overweight to the Canadian dollar added value. The U.S. dollar weakened relative to most foreign currencies which boosted returns for U.S. investors. The MSCI EAFE Index returned 10% more in U.S. dollar terms than in local currency.
Sector exposures had a positive impact. Our underweight to Financials and overweight to Energy helped while our underweight to Consumer Staples hurt.
Among GMO's international quantitative stock selection disciplines, momentum did better than valuation, but all underperformed. Stocks favored for their strong momentum characteristics missed slightly relative to EAFE, while those highly ranked by intrinsic value or by quality-adjusted value lagged by a wider margin.
The views expressed herein are exclusively those of Grantham, Mayo, Van Otterloo & Co. LLC Management as of the date of this report and are subject to change. GMO disclaims any responsibility to update such views. They are not meant as investment advice. References to specific securities are not recommendations of such securities and may not be representative of any GMO portfolio's current or future investments.

Performance data quoted represents past performance and is not indicative of future results. The investment return and principal value of an investment will fluctuate so that an investor's shares, when redeemed, may be worth more or less than their original cost. Current performance data may be lower or higher than the performance data provided herein. To obtain performance information to the most recent month-end, visit www.gmo.com. Performance shown is net of all fees after reimbursement from the Manager. Returns would have been lower had certain expenses not been reimbursed during the periods shown and do not include the effect of taxes on distributions and redemptions. All information is unaudited. Performance for Classes II, IV and M will vary due to different fees.
GMO International Intrinsic Value Fund
(A Series of GMO Trust)
Investments Concentration Summary
February 29, 2008 (Unaudited)
| Asset Class Summary | % of Total Net Assets | ||||||
| Common Stocks | 94.8 | % | |||||
| Short-Term Investments | 3.8 | ||||||
| Preferred Stocks | 0.4 | ||||||
| Forward Currency Contracts | 0.3 | ||||||
| Rights and Warrants | 0.0 | ||||||
| Futures | (0.8 | ) | |||||
| Other | 1.5 | ||||||
| 100.0 | % | ||||||
| Country Summary | % of Equity Investments | ||||||
| Japan | 22.4 | % | |||||
| United Kingdom | 22.4 | ||||||
| France | 12.7 | ||||||
| Germany | 7.5 | ||||||
| Australia | 5.1 | ||||||
| Switzerland | 4.3 | ||||||
| Finland | 4.3 | ||||||
| Italy | 4.1 | ||||||
| Netherlands | 3.6 | ||||||
| Canada | 2.5 | ||||||
| Spain | 2.4 | ||||||
| Hong Kong | 2.0 | ||||||
| Singapore | 1.9 | ||||||
| Belgium | 1.5 | ||||||
| Sweden | 1.4 | ||||||
| Norway | 0.8 | ||||||
| Ireland | 0.6 | ||||||
| Austria | 0.2 | ||||||
| Denmark | 0.2 | ||||||
| Greece | 0.1 | ||||||
| 100.0 | % | ||||||
1
GMO International Intrinsic Value Fund
(A Series of GMO Trust)
Investments Concentration Summary — (Continued)
February 29, 2008 (Unaudited)
| Industry Sector Summary | % of Equity Investments | ||||||
| Financials | 20.9 | % | |||||
| Energy | 15.7 | ||||||
| Health Care | 11.9 | ||||||
| Consumer Discretionary | 10.8 | ||||||
| Materials | 9.3 | ||||||
| Telecommunication Services | 9.2 | ||||||
| Industrials | 7.9 | ||||||
| Information Technology | 5.5 | ||||||
| Utilities | 4.5 | ||||||
| Consumer Staples | 4.3 | ||||||
| 100.0 | % | ||||||
2
GMO International Intrinsic Value Fund
(A Series of GMO Trust)
Schedule of Investments
(showing percentage of total net assets)
February 29, 2008
| Shares | Description | Value ($) | |||||||||||||
| COMMON STOCKS — 94.8% | |||||||||||||||
| Australia — 4.9% | |||||||||||||||
| 1,127,380 | Australia and New Zealand Banking Group Ltd | 22,749,877 | |||||||||||||
| 1,856,798 | BHP Billiton Ltd | 67,184,149 | |||||||||||||
| 1,690,912 | BlueScope Steel Ltd | 16,914,481 | |||||||||||||
| 315,009 | Commonwealth Bank of Australia | 12,198,371 | |||||||||||||
| 162,800 | Macquarie Group Ltd | 8,130,296 | |||||||||||||
| 4,232,474 | Mirvac Group Ltd | 15,002,995 | |||||||||||||
| 2,414,840 | Qantas Airways Ltd | 9,391,847 | |||||||||||||
| 297,833 | QBE Insurance Group Ltd | 6,160,307 | |||||||||||||
| 368,880 | Santos Ltd | 4,372,453 | |||||||||||||
| 5,732,648 | Stockland | 37,099,239 | |||||||||||||
| 2,571,958 | Suncorp-Metway Ltd | 32,993,563 | |||||||||||||
| 242,694 | TABCORP Holdings Ltd | 3,421,315 | |||||||||||||
| 6,732,990 | Telstra Corp Ltd | 30,267,354 | |||||||||||||
| 1,352,222 | Westpac Banking Corp | 28,922,227 | |||||||||||||
| 847,188 | Woodside Petroleum Ltd | 44,300,761 | |||||||||||||
| 254,630 | Woolworths Ltd | 6,800,446 | |||||||||||||
| 788,833 | Zinifex Ltd | 7,936,685 | |||||||||||||
| Total Australia | 353,846,366 | ||||||||||||||
| Austria — 0.2% | |||||||||||||||
| 204,281 | OMV AG | 14,760,320 | |||||||||||||
| Belgium — 1.4% | |||||||||||||||
| 60,387 | Belgacom SA | 2,892,055 | |||||||||||||
| 23,323 | Colruyt SA | 5,698,923 | |||||||||||||
| 40,503 | Delhaize Group | 3,067,392 | |||||||||||||
| 1,798,600 | Dexia | 42,285,214 | |||||||||||||
| 2,132,999 | Fortis | 47,123,115 | |||||||||||||
| 28,241 | Solvay SA | 3,549,077 | |||||||||||||
| Total Belgium | 104,615,776 | ||||||||||||||
See accompanying notes to the financial statements.
3
GMO International Intrinsic Value Fund
(A Series of GMO Trust)
Schedule of Investments — (Continued)
(showing percentage of total net assets)
February 29, 2008
| Shares | Description | Value ($) | |||||||||||||
| Canada — 2.4% | |||||||||||||||
| 131,200 | Bank of Montreal | 6,624,984 | |||||||||||||
| 322,611 | BCE Inc | 11,691,678 | |||||||||||||
| 402,800 | Canadian Imperial Bank of Commerce | 27,333,515 | |||||||||||||
| 229,300 | Canadian Natural Resources | 17,183,813 | |||||||||||||
| 56,700 | Canadian Pacific Railway Ltd | 4,121,227 | |||||||||||||
| 447,000 | EnCana Corp | 34,075,093 | |||||||||||||
| 147,600 | Magna International Inc Class A | 10,824,250 | |||||||||||||
| 530,300 | National Bank of Canada | 26,174,218 | |||||||||||||
| 344,000 | Sun Life Financial Inc | 16,479,147 | |||||||||||||
| 190,500 | Suncor Energy Inc | 19,645,161 | |||||||||||||
| Total Canada | 174,153,086 | ||||||||||||||
| Denmark — 0.2% | |||||||||||||||
| 332,800 | Danske Bank A/S (a) | 12,712,361 | |||||||||||||
| Finland — 4.1% | |||||||||||||||
| 329,570 | Neste Oil Oyj | 11,531,360 | |||||||||||||
| 5,936,592 | Nokia Oyj | 213,287,663 | |||||||||||||
| 348,479 | Outokumpu Oyj | 13,217,461 | |||||||||||||
| 510,317 | Rautaruukki Oyj | 22,250,003 | |||||||||||||
| 1,110,219 | Sampo Oyj Class A | 30,131,645 | |||||||||||||
| 38,955 | Stockmann Oyj AB Class A | 1,830,144 | |||||||||||||
| 21,113 | Wartsila Oyj Class A | 1,633,816 | |||||||||||||
| 66,708 | Wartsila Oyj Class B | 4,559,927 | |||||||||||||
| Total Finland | 298,442,019 | ||||||||||||||
| France — 12.0% | |||||||||||||||
| 999,657 | Arcelor Mittal (a) | 75,902,407 | |||||||||||||
| 826,470 | BNP Paribas | 73,886,341 | |||||||||||||
| 17,258 | Bongrain SA | 1,902,158 | |||||||||||||
| 100,462 | Bouygues | 6,861,575 | |||||||||||||
| 118,326 | Casino Guichard-Perrachon SA | 13,383,521 | |||||||||||||
| 189,857 | Cie de Saint-Gobain | 14,841,957 | |||||||||||||
| 301,329 | Credit Agricole SA | 8,173,485 | |||||||||||||
| 90,739 | Essilor International SA | 5,387,876 | |||||||||||||
See accompanying notes to the financial statements.
4
GMO International Intrinsic Value Fund
(A Series of GMO Trust)
Schedule of Investments — (Continued)
(showing percentage of total net assets)
February 29, 2008
| Shares | Description | Value ($) | |||||||||||||
| France — continued | |||||||||||||||
| 1,103,013 | France Telecom SA | 37,027,076 | |||||||||||||
| 3,655 | Fromageries Bel | 957,724 | |||||||||||||
| 51,142 | Hermes International | 5,985,347 | |||||||||||||
| 82,853 | L'Oreal SA | 9,832,316 | |||||||||||||
| 56,145 | Michelin SA Class B | 5,529,737 | |||||||||||||
| 703,581 | Peugeot SA | 53,485,690 | |||||||||||||
| 289,154 | Renault SA | 30,895,089 | |||||||||||||
| 2,682,871 | Sanofi-Aventis | 198,298,108 | |||||||||||||
| 266,693 | Societe Generale | 28,535,941 | |||||||||||||
| 66,673 | Societe Generale NV (New Shares) * | 7,326,276 | |||||||||||||
| 3,957,451 | Total SA | 298,012,030 | |||||||||||||
| Total France | 876,224,654 | ||||||||||||||
| Germany — 6.8% | |||||||||||||||
| 758 | Aareal Bank AG | 25,780 | |||||||||||||
| 271,462 | Adidas AG | 17,229,956 | |||||||||||||
| 107,805 | Allianz SE (Registered) | 18,584,851 | |||||||||||||
| 518,023 | BASF AG | 66,242,500 | |||||||||||||
| 163,521 | Bayer AG | 12,584,482 | |||||||||||||
| 522,346 | Bayerische Motoren Werke AG | 28,781,920 | |||||||||||||
| 697,207 | Daimler AG (Registered) | 58,059,017 | |||||||||||||
| 150,896 | Deutsche Bank AG (Registered) | 16,740,681 | |||||||||||||
| 325,823 | E.ON AG | 61,344,586 | |||||||||||||
| 58,487 | Linde AG | 7,774,569 | |||||||||||||
| 106,469 | MAN AG | 14,043,397 | |||||||||||||
| 196,304 | Muenchener Rueckversicherungs AG (Registered) | 34,539,558 | |||||||||||||
| 181,683 | RWE AG | 21,995,512 | |||||||||||||
| 171,703 | Salzgitter AG | 30,096,438 | |||||||||||||
| 617,306 | SAP AG | 29,152,145 | |||||||||||||
| 574,649 | ThyssenKrupp AG | 33,046,553 | |||||||||||||
| 186,022 | Volkswagen AG | 42,356,227 | |||||||||||||
| Total Germany | 492,598,172 | ||||||||||||||
| Greece — 0.1% | |||||||||||||||
| 148,497 | Alpha Bank A.E. | 4,504,621 | |||||||||||||
See accompanying notes to the financial statements.
5
GMO International Intrinsic Value Fund
(A Series of GMO Trust)
Schedule of Investments — (Continued)
(showing percentage of total net assets)
February 29, 2008
| Shares | Description | Value ($) | |||||||||||||
| Hong Kong — 1.9% | |||||||||||||||
| 290,000 | Cheung Kong Holdings Ltd | 4,331,843 | |||||||||||||
| 5,688,098 | CLP Holdings Ltd | 44,464,577 | |||||||||||||
| 535,200 | Esprit Holdings Ltd | 6,725,872 | |||||||||||||
| 171,000 | Guoco Group | 1,940,789 | |||||||||||||
| 542,700 | Hang Seng Bank Ltd | 10,272,320 | |||||||||||||
| 1,094,000 | Henderson Land Development Co Ltd | 8,493,589 | |||||||||||||
| 1,636,000 | Hong Kong & China Gas | 4,764,107 | |||||||||||||
| 290,700 | Hong Kong Aircraft Engineering Co Ltd | 6,424,390 | |||||||||||||
| 4,471,969 | Hong Kong Electric Holdings Ltd | 25,325,794 | |||||||||||||
| 564,700 | Hong Kong Ferry Co Ltd | 543,146 | |||||||||||||
| 1,302,000 | Sino Land | 3,253,335 | |||||||||||||
| 947,000 | Sun Hung Kai Properties Ltd | 16,502,856 | |||||||||||||
| 2,664,400 | Yue Yuen Industrial Holdings | 7,885,204 | |||||||||||||
| Total Hong Kong | 140,927,822 | ||||||||||||||
| Ireland — 0.6% | |||||||||||||||
| 580,741 | Bank of Ireland | 8,169,387 | |||||||||||||
| 906,394 | CRH Plc | 33,686,610 | |||||||||||||
| Total Ireland | 41,855,997 | ||||||||||||||
| Italy — 3.9% | |||||||||||||||
| 1,152,750 | AEM SPA | 4,663,351 | |||||||||||||
| 275,283 | Banco Popolare Scarl * | 5,205,330 | |||||||||||||
| 1,142,358 | Enel SPA | 12,326,503 | |||||||||||||
| 6,766,600 | ENI SPA | 233,659,039 | |||||||||||||
| 141,901 | Fiat SPA - Di RISP | 2,371,464 | |||||||||||||
| 174,411 | Fondiaria - Sai SPA - Di RISP | 5,308,298 | |||||||||||||
| 291,136 | Italcementi SPA - Di RISP | 4,427,704 | |||||||||||||
| 197,819 | Luxottica Group SPA | 5,449,677 | |||||||||||||
| 690,888 | Mediaset SPA | 6,239,318 | |||||||||||||
| 97,300 | Natuzzi SPA ADR * | 374,605 | |||||||||||||
| 779,886 | Snam Rete Gas SPA | 5,423,238 | |||||||||||||
| Total Italy | 285,448,527 | ||||||||||||||
See accompanying notes to the financial statements.
6
GMO International Intrinsic Value Fund
(A Series of GMO Trust)
Schedule of Investments — (Continued)
(showing percentage of total net assets)
February 29, 2008
| Shares | Description | Value ($) | |||||||||||||
| Japan — 21.3% | |||||||||||||||
| 437,470 | Acom Co Ltd | 12,653,727 | |||||||||||||
| 310,800 | Aiful Corp | 5,530,682 | |||||||||||||
| 371,000 | Aisin Seiki Co Ltd | 14,777,812 | |||||||||||||
| 478,900 | Asahi Breweries | 8,951,598 | |||||||||||||
| 1,144,000 | Asahi Kasei Corp | 6,295,823 | |||||||||||||
| 2,015,000 | Cosmo Oil Co Ltd | 6,658,498 | |||||||||||||
| 397,780 | Daiichi Sankyo Co Ltd | 12,344,505 | |||||||||||||
| 503,000 | Dainippon Ink and Chemicals Inc | 1,829,861 | |||||||||||||
| 320,500 | Denso Corp | 11,964,759 | |||||||||||||
| 314,000 | Eisai Co Ltd | 11,324,228 | |||||||||||||
| 71,700 | FamilyMart Co Ltd | 2,112,813 | |||||||||||||
| 118,800 | Fanuc Ltd | 11,075,586 | |||||||||||||
| 81,100 | Fast Retailing Co Ltd | 5,991,053 | |||||||||||||
| 3,223,000 | Fuji Heavy Industries Ltd | 14,060,262 | |||||||||||||
| 873,000 | Fujitsu Ltd | 6,211,498 | |||||||||||||
| 1,779,000 | Hitachi Ltd | 12,890,318 | |||||||||||||
| 453,000 | Hokkaido Electric Power | 10,144,161 | |||||||||||||
| 3,944,000 | Honda Motor Co Ltd | 120,391,900 | |||||||||||||
| 580,600 | Hoya Corp | 14,731,527 | |||||||||||||
| 2,074,000 | Isuzu Motors Ltd | 9,444,456 | |||||||||||||
| 5,760,000 | Itochu Corp | 60,654,857 | |||||||||||||
| 532,600 | JFE Holdings Inc | 23,731,473 | |||||||||||||
| 1,069,000 | Kao Corp | 32,912,181 | |||||||||||||
| 3,525,000 | Kawasaki Kisen Kaisha Ltd | 35,757,652 | |||||||||||||
| 24,700 | Keyence Corp | 5,763,275 | |||||||||||||
| 280,000 | Konami Corp | 9,271,587 | |||||||||||||
| 642,000 | Konica Minolta Holdings Inc | 9,095,311 | |||||||||||||
| 529,000 | Kurray Co Ltd | 6,310,319 | |||||||||||||
| 804,800 | Kyushu Electric Power Co Inc | 20,277,589 | |||||||||||||
| 5,062,000 | Marubeni Corp | 38,324,924 | |||||||||||||
| 527,000 | Matsushita Electric Industrial Co Ltd | 11,099,358 | |||||||||||||
| 1,408,000 | Mazda Motor Corp | 5,737,059 | |||||||||||||
| 965,500 | Mitsubishi Chemical Holdings | 6,530,590 | |||||||||||||
| 2,550,900 | Mitsubishi Corp | 77,829,189 | |||||||||||||
See accompanying notes to the financial statements.
7
GMO International Intrinsic Value Fund
(A Series of GMO Trust)
Schedule of Investments — (Continued)
(showing percentage of total net assets)
February 29, 2008
| Shares | Description | Value ($) | |||||||||||||
| Japan — continued | |||||||||||||||
| 1,837,000 | Mitsubishi Electric Corp | 16,825,919 | |||||||||||||
| 389,000 | Mitsubishi Gas Chemical Co Inc | 2,884,740 | |||||||||||||
| 2,589,000 | Mitsui & Co | 56,304,106 | |||||||||||||
| 2,032,000 | Mitsui OSK Lines Ltd | 26,391,379 | |||||||||||||
| 3,486,000 | Mitsui Trust Holding Inc | 24,030,512 | |||||||||||||
| 108,200 | Murata Manufacturing Co Ltd | 5,870,709 | |||||||||||||
| 27,400 | Nintendo Co Ltd | 13,642,342 | |||||||||||||
| 2,671,500 | Nippon Mining Holdings Inc | 15,822,897 | |||||||||||||
| 5,246,000 | Nippon Oil Corp | 35,786,496 | |||||||||||||
| 926,000 | Nippon Sheet Glass | 4,329,575 | |||||||||||||
| 2,702,000 | Nippon Steel Corp | 14,215,763 | |||||||||||||
| 10,823 | Nippon Telegraph & Telephone Corp | 47,196,220 | |||||||||||||
| 3,433,000 | Nippon Yusen KK | 31,722,397 | |||||||||||||
| 8,056,100 | Nissan Motor Co | 72,448,285 | |||||||||||||
| 87,700 | Nitto Denko Corp | 4,269,949 | |||||||||||||
| 34,830 | NTT Docomo Inc | 51,028,390 | |||||||||||||
| 177,000 | Olympus Corp | 5,182,846 | |||||||||||||
| 163,700 | Ono Pharmaceutical Co Ltd | 8,264,602 | |||||||||||||
| 8,812,000 | Osaka Gas Co Ltd | 35,356,816 | |||||||||||||
| 361,050 | Promise Co Ltd | 12,071,161 | |||||||||||||
| 25,578 | Resona Holdings Inc | 41,372,778 | |||||||||||||
| 1,454,000 | Ricoh Company Ltd | 23,351,430 | |||||||||||||
| 59,500 | Rohm Co Ltd | 4,339,665 | |||||||||||||
| 68,500 | Sankyo Co Ltd Gunma | 3,660,515 | |||||||||||||
| 41,048 | SBI Holdings Inc | 10,053,004 | |||||||||||||
| 941,900 | Sega Sammy Holdings Inc | 10,392,114 | |||||||||||||
| 1,829,500 | Seven & I Holdings Co Ltd | 45,491,010 | |||||||||||||
| 610,200 | Shin-Etsu Chemical Co Ltd | 32,930,286 | |||||||||||||
| 1,070,000 | Shinko Securities Co Ltd | 3,672,221 | |||||||||||||
| 1,054,000 | Showa Shell Sekiyu KK | 10,693,078 | |||||||||||||
| 5,790,200 | Sojitz Corp | 21,704,728 | |||||||||||||
| 204,400 | Sony Corp | 9,656,513 | |||||||||||||
| 457,100 | SUMCO Corp | 10,108,131 | |||||||||||||
| 920,000 | Sumitomo Chemical Co Ltd | 6,368,542 | |||||||||||||
See accompanying notes to the financial statements.
8
GMO International Intrinsic Value Fund
(A Series of GMO Trust)
Schedule of Investments — (Continued)
(showing percentage of total net assets)
February 29, 2008
| Shares | Description | Value ($) | |||||||||||||
| Japan — continued | |||||||||||||||
| 1,916,100 | Sumitomo Corp | 27,555,814 | |||||||||||||
| 598,400 | Sumitomo Electric Industries Ltd | 8,855,132 | |||||||||||||
| 197,800 | Suzuki Motor Corp | 5,342,552 | |||||||||||||
| 504,000 | Taisho Pharmaceutical Co Ltd | 10,270,697 | |||||||||||||
| 837,200 | Takeda Pharmaceutical Co Ltd | 46,714,947 | |||||||||||||
| 913,510 | Takefuji Corp | 23,073,480 | |||||||||||||
| 159,500 | TDK Corp | 11,337,701 | |||||||||||||
| 80,700 | Terumo Corp | 4,381,795 | |||||||||||||
| 172,900 | Tokyo Electric Power Co Inc | 4,442,159 | |||||||||||||
| 2,833,000 | Tokyo Gas Co Ltd | 12,708,204 | |||||||||||||
| 896,000 | TonenGeneral Sekiyu KK | 8,506,147 | |||||||||||||
| 848,000 | Tosoh Corp | 3,032,857 | |||||||||||||
| 200 | Toyota Industries Corp | 7,570 | |||||||||||||
| 137,400 | Toyota Tsusho Kaisha | 3,488,093 | |||||||||||||
| 1,263,000 | Ube Industries Ltd | 3,881,807 | |||||||||||||
| 894 | West Japan Railway Co | 4,090,033 | |||||||||||||
| 15,344 | Yahoo Japan Corp | 6,821,998 | |||||||||||||
| 89,000 | Yamato Kogyo Co | 3,745,288 | |||||||||||||
| Total Japan | 1,548,375,824 | ||||||||||||||
| Netherlands — 3.4% | |||||||||||||||
| 4,238,988 | Aegon NV | 63,307,154 | |||||||||||||
| 11,644 | Gamma Holdings NV | 775,480 | |||||||||||||
| 442,871 | Heineken NV | 24,978,140 | |||||||||||||
| 4,080,278 | ING Groep NV | 135,594,559 | |||||||||||||
| 256,990 | Koninklijke DSM | 11,309,221 | |||||||||||||
| 429,906 | Reed Elsevier NV | 7,986,818 | |||||||||||||
| 150,599 | TNT NV | 5,930,962 | |||||||||||||
| Total Netherlands | 249,882,334 | ||||||||||||||
| Norway — 0.8% | |||||||||||||||
| 938,100 | DnB NOR ASA | 13,722,142 | |||||||||||||
| 1,202,600 | StatoilHydro ASA | 36,644,792 | |||||||||||||
| 121,400 | Yara International ASA | 6,778,535 | |||||||||||||
| Total Norway | 57,145,469 | ||||||||||||||
See accompanying notes to the financial statements.
9
GMO International Intrinsic Value Fund
(A Series of GMO Trust)
Schedule of Investments — (Continued)
(showing percentage of total net assets)
February 29, 2008
| Shares | Description | Value ($) | |||||||||||||
| Singapore — 1.8% | |||||||||||||||
| 2,384,000 | Neptune Orient Lines Ltd | 5,209,798 | |||||||||||||
| 3,387,000 | Oversea-Chinese Banking Corp | 18,271,201 | |||||||||||||
| 3,258,100 | Sembcorp Industries Ltd | 10,954,774 | |||||||||||||
| 4,795,000 | SembCorp Marine Ltd | 12,280,205 | |||||||||||||
| 848,000 | Singapore Exchange Ltd | 4,934,194 | |||||||||||||
| 4,145,000 | Singapore Press Holdings Ltd | 12,916,092 | |||||||||||||
| 17,953,000 | Singapore Telecommunications | 48,575,678 | |||||||||||||
| 893,201 | Straits Trading Co Ltd | 4,302,912 | |||||||||||||
| 1,133,000 | United Overseas Bank Ltd | 14,365,764 | |||||||||||||
| Total Singapore | 131,810,618 | ||||||||||||||
| Spain — 2.3% | |||||||||||||||
| 118,893 | Gas Natural SDG SA | 7,204,157 | |||||||||||||
| 1,039,192 | Iberdrola SA | 15,008,809 | |||||||||||||
| 245,536 | Inditex SA | 12,658,275 | |||||||||||||
| 1,669,334 | Repsol YPF SA | 57,586,379 | |||||||||||||
| 2,496,488 | Telefonica SA | 72,239,741 | |||||||||||||
| Total Spain | 164,697,361 | ||||||||||||||
| Sweden — 1.3% | |||||||||||||||
| 387,125 | Hennes & Mauritz AB Class B | 21,713,116 | |||||||||||||
| 1,404,200 | Investor AB | 29,702,243 | |||||||||||||
| 572,600 | SKF AB Class B | 10,531,110 | |||||||||||||
| 493,800 | Svenska Handelsbanken AB Class A | 13,756,696 | |||||||||||||
| 237,300 | Swedbank AB | 6,413,712 | |||||||||||||
| 291,500 | Tele2 AB Class B | 5,123,627 | |||||||||||||
| 716,500 | TeliaSonera AB | 5,708,156 | |||||||||||||
| 408,700 | Volvo AB Class A | 6,039,866 | |||||||||||||
| Total Sweden | 98,988,526 | ||||||||||||||
| Switzerland — 4.1% | |||||||||||||||
| 255,426 | CIE Financiere Richemont SA Class A | 14,786,288 | |||||||||||||
| 127,868 | Nestle SA (Registered) | 61,029,906 | |||||||||||||
| 2,830,947 | Novartis AG (Registered) | 139,828,372 | |||||||||||||
See accompanying notes to the financial statements.
10
GMO International Intrinsic Value Fund
(A Series of GMO Trust)
Schedule of Investments — (Continued)
(showing percentage of total net assets)
February 29, 2008
| Shares | Description | Value ($) | |||||||||||||
| Switzerland — continued | |||||||||||||||
| 28,365 | Swatch Group AG | 8,325,836 | |||||||||||||
| 358,963 | Swiss Reinsurance Co (Registered) | 28,772,143 | |||||||||||||
| 33,591 | Synthes Inc | 4,707,493 | |||||||||||||
| 136,229 | Zurich Financial Services AG | 42,586,704 | |||||||||||||
| Total Switzerland | 300,036,742 | ||||||||||||||
| United Kingdom — 21.3% | |||||||||||||||
| 1,932,712 | 3i Group Plc | 31,236,240 | |||||||||||||
| 835,467 | Alliance & Leicester Plc | 9,265,931 | |||||||||||||
| 571,310 | Antofagasta Plc | 9,105,726 | |||||||||||||
| 1,644,004 | AstraZeneca Plc | 61,448,602 | |||||||||||||
| 1,934,426 | Aviva Plc | 23,316,498 | |||||||||||||
| 3,692,702 | Barclays Plc | 34,609,180 | |||||||||||||
| 2,134,998 | BG Group Plc | 50,324,002 | |||||||||||||
| 474,654 | BHP Billiton Plc | 15,184,236 | |||||||||||||
| 452,836 | British American Tobacco Plc | 16,979,913 | |||||||||||||
| 692,866 | Cadbury Schweppes Plc | 7,712,468 | |||||||||||||
| 249,251 | Capita Group Plc | 3,229,634 | |||||||||||||
| 857,388 | Diageo Plc | 17,520,571 | |||||||||||||
| 401,044 | FirstGroup Plc | 4,578,637 | |||||||||||||
| 14,306,808 | GlaxoSmithKline Plc | 312,296,718 | |||||||||||||
| 3,943,691 | HBOS Plc | 46,862,708 | |||||||||||||
| 2,998,337 | Home Retail Group | 15,315,834 | |||||||||||||
| 400,379 | International Power Plc | 3,007,982 | |||||||||||||
| 4,451,832 | Kingfisher Plc | 11,491,855 | |||||||||||||
| 137,170 | London Stock Exchange | 3,678,437 | |||||||||||||
| 504,514 | Next Plc | 12,795,439 | |||||||||||||
| 6,401,411 | Old Mutual Plc | 15,812,137 | |||||||||||||
| 196,978 | Reckitt Benckiser Group Plc | 10,625,240 | |||||||||||||
| 581,886 | Reed Elsevier Plc | 7,323,603 | |||||||||||||
| 723,713 | Rio Tinto Plc | 81,423,188 | |||||||||||||
| 19,768,853 | Royal Bank of Scotland Group | 149,462,938 | |||||||||||||
| 1,344,333 | Royal Dutch Shell Group Class A (Amsterdam) | 48,072,767 | |||||||||||||
| 3,163,617 | Royal Dutch Shell Plc A Shares (London) | 113,119,456 | |||||||||||||
See accompanying notes to the financial statements.
11
GMO International Intrinsic Value Fund
(A Series of GMO Trust)
Schedule of Investments — (Continued)
(showing percentage of total net assets)
February 29, 2008
| Shares | Description | Value ($) | |||||||||||||
| United Kingdom — continued | |||||||||||||||
| 719,788 | Royal Dutch Shell Plc B Shares (London) | 25,251,577 | |||||||||||||
| 814,502 | Sage Group Plc | 3,175,249 | |||||||||||||
| 343,931 | Scottish & Southern Energy Plc | 10,056,760 | |||||||||||||
| 463,122 | Smith & Nephew Plc | 6,017,400 | |||||||||||||
| 2,881,273 | Taylor Woodrow Plc | 9,749,500 | |||||||||||||
| 1,418,284 | Tesco Plc | 11,207,704 | |||||||||||||
| 706,644 | Unilever Plc | 22,263,715 | |||||||||||||
| 764,160 | United Utilities Plc | 10,463,764 | |||||||||||||
| 98,343,721 | Vodafone Group Inc | 316,609,586 | |||||||||||||
| 591,770 | Wolseley Plc | 7,241,518 | |||||||||||||
| 127,799 | Xstrata Plc | 9,969,650 | |||||||||||||
| Total United Kingdom | 1,547,806,363 | ||||||||||||||
| TOTAL COMMON STOCKS (COST $6,493,177,392) | 6,898,832,958 | ||||||||||||||
| PREFERRED STOCKS — 0.4% | |||||||||||||||
| Germany — 0.4% | |||||||||||||||
| 9,049 | Villeroy & Boch AG (Non Voting) 4.37% | 130,262 | |||||||||||||
| 200,958 | Volkswagen AG 2.02% | 28,001,103 | |||||||||||||
| Total Germany | 28,131,365 | ||||||||||||||
| Italy — 0.0% | |||||||||||||||
| 67,260 | Fiat SPA 3.57% | 1,135,788 | |||||||||||||
| TOTAL PREFERRED STOCKS (COST $7,676,890) | 29,267,153 | ||||||||||||||
| RIGHTS AND WARRANTS — 0.0% | |||||||||||||||
| France — 0.0% | |||||||||||||||
| 1 | Societe Generale Rights, Expires 02/29/08 * (b) | 9 | |||||||||||||
| TOTAL RIGHTS AND WARRANTS (COST $7) | 9 | ||||||||||||||
See accompanying notes to the financial statements.
12
GMO International Intrinsic Value Fund
(A Series of GMO Trust)
Schedule of Investments — (Continued)
(showing percentage of total net assets)
February 29, 2008
| Shares / Par Value ($) | Description | Value ($) | |||||||||||||
| SHORT-TERM INVESTMENTS — 3.8% | |||||||||||||||
| 21,714,791 | Bank of New York Mellon Institutional Cash Reserves Fund (c) | 21,714,791 | |||||||||||||
| 251,100,000 | ING Bank Time Deposit, 3.13%, due 03/03/08 | 251,100,000 | |||||||||||||
| TOTAL SHORT-TERM INVESTMENTS (COST $272,814,791) | 272,814,791 | ||||||||||||||
| TOTAL INVESTMENTS — 99.0% (Cost $6,773,669,080) | 7,200,914,911 | ||||||||||||||
| Other Assets and Liabilities (net) — 1.0% | 75,048,280 | ||||||||||||||
| TOTAL NET ASSETS — 100.0% | $ | 7,275,963,191 | |||||||||||||
See accompanying notes to the financial statements.
13
GMO International Intrinsic Value Fund
(A Series of GMO Trust)
Schedule of Investments — (Continued)
February 29, 2008
A summary of outstanding financial instruments at February 29, 2008 is as follows:
Forward Currency Contracts
| Settlement Date | Deliver/Receive | Units of Currency | Value | Net Unrealized Appreciation (Depreciation) | |||||||||||||||||||
| Buys | |||||||||||||||||||||||
| 5/23/08 | CAD | 13,782,806 | $ | 13,980,951 | $ | 349,657 | |||||||||||||||||
| 5/23/08 | CAD | 14,200,467 | 14,404,616 | 384,628 | |||||||||||||||||||
| 5/23/08 | CAD | 13,782,806 | 13,980,951 | 370,320 | |||||||||||||||||||
| 5/23/08 | CHF | 92,224,989 | 88,588,717 | 4,228,620 | |||||||||||||||||||
| 5/23/08 | CHF | 92,224,989 | 88,588,717 | 4,265,567 | |||||||||||||||||||
| 5/23/08 | CHF | 92,224,989 | 88,588,717 | 4,237,879 | |||||||||||||||||||
| 5/23/08 | CHF | 92,224,989 | 88,588,717 | 4,310,029 | |||||||||||||||||||
| 5/23/08 | CHF | 92,224,989 | 88,588,717 | 4,204,305 | |||||||||||||||||||
| 5/23/08 | CHF | 92,224,989 | 88,588,717 | 4,111,165 | |||||||||||||||||||
| 5/23/08 | CHF | 92,224,989 | 88,588,717 | 4,078,652 | |||||||||||||||||||
| 5/23/08 | JPY | 9,056,555,018 | 87,584,411 | 2,673,270 | |||||||||||||||||||
| 5/23/08 | JPY | 5,279,470,018 | 51,056,861 | 1,650,452 | |||||||||||||||||||
| 5/23/08 | JPY | 5,279,470,018 | 51,056,861 | 1,764,391 | |||||||||||||||||||
| 5/23/08 | JPY | 5,279,470,018 | 51,056,861 | 1,792,265 | |||||||||||||||||||
| 5/23/08 | JPY | 5,279,470,018 | 51,056,861 | 1,752,284 | |||||||||||||||||||
| 5/23/08 | JPY | 5,279,470,018 | 51,056,861 | 1,621,769 | |||||||||||||||||||
| 5/23/08 | JPY | 5,279,470,018 | 51,056,861 | 1,640,741 | |||||||||||||||||||
| 5/23/08 | NZD | 24,638,081 | 19,440,883 | (28,128 | ) | ||||||||||||||||||
| 5/23/08 | NZD | 26,177,961 | 20,655,938 | 13,045 | |||||||||||||||||||
| 5/23/08 | NZD | 26,177,961 | 20,655,938 | 12,784 | |||||||||||||||||||
| 5/23/08 | NZD | 26,177,961 | 20,655,938 | 15,401 | |||||||||||||||||||
| 5/23/08 | NZD | 24,638,081 | 19,440,883 | 58,351 | |||||||||||||||||||
| 5/23/08 | NZD | 26,177,961 | 20,655,938 | (19,572 | ) | ||||||||||||||||||
| 5/23/08 | SEK | 327,172,145 | 52,860,430 | 1,341,315 | |||||||||||||||||||
| 5/23/08 | SEK | 327,172,145 | 52,860,430 | 1,299,907 | |||||||||||||||||||
| 5/23/08 | SEK | 327,172,145 | 52,860,430 | 1,250,228 | |||||||||||||||||||
| 5/23/08 | SEK | 327,172,145 | 52,860,430 | 1,272,371 | |||||||||||||||||||
| 5/23/08 | SEK | 327,172,145 | 52,860,430 | 1,294,217 | |||||||||||||||||||
| 5/23/08 | SEK | 327,172,145 | 52,860,430 | 1,249,560 | |||||||||||||||||||
| 5/23/08 | SEK | 327,172,145 | 52,860,430 | 1,261,167 | |||||||||||||||||||
| 5/23/08 | SGD | 34,468,502 | 24,793,767 | 262,772 | |||||||||||||||||||
| 5/23/08 | SGD | 34,468,502 | 24,793,767 | 295,724 | |||||||||||||||||||
See accompanying notes to the financial statements.
14
GMO International Intrinsic Value Fund
(A Series of GMO Trust)
Schedule of Investments — (Continued)
February 29, 2008
Forward Currency Contracts — continued
| Settlement Date | Deliver/Receive | Units of Currency | Value | Net Unrealized Appreciation (Depreciation) | |||||||||||||||||||
| 5/23/08 | SGD | 34,468,502 | $ | 24,793,767 | $ | 281,089 | |||||||||||||||||
| 5/23/08 | SGD | 34,468,502 | 24,793,767 | 299,363 | |||||||||||||||||||
| 5/23/08 | SGD | 34,468,502 | 24,793,767 | 295,028 | |||||||||||||||||||
| 5/23/08 | SGD | 34,468,502 | 24,793,767 | 270,224 | |||||||||||||||||||
| 5/23/08 | SGD | 34,468,502 | 24,793,767 | 279,346 | |||||||||||||||||||
| $ | 1,721,498,011 | $ | 54,440,186 | ||||||||||||||||||||
| Sales | |||||||||||||||||||||||
| 5/23/08 | AUD | 43,633,814 | $ | 40,211,323 | $ | (501,498 | ) | ||||||||||||||||
| 5/23/08 | AUD | 43,633,814 | 40,211,323 | (452,192 | ) | ||||||||||||||||||
| 5/23/08 | AUD | 43,633,814 | 40,211,323 | (440,454 | ) | ||||||||||||||||||
| 5/23/08 | AUD | 43,633,814 | 40,211,323 | (478,023 | ) | ||||||||||||||||||
| 5/23/08 | AUD | 43,633,814 | 40,211,323 | (501,672 | ) | ||||||||||||||||||
| 5/23/08 | AUD | 43,633,814 | 40,211,323 | (483,172 | ) | ||||||||||||||||||
| 5/23/08 | AUD | 43,633,814 | 40,211,323 | (525,060 | ) | ||||||||||||||||||
| 5/23/08 | DKK | 19,375,920 | 3,936,275 | (115,974 | ) | ||||||||||||||||||
| 5/23/08 | DKK | 18,806,040 | 3,820,502 | (115,463 | ) | ||||||||||||||||||
| 5/23/08 | DKK | 18,806,040 | 3,820,502 | (113,491 | ) | ||||||||||||||||||
| 5/23/08 | EUR | 75,444,309 | 114,207,092 | (3,743,585 | ) | ||||||||||||||||||
| 5/23/08 | EUR | 34,008,309 | 51,481,551 | (1,512,123 | ) | ||||||||||||||||||
| 5/23/08 | EUR | 34,008,309 | 51,481,551 | (1,519,979 | ) | ||||||||||||||||||
| 5/23/08 | EUR | 34,008,309 | 51,481,551 | (1,513,822 | ) | ||||||||||||||||||
| 5/23/08 | EUR | 34,008,309 | 51,481,551 | (1,509,062 | ) | ||||||||||||||||||
| 5/23/08 | EUR | 34,008,309 | 51,481,551 | (1,505,457 | ) | ||||||||||||||||||
| 5/23/08 | EUR | 34,008,309 | 51,481,551 | (1,525,896 | ) | ||||||||||||||||||
| 5/23/08 | GBP | 35,839,041 | 70,798,950 | (1,263,326 | ) | ||||||||||||||||||
| 5/23/08 | GBP | 35,839,041 | 70,798,950 | (1,335,363 | ) | ||||||||||||||||||
| 5/23/08 | GBP | 35,839,041 | 70,798,950 | (1,331,779 | ) | ||||||||||||||||||
| 5/23/08 | GBP | 35,839,041 | 70,798,950 | (1,334,252 | ) | ||||||||||||||||||
| 5/23/08 | GBP | 35,839,041 | 70,798,950 | (1,289,955 | ) | ||||||||||||||||||
| 5/23/08 | GBP | 35,839,041 | 70,798,950 | (1,280,887 | ) | ||||||||||||||||||
| 5/23/08 | GBP | 35,839,041 | 70,798,950 | (1,315,472 | ) | ||||||||||||||||||
| 5/23/08 | HKD | 147,045,302 | 18,924,213 | (37,112 | ) | ||||||||||||||||||
| 5/23/08 | HKD | 147,045,302 | 18,924,213 | (39,082 | ) | ||||||||||||||||||
| 5/23/08 | HKD | 151,501,221 | 19,497,675 | (39,516 | ) | ||||||||||||||||||
See accompanying notes to the financial statements.
15
GMO International Intrinsic Value Fund
(A Series of GMO Trust)
Schedule of Investments — (Continued)
February 29, 2008
Forward Currency Contracts — continued
| Settlement Date | Deliver/Receive | Units of Currency | Value | Net Unrealized Appreciation (Depreciation) | |||||||||||||||||||
| 5/23/08 | NOK | 83,516,503 | $ | 15,914,979 | $ | (372,612 | ) | ||||||||||||||||
| 5/23/08 | NOK | 86,047,306 | 16,397,251 | (393,517 | ) | ||||||||||||||||||
| 5/23/08 | NOK | 83,516,503 | 15,914,979 | (382,226 | ) | ||||||||||||||||||
| 5/23/08 | NZD | 21,106,667 | 16,654,391 | (377,035 | ) | ||||||||||||||||||
| 5/23/08 | NZD | 21,106,667 | 16,654,391 | (375,875 | ) | ||||||||||||||||||
| 5/23/08 | NZD | 21,106,667 | 16,654,391 | (372,920 | ) | ||||||||||||||||||
| 5/23/08 | SEK | 340,041,000 | 54,939,621 | (2,347,814 | ) | ||||||||||||||||||
| $ | 1,422,221,692 | $ | (30,445,666 | ) | |||||||||||||||||||
Futures Contracts
| Number of Contracts | Type | Expiration Date | Contract Value | Net Unrealized Appreciation (Depreciation) | |||||||||||||||
| Buys | |||||||||||||||||||
| 1,344 | DAX | March 2008 | $ | 344,239,905 | $ | (55,798,208 | ) | ||||||||||||
| 250 | Hang Seng | March 2008 | 38,891,316 | 1,083,199 | |||||||||||||||
| 1,374 | MSCI Singapore | March 2008 | 73,383,755 | (2,077,881 | ) | ||||||||||||||
| 46 | S&P/MIB | March 2008 | 11,755,658 | (272,029 | ) | ||||||||||||||
| $ | 468,270,634 | $ | (57,064,919 | ) | |||||||||||||||
| Sales | |||||||||||||||||||
| 11 | AEX | March 2008 | $ | 1,494,619 | $ | 20,970 | |||||||||||||
| 79 | CAC 40 | March 2008 | 5,753,826 | 96,750 | |||||||||||||||
| 134 | FTSE 100 | March 2008 | 15,528,557 | 328,363 | |||||||||||||||
| 670 | IBEX 35 | March 2008 | 134,316,044 | 217,168 | |||||||||||||||
| 60 | OMXS 30 | March 2008 | 941,924 | 5,732 | |||||||||||||||
| 295 | S&P Toronto 60 | March 2008 | 47,721,514 | (496,181 | ) | ||||||||||||||
| 130 | SPI 200 | March 2008 | 16,845,219 | 1,691,550 | |||||||||||||||
| 64 | TOPIX Index | March 2008 | 8,134,758 | 15,400 | |||||||||||||||
| $ | 230,736,461 | $ | 1,879,752 | ||||||||||||||||
As of February 29, 2008, for the futures contracts held, the Fund had sufficient cash and/or securities to cover any commitments or margin requirements of the relevant broker or exchange.
See accompanying notes to the financial statements.
16
GMO International Intrinsic Value Fund
(A Series of GMO Trust)
Schedule of Investments — (Continued)
February 29, 2008
Notes to Schedule of Investments:
ADR - American Depositary Receipt
* Non-income producing security.
(a) All or a portion of this security is out on loan (Note 2).
(b) As of February 29, 2008, the Fund elected to sell these rights but the sale did not occur until after the Fund's year end.
(c) All or a portion of this security represents investment of security lending collateral (Note 2).
As of February 29, 2008, 90.71% of the Net Assets of the Fund were valued using fair value prices based on models used by a third party vendor (Note 2).
Currency Abbreviations:
AUD - Australian Dollar
CAD - Canadian Dollar
CHF - Swiss Franc
DKK - Danish Krone
EUR - Euro
GBP - British Pound
HKD - Hong Kong Dollar
JPY - Japanese Yen
NOK - Norwegian Krone
NZD - New Zealand Dollar
SEK - Swedish Krona
SGD - Singapore Dollar
See accompanying notes to the financial statements.
17
GMO International Intrinsic Value Fund
(A Series of GMO Trust)
Statement of Assets and Liabilities — February 29, 2008
| Assets: | |||||||
| Investments, at value, including securities on loan of $20,047,211 (cost $6,773,669,080) (Note 2) | $ | 7,200,914,911 | |||||
| Foreign currency, at value (cost $5,106,940) (Note 2) | 5,150,896 | ||||||
| Receivable for investments sold | 4,807,932 | ||||||
| Receivable for Fund shares sold | 30,251,029 | ||||||
| Dividends and interest receivable | 13,354,813 | ||||||
| Foreign taxes receivable | 1,783,113 | ||||||
| Unrealized appreciation on open forward currency contracts (Note 2) | 54,487,886 | ||||||
| Receivable for collateral on open futures contracts (Note 2) | 67,130,000 | ||||||
| Receivable for expenses reimbursed by Manager (Note 3) | 355,395 | ||||||
| Total assets | 7,378,235,975 | ||||||
| Liabilities: | |||||||
| Due to custodian | 539,869 | ||||||
| Collateral on securities loaned, at value (Note 2) | 21,714,791 | ||||||
| Payable for investments purchased | 9,618,556 | ||||||
| Payable for Fund shares repurchased | 29,323,698 | ||||||
| Payable to affiliate for (Note 3): | |||||||
| Management fee | 3,092,258 | ||||||
| Shareholder service fee | 686,993 | ||||||
| Administration fee – Class M | 2,929 | ||||||
| Trustees and Chief Compliance Officer of GMO Trust fees | 8,600 | ||||||
| Payable for 12b-1 fee – Class M | 7,864 | ||||||
| Unrealized depreciation on open forward currency contracts (Note 2) | 30,493,366 | ||||||
| Payable for variation margin on open futures contracts (Note 2) | 5,510,928 | ||||||
| Accrued expenses | 1,272,932 | ||||||
| Total liabilities | 102,272,784 | ||||||
| Net assets | $ | 7,275,963,191 | |||||
See accompanying notes to the financial statements.
18
GMO International Intrinsic Value Fund
(A Series of GMO Trust)
Statement of Assets and Liabilities — February 29, 2008 — (Continued)
| Net assets consist of: | |||||||
| Paid-in capital | $ | 6,397,543,740 | |||||
| Accumulated undistributed net investment income | 84,019,314 | ||||||
| Accumulated net realized gain | 397,961,965 | ||||||
| Net unrealized appreciation | 396,438,172 | ||||||
| $ | 7,275,963,191 | ||||||
| Net assets attributable to: | |||||||
| Class II shares | $ | 510,005,986 | |||||
| Class III shares | $ | 2,615,878,046 | |||||
| Class IV shares | $ | 4,131,392,501 | |||||
| Class M shares | $ | 18,686,658 | |||||
| Shares outstanding: | |||||||
| Class II | 17,178,662 | ||||||
| Class III | 87,274,536 | ||||||
| Class IV | 137,900,530 | ||||||
| Class M | 631,255 | ||||||
| Net asset value per share: | |||||||
| Class II | $ | 29.69 | |||||
| Class III | $ | 29.97 | |||||
| Class IV | $ | 29.96 | |||||
| Class M | $ | 29.60 | |||||
See accompanying notes to the financial statements.
19
GMO International Intrinsic Value Fund
(A Series of GMO Trust)
Statement of Operations — Year Ended February 29, 2008
| Investment Income: | |||||||
| Dividends (net of withholding taxes of $25,382,372) | $ | 250,679,585 | |||||
| Interest | 14,763,179 | ||||||
| Securities lending income | 7,300,041 | ||||||
| Total investment income | 272,742,805 | ||||||
| Expenses: | |||||||
| Management fee (Note 3) | 44,567,395 | ||||||
| Shareholder service fee – Class II (Note 3) | 1,257,314 | ||||||
| Shareholder service fee – Class III (Note 3) | 4,290,994 | ||||||
| Shareholder service fee – Class IV (Note 3) | 4,320,913 | ||||||
| 12b-1 fee – Class M (Note 3) | 50,094 | ||||||
| Administration fee – Class M (Note 3) | 40,075 | ||||||
| Custodian and fund accounting agent fees | 3,279,718 | ||||||
| Transfer agent fees | 76,623 | ||||||
| Audit and tax fees | 135,819 | ||||||
| Legal fees | 179,880 | ||||||
| Trustees fees and related expenses (Note 3) | 90,076 | ||||||
| Registration fees | 46,775 | ||||||
| Miscellaneous | 105,870 | ||||||
| Total expenses | 58,441,546 | ||||||
| Fees and expenses reimbursed by Manager (Note 3) | (3,737,235 | ) | |||||
| Net expenses | 54,704,311 | ||||||
| Net investment income (loss) | 218,038,494 | ||||||
| Realized and unrealized gain (loss): | |||||||
| Net realized gain (loss) on: | |||||||
| Investments | 1,144,366,689 | ||||||
| Closed futures contracts | 69,258,238 | ||||||
| Foreign currency, forward contracts and foreign currency related transactions | 60,896,192 | ||||||
| Net realized gain (loss) | 1,274,521,119 | ||||||
| Change in net unrealized appreciation (depreciation) on: | |||||||
| Investments | (1,484,624,256 | ) | |||||
| Open futures contracts | (53,985,887 | ) | |||||
| Foreign currency, forward contracts and foreign currency related transactions | 16,186,155 | ||||||
| Net unrealized gain (loss) | (1,522,423,988 | ) | |||||
| Net realized and unrealized gain (loss) | (247,902,869 | ) | |||||
| Net increase (decrease) in net assets resulting from operations | $ | (29,864,375 | ) | ||||
See accompanying notes to the financial statements.
20
GMO International Intrinsic Value Fund
(A Series of GMO Trust)
Statement of Changes in Net Assets
| Year Ended February 29, 2008 | Year Ended February 28, 2007 | ||||||||||
| Increase (decrease) in net assets: | |||||||||||
| Operations: | |||||||||||
| Net investment income (loss) | $ | 218,038,494 | $ | 165,472,351 | |||||||
| Net realized gain (loss) | 1,274,521,119 | 597,081,731 | |||||||||
| Change in net unrealized appreciation (depreciation) | (1,522,423,988 | ) | 585,852,751 | ||||||||
| Net increase (decrease) in net assets from operations | (29,864,375 | ) | 1,348,406,833 | ||||||||
| Distributions to shareholders from: | |||||||||||
| Net investment income | |||||||||||
| Class II | (12,407,304 | ) | (8,365,929 | ) | |||||||
| Class III | (65,215,261 | ) | (39,875,988 | ) | |||||||
| Class IV | (109,936,051 | ) | (70,325,262 | ) | |||||||
| Class M | (443,458 | ) | (208,724 | ) | |||||||
| Total distributions from net investment income | (188,002,074 | ) | (118,775,903 | ) | |||||||
| Net realized gains | |||||||||||
| Class II | (69,248,911 | ) | (48,849,679 | ) | |||||||
| Class III | (349,607,893 | ) | (226,473,274 | ) | |||||||
| Class IV | (574,842,698 | ) | (379,033,945 | ) | |||||||
| Class M | (2,604,560 | ) | (1,509,855 | ) | |||||||
| Total distributions from net realized gains | (996,304,062 | ) | (655,866,753 | ) | |||||||
| (1,184,306,136 | ) | (774,642,656 | ) | ||||||||
| Net share transactions (Note 7): | |||||||||||
| Class II | 29,246,584 | (56,916,409 | ) | ||||||||
| Class III | 350,165,933 | (325,585,440 | ) | ||||||||
| Class IV | 254,901,122 | 1,130,419,119 | |||||||||
| Class M | 4,852,998 | (14,361,930 | ) | ||||||||
| Increase (decrease) in net assets resulting from net share transactions | 639,166,637 | 733,555,340 | |||||||||
| Total increase (decrease) in net assets | (575,003,874 | ) | 1,307,319,517 | ||||||||
| Net assets: | |||||||||||
| Beginning of period | 7,850,967,065 | 6,543,647,548 | |||||||||
| End of period (including accumulated undistributed net investment income of $84,019,314 and distributions in excess of net investment income of $23,501,366, respectively) | $ | 7,275,963,191 | $ | 7,850,967,065 | |||||||
See accompanying notes to the financial statements.
21
GMO International Intrinsic Value Fund
(A Series of GMO Trust)
Financial Highlights
(For a Class II share outstanding throughout each period)
| Year Ended February 28/29, | |||||||||||||||||||||||
| 2008 | 2007 | 2006 | 2005 | 2004 | |||||||||||||||||||
| Net asset value, beginning of period | $ | 34.99 | $ | 32.35 | $ | 29.04 | $ | 24.18 | $ | 16.04 | |||||||||||||
| Income (loss) from investment operations: | |||||||||||||||||||||||
| Net investment income (loss)† | 0.93 | 0.79 | 0.65 | 0.49 | 0.44 | ||||||||||||||||||
| Net realized and unrealized gain (loss) | (0.86 | ) | 5.60 | 4.45 | 5.07 | 8.31 | |||||||||||||||||
| Total from investment operations | 0.07 | 6.39 | 5.10 | 5.56 | 8.75 | ||||||||||||||||||
| Less distributions to shareholders: | |||||||||||||||||||||||
| From net investment income | (0.83 | ) | (0.54 | ) | (0.36 | ) | (0.66 | ) | (0.61 | ) | |||||||||||||
| From net realized gains | (4.54 | ) | (3.21 | ) | (1.43 | ) | (0.04 | ) | — | ||||||||||||||
| Total distributions | (5.37 | ) | (3.75 | ) | (1.79 | ) | (0.70 | ) | (0.61 | ) | |||||||||||||
| Net asset value, end of period | $ | 29.69 | $ | 34.99 | $ | 32.35 | $ | 29.04 | $ | 24.18 | |||||||||||||
| Total Return(a) | (1.11 | )% | 20.46 | % | 18.16 | % | 23.17 | % | 54.99 | % | |||||||||||||
| Ratios/Supplemental Data: | |||||||||||||||||||||||
| Net assets, end of period (000's) | $ | 510,006 | $ | 564,440 | $ | 567,313 | $ | 231,695 | $ | 85,625 | |||||||||||||
| Net expenses to average daily net assets | 0.76 | % | 0.76 | % | 0.76 | % | 0.76 | % | 0.76 | % | |||||||||||||
| Net investment income to average daily net assets | 2.59 | % | 2.32 | % | 2.16 | % | 1.88 | % | 2.15 | % | |||||||||||||
| Portfolio turnover rate | 47 | % | 36 | % | 38 | % | 46 | % | 44 | % | |||||||||||||
| Fees and expenses reimbursed by the Manager to average daily net assets: | 0.05 | % | 0.04 | % | 0.06 | % | 0.07 | % | 0.09 | % | |||||||||||||
† Calculated using average shares outstanding throughout the period.
(a) The total returns would have been lower had certain expenses not been reimbursed during the periods shown and assumes the effect of reinvested distributions.
See accompanying notes to the financial statements.
22
GMO International Intrinsic Value Fund
(A Series of GMO Trust)
Financial Highlights
(For a Class III share outstanding throughout each period)
| Year Ended February 28/29, | |||||||||||||||||||||||
| 2008 | 2007 | 2006 | 2005 | 2004 | |||||||||||||||||||
| Net asset value, beginning of period | $ | 35.28 | $ | 32.59 | $ | 29.23 | $ | 24.32 | $ | 16.13 | |||||||||||||
| Income (loss) from investment operations: | |||||||||||||||||||||||
| Net investment income (loss)† | 0.94 | 0.81 | 0.72 | 0.59 | 0.45 | ||||||||||||||||||
| Net realized and unrealized gain (loss) | (0.86 | ) | 5.66 | 4.44 | 5.02 | 8.36 | |||||||||||||||||
| Total from investment operations | 0.08 | 6.47 | 5.16 | 5.61 | 8.81 | ||||||||||||||||||
| Less distributions to shareholders: | |||||||||||||||||||||||
| From net investment income | (0.85 | ) | (0.57 | ) | (0.37 | ) | (0.66 | ) | (0.62 | ) | |||||||||||||
| From net realized gains | (4.54 | ) | (3.21 | ) | (1.43 | ) | (0.04 | ) | — | ||||||||||||||
| Total distributions | (5.39 | ) | (3.78 | ) | (1.80 | ) | (0.70 | ) | (0.62 | ) | |||||||||||||
| Net asset value, end of period | $ | 29.97 | $ | 35.28 | $ | 32.59 | $ | 29.23 | $ | 24.32 | |||||||||||||
| Total Return(a) | (1.06 | )% | 20.54 | % | 18.26 | % | 23.28 | % | 55.05 | % | |||||||||||||
| Ratios/Supplemental Data: | |||||||||||||||||||||||
| Net assets, end of period (000's) | $ | 2,615,878 | $ | 2,703,050 | $ | 2,795,610 | $ | 1,804,485 | $ | 1,350,850 | |||||||||||||
| Net expenses to average daily net assets | 0.69 | % | 0.69 | % | 0.69 | % | 0.69 | % | 0.69 | % | |||||||||||||
| Net investment income to average daily net assets | 2.61 | % | 2.36 | % | 2.39 | % | 2.30 | % | 2.22 | % | |||||||||||||
| Portfolio turnover rate | 47 | % | 36 | % | 38 | % | 46 | % | 44 | % | |||||||||||||
| Fees and expenses reimbursed by the Manager to average daily net assets: | 0.05 | % | 0.04 | % | 0.06 | % | 0.07 | % | 0.09 | % | |||||||||||||
† Calculated using average shares outstanding throughout the period.
(a) The total returns would have been lower had certain expenses not been reimbursed during the periods shown and assumes the effect of reinvested distributions.
See accompanying notes to the financial statements.
23
GMO International Intrinsic Value Fund
(A Series of GMO Trust)
Financial Highlights
(For a Class IV share outstanding throughout each period)
| Year Ended February 28/29, | |||||||||||||||||||||||
| 2008 | 2007 | 2006 | 2005 | 2004 | |||||||||||||||||||
| Net asset value, beginning of period | $ | 35.26 | $ | 32.58 | $ | 29.22 | $ | 24.31 | $ | 16.12 | |||||||||||||
| Income (loss) from investment operations: | |||||||||||||||||||||||
| Net investment income (loss)† | 0.96 | 0.80 | 0.74 | 0.54 | 0.43 | ||||||||||||||||||
| Net realized and unrealized gain (loss) | (0.85 | ) | 5.68 | 4.43 | 5.09 | 8.39 | |||||||||||||||||
| Total from investment operations | 0.11 | 6.48 | 5.17 | 5.63 | 8.82 | ||||||||||||||||||
| Less distributions to shareholders: | |||||||||||||||||||||||
| From net investment income | (0.87 | ) | (0.59 | ) | (0.38 | ) | (0.68 | ) | (0.63 | ) | |||||||||||||
| From net realized gains | (4.54 | ) | (3.21 | ) | (1.43 | ) | (0.04 | ) | — | ||||||||||||||
| Total distributions | (5.41 | ) | (3.80 | ) | (1.81 | ) | (0.72 | ) | (0.63 | ) | |||||||||||||
| Net asset value, end of period | $ | 29.96 | $ | 35.26 | $ | 32.58 | $ | 29.22 | $ | 24.31 | |||||||||||||
| Total Return(a) | (0.98 | )% | 20.61 | % | 18.32 | % | 23.37 | % | 55.15 | % | |||||||||||||
| Ratios/Supplemental Data: | |||||||||||||||||||||||
| Net assets, end of period (000's) | $ | 4,131,392 | $ | 4,566,106 | $ | 3,150,741 | $ | 2,193,988 | $ | 863,612 | |||||||||||||
| Net expenses to average daily net assets | 0.63 | % | 0.63 | % | 0.63 | % | 0.63 | % | 0.63 | % | |||||||||||||
| Net investment income to average daily net assets | 2.67 | % | 2.32 | % | 2.45 | % | 2.06 | % | 2.08 | % | |||||||||||||
| Portfolio turnover rate | 47 | % | 36 | % | 38 | % | 46 | % | 44 | % | |||||||||||||
| Fees and expenses reimbursed by the Manager to average daily net assets: | 0.05 | % | 0.04 | % | 0.06 | % | 0.07 | % | 0.09 | % | |||||||||||||
† Calculated using average shares outstanding throughout the period.
(a) The total returns would have been lower had certain expenses not been reimbursed during the periods shown and assumes the effect of reinvested distributions.
See accompanying notes to the financial statements.
24
GMO International Intrinsic Value Fund
(A Series of GMO Trust)
Financial Highlights
(For a Class M share outstanding throughout each period)
| Year Ended February 28/29, | |||||||||||||||||||||||
| 2008 | 2007 | 2006 | 2005 | 2004(a) | |||||||||||||||||||
| Net asset value, beginning of period | $ | 34.93 | $ | 32.28 | $ | 28.98 | $ | 24.15 | $ | 20.92 | |||||||||||||
| Income (loss) from investment operations: | |||||||||||||||||||||||
| Net investment income (loss)† | 0.79 | 0.68 | 0.61 | 0.44 | 0.01 | ||||||||||||||||||
| Net realized and unrealized gain (loss) | (0.81 | ) | 5.62 | 4.41 | 5.04 | 3.73 | |||||||||||||||||
| Total from investment operations | (0.02 | ) | 6.30 | 5.02 | 5.48 | 3.74 | |||||||||||||||||
| Less distributions to shareholders: | |||||||||||||||||||||||
| From net investment income | (0.77 | ) | (0.44 | ) | (0.29 | ) | (0.61 | ) | (0.51 | ) | |||||||||||||
| From net realized gains | (4.54 | ) | (3.21 | ) | (1.43 | ) | (0.04 | ) | — | ||||||||||||||
| Total distributions | (5.31 | ) | (3.65 | ) | (1.72 | ) | (0.65 | ) | (0.51 | ) | |||||||||||||
| Net asset value, end of period | $ | 29.60 | $ | 34.93 | $ | 32.28 | $ | 28.98 | $ | 24.15 | |||||||||||||
| Total Return(b) | (1.36 | )% | 20.18 | % | 17.92 | % | 22.88 | % | 18.06 | %** | |||||||||||||
| Ratios/Supplemental Data: | |||||||||||||||||||||||
| Net assets, end of period (000's) | $ | 18,687 | $ | 17,371 | $ | 29,984 | $ | 18,347 | $ | 7,408 | |||||||||||||
| Net expenses to average daily net assets | 0.99 | % | 0.99 | % | 0.99 | % | 0.99 | % | 0.99 | %* | |||||||||||||
| Net investment income to average daily net assets | 2.22 | % | 2.00 | % | 2.07 | % | 1.72 | % | 0.12 | %* | |||||||||||||
| Portfolio turnover rate | 47 | % | 36 | % | 38 | % | 46 | % | 44 | %†† | |||||||||||||
| Fees and expenses reimbursed by the Manager to average daily net assets: | 0.05 | % | 0.04 | % | 0.06 | % | 0.07 | % | 0.09 | %* | |||||||||||||
(a) Period from October 2, 2003 (commencement of operations) to February 29, 2004.
(b) The total returns would have been lower had certain expenses not been reimbursed during the periods shown and assumes the effect of reinvested distributions.
† Calculated using average shares outstanding throughout the period.
†† Calculation represents portfolio turnover of the Fund for the year ended February 29, 2004.
* Annualized.
** Not annualized.
See accompanying notes to the financial statements.
25
GMO International Intrinsic Value Fund
(A Series of GMO Trust)
Notes to Financial Statements
February 29, 2008
1. Organization
GMO International Intrinsic Value Fund (the "Fund") is a series of GMO Trust (the "Trust"). The Fund is registered under the Investment Company Act of 1940, as amended, as an open-end, diversified management investment company. The Fund is advised and managed by Grantham, Mayo, Van Otterloo & Co. LLC (the "Manager" or "GMO"). The Trust was established as a Massachusetts business trust under the laws of the Commonwealth of Massachusetts on June 24, 1985. The Declaration of Trust permits the Trustees of the Trust ("Trustees") to create an unlimited number of series of shares ("Funds") and to subdivide Funds into classes.
The Fund seeks high total return. The Fund seeks to achieve its objective by outperforming the S&P/Citigroup Primary Market Index ("PMI") Europe, Pacific, Asia Composite ("EPAC") Value Index. The Fund typically makes equity investments in companies from developed countries, other than the U.S.
Throughout the year ended February 29, 2008, the Fund had four classes of shares outstanding: Class II, Class III, Class IV and Class M. Class M shares bear an administration fee and a 12b-1 fee while classes II, III, and IV bear a shareholder service fee (See Note 3). The principal economic difference among the classes of shares is the type and level of fees borne by the classes.
2. Significant accounting policies
The following is a summary of significant accounting policies which are in conformity with accounting principles generally accepted in the United States of America ("U.S. GAAP") and which are consistently followed by the Fund in the preparation of its financial statements. The preparation of financial statements in accordance with U.S. GAAP requires management to make estimates and assumptions that affect the reported amounts and disclosures in the financial statements. Actual results could differ from those estimates. The accounting records of the Fund are maintained in U.S. dollars.
Portfolio valuation
Securities listed on a securities exchange for which market quotations are readily available are valued at the last sale price or official closing price on each business day, or if there is no such reported sale or official closing price, at the most recent quoted bid price. Unlisted securities for which market quotations are readily available are generally valued at the most recent quoted bid price. Short-term investments with a remaining maturity of sixty days or less are generally valued at amortized cost, which approximates fair value. Shares of investment funds are valued at their net asset value. Securities for which quotations are not readily available or whose values the Manager has determined to be unreliable are valued at fair value as determined in good faith by the Trustees or other persons acting at their direction pursuant to procedures approved by the Trustees. By its nature, a fair value price is a good faith est imate of the value of a security at a given point in time and may not reflect the value that would be realized if the security was sold and the differences could be material. Because many foreign equity securities markets and exchanges close
26
GMO International Intrinsic Value Fund
(A Series of GMO Trust)
Notes to Financial Statements — (Continued)
February 29, 2008
prior to the close of the New York Stock Exchange ("NYSE"), closing prices for foreign securities in those markets or on those exchanges do not reflect the events that occur after that close but before the close of the NYSE. As a result, foreign equity securities are generally valued using fair value prices supplied by a third party vendor based on models to the extent that these fair value prices are available.
Foreign currency translation
The market values of foreign securities, currency holdings and other assets and liabilities are translated to U.S. dollars based on the current exchange rates each business day. Income and expenses denominated in foreign currencies are translated at current exchange rates when accrued or incurred. The Fund does not isolate realized and unrealized gains and losses attributable to changes in exchange rates from gains and losses that arise from changes in the market value of investments. Such fluctuations are included with net realized and unrealized gain or loss on investments. Net realized gains and losses on foreign currency transactions represent gains and losses on disposition of currencies and forward currency contracts, currency gains and losses realized between the trade and settlement dates on securities transactions, and the difference between the amount of investment income and foreign withholding taxes recorded on the F und's accounting records and the U.S. dollar equivalent amounts actually received or paid.
Forward currency contracts
The Fund may enter into forward currency contracts including forward cross currency contracts. A forward currency contract is an agreement between two parties to buy and sell a currency at a set price on a future date. The market value of a forward currency contract fluctuates with changes in forward currency exchange rates. Forward currency contracts are marked to market daily using rates supplied by a quotation service and changes in value are recorded by the Fund as an unrealized gain or loss. Realized gains or losses equal to the difference between the value of the contract at the time it was opened and the value at the time it was closed are recorded upon delivery or receipt of the currency or, if a forward currency contract is offset by entering into another forward currency contract with the same broker, upon settlement of the net gain or loss. These contracts may involve market risk in excess of the unrealized gain or lo ss reflected in the Fund's Statement of Assets and Liabilities. In addition, the Fund could be exposed to risk if the counterparties are unable to meet the terms of the contracts or if there are movements in currency values that are unfavorable to the Fund. Forward currency contracts outstanding at the end of the period are listed in the Fund's Schedule of Investments.
Futures contracts
The Fund may purchase and sell futures contracts. Upon entering into a futures contract, the Fund is required to deposit with the futures clearing broker an amount of cash, U.S. government and agency obligations, or other liquid assets in accordance with the initial margin requirements of the broker or exchange. In addition, the Fund maintains cash or securities in an amount that at least equals the net amount payable in the event the Fund must deliver the full amount of the contracts. Futures contracts are marked to market daily and an appropriate payable or receivable for the change in value ("variation margin") is recorded by the Fund. The payable or receivable is liquidated on the following business day.
27
GMO International Intrinsic Value Fund
(A Series of GMO Trust)
Notes to Financial Statements — (Continued)
February 29, 2008
Gains or losses are recognized but not considered realized until the contracts expire or are closed. Futures contracts involve, to varying degrees, risk of loss in excess of the variation margin disclosed in the Statement of Assets and Liabilities. Under certain circumstances, futures exchanges may establish daily limits on the amount that the price of a futures contract can vary from the previous day's settlement price, thereby effectively preventing liquidation of unfavorable positions. Losses may arise from changes in the value of the underlying instrument if the Fund is unable to liquidate a futures position due to an illiquid secondary market for the contracts or the imposition of price limits, or if counterparties do not perform under the contract terms. Futures contracts are generally valued at the settlement price established each day by the board of trade or exchange on which they are traded. Futures contracts outstandi ng at the end of the period are listed in the Fund's Schedule of Investments.
Options
The Fund may write call and put options. Writing options increases the Fund's exposure to the underlying instrument by, in the case of a call option, obligating the Fund to sell the underlying instrument at a set price to the option-holder and, in the case of a put option, obligating the Fund to purchase the underlying instrument at a set price from the option-holder. When the Fund writes a call or put option, an amount equal to the premium received is recorded as a liability and subsequently marked to market to reflect the current value of the option written. Premiums received from writing options which expire are treated as realized gains. Premiums received from writing options which are exercised or closed are added to the proceeds or offset against the amounts paid on the underlying future, security or currency transaction to determine the realized gain or loss. The Fund as a writer of an option has no control over whether t he underlying future, security or currency may be sold (call) or purchased (put) and as a result bears the market risk of an unfavorable change in the price of the future, security or currency underlying the written option. In the event that the Fund writes uncovered call options (i.e. options for investments that the Fund does not own), it bears the risk of incurring substantial losses if the price of the underlying instrument increases during the term of the option. There is the risk the Fund may not be able to enter into a closing transaction because of an illiquid market. There were no open written option contracts during the period.
The Fund may also purchase put and call options. Purchasing options alters the Fund's exposure to the underlying instrument by, in the case of a call option, entitling the Fund to purchase the underlying instrument at a set price from the writer of the option and, in the case of a put option, entitling the Fund to sell the underlying instrument at a set price to the writer of the option. The Fund pays a premium as a cost for a purchased option disclosed in the Schedule of Investments which is subsequently marked to market to reflect the current value of the option. Premiums paid for purchasing options which expire are treated as realized losses. Premiums paid for purchasing options which are exercised or closed are added to the amounts paid or offset against the proceeds on the closing transaction to determine the realized gain or loss. The risk associated with purchasing put and call options is limited to the premium paid. Ther e were no purchased option contracts outstanding at the end of the period.
28
GMO International Intrinsic Value Fund
(A Series of GMO Trust)
Notes to Financial Statements — (Continued)
February 29, 2008
Exchange traded options are valued at the last sale price, or if no sale is reported, the last bid price for purchased options and the last ask price for written options. Options traded over-the-counter are valued using prices supplied by a primary pricing source chosen by the Manager.
Swap agreements
The Fund may enter into swap agreements. A swap is an agreement to exchange the return generated by one instrument for the return generated by another instrument. Interest rate swap agreements involve the exchange by one party with another party of their respective commitments to pay or receive interest, e.g., an exchange of floating rate payments for fixed rate payments with respect to a notional amount of principal. Total return swap agreements involve a commitment by one party in the agreement to pay interest in exchange for a market-linked return, both based on notional amounts. To the extent the total return of the security or index underlying the transaction exceeds or falls short of the offsetting interest rate obligation, the party will receive a payment from or make a payment to the counterparty, respectively. Forward spread lock swap agreements involve commitments to pay or receive a settlement amount calculated as the difference between the swap spread and a fixed spread, multiplied by the notional amount times the duration of the swap rate. The swap spread is the difference between the benchmark swap rate (market rate) and the specific treasury rate. Variance swap agreements involve commitments to pay or receive a settlement amount calculated as the difference between the annualized realized variance of returns on the underlying price and a fixed quantity, also known as the variance strike, over a period of time. In connection with these agreements, cash or securities may be set aside as collateral by the Fund's custodian or brokers in accordance with the terms of the swap agreement. The Fund earns or pays interest on cash set aside as collateral.
Swaps are marked to market daily using models that incorporate quotations from market makers and the change in value, if any, is recorded as unrealized gain or loss in the Statement of Operations. Payments received or made on swap contracts are recorded as realized gain or loss in the Statement of Operations. Gains or losses are realized upon early termination of the swap agreements. These financial instruments are not actively traded on financial markets. The values assigned to these instruments are based upon the best available information and because of the uncertainty of the valuation, these values may differ significantly from the values that would have been realized had a ready market for these instruments existed, and the differences could be material. Entering into these agreements involves, to varying degrees, elements of credit, legal, market and documentation risk in excess of the amounts recognized in the Statement o f Assets and Liabilities. Such risks involve the possibility that there will be no liquid market for these agreements, that the counterparties to the agreements may default on their obligations to perform or disagree as to the meaning of contractual terms in the agreements, or that there may be unfavorable changes in interest rates or the price of the index or security underlying these transactions. There were no swap agreements outstanding at the end of the period.
Securities lending
The Fund may lend its securities to certain qualified broker-dealers. The loans are collateralized with cash or liquid securities with a market value at least equal to the market value of the securities on loan. As with other extensions of credit, the Fund may bear the risk of loss with respect to the investment of the
29
GMO International Intrinsic Value Fund
(A Series of GMO Trust)
Notes to Financial Statements — (Continued)
February 29, 2008
collateral, the risk of delay in and/or inability to exercise its rights with respect to the collateral, and the risk of delay in recovery or loss of rights in the loaned securities should the borrower of the securities fail financially. If a loan is collateralized by U.S. government securities, the Fund receives a fee from the borrower. If a loan is collateralized by cash, the Fund typically invests the cash collateral for its own account in interest-bearing, short-term securities and pays a fee to the borrower that normally represents a portion of the Fund's earnings on the collateral. As of February 29, 2008, the Fund had loaned securities valued by the Fund at $20,047,211, collateralized by cash in the amount of $21,714,791, which was invested in the Bank of New York Mellon Institutional Cash Reserves Fund.
Taxes and distributions
The Fund intends to qualify each tax year as a regulated investment company under Subchapter M of the Internal Revenue Code of 1986, as amended (the "Code"). The Fund intends to distribute substantially all of its net investment income and net realized short-term and long-term capital gains, if any, after giving effect to any available capital loss carryovers for U.S. federal income tax purposes. Therefore, no provision for U.S. federal income or excise tax is necessary. Taxes on foreign interest and dividend income are generally withheld in accordance with the applicable country's tax treaty with the United States. The foreign withholding rates applicable to a Fund's investments in certain foreign jurisdictions may be higher if a significant portion of the Fund is held by non-U.S. shareholders.
The Fund's policy is to declare and pay distributions from net investment income, if any, semiannually, and from net realized short-term and long-term capital gains, if any, at least annually. All distributions are paid in shares of the Fund, at net asset value, unless the shareholder elects to receive cash distributions. Distributions to shareholders are recorded by the Fund on the ex-dividend date.
Dividends received by shareholders of the Fund which are derived from foreign source income and foreign taxes paid by the Fund may be treated, to the extent allowable under the Code, as if received and paid by the shareholders of the Fund.
The Fund may be subject to capital gains and repatriation taxes imposed by certain countries in which it invests.
Income and capital gain distributions are determined in accordance with U.S. federal income tax regulations, which may differ from U.S. GAAP. Certain capital accounts in the financial statements are periodically adjusted for permanent differences in order to reflect their tax character. These adjustments have no impact on net assets or net asset value per share. Temporary differences which arise from recognizing certain items of income, expense, gain or loss in different periods for financial statement and tax purposes will reverse at some time in the future. Distributions in excess of net investment income or net realized gains are temporary over distributions for financial statement purposes resulting from differences in the recognition or classification of income or distributions for financial statement and tax purposes.
U.S. GAAP and tax accounting differences primarily relate to derivative contract transactions, foreign currency transactions, losses on wash sale transactions and passive foreign investment company transactions.
30
GMO International Intrinsic Value Fund
(A Series of GMO Trust)
Notes to Financial Statements — (Continued)
February 29, 2008
The following reclassification represents the amount necessary to report the stated components of net assets on a tax basis, excluding certain temporary differences, as of February 29, 2008. The financial highlights exclude these adjustments.
| Accumulated Undistributed Net Investment Income | Accumulated Net Realized Gain | Paid-in Capital | |||||||||
| $ | 77,484,260 | $ | (77,430,827 | ) | $ | (53,433 | ) | ||||
The tax character of distributions declared to shareholders is as follows:
| 2/29/2008 | 2/28/2007 | ||||||||||
| Ordinary income (including any short-term capital gains) | $ | 329,444,076 | $ | 270,198,860 | |||||||
| Long-term capital gains | 854,862,060 | 504,443,796 | |||||||||
| Total distributions | $ | 1,184,306,136 | $ | 774,642,656 | |||||||
Distributions in excess of tax basis earnings and profits, if significant, are reported in the financial statements as a tax return of capital.
As of February 29, 2008, the components of distributable earnings on a tax basis consisted of the following:
| Undistributed ordinary income | $ | 115,287,672 | |||||
| Undistributed long-term capital gain | $ | 401,581,471 | |||||
As of February 29, 2008, the approximate cost for U.S. federal income tax purposes and gross and net unrealized appreciation and depreciation in value of investments were as follows:
Aggregate Cost | Gross Unrealized Appreciation | Gross Unrealized (Depreciation) | Net Unrealized Appreciation (Depreciation) | ||||||||||||
| $ | 6,785,124,535 | $ | 889,869,963 | $ | (474,079,587 | ) | $ | 415,790,376 | |||||||
Security transactions and related investment income
Security transactions are accounted for on trade date. Dividend income, net of applicable foreign withholding taxes, if any, is recorded on the ex-dividend date, or when the Fund is informed of the ex-dividend date, if later. Interest income is recorded on the accrual basis and is adjusted for the amortization of premiums and accretion of discounts. Interest income on inflation indexed securities, if
31
GMO International Intrinsic Value Fund
(A Series of GMO Trust)
Notes to Financial Statements — (Continued)
February 29, 2008
any, is accrued daily based upon an inflation adjusted principal. Additionally, any increase or decrease in the principal or face amount of the securities adjusted for inflation is recorded as interest income or loss. Income is not recognized on securities for which collection is not expected. Non-cash dividends, if any, are recorded at the fair market value of the securities received. In determining the net gain or loss on securities sold, the cost of securities is determined on the identified cost basis.
Expenses
The majority of expenses of the Trust are directly identifiable to an individual fund. Expenses which are not readily identifiable to a specific fund are allocated taking into consideration, among other things, the nature and type of expense and the relative size of the funds. Investment income, common expenses and realized and unrealized gains and losses are allocated pro rata among the classes of shares of the Fund based on the relative net assets of each class. Shareholder service, 12b-1, and administration fees, which are directly attributable to a class of shares, are charged to that class's operations.
Brown Brothers Harriman & Co. ("BBH") serves as custodian and fund accounting agent of the Fund. State Street Bank and Trust Company ("State Street") serves as transfer agent of the Fund. BBH and State Street's fees may be reduced by credits that are an earnings allowance calculated on the average daily cash balances the Fund maintains with each agent. Credit balances or expense reimbursements used to reduce fees, if any, are reported as a reduction of expenses in the Statement of Operations.
Investment risks
There are certain additional risks involved in investing in foreign securities that are not inherent in investments in U.S. securities. These risks may involve adverse political and economic developments including the possible imposition of capital controls or other foreign governmental laws or restrictions. In addition, the securities of some foreign companies and securities markets are less liquid and at times may be more volatile than securities of comparable U.S. companies and U.S. securities markets.
Recently issued accounting pronouncements
In June 2006, the Financial Accounting Standards Board ("FASB") issued FASB Interpretation No. 48, Accounting for Uncertainty in Income Taxes – an Interpretation of FASB Statement No. 109 ("FIN 48"). FIN 48 clarifies the accounting for uncertainty in income taxes recognized in accordance with FASB Statement No. 109, Accounting for Income Taxes. FIN 48 prescribes a recognition threshold and measurement attribute for a tax position taken or expected to be taken in the tax return that could impact the Fund's financial statements. It also provides guidance in relation to the Fund's financial statements on classification of tax benefits or liabilities, interest and penalties, accounting in interim periods, disclosure, and transition. FIN 48 is effective for fiscal years beginning after December 15, 2006 for registered investment companies. Management has evaluated the effects of applying the various provisions of FIN 48 and has determined that the adoption of FIN 48 does not have a material effect on the Fund's financial statements. The Fund's federal tax returns for the prior three fiscal years, if applicable, remain subject to examination by the Internal Revenue Service. Management will continue to monitor the rules and guidance pertaining to FIN 48 and will take action if appropriate.
32
GMO International Intrinsic Value Fund
(A Series of GMO Trust)
Notes to Financial Statements — (Continued)
February 29, 2008
In September 2006, the FASB issued Statement of Financial Accounting Standards No. 157 ("FAS 157"), "Fair Value Measurements." FAS 157 defines fair value, establishes a framework for measuring fair value in accordance with generally accepted accounting principles and expands disclosure about fair value measurements. FAS 157 is effective for fiscal years beginning after November 15, 2007. Management is currently evaluating the impact the adoption of FAS 157 will have on the Fund's financial statement disclosures.
3. Fees and other transactions with affiliates
GMO earns a management fee paid monthly at the annual rate of 0.54% of average daily net assets. The Fund has adopted a Shareholder Service Plan under which the Fund pays GMO a shareholder service fee for client and shareholder service, reporting, and other support. Pursuant to the Shareholder Service Plan, the shareholder service fee is calculated based on average daily net assets of each class at the annual rate of 0.22% for Class II shares, 0.15% for Class III shares, and 0.09% for Class IV shares.
Class M shares of the Fund pay GMO an administration fee monthly at the annual rate of 0.20% of average daily Class M net assets for support services provided to Class M shareholders.
Pursuant to a Rule 12b-1 distribution plan adopted by the Fund, Class M shares of the Fund may pay a fee, at the annual rate of up to 1.00% of average daily Class M net assets for any activities or expenses primarily intended to result in the sale of Class M shares of the Fund and/or the provision of certain other services incidental thereto. The Trustees currently limit payments on Class M shares to 0.25% of the Fund's average daily Class M net assets. This fee may be spent on personal services rendered to Class M shareholders of the Fund and/or maintenance of Class M shareholder accounts.
The Manager has contractually agreed to reimburse the Fund for Fund expenses through at least June 30, 2008 to the extent the Fund's total annual operating expenses (excluding administration and distribution (12b-1) fees (Class M only), shareholder service fees (Class II, III and IV only), fees and expenses of the independent Trustees of the Trust, fees and expenses for legal services not approved by the Manager for the Trust, compensation and expenses of the Trust's Chief Compliance Officer ("CCO") (excluding any employee benefits), brokerage commissions, securities lending fees and expenses, interest expense, transfer taxes, and other investment-related costs (including expenses associated with investments in any company that is an investment company or would be an investment company under the 1940 Act, but for the exceptions to the definition of investment company provided in Section 3(c)(1) and 3(c)(7) of the 1940 Act), hedg ing transaction fees, extraordinary, non-recurring and certain other unusual expenses (including taxes)) exceed 0.54% of the Fund's average daily net assets.
The Fund's portion of the fees paid by the Trust to the independent Trustees and CCO during the year ended February 29, 2008 was $78,576 and $33,892, respectively. The compensation and expenses of the CCO are included in miscellaneous expenses in the Statement of Operations. No remuneration was paid by the Fund to any other officer of the Trust.
33
GMO International Intrinsic Value Fund
(A Series of GMO Trust)
Notes to Financial Statements — (Continued)
February 29, 2008
4. Purchases and sales of securities
Cost of purchases and proceeds from sales of securities, excluding short-term investments, for the year ended February 29, 2008 aggregated $3,727,509,363 and $4,033,587,834, respectively.
5. Guarantees
In the normal course of business the Fund enters into contracts with third-party service providers that contain a variety of representations and warranties and which provide general indemnifications. The Fund's maximum exposure under these arrangements is unknown, as this would involve future claims that may be made against the Fund that have not yet occurred. Based on experience, management is of the view that the risk of loss in connection with these potential indemnification obligations is remote; however, there can be no assurance that material liabilities related to such obligations will not arise in the future that could adversely impact the Fund.
6. Principal shareholders and related parties
As of February 29, 2008, there were no shareholders individually holding in excess of 10% of the Fund's outstanding shares.
As of February 29, 2008, 0.25% of the Fund's shares were held by twelve related parties comprised of certain GMO employee accounts, and 55.66% of the Fund's shares were held by accounts for which the Manager has investment discretion.
7. Share transactions
The Declaration of Trust permits the Trustees to issue an unlimited number of shares of beneficial interest (without par value). Transactions in Fund shares were as follows:
| Year Ended February 29, 2008 | Year Ended February 28, 2007 | ||||||||||||||||||
| Class II: | Shares | Amount | Shares | Amount | |||||||||||||||
| Shares sold | 2,870,488 | $ | 104,261,777 | 5,095,447 | $ | 178,165,420 | |||||||||||||
| Shares issued to shareholders in reinvestment of distributions | 2,225,434 | 73,788,974 | 1,546,695 | 52,194,974 | |||||||||||||||
| Shares repurchased | (4,046,894 | ) | (148,804,167 | ) | (8,046,545 | ) | (287,276,803 | ) | |||||||||||
| Net increase (decrease) | 1,049,028 | $ | 29,246,584 | (1,404,403 | ) | $ | (56,916,409 | ) | |||||||||||
34
GMO International Intrinsic Value Fund
(A Series of GMO Trust)
Notes to Financial Statements — (Continued)
February 29, 2008
| Year Ended February 29, 2008 | Year Ended February 28, 2007 | ||||||||||||||||||
| Class III: | Shares | Amount | Shares | Amount | |||||||||||||||
| Shares sold | 11,261,644 | $ | 401,290,984 | 14,491,808 | $ | 507,451,764 | |||||||||||||
| Shares issued to shareholders in reinvestment of distributions | 12,081,961 | 403,817,120 | 7,640,858 | 259,775,124 | |||||||||||||||
| Shares repurchased | (12,684,964 | ) | (454,942,171 | ) | (31,298,044 | ) | (1,092,812,328 | ) | |||||||||||
| Net increase (decrease) | 10,658,641 | $ | 350,165,933 | (9,165,378 | ) | $ | (325,585,440 | ) | |||||||||||
| Year Ended February 29, 2008 | Year Ended February 28, 2007 | ||||||||||||||||||
| Class IV: | Shares | Amount | Shares | Amount | |||||||||||||||
| Shares sold | 25,699,917 | $ | 891,693,160 | 40,351,070 | $ | 1,405,437,963 | |||||||||||||
| Shares issued to shareholders in reinvestment of distributions | 19,888,170 | 664,131,421 | 12,864,438 | 437,301,495 | |||||||||||||||
| Shares repurchased | (37,173,406 | ) | (1,300,923,459 | ) | (20,437,344 | ) | (712,320,339 | ) | |||||||||||
| Net increase (decrease) | 8,414,681 | $ | 254,901,122 | 32,778,164 | $ | 1,130,419,119 | |||||||||||||
| Year Ended February 29, 2008 | Year Ended February 28, 2007 | ||||||||||||||||||
| Class M: | Shares | Amount | Shares | Amount | |||||||||||||||
| Shares sold | 245,514 | $ | 9,021,667 | 154,337 | $ | 5,220,668 | |||||||||||||
| Shares issued to shareholders in reinvestment of distributions | 92,415 | 3,048,018 | 50,922 | 1,714,741 | |||||||||||||||
| Shares repurchased | (204,043 | ) | (7,216,687 | ) | (636,857 | ) | (21,297,339 | ) | |||||||||||
| Net increase (decrease) | 133,886 | $ | 4,852,998 | (431,598 | ) | $ | (14,361,930 | ) | |||||||||||
35
Report of Independent Registered Public Accounting Firm
To the Trustees of GMO Trust and the Shareholders of
GMO International Intrinsic Value Fund
In our opinion, the accompanying statement of assets and liabilities, including the schedule of investments, and the related statements of operations and of changes in net assets and the financial highlights present fairly, in all material respects, the financial position of GMO International Intrinsic Value Fund (the "Fund") at February 29, 2008, the results of its operations for the year then ended, the changes in its net assets for each of the two years in the period then ended and the financial highlights for each of the five years in the period then ended, in conformity with accounting principles generally accepted in the United States of America. These financial statements and financial highlights (hereafter referred to as "financial statements") are the responsibility of the Fund's management; our responsibility is to express an opinion on these financial statements based on our audits. We conducted our audits of these fi nancial statements in accordance with the standards of the Public Company Accounting Oversight Board (United States). Those standards require that we plan and perform the audit to obtain reasonable assurance about whether the financial statements are free of material misstatement. An audit includes examining, on a test basis, evidence supporting the amounts and disclosures in the financial statements, assessing the accounting principles used and significant estimates made by management, and evaluating the overall financial statement presentation. We believe that our audits, which included confirmation of securities at February 29, 2008 by correspondence with the custodian and brokers, provide a reasonable basis for our opinion.
PricewaterhouseCoopers LLP
Boston, Massachusetts
April 29, 2008
36
GMO International Intrinsic Value Fund
(A Series of GMO Trust)
Fund Expenses
February 29, 2008 (Unaudited)
Expense Examples: The following information is in relation to expenses for the six month period ended February 29, 2008.
As a shareholder of the Fund, you may incur two types of costs: (1) transaction costs; and (2) ongoing costs, including management fees, shareholder service fees, distribution (12b-1) and/or administration fees, and other Fund expenses. This example is intended to help you understand your ongoing costs (in dollars) of investing in the Fund and to compare these costs with the ongoing costs of investing in other mutual funds.
These examples are based on an investment of $1,000 invested at the beginning of the period and held for the entire period, September 1, 2007 through February 29, 2008.
Actual Expenses
The first line of the table for each class below provides information about actual account values and actual expenses. You may use the information in this line, together with the amount you invested, to estimate the expenses that you paid over the period. Simply divide your account value by $1,000 (for example, a $35,000,000 account value divided by $1,000 = 35,000), then multiply the result by the number in the first line under the heading entitled "Net Expense Incurred" to estimate the expenses you paid on your account during this period.
Hypothetical Example for Comparison Purposes
The second line of the table for each class below provides information about hypothetical account values and hypothetical expenses based on the Fund's actual expense ratio and an assumed rate of return of 5% per year before expenses, which is not the Fund's actual return. The hypothetical account values and expenses may not be used to estimate the actual ending account balance or expenses you paid for the period. You may use this information to compare the ongoing costs of investing in the Fund with other funds. To do so, compare this 5% hypothetical example with the 5% hypothetical examples that appear in the shareholder reports of other funds.
37
GMO International Intrinsic Value Fund
(A Series of GMO Trust)
Fund Expenses — (Continued)
February 29, 2008 (Unaudited)
Please note that the expenses shown in the table are meant to highlight your ongoing costs only and do not reflect any transactional costs, such as purchase premiums and redemption fees. Therefore, the second line of the table is useful in comparing ongoing costs only, and will not help you determine the relative total costs of owning different funds. In addition, if these transactional costs were included, your costs would have been higher.
| Annualized Net Expense Ratio | Beginning Account Value | Ending Account Value | Net Expense Incurred* | ||||||||||||||||
| Class II | |||||||||||||||||||
| 1) Actual | 0.76 | % | $ | 1,000.00 | $ | 934.60 | $ | 3.66 | |||||||||||
| 2) Hypothetical | 0.76 | % | $ | 1,000.00 | $ | 1,021.08 | $ | 3.82 | |||||||||||
| Class III | |||||||||||||||||||
| 1) Actual | 0.69 | % | $ | 1,000.00 | $ | 934.70 | $ | 3.32 | |||||||||||
| 2) Hypothetical | 0.69 | % | $ | 1,000.00 | $ | 1,021.43 | $ | 3.47 | |||||||||||
| Class IV | |||||||||||||||||||
| 1) Actual | 0.63 | % | $ | 1,000.00 | $ | 935.10 | $ | 3.03 | |||||||||||
| 2) Hypothetical | 0.63 | % | $ | 1,000.00 | $ | 1,021.73 | $ | 3.17 | |||||||||||
| Class M | |||||||||||||||||||
| 1) Actual | 0.99 | % | $ | 1,000.00 | $ | 933.30 | $ | 4.76 | |||||||||||
| 2) Hypothetical | 0.99 | % | $ | 1,000.00 | $ | 1,019.94 | $ | 4.97 | |||||||||||
* Expenses are calculated using each Class's annualized net expense ratio for the six months ended February 29, 2008, multiplied by the average account value over the period, multiplied by 182 days in the period, divided by 366 days in the year.
38
GMO International Intrinsic Value Fund
(A Series of GMO Trust)
Tax Information for the Tax Year Ended February 29, 2008 (Unaudited)
The Fund will notify shareholders of amounts for use in preparing 2008 income tax forms in January 2009.
The Fund's distributions to shareholders include $854,862,060 from long-term capital gains.
During the year ended February 29, 2008, the Fund paid foreign taxes of $25,115,924 and recognized foreign source income of $276,061,957.
For taxable, non-corporate shareholders, 59.90% of the income and short-term capital gains, if any, distributed in the Fund's fiscal year ended February 29, 2008 represents qualified dividend income subject to the 15% rate category.
The Fund hereby designates as qualified short-term capital gains with respect to its taxable year ended February 29, 2008, $141,442,002 or if determined to be different, the qualified short-term gains of such year.
39
Trustees and Officers (Unaudited)
The following tables list the Trust's Trustees and Officers as of the date of this report; their address and date of birth ("DOB"); their position with the Trust; the length of time holding that position with the Trust; their principal occupation(s) during the past five years; the number of portfolios in the fund complex they oversee; and other directorships they hold in companies subject to registration or reporting requirements of the Securities Exchange Act of 1934 (generally called "public companies") or in registered investment companies. The Trust's Statement of Additional Information ("SAI") includes additional information about the Trust's trustees, including changes subsequent to the date of the report. The SAI is available, without charge, upon request by writing GMO, c/o GMO Trust, 40 Rowes Wharf, Boston, MA 02110.
Independent Trustees:
| Name, Address, and DOB | Position(s) Held with Trust | Term of Office1 and Length of Time Served | Principal Occupation(s) During Past Five Years | Number of Portfolios in Fund Complex Overseen by Trustee | Other Directorships Held by Trustee | ||||||||||||||||||
| Donald W. Glazer, Esq. c/o GMO Trust 40 Rowes Wharf Boston, MA 02110 DOB: 07/26/1944 | Chairman of the Board of Trustees | Chairman of the Board of Trustees since March 2005; Lead Independent Trustee (September 2004 – March 2005); Trustee since December 2000. | Consultant – Law and Business2; Vice Chair (since 2002) and Secretary, Provant, Inc. (provider of personnel performance improvement services and training products); Author of Legal Treatises. | 47 | None. | ||||||||||||||||||
1 Each Trustee is elected to serve during the continued lifetime of the Trust until he/she dies, resigns or is removed, or if sooner, until the next meeting of Shareholders called for the purpose of electing Trustees and until the election and qualification of his/her successor.
2 As part of Mr. Glazer's work as a consultant, he provides part-time consulting services to Goodwin Procter LLP ("Goodwin"). Goodwin has provided legal services to Renewable Resources, LLC, an affiliate of GMO; GMO, in connection with its relationship with Renewable Resources; and funds managed by Renewable Resources. Mr. Glazer has represented that he has no financial interest in, and is not involved in the provision of, such legal services. In the calendar years ended December 31, 2006 and December 31, 2007, these entities paid $825,738 and $291,721 respectively, in legal fees and disbursements to Goodwin.
40
Independent Trustees — (Continued)
| Name, Address, and DOB | Position(s) Held with Trust | Term of Office1 and Length of Time Served | Principal Occupation(s) During Past Five Years | Number of Portfolios in Fund Complex Overseen by Trustee | Other Directorships Held by Trustee | ||||||||||||||||||
| Jay O. Light c/o GMO Trust 40 Rowes Wharf Boston, MA 02110 DOB: 10/03/1941 | Trustee | Since May 1996. | Dean (since April 2006), Acting Dean (August 2005 – April 2006), Senior Associate Dean (1998 – 2005), and Professor of Business Administration, Harvard Business School. | 47 | Director of Harvard Management Company, Inc.3 and Verde, Inc.; Director of Partners HealthCare System, Inc. and Chair of its Investment Committee.4 | ||||||||||||||||||
| W. Nicholas Thorndike c/o GMO Trust 40 Rowes Wharf Boston, MA 02110 DOB: 03/28/1933 | Trustee | Since March 2005. | Director or trustee of various corporations and charitable organizations, including Courier Corporation (a book publisher and manufacturer) (July 1989 – present); Putnam Funds (December 1992 – June 2004); and Providence Journal (a newspaper publisher) (December 1986 – December 2003). | 47 | Director of Courier Corporation (a book publisher and manufacturer); Member of the Investment Committee of Partners HealthCare System, Inc.4 | ||||||||||||||||||
1 Each Trustee is elected to serve during the continued lifetime of the Trust until he/she dies, resigns or is removed, or if sooner, until the next meeting of Shareholders called for the purpose of electing Trustees and until the election and qualification of his/her successor.
3 Harvard Management Company, Inc. is a client of the Manager.
4 Partners HealthCare System, Inc. is a client of the Manager.
41
Principal Officers:
| Name, Address, and DOB | Position(s) Held with Trust | Term of Office5 and Length of Time Served | Principal Occupation(s) During Past Five Years | ||||||||||||
| Scott Eston c/o GMO Trust 40 Rowes Wharf Boston, MA 02110 DOB: 01/20/1956 | President and Chief Executive Officer | President and Chief Executive Officer since October 2002; Chief Financial Officer, November 2006 – February 2007. | Chief Financial Officer, Chief Operating Officer and Member, Grantham, Mayo, Van Otterloo & Co. LLC. | ||||||||||||
| Sheppard N. Burnett c/o GMO Trust 40 Rowes Wharf Boston, MA 02110 DOB: 10/24/1968 | Treasurer and Chief Financial Officer | Chief Financial Officer since March 2007; Treasurer since November 2006; Assistant Treasurer, September 2004 – November 2006. | Fund Administration Staff, Grantham, Mayo, Van Otterloo & Co. LLC (June 2004 – present); Vice President, Director of Tax, Columbia Management Group (2002 – 2004). | ||||||||||||
| Brent C. Arvidson c/o GMO Trust 40 Rowes Wharf Boston, MA 02110 DOB: 06/26/1969 | Assistant Treasurer | Since August 1998. | Senior Fund Administrator, Grantham, Mayo, Van Otterloo & Co. LLC. | ||||||||||||
| John L. Nasrah c/o GMO Trust 40 Rowes Wharf Boston, MA 02110 DOB: 05/27/1977 | Assistant Treasurer | Since March 2007. | Fund Administrator, Grantham, Mayo, Van Otterloo & Co. LLC (September 2004 – present); Tax Analyst, Bain & Company, Inc (June 2003 – September 2004); Senior Tax Associate, PricewaterhouseCoopers LLP (2001 – 2003). | ||||||||||||
| Mahmoodur Rahman c/o GMO Trust 40 Rowes Wharf Boston, MA 02110 DOB: 11/30/1967 | Assistant Treasurer | Since September 2007. | Fund Administrator, Grantham, Mayo, Van Otterloo & Co. (April 2007 – present); Vice President and Senior Tax Manager, Massachusetts Financial Services Company (January 2000 – April 2007). | ||||||||||||
5 Officers are elected to hold such office until their successor is elected and qualified to carry out the duties and responsibilities of their office, or until he or she resigns or is removed from office.
42
Principal Officers — (Continued)
| Name, Address, and DOB | Position(s) Held with Trust | Term of Office5 and Length of Time Served | Principal Occupation(s) During Past Five Years | ||||||||||||
| Michael E. Gillespie c/o GMO Trust 40 Rowes Wharf Boston, MA 02110 DOB: 02/18/1958 | Chief Compliance Officer | Since March 2005. | Vice President of Compliance (June 2004 – February 2005) and Director of Domestic Compliance (March 2002 – June 2004), Fidelity Investments; Vice President and Senior Counsel, State Street Bank and Trust Company (May 1998 – March 2002). | ||||||||||||
| Jason B. Harrison c/o GMO Trust 40 Rowes Wharf Boston, MA 02110 DOB: 01/29/1977 | Vice President and Clerk | Vice President since November 2006; Clerk since March 2006. | Legal Counsel, Grantham, Mayo, Van Otterloo & Co. LLC (since February 2006) and Attorney, Ropes & Gray LLP (September 2002 – February 2006). | ||||||||||||
| David L. Bohan c/o GMO Trust 40 Rowes Wharf Boston, MA 02110 DOB: 06/21/1964 | Vice President and Assistant Clerk | Vice President since March 2005; Assistant Clerk since March 2006. | Legal Counsel, Grantham, Mayo, Van Otterloo & Co. LLC (September 2003 – present); Attorney, Goodwin Procter LLP (September 1996 – September 2003). | ||||||||||||
| Gregory L. Pottle c/o GMO Trust 40 Rowes Wharf Boston, MA 02110 DOB: 07/09/1971 | Vice President and Assistant Clerk | Since November 2006. | Legal Counsel, Grantham, Mayo, Van Otterloo & Co. LLC. | ||||||||||||
| Anne K. Trinque c/o GMO Trust 40 Rowes Wharf Boston, MA 02110 DOB: 04/15/1978 | Vice President and Assistant Clerk | Since September 2007. | Legal Counsel, Grantham, Mayo, Van Otterloo & Co. LLC (since January 2007); Attorney, Goodwin Procter LLP (September 2003 – January 2007). | ||||||||||||
| Cheryl Wakeham c/o GMO Trust 40 Rowes Wharf Boston, MA 02110 DOB: 10/29/1958 | Anti-Money Laundering Officer | Since December 2004. | Manager, Client Service Administration, Grantham, Mayo, Van Otterloo & Co. LLC. | ||||||||||||
5 Officers are elected to hold such office until their successor is elected and qualified to carry out the duties and responsibilities of their office, or until he or she resigns or is removed from office.
43
GMO Global Bond Fund
(A Series of GMO Trust)
Annual Report
February 29, 2008
For a free copy of the Fund's proxy voting guidelines, shareholders may call 1-617-346-7646 (collect), visit our website at www.gmo.com, or visit the Securities and Exchange Commission's website at www.sec.gov. Information regarding how the Fund voted proxies relating to portfolio securities during the most recent 12-month period ended June 30 is available on our website at www.gmo.com, or on the Securities and Exchange Commission's website at www.sec.gov.
The Fund files its complete schedule of portfolio holdings with the Securities and Exchange Commission for the first and third quarter of each fiscal year on Form N-Q, which is available on the Commission's website at www.sec.gov. The Fund's Form N-Q may be reviewed and copied at the Commission's Public Reference Room in Washington, D.C. Information on the operation of the Public Reference Room may be obtained by calling 1-800-SEC-0330. The Fund has a policy with respect to disclosure of portfolio holdings under which it may also make available on GMO's website (www.gmo.com) a complete schedule of portfolio holdings.
This report is prepared for the general information of shareholders. It is authorized for distribution to prospective investors only when preceded or accompanied by a prospectus for the GMO Trust.
GMO Global Bond Fund
(A Series of GMO Trust)
Portfolio Management
Day-to-day management of the Fund's portfolio is the responsibility of the Fixed Income Division at Grantham, Mayo, Van Otterloo & Co. LLC.
Management Discussion and Analysis of Fund Performance
The GMO Global Bond Fund returned +6.5% for the fiscal year ended February 29, 2008, compared with the +16.5% return for the JPMorgan Global Government Bond Index. The Fund's exposure to various issues is achieved directly and indirectly through its investment in certain underlying GMO mutual funds, primarily in the GMO Emerging Country Debt Fund, the GMO World Opportunity Overlay Fund, and the GMO Short-Duration Collateral Fund.
The Fund underperformed the benchmark during the fiscal year by 10%. Cash management was the primary contributor to negative performance for the fiscal year, followed by interest-rate strategy, currency selection, and emerging debt exposure losses.
More than 60% of the fiscal year's underperformance was due to mark-to-market losses in the cash collateral pools of two funds in which the Fund invests a substantial portion of its total assets: the GMO Short Duration Collateral Fund (SDCF) and the GMO World Opportunity Overlay Fund (WOOF). SDCF and WOOF primarily invest cash in high quality U.S. and foreign floating-rate fixed income securities, mainly asset-backed securities, seeking to earn a LIBOR-type return. The cash positions in SDCF and WOOF collateralize derivatives positions that seek to deliver the return of the benchmark as well as create active exposures in global interest-rate and currency markets.
With the extreme price volatility of AAA-credit quality asset-backed securities during the year, the cash pools in SDCF and WOOF underperformed LIBOR by nearly 700 basis points, directly contributing to the Global Bond Fund's underperformance given the Fund's 91% exposure to these two funds.
Further Fund underperformance was attributable to interest-rate and currency strategies. For much of the fiscal year, the Fund was overweight Australian, Euro-area, Swedish, Swiss, and Canadian interest-rate markets relative to Japanese, U.K., and U.S. markets. However, the U.S., U.K., and Japanese markets were among the top performers, detracting from performance. Similar results came out of two other cross-sectional models implemented in swaps. Further, the slope and volatility strategies also underperformed, leaving only the U.S. Eurodollar directional strategy and opportunistic trading with positive contributions for the year.
GMO Global Bond Fund
(A Series of GMO Trust)
Management Discussion and Analysis of Fund Performance — (Continued)
In currencies, the largest negative contributors were underweight positions in euros, yen, and Canadian dollars, as well as an overweight position in Australian dollars. Partially offsetting losses were gains from overweight positions in the Swiss franc, Norwegian krone, and sterling. A major risk aversion episode during the fiscal year, prompted by the turmoil in structured credit markets, persisted for much of the third and fourth quarters. Our choice of a defensive currency during this episode, the Swiss franc, was incorrect, as risk aversion manifested itself in a swift rise in the yen, in which the Fund remained underweight. In addition, a drastic change in the relative volatilities of the currencies in August resulted in a shifting of risk positions into less advantageous, and ultimately unprofitable, intra-European trades.
A relatively minor contribution to negative performance came from the small exposure to emerging debt, where spread widening on the asset class contributed negatively, as did negative contributions from country selection.
The views expressed herein are exclusively those of Grantham, Mayo, Van Otterloo & Co. LLC Management as of the date of this report and are subject to change. GMO disclaims any responsibility to update such views. They are not meant as investment advice.
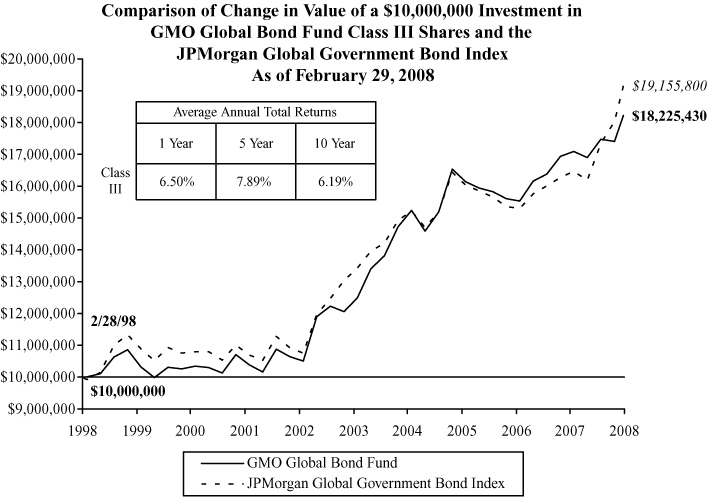
Performance data quoted represents past performance and is not indicative of future results. The investment return and principal value of an investment will fluctuate so that an investor's shares, when redeemed, may be worth more or less than their original cost. Current performance data may be lower or higher than the performance data provided herein. To obtain performance information to the most recent month-end, visit www.gmo.com. Performance shown is net of all fees after reimbursement from the Manager. Returns would have been lower had certain expenses not been reimbursed during the periods shown and do not include the effect of taxes on distributions and redemptions. All information is unaudited.
This page has been left blank intentionally.
GMO Global Bond Fund
(A Series of GMO Trust)
Investments Concentration Summary
February 29, 2008 (Unaudited)
| Asset Class Summary* | % of Total Net Assets | ||||||
| Debt Obligations | 87.4 | % | |||||
| Short-Term Investments | 8.7 | ||||||
| Forward Currency Contracts | 3.3 | ||||||
| Futures | 1.0 | ||||||
| Swaps | 0.5 | ||||||
| Options Purchased | 0.3 | ||||||
| Loan Participations | 0.1 | ||||||
| Loan Assignments | 0.1 | ||||||
| Rights and Warrants | 0.0 | ||||||
| Promissory Notes | 0.0 | ||||||
| Written Options | (0.1 | ) | |||||
| Reverse Repurchase Agreements | (0.6 | ) | |||||
| Other | (0.7 | ) | |||||
| 100.0 | % | ||||||
| Country / Region Summary** | % of Investments | ||||||
| Euro Region*** | 32.7 | % | |||||
| Japan | 31.6 | ||||||
| United States | 21.4 | ||||||
| Australia | 6.0 | ||||||
| Canada | 5.1 | ||||||
| Emerging | 2.5 | ||||||
| Switzerland | 2.5 | ||||||
| Denmark | 0.1 | ||||||
| Sweden | 0.1 | ||||||
| United Kingdom | (2.0 | ) | |||||
| 100.0 | % | ||||||
* The table above incorporates aggregate indirect asset class exposure associated with investments in other funds of GMO Trust ("underlying funds").
** The table above incorporates aggregate indirect country exposure associated with investments in the underlying funds. The table excludes short-term investments. The table includes exposure through the use of derivative contracts.
*** The "Euro Region" is comprised of Austria, Belgium, Finland, France, Germany, Greece, Ireland, Italy, Netherlands, Portugal and Spain.
1
GMO Global Bond Fund
(A Series of GMO Trust)
Schedule of Investments
(showing percentage of total net assets)
February 29, 2008
| Par Value / Shares | Description | Value ($) | |||||||||||||
| DEBT OBLIGATIONS — 1.2% | |||||||||||||||
| Australia — 0.2% | |||||||||||||||
| Asset-Backed Securities | |||||||||||||||
| USD | 857,273 | Medallion Trust, Series 03-1G, Class A, Variable Rate, 3 mo. LIBOR + .19%, 5.10%, due 12/21/33 | 830,149 | ||||||||||||
| United Kingdom — 0.1% | |||||||||||||||
| Asset-Backed Securities | |||||||||||||||
| GBP | 87,102 | RMAC, Series 03-NS2A Class A2A, 144A, AMBAC, Variable Rate, 3 mo. LIBOR + .40%, 7.03%, due 09/12/35 | 173,042 | ||||||||||||
| United States — 0.9% | |||||||||||||||
| U.S. Government | |||||||||||||||
| USD | 3,000,000 | U.S. Treasury Note, 2.63%, due 05/15/08 (a) | 3,004,218 | ||||||||||||
| TOTAL DEBT OBLIGATIONS (COST $3,995,850) | 4,007,409 | ||||||||||||||
| MUTUAL FUNDS — 93.8% | |||||||||||||||
| United States — 93.8% | |||||||||||||||
| Affiliated Issuers | |||||||||||||||
| 982,617 | GMO Emerging Country Debt Fund, Class III | 9,885,128 | |||||||||||||
| 10,060,308 | GMO Short-Duration Collateral Fund | 241,749,211 | |||||||||||||
| 45,838 | GMO Special Purpose Holding Fund (b) (c) | 57,756 | |||||||||||||
| 2,572,687 | GMO World Opportunity Overlay Fund | 66,066,597 | |||||||||||||
| Total United States | 317,758,692 | ||||||||||||||
| TOTAL MUTUAL FUNDS (COST $334,255,175) | 317,758,692 | ||||||||||||||
See accompanying notes to the financial statements.
2
GMO Global Bond Fund
(A Series of GMO Trust)
Schedule of Investments — (Continued)
(showing percentage of total net assets)
February 29, 2008
| Shares / Par Value ($) | Description | Value ($) | |||||||||||||
| SHORT-TERM INVESTMENTS — 1.0% | |||||||||||||||
| Money Market Funds — 0.4% | |||||||||||||||
| 1,298,258 | State Street Institutional Liquid Reserves Fund-Institutional Class | 1,298,258 | |||||||||||||
| Other Short-Term Investments — 0.6% | |||||||||||||||
| 2,000,000 | U.S. Treasury Bill, 2.05%, due 04/17/08 (a) (d) | 1,994,647 | |||||||||||||
| TOTAL SHORT-TERM INVESTMENTS (COST $3,292,905) | 3,292,905 | ||||||||||||||
| TOTAL INVESTMENTS — 96.0% (Cost $341,543,930) | 325,059,006 | ||||||||||||||
| Other Assets and Liabilities (net) — 4.0% | 13,555,485 | ||||||||||||||
| TOTAL NET ASSETS — 100.0% | $ | 338,614,491 | |||||||||||||
See accompanying notes to the financial statements.
3
GMO Global Bond Fund
(A Series of GMO Trust)
Schedule of Investments — (Continued)
February 29, 2008
A summary of outstanding financial instruments at February 29, 2008 is as follows:
Forward Currency Contracts
| Settlement Date | Deliver/ Receive | Units of Currency | Value | Net Unrealized Appreciation (Depreciation) | |||||||||||||||
| Buys | |||||||||||||||||||
| 3/04/08 | AUD | 7,100,000 | $ | 6,614,005 | $ | 334,038 | |||||||||||||
| 3/04/08 | AUD | 3,200,000 | 2,980,960 | 13,104 | |||||||||||||||
| 5/06/08 | AUD | 5,300,000 | 4,897,511 | (84,489 | ) | ||||||||||||||
| 5/06/08 | AUD | 5,000,000 | 4,620,293 | (22,307 | ) | ||||||||||||||
| 3/11/08 | CAD | 4,900,000 | 4,977,692 | 135,009 | |||||||||||||||
| 4/01/08 | CHF | 28,700,000 | 27,562,243 | 1,143,803 | |||||||||||||||
| 4/15/08 | EUR | 98,300,000 | 149,038,556 | 6,995,055 | |||||||||||||||
| 3/25/08 | GBP | 6,600,000 | 13,096,512 | 75,752 | |||||||||||||||
| 3/25/08 | GBP | 4,500,000 | 8,929,440 | 141,220 | |||||||||||||||
| 3/25/08 | GBP | 1,900,000 | 3,770,208 | 684 | |||||||||||||||
| 4/22/08 | JPY | 10,642,500,000 | 102,741,304 | 3,814,924 | |||||||||||||||
| 4/22/08 | JPY | 30,000,000 | 289,616 | 10,198 | |||||||||||||||
| 4/08/08 | NZD | 3,000,000 | 2,385,910 | 53,410 | |||||||||||||||
| 4/08/08 | NZD | 3,000,000 | 2,385,910 | (34,370 | ) | ||||||||||||||
| 4/08/08 | NZD | 5,500,000 | 4,374,168 | (77,422 | ) | ||||||||||||||
| $ | 338,664,328 | $ | 12,498,609 | ||||||||||||||||
| Sales | |||||||||||||||||||
| 3/04/08 | AUD | 5,000,000 | $ | 4,657,750 | $ | (295,350 | ) | ||||||||||||
| 3/04/08 | AUD | 5,300,000 | 4,937,215 | 85,277 | |||||||||||||||
| 3/11/08 | CAD | 4,100,000 | 4,165,008 | 19,220 | |||||||||||||||
| 4/01/08 | CHF | 22,500,000 | 21,608,030 | (729,955 | ) | ||||||||||||||
| 4/15/08 | EUR | 2,600,000 | 3,942,016 | (133,224 | ) | ||||||||||||||
| 4/15/08 | EUR | 3,000,000 | 4,548,481 | (14,041 | ) | ||||||||||||||
| 4/08/08 | NZD | 1,500,000 | 1,192,955 | (16,220 | ) | ||||||||||||||
| $ | 45,051,455 | $ | (1,084,293 | ) | |||||||||||||||
See accompanying notes to the financial statements.
4
GMO Global Bond Fund
(A Series of GMO Trust)
Schedule of Investments — (Continued)
February 29, 2008
Forward Cross Currency Contracts
| Settlement Date | Deliver/Units of Currency | Receive/In Exchange For | Net Unrealized Appreciation (Depreciation) | ||||||||||||
| 3/18/08 | EUR | 11,400,000 | SEK | 107,168,160 | $ | 70,604 | |||||||||
| 3/18/08 | SEK | 64,940,620 | EUR | 6,900,000 | (55,001 | ) | |||||||||
| 4/29/08 | EUR | 9,700,000 | NOK | 76,503,900 | (89,028 | ) | |||||||||
| 4/29/08 | NOK | 23,668,500 | EUR | 3,000,000 | 26,102 | ||||||||||
| $ | (47,323 | ) | |||||||||||||
Futures Contracts
| Number of Contracts | Type | Expiration Date | Contract Value | Net Unrealized Appreciation (Depreciation) | |||||||||||||||
| Buys | |||||||||||||||||||
| 79 | Australian Government Bond 10 Yr. | March 2008 | $ | 7,229,306 | $ | 10,858 | |||||||||||||
| 166 | Australian Government Bond 3 Yr. | March 2008 | 15,202,588 | 29,972 | |||||||||||||||
| 176 | Canadian Government Bond 10 Yr. | June 2008 | 21,082,449 | 424,921 | |||||||||||||||
| 207 | Euro BOBL | March 2008 | 34,990,951 | 587,622 | |||||||||||||||
| 392 | Euro Bund | March 2008 | 69,664,139 | 1,114,873 | |||||||||||||||
| 79 | Japanese Government Bond 10 Yr. (TSE) | March 2008 | 105,295,312 | 1,488,115 | |||||||||||||||
| 88 | U.S. Long Bond (CBT) | June 2008 | 10,439,000 | 236,299 | |||||||||||||||
| 24 | U.S. Treasury Note 10 Yr. | June 2008 | 2,814,750 | 51,445 | |||||||||||||||
| 71 | U.S. Treasury Note 5 Yr. (CBT) | June 2008 | 8,111,750 | 109,112 | |||||||||||||||
| $ | 274,830,245 | $ | 4,053,217 | ||||||||||||||||
| Sales | |||||||||||||||||||
| 20 | Euro Bund | March 2008 | $ | 3,554,293 | $ | (30,091 | ) | ||||||||||||
| 370 | Federal Fund 30 day | March 2008 | 150,070,130 | (23,184 | ) | ||||||||||||||
| 108 | U.S. Treasury Note 2 Yr. (CBT) | June 2008 | 23,211,563 | (148,746 | ) | ||||||||||||||
| 82 | UK Gilt Long Bond | June 2008 | 17,973,702 | (307,248 | ) | ||||||||||||||
| $ | 194,809,688 | $ | (509,269 | ) | |||||||||||||||
See accompanying notes to the financial statements.
5
GMO Global Bond Fund
(A Series of GMO Trust)
Schedule of Investments — (Continued)
February 29, 2008
Swap Agreements
Interest Rate Swaps
| Notional Amount | Expiration Date | Counterparty | Receive (Pay) | Fixed Rate | Variable Rate | Market Value | |||||||||||||||||||||||||
| 13,300,000 | CHF | 3/19/2013 | JP Morgan | Receive | 3.00 | % | 6 month | ||||||||||||||||||||||||
| Chase Bank | CHF LIBOR | $ | 87,619 | ||||||||||||||||||||||||||||
| 3,100,000 | AUD | 3/19/2018 | JP Morgan Chase Bank | Receive | 7.07 | % | 6 month AUD BBSW | (39,185 | ) | ||||||||||||||||||||||
| 3,000,000 | EUR | 3/21/2030 | UBS Warburg | Receive | 5.90 | % | 3 Month Floating Rate EUR LIBOR | 845,580 | |||||||||||||||||||||||
| Premiums to (Pay) Receive | $ | 45,389 | $ | 894,014 | |||||||||||||||||||||||||||
Total Return Swaps
| Notional Amount | Expiration Date | Counterparty | Pay | Receive | Market Value | ||||||||||||||||||||||
| 75,000,000 | USD | 9/24/2008 | JP Morgan Chase Bank | 3 month | Return on | ||||||||||||||||||||||
| LIBOR -0.03% | JP Morgan | ||||||||||||||||||||||||||
| Hedged Traded | |||||||||||||||||||||||||||
| Total Return | |||||||||||||||||||||||||||
| Government | |||||||||||||||||||||||||||
| Bond Index | $ | 1,604,125 | |||||||||||||||||||||||||
| Premiums to (Pay) Receive | $ | — | $ | 1,604,125 | |||||||||||||||||||||||
As of February 29, 2008, for the futures and/or swap contracts held, the Fund had sufficient cash and/or securities to cover any commitments or margin requirements of the relevant broker or exchange.
See accompanying notes to the financial statements.
6
GMO Global Bond Fund
(A Series of GMO Trust)
Schedule of Investments — (Continued)
February 29, 2008
Notes to Schedule of Investments:
144A - Securities exempt from registration under Rule 144A of the Securities Act of 1933. These securities may be resold in transactions exempt from registration, normally to qualified institutional investors.
AMBAC - Insured as to the payment of principal and interest by AMBAC Assurance Corporation.
BBSW - Bank Bill Swap Reference Rate
LIBOR - London Interbank Offered Rate
RMAC - Residential Mortgage Acceptance Corp.
Variable rate - The rates shown on variable rate notes are the current interest rates at February 29, 2008, which are subject to change based on the terms of the security.
(a) All or a portion of this security has been segregated to cover margin requirements on open financial futures contracts and/or collateral on open swap contracts (Note 2).
(b) Security valued at fair value using methods determined in good faith by or at the direction of the Trustees of GMO Trust (Note 2).
(c) Underlying investment represents interests in defaulted securities.
(d) Rate shown represents yield-to-maturity.
Currency Abbreviations:
AUD - Australian Dollar
CAD - Canadian Dollar
CHF - Swiss Franc
EUR - Euro
GBP - British Pound
JPY - Japanese Yen
NOK - Norwegian Krone
NZD - New Zealand Dollar
SEK - Swedish Krona
USD - United States Dollar
See accompanying notes to the financial statements.
7
GMO Global Bond Fund
(A Series of GMO Trust)
Statement of Assets and Liabilities — February 29, 2008
| Assets: | |||||||
| Investments in unaffiliated issuers, at value (cost $7,288,755) (Note 2) | $ | 7,300,314 | |||||
| Investments in affiliated issuers, at value (cost $334,255,175) (Notes 2 and 8) | 317,758,692 | ||||||
| Interest receivable | 39,710 | ||||||
| Unrealized appreciation on open forward currency contracts (Note 2) | 12,918,400 | ||||||
| Receivable for variation margin on open futures contracts (Note 2) | 1,681,038 | ||||||
| Interest receivable for open swap contracts | 140,889 | ||||||
| Receivable for open swap contracts (Note 2) | 2,537,324 | ||||||
| Receivable for expenses reimbursed by Manager (Note 3) | 12,715 | ||||||
| Total assets | 342,389,082 | ||||||
| Liabilities: | |||||||
| Payable for investments purchased | 2,000,000 | ||||||
| Payable to broker for closed futures contracts | 1,964 | ||||||
| Payable to affiliate for (Note 3): | |||||||
| Management fee | 49,678 | ||||||
| Shareholder service fee | 39,219 | ||||||
| Trustees and Chief Compliance Officer of GMO Trust fees | 363 | ||||||
| Unrealized depreciation on open forward currency contracts (Note 2) | 1,551,407 | ||||||
| Payable for open swap contracts (Note 2) | 39,185 | ||||||
| Accrued expenses | 92,775 | ||||||
| Total liabilities | 3,774,591 | ||||||
| Net assets | $ | 338,614,491 | |||||
| Net assets consist of: | |||||||
| Paid-in capital | $ | 351,242,775 | |||||
| Accumulated undistributed net investment income | 403,110 | ||||||
| Accumulated net realized loss | (14,000,571 | ) | |||||
| Net unrealized appreciation | 969,177 | ||||||
| $ | 338,614,491 | ||||||
| Net assets attributable to: | |||||||
| Class III shares | $ | 338,614,491 | |||||
| Shares outstanding: | |||||||
| Class III | 38,934,674 | ||||||
| Net asset value per share: | |||||||
| Class III | $ | 8.70 | |||||
See accompanying notes to the financial statements.
8
GMO Global Bond Fund
(A Series of GMO Trust)
Statement of Operations — Year Ended February 29, 2008
| Investment Income: | |||||||
| Dividends from affiliated issuers (Note 8) | $ | 12,565,241 | |||||
| Interest | 1,110,784 | ||||||
| Dividends | 71,822 | ||||||
| Total investment income | 13,747,847 | ||||||
| Expenses: | |||||||
| Management fee (Note 3) | 498,264 | ||||||
| Shareholder service fee – Class III (Note 3) | 393,366 | ||||||
| Custodian, fund accounting agent and transfer agent fees | 118,794 | ||||||
| Audit and tax fees | 60,190 | ||||||
| Legal fees | 6,827 | ||||||
| Trustees fees and related expenses (Note 3) | 2,392 | ||||||
| Registration fees | 4,154 | ||||||
| Miscellaneous | 4,345 | ||||||
| Total expenses | 1,088,332 | ||||||
| Fees and expenses reimbursed by Manager (Note 3) | (36,536 | ) | |||||
| Expense reductions (Note 2) | (394 | ) | |||||
| Indirectly incurred fees waived or borne by Manager (Note 3) | (32,971 | ) | |||||
| Shareholder service fee waived (Note 3) | (11,709 | ) | |||||
| Net expenses | 1,006,722 | ||||||
| Net investment income (loss) | 12,741,125 | ||||||
| Realized and unrealized gain (loss): | |||||||
| Net realized gain (loss) on: | |||||||
| Investments in unaffiliated issuers | 664,965 | ||||||
| Investments in affiliated issuers | 389,157 | ||||||
| Realized gains distributions from affiliated issuers (Note 8) | 595,307 | ||||||
| Closed futures contracts | (1,108,056 | ) | |||||
| Closed swap contracts | (145,542 | ) | |||||
| Foreign currency, forward contracts and foreign currency related transactions | 10,028,680 | ||||||
| Net realized gain (loss) | 10,424,511 | ||||||
| Change in net unrealized appreciation (depreciation) on: | |||||||
| Investments in unaffiliated issuers | (1,251,362 | ) | |||||
| Investments in affiliated issuers | (18,809,113 | ) | |||||
| Open futures contracts | 3,838,891 | ||||||
| Open swap contracts | 1,317,373 | ||||||
| Foreign currency, forward contracts and foreign currency related transactions | 11,550,391 | ||||||
| Net unrealized gain (loss) | (3,353,820 | ) | |||||
| Net realized and unrealized gain (loss) | 7,070,691 | ||||||
| Net increase (decrease) in net assets resulting from operations | $ | 19,811,816 | |||||
See accompanying notes to the financial statements.
9
GMO Global Bond Fund
(A Series of GMO Trust)
Statement of Changes in Net Assets
| Year Ended February 29, 2008 | Year Ended February 28, 2007 | ||||||||||
| Increase (decrease) in net assets: | |||||||||||
| Operations: | |||||||||||
| Net investment income (loss) | $ | 12,741,125 | $ | 7,675,517 | |||||||
| Net realized gain (loss) | 10,424,511 | 7,986,161 | |||||||||
| Change in net unrealized appreciation (depreciation) | (3,353,820 | ) | (588,542 | ) | |||||||
| Net increase (decrease) in net assets from operations | 19,811,816 | 15,073,136 | |||||||||
| Distributions to shareholders from: | |||||||||||
| Net investment income | |||||||||||
| Class III | (23,714,054 | ) | (7,434,973 | ) | |||||||
| Net share transactions (Note 7): | |||||||||||
| Class III | 157,195,473 | 9,358,867 | |||||||||
| Total increase (decrease) in net assets | 153,293,235 | 16,997,030 | |||||||||
| Net assets: | |||||||||||
| Beginning of period | 185,321,256 | 168,324,226 | |||||||||
| End of period (including accumulated undistributed net investment income of $403,110 and $1,299,063, respectively) | $ | 338,614,491 | $ | 185,321,256 | |||||||
See accompanying notes to the financial statements.
10
GMO Global Bond Fund
(A Series of GMO Trust)
Financial Highlights
(For a Class III share outstanding throughout each period)
| Year Ended February 28/29, | |||||||||||||||||||||||
| 2008 | 2007 | 2006 | 2005 | 2004 | |||||||||||||||||||
| Net asset value, beginning of period | $ | 8.92 | $ | 8.53 | $ | 9.11 | $ | 8.73 | $ | 9.20 | |||||||||||||
| Income (loss) from investment operations: | |||||||||||||||||||||||
| Net investment income (loss)(a)† | 0.42 | 0.38 | 0.18 | 0.21 | 0.12 | ||||||||||||||||||
| Net realized and unrealized gain (loss) | 0.11 | 0.38 | (0.57 | ) | 0.63 | 1.42 | |||||||||||||||||
| Total from investment operations | 0.53 | 0.76 | (0.39 | ) | 0.84 | 1.54 | |||||||||||||||||
| Less distributions to shareholders: | |||||||||||||||||||||||
| From net investment income | (0.75 | ) | (0.37 | ) | (0.19 | ) | (0.46 | ) | — | ||||||||||||||
| From net realized gains | — | — | — | — | (1.90 | ) | |||||||||||||||||
| Return of capital | — | — | — | — | (0.11 | ) | |||||||||||||||||
| Total distributions | (0.75 | ) | (0.37 | ) | (0.19 | ) | (0.46 | ) | (2.01 | ) | |||||||||||||
| Net asset value, end of period | $ | 8.70 | $ | 8.92 | $ | 8.53 | $ | 9.11 | $ | 8.73 | |||||||||||||
| Total Return(b) | 6.50 | % | 8.99 | % | (4.33 | )% | 9.52 | % | 20.21 | % | |||||||||||||
| Ratios/Supplemental Data: | |||||||||||||||||||||||
| Net assets, end of period (000's) | $ | 338,614 | $ | 185,321 | $ | 168,324 | $ | 170,750 | $ | 138,684 | |||||||||||||
| Net expenses to average daily net assets(c) | 0.38 | %(d) | 0.39 | % | 0.37 | % | 0.33 | % | 0.32 | % | |||||||||||||
| Net investment income to average daily net assets(a) | 4.86 | % | 4.33 | % | 2.12 | % | 2.40 | % | 1.44 | % | |||||||||||||
| Portfolio turnover rate | 20 | % | 22 | % | 20 | % | 38 | % | 45 | % | |||||||||||||
| Fees and expenses reimbursed and/or waived by the Manager to average daily net assets: | 0.03 | % | 0.06 | % | 0.07 | % | 0.12 | % | 0.12 | % | |||||||||||||
(a) Net investment income is affected by the timing of the declaration of dividends by the underlying funds in which the Fund invests.
(b) The total returns would have been lower had certain expenses not been reimbursed and/or waived during the periods shown and assumes the effect of reinvested distributions.
(c) Net expenses exclude expenses incurred indirectly through investment in the underlying funds (See Note 3).
(d) The net expense ratio does not include the effect of expense reductions.
† Calculated using average shares outstanding throughout the period.
See accompanying notes to the financial statements.
11
GMO Global Bond Fund
(A Series of GMO Trust)
Notes to Financial Statements
February 29, 2008
1. Organization
GMO Global Bond Fund (the "Fund") is a series of GMO Trust (the "Trust"). The Fund is registered under the Investment Company Act of 1940, as amended, as an open-end, non-diversified management investment company. The Fund is advised and managed by Grantham, Mayo, Van Otterloo & Co. LLC (the "Manager" or "GMO"). The Trust was established as a Massachusetts business trust under the laws of the Commonwealth of Massachusetts on June 24, 1985. The Declaration of Trust permits the Trustees of the Trust ("Trustees") to create an unlimited number of series of shares ("Funds") and to subdivide Funds into classes.
The Fund seeks total return in excess of that of the JPMorgan Global Government Bond Index. The Fund typically invests in bonds included in the JPMorgan Global Government Bond Index and in securities and instruments with similar characteristics. The Fund seeks additional returns by investing in global interest rate, currency, and emerging country debt markets. The Fund may invest a substantial portion of its assets in shares of Short-Duration Collateral Fund; in futures contracts, currency options, currency forwards, swap contracts, and other types of derivatives; in investment-grade bonds denominated in various currencies, including foreign and U.S. government securities and asset-backed securities issued by foreign governments and U.S. government agencies (including securities neither guaranteed nor insured by the U.S. government), corporate bonds, and mortgage-backed and other asset-backed securities issued by private issuers ; in shares of GMO World Opportunity Overlay Fund; and up to 5% of the Fund's total assets in sovereign debt of emerging countries (including below investment grade securities), primarily through investment in shares of GMO Emerging Country Debt Fund ("ECDF").
The financial statements of the series of the Trust in which the Fund invests ("underlying funds") should be read in conjunction with the Fund's financial statements. These financial statements are available without charge, upon request by calling (617) 346-7646 (collect). Shares of the GMO Short-Duration Collateral Fund, the GMO World Opportunity Overlay Fund and the GMO Special Purpose Holding Fund are not publicly available for direct purchase.
2. Significant accounting policies
The following is a summary of significant accounting policies which are in conformity with accounting principles generally accepted in the United States of America ("U.S. GAAP") and which are consistently followed by the Fund in the preparation of its financial statements. The preparation of financial statements in accordance with U.S. GAAP requires management to make estimates and assumptions that affect the reported amounts and disclosures in the financial statements. Actual results could differ from those estimates. The accounting records of the Fund are maintained in U.S. dollars.
12
GMO Global Bond Fund
(A Series of GMO Trust)
Notes to Financial Statements — (Continued)
February 29, 2008
Portfolio valuation
Securities listed on a securities exchange for which market quotations are readily available are valued at the last sale price or official closing price on each business day, or if there is no such reported sale or official closing price, at the most recent quoted bid price. Unlisted securities for which market quotations are readily available are generally valued at the most recent quoted bid price. Short-term investments with a remaining maturity of sixty days or less are generally valued at amortized cost, which approximates fair value. Shares of investment funds are valued at their net asset value. Securities for which quotations are not readily available or whose values the Manager has determined to be unreliable are valued at fair value as determined in good faith by the Trustees or other persons acting at their direction pursuant to procedures approved by the Trustees. By its nature, a fair value price is a good faith est imate of the value of a security at a given point in time and may not reflect the value that would be realized if the security was sold and the differences could be material.
Fixed income securities held by the Fund or the underlying funds are typically valued pursuant to prices supplied by a primary pricing source chosen by the Manager. The Manager evaluates such primary pricing sources on an ongoing basis, and may change a pricing source should it deem it appropriate. The Manager, at its discretion, may override a price supplied by a primary source by using a price provided by another source if such action is deemed appropriate. The prices provided by such primary pricing sources may differ from the value that would be realized if the securities were sold and the differences could be material.
Certain securities held by the Fund or the underlying funds are valued on the basis of a price provided by a single source. The prices provided may differ from the value that would be realized if the securities were sold and the differences could be material. As of February 29, 2008, the total value of these securities represented 30.66% of net assets.
The Fund indirectly invests through underlying funds in securities with contractual cash flows, such as asset-backed securities, collateralized mortgage obligations and commercial mortgage backed securities, including securities backed by subprime mortgage loans. The value, liquidity and related income of these securities are sensitive to changes in economic conditions, including real estate values, delinquencies and/or defaults, and may be adversely affected by shifts in the market's perception of the securities' market values and changes in interest rates.
GMO Special Purpose Holding Fund ("SPHF"), an investment of the Fund, has litigation pending against various entities related to the default of certain asset-backed securities previously held by SPHF. For the year ended February 29, 2008, the Fund received $297,305 through SPHF in conjunction with settlement agreements related to the default of those securities.
Foreign currency translation
The market values of foreign securities, currency holdings and other assets and liabilities are translated to U.S. dollars based on the current exchange rates each business day. Income and expenses denominated in
13
GMO Global Bond Fund
(A Series of GMO Trust)
Notes to Financial Statements — (Continued)
February 29, 2008
foreign currencies are translated at current exchange rates when accrued or incurred. The Fund does not isolate realized and unrealized gains and losses attributable to changes in exchange rates from gains and losses that arise from changes in the market value of investments. Such fluctuations are included with net realized and unrealized gain or loss on investments. Net realized gains and losses on foreign currency transactions represent gains and losses on disposition of currencies and forward currency contracts, currency gains and losses realized between the trade and settlement dates on securities transactions, and the difference between the amount of investment income and foreign withholding taxes recorded on the Fund's accounting records and the U.S. dollar equivalent amounts actually received or paid.
Forward currency contracts
The Fund may enter into forward currency contracts including forward cross currency contracts. A forward currency contract is an agreement between two parties to buy and sell a currency at a set price on a future date. The market value of a forward currency contract fluctuates with changes in forward currency exchange rates. Forward currency contracts are marked to market daily using rates supplied by a quotation service and changes in value are recorded by the Fund as an unrealized gain or loss. Realized gains or losses equal to the difference between the value of the contract at the time it was opened and the value at the time it was closed are recorded upon delivery or receipt of the currency or, if a forward currency contract is offset by entering into another forward currency contract with the same broker, upon settlement of the net gain or loss. These contracts may involve market risk in excess of the unrealized gain or lo ss reflected in the Fund's Statement of Assets and Liabilities. In addition, the Fund could be exposed to risk if the counterparties are unable to meet the terms of the contracts or if there are movements in currency values that are unfavorable to the Fund. Forward currency contracts outstanding at the end of the period are listed in the Fund's Schedule of Investments.
Futures contracts
The Fund may purchase and sell futures contracts. Upon entering into a futures contract, the Fund is required to deposit with the futures clearing broker an amount of cash, U.S. government and agency obligations, or other liquid assets in accordance with the initial margin requirements of the broker or exchange. In addition, the Fund maintains cash or securities in an amount that at least equals the net amount payable in the event the Fund must deliver the full amount of the contracts. Futures contracts are marked to market daily and an appropriate payable or receivable for the change in value ("variation margin") is recorded by the Fund. The payable or receivable is liquidated on the following business day. Gains or losses are recognized but not considered realized until the contracts expire or are closed. Futures contracts involve, to varying degrees, risk of loss in excess of the variation margin disclosed in the Statement of Assets and Liabilities. Under certain circumstances, futures exchanges may establish daily limits on the amount that the price of a futures contract can vary from the previous day's settlement price, thereby effectively preventing liquidation of unfavorable positions. Losses may arise from changes in the value of the underlying instrument if the Fund is unable to liquidate a futures position due to an illiquid secondary market for the contracts or the imposition of price limits, or if counterparties do not perform under the contract terms. Futures contracts are generally valued at the settlement price established each
14
GMO Global Bond Fund
(A Series of GMO Trust)
Notes to Financial Statements — (Continued)
February 29, 2008
day by the board of trade or exchange on which they are traded. Futures contracts outstanding at the end of the period are listed in the Fund's Schedule of Investments.
Options
The Fund may write call and put options. Writing options increases the Fund's exposure to the underlying instrument by, in the case of a call option, obligating the Fund to sell the underlying instrument at a set price to the option-holder and, in the case of a put option, obligating the Fund to purchase the underlying instrument at a set price from the option-holder. When the Fund writes a call or put option, an amount equal to the premium received is recorded as a liability and subsequently marked to market to reflect the current value of the option written. Premiums received from writing options which expire are treated as realized gains. Premiums received from writing options which are exercised or closed are added to the proceeds or offset against the amounts paid on the underlying future, security or currency transaction to determine the realized gain or loss. The Fund as a writer of an option has no control over whether t he underlying future, security or currency may be sold (call) or purchased (put) and as a result bears the market risk of an unfavorable change in the price of the future, security or currency underlying the written option. In the event that the Fund writes uncovered call options (i.e. options for investments that the Fund does not own), it bears the risk of incurring substantial losses if the price of the underlying instrument increases during the term of the option. There is the risk the Fund may not be able to enter into a closing transaction because of an illiquid market. There were no open written option contracts during the period.
The Fund may also purchase put and call options. Purchasing options alters the Fund's exposure to the underlying instrument by, in the case of a call option, entitling the Fund to purchase the underlying instrument at a set price from the writer of the option and, in the case of a put option, entitling the Fund to sell the underlying instrument at a set price to the writer of the option. The Fund pays a premium as a cost for a purchased option disclosed in the Schedule of Investments which is subsequently marked to market to reflect the current value of the option. Premiums paid for purchasing options which expire are treated as realized losses. Premiums paid for purchasing options which are exercised or closed are added to the amounts paid or offset against the proceeds on the closing transaction to determine the realized gain or loss. The risk associated with purchasing put and call options is limited to the premium paid. Ther e were no purchased option contracts outstanding at the end of the period.
Exchange traded options are valued at the last sale price, or if no sale is reported, the last bid price for purchased options and the last ask price for written options. Options traded over-the-counter are valued using prices supplied by a primary pricing source chosen by the Manager.
Indexed securities
The Fund may invest in indexed securities where the redemption values and/or coupons are linked to the prices of a specific instrument or financial statistic. The Fund uses indexed securities to increase or decrease its exposure to different underlying instruments and to gain exposure to markets in which it may be difficult to invest through conventional securities. Indexed securities may be more volatile than their
15
GMO Global Bond Fund
(A Series of GMO Trust)
Notes to Financial Statements — (Continued)
February 29, 2008
underlying instruments, but any loss is limited to the amount of the original investment. There were no indexed securities held by the Fund at the end of the period.
Swap agreements
The Fund may enter into swap agreements. A swap is an agreement to exchange the return generated by one instrument for the return generated by another instrument. Interest rate swap agreements involve the exchange by one party with another party of their respective commitments to pay or receive interest, e.g., an exchange of floating rate payments for fixed rate payments with respect to a notional amount of principal. Total return swap agreements involve a commitment by one party in the agreement to pay interest in exchange for a market-linked return, both based on notional amounts. To the extent the total return of the security or index underlying the transaction exceeds or falls short of the offsetting interest rate obligation, the party will receive a payment from or make a payment to the counterparty, respectively. Forward spread lock swap agreements involve commitments to pay or receive a settlement amount calculated as the difference between the swap spread and a fixed spread, multiplied by the notional amount times the duration of the swap rate. The swap spread is the difference between the benchmark swap rate (market rate) and the specific treasury rate. In a credit default swap, one party makes a stream of payments to another party in exchange for the right to receive a specified return in the event of a default by a third party on its obligation. Credit default swaps may be used to provide a measure of protection against defaults of sovereign or corporate issuers (i.e., to reduce risk where a party owns or has exposure to the issuer) or to take an active long or short position with respect to the likelihood of a particular issuer's default. Variance swap agreements involve commitments to pay or receive a settlement amount calculated as the difference between the annualized realized variance of returns on the underlying price and a fixed quantity, also known as the variance strike, over a period of time. In connection with these agreements, cash or securities may be set aside as collateral by the Fund's custodian or brokers in accordance with the terms of the swap agreement. The Fund earns or pays interest on cash set aside as collateral.
Swaps are marked to market daily using models that incorporate quotations from market makers and the change in value, if any, is recorded as unrealized gain or loss in the Statement of Operations. Payments received or made on swap contracts are recorded as realized gain or loss in the Statement of Operations. Gains or losses are realized upon early termination of the swap agreements. These financial instruments are not actively traded on financial markets. The values assigned to these instruments are based upon the best available information and because of the uncertainty of the valuation, these values may differ significantly from the values that would have been realized had a ready market for these instruments existed, and the differences could be material. Entering into these agreements involves, to varying degrees, elements of credit, legal, market and documentation risk in excess of the amounts recognized in the Statement o f Assets and Liabilities. Such risks involve the possibility that there will be no liquid market for these agreements, that the counterparties to the agreements may default on their obligations to perform or disagree as to the meaning of contractual terms in the agreements, or that there may be unfavorable changes in interest rates or the price of the index or security underlying these transactions. Swap agreements outstanding at the end of the period are listed in the Fund's Schedule of Investments.
16
GMO Global Bond Fund
(A Series of GMO Trust)
Notes to Financial Statements — (Continued)
February 29, 2008
Repurchase agreements
The Fund may enter into repurchase agreements with banks and broker-dealers whereby the Fund acquires a security for cash and obtains a simultaneous commitment from the seller to repurchase the security at an agreed upon price and date. The Fund, through its custodian, takes possession of securities collateralizing the repurchase agreement. The collateral is marked to market daily to ensure that the market value of the underlying assets remains sufficient to protect the Fund in the event of default by the seller. Collateral for certain tri-party repurchase agreements is held at the counterparty's custodian in a segregated account for the benefit of the Fund and the counterparty. In connection with transactions in repurchase agreements, if the seller defaults or enters into insolvency proceedings and the value of the collateral declines, recovery of cash by the Fund may be delayed or limited. There were no repurchase agreements o utstanding at the end of the period.
Reverse repurchase agreements
The Fund may enter into reverse repurchase agreements with banks and broker-dealers whereby the Fund sells portfolio assets concurrent with an agreement by the Fund to repurchase the same assets at a later date at a fixed price. In connection with these agreements, the Fund establishes segregated accounts with its custodian in which the Fund maintains cash, U.S. government securities or other assets equal in value to its obligations in respect of reverse repurchase agreements. Reverse repurchase agreements involve the risk that the market value of the securities the Fund has sold under the agreement may decline below the price at which the Fund is obligated to repurchase under the agreement. The market value of the securities the Fund has sold is determined daily and any additional required collateral is allocated to or sent by the Fund on the next business day. There were no reverse repurchase agreements outstanding at the end of the period.
Securities lending
The Fund may lend its securities to certain qualified broker-dealers. The loans are collateralized with cash or liquid securities with a market value at least equal to the market value of the securities on loan. As with other extensions of credit, the Fund may bear the risk of loss with respect to the investment of the collateral, the risk of delay in and/or inability to exercise its rights with respect to the collateral, and the risk of delay in recovery or loss of rights in the loaned securities should the borrower of the securities fail financially. If a loan is collateralized by U.S. government securities, the Fund receives a fee from the borrower. If a loan is collateralized by cash, the Fund typically invests the cash collateral for its own account in interest-bearing, short-term securities and pays a fee to the borrower that normally represents a portion of the Fund's earnings on the collateral. For the year ended Februar y 29, 2008, the Fund did not participate in securities lending.
Taxes and distributions
The Fund intends to qualify each tax year as a regulated investment company under Subchapter M of the Internal Revenue Code of 1986, as amended (the "Code"). The Fund intends to distribute substantially all of its net investment income and net realized short-term and long-term capital gains, if any, after giving effect to any available capital loss carryovers for U.S. federal income tax purposes. Therefore, no provision
17
GMO Global Bond Fund
(A Series of GMO Trust)
Notes to Financial Statements — (Continued)
February 29, 2008
for U.S. federal income or excise tax is necessary. Taxes on foreign interest and dividend income are generally withheld in accordance with the applicable country's tax treaty with the United States.
The Fund's policy is to declare and pay distributions from net investment income, if any, semiannually, and from net realized short-term and long-term capital gains, if any, at least annually. All distributions are paid in shares of the Fund, at net asset value, unless the shareholder elects to receive cash distributions. Distributions to shareholders are recorded by the Fund on the ex-dividend date.
Income and capital gain distributions are determined in accordance with U.S. federal income tax regulations, which may differ from U.S. GAAP. Certain capital accounts in the financial statements are periodically adjusted for permanent differences in order to reflect their tax character. These adjustments have no impact on net assets or net asset value per share. Temporary differences which arise from recognizing certain items of income, expense, gain or loss in different periods for financial statement and tax purposes will reverse at some time in the future. Distributions in excess of net investment income or net realized gains are temporary over distributions for financial statement purposes resulting from differences in the recognition or classification of income or distributions for financial statement and tax purposes.
U.S. GAAP and tax accounting differences primarily relate to capital loss carryforwards, derivative contract transactions, foreign currency transactions, losses on wash sale transactions and partnership interest tax allocations.
The following reclassification represents the amount necessary to report the stated components of net assets on a tax basis, excluding certain temporary differences, as of February 29, 2008. The financial highlights exclude these adjustments.
| Accumulated Undistributed Net Investment Income | Accumulated Net Realized Loss | Paid-in Capital | |||||||||
| $ | 10,076,976 | $ | (10,123,079 | ) | $ | 46,103 | |||||
The tax character of distributions declared to shareholders is as follows:
| 2/29/2008 | 2/28/2007 | ||||||||||
| Ordinary income (including any short-term capital gains) | $ | 23,714,054 | $ | 7,434,973 | |||||||
| Total distributions | $ | 23,714,054 | $ | 7,434,973 | |||||||
Distributions in excess of tax basis earnings and profits, if significant, are reported in the financial statements as a tax return of capital.
18
GMO Global Bond Fund
(A Series of GMO Trust)
Notes to Financial Statements — (Continued)
February 29, 2008
As of February 29, 2008, the components of distributable earnings on a tax basis consisted of the following:
| Undistributed ordinary income | $ | 19,732,753 | |||||
As of February 29, 2008, the Fund had capital loss carryforwards available to offset future realized gains if any, to the extent permitted by the Code. Utilization of the capital loss carryforwards could be subject to limitations imposed by the Code related to share ownership activity. Such losses expire as follows:
| 2/29/2012 | $ | (7,605,871 | ) | ||||
| 2/28/2014 | (7,575,780 | ) | |||||
| 2/28/2015 | (269,796 | ) | |||||
| Total | $ | (15,451,447 | ) | ||||
As of February 29, 2008, the approximate cost for U.S. federal income tax purposes and gross and net unrealized appreciation and depreciation in value of investments were as follows:
| Aggregate Cost | Gross Unrealized Appreciation | Gross Unrealized (Depreciation) | Net Unrealized Appreciation (Depreciation) | ||||||||||||
| $ | 346,829,505 | $ | 96,439 | $ | (21,866,938 | ) | $ | (21,770,499 | ) | ||||||
Security transactions and related investment income
Security transactions are accounted for on trade date. Dividend income, net of applicable foreign withholding taxes, if any, is recorded on the ex-dividend date, or when the Fund is informed of the ex-dividend date, if later. Interest income is recorded on the accrual basis and is adjusted for the amortization of premiums and accretion of discounts. Interest income on inflation indexed securities, if any, is accrued daily based upon an inflation adjusted principal. Additionally, any increase or decrease in the principal or face amount of the securities adjusted for inflation is recorded as interest income or loss. Income is not recognized on securities for which collection is not expected. Non-cash dividends, if any, are recorded at the fair market value of the securities received. In determining the net gain or loss on securities sold, the cost of securities is determined on the identified cost basis.
Expenses
The majority of expenses of the Trust are directly identifiable to an individual fund. Expenses which are not readily identifiable to a specific fund are allocated taking into consideration, among other things, the nature and type of expense and the relative size of the funds. In addition, the Fund will also incur certain fees and expenses indirectly as a shareholder in the underlying funds. Because the underlying funds have varied expense and fee levels and the Fund may own different proportions of the underlying funds at different times, the amount of fees and expenses indirectly incurred by the Fund will vary (See Note 3).
19
GMO Global Bond Fund
(A Series of GMO Trust)
Notes to Financial Statements — (Continued)
February 29, 2008
State Street Bank and Trust Company ("State Street") serves as custodian, fund accounting agent and transfer agent of the Fund. State Street's fee may be reduced by credits that are an earnings allowance calculated on the average daily cash balances the Fund maintains with State Street. Credit balances used to reduce the fee paid to State Street, if any, are reported as a reduction of expenses in the Statement of Operations.
Investment risks
There are certain additional risks involved in investing in foreign securities that are not inherent in investments in U.S. securities. These risks may involve adverse political and economic developments including the possible imposition of capital controls or other foreign governmental laws or restrictions. In addition, the securities of some foreign companies and securities markets are less liquid and at times may be more volatile than securities of comparable U.S. companies and U.S. securities markets. The risks described above apply to an even greater extent to investments in emerging markets. The securities markets of emerging countries are generally smaller, less developed, less liquid, and more volatile than the securities markets of the U.S. and developed foreign markets.
Recently issued accounting pronouncements
In June 2006, the Financial Accounting Standards Board ("FASB") issued FASB Interpretation No. 48, Accounting for Uncertainty in Income Taxes – an Interpretation of FASB Statement No. 109 ("FIN 48"). FIN 48 clarifies the accounting for uncertainty in income taxes recognized in accordance with FASB Statement No. 109, Accounting for Income Taxes. FIN 48 prescribes a recognition threshold and measurement attribute for a tax position taken or expected to be taken in the tax return that could impact the Fund's financial statements. It also provides guidance in relation to the Fund's financial statements on classification of tax benefits or liabilities, interest and penalties, accounting in interim periods, disclosure, and transition. FIN 48 is effective for fiscal years beginning after December 15, 2006 for registered investment companies. Management has evaluated the effects of applying the various provisions of FIN 48 and has determined that the adoption of FIN 48 does not have a material effect on the Fund's financial statements. The Fund's federal tax returns for the prior three fiscal years, if applicable, remain subject to examination by the Internal Revenue Service. Management will continue to monitor the rules and guidance pertaining to FIN 48 and will take action if appropriate.
In September 2006, the FASB issued Statement of Financial Accounting Standards No. 157 ("FAS 157"), "Fair Value Measurements." FAS 157 defines fair value, establishes a framework for measuring fair value in accordance with generally accepted accounting principles and expands disclosure about fair value measurements. FAS 157 is effective for fiscal years beginning after November 15, 2007. Management is currently evaluating the impact the adoption of FAS 157 will have on the Fund's financial statement disclosures.
3. Fees and other transactions with affiliates
GMO earns a management fee paid monthly at the annual rate of 0.19% of average daily net assets. The Fund has adopted a Shareholder Service Plan under which the Fund pays GMO a shareholder service fee
20
GMO Global Bond Fund
(A Series of GMO Trust)
Notes to Financial Statements — (Continued)
February 29, 2008
for client and shareholder service, reporting, and other support. Pursuant to the Shareholder Service Plan, the shareholder service fee is calculated based on average daily net assets at the annual rate of 0.15% for Class III shares. The Manager will waive the Fund's shareholder service fee to the extent that the aggregate of any direct and indirect shareholder service fees borne by the Fund exceeds 0.15%; provided, however, that the amount of this waiver will not exceed 0.15%.
The Manager has contractually agreed to reimburse the Fund for Fund expenses through at least June 30, 2008 to the extent the Fund's total annual operating expenses (excluding shareholder service fees, expenses indirectly incurred by investment in the underlying funds, fees and expenses of the independent Trustees of the Trust, fees and expenses for legal services not approved by the Manager for the Trust, compensation and expenses of the Trust's Chief Compliance Officer ("CCO") (excluding any employee benefits), brokerage commissions, securities lending fees and expenses, interest expense, transfer taxes, and other investment-related costs (including expenses associated with investments in any company that is an investment company or would be an investment company under the 1940 Act, but for the exceptions to the definition of investment company provided in Section 3(c)(1) and 3(c)(7) of the 1940 Act), hedging transaction fees, extraordinary, non-recurring and certain other unusual expenses (including taxes) (collectively, "Excluded Fund Fees and Expenses")) exceed 0.25% of the Fund's average daily net assets. In addition, the Manager has contractually agreed to reimburse the Fund through at least June 30, 2008 to the extent that the sum of (a) the Fund's total annual operating expenses (excluding Excluded Fund Fees and Expenses) and (b) the amount of fees and expenses incurred indirectly by the Fund through its investment in ECDF (excluding ECDF's fees and expenses of the independent trustees of the Trust, fees for legal services not procured or provided by the Manager for the Trust, compensation and expenses of the Trust's CCO (excluding any employee benefits), and investment-related expenses such as brokerage commissions, hedging transaction fees, securities lending fees and expenses, interest expense and transfer taxes), exceeds 0.25% of the Fund's average daily net assets, subject to a maximum total reimbursement to the Fund equal to 0.25% of the Fund's average daily net assets.
The Fund incurs fees and expenses indirectly as a shareholder in the underlying funds. For the year ended February 29, 2008, these indirect fees and expenses expressed as an annualized percentage of the Fund's average daily net assets were as follows:
| Indirect Net Expenses (excluding shareholder service fees and interest expense) | Indirect Shareholder Service Fees | Indirect Interest Expense | Total Indirect Expenses | ||||||||||||
| 0.014 | % | 0.004 | % | 0.037 | % | 0.055 | % | ||||||||
21
GMO Global Bond Fund
(A Series of GMO Trust)
Notes to Financial Statements — (Continued)
February 29, 2008
The Fund's portion of the fees paid by the Trust to the independent Trustees and CCO during the year ended February 29, 2008 was $2,116 and $1,230, respectively. The compensation and expenses of the CCO are included in miscellaneous expenses in the Statement of Operations. No remuneration was paid by the Fund to any other officer of the Trust.
4. Purchases and sales of securities
For the year ended February 29, 2008, cost of purchases and proceeds from sales of investments, other than short-term obligations, were as follows:
| Purchases | Sales | ||||||||||
| U.S. Government securities | $ | 7,488,854 | $ | 9,882,626 | |||||||
| Investments (non-U.S. Government securities) | 201,993,431 | 41,636,033 | |||||||||
5. Guarantees
In the normal course of business the Fund enters into contracts with third-party service providers that contain a variety of representations and warranties and which provide general indemnifications. The Fund's maximum exposure under these arrangements is unknown, as this would involve future claims that may be made against the Fund that have not yet occurred. Based on experience, management is of the view that the risk of loss in connection with these potential indemnification obligations is remote; however, there can be no assurance that material liabilities related to such obligations will not arise in the future that could adversely impact the Fund.
6. Principal shareholders and related parties
As of February 29, 2008, 65.90% of the outstanding shares of the Fund were held by three shareholders, each holding in excess of 10% of the Fund's outstanding shares. No other shareholder owned in excess of 10% of the outstanding shares of the Fund. Investment activities of these shareholders may have a material effect on the Fund.
As of February 29, 2008, 0.01% of the Fund's shares were held by two related parties comprised of certain GMO employee accounts, and 28.74% of the Fund's shares were held by accounts for which the Manager has investment discretion.
22
GMO Global Bond Fund
(A Series of GMO Trust)
Notes to Financial Statements — (Continued)
February 29, 2008
7. Share transactions
The Declaration of Trust permits the Trustees to issue an unlimited number of shares of beneficial interest (without par value). Transactions in Fund shares were as follows:
| Year Ended February 29, 2008 | Year Ended February 28, 2007 | ||||||||||||||||||
| Class III: | Shares | Amount | Shares | Amount | |||||||||||||||
| Shares sold | 15,937,195 | $ | 139,052,495 | 2,029,627 | $ | 17,848,889 | |||||||||||||
| Shares issued to shareholders in reinvestment of distributions | 2,820,633 | 23,399,087 | 824,308 | 7,278,642 | |||||||||||||||
| Shares repurchased | (606,251 | ) | (5,256,109 | ) | (1,798,812 | ) | (15,768,664 | ) | |||||||||||
| Net increase (decrease) | 18,151,577 | $ | 157,195,473 | 1,055,123 | $ | 9,358,867 | |||||||||||||
8. Investments in affiliated issuers
A summary of the Fund's transactions in the shares of affiliated issuers during the year ended February 29, 2008 is set forth below:
| Affiliate | Value, beginning of period | Purchases | Sales Proceeds | Dividend Income | Distributions of Realized Gains | Value, end of period | |||||||||||||||||||||
| GMO Emerging Country Debt Fund, Class III | $ | 6,061,685 | $ | 4,378,538 | $ | — | $ | 580,536 | $ | 298,002 | $ | 9,885,128 | |||||||||||||||
| GMO Short-Duration Collateral Fund | 124,359,943 | 165,534,705 | 31,600,000 | 11,984,705 | — | 241,749,211 | |||||||||||||||||||||
| GMO Special Purpose Holding Fund | 64,632 | — | — | — | 297,305 | 57,756 | |||||||||||||||||||||
| GMO World Opportunity Overlay Fund | 37,179,145 | 32,000,000 | 1,800,000 | — | — | 66,066,597 | |||||||||||||||||||||
| Totals | $ | 167,665,405 | $ | 201,913,243 | $ | 33,400,000 | $ | 12,565,241 | $ | 595,307 | $ | 317,758,692 | |||||||||||||||
23
Report of Independent Registered Public Accounting Firm
To the Trustees of GMO Trust and the Shareholders of
GMO Global Bond Fund
In our opinion, the accompanying statement of assets and liabilities, including the schedule of investments, and the related statements of operations and of changes in net assets and the financial highlights present fairly, in all material respects, the financial position of GMO Global Bond Fund (the "Fund") at February 29, 2008, the results of its operations for the year then ended, the changes in its net assets for each of the two years in the period then ended and the financial highlights for each of the five years in the period then ended, in conformity with accounting principles generally accepted in the United States of America. These financial statements and financial highlights (hereafter referred to as "financial statements") are the responsibility of the Fund's management; our responsibility is to express an opinion on these financial statements based on our audits. We conducted our audits of these financial statements in accordance with the standards of the Public Company Accounting Oversight Board (United States). Those standards require that we plan and perform the audit to obtain reasonable assurance about whether the financial statements are free of material misstatement. An audit includes examining, on a test basis, evidence supporting the amounts and disclosures in the financial statements, assessing the accounting principles used and significant estimates made by management, and evaluating the overall financial statement presentation. We believe that our audits, which included confirmation of securities at February 29, 2008 by correspondence with the custodian and brokers, provide a reasonable basis for our opinion.
PricewaterhouseCoopers LLP
Boston, Massachusetts
April 29, 2008
24
GMO Global Bond Fund
(A Series of GMO Trust)
Fund Expenses
February 29, 2008 (Unaudited)
Expense Examples: The following information is in relation to expenses for the six month period ended February 29, 2008.
As a shareholder of the Fund, you may incur two types of costs: (1) transaction costs, and (2) ongoing costs, including management fees, shareholder service fees, and other Fund expenses. This example is intended to help you understand your ongoing costs (in dollars) of investing in the Fund and to compare these costs with the ongoing costs of investing in other mutual funds.
These examples are based on an investment of $1,000 invested at the beginning of the period and held for the entire period, September 1, 2007 through February 29, 2008.
Actual Expenses
The first line of the table below provides information about actual account values and actual expenses. You may use the information in this line, together with the amount you invested, to estimate the expenses that you paid over the period. Simply divide your account value by $1,000 (for example, a $10,000,000 account value divided by $1,000 = 10,000), then multiply the result by the number in the first line under the heading entitled "Net Expense Incurred" to estimate the expenses you paid on your account during this period.
Hypothetical Example for Comparison Purposes
The second line of the table below provides information about hypothetical account values and hypothetical expenses based on the Fund's actual expense ratio and an assumed rate of return of 5% per year before expenses, which is not the Fund's actual return. The hypothetical account values and expenses may not be used to estimate the actual ending account balance or expenses you paid for the period. You may use this information to compare the ongoing costs of investing in the Fund with other funds. To do so, compare this 5% hypothetical example with the 5% hypothetical examples that appear in the shareholder reports of other funds.
Please note that the expenses shown in the table are meant to highlight your ongoing costs only and do not reflect any transactional costs. Therefore, the second line of the table is useful in comparing ongoing costs only, and will not help you determine the relative total costs of owning different funds. In addition, if these transactional costs were included, your costs would have been higher.
| Annualized Net Expense Ratio | Beginning Account Value | Ending Account Value | Net Expense Incurred* | ||||||||||||||||
| Class III | |||||||||||||||||||
| 1) Actual | 0.43 | % | $ | 1,000.00 | $ | 1,062.00 | $ | 2.20 | |||||||||||
| 2) Hypothetical | 0.43 | % | $ | 1,000.00 | $ | 1,022.73 | $ | 2.16 | |||||||||||
* Expenses are calculated using the Class's annualized net expense ratio (including indirect expenses incurred) for the six months ended February 29, 2008, multiplied by the average account value over the period, multiplied by 182 days in the period, divided by 366 days in the year.
25
GMO Global Bond Fund
(A Series of GMO Trust)
Tax Information for the Tax Year Ended February 29, 2008 (Unaudited)
The Fund will notify shareholders of amounts for use in preparing 2008 income tax forms in January 2009.
The Fund hereby designates as qualified interest income with respect to its taxable year ended February 29, 2008, $7,662,202 or if determined to be different, the qualified interest income of such year.
26
Trustees and Officers (Unaudited)
The following tables list the Trust's Trustees and Officers as of the date of this report; their address and date of birth ("DOB"); their position with the Trust; the length of time holding that position with the Trust; their principal occupation(s) during the past five years; the number of portfolios in the fund complex they oversee; and other directorships they hold in companies subject to registration or reporting requirements of the Securities Exchange Act of 1934 (generally called "public companies") or in registered investment companies. The Trust's Statement of Additional Information ("SAI") includes additional information about the Trust's trustees, including changes subsequent to the date of the report. The SAI is available, without charge, upon request by writing GMO, c/o GMO Trust, 40 Rowes Wharf, Boston, MA 02110.
Independent Trustees:
| Name, Address, and DOB | Position(s) Held with Trust | Term of Office1 and Length of Time Served | Principal Occupation(s) During Past Five Years | Number of Portfolios in Fund Complex Overseen by Trustee | Other Directorships Held by Trustee | ||||||||||||||||||
| Donald W. Glazer, Esq. c/o GMO Trust 40 Rowes Wharf Boston, MA 02110 DOB: 07/26/1944 | Chairman of the Board of Trustees | Chairman of the Board of Trustees since March 2005; Lead Independent Trustee (September 2004 – March 2005); Trustee since December 2000. | Consultant – Law and Business2; Vice Chair (since 2002) and Secretary, Provant, Inc. (provider of personnel performance improvement services and training products); Author of Legal Treatises. | 47 | None. | ||||||||||||||||||
1 Each Trustee is elected to serve during the continued lifetime of the Trust until he/she dies, resigns or is removed, or if sooner, until the next meeting of Shareholders called for the purpose of electing Trustees and until the election and qualification of his/her successor.
2 As part of Mr. Glazer's work as a consultant, he provides part-time consulting services to Goodwin Procter LLP ("Goodwin"). Goodwin has provided legal services to Renewable Resources, LLC, an affiliate of GMO; GMO, in connection with its relationship with Renewable Resources; and funds managed by Renewable Resources. Mr. Glazer has represented that he has no financial interest in, and is not involved in the provision of, such legal services. In the calendar years ended December 31, 2006 and December 31, 2007, these entities paid $825,738 and $291,721 respectively, in legal fees and disbursements to Goodwin.
27
Independent Trustees — (Continued)
| Name, Address, and DOB | Position(s) Held with Trust | Term of Office1 and Length of Time Served | Principal Occupation(s) During Past Five Years | Number of Portfolios in Fund Complex Overseen by Trustee | Other Directorships Held by Trustee | ||||||||||||||||||
| Jay O. Light c/o GMO Trust 40 Rowes Wharf Boston, MA 02110 DOB: 10/03/1941 | Trustee | Since May 1996. | Dean (since April 2006), Acting Dean (August 2005 – April 2006), Senior Associate Dean (1998 – 2005), and Professor of Business Administration, Harvard Business School. | 47 | Director of Harvard Management Company, Inc.3 and Verde, Inc.; Director of Partners HealthCare System, Inc. and Chair of its Investment Committee.4 | ||||||||||||||||||
| W. Nicholas Thorndike c/o GMO Trust 40 Rowes Wharf Boston, MA 02110 DOB: 03/28/1933 | Trustee | Since March 2005. | Director or trustee of various corporations and charitable organizations, including Courier Corporation (a book publisher and manufacturer) (July 1989 – present); Putnam Funds (December 1992 – June 2004); and Providence Journal (a newspaper publisher) (December 1986 – December 2003). | 47 | Director of Courier Corporation (a book publisher and manufacturer); Member of the Investment Committee of Partners HealthCare System, Inc.4 | ||||||||||||||||||
1 Each Trustee is elected to serve during the continued lifetime of the Trust until he/she dies, resigns or is removed, or if sooner, until the next meeting of Shareholders called for the purpose of electing Trustees and until the election and qualification of his/her successor.
3 Harvard Management Company, Inc. is a client of the Manager.
4 Partners HealthCare System, Inc. is a client of the Manager.
28
Principal Officers:
| Name, Address, and DOB | Position(s) Held with Trust | Term of Office5 and Length of Time Served | Principal Occupation(s) During Past Five Years | ||||||||||||
| Scott Eston c/o GMO Trust 40 Rowes Wharf Boston, MA 02110 DOB: 01/20/1956 | President and Chief Executive Officer | President and Chief Executive Officer since October 2002; Chief Financial Officer, November 2006 – February 2007. | Chief Financial Officer, Chief Operating Officer and Member, Grantham, Mayo, Van Otterloo & Co. LLC. | ||||||||||||
| Sheppard N. Burnett c/o GMO Trust 40 Rowes Wharf Boston, MA 02110 DOB: 10/24/1968 | Treasurer and Chief Financial Officer | Chief Financial Officer since March 2007; Treasurer since November 2006; Assistant Treasurer, September 2004 – November 2006. | Fund Administration Staff, Grantham, Mayo, Van Otterloo & Co. LLC (June 2004 – present); Vice President, Director of Tax, Columbia Management Group (2002 – 2004). | ||||||||||||
| Brent C. Arvidson c/o GMO Trust 40 Rowes Wharf Boston, MA 02110 DOB: 06/26/1969 | Assistant Treasurer | Since August 1998. | Senior Fund Administrator, Grantham, Mayo, Van Otterloo & Co. LLC. | ||||||||||||
| John L. Nasrah c/o GMO Trust 40 Rowes Wharf Boston, MA 02110 DOB: 05/27/1977 | Assistant Treasurer | Since March 2007. | Fund Administrator, Grantham, Mayo, Van Otterloo & Co. LLC (September 2004 – present); Tax Analyst, Bain & Company, Inc (June 2003 – September 2004); Senior Tax Associate, PricewaterhouseCoopers LLP (2001 – 2003). | ||||||||||||
| Mahmoodur Rahman c/o GMO Trust 40 Rowes Wharf Boston, MA 02110 DOB: 11/30/1967 | Assistant Treasurer | Since September 2007. | Fund Administrator, Grantham, Mayo, Van Otterloo & Co. (April 2007 – present); Vice President and Senior Tax Manager, Massachusetts Financial Services Company (January 2000 – April 2007). | ||||||||||||
5 Officers are elected to hold such office until their successor is elected and qualified to carry out the duties and responsibilities of their office, or until he or she resigns or is removed from office.
29
Principal Officers — (Continued)
| Name, Address, and DOB | Position(s) Held with Trust | Term of Office5 and Length of Time Served | Principal Occupation(s) During Past Five Years | ||||||||||||
| Michael E. Gillespie c/o GMO Trust 40 Rowes Wharf Boston, MA 02110 DOB: 02/18/1958 | Chief Compliance Officer | Since March 2005. | Vice President of Compliance (June 2004 – February 2005) and Director of Domestic Compliance (March 2002 – June 2004), Fidelity Investments; Vice President and Senior Counsel, State Street Bank and Trust Company (May 1998 – March 2002). | ||||||||||||
| Jason B. Harrison c/o GMO Trust 40 Rowes Wharf Boston, MA 02110 DOB: 01/29/1977 | Vice President and Clerk | Vice President since November 2006; Clerk since March 2006. | Legal Counsel, Grantham, Mayo, Van Otterloo & Co. LLC (since February 2006) and Attorney, Ropes & Gray LLP (September 2002 – February 2006). | ||||||||||||
| David L. Bohan c/o GMO Trust 40 Rowes Wharf Boston, MA 02110 DOB: 06/21/1964 | Vice President and Assistant Clerk | Vice President since March 2005; Assistant Clerk since March 2006. | Legal Counsel, Grantham, Mayo, Van Otterloo & Co. LLC (September 2003 – present); Attorney, Goodwin Procter LLP (September 1996 – September 2003). | ||||||||||||
| Gregory L. Pottle c/o GMO Trust 40 Rowes Wharf Boston, MA 02110 DOB: 07/09/1971 | Vice President and Assistant Clerk | Since November 2006. | Legal Counsel, Grantham, Mayo, Van Otterloo & Co. LLC. | ||||||||||||
| Anne K. Trinque c/o GMO Trust 40 Rowes Wharf Boston, MA 02110 DOB: 04/15/1978 | Vice President and Assistant Clerk | Since September 2007. | Legal Counsel, Grantham, Mayo, Van Otterloo & Co. LLC (since January 2007); Attorney, Goodwin Procter LLP (September 2003 – January 2007). | ||||||||||||
| Cheryl Wakeham c/o GMO Trust 40 Rowes Wharf Boston, MA 02110 DOB: 10/29/1958 | Anti-Money Laundering Officer | Since December 2004. | Manager, Client Service Administration, Grantham, Mayo, Van Otterloo & Co. LLC. | ||||||||||||
5 Officers are elected to hold such office until their successor is elected and qualified to carry out the duties and responsibilities of their office, or until he or she resigns or is removed from office.
30
GMO Strategic Fixed Income Fund
(A Series of GMO Trust)
Annual Report
February 29, 2008
For a free copy of the Fund's proxy voting guidelines, shareholders may call 1-617-346-7646 (collect), visit our website at www.gmo.com, or visit the Securities and Exchange Commission's website at www.sec.gov. Information regarding how the Fund voted proxies relating to portfolio securities during the most recent 12-month period ended June 30 is available on our website at www.gmo.com, or on the Securities and Exchange Commission's website at www.sec.gov.
The Fund files its complete schedule of portfolio holdings with the Securities and Exchange Commission for the first and third quarter of each fiscal year on Form N-Q, which is available on the Commission's website at www.sec.gov. The Fund's Form N-Q may be reviewed and copied at the Commission's Public Reference Room in Washington, D.C. Information on the operation of the Public Reference Room may be obtained by calling 1-800-SEC-0330. The Fund has a policy with respect to disclosure of portfolio holdings under which it may also make available on GMO's website (www.gmo.com) a complete schedule of portfolio holdings.
This report is prepared for the general information of shareholders. It is authorized for distribution to prospective investors only when preceded or accompanied by a prospectus for the GMO Trust.
GMO Strategic Fixed Income Fund
(A Series of GMO Trust)
Portfolio Management
Day-to-day management of the Fund's portfolio is the responsibility of the Fixed Income Division at Grantham, Mayo, Van Otterloo & Co. LLC.
Management Discussion and Analysis of Fund Performance
The Class III shares of the GMO Strategic Fixed Income Fund returned -2.4% for the fiscal year ended February 29, 2008, compared with the +5.8% return for the JPMorgan U.S. 3 Month Cash Index. The Fund's exposure to various issues is achieved directly and indirectly through its investment in certain underlying GMO mutual funds, including the GMO Emerging Country Debt Fund, the GMO World Opportunity Overlay Fund, and the GMO Short-Duration Collateral Fund.
The Fund underperformed the benchmark during the fiscal year by 8.2%. Cash management was the primary contributor to negative performance for the fiscal year, followed by currency selection, interest-rate strategy, and emerging debt exposure losses.
About 77% of the fiscal year's underperformance was due to mark-to-market losses in the cash collateral pools of two funds in which the strategy invests a substantial portion of its total assets: the GMO Short Duration Collateral Fund (SDCF) and the GMO World Opportunity Overlay Fund (WOOF). SDCF and WOOF primarily invest cash in high quality U.S. and foreign floating-rate fixed income securities, mainly asset-backed securities, in order to earn a LIBOR-type return. The cash positions in SDCF and WOOF collateralize derivatives positions that seek to deliver the return of the benchmark as well as create active exposures in global interest-rate and currency markets.
With the extreme price volatility of AAA-credit quality asset-backed securities during the year, the cash pools in SDCF and WOOF underperformed LIBOR by nearly 700 basis points, directly contributing to the Strategic Fixed Income Fund's underperformance given the Fund's 95% exposure to these two funds.
Further strategy underperformance was attributable to currency and interest-rate strategies. In currencies, the largest negative contributors were underweight positions in euros, yen, and Canadian dollars, as well as an overweight position in Australian dollars. Partially offsetting losses were gains from overweight positions in the Swiss franc, Norwegian krone, and sterling. A major risk aversion episode during the fiscal year, prompted by the turmoil in structured credit markets, persisted for much of the third and fourth quarters. Our choice of a defensive currency during this episode, the Swiss franc, was incorrect, as risk aversion manifested itself in a swift rise in the yen, in which the Fund remained underweight. In addition, a drastic change in the relative volatilities of the currencies in August resulted in a shifting of risk positions into less advantageous, and ultimately unprofitable, intra-European trades.
GMO Strategic Fixed Income Fund
(A Series of GMO Trust)
Management Discussion and Analysis of Fund Performance — (Continued)
For much of the fiscal year, the strategy was overweight Australian, Euro-area, Swedish, Swiss, and Canadian interest-rate markets relative to Japanese, U.K., and U.S. markets. However, the U.S., U.K., and Japanese markets were among the top performers, detracting from performance. Similar results came out of two other cross-sectional models implemented in swaps. Further, the slope and volatility strategies also underperformed, leaving only the U.S. Eurodollar directional strategy and opportunistic trading with positive contributions for the year.
A relatively minor contribution to negative performance came from the small exposure to emerging debt, where spread widening on the asset class contributed negatively, as did negative contributions from country selection.
The views expressed herein are exclusively those of Grantham, Mayo, Van Otterloo & Co. LLC Management as of the date of this report and are subject to change. GMO disclaims any responsibility to update such views. They are not meant as investment advice.
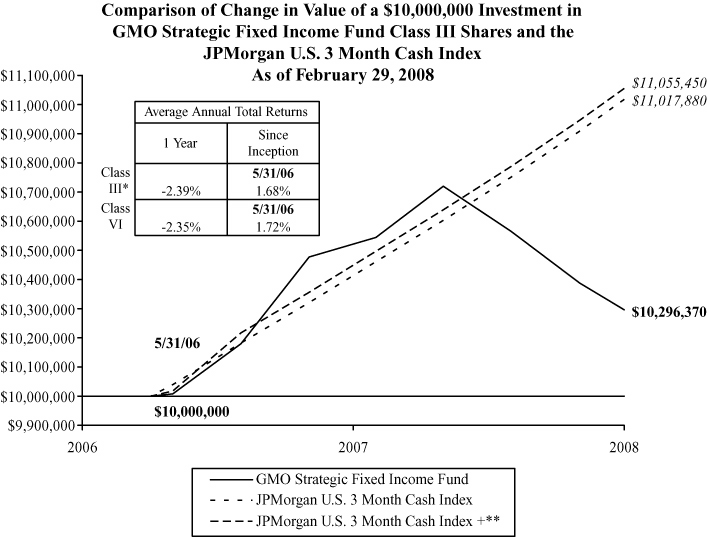
Performance data quoted represents past performance and is not indicative of future results. The investment return and principal value of an investment will fluctuate so that an investor's shares, when redeemed, may be worth more or less than their original cost. Current performance data may be lower or higher than the performance data provided herein. To obtain performance information to the most recent month-end, visit www.gmo.com. Performance shown is net of all fees after reimbursement from the Manager. Returns would have been lower had certain expenses not been reimbursed during the periods shown and do not include the effect of taxes on distributions and redemptions. All information is unaudited. Performance for Class VI will vary due to different fees.
* Class III performance information represents Class VI performance from May 31, 2006 to July 13, 2006 and Class III performance thereafter.
** JPMorgan U.S. 3 Month Cash Index + represents the Lehman Brothers U.S. Treasury 1-3 Year Index prior to 9/29/06 and the JPMorgan U.S. 3 Month Cash Index thereafter.
This page has been left blank intentionally.
GMO Strategic Fixed Income Fund
(A Series of GMO Trust)
Investments Concentration Summary
February 29, 2008 (Unaudited)
| Asset Class Summary* | % of Total Net Assets | ||||||
| Debt Obligations | 91.0 | % | |||||
| Short-Term Investments | 8.3 | ||||||
| Swaps | 0.5 | ||||||
| Options Purchased | 0.2 | ||||||
| Loan Participations | 0.1 | ||||||
| Loan Assignments | 0.0 | ||||||
| Rights and Warrants | 0.0 | ||||||
| Promissory Notes | 0.0 | ||||||
| Forward Currency Contracts | (0.0 | ) | |||||
| Written Options | (0.0 | ) | |||||
| Futures | (0.1 | ) | |||||
| Reverse Repurchase Agreements | (0.3 | ) | |||||
| Other | 0.3 | ||||||
| 100.0 | % | ||||||
* The table above incorporates aggregate indirect asset class exposure associated with investments in other funds of GMO Trust ("underlying funds").
1
GMO Strategic Fixed Income Fund
(A Series of GMO Trust)
Schedule of Investments
(showing percentage of total net assets)
February 29, 2008
| Par Value ($) | Description | Value ($) | |||||||||||||
| DEBT OBLIGATIONS — 2.6% | |||||||||||||||
| Canada — 0.3% | |||||||||||||||
| Corporate Debt | |||||||||||||||
| 15,000,000 | TransAlta Corp., 5.75%, due 12/15/13 | 15,474,000 | |||||||||||||
| Italy — 0.2% | |||||||||||||||
| Corporate Debt | |||||||||||||||
| 10,000,000 | Telecom Italia Capital, 4.95%, due 09/30/14 | 9,478,000 | |||||||||||||
| Mexico — 0.2% | |||||||||||||||
| Corporate Debt | |||||||||||||||
| 10,000,000 | Telefonos de Mexico SA de CV, 5.50%, due 01/27/15 | 9,824,850 | |||||||||||||
| United States — 1.9% | |||||||||||||||
| Corporate Debt — 1.0% | |||||||||||||||
| 7,000,000 | CVS Corp., 6.13%, due 08/15/16 | 7,444,150 | |||||||||||||
| 10,000,000 | Eastman Chemical Co., 7.25%, due 01/15/24 | 10,614,000 | |||||||||||||
| 10,000,000 | Kinder Morgan Energy Partners, L.P., 6.00%, due 02/01/17 | 10,064,000 | |||||||||||||
| 5,000,000 | Ryder System, Inc., MTN, 5.85%, due 11/01/16 | 4,894,500 | |||||||||||||
| 10,000,000 | Southwest Airlines Co., 5.75%, due 12/15/16 | 9,654,200 | |||||||||||||
| 5,000,000 | Wyeth, 5.50%, due 02/01/14 | 5,208,000 | |||||||||||||
| 5,000,000 | Spectra Energy Capital, Series B, 6.75%, due 07/15/18 | 5,120,000 | |||||||||||||
| 52,998,850 | |||||||||||||||
| Structured Notes — 0.4% | |||||||||||||||
| 20,000,000 | Boston Scientific Corp., 6.25%, due 11/15/15 | 18,600,000 | |||||||||||||
| 5,000,000 | RPM UK Group, 144A, 6.70%, due 11/01/15 | 5,269,000 | |||||||||||||
| 23,869,000 | |||||||||||||||
| U.S. Government — 0.5% | |||||||||||||||
| 20,000,000 | U.S. Treasury Note, 4.88%, due 05/15/09 (a) | 20,781,250 | |||||||||||||
| 6,000,000 | U.S. Treasury Note, 3.13%, due 10/15/08 (a) | 6,050,625 | |||||||||||||
| 26,831,875 | |||||||||||||||
| Total United States | 103,699,725 | ||||||||||||||
| TOTAL DEBT OBLIGATIONS (COST $138,935,576) | 138,476,575 | ||||||||||||||
See accompanying notes to the financial statements.
2
GMO Strategic Fixed Income Fund
(A Series of GMO Trust)
Schedule of Investments — (Continued)
(showing percentage of total net assets)
February 29, 2008
| Shares | Description | Value ($) | |||||||||||||
| MUTUAL FUNDS — 96.6% | |||||||||||||||
| United States — 96.6% | |||||||||||||||
| Affiliated Issuers | |||||||||||||||
| 8,047,936 | GMO Emerging Country Debt Fund, Class III | 80,962,232 | |||||||||||||
| 179,527,686 | GMO Short-Duration Collateral Fund | 4,314,050,306 | |||||||||||||
| 31,983,649 | GMO World Opportunity Overlay Fund | 821,340,094 | |||||||||||||
| Total United States | 5,216,352,632 | ||||||||||||||
| TOTAL MUTUAL FUNDS (COST $5,383,127,075) | 5,216,352,632 | ||||||||||||||
| SHORT-TERM INVESTMENTS — 0.1% | |||||||||||||||
| Money Market Funds — 0.1% | |||||||||||||||
| 5,798,647 | State Street Institutional Liquid Reserves Fund-Institutional Class | 5,798,647 | |||||||||||||
| TOTAL SHORT-TERM INVESTMENTS (COST $5,798,647) | 5,798,647 | ||||||||||||||
| TOTAL INVESTMENTS — 99.3% (Cost $5,527,861,298) | 5,360,627,854 | ||||||||||||||
| Other Assets and Liabilities (net) — 0.7% | 38,948,625 | ||||||||||||||
| TOTAL NET ASSETS — 100.0% | $ | 5,399,576,479 | |||||||||||||
See accompanying notes to the financial statements.
3
GMO Strategic Fixed Income Fund
(A Series of GMO Trust)
Schedule of Investments — (Continued)
February 29, 2008
A summary of outstanding financial instruments at February 29, 2008 is as follows:
Forward Cross Currency Contracts
| Settlement Date | Deliver/Units of Currency | Receive/In Exchange for | Net Unrealized Appreciation (Depreciation) | ||||||||||||
| 03/18/08 | EUR | 600,000 | SEK | 5,641,800 | $ | 3,400 | |||||||||
Futures Contracts
| Number of Contracts | Type | Expiration Date | Contract Value | Net Unrealized Appreciation (Depreciation) | |||||||||||||||
| Buys | |||||||||||||||||||
| 71 | U.S. Treasury Note 2 Yr. (CBT) | June 2008 | $ | 15,259,453 | $ | 99,682 | |||||||||||||
| Sales | |||||||||||||||||||
| 55 | U.S. Long Bond (CBT) | June 2008 | $ | 6,524,375 | $ | (147,938 | ) | ||||||||||||
| 1,168 | U.S. Treasury Note 10 Yr. | June 2008 | 136,984,500 | (2,448,163 | ) | ||||||||||||||
| 452 | U.S. Treasury Note 5 Yr. (CBT) | June 2008 | 51,641,000 | (683,257 | ) | ||||||||||||||
| $ | 195,149,875 | $ | (3,279,358 | ) | |||||||||||||||
Swap Agreements
Credit Default Swaps
| Notional Amount | Expiration Date | Counterparty | Receive (Pay) | Annual Premium | Deliverable On Default | Market Value | |||||||||||||||||||||||||
| 15,000,000 | USD | 12/15/2013 | Goldman Sachs | (Pay) | 0.42 | % | TransAlta Corp. | $ | 1,036,847 | ||||||||||||||||||||||
| 5,000,000 | USD | 3/20/2014 | Morgan Stanley | (Pay) | 0.15 | % | Wyeth | 101,460 | |||||||||||||||||||||||
| 10,000,000 | USD | 9/30/2014 | Goldman Sachs | (Pay) | 0.74 | % | Telecom Italia Capital | 516,999 | |||||||||||||||||||||||
| 10,000,000 | USD | 2/20/2015 | JP Morgan Chase Bank | (Pay) | 0.61 | % | Telefonos de Mexico SA de CV | 620,037 | |||||||||||||||||||||||
| 5,000,000 | USD | 11/1/2015 | Goldman Sachs | (Pay) | 0.62 | % | RPM UK | 249,152 | |||||||||||||||||||||||
| 15,000,000 | USD | 12/20/2015 | Barclays Bank PLC | (Pay) | 0.73 | % | Boston Scientific Corp. | 1,923,666 | |||||||||||||||||||||||
| 5,000,000 | USD | 12/20/2015 | Morgan Stanley | (Pay) | 0.81 | % | Boston Scientific Corp. | 617,189 | |||||||||||||||||||||||
| 7,000,000 | USD | 9/20/2016 | Barclays Bank PLC | (Pay) | 0.32 | % | CVS Corp. | 215,152 | |||||||||||||||||||||||
See accompanying notes to the financial statements.
4
GMO Strategic Fixed Income Fund
(A Series of GMO Trust)
Schedule of Investments — (Continued)
February 29, 2008
Credit Default Swaps — continued
| Notional Amount | Expiration Date | Counterparty | Receive (Pay) | Annual Premium | Deliverable On Default | Market Value | |||||||||||||||||||||||||
| 5,000,000 | USD | 12/20/2016 | Morgan Stanley | (Pay) | 0.46 | % | Ryder System, Inc., MTN | $ | 297,632 | ||||||||||||||||||||||
| 10,000,000 | USD | 12/20/2016 | Barclays Bank PLC | (Pay) | 0.72 | % | Southwest Airlines | 396,478 | |||||||||||||||||||||||
| 10,000,000 | USD | 2/1/2017 | Goldman Sachs | (Pay) | 0.49 | % | Kinder Morgan Energy Partners LP | 587,488 | |||||||||||||||||||||||
| 5,000,000 | USD | 7/15/2018 | Goldman Sachs | (Pay) | 0.93 | % | Spectra Energy Capital | 66,262 | |||||||||||||||||||||||
| 10,000,000 | USD | 1/20/2024 | Goldman Sachs | (Pay) | 1.11 | % | Eastman Chemical Co. | 3,209 | |||||||||||||||||||||||
| Premiums to (Pay) Receive | $— | $ | 6,631,571 | ||||||||||||||||||||||||||||
Interest Rate Swaps
| Notional Amount | Expiration Date | Counterparty | Receive (Pay) | Fixed Rate | Variable Rate | Market Value | |||||||||||||||||||||||||
| 333,000,000 | USD | 2/8/2010 | Morgan Stanley | (Pay) | 4.90 | % | 3 month LIBOR | $ | (660,749 | ) | |||||||||||||||||||||
| 1,388,000,000 | USD | 2/1/2012 | Deutsche Bank AG | Receive | 3.75 | % | 3 month LIBOR | 3,000,418 | |||||||||||||||||||||||
| 2,776,000,000 | USD | 2/4/2012 | Citigroup | Receive | 3.75 | % | 3 month LIBOR | 5,629,127 | |||||||||||||||||||||||
| 1,379,000,000 | USD | 2/4/2012 | Merrill Lynch | Receive | 3.75 | % | 3 month LIBOR | 2,796,314 | |||||||||||||||||||||||
| 1,380,000,000 | USD | 2/7/2012 | JP Morgan Chase Bank | Receive | 3.70 | % | 3 month LIBOR | 1,359,667 | |||||||||||||||||||||||
| 1,390,000,000 | USD | 2/8/2012 | Morgan Stanley | Receive | 3.80 | % | 3 month LIBOR | 3,845,119 | |||||||||||||||||||||||
| 2,755,000,000 | USD | 2/11/2012 | Deutsche Bank AG | Receive | 3.85 | % | 3 month LIBOR | 9,764,689 | |||||||||||||||||||||||
| 2,766,000,000 | USD | 2/16/2012 | Merrill Lynch | Receive | 3.90 | % | 3 month LIBOR | 11,720,700 | |||||||||||||||||||||||
| 1,398,000,000 | USD | 3/4/2012 | Morgan Stanley | Receive | 3.80 | % | 3 month LIBOR | 2,234,131 | |||||||||||||||||||||||
| 333,000,000 | USD | 2/1/2020 | Deutsche Bank AG | (Pay) | 4.75 | % | 3 month LIBOR | 2,955,826 | |||||||||||||||||||||||
| 660,000,000 | USD | 2/4/2020 | Citigroup | (Pay) | 4.80 | % | 3 month LIBOR | 3,499,384 | |||||||||||||||||||||||
| 332,000,000 | USD | 2/4/2020 | Merrill Lynch | (Pay) | 4.80 | % | 3 month LIBOR | 1,760,296 | |||||||||||||||||||||||
| 330,000,000 | USD | 2/7/2020 | JP Morgan Chase Bank | (Pay) | 4.80 | % | 3 month LIBOR | 1,824,019 | |||||||||||||||||||||||
| 666,000,000 | USD | 2/11/2020 | Deutsche Bank AG | (Pay) | 5.00 | % | 3 month LIBOR | (6,222,919 | ) | ||||||||||||||||||||||
| 668,000,000 | USD | 2/18/2020 | Merrill Lynch | (Pay) | 5.10 | % | 3 month LIBOR | (11,120,483 | ) | ||||||||||||||||||||||
| 333,000,000 | USD | 3/4/2020 | Morgan Stanley | (Pay) | 5.00 | % | 3 month LIBOR | (2,516,501 | ) | ||||||||||||||||||||||
| Premiums to (Pay) Receive | $ | 4,933,100 | $ | 29,869,038 | |||||||||||||||||||||||||||
As of February 29, 2008, for the futures and/or swap contracts held, the Fund had sufficient cash and/or securities to cover any commitments or margin requirements of the relevant broker or exchange.
See accompanying notes to the financial statements.
5
GMO Strategic Fixed Income Fund
(A Series of GMO Trust)
Schedule of Investments — (Continued)
February 29, 2008
Notes to Schedule of Investments:
144A - Securities exempt from registration under Rule 144A of the Securities Act of 1933. These securities may be resold in transactions exempt from registration, normally to qualified institutional investors.
LIBOR - London Interbank Offered Rate
MTN - Medium Term Note
(a) All or a portion of this security has been segregated to cover margin requirements on open financial futures contracts and/or collateral on open swap contracts (Note 2).
Currency Abbreviations:
EUR - Euro
SEK - Swedish Krona
USD - United States Dollar
See accompanying notes to the financial statements.
6
GMO Strategic Fixed Income Fund
(A Series of GMO Trust)
Statement of Assets and Liabilities — February 29, 2008
| Assets: | |||||||
| Investments in unaffiliated issuers, at value (cost $144,734,223) (Note 2) | $ | 144,275,222 | |||||
| Investments in affiliated issuers, at value (cost $5,383,127,075) (Notes 2 and 8) | 5,216,352,632 | ||||||
| Receivable for investments sold | 10,000,000 | ||||||
| Receivable for Fund shares sold | 1,818,558 | ||||||
| Interest receivable | 1,769,076 | ||||||
| Unrealized appreciation on open forward currency contracts (Note 2) | 3,400 | ||||||
| Receivable for open swap contracts (Note 2) | 57,021,261 | ||||||
| Receivable for closed swap contracts (Note 2) | 5,960,000 | ||||||
| Receivable for expenses reimbursed by Manager (Note 3) | 154,487 | ||||||
| Total assets | 5,437,354,636 | ||||||
| Liabilities: | |||||||
| Payable for Fund shares repurchased | 13,580,892 | ||||||
| Payable to affiliate for (Note 3): | |||||||
| Management fee | 923,973 | ||||||
| Shareholder service fee | 221,738 | ||||||
| Trustees and Chief Compliance Officer of GMO Trust fees | 2,795 | ||||||
| Payable for open swap contracts (Note 2) | 20,520,652 | ||||||
| Payable for variation margin on open futures contracts (Note 2) | 2,290,609 | ||||||
| Accrued expenses | 237,498 | ||||||
| Total liabilities | 37,778,157 | ||||||
| Net assets | $ | 5,399,576,479 | |||||
See accompanying notes to the financial statements.
7
GMO Strategic Fixed Income Fund
(A Series of GMO Trust)
Statement of Assets and Liabilities — February 29, 2008 — (Continued)
| Net assets consist of: | |||||||
| Paid-in capital | $ | 5,550,653,138 | |||||
| Distributions in excess of net investment income | (28,882,220 | ) | |||||
| Accumulated net realized gain | 6,781,572 | ||||||
| Net unrealized depreciation | (128,976,011 | ) | |||||
| $ | 5,399,576,479 | ||||||
| Net assets attributable to: | |||||||
| Class III shares | $ | 277,878,887 | |||||
| Class VI shares | $ | 5,121,697,592 | |||||
| Shares outstanding: | |||||||
| Class III | 11,776,714 | ||||||
| Class VI | 217,264,327 | ||||||
| Net asset value per share: | |||||||
| Class III | $ | 23.60 | |||||
| Class VI | $ | 23.57 | |||||
See accompanying notes to the financial statements.
8
GMO Strategic Fixed Income Fund
(A Series of GMO Trust)
Statement of Operations — Year Ended February 29, 2008
| Investment Income: | |||||||
| Dividends from affiliated issuers (Note 8) | $ | 119,644,317 | |||||
| Interest | 8,380,447 | ||||||
| Dividends | 559,421 | ||||||
| Total investment income | 128,584,185 | ||||||
| Expenses: | |||||||
| Management fee (Note 3) | 7,804,357 | ||||||
| Shareholder service fee – Class III (Note 3) | 322,786 | ||||||
| Shareholder service fee – Class VI (Note 3) | 1,598,604 | ||||||
| Custodian, fund accounting agent and transfer agent fees | 374,306 | ||||||
| Audit and tax fees | 60,539 | ||||||
| Legal fees | 81,307 | ||||||
| Trustees fees and related expenses (Note 3) | 28,877 | ||||||
| Registration fees | 81,682 | ||||||
| Miscellaneous | 26,285 | ||||||
| Total expenses | 10,378,743 | ||||||
| Fees and expenses reimbursed by Manager (Note 3) | (599,578 | ) | |||||
| Expense reductions (Note 2) | (337 | ) | |||||
| Indirectly incurred fees waived or borne by Manager (Note 3) | (385,570 | ) | |||||
| Shareholder service fee waived (Note 3) | (137,448 | ) | |||||
| Net expenses | 9,255,810 | ||||||
| Net investment income (loss) | 119,328,375 | ||||||
| Realized and unrealized gain (loss): | |||||||
| Net realized gain (loss) on: | |||||||
| Investments in unaffiliated issuers | (4,520,416 | ) | |||||
| Investments in affiliated issuers | 18,881,405 | ||||||
| Realized gains distributions from affiliated issuers (Note 8) | 3,863,142 | ||||||
| Closed futures contracts | (30,436,469 | ) | |||||
| Closed swap contracts | (7,193,222 | ) | |||||
| Foreign currency, forward contracts and foreign currency related transactions | (17,390,829 | ) | |||||
| Net realized gain (loss) | (36,796,389 | ) | |||||
| Change in net unrealized appreciation (depreciation) on: | |||||||
| Investments in unaffiliated issuers | (1,174,360 | ) | |||||
| Investments in affiliated issuers | (171,930,439 | ) | |||||
| Open futures contracts | 5,813,757 | ||||||
| Open swap contracts | 38,300,870 | ||||||
| Foreign currency, forward contracts and foreign currency related transactions | 2,850,816 | ||||||
| Net unrealized gain (loss) | (126,139,356 | ) | |||||
| Net realized and unrealized gain (loss) | (162,935,745 | ) | |||||
| Net increase (decrease) in net assets resulting from operations | $ | (43,607,370 | ) | ||||
See accompanying notes to the financial statements.
9
GMO Strategic Fixed Income Fund
(A Series of GMO Trust)
Statement of Changes in Net Assets
| Year Ended February 29, 2008 | Period from May 31, 2006 (commencement of operations) through February 28, 2007 | ||||||||||
| Increase (decrease) in net assets: | |||||||||||
| Operations: | |||||||||||
| Net investment income (loss) | $ | 119,328,375 | $ | 30,368,989 | |||||||
| Net realized gain (loss) | (36,796,389 | ) | 12,612,912 | ||||||||
| Change in net unrealized appreciation (depreciation) | (126,139,356 | ) | (2,836,655 | ) | |||||||
| Net increase (decrease) in net assets from operations | (43,607,370 | ) | 40,145,246 | ||||||||
| Distributions to shareholders from: | |||||||||||
| Net investment income | |||||||||||
| Class III | (5,772,752 | ) | (9,486,069 | ) | |||||||
| Class VI | (97,139,821 | ) | (28,962,149 | ) | |||||||
| Total distributions from net investment income | (102,912,573 | ) | (38,448,218 | ) | |||||||
| Net realized gains | |||||||||||
| Class III | (344,272 | ) | — | ||||||||
| Class VI | (5,909,472 | ) | — | ||||||||
| Total distributions from net realized gains | (6,253,744 | ) | — | ||||||||
| (109,166,317 | ) | (38,448,218 | ) | ||||||||
| Net share transactions (Note 7): | |||||||||||
| Class III | 59,121,073 | 227,768,727 | |||||||||
| Class VI | 3,042,002,441 | 2,221,760,897 | |||||||||
| Increase (decrease) in net assets resulting from net share transactions | 3,101,123,514 | 2,449,529,624 | |||||||||
| Total increase (decrease) in net assets | 2,948,349,827 | 2,451,226,652 | |||||||||
| Net assets: | |||||||||||
| Beginning of period | 2,451,226,652 | — | |||||||||
| End of period (including distributions in excess of net investment income of $28,882,220 and accumulated undistributed net investment income of $984,360, respectively) | $ | 5,399,576,479 | $ | 2,451,226,652 | |||||||
See accompanying notes to the financial statements.
10
GMO Strategic Fixed Income Fund
(A Series of GMO Trust)
Financial Highlights
(For a Class III share outstanding throughout each period)
| Year Ended February 29, 2008 | Period from July 13, 2006 (commencement of operations) through February 28, 2007 | ||||||||||
| Net asset value, beginning of period | $ | 25.22 | $ | 25.06 | |||||||
| Income (loss) from investment operations: | |||||||||||
| Net investment income (loss)(a)† | 0.78 | 0.96 | |||||||||
| Net realized and unrealized gain (loss) | (1.37 | ) | 0.34 | ||||||||
| Total from investment operations | (0.59 | ) | 1.30 | ||||||||
| Less distributions to shareholders: | |||||||||||
| From net investment income | (0.97 | ) | (1.14 | ) | |||||||
| From net realized gains | (0.06 | ) | — | ||||||||
| Total distributions | (1.03 | ) | (1.14 | ) | |||||||
| Net asset value, end of period | $ | 23.60 | $ | 25.22 | |||||||
| Total Return(b) | (2.39 | )% | 5.23 | %** | |||||||
| Ratios/Supplemental Data: | |||||||||||
| Net assets, end of period (000's) | $ | 277,879 | $ | 226,917 | |||||||
| Net expenses to average daily net assets(c) | 0.38 | %(d) | 0.39 | %* | |||||||
| Net investment income to average daily net assets(a) | 3.12 | % | 5.96 | %* | |||||||
| Portfolio turnover rate | 67 | % | 7 | %**†† | |||||||
| Fees and expenses reimbursed and/or waived by the Manager to average daily net assets: | 0.04 | % | 0.06 | %* | |||||||
(a) Net investment income is affected by the timing of the declaration of dividends by the underlying funds in which the Fund invests.
(b) The total returns would have been lower had certain expenses not been reimbursed and/or waived during the periods shown and assumes the effect of reinvested distributions.
(c) Net expenses exclude expenses incurred indirectly through investment in the underlying funds (See Note 3).
(d) The net expense ratio does not include the effect of expense reductions.
† Calculated using average shares outstanding throughout the period.
†† Calculation represents portfolio turnover rate of the Fund for the period May 31, 2006 through February 28, 2007.
* Annualized.
** Not annualized.
See accompanying notes to the financial statements.
11
GMO Strategic Fixed Income Fund
(A Series of GMO Trust)
Financial Highlights
(For a Class VI share outstanding throughout each period)
| Year Ended February 29, 2008 | Period from May 31, 2006 (commencement of operations) through February 28, 2007 | ||||||||||
| Net asset value, beginning of period | $ | 25.22 | $ | 25.00 | |||||||
| Income (loss) from investment operations: | |||||||||||
| Net investment income (loss)(a)† | 0.97 | 0.76 | |||||||||
| Net realized and unrealized gain (loss) | (1.55 | ) | 0.61 | ||||||||
| Total from investment operations | (0.58 | ) | 1.37 | ||||||||
| Less distributions to shareholders: | |||||||||||
| From net investment income | (1.01 | ) | (1.15 | ) | |||||||
| From net realized gains | (0.06 | ) | — | ||||||||
| Total distributions | (1.07 | ) | (1.15 | ) | |||||||
| Net asset value, end of period | $ | 23.57 | $ | 25.22 | |||||||
| Total Return(b) | (2.35 | )% | 5.52 | %** | |||||||
| Ratios/Supplemental Data: | |||||||||||
| Net assets, end of period (000's) | $ | 5,121,698 | $ | 2,224,310 | |||||||
| Net expenses to average daily net assets(c) | 0.29 | %(d) | 0.29 | %* | |||||||
| Net investment income to average daily net assets(a) | 3.87 | % | 4.01 | %* | |||||||
| Portfolio turnover rate | 67 | % | 7 | %** | |||||||
| Fees and expenses reimbursed and/or waived by the Manager to average daily net assets: | 0.04 | % | 0.06 | %* | |||||||
(a) Net investment income is affected by the timing of the declaration of dividends by the underlying funds in which the Fund invests.
(b) The total returns would have been lower had certain expenses not been reimbursed and/or waived during the periods shown and assumes the effect of reinvested distributions.
(c) Net expenses exclude expenses incurred indirectly through investment in the underlying funds (See Note 3).
(d) The net expense ratio does not include the effect of expense reductions.
† Calculated using average shares outstanding throughout the period.
* Annualized.
** Not annualized.
See accompanying notes to the financial statements.
12
GMO Strategic Fixed Income Fund
(A Series of GMO Trust)
Notes to Financial Statements
February 29, 2008
1. Organization
GMO Strategic Fixed Income Fund (the "Fund") is a series of GMO Trust (the "Trust"). The Fund is registered under the Investment Company Act of 1940, as amended, as an open-end, non-diversified management investment company. The Fund is advised and managed by Grantham, Mayo, Van Otterloo & Co. LLC (the "Manager" or "GMO"). The Trust was established as a Massachusetts business trust under the laws of the Commonwealth of Massachusetts on June 24, 1985. The Declaration of Trust permits the Trustees of the Trust ("Trustees") to create an unlimited number of series of shares ("Funds") and to subdivide Funds into classes.
The Fund seeks total return in excess of that of the JPMorgan U.S. 3 Month Cash Index. The Manager may, in the future, depending on the Manager's assessment of interest rate conditions, change the Fund's benchmark to another nationally recognized debt index with a duration between 90 days and 15 years.
The Fund typically invests in fixed income securities included in the Fund's benchmark and in securities and instruments with similar characteristics. The Fund may seek additional returns by investing in global interest rate, currency, and emerging country debt markets. The Fund may invest a substantial portion of its total assets in shares of GMO Short-Duration Collateral Fund; in futures contracts, currency options, currency forwards, swap contracts and other types of derivatives; in U.S. and foreign investment-grade bonds, including U.S. and foreign government securities and asset-backed securities issued by U.S. government agencies (including securities neither guaranteed nor insured by the U.S. government), and foreign governments, corporate bonds, and mortgage-backed and other asset-backed securities issued by private issuers; in shares of GMO World Opportunity Overlay Fund, and up to 5% of the Fund's total assets in sover eign debt of emerging countries (including below investment grade securities), primarily through investment in shares of GMO Emerging Country Debt Fund ("ECDF").
As of February 29, 2008, the Fund had two classes of shares outstanding: Class III and Class VI. Each class of shares bears a different level of shareholder service fees.
The financial statements of the series of the Trust in which the Fund invests ("underlying funds") should be read in conjunction with the Fund's financial statements. These financial statements are available, without charge, upon request by calling (617) 346-7646 (collect). Shares of GMO Short-Duration Collateral Fund and GMO World Opportunity Overlay Fund are not publicly available for direct purchase.
2. Significant accounting policies
The following is a summary of significant accounting policies which are in conformity with accounting principles generally accepted in the United States of America ("U.S. GAAP") and which are consistently followed by the Fund in the preparation of its financial statements. The preparation of financial statements in accordance with U.S. GAAP requires management to make estimates and assumptions that affect the
13
GMO Strategic Fixed Income Fund
(A Series of GMO Trust)
Notes to Financial Statements — (Continued)
February 29, 2008
reported amounts and disclosures in the financial statements. Actual results could differ from those estimates. The accounting records of the Fund are maintained in U.S. dollars.
Portfolio valuation
Securities listed on a securities exchange for which market quotations are readily available are valued at the last sale price or official closing price on each business day, or if there is no such reported sale or official closing price, at the most recent quoted bid price. Unlisted securities for which market quotations are readily available are generally valued at the most recent quoted bid price. Short-term investments with a remaining maturity of sixty days or less are generally valued at amortized cost, which approximates fair value. Shares of investment funds are valued at their net asset value. Securities for which quotations are not readily available or whose values the Manager has determined to be unreliable are valued at fair value as determined in good faith by the Trustees or other persons acting at their direction pursuant to procedures approved by the Trustees. By its nature, a fair value price is a good faith est imate of the value of a security at a given point in time and may not reflect the value that would be realized if the security was sold and the differences could be material.
Fixed income securities held by the Fund or the underlying funds are typically valued pursuant to prices supplied by a primary pricing source chosen by the Manager. The Manager evaluates such primary pricing sources on an ongoing basis, and may change a pricing source should it deem it appropriate. The Manager, at its discretion, may override a price supplied by a primary source by using a price provided by another source if such action is deemed appropriate. The prices provided by such primary pricing sources may differ from the value that would be realized if the securities were sold and the differences could be material.
Certain securities held by the Fund or the underlying funds are valued on the basis of a price provided by a single source. The prices provided may differ from the value that would be realized if the securities were sold and the differences could be material. As of February 29, 2008, the total value of these securities represented 31.47% of net assets.
The Fund indirectly invests through underlying funds in securities with contractual cash flows, such as asset-backed securities, collateralized mortgage obligations and commercial mortgage backed securities, including securities backed by subprime mortgage loans. The value, liquidity and related income of these securities are sensitive to changes in economic conditions, including real estate values, delinquencies and/or defaults, and may be adversely affected by shifts in the market's perception of the securities' market values and changes in interest rates.
Foreign currency translation
The market values of foreign securities, currency holdings and other assets and liabilities are translated to U.S. dollars based on the current exchange rates each business day. Income and expenses denominated in foreign currencies are translated at current exchange rates when accrued or incurred. The Fund does not
14
GMO Strategic Fixed Income Fund
(A Series of GMO Trust)
Notes to Financial Statements — (Continued)
February 29, 2008
isolate realized and unrealized gains and losses attributable to changes in exchange rates from gains and losses that arise from changes in the market value of investments. Such fluctuations are included with net realized and unrealized gain or loss on investments. Net realized gains and losses on foreign currency transactions represent gains and losses on disposition of currencies and forward currency contracts, currency gains and losses realized between the trade and settlement dates on securities transactions, and the difference between the amount of investment income and foreign withholding taxes recorded on the Fund's accounting records and the U.S. dollar equivalent amounts actually received or paid.
Forward currency contracts
The Fund may enter into forward currency contracts including forward cross currency contracts. A forward currency contract is an agreement between two parties to buy and sell a currency at a set price on a future date. The market value of a forward currency contract fluctuates with changes in forward currency exchange rates. Forward currency contracts are marked to market daily using rates supplied by a quotation service and changes in value are recorded by the Fund as an unrealized gain or loss. Realized gains or losses equal to the difference between the value of the contract at the time it was opened and the value at the time it was closed are recorded upon delivery or receipt of the currency or, if a forward currency contract is offset by entering into another forward currency contract with the same broker, upon settlement of the net gain or loss. These contracts may involve market risk in excess of the unrealized gain or lo ss reflected in the Fund's Statement of Assets and Liabilities. In addition, the Fund could be exposed to risk if the counterparties are unable to meet the terms of the contracts or if there are movements in currency values that are unfavorable to the Fund. Forward currency contracts outstanding at the end of the period are listed in the Fund's Schedule of Investments.
Futures contracts
The Fund may purchase and sell futures contracts. Upon entering into a futures contract, the Fund is required to deposit with the futures clearing broker an amount of cash, U.S. government and agency obligations, or other liquid assets in accordance with the initial margin requirements of the broker or exchange. In addition, the Fund maintains cash or securities in an amount that at least equals the net amount payable in the event the Fund must deliver the full amount of the contracts. Futures contracts are marked to market daily and an appropriate payable or receivable for the change in value ("variation margin") is recorded by the Fund. The payable or receivable is liquidated on the following business day. Gains or losses are recognized but not considered realized until the contracts expire or are closed. Futures contracts involve, to varying degrees, risk of loss in excess of the variation margin disclosed in the Statement of Assets and Liabilities. Under certain circumstances, futures exchanges may establish daily limits on the amount that the price of a futures contract can vary from the previous day's settlement price, thereby effectively preventing liquidation of unfavorable positions. Losses may arise from changes in the value of the underlying instrument if the Fund is unable to liquidate a futures position due to an illiquid secondary market for the contracts or the imposition of price limits, or if counterparties do not perform under the contract terms. Futures contracts are generally valued at the settlement price established each
15
GMO Strategic Fixed Income Fund
(A Series of GMO Trust)
Notes to Financial Statements — (Continued)
February 29, 2008
day by the board of trade or exchange on which they are traded. Futures contracts outstanding at the end of the period are listed in the Fund's Schedule of Investments.
Options
The Fund may write call and put options. Writing options increases the Fund's exposure to the underlying instrument by, in the case of a call option, obligating the Fund to sell the underlying instrument at a set price to the option-holder and, in the case of a put option, obligating the Fund to purchase the underlying instrument at a set price from the option-holder. When the Fund writes a call or put option, an amount equal to the premium received is recorded as a liability and subsequently marked to market to reflect the current value of the option written. Premiums received from writing options which expire are treated as realized gains. Premiums received from writing options which are exercised or closed are added to the proceeds or offset against the amounts paid on the underlying future, security or currency transaction to determine the realized gain or loss. The Fund as a writer of an option has no control over whether t he underlying future, security or currency may be sold (call) or purchased (put) and as a result bears the market risk of an unfavorable change in the price of the future, security or currency underlying the written option. In the event that the Fund writes uncovered call options (i.e. options for investments that the Fund does not own), it bears the risk of incurring substantial losses if the price of the underlying instrument increases during the term of the option. There is the risk the Fund may not be able to enter into a closing transaction because of an illiquid market. There were no open written option contracts during the period.
The Fund may also purchase put and call options. Purchasing options alters the Fund's exposure to the underlying instrument by, in the case of a call option, entitling the Fund to purchase the underlying instrument at a set price from the writer of the option and, in the case of a put option, entitling the Fund to sell the underlying instrument at a set price to the writer of the option. The Fund pays a premium as a cost for a purchased option disclosed in the Schedule of Investments which is subsequently marked to market to reflect the current value of the option. Premiums paid for purchasing options which expire are treated as realized losses. Premiums paid for purchasing options which are exercised or closed are added to the amounts paid or offset against the proceeds on the closing transaction to determine the realized gain or loss. The risk associated with purchasing put and call options is limited to the premium paid. Ther e were no purchased option contracts outstanding at the end of the period.
Exchange traded options are valued at the last sale price, or if no sale is reported, the last bid price for purchased options and the last ask price for written options. Options traded over-the-counter are valued using prices supplied by a primary pricing source chosen by the Manager.
Loan agreements
The Fund may invest in direct debt instruments which are interests in amounts owed by a corporate, governmental, or other borrower to lenders or lending syndicates. The Fund's investments in loans may be in the form of participations in loans or assignments of all or a portion of loans from third parties. A loan is often administered by a bank or other financial institution (the "lender") that acts as agent for all
16
GMO Strategic Fixed Income Fund
(A Series of GMO Trust)
Notes to Financial Statements — (Continued)
February 29, 2008
holders. The agent administers the terms of the loan, as specified in the loan agreement. When investing in a loan participation, the Fund has the right to receive payments of principal, interest and any fees to which it is entitled only from the lender selling the loan agreement and only upon receipt by the lender of payments from the borrower. The Fund generally has no right to enforce compliance with the terms of the loan agreement with the borrower. As a result, the Fund may be subject to the credit risk of both the borrower and the lender that is selling the loan agreement. When the Fund purchases assignments from lenders it acquires direct rights against the borrower on the loan. There were no loan agreements outstanding at the end of the period.
Indexed securities
The Fund may invest in indexed securities where the redemption values and/or coupons are linked to the prices of a specific instrument or financial statistic. The Fund uses indexed securities to increase or decrease its exposure to different underlying instruments and to gain exposure to markets in which it may be difficult to invest through conventional securities. Indexed securities may be more volatile than their underlying instruments, but any loss is limited to the amount of the original investment. There were no indexed securities held by the Fund at the end of the period.
Swap agreements
The Fund may enter into swap agreements. A swap is an agreement to exchange the return generated by one instrument for the return generated by another instrument. Interest rate swap agreements involve the exchange by one party with another party of their respective commitments to pay or receive interest, e.g., an exchange of floating rate payments for fixed rate payments with respect to a notional amount of principal. Total return swap agreements involve a commitment by one party in the agreement to pay interest in exchange for a market-linked return, both based on notional amounts. To the extent the total return of the security or index underlying the transaction exceeds or falls short of the offsetting interest rate obligation, the party will receive a payment from or make a payment to the counterparty, respectively. Forward spread lock swap agreements involve commitments to pay or receive a settlement amount calculated as the difference between the swap spread and a fixed spread, multiplied by the notional amount times the duration of the swap rate. The swap spread is the difference between the benchmark swap rate (market rate) and the specific treasury rate. In a credit default swap, one party makes a stream of payments to another party in exchange for the right to receive a specified return in the event of a default by a third party on its obligation. Credit default swaps may be used to provide a measure of protection against defaults of sovereign or corporate issuers (i.e., to reduce risk where a party owns or has exposure to the issuer) or to take an active long or short position with respect to the likelihood of a particular issuer's default. Variance swap agreements involve commitments to pay or receive a settlement amount calculated as the difference between the annualized realized variance of returns on the underlying price and a fixed quantity, also known as the variance strike, over a period of time. In connection with these agreements, cash or securities may be set aside as collateral by the Fund's custodian or brokers in accordance with the terms of the swap agreement. The Fund earns or pays interest on cash set aside as collateral.
17
GMO Strategic Fixed Income Fund
(A Series of GMO Trust)
Notes to Financial Statements — (Continued)
February 29, 2008
Swaps are marked to market daily using models that incorporate quotations from market makers and the change in value, if any, is recorded as unrealized gain or loss in the Statement of Operations. Payments received or made on swap contracts are recorded as realized gain or loss in the Statement of Operations. Gains or losses are realized upon early termination of the swap agreements. These financial instruments are not actively traded on financial markets. The values assigned to these instruments are based upon the best available information and because of the uncertainty of the valuation, these values may differ significantly from the values that would have been realized had a ready market for these instruments existed, and the differences could be material. Entering into these agreements involves, to varying degrees, elements of credit, legal, market and documentation risk in excess of the amounts recognized in the Statement o f Assets and Liabilities. Such risks involve the possibility that there will be no liquid market for these agreements, that the counterparties to the agreements may default on their obligations to perform or disagree as to the meaning of contractual terms in the agreements, or that there may be unfavorable changes in interest rates or the price of the index or security underlying these transactions. Swap agreements outstanding at the end of the period are listed in the Fund's Schedule of Investments.
Repurchase agreements
The Fund may enter into repurchase agreements with banks and broker-dealers whereby the Fund acquires a security for cash and obtains a simultaneous commitment from the seller to repurchase the security at an agreed upon price and date. The Fund, through its custodian, takes possession of securities collateralizing the repurchase agreement. The collateral is marked to market daily to ensure that the market value of the underlying assets remains sufficient to protect the Fund in the event of default by the seller. Collateral for certain tri-party repurchase agreements is held at the counterparty's custodian in a segregated account for the benefit of the Fund and the counterparty. In connection with transactions in repurchase agreements, if the seller defaults or enters into insolvency proceedings and the value of the collateral declines, recovery of cash by the Fund may be delayed or limited. There were no repurchase agreements o utstanding at the end of the period.
Reverse repurchase agreements
The Fund may enter into reverse repurchase agreements with banks and broker-dealers whereby the Fund sells portfolio assets concurrent with an agreement by the Fund to repurchase the same assets at a later date at a fixed price. In connection with these agreements, the Fund establishes segregated accounts with its custodian in which the Fund maintains cash, U.S. government securities or other assets equal in value to its obligations in respect of reverse repurchase agreements. Reverse repurchase agreements involve the risk that the market value of the securities the Fund has sold under the agreement may decline below the price at which the Fund is obligated to repurchase under the agreement. The market value of the securities the Fund has sold is determined daily and any additional required collateral is allocated to or sent by the Fund on the next business day. There were no reverse repurchase agreements outstanding at the end of the period.
18
GMO Strategic Fixed Income Fund
(A Series of GMO Trust)
Notes to Financial Statements — (Continued)
February 29, 2008
Delayed delivery commitments
The Fund may purchase or sell securities on a when-issued or forward commitment basis. Payment and delivery may take place a month or more after the date of the transaction. The price of the underlying securities and the date when the securities will be delivered and paid for are fixed at the time the transaction is negotiated. Collateral consisting of liquid securities or cash and cash equivalents is maintained with the custodian in an amount at least equal to these commitments. There were no delayed delivery commitments outstanding at the end of the period.
Securities lending
The Fund may lend its securities to certain qualified broker-dealers. The loans are collateralized with cash or liquid securities with a market value at least equal to the market value of the securities on loan. As with other extensions of credit, the Fund may bear the risk of loss with respect to the investment of the collateral, the risk of delay in and/or inability to exercise its rights with respect to the collateral, and the risk of delay in recovery or loss of rights in the loaned securities should the borrower of the securities fail financially. If a loan is collateralized by U.S. government securities, the Fund receives a fee from the borrower. If a loan is collateralized by cash, the Fund typically invests the cash collateral for its own account in interest-bearing, short-term securities and pays a fee to the borrower that normally represents a portion of the Fund's earnings on the collateral. For the year ended Februar y 29, 2008, the Fund did not participate in securities lending.
Taxes and distributions
The Fund intends to qualify each tax year as a regulated investment company under Subchapter M of the Internal Revenue Code of 1986, as amended (the "Code"). The Fund intends to distribute substantially all of its net investment income and net realized short-term and long-term capital gains, if any, after giving effect to any available capital loss carryovers for U.S. federal income tax purposes. Therefore, no provision for U.S. federal income or excise tax is necessary. Taxes on foreign interest and dividend income are generally withheld in accordance with the applicable country's tax treaty with the United States.
The Fund's policy is to declare and pay distributions from net investment income, if any, semiannually, and from net realized short-term and long-term capital gains, if any, at least annually. All distributions are paid in shares of the Fund, at net asset value, unless the shareholder elects to receive cash distributions. Distributions to shareholders are recorded by the Fund on the ex-dividend date.
Income and capital gain distributions are determined in accordance with U.S. federal income tax regulations, which may differ from U.S. GAAP. Certain capital accounts in the financial statements are periodically adjusted for permanent differences in order to reflect their tax character. These adjustments have no impact on net assets or net asset value per share. Temporary differences which arise from recognizing certain items of income, expense, gain or loss in different periods for financial statement and tax purposes will reverse at some time in the future. Distributions in excess of net investment income or net realized gains are temporary over distributions for financial statement purposes resulting from
19
GMO Strategic Fixed Income Fund
(A Series of GMO Trust)
Notes to Financial Statements — (Continued)
February 29, 2008
differences in the recognition or classification of income or distributions for financial statement and tax purposes.
U.S. GAAP and tax accounting differences primarily relate to derivative contract transactions, foreign currency transactions, losses on wash sale transactions and partnership interest tax allocations.
The following reclassification represents the amount necessary to report the stated components of net assets on a tax basis, excluding certain temporary differences, as of February 29, 2008. The financial highlights exclude these adjustments.
| Distributions In Excess Of Net Investment Income | Accumulated Net Realized Gain | Paid-in Capital | |||||||||
| $ | (46,282,382 | ) | $ | 46,282,382 | $ | — | |||||
The tax character of distributions declared to shareholders is as follows:
| 2/29/2008 | 2/28/2007 | ||||||||||
| Ordinary income (including any short-term capital gains) | $ | 105,777,934 | $ | 38,448,218 | |||||||
| Long-term capital gains | 3,388,383 | — | |||||||||
| Total distributions | $ | 109,166,317 | $ | 38,448,218 | |||||||
Distributions in excess of tax basis earnings and profits, if significant, are reported in the financial statements as a tax return of capital.
As of February 29, 2008, the components of distributable earnings on a tax basis consisted of the following:
| Undistributed ordinary income | $ | 377,979 | |||||
As of February 29, 2008, the Fund elected to defer to March 1, 2008 post-October capital losses of $157,824.
As of February 29, 2008, the approximate cost for U.S. federal income tax purposes and gross and net unrealized appreciation and depreciation in value of investments were as follows:
Aggregate Cost | Gross Unrealized Appreciation | Gross Unrealized (Depreciation) | Net Unrealized Appreciation (Depreciation) | ||||||||||||
| $ | 5,553,473,122 | $ | 1,600,070 | $ | (194,445,338 | ) | $ | (192,845,268 | ) | ||||||
20
GMO Strategic Fixed Income Fund
(A Series of GMO Trust)
Notes to Financial Statements — (Continued)
February 29, 2008
Security transactions and related investment income
Security transactions are accounted for on trade date. Dividend income, net of applicable foreign withholding taxes, if any, is recorded on the ex-dividend date, or when the Fund is informed of the ex-dividend date, if later. Interest income is recorded on the accrual basis and is adjusted for the amortization of premiums and accretion of discounts. Interest income on inflation indexed securities, if any, is accrued daily based upon an inflation adjusted principal. Additionally, any increase or decrease in the principal or face amount of the securities adjusted for inflation is recorded as interest income or loss. Income is not recognized on securities for which collection is not expected. Non-cash dividends, if any, are recorded at the fair market value of the securities received. In determining the net gain or loss on securities sold, the cost of securities is determined on the identified cost basis.
Expenses
The majority of expenses of the Trust are directly identifiable to an individual fund. Expenses which are not readily identifiable to a specific fund are allocated taking into consideration, among other things, the nature and type of expense and the relative size of the funds. Investment income, common expenses and realized and unrealized gains and losses are allocated pro rata among the classes of shares of the Fund based on the relative net assets of each class. Shareholder service fees, which are directly attributable to a class of shares, are charged to that class's operations. In addition, the Fund will also incur certain fees and expenses indirectly as a shareholder in the underlying funds. Because the underlying funds have varied expense and fee levels and the Fund may own different proportions of the underlying funds at different times, the amount of fees and expenses indirectly incurred by the Fund will vary (See Note 3 ).
State Street Bank and Trust Company ("State Street") serves as custodian, fund accounting agent and transfer agent of the Fund. State Street's fee may be reduced by credits that are an earnings allowance calculated on the average daily cash balances the Fund maintains with State Street. Credit balances used to reduce the fee paid to State Street, if any, are reported as a reduction of expenses in the Statement of Operations.
Investment risks
There are certain additional risks involved in investing in foreign securities that are not inherent in investments in U.S. securities. These risks may involve adverse political and economic developments including the possible imposition of capital controls or other foreign governmental laws or restrictions. In addition, the securities of some foreign companies and securities markets are less liquid and at times may be more volatile than securities of comparable U.S. companies and U.S. securities markets. The risks described above apply to an even greater extent to investments in emerging markets. The securities markets of emerging countries are generally smaller, less developed, less liquid, and more volatile than the securities markets of the U.S. and developed foreign markets.
21
GMO Strategic Fixed Income Fund
(A Series of GMO Trust)
Notes to Financial Statements — (Continued)
February 29, 2008
Recently issued accounting pronouncements
In June 2006, the Financial Accounting Standards Board ("FASB") issued FASB Interpretation No. 48, Accounting for Uncertainty in Income Taxes – an Interpretation of FASB Statement No. 109 ("FIN 48"). FIN 48 clarifies the accounting for uncertainty in income taxes recognized in accordance with FASB Statement No. 109, Accounting for Income Taxes. FIN 48 prescribes a recognition threshold and measurement attribute for a tax position taken or expected to be taken in the tax return that could impact the Fund's financial statements. It also provides guidance in relation to the Fund's financial statements on classification of tax benefits or liabilities, interest and penalties, accounting in interim periods, disclosure, and transition. FIN 48 is effective for fiscal years beginning after December 15, 2006 for registered investment companies. Management has evaluated the effects of applying the various provisions of FIN 48 and has determined that the adoption of FIN 48 does not have a material effect on the Fund's financial statements. The Fund's federal tax returns for the prior three fiscal years, if applicable, remain subject to examination by the Internal Revenue Service. Management will continue to monitor the rules and guidance pertaining to FIN 48 and will take action if appropriate.
In September 2006, the FASB issued Statement of Financial Accounting Standards No. 157 ("FAS 157"), "Fair Value Measurements." FAS 157 defines fair value, establishes a framework for measuring fair value in accordance with generally accepted accounting principles and expands disclosure about fair value measurements. FAS 157 is effective for fiscal years beginning after November 15, 2007. Management is currently evaluating the impact the adoption of FAS 157 will have on the Fund's financial statement disclosures.
3. Fees and other transactions with affiliates
GMO earns a management fee paid monthly at the annual rate of 0.25% of average daily net assets. The Fund has adopted a Shareholder Service Plan under which the Fund pays GMO a shareholder service fee for client and shareholder service, reporting, and other support. Pursuant to the Shareholder Service Plan, the shareholder service fee is calculated based on average daily net assets at the annual rate of 0.15% for Class III shares and 0.055% for Class VI shares. The Manager will waive the Fund's shareholder service fee to the extent that the aggregate of any direct and indirect shareholder service fees borne by a class of shares of the Fund exceeds 0.15% for Class III shares and 0.055% for Class VI shares; provided, however, that the amount of this waiver will not exceed the respective Class's shareholder service fee.
The Manager has contractually agreed to reimburse the Fund for Fund expenses through at least June 30, 2008 to the extent the Fund's total annual operating expenses (excluding shareholder service fees, expenses indirectly incurred by investment in underlying funds, fees and expenses of the independent Trustees of the Trust, fees and expenses for legal services not approved by the Manager for the Trust, compensation and expenses of the Trust's Chief Compliance Officer ("CCO") (excluding any employee benefits), brokerage commissions, securities lending fees and expenses, interest expense, transfer taxes, and other investment-related costs (including expenses associated with investments in any company that is
22
GMO Strategic Fixed Income Fund
(A Series of GMO Trust)
Notes to Financial Statements — (Continued)
February 29, 2008
an investment company or would be an investment company under the 1940 Act, but for the exceptions to the definition of investment company provided in Section 3(c)(1) and 3(c)(7) of the 1940 Act), hedging transaction fees, extraordinary, non-recurring and certain other unusual expenses (including taxes) (collectively, "Excluded Fund Fees and Expenses")) exceed 0.25% of the Fund's average daily net assets. In addition, the Manager has contractually agreed to reimburse the Fund through at least June 30, 2008 to the extent that the sum of (a) the Fund's total annual operating expenses (excluding Excluded Fund Fees and Expenses) and (b) the amount of fees and expenses incurred indirectly by the Fund through its investment in ECDF (excluding ECDF's Excluded Fund Fees and Expenses), exceeds 0.25% of the Fund's average daily net assets, subject to a maximum total reimbursement to the Fund equal to 0.25% of the Fund's average daily net assets.
The Fund incurs fees and expenses indirectly as a shareholder in the underlying funds. For the year ended February 29, 2008, these indirect fees and expenses expressed as an annualized percentage of the Fund's average daily net assets were as follows:
| Indirect Net Expenses (excluding shareholder service fees and interest expense) | Indirect Shareholder Service Fees | Indirect Interest Expense | Total Indirect Expenses | ||||||||||||
| 0.014 | % | 0.004 | % | 0.030 | % | 0.048 | % | ||||||||
The Fund's portion of the fees paid by the Trust to the independent Trustees and CCO during the year ended February 29, 2008 was $24,093 and $12,235, respectively. The compensation and expenses of the CCO are included in miscellaneous expenses in the Statement of Operations. No remuneration was paid by the Fund to any other officer of the Trust.
4. Purchases and sales of securities
For the year ended February 29, 2008, cost of purchases and proceeds from sales of investments, other than short-term obligations, were as follows:
| Purchases | Sales | ||||||||||
| U.S. Government securities | $ | 6,041,719 | $ | 15,000,000 | |||||||
| Investments (non-U.S. Government securities) | 5,018,088,729 | 1,939,950,045 | |||||||||
23
GMO Strategic Fixed Income Fund
(A Series of GMO Trust)
Notes to Financial Statements — (Continued)
February 29, 2008
5. Guarantees
In the normal course of business the Fund enters into contracts with third-party service providers that contain a variety of representations and warranties and which provide general indemnifications. The Fund's maximum exposure under these arrangements is unknown, as this would involve future claims that may be made against the Fund that have not yet occurred. Based on experience, management is of the view that the risk of loss in connection with these potential indemnification obligations is remote; however, there can be no assurance that material liabilities related to such obligations will not arise in the future that could adversely impact the Fund.
6. Principal shareholders and related parties
As of February 29, 2008, 69.04% of the outstanding shares of the Fund were held by two shareholders, each holding in excess of 10% of the Fund's outstanding shares. No other shareholder owned in excess of 10% of the outstanding shares of the Fund. One of the shareholders is another fund of the Trust. Investment activities of these shareholders may have a material effect on the Fund.
As of February 29, 2008, there were no shares held by related parties, and 99.99% of the Fund's shares were held by accounts for which the Manager has investment discretion.
7. Share transactions
The Declaration of Trust permits the Trustees to issue an unlimited number of shares of beneficial interest (without par value). Transactions in Fund shares were as follows:
| Year Ended February 29, 2008 | Period from July 13, 2006 (commencement of operations) through February 28, 2007 | ||||||||||||||||||
| Class III: | Shares | Amount | Shares | Amount | |||||||||||||||
| Shares sold | 14,637,641 | $ | 354,355,271 | 8,706,666 | $ | 220,472,019 | |||||||||||||
| Shares issued to shareholders in reinvestment of distributions | 210,515 | 5,059,119 | 295,257 | 7,384,377 | |||||||||||||||
| Shares repurchased | (12,069,867 | ) | (300,293,317 | ) | (3,498 | ) | (87,669 | ) | |||||||||||
| Net increase (decrease) | 2,778,289 | $ | 59,121,073 | 8,998,425 | $ | 227,768,727 | |||||||||||||
24
GMO Strategic Fixed Income Fund
(A Series of GMO Trust)
Notes to Financial Statements — (Continued)
February 29, 2008
| Year Ended February 29, 2008 | Period from May 31, 2006 (commencement of operations) through February 28, 2007 | ||||||||||||||||||
| Class VI: | Shares | Amount | Shares | Amount | |||||||||||||||
| Shares sold | 188,277,166 | $ | 4,555,951,605 | 87,191,248 | $ | 2,196,531,526 | |||||||||||||
| Shares issued to shareholders in reinvestment of distributions | 4,301,787 | 103,049,293 | 1,158,486 | 28,962,149 | |||||||||||||||
| Shares repurchased | (63,520,875 | ) | (1,616,998,457 | ) | (143,485 | ) | (3,732,778 | ) | |||||||||||
| Net increase (decrease) | 129,058,078 | $ | 3,042,002,441 | 88,206,249 | $ | 2,221,760,897 | |||||||||||||
8. Investments in affiliated issuers
A summary of the Fund's transactions in the securities of affiliated issuers during the year ended February 29, 2008 is set forth below:
| Affiliate | Value, beginning of period | Purchases | Sales Proceeds | Dividend Income | Distributions of Realized Gains | Value, end of period | |||||||||||||||||||||
| GMO Emerging Country Debt Fund, Class III | $ | 75,423,462 | $ | 52,269,222 | $ | 41,900,000 | $ | 5,906,079 | $ | 3,863,142 | $ | 80,962,232 | |||||||||||||||
| GMO Short-Duration Collateral Fund | 1,759,931,834 | 4,198,918,238 | 1,497,483,000 | 113,738,238 | — | 4,314,050,306 | |||||||||||||||||||||
| GMO World Opportunity Overlay Fund | 472,286,910 | 736,055,000 | 386,100,000 | — | — | 821,340,094 | |||||||||||||||||||||
| Totals | $ | 2,307,642,206 | $ | 4,987,242,460 | $ | 1,925,483,000 | $ | 119,644,317 | $ | 3,863,142 | $ | 5,216,352,632 | |||||||||||||||
25
Report of Independent Registered Public Accounting Firm
To the Trustees of GMO Trust and the Shareholders of
GMO Strategic Fixed Income Fund
In our opinion, the accompanying statement of assets and liabilities, including the schedule of investments, and the related statements of operations and of changes in net assets and the financial highlights present fairly, in all material respects, the financial position of GMO Strategic Fixed Income Fund (the "Fund") at February 29, 2008, the results of its operations for the year then ended, the changes in its net assets for each of the periods indicated and the financial highlights for each of the periods indicated, in conformity with accounting principles generally accepted in the United States of America. These financial statements and financial highlights (hereafter referred to as "financial statements") are the responsibility of the Fund's management; our responsibility is to express an opinion on these financial statements based on our audits. We conducted our audits of these financial statements in accordance with the standards of the Public Company Accounting Oversight Board (United States). Those standards require that we plan and perform the audit to obtain reasonable assurance about whether the financial statements are free of material misstatement. An audit includes examining, on a test basis, evidence supporting the amounts and disclosures in the financial statements, assessing the accounting principles used and significant estimates made by management, and evaluating the overall financial statement presentation. We believe that our audits, which included confirmation of securities at February 29, 2008 by correspondence with the custodian and brokers, provide a reasonable basis for our opinion.
PricewaterhouseCoopers LLP
Boston, Massachusetts
April 29, 2008
26
GMO Strategic Fixed Income Fund
(A Series of GMO Trust)
Fund Expenses
February 29, 2008 (Unaudited)
Expense Examples: The following information is in relation to expenses for the six month period ended February 29, 2008.
As a shareholder of the Fund, you may incur two types of costs: (1) transaction costs, and (2) ongoing costs, including management fees, shareholder service fees and other Fund expenses. This example is intended to help you understand your ongoing costs (in dollars) of investing in the Fund and to compare these costs with the ongoing costs of investing in other mutual funds.
These examples are based on an investment of $1,000 invested at the beginning of the period and held for the entire period, September 1, 2007 through February 29, 2008.
Actual Expenses
The first line of the table for each class below provides information about actual account values and actual expenses. You may use the information in this line, together with the amount you invested, to estimate the expenses that you paid over the period. Simply divide your account value by $1,000 (for example, a $10,000,000 account value divided by $1,000 = 10,000), then multiply the result by the number in the first line under the heading entitled "Net Expense Incurred" to estimate the expenses you paid on your account during this period.
Hypothetical Example for Comparison Purposes
The second line of the table for each class below provides information about hypothetical account values and hypothetical expenses based on the Fund's actual expense ratio and an assumed rate of return of 5% per year before expenses, which is not the Fund's actual return. The hypothetical account values and expenses may not be used to estimate the actual ending account balance or expenses you paid for the period. You may use this information to compare the ongoing costs of investing in the Fund with other funds. To do so, compare this 5% hypothetical example with the 5% hypothetical examples that appear in the shareholder reports of other funds.
Please note that the expenses shown in the table are meant to highlight your ongoing costs only and do not reflect any transactional costs. Therefore, the second line of the table is useful in comparing ongoing costs only, and will not help you determine the relative total costs of owning different funds. In addition, if these transactional costs were included, your costs would have been higher.
| Annualized Net Expense Ratio | Beginning Account Value | Ending Account Value | Net Expense Incurred* | ||||||||||||||||
| Class III | |||||||||||||||||||
| 1) Actual | 0.43 | % | $ | 1,000.00 | $ | 974.50 | $ | 2.11 | |||||||||||
| 2) Hypothetical | 0.43 | % | $ | 1,000.00 | $ | 1,022.73 | $ | 2.16 | |||||||||||
| Class VI | |||||||||||||||||||
| 1) Actual | 0.33 | % | $ | 1,000.00 | $ | 974.50 | $ | 1.62 | |||||||||||
| 2) Hypothetical | 0.33 | % | $ | 1,000.00 | $ | 1,023.22 | $ | 1.66 | |||||||||||
* Expenses are calculated using each Class's annualized net expense ratio (including indirect expenses incurred) for the six months ended February 29, 2008, multiplied by the average account value over the period, multiplied by 182 days in the period, divided by 366 days in the year.
27
GMO Strategic Fixed Income Fund
(A Series of GMO Trust)
Tax Information for the Tax Year Ended February 29, 2008 (Unaudited)
The Fund will notify shareholders of amounts for use in preparing 2008 income tax forms in January 2009.
The Fund's distributions to shareholders include $3,388,383 from long-term capital gains.
The Fund hereby designates as qualified interest income and qualified short-term capital gains with respect to its taxable year ended February 29, 2008, $72,476,756 and $2,844,478, respectively, or if determined to be different, the qualified interest income and qualified short-term gains of such year.
28
Trustees and Officers (Unaudited)
The following tables list the Trust's Trustees and Officers as of the date of this report; their address and date of birth ("DOB"); their position with the Trust; the length of time holding that position with the Trust; their principal occupation(s) during the past five years; the number of portfolios in the fund complex they oversee; and other directorships they hold in companies subject to registration or reporting requirements of the Securities Exchange Act of 1934 (generally called "public companies") or in registered investment companies. The Trust's Statement of Additional Information ("SAI") includes additional information about the Trust's trustees, including changes subsequent to the date of the report. The SAI is available, without charge, upon request by writing GMO, c/o GMO Trust, 40 Rowes Wharf, Boston, MA 02110.
Independent Trustees:
| Name, Address, and DOB | Position(s) Held with Trust | Term of Office1 and Length of Time Served | Principal Occupation(s) During Past Five Years | Number of Portfolios in Fund Complex Overseen by Trustee | Other Directorships Held by Trustee | ||||||||||||||||||
| Donald W. Glazer, Esq. c/o GMO Trust 40 Rowes Wharf Boston, MA 02110 DOB: 07/26/1944 | Chairman of the Board of Trustees | Chairman of the Board of Trustees since March 2005; Lead Independent Trustee (September 2004 – March 2005); Trustee since December 2000. | Consultant – Law and Business2; Vice Chair (since 2002) and Secretary, Provant, Inc. (provider of personnel performance improvement services and training products); Author of Legal Treatises. | 47 | None. | ||||||||||||||||||
1 Each Trustee is elected to serve during the continued lifetime of the Trust until he/she dies, resigns or is removed, or if sooner, until the next meeting of Shareholders called for the purpose of electing Trustees and until the election and qualification of his/her successor.
2 As part of Mr. Glazer's work as a consultant, he provides part-time consulting services to Goodwin Procter LLP ("Goodwin"). Goodwin has provided legal services to Renewable Resources, LLC, an affiliate of GMO; GMO, in connection with its relationship with Renewable Resources; and funds managed by Renewable Resources. Mr. Glazer has represented that he has no financial interest in, and is not involved in the provision of, such legal services. In the calendar years ended December 31, 2006 and December 31, 2007, these entities paid $825,738 and $291,721 respectively, in legal fees and disbursements to Goodwin.
29
Independent Trustees — (Continued)
| Name, Address, and DOB | Position(s) Held with Trust | Term of Office1 and Length of Time Served | Principal Occupation(s) During Past Five Years | Number of Portfolios in Fund Complex Overseen by Trustee | Other Directorships Held by Trustee | ||||||||||||||||||
| Jay O. Light c/o GMO Trust 40 Rowes Wharf Boston, MA 02110 DOB: 10/03/1941 | Trustee | Since May 1996. | Dean (since April 2006), Acting Dean (August 2005 – April 2006), Senior Associate Dean (1998 – 2005), and Professor of Business Administration, Harvard Business School. | 47 | Director of Harvard Management Company, Inc.3 and Verde, Inc.; Director of Partners HealthCare System, Inc. and Chair of its Investment Committee.4 | ||||||||||||||||||
| W. Nicholas Thorndike c/o GMO Trust 40 Rowes Wharf Boston, MA 02110 DOB: 03/28/1933 | Trustee | Since March 2005. | Director or trustee of various corporations and charitable organizations, including Courier Corporation (a book publisher and manufacturer) (July 1989 – present); Putnam Funds (December 1992 – June 2004); and Providence Journal (a newspaper publisher) (December 1986 – December 2003). | 47 | Director of Courier Corporation (a book publisher and manufacturer); Member of the Investment Committee of Partners HealthCare System, Inc.4 | ||||||||||||||||||
1 Each Trustee is elected to serve during the continued lifetime of the Trust until he/she dies, resigns or is removed, or if sooner, until the next meeting of Shareholders called for the purpose of electing Trustees and until the election and qualification of his/her successor.
3 Harvard Management Company, Inc. is a client of the Manager.
4 Partners HealthCare System, Inc. is a client of the Manager.
30
Principal Officers:
| Name, Address, and DOB | Position(s) Held with Trust | Term of Office5 and Length of Time Served | Principal Occupation(s) During Past Five Years | ||||||||||||
| Scott Eston c/o GMO Trust 40 Rowes Wharf Boston, MA 02110 DOB: 01/20/1956 | President and Chief Executive Officer | President and Chief Executive Officer since October 2002; Chief Financial Officer, November 2006 – February 2007. | Chief Financial Officer, Chief Operating Officer and Member, Grantham, Mayo, Van Otterloo & Co. LLC. | ||||||||||||
| Sheppard N. Burnett c/o GMO Trust 40 Rowes Wharf Boston, MA 02110 DOB: 10/24/1968 | Treasurer and Chief Financial Officer | Chief Financial Officer since March 2007; Treasurer since November 2006; Assistant Treasurer, September 2004 – November 2006. | Fund Administration Staff, Grantham, Mayo, Van Otterloo & Co. LLC (June 2004 – present); Vice President, Director of Tax, Columbia Management Group (2002 – 2004). | ||||||||||||
| Brent C. Arvidson c/o GMO Trust 40 Rowes Wharf Boston, MA 02110 DOB: 06/26/1969 | Assistant Treasurer | Since August 1998. | Senior Fund Administrator, Grantham, Mayo, Van Otterloo & Co. LLC. | ||||||||||||
| John L. Nasrah c/o GMO Trust 40 Rowes Wharf Boston, MA 02110 DOB: 05/27/1977 | Assistant Treasurer | Since March 2007. | Fund Administrator, Grantham, Mayo, Van Otterloo & Co. LLC (September 2004-present); Tax Analyst, Bain & Company, Inc (June 2003 – September 2004); Senior Tax Associate, PricewaterhouseCoopers LLP (2001 – 2003). | ||||||||||||
| Mahmoodur Rahman c/o GMO Trust 40 Rowes Wharf Boston, MA 02110 DOB: 11/30/1967 | Assistant Treasurer | Since September 2007. | Fund Administrator, Grantham, Mayo, Van Otterloo & Co. (April 2007 – present); Vice President and Senior Tax Manager, Massachusetts Financial Services Company (January 2000 – April 2007). | ||||||||||||
5 Officers are elected to hold such office until their successor is elected and qualified to carry out the duties and responsibilities of their office, or until he or she resigns or is removed from office.
31
Principal Officers — (Continued)
| Name, Address, and DOB | Position(s) Held with Trust | Term of Office5 and Length of Time Served | Principal Occupation(s) During Past Five Years | ||||||||||||
| Michael E. Gillespie c/o GMO Trust 40 Rowes Wharf Boston, MA 02110 DOB: 02/18/1958 | Chief Compliance Officer | Since March 2005. | Vice President of Compliance (June 2004 – February 2005) and Director of Domestic Compliance (March 2002 – June 2004), Fidelity Investments; Vice President and Senior Counsel, State Street Bank and Trust Company (May 1998 – March 2002). | ||||||||||||
| Jason B. Harrison c/o GMO Trust 40 Rowes Wharf Boston, MA 02110 DOB: 01/29/1977 | Vice President and Clerk | Vice President since November 2006; Clerk since March 2006. | Legal Counsel, Grantham, Mayo, Van Otterloo & Co. LLC (since February 2006) and Attorney, Ropes & Gray LLP (September 2002 – February 2006). | ||||||||||||
| David L. Bohan c/o GMO Trust 40 Rowes Wharf Boston, MA 02110 DOB: 06/21/1964 | Vice President and Assistant Clerk | Vice President since March 2005; Assistant Clerk since March 2006. | Legal Counsel, Grantham, Mayo, Van Otterloo & Co. LLC (September 2003 – present); Attorney, Goodwin Procter LLP (September 1996 – September 2003). | ||||||||||||
| Gregory L. Pottle c/o GMO Trust 40 Rowes Wharf Boston, MA 02110 DOB: 07/09/1971 | Vice President and Assistant Clerk | Since November 2006. | Legal Counsel, Grantham, Mayo, Van Otterloo & Co. LLC. | ||||||||||||
| Anne K. Trinque c/o GMO Trust 40 Rowes Wharf Boston, MA 02110 DOB: 04/15/1978 | Vice President and Assistant Clerk | Since September 2007. | Legal Counsel, Grantham, Mayo, Van Otterloo & Co. LLC (since January 2007); Attorney, Goodwin Procter LLP (September 2003 – January 2007). | ||||||||||||
| Cheryl Wakeham c/o GMO Trust 40 Rowes Wharf Boston, MA 02110 DOB: 10/29/1958 | Anti-Money Laundering Officer | Since December 2004. | Manager, Client Service Administration, Grantham, Mayo, Van Otterloo & Co. LLC. | ||||||||||||
5 Officers are elected to hold such office until their successor is elected and qualified to carry out the duties and responsibilities of their office, or until he or she resigns or is removed from office.
32
GMO Emerging Markets Fund
(A Series of GMO Trust)
Annual Report
February 29, 2008
For a free copy of the Fund's proxy voting guidelines, shareholders may call 1-617-346-7646 (collect), visit our website at www.gmo.com, or visit the Securities and Exchange Commission's website at www.sec.gov. Information regarding how the Fund voted proxies relating to portfolio securities during the most recent 12-month period ended June 30 is available on our website at www.gmo.com, or on the Securities and Exchange Commission's website at www.sec.gov.
The Fund files its complete schedule of portfolio holdings with the Securities and Exchange Commission for the first and third quarter of each fiscal year on Form N-Q, which is available on the Commission's website at www.sec.gov. The Fund's Form N-Q may be reviewed and copied at the Commission's Public Reference Room in Washington, D.C. Information on the operation of the Public Reference Room may be obtained by calling 1-800-SEC-0330. The Fund has a policy with respect to disclosure of portfolio holdings under which it may also make available on GMO's website (www.gmo.com) a complete schedule of portfolio holdings.
This report is prepared for the general information of shareholders. It is authorized for distribution to prospective investors only when preceded or accompanied by a prospectus for the GMO Trust.
GMO Emerging Markets Fund
(A Series of GMO Trust)
Portfolio Management
Day-to-day management of the Fund's portfolio is the responsibility of the Emerging Markets Division at Grantham, Mayo, Van Otterloo & Co. LLC.
Management Discussion and Analysis of Fund Performance
The Class III shares of the GMO Emerging Markets Fund returned +28.4% for the fiscal year ended February 29, 2008, as compared to +32.9% for the S&P/IFC Investable Composite Index. Consistent with the Fund's investment objectives and policies, the Fund was invested substantially in emerging markets equities throughout the fiscal year.
Country selection detracted 4.5% from performance during the period. The Fund's underweights in Russia and South Africa and overweight in Brazil contributed to performance. The Fund's overweights in South Korea and Taiwan and underweights in India and China detracted from performance.
Stock selection was flat during the fiscal year. Stock selection was successful in India, South Korea, Taiwan, and Thailand, but selection detracted from performance in China, Malaysia, Philippines, and Russia.
The views expressed herein are exclusively those of Grantham, Mayo, Van Otterloo & Co. LLC Management as of the date of this report and are subject to change. GMO disclaims any responsibility to update such views. They are not meant as investment advice.
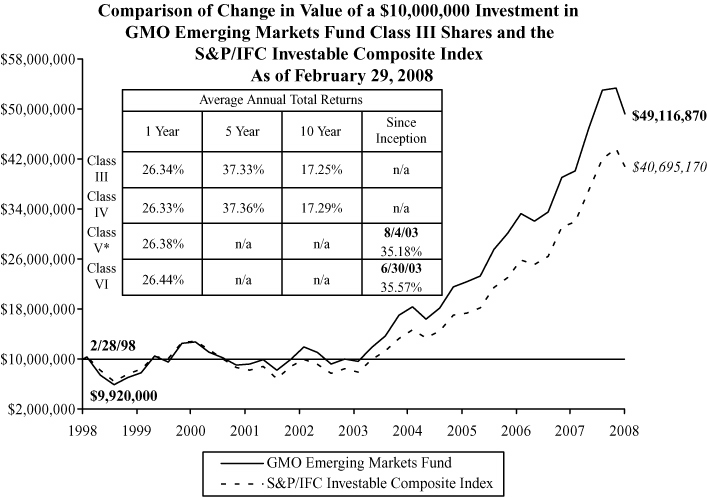
Performance data quoted represents past performance and is not indicative of future results. The investment return and principal value of an investment will fluctuate so that an investor's shares, when redeemed, may be worth more or less than their original cost. Current performance data may be lower or higher than the performance data provided herein. To obtain performance information to the most recent month-end, visit www.gmo.com. Performance shown is net of all fees after reimbursement from the Manager. Each performance figure assumes a purchase at the beginning and redemption at the end of the stated period and reflects a transaction fee of .80% on the purchase and .80% on the redemption. Transaction fees are retained by the Fund to cover trading costs. Returns would have been lower had certain expenses not been reimbursed during the periods shown and do not include the effect oftaxes on distributions and redemptions. All information is unaudited. Performance for Class IV, V and VI shares will vary due to different fees.
* For the period from 10/26/04 to 2/11/05, no Class V shares were outstanding. Performance for that period is that of Class IV shares, which have higher expenses. Therefore, the performance shown is lower than it would have been if Class V shares had been outstanding.
GMO Emerging Markets Fund
(A Series of GMO Trust)
Investments Concentration Summary
February 29, 2008 (Unaudited)
| Asset Class Summary | % of Total Net Assets | ||||||
| Common Stocks | 81.0 | % | |||||
| Preferred Stocks | 13.5 | ||||||
| Short-Term Investments | 3.3 | ||||||
| Private Equity Securities | 0.7 | ||||||
| Investment Funds | 0.4 | ||||||
| Debt Obligations | 0.1 | ||||||
| Rights and Warrants | 0.1 | ||||||
| Convertible Securities | 0.0 | ||||||
| Mutual Funds | 0.0 | ||||||
| Other | 0.9 | ||||||
| 100.0 | % | ||||||
| Country Summary | % of Investments * | ||||||
| Brazil | 21.0 | % | |||||
| South Korea | 18.2 | ||||||
| Taiwan | 15.2 | ||||||
| China | 9.6 | ||||||
| Russia | 8.2 | ||||||
| Thailand | 6.7 | ||||||
| India | 5.4 | ||||||
| Malaysia | 4.8 | ||||||
| Turkey | 2.7 | ||||||
| South Africa | 1.9 | ||||||
| Philippines | 1.8 | ||||||
| Indonesia | 1.7 | ||||||
| Israel | 0.9 | ||||||
| Hungary | 0.9 | ||||||
| Poland | 0.8 | ||||||
| Mexico | 0.1 | ||||||
| United States | 0.1 | ||||||
| Sri Lanka | 0.0 | ||||||
| Chile | 0.0 | ||||||
| Argentina | 0.0 | ||||||
| Pakistan | 0.0 | ||||||
| Lebanon | 0.0 | ||||||
| Ukraine | 0.0 | ||||||
| 100.0 | % | ||||||
* The table excludes short-term investments.
1
GMO Emerging Markets Fund
(A Series of GMO Trust)
Investments Concentration Summary — (Continued)
February 29, 2008 (Unaudited)
| Industry Sector Summary | % of Investments * | ||||||
| Financials | 20.3 | % | |||||
| Energy | 20.0 | ||||||
| Materials | 16.8 | ||||||
| Information Technology | 12.1 | ||||||
| Industrials | 9.6 | ||||||
| Telecommunication Services | 7.0 | ||||||
| Consumer Discretionary | 6.7 | ||||||
| Consumer Staples | 3.0 | ||||||
| Utilities | 2.2 | ||||||
| Health Care | 1.2 | ||||||
| Miscellaneous | 1.1 | ||||||
| 100.0 | % | ||||||
* The table excludes short-term investments.
2
GMO Emerging Markets Fund
(A Series of GMO Trust)
Schedule of Investments
(showing percentage of total net assets)
February 29, 2008
| Shares | Description | Value ($) | |||||||||
| COMMON STOCKS — 81.0% | |||||||||||
| Argentina — 0.0% | |||||||||||
| 12,440 | Petrobras Energia Participaciones SA Sponsored ADR | 148,160 | |||||||||
| 12,800 | Tenaris SA ADR | 568,960 | |||||||||
| Total Argentina | 717,120 | ||||||||||
| Brazil — 8.2% | |||||||||||
| 234,893,720 | Aes Tiete SA | 9,920,235 | |||||||||
| 746,100 | B2W Companhia Global do Varejo | 31,324,641 | |||||||||
| 3,707,260 | Banco do Brasil SA | 61,974,005 | |||||||||
| 1,946,500 | Bolsa de Mercadorias e Futuros | 20,752,998 | |||||||||
| 790,900 | Bovespa Holding SA | 12,393,620 | |||||||||
| 1,803,302 | Companhia Saneamento Basico Sao Paulo | 42,867,211 | |||||||||
| 1,788,316 | Companhia Siderurgica Nacional SA | 66,727,420 | |||||||||
| 3,859,500 | Companhia Vale do Rio Doce | 133,876,335 | |||||||||
| 3,340,790 | Companhia Vale do Rio Doce ADR | 116,393,124 | |||||||||
| 1,747,230 | Companhia Vale do Rio Doce Sponsored ADR | 51,228,784 | |||||||||
| 1,320,792 | Electrobras (Centro) | 19,424,101 | |||||||||
| 606,900 | Iguatemi Empresa de Shopping | 9,976,832 | |||||||||
| 315,800 | OdontoPrev SA | 8,401,539 | |||||||||
| 1,990,250 | Petroleo Brasileiro SA (Petrobras) | 114,982,807 | |||||||||
| 2,138,780 | Petroleo Brasileiro SA (Petrobras) ADR | 250,964,445 | |||||||||
| 1,106,204 | Souza Cruz SA | 32,202,958 | |||||||||
| 373,200 | Tele Norte Leste Participacoes SA | 14,101,756 | |||||||||
| 513,840 | Unibanco-Uniao de Bancos Brasileiros SA GDR | 69,686,981 | |||||||||
| 635,400 | Usinas Siderurgicas de Minas Gerais SA | 38,136,775 | |||||||||
| Total Brazil | 1,105,336,567 | ||||||||||
| Chile — 0.0% | |||||||||||
| 1,400 | AFP Provida SA Sponsored ADR | 51,170 | |||||||||
| 4,920 | Empresa Nacional de Electricidad SA ADR | 208,460 | |||||||||
| 15,040 | Enersis SA Sponsored ADR | 237,181 | |||||||||
| 5,150 | Lan Airlines SA Sponsored ADR | 68,907 | |||||||||
| 970 | Sociedad Quimica y Minera de Chile SA Sponsored ADR | 189,198 | |||||||||
| Total Chile | 754,916 | ||||||||||
See accompanying notes to the financial statements.
3
GMO Emerging Markets Fund
(A Series of GMO Trust)
Schedule of Investments — (Continued)
(showing percentage of total net assets)
February 29, 2008
| Shares | Description | Value ($) | |||||||||
| China — 9.1% | |||||||||||
| 18,629,990 | Advanced Semiconductor Manufacturing Co Class H * | 683,784 | |||||||||
| 14,112,000 | Air China Ltd Class H | 13,233,140 | |||||||||
| 3,486,000 | Ajisen China Holdings Ltd * | 4,962,016 | |||||||||
| 2,190,000 | Anhui Conch Cement Co Ltd Class H | 16,879,771 | |||||||||
| 74,810 | Baidu.com Inc Sponsored ADR * | 18,801,997 | |||||||||
| 82,856,000 | Bank of China Ltd Class H | 34,706,392 | |||||||||
| 5,797,000 | Belle International Holdings Ltd | 7,004,929 | |||||||||
| 18,134,000 | BOC Hong Kong Holdings Ltd | 44,439,288 | |||||||||
| 12,184,000 | China Communication Services Corp Ltd Class H * | 10,517,357 | |||||||||
| 6,726,000 | China Communications Construction Co Ltd Class H | 17,427,284 | |||||||||
| 31,717,000 | China Construction Bank Class H | 24,030,785 | |||||||||
| 3,140,000 | China Life Insurance Co Ltd Class H | 12,193,472 | |||||||||
| 15,083,000 | China Merchants Bank Co Ltd Class H | 52,357,566 | |||||||||
| 4,786,000 | China Merchants Holdings International Co Ltd | 25,689,576 | |||||||||
| 12,830,442 | China Mobile Ltd | 192,112,014 | |||||||||
| 375,649 | China Mobile Ltd Sponsored ADR | 28,030,928 | |||||||||
| 65,471,351 | China Petroleum & Chemical Corp Class H | 71,553,784 | |||||||||
| 6,871,400 | China Resources Enterprise Ltd | 24,394,605 | |||||||||
| 2,250,000 | China Shenhua Energy Co Ltd Class H | 11,460,620 | |||||||||
| 4,074,000 | China Shipping Development Co Ltd Class H | 12,600,745 | |||||||||
| 123,230 | China Telecom Corp Ltd ADR (a) | 9,046,314 | |||||||||
| 18,946,700 | China Telecom Corp Ltd Class H | 13,953,691 | |||||||||
| 15,474,000 | China Ting Group Holding Ltd | 2,506,250 | |||||||||
| 58,314,000 | China Travel International Investment Hong Kong Ltd | 31,407,859 | |||||||||
| 28,854,000 | CNOOC Ltd | 47,919,303 | |||||||||
| 27,146,416 | Denway Motors Ltd | 13,721,651 | |||||||||
| 2,025,000 | Dongfang Electrical Machinery Co Ltd | 12,150,911 | |||||||||
| 7,286,686 | Fountain Set Holdings Ltd | 1,467,488 | |||||||||
| 9,581,284 | GOME Electrical Appliances Holdings Ltd | 21,070,378 | |||||||||
| 12,136,700 | Guangdong Investments Ltd | 6,432,000 | |||||||||
| 13,504,000 | Huaneng Power International Inc Class H | 11,033,944 | |||||||||
| 68,758,000 | Industrial and Commercial Bank of China Ltd Class H | 47,701,067 | |||||||||
| 5,176,000 | Jiangxi Copper Co Ltd Class H | 11,977,711 | |||||||||
See accompanying notes to the financial statements.
4
GMO Emerging Markets Fund
(A Series of GMO Trust)
Schedule of Investments — (Continued)
(showing percentage of total net assets)
February 29, 2008
| Shares | Description | Value ($) | |||||||||
| China — continued | |||||||||||
| 571,700 | New Oriental Education & Technology Group Inc Sponsored ADR * | 35,645,495 | |||||||||
| 4,516,100 | Parkson Retail Group Ltd | 47,012,118 | |||||||||
| 6,356,172 | Peace Mark Holdings Ltd | 7,089,379 | |||||||||
| 182,310 | Perfect World Co Ltd ADR * | 4,927,839 | |||||||||
| 85,267,101 | PetroChina Co Ltd Class H | 124,812,153 | |||||||||
| 8,574,000 | PICC Property & Casualty Co Ltd Class H | 8,990,508 | |||||||||
| 33,832,789 | Pico Far East Holdings Ltd | 4,891,021 | |||||||||
| 1,722,000 | Ping An Insurance (Group) Co of China Ltd Class H | 13,042,391 | |||||||||
| 9,513,000 | Shandong Weigao Group Medical Polymer Co Ltd Class H | 14,610,896 | |||||||||
| 12,984,344 | Shanghai Industrial Holdings Ltd | 52,948,751 | |||||||||
| 2,522,000 | Shanghai Jin Jiang International Hotels Co Ltd Class H | 964,714 | |||||||||
| 15,291,500 | Sinofert Holdings Ltd | 15,256,324 | |||||||||
| 14,906,000 | Sinopec Shanghai Petrochemical Co Ltd Class H | 6,978,789 | |||||||||
| 240,310 | Suntech Power Holdings Co Ltd ADR * | 8,932,323 | |||||||||
| 3,328,000 | Tianjin Development Holdings Ltd | 3,012,748 | |||||||||
| 10,962,000 | Yanzhou Coal Mining Co Ltd Class H | 17,883,107 | |||||||||
| 4,958,000 | Zhuzhou CSR Times Electric Co Ltd Class H | 6,056,542 | |||||||||
| Total China | 1,226,523,718 | ||||||||||
| Hungary — 0.8% | |||||||||||
| 63,480 | Gedeon Richter Rt | 13,702,733 | |||||||||
| 478,610 | MOL Magyar Olaj es Gazipari Nyrt (New Shares) | 65,199,588 | |||||||||
| 809,060 | OTP Bank Nyrt | 32,691,992 | |||||||||
| Total Hungary | 111,594,313 | ||||||||||
| India — 5.0% | |||||||||||
| 66,780 | Aban Offshore Ltd | 6,772,605 | |||||||||
| 504,970 | Axis Bank Ltd | 12,688,283 | |||||||||
| 1,392,921 | Balrampur Chini Mills Ltd * | 3,198,096 | |||||||||
| 51,800 | BF Utilities Ltd * | 1,533,199 | |||||||||
| 521,411 | Bombay Dyeing & Manufacturing Co Ltd | 8,909,137 | |||||||||
| 11,896,352 | CBAY Systems Holdings Ltd * (b) | 18,319,951 | |||||||||
| 5,948,177 | CBAY Systems Ltd * (c) (d) | 59,482 | |||||||||
See accompanying notes to the financial statements.
5
GMO Emerging Markets Fund
(A Series of GMO Trust)
Schedule of Investments — (Continued)
(showing percentage of total net assets)
February 29, 2008
| Shares | Description | Value ($) | |||||||||
| India — continued | |||||||||||
| 21,797,849 | Centurion Bank of Punjab Ltd * | 26,289,464 | |||||||||
| 754,430 | Century Textiles & Industries Ltd | 14,923,298 | |||||||||
| 3,000 | Cipla Ltd (Shares Under Objection) (c) | 1 | |||||||||
| 488,639 | Cummins India Ltd | 4,070,902 | |||||||||
| 176,150 | Emco Ltd | 5,173,972 | |||||||||
| 1,063,900 | GAIL India Ltd | 11,075,004 | |||||||||
| 1,209,169 | Gammon India Ltd | 14,618,380 | |||||||||
| 321,462 | Gitanjali Gems Ltd | 2,287,745 | |||||||||
| 200 | HCL Infosystems Ltd (Shares Under Objection) (c) | — | |||||||||
| 431,539 | HDFC Bank Ltd | 15,457,712 | |||||||||
| 3,143,858 | Hindalco Industries Ltd | 15,660,341 | |||||||||
| 174,394 | Housing Development Finance Corp Ltd | 11,993,156 | |||||||||
| 1,624,350 | ICICI Bank Ltd | 43,292,315 | |||||||||
| 770,280 | India Cements Ltd | 3,938,467 | |||||||||
| 710,030 | Indiabulls Financial Services Ltd | 10,655,539 | |||||||||
| 743,410 | Indiabulls Real Estate Ltd * | 11,608,962 | |||||||||
| 484,076 | Indiabulls Securities Ltd | 4,549,214 | |||||||||
| 217,620 | Infosys Technologies Ltd | 8,307,423 | |||||||||
| 1,500 | ITC Ltd (Shares Under Objection) (c) | — | |||||||||
| 3,869,707 | IVRCL Infrastructures & Projects Ltd | 44,851,882 | |||||||||
| 1,522,424 | Jaiprakash Associates Ltd | 9,840,771 | |||||||||
| 1,766,780 | Jindal Steel & Power Ltd | 99,881,458 | |||||||||
| 194,927 | JSW Steel Ltd | 5,093,657 | |||||||||
| 425,780 | Lanco Infratech Ltd * | 4,957,522 | |||||||||
| 123,850 | Madhucon Projects Ltd | 2,131,036 | |||||||||
| 87 | Mahindra Lifespace Developers Ltd | 1,210 | |||||||||
| 185,010 | Maruti Suzuki India Ltd | 3,955,148 | |||||||||
| 1,672,410 | Power Finance Corp | 7,697,880 | |||||||||
| 1,708,767 | PTC India Ltd | 4,976,332 | |||||||||
| 297,853 | Punj Lloyd Ltd | 2,765,334 | |||||||||
| 527,749 | Reliance Capital Ltd | 23,657,792 | |||||||||
| 1,287,000 | Reliance Communications Ltd | 18,230,893 | |||||||||
| 250,900 | Reliance Energy Ltd | 9,684,378 | |||||||||
| 900 | Reliance Energy Ltd (Shares Under Objection) (c) | — | |||||||||
See accompanying notes to the financial statements.
6
GMO Emerging Markets Fund
(A Series of GMO Trust)
Schedule of Investments — (Continued)
(showing percentage of total net assets)
February 29, 2008
| Shares | Description | Value ($) | |||||||||
| India — continued | |||||||||||
| 787,008 | Reliance Industries Ltd | 47,981,308 | |||||||||
| 7,133 | Reliance Industries Ltd (Shares Under Objection) (c) | 2 | |||||||||
| 528,912 | Rolta India Ltd | 3,946,578 | |||||||||
| 1,817,865 | Satyam Computer Services Ltd | 19,557,320 | |||||||||
| 28,949 | SAW Ltd * | 622,460 | |||||||||
| 368,485 | Shree Precoated Steels Ltd | 2,196,380 | |||||||||
| 1,878,500 | Sintex Industries Ltd | 21,525,652 | |||||||||
| 525,136 | Tasc Pharmaceuticals Ltd * | 3,304,035 | |||||||||
| 1,044,924 | Tata Consultancy Services Ltd | 22,663,178 | |||||||||
| 186,450 | Tata Motors Ltd | 3,214,053 | |||||||||
| 309,947 | Tata Power Co Ltd | 10,611,134 | |||||||||
| 190,622 | Tata Steel Ltd | 3,764,724 | |||||||||
| 592,429 | United Phosphorus Ltd | 4,885,754 | |||||||||
| 67,166 | Welspun India Ltd * | 102,790 | |||||||||
| 3,184,720 | Wipro Ltd | 34,324,652 | |||||||||
| 600 | Wockhardt Ltd | 4,971 | |||||||||
| Total India | 671,812,932 | ||||||||||
| Indonesia — 1.6% | |||||||||||
| 8,454,000 | Astra International Tbk PT | 25,366,274 | |||||||||
| 1,408,557,000 | Bakrie & Brothers Tbk PT * (b) | 52,163,380 | |||||||||
| 120,493,500 | Bumi Resources Tbk PT | 99,415,428 | |||||||||
| 59,543,100 | Matahari Putra Prima Tbk PT | 3,935,419 | |||||||||
| 23,513,000 | Telekomunikasi Indonesia Tbk PT | 24,889,858 | |||||||||
| 75,674,500 | Truba Alam Manunggal Engineering Tbk PT * | 9,649,776 | |||||||||
| Total Indonesia | 215,420,135 | ||||||||||
| Israel — 0.9% | |||||||||||
| 6,012,720 | Bank Hapoalim BM | 25,690,616 | |||||||||
| 7,424,000 | Bank Leumi Le — Israel | 34,110,298 | |||||||||
| 2,900 | Teva Pharmaceutical Industries Ltd | 141,618 | |||||||||
| 1,169,440 | Teva Pharmaceutical Industries Ltd Sponsored ADR | 57,384,421 | |||||||||
| Total Israel | 117,326,953 | ||||||||||
See accompanying notes to the financial statements.
7
GMO Emerging Markets Fund
(A Series of GMO Trust)
Schedule of Investments — (Continued)
(showing percentage of total net assets)
February 29, 2008
| Shares | Description | Value ($) | |||||||||
| Lebanon — 0.0% | |||||||||||
| 8,700 | Banque Libanaise pour le Commerce Sal * (c) | 35,695 | |||||||||
| Malaysia — 4.5% | |||||||||||
| 17,423,200 | Berjaya Sports Toto Berhad | 27,845,486 | |||||||||
| 10,411,100 | Gamuda Berhad | 12,658,229 | |||||||||
| 21,011,400 | Genting Berhad | 44,446,560 | |||||||||
| 4,613,000 | Hong Leong Bank Berhad | 8,008,526 | |||||||||
| 4,020,500 | IGB Corp Berhad | 2,381,339 | |||||||||
| 20,301,100 | IOI Corp Berhad | 50,493,148 | |||||||||
| 19,613,684 | KNM Group Berhad | 36,896,075 | |||||||||
| 16,708,825 | Malayan Banking Berhad | 47,164,967 | |||||||||
| 8,111,100 | Public Bank Berhad | 26,497,614 | |||||||||
| 61,892,700 | Resorts World Berhad | 71,583,960 | |||||||||
| 54,330,729 | RHB Capital Berhad | 83,345,668 | |||||||||
| 8,783,700 | Shangri-La Hotels Berhad | 6,716,801 | |||||||||
| 17,199,089 | Sime Darby Berhad * | 62,454,040 | |||||||||
| 14,890,400 | Sunway City Berhad | 13,676,141 | |||||||||
| 5,666,168 | Tanjong Plc | 28,150,275 | |||||||||
| 6,838,300 | UEM World Berhad | 7,338,355 | |||||||||
| 27,048,400 | UMW Holdings Berhad | 58,848,580 | |||||||||
| 18,444,532 | WCT Engineering Berhad | 23,246,057 | |||||||||
| Total Malaysia | 611,751,821 | ||||||||||
| Mexico — 0.1% | |||||||||||
| 3,077,311 | Grupo Cementos de Chihuahua SA de CV | 17,351,896 | |||||||||
| Pakistan — 0.0% | |||||||||||
| 65,510 | Attock Refinery Ltd | 286,030 | |||||||||
| 29,040 | MCB Bank Ltd | 201,783 | |||||||||
| 106,720 | Oil & Gas Development Co Ltd | 219,640 | |||||||||
| Total Pakistan | 707,453 | ||||||||||
See accompanying notes to the financial statements.
8
GMO Emerging Markets Fund
(A Series of GMO Trust)
Schedule of Investments — (Continued)
(showing percentage of total net assets)
February 29, 2008
| Shares | Description | Value ($) | |||||||||
| Philippines — 1.8% | |||||||||||
| 648,604 | Ayala Corp | 6,831,449 | |||||||||
| 64,457,483 | Ayala Land Inc | 18,317,458 | |||||||||
| 9,145,830 | Bank of the Philippine Islands | 12,344,576 | |||||||||
| 707,472,942 | Filinvest Land Inc * | 18,081,515 | |||||||||
| 4,914,000 | First Gen Corp | 4,852,358 | |||||||||
| 6,379,623 | First Philippine Holdings | 7,214,721 | |||||||||
| 827,704,087 | Megaworld Corp | 49,255,194 | |||||||||
| 1,032,446 | Philippine Long Distance Telephone Co | 72,847,731 | |||||||||
| 8,160 | Philippine Long Distance Telephone Co Sponsored ADR (a) | 578,952 | |||||||||
| 11,567,600 | PNOC Energy Development Corp | 1,802,190 | |||||||||
| 132,173,510 | Robinsons Land Corp | 36,937,049 | |||||||||
| 38,329,445 | SM Prime Holdings Inc | 8,645,793 | |||||||||
| Total Philippines | 237,708,986 | ||||||||||
| Poland — 0.1% | |||||||||||
| 842,890 | Polski Koncern Naftowy Orlen SA * | 14,298,604 | |||||||||
| Russia — 7.5% | |||||||||||
| 327,920 | AvtoVAZ | 590,256 | |||||||||
| 618,700 | Cherepovets MK Severstal GDR (Registered Shares) | 15,776,850 | |||||||||
| 376,540 | CTC Media Inc * | 11,055,214 | |||||||||
| 4,165,493 | Gazprom Neft | 24,368,134 | |||||||||
| 403,900 | Gazprom Neft Sponsored ADR | 12,722,850 | |||||||||
| 725,000 | JSC Mining & Smelting Co ADR | 21,170,000 | |||||||||
| 21,350 | KamAZ * | 123,830 | |||||||||
| 685 | Lukoil GDR | 203,856 | |||||||||
| 611,350 | Lukoil Sponsored ADR | 45,239,900 | |||||||||
| 656,730 | Mobile Telesystems Sponsored ADR | 53,891,264 | |||||||||
| 293,100 | Novolipetsk Steel GDR (Registered Shares) | 13,429,842 | |||||||||
| 9,161,800 | OAO Gazprom Sponsored GDR | 465,419,440 | |||||||||
| 685,883 | OAO Mechel ADR (a) | 90,570,850 | |||||||||
| 1,728,900 | OAO Rosneft Oil Co GDR | 14,142,402 | |||||||||
| 162,300 | OAO Tatneft Sponsored GDR (Registered Shares) | 20,368,650 | |||||||||
| 452,500 | PIK Group GDR (Registered Shares) * | 12,896,250 | |||||||||
See accompanying notes to the financial statements.
9
GMO Emerging Markets Fund
(A Series of GMO Trust)
Schedule of Investments — (Continued)
(showing percentage of total net assets)
February 29, 2008
| Shares | Description | Value ($) | |||||||||
| Russia — continued | |||||||||||
| 135,000 | Russia Petroleum * (c) | 1,350,000 | |||||||||
| 38,088,550 | Sberbank RF | 126,834,871 | |||||||||
| 741,310 | Vimpel-Communications Sponsored ADR | 25,745,696 | |||||||||
| 424,790 | Wimm-Bill-Dann Foods ADR | 44,713,395 | |||||||||
| 490,900 | X5 Retail Group NV GDR (Registered Shares) * | 16,543,330 | |||||||||
| Total Russia | 1,017,156,880 | ||||||||||
| South Africa — 1.8% | |||||||||||
| 844,275 | Absa Group Ltd | 11,950,459 | |||||||||
| 2,003,660 | African Bank Investments Ltd | 7,893,393 | |||||||||
| 605,000 | ArcelorMittal South Africa Ltd | 14,347,329 | |||||||||
| 1,641,493 | Aveng Ltd | 12,902,859 | |||||||||
| 828,300 | Barloworld Ltd | 9,973,811 | |||||||||
| 7,072,300 | FirstRand Ltd | 16,737,274 | |||||||||
| 1,905,300 | Freeworld Coatings Ltd * | 2,381,716 | |||||||||
| 1,475,800 | MTN Group Ltd | 23,109,973 | |||||||||
| 4,136,780 | Murray & Roberts Holdings Ltd | 51,751,251 | |||||||||
| 1,129,700 | Reunert Ltd | 8,235,367 | |||||||||
| 8,300,471 | Sanlam Ltd | 19,725,914 | |||||||||
| 654,100 | Sasol Ltd | 33,451,979 | |||||||||
| 1,188,726 | Standard Bank Group Ltd | 14,835,732 | |||||||||
| 3,353,900 | Steinhoff International Holdings Ltd | 7,703,057 | |||||||||
| 497,948 | Tiger Brands Ltd | 8,863,128 | |||||||||
| Total South Africa | 243,863,242 | ||||||||||
| South Korea — 16.0% | |||||||||||
| 4,403,499 | Biomass Korea Co Ltd * (b) | 4,806,682 | |||||||||
| 188,185 | Boryung Pharmaceutical Co Ltd (b) | 9,623,938 | |||||||||
| 26,120 | CJ CheilJedang Corp * | 7,468,420 | |||||||||
| 577,880 | Daehan Pulp Co Ltd * (b) | 3,241,894 | |||||||||
| 318,260 | Daelim Industrial Co Ltd | 49,523,728 | |||||||||
| 12,315 | Daesun Shipbuilding | 1,663,793 | |||||||||
| 681,411 | Daewoo Engineering & Construction Co Ltd | 14,585,751 | |||||||||
| 497,250 | Daewoo International Corp | 18,771,979 | |||||||||
See accompanying notes to the financial statements.
10
GMO Emerging Markets Fund
(A Series of GMO Trust)
Schedule of Investments — (Continued)
(showing percentage of total net assets)
February 29, 2008
| Shares | Description | Value ($) | |||||||||
| South Korea — continued | |||||||||||
| 128,526 | DC Chemical Co Ltd | 45,993,921 | |||||||||
| 501,263 | Dongbu Insurance Co Ltd | 19,846,541 | |||||||||
| 274,450 | Dongkuk Steel Mill Co Ltd | 12,276,693 | |||||||||
| 1,413,948 | EnE System Inc * (b) | 9,225,369 | |||||||||
| 191,100 | GS Holdings Corp | 9,264,844 | |||||||||
| 243,319 | Hana Financial Group Inc | 10,796,792 | |||||||||
| 81,961 | Hana Tour Service Inc | 5,368,062 | |||||||||
| 545,175 | Hanjin Heavy Industries & Construction Co Ltd | 33,399,074 | |||||||||
| 441,644 | Hanjin Heavy Industries & Construction Holdings Co Ltd * | 15,637,248 | |||||||||
| 2,939,252 | Hanwha Corp | 178,781,231 | |||||||||
| 77,974 | Honam Petrochemical Corp | 7,583,225 | |||||||||
| 434,226 | Hyundai Engineering & Construction | 39,053,928 | |||||||||
| 153,860 | Hyundai Heavy Industries | 60,931,674 | |||||||||
| 1,004,360 | Hyundai Marine & Fire Insurance Co Ltd | 22,463,326 | |||||||||
| 35,611 | Hyundai Mipo Dockyard Co Ltd | 10,020,488 | |||||||||
| 525,410 | Hyundai Mobis | 40,329,946 | |||||||||
| 1,018,130 | Hyundai Motor Co | 71,388,353 | |||||||||
| 447,490 | Hyundai Steel Co | 34,621,626 | |||||||||
| 131,410 | Hyunjin Materials Co Ltd | 5,011,812 | |||||||||
| 448,416 | In the F Co Ltd * (b) | 11,011,120 | |||||||||
| 1,138,040 | Industrial Bank of Korea | 18,348,307 | |||||||||
| 169,736 | JVM Co Ltd | 9,250,619 | |||||||||
| 79,970 | KCC Corp | 47,147,975 | |||||||||
| 936,270 | Kookmin Bank | 57,701,931 | |||||||||
| 40,200 | Kookmin Bank ADR * | 2,461,446 | |||||||||
| 1,451,610 | Korea Exchange Bank | 20,299,146 | |||||||||
| 286,143 | Korea Gas Corp | 21,343,366 | |||||||||
| 93,346 | Korea Iron & Steel Co Ltd | 7,563,928 | |||||||||
| 11,353,300 | Korea Real Estate * | 19,779,239 | |||||||||
| 81,889 | Korea Zinc Co Ltd | 12,364,300 | |||||||||
| 534,254 | Korean Air Lines Co Ltd | 40,365,222 | |||||||||
| 283,370 | KT Corp | 13,932,745 | |||||||||
| 313,740 | KT Corp ADR * | 7,620,745 | |||||||||
| 1,349,288 | KT&G Corp | 111,324,919 | |||||||||
See accompanying notes to the financial statements.
11
GMO Emerging Markets Fund
(A Series of GMO Trust)
Schedule of Investments — (Continued)
(showing percentage of total net assets)
February 29, 2008
| Shares | Description | Value ($) | |||||||||
| South Korea — continued | |||||||||||
| 566,000 | KT&G Corp GDR 144A * | 23,211,660 | |||||||||
| 394,050 | LG Corp | 27,406,847 | |||||||||
| 301,850 | LG Electronics Inc | 32,510,306 | |||||||||
| 2,033,830 | LG Philips LCD Co Ltd | 96,626,427 | |||||||||
| 476,019 | Maeil Dairy Industry | 10,436,431 | |||||||||
| 142,680 | MegaStudy Co Ltd | 49,607,546 | |||||||||
| 456,780 | NHN Corp * | 101,376,345 | |||||||||
| 219,269 | POSCO | 120,602,993 | |||||||||
| 76,000 | POSCO ADR | 10,282,800 | |||||||||
| 794,190 | Pumyang Construction Co Ltd (b) | 13,435,930 | |||||||||
| 608,590 | Samsung Corp | 37,126,729 | |||||||||
| 236,691 | Samsung Electronics Co Ltd | 138,741,697 | |||||||||
| 337,326 | Samsung Fire & Marine Insurance Co Ltd | 66,680,047 | |||||||||
| 1,441,325 | Shinhan Financial Group Co Ltd | 77,642,460 | |||||||||
| 56,890 | Shinsegae Co Ltd | 35,324,293 | |||||||||
| 472,128 | SK Energy Co Ltd | 64,102,302 | |||||||||
| 400 | SK Telecom Co Ltd | 81,307 | |||||||||
| 616,500 | SK Telecom Co Ltd ADR | 13,809,600 | |||||||||
| 286,821 | SSCP Co Ltd * | 7,660,637 | |||||||||
| 492,492 | Taewoong Co Ltd | 43,205,235 | |||||||||
| 675,220 | Taihan Electric Wire Co Ltd | 32,899,499 | |||||||||
| 1,089,630 | Woori Finance Holdings Co Ltd | 19,512,494 | |||||||||
| Total South Korea | 2,164,478,931 | ||||||||||
| Sri Lanka — 0.0% | |||||||||||
| 208,500 | Lanka Walltile Ltd | 121,356 | |||||||||
| Taiwan — 14.6% | |||||||||||
| 17,344,250 | Asustek Computer Inc | 47,883,090 | |||||||||
| 44,698,000 | AU Optronics Corp | 85,256,429 | |||||||||
| 17,118,000 | Cathay Financial Holding Co Ltd | 42,889,795 | |||||||||
| 45,781,000 | Chi Mei Optoelectronics Corp | 60,216,490 | |||||||||
| 52,437,000 | China Bills Finance Corp * | 12,392,874 | |||||||||
| 74,374,840 | China Development Financial Holding Corp | 30,455,072 | |||||||||
See accompanying notes to the financial statements.
12
GMO Emerging Markets Fund
(A Series of GMO Trust)
Schedule of Investments — (Continued)
(showing percentage of total net assets)
February 29, 2008
| Shares | Description | Value ($) | |||||||||
| Taiwan — continued | |||||||||||
| 42,802,079 | China Steel Corp | 63,239,362 | |||||||||
| 383,778 | China Steel Corp Sponsored GDR | 11,563,231 | |||||||||
| 58,891,387 | Chinatrust Financial Holding Co Ltd * | 52,649,452 | |||||||||
| 38,904,610 | Chunghwa Telecom Co Ltd | 96,729,583 | |||||||||
| 847,231 | Chungwa Telecom Co Ltd ADR | 20,791,049 | |||||||||
| 24,812,548 | Compal Electronics Inc | 22,363,076 | |||||||||
| 3,487,855 | Delta Electronics Inc | 9,920,355 | |||||||||
| 2,487,596 | DFI Inc | 5,811,962 | |||||||||
| 10,569,806 | Dimerco Express Taiwan Corp (b) | 13,447,262 | |||||||||
| 7,663,776 | D-Link Corp | 12,175,550 | |||||||||
| 10,861,040 | Far Eastern Department Stores Ltd | 19,862,406 | |||||||||
| 33,753,162 | Far Eastern Textile Co Ltd | 54,991,942 | |||||||||
| 16,535,000 | Far Eastone Telecommunications Co Ltd | 23,089,310 | |||||||||
| 22,247,000 | First Financial Holding Co Ltd | 19,860,962 | |||||||||
| 30,631,208 | Formosa Chemicals & Fibre Co | 74,438,938 | |||||||||
| 3,054,044 | Formosa Petrochemical Corp | 8,450,599 | |||||||||
| 26,509,107 | Formosa Plastics Corp | 71,460,201 | |||||||||
| 4,085,250 | Foxconn Technology Co Ltd | 26,651,476 | |||||||||
| 31,652,000 | Fubon Financial Holding Co Ltd | 34,447,492 | |||||||||
| 6,132,670 | Gloria Material Technology Corp | 9,185,655 | |||||||||
| 28,278,000 | Hannstar Display Corp * | 12,163,702 | |||||||||
| 3,906,000 | High Tech Computer Corp | 80,634,345 | |||||||||
| 30,814,526 | Hon Hai Precision Industry Co Ltd | 183,843,160 | |||||||||
| 3,504,586 | Innolux Display Corp | 9,670,390 | |||||||||
| 11,942,883 | Les Enphants Co Ltd (b) | 8,606,563 | |||||||||
| 14,247,391 | Lite-On Technology Corp | 19,462,402 | |||||||||
| 7,102,365 | MediaTek Inc | 79,656,671 | |||||||||
| 21,596,000 | Mega Financial Holdings Co Ltd | 15,421,004 | |||||||||
| 41,155,405 | Nan Ya Plastics Corp | 96,923,075 | |||||||||
| 5,137,000 | Novatek Microelectronics Corp Ltd | 18,076,158 | |||||||||
| 199 | Oriental Union Chemical | 194 | |||||||||
| 2,007,850 | Richtek Technology Corp | 17,717,089 | |||||||||
| 19,222,903 | Siliconware Precision Industries Co | 31,325,715 | |||||||||
| 52,257,350 | Taiwan Cement Corp | 92,969,570 | |||||||||
See accompanying notes to the financial statements.
13
GMO Emerging Markets Fund
(A Series of GMO Trust)
Schedule of Investments — (Continued)
(showing percentage of total net assets)
February 29, 2008
| Shares | Description | Value ($) | |||||||||
| Taiwan — continued | |||||||||||
| 2,440,000 | Taiwan Fertilizer Co Ltd | 9,516,908 | |||||||||
| 20,745,288 | Taiwan Mobile Co Ltd | 35,145,330 | |||||||||
| 82,773,965 | Taiwan Semiconductor Manufacturing Co Ltd | 161,702,549 | |||||||||
| 816,117 | Taiwan Semiconductor Manufacturing Co Ltd Sponsored ADR | 7,948,980 | |||||||||
| 438 | Tsann Kuen Enterprises Co Ltd * | 582 | |||||||||
| 7,051,000 | U-Ming Marine Transport Co | 19,386,544 | |||||||||
| 6,916,540 | Unimicron Technology Corp | 10,436,514 | |||||||||
| 9,079,100 | Uni-President Enterprises Corp | 13,033,670 | |||||||||
| 12,133,873 | Wan Hai Lines Ltd | 10,304,078 | |||||||||
| 38,672,020 | Waterland Financial Holdings | 14,778,929 | |||||||||
| 11,001,000 | Wintek Corp | 10,739,453 | |||||||||
| 15,408,000 | Wistron Corp | 25,444,257 | |||||||||
| 66,725,000 | Yuanta Financial Holding Co Ltd * | 58,497,634 | |||||||||
| Total Taiwan | 1,973,629,079 | ||||||||||
| Thailand — 6.4% | |||||||||||
| 14,364,590 | Advanced Info Service Pcl (Foreign Registered) (c) | 47,305,071 | |||||||||
| 7,983,540 | Bangkok Bank Pcl NVDR (c) | 32,596,356 | |||||||||
| 29,855,800 | Bangkok Dusit Medical Service Pcl (Foreign Registered) (c) | 31,563,201 | |||||||||
| 5,452,500 | Bank of Ayudhya Pcl (Foreign Registered) (c) | 4,362,381 | |||||||||
| 18,701,760 | Bank of Ayudhya Pcl NVDR (c) | 14,454,752 | |||||||||
| 5,134,940 | Banpu Pcl (Foreign Registered) (c) | 76,935,040 | |||||||||
| 573,790 | Banpu Pcl NVDR (c) | 8,596,898 | |||||||||
| 41,745,020 | BEC World Pcl (Foreign Registered) (c) | 36,089,714 | |||||||||
| 11,150,580 | Home Product Center Pcl (Foreign Registered) (c) | 1,756,389 | |||||||||
| 103,455,800 | IRPC Pcl (Foreign Registered) (c) | 19,477,301 | |||||||||
| 109,514,650 | Italian Thai Development Pcl (Foreign Registered) * (c) | 30,884,697 | |||||||||
| 18,442,760 | Kasikornbank Pcl (Foreign Registered) (c) | 51,699,524 | |||||||||
| 21,641,700 | Kasikornbank Pcl NVDR (c) | 59,650,163 | |||||||||
| 31,705,000 | Krung Thai Bank Pcl (Foreign Registered) (c) | 10,778,189 | |||||||||
| 48,301,630 | Land & Houses Pcl NVDR (c) | 12,741,195 | |||||||||
| 13,838,500 | Major Cineplex Group (Foreign Registered) (c) | 7,731,006 | |||||||||
| 22,331,771 | PTT Aromatics & Refining Pcl (Foreign Registered) * (c) | 29,976,722 | |||||||||
| 9,740,000 | PTT Exploration & Production Pcl (Foreign Registered) (c) | 49,025,234 | |||||||||
See accompanying notes to the financial statements.
14
GMO Emerging Markets Fund
(A Series of GMO Trust)
Schedule of Investments — (Continued)
(showing percentage of total net assets)
February 29, 2008
| Shares | Description | Value ($) | |||||||||
| Thailand — continued | |||||||||||
| 17,043,270 | PTT Pcl (Foreign Registered) (c) | 182,264,980 | |||||||||
| 8,938,690 | Robinson Department Store Pcl (Foreign Registered) (c) | 3,174,421 | |||||||||
| 3,499,793 | Robinson Department Store Pcl NVDR (c) | 1,242,891 | |||||||||
| 13,251,400 | Saha Pathana International Holding Pcl (Foreign Registered) (c) | 8,191,618 | |||||||||
| 3,564,838 | Siam Cement Pcl NVDR (c) | 24,228,202 | |||||||||
| 20,186,900 | Siam Commercial Bank Pcl (Foreign Registered) (c) | 55,330,128 | |||||||||
| 3,108,050 | Star Block Co Ltd (Foreign Registered) * (b) (c) (e) | 987 | |||||||||
| 19,808,320 | Thai Oil Pcl (Foreign Registered) (c) | 48,980,831 | |||||||||
| 10,883,760 | Thoresen Thai Agencies Pcl (Foreign Registered) (c) | 16,256,378 | |||||||||
| Total Thailand | 865,294,269 | ||||||||||
| Turkey — 2.6% | |||||||||||
| 5,315,530 | Akbank TAS | 28,138,556 | |||||||||
| 5,576,090 | Dogan Sirketler Grubu Holdings AS * | 7,015,685 | |||||||||
| 1,966,410 | Enka Insaat ve Sanayi AS | 29,586,536 | |||||||||
| 3,984,970 | Eregli Demir ve Celik Fabrikalari TAS | 28,020,494 | |||||||||
| 3,679,520 | Haci Omer Sabanci Holding AS | 16,549,248 | |||||||||
| 4,144,150 | KOC Holding AS * | 15,607,538 | |||||||||
| 42,150 | Medya Holding AS * (c) (e) | 345 | |||||||||
| 1,715,910 | Tupras-Turkiye Petrol Rafineriler AS | 43,503,555 | |||||||||
| 1,034,670 | Turk Hava Yollari Anonim Ortakligi * | 6,147,491 | |||||||||
| 4,103,170 | Turkcell Iletisim Hizmet AS | 40,540,866 | |||||||||
| 14,160,600 | Turkiye Garanti Bankasi | 83,979,725 | |||||||||
| 1,410,330 | Turkiye Halk Bankasi AS * | 8,924,309 | |||||||||
| 7,242,630 | Turkiye IS Bankasi Class C | 33,219,965 | |||||||||
| 4,785,200 | Yapi Ve Kredi Bankasi AS * | 10,816,395 | |||||||||
| Total Turkey | 352,050,708 | ||||||||||
| TOTAL COMMON STOCKS (COST $9,002,269,976) | 10,947,935,574 | ||||||||||
See accompanying notes to the financial statements.
15
GMO Emerging Markets Fund
(A Series of GMO Trust)
Schedule of Investments — (Continued)
(showing percentage of total net assets)
February 29, 2008
| Shares | Description | Value ($) | |||||||||
| PREFERRED STOCKS — 13.5% | |||||||||||
| Brazil — 12.0% | |||||||||||
| 3,609,968 | Banco Bradesco SA 0.32% | 112,711,437 | |||||||||
| 4,494,640 | Banco Itau Holding Financeira SA 2.81% | 113,223,147 | |||||||||
| 959,700 | Bradespar SA 0.28% | 24,970,019 | |||||||||
| 3,180,726 | Companhia Energetica de Minas Gerais 2.29% | 60,563,762 | |||||||||
| 1,158,700 | Companhia Paranaense de Energia Class B 2.20% | 18,849,173 | |||||||||
| 8,257,108 | Companhia Vale do Rio Doce Class A 0.05% | 243,450,656 | |||||||||
| 938,500 | Electrobras (Centro) SA Class B 6.09% | 13,763,113 | |||||||||
| 896,500 | Gerdau Metalurgica SA 2.65% | 39,494,560 | |||||||||
| 3,256,031 | Gerdau SA 2.11% | 106,397,181 | |||||||||
| 19,623,682 | Itausa-Investimentos Itau SA 0.11% | 124,744,002 | |||||||||
| 1,802,052 | Net Servicos de Comunicacoa SA * | 19,830,990 | |||||||||
| 8,703,052 | Petroleo Brasileiro SA (Petrobras) 0.43% | 419,173,074 | |||||||||
| 1,025,400 | Petroleo Brasileiro SA Sponsored ADR 0.38% | 100,417,422 | |||||||||
| 5,674,223 | Sadia SA 3.09% | 32,077,093 | |||||||||
| 3,108,720 | Tele Norte Leste Participacoes ADR 3.52% | 77,811,262 | |||||||||
| 387,300 | Telecomunicacoes de Sao Paulo SA 6.72% | 11,066,369 | |||||||||
| 659,100 | Telemar Norte Leste SA Class A 3.67% | 35,466,915 | |||||||||
| 6,220,732 | Unipar Class B 0.68% | 5,959,190 | |||||||||
| 970,800 | Usinas Siderrurgicas de Minas Gerais SA Class A 2.26% | 56,258,293 | |||||||||
| Total Brazil | 1,616,227,658 | ||||||||||
| Malaysia — 0.0% | |||||||||||
| 15,370,443 | WCT Engineering Series ICPS * | 4,059,009 | |||||||||
| Russia — 0.1% | |||||||||||
| 11,260 | Transneft 0.66% | 16,383,300 | |||||||||
| South Korea — 1.4% | |||||||||||
| 365,300 | Hyundai Motor Co 3.86% | 10,445,812 | |||||||||
| 491,990 | Hyundai Motor Co 4.03% | 14,167,546 | |||||||||
| 387,392 | Samsung Electronics Co Ltd (Non Voting) 3.69% | 166,299,832 | |||||||||
| Total South Korea | 190,913,190 | ||||||||||
| TOTAL PREFERRED STOCKS (COST $795,603,691) | 1,827,583,157 | ||||||||||
See accompanying notes to the financial statements.
16
GMO Emerging Markets Fund
(A Series of GMO Trust)
Schedule of Investments — (Continued)
(showing percentage of total net assets)
February 29, 2008
| Shares | Description | Value ($) | |||||||||
| PRIVATE EQUITY SECURITIES — 0.7% | |||||||||||
| Poland — 0.7% | |||||||||||
| CHP Investors (Multimedia) * (c) (d) | 29,356,596 | ||||||||||
| MHP Investors (Tri Media Holdings Ltd) * (c) (d) | 57,335,486 | ||||||||||
| Total Poland | 86,692,082 | ||||||||||
| Russia — 0.0% | |||||||||||
| 46,624 | Divot Holdings NV, Convertible Securities-Class F * (c) (d) (e) | 466 | |||||||||
| 90,000 | Divot Holdings NV, Private Equity Securities-Class D * (c) (d) (e) | 900 | |||||||||
| 124,330 | Divot Holdings NV, Private Equity Securities-Class E * (c) (d) (e) | 1,243 | |||||||||
| Total Russia | 2,609 | ||||||||||
| Sri Lanka — 0.0% | |||||||||||
| 2,545,869 | Millenium Information Technology * (b) (c) (d) | 787,470 | |||||||||
| TOTAL PRIVATE EQUITY SECURITIES (COST $3,925,626) | 87,482,161 | ||||||||||
| INVESTMENT FUNDS — 0.4% | |||||||||||
| China — 0.1% | |||||||||||
| 250,446 | Martin Currie China A Share Fund Ltd * (c) (d) | 14,335,519 | |||||||||
| India — 0.1% | |||||||||||
| 10,303 | Fire Capital Mauritius Private Fund * (c) (d) (k) | 9,021,539 | |||||||||
| 170 | SPG Infinity Technology Fund I * (c) (d) | 5,583 | |||||||||
| 1,371,900 | TDA India Technology Fund II LP * (c) (d) | 2,521,621 | |||||||||
| 100 | UTI Masterplus 1991 Units (Shares Under Objection) * (c) (d) | — | |||||||||
| Total India | 11,548,743 | ||||||||||
| Poland — 0.0% | |||||||||||
| 1,749,150 | The Emerging European Fund II LP * (c) (d) | 786,278 | |||||||||
See accompanying notes to the financial statements.
17
GMO Emerging Markets Fund
(A Series of GMO Trust)
Schedule of Investments — (Continued)
(showing percentage of total net assets)
February 29, 2008
| Shares / Par Value ($) | Description | Value ($) | |||||||||
| Russia — 0.2% | |||||||||||
| 9,500,000 | NCH Eagle Fund LP * (c) (d) | 28,534,200 | |||||||||
| 2,000 | Steep Rock Russia Fund LP (c) (d) | 1,943,925 | |||||||||
| Total Russia | 30,478,125 | ||||||||||
| Ukraine — 0.0% | |||||||||||
| 16,667 | Societe Generale Thalmann Ukraine Fund * (c) (d) | 4,000 | |||||||||
| TOTAL INVESTMENT FUNDS (COST $26,727,232) | 57,152,665 | ||||||||||
| DEBT OBLIGATIONS — 0.1% | |||||||||||
| United States — 0.1% | |||||||||||
| 15,773,052 | U.S. Treasury Inflation Indexed Note, 3.88%, due 01/15/09 (f) | 16,427,381 | |||||||||
| TOTAL DEBT OBLIGATIONS (COST $16,536,501) | 16,427,381 | ||||||||||
| RIGHTS AND WARRANTS — 0.1% | |||||||||||
| Brazil — 0.0% | |||||||||||
| 31,966 | Banco Bradesco SA Rights, Expires 02/22/08 * (g) | 84,116 | |||||||||
| 20,157 | Net Servicos de Comunicacao SA Right, Expires 03/07/08 * | 1,430 | |||||||||
| Total Brazil | 85,546 | ||||||||||
| India — 0.1% | |||||||||||
| 32,542 | Uniphos Enterprises Ltd Warrants, 144A, Expires 01/28/09 (Merrill Lynch) * (c) (h) | 46,355 | |||||||||
| 711,650 | United Phosphorus Ltd Warrants, 144A, Expires 01/28/09 (Merrill Lynch) * (c) (h) | 5,957,835 | |||||||||
| Total India | 6,004,190 | ||||||||||
| Malaysia — 0.0% | |||||||||||
| 4,963,466 | Sunway City Warrants, Expires 10/04/17 * | 769,108 | |||||||||
See accompanying notes to the financial statements.
18
GMO Emerging Markets Fund
(A Series of GMO Trust)
Schedule of Investments — (Continued)
(showing percentage of total net assets)
February 29, 2008
| Shares / Par Value ($) | Description | Value ($) | |||||||||
| Thailand — 0.0% | |||||||||||
| 2,689,393 | True Corp Pcl Warrants, Expires 04/03/08 * (c) | — | |||||||||
| TOTAL RIGHTS AND WARRANTS (COST $1,978,162) | 6,858,844 | ||||||||||
| MUTUAL FUNDS — 0.0% | |||||||||||
| United States — 0.0% | |||||||||||
| Affiliated Issuer | |||||||||||
| 8,064 | GMO Special Purpose Holding Fund (c) (i) | 10,161 | |||||||||
| TOTAL MUTUAL FUNDS (COST $0) | 10,161 | ||||||||||
| CONVERTIBLE SECURITIES — 0.0% | |||||||||||
| India — 0.0% | |||||||||||
| 3,380,000 | Adani Enterprise, 0.06%, due 01/27/12 | 3,929,250 | |||||||||
| TOTAL CONVERTIBLE SECURITIES (COST $4,148,950) | 3,929,250 | ||||||||||
| SHORT-TERM INVESTMENTS — 3.3% | |||||||||||
| 17,438,850 | Bank of New York Mellon Institutional Cash Reserves Fund (j) | 17,438,850 | |||||||||
| 428,400,000 | Rabobank Time Deposit, 3.15%, due 03/03/08 | 428,400,000 | |||||||||
| TOTAL SHORT-TERM INVESTMENTS (COST $445,838,850) | 445,838,850 | ||||||||||
| TOTAL INVESTMENTS — 99.1% (Cost $10,297,028,988) | 13,393,218,043 | ||||||||||
| Other Assets and Liabilities (net) — 0.9% | 123,737,290 | ||||||||||
| TOTAL NET ASSETS — 100.0% | $ | 13,516,955,333 | |||||||||
See accompanying notes to the financial statements.
19
GMO Emerging Markets Fund
(A Series of GMO Trust)
Schedule of Investments — (Continued)
February 29, 2008
Additional information on each restricted security is as follows:
| Issuer Description | Acquisition Date | Acquisition Cost | Value as a Percentage of Fund's Net Assets | Value as of February 29, 2008 | |||||||||||||||
| CBAY Systems Ltd | 5/06/03-11/10/05 | $ | — | 0.00 | % | $ | 59,482 | ||||||||||||
| CHP Investors (Multimedia) | 3/05/01 | 18,178,923 | 0.22 | % | 29,356,596 | ||||||||||||||
| Divot Holdings NV, Convertible Securities-Class F | 3/27/02 | 46,624 | 0.00 | % | 466 | ||||||||||||||
| Divot Holdings NV, Private Equity Securities-Class D | 6/26/00 | 1,502,100 | 0.00 | % | 900 | ||||||||||||||
| Divot Holdings NV, Private Equity Securities-Class E | 9/21/01 | 124,330 | 0.00 | % | 1,243 | ||||||||||||||
| Fire Capital Mauritius Private Fund | 9/06/06-1/18/08 | 10,341,817 | 0.07 | % | 9,021,539 | ||||||||||||||
| Martin Currie China A Share Fund Ltd | 1/20/06 | 2,710,928 | 0.11 | % | 14,335,519 | ||||||||||||||
| MHP Investors (Tri Media Holdings Ltd) | 5/01/05 | 27,983,521 | 0.42 | % | 57,335,486 | ||||||||||||||
| Millenium Information Technology | 10/21/99 | 2,252,570 | 0.01 | % | 787,470 | ||||||||||||||
| NCH Eagle Fund LP | 1/08/03 | 9,500,000 | 0.21 | % | 28,534,200 | ||||||||||||||
| Societe Generale Thalmann Ukraine Fund | 7/15/97 | 199,943 | 0.00 | % | 4,000 | ||||||||||||||
| SPG Infinity Technology Fund I | 12/23/99 | 62,449 | 0.00 | % | 5,583 | ||||||||||||||
| Steep Rock Russia Fund LP | 12/22/06 | 2,000,000 | 0.01 | % | 1,943,925 | ||||||||||||||
| TDA India Technology Fund II LP | 2/23/00-3/23/04 | 787,800 | 0.02 | % | 2,521,621 | ||||||||||||||
| The Emerging European Fund II LP | 12/05/97-6/24/02 | 1,124,248 | 0.01 | % | 786,278 | ||||||||||||||
| UTI Masterplus 1991 Units (Shares Under Objection) | 11/14/97 | 48 | 0.00 | % | — | ||||||||||||||
| $ | 144,694,308 | ||||||||||||||||||
See accompanying notes to the financial statements.
20
GMO Emerging Markets Fund
(A Series of GMO Trust)
Schedule of Investments — (Continued)
February 29, 2008
Notes to Schedule of Investments:
144A - Securities exempt from registration under Rule 144A of the Securities Act of 1933. These securities may be resold in transactions exempt from registration, normally to qualified institutional investors.
ADR - American Depositary Receipt
Foreign Registered - Shares issued to foreign investors in markets that have foreign ownership limits.
GDR - Global Depository Receipt
NVDR - Non-Voting Depository Receipt
* Non-income producing security.
(a) All or a portion of this security is out on loan (Note 2).
(b) Affiliated company (Note 8).
(c) Security valued at fair value using methods determined in good faith by or at the direction of the Trustees of GMO Trust (Note 2).
(d) Direct placement securities are restricted as to resale.
(e) Bankrupt issuer.
(f) Indexed security in which price and/or coupon is linked to the prices of a specific instrument or financial statistic.
(g) As of February 29, 2008, these rights have been exercised but shares have not yet been credited to the Fund.
(h) Structured warrants with risks similar to equity swaps.
(i) Underlying investment represents interests in defaulted securities.
(j) All or a portion of this security represents investment of security lending collateral (Note 2).
(k) The Fund is committed to additional capital contributions in the amount of $9,696,527 to this investment.
As of February 29, 2008, 60.56% of the Net Assets of the Fund were valued using fair value prices based on models used by a third party vendor (Note 2).
See accompanying notes to the financial statements.
21
GMO Emerging Markets Fund
(A Series of GMO Trust)
Statement of Assets and Liabilities — February 29, 2008
| Assets: | |||||||
| Investments in unaffiliated issuers, at value, including securities on loan of $16,225,724 (cost $10,182,797,395) (Note 2) | $ | 13,248,537,336 | |||||
| Investments in affiliated issuers, at value (cost $114,231,593) (Notes 2 and 8) | 144,680,707 | ||||||
| Cash | 63,995 | ||||||
| Foreign currency, at value (cost $86,494,575) (Note 2) | 86,313,929 | ||||||
| Receivable for investments sold | 95,492,282 | ||||||
| Receivable for Fund shares sold | 52,211,918 | ||||||
| Dividends and interest receivable | 45,532,431 | ||||||
| Foreign taxes receivable | 2,070,758 | ||||||
| Receivable for expenses reimbursed by Manager (Note 3) | 50,199 | ||||||
| Total assets | 13,674,953,555 | ||||||
| Liabilities: | |||||||
| Collateral on securities loaned, at value (Note 2) | 17,438,850 | ||||||
| Payable for investments purchased | 70,786,759 | ||||||
| Payable for Fund shares repurchased | 51,965,953 | ||||||
| Payable to affiliate for (Note 3): | |||||||
| Management fee | 8,530,589 | ||||||
| Shareholder service fee | 978,532 | ||||||
| Trustees and Chief Compliance Officer of GMO Trust fees | 16,853 | ||||||
| Accrued expenses | 8,280,686 | ||||||
| Total liabilities | 157,998,222 | ||||||
| Net assets | $ | 13,516,955,333 | |||||
See accompanying notes to the financial statements.
22
GMO Emerging Markets Fund
(A Series of GMO Trust)
Statement of Assets and Liabilities — February 29, 2008 — (Continued)
| Net assets consist of: | |||||||
| Paid-in capital | $ | 8,834,010,948 | |||||
| Distributions in excess of net investment income | (89,222,065 | ) | |||||
| Accumulated net realized gain | 1,675,668,963 | ||||||
| Net unrealized appreciation | 3,096,497,487 | ||||||
| $ | 13,516,955,333 | ||||||
| Net assets attributable to: | |||||||
| Class III shares | $ | 3,402,343,405 | |||||
| Class IV shares | $ | 3,021,318,725 | |||||
| Class V shares | $ | 1,190,886,765 | |||||
| Class VI shares | $ | 5,902,406,438 | |||||
| Shares outstanding: | |||||||
| Class III | 166,148,951 | ||||||
| Class IV | 148,097,253 | ||||||
| Class V | 58,409,062 | ||||||
| Class VI | 289,117,768 | ||||||
| Net asset value per share: | |||||||
| Class III | $ | 20.48 | |||||
| Class IV | $ | 20.40 | |||||
| Class V | $ | 20.39 | |||||
| Class VI | $ | 20.42 | |||||
See accompanying notes to the financial statements.
23
GMO Emerging Markets Fund
(A Series of GMO Trust)
Statement of Operations — Year Ended February 29, 2008
| Investment Income: | |||||||
| Dividends (net of withholding taxes of $39,932,639) | $ | 281,773,024 | |||||
| Interest | 9,874,710 | ||||||
| Dividends from affiliated issuers (Note 8) | 2,359,355 | ||||||
| Securities lending income | 203,917 | ||||||
| Total investment income | 294,211,006 | ||||||
| Expenses: | |||||||
| Management fee (Note 3) | 115,289,453 | ||||||
| Shareholder service fee – Class III (Note 3) | 6,183,843 | ||||||
| Shareholder service fee – Class IV (Note 3) | 3,374,485 | ||||||
| Shareholder service fee – Class V (Note 3) | 835,934 | ||||||
| Shareholder service fee – Class VI (Note 3) | 3,252,401 | ||||||
| Custodian and fund accounting agent fees | 18,453,904 | ||||||
| Transfer agent fees | 63,698 | ||||||
| Audit and tax fees | 721,821 | ||||||
| Legal fees | 412,213 | ||||||
| Trustees fees and related expenses (Note 3) | 154,957 | ||||||
| Registration fees | 38,143 | ||||||
| Miscellaneous | 171,950 | ||||||
| Total expenses | 148,952,802 | ||||||
| Fees and expenses reimbursed by Manager (Note 3) | (644,613 | ) | |||||
| Expense reductions (Note 2) | (66,795 | ) | |||||
| Net expenses | 148,241,394 | ||||||
| Net investment income (loss) | 145,969,612 | ||||||
| Realized and unrealized gain (loss): | |||||||
| Net realized gain (loss) on: | |||||||
| Investments in unaffiliated issuers (net of foreign capital gains tax of $4,298,031) (Note 2) | 4,111,684,769 | ||||||
| Investments in affiliated issuers | 39,869,031 | ||||||
| Realized gains distributions from affiliated issuers (Note 8) | 52,305 | ||||||
| Written options | 1,514,966 | ||||||
| Foreign currency, forward contracts and foreign currency related transactions (net of CPMF tax of $291,328) (Note2) | (6,618,160 | ) | |||||
| Net realized gain (loss) | 4,146,502,911 | ||||||
| Change in net unrealized appreciation (depreciation) on: | |||||||
| Investments in unaffiliated issuers (net of change in foreign capital gains tax accrual of ($100,262)) (Note 2) | (775,250,798 | ) | |||||
| Investments in affiliated issuers | (12,173,003 | ) | |||||
| Written options | (1,365,146 | ) | |||||
| Foreign currency, forward contracts and foreign currency related transactions | 546,653 | ||||||
| Net unrealized gain (loss) | (788,242,294 | ) | |||||
| Net realized and unrealized gain (loss) | 3,358,260,617 | ||||||
| Net increase (decrease) in net assets resulting from operations | $ | 3,504,230,229 | |||||
See accompanying notes to the financial statements.
24
GMO Emerging Markets Fund
(A Series of GMO Trust)
Statement of Changes in Net Assets
| Year Ended February 29, 2008 | Year Ended February 28, 2007 | ||||||||||
| Increase (decrease) in net assets: | |||||||||||
| Operations: | |||||||||||
| Net investment income (loss) | $ | 145,969,612 | $ | 232,232,829 | |||||||
| Net realized gain (loss) | 4,146,502,911 | 2,466,047,655 | |||||||||
| Change in net unrealized appreciation (depreciation) | (788,242,294 | ) | (767,827,160 | ) | |||||||
| Net increase (decrease) in net assets from operations | 3,504,230,229 | 1,930,453,324 | |||||||||
| Distributions to shareholders from: | |||||||||||
| Net investment income | |||||||||||
| Class III | (48,626,770 | ) | (105,664,375 | ) | |||||||
| Class IV | (42,295,439 | ) | (68,374,071 | ) | |||||||
| Class V | (15,014,450 | ) | (29,926,264 | ) | |||||||
| Class VI | (80,326,387 | ) | (93,772,150 | ) | |||||||
| Total distributions from net investment income | (186,263,046 | ) | (297,736,860 | ) | |||||||
| Net realized gains | |||||||||||
| Class III | (949,235,421 | ) | (908,095,602 | ) | |||||||
| Class IV | (772,927,597 | ) | (590,804,170 | ) | |||||||
| Class V | (267,663,344 | ) | (258,528,323 | ) | |||||||
| Class VI | (1,418,555,036 | ) | (746,269,681 | ) | |||||||
| Total distributions from net realized gains | (3,408,381,398 | ) | (2,503,697,776 | ) | |||||||
| (3,594,644,444 | ) | (2,801,434,636 | ) | ||||||||
| Net share transactions (Note 7): | |||||||||||
| Class III | (1,040,843,043 | ) | (220,757,037 | ) | |||||||
| Class IV | 486,322,877 | (274,126,590 | ) | ||||||||
| Class V | 616,982,566 | (689,231,191 | ) | ||||||||
| Class VI | 853,624,667 | 2,195,109,702 | |||||||||
| Increase (decrease) in net assets resulting from net share transactions | 916,087,067 | 1,010,994,884 | |||||||||
See accompanying notes to the financial statements.
25
GMO Emerging Markets Fund
(A Series of GMO Trust)
Statement of Changes in Net Assets — (Continued)
| Year Ended February 29, 2008 | Year Ended February 28, 2007 | ||||||||||
| Purchase premiums and redemption fees (Notes 2 and 7): | |||||||||||
| Class III | $ | 6,256,642 | $ | 3,421,946 | |||||||
| Class IV | 3,200,572 | 3,362,504 | |||||||||
| Class V | 2,262,707 | 1,945,943 | |||||||||
| Class VI | 7,226,204 | 3,682,255 | |||||||||
| Increase in net assets resulting from purchase premiums and redemption fees | 18,946,125 | 12,412,648 | |||||||||
| Total increase (decrease) in net assets resulting from net share transactions, purchase premiums and redemption fees | 935,033,192 | 1,023,407,532 | |||||||||
| Total increase (decrease) in net assets | 844,618,977 | 152,426,220 | |||||||||
| Net assets: | |||||||||||
| Beginning of period | 12,672,336,356 | 12,519,910,136 | |||||||||
| End of period (including distributions in excess of net investment income of $89,222,065 and $68,376,637, respectively) | $ | 13,516,955,333 | $ | 12,672,336,356 | |||||||
See accompanying notes to the financial statements.
26
GMO Emerging Markets Fund
(A Series of GMO Trust)
Financial Highlights
(For a Class III share outstanding throughout each period)
| Year Ended February 28/29, | |||||||||||||||||||||||
| 2008 | 2007 | 2006 | 2005 | 2004 | |||||||||||||||||||
| Net asset value, beginning of period | $ | 20.67 | $ | 22.49 | $ | 19.05 | $ | 15.78 | $ | 8.82 | |||||||||||||
| Income (loss) from investment operations: | |||||||||||||||||||||||
| Net investment income (loss)† | 0.25 | 0.41 | 0.37 | 0.34 | 0.23 | ||||||||||||||||||
| Net realized and unrealized gain (loss) | 5.94 | 3.00 | 6.24 | 4.40 | 6.97 | ||||||||||||||||||
| Total from investment operations | 6.19 | 3.41 | 6.61 | 4.74 | 7.20 | ||||||||||||||||||
| Less distributions to shareholders: | |||||||||||||||||||||||
| From net investment income | (0.31 | ) | (0.54 | ) | (0.43 | ) | (0.32 | ) | (0.24 | ) | |||||||||||||
| From net realized gains | (6.07 | ) | (4.69 | ) | (2.74 | ) | (1.15 | ) | — | ||||||||||||||
| Total distributions | (6.38 | ) | (5.23 | ) | (3.17 | ) | (1.47 | ) | (0.24 | ) | |||||||||||||
| Net asset value, end of period | $ | 20.48 | $ | 20.67 | $ | 22.49 | $ | 19.05 | $ | 15.78 | |||||||||||||
| Total Return(a) | 28.38 | % | 17.05 | % | 37.99 | % | 31.45 | % | 82.10 | % | |||||||||||||
| Ratios/Supplemental Data: | |||||||||||||||||||||||
| Net assets, end of period (000's) | $ | 3,402,343 | $ | 4,276,782 | $ | 4,788,395 | $ | 4,433,098 | $ | 4,079,172 | |||||||||||||
| Net expenses to average daily net assets | 1.09 | %(b) | 1.07 | % | 1.10 | % | 1.11 | % | 1.12 | % | |||||||||||||
| Net investment income to average daily net assets | 1.04 | % | 1.87 | % | 1.88 | % | 2.17 | % | 1.85 | % | |||||||||||||
| Portfolio turnover rate | 60 | % | 44 | % | 41 | % | 57 | % | 46 | % | |||||||||||||
| Fees and expenses reimbursed by the Manager to average daily net assets: | 0.00 | %(c) | 0.01 | % | 0.01 | % | 0.01 | % | 0.02 | % | |||||||||||||
| Purchase premiums and redemption fees consisted of the following per share amounts:† | $ | 0.04 | $ | 0.02 | $ | 0.01 | $ | 0.01 | $ | 0.06 | |||||||||||||
(a) The total returns would have been lower had certain expenses not been reimbursed during the periods shown and assumes the effect of reinvested distributions. Calculation excludes purchase premiums and redemption fees which are borne by the shareholder.
(b) The net expense ratio does not include the effect of expense reductions.
(c) Ratio is less than 0.01%.
† Calculated using average shares outstanding throughout the period.
See accompanying notes to the financial statements
27
GMO Emerging Markets Fund
(A Series of GMO Trust)
Financial Highlights
(For a Class IV share outstanding throughout each period)
| Year Ended February 28/29, | |||||||||||||||||||||||
| 2008 | 2007 | 2006 | 2005 | 2004 | |||||||||||||||||||
| Net asset value, beginning of period | $ | 20.62 | $ | 22.45 | $ | 19.02 | $ | 15.75 | $ | 8.81 | |||||||||||||
| Income (loss) from investment operations: | |||||||||||||||||||||||
| Net investment income (loss)† | 0.23 | 0.42 | 0.40 | 0.34 | 0.24 | ||||||||||||||||||
| Net realized and unrealized gain (loss) | 5.95 | 2.99 | 6.20 | 4.41 | 6.94 | ||||||||||||||||||
| Total from investment operations | 6.18 | 3.41 | 6.60 | 4.75 | 7.18 | ||||||||||||||||||
| Less distributions to shareholders: | |||||||||||||||||||||||
| From net investment income | (0.33 | ) | (0.55 | ) | (0.43 | ) | (0.33 | ) | (0.24 | ) | |||||||||||||
| From net realized gains | (6.07 | ) | (4.69 | ) | (2.74 | ) | (1.15 | ) | — | ||||||||||||||
| Total distributions | (6.40 | ) | (5.24 | ) | (3.17 | ) | (1.48 | ) | (0.24 | ) | |||||||||||||
| Net asset value, end of period | $ | 20.40 | $ | 20.62 | $ | 22.45 | $ | 19.02 | $ | 15.75 | |||||||||||||
| Total Return(a) | 28.38 | % | 17.10 | % | 38.05 | % | 31.59 | % | 81.97 | % | |||||||||||||
| Ratios/Supplemental Data: | |||||||||||||||||||||||
| Net assets, end of period (000's) | $ | 3,021,319 | $ | 2,599,002 | $ | 3,081,021 | $ | 3,255,865 | $ | 1,799,736 | |||||||||||||
| Net expenses to average daily net assets | 1.05 | %(b) | 1.03 | % | 1.05 | % | 1.06 | % | 1.08 | % | |||||||||||||
| Net investment income to average daily net assets | 0.98 | % | 1.94 | % | 2.03 | % | 2.13 | % | 2.05 | % | |||||||||||||
| Portfolio turnover rate | 60 | % | 44 | % | 41 | % | 57 | % | 46 | % | |||||||||||||
| Fees and expenses reimbursed by the Manager to average daily net assets: | 0.00 | %(c) | 0.01 | % | 0.01 | % | 0.01 | % | 0.02 | % | |||||||||||||
| Purchase premiums and redemption fees consisted of the following per share amounts:† | $ | 0.02 | $ | 0.02 | $ | 0.01 | $ | 0.00 | (d) | $ | 0.05 | ||||||||||||
(a) The total returns would have been lower had certain expenses not been reimbursed during the periods shown and assumes the effect of reinvested distributions. Calculation excludes purchase premiums and redemption fees which are borne by the shareholder.
(b) The net expense ratio does not include the effect of expense reductions.
(c) Ratio is less than 0.01%.
(d) Purchase premiums and redemption fees were less than $0.01 per share.
† Calculated using average shares outstanding throughout the period.
See accompanying notes to the financial statements
28
This page has been left blank intentionally.
29
GMO Emerging Markets Fund
(A Series of GMO Trust)
Financial Highlights
(For a Class V share outstanding throughout each period)
| Year Ended February 28/29, | |||||||||||||||
| 2008 | 2007 | 2006 | |||||||||||||
| Net asset value, beginning of period | $ | 20.61 | $ | 22.44 | $ | 19.02 | |||||||||
| Income (loss) from investment operations: | |||||||||||||||
| Net investment income (loss)† | 0.23 | 0.43 | 0.22 | ||||||||||||
| Net realized and unrealized gain (loss) | 5.96 | 2.98 | 6.39 | ||||||||||||
| Total from investment operations | 6.19 | 3.41 | 6.61 | ||||||||||||
| Less distributions to shareholders: | |||||||||||||||
| From net investment income | (0.34 | ) | (0.55 | ) | (0.45 | ) | |||||||||
| From net realized gains | (6.07 | ) | (4.69 | ) | (2.74 | ) | |||||||||
| Total distributions | (6.41 | ) | (5.24 | ) | (3.19 | ) | |||||||||
| Net asset value, end of period | $ | 20.39 | $ | 20.61 | $ | 22.44 | |||||||||
| Total Return(c) | 28.43 | % | 17.11 | % | 38.12 | % | |||||||||
| Ratios/Supplemental Data: | |||||||||||||||
| Net assets, end of period (000's) | $ | 1,190,887 | $ | 679,988 | $ | 1,447,059 | |||||||||
| Net expenses to average daily net assets | 1.03 | %(d) | 1.01 | % | 1.04 | % | |||||||||
| Net investment income to average daily net assets | 0.98 | % | 1.97 | % | 1.06 | % | |||||||||
| Portfolio turnover rate | 60 | % | 44 | % | 41 | % | |||||||||
| Fees and expenses reimbursed by the Manager to average daily net assets: | 0.00 | %(f) | 0.01 | % | 0.01 | % | |||||||||
| Purchase premiums and redemption fees consisted of the following per share amounts:† | $ | 0.05 | $ | 0.03 | $ | 0.02 | |||||||||
(a) The class was inactive from October 27, 2004 to February 11, 2005.
(b) Distributions from net realized gains were less than $0.01 per share.
(c) The total returns would have been lower had certain expenses not been reimbursed during the periods shown and assumes the effect of
reinvested distributions. Calculation excludes purchase premiums and redemption fees which are borne by the shareholder.
(d) The net expense ratio does not include the effect of expense reductions.
(e) The ratio for the period has not been annualized since the Fund believes it would not be appropriate because the Fund's dividend income is
not earned ratably throughout the fiscal year.
(f) Ratio is less than 0.01%.
† Calculated using average shares outstanding throughout the period.
* Annualized.
** Not annualized.
*** Calculation represents portfolio turnover of the Fund for the year ended February 28, 2005.
**** Calculation represents portfolio turnover of the Fund for the year ended February 29, 2004.
See accompanying notes to the financial statements.
30
GMO Emerging Markets Fund
(A Series of GMO Trust)
Financial Highlights — (Continued)
(For a Class V share outstanding throughout each period)
| Period from February 11, 2005 (commencement of operations) through | Period from March 1, 2004 through | Period from August 4, 2003 (commencement of operations) through | |||||||||||||
| February 28, 2005(a) | October 26, 2004(a) | February 29, 2004 | |||||||||||||
| Net asset value, beginning of period | $ | 17.88 | $ | 15.77 | $ | 10.81 | |||||||||
| Income (loss) from investment operations: | |||||||||||||||
| Net investment income (loss)† | (0.01 | ) | 0.25 | 0.13 | |||||||||||
| Net realized and unrealized gain (loss) | 1.15 | (0.09 | ) | 5.02 | |||||||||||
| Total from investment operations | 1.14 | 0.16 | 5.15 | ||||||||||||
| Less distributions to shareholders: | |||||||||||||||
| From net investment income | — | (0.07 | ) | (0.19 | ) | ||||||||||
| From net realized gains | — | (0.00 | )(b) | — | |||||||||||
| Total distributions | — | (0.07 | ) | (0.19 | ) | ||||||||||
| Net asset value, end of period | $ | 19.02 | $ | 15.86 | $ | 15.77 | |||||||||
| Total Return(c) | 6.38 | %** | 1.10 | %** | 47.82 | %** | |||||||||
| Ratios/Supplemental Data: | |||||||||||||||
| Net assets, end of period (000's) | $ | 38,564 | $ | 116,417 | $ | 382,193 | |||||||||
| Net expenses to average daily net assets | 1.03 | %* | 1.05 | %* | 1.07 | %* | |||||||||
| Net investment income to average daily net assets | (0.05 | )%(e)** | 1.70 | %(e)** | 1.69 | %* | |||||||||
| Portfolio turnover rate | 57 | %*** | 57 | %*** | 46 | %**** | |||||||||
| Fees and expenses reimbursed by the Manager to average daily net assets: | 0.02 | %* | 0.01 | %* | 0.02 | %* | |||||||||
| Purchase premiums and redemption fees consisted of the following per share amounts:† | — | — | $ | 0.03 | |||||||||||
See accompanying notes to the financial statements.
31
GMO Emerging Markets Fund
(A Series of GMO Trust)
Financial Highlights
(For a Class VI share outstanding throughout each period)
| Year Ended February 28/29, | |||||||||||||||||||||||
| 2008 | 2007 | 2006 | 2005 | 2004(a) | |||||||||||||||||||
| Net asset value, beginning of period | $ | 20.63 | $ | 22.45 | $ | 19.03 | $ | 15.76 | $ | 10.45 | |||||||||||||
| Income (loss) from investment operations: | |||||||||||||||||||||||
| Net investment income (loss)† | 0.25 | 0.42 | 0.38 | 0.34 | 0.14 | ||||||||||||||||||
| Net realized and unrealized gain (loss) | 5.95 | 3.01 | 6.23 | 4.41 | 5.42 | ||||||||||||||||||
| Total from investment operations | 6.20 | 3.43 | 6.61 | 4.75 | 5.56 | ||||||||||||||||||
| Less distributions to shareholders: | |||||||||||||||||||||||
| From net investment income | (0.34 | ) | (0.56 | ) | (0.45 | ) | (0.33 | ) | (0.25 | ) | |||||||||||||
| From net realized gains | (6.07 | ) | (4.69 | ) | (2.74 | ) | (1.15 | ) | — | ||||||||||||||
| Total distributions | (6.41 | ) | (5.25 | ) | (3.19 | ) | (1.48 | ) | (0.25 | ) | |||||||||||||
| Net asset value, end of period | $ | 20.42 | $ | 20.63 | $ | 22.45 | $ | 19.03 | $ | 15.76 | |||||||||||||
| Total Return(b) | 28.49 | % | 17.20 | % | 38.07 | % | 31.63 | % | 53.62 | %** | |||||||||||||
| Ratios/Supplemental Data: | |||||||||||||||||||||||
| Net assets, end of period (000's) | $ | 5,902,406 | $ | 5,116,565 | $ | 3,203,435 | $ | 2,083,376 | $ | 879,837 | |||||||||||||
| Net expenses to average daily net assets | 1.00 | %(c) | 0.98 | % | 1.00 | % | 1.01 | % | 1.04 | %* | |||||||||||||
| Net investment income to average daily net assets | 1.05 | % | 1.93 | % | 1.94 | % | 2.15 | % | 1.54 | %* | |||||||||||||
| Portfolio turnover rate | 60 | % | 44 | % | 41 | % | 57 | % | 46 | %*** | |||||||||||||
| Fees and expenses reimbursed by the Manager to average daily net assets: | 0.00 | %(d) | 0.01 | % | 0.01 | % | 0.01 | % | 0.02 | %* | |||||||||||||
| Purchase premiums and redemption fees consisted of the following per share amounts:† | $ | 0.03 | $ | 0.02 | $ | 0.02 | $ | 0.03 | $ | 0.04 | |||||||||||||
(a) Period from June 30, 2003 (commencement of operations) through February 29, 2004.
(b) The total returns would have been lower had certain expenses not been reimbursed during the
periods shown and assumes the effect of reinvested distributions. Calculation excludes purchase premiums and redemption fees which are borne by the shareholder.
(c) The net expense ratio does not include the effect of expense reductions.
(d) Ratio is less than 0.01%.
† Calculated using average shares outstanding throughout the period.
* Annualized.
** Not annualized.
*** Calculation represents portfolio turnover of the Fund for the year ended February 29, 2004.
See accompanying notes to the financial statements
32
GMO Emerging Markets Fund
(A Series of GMO Trust)
Notes to Financial Statements
February 29, 2008
1 Organization
GMO Emerging Markets Fund (the "Fund") is a series of GMO Trust (the "Trust"). The Fund is registered under the Investment Company Act of 1940, as amended, as an open-end, non-diversified management investment company. The Fund is advised and managed by Grantham, Mayo, Van Otterloo & Co. LLC (the "Manager" or "GMO"). The Trust was established as a Massachusetts business trust under the laws of the Commonwealth of Massachusetts on June 24, 1985. The Declaration of Trust permits the Trustees of the Trust ("Trustees") to create an unlimited number of series of shares ("Funds") and to subdivide Funds into classes.
The Fund seeks high total return. The Fund seeks to achieve its investment objective by outperforming the S&P/IFCI (Investable) Composite Index. The Fund typically makes equity investments in companies whose stocks are traded in the securities markets of the world's non-developed markets, which excludes countries that are included in the MSCI EAFE Index.
Throughout the year ended February 29, 2008, the Fund had four classes of shares outstanding: Class III, Class IV, Class V and Class VI. Each class of shares bears a different level of shareholder service fees.
The financial statements of the series of the Trust in which the Fund invests ("underlying funds") should be read in conjunction with the Fund's financial statements. These financial statements are available, without charge, upon request, by calling (617) 346-7646 (collect). Shares of GMO Special Purpose Holding Fund are not publicly available for direct purchase.
The Fund currently limits subscriptions due to capacity considerations.
2. Significant accounting policies
The following is a summary of significant accounting policies which are in conformity with accounting principles generally accepted in the United States of America ("U.S. GAAP") and which are consistently followed by the Fund in the preparation of its financial statements. The preparation of financial statements in accordance with U.S. GAAP requires management to make estimates and assumptions that affect the reported amounts and disclosures in the financial statements. Actual results could differ from those estimates. The accounting records of the Fund are maintained in U.S. dollars.
Portfolio valuation
Securities listed on a securities exchange for which market quotations are readily available are valued at the last sale price or official closing price on each business day, or if there is no such reported sale or official closing price, at the most recent quoted bid price. Unlisted securities for which market quotations are readily available are generally valued at the most recent quoted bid price. Short-term investments with a remaining maturity of sixty days or less are generally valued at amortized cost, which approximates fair
33
GMO Emerging Markets Fund
(A Series of GMO Trust)
Notes to Financial Statements — (Continued)
February 29, 2008
value. Shares of investment funds are valued at their net asset value. Securities for which quotations are not readily available or whose values the Manager has determined to be unreliable are valued at fair value as determined in good faith by the Trustees or other persons acting at their direction pursuant to procedures approved by the Trustees. By its nature, a fair value price is a good faith estimate of the value of a security at a given point in time and may not reflect the value that would be realized if the security was sold and the differences could be material. Because many foreign equity securities markets and exchanges close prior to the close of the New York Stock Exchange ("NYSE"), closing prices for foreign securities in those markets or on those exchanges do not reflect the events that occur after that close but before the close of the NYSE. As a result, foreign equity securities are generally valued using fair v alue prices supplied by a third party vendor based on models to the extent that these fair value prices are available.
Indian regulators have alleged that the Fund violated certain conditions under which it was granted permission to operate in India and have restricted a portion of the Fund's locally held assets pending resolution of the dispute. The amount of these restricted assets represents less than 0.1% of the Fund's net assets as of February 29, 2008. The valuation of this possible claim and all matters relating to the Fund's response to these allegations are subject to supervision and control of the Trustees, and all costs in respect of this matter are being borne by the Fund.
GMO Special Purpose Holding Fund ("SPHF"), an investment of the Fund, has litigation pending against various entities related to the default of certain asset-backed securities previously held by SPHF. For the year ended February 29, 2008, the Fund received $52,305 through SPHF in conjunction with settlement agreements related to the default of those securities.
Foreign currency translation
The market values of foreign securities, currency holdings and other assets and liabilities are translated to U.S. dollars based on the current exchange rates each business day. Income and expenses denominated in foreign currencies are translated at current exchange rates when accrued or incurred. The Fund does not isolate realized and unrealized gains and losses attributable to changes in exchange rates from gains and losses that arise from changes in the market value of investments. Such fluctuations are included with net realized and unrealized gain or loss on investments. Net realized gains and losses on foreign currency transactions represent gains and losses on disposition of currencies and forward currency contracts, currency gains and losses realized between the trade and settlement dates on securities transactions, and the difference between the amount of investment income and foreign withholding taxes recorded on the F und's accounting records and the U.S. dollar equivalent amounts actually received or paid.
Forward currency contracts
The Fund may enter into forward currency contracts including forward cross currency contracts. A forward currency contract is an agreement between two parties to buy and sell a currency at a set price on a future date. The market value of a forward currency contract fluctuates with changes in forward currency
34
GMO Emerging Markets Fund
(A Series of GMO Trust)
Notes to Financial Statements — (Continued)
February 29, 2008
exchange rates. Forward currency contracts are marked to market daily using rates supplied by a quotation service and changes in value are recorded by the Fund as an unrealized gain or loss. Realized gains or losses equal to the difference between the value of the contract at the time it was opened and the value at the time it was closed are recorded upon delivery or receipt of the currency or, if a forward currency contract is offset by entering into another forward currency contract with the same broker, upon settlement of the net gain or loss. These contracts may involve market risk in excess of the unrealized gain or loss reflected in the Fund's Statement of Assets and Liabilities. In addition, the Fund could be exposed to risk if the counterparties are unable to meet the terms of the contracts or if there are movements in currency values that are unfavorable to the Fund. There were no forward currency contracts outstanding at the end of the period.
Futures contracts
The Fund may purchase and sell futures contracts. Upon entering into a futures contract, the Fund is required to deposit with the futures clearing broker an amount of cash, U.S. government and agency obligations, or other liquid assets in accordance with the initial margin requirements of the broker or exchange. In addition, the Fund maintains cash or securities in an amount that at least equals the net amount payable in the event the Fund must deliver the full amount of the contracts. Futures contracts are marked to market daily and an appropriate payable or receivable for the change in value ("variation margin") is recorded by the Fund. The payable or receivable is liquidated on the following business day. Gains or losses are recognized but not considered realized until the contracts expire or are closed. Futures contracts involve, to varying degrees, risk of loss in excess of the variation margin disclosed in the Statement of Assets and Liabilities. Under certain circumstances, futures exchanges may establish daily limits on the amount that the price of a futures contract can vary from the previous day's settlement price, thereby effectively preventing liquidation of unfavorable positions. Losses may arise from changes in the value of the underlying instrument if the Fund is unable to liquidate a futures position due to an illiquid secondary market for the contracts or the imposition of price limits, or if counterparties do not perform under the contract terms. Futures contracts are generally valued at the settlement price established each day by the board of trade or exchange on which they are traded. There were no futures contracts outstanding at the end of the period.
Options
The Fund may write call and put options. Writing options increases the Fund's exposure to the underlying instrument by, in the case of a call option, obligating the Fund to sell the underlying instrument at a set price to the option-holder and, in the case of a put option, obligating the Fund to purchase the underlying instrument at a set price from the option-holder. When the Fund writes a call or put option, an amount equal to the premium received is recorded as a liability and subsequently marked to market to reflect the current value of the option written. Premiums received from writing options which expire are treated as realized gains. Premiums received from writing options which are exercised or closed are added to the proceeds or offset against the amounts paid on the underlying future, security or currency transaction to determine the realized gain or loss. The Fund as a writer of an option has no control over whether t he
35
GMO Emerging Markets Fund
(A Series of GMO Trust)
Notes to Financial Statements — (Continued)
February 29, 2008
underlying future, security or currency may be sold (call) or purchased (put) and as a result bears the market risk of an unfavorable change in the price of the future, security or currency underlying the written option. In the event that the Fund writes uncovered call options (i.e. options for investments that the Fund does not own), it bears the risk of incurring substantial losses if the price of the underlying instrument increases during the term of the option. There is the risk the Fund may not be able to enter into a closing transaction because of an illiquid market. There were no open written option contracts at the end of the period.
For the year ended February 29, 2008, the Fund's investment activity in written options contracts was as follows:
| Principal Amount of Contracts | Premiums | ||||||||||
| Outstanding, beginning of period | $ | (23,523,993 | ) | $ | (1,514,966 | ) | |||||
| Options written | — | — | |||||||||
| Options exercised | — | — | |||||||||
| Options expired | 23,523,993 | 1,514,966 | |||||||||
| Options sold | — | — | |||||||||
| Outstanding, end of period | $ | — | $ | — | |||||||
The Fund may also purchase put and call options. Purchasing options alters the Fund's exposure to the underlying instrument by, in the case of a call option, entitling the Fund to purchase the underlying instrument at a set price from the writer of the option and, in the case of a put option, entitling the Fund to sell the underlying instrument at a set price to the writer of the option. The Fund pays a premium as a cost for a purchased option disclosed in the Schedule of Investments which is subsequently marked to market to reflect the current value of the option. Premiums paid for purchasing options which expire are treated as realized losses. Premiums paid for purchasing options which are exercised or closed are added to the amounts paid or offset against the proceeds on the closing transaction to determine the realized gain or loss. The risk associated with purchasing put and call options is limited to the premium paid. Ther e were no purchased option contracts outstanding at the end of the period.
Exchange traded options are valued at the last sale price, or if no sale is reported, the last bid price for purchased options and the last ask price for written options. Options traded over-the-counter are valued using prices supplied by a primary pricing source chosen by the Manager.
Indexed securities
The Fund may invest in indexed securities where the redemption values and/or coupons are linked to the prices of a specific instrument or financial statistic. The Fund uses indexed securities to increase or decrease its exposure to different underlying instruments and to gain exposure to markets in which it may
36
GMO Emerging Markets Fund
(A Series of GMO Trust)
Notes to Financial Statements — (Continued)
February 29, 2008
be difficult to invest through conventional securities. Indexed securities may be more volatile than their underlying instruments, but any loss is limited to the amount of the original investment. Indexed securities held by the Fund at the end of the period are listed in the Fund's Schedule of Investments.
Swap agreements
The Fund may enter into swap agreements. A swap is an agreement to exchange the return generated by one instrument for the return generated by another instrument. Interest rate swap agreements involve the exchange by one party with another party of their respective commitments to pay or receive interest, e.g., an exchange of floating rate payments for fixed rate payments with respect to a notional amount of principal. Total return swap agreements involve a commitment by one party in the agreement to pay interest in exchange for a market-linked return, both based on notional amounts. To the extent the total return of the security or index underlying the transaction exceeds or falls short of the offsetting interest rate obligation, the party will receive a payment from or make a payment to the counterparty, respectively. Forward spread lock swap agreements involve commitments to pay or receive a settlement amount calculated as the difference between the swap spread and a fixed spread, multiplied by the notional amount times the duration of the swap rate. The swap spread is the difference between the benchmark swap rate (market rate) and the specific treasury rate. Variance swap agreements involve commitments to pay or receive a settlement amount calculated as the difference between the annualized realized variance of returns on the underlying price and a fixed quantity, also known as the variance strike, over a period of time. In connection with these agreements, cash or securities may be set aside as collateral by the Fund's custodian or brokers in accordance with the terms of the swap agreement. The Fund earns or pays interest on cash set aside as collateral.
Swaps are marked to market daily using models that incorporate quotations from market makers and the change in value, if any, is recorded as unrealized gain or loss in the Statement of Operations. Payments received or made on swap contracts are recorded as realized gain or loss in the Statement of Operations. Gains or losses are realized upon early termination of the swap agreements. These financial instruments are not actively traded on financial markets. The values assigned to these instruments are based upon the best available information and because of the uncertainty of the valuation, these values may differ significantly from the values that would have been realized had a ready market for these instruments existed, and the differences could be material. Entering into these agreements involves, to varying degrees, elements of credit, legal, market and documentation risk in excess of the amounts recognized in the Statement o f Assets and Liabilities. Such risks involve the possibility that there will be no liquid market for these agreements, that the counterparties to the agreements may default on their obligations to perform or disagree as to the meaning of contractual terms in the agreements, or that there may be unfavorable changes in interest rates or the price of the index or security underlying these transactions. There were no swap agreements outstanding at the end of the period.
37
GMO Emerging Markets Fund
(A Series of GMO Trust)
Notes to Financial Statements — (Continued)
February 29, 2008
Securities lending
The Fund may lend its securities to certain qualified broker-dealers. The loans are collateralized with cash or liquid securities with a market value at least equal to the market value of the securities on loan. As with other extensions of credit, the Fund may bear the risk of loss with respect to the investment of the collateral, the risk of delay in and/or inability to exercise its rights with respect to the collateral, and the risk of delay in recovery or loss of rights in the loaned securities should the borrower of the securities fail financially. If a loan is collateralized by U.S. government securities, the Fund receives a fee from the borrower. If a loan is collateralized by cash, the Fund typically invests the cash collateral for its own account in interest-bearing, short-term securities and pays a fee to the borrower that normally represents a portion of the Fund's earnings on the collateral. As of February 29, 2008, t he Fund had loaned securities valued by the Fund at $16,225,724 collateralized by cash in the amount of $17,438,850, which was invested in the Bank of New York Mellon Institutional Cash Reserves Fund.
Taxes and distributions
The Fund intends to qualify each tax year as a regulated investment company under Subchapter M of the Internal Revenue Code of 1986, as amended (the "Code"). The Fund intends to distribute substantially all of its net investment income and net realized short-term and long-term capital gains, if any, after giving effect to any available capital loss carryovers for U.S. federal income tax purposes. Therefore, no provision for U.S. federal income or excise tax is necessary. Taxes on foreign interest and dividend income are generally withheld in accordance with the applicable country's tax treaty with the United States. The foreign withholding rates applicable to a Fund's investments in certain foreign jurisdictions may be higher if a significant portion of the Fund is held by non-U.S. shareholders.
The Fund's policy is to declare and pay distributions from net investment income, if any, semiannually, and from net realized short-term and long-term capital gains, if any, at least annually. All distributions are paid in shares of the Fund, at net asset value, unless the shareholder elects to receive cash distributions. Distributions to shareholders are recorded by the Fund on the ex-dividend date.
Dividends received by shareholders of the Fund which are derived from foreign source income and foreign taxes paid by the Fund may be treated, to the extent allowable under the Code, as if received and paid by the shareholders of the Fund.
The Fund may be subject to capital gains and repatriation taxes imposed by certain countries in which it invests. For the year ended February 29, 2008, the Fund incurred $4,298,031 in capital gain taxes which is included in net realized gain (loss) in the Statement of Operations.
The Fund is subject to a Contribuição Provisória sobre Movimentações Financiera ("CPMF") tax which is applied to foreign exchange transactions representing capital inflows or outflows to/from the Brazilian market. For the year ended February 29, 2008, the Fund incurred $291,328 in CPMF tax which is included
38
GMO Emerging Markets Fund
(A Series of GMO Trust)
Notes to Financial Statements — (Continued)
February 29, 2008
in the net realized gain (loss) on foreign currency, forward contracts and foreign currency related transactions in the Statement of Operations.
The Fund is currently subject to a Taiwanese security transaction tax of 0.30% of the transaction amount on equities, which must be paid by the Fund upon the sale or transfer of any portfolio securities subject to such tax.
Income and capital gain distributions are determined in accordance with U.S. federal income tax regulations, which may differ from U.S. GAAP. Certain capital accounts in the financial statements are periodically adjusted for permanent differences in order to reflect their tax character. These adjustments have no impact on net assets or net asset value per share. Temporary differences which arise from recognizing certain items of income, expense, gain or loss in different periods for financial statement and tax purposes will reverse at some time in the future. Distributions in excess of net investment income or net realized gains are temporary over distributions for financial statement purposes resulting from differences in the recognition or classification of income or distributions for financial statement and tax purposes.
U.S. GAAP and tax accounting differences primarily relate to foreign currency transactions, losses on wash sale transactions, partnership interest tax allocations, post-October currency losses and passive foreign investment company transactions.
The following reclassification represents the amount necessary to report the stated components of net assets on a tax basis, excluding certain temporary differences, as of February 29, 2008. The financial highlights exclude these adjustments.
| Distributions In Excess Of Net Investment Income | Accumulated Net Realized Gain | Paid-in Capital | |||||||||
| $ | 19,448,006 | $ | (21,180,412 | ) | $ | 1,732,406 | |||||
39
GMO Emerging Markets Fund
(A Series of GMO Trust)
Notes to Financial Statements — (Continued)
February 29, 2008
The tax character of distributions declared to shareholders is as follows:
| 2/29/2008 | 2/28/2007 | ||||||||||
| Ordinary income (including any short-term capital gains) | $ | 563,852,184 | $ | 621,004,317 | |||||||
| Long-term capital gains | 3,030,792,260 | 2,180,430,319 | |||||||||
| Total distributions | $ | 3,594,644,444 | $ | 2,801,434,636 | |||||||
Distributions in excess of tax basis earnings and profits, if significant, are reported in the financial statements as a tax return of capital.
As of February 29, 2008, the components of distributable earnings on a tax basis consisted of the following:
| Undistributed ordinary income | $ | 39,329,362 | |||||
| Undistributed long–term capital gain | $ | 1,676,727,752 | |||||
As of February 29, 2008, the Fund elected to defer to March 1, 2008 post-October currency losses of $12,836,574.
As of February 29, 2008, the approximate cost for U.S. federal income tax purposes and gross and net unrealized appreciation and depreciation in value of investments were as follows:
| Aggregate Cost | Gross Unrealized Appreciation | Gross Unrealized (Depreciation) | Net Unrealized Appreciation (Depreciation) | ||||||||||||
| $ | 10,411,605,151 | $ | 3,446,042,399 | $ | (464,429,507 | ) | $ | 2,981,612,892 | |||||||
Security transactions and related investment income
Security transactions are accounted for on trade date. Dividend income, net of applicable foreign withholding taxes, if any, is recorded on the ex-dividend date, or when the Fund is informed of the ex-dividend date, if later. Interest income is recorded on the accrual basis and is adjusted for the amortization of premiums and accretion of discounts. Interest income on inflation indexed securities, if any, is accrued daily based upon an inflation adjusted principal. Additionally, any increase or decrease in the principal or face amount of the securities adjusted for inflation is recorded as interest income or loss. Income is not recognized on securities for which collection is not expected. Non-cash dividends, if any, are recorded at the fair market value of the securities received. In determining the net gain or loss on securities sold, the cost of securities is determined on the identified cost basis.
40
GMO Emerging Markets Fund
(A Series of GMO Trust)
Notes to Financial Statements — (Continued)
February 29, 2008
Expenses
The majority of expenses of the Trust are directly identifiable to an individual fund. Expenses which are not readily identifiable to a specific fund are allocated taking into consideration, among other things, the nature and type of expense and the relative size of the funds. Investment income, common expenses and realized and unrealized gains and losses are allocated pro rata among the classes of shares of the Fund based on the relative net assets of each class. Shareholder service fees, which are directly attributable to a class of shares, are charged to that class's operations. In addition, the Fund will also incur certain fees and expenses indirectly as a shareholder in the underlying funds. Because the underlying funds have varied expense and fee levels and the Fund may own different proportions of the underlying funds at different times, the amount of fees and expenses indirectly incurred by the Fund will vary (See Note 3 ).
Brown Brothers Harriman & Co. ("BBH") serves as custodian and fund accounting agent of the Fund. State Street Bank and Trust Company ("State Street") serves as transfer agent of the Fund. BBH and State Street's fees may be reduced by credits that are an earnings allowance calculated on the average daily cash balances the Fund maintains with each agent. Credit balances or expense reimbursements used to reduce fees, if any, are reported as a reduction of expenses in the Statement of Operations.
Purchases and redemptions of Fund shares
As of February 29, 2008, the premium on cash purchases and fee on cash redemptions of Fund shares were each 0.80% of the amount invested or redeemed. If the Manager determines that any portion of a cash purchase or redemption is offset by a corresponding cash redemption or purchase occurring on the same day, it will waive the purchase premium or redemption fee in an amount approximately equal to the fee with respect to that portion. In addition, the purchase premium or redemption fee charged by the Fund may be waived in extraordinary circumstances if the Fund will not incur transaction costs. All purchase premiums and redemption fees are paid to and recorded by the Fund as paid-in capital. These fees are allocated relative to each class's net assets on the share transaction date. The Manager will waive the purchase premium relating to the in-kind portion of a purchase transaction except to the extent of certain estimated or know n transaction costs (e.g. stamp duties and transfer taxes) incurred by the Fund in connection with the transfer of the purchasing shareholder's securities to the Fund. In-kind redemption transactions are generally not subject to redemption fees except to the extent those transactions include a cash component. However, when a substantial portion of a Fund is being redeemed, the Fund may assess estimated or known transaction costs. There is no premium for reinvested distributions.
Investment risks
Investments in securities of issuers in emerging countries present certain risks that are not inherent in many other investments. Many emerging countries present elements of political and/or economic instability. The securities markets of emerging countries are generally smaller and less developed than the securities markets of the U.S. and developed foreign markets. Further, countries may impose various types of foreign currency regulations or controls which may impede the Fund's ability to repatriate amounts it receives. The Fund may acquire interests in securities in anticipation of improving conditions in the related
41
GMO Emerging Markets Fund
(A Series of GMO Trust)
Notes to Financial Statements — (Continued)
February 29, 2008
countries. These factors may result in significant volatility in the values of its holdings. The markets in emerging countries are typically less liquid than those of developed markets. Accordingly, the Fund may not be able to realize in an actual sale amounts approximating those used to value its holdings.
Recently issued accounting pronouncements
In June 2006, the Financial Accounting Standards Board ("FASB") issued FASB Interpretation No. 48, Accounting for Uncertainty in Income Taxes – an Interpretation of FASB Statement No. 109 ("FIN 48"). FIN 48 clarifies the accounting for uncertainty in income taxes recognized in accordance with FASB Statement No. 109, Accounting for Income Taxes. FIN 48 prescribes a recognition threshold and measurement attribute for a tax position taken or expected to be taken in the tax return that could impact the Fund's financial statements. It also provides guidance in relation to the Fund's financial statements on classification of tax benefits or liabilities, interest and penalties, accounting in interim periods, disclosure, and transition. FIN 48 is effective for fiscal years beginning after December 15, 2006 for registered investment companies. Management has evaluated the effects of applying the various provisions of FIN 48 and has determined that the adoption of FIN 48 does not have a material effect on the Fund's financial statements. The Fund's federal tax returns for the prior three fiscal years, if applicable, remain subject to examination by the Internal Revenue Service. Management will continue to monitor the rules and guidance pertaining to FIN 48 and will take action if appropriate.
In September 2006, the FASB issued Statement of Financial Accounting Standards No. 157 ("FAS 157"), "Fair Value Measurements." FAS 157 defines fair value, establishes a framework for measuring fair value in accordance with generally accepted accounting principles and expands disclosure about fair value measurements. FAS 157 is effective for fiscal years beginning after November 15, 2007. Management is currently evaluating the impact the adoption of FAS 157 will have on the Fund's financial statement disclosures.
3. Fees and other transactions with affiliates
GMO earns a management fee paid monthly at the annual rate of 0.81% of average daily net assets. The Fund has adopted a Shareholder Service Plan under which the Fund pays GMO a shareholder service fee for client and shareholder service, reporting, and other support. Pursuant to the Shareholder Service Plan, the shareholder service fee is calculated based on average daily net assets of each class at the annual rate of 0.15% for Class III shares, 0.105% for Class IV shares, 0.085% for Class V shares, and 0.055% for Class VI shares.
The Manager has contractually agreed to reimburse the Fund for Fund expenses through at least June 30, 2008 to the extent the Fund's total annual operating expenses (excluding shareholder service fees, expenses indirectly incurred by investment in the underlying funds, custodial fees, fees and expenses of the independent Trustees of the Trust, fees and expenses for legal services not approved by the Manager for the Trust, compensation and expenses of the Trust's Chief Compliance Officer ("CCO") (excluding
42
GMO Emerging Markets Fund
(A Series of GMO Trust)
Notes to Financial Statements — (Continued)
February 29, 2008
any employee benefits), brokerage commissions, securities lending fees and expenses, interest expense, transfer taxes, and other investment-related costs (including expenses associated with investments in any company that is an investment company or would be an investment company under the 1940 Act, but for the exceptions to the definition of investment company provided in Section 3(c)(1) and 3(c)(7) of the 1940 Act), hedging transaction fees, extraordinary, non-recurring and certain other unusual expenses (including taxes)) exceed 0.81% of the Fund's average daily net assets.
The Fund incurs fees and expenses indirectly as a shareholder in the GMO Special Purpose Holding Fund. For the year ended February 29, 2008, these indirect fees and expenses expressed as an annualized percentage of the Fund's average daily net assets were as follows:
| Indirect Net Expenses (excluding shareholder service fees) | Indirect Shareholder Service Fees | Total Indirect Expenses | |||||||||
| 0.000 | % | 0.000 | % | 0.000 | % | ||||||
The Fund's portion of the fees paid by the Trust to the independent Trustees and CCO during the year ended February 29, 2008 was $136,005 and $61,378, respectively. The compensation and expenses of the CCO are included in miscellaneous expenses in the Statement of Operations. No remuneration was paid by the Fund to any other officer of the Trust.
4. Purchases and sales of securities
For the year ended February 29, 2008, cost of purchases and proceeds from sales of investments, other than short-term obligations, were as follows:
| Purchases | Sales | ||||||||||
| U.S. Government securities | $ | — | $ | 2,979,372 | |||||||
| Investments (non-U.S. Government securities) | 8,247,123,561 | 11,120,966,132 | |||||||||
5. Guarantees
In the normal course of business the Fund enters into contracts with third-party service providers that contain a variety of representations and warranties and which provide general indemnifications. The Fund's maximum exposure under these arrangements is unknown, as this would involve future claims that may be made against the Fund that have not yet occurred. Based on experience, management is of the view that the risk of loss in connection with these potential indemnification obligations is remote; however, there can be no assurance that material liabilities related to such obligations will not arise in the future that could adversely impact the Fund.
43
GMO Emerging Markets Fund
(A Series of GMO Trust)
Notes to Financial Statements — (Continued)
February 29, 2008
6. Principal shareholders and related parties
As of February 29, 2008, there were no shareholders individually holding in excess of 10% of the Fund's outstanding shares.
As of February 29, 2008, 0.40% of the Fund's shares were held by forty-nine related parties comprised of certain GMO employee accounts, and 26.82% of the Fund's shares were held by accounts for which the Manager has investment discretion.
44
GMO Emerging Markets Fund
(A Series of GMO Trust)
Notes to Financial Statements — (Continued)
February 29, 2008
7. Share transactions
The Declaration of Trust permits the Trustees to issue an unlimited number of shares of beneficial interest (without par value). Transactions in Fund shares were as follows:
| Year Ended February 29, 2008 | Year Ended February 28, 2007 | ||||||||||||||||||
| Class III: | Shares | Amount | Shares | Amount | |||||||||||||||
| Shares sold | 511,450 | $ | 11,067,541 | 901,800 | $ | 19,806,386 | |||||||||||||
| Shares issued to shareholders in reinvestment of distributions | 41,256,239 | 944,580,044 | 47,035,328 | 954,963,472 | |||||||||||||||
| Shares repurchased | (82,489,753 | ) | (1,996,490,628 | ) | (53,946,185 | ) | (1,195,526,895 | ) | |||||||||||
| Purchase premiums | — | 34,924 | — | 16,816 | |||||||||||||||
| Redemption fees | — | 6,221,718 | — | 3,405,130 | |||||||||||||||
| Net increase (decrease) | (40,722,064 | ) | $ | (1,034,586,401 | ) | (6,009,057 | ) | $ | (217,335,091 | ) | |||||||||
| Year Ended February 29, 2008 | Year Ended February 28, 2007 | ||||||||||||||||||
| Class IV: | Shares | Amount | Shares | Amount | |||||||||||||||
| Shares sold | 42,157,428 | $ | 1,040,161,863 | 19,134,727 | $ | 423,961,978 | |||||||||||||
| Shares issued to shareholders in reinvestment of distributions | 35,738,546 | 808,409,341 | 32,302,833 | 653,579,480 | |||||||||||||||
| Shares repurchased | (55,851,088 | ) | (1,362,248,327 | ) | (62,645,477 | ) | (1,351,668,048 | ) | |||||||||||
| Purchase premiums | — | 4,000 | — | 4,261 | |||||||||||||||
| Redemption fees | — | 3,196,572 | — | 3,358,243 | |||||||||||||||
| Net increase (decrease) | 22,044,886 | $ | 489,523,449 | (11,207,917 | ) | $ | (270,764,086 | ) | |||||||||||
45
GMO Emerging Markets Fund
(A Series of GMO Trust)
Notes to Financial Statements — (Continued)
February 29, 2008
| Year Ended February 29, 2008 | Year Ended February 28, 2007 | ||||||||||||||||||
| Class V: | Shares | Amount | Shares | Amount | |||||||||||||||
| Shares sold | 36,562,016 | $ | 922,567,536 | 14,260,670 | $ | 302,250,327 | |||||||||||||
| Shares issued to shareholders in reinvestment of distributions | 12,460,349 | 281,241,715 | 14,192,468 | 287,016,728 | |||||||||||||||
| Shares repurchased | (23,612,498 | ) | (586,826,685 | ) | (59,953,974 | ) | (1,278,498,246 | ) | |||||||||||
| Purchase premiums | — | — | — | — | |||||||||||||||
| Redemption fees | — | 2,262,707 | — | 1,945,943 | |||||||||||||||
| Net increase (decrease) | 25,409,867 | $ | 619,245,273 | (31,500,836 | ) | $ | (687,285,248 | ) | |||||||||||
| Year Ended February 29, 2008 | Year Ended February 28, 2007 | ||||||||||||||||||
| Class VI: | Shares | Amount | Shares | Amount | |||||||||||||||
| Shares sold | 25,646,673 | $ | 584,700,516 | 92,951,864 | $ | 1,981,148,689 | |||||||||||||
| Shares issued to shareholders in reinvestment of distributions | 64,927,161 | 1,472,096,525 | 39,847,798 | 808,375,017 | |||||||||||||||
| Shares repurchased | (49,478,255 | ) | (1,203,172,374 | ) | (27,445,223 | ) | (594,414,004 | ) | |||||||||||
| Purchase premiums | — | 953,166 | — | 715,182 | |||||||||||||||
| Redemption fees | — | 6,273,038 | — | 2,967,073 | |||||||||||||||
| Net increase (decrease) | 41,095,579 | $ | 860,850,871 | 105,354,439 | $ | 2,198,791,957 | |||||||||||||
8. Investments in affiliated issuers
A summary of the Fund's transactions in the shares of other funds in GMO Trust during the year ended February 29, 2008 is set forth below:
| Affiliate | Value, beginning of period | Purchases | Sales Proceeds | Dividend Income | Distributions of Realized Gains | Value, end of period | |||||||||||||||||||||
| GMO Special Purpose Holding Fund | $ | 11,371 | $ | — | $ | — | $ | — | $ | 52,305 | $ | 10,161 | |||||||||||||||
| Totals | $ | 11,371 | $ | — | $ | — | $ | — | $ | 52,305 | $ | 10,161 | |||||||||||||||
46
GMO Emerging Markets Fund
(A Series of GMO Trust)
Notes to Financial Statements — (Continued)
February 29, 2008
An affiliated company is a company in which the Fund has or had ownership of at least 5% of the voting securities. A summary of the Fund's transactions with companies which are or were affiliates during the year ended February 29, 2008 is set forth below:
| Affiliate | Value, beginning of period | Purchases | Sales Proceeds | Dividend Income | Value, end of period | ||||||||||||||||||
| Bakrie & Brothers Tbk PT | $ | — | $ | 48,294,307 | $ | — | $ | — | $ | 52,163,380 | |||||||||||||
| Biomass Korea Co Ltd | — | 7,053,102 | — | — | 4,806,682 | ||||||||||||||||||
| Boryung Pharmaceutical Co Ltd | 7,071,014 | — | — | 97,964 | 9,623,938 | ||||||||||||||||||
| CBAY Systems Holdings Ltd | 16,259,042 | — | — | — | 18,319,951 | ||||||||||||||||||
| Daehan Pulp Co Ltd | 3,669,664 | — | — | — | 3,241,894 | ||||||||||||||||||
| Dimerco Express Taiwan Corp | 10,538,781 | — | — | 248,444 | 13,447,262 | ||||||||||||||||||
| EnE System Inc | 13,754,436 | — | — | — | 9,225,369 | ||||||||||||||||||
| In The F Co Ltd (formerly Nasan Co Ltd) | 14,147,918 | — | — | — | 11,011,120 | ||||||||||||||||||
| Kolon Construction* | 29,034,912 | — | 31,811,704 | — | — | ||||||||||||||||||
| Korea Real Estate* | 14,787,117 | — | — | — | 19,779,239 | ||||||||||||||||||
| Les Enphants Co Ltd | 10,293,616 | — | 404,121 | 230,214 | 8,606,563 | ||||||||||||||||||
| Mbiznetworks Global Co* | 2,855,881 | — | 3,356,490 | — | — | ||||||||||||||||||
| Megaworld Corp* | 65,571,291 | 3,829,378 | 22,510,724 | 423,735 | 49,255,194 | ||||||||||||||||||
| Millenium Information Technology | 787,470 | — | — | — | 787,470 | ||||||||||||||||||
| Pumyang Construction Co Ltd | 9,376,861 | — | — | — | 13,435,930 | ||||||||||||||||||
| Robinsons Land Corp* | 64,992,132 | 914,695 | 16,260,267 | 1,333,399 | 36,937,049 | ||||||||||||||||||
| SSCP Co Ltd* | 31,670,938 | — | 30,076,389 | — | 7,660,637 | ||||||||||||||||||
| Star Block Co Ltd (Foreign Registered) | 913 | — | — | — | 987 | ||||||||||||||||||
| Yarnapund Pcl* | 2,616,004 | — | 2,310,202 | 25,599 | — | ||||||||||||||||||
| Totals | $ | 297,427,990 | $ | 60,091,482 | $ | 106,729,897 | $ | 2,359,355 | $ | 258,302,665 | |||||||||||||
* No longer an affiliate as of February 29, 2008.
47
Report of Independent Registered Public Accounting Firm
To the Trustees of GMO Trust and the Shareholders of
GMO Emerging Markets Fund
In our opinion, the accompanying statement of assets and liabilities, including the schedule of investments, and the related statements of operations and of changes in net assets and the financial highlights present fairly, in all material respects, the financial position of GMO Emerging Markets Fund (the "Fund") at February 29, 2008, the results of its operations for the year then ended, the changes in its net assets for each of the two years in the period then ended and the financial highlights for each of the five years in the period then ended, in conformity with accounting principles generally accepted in the United States of America. These financial statements and financial highlights (hereafter referred to as "financial statements") are the responsibility of the Fund's management; our responsibility is to express an opinion on these financial statements based on our audits. We conducted our audits of these financial state ments in accordance with the standards of the Public Company Accounting Oversight Board (United States). Those standards require that we plan and perform the audit to obtain reasonable assurance about whether the financial statements are free of material misstatement. An audit includes examining, on a test basis, evidence supporting the amounts and disclosures in the financial statements, assessing the accounting principles used and significant estimates made by management, and evaluating the overall financial statement presentation. We believe that our audits, which included confirmation of securities at February 29, 2008 by correspondence with the custodian, provide a reasonable basis for our opinion.
PricewaterhouseCoopers LLP
Boston, Massachusetts
April 29, 2008
48
GMO Emerging Markets Fund
(A Series of GMO Trust)
Fund Expenses
February 29, 2008 (Unaudited)
Expense Examples: The following information is in relation to expenses for the six month period ended February 29, 2008.
As a shareholder of the Fund, you may incur two types of costs: (1) transaction costs, including purchase premiums and redemption fees; and (2) ongoing costs, including management fees, shareholder service fees, and other Fund expenses. This example is intended to help you understand your ongoing costs (in dollars) of investing in the Fund and to compare these costs with the ongoing costs of investing in other mutual funds.
These examples are based on an investment of $1,000 invested at the beginning of the period and held for the entire period, September 1, 2007 through February 29, 2008.
Actual Expenses
The first line of the table for each class below provides information about actual account values and actual expenses. You may use the information in this line, together with the amount you invested, to estimate the expenses that you paid over the period. Simply divide your account value by $1,000 (for example, a $10,000,000 account value divided by $1,000 = 10,000), then multiply the result by the number in the first line under the heading entitled "Net Expense Incurred" to estimate the expenses you paid on your account during this period.
Hypothetical Example for Comparison Purposes
The second line of the table for each class below provides information about hypothetical account values and hypothetical expenses based on the Fund's actual expense ratio and an assumed rate of return of 5% per year before expenses, which is not the Fund's actual return. The hypothetical account values and expenses may not be used to estimate the actual ending account balance or expenses you paid for the period. You may use this information to compare the ongoing costs of investing in the Fund with other funds. To do so, compare this 5% hypothetical example with the 5% hypothetical examples that appear in the shareholder reports of other funds.
49
GMO Emerging Markets Fund
(A Series of GMO Trust)
Fund Expenses — (Continued)
February 29, 2008 (Unaudited)
Please note that the expenses shown in the table are meant to highlight your ongoing costs only and do not reflect any transactional costs, such as purchase premiums and redemption fees. Therefore, the second line of the table is useful in comparing ongoing costs only, and will not help you determine the relative total costs of owning different funds. In addition, if these transactional costs were included, your costs would have been higher.
| Annualized Net Expense Ratio | Beginning Account Value | Ending Account Value | Net Expense Incurred* | ||||||||||||||||
| Class III | |||||||||||||||||||
| 1) Actual | 1.12 | % | $ | 1,000.00 | $ | 1,027.60 | $ | 5.65 | |||||||||||
| 2) Hypothetical | 1.12 | % | $ | 1,000.00 | $ | 1,019.29 | $ | 5.62 | |||||||||||
| Class IV | |||||||||||||||||||
| 1) Actual | 1.08 | % | $ | 1,000.00 | $ | 1,027.40 | $ | 5.44 | |||||||||||
| 2) Hypothetical | 1.08 | % | $ | 1,000.00 | $ | 1,019.49 | $ | 5.42 | |||||||||||
| Class V | |||||||||||||||||||
| 1) Actual | 1.06 | % | $ | 1,000.00 | $ | 1,027.70 | $ | 5.34 | |||||||||||
| 2) Hypothetical | 1.06 | % | $ | 1,000.00 | $ | 1,019.59 | $ | 5.32 | |||||||||||
| Class VI | |||||||||||||||||||
| 1) Actual | 1.03 | % | $ | 1,000.00 | $ | 1,027.80 | $ | 5.19 | |||||||||||
| 2) Hypothetical | 1.03 | % | $ | 1,000.00 | $ | 1,019.74 | $ | 5.17 | |||||||||||
* Expenses are calculated using each Class's annualized net expense ratio (including indirect expenses incurred) for the six months ended February 29, 2008, multiplied by the average account value over the period, multiplied by 182 days in the period, divided by 366 days in the year.
50
GMO Emerging Markets Fund
(A Series of GMO Trust)
Tax Information for the Tax Year Ended February 29, 2008 (Unaudited)
The Fund will notify shareholders of amounts for use in preparing 2008 income tax forms in January 2009.
The Fund's distributions to shareholders include $3,030,792,260 from long-term capital gains.
During the year ended February 29, 2008, the Fund paid foreign taxes of $44,170,023 and recognized foreign source income of $321,705,663.
For taxable, non-corporate shareholders, 15.85% of the income and short-term capital gains, if any, distributed in the Fund's fiscal year ended February 29, 2008 represents qualified dividend income subject to the 15% rate category.
The Fund hereby designates as qualified short-term capital gains with respect to its taxable year ended February 29, 2008, $377,589,138 or if determined to be different, the qualified short term capital gains of such year.
51
Trustees and Officers (Unaudited)
The following tables list the Trust's Trustees and Officers as of the date of this report; their address and date of birth ("DOB"); their position with the Trust; the length of time holding that position with the Trust; their principal occupation(s) during the past five years; the number of portfolios in the fund complex they oversee; and other directorships they hold in companies subject to registration or reporting requirements of the Securities Exchange Act of 1934 (generally called "public companies") or in registered investment companies. The Trust's Statement of Additional Information ("SAI") includes additional information about the Trust's trustees, including changes subsequent to the date of the report. The SAI is available, without charge, upon request by writing GMO, c/o GMO Trust, 40 Rowes Wharf, Boston, MA 02110.
Independent Trustees:
| Name, Address, and DOB | Position(s) Held with Trust | Term of Office1 and Length of Time Served | Principal Occupation(s) During Past Five Years | Number of Portfolios in Fund Complex Overseen by Trustee | Other Directorships Held by Trustee | ||||||||||||||||||
| Donald W. Glazer, Esq. c/o GMO Trust 40 Rowes Wharf Boston, MA 02110 DOB: 07/26/1944 | Chairman of the Board of Trustees | Chairman of the Board of Trustees since March 2005; Lead Independent Trustee (September 2004 – March 2005); Trustee since December 2000. | Consultant – Law and Business2; Vice Chair (since 2002) and Secretary, Provant, Inc. (provider of personnel performance improvement services and training products); Author of Legal Treatises. | 47 | None. | ||||||||||||||||||
1 Each Trustee is elected to serve during the continued lifetime of the Trust until he/she dies, resigns or is removed, or if sooner, until the next meeting of Shareholders called for the purpose of electing Trustees and until the election and qualification of his/her successor.
2 As part of Mr. Glazer's work as a consultant, he provides part-time consulting services to Goodwin Procter LLP ("Goodwin"). Goodwin has provided legal services to Renewable Resources, LLC, an affiliate of GMO; GMO, in connection with its relationship with Renewable Resources; and funds managed by Renewable Resources. Mr. Glazer has represented that he has no financial interest in, and is not involved in the provision of, such legal services. In the calendar years ended December 31, 2006 and December 31, 2007, these entities paid $825,738 and $291,721 respectively, in legal fees and disbursements to Goodwin.
52
Independent Trustees — (Continued)
| Name, Address, and DOB | Position(s) Held with Trust | Term of Office1 and Length of Time Served | Principal Occupation(s) During Past Five Years | Number of Portfolios in Fund Complex Overseen by Trustee | Other Directorships Held by Trustee | ||||||||||||||||||
| Jay O. Light c/o GMO Trust 40 Rowes Wharf Boston, MA 02110 DOB: 10/03/1941 | Trustee | Since May 1996. | Dean (since April 2006), Acting Dean (August 2005 – April 2006), Senior Associate Dean (1998 – 2005), and Professor of Business Administration, Harvard Business School. | 47 | Director of Harvard Management Company, Inc.3 and Verde, Inc.; Director of Partners HealthCare System, Inc. and Chair of its Investment Committee.4 | ||||||||||||||||||
| W. Nicholas Thorndike c/o GMO Trust 40 Rowes Wharf Boston, MA 02110 DOB: 03/28/1933 | Trustee | Since March 2005. | Director or trustee of various corporations and charitable organizations, including Courier Corporation (a book publisher and manufacturer) (July 1989 – present); Putnam Funds (December 1992 – June 2004); and Providence Journal (a newspaper publisher) (December 1986 – December 2003). | 47 | Director of Courier Corporation (a book publisher and manufacturer); Member of the Investment Committee of Partners HealthCare System, Inc.4 | ||||||||||||||||||
1 Each Trustee is elected to serve during the continued lifetime of the Trust until he/she dies, resigns or is removed, or if sooner, until the next meeting of Shareholders called for the purpose of electing Trustees and until the election and qualification of his/her successor.
3 Harvard Management Company, Inc. is a client of the Manager.
4 Partners HealthCare System, Inc. is a client of the Manager.
53
Principal Officers:
| Name, Address, and DOB | Position(s) Held with Trust | Term of Office5 and Length of Time Served | Principal Occupation(s) During Past Five Years | ||||||||||||
| Scott Eston c/o GMO Trust 40 Rowes Wharf Boston, MA 02110 DOB: 01/20/1956 | President and Chief Executive Officer | President and Chief Executive Officer since October 2002; Chief Financial Officer, November 2006 – February 2007. | Chief Financial Officer, Chief Operating Officer and Member, Grantham, Mayo, Van Otterloo & Co. LLC. | ||||||||||||
| Sheppard N. Burnett c/o GMO Trust 40 Rowes Wharf Boston, MA 02110 DOB: 10/24/1968 | Treasurer and Chief Financial Officer | Chief Financial Officer since March 2007; Treasurer since November 2006; Assistant Treasurer, September 2004 – November 2006. | Fund Administration Staff, Grantham, Mayo, Van Otterloo & Co. LLC (June 2004 – present); Vice President, Director of Tax, Columbia Management Group (2002 – 2004). | ||||||||||||
| Brent C. Arvidson c/o GMO Trust 40 Rowes Wharf Boston, MA 02110 DOB: 06/26/1969 | Assistant Treasurer | Since August 1998. | Senior Fund Administrator, Grantham, Mayo, Van Otterloo & Co. LLC. | ||||||||||||
| John L. Nasrah c/o GMO Trust 40 Rowes Wharf Boston, MA 02110 DOB: 05/27/1977 | Assistant Treasurer | Since March 2007. | Fund Administrator, Grantham, Mayo, Van Otterloo & Co. LLC (September 2004 – present); Tax Analyst, Bain & Company, Inc (June 2003 – September 2004); Senior Tax Associate, PricewaterhouseCoopers LLP (2001 – 2003). | ||||||||||||
| Mahmoodur Rahman c/o GMO Trust 40 Rowes Wharf Boston, MA 02110 DOB: 11/30/1967 | Assistant Treasurer | Since September 2007. | Fund Administrator, Grantham, Mayo, Van Otterloo & Co. (April 2007 – present); Vice President and Senior Tax Manager, Massachusetts Financial Services Company (January 2000 – April 2007). | ||||||||||||
5 Officers are elected to hold such office until their successor is elected and qualified to carry out the duties and responsibilities of their office, or until he or she resigns or is removed from office.
54
Principal Officers — (Continued)
| Name, Address, and DOB | Position(s) Held with Trust | Term of Office5 and Length of Time Served | Principal Occupation(s) During Past Five Years | ||||||||||||
| Michael E. Gillespie c/o GMO Trust 40 Rowes Wharf Boston, MA 02110 DOB: 02/18/1958 | Chief Compliance Officer | Since March 2005. | Vice President of Compliance (June 2004 – February 2005) and Director of Domestic Compliance (March 2002 – June 2004), Fidelity Investments; Vice President and Senior Counsel, State Street Bank and Trust Company (May 1998 – March 2002). | ||||||||||||
| Jason B. Harrison c/o GMO Trust 40 Rowes Wharf Boston, MA 02110 DOB: 01/29/1977 | Vice President and Clerk | Vice President since November 2006; Clerk since March 2006. | Legal Counsel, Grantham, Mayo, Van Otterloo & Co. LLC (since February 2006) and Attorney, Ropes & Gray LLP (September 2002 – February 2006). | ||||||||||||
| David L. Bohan c/o GMO Trust 40 Rowes Wharf Boston, MA 02110 DOB: 06/21/1964 | Vice President and Assistant Clerk | Vice President since March 2005; Assistant Clerk since March 2006. | Legal Counsel, Grantham, Mayo, Van Otterloo & Co. LLC (September 2003 – present); Attorney, Goodwin Procter LLP (September 1996 – September 2003). | ||||||||||||
| Gregory L. Pottle c/o GMO Trust 40 Rowes Wharf Boston, MA 02110 DOB: 07/09/1971 | Vice President and Assistant Clerk | Since November 2006. | Legal Counsel, Grantham, Mayo, Van Otterloo & Co. LLC. | ||||||||||||
| Anne K. Trinque c/o GMO Trust 40 Rowes Wharf Boston, MA 02110 DOB: 04/15/1978 | Vice President and Assistant Clerk | Since September 2007. | Legal Counsel, Grantham, Mayo, Van Otterloo & Co. LLC (since January 2007); Attorney, Goodwin Procter LLP (September 2003 – January 2007). | ||||||||||||
| Cheryl Wakeham c/o GMO Trust 40 Rowes Wharf Boston, MA 02110 DOB: 10/29/1958 | Anti-Money Laundering Officer | Since December 2004. | Manager, Client Service Administration, Grantham, Mayo, Van Otterloo & Co. LLC. | ||||||||||||
5 Officers are elected to hold such office until their successor is elected and qualified to carry out the duties and responsibilities of their office, or until he or she resigns or is removed from office.
55
GMO Short-Duration Investment Fund
(A Series of GMO Trust)
Annual Report
February 29, 2008
For a free copy of the Fund's proxy voting guidelines, shareholders may call 1-617-346-7646 (collect), visit our website at www.gmo.com, or visit the Securities and Exchange Commission's website at www.sec.gov. Information regarding how the Fund voted proxies relating to portfolio securities during the most recent 12-month period ended June 30 is available on our website at www.gmo.com, or on the Securities and Exchange Commission's website at www.sec.gov.
The Fund files its complete schedule of portfolio holdings with the Securities and Exchange Commission for the first and third quarter of each fiscal year on Form N-Q, which is available on the Commission's website at www.sec.gov. The Fund's Form N-Q may be reviewed and copied at the Commission's Public Reference Room in Washington, D.C. Information on the operation of the Public Reference Room may be obtained by calling 1-800-SEC-0330. The Fund has a policy with respect to disclosure of portfolio holdings under which it may also make available on GMO's website (www.gmo.com) a complete schedule of portfolio holdings.
This report is prepared for the general information of shareholders. It is authorized for distribution to prospective investors only when preceded or accompanied by a prospectus for the GMO Trust.
GMO Short-Duration Investment Fund
(A Series of GMO Trust)
Portfolio Managers
Day-to-day management of the Fund's portfolio is the responsibility of the Fixed Income Division at Grantham, Mayo, Van Otterloo & Co. LLC.
Management Discussion and Analysis of Fund Performance
The GMO Short-Duration Investment Fund returned +0.4% for the fiscal year ended February 29, 2008, as compared with +5.8% for the JPMorgan U.S. 3 Month Cash Index. The Fund underperformed the benchmark during the fiscal year by 5.4%.
The fiscal year's underperformance stemmed from mark-to-market losses in the GMO Short Duration Collateral Fund (SDCF), the cash collateral pool in which the strategy invests a substantial portion of its total assets. SDCF primarily invests in high quality U.S. and foreign floating-rate fixed income securities, mainly asset-backed securities, in order to earn a LIBOR-type return.
With the extreme price volatility of AAA-credit quality asset-backed securities during the year, SDCF underperformed LIBOR by nearly 700 basis points, directly contributing to the Short-Duration Investment Fund's underperformance given the latter's 72% exposure to the former.
The views expressed herein are exclusively those of Grantham, Mayo, Van Otterloo & Co. LLC Management as of the date of this report and are subject to change. GMO disclaims any responsibility to update such views. They are not meant as investment advice.
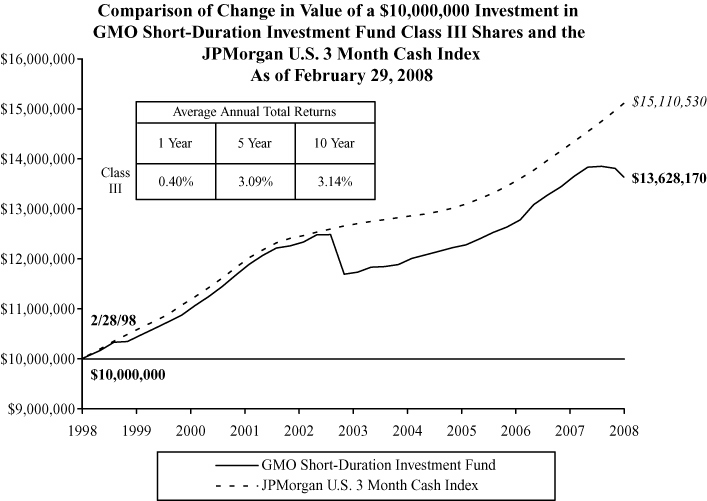
Performance data quoted represents past performance and is not indicative of future results. The investment return and principal value of an investment will fluctuate so that an investor's shares, when redeemed, may be worth more or less than their original cost. Current performance data may be lower or higher than the performance data provided herein. To obtain performance information to the most recent month-end, visit www.gmo.com. Performance shown is net of all fees after reimbursement from the Manager. Returns would have been lower had certain expenses not been reimbursed during the periods shown and do not include the effect of taxes on distributions and redemptions. All information is unaudited.
GMO Short-Duration Investment Fund
(A Series of GMO Trust)
Investments Concentration Summary
February 29, 2008 (Unaudited)
| Asset Class Summary* | % of Total Net Assets | ||||||
| Debt Obligations | 90.6 | % | |||||
| Short-Term Investments | 6.5 | ||||||
| Futures | (0.0 | ) | |||||
| Forward Currency Contracts | (0.0 | ) | |||||
| Swaps | (0.2 | ) | |||||
| Other | 3.1 | ||||||
| 100.0 | % | ||||||
* The table above incorporates aggregate indirect asset class exposure associated with investments in other funds of GMO Trust ("underlying funds").
1
GMO Short-Duration Investment Fund
(A Series of GMO Trust)
Schedule of Investments
(showing percentage of total net assets)
February 29, 2008
| Par Value ($)/Shares | Description | Value ($) | |||||||||
| DEBT OBLIGATIONS — 25.0% | |||||||||||
| U.S. Government Agency — 25.0% | |||||||||||
| 116,655 | Agency for International Development Floater (Support of Botswana), Variable Rate, 6 mo. U.S. Treasury Bill + .40%, 2.53%, due 10/01/12 | 116,365 | |||||||||
| 751,500 | Agency for International Development Floater (Support of C.A.B.E.I.), Variable Rate, 6 mo. U.S. Treasury Bill + .40%, 2.53%, due 10/01/12 | 749,629 | |||||||||
| 670,297 | Agency for International Development Floater (Support of Honduras), Variable Rate, 3 mo. U.S. Treasury Bill x 117%, 4.11%, due 10/01/11 | 666,527 | |||||||||
| 38,994 | Agency for International Development Floater (Support of Peru), Series A, Variable Rate, 6 mo. U.S. Treasury Bill + .35%, 2.48%, due 05/01/14 | 38,800 | |||||||||
| 265,920 | Small Business Administration Pool #502320, Variable Rate, Prime - 2.18%, 5.06%, due 08/25/18 | 269,380 | |||||||||
| Total U.S. Government Agency | 1,840,701 | ||||||||||
| TOTAL DEBT OBLIGATIONS (COST $1,844,284) | 1,840,701 | ||||||||||
| MUTUAL FUNDS — 72.3% | |||||||||||
| Affiliated Issuers — 72.3% | |||||||||||
| 221,558 | GMO Short-Duration Collateral Fund | 5,324,037 | |||||||||
| 9,192 | GMO Special Purpose Holding Fund(a)(b) | 11,582 | |||||||||
| TOTAL MUTUAL FUNDS (COST $5,707,366) | 5,335,619 | ||||||||||
| TOTAL INVESTMENTS — 97.3% (Cost $7,551,650) | 7,176,320 | ||||||||||
| Other Assets and Liabilities (net) — 2.7% | 199,074 | ||||||||||
| TOTAL NET ASSETS — 100.0% | $ | 7,375,394 | |||||||||
See accompanying notes to the financial statements.
2
GMO Short-Duration Investment Fund
(A Series of GMO Trust)
Schedule of Investments — (Continued)
February 29, 2008
Notes to Schedule of Investments:
C.A.B.E.I. - Central American Bank of Economic Integration
Variable rate - The rates shown on variable rate notes are the current interest rates at February 29, 2008, which are subject to change based on the terms of the security.
(a) Security valued at fair value using methods determined in good faith by or at the direction of the Trustees of GMO Trust (Note 2).
(b) Underlying investment represents interests in defaulted securities.
See accompanying notes to the financial statements.
3
GMO Short-Duration Investment Fund
(A Series of GMO Trust)
Statement of Assets and Liabilities — February 29, 2008
| Assets: | |||||||
| Investments in unaffiliated issuers, at value (cost $1,844,284) (Note 2) | $ | 1,840,701 | |||||
| Investments in affiliated issuers, at value (cost $5,707,366) (Notes 2 and 8) | 5,335,619 | ||||||
| Cash | 176,127 | ||||||
| Receivable for investments sold | 1,613 | ||||||
| Receivable for Fund shares sold | 469,351 | ||||||
| Interest receivable | 32,761 | ||||||
| Receivable for expenses reimbursed by Manager (Note 3) | 16,849 | ||||||
| Total assets | 7,873,021 | ||||||
| Liabilities: | |||||||
| Payable for Fund shares repurchased | 469,351 | ||||||
| Payable to affiliate for (Note 3): | |||||||
| Management fee | 313 | ||||||
| Shareholder service fee | 940 | ||||||
| Trustees and Chief Compliance Officer of GMO Trust fees | 12 | ||||||
| Accrued expenses | 27,011 | ||||||
| Total liabilities | 497,627 | ||||||
| Net assets | $ | 7,375,394 | |||||
| Net assets consist of: | |||||||
| Paid-in capital | $ | 12,105,073 | |||||
| Accumulated undistributed net investment income | 1,079 | ||||||
| Accumulated net realized loss | (4,355,428 | ) | |||||
| Net unrealized depreciation | (375,330 | ) | |||||
| $ | 7,375,394 | ||||||
| Net assets attributable to: | |||||||
| Class III shares | $ | 7,375,394 | |||||
| Shares outstanding: | |||||||
| Class III | 872,954 | ||||||
| Net asset value per share: | |||||||
| Class III | $ | 8.45 | |||||
See accompanying notes to the financial statements.
4
GMO Short-Duration Investment Fund
(A Series of GMO Trust)
Statement of Operations — Year Ended February 29, 2008
| Investment Income: | |||||||
| Dividends from affiliated issuers (Note 8) | $ | 396,947 | |||||
| Interest | 164,495 | ||||||
| Total investment income | 561,442 | ||||||
| Expenses: | |||||||
| Management fee (Note 3) | 7,407 | ||||||
| Shareholder service fee – Class III (Note 3) | 22,221 | ||||||
| Custodian, fund accounting agent and transfer agent fees | 2,847 | ||||||
| Audit and tax fees | 35,880 | ||||||
| Legal fees | 45,634 | ||||||
| Trustees fees and related expenses (Note 3) | 121 | ||||||
| Registration fees | 2,589 | ||||||
| Miscellaneous | 1,600 | ||||||
| Total expenses | 118,299 | ||||||
| Fees and expenses reimbursed by Manager (Note 3) | (88,495 | ) | |||||
| Net expenses | 29,804 | ||||||
| Net investment income (loss) | 531,638 | ||||||
| Realized and unrealized gain (loss): | |||||||
| Net realized gain (loss) on: | |||||||
| Investments in unaffiliated issuers | (113,568 | ) | |||||
| Investments in affiliated issuers | 288,575 | ||||||
| Realized gains distributions from affiliated issuers (Note 8) | 59,618 | ||||||
| Net realized gain (loss) | 234,625 | ||||||
| Change in net unrealized appreciation (depreciation) on: | |||||||
| Investments in unaffiliated issuers | 106,921 | ||||||
| Investments in affiliated issuers | (500,322 | ) | |||||
| Net unrealized gain (loss) | (393,401 | ) | |||||
| Net realized and unrealized gain (loss) | (158,776 | ) | |||||
| Net increase (decrease) in net assets resulting from operations | $ | 372,862 | |||||
See accompanying notes to the financial statements.
5
GMO Short-Duration Investment Fund
(A Series of GMO Trust)
Statement of Changes in Net Assets
| Year Ended February 29, 2008 | Year Ended February 28, 2007 | ||||||||||
| Increase (decrease) in net assets: | |||||||||||
| Operations: | |||||||||||
| Net investment income (loss) | $ | 531,638 | $ | 1,648,053 | |||||||
| Net realized gain (loss) | 234,625 | 483,475 | |||||||||
| Change in net unrealized appreciation (depreciation) | (393,401 | ) | (118,646 | ) | |||||||
| Net increase (decrease) in net assets from operations | 372,862 | 2,012,882 | |||||||||
| Distributions to shareholders from: | |||||||||||
| Net investment income | |||||||||||
| Class III | (529,051 | ) | (1,646,299 | ) | |||||||
| Net share transactions (Note 7): | |||||||||||
| Class III | (23,783,143 | ) | 1,493,876 | ||||||||
| Total increase (decrease) in net assets | (23,939,332 | ) | 1,860,459 | ||||||||
| Net assets: | |||||||||||
| Beginning of period | 31,314,726 | 29,454,267 | |||||||||
| End of period (including accumulated undistributed net investment income of $1,079 and distributions in excess of net investment income of $1,492, respectively) | $ | 7,375,394 | $ | 31,314,726 | |||||||
See accompanying notes to the financial statements.
6
GMO Short-Duration Investment Fund
(A Series of GMO Trust)
Financial Highlights
(For a Class III share outstanding throughout each period)
| Year Ended February 28/29, | |||||||||||||||||||||||
| 2008 | 2007 | 2006 | 2005 | 2004 | |||||||||||||||||||
| Net asset value, beginning of period | $ | 8.93 | $ | 8.82 | $ | 8.77 | $ | 8.75 | $ | 8.68 | |||||||||||||
| Income (loss) from investment operations: | |||||||||||||||||||||||
| Net investment income (loss)(a)† | 0.32 | 0.47 | 0.27 | 0.23 | 0.12 | ||||||||||||||||||
| Net realized and unrealized gain (loss) | (0.28 | ) | 0.11 | 0.07 | (0.01 | ) | 0.07 | ||||||||||||||||
| Total from investment operations | 0.04 | 0.58 | 0.34 | 0.22 | 0.19 | ||||||||||||||||||
| Less distributions to shareholders: | |||||||||||||||||||||||
| From net investment income | (0.52 | ) | (0.47 | ) | (0.29 | ) | (0.20 | ) | (0.12 | ) | |||||||||||||
| Return of capital | — | — | — | — | (0.00 | )(b) | |||||||||||||||||
| Total distributions | (0.52 | ) | (0.47 | ) | (0.29 | ) | (0.20 | ) | (0.12 | ) | |||||||||||||
| Net asset value, end of period | $ | 8.45 | $ | 8.93 | $ | 8.82 | $ | 8.77 | $ | 8.75 | |||||||||||||
| Total Return(c) | 0.40 | % | 6.62 | % | 3.83 | % | 2.49 | % | 2.24 | % | |||||||||||||
| Ratios/Supplemental Data: | |||||||||||||||||||||||
| Net assets, end of period (000's) | $ | 7,375 | $ | 31,315 | $ | 29,454 | $ | 29,607 | $ | 44,156 | |||||||||||||
| Net expenses to average daily net assets(d) | 0.20 | % | 0.20 | % | 0.20 | % | 0.20 | % | 0.21 | % | |||||||||||||
| Net investment income to average daily net assets(a) | 3.59 | % | 5.21 | % | 3.01 | % | 2.57 | % | 1.36 | % | |||||||||||||
| Portfolio turnover rate | 5 | % | 12 | % | 17 | % | 101 | % | 4 | % | |||||||||||||
| Fees and expenses reimbursed by the Manager to average daily net assets: | 0.60 | % | 0.14 | % | 0.13 | % | 0.10 | % | 0.10 | % | |||||||||||||
(a) Net investment income is affected by the timing of the declaration of dividends by the underlying funds in which the Fund invests.
(b) Return of capital distribution was less than $0.01.
(c) The total returns would have been lower had certain expenses not been reimbursed during the periods shown and assumes the effect of reinvested distributions.
(d) Net expenses exclude expenses incurred indirectly through investment in the underlying funds (See Note 3).
† Calculated using average shares outstanding throughout the period.
See accompanying notes to the financial statements.
7
GMO Short-Duration Investment Fund
(A Series of GMO Trust)
Notes to Financial Statements
February 29, 2008
1. Organization
GMO Short-Duration Investment Fund (the "Fund") is a series of GMO Trust (the "Trust"). The Fund is registered under the Investment Company Act of 1940, as amended, as an open-end, non-diversified management investment company. The Fund is advised and managed by Grantham, Mayo, Van Otterloo & Co. LLC (the "Manager" or "GMO"). The Trust was established as a Massachusetts business trust under the laws of the Commonwealth of Massachusetts on June 24, 1985. The Declaration of Trust permits the Trustees of the Trust ("Trustees") to create an unlimited number of series of shares ("Funds") and to subdivide Funds into classes.
The Fund seeks to provide current income. The Fund seeks to achieve this objective by investing a substantial portion of its assets in GMO Short-Duration Collateral Fund, which primarily invests in high quality U.S. and foreign floating rate fixed income securities, in particular asset-backed securities, issued by a wide range of private and government issuers. In addition, the Fund makes investments in high quality fixed income securities. The Fund's benchmark is the JPMorgan U.S. 3 Month Cash Index.
The financial statements of the series of the Trust in which the Fund invests ("underlying funds") should be read in conjunction with the Fund's financial statements. These financial statements are available, without charge, upon request, by calling (617) 346-7646 (collect). Shares of the GMO Special Purpose Holding Fund and the GMO Short-Duration Collateral Fund are not publicly available for direct purchase.
2. Significant accounting policies
The following is a summary of significant accounting policies which are in conformity with accounting principles generally accepted in the United States of America ("U.S. GAAP") and which are consistently followed by the Fund in the preparation of its financial statements. The preparation of financial statements in accordance with U.S. GAAP requires management to make estimates and assumptions that affect the reported amounts and disclosures in the financial statements. Actual results could differ from those estimates. The accounting records of the Fund are maintained in U.S. dollars.
Portfolio valuation
Securities listed on a securities exchange for which market quotations are readily available are valued at the last sale price or official closing price on each business day, or if there is no such reported sale or official closing price, at the most recent quoted bid price. Unlisted securities for which market quotations are readily available are generally valued at the most recent quoted bid price. Short-term investments with a remaining maturity of sixty days or less are generally valued at amortized cost, which approximates fair value. Shares of investment funds are valued at their net asset value. Securities for which quotations are not readily available or whose values the Manager has determined to be unreliable are valued at fair value as determined in good faith by the Trustees or other persons acting at their direction pursuant to procedures approved by the Trustees. By its nature, a fair value price is a good faith est imate of the value
8
GMO Short-Duration Investment Fund
(A Series of GMO Trust)
Notes to Financial Statements — (Continued)
February 29, 2008
of a security at a given point in time and may not reflect the value that would be realized if the security was sold and the differences could be material.
Fixed income securities held by the Fund or the underlying funds are typically valued pursuant to prices supplied by a primary pricing source chosen by the Manager. The Manager evaluates such primary pricing sources on an ongoing basis, and may change a pricing source should it deem it appropriate. The Manager, at its discretion, may override a price supplied by a primary source by using a price provided by another source if such action is deemed appropriate. The prices provided by such primary pricing sources may differ from the value that would be realized if the securities were sold and the differences could be material.
Certain securities held by the Fund or the underlying funds are valued on the basis of a price provided by a single source. The prices provided may differ from the value that would be realized if the securities were sold and the differences could be material. As of February 29, 2008, the total value of these securities represented 48.09% of net assets.
The Fund indirectly invests through underlying funds in securities with contractual cash flows, such as asset-backed securities, collateralized mortgage obligations and commercial mortgage backed securities, including securities backed by subprime mortgage loans. The value, liquidity and related income of these securities are sensitive to changes in economic conditions, including real estate values, delinquencies and/or defaults, and may be adversely affected by shifts in the market's perception of the securities' market values and changes in interest rates.
GMO Special Purpose Holding Fund ("SPHF"), an investment of the Fund, has litigation pending against various entities related to the default of certain asset-backed securities previously held by SPHF. For the year ended February 29, 2008, the Fund received $59,618 through SPHF in conjunction with settlement agreements related to the default of those securities.
Indexed securities
The Fund may invest in indexed securities where the redemption values and/or coupons are linked to the prices of a specific instrument or financial statistic. The Fund uses indexed securities to increase or decrease its exposure to different underlying instruments and to gain exposure to markets in which it may be difficult to invest through conventional securities. Indexed securities may be more volatile than their underlying instruments, but any loss is limited to the amount of the original investment. There were no indexed securities held by the Fund at the end of the period.
Repurchase agreements
The Fund may enter into repurchase agreements with banks and broker-dealers whereby the Fund acquires a security for cash and obtains a simultaneous commitment from the seller to repurchase the security at an agreed upon price and date. The Fund, through its custodian, takes possession of securities collateralizing
9
GMO Short-Duration Investment Fund
(A Series of GMO Trust)
Notes to Financial Statements — (Continued)
February 29, 2008
the repurchase agreement. The collateral is marked to market daily to ensure that the market value of the underlying assets remains sufficient to protect the Fund in the event of default by the seller. Collateral for certain tri-party repurchase agreements is held at the counterparty's custodian in a segregated account for the benefit of the Fund and the counterparty. In connection with transactions in repurchase agreements, if the seller defaults or enters into insolvency proceedings and the value of the collateral declines, recovery of cash by the Fund may be delayed or limited. There were no repurchase agreements outstanding at the end of the period.
Securities lending
The Fund may lend its securities to certain qualified broker-dealers. The loans are collateralized with cash or liquid securities with a market value at least equal to the market value of the securities on loan. As with other extensions of credit, the Fund may bear the risk of loss with respect to the investment of the collateral, the risk of delay in and/or inability to exercise its rights with respect to the collateral, and the risk of delay in recovery or loss of rights in the loaned securities should the borrower of the securities fail financially. If a loan is collateralized by U.S. government securities, the Fund receives a fee from the borrower. If a loan is collateralized by cash, the Fund typically invests the cash collateral for its own account in interest-bearing, short-term securities and pays a fee to the borrower that normally represents a portion of the Fund's earnings on the collateral. For the year ended Februar y 29, 2008, the Fund did not participate in securities lending.
Taxes and distributions
The Fund intends to qualify each tax year as a regulated investment company under Subchapter M of the Internal Revenue Code of 1986, as amended (the "Code"). The Fund intends to distribute substantially all of its net investment income and net realized short-term and long-term capital gains, if any, after giving effect to any available capital loss carryovers for U.S. federal income tax purposes. Therefore, no provision for U.S. federal income or excise tax is necessary.
The Fund's policy is to declare and pay distributions from net investment income, if any, quarterly, and from net realized short-term and long-term capital gains, if any, at least annually. All distributions are paid in shares of the Fund, at net asset value, unless the shareholder elects to receive cash distributions. Distributions to shareholders are recorded by the Fund on the ex-dividend date.
Income and capital gain distributions are determined in accordance with U.S. federal income tax regulations, which may differ from U.S. GAAP. Certain capital accounts in the financial statements are periodically adjusted for permanent differences in order to reflect their tax character. These adjustments have no impact on net assets or net asset value per share. Temporary differences which arise from recognizing certain items of income, expense, gain or loss in different periods for financial statement and tax purposes will reverse at some time in the future. Distributions in excess of net investment income or net realized gains are temporary over distributions for financial statement purposes resulting from
10
GMO Short-Duration Investment Fund
(A Series of GMO Trust)
Notes to Financial Statements — (Continued)
February 29, 2008
differences in the recognition or classification of income or distributions for financial statement and tax purposes.
U.S. GAAP and tax accounting differences primarily relate to capital loss carryforwards, losses on wash sale transactions and partnership interest tax allocations.
The following reclassification represents the amount necessary to report the stated components of net assets on a tax basis, excluding certain temporary differences, as of February 29, 2008. The financial highlights exclude these adjustments.
| Accumulated Undistributed Net Investment Income | Accumulated Net Realized Loss | Paid-in Capital | |||||||||
| $ | (16 | ) | $ | 16 | $ | — | |||||
The tax character of distributions declared to shareholders is as follows:
| 2/29/2008 | 2/28/2007 | ||||||||||
| Ordinary income (including any short-term capital gains) | $ | 529,051 | $ | 1,646,299 | |||||||
| Total distributions | $ | 529,051 | $ | 1,646,299 | |||||||
Distributions in excess of tax basis earnings and profits, if significant, are reported in the financial statements as a tax return of capital.
As of February 29, 2008, the components of distributable earnings on a tax basis consisted of the following:
| Undistributed ordinary income | $ | 5,072 | |||||
As of February 29, 2008, the Fund had capital loss carryforwards available to offset future realized gains if any, to the extent permitted by the Code. Utilization of the capital loss carryforwards could be subject to limitations imposed by the Code related to share ownership activity. Such losses expire as follows:
| 02/29/2012 | $ | (500,299 | ) | ||||
| 02/28/2013 | (708 | ) | |||||
| 02/28/2014 | (3,024,063 | ) | |||||
| 02/29/2016 | (226,383 | ) | |||||
| Total | $ | (3,751,453 | ) | ||||
11
GMO Short-Duration Investment Fund
(A Series of GMO Trust)
Notes to Financial Statements — (Continued)
February 29, 2008
As of February 29, 2008, the approximate cost for U.S. federal income tax purposes and gross and net unrealized appreciation and depreciation in value of investments were as follows:
| Aggregate Cost | Gross Unrealized Appreciation | Gross Unrealized (Depreciation) | Net Unrealized Appreciation (Depreciation) | ||||||||||||
| $ | 8,159,618 | $ | 13,657 | $ | (996,955 | ) | $ | (983,298 | ) | ||||||
Security transactions and related investment income
Security transactions are accounted for on trade date. Dividend income, net of applicable foreign withholding taxes, if any, is recorded on the ex-dividend date, or when the Fund is informed of the ex-dividend date, if later. Interest income is recorded on the accrual basis and is adjusted for the amortization of premiums and accretion of discounts. Interest income on inflation indexed securities, if any, is accrued daily based upon an inflation adjusted principal. Additionally, any increase or decrease in the principal or face amount of the securities adjusted for inflation is recorded as interest income or loss. Income is not recognized on securities for which collection is not expected. Non-cash dividends, if any, are recorded at the fair market value of the securities received. In determining the net gain or loss on securities sold, the cost of securities is determined on the identified cost basis.
Expenses
The majority of expenses of the Trust are directly identifiable to an individual fund. Expenses which are not readily identifiable to a specific fund are allocated taking into consideration, among other things, the nature and type of expense and the relative size of the funds. In addition, the Fund will also incur certain fees and expenses indirectly as a shareholder in the underlying funds. Because the underlying funds have varied expense and fee levels and the Fund may own different proportions of the underlying funds at different times, the amount of fees and expenses indirectly incurred by the Fund will vary (See Note 3).
State Street Bank and Trust Company ("State Street") serves as custodian, fund accounting agent and transfer agent of the Fund. State Street's fee may be reduced by credits that are an earnings allowance calculated on the average daily cash balances the Fund maintains with State Street. Credit balances used to reduce the fee paid to State Street, if any, are reported as a reduction of expenses in the Statement of Operations.
Recently issued accounting pronouncements
In June 2006, the Financial Accounting Standards Board ("FASB") issued FASB Interpretation No. 48, Accounting for Uncertainty in Income Taxes – an Interpretation of FASB Statement No. 109 ("FIN 48"). FIN 48 clarifies the accounting for uncertainty in income taxes recognized in accordance with FASB Statement No. 109, Accounting for Income Taxes. FIN 48 prescribes a recognition threshold and measurement attribute for a tax position taken or expected to be taken in the tax return that could impact
12
GMO Short-Duration Investment Fund
(A Series of GMO Trust)
Notes to Financial Statements — (Continued)
February 29, 2008
the Fund's financial statements. It also provides guidance in relation to the Fund's financial statements on classification of tax benefits or liabilities, interest and penalties, accounting in interim periods, disclosure, and transition. FIN 48 is effective for fiscal years beginning after December 15, 2006 for registered investment companies. Management has evaluated the effects of applying the various provisions of FIN 48 and has determined that the adoption of FIN 48 does not have a material effect on the Fund's financial statements. The Fund's federal tax returns for the prior three fiscal years, if applicable, remain subject to examination by the Internal Revenue Service. Management will continue to monitor the rules and guidance pertaining to FIN 48 and will take action if appropriate.
In September 2006, the FASB issued Statement of Financial Accounting Standards No. 157 ("FAS 157"), "Fair Value Measurements." FAS 157 defines fair value, establishes a framework for measuring fair value in accordance with generally accepted accounting principles and expands disclosure about fair value measurements. FAS 157 is effective for fiscal years beginning after November 15, 2007. Management is currently evaluating the impact the adoption of FAS 157 will have on the Fund's financial statement disclosures.
3. Fees and other transactions with affiliates
GMO earns a management fee paid monthly at the annual rate of 0.05% of average daily net assets. The Fund has adopted a Shareholder Service Plan under which the Fund pays GMO a shareholder service fee for client and shareholder service, reporting, and other support. Pursuant to the Shareholder Service Plan, the shareholder service fee is calculated based on average daily net assets at the annual rate of 0.15% for Class III shares.
The Manager has contractually agreed to reimburse the Fund for Fund expenses through at least June 30, 2008 to the extent the Fund's total annual operating expenses (excluding shareholder service fees, expense indirectly incurred by investment in underlying funds, fees and expenses of the independent Trustees of the Trust, fees and expenses for legal services not approved by the Manager for the Trust, compensation and expenses of the Trust's Chief Compliance Officer ("CCO") (excluding any employee benefits), brokerage commissions, securities lending fees and expenses, interest expense, transfer taxes, and other investment-related costs (including expenses associated with investments in any company that is an investment company or would be an investment company under the 1940 Act, but for the exceptions to the definition of investment company provided in Section 3(c)(1) and 3(c)(7) of the 1940 Act), hedging transaction fees, extr aordinary, non-recurring and certain other unusual expenses (including taxes)) exceed 0.05% of the Fund's average daily net assets.
13
GMO Short-Duration Investment Fund
(A Series of GMO Trust)
Notes to Financial Statements — (Continued)
February 29, 2008
The Fund incurs fees and expenses indirectly as a shareholder in the underlying funds. For the year ended February 29, 2008, these indirect fees and expenses expressed as an annualized percentage of the Fund's average daily net assets were as follows:
| Indirect Net Expenses (excluding shareholder service fees and interest expense) | Indirect Shareholder Service Fees | Indirect Interest Expense | Total Indirect Expenses | ||||||||||||
| 0.001 | % | 0.000 | % | 0.000 | % | 0.001 | % | ||||||||
The Fund's portion of the fees paid by the Trust to the independent Trustees and CCO during the year ended February 29, 2008 was $114 and $51, respectively. The compensation and expenses of the CCO are included in miscellaneous expenses in the Statement of Operations. No remuneration was paid by the Fund to any other officer of the Trust.
4. Purchases and sales of securities
For the year ended February 29, 2008, cost of purchases and proceeds from sales of investments, other than short-term obligations, were as follows:
| Purchases | Sales | ||||||||||
| U.S. Government securities | $ | — | $ | 3,566,272 | |||||||
| Investments (non-U.S. Government securities) | 736,947 | 21,000,000 | |||||||||
5. Guarantees
In the normal course of business the Fund enters into contracts with third-party service providers that contain a variety of representations and warranties and which provide general indemnifications. The Fund's maximum exposure under these arrangements is unknown, as this would involve future claims that may be made against the Fund that have not yet occurred. Based on experience, management is of the view that the risk of loss in connection with these potential indemnification obligations is remote; however, there can be no assurance that material liabilities related to such obligations will not arise in the future that could adversely impact the Fund.
6. Principal shareholders and related parties
As of February 29, 2008, 54.45% of the outstanding shares of the Fund were held by two shareholders, each holding in excess of 10% of the Fund's outstanding shares. No other shareholder owned in excess of
14
GMO Short-Duration Investment Fund
(A Series of GMO Trust)
Notes to Financial Statements — (Continued)
February 29, 2008
10% of the outstanding shares of the Fund. One of the shareholders is another fund of the Trust. Investment activities of these shareholders may have a material effect on the Fund.
As of February 29, 2008, 15.07% of the Fund's shares were held by sixteen related parties comprised of certain GMO employee accounts, and 80.68% of the Fund's shares were held by accounts for which the Manager has investment discretion.
7. Share transactions
The Declaration of Trust permits the Trustees to issue an unlimited number of shares of beneficial interest (without par value). Transactions in Fund shares were as follows:
| Year Ended February 29, 2008 | Year Ended February 28, 2007 | ||||||||||||||||||
| Class III: | Shares | Amount | Shares | Amount | |||||||||||||||
| Shares sold | 55,544 | $ | 469,351 | 343,252 | $ | 3,089,088 | |||||||||||||
| Shares issued to shareholders in reinvestment of distributions | 60,822 | 528,993 | 184,742 | 1,642,384 | |||||||||||||||
| Shares repurchased | (2,751,782 | ) | (24,781,487 | ) | (360,524 | ) | (3,237,596 | ) | |||||||||||
| Net increase (decrease) | (2,635,416 | ) | $ | (23,783,143 | ) | 167,470 | $ | 1,493,876 | |||||||||||
8. Investments in affiliated issuers
A summary of the Fund's transactions in the shares of affiliated issuers during the year ended February 29, 2008 is set forth below:
| Affiliate | Value, beginning of period | Purchases | Sales Proceeds | Dividend Income | Distributions of Realized Gains | Value, end of period | |||||||||||||||||||||
| GMO Short-Duration Collateral Fund | $ | 25,797,458 | $ | 736,947 | $ | 21,000,000 | $ | 396,947 | $ | — | $ | 5,324,037 | |||||||||||||||
| GMO Special Purpose Holding Fund | 12,961 | — | — | — | 59,618 | 11,582 | |||||||||||||||||||||
| Totals | $ | 25,810,419 | $ | 736,947 | $ | 21,000,000 | $ | 396,947 | $ | 59,618 | $ | 5,335,619 | |||||||||||||||
15
Report of Independent Registered Public Accounting Firm
To the Trustees of GMO Trust and the Shareholders of
GMO Short-Duration Investment Fund
In our opinion, the accompanying statement of assets and liabilities, including the schedule of investments, and the related statements of operations and of changes in net assets and the financial highlights present fairly, in all material respects, the financial position of GMO Short-Duration Investment Fund (the "Fund") at February 29, 2008, the results of its operations for the year then ended, the changes in its net assets for each of the two years in the period then ended and the financial highlights for each of the five years in the period then ended, in conformity with accounting principles generally accepted in the United States of America. These financial statements and financial highlights (hereafter referred to as "financial statements") are the responsibility of the Fund's management; our responsibility is to express an opinion on these financial statements based on our audits. We conducted our audits of these financ ial statements in accordance with the standards of the Public Company Accounting Oversight Board (United States). Those standards require that we plan and perform the audit to obtain reasonable assurance about whether the financial statements are free of material misstatement. An audit includes examining, on a test basis, evidence supporting the amounts and disclosures in the financial statements, assessing the accounting principles used and significant estimates made by management, and evaluating the overall financial statement presentation. We believe that our audits, which included confirmation of securities at February 29, 2008 by correspondence with the custodian, provide a reasonable basis for our opinion.
PricewaterhouseCoopers LLP
Boston, Massachusetts
April 29, 2008
16
GMO Short-Duration Investment Fund
(A Series of GMO Trust)
Fund Expenses
February 29, 2008 (Unaudited)
Expense Examples: The following information is in relation to expenses for the six month period ended February 29, 2008.
As a shareholder of the Fund, you may incur two types of costs: (1) transaction costs, and (2) ongoing costs, including management fees, shareholder service fees, and other Fund expenses. This example is intended to help you understand your ongoing costs (in dollars) of investing in the Fund and to compare these costs with the ongoing costs of investing in other mutual funds.
These examples are based on an investment of $1,000 invested at the beginning of the period and held for the entire period, September 1, 2007 through February 29, 2008.
Actual Expenses
The first line of the table below provides information about actual account values and actual expenses. You may use the information in this line, together with the amount you invested, to estimate the expenses that you paid over the period. Simply divide your account value by $1,000 (for example, a $10,000,000 account value divided by $1,000 = 10,000), then multiply the result by the number in the first line under the heading entitled "Net Expense Incurred" to estimate the expenses you paid on your account during this period.
Hypothetical Example for Comparison Purposes
The second line of the table below provides information about hypothetical account values and hypothetical expenses based on the Fund's actual expense ratio and an assumed rate of return of 5% per year before expenses, which is not the Fund's actual return. The hypothetical account values and expenses may not be used to estimate the actual ending account balance or expenses you paid for the period. You may use this information to compare the ongoing costs of investing in the Fund with other funds. To do so, compare this 5% hypothetical example with the 5% hypothetical examples that appear in the shareholder reports of other funds.
Please note that the expenses shown in the table are meant to highlight your ongoing costs only and do not reflect any transactional costs. Therefore, the second line of the table is useful in comparing ongoing costs only, and will not help you determine the relative total costs of owning different funds. In addition, if these transactional costs were included, your costs would have been higher.
| Annualized Net Expense Ratio | Beginning Account Value | Ending Account Value | Net Expense Incurred* | ||||||||||||||||
| Class III | |||||||||||||||||||
| 1) Actual | 0.20 | % | $ | 1,000.00 | $ | 987.50 | $ | 0.99 | |||||||||||
| 2) Hypothetical | 0.20 | % | $ | 1,000.00 | $ | 1,023.87 | $ | 1.01 | |||||||||||
* Expenses are calculated using the Class's annualized net expense ratio (including indirect expenses incurred) for the six months ended February 29, 2008, multiplied by the average account value over the period, multiplied by 182 days in the period, divided by 366 days in the year.
17
GMO Short-Duration Investment Fund
(A Series of GMO Trust)
Tax Information for the Tax Year Ended February 29, 2008 (Unaudited)
The Fund will notify shareholders of amounts for use in preparing 2008 income tax forms in January 2009.
The Fund hereby designates as qualified interest income with respect to its taxable year ended February 29, 2008, $281,931 or if determined to be different, the qualified interest income of such year.
18
Trustees and Officers (Unaudited)
The following tables list the Trust's Trustees and Officers as of the date of this report; their address and date of birth ("DOB"); their position with the Trust; the length of time holding that position with the Trust; their principal occupation(s) during the past five years; the number of portfolios in the fund complex they oversee; and other directorships they hold in companies subject to registration or reporting requirements of the Securities Exchange Act of 1934 (generally called "public companies") or in registered investment companies. The Trust's Statement of Additional Information ("SAI") includes additional information about the Trust's trustees, including changes subsequent to the date of the report. The SAI is available, without charge, upon request by writing GMO, c/o GMO Trust, 40 Rowes Wharf, Boston, MA 02110.
Independent Trustees:
| Name, Address, | and DOB | Position(s) Held with Trust | Term of Office1 and Length of Time Served | Principal Occupation(s) During Past Five Years | Number of Portfolios in Fund Complex Overseen by Trustee | Other Directorships Held by Trustee | |||||||||||||||||||||
| Donald W. Glazer, Esq. c/o GMO Trust 40 Rowes Wharf Boston, MA 02110 DOB: 07/26/1944 | Chairman of the Board of Trustees | Chairman of the Board of Trustees since March 2005; Lead Independent Trustee (September 2004 – March 2005); Trustee since December 2000. | Consultant – Law and Business2; Vice Chair (since 2002) and Secretary, Provant, Inc. (provider of personnel performance improvement services and training products); Author of Legal Treatises. | 47 | None. | ||||||||||||||||||||||
1 Each Trustee is elected to serve during the continued lifetime of the Trust until he/she dies, resigns or is removed, or if sooner, until the next meeting of Shareholders called for the purpose of electing Trustees and until the election and qualification of his/her successor.
2 As part of Mr. Glazer's work as a consultant, he provides part-time consulting services to Goodwin Procter LLP ("Goodwin"). Goodwin has provided legal services to Renewable Resources, LLC, an affiliate of GMO; GMO, in connection with its relationship with Renewable Resources; and funds managed by Renewable Resources. Mr. Glazer has represented that he has no financial interest in, and is not involved in the provision of, such legal services. In the calendar years ended December 31, 2006 and December 31, 2007, these entities paid $825,738 and $291,721 respectively, in legal fees and disbursements to Goodwin.
19
Independent Trustees — (Continued)
| Name, Address, | and DOB | Position(s) Held with Trust | Term of Office1 and Length of Time Served | Principal Occupation(s) During Past Five Years | Number of Portfolios in Fund Complex Overseen by Trustee | Other Directorships Held by Trustee | |||||||||||||||||||||
| Jay O. Light c/o GMO Trust 40 Rowes Wharf Boston, MA 02110 DOB: 10/03/1941 | Trustee | Since May 1996. | Dean (since April 2006), Acting Dean (August 2005 – April 2006), Senior Associate Dean (1998 – 2005), and Professor of Business Administration, Harvard Business School. | 47 | Director of Harvard Management Company, Inc.3 and Verde, Inc.; Director of Partners HealthCare System, Inc. and Chair of its Investment Committee.4 | ||||||||||||||||||||||
| W. Nicholas Thorndike c/o GMO Trust 40 Rowes Wharf Boston, MA 02110 DOB: 03/28/1933 | Trustee | Since March 2005. | Director or trustee of various corporations and charitable organizations, including Courier Corporation (a book publisher and manufacturer) (July 1989 – present); Putnam Funds (December 1992 – June 2004); and Providence Journal (a newspaper publisher) (December 1986 – December 2003). | 47 | Director of Courier Corporation (a book publisher and manufacturer); Member of the Investment Committee of Partners HealthCare System, Inc.4 | ||||||||||||||||||||||
1 Each Trustee is elected to serve during the continued lifetime of the Trust until he/she dies, resigns or is removed, or if sooner, until the next meeting of Shareholders called for the purpose of electing Trustees and until the election and qualification of his/her successor.
3 Harvard Management Company, Inc. is a client of the Manager.
4 Partners HealthCare System, Inc. is a client of the Manager.
20
Principal Officers:
| Name, Address, and DOB | Position(s) Held with Trust | Term of Office5 and Length of Time Served | Principal Occupation(s) During Past Five Years | ||||||||||||
| Scott Eston c/o GMO Trust 40 Rowes Wharf Boston, MA 02110 DOB: 01/20/1956 | President and Chief Executive Officer | President and Chief Executive Officer since October 2002; Chief Financial Officer, November 2006 – February 2007. | Chief Financial Officer, Chief Operating Officer and Member, Grantham, Mayo, Van Otterloo & Co. LLC. | ||||||||||||
| Sheppard N. Burnett c/o GMO Trust 40 Rowes Wharf Boston, MA 02110 DOB: 10/24/1968 | Treasurer and Chief Financial Officer | Chief Financial Officer since March 2007; Treasurer since November 2006; Assistant Treasurer, September 2004 – November 2006. | Fund Administration Staff, Grantham, Mayo, Van Otterloo & Co. LLC (June 2004 – present); Vice President, Director of Tax, Columbia Management Group (2002 – 2004). | ||||||||||||
| Brent C. Arvidson c/o GMO Trust 40 Rowes Wharf Boston, MA 02110 DOB: 06/26/1969 | Assistant Treasurer | Since August 1998. | Senior Fund Administrator, Grantham, Mayo, Van Otterloo & Co. LLC. | ||||||||||||
| John L. Nasrah c/o GMO Trust 40 Rowes Wharf Boston, MA 02110 DOB: 05/27/1977 | Assistant Treasurer | Since March 2007. | Fund Administrator, Grantham, Mayo, Van Otterloo & Co. LLC (September 2004 – present); Tax Analyst, Bain & Company, Inc (June 2003 – September 2004); Senior Tax Associate, PricewaterhouseCoopers LLP (2001-2003). | ||||||||||||
| Mahmoodur Rahman c/o GMO Trust 40 Rowes Wharf Boston, MA 02110 DOB: 11/30/1967 | Assistant Treasurer | Since September 2007. | Fund Administrator, Grantham, Mayo, Van Otterloo & Co. (April 2007 – present); Vice President and Senior Tax Manager, Massachusetts Financial Services Company (January 2000 – April 2007). | ||||||||||||
5 Officers are elected to hold such office until their successor is elected and qualified to carry out the duties and responsibilities of their office, or until he or she resigns or is removed from office.
21
Principal Officers — (Continued)
| Name, Address, and DOB | Position(s) Held with Trust | Term of Office5 and Length of Time Served | Principal Occupation(s) During Past Five Years | ||||||||||||
| Michael E. Gillespie c/o GMO Trust 40 Rowes Wharf Boston, MA 02110 DOB: 02/18/1958 | Chief Compliance Officer | Since March 2005. | Vice President of Compliance (June 2004 – February 2005) and Director of Domestic Compliance (March 2002 – June 2004), Fidelity Investments; Vice President and Senior Counsel, State Street Bank and Trust Company (May 1998 – March 2002) | ||||||||||||
| Jason B. Harrison c/o GMO Trust 40 Rowes Wharf Boston, MA 02110 DOB: 01/29/1977 | Vice President and Clerk | Vice President since November 2006; Clerk since March 2006. | Legal Counsel, Grantham, Mayo, Van Otterloo & Co. LLC (since February 2006) and Attorney, Ropes & Gray LLP (September 2002 – February 2006). | ||||||||||||
| David L. Bohan c/o GMO Trust 40 Rowes Wharf Boston, MA 02110 DOB: 06/21/1964 | Vice President and Assistant Clerk | Vice President since March 2005; Assistant Clerk since March 2006. | Legal Counsel, Grantham, Mayo, Van Otterloo & Co. LLC (September 2003 – present); Attorney, Goodwin Procter LLP (September 1996 – September 2003). | ||||||||||||
| Gregory L. Pottle c/o GMO Trust 40 Rowes Wharf Boston, MA 02110 DOB: 07/09/1971 | Vice President and Assistant Clerk | Since November 2006. | Legal Counsel, Grantham, Mayo, Van Otterloo & Co. LLC. | ||||||||||||
| Anne K. Trinque c/o GMO Trust 40 Rowes Wharf Boston, MA 02110 DOB: 04/15/1978 | Vice President and Assistant Clerk | Since September 2007. | Legal Counsel, Grantham, Mayo, Van Otterloo & Co. LLC (since January 2007); Attorney, Goodwin Procter LLP (September 2003 – January 2007). | ||||||||||||
5 Officers are elected to hold such office until their successor is elected and qualified to carry out the duties and responsibilities of their office, or until he or she resigns or is removed from office.
22
Principal Officers — (Continued)
| Name, Address, and DOB | Position(s) Held with Trust | Term of Office5 and Length of Time Served | Principal Occupation(s) During Past Five Years | ||||||||||||
| Cheryl Wakeham c/o GMO Trust 40 Rowes Wharf Boston, MA 02110 DOB: 10/29/1958 | Anti-Money Laundering Officer | Since December 2004. | Manager, Client Service Administration, Grantham, Mayo, Van Otterloo & Co. LLC. | ||||||||||||
5 Officers are elected to hold such office until their successor is elected and qualified to carry out the duties and responsibilities of their office, or until he or she resigns or is removed from office.
23
GMO U.S. Small/Mid Cap Growth Fund
(A Series of GMO Trust)
Annual Report
February 29, 2008
For a free copy of the Fund's proxy voting guidelines, shareholders may call 1-617-346-7646 (collect), visit our website at www.gmo.com, or visit the Securities and Exchange Commission's website at www.sec.gov. Information regarding how the Fund voted proxies relating to portfolio securities during the most recent 12-month period ended June 30 is available on our website at www.gmo.com, or on the Securities and Exchange Commission's website at www.sec.gov.
The Fund files its complete schedule of portfolio holdings with the Securities and Exchange Commission for the first and third quarter of each fiscal year on Form N-Q, which is available on the Commission's website at www.sec.gov. The Fund's Form N-Q may be reviewed and copied at the Commission's Public Reference Room in Washington, D.C. Information on the operation of the Public Reference Room may be obtained by calling 1-800-SEC-0330. The Fund has a policy with respect to disclosure of portfolio holdings under which it may also make available on GMO's website (www.gmo.com) a complete schedule of portfolio holdings.
This report is prepared for the general information of shareholders. It is authorized for distribution to prospective investors only when preceded or accompanied by a prospectus for the GMO Trust.
GMO U.S. Small/Mid Cap Growth Fund
(A Series of GMO Trust)
Portfolio Management
Day-to-day management of the Fund's portfolio is the responsibility of the U.S. Quantitative team at Grantham, Mayo, Van Otterloo & Co. LLC.
Management Discussion and Analysis of Fund Performance
The GMO U.S. Small/Mid Cap Growth Fund returned -11.7% for the fiscal year ended February 29, 2008, as compared to -4.3% for the Russell 2500 Growth Index. The Fund was invested substantially in U.S. equity securities throughout the period.
Stock selection detracted from returns relative to the Russell 2500 Growth Index. Selections in Materials and Telecommunication Services added to relative returns while selections in Consumer Discretionary, Financials, and Energy detracted. Individual names adding to relative returns included overweight positions in CF Industries, Priceline.com, and Cleveland-Cliffs. Individual names detracting from relative returns included overweight positions in First Marblehead, ITT Educational Services, and American Eagle Outfitters.
Sector selection detracted from returns relative to the Russell 2500 Growth Index. Sector weightings positively impacting relative performance included an overweight in Materials and underweight positions in Financials and Telecommunication Services. Sector weightings negatively impacting relative performance included an overweight in Consumer Discretionary and underweight positions in Energy and Health Care.
The views expressed herein are exclusively those of Grantham, Mayo, Van Otterloo & Co. LLC Management as of the date of this report and are subject to change. GMO disclaims any responsibility to update such views. They are not meant as investment advice. References to specific securities are not recommendations of such securities and may not be representative of any GMO portfolio's current or future investments.
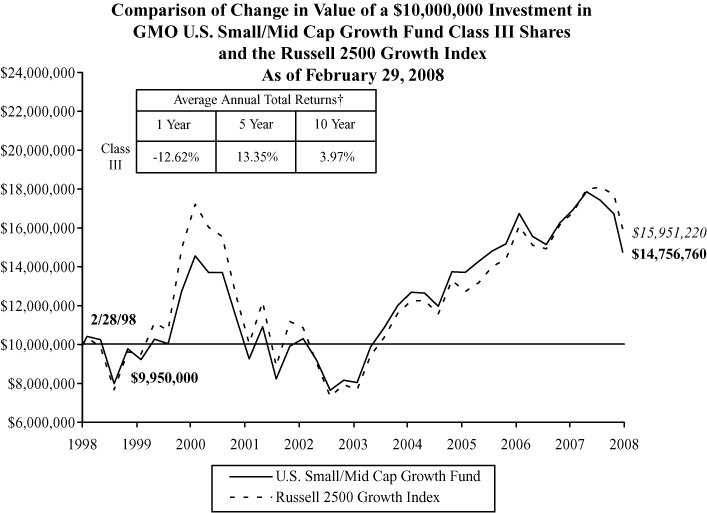
Performance data quoted represents past performance and is not indicative of future results. The investment return and principal value of an investment will fluctuate so that an investor's shares, when redeemed, may be worth more or less than their original cost. Current performance data may be lower or higher than the performance data provided herein. To obtain performance information to the most recent month-end, visit www.gmo.com. Performance shown is net of all fees after reimbursement from the Manager. Each performance figure assumes a purchase at the beginning and redemption at the end of the stated period and reflects a transaction fee of .50% on the purchase and .50% on the redemption. Transaction fees are retained by the Fund to cover trading costs. Returns would have been lower had certain expenses not been reimbursed during the periods shown and do not include the effect of taxes on distributions and redemptions. All information is unaudited.
† The Fund is the successor to the GMO Small/Mid Cap Growth Fund, therefore, performance for the periods prior to September 16, 2005 is that of GMO Small/Mid Cap Growth Fund.
GMO U.S. Small/Mid Cap Growth Fund
(A Series of GMO Trust)
Investments Concentration Summary
February 29, 2008 (Unaudited)
| Asset Class Summary | % of Total Net Assets | ||||||
| Common Stocks | 99.6 | % | |||||
| Short-Term Investments | 1.1 | ||||||
| Other | (0.7 | ) | |||||
| 100.0 | % | ||||||
| Industry Sector Summary | % of Equity Investments | ||||||
| Health Care | 20.4 | % | |||||
| Industrials | 18.5 | ||||||
| Consumer Discretionary | 18.4 | ||||||
| Information Technology | 14.9 | ||||||
| Materials | 7.6 | ||||||
| Consumer Staples | 6.6 | ||||||
| Financials | 6.3 | ||||||
| Energy | 6.3 | ||||||
| Utilities | 1.0 | ||||||
| 100.0 | % | ||||||
1
GMO U.S. Small/Mid Cap Growth Fund
(A Series of GMO Trust)
Schedule of Investments
(showing percentage of total net assets)
February 29, 2008
| Shares | Description | Value ($) | |||||||||||||
| COMMON STOCKS — 99.6% | |||||||||||||||
| Consumer Discretionary — 18.3% | |||||||||||||||
| 200 | Abercrombie & Fitch Co.-Class A | 15,506 | |||||||||||||
| 1,000 | Advance Auto Parts, Inc. | 33,540 | |||||||||||||
| 1,400 | Aeropostale, Inc. * | 37,604 | |||||||||||||
| 600 | American Eagle Outfitters, Inc. | 12,822 | |||||||||||||
| 500 | Blue Nile, Inc. * | 22,080 | |||||||||||||
| 700 | BorgWarner, Inc. | 30,177 | |||||||||||||
| 600 | Buckle, Inc. | 27,240 | |||||||||||||
| 400 | Buffalo Wild Wings, Inc. * | 9,268 | |||||||||||||
| 1,400 | Career Education Corp. * | 20,790 | |||||||||||||
| 600 | Chico's FAS, Inc. * | 5,586 | |||||||||||||
| 100 | Chipotle Mexican Grill, Inc.-Class A * | 9,930 | |||||||||||||
| 1,100 | Choice Hotels International, Inc. | 35,695 | |||||||||||||
| 1,100 | Crocs, Inc. * | 26,752 | |||||||||||||
| 700 | Deckers Outdoor Corp. * | 77,448 | |||||||||||||
| 600 | DeVry, Inc. | 26,364 | |||||||||||||
| 100 | Dick's Sporting Goods, Inc. * | 2,758 | |||||||||||||
| 800 | Discovery Holding Co.-Class A * | 18,056 | |||||||||||||
| 1,000 | Dollar Tree Stores, Inc. * | 26,830 | |||||||||||||
| 1,450 | Fossil, Inc. * | 46,661 | |||||||||||||
| 1,400 | GameStop Corp.-Class A * | 59,304 | |||||||||||||
| 2,300 | Gentex Corp. | 37,076 | |||||||||||||
| 200 | Getty Images, Inc. * | 6,432 | |||||||||||||
| 2,200 | Guess?, Inc. | 90,486 | |||||||||||||
| 1,900 | Hasbro, Inc. | 48,963 | |||||||||||||
| 100 | Hibbett Sports, Inc. * | 1,580 | |||||||||||||
| 1,100 | Interactive Data Corp. | 32,186 | |||||||||||||
| 1,700 | ITT Educational Services, Inc. * | 93,874 | |||||||||||||
| 100 | J Crew Group, Inc. * | 4,005 | |||||||||||||
| 1,400 | Jack in the Box, Inc. * | 36,778 | |||||||||||||
| 400 | John Wiley and Sons, Inc.-Class A | 14,592 | |||||||||||||
| 1,100 | LKQ Corp. * | 23,364 | |||||||||||||
| 1,300 | Marvel Entertainment, Inc. * | 32,695 | |||||||||||||
See accompanying notes to the financial statements.
2
GMO U.S. Small/Mid Cap Growth Fund
(A Series of GMO Trust)
Schedule of Investments — (Continued)
(showing percentage of total net assets)
February 29, 2008
| Shares | Description | Value ($) | |||||||||||||
| Consumer Discretionary — continued | |||||||||||||||
| 100 | Matthews International Corp.-Class A | 4,486 | |||||||||||||
| 300 | Men's Wearhouse, Inc. | 6,912 | |||||||||||||
| 1,200 | O'Reilly Automotive, Inc. * | 32,352 | |||||||||||||
| 100 | PetMed Express, Inc. * | 1,145 | |||||||||||||
| 200 | PetSmart, Inc. | 4,306 | |||||||||||||
| 100 | PF Chang's China Bistro, Inc. * | 2,853 | |||||||||||||
| 400 | Polaris Industries, Inc. | 15,272 | |||||||||||||
| 300 | Pre-Paid Legal Services, Inc. * | 14,295 | |||||||||||||
| 1,100 | Priceline.com, Inc. * | 125,422 | |||||||||||||
| 200 | Ross Stores, Inc. | 5,570 | |||||||||||||
| 1,100 | Service Corporation International | 11,880 | |||||||||||||
| 300 | Spartan Motors, Inc. | 2,439 | |||||||||||||
| 400 | Strayer Education, Inc. | 62,280 | |||||||||||||
| 400 | Sturm, Ruger & Co, Inc. * | 3,160 | |||||||||||||
| 400 | Tempur-Pedic International, Inc. | 6,968 | |||||||||||||
| 300 | Thor Industries, Inc. | 9,144 | |||||||||||||
| 2,000 | Tiffany & Co. | 75,280 | |||||||||||||
| 100 | Tractor Supply Co. * | 3,744 | |||||||||||||
| 900 | Tupperware Corp. | 32,832 | |||||||||||||
| 100 | Universal Electronics, Inc. * | 2,270 | |||||||||||||
| 2,700 | Urban Outfitters, Inc. * | 77,706 | |||||||||||||
| 700 | Weight Watchers International, Inc. | 32,900 | |||||||||||||
| 100 | Williams-Sonoma, Inc. | 2,336 | |||||||||||||
| Total Consumer Discretionary | 1,501,994 | ||||||||||||||
| Consumer Staples — 6.6% | |||||||||||||||
| 800 | Alberto-Culver Co. | 21,440 | |||||||||||||
| 100 | Bare Escentuals, Inc. * | 2,738 | |||||||||||||
| 400 | Boston Beer Co., Inc.-Class A * | 14,264 | |||||||||||||
| 600 | Central European Distribution Corp. * | 34,908 | |||||||||||||
| 500 | Chattem, Inc. * | 38,950 | |||||||||||||
| 1,100 | Church & Dwight Co., Inc. | 58,806 | |||||||||||||
| 100 | Darling International, Inc. * | 1,390 | |||||||||||||
| 1,300 | Energizer Holdings, Inc. * | 120,679 | |||||||||||||
See accompanying notes to the financial statements.
3
GMO U.S. Small/Mid Cap Growth Fund
(A Series of GMO Trust)
Schedule of Investments — (Continued)
(showing percentage of total net assets)
February 29, 2008
| Shares | Description | Value ($) | |||||||||||||
| Consumer Staples — continued | |||||||||||||||
| 100 | Estee Lauder Cos. (The), Inc.-Class A | 4,258 | |||||||||||||
| 1,200 | Flowers Foods, Inc. | 27,192 | |||||||||||||
| 400 | Fresh Del Monte Produce, Inc. * | 13,284 | |||||||||||||
| 600 | Green Mountain Coffee Roasters, Inc. * | 18,306 | |||||||||||||
| 1,700 | Hansen Natural Corp. * | 70,550 | |||||||||||||
| 100 | Herbalife, Ltd. | 4,183 | |||||||||||||
| 1,300 | Hormel Foods Corp. | 53,118 | |||||||||||||
| 200 | JM Smucker Co. (The) | 10,238 | |||||||||||||
| 1,100 | McCormick & Co., Inc. (Non Voting) | 37,895 | |||||||||||||
| 100 | Ralcorp Holdings, Inc. * | 5,545 | |||||||||||||
| 100 | USANA Health Sciences, Inc. * | 3,118 | |||||||||||||
| Total Consumer Staples | 540,862 | ||||||||||||||
| Energy — 6.3% | |||||||||||||||
| 200 | Alon USA Energy, Inc. | 3,138 | |||||||||||||
| 200 | Alpha Natural Resources, Inc. * | 8,108 | |||||||||||||
| 100 | Atlas America, Inc. | 6,047 | |||||||||||||
| 300 | Atwood Oceanics, Inc. * | 27,927 | |||||||||||||
| 100 | Berry Petroleum Co. | 4,111 | |||||||||||||
| 100 | Cabot Oil & Gas Corp. | 4,975 | |||||||||||||
| 200 | Cheniere Energy, Inc. * | 5,866 | |||||||||||||
| 100 | Cimarex Energy Co. | 5,270 | |||||||||||||
| 100 | Delek US Holdings, Inc. | 1,578 | |||||||||||||
| 1,800 | Denbury Resources, Inc. * | 57,402 | |||||||||||||
| 900 | Dresser-Rand Group, Inc. * | 30,663 | |||||||||||||
| 2,000 | FMC Technologies, Inc. * | 113,320 | |||||||||||||
| 1,800 | Frontier Oil Corp. | 64,278 | |||||||||||||
| 200 | Global Industries Ltd. * | 3,682 | |||||||||||||
| 200 | Helmerich & Payne, Inc. | 8,966 | |||||||||||||
| 800 | Holly Corp. | 42,712 | |||||||||||||
| 1,300 | Oceaneering International, Inc. * | 78,000 | |||||||||||||
| 200 | Oil States International, Inc. * | 8,432 | |||||||||||||
| 100 | Range Resources Corp. | 6,118 | |||||||||||||
| 200 | Tidewater, Inc. | 11,230 | |||||||||||||
See accompanying notes to the financial statements.
4
GMO U.S. Small/Mid Cap Growth Fund
(A Series of GMO Trust)
Schedule of Investments — (Continued)
(showing percentage of total net assets)
February 29, 2008
| Shares | Description | Value ($) | |||||||||||||
| Energy — continued | |||||||||||||||
| 200 | Unit Corp. * | 11,030 | |||||||||||||
| 300 | Western Refining, Inc. | 5,976 | |||||||||||||
| 100 | Willbros Group, Inc. * | 3,426 | |||||||||||||
| Total Energy | 512,255 | ||||||||||||||
| Financials — 6.3% | |||||||||||||||
| 1,600 | Brown & Brown, Inc. | 28,528 | |||||||||||||
| 600 | Cohen & Steers, Inc. | 15,108 | |||||||||||||
| 3,100 | Eaton Vance Corp. | 98,735 | |||||||||||||
| 300 | Entertainment Properties Trust REIT | 14,061 | |||||||||||||
| 700 | Erie Indemnity Co.-Class A | 34,545 | |||||||||||||
| 1,200 | Federated Investors, Inc.-Class B | 48,696 | |||||||||||||
| 100 | First Marblehead Corp. (The) | 1,203 | |||||||||||||
| 200 | Frontier Financial Corp. | 2,996 | |||||||||||||
| 100 | HCC Insurance Holdings, Inc. | 2,406 | |||||||||||||
| 300 | IntercontinentalExchange, Inc. * | 39,090 | |||||||||||||
| 500 | Janus Capital Group, Inc. | 12,110 | |||||||||||||
| 100 | Markel Corp. * | 46,475 | |||||||||||||
| 300 | Odyssey Re Holdings Corp. | 10,854 | |||||||||||||
| 1,000 | Philadelphia Consolidated Holding Corp. * | 33,920 | |||||||||||||
| 3,900 | SEI Investment Co. | 97,539 | |||||||||||||
| 100 | Stifel Financial Corp. * | 4,359 | |||||||||||||
| 100 | SVB Financial Group * | 4,530 | |||||||||||||
| 600 | Waddell and Reed Financial, Inc. | 18,804 | |||||||||||||
| Total Financials | 513,959 | ||||||||||||||
| Health Care — 20.3% | |||||||||||||||
| 400 | Applera Corp. - Applied Biosystems Group | 13,484 | |||||||||||||
| 500 | ArthoCare Corp. * | 20,075 | |||||||||||||
| 300 | Barr Pharmaceuticals, Inc. * | 14,145 | |||||||||||||
| 200 | Bio-Rad Laboratories, Inc. * | 18,888 | |||||||||||||
| 700 | Cerner Corp. * | 30,415 | |||||||||||||
| 700 | Charles River Laboratories International, Inc. * | 41,006 | |||||||||||||
| 500 | Chemed Corp. | 23,855 | |||||||||||||
See accompanying notes to the financial statements.
5
GMO U.S. Small/Mid Cap Growth Fund
(A Series of GMO Trust)
Schedule of Investments — (Continued)
(showing percentage of total net assets)
February 29, 2008
| Shares | Description | Value ($) | |||||||||||||
| Health Care — continued | |||||||||||||||
| 1,300 | Covance, Inc. * | 109,733 | |||||||||||||
| 200 | CV Therapeutics, Inc. * | 1,168 | |||||||||||||
| 2,800 | DENTSPLY International, Inc. | 109,312 | |||||||||||||
| 400 | Dionex Corp. * | 29,528 | |||||||||||||
| 400 | Edwards Lifesciences Corp. * | 17,444 | |||||||||||||
| 500 | Emergency Medical Services, LP * | 12,365 | |||||||||||||
| 1,100 | Endo Pharmaceuticals Holdings, Inc. * | 28,886 | |||||||||||||
| 700 | Gen-Probe, Inc. * | 33,467 | |||||||||||||
| 300 | Health Net, Inc. * | 13,182 | |||||||||||||
| 1,300 | Henry Schein, Inc. * | 77,766 | |||||||||||||
| 1,700 | Idexx Laboratories, Inc. * | 94,299 | |||||||||||||
| 2,000 | Immucor, Inc. * | 59,600 | |||||||||||||
| 500 | Intuitive Surgical, Inc. * | 140,960 | |||||||||||||
| 1,000 | Invitrogen Corp. * | 84,490 | |||||||||||||
| 1,000 | Kinetic Concepts, Inc. * | 51,390 | |||||||||||||
| 600 | Lifecell Corp. * | 24,210 | |||||||||||||
| 700 | Lincare Holdings, Inc. * | 22,750 | |||||||||||||
| 1,700 | Meridian Bioscience, Inc. | 58,259 | |||||||||||||
| 200 | Onyx Pharmaceuticals, Inc. * | 5,464 | |||||||||||||
| 1,500 | Patterson Cos., Inc. * | 52,800 | |||||||||||||
| 1,100 | Pediatrix Medical Group, Inc. * | 72,611 | |||||||||||||
| 200 | PerkinElmer, Inc. | 4,964 | |||||||||||||
| 1,700 | Pharmaceutical Product Development, Inc. | 76,619 | |||||||||||||
| 400 | ResMed, Inc. * | 16,196 | |||||||||||||
| 1,600 | Respironics, Inc. * | 105,088 | |||||||||||||
| 600 | Techne Corp. * | 41,034 | |||||||||||||
| 300 | Varian Medical Systems, Inc. * | 15,735 | |||||||||||||
| 300 | Varian, Inc. * | 16,245 | |||||||||||||
| 900 | VCA Antech, Inc. * | 28,899 | |||||||||||||
| 300 | Warner Chilcott Ltd.-Class A * | 5,061 | |||||||||||||
| 1,600 | Waters Corp. * | 95,376 | |||||||||||||
| Total Health Care | 1,666,769 | ||||||||||||||
See accompanying notes to the financial statements.
6
GMO U.S. Small/Mid Cap Growth Fund
(A Series of GMO Trust)
Schedule of Investments — (Continued)
(showing percentage of total net assets)
February 29, 2008
| Shares | Description | Value ($) | |||||||||||||
| Industrials — 18.4% | |||||||||||||||
| 600 | ABM Industries, Inc. | 11,916 | |||||||||||||
| 400 | Alliant Techsystems, Inc. * | 41,976 | |||||||||||||
| 900 | Ametek, Inc. | 38,331 | |||||||||||||
| 100 | Baldor Electric Co. | 2,867 | |||||||||||||
| 100 | BE Aerospace, Inc. * | 3,430 | |||||||||||||
| 200 | Ceradyne, Inc. * | 6,222 | |||||||||||||
| 200 | Clarcor, Inc. | 7,160 | |||||||||||||
| 100 | Copa Holdings SA-Class A | 3,611 | |||||||||||||
| 1,600 | Copart, Inc. * | 66,656 | |||||||||||||
| 100 | Corrections Corporation of America * | 2,686 | |||||||||||||
| 900 | Donaldson Co., Inc. | 37,944 | |||||||||||||
| 900 | Dun & Bradstreet Corp. | 78,606 | |||||||||||||
| 300 | Dynamic Materials Corp. | 17,097 | |||||||||||||
| 100 | EMCOR Group, Inc. * | 2,409 | |||||||||||||
| 1,000 | Equifax, Inc. | 34,220 | |||||||||||||
| 600 | Fastenal Co. | 24,396 | |||||||||||||
| 100 | First Solar, Inc. * | 20,520 | |||||||||||||
| 300 | Flowserve Corp. | 32,670 | |||||||||||||
| 1,000 | FTI Consulting, Inc. * | 63,500 | |||||||||||||
| 100 | General Cable Corp. * | 6,172 | |||||||||||||
| 600 | Graco, Inc. | 20,826 | |||||||||||||
| 500 | Harsco Corp. | 28,245 | |||||||||||||
| 1,100 | Healthcare Services Group, Inc. | 21,758 | |||||||||||||
| 400 | Horizon Lines, Inc.-Class A | 8,068 | |||||||||||||
| 300 | Hubbell, Inc.-Class B | 13,611 | |||||||||||||
| 700 | Idex Corp | 21,112 | |||||||||||||
| 800 | II-VI, Inc. * | 26,192 | |||||||||||||
| 250 | Innovative Solutions & Support, Inc. * | 2,262 | |||||||||||||
| 2,000 | Jacobs Engineering Group, Inc. * | 160,580 | |||||||||||||
| 100 | JB Hunt Transport Services, Inc. | 2,737 | |||||||||||||
| 100 | KBR, Inc. * | 3,333 | |||||||||||||
| 200 | Landstar System, Inc. | 9,276 | |||||||||||||
| 500 | M&F Worldwide Corp. * | 18,515 | |||||||||||||
| 2,200 | Manitowoc Co. (The), Inc. | 89,628 | |||||||||||||
See accompanying notes to the financial statements.
7
GMO U.S. Small/Mid Cap Growth Fund
(A Series of GMO Trust)
Schedule of Investments — (Continued)
(showing percentage of total net assets)
February 29, 2008
| Shares | Description | Value ($) | |||||||||||||
| Industrials — continued | |||||||||||||||
| 500 | Middleby Corp. * | 34,000 | |||||||||||||
| 500 | Mine Safety Appliances Co. | 20,055 | |||||||||||||
| 1,200 | MSC Industrial Direct Co., Inc.-Class A | 48,696 | |||||||||||||
| 100 | Oshkosh Truck Corp. | 4,007 | |||||||||||||
| 1,700 | Pall Corp. | 66,929 | |||||||||||||
| 200 | Quanta Services, Inc. * | 4,776 | |||||||||||||
| 600 | Raven Industries, Inc. | 17,568 | |||||||||||||
| 300 | Resources Connection, Inc. | 4,830 | |||||||||||||
| 800 | Roper Industries, Inc. | 45,120 | |||||||||||||
| 100 | Shaw Group (The), Inc. * | 6,438 | |||||||||||||
| 100 | Spirit Aerosystems Holdings, Inc.-Class A * | 2,702 | |||||||||||||
| 1,700 | Stericycle, Inc. * | 91,613 | |||||||||||||
| 800 | Sunpower Corp.-Class A * | 52,576 | |||||||||||||
| 600 | Teledyne Technologies, Inc. * | 26,640 | |||||||||||||
| 300 | Teleflex, Inc. | 16,965 | |||||||||||||
| 300 | TeleTech Holdings, Inc. * | 6,771 | |||||||||||||
| 700 | Toro Co. | 33,726 | |||||||||||||
| 400 | Valmont Industries, Inc. | 31,960 | |||||||||||||
| 700 | Watson Wyatt Worldwide, Inc. | 37,135 | |||||||||||||
| 1,000 | Woodward Governor Co. | 28,570 | |||||||||||||
| Total Industrials | 1,509,609 | ||||||||||||||
| Information Technology — 14.8% | |||||||||||||||
| 100 | Activision, Inc. * | 2,725 | |||||||||||||
| 300 | ADTRAN, Inc. | 5,526 | |||||||||||||
| 500 | Advanced Analogic Technologies, Inc. * | 3,250 | |||||||||||||
| 100 | Alliance Data Systems Corp. * | 5,063 | |||||||||||||
| 1,200 | Amphenol Corp.-Class A | 44,364 | |||||||||||||
| 600 | Ansoft Corp. * | 14,592 | |||||||||||||
| 1,400 | Ansys, Inc. * | 52,318 | |||||||||||||
| 300 | Bankrate, Inc. * | 12,678 | |||||||||||||
| 200 | Blue Coat Systems, Inc. * | 4,696 | |||||||||||||
| 300 | BMC Software, Inc. * | 9,684 | |||||||||||||
| 200 | Broadridge Financial Solutions LLC | 3,830 | |||||||||||||
See accompanying notes to the financial statements.
8
GMO U.S. Small/Mid Cap Growth Fund
(A Series of GMO Trust)
Schedule of Investments — (Continued)
(showing percentage of total net assets)
February 29, 2008
| Shares | Description | Value ($) | |||||||||||||
| Information Technology — continued | |||||||||||||||
| 500 | Citrix Systems, Inc. * | 16,465 | |||||||||||||
| 600 | CommScope, Inc. * | 25,128 | |||||||||||||
| 100 | Comtech Telecommunications Corp. * | 4,338 | |||||||||||||
| 600 | Concur Technologies, Inc. * | 17,544 | |||||||||||||
| 900 | Cree, Inc. * | 27,810 | |||||||||||||
| 100 | DST Systems, Inc. * | 7,026 | |||||||||||||
| 1,950 | Factset Research Systems, Inc. | 102,648 | |||||||||||||
| 100 | Faro Technologies, Inc. * | 3,275 | |||||||||||||
| 4,500 | FLIR Systems, Inc. * | 128,070 | |||||||||||||
| 400 | Foundry Networks, Inc. * | 4,748 | |||||||||||||
| 100 | Gartner, Inc. * | 1,891 | |||||||||||||
| 1,100 | Global Payments, Inc. | 43,637 | |||||||||||||
| 100 | Informatica Corp. * | 1,746 | |||||||||||||
| 400 | Intersil Corp.-Class A | 9,308 | |||||||||||||
| 100 | j2 Global Communications, Inc. * | 2,152 | |||||||||||||
| 900 | Jack Henry and Associates, Inc. | 21,177 | |||||||||||||
| 400 | Manhattan Associates, Inc. * | 8,824 | |||||||||||||
| 1,700 | McAfee, Inc. * | 56,559 | |||||||||||||
| 1,300 | Mettler-Toledo International, Inc. * | 127,010 | |||||||||||||
| 1,400 | Micros Systems, Inc. * | 44,856 | |||||||||||||
| 400 | NAVTEQ Corp. * | 29,980 | |||||||||||||
| 100 | Netgear, Inc. * | 2,182 | |||||||||||||
| 100 | Novatel Wireless, Inc. * | 1,058 | |||||||||||||
| 200 | Nuance Communications, Inc. * | 3,290 | |||||||||||||
| 100 | Omniture, Inc. * | 2,298 | |||||||||||||
| 1,400 | ON Semiconductor Corp. * | 8,400 | |||||||||||||
| 1,400 | Polycom, Inc. * | 30,520 | |||||||||||||
| 200 | Power Integrations, Inc. * | 5,260 | |||||||||||||
| 500 | Semtech Corp. * | 6,370 | |||||||||||||
| 100 | Silicon Laboratories, Inc. * | 3,095 | |||||||||||||
| 800 | Sohu.Com, Inc. * | 36,064 | |||||||||||||
| 700 | Stratasys, Inc. * | 13,132 | |||||||||||||
| 200 | Synaptics, Inc. * | 5,358 | |||||||||||||
| 300 | Synchronoss Technologies, Inc. * | 4,824 | |||||||||||||
See accompanying notes to the financial statements.
9
GMO U.S. Small/Mid Cap Growth Fund
(A Series of GMO Trust)
Schedule of Investments — (Continued)
(showing percentage of total net assets)
February 29, 2008
| Shares | Description | Value ($) | |||||||||||||
| Information Technology — continued | |||||||||||||||
| 300 | Synopsys, Inc. * | 6,963 | |||||||||||||
| 1,200 | Syntel, Inc. | 32,676 | |||||||||||||
| 1,700 | Total System Services, Inc. | 37,791 | |||||||||||||
| 2,600 | Trimble Navigation Ltd. * | 71,084 | |||||||||||||
| 1,350 | Varian Semiconductor Equipment Associates, Inc. * | 45,603 | |||||||||||||
| 900 | Vasco Data Security International, Inc. * | 9,954 | |||||||||||||
| 100 | Websense, Inc. * | 1,947 | |||||||||||||
| 1,500 | Western Digital Corp. * | 46,305 | |||||||||||||
| Total Information Technology | 1,217,092 | ||||||||||||||
| Materials — 7.6% | |||||||||||||||
| 600 | AK Steel Holding Corp. | 31,572 | |||||||||||||
| 1,000 | Albemarle Corp. | 37,940 | |||||||||||||
| 900 | AptarGroup, Inc. | 33,732 | |||||||||||||
| 1,200 | Celanese Corp.-Class A | 46,680 | |||||||||||||
| 1,100 | CF Industries Holdings, Inc. | 134,288 | |||||||||||||
| 300 | Cleveland-Cliffs, Inc. | 35,838 | |||||||||||||
| 1,100 | International Flavors & Fragrances, Inc. | 47,443 | |||||||||||||
| 500 | Martin Marietta Materials, Inc. | 53,800 | |||||||||||||
| 200 | Nalco Holding Co. | 4,320 | |||||||||||||
| 300 | Packaging Corp. of America | 6,837 | |||||||||||||
| 1,900 | Sigma Aldrich Corp. | 104,538 | |||||||||||||
| 500 | Silgan Holdings, Inc. | 23,370 | |||||||||||||
| 1,300 | Terra Industries, Inc. * | 58,773 | |||||||||||||
| Total Materials | 619,131 | ||||||||||||||
| Utilities — 1.0% | |||||||||||||||
| 900 | Energen Corp. | 54,000 | |||||||||||||
| 1,200 | Reliant Energy, Inc. * | 27,360 | |||||||||||||
| Total Utilities | 81,360 | ||||||||||||||
| TOTAL COMMON STOCKS (COST $8,666,736) | 8,163,031 | ||||||||||||||
See accompanying notes to the financial statements.
10
GMO U.S. Small/Mid Cap Growth Fund
(A Series of GMO Trust)
Schedule of Investments — (Continued)
(showing percentage of total net assets)
February 29, 2008
| Par Value ($) | Description | Value ($) | |||||||||||||
| SHORT-TERM INVESTMENTS — 1.1% | |||||||||||||||
| 92,630 | Citigroup Global Markets Repurchase Agreement, dated 02/29/08, due 03/03/08, with a maturity value of $92,636 and an effective yield of 0.75%, collateralized by a U.S. Treasury Bond with a rate of 8.13%, maturity date of 08/15/19 and a market value, including accrued interest, of $94,201. | 92,630 | |||||||||||||
| TOTAL SHORT-TERM INVESTMENTS (COST $92,630) | 92,630 | ||||||||||||||
| TOTAL INVESTMENTS — 100.7% (Cost $8,759,366) | 8,255,661 | ||||||||||||||
| Other Assets and Liabilities (net) — (0.7%) | (57,513 | ) | |||||||||||||
| TOTAL NET ASSETS — 100.0% | $ | 8,198,148 | |||||||||||||
Notes to Schedule of Investments:
REIT - Real Estate Investment Trust
* Non-income producing security.
See accompanying notes to the financial statements.
11
GMO U.S. Small/Mid Cap Growth Fund
(A Series of GMO Trust)
Statement of Assets and Liabilities — February 29, 2008
| Assets: | |||||||
| Investments, at value (cost $8,759,366) (Note 2) | $ | 8,255,661 | |||||
| Receivable for Fund shares sold | 1,799 | ||||||
| Dividends and interest receivable | 2,607 | ||||||
| Receivable for expenses reimbursed by Manager (Note 3) | 7,598 | ||||||
| Total assets | 8,267,665 | ||||||
| Liabilities: | |||||||
| Payable to affiliate for (Note 3): | |||||||
| Management fee | 2,504 | ||||||
| Shareholder service fee | 1,211 | ||||||
| Trustees and Chief Compliance Officer of GMO Trust fees | 2 | ||||||
| Accrued expenses | 65,800 | ||||||
| Total liabilities | 69,517 | ||||||
| Net assets | $ | 8,198,148 | |||||
| Net assets consist of: | |||||||
| Paid-in capital | $ | 10,071,702 | |||||
| Distributions in excess of net realized gain | (1,369,849 | ) | |||||
| Net unrealized depreciation | (503,705 | ) | |||||
| $ | 8,198,148 | ||||||
| Net assets attributable to: | |||||||
| Class III shares | $ | 8,198,148 | |||||
| Shares outstanding: | |||||||
| Class III | 603,311 | ||||||
| Net asset value per share: | |||||||
| Class III | $ | 13.59 | |||||
See accompanying notes to the financial statements.
12
GMO U.S. Small/Mid Cap Growth Fund
(A Series of GMO Trust)
Statement of Operations — Year Ended February 29, 2008
| Investment Income: | |||||||
| Dividends | $ | 115,710 | |||||
| Interest | 23,286 | ||||||
| Securities lending income | 12,189 | ||||||
| Total investment income | 151,185 | ||||||
| Expenses: | |||||||
| Management fee (Note 3) | 61,523 | ||||||
| Shareholder service fee – Class III (Note 3) | 29,769 | ||||||
| Custodian, fund accounting agent and transfer agent fees | 45,337 | ||||||
| Audit and tax fees | 47,996 | ||||||
| Legal fees | 400 | ||||||
| Trustees fees and related expenses (Note 3) | 151 | ||||||
| Registration fees | 552 | ||||||
| Miscellaneous | 1,363 | ||||||
| Total expenses | 187,091 | ||||||
| Fees and expenses reimbursed by Manager (Note 3) | (95,589 | ) | |||||
| Net expenses | 91,502 | ||||||
| Net investment income (loss) | 59,683 | ||||||
| Realized and unrealized gain (loss): | |||||||
| Net realized gain (loss) on: | |||||||
| Investments | 1,121,932 | ||||||
| Closed futures contracts | (50,326 | ) | |||||
| Net realized gain (loss) | 1,071,606 | ||||||
| Change in net unrealized appreciation (depreciation) on: | |||||||
| Investments | (2,475,492 | ) | |||||
| Open futures contracts | (151 | ) | |||||
| Net unrealized gain (loss) | (2,475,643 | ) | |||||
| Net realized and unrealized gain (loss) | (1,404,037 | ) | |||||
| Net increase (decrease) in net assets resulting from operations | $ | (1,344,354 | ) | ||||
See accompanying notes to the financial statements.
13
GMO U.S. Small/Mid Cap Growth Fund
(A Series of GMO Trust)
Statement of Changes in Net Assets
| Year Ended February 29, 2008 | Year Ended February 28, 2007 | ||||||||||
| Increase (decrease) in net assets: | |||||||||||
| Operations: | |||||||||||
| Net investment income (loss) | $ | 59,683 | $ | 102,256 | |||||||
| Net realized gain (loss) | 1,071,606 | 2,917,966 | |||||||||
| Change in net unrealized appreciation (depreciation) | (2,475,643 | ) | (2,052,599 | ) | |||||||
| Net increase (decrease) in net assets from operations | (1,344,354 | ) | 967,623 | ||||||||
| Distributions to shareholders from: | |||||||||||
| Net investment income | |||||||||||
| Class III | (57,832 | ) | (120,249 | ) | |||||||
| Net realized gains | |||||||||||
| Class III | (3,159,111 | ) | (2,054,581 | ) | |||||||
| Return of capital | |||||||||||
| Class III | (44,360 | ) | — | ||||||||
| (3,261,303 | ) | (2,174,830 | ) | ||||||||
| Net share transactions (Note 7): | |||||||||||
| Class III | (12,589,446 | ) | (3,319,666 | ) | |||||||
| Purchase premiums and redemption fees (Notes 2 and 7): | |||||||||||
| Class III | 79,121 | 37,463 | |||||||||
| Total increase (decrease) in net assets resulting from net share transactions, purchase premiums and redemption fees | (12,510,325 | ) | (3,282,203 | ) | |||||||
| Total increase (decrease) in net assets | (17,115,982 | ) | (4,489,410 | ) | |||||||
| Net assets: | |||||||||||
| Beginning of period | 25,314,130 | 29,803,540 | |||||||||
| End of period | $ | 8,198,148 | $ | 25,314,130 | |||||||
See accompanying notes to the financial statements.
14
GMO U.S. Small/Mid Cap Growth Fund
(A Series of GMO Trust)
Financial Highlights
(For a Class III share outstanding throughout each period)
| Year Ended February 28/29, | |||||||||||||||||||||||
| 2008 | 2007 | 2006 | 2005 | 2004 | |||||||||||||||||||
| Net asset value, beginning of period | $ | 18.93 | $ | 19.67 | $ | 21.96 | $ | 21.78 | $ | 13.52 | |||||||||||||
| Income (loss) from investment operations: | |||||||||||||||||||||||
| Net investment income (loss)† | 0.06 | 0.07 | 0.06 | 0.03 | 0.00 | (a) | |||||||||||||||||
| Net realized and unrealized gain (loss) | (1.79 | ) | 0.79 | 2.93 | 1.96 | 8.28 | |||||||||||||||||
| Total from investment operations | (1.73 | ) | 0.86 | 2.99 | 1.99 | 8.28 | |||||||||||||||||
| Less distributions to shareholders: | |||||||||||||||||||||||
| From net investment income | (0.06 | ) | (0.09 | ) | (0.07 | ) | (0.01 | ) | (0.02 | ) | |||||||||||||
| From net realized gains | (3.49 | ) | (1.51 | ) | (5.21 | ) | (1.80 | ) | — | ||||||||||||||
| Return of capital | (0.06 | ) | — | — | — | — | |||||||||||||||||
| Total distributions | (3.61 | ) | (1.60 | ) | (5.28 | ) | (1.81 | ) | (0.02 | ) | |||||||||||||
| Net asset value, end of period | $ | 13.59 | $ | 18.93 | $ | 19.67 | $ | 21.96 | $ | 21.78 | |||||||||||||
| Total Return(b) | (11.74 | )% | 4.86 | % | 14.63 | % | 10.50 | % | 61.22 | % | |||||||||||||
| Ratios/Supplemental Data: | |||||||||||||||||||||||
| Net assets, end of period (000's) | $ | 8,198 | $ | 25,314 | $ | 29,804 | $ | 38,801 | $ | 41,662 | |||||||||||||
| Net expenses to average daily net assets | 0.46 | % | 0.46 | % | 0.48 | % | 0.48 | % | 0.48 | % | |||||||||||||
| Net investment income to average daily net assets | 0.30 | % | 0.38 | % | 0.30 | % | 0.16 | % | 0.02 | % | |||||||||||||
| Portfolio turnover rate | 118 | % | 109 | % | 87 | % | 110 | % | 97 | % | |||||||||||||
| Fees and expenses reimbursed by the Manager to average daily net assets: | 0.48 | % | 0.60 | % | 0.35 | % | 0.26 | % | 0.24 | % | |||||||||||||
| Purchase premiums and redemption fees consisted of the following per share amounts:† | $ | 0.07 | $ | 0.03 | $ | 0.08 | $ | 0.04 | $ | 0.06 | |||||||||||||
(a) Net investment income was less than $0.01 per share.
(b) The total returns would have been lower had certain expenses not been reimbursed during the periods shown and assumes the effect of reinvested distributions. Calculation excludes purchase premiums and redemption fees which are borne by the shareholders.
† Calculated using average shares outstanding throughout the period.
See accompanying notes to the financial statements.
15
GMO U.S. Small/Mid Cap Growth Fund
(A Series of GMO Trust)
Notes to Financial Statements
February 29, 2008
1. Organization
GMO U.S. Small/Mid Cap Growth Fund (the "Fund") is a series of GMO Trust (the "Trust"). The Fund is registered under the Investment Company Act of 1940, as amended, as an open-end, non-diversified management investment company. The Fund is advised and managed by Grantham, Mayo, Van Otterloo & Co. LLC (the "Manager" or "GMO"). The Trust was established as a Massachusetts business trust under the laws of the Commonwealth of Massachusetts on June 24, 1985. The Declaration of Trust permits the Trustees of the Trust ("Trustees") to create an unlimited number of series of shares ("Funds") and to subdivide Funds into classes.
The Fund seeks long-term capital growth. The Fund seeks to achieve its objective by outperforming the Russell 2500 Growth Index. The Fund typically makes equity investments in companies that issue stocks included in the Russell 2500 Index, and companies with similar market capitalizations.
2. Significant accounting policies
The following is a summary of significant accounting policies which are in conformity with accounting principles generally accepted in the United States of America ("U.S. GAAP") and which are consistently followed by the Fund in the preparation of its financial statements. The preparation of financial statements in accordance with U.S. GAAP requires management to make estimates and assumptions that affect the reported amounts and disclosures in the financial statements. Actual results could differ from those estimates. The accounting records of the Fund are maintained in U.S. dollars.
Portfolio valuation
Securities listed on a securities exchange for which market quotations are readily available are valued at the last sale price or official closing price on each business day, or if there is no such reported sale or official closing price, at the most recent quoted bid price. Unlisted securities for which market quotations are readily available are generally valued at the most recent quoted bid price. Short-term investments with a remaining maturity of sixty days or less are generally valued at amortized cost, which approximates fair value. Shares of investment funds are valued at their net asset value. Securities for which quotations are not readily available or whose values the Manager has determined to be unreliable are valued at fair value as determined in good faith by the Trustees or other persons acting at their direction pursuant to procedures approved by the Trustees. By its nature, a fair value price is a good faith est imate of the value of a security at a given point in time and may not reflect the value that would be realized if the security was sold and the differences could be material.
Futures contracts
The Fund may purchase and sell futures contracts. Upon entering into a futures contract, the Fund is required to deposit with the futures clearing broker an amount of cash, U.S. government and agency obligations, or other liquid assets in accordance with the initial margin requirements of the broker or
16
GMO U.S. Small/Mid Cap Growth Fund
(A Series of GMO Trust)
Notes to Financial Statements — (Continued)
February 29, 2008
exchange. In addition, the Fund maintains cash or securities in an amount that at least equals the net amount payable in the event the Fund must deliver the full amount of the contracts. Futures contracts are marked to market daily and an appropriate payable or receivable for the change in value ("variation margin") is recorded by the Fund. The payable or receivable is liquidated on the following business day. Gains or losses are recognized but not considered realized until the contracts expire or are closed. Futures contracts involve, to varying degrees, risk of loss in excess of the variation margin disclosed in the Statement of Assets and Liabilities. Under certain circumstances, futures exchanges may establish daily limits on the amount that the price of a futures contract can vary from the previous day's settlement price, thereby effectively preventing liquidation of unfavorable positions. Losses may arise from changes in t he value of the underlying instrument if the Fund is unable to liquidate a futures position due to an illiquid secondary market for the contracts or the imposition of price limits, or if counterparties do not perform under the contract terms. Futures contracts are generally valued at the settlement price established each day by the board of trade or exchange on which they are traded. There were no futures contracts outstanding at the end of the period.
Swap agreements
The Fund may enter into swap agreements. A swap is an agreement to exchange the return generated by one instrument for the return generated by another instrument. Interest rate swap agreements involve the exchange by one party with another party of their respective commitments to pay or receive interest, e.g., an exchange of floating rate payments for fixed rate payments with respect to a notional amount of principal. Total return swap agreements involve a commitment by one party in the agreement to pay interest in exchange for a market-linked return, both based on notional amounts. To the extent the total return of the security or index underlying the transaction exceeds or falls short of the offsetting interest rate obligation, the party will receive a payment from or make a payment to the counterparty, respectively. Forward spread lock swap agreements involve commitments to pay or receive a settlement amount calculated as the difference between the swap spread and a fixed spread, multiplied by the notional amount times the duration of the swap rate. The swap spread is the difference between the benchmark swap rate (market rate) and the specific treasury rate. Variance swap agreements involve commitments to pay or receive a settlement amount calculated as the difference between the annualized realized variance of returns on the underlying price and a fixed quantity, also known as the variance strike, over a period of time. In connection with these agreements, cash or securities may be set aside as collateral by the Fund's custodian or brokers in accordance with the terms of the swap agreement. The Fund earns or pays interest on cash set aside as collateral.
Swaps are marked to market daily using models that incorporate quotations from market makers and the change in value, if any, is recorded as unrealized gain or loss in the Statement of Operations. Payments received or made on swap contracts are recorded as realized gain or loss in the Statement of Operations. Gains or losses are realized upon early termination of the swap agreements. These financial instruments are not actively traded on financial markets. The values assigned to these instruments are based upon the best available information and because of the uncertainty of the valuation, these values may differ
17
GMO U.S. Small/Mid Cap Growth Fund
(A Series of GMO Trust)
Notes to Financial Statements — (Continued)
February 29, 2008
significantly from the values that would have been realized had a ready market for these instruments existed, and the differences could be material. Entering into these agreements involves, to varying degrees, elements of credit, legal, market and documentation risk in excess of the amounts recognized in the Statement of Assets and Liabilities. Such risks involve the possibility that there will be no liquid market for these agreements, that the counterparties to the agreements may default on their obligations to perform or disagree as to the meaning of contractual terms in the agreements, or that there may be unfavorable changes in interest rates or the price of the index or security underlying these transactions. There were no swap agreements outstanding at the end of the period.
Repurchase agreements
The Fund may enter into repurchase agreements with banks and broker-dealers whereby the Fund acquires a security for cash and obtains a simultaneous commitment from the seller to repurchase the security at an agreed upon price and date. The Fund, through its custodian, takes possession of securities collateralizing the repurchase agreement. The collateral is marked to market daily to ensure that the market value of the underlying assets remains sufficient to protect the Fund in the event of default by the seller. Collateral for certain tri-party repurchase agreements is held at the counterparty's custodian in a segregated account for the benefit of the Fund and the counterparty. In connection with transactions in repurchase agreements, if the seller defaults or enters into insolvency proceedings and the value of the collateral declines, recovery of cash by the Fund may be delayed or limited. Repurchase agreements outstanding at the end of the period are listed in the Fund's Schedule of Investments.
Securities lending
The Fund may lend its securities to certain qualified broker-dealers. The loans are collateralized with cash or liquid securities with a market value at least equal to the market value of the securities on loan. As with other extensions of credit, the Fund may bear the risk of loss with respect to the investment of the collateral, the risk of delay in and/or inability to exercise its rights with respect to the collateral, and the risk of delay in recovery or loss of rights in the loaned securities should the borrower of the securities fail financially. If a loan is collateralized by U.S. government securities, the Fund receives a fee from the borrower. If a loan is collateralized by cash, the Fund typically invests the cash collateral for its own account in interest-bearing, short-term securities and pays a fee to the borrower that normally represents a portion of the Fund's earnings on the collateral. As of February 29, 2008, t he Fund had no securities on loan.
Taxes and distributions
The Fund intends to qualify each tax year as a regulated investment company under Subchapter M of the Internal Revenue Code of 1986, as amended (the "Code"). The Fund intends to distribute substantially all of its net investment income and net realized short-term and long-term capital gains, if any, after giving effect to any available capital loss carryovers for U.S. federal income tax purposes. Therefore, no provision for U.S. federal income or excise tax is necessary.
18
GMO U.S. Small/Mid Cap Growth Fund
(A Series of GMO Trust)
Notes to Financial Statements — (Continued)
February 29, 2008
The Fund's policy is to declare and pay distributions from net investment income, if any, quarterly, and from net realized short-term and long-term capital gains, if any, at least annually. All distributions are paid in shares of the Fund, at net asset value, unless the shareholder elects to receive cash distributions. Distributions to shareholders are recorded by the Fund on the ex-dividend date.
Income and capital gain distributions are determined in accordance with U.S. federal income tax regulations, which may differ from U.S. GAAP. Certain capital accounts in the financial statements are periodically adjusted for permanent differences in order to reflect their tax character. These adjustments have no impact on net assets or net asset value per share. Temporary differences which arise from recognizing certain items of income, expense, gain or loss in different periods for financial statement and tax purposes will reverse at some time in the future. Distributions in excess of net investment income or net realized gains are temporary over distributions for financial statement purposes resulting from differences in the recognition or classification of income or distributions for financial statement and tax purposes.
U.S. GAAP and tax accounting differences primarily relate to losses on wash sale transactions and post-October capital losses.
The following reclassification represents the amount necessary to report the stated components of net assets on a tax basis, excluding certain temporary differences, as of February 29, 2008. The financial highlights exclude these adjustments.
| Accumulated Undistributed Net Investment Income | Distributions In Excess Of Net Realized Gain | Paid-in Capital | |||||||||
| $ | (1,851 | ) | $ | 1,851 | $ | — | |||||
The tax character of distributions declared to shareholders is as follows:
| 2/29/2008 | 2/28/2007 | ||||||||||
| Ordinary income (including any short-term capital gains) | $ | 1,413,260 | $ | 695,366 | |||||||
| Long-term capital gains | 1,803,683 | 1,479,464 | |||||||||
| $ | 3,216,943 | $ | 2,174,830 | ||||||||
| Tax return of capital | 44,360 | — | |||||||||
| Total distributions | $ | 3,261,303 | $ | 2,174,830 | |||||||
Distributions in excess of tax basis earnings and profits, if significant, are reported in the financial statements as a tax return of capital.
19
GMO U.S. Small/Mid Cap Growth Fund
(A Series of GMO Trust)
Notes to Financial Statements — (Continued)
February 29, 2008
As of February 29, 2008, the Fund elected to defer to March 1, 2008 post-October capital losses of $1,250,145.
As of February 29, 2008, the approximate cost for U.S. federal income tax purposes and gross and net unrealized appreciation and depreciation in value of investments were as follows:
| Aggregate Cost | Gross Unrealized Appreciation | Gross Unrealized (Depreciation) | Net Unrealized Appreciation (Depreciation) | ||||||||||||
| $ | 8,879,070 | $ | 344,064 | $ | (967,473 | ) | $ | (623,409 | ) | ||||||
Security transactions and related investment income
Security transactions are accounted for on trade date. Dividend income, net of applicable foreign withholding taxes, if any, is recorded on the ex-dividend date, or when the Fund is informed of the ex-dividend date, if later. Interest income is recorded on the accrual basis and is adjusted for the amortization of premiums and accretion of discounts. Interest income on inflation indexed securities, if any, is accrued daily based upon an inflation adjusted principal. Additionally, any increase or decrease in the principal or face amount of the securities adjusted for inflation is recorded as interest income or loss. Income is not recognized on securities for which collection is not expected. Non-cash dividends, if any, are recorded at the fair market value of the securities received. In determining the net gain or loss on securities sold, the cost of securities is determined on the identified cost basis.
Expenses
The majority of expenses of the Trust are directly identifiable to an individual fund. Expenses which are not readily identifiable to a specific fund are allocated taking into consideration, among other things, the nature and type of expense and the relative size of the funds.
State Street Bank and Trust Company ("State Street") serves as custodian, fund accounting agent and transfer agent of the Fund. State Street's fee may be reduced by credits that are an earnings allowance calculated on the average daily cash balances the Fund maintains with State Street. Credit balances used to reduce the fee paid to State Street, if any, are reported as a reduction of expenses in the Statement of Operations.
Purchases and redemptions of Fund shares
As of February 29, 2008, the premium on cash purchases and fee on cash redemptions of Fund shares were each 0.50% of the amount invested or redeemed. If the Manager determines that any portion of a cash purchase or redemption is offset by a corresponding cash redemption or purchase occurring on the same day, it will waive the purchase premium or redemption fee in the amount approximately equal to the fee with respect to that portion. In addition, the purchase premium or redemption fee charged by the Fund may be waived in extraordinary circumstances if the Fund will not incur transaction costs. All purchase
20
GMO U.S. Small/Mid Cap Growth Fund
(A Series of GMO Trust)
Notes to Financial Statements — (Continued)
February 29, 2008
premiums and redemption fees are paid to and recorded by the Fund as paid-in capital. The Manager will waive the purchase premium relating to the in-kind portion of a purchase transaction except to the extent of certain estimated or known transaction costs (e.g. stamp duties and transfer taxes) incurred by the Fund in connection with the transfer of the purchasing shareholder's securities to the Fund. In-kind redemption transactions are generally not subject to redemption fees except to the extent those transactions include a cash component. However, when a substantial portion of a Fund is being redeemed, the Fund may assess estimated or known transaction costs. There is no premium for reinvested distributions.
Recently issued accounting pronouncements
In June 2006, the Financial Accounting Standards Board ("FASB") issued FASB Interpretation No. 48, Accounting for Uncertainty in Income Taxes – an Interpretation of FASB Statement No. 109 ("FIN 48"). FIN 48 clarifies the accounting for uncertainty in income taxes recognized in accordance with FASB Statement No. 109, Accounting for Income Taxes. FIN 48 prescribes a recognition threshold and measurement attribute for a tax position taken or expected to be taken in the tax return that could impact the Fund's financial statements. It also provides guidance in relation to the Fund's financial statements on classification of tax benefits or liabilities, interest and penalties, accounting in interim periods, disclosure, and transition. FIN 48 is effective for fiscal years beginning after December 15, 2006 for registered investment companies. Management has evaluated the effects of applying the various provisions of FIN 48 and has determined that the adoption of FIN 48 does not have a material effect on the Fund's financial statements. The Fund's federal tax returns for the prior three fiscal years, if applicable, remain subject to examination by the Internal Revenue Service. Management will continue to monitor the rules and guidance pertaining to FIN 48 and will take action if appropriate.
In September 2006, the FASB issued Statement of Financial Accounting Standards No. 157 ("FAS 157"), "Fair Value Measurements." FAS 157 defines fair value, establishes a framework for measuring fair value in accordance with generally accepted accounting principles and expands disclosure about fair value measurements. FAS 157 is effective for fiscal years beginning after November 15, 2007. Management is currently evaluating the impact the adoption of FAS 157 will have on the Fund's financial statement disclosures.
3. Fees and other transactions with affiliates
GMO earns a management fee paid monthly at the annual rate of 0.31% of average daily net assets. The Fund has adopted a Shareholder Service Plan under which the Fund pays GMO a shareholder service fee for client and shareholder service, reporting, and other support. Pursuant to the Shareholder Service Plan, the shareholder service fee is calculated based on average daily net assets at the annual rate of 0.15% for Class III shares.
The Manager has contractually agreed to reimburse the Fund for Fund expenses through at least June 30, 2008 to the extent the Fund's total annual operating expense (excluding shareholder service fees, fees and expenses of the independent Trustees of the Trust, fees and expenses for legal services not approved by the
21
GMO U.S. Small/Mid Cap Growth Fund
(A Series of GMO Trust)
Notes to Financial Statements — (Continued)
February 29, 2008
Manager for the Trust, compensation and expenses of the Trust's Chief Compliance Officer ("CCO") (excluding any employee benefits), brokerage commissions, securities lending fees and expenses, interest expense, transfer taxes, and other investment-related costs (including expenses associated with investments in any company that is an investment company or would be an investment company under the 1940 Act, but for the exceptions to the definition of investment company provided in Section 3(c)(1) and 3(c)(7) of the 1940 Act,), hedging transaction fees, extraordinary, non-recurring and certain other unusual expenses (including taxes) exceed 0.31% of the Fund's average daily net assets.
The Fund's portion of the fees paid by the Trust to the independent Trustees and CCO during the year ended February 29, 2008 was $151 and $59, respectively. The compensation and expenses of the CCO are included in miscellaneous expenses in the Statement of Operations. No remuneration was paid by the Fund to any other officer of the Trust.
4. Purchases and sales of securities
Cost of purchases and proceeds from sales of securities, excluding short-term investments, for the year ended February 29, 2008 aggregated $22,607,383 and $37,651,931, respectively.
5. Guarantees
In the normal course of business the Fund enters into contracts with third-party service providers that contain a variety of representations and warranties and which provide general indemnifications. The Fund's maximum exposure under these arrangements is unknown, as this would involve future claims that may be made against the Fund that have not yet occurred. Based on experience, management is of the view that the risk of loss in connection with these potential indemnification obligations is remote; however, there can be no assurance that material liabilities related to such obligations will not arise in the future that could adversely impact the Fund.
6. Principal shareholders and related parties
As of February 29, 2008, 77.05% of the outstanding shares of the Fund were held by five shareholders, each holding in excess of 10% of the Fund's outstanding shares. No other shareholder owned in excess of 10% of the outstanding shares of the Fund. One of the shareholders is another fund of the Trust. Investment activities of these shareholders may have a material effect on the Fund.
As of February 29, 2008, there were no shares held by related parties, and 97.44% of the Fund's shares were held by accounts for which the Manager has investment discretion.
22
GMO U.S. Small/Mid Cap Growth Fund
(A Series of GMO Trust)
Notes to Financial Statements — (Continued)
February 29, 2008
7. Share transactions
The Declaration of Trust permits the Trustees to issue an unlimited number of shares of beneficial interest (without par value). Transactions in Fund shares were as follows:
| Year Ended February 29, 2008 | Year Ended February 28, 2007 | ||||||||||||||||||
| Class III: | Shares | Amount | Shares | Amount | |||||||||||||||
| Shares sold | 626 | $ | 10,677 | 58,808 | $ | 1,047,837 | |||||||||||||
| Shares issued to shareholders in reinvestment of distributions | 191,266 | 3,213,436 | 115,018 | 2,091,121 | |||||||||||||||
| Shares repurchased | (925,656 | ) | (15,813,559 | ) | (351,770 | ) | (6,458,624 | ) | |||||||||||
| Purchase premiums | — | 53 | — | 32,210 | |||||||||||||||
| Redemption fees | — | 79,068 | — | 5,253 | |||||||||||||||
| Net increase (decrease) | (733,764 | ) | $ | (12,510,325 | ) | (177,944 | ) | $ | (3,282,203 | ) | |||||||||
23
Report of Independent Registered Public Accounting Firm
To the Trustees of GMO Trust and the Shareholders of
GMO U.S. Small/Mid Cap Growth Fund
In our opinion, the accompanying statement of assets and liabilities, including the schedule of investments, and the related statements of operations and of changes in net assets and the financial highlights present fairly, in all material respects, the financial position of GMO U.S. Small/Mid Cap Growth Fund (the "Fund") at February 29, 2008, the results of its operations for the year then ended, the changes in its net assets for each of the two years in the period then ended and the financial highlights for each of the five years in the period then ended, in conformity with accounting principles generally accepted in the United States of America. These financial statements and financial highlights (hereafter referred to as "financial statements") are the responsibility of the Fund's management; our responsibility is to express an opinion on these financial statements based on our audits. We conducted our audits of these financ ial statements in accordance with the standards of the Public Company Accounting Oversight Board (United States). Those standards require that we plan and perform the audit to obtain reasonable assurance about whether the financial statements are free of material misstatement. An audit includes examining, on a test basis, evidence supporting the amounts and disclosures in the financial statements, assessing the accounting principles used and significant estimates made by management, and evaluating the overall financial statement presentation. We believe that our audits, which included confirmation of securities at February 29, 2008 by correspondence with the custodian, provide a reasonable basis for our opinion.
PricewaterhouseCoopers LLP
Boston, Massachusetts
April 29, 2008
24
GMO U.S. Small/Mid Cap Growth Fund
(A Series of GMO Trust)
Fund Expenses
February 29, 2008 (Unaudited)
Expense Examples: The following information is in relation to expenses for the six month period ended February 29, 2008.
As a shareholder of the Fund, you may incur two types of costs: (1) transaction costs, including purchase premiums and redemption fees; and (2) ongoing costs, including management fees, shareholder service fees, and other Fund expenses. This example is intended to help you understand your ongoing costs (in dollars) of investing in the Fund and to compare these costs with the ongoing costs of investing in other mutual funds.
These examples are based on an investment of $1,000 invested at the beginning of the period and held for the entire period, September 1, 2007 through February 29, 2008.
Actual Expenses
The first line of the table below provides information about actual account values and actual expenses. You may use the information in this line, together with the amount you invested, to estimate the expenses that you paid over the period. Simply divide your account value by $1,000 (for example, a $10,000,000 account value divided by $1,000 = 10,000), then multiply the result by the number in the first line under the heading entitled "Net Expense Incurred" to estimate the expenses you paid on your account during this period.
Hypothetical Example for Comparison Purposes
The second line of the table below provides information about hypothetical account values and hypothetical expenses based on the Fund's actual expense ratio and an assumed rate of return of 5% per year before expenses, which is not the Fund's actual return. The hypothetical account values and expenses may not be used to estimate the actual ending account balance or expenses you paid for the period. You may use this information to compare the ongoing costs of investing in the Fund with other funds. To do so, compare this 5% hypothetical example with the 5% hypothetical examples that appear in the shareholder reports of other funds.
Please note that the expenses shown in the table are meant to highlight your ongoing costs only and do not reflect any transactional costs, such as purchase premiums and redemption fees. Therefore, the second line of the table is useful in comparing ongoing costs only, and will not help you determine the relative total costs of owning different funds. In addition, if these transactional costs were included, your costs would have been higher.
| Annualized Net Expense Ratio | Beginning Account Value | Ending Account Value | Net Expense Incurred* | ||||||||||||||||
| Class III | |||||||||||||||||||
| 1) Actual | 0.46 | % | $ | 1,000.00 | $ | 871.10 | $ | 2.14 | |||||||||||
| 2) Hypothetical | 0.46 | % | $ | 1,000.00 | $ | 1,022.58 | $ | 2.31 | |||||||||||
* Expenses are calculated using the Class's annualized net expense ratio for the six months ended February 29, 2008, multiplied by the average account value over the period, multiplied by 182 days in the period, divided by 366 days in the year.
25
GMO U.S. Small/Mid Cap Growth Fund
(A Series of GMO Trust)
Tax Information for the Tax Year Ended February 29, 2008 (Unaudited)
The Fund will notify shareholders of amounts for use in preparing 2008 income tax forms in January 2009.
The Fund's distributions to shareholders include $1,803,683 from long-term capital gains.
For taxable, non-corporate shareholders, 8.13% of the income and short-term capital gains, if any, distributed in the Fund's fiscal year ended February 29, 2008 represents qualified dividend income subject to the 15% rate category.
For corporate shareholders, 7.99% of the income and short-term capital gains, if any, distributed in the Fund's fiscal year ended February 29, 2008 qualified for the dividends-received deduction.
The Fund hereby designates as qualified interest income and qualified short-term capital gains with respect to its taxable year ended February 29, 2008, $4,781 and $1,361,579, respectively, or if determined to be different, the qualified interest income and qualified short-term gains of such year.
26
GMO U.S. Small/Mid Cap Growth Fund
(A Series of GMO Trust)
Note Concerning Distributions (Unaudited)
The Fund previously reported estimated sources of any dividends, short-term capital gains, and long-term capital gains distributions paid on a per share basis. Pursuant to Rule 19a-1(e) of the Investment Company Act, the following serves as a correction of such estimates. 35.69% of distributions to shareholders declared from net investment income and 0.38% declared from net realized gains during the Fund's fiscal year were reclassified to distributions from return of capital and are reflected as such in the Statement of Changes in Net Assets.
27
Trustees and Officers (Unaudited)
The following tables list the Trust's Trustees and Officers as of the date of this report; their address and date of birth ("DOB"); their position with the Trust; the length of time holding that position with the Trust; their principal occupation(s) during the past five years; the number of portfolios in the fund complex they oversee; and other directorships they hold in companies subject to registration or reporting requirements of the Securities Exchange Act of 1934 (generally called "public companies") or in registered investment companies. The Trust's Statement of Additional Information ("SAI") includes additional information about the Trust's trustees, including changes subsequent to the date of the report. The SAI is available, without charge, upon request by writing GMO, c/o GMO Trust, 40 Rowes Wharf, Boston, MA 02110.
Independent Trustees:
| Name, Address, and DOB | Position(s) Held with Trust | Term of Office1 and Length of Time Served | Principal Occupation(s) During Past Five Years | Number of Portfolios in Fund Complex Overseen by Trustee | Other Directorships Held by Trustee | ||||||||||||||||||
| Donald W. Glazer, Esq. c/o GMO Trust 40 Rowes Wharf Boston, MA 02110 DOB: 07/26/1944 | Chairman of the Board of Trustees | Chairman of the Board of Trustees since March 2005; Lead Independent Trustee (September 2004 – March 2005); Trustee since December 2000. | Consultant – Law and Business2; Vice Chair (since 2002) and Secretary, Provant, Inc. (provider of personnel performance improvement services and training products); Author of Legal Treatises. | 47 | None | ||||||||||||||||||
1 Each Trustee is elected to serve during the continued lifetime of the Trust until he/she dies, resigns or is removed, or if sooner, until the next meeting of Shareholders called for the purpose of electing Trustees and until the election and qualification of his/her successor.
2 As part of Mr. Glazer's work as a consultant, he provides part-time consulting services to Goodwin Procter LLP ("Goodwin"). Goodwin has provided legal services to Renewable Resources, LLC, an affiliate of GMO; GMO, in connection with its relationship with Renewable Resources; and funds managed by Renewable Resources. Mr. Glazer has represented that he has no financial interest in, and is not involved in the provision of, such legal services. In the calendar years ended December 31, 2006 and December 31, 2007, these entities paid $825,738 and $291,721 respectively, in legal fees and disbursements to Goodwin.
28
Independent Trustees — (Continued)
| Name, Address, and DOB | Position(s) Held with Trust | Term of Office1 and Length of Time Served | Principal Occupation(s) During Past Five Years | Number of Portfolios in Fund Complex Overseen by Trustee | Other Directorships Held by Trustee | ||||||||||||||||||
| Jay O. Light c/o GMO Trust 40 Rowes Wharf Boston, MA 02110 DOB: 10/03/1941 | Trustee | Since May 1996. | Dean (since April 2006), Acting Dean (August 2005 – April 2006), Senior Associate Dean (1998 – 2005), and Professor of Business Administration, Harvard Business School. | 47 | Director of Harvard Management Company, Inc.3 and Verde, Inc.; Director of Partners HealthCare System, Inc. and Chair of its Investment Committee.4 | ||||||||||||||||||
| W. Nicholas Thorndike c/o GMO Trust 40 Rowes Wharf Boston, MA 02110 DOB: 03/28/1933 | Trustee | Since March 2005. | Director or trustee of various corporations and charitable organizations, including Courier Corporation (a book publisher and manufacturer) (July 1989 – present); Putnam Funds (December 1992 – June 2004); and Providence Journal (a newspaper publisher) (December 1986 – December 2003). | 47 | Director of Courier Corporation (a book publisher and manufacturer); Member of the Investment Committee of Partners HealthCare System, Inc.4 | ||||||||||||||||||
1 Each Trustee is elected to serve during the continued lifetime of the Trust until he/she dies, resigns or is removed, or if sooner, until the next meeting of Shareholders called for the purpose of electing Trustees and until the election and qualification of his/her successor.
3 Harvard Management Company, Inc. is a client of the Manager.
4 Partners HealthCare System, Inc. is a client of the Manager.
29
Principal Officers:
| Name, Address, and DOB | Position(s) Held with Trust | Term of Office5 and Length of Time Served | Principal Occupation(s) During Past Five Years | ||||||||||||
| Scott Eston c/o GMO Trust 40 Rowes Wharf Boston, MA 02110 DOB: 01/20/1956 | President and Chief Executive Officer | President and Chief Executive Officer since October 2002; Chief Financial Officer, November 2006 – February 2007. | Chief Financial Officer, Chief Operating Officer and Member, Grantham, Mayo, Van Otterloo & Co. LLC. | ||||||||||||
| Sheppard N. Burnett c/o GMO Trust 40 Rowes Wharf Boston, MA 02110 DOB: 10/24/1968 | Treasurer and Chief Financial Officer | Chief Financial Officer since March 2007; Treasurer since November 2006; Assistant Treasurer, September 2004 – November 2006. | Fund Administration Staff, Grantham, Mayo, Van Otterloo & Co. LLC (June 2004 – present); Vice President, Director of Tax, Columbia Management Group (2002 – 2004). | ||||||||||||
| Brent C. Arvidson c/o GMO Trust 40 Rowes Wharf Boston, MA 02110 DOB: 06/26/1969 | Assistant Treasurer | Since August 1998. | Senior Fund Administrator, Grantham, Mayo, Van Otterloo & Co. LLC. | ||||||||||||
| John L. Nasrah c/o GMO Trust 40 Rowes Wharf Boston, MA 02110 DOB: 05/27/1977 | Assistant Treasurer | Since March 2007. | Fund Administrator, Grantham, Mayo, Van Otterloo & Co. LLC (September 2004 – present); Tax Analyst, Bain & Company, Inc (June 2003 – September 2004); Senior Tax Associate, PricewaterhouseCoopers LLP (2001 – 2003). | ||||||||||||
| Mahmoodur Rahman c/o GMO Trust 40 Rowes Wharf Boston, MA 02110 DOB: 11/30/1967 | Assistant Treasurer | Since September 2007. | Fund Administrator, Grantham, Mayo, Van Otterloo & Co. (April 2007 – present); Vice President and Senior Tax Manager, Massachusetts Financial Services Company (January 2000 – April 2007). | ||||||||||||
5 Officers are elected to hold such office until their successor is elected and qualified to carry out the duties and responsibilities of their office, or until he or she resigns or is removed from office.
30
Principal Officers — (Continued)
| Name, Address, and DOB | Position(s) Held with Trust | Term of Office5 and Length of Time Served | Principal Occupation(s) During Past Five Years | ||||||||||||
| Michael E. Gillespie c/o GMO Trust 40 Rowes Wharf Boston, MA 02110 DOB: 02/18/1958 | Chief Compliance Officer | Since March 2005. | Vice President of Compliance (June 2004 – February 2005) and Director of Domestic Compliance (March 2002 – June 2004), Fidelity Investments; Vice President and Senior Counsel, State Street Bank and Trust Company (May 1998 – March 2002). | ||||||||||||
| Jason B. Harrison c/o GMO Trust 40 Rowes Wharf Boston, MA 02110 DOB: 01/29/1977 | Vice President and Clerk | Vice President since November 2006; Clerk since March 2006. | Legal Counsel, Grantham, Mayo, Van Otterloo & Co. LLC (since February 2006) and Attorney, Ropes & Gray LLP (September 2002 – February 2006). | ||||||||||||
| David L. Bohan c/o GMO Trust 40 Rowes Wharf Boston, MA 02110 DOB: 06/21/1964 | Vice President and Assistant Clerk | Vice President since March 2005; Assistant Clerk since March 2006. | Legal Counsel, Grantham, Mayo, Van Otterloo & Co. LLC (September 2003 – present); Attorney, Goodwin Procter LLP (September 1996 – September 2003). | ||||||||||||
| Gregory L. Pottle c/o GMO Trust 40 Rowes Wharf Boston, MA 02110 DOB: 07/09/1971 | Vice President and Assistant Clerk | Since November 2006. | Legal Counsel, Grantham, Mayo, Van Otterloo & Co. LLC. | ||||||||||||
| Anne K. Trinque c/o GMO Trust 40 Rowes Wharf Boston, MA 02110 DOB: 04/15/1978 | Vice President and Assistant Clerk | Since September 2007. | Legal Counsel, Grantham, Mayo, Van Otterloo & Co. LLC (since January 2007); Attorney, Goodwin Procter LLP (September 2003 – January 2007). | ||||||||||||
| Cheryl Wakeham c/o GMO Trust 40 Rowes Wharf Boston, MA 02110 DOB: 10/29/1958 | Anti-Money Laundering Officer | Since December 2004. | Manager, Client Service Administration, Grantham, Mayo, Van Otterloo & Co. LLC. | ||||||||||||
5 Officers are elected to hold such office until their successor is elected and qualified to carry out the duties and responsibilities of their office, or until he or she resigns or is removed from office.
31
GMO International Core Equity Fund
(A Series of GMO Trust)
Annual Report
February 29, 2008
For a free copy of the Fund's proxy voting guidelines, shareholders may call 1-617-346-7646 (collect), visit our website at www.gmo.com, or visit the Securities and Exchange Commission's website at www.sec.gov. Information regarding how the Fund voted proxies relating to portfolio securities during the most recent 12-month period ended June 30 is available on our website at www.gmo.com, or on the Securities and Exchange Commission's website at www.sec.gov.
The Fund files its complete schedule of portfolio holdings with the Securities and Exchange Commission for the first and third quarter of each fiscal year on Form N-Q, which is available on the Commission's website at www.sec.gov. The Fund's Form N-Q may be reviewed and copied at the Commission's Public Reference Room in Washington, D.C. Information on the operation of the Public Reference Room may be obtained by calling 1-800-SEC-0330. The Fund has a policy with respect to disclosure of portfolio holdings under which it may also make available on GMO's website (www.gmo.com) a complete schedule of portfolio holdings.
This report is prepared for the general information of shareholders. It is authorized for distribution to prospective investors only when preceded or accompanied by a prospectus for the GMO Trust.
GMO International Core Equity Fund
(A Series of GMO Trust)
Portfolio Managers
Day-to-day management of the Fund's portfolio is the responsibility of the International Quantitative team at Grantham, Mayo, Van Otterloo & Co. LLC.
Management Discussion and Analysis of Fund Performance
The Class III shares of the GMO International Core Equity Fund returned +0.7% for the fiscal year ended February 29, 2008, as compared to +0.8% for the MSCI EAFE Index. Consistent with the Fund's investment objectives and policies, the Fund was invested substantially in international equity securities throughout the period.
Country allocation had a small positive impact on relative performance. Overweights to Germany and the Netherlands helped, while an underweight to Hong Kong hurt.
Sector exposures had a small positive impact. Our underweight to Financials and overweight to Energy helped while our underweight to Consumer Staples hurt.
Currency allocation had minimal impact as our underweight to the British pound and overweight to the Canadian dollar added slightly more value than our underweight to the Australian dollar detracted. The U.S. dollar weakened relative to most foreign currencies, which boosted returns for U.S. investors. The MSCI EAFE Index returned 10% more in U.S. dollar terms than in local currency.
Among GMO's international quantitative stock selection disciplines, stocks favored for their strong momentum characteristics significantly outperformed relative to MSCI EAFE. Those highly ranked by intrinsic value or by quality-adjusted value underperformed by a small margin.
Stock selection helped relative performance. Among the most significant contributors were holdings in Australian mining company Rio Tinto, Canadian fertilizer company Potash Corp. of Saskatchewan, and Canadian technology company Research in Motion, all of which outperformed. Overweight positions in British bank Royal Bank of Scotland, British pharmaceutical GlaxoSmithKline, and an underweight position in Australian mining company BHP Billiton hurt returns.
The views expressed herein are exclusively those of Grantham, Mayo, Van Otterloo & Co. LLC Management as of the date of this report and are subject to change. GMO disclaims any responsibility to update such views. They are not meant as investment advice. References to specific securities are not recommendations of such securities and may not be representative of any GMO portfolio's current or future investments.
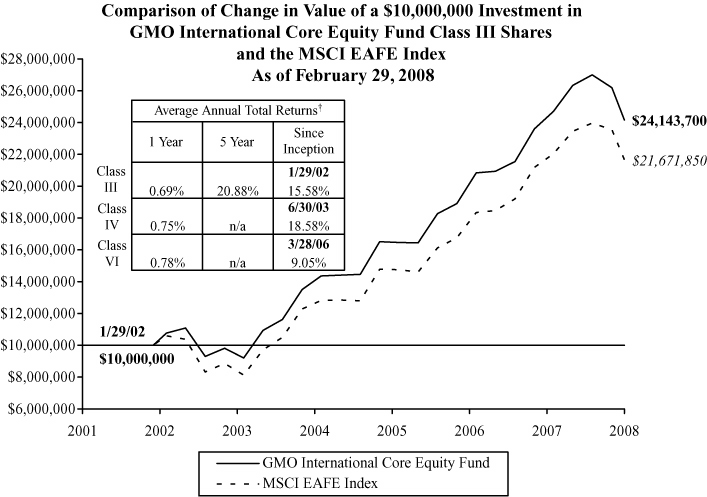
Performance data quoted represents past performance and is not indicative of future results. The investment return and principal value of an investment will fluctuate so that an investor's shares, when redeemed, may be worth more or less than their original cost. Current performance data may be lower or higher than the performance data provided herein. To obtain performance information to the most recent month-end, visit www.gmo.com. Performance shown is net of all fees after reimbursement from the Manager. Returns would have been lower had certain expenses not been reimbursed during the periods shown and do not include the effect of taxes on distributions and redemptions. All information is unaudited. Performance for Classes IV and VI will vary due to different fees.
† The Fund is the successor to the GMO International Disciplined Equity Fund, therefore, performance for the periods prior to September 16, 2005 is that of GMO International Disciplined Equity Fund.
GMO International Core Equity Fund
(A Series of GMO Trust)
Investments Concentration Summary
February 29, 2008 (Unaudited)
| Asset Class Summary | % of Total Net Assets | ||||||
| Common Stocks | 96.9 | % | |||||
| Short-Term Investments | 1.4 | ||||||
| Preferred Stocks | 0.6 | ||||||
| Forward Currency Contracts | 0.2 | ||||||
| Rights and Warrants | 0.0 | ||||||
| Futures | (0.4 | ) | |||||
| Other | 1.3 | ||||||
| 100.0 | % | ||||||
| Country Summary | % of Equity Investments | ||||||
| United Kingdom | 23.1 | % | |||||
| Japan | 19.8 | ||||||
| Germany | 11.9 | ||||||
| France | 9.9 | ||||||
| Switzerland | 6.9 | ||||||
| Australia | 5.0 | ||||||
| Finland | 4.8 | ||||||
| Canada | 3.4 | ||||||
| Netherlands | 2.8 | ||||||
| Italy | 2.6 | ||||||
| Spain | 2.0 | ||||||
| Hong Kong | 1.6 | ||||||
| Sweden | 1.6 | ||||||
| Singapore | 1.4 | ||||||
| Belgium | 1.0 | ||||||
| Norway | 0.8 | ||||||
| Ireland | 0.6 | ||||||
| Denmark | 0.3 | ||||||
| Greece | 0.3 | ||||||
| Portugal | 0.1 | ||||||
| Austria | 0.1 | ||||||
| 100.0 | % | ||||||
1
GMO International Core Equity Fund
(A Series of GMO Trust)
Investments Concentration Summary — (Continued)
February 29, 2008 (Unaudited)
| Industry Sector Summary | % of Equity Investments | ||||||
| Financials | 17.3 | % | |||||
| Industrials | 12.9 | ||||||
| Health Care | 11.4 | ||||||
| Materials | 11.1 | ||||||
| Energy | 10.6 | ||||||
| Consumer Discretionary | 10.4 | ||||||
| Information Technology | 8.4 | ||||||
| Telecommunication Services | 7.0 | ||||||
| Consumer Staples | 6.7 | ||||||
| Utilities | 4.2 | ||||||
| 100.0 | % | ||||||
2
GMO International Core Equity Fund
(A Series of GMO Trust)
Schedule of Investments
(showing percentage of total net assets)
February 29, 2008
| Shares | Description | Value ($) | |||||||||
| COMMON STOCKS — 96.9% | |||||||||||
| Australia — 4.9% | |||||||||||
| 141 | Aristocrat Leisure Ltd | 1,343 | |||||||||
| 730,094 | Australia and New Zealand Banking Group Ltd | 14,732,875 | |||||||||
| 89,620 | Australian Stock Exchange Ltd | 3,445,681 | |||||||||
| 1,328,697 | BHP Billiton Ltd | 48,075,977 | |||||||||
| 1,401,205 | BlueScope Steel Ltd | 14,016,492 | |||||||||
| 1,266,234 | Foster's Group Ltd | 6,238,576 | |||||||||
| 29,938 | Incitec Pivot Ltd | 4,066,249 | |||||||||
| 193,523 | Macquarie Group Ltd | 9,664,615 | |||||||||
| 1,902,422 | Mirvac Group Ltd | 6,743,580 | |||||||||
| 201,508 | QBE Insurance Group Ltd | 4,167,944 | |||||||||
| 1,024,425 | Santos Ltd | 12,142,839 | |||||||||
| 1,491,907 | Stockland | 9,654,982 | |||||||||
| 1,529,495 | Suncorp-Metway Ltd | 19,620,651 | |||||||||
| 527,673 | TABCORP Holdings Ltd | 7,438,733 | |||||||||
| 4,262,769 | Telstra Corp Ltd | 19,162,770 | |||||||||
| 959,997 | Westpac Banking Corp | 20,533,057 | |||||||||
| 641,861 | Woodside Petroleum Ltd | 33,563,897 | |||||||||
| 848,445 | Woolworths Ltd | 22,659,561 | |||||||||
| 945,346 | Zinifex Ltd | 9,511,409 | |||||||||
| Total Australia | 265,441,231 | ||||||||||
| Austria — 0.1% | |||||||||||
| 88,416 | OMV AG | 6,388,497 | |||||||||
| Belgium — 1.0% | |||||||||||
| 100,833 | Belgacom SA | 4,829,096 | |||||||||
| 27,283 | Colruyt SA | 6,666,540 | |||||||||
| 553,143 | Dexia | 13,004,431 | |||||||||
| 1,300,543 | Fortis | 28,732,145 | |||||||||
| Total Belgium | 53,232,212 | ||||||||||
See accompanying notes to the financial statements.
3
GMO International Core Equity Fund
(A Series of GMO Trust)
Schedule of Investments — (Continued)
(showing percentage of total net assets)
February 29, 2008
| Shares | Description | Value ($) | |||||||||
| Canada — 3.3% | |||||||||||
| 209,600 | Canadian Imperial Bank of Commerce | 14,223,199 | |||||||||
| 120,500 | Canadian Natural Resources | 9,030,307 | |||||||||
| 205,400 | EnCana Corp | 15,657,772 | |||||||||
| 93,400 | Magna International Inc Class A | 6,849,491 | |||||||||
| 458,200 | National Bank of Canada | 22,615,551 | |||||||||
| 364,900 | Potash Corp of Saskatchewan Inc | 58,013,261 | |||||||||
| 453,200 | Research In Motion Ltd * | 47,210,156 | |||||||||
| 94,500 | Sun Life Financial Inc | 4,526,975 | |||||||||
| Total Canada | 178,126,712 | ||||||||||
| Denmark — 0.3% | |||||||||||
| 116,750 | Novo-Nordisk A/S | 7,986,683 | |||||||||
| 101,650 | Vestas Wind Systems A/S * | 10,305,071 | |||||||||
| Total Denmark | 18,291,754 | ||||||||||
| Finland — 4.7% | |||||||||||
| 267,053 | Fortum Oyj | 11,150,162 | |||||||||
| 133,467 | KCI Konecranes Oyj | 4,845,889 | |||||||||
| 343,277 | Neste Oil Oyj | 12,010,956 | |||||||||
| 4,853,810 | Nokia Oyj | 174,385,875 | |||||||||
| 189,114 | Outokumpu Oyj | 7,172,906 | |||||||||
| 161,914 | Outotec Oyj | 8,942,607 | |||||||||
| 258,386 | Rautaruukki Oyj | 11,265,722 | |||||||||
| 548,156 | Sampo Oyj Class A | 14,877,102 | |||||||||
| 563,791 | Tietoenator Oyj | 10,583,100 | |||||||||
| Total Finland | 255,234,319 | ||||||||||
| France — 9.7% | |||||||||||
| 185,488 | Alstom | 38,982,061 | |||||||||
| 309,279 | Arcelor Mittal | 23,483,075 | |||||||||
| 312,487 | BNP Paribas | 27,936,309 | |||||||||
| 207,475 | Bouygues | 14,170,584 | |||||||||
| 108,966 | Casino Guichard-Perrachon SA | 12,324,838 | |||||||||
| 101,330 | Cie de Saint-Gobain | 7,921,412 | |||||||||
See accompanying notes to the financial statements.
4
GMO International Core Equity Fund
(A Series of GMO Trust)
Schedule of Investments — (Continued)
(showing percentage of total net assets)
February 29, 2008
| Shares | Description | Value ($) | |||||||||
| France — continued | |||||||||||
| 231,608 | Credit Agricole SA | 6,282,317 | |||||||||
| 128,195 | Electricite de France | 11,956,744 | |||||||||
| 71,859 | Essilor International SA | 4,266,824 | |||||||||
| 1,112,600 | France Telecom SA | 37,348,902 | |||||||||
| 40,781 | Hermes International | 4,772,759 | |||||||||
| 78,952 | L'Oreal SA | 9,369,377 | |||||||||
| 81,618 | Michelin SA Class B | 8,038,580 | |||||||||
| 65,360 | Nexans SA | 7,136,037 | |||||||||
| 417,507 | Peugeot SA | 31,738,563 | |||||||||
| 92,855 | Renault SA | 9,921,230 | |||||||||
| 1,649,909 | Sanofi-Aventis | 121,949,148 | |||||||||
| 90,011 | Societe Generale | 9,631,106 | |||||||||
| 22,502 | Societe Generale NV (New Shares) * | 2,472,603 | |||||||||
| 1,733,843 | Total SA | 130,565,375 | |||||||||
| 44,700 | UbiSoft Entertainment SA * | 3,756,938 | |||||||||
| Total France | 524,024,782 | ||||||||||
| Germany — 10.9% | |||||||||||
| 94,101 | Adidas AG | 5,972,681 | |||||||||
| 91,019 | Allianz SE (Registered) | 15,691,058 | |||||||||
| 512,022 | Altana AG | 11,927,138 | |||||||||
| 369,375 | BASF AG | 47,234,048 | |||||||||
| 309,687 | Bayer AG | 23,833,334 | |||||||||
| 143,808 | Bayerische Motoren Werke AG | 7,924,001 | |||||||||
| 111,131 | Bilfinger & Berger AG | 8,822,908 | |||||||||
| 294,954 | Commerzbank AG | 8,867,564 | |||||||||
| 700,350 | Daimler AG (Registered) | 58,320,747 | |||||||||
| 71,743 | Deutsche Bank AG (Registered) | 7,959,301 | |||||||||
| 231,353 | Deutsche Boerse AG | 36,814,056 | |||||||||
| 331,649 | E.ON AG | 62,441,481 | |||||||||
| 489,056 | Epcos AG | 6,864,417 | |||||||||
| 385,503 | GEA Group AG * | 12,472,409 | |||||||||
| 68,531 | Hannover Rueckversicherungs AG (Registered) | 3,271,632 | |||||||||
| 21,149 | Hochtief AG | 2,293,107 | |||||||||
See accompanying notes to the financial statements.
5
GMO International Core Equity Fund
(A Series of GMO Trust)
Schedule of Investments — (Continued)
(showing percentage of total net assets)
February 29, 2008
| Shares | Description | Value ($) | |||||||||
| Germany — continued | |||||||||||
| 55,790 | K&S AG | 16,233,453 | |||||||||
| 68,269 | Linde AG | 9,074,872 | |||||||||
| 172,477 | MAN AG | 22,749,936 | |||||||||
| 112,534 | Muenchener Rueckversicherungs AG (Registered) | 19,800,282 | |||||||||
| 88,252 | Q-Cells AG * | 7,114,353 | |||||||||
| 62,796 | Rheinmetall AG | 4,388,584 | |||||||||
| 164,964 | RWE AG | 19,971,421 | |||||||||
| 109,178 | Salzgitter AG | 19,136,933 | |||||||||
| 428,184 | SAP AG | 20,220,899 | |||||||||
| 211,250 | SGL Carbon AG * | 11,723,941 | |||||||||
| 343,236 | Siemens AG (Registered) | 43,770,877 | |||||||||
| 140,230 | Solarworld AG | 6,338,273 | |||||||||
| 393,294 | Suedzucker AG | 8,670,487 | |||||||||
| 296,150 | ThyssenKrupp AG | 17,030,808 | |||||||||
| 206,996 | Volkswagen AG | 47,131,896 | |||||||||
| Total Germany | 594,066,897 | ||||||||||
| Greece — 0.3% | |||||||||||
| 317,531 | National Bank of Greece SA | 17,204,807 | |||||||||
| Hong Kong — 1.6% | |||||||||||
| 3,139,221 | CLP Holdings Ltd | 24,539,685 | |||||||||
| 2,446,500 | Hong Kong Electric Holdings Ltd | 13,855,095 | |||||||||
| 1,639,000 | Hong Kong Exchanges and Clearing Ltd | 31,136,198 | |||||||||
| 669,000 | Sun Hung Kai Properties Ltd | 11,658,301 | |||||||||
| 2,083,000 | Yue Yuen Industrial Holdings | 6,164,570 | |||||||||
| Total Hong Kong | 87,353,849 | ||||||||||
| Ireland — 0.6% | |||||||||||
| 627,039 | Anglo Irish Bank Corp | 8,880,546 | |||||||||
| 430,752 | CRH Plc | 16,009,125 | |||||||||
| 265,691 | DCC Plc | 6,684,865 | |||||||||
| Total Ireland | 31,574,536 | ||||||||||
See accompanying notes to the financial statements.
6
GMO International Core Equity Fund
(A Series of GMO Trust)
Schedule of Investments — (Continued)
(showing percentage of total net assets)
February 29, 2008
| Shares | Description | Value ($) | |||||||||
| Italy — 2.5% | |||||||||||
| 334,331 | Bulgari SPA | 3,722,428 | |||||||||
| 1,033,644 | Enel SPA | 11,153,435 | |||||||||
| 3,330,010 | ENI SPA | 114,989,350 | |||||||||
| 995,826 | Impregilo SPA * | 5,312,663 | |||||||||
| Total Italy | 135,177,876 | ||||||||||
| Japan — 19.3% | |||||||||||
| 185,530 | Acom Co Ltd | 5,366,416 | |||||||||
| 174,100 | Aiful Corp | 3,098,107 | |||||||||
| 1,365,600 | Alps Electric Co Ltd | 15,957,359 | |||||||||
| 120,100 | Astellas Pharma Inc | 5,249,062 | |||||||||
| 726,200 | Daiei Inc * | 4,614,882 | |||||||||
| 559,948 | Daiichi Sankyo Co Ltd | 17,377,146 | |||||||||
| 257,300 | Daikin Industries Ltd | 11,577,856 | |||||||||
| 2,376,000 | Daikyo Inc | 5,609,400 | |||||||||
| 99,200 | Eisai Co Ltd | 3,577,590 | |||||||||
| 77,600 | Fanuc Ltd | 7,234,558 | |||||||||
| 66,200 | Fast Retailing Co Ltd | 4,890,354 | |||||||||
| 1,571,000 | Fuji Heavy Industries Ltd | 6,853,451 | |||||||||
| 55,500 | Fuji Photo Film Co Ltd | 2,081,137 | |||||||||
| 3,339,000 | Haseko Corp * | 5,036,063 | |||||||||
| 897,000 | Hitachi Ltd | 6,499,503 | |||||||||
| 1,810,900 | Honda Motor Co Ltd | 55,278,320 | |||||||||
| 264,600 | Hoya Corp | 6,713,679 | |||||||||
| 1,272,000 | Isuzu Motors Ltd | 5,792,357 | |||||||||
| 3,107,000 | Itochu Corp | 32,717,820 | |||||||||
| 1,071 | Japan Real Estate Investment Corp | 11,918,185 | |||||||||
| 859,000 | Japan Steel Works Ltd (The) | 13,959,459 | |||||||||
| 154,800 | JFE Holdings Inc | 6,897,544 | |||||||||
| 242,000 | Kao Corp | 7,450,653 | |||||||||
| 2,312,000 | Kawasaki Kisen Kaisha Ltd | 23,452,962 | |||||||||
| 2,832 | Kenedix Inc | 3,742,146 | |||||||||
| 7,080 | KK DaVinci Advisors * | 5,960,883 | |||||||||
| 1,023,700 | Komatsu Ltd | 26,006,586 | |||||||||
See accompanying notes to the financial statements.
7
GMO International Core Equity Fund
(A Series of GMO Trust)
Schedule of Investments — (Continued)
(showing percentage of total net assets)
February 29, 2008
| Shares | Description | Value ($) | |||||||||
| Japan — continued | |||||||||||
| 192,500 | Konami Corp | 6,374,216 | |||||||||
| 164,700 | Kyushu Electric Power Co Inc | 4,149,750 | |||||||||
| 3,497,000 | Marubeni Corp | 26,476,148 | |||||||||
| 384,000 | Matsushita Electric Industrial Co Ltd | 8,087,577 | |||||||||
| 871,000 | Meiji Dairies Corp | 4,992,576 | |||||||||
| 1,724,600 | Mitsubishi Corp | 52,618,378 | |||||||||
| 398,500 | Mitsubishi Estate Co Ltd | 9,711,638 | |||||||||
| 1,754,000 | Mitsui & Co | 38,144,999 | |||||||||
| 2,126,000 | Mitsui OSK Lines Ltd | 27,612,240 | |||||||||
| 2,885,600 | Mitsui Trust Holding Inc | 19,891,694 | |||||||||
| 553,500 | Mitsumi Electric Co Ltd | 17,200,898 | |||||||||
| 278 | Mixi Inc * | 3,241,597 | |||||||||
| 491,000 | NGK Insulators Ltd | 11,149,587 | |||||||||
| 413,000 | Nikon Corp | 11,568,144 | |||||||||
| 128,900 | Nintendo Co Ltd | 64,178,757 | |||||||||
| 1,253 | Nippon Building Fund Inc | 15,415,644 | |||||||||
| 2,863,000 | Nippon Light Metal | 4,419,252 | |||||||||
| 1,731,000 | Nippon Mining Holdings Inc | 10,252,455 | |||||||||
| 2,925,000 | Nippon Oil Corp | 19,953,393 | |||||||||
| 1,142,000 | Nippon Steel Corp | 6,008,291 | |||||||||
| 3,843 | Nippon Telegraph & Telephone Corp | 16,758,299 | |||||||||
| 1,025,000 | Nippon Yakin Koguo Co Ltd | 9,732,846 | |||||||||
| 1,806,000 | Nippon Yusen KK | 16,688,217 | |||||||||
| 3,150,100 | Nissan Motor Co | 28,328,762 | |||||||||
| 9,198 | NTT Docomo Inc | 13,475,714 | |||||||||
| 145,400 | Ono Pharmaceutical Co Ltd | 7,340,704 | |||||||||
| 6,666,000 | Osaka Gas Co Ltd | 26,746,316 | |||||||||
| 764,000 | Pacific Metals Co Ltd | 9,128,200 | |||||||||
| 12,585 | Resona Holdings Inc | 20,356,416 | |||||||||
| 509,000 | Ricoh Company Ltd | 8,174,607 | |||||||||
| 5,260,000 | Sanyo Electric Co Ltd * | 11,103,881 | |||||||||
| 1,258,000 | Seven & I Holdings Co Ltd | 31,280,508 | |||||||||
| 395,700 | Shin-Etsu Chemical Co Ltd | 21,354,497 | |||||||||
| 4,865,400 | Sojitz Corp | 18,238,089 | |||||||||
See accompanying notes to the financial statements.
8
GMO International Core Equity Fund
(A Series of GMO Trust)
Schedule of Investments — (Continued)
(showing percentage of total net assets)
February 29, 2008
| Shares | Description | Value ($) | |||||||||
| Japan — continued | |||||||||||
| 320,600 | Sony Corp | 15,146,175 | |||||||||
| 381,600 | SUMCO Corp | 8,438,553 | |||||||||
| 1,130,200 | Sumitomo Corp | 16,253,630 | |||||||||
| 195,000 | Taisho Pharmaceutical Co Ltd | 3,973,781 | |||||||||
| 549,000 | Taiyo Yuden Co Ltd | 5,978,512 | |||||||||
| 654,000 | Takeda Pharmaceutical Co Ltd | 36,492,565 | |||||||||
| 291,260 | Takefuji Corp | 7,356,659 | |||||||||
| 112,700 | TDK Corp | 8,011,028 | |||||||||
| 290,300 | Tokyo Electric Power Co Inc | 7,458,408 | |||||||||
| 1,276,000 | Tokyo Gas Co Ltd | 5,723,851 | |||||||||
| 746,900 | Tokyo Steel Manufacturing Co | 8,928,735 | |||||||||
| 354,000 | TonenGeneral Sekiyu KK | 3,360,688 | |||||||||
| 1,859,000 | Toshiba Corp | 13,943,867 | |||||||||
| Total Japan | 1,046,134,220 | ||||||||||
| Netherlands — 2.8% | |||||||||||
| 1,723,698 | Aegon NV | 25,742,563 | |||||||||
| 51,431 | Heineken Holding NV | 2,614,836 | |||||||||
| 449,928 | Heineken NV | 25,376,158 | |||||||||
| 1,729,292 | ING Groep NV | 57,467,306 | |||||||||
| 267,205 | Koninklijke DSM | 11,758,747 | |||||||||
| 203,122 | OCE NV | 3,767,013 | |||||||||
| 380,217 | Reed Elsevier NV | 7,063,693 | |||||||||
| 154,281 | TomTom NV * | 7,230,073 | |||||||||
| 63,789 | Wereldhave NV | 7,710,686 | |||||||||
| Total Netherlands | 148,731,075 | ||||||||||
| Norway — 0.7% | |||||||||||
| 344,800 | DnB NOR ASA | 5,043,593 | |||||||||
| 970,550 | StatoilHydro ASA | 29,573,926 | |||||||||
| 364,000 | Tandberg ASA | 5,318,913 | |||||||||
| Total Norway | 39,936,432 | ||||||||||
See accompanying notes to the financial statements.
9
GMO International Core Equity Fund
(A Series of GMO Trust)
Schedule of Investments — (Continued)
(showing percentage of total net assets)
February 29, 2008
| Shares | Description | Value ($) | |||||||||
| Portugal — 0.1% | |||||||||||
| 2,575,760 | Banco Commercial Portugues SA | 7,420,356 | |||||||||
| Singapore — 1.3% | |||||||||||
| 359,000 | City Developments Ltd | 3,013,011 | |||||||||
| 412,200 | MobileOne Ltd | 589,444 | |||||||||
| 2,928,000 | Oversea-Chinese Banking Corp | 15,795,121 | |||||||||
| 2,733,000 | Singapore Exchange Ltd | 15,902,302 | |||||||||
| 9,853,000 | Singapore Telecommunications | 26,659,397 | |||||||||
| 844,000 | United Overseas Bank Ltd | 10,701,417 | |||||||||
| Total Singapore | 72,660,692 | ||||||||||
| Spain — 2.0% | |||||||||||
| 975,428 | Iberdrola SA | 14,087,881 | |||||||||
| 165,275 | Inditex SA | 8,520,528 | |||||||||
| 620,140 | Repsol YPF SA | 21,392,733 | |||||||||
| 2,132,416 | Telefonica SA | 61,704,754 | |||||||||
| Total Spain | 105,705,896 | ||||||||||
| Sweden — 1.6% | |||||||||||
| 606,600 | Electrolux AB Series B | 9,732,968 | |||||||||
| 383,200 | Hennes & Mauritz AB Class B | 21,492,970 | |||||||||
| 857,200 | Investor AB | 18,131,863 | |||||||||
| 427,900 | Sandvik AB | 7,215,237 | |||||||||
| 402,800 | Scania AB Class B | 9,717,703 | |||||||||
| 245,200 | SKF AB Class B | 4,509,654 | |||||||||
| 144,400 | Svenska Handelsbanken AB Class A | 4,022,817 | |||||||||
| 176,200 | Swedbank AB | 4,762,309 | |||||||||
| 334,650 | Tele2 AB Class B | 5,882,065 | |||||||||
| Total Sweden | 85,467,586 | ||||||||||
| Switzerland — 6.7% | |||||||||||
| 1,967,945 | ABB Ltd | 49,030,009 | |||||||||
| 131,713 | Actelion Ltd * | 6,865,754 | |||||||||
| 199,011 | CIE Financiere Richemont SA Class A | 11,520,495 | |||||||||
See accompanying notes to the financial statements.
10
GMO International Core Equity Fund
(A Series of GMO Trust)
Schedule of Investments — (Continued)
(showing percentage of total net assets)
February 29, 2008
| Shares | Description | Value ($) | |||||||||
| Switzerland — continued | |||||||||||
| 150,592 | Nestle SA (Registered) | 71,875,806 | |||||||||
| 2,525,679 | Novartis AG (Registered) | 124,750,333 | |||||||||
| 120,745 | Roche Holding AG (Non Voting) | 23,679,119 | |||||||||
| 48,805 | Swatch Group AG | 14,325,487 | |||||||||
| 296,179 | Swiss Reinsurance Co (Registered) | 23,739,785 | |||||||||
| 36,014 | Syngenta AG (Registered) | 10,354,361 | |||||||||
| 90,237 | Zurich Financial Services AG | 28,209,092 | |||||||||
| Total Switzerland | 364,350,241 | ||||||||||
| United Kingdom — 22.5% | |||||||||||
| 1,694,558 | 3i Group Plc | 27,387,227 | |||||||||
| 1,174,461 | Aberdeen Asset Management | 3,107,105 | |||||||||
| 1,315,639 | AMEC Plc | 20,069,263 | |||||||||
| 515,699 | Arriva Plc | 6,943,501 | |||||||||
| 1,693,363 | AstraZeneca Plc | 63,293,513 | |||||||||
| 1,440,805 | Aviva Plc | 17,366,664 | |||||||||
| 2,209,054 | Barclays Plc | 20,703,958 | |||||||||
| 704,818 | Barratt Developments Plc | 5,702,311 | |||||||||
| 1,466,851 | BBA Aviation Plc | 5,337,119 | |||||||||
| 119,657 | Berkeley Group Holdings Plc * | 2,461,718 | |||||||||
| 2,060,555 | BG Group Plc | 48,569,307 | |||||||||
| 1,723,945 | BHP Billiton Plc | 55,149,197 | |||||||||
| 255,339 | British American Tobacco Plc | 9,574,402 | |||||||||
| 1,035,909 | Britvic Plc | 6,811,667 | |||||||||
| 516,658 | Cadbury Schweppes Plc | 5,751,052 | |||||||||
| 736,905 | Capita Group Plc | 9,548,339 | |||||||||
| 484,112 | Centrica Plc | 3,090,953 | |||||||||
| 344,724 | Cookson Group Plc | 4,057,365 | |||||||||
| 647,861 | Diageo Plc | 13,238,924 | |||||||||
| 5,139,926 | DSG International Plc | 6,425,181 | |||||||||
| 893,591 | FirstGroup Plc | 10,201,945 | |||||||||
| 7,799,421 | GlaxoSmithKline Plc | 170,249,966 | |||||||||
| 1,664,273 | HBOS Plc | 19,776,484 | |||||||||
| 1,940,294 | Home Retail Group | 9,911,234 | |||||||||
See accompanying notes to the financial statements.
11
GMO International Core Equity Fund
(A Series of GMO Trust)
Schedule of Investments — (Continued)
(showing percentage of total net assets)
February 29, 2008
| Shares | Description | Value ($) | |||||||||
| United Kingdom — continued | |||||||||||
| 595,644 | Imperial Tobacco Group Plc | 27,573,733 | |||||||||
| 242,248 | Intermediate Capital Group Plc | 7,168,204 | |||||||||
| 684,442 | J Sainsbury Plc | 4,798,560 | |||||||||
| 585,520 | Kesa Electricals Plc | 2,473,627 | |||||||||
| 1,050,873 | Kingfisher Plc | 2,712,699 | |||||||||
| 1,698,984 | Ladbrokes Plc | 10,202,170 | |||||||||
| 441,807 | London Stock Exchange | 11,847,775 | |||||||||
| 773,035 | Michael Page International Plc | 4,277,618 | |||||||||
| 418,646 | Next Plc | 10,617,663 | |||||||||
| 3,231,060 | Northern Foods Plc | 5,765,409 | |||||||||
| 2,845,307 | Old Mutual Plc | 7,028,198 | |||||||||
| 234,773 | Provident Financial Plc | 3,719,497 | |||||||||
| 342,857 | Reckitt Benckiser Group Plc | 18,494,137 | |||||||||
| 936,109 | Rio Tinto Plc | 105,319,345 | |||||||||
| 9,421,938 | Royal Bank of Scotland Group | 71,234,812 | |||||||||
| 785,414 | Royal Dutch Shell Group Class A (Amsterdam) | 28,086,065 | |||||||||
| 1,370,789 | Royal Dutch Shell Plc A Shares (London) | 49,014,437 | |||||||||
| 524,236 | Royal Dutch Shell Plc B Shares (London) | 18,391,228 | |||||||||
| 523,446 | SABMiller Breweries Plc | 10,874,905 | |||||||||
| 286,269 | Scottish & Southern Energy Plc | 8,370,687 | |||||||||
| 2,526,598 | Signet Group Plc | 3,045,923 | |||||||||
| 316,948 | Smith & Nephew Plc | 4,118,144 | |||||||||
| 254,997 | Spectris Plc | 3,957,212 | |||||||||
| 2,404,744 | Stagecoach Group Plc | 11,927,231 | |||||||||
| 2,937,716 | Taylor Woodrow Plc | 9,940,489 | |||||||||
| 1,914,380 | Tesco Plc | 15,128,003 | |||||||||
| 694,916 | Tomkins Plc | 2,329,879 | |||||||||
| 254,974 | Travis Perkins Plc | 5,450,752 | |||||||||
| 1,098,231 | Trinity Mirror Plc | 6,171,156 | |||||||||
| 950,710 | Unilever Plc | 29,953,324 | |||||||||
| 52,173,195 | Vodafone Group Inc | 167,967,345 | |||||||||
| 174,639 | Wetherspoon J D Plc | 1,058,955 | |||||||||
| 576,582 | WH Smith Plc | 4,264,400 | |||||||||
| 237,829 | Whitbread Plc | 5,951,034 | |||||||||
| Total United Kingdom | 1,223,963,011 | ||||||||||
| TOTAL COMMON STOCKS (COST $5,313,136,824) | 5,260,486,981 | ||||||||||
See accompanying notes to the financial statements.
12
GMO International Core Equity Fund
(A Series of GMO Trust)
Schedule of Investments — (Continued)
(showing percentage of total net assets)
February 29, 2008
| Shares / Par Value ($) | Description | Value ($) | |||||||||
| PREFERRED STOCKS — 0.6% | |||||||||||
| Germany — 0.6% | |||||||||||
| 8,684 | Porsche AG (Non Voting) 0.06% | 15,057,009 | |||||||||
| 131,566 | Volkswagen AG 2.02% | 18,332,154 | |||||||||
| Total Germany | 33,389,163 | ||||||||||
| TOTAL PREFERRED STOCKS (COST $20,335,489) | 33,389,163 | ||||||||||
| RIGHTS AND WARRANTS — 0.0% | |||||||||||
| France — 0.0% | |||||||||||
| 3 | Societe Generale Rights, Expires 02/29/08 * (a) | 26 | |||||||||
| TOTAL RIGHTS AND WARRANTS (COST $21) | 26 | ||||||||||
| SHORT-TERM INVESTMENTS — 1.4% | |||||||||||
| 78,200,000 | Royal Bank of Scotland Time Deposit, 3.10%, due 03/03/08 | 78,200,000 | |||||||||
| TOTAL SHORT-TERM INVESTMENTS (COST $78,200,000) | 78,200,000 | ||||||||||
| TOTAL INVESTMENTS — 98.9% (Cost $5,411,672,334) | 5,372,076,170 | ||||||||||
| Other Assets and Liabilities (net) — 1.1% | 60,031,864 | ||||||||||
| TOTAL NET ASSETS — 100.0% | $ | 5,432,108,034 | |||||||||
See accompanying notes to the financial statements.
13
GMO International Core Equity Fund
(A Series of GMO Trust)
Schedule of Investments — (Continued)
February 29, 2008
A summary of outstanding financial instruments at February 29, 2008 is as follows:
Forward Currency Contracts
| Settlement Date | Deliver/ Receive | Units of Currency | Value | Net Unrealized Appreciation (Depreciation) | |||||||||||||||
| Buys | |||||||||||||||||||
| 05/23/08 | CHF | 51,977,142 | $ | 49,927,773 | $ | 2,404,033 | |||||||||||||
| 05/23/08 | CHF | 51,977,142 | 49,927,773 | 2,429,092 | |||||||||||||||
| 05/23/08 | CHF | 51,977,142 | 49,927,773 | 2,383,211 | |||||||||||||||
| 05/23/08 | CHF | 51,977,142 | 49,927,773 | 2,388,429 | |||||||||||||||
| 05/23/08 | CHF | 51,977,142 | 49,927,773 | 2,369,508 | |||||||||||||||
| 05/23/08 | CHF | 51,977,142 | 49,927,773 | 2,317,014 | |||||||||||||||
| 05/23/08 | CHF | 51,977,142 | 49,927,773 | 2,298,690 | |||||||||||||||
| 05/23/08 | HKD | 53,165,333 | 6,842,190 | 13,867 | |||||||||||||||
| 05/23/08 | HKD | 53,165,333 | 6,842,190 | 13,516 | |||||||||||||||
| 05/23/08 | HKD | 54,776,403 | 7,049,531 | 13,745 | |||||||||||||||
| 05/23/08 | JPY | 4,416,220,821 | 42,708,524 | 1,356,593 | |||||||||||||||
| 05/23/08 | JPY | 4,416,220,821 | 42,708,524 | 1,465,767 | |||||||||||||||
| 05/23/08 | JPY | 4,416,220,821 | 42,708,524 | 1,380,586 | |||||||||||||||
| 05/23/08 | JPY | 4,416,220,821 | 42,708,524 | 1,475,894 | |||||||||||||||
| 05/23/08 | JPY | 4,416,220,821 | 42,708,524 | 1,372,462 | |||||||||||||||
| 05/23/08 | JPY | 4,416,220,821 | 42,708,524 | 1,499,210 | |||||||||||||||
| 05/23/08 | JPY | 9,522,297,821 | 92,088,530 | 2,707,463 | |||||||||||||||
| 05/23/08 | NZD | 23,869,700 | 18,834,586 | 56,530 | |||||||||||||||
| 05/23/08 | NZD | 23,167,650 | 18,280,627 | (17,322 | ) | ||||||||||||||
| 05/23/08 | NZD | 23,167,650 | 18,280,627 | (26,450 | ) | ||||||||||||||
| 05/23/08 | SEK | 203,027,499 | 32,802,674 | 775,418 | |||||||||||||||
| 05/23/08 | SEK | 203,027,499 | 32,802,674 | 782,621 | |||||||||||||||
| 05/23/08 | SEK | 203,027,499 | 32,802,674 | 832,356 | |||||||||||||||
| 05/23/08 | SEK | 203,027,499 | 32,802,674 | 806,661 | |||||||||||||||
| 05/23/08 | SEK | 203,027,499 | 32,802,674 | 803,130 | |||||||||||||||
| 05/23/08 | SEK | 203,027,499 | 32,802,674 | 775,832 | |||||||||||||||
| 05/23/08 | SEK | 203,027,499 | 32,802,674 | 789,574 | |||||||||||||||
| $ | 1,003,582,554 | $ | 33,467,430 | ||||||||||||||||
See accompanying notes to the financial statements.
14
GMO International Core Equity Fund
(A Series of GMO Trust)
Schedule of Investments — (Continued)
February 29, 2008
Forward Currency Contracts — continued
| Settlement Date | Deliver/ Receive | Units of Currency | Value | Net Unrealized Appreciation (Depreciation) | |||||||||||||||
| Sales | |||||||||||||||||||
| 05/23/08 | AUD | 25,998,045 | $ | 23,958,845 | $ | (298,908 | ) | ||||||||||||
| 05/23/08 | AUD | 25,998,045 | 23,958,845 | (262,433 | ) | ||||||||||||||
| 05/23/08 | AUD | 25,998,045 | 23,958,845 | (269,426 | ) | ||||||||||||||
| 05/23/08 | AUD | 25,998,045 | 23,958,845 | (284,817 | ) | ||||||||||||||
| 05/23/08 | AUD | 24,468,748 | 22,549,501 | (281,227 | ) | ||||||||||||||
| 05/23/08 | AUD | 24,468,748 | 22,549,501 | (294,441 | ) | ||||||||||||||
| 05/23/08 | CHF | 47,480,000 | 45,607,946 | (2,313,484 | ) | ||||||||||||||
| 05/23/08 | CHF | 22,006,000 | 21,138,342 | (1,227,698 | ) | ||||||||||||||
| 05/23/08 | CHF | 22,075,000 | 21,204,621 | (1,151,934 | ) | ||||||||||||||
| 05/23/08 | CHF | 10,580,000 | 10,162,849 | (551,963 | ) | ||||||||||||||
| 05/23/08 | CAD | 10,863,000 | 11,019,169 | (261,327 | ) | ||||||||||||||
| 05/23/08 | CAD | 12,532,166 | 12,712,332 | (336,717 | ) | ||||||||||||||
| 05/23/08 | CAD | 12,532,166 | 12,712,332 | (387,833 | ) | ||||||||||||||
| 05/23/08 | CAD | 12,911,928 | 13,097,553 | (287,630 | ) | ||||||||||||||
| 05/23/08 | EUR | 8,698,000 | 13,166,974 | (211,439 | ) | ||||||||||||||
| 05/23/08 | EUR | 15,741,734 | 23,829,732 | (700,717 | ) | ||||||||||||||
| 05/23/08 | EUR | 15,741,734 | 23,829,732 | (706,305 | ) | ||||||||||||||
| 05/23/08 | EUR | 15,741,734 | 23,829,732 | (699,930 | ) | ||||||||||||||
| 05/23/08 | EUR | 15,741,734 | 23,829,732 | (696,845 | ) | ||||||||||||||
| 05/23/08 | EUR | 15,741,734 | 23,829,732 | (698,513 | ) | ||||||||||||||
| 05/23/08 | EUR | 15,741,734 | 23,829,732 | (703,566 | ) | ||||||||||||||
| 05/23/08 | EUR | 19,169,734 | 29,019,016 | (912,117 | ) | ||||||||||||||
| 05/23/08 | GBP | 14,410,438 | 28,467,388 | (536,933 | ) | ||||||||||||||
| 05/23/08 | GBP | 14,410,438 | 28,467,388 | (518,675 | ) | ||||||||||||||
| 05/23/08 | GBP | 14,410,438 | 28,467,388 | (507,968 | ) | ||||||||||||||
| 05/23/08 | GBP | 14,410,438 | 28,467,388 | (515,029 | ) | ||||||||||||||
| 05/23/08 | GBP | 15,522,438 | 30,664,111 | (534,424 | ) | ||||||||||||||
| 05/23/08 | GBP | 16,872,438 | 33,330,995 | (577,542 | ) | ||||||||||||||
| 05/23/08 | GBP | 16,960,438 | 33,504,837 | (605,005 | ) | ||||||||||||||
| 05/23/08 | GBP | 33,926,000 | 67,019,795 | (843,400 | ) | ||||||||||||||
| 05/23/08 | JPY | 329,820,000 | 3,189,633 | (48,703 | ) | ||||||||||||||
| 05/23/08 | JPY | 769,315,000 | 7,439,915 | (278,867 | ) | ||||||||||||||
| 05/23/08 | JPY | 831,459,000 | 8,040,899 | (255,119 | ) | ||||||||||||||
See accompanying notes to the financial statements.
15
GMO International Core Equity Fund
(A Series of GMO Trust)
Schedule of Investments — (Continued)
February 29, 2008
Forward Currency Contracts — continued
| Settlement Date | Deliver/ Receive | Units of Currency | Value | Net Unrealized Appreciation (Depreciation) | |||||||||||||||
| 05/23/08 | JPY | 1,147,136,000 | $ | 11,093,758 | $ | (352,483 | ) | ||||||||||||
| 05/23/08 | NOK | 67,116,398 | 12,789,760 | (309,740 | ) | ||||||||||||||
| 05/23/08 | NOK | 67,116,398 | 12,789,760 | (324,093 | ) | ||||||||||||||
| 05/23/08 | NOK | 69,150,229 | 13,177,329 | (329,380 | ) | ||||||||||||||
| 05/23/08 | NZD | 10,616,667 | 8,377,170 | (187,579 | ) | ||||||||||||||
| 05/23/08 | NZD | 10,616,667 | 8,377,170 | (189,649 | ) | ||||||||||||||
| 05/23/08 | NZD | 10,616,667 | 8,377,170 | (189,065 | ) | ||||||||||||||
| 05/23/08 | SEK | 111,240,000 | 17,972,784 | (768,057 | ) | ||||||||||||||
| 05/23/08 | SGD | 5,337,153 | 3,839,102 | (45,791 | ) | ||||||||||||||
| 05/23/08 | SGD | 5,337,153 | 3,839,102 | (43,255 | ) | ||||||||||||||
| 05/23/08 | SGD | 5,498,885 | 3,955,439 | (47,068 | ) | ||||||||||||||
| $ | 875,402,189 | $ | (21,547,095 | ) | |||||||||||||||
Futures Contracts
| Number of Contracts | Type | Expiration Date | Contract Value | Net Unrealized Appreciation (Depreciation) | |||||||||||||||
| Buys | |||||||||||||||||||
| 145 | DAX | March 2008 | $ | 37,138,978 | $ | (3,510,983 | ) | ||||||||||||
| 1,011 | MSCI Singapore | March 2008 | 53,996,344 | (1,528,921 | ) | ||||||||||||||
| 171 | S&P/MIB | March 2008 | 43,700,380 | (5,727,598 | ) | ||||||||||||||
| 338 | SPI 200 | March 2008 | 43,797,569 | (4,030,218 | ) | ||||||||||||||
| 775 | TOPIX | March 2008 | 98,506,834 | (8,607,620 | ) | ||||||||||||||
| $ | 277,140,105 | $ | (23,405,340 | ) | |||||||||||||||
| Sales | |||||||||||||||||||
| 22 | AEX | March 2008 | $ | 2,989,237 | $ | 45,254 | |||||||||||||
| 145 | CAC 40 | March 2008 | 10,560,821 | 220,777 | |||||||||||||||
| 476 | FTSE 100 | March 2008 | 55,161,144 | 1,238,239 | |||||||||||||||
| 7 | HANG SENG | March 2008 | 1,088,957 | (16,703 | ) | ||||||||||||||
| 16 | IBEX 35 | March 2008 | 3,207,547 | 5,023 | |||||||||||||||
| 126 | OMXS 30 | March 2008 | 1,978,041 | (5,843 | ) | ||||||||||||||
| 863 | S&P Toronto 60 | March 2008 | 139,605,649 | (1,499,565 | ) | ||||||||||||||
| $ | 214,591,396 | $ | (12,818 | ) | |||||||||||||||
See accompanying notes to the financial statements.
16
GMO International Core Equity Fund
(A Series of GMO Trust)
Schedule of Investments — (Continued)
February 29, 2008
As of February 29, 2008, for the futures contracts held, the Fund had sufficient cash and/or securities to cover any commitments or margin requirements of the relevant broker or exchange.
Notes to Schedule of Investments:
* Non-income producing security.
(a) As of February 29, 2008, the Fund elected to sell these rights but the sale did not occur until after the Fund's year end.
As of February 29, 2008, 91.68% of the Net Assets of the Fund were valued using fair value prices based on models used by a third party vendor (Note 2).
Currency Abbreviations:
| AUD - Australian Dollar CAD - Canadian Dollar CHF - Swiss Franc EUR - Euro GBP - B ritish Pound HKD - Hong Kong Dollar JPY - Japanese Yen NOK - Norwegian Krone NZD - New Zealand Dollar SEK - Swedish Krona SGD - Singapore Dollar | |||
See accompanying notes to the financial statements.
17
GMO International Core Equity Fund
(A Series of GMO Trust)
Statement of Assets and Liabilities — February 29, 2008
| Assets: | |||||||
| Investments, at value (cost $5,411,672,334) (Note 2) | $ | 5,372,076,170 | |||||
| Foreign currency, at value (cost $4,892,288) (Note 2) | 4,932,178 | ||||||
| Receivable for investments sold | 1,622,667 | ||||||
| Receivable for Fund shares sold | 57,295,283 | ||||||
| Dividends and interest receivable | 9,930,009 | ||||||
| Foreign taxes receivable | 1,689,975 | ||||||
| Unrealized appreciation on open forward currency contracts (Note 2) | 33,511,202 | ||||||
| Receivable for collateral on open futures contracts (Note 2) | 37,335,000 | ||||||
| Receivable for expenses reimbursed by Manager (Note 3) | 429,490 | ||||||
| Total assets | 5,518,821,974 | ||||||
| Liabilities: | |||||||
| Due to custodian | 239,639 | ||||||
| Payable for investments purchased | 3,246,243 | ||||||
| Payable for Fund shares repurchased | 58,403,564 | ||||||
| Payable to affiliate for (Note 3): | |||||||
| Management fee | 1,625,610 | ||||||
| Shareholder service fee | 330,279 | ||||||
| Trustees and Chief Compliance Officer of GMO Trust fees | 6,429 | ||||||
| Unrealized depreciation on open forward currency contracts (Note 2) | 21,590,867 | ||||||
| Payable for variation margin on open futures contracts (Note 2) | 189,752 | ||||||
| Accrued expenses | 1,081,557 | ||||||
| Total liabilities | 86,713,940 | ||||||
| Net assets | $ | 5,432,108,034 | |||||
See accompanying notes to the financial statements.
18
GMO International Core Equity Fund
(A Series of GMO Trust)
Statement of Assets and Liabilities — February 29, 2008 — (Continued)
| Net assets consist of: | |||||||
| Paid-in capital | $ | 5,380,056,555 | |||||
| Accumulated undistributed net investment income | 60,260,648 | ||||||
| Accumulated net realized gain | 42,582,440 | ||||||
| Net unrealized depreciation | (50,791,609 | ) | |||||
| $ | 5,432,108,034 | ||||||
| Net assets attributable to: | |||||||
| Class III shares | $ | 917,684,966 | |||||
| Class IV shares | $ | 947,062,869 | |||||
| Class VI shares | $ | 3,567,360,199 | |||||
| Shares outstanding: | |||||||
| Class III | 24,634,958 | ||||||
| Class IV | 25,435,825 | ||||||
| Class VI | 95,840,331 | ||||||
| Net asset value per share: | |||||||
| Class III | $ | 37.25 | |||||
| Class IV | $ | 37.23 | |||||
| Class VI | $ | 37.22 | |||||
See accompanying notes to the financial statements.
19
GMO International Core Equity Fund
(A Series of GMO Trust)
Statement of Operations — Year Ended February 29, 2008
| Investment Income: | |||||||
| Dividends (net of withholding taxes of $13,049,764) | $ | 140,838,550 | |||||
| Interest | 11,745,976 | ||||||
| Securities lending income | 2,965,247 | ||||||
| Total investment income | 155,549,773 | ||||||
| Expenses: | |||||||
| Management fee (Note 3) | 20,690,755 | ||||||
| Shareholder service fee – Class III (Note 3) | 1,455,079 | ||||||
| Shareholder service fee – Class IV (Note 3) | 737,097 | ||||||
| Shareholder service fee – Class VI (Note 3) | 2,010,737 | ||||||
| Custodian and fund accounting agent fees | 2,347,759 | ||||||
| Transfer agent fees | 46,820 | ||||||
| Audit and tax fees | 80,171 | ||||||
| Legal fees | 120,982 | ||||||
| Trustees fees and related expenses (Note 3) | 59,221 | ||||||
| Miscellaneous | 79,147 | ||||||
| Total expenses | 27,627,768 | ||||||
| Fees and expenses reimbursed by Manager (Note 3) | (2,645,358 | ) | |||||
| Expense reductions (Note 2) | (30,087 | ) | |||||
| Net expenses | 24,952,323 | ||||||
| Net investment income (loss) | 130,597,450 | ||||||
| Realized and unrealized gain (loss): | |||||||
| Net realized gain (loss) on: | |||||||
| Investments | 249,043,995 | ||||||
| Closed futures contracts | (13,356,499 | ) | |||||
| Foreign currency, forward contracts and foreign currency related transactions | 27,141,524 | ||||||
| Net realized gain (loss) | 262,829,020 | ||||||
| Change in net unrealized appreciation (depreciation) on: | |||||||
| Investments | (524,666,886 | ) | |||||
| Open futures contracts | (21,373,511 | ) | |||||
| Foreign currency, forward contracts and foreign currency related transactions | 7,703,873 | ||||||
| Net unrealized gain (loss) | (538,336,524 | ) | |||||
| Net realized and unrealized gain (loss) | (275,507,504 | ) | |||||
| Net increase (decrease) in net assets resulting from operations | $ | (144,910,054 | ) | ||||
See accompanying notes to the financial statements.
20
GMO International Core Equity Fund
(A Series of GMO Trust)
Statement of Changes in Net Assets
| Year Ended February 29, 2008 | Year Ended February 28, 2007 | ||||||||||
| Increase (decrease) in net assets: | |||||||||||
| Operations: | |||||||||||
| Net investment income (loss) | $ | 130,597,450 | $ | 57,734,964 | |||||||
| Net realized gain (loss) | 262,829,020 | 191,962,966 | |||||||||
| Change in net unrealized appreciation (depreciation) | (538,336,524 | ) | 212,810,791 | ||||||||
| Net increase (decrease) in net assets from operations | (144,910,054 | ) | 462,508,721 | ||||||||
| Distributions to shareholders from: | |||||||||||
| Net investment income | |||||||||||
| Class III | (15,752,992 | ) | (15,520,665 | ) | |||||||
| Class IV | (13,850,618 | ) | (19,922,801 | ) | |||||||
| Class VI | (70,382,406 | ) | (18,254,450 | ) | |||||||
| Total distributions from net investment income | (99,986,016 | ) | (53,697,916 | ) | |||||||
| Net realized gains | |||||||||||
| Class III | (44,597,287 | ) | (41,938,026 | ) | |||||||
| Class IV | (40,295,188 | ) | (49,032,006 | ) | |||||||
| Class VI | (183,168,178 | ) | (44,892,191 | ) | |||||||
| Total distributions from net realized gains | (268,060,653 | ) | (135,862,223 | ) | |||||||
| (368,046,669 | ) | (189,560,139 | ) | ||||||||
| Net share transactions (Note 7): | |||||||||||
| Class III | 81,033,866 | (41,461,834 | ) | ||||||||
| Class IV | 308,789,561 | (579,931,387 | ) | ||||||||
| Class VI | 2,587,884,351 | 1,311,930,094 | |||||||||
| Increase (decrease) in net assets resulting from net share transactions | 2,977,707,778 | 690,536,873 | |||||||||
| Total increase (decrease) in net assets | 2,464,751,055 | 963,485,455 | |||||||||
| Net assets: | |||||||||||
| Beginning of period | 2,967,356,979 | 2,003,871,524 | |||||||||
| End of period (including accumulated undistributed net investment income of $60,260,648 and distributions in excess of net investment income of $6,487,249, respectively) | $ | 5,432,108,034 | $ | 2,967,356,979 | |||||||
See accompanying notes to the financial statements.
21
GMO International Core Equity Fund
(A Series of GMO Trust)
Financial Highlights
(For a Class III share outstanding throughout each period)
| Year Ended February 28/29, | |||||||||||||||||||||||
| 2008 | 2007 | 2006 | 2005 | 2004 | |||||||||||||||||||
| Net asset value, beginning of period | $ | 39.38 | $ | 35.23 | $ | 30.81 | $ | 26.75 | $ | 18.04 | |||||||||||||
| Income (loss) from investment operations: | |||||||||||||||||||||||
| Net investment income (loss)† | 1.01 | 0.86 | 0.72 | 0.55 | 0.40 | ||||||||||||||||||
| Net realized and unrealized gain (loss) | (0.51 | ) | 6.06 | 4.79 | 4.54 | 8.81 | |||||||||||||||||
| Total from investment operations | 0.50 | 6.92 | 5.51 | 5.09 | 9.21 | ||||||||||||||||||
| Less distributions to shareholders: | |||||||||||||||||||||||
| From net investment income | (0.68 | ) | (0.77 | ) | (0.16 | ) | (0.54 | ) | (0.50 | ) | |||||||||||||
| From net realized gains | (1.95 | ) | (2.00 | ) | (0.93 | ) | (0.49 | ) | — | ||||||||||||||
| Total distributions | (2.63 | ) | (2.77 | ) | (1.09 | ) | (1.03 | ) | (0.50 | ) | |||||||||||||
| Net asset value, end of period | $ | 37.25 | $ | 39.38 | $ | 35.23 | $ | 30.81 | $ | 26.75 | |||||||||||||
| Total Return(a) | 0.69 | % | 20.04 | % | 18.26 | % | 19.20 | % | 51.46 | % | |||||||||||||
| Ratios/Supplemental Data: | |||||||||||||||||||||||
| Net assets, end of period (000's) | $ | 917,685 | $ | 877,816 | $ | 820,336 | $ | 321,463 | $ | 201,333 | |||||||||||||
| Net expenses to average daily net assets | 0.53 | %(b) | 0.53 | % | 0.54 | % | 0.55 | % | 0.55 | % | |||||||||||||
| Net investment income to average daily net assets | 2.44 | % | 2.29 | % | 2.26 | % | 1.98 | % | 1.77 | % | |||||||||||||
| Portfolio turnover rate | 43 | % | 47 | % | 43 | % | 45 | % | 43 | % | |||||||||||||
| Fees and expenses reimbursed by the Manager to average daily net assets: | 0.05 | % | 0.05 | % | 0.10 | % | 0.14 | % | 0.27 | % | |||||||||||||
(a) The total returns would have been lower had certain expenses not been reimbursed during the periods shown and assumes the effect of reinvested distributions.
(b) The net expense ratio does not include the effect of expense reductions.
† Calculated using average shares outstanding throughout period.
See accompanying notes to the financial statements.
22
GMO International Core Equity Fund
(A Series of GMO Trust)
Financial Highlights
(For a Class IV share outstanding throughout each period)
| Year Ended February 28/29, | |||||||||||||||||||||||
| 2008 | 2007 | 2006 | 2005 | 2004(a) | |||||||||||||||||||
| Net asset value, beginning of period | $ | 39.36 | $ | 35.21 | $ | 30.80 | $ | 26.75 | $ | 21.08 | |||||||||||||
| Income (loss) from investment operations: | |||||||||||||||||||||||
| Net investment income (loss)† | 1.04 | 0.85 | 0.65 | 0.56 | 0.16 | ||||||||||||||||||
| Net realized and unrealized gain (loss) | (0.52 | ) | 6.09 | 4.87 | 4.54 | 6.03 | |||||||||||||||||
| Total from investment operations | 0.52 | 6.94 | 5.52 | 5.10 | 6.19 | ||||||||||||||||||
| Less distributions to shareholders: | |||||||||||||||||||||||
| From net investment income | (0.70 | ) | (0.79 | ) | (0.18 | ) | (0.56 | ) | (0.52 | ) | |||||||||||||
| From net realized gains | (1.95 | ) | (2.00 | ) | (0.93 | ) | (0.49 | ) | — | ||||||||||||||
| Total distributions | (2.65 | ) | (2.79 | ) | (1.11 | ) | (1.05 | ) | (0.52 | ) | |||||||||||||
| Net asset value, end of period | $ | 37.23 | $ | 39.36 | $ | 35.21 | $ | 30.80 | $ | 26.75 | |||||||||||||
| Total Return(b) | 0.75 | % | 20.14 | % | 18.31 | % | 19.24 | % | 29.71 | %** | |||||||||||||
| Ratios/Supplemental Data: | |||||||||||||||||||||||
| Net assets, end of period (000's) | $ | 947,063 | $ | 711,712 | $ | 1,183,535 | $ | 255,580 | $ | 24,134 | |||||||||||||
| Net expenses to average daily net assets | 0.47 | %(c) | 0.47 | % | 0.48 | % | 0.49 | % | 0.49 | %* | |||||||||||||
| Net investment income to average daily net assets | 2.51 | % | 2.27 | % | 1.98 | % | 2.01 | % | 0.99 | %* | |||||||||||||
| Portfolio turnover rate | 43 | % | 47 | % | 43 | % | 45 | % | 43 | %†† | |||||||||||||
| Fees and expenses reimbursed by the Manager to average daily net assets: | 0.05 | % | 0.05 | % | 0.11 | % | 0.14 | % | 0.26 | %* | |||||||||||||
(a) Period from June 30, 2003 (commencement of operations) through February 29, 2004.
(b) The total returns would have been lower had certain expense not been reimbursed during the period shown and assumes the effect of reinvested distributions.
(c) The net expense ratio does not include the effect of expense reductions.
† Calculated using average shares outstanding throughout period.
†† Calculation represtents portfolio turnover of the Fund for year ended February 29, 2004.
* Annualized
** Not annualized
See accompanying notes to the financial statements.
23
GMO International Core Equity Fund
(A Series of GMO Trust)
Financial Highlights
(For a Class VI share outstanding throughout each period)
| Year Ended February 29, 2008 | Period from March 28, 2006 (commencement of operations) through February 28, 2007 | ||||||||||
| Net asset value, beginning of period | $ | 39.35 | $ | 36.09 | |||||||
| Income (loss) from investment operations: | |||||||||||
| Net investment income (loss)† | 0.98 | 0.74 | |||||||||
| Net realized and unrealized gain (loss) | (0.45 | ) | 5.33 | ||||||||
| Total from investment operations | 0.53 | 6.07 | |||||||||
| Less distributions to shareholders: | |||||||||||
| From net investment income | (0.71 | ) | (0.81 | ) | |||||||
| From net realized gains | (1.95 | ) | (2.00 | ) | |||||||
| Total distributions | (2.66 | ) | (2.81 | ) | |||||||
| Net asset value, end of period | $ | 37.22 | $ | 39.35 | |||||||
| Total Return(a) | 0.78 | % | 17.24 | %** | |||||||
| Ratios/Supplemental Data: | |||||||||||
| Net assets, end of period (000's) | $ | 3,567,360 | $ | 1,377,829 | |||||||
| Net expenses to average daily net assets | 0.44 | %(b) | 0.44 | %* | |||||||
| Net investment income to average daily net assets | 2.36 | % | 2.11 | %* | |||||||
| Portfolio turnover rate | 43 | % | 47 | %†† | |||||||
| Fees and expenses reimbursed by the Manager to average daily net assets: | 0.05 | % | 0.05 | %* | |||||||
(a) The total returns would have been lower had certain expenses not been reimbursed during the periods shown and assumes the effect of reinvested distributions.
(b) The net expense ratio does not include the effect of expense reductions.
† Calculated using average shares outstanding throughout the period.
†† Calculation represents portfolio turnover of the Fund for the year ended Febuary 28, 2007.
* Annualized
** Not annualized
See accompanying notes to the financial statements.
24
GMO International Core Equity Fund
(A Series of GMO Trust)
Notes to Financial Statements
February 29, 2008
1. Organization
GMO International Core Equity Fund (the "Fund") is a series of GMO Trust (the "Trust"). The Fund is registered under the Investment Company Act of 1940, as amended, as an open-end, diversified management investment company. The Fund is advised and managed by Grantham, Mayo, Van Otterloo & Co. LLC (the "Manager" or "GMO"). The Trust was established as a Massachusetts business trust under the laws of the Commonwealth of Massachusetts on June 24, 1985. The Declaration of Trust permits the Trustees of the Trust ("Trustees") to create an unlimited number of series of shares ("Funds") and to subdivide Funds into classes.
The Fund seeks high total return. The Fund seeks to achieve its objective by outperforming the MSCI EAFE Index. The Fund typically makes equity investments in companies from developed countries, other than the U.S.
As of February 29, 2008, the Fund had three classes of shares outstanding: Class III, Class IV and Class VI. Each class of shares bears a different level of shareholder service fees.
2. Significant accounting policies
The following is a summary of significant accounting policies which are in conformity with accounting principles generally accepted in the United States of America ("U.S. GAAP") and which are consistently followed by the Fund in the preparation of its financial statements. The preparation of financial statements in accordance with U.S. GAAP requires management to make estimates and assumptions that affect the reported amounts and disclosures in the financial statements. Actual results could differ from those estimates. The accounting records of the Fund are maintained in U.S. dollars.
Portfolio valuation
Securities listed on a securities exchange for which market quotations are readily available are valued at the last sale price or official closing price on each business day, or if there is no such reported sale or official closing price, at the most recent quoted bid price. Unlisted securities for which market quotations are readily available are generally valued at the most recent quoted bid price. Short-term investments with a remaining maturity of sixty days or less are generally valued at amortized cost, which approximates fair value. Shares of investment funds are valued at their net asset value. Securities for which quotations are not readily available or whose values the Manager has determined to be unreliable are valued at fair value as determined in good faith by the Trustees or other persons acting at their direction pursuant to procedures approved by the Trustees. By its nature, a fair value price is a good faith est imate of the value of a security at a given point in time and may not reflect the value that would be realized if the security was sold and the differences could be material. Because many foreign equity securities markets and exchanges close prior to the close of the New York Stock Exchange ("NYSE"), closing prices for foreign securities in those markets or on those exchanges do not reflect the events that occur after that close but
25
GMO International Core Equity Fund
(A Series of GMO Trust)
Notes to Financial Statements — (Continued)
February 29, 2008
before the close of the NYSE. As a result, foreign equity securities are generally valued using fair value prices supplied by a third party vendor based on models to the extent that these fair value prices are available.
Foreign currency translation
The market values of foreign securities, currency holdings and other assets and liabilities are translated to U.S. dollars based on the current exchange rates each business day. Income and expenses denominated in foreign currencies are translated at current exchange rates when accrued or incurred. The Fund does not isolate realized and unrealized gains and losses attributable to changes in exchange rates from gains and losses that arise from changes in the market value of investments. Such fluctuations are included with net realized and unrealized gain or loss on investments. Net realized gains and losses on foreign currency transactions represent gains and losses on disposition of currencies and forward currency contracts, currency gains and losses realized between the trade and settlement dates on securities transactions, and the difference between the amount of investment income and foreign withholding taxes recorded on the F und's accounting records and the U.S. dollar equivalent amounts actually received or paid.
Forward currency contracts
The Fund may enter into forward currency contracts including forward cross currency contracts. A forward currency contract is an agreement between two parties to buy and sell a currency at a set price on a future date. The market value of a forward currency contract fluctuates with changes in forward currency exchange rates. Forward currency contracts are marked to market daily using rates supplied by a quotation service and changes in value are recorded by the Fund as an unrealized gain or loss. Realized gains or losses equal to the difference between the value of the contract at the time it was opened and the value at the time it was closed are recorded upon delivery or receipt of the currency or, if a forward currency contract is offset by entering into another forward currency contract with the same broker, upon settlement of the net gain or loss. These contracts may involve market risk in excess of the unrealized gain or lo ss reflected in the Fund's Statement of Assets and Liabilities. In addition, the Fund could be exposed to risk if the counterparties are unable to meet the terms of the contracts or if there are movements in currency values that are unfavorable to the Fund. Forward currency contracts outstanding at the end of the period are listed in the Fund's Schedule of Investments.
Futures contracts
The Fund may purchase and sell futures contracts. Upon entering into a futures contract, the Fund is required to deposit with the futures clearing broker an amount of cash, U.S. government and agency obligations, or other liquid assets in accordance with the initial margin requirements of the broker or exchange. In addition, the Fund maintains cash or securities in an amount that at least equals the net amount payable in the event the Fund must deliver the full amount of the contracts. Futures contracts are marked to market daily and an appropriate payable or receivable for the change in value ("variation margin") is recorded by the Fund. The payable or receivable is liquidated on the following business day. Gains or losses are recognized but not considered realized until the contracts expire or are closed. Futures contracts involve, to varying degrees, risk of loss in excess of the variation margin disclosed in the
26
GMO International Core Equity Fund
(A Series of GMO Trust)
Notes to Financial Statements — (Continued)
February 29, 2008
Statement of Assets and Liabilities. Under certain circumstances, futures exchanges may establish daily limits on the amount that the price of a futures contract can vary from the previous day's settlement price, thereby effectively preventing liquidation of unfavorable positions. Losses may arise from changes in the value of the underlying instrument if the Fund is unable to liquidate a futures position due to an illiquid secondary market for the contracts or the imposition of price limits, or if counterparties do not perform under the contract terms. Futures contracts are generally valued at the settlement price established each day by the board of trade or exchange on which they are traded. Futures contracts outstanding at the end of the period are listed in the Fund's Schedule of Investments.
Options
The Fund may write call and put options. Writing options increases the Fund's exposure to the underlying instrument by, in the case of a call option, obligating the Fund to sell the underlying instrument at a set price to the option-holder and, in the case of a put option, obligating the Fund to purchase the underlying instrument at a set price from the option-holder. When the Fund writes a call or put option, an amount equal to the premium received is recorded as a liability and subsequently marked to market to reflect the current value of the option written. Premiums received from writing options which expire are treated as realized gains. Premiums received from writing options which are exercised or closed are added to the proceeds or offset against the amounts paid on the underlying future, security or currency transaction to determine the realized gain or loss. The Fund as a writer of an option has no control over whether t he underlying future, security or currency may be sold (call) or purchased (put) and as a result bears the market risk of an unfavorable change in the price of the future, security or currency underlying the written option. In the event that the Fund writes uncovered call options (i.e. options for investments that the Fund does not own), it bears the risk of incurring substantial losses if the price of the underlying instrument increases during the term of the option. There is the risk the Fund may not be able to enter into a closing transaction because of an illiquid market. There were no open written option contracts during the period.
The Fund may also purchase put and call options. Purchasing options alters the Fund's exposure to the underlying instrument by, in the case of a call option, entitling the Fund to purchase the underlying instrument at a set price from the writer of the option and, in the case of a put option, entitling the Fund to sell the underlying instrument at a set price to the writer of the option. The Fund pays a premium as a cost for a purchased option disclosed in the Schedule of Investments which is subsequently marked to market to reflect the current value of the option. Premiums paid for purchasing options which expire are treated as realized losses. Premiums paid for purchasing options which are exercised or closed are added to the amounts paid or offset against the proceeds on the closing transaction to determine the realized gain or loss. The risk associated with purchasing put and call options is limited to the premium paid. Ther e were no purchased option contracts outstanding at the end of the period.
Exchange traded options are valued at the last sale price, or if no sale is reported, the last bid price for purchased options and the last ask price for written options. Options traded over-the-counter are valued using prices supplied by a primary pricing source chosen by the Manager.
27
GMO International Core Equity Fund
(A Series of GMO Trust)
Notes to Financial Statements — (Continued)
February 29, 2008
Swap agreements
The Fund may enter into swap agreements. A swap is an agreement to exchange the return generated by one instrument for the return generated by another instrument. Interest rate swap agreements involve the exchange by one party with another party of their respective commitments to pay or receive interest, e.g., an exchange of floating rate payments for fixed rate payments with respect to a notional amount of principal. Total return swap agreements involve a commitment by one party in the agreement to pay interest in exchange for a market-linked return, both based on notional amounts. To the extent the total return of the security or index underlying the transaction exceeds or falls short of the offsetting interest rate obligation, the party will receive a payment from or make a payment to the counterparty, respectively. Forward spread lock swap agreements involve commitments to pay or receive a settlement amount calculated as the difference between the swap spread and a fixed spread, multiplied by the notional amount times the duration of the swap rate. The swap spread is the difference between the benchmark swap rate (market rate) and the specific treasury rate. Variance swap agreements involve commitments to pay or receive a settlement amount calculated as the difference between the annualized realized variance of returns on the underlying price and a fixed quantity, also known as the variance strike, over a period of time. In connection with these agreements, cash or securities may be set aside as collateral by the Fund's custodian or brokers in accordance with the terms of the swap agreement. The Fund earns or pays interest on cash set aside as collateral.
Swaps are marked to market daily using models that incorporate quotations from market makers and the change in value, if any, is recorded as unrealized gain or loss in the Statement of Operations. Payments received or made on swap contracts are recorded as realized gain or loss in the Statement of Operations. Gains or losses are realized upon early termination of the swap agreements. These financial instruments are not actively traded on financial markets. The values assigned to these instruments are based upon the best available information and because of the uncertainty of the valuation, these values may differ significantly from the values that would have been realized had a ready market for these instruments existed, and the differences could be material. Entering into these agreements involves, to varying degrees, elements of credit, legal, market and documentation risk in excess of the amounts recognized in the Statement o f Assets and Liabilities. Such risks involve the possibility that there will be no liquid market for these agreements, that the counterparties to the agreements may default on their obligations to perform or disagree as to the meaning of contractual terms in the agreements, or that there may be unfavorable changes in interest rates or the price of the index or security underlying these transactions. There were no swap agreements outstanding at the end of the period.
Securities lending
The Fund may lend its securities to certain qualified broker-dealers. The loans are collateralized with cash or liquid securities with a market value at least equal to the market value of the securities on loan. As with other extensions of credit, the Fund may bear the risk of loss with respect to the investment of the collateral, the risk of delay in and/or inability to exercise its rights with respect to the collateral, and the risk of delay in recovery or loss of rights in the loaned securities should the borrower of the securities fail
28
GMO International Core Equity Fund
(A Series of GMO Trust)
Notes to Financial Statements — (Continued)
February 29, 2008
financially. If a loan is collateralized by U.S. government securities, the Fund receives a fee from the borrower. If a loan is collateralized by cash, the Fund typically invests the cash collateral for its own account in interest-bearing, short-term securities and pays a fee to the borrower that normally represents a portion of the Fund's earnings on the collateral. The fund had no securities on loan at February 29, 2008.
Taxes and distributions
The Fund intends to qualify each tax year as a regulated investment company under Subchapter M of the Internal Revenue Code of 1986, as amended (the "Code"). The Fund intends to distribute substantially all of its net investment income and net realized short-term and long-term capital gains, if any, after giving effect to any available capital loss carryovers for U.S. federal income tax purposes. Therefore, no provision for U.S. federal income or excise tax is necessary. Taxes on foreign interest and dividend income are generally withheld in accordance with the applicable country's tax treaty with the United States. The foreign withholding rates applicable to a Fund's investments in certain foreign jurisdictions may be higher if a significant portion of the Fund is held by non-U.S. shareholders.
The Fund's policy is to declare and pay distributions from net investment income, if any, semiannually, and from net realized short-term and long-term capital gains, if any, at least annually. All distributions are paid in shares of the Fund, at net asset value, unless the shareholder elects to receive cash distributions. Distributions to shareholders are recorded by the Fund on the ex-dividend date.
Dividends received by shareholders of the Fund which are derived from foreign source income and foreign taxes paid by the Fund may be treated, to the extent allowable under the Code, as if received and paid by the shareholders of the Fund.
The Fund may be subject to capital gains and repatriation taxes imposed by certain countries in which it invests.
Income and capital gain distributions are determined in accordance with U.S. federal income tax regulations, which may differ from U.S. GAAP. Certain capital accounts in the financial statements are periodically adjusted for permanent differences in order to reflect their tax character. These adjustments have no impact on net assets or net asset value per share. Temporary differences which arise from recognizing certain items of income, expense, gain or loss in different periods for financial statement and tax purposes will reverse at some time in the future. Distributions in excess of net investment income or net realized gains are temporary over distributions for financial statement purposes resulting from differences in the recognition or classification of income or distributions for financial statement and tax purposes.
U.S. GAAP and tax accounting differences primarily relate to derivative contract transactions, foreign currency transactions, losses on wash sale transactions and passive foreign investment company transactions.
29
GMO International Core Equity Fund
(A Series of GMO Trust)
Notes to Financial Statements — (Continued)
February 29, 2008
The following reclassification represents the amount necessary to report the stated components of net assets on a tax basis, excluding certain temporary differences, as of February 29, 2008. The financial highlights exclude these adjustments.
| Accumulated Undistributed Net Investment Income | Accumulated Net Realized Gain | Paid-in Capital | |||||||||
| $ | 36,136,463 | $ | (36,135,420 | ) | $ | (1,043 | ) | ||||
The tax character of distributions declared to shareholders is as follows:
| 2/29/2008 | 2/28/2007 | ||||||||||
| Ordinary income (including any short-term capital gains) | $ | 172,283,394 | $ | 124,259,765 | |||||||
| Long-term capital gains | 195,763,275 | 65,300,374 | |||||||||
| Total distributions | $ | 368,046,669 | $ | 189,560,139 | |||||||
Distributions in excess of tax basis earnings and profits, if significant, are reported in the financial statements as a tax return of capital.
As of February 29, 2008, the components of distributable earnings on a tax basis consisted of the following:
| Undistributed ordinary income | $ | 73,174,805 | |||||
| Undistributed long–term capital gain | $ | 43,604,267 | |||||
As of February 29, 2008, the approximate cost for U.S. federal income tax purposes and gross and net unrealized appreciation and depreciation in value of investments were as follows:
| Aggregate Cost | Gross Unrealized Appreciation | Gross Unrealized (Depreciation) | Net Unrealized Appreciation (Depreciation) | ||||||||||||
| $ | 5,413,394,342 | $ | 488,064,974 | $ | (529,383,146 | ) | $ | (41,318,172 | ) | ||||||
Security transactions and related investment income
Security transactions are accounted for on trade date. Dividend income, net of applicable foreign withholding taxes, if any, is recorded on the ex-dividend date, or when the Fund is informed of the ex-dividend date, if later. Interest income is recorded on the accrual basis and is adjusted for the amortization of premiums and accretion of discounts. Interest income on inflation indexed securities, if any, is accrued
30
GMO International Core Equity Fund
(A Series of GMO Trust)
Notes to Financial Statements — (Continued)
February 29, 2008
daily based upon an inflation adjusted principal. Additionally, any increase or decrease in the principal or face amount of the securities adjusted for inflation is recorded as interest income or loss. Income is not recognized on securities for which collection is not expected. Non-cash dividends, if any, are recorded at the fair market value of the securities received. In determining the net gain or loss on securities sold, the cost of securities is determined on the identified cost basis.
Expenses
The majority of expenses of the Trust are directly identifiable to an individual fund. Expenses which are not readily identifiable to a specific fund are allocated taking into consideration, among other things, the nature and type of expense and the relative size of the funds. Investment income, common expenses and realized and unrealized gains and losses are allocated pro rata among the classes of shares of the Fund based on the relative net assets of each class. Shareholder service fees, which are directly attributable to a class of shares, are charged to that class's operations.
Brown Brothers Harriman & Co. ("BBH") serves as custodian and fund accounting agent of the Fund. State Street Bank and Trust Company ("State Street") serves as transfer agent of the Fund. BBH and State Street's fees may be reduced by credits that are an earnings allowance calculated on the average daily cash balances the Fund maintains with each agent. Credit balances or expense reimbursements used to reduce fees, if any, are reported as a reduction of expenses in the Statement of Operations.
Investment risks
There are certain additional risks involved in investing in foreign securities that are not inherent in investments in U.S. securities. These risks may involve adverse political and economic developments including the possible imposition of capital controls or other foreign governmental laws or restrictions. In addition, the securities of some foreign companies and securities markets are less liquid and at times may be more volatile than securities of comparable U.S. companies and U.S. securities markets.
Recently issued accounting pronouncements
In June 2006, the Financial Accounting Standards Board ("FASB") issued FASB Interpretation No. 48, Accounting for Uncertainty in Income Taxes – an Interpretation of FASB Statement No. 109 ("FIN 48"). FIN 48 clarifies the accounting for uncertainty in income taxes recognized in accordance with FASB Statement No. 109, Accounting for Income Taxes. FIN 48 prescribes a recognition threshold and measurement attribute for a tax position taken or expected to be taken in the tax return that could impact the Fund's financial statements. It also provides guidance in relation to the Fund's financial statements on classification of tax benefits or liabilities, interest and penalties, accounting in interim periods, disclosure, and transition. FIN 48 is effective for fiscal years beginning after December 15, 2006 for registered investment companies. Management has evaluated the effects of applying the various provisions of FIN 48 and has determined that the adoption of FIN 48 does not have a material effect on the Fund's financial statements. The Fund's federal tax returns for the prior three fiscal years, if applicable, remain subject to
31
GMO International Core Equity Fund
(A Series of GMO Trust)
Notes to Financial Statements — (Continued)
February 29, 2008
examination by the Internal Revenue Service. Management will continue to monitor the rules and guidance pertaining to FIN 48 and will take action if appropriate.
In September 2006, the FASB issued Statement of Financial Accounting Standards No. 157 ("FAS 157"), "Fair Value Measurements." FAS 157 defines fair value, establishes a framework for measuring fair value in accordance with generally accepted accounting principles and expands disclosure about fair value measurements. FAS 157 is effective for fiscal years beginning after November 15, 2007. Management is currently evaluating the impact the adoption of FAS 157 will have on the Fund's financial statement disclosures.
3. Fees and other transactions with affiliates
GMO earns a management fee paid monthly at the annual rate of 0.38% of average daily net assets. The Fund has adopted a Shareholder Service Plan under which the Fund pays GMO a shareholder service fee for client and shareholder service, reporting, and other support. Pursuant to the Shareholder Service Plan, the shareholder service fee is calculated based on average daily net assets of each class at the annual rate of 0.15% for Class III shares, 0.09% for Class IV shares and 0.055% for Class VI shares.
The Manager has contractually agreed to reimburse the Fund for Fund expenses through at least June 30, 2008 to the extent the Fund's total annual operating expenses (excluding shareholder service fees, fees and expenses of the independent Trustees of the Trust, fees and expenses for legal services not approved by the Manager for the Trust, compensation and expenses of the Trust's Chief Compliance Officer ("CCO") (excluding any employee benefits), brokerage commissions, securities lending fees and expenses, interest expense, transfer taxes, and other investment-related costs (including expenses associated with investments in any company that is an investment company or would be an investment company under the 1940 Act, but for the exceptions to the definition of investment company provided in Section 3(c)(1) and 3(c)(7) of the 1940 Act), hedging transaction fees, extraordinary, non-recurring and certain other unusual expenses (in cluding taxes)) exceed 0.38% of the Fund's average daily net assets.
The Fund's portion of the fee paid by the Trust to the independent Trustees and CCO during the year ended February 29, 2008 was $51,586 and $28,412, respectively. The compensation and expenses of the CCO are included in miscellaneous expenses in the Statement of Operations. No remuneration was paid by the Fund to any other officer of the Trust.
4. Purchases and sales of securities
Cost of purchases and proceeds from sales of securities, excluding short-term investments, for the year ended February 29, 2008 aggregated $4,990,437,892 and $2,199,160,766, respectively.
32
GMO International Core Equity Fund
(A Series of GMO Trust)
Notes to Financial Statements — (Continued)
February 29, 2008
5. Guarantees
In the normal course of business the Fund enters into contracts with third-party service providers that contain a variety of representations and warranties and which provide general indemnifications. The Fund's maximum exposure under these arrangements is unknown, as this would involve future claims that may be made against the Fund that have not yet occurred. Based on experience, management is of the view that the risk of loss in connection with these potential indemnification obligations is remote; however, there can be no assurance that material liabilities related to such obligations will not arise in the future that could adversely impact the Fund.
6. Principal shareholders and related parties
As of February 29, 2008, 25.34% of the outstanding shares of the Fund were held by one shareholder. No other shareholder owned in excess of 10% of the outstanding shares of the Fund. Investment activities of this shareholder may have a material effect on the Fund.
As of February 29, 2008, less than 0.01% of the Fund's shares were held by four related parties comprised of certain GMO employee accounts, and 39.32% of the Fund's shares were held by accounts for which the Manager has investment discretion.
7. Share transactions
The Declaration of Trust permits the Trustees to issue an unlimited number of shares of beneficial interest (without par value). Transactions in Fund shares were as follows:
| Year Ended February 29, 2008 | Year Ended February 28, 2007 | ||||||||||||||||||
| Class III: | Shares | Amount | Shares | Amount | |||||||||||||||
| Shares sold | 11,949,449 | $ | 492,041,742 | 7,843,505 | $ | 293,242,889 | |||||||||||||
| Shares issued to shareholders in reinvestment of distributions | 1,414,279 | 58,116,527 | 1,421,250 | 53,860,001 | |||||||||||||||
| Shares repurchased | (11,019,208 | ) | (469,124,403 | ) | (10,261,207 | ) | (388,564,724 | ) | |||||||||||
| Net increase (decrease) | 2,344,520 | $ | 81,033,866 | (996,452 | ) | $ | (41,461,834 | ) | |||||||||||
33
GMO International Core Equity Fund
(A Series of GMO Trust)
Notes to Financial Statements — (Continued)
February 29, 2008
| Year Ended February 29, 2008 | Year Ended February 28, 2007 | ||||||||||||||||||
| Class IV: | Shares | Amount | Shares | Amount | |||||||||||||||
| Shares sold | 15,988,725 | $ | 658,843,076 | 7,912,379 | $ | 293,799,706 | |||||||||||||
| Shares issued to shareholders in reinvestment of distributions | 1,206,587 | 49,719,301 | 1,684,571 | 63,941,116 | |||||||||||||||
| Shares repurchased | (9,841,902 | ) | (399,772,816 | ) | (25,127,429 | ) | (937,672,209 | ) | |||||||||||
| Net increase (decrease) | 7,353,410 | $ | 308,789,561 | (15,530,479 | ) | $ | (579,931,387 | ) | |||||||||||
| Period from March 28, 2006 | |||||||||||||||||||
| Year Ended | (commencement of operations) | ||||||||||||||||||
| February 29, 2008 | through February 28, 2007 | ||||||||||||||||||
| Class VI: | Shares | Amount | Shares | Amount | |||||||||||||||
| Shares sold | 74,361,787 | $ | 3,110,181,310 | 34,871,102 | $ | 1,305,783,453 | |||||||||||||
| Shares issued to shareholders in reinvestment of distributions | 6,180,798 | 253,296,700 | 1,665,967 | 63,146,641 | |||||||||||||||
| Shares repurchased | (19,719,605 | ) | (775,593,659 | ) | (1,519,718 | ) | (57,000,000 | ) | |||||||||||
| Net increase (decrease) | 60,822,980 | $ | 2,587,884,351 | 35,017,351 | $ | 1,311,930,094 | |||||||||||||
34
Report of Independent Registered Public Accounting Firm
To the Trustees of GMO Trust and the Shareholders of
GMO International Core Equity Fund
In our opinion, the accompanying statement of assets and liabilities, including the schedule of investments, and the related statements of operations and of changes in net assets and the financial highlights present fairly, in all material respects, the financial position of GMO International Core Equity Fund (the "Fund") at February 29, 2008, the results of its operations for the year then ended, the changes in its net assets for each of the two years in the period then ended and the financial highlights for each of the five years in the period then ended, in conformity with accounting principles generally accepted in the United States of America. These financial statements and financial highlights (hereafter referred to as "financial statements") are the responsibility of the Fund's management; our responsibility is to express an opinion on these financial statements based on our audits. We conducted our audits of these financ ial statements in accordance with the standards of the Public Company Accounting Oversight Board (United States). Those standards require that we plan and perform the audit to obtain reasonable assurance about whether the financial statements are free of material misstatement. An audit includes examining, on a test basis, evidence supporting the amounts and disclosures in the financial statements, assessing the accounting principles used and significant estimates made by management, and evaluating the overall financial statement presentation. We believe that our audits, which included confirmation of securities at February 29, 2008 by correspondence with the custodian and brokers, provide a reasonable basis for our opinion.
PricewaterhouseCoopers LLP
Boston, Massachusetts
April 29, 2008
35
GMO International Core Equity Fund
(A Series of GMO Trust)
Fund Expenses
February 29, 2008 (Unaudited)
Expense Examples: The following information is in relation to expenses for the six month period ended February 29, 2008.
As a shareholder of the Fund, you may incur two types of costs: (1) transaction costs, and (2) ongoing costs, including management fees, shareholder service fees and other Fund expenses. This example is intended to help you understand your ongoing costs (in dollars) of investing in the Fund and to compare these costs with the ongoing costs of investing in other mutual funds.
These examples are based on an investment of $1,000 invested at the beginning of the period and held for the entire period, September 1, 2007 through February 29, 2008.
Actual Expenses
The first line of the table for each class below provides information about actual account values and actual expenses. You may use the information in this line, together with the amount you invested, to estimate the expenses that you paid over the period. Simply divide your account value by $1,000 (for example, a $10,000,000 account value divided by $1,000 = 10,000), then multiply the result by the number in the first line under the heading entitled "Net Expense Incurred" to estimate the expenses you paid on your account during this period.
Hypothetical Example for Comparison Purposes
The second line of the table for each class below provides information about hypothetical account values and hypothetical expenses based on the Fund's actual expense ratio and an assumed rate of return of 5% per year before expenses, which is not the Fund's actual return. The hypothetical account values and expenses may not be used to estimate the actual ending account balance or expenses you paid for the period. You may use this information to compare the ongoing costs of investing in the Fund with other funds. To do so, compare this 5% hypothetical example with the 5% hypothetical examples that appear in the shareholder reports of other funds.
36
GMO International Core Equity Fund
(A Series of GMO Trust)
Fund Expenses — (Continued)
February 29, 2008 (Unaudited)
Please note that the expenses shown in the table are meant to highlight your ongoing costs only and do not reflect any transactional costs. Therefore, the second line of the table is useful in comparing ongoing costs only, and will not help you determine the relative total costs of owning different funds. In addition, if these transactional costs were included, your costs would have been higher.
| Annualized Net Expense Ratio | Beginning Account Value | Ending Account Value | Net Expense Incurred* | ||||||||||||||||
| Class III | |||||||||||||||||||
| 1) Actual | 0.53 | % | $ | 1,000.00 | $ | 944.80 | $ | 2.56 | |||||||||||
| 2) Hypothetical | 0.53 | % | $ | 1,000.00 | $ | 1,022.23 | $ | 2.66 | |||||||||||
| Class IV | |||||||||||||||||||
| 1) Actual | 0.47 | % | $ | 1,000.00 | $ | 945.00 | $ | 2.27 | |||||||||||
| 2) Hypothetical | 0.47 | % | $ | 1,000.00 | $ | 1,022.53 | $ | 2.36 | |||||||||||
| Class VI | |||||||||||||||||||
| 1) Actual | 0.44 | % | $ | 1,000.00 | $ | 945.10 | $ | 2.13 | |||||||||||
| 2) Hypothetical | 0.44 | % | $ | 1,000.00 | $ | 1,022.68 | $ | 2.21 | |||||||||||
* Expenses are calculated using each Class's annualized net expense ratio for the six month period ended February 29, 2008, multiplied by the average account value over the period, multiplied by 182 days, divided by 366 days in the year.
37
GMO International Core Equity Fund
(A Series of GMO Trust)
Tax Information for the Tax Year Ended February 29, 2008 (Unaudited)
The Fund will notify shareholders of amounts for use in preparing 2008 income tax forms in January 2009.
The Fund's distributions to shareholders include $195,763,276 from long-term capital gains.
During the year ended February 29, 2008, the Fund paid foreign taxes of $12,920,265 and recognized foreign source income of $153,888,314.
For taxable, non-corporate shareholders, 60.21% of the income and short-term capital gains, if any, distributed in the Fund's fiscal year ended February 29, 2008 represents qualified dividend income subject to the 15% rate category.
The Fund hereby designates as qualified short-term capital gains with respect to its taxable year ended February 29, 2008, $72,297,378 or if determined to be different, the qualified short-term gains of such year.
38
Trustees and Officers (Unaudited)
The following tables list the Trust's Trustees and Officers as of the date of this report; their address and date of birth ("DOB"); their position with the Trust; the length of time holding that position with the Trust; their principal occupation(s) during the past five years; the number of portfolios in the fund complex they oversee; and other directorships they hold in companies subject to registration or reporting requirements of the Securities Exchange Act of 1934 (generally called "public companies") or in registered investment companies. The Trust's Statement of Additional Information ("SAI") includes additional information about the Trust's trustees, including changes subsequent to the date of the report. The SAI is available, without charge, upon request by writing GMO, c/o GMO Trust, 40 Rowes Wharf, Boston, MA 02110.
Independent Trustees:
| Name, Address, and DOB | Position(s) Held with Trust | Term of Office1 and Length of Time Served | Principal Occupation(s) During Past Five Years | Number of Portfolios in Fund Complex Overseen by Trustee | Other Directorships Held by Trustee | ||||||||||||||||||
| Donald W. Glazer, Esq. c/o GMO Trust 40 Rowes Wharf Boston, MA 02110 DOB: 07/26/1944 | Chairman of the Board of Trustees | Chairman of the Board of Trustees since March 2005; Lead Independent Trustee (September 2004 – March 2005); Trustee since December 2000. | Consultant – Law and Business2; Vice Chair (since 2002) and Secretary, Provant, Inc. (provider of personnel performance improvement services and training products); Author of Legal Treatises. | 47 | None. | ||||||||||||||||||
1 Each Trustee is elected to serve during the continued lifetime of the Trust until he/she dies, resigns or is removed, or if sooner, until the next meeting of Shareholders called for the purpose of electing Trustees and until the election and qualification of his/her successor.
2 As part of Mr. Glazer's work as a consultant, he provides part-time consulting services to Goodwin Procter LLP ("Goodwin"). Goodwin has provided legal services to Renewable Resources, LLC, an affiliate of GMO; GMO, in connection with its relationship with Renewable Resources; and funds managed by Renewable Resources. Mr. Glazer has represented that he has no financial interest in, and is not involved in the provision of, such legal services. In the calendar years ended December 31, 2006 and December 31, 2007, these entities paid $825,738 and $291,721 respectively, in legal fees and disbursements to Goodwin.
39
Independent Trustees — (Continued)
| Name, Address, and DOB | Position(s) Held with Trust | Term of Office1 and Length of Time Served | Principal Occupation(s) During Past Five Years | Number of Portfolios in Fund Complex Overseen by Trustee | Other Directorships Held by Trustee | ||||||||||||||||||
| Jay O. Light c/o GMO Trust 40 Rowes Wharf Boston, MA 02110 DOB: 10/03/1941 | Trustee | Since May 1996. | Dean (since April 2006), Acting Dean (August 2005 – April 2006), Senior Associate Dean (1998 – 2005), and Professor of Business Administration, Harvard Business School. | 47 | Director of Harvard Management Company, Inc.3 and Verde, Inc.; Director of Partners HealthCare System, Inc. and Chair of its Investment Committee.4 | ||||||||||||||||||
| W. Nicholas Thorndike c/o GMO Trust 40 Rowes Wharf Boston, MA 02110 DOB: 03/28/1933 | Trustee | Since March 2005. | Director or trustee of various corporations and charitable organizations, including Courier Corporation (a book publisher and manufacturer) (July 1989 – present); Putnam Funds (December 1992 – June 2004); and Providence Journal (a newspaper publisher) (December 1986 – December 2003). | 47 | Director of Courier Corporation (a book publisher and manufacturer); Member of the Investment Committee of Partners HealthCare System, Inc.4 | ||||||||||||||||||
1 Each Trustee is elected to serve during the continued lifetime of the Trust until he/she dies, resigns or is removed, or if sooner, until the next meeting of Shareholders called for the purpose of electing Trustees and until the election and qualification of his/her successor.
3 Harvard Management Company, Inc. is a client of the Manager.
4 Partners HealthCare System, Inc. is a client of the Manager.
40
Principal Officers:
| Name, Address, and DOB | Position(s) Held with Trust | Term of Office5 and Length of Time Served | Principal Occupation(s) During Past Five Years | ||||||||||||
| Scott Eston c/o GMO Trust 40 Rowes Wharf Boston, MA 02110 DOB: 01/20/1956 | President and Chief Executive Officer | President and Chief Executive Officer since October 2002; Chief Financial Officer, November 2006 – February 2007. | Chief Financial Officer, Chief Operating Officer and Member, Grantham, Mayo, Van Otterloo & Co. LLC. | ||||||||||||
| Sheppard N. Burnett c/o GMO Trust 40 Rowes Wharf Boston, MA 02110 DOB: 10/24/1968 | Treasurer and Chief Financial Officer | Chief Financial Officer since March 2007; Treasurer since November 2006; Assistant Treasurer, September 2004 – November 2006. | Fund Administration Staff, Grantham, Mayo, Van Otterloo & Co. LLC (June 2004 – present); Vice President, Director of Tax, Columbia Management Group (2002 – 2004). | ||||||||||||
| Brent C. Arvidson c/o GMO Trust 40 Rowes Wharf Boston, MA 02110 DOB: 06/26/1969 | Assistant Treasurer | Since August 1998. | Senior Fund Administrator, Grantham, Mayo, Van Otterloo & Co. LLC. | ||||||||||||
| John L. Nasrah c/o GMO Trust 40 Rowes Wharf Boston, MA 02110 DOB: 05/27/1977 | Assistant Treasurer | Since March 2007. | Fund Administrator, Grantham, Mayo, Van Otterloo & Co. LLC (September 2004 – present); Tax Analyst, Bain & Company, Inc (June 2003 – September 2004); Senior Tax Associate, PricewaterhouseCoopers LLP (2001 – 2003). | ||||||||||||
| Mahmoodur Rahman c/o GMO Trust 40 Rowes Wharf Boston, MA 02110 DOB: 11/30/1967 | Assistant Treasurer | Since September 2007. | Fund Administrator, Grantham, Mayo, Van Otterloo & Co. (April 2007 – present); Vice President and Senior Tax Manager, Massachusetts Financial Services Company (January 2000 – April 2007). | ||||||||||||
5 Officers are elected to hold such office until their successor is elected and qualified to carry out the duties and responsibilities of their office, or until he or she resigns or is removed from office.
41
Principal Officers — (Continued)
| Name, Address, and DOB | Position(s) Held with Trust | Term of Office5 and Length of Time Served | Principal Occupation(s) During Past Five Years | ||||||||||||
| Michael E. Gillespie c/o GMO Trust 40 Rowes Wharf Boston, MA 02110 DOB: 02/18/1958 | Chief Compliance Officer | Since March 2005. | Vice President of Compliance (June 2004 – February 2005) and Director of Domestic Compliance (March 2002 – June 2004), Fidelity Investments; Vice President and Senior Counsel, State Street Bank and Trust Company (May 1998 – March 2002). | ||||||||||||
| Jason B. Harrison c/o GMO Trust 40 Rowes Wharf Boston, MA 02110 DOB: 01/29/1977 | Vice President and Clerk | Vice President since November 2006; Clerk since March 2006. | Legal Counsel, Grantham, Mayo, Van Otterloo & Co. LLC (since February 2006) and Attorney, Ropes & Gray LLP (September 2002 – February 2006). | ||||||||||||
| David L. Bohan c/o GMO Trust 40 Rowes Wharf Boston, MA 02110 DOB: 06/21/1964 | Vice President and Assistant Clerk | Vice President since March 2005; Assistant Clerk since March 2006. | Legal Counsel, Grantham, Mayo, Van Otterloo & Co. LLC (September 2003 – present); Attorney, Goodwin Procter LLP (September 1996 – September 2003). | ||||||||||||
| Gregory L. Pottle c/o GMO Trust 40 Rowes Wharf Boston, MA 02110 DOB: 07/09/1971 | Vice President and Assistant Clerk | Since November 2006. | Legal Counsel, Grantham, Mayo, Van Otterloo & Co. LLC. | ||||||||||||
| Anne K. Trinque c/o GMO Trust 40 Rowes Wharf Boston, MA 02110 DOB: 04/15/1978 | Vice President and Assistant Clerk | Since September 2007. | Legal Counsel, Grantham, Mayo, Van Otterloo & Co. LLC (since January 2007); Attorney, Goodwin Procter LLP (September 2003 – January 2007). | ||||||||||||
| Cheryl Wakeham c/o GMO Trust 40 Rowes Wharf Boston, MA 02110 DOB: 10/29/1958 | Anti-Money Laundering Officer | Since December 2004. | Manager, Client Service Administration, Grantham, Mayo, Van Otterloo & Co. LLC. | ||||||||||||
5 Officers are elected to hold such office until their successor is elected and qualified to carry out the duties and responsibilities of their office, or until he or she resigns or is removed from office.
42
GMO International Growth Equity Fund
(A Series of GMO Trust)
Annual Report
February 29, 2008
For a free copy of the Fund's proxy voting guidelines, shareholders may call 1-617-346-7646 (collect), visit our website at www.gmo.com, or visit the Securities and Exchange Commission's website at www.sec.gov. Information regarding how the Fund voted proxies relating to portfolio securities during the most recent 12-month period ended June 30 is available on our website at www.gmo.com, or on the Securities and Exchange Commission's website at www.sec.gov.
The Fund files its complete schedule of portfolio holdings with the Securities and Exchange Commission for the first and third quarter of each fiscal year on Form N-Q, which is available on the Commission's website at www.sec.gov. The Fund's Form N-Q may be reviewed and copied at the Commission's Public Reference Room in Washington, D.C. Information on the operation of the Public Reference Room may be obtained by calling 1-800-SEC-0330. The Fund has a policy with respect to disclosure of portfolio holdings under which it may also make available on GMO's website (www.gmo.com) a complete schedule of portfolio holdings.
This report is prepared for the general information of shareholders. It is authorized for distribution to prospective investors only when preceded or accompanied by a prospectus for the GMO Trust.
GMO International Growth Equity Fund
(A Series of GMO Trust)
Portfolio Managers
Day-to-day management of the Fund's portfolio is the responsibility of the International Quantitative team at Grantham, Mayo, Van Otterloo & Co. LLC.
Management Discussion and Analysis of Fund Performance
The Class III shares of the GMO International Growth Equity Fund returned +5.0% for the fiscal year ended February 29, 2008, as compared to +0.8% for the MSCI EAFE Index and +3.5% for the S&P/Citigroup PMI EPAC Growth Index. Consistent with the Fund's investment objectives and policies, the Fund was invested substantially in international equity securities throughout the period.
Stock selection made a strong positive contribution to relative performance. Among the most significant contributors were holdings in Canadian fertilizer company Potash Corp. of Saskatchewan, Canadian tech company Research in Motion, and Australian mining company Rio Tinto, all of which outperformed. Overweight positions in British bank Royal Bank of Scotland, Japanese financial Resona Holdings, and an underweight position in Australian mining company BHP Billiton hurt returns.
Country allocation had a positive impact on relative performance. Overweights to Germany, Canada, Singapore, and Hong Kong helped, while overweights to Sweden and Ireland hurt. In addition, not holding Korea, which GMO classifies as an emerging market but S&P/Citigroup considers developed, reduced returns against the growth index.
Currency allocation had a positive impact as our underweight to the British pound and overweights to the Canadian dollar and Swiss franc added slightly more value than our underweight to the Australian dollar detracted. The U.S. dollar weakened relative to most foreign currencies which boosted returns for U.S. investors. The MSCI EAFE Index returned 10% more in U.S. dollar terms than in local currency.
Sector exposures had a positive impact. Our underweight to Financials and overweight to Energy helped while our underweight to Consumer Staples hurt.
Among GMO's international quantitative stock selection disciplines, stocks favored for their strong momentum (especially price momentum) characteristics significantly outperformed. Those highly ranked by intrinsic value also did well.
The views expressed herein are exclusively those of Grantham, Mayo, Van Otterloo & Co. LLC Management as of the date of this report and are subject to change. GMO disclaims any responsibility to update such views. They are not meant as investment advice. References to specific securities are not recommendations of such securities and may not be representative of any GMO portfolio's current or future investments.
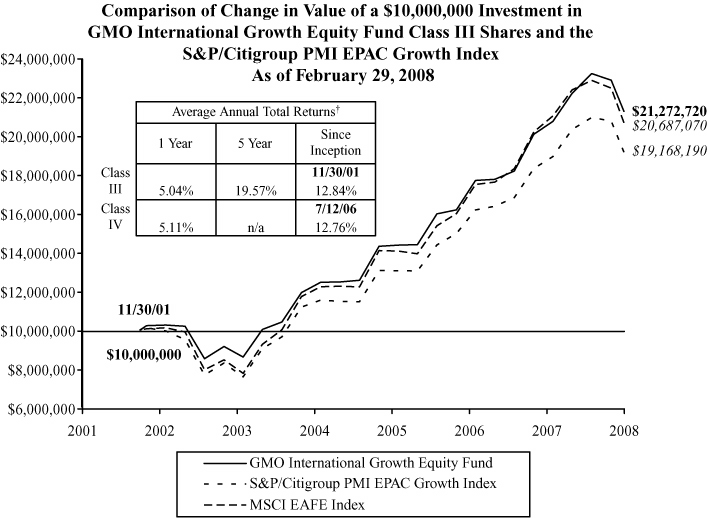
Performance data quoted represents past performance and is not indicative of future results. The investment return and principal value of an investment will fluctuate so that an investor's shares, when redeemed, may be worth more or less than their original cost. Current performance data may be lower or higher than the performance data provided herein. To obtain performance information to the most recent month-end, visit www.gmo.com. Performance shown is net of all fees after reimbursement from the Manager. Returns would have been lower had certain expenses not been reimbursed during the periods shown and do not include the effect of taxes on distributions and redemptions. All information is unaudited. Performance for Classes IV will vary due to different fees.
† The Fund is the successor to the GMO International Growth Fund, therefore, performance for the periods prior to September 16, 2005 is that of GMO International Growth Fund.
GMO International Growth Equity Fund
(A Series of GMO Trust)
Investments Concentration Summary
February 29, 2008 (Unaudited)
| Asset Class Summary | % of Total Net Assets | ||||||
| Common Stocks | 94.3 | % | |||||
| Short-Term Investments | 3.8 | ||||||
| Preferred Stocks | 0.6 | ||||||
| Forward Currency Contracts | 0.3 | ||||||
| Rights and Warrants | 0.0 | ||||||
| Futures | (0.5 | ) | |||||
| Other | 1.5 | ||||||
| 100.0 | % | ||||||
| Country Summary | % of Equity Investments | ||||||
| United Kingdom | 20.6 | % | |||||
| Japan | 17.2 | ||||||
| Switzerland | 9.4 | ||||||
| Germany | 8.3 | ||||||
| France | 7.5 | ||||||
| Australia | 6.8 | ||||||
| Finland | 6.8 | ||||||
| Canada | 5.5 | ||||||
| Spain | 4.4 | ||||||
| Denmark | 2.6 | ||||||
| Sweden | 2.4 | ||||||
| Hong Kong | 1.9 | ||||||
| Singapore | 1.5 | ||||||
| Ireland | 1.2 | ||||||
| Norway | 0.9 | ||||||
| Italy | 0.9 | ||||||
| Netherlands | 0.8 | ||||||
| Belgium | 0.6 | ||||||
| Austria | 0.3 | ||||||
| Greece | 0.3 | ||||||
| Portugal | 0.1 | ||||||
| 100.0 | % | ||||||
1
GMO International Growth Equity Fund
(A Series of GMO Trust)
Investments Concentration Summary — (Continued)
February 29, 2008 (Unaudited)
| Industry Sector Summary | % of Equity Investments | ||||||
| Industrials | 14.4 | % | |||||
| Health Care | 13.3 | ||||||
| Materials | 13.1 | ||||||
| Information Technology | 12.6 | ||||||
| Consumer Staples | 10.2 | ||||||
| Financials | 8.7 | ||||||
| Consumer Discretionary | 8.6 | ||||||
| Energy | 8.5 | ||||||
| Telecommunication Services | 7.1 | ||||||
| Utilities | 3.5 | ||||||
| 100.0 | % | ||||||
2
GMO International Growth Equity Fund
(A Series of GMO Trust)
Schedule of Investments
(showing percentage of total net assets)
February 29, 2008
| Shares | Description | Value ($) | |||||||||
| COMMON STOCKS — 94.3% | |||||||||||
| Australia — 6.5% | |||||||||||
| 639,442 | AMP Ltd | 4,720,821 | |||||||||
| 276,568 | Australia and New Zealand Banking Group Ltd | 5,580,982 | |||||||||
| 238,031 | Australian Stock Exchange Ltd | 9,151,739 | |||||||||
| 267,107 | Babcock & Brown Ltd | 4,184,167 | |||||||||
| 730,600 | BHP Billiton Ltd | 26,435,153 | |||||||||
| 698,330 | BlueScope Steel Ltd | 6,985,514 | |||||||||
| 570,230 | Brambles Ltd | 5,475,852 | |||||||||
| 24,430 | Cochlear Ltd | 1,217,973 | |||||||||
| 873,708 | CSL Ltd | 29,303,671 | |||||||||
| 1,855,629 | CSR Ltd | 5,781,340 | |||||||||
| 1,011,812 | Foster's Group Ltd | 4,985,071 | |||||||||
| 1,100,514 | Harvey Norman Holdings Ltd | 4,603,178 | |||||||||
| 24,806 | Incitec Pivot Ltd | 3,369,208 | |||||||||
| 869,589 | Insurance Australia Group Ltd | 3,018,953 | |||||||||
| 74,746 | Leighton Holdings Ltd | 3,133,431 | |||||||||
| 192,790 | Macquarie Group Ltd | 9,628,009 | |||||||||
| 527,404 | Macquarie Infrastructure Group | 1,414,855 | |||||||||
| 288,508 | Newcrest Mining Ltd | 10,030,432 | |||||||||
| 234,067 | QBE Insurance Group Ltd | 4,841,386 | |||||||||
| 37,568 | Rio Tinto Ltd | 4,681,135 | |||||||||
| 172,409 | Santos Ltd | 2,043,619 | |||||||||
| 84,549 | St George Bank | 1,846,275 | |||||||||
| 182,769 | TABCORP Holdings Ltd | 2,576,538 | |||||||||
| 1,403,836 | Telstra Corp Ltd | 6,310,777 | |||||||||
| 156,242 | Westfarmers Ltd | 5,413,382 | |||||||||
| 483,838 | Westpac Banking Corp | 10,348,650 | |||||||||
| 490,385 | Woodside Petroleum Ltd | 25,642,984 | |||||||||
| 595,751 | Woolworths Ltd | 15,910,821 | |||||||||
| 239,535 | Worleyparsons Ltd | 8,199,303 | |||||||||
| 194,409 | Zinifex Ltd | 1,956,007 | |||||||||
| Total Australia | 228,791,226 | ||||||||||
See accompanying notes to the financial statements.
3
GMO International Growth Equity Fund
(A Series of GMO Trust)
Schedule of Investments — (Continued)
(showing percentage of total net assets)
February 29, 2008
| Shares | Description | Value ($) | |||||||||
| Austria — 0.3% | |||||||||||
| 64,794 | OMV AG | 4,681,689 | |||||||||
| 68,461 | Voestalpine AG | 4,303,255 | |||||||||
| Total Austria | 8,984,944 | ||||||||||
| Belgium — 0.5% | |||||||||||
| 61,829 | Belgacom SA | 2,961,115 | |||||||||
| 9,780 | Colruyt SA | 2,389,721 | |||||||||
| 59,315 | Dexia | 1,394,500 | |||||||||
| 218,662 | Fortis | 4,830,773 | |||||||||
| 24,668 | Inbev NV | 2,229,524 | |||||||||
| 21,044 | Mobistar SA | 1,793,273 | |||||||||
| 76,380 | Umicore | 3,880,454 | |||||||||
| Total Belgium | 19,479,360 | ||||||||||
| Canada — 5.3% | |||||||||||
| 53,900 | Canadian Imperial Bank of Commerce | 3,657,588 | |||||||||
| 127,300 | Canadian National Railway Co | 6,731,994 | |||||||||
| 66,000 | Canadian Natural Resources | 4,946,060 | |||||||||
| 47,900 | Canadian Pacific Railway Ltd | 3,481,601 | |||||||||
| 52,300 | Enbridge Inc | 2,154,702 | |||||||||
| 123,500 | EnCana Corp | 9,414,483 | |||||||||
| 90,800 | Goldcorp Inc | 3,919,829 | |||||||||
| 74,600 | Husky Energy Inc (a) | 3,160,599 | |||||||||
| 52,800 | IGM Financial Inc | 2,298,684 | |||||||||
| 102,800 | Penn West Energy Trust | 2,901,482 | |||||||||
| 377,400 | Potash Corp of Saskatchewan Inc | 60,000,561 | |||||||||
| 539,500 | Research In Motion Ltd * | 56,200,086 | |||||||||
| 205,600 | Royal Bank of Canada | 10,317,078 | |||||||||
| 95,600 | Shoppers Drug Mart Corp | 4,886,600 | |||||||||
| 112,900 | Suncor Energy Inc | 11,642,723 | |||||||||
| Total Canada | 185,714,070 | ||||||||||
See accompanying notes to the financial statements.
4
GMO International Growth Equity Fund
(A Series of GMO Trust)
Schedule of Investments — (Continued)
(showing percentage of total net assets)
February 29, 2008
| Shares | Description | Value ($) | |||||||||
| Denmark — 2.4% | |||||||||||
| 1,228 | AP Moller-Maersk A/S | 12,618,734 | |||||||||
| 758 | AP Moller-Maersk A/S Class A | 7,823,922 | |||||||||
| 22,175 | D/S Norden | 2,416,925 | |||||||||
| 304,200 | H Lundbeck A/S | 7,264,182 | |||||||||
| 609,050 | Novo-Nordisk A/S | 41,664,148 | |||||||||
| 137,700 | Vestas Wind Systems A/S * | 13,959,747 | |||||||||
| Total Denmark | 85,747,658 | ||||||||||
| Finland — 6.4% | |||||||||||
| 96,827 | Alma Media Corp (a) | 1,467,113 | |||||||||
| 110,598 | Amer Sports Oyj Class A (a) | 2,310,095 | |||||||||
| 50,879 | Elisa Oyj | 1,550,771 | |||||||||
| 233,762 | Fortum Oyj | 9,760,175 | |||||||||
| 67,129 | KCI Konecranes Oyj | 2,437,304 | |||||||||
| 198,706 | Kone Oyj (a) | 6,952,666 | |||||||||
| 90,359 | Metso Oyj | 4,701,204 | |||||||||
| 49,361 | Neste Oil Oyj | 1,727,097 | |||||||||
| 4,334,171 | Nokia Oyj | 155,716,479 | |||||||||
| 394,944 | Nokian Renkaat Oyj | 16,237,401 | |||||||||
| 121,641 | Outotec Oyj | 6,718,305 | |||||||||
| 248,383 | Rautaruukki Oyj | 10,829,587 | |||||||||
| 82,709 | Tietoenator Oyj | 1,552,557 | |||||||||
| 41,646 | Wartsila Oyj Class B | 2,846,776 | |||||||||
| 86,388 | YIT Oyj | 2,146,138 | |||||||||
| Total Finland | 226,953,668 | ||||||||||
| France — 7.1% | |||||||||||
| 71,281 | Alstom | 14,980,378 | |||||||||
| 37,831 | BNP Paribas | 3,382,088 | |||||||||
| 94,820 | Bouygues | 6,476,225 | |||||||||
| 78,684 | Carrefour SA | 5,533,533 | |||||||||
| 233,387 | Credit Agricole SA | 6,330,572 | |||||||||
| 54,092 | Dassault Systemes SA | 2,949,455 | |||||||||
| 121,295 | Electricite de France | 11,313,182 | |||||||||
See accompanying notes to the financial statements.
5
GMO International Growth Equity Fund
(A Series of GMO Trust)
Schedule of Investments — (Continued)
(showing percentage of total net assets)
February 29, 2008
| Shares | Description | Value ($) | |||||||||
| France — continued | |||||||||||
| 102,991 | Essilor International SA | 6,115,372 | |||||||||
| 221,572 | Groupe Danone | 17,356,646 | |||||||||
| 78,262 | Hermes International | 9,159,306 | |||||||||
| 129,519 | L'Oreal SA | 15,370,254 | |||||||||
| 41,580 | LVMH Moet Hennessy Louis Vuitton SA | 4,272,007 | |||||||||
| 28,972 | Neopost SA | 3,007,259 | |||||||||
| 37,858 | Peugeot SA | 2,877,936 | |||||||||
| 878,539 | Sanofi-Aventis | 64,935,146 | |||||||||
| 21,841 | Societe Generale | 2,336,970 | |||||||||
| 5,460 | Societe Generale NV (New Shares) * | 599,965 | |||||||||
| 762,171 | Total SA | 57,394,552 | |||||||||
| 29,389 | UbiSoft Entertainment SA * | 2,470,081 | |||||||||
| 129,236 | Veolia Environnement | 11,498,593 | |||||||||
| 18,447 | Wendel Investissement | 2,080,515 | |||||||||
| Total France | 250,440,035 | ||||||||||
| Germany — 7.3% | |||||||||||
| 154,460 | Adidas AG | 9,803,726 | |||||||||
| 29,437 | Allianz SE (Registered) | 5,074,739 | |||||||||
| 210,250 | BASF AG | 26,885,844 | |||||||||
| 38,795 | Bayer AG | 2,985,641 | |||||||||
| 36,296 | Beiersdorf AG (Bearer) | 2,873,439 | |||||||||
| 127,731 | Deutsche Bank AG (Registered) | 14,170,713 | |||||||||
| 160,390 | Deutsche Boerse AG | 25,522,066 | |||||||||
| 73,435 | E.ON AG | 13,826,033 | |||||||||
| 36,368 | K&S AG | 10,582,151 | |||||||||
| 63,006 | MAN AG | 8,310,572 | |||||||||
| 75,636 | Muenchener Rueckversicherungs AG (Registered) | 13,308,104 | |||||||||
| 36,707 | Norddeutsche Affinerie AG | 1,482,582 | |||||||||
| 55,006 | Premiere AG * | 1,177,896 | |||||||||
| 7,376 | Puma AG Rudolf Dassler Sport | 2,624,402 | |||||||||
| 83,646 | Q-Cells AG * | 6,743,044 | |||||||||
| 81,942 | Salzgitter AG | 14,362,954 | |||||||||
| 691,442 | SAP AG | 32,653,202 | |||||||||
See accompanying notes to the financial statements.
6
GMO International Growth Equity Fund
(A Series of GMO Trust)
Schedule of Investments — (Continued)
(showing percentage of total net assets)
February 29, 2008
| Shares | Description | Value ($) | |||||||||
| Germany — continued | |||||||||||
| 67,329 | SGL Carbon AG * | 3,736,621 | |||||||||
| 357,428 | Siemens AG (Registered) | 45,580,700 | |||||||||
| 97,472 | Solarworld AG | 4,405,649 | |||||||||
| 61,401 | ThyssenKrupp AG | 3,531,010 | |||||||||
| 17,450 | Volkswagen AG | 3,973,273 | |||||||||
| 12,768 | Wacker-Chemie AG | 2,712,150 | |||||||||
| 17,253 | Wincor Nixdorf AG | 1,371,874 | |||||||||
| Total Germany | 257,698,385 | ||||||||||
| Greece — 0.3% | |||||||||||
| 56,895 | Coca Cola Hellenic Bottling Co SA | 2,490,023 | |||||||||
| 51,839 | EFG Eurobank Ergasias | 1,493,305 | |||||||||
| 62,990 | Greek Organization of Football Prognostics SA | 2,060,665 | |||||||||
| 105,346 | Hellenic Telecommunications Organization SA | 2,926,322 | |||||||||
| Total Greece | 8,970,315 | ||||||||||
| Hong Kong — 1.8% | |||||||||||
| 1,303,500 | CLP Holdings Ltd | 10,189,623 | |||||||||
| 1,246,500 | Esprit Holdings Ltd | 15,664,798 | |||||||||
| 297,300 | Hang Seng Bank Ltd | 5,627,346 | |||||||||
| 2,691,000 | Hong Kong & China Gas | 7,836,315 | |||||||||
| 41,600 | Hong Kong Aircraft Engineering Co Ltd | 919,349 | |||||||||
| 1,618,000 | Hong Kong Electric Holdings Ltd | 9,163,108 | |||||||||
| 425,931 | Hong Kong Exchanges and Clearing Ltd | 8,091,441 | |||||||||
| 1,480,000 | Li & Fung Ltd | 5,383,257 | |||||||||
| 2,691,000 | PCCW Ltd | 1,552,807 | |||||||||
| Total Hong Kong | 64,428,044 | ||||||||||
| Ireland — 1.1% | |||||||||||
| 153,867 | Allied Irish Banks Plc | 3,114,778 | |||||||||
| 604,151 | Anglo Irish Bank Corp | 8,556,391 | |||||||||
| 338,168 | Bank of Ireland | 4,757,069 | |||||||||
| 482,633 | C&C Group Plc | 3,286,641 | |||||||||
| 204,383 | CRH Plc | 7,596,002 | |||||||||
See accompanying notes to the financial statements.
7
GMO International Growth Equity Fund
(A Series of GMO Trust)
Schedule of Investments — (Continued)
(showing percentage of total net assets)
February 29, 2008
| Shares | Description | Value ($) | |||||||||
| Ireland — continued | |||||||||||
| 247,333 | DCC Plc | 6,222,972 | |||||||||
| 116,249 | Irish Life & Permanent Plc | 1,890,914 | |||||||||
| 164,864 | Kerry Group Plc | 5,172,933 | |||||||||
| Total Ireland | 40,597,700 | ||||||||||
| Italy — 0.9% | |||||||||||
| 659,173 | AEM SPA | 2,666,628 | |||||||||
| 145,729 | Bulgari SPA | 1,622,541 | |||||||||
| 657,278 | ENI SPA | 22,696,620 | |||||||||
| 121,800 | Saipem | 4,976,223 | |||||||||
| Total Italy | 31,962,012 | ||||||||||
| Japan — 16.4% | |||||||||||
| 147,200 | Astellas Pharma Inc | 6,433,488 | |||||||||
| 750,850 | Canon Inc | 33,657,062 | |||||||||
| 416 | Central Japan Railway Co | 3,961,418 | |||||||||
| 263,000 | Daiichi Chuo Kisen Kaisha | 1,898,588 | |||||||||
| 45,800 | Daiichi Sankyo Co Ltd | 1,421,334 | |||||||||
| 205,800 | Daikin Industries Ltd | 9,260,485 | |||||||||
| 115,100 | Denso Corp | 4,296,860 | |||||||||
| 480 | East Japan Railway Co | 3,852,653 | |||||||||
| 132,800 | Eisai Co Ltd | 4,789,355 | |||||||||
| 102,100 | Fanuc Ltd | 9,518,664 | |||||||||
| 50,700 | Fast Retailing Co Ltd | 3,745,331 | |||||||||
| 44,300 | Hirose Electric Co Ltd | 4,693,700 | |||||||||
| 58,400 | Hokkaido Electric Power | 1,307,768 | |||||||||
| 637,700 | Honda Motor Co Ltd | 19,466,003 | |||||||||
| 455,400 | Hoya Corp | 11,554,835 | |||||||||
| 116,000 | Ibiden Co Ltd | 5,539,090 | |||||||||
| 1,302,000 | Isuzu Motors Ltd | 5,928,969 | |||||||||
| 85,300 | Ito En Ltd | 1,738,067 | |||||||||
| 411,000 | Japan Steel Works Ltd (The) | 6,679,089 | |||||||||
| 1,313 | Japan Tobacco Inc | 6,632,553 | |||||||||
| 126,000 | JFE Holdings Inc | 5,614,280 | |||||||||
See accompanying notes to the financial statements.
8
GMO International Growth Equity Fund
(A Series of GMO Trust)
Schedule of Investments — (Continued)
(showing percentage of total net assets)
February 29, 2008
| Shares | Description | Value ($) | |||||||||
| Japan — continued | |||||||||||
| 266,000 | Kao Corp | 8,189,561 | |||||||||
| 1,287,000 | Kawasaki Kisen Kaisha Ltd | 13,055,347 | |||||||||
| 52,300 | Keyence Corp | 12,203,209 | |||||||||
| 1,054,200 | Komatsu Ltd | 26,781,423 | |||||||||
| 189,500 | Konica Minolta Holdings Inc | 2,684,675 | |||||||||
| 652,000 | Marubeni Corp | 4,936,359 | |||||||||
| 229,000 | Matsushita Electric Industrial Co Ltd | 4,823,061 | |||||||||
| 585,000 | Mazda Motor Corp | 2,383,650 | |||||||||
| 726,700 | Mitsubishi Corp | 22,171,967 | |||||||||
| 284,000 | Mitsubishi Estate Co Ltd | 6,921,218 | |||||||||
| 204,000 | Mitsubishi Heavy Industries | 953,974 | |||||||||
| 600,000 | Mitsui & Co | 13,048,460 | |||||||||
| 1,433,000 | Mitsui OSK Lines Ltd | 18,611,637 | |||||||||
| 843,000 | Mitsui Trust Holding Inc | 5,811,165 | |||||||||
| 1,104 | Mizuho Financial Group Inc | 4,565,091 | |||||||||
| 71,300 | Murata Manufacturing Co Ltd | 3,868,591 | |||||||||
| 148,000 | NGK Insulators Ltd | 3,360,772 | |||||||||
| 241,000 | Nikon Corp | 6,750,418 | |||||||||
| 115,400 | Nintendo Co Ltd | 57,457,165 | |||||||||
| 382,500 | Nippon Mining Holdings Inc | 2,265,491 | |||||||||
| 1,247,000 | Nippon Oil Corp | 8,506,626 | |||||||||
| 1,458,000 | Nippon Steel Corp | 7,670,830 | |||||||||
| 1,546,000 | Nippon Yusen KK | 14,285,705 | |||||||||
| 144,000 | Nomura Research Institute | 4,101,277 | |||||||||
| 592 | NTT Data Corp | 2,770,326 | |||||||||
| 3,294 | NTT Docomo Inc | 4,825,941 | |||||||||
| 178,000 | Olympus Corp | 5,212,128 | |||||||||
| 7,270 | ORIX Corp | 1,086,930 | |||||||||
| 866,000 | Osaka Gas Co Ltd | 3,474,694 | |||||||||
| 3,537 | Resona Holdings Inc | 5,721,148 | |||||||||
| 89,000 | Ricoh Company Ltd | 1,429,352 | |||||||||
| 38,000 | Rohm Co Ltd | 2,771,551 | |||||||||
| 8,714 | SBI Holdings Inc | 2,134,133 | |||||||||
| 64,100 | Secom Co | 3,232,498 | |||||||||
See accompanying notes to the financial statements.
9
GMO International Growth Equity Fund
(A Series of GMO Trust)
Schedule of Investments — (Continued)
(showing percentage of total net assets)
February 29, 2008
| Shares | Description | Value ($) | |||||||||
| Japan — continued | |||||||||||
| 687,200 | Seven & I Holdings Co Ltd | 17,087,413 | |||||||||
| 27,200 | Shimamura Co | 1,972,273 | |||||||||
| 452,600 | Shin-Etsu Chemical Co Ltd | 24,425,184 | |||||||||
| 112,000 | Shiseido Co Ltd | 2,552,358 | |||||||||
| 193,900 | Sony Corp | 9,160,459 | |||||||||
| 210,400 | SUMCO Corp | 4,652,703 | |||||||||
| 1,051,000 | Sumitomo Metal Industries Ltd | 4,452,117 | |||||||||
| 683 | Sumitomo Mitsui Financial Group Inc | 4,933,286 | |||||||||
| 629,100 | Takeda Pharmaceutical Co Ltd | 35,103,169 | |||||||||
| 87,300 | TDK Corp | 6,205,526 | |||||||||
| 208,700 | Terumo Corp | 11,331,854 | |||||||||
| 58,600 | Tokyo Electron Ltd | 3,632,150 | |||||||||
| 639,000 | Tokyo Gas Co Ltd | 2,866,411 | |||||||||
| 31,600 | Uni-Charm Corp | 2,309,397 | |||||||||
| 10,284 | Yahoo Japan Corp | 4,572,304 | |||||||||
| 40,540 | Yamada Denki Co Ltd | 3,545,367 | |||||||||
| Total Japan | 578,857,936 | ||||||||||
| Netherlands — 0.8% | |||||||||||
| 47,889 | Fugro NV | 3,612,895 | |||||||||
| 314,213 | Heineken NV | 17,721,766 | |||||||||
| 51,700 | ING Groep NV | 1,718,079 | |||||||||
| 87,278 | TomTom NV * | 4,090,110 | |||||||||
| Total Netherlands | 27,142,850 | ||||||||||
| Norway — 0.9% | |||||||||||
| 124,400 | Frontline Ltd | 5,673,937 | |||||||||
| 186,687 | Orkla ASA | 2,320,707 | |||||||||
| 204,895 | Renewable Energy Corp AS * | 5,011,274 | |||||||||
| 504,350 | StatoilHydro ASA | 15,368,203 | |||||||||
| 230,000 | Tandberg ASA | 3,360,852 | |||||||||
| Total Norway | 31,734,973 | ||||||||||
See accompanying notes to the financial statements.
10
GMO International Growth Equity Fund
(A Series of GMO Trust)
Schedule of Investments — (Continued)
(showing percentage of total net assets)
February 29, 2008
| Shares | Description | Value ($) | |||||||||
| Portugal — 0.1% | |||||||||||
| 357,111 | Portugal Telecom SA | 4,558,056 | |||||||||
| Singapore — 1.4% | |||||||||||
| 563,000 | Capitaland Ltd | 2,487,347 | |||||||||
| 642,000 | Cosco Corp | 1,821,340 | |||||||||
| 4,248,000 | Genting International Plc * | 1,876,563 | |||||||||
| 660,000 | Keppel Corp Ltd | 4,973,208 | |||||||||
| 1,471,000 | Keppel Land Ltd | 6,111,679 | |||||||||
| 2,473,000 | Neptune Orient Lines Ltd | 5,404,291 | |||||||||
| 587,000 | Oversea-Chinese Banking Corp | 3,166,577 | |||||||||
| 747,000 | Singapore Press Holdings Ltd | 2,327,701 | |||||||||
| 875,000 | Singapore Technologies Engineering Ltd | 2,115,707 | |||||||||
| 6,836,500 | Singapore Telecommunications | 18,497,612 | |||||||||
| Total Singapore | 48,782,025 | ||||||||||
| Spain — 4.1% | |||||||||||
| 182,949 | Abertis Infraestructuras SA | 5,773,354 | |||||||||
| 130,040 | ACS Actividades de Construccion y Servicios SA | 6,641,651 | |||||||||
| 55,770 | Bolsas y Mercados Espanoles | 2,789,497 | |||||||||
| 75,464 | Cintra Concesiones de Infraestructuras de Transporte SA | 1,196,913 | |||||||||
| 184,758 | Gas Natural SDG SA | 11,195,156 | |||||||||
| 203,199 | Inditex SA | 10,475,648 | |||||||||
| 50,517 | Red Electrica de Espana | 3,151,735 | |||||||||
| 78,522 | Repsol YPF SA | 2,708,744 | |||||||||
| 3,545,396 | Telefonica SA | 102,591,515 | |||||||||
| Total Spain | 146,524,213 | ||||||||||
| Sweden — 2.2% | |||||||||||
| 70,200 | Alfa Laval AB | 3,769,630 | |||||||||
| 338,400 | Hennes & Mauritz AB Class B | 18,980,222 | |||||||||
| 118,600 | Investor AB | 2,508,678 | |||||||||
| 311,100 | Kinnevik Investment AB Class B | 5,975,147 | |||||||||
| 1,006,800 | Sandvik AB | 16,976,633 | |||||||||
| 157,200 | Scania AB Class B | 3,792,510 | |||||||||
See accompanying notes to the financial statements.
11
GMO International Growth Equity Fund
(A Series of GMO Trust)
Schedule of Investments — (Continued)
(showing percentage of total net assets)
February 29, 2008
| Shares | Description | Value ($) | |||||||||
| Sweden — continued | |||||||||||
| 247,400 | SSAB Svenskt Stal AB Series A | 6,927,252 | |||||||||
| 120,000 | Swedish Match AB | 2,796,791 | |||||||||
| 138,000 | Tele2 AB Class B | 2,425,594 | |||||||||
| 573,900 | Volvo AB Class A | 8,481,231 | |||||||||
| 461,400 | Volvo AB Class B | 6,849,995 | |||||||||
| Total Sweden | 79,483,683 | ||||||||||
| Switzerland — 8.9% | |||||||||||
| 1,629,208 | ABB Ltd | 40,590,607 | |||||||||
| 200,935 | Actelion Ltd * | 10,474,064 | |||||||||
| 245,367 | CIE Financiere Richemont SA Class A | 14,203,985 | |||||||||
| 42,654 | Geberit AG (Registered) | 6,275,345 | |||||||||
| 171,085 | Nestle SA (Registered) | 81,656,876 | |||||||||
| 18,468 | Nobel Biocare AG | 4,466,370 | |||||||||
| 1,117,708 | Novartis AG (Registered) | 55,206,717 | |||||||||
| 291,927 | Roche Holding AG (Non Voting) | 57,249,361 | |||||||||
| 2,872 | SGS SA (Registered) | 3,857,475 | |||||||||
| 25,188 | Swatch Group AG | 7,393,307 | |||||||||
| 11,174 | Swisscom AG (Registered) | 4,249,887 | |||||||||
| 14,009 | Syngenta AG (Registered) | 4,027,718 | |||||||||
| 69,917 | Synthes Inc | 9,798,274 | |||||||||
| 105,268 | UBS AG (Registered) | 3,434,749 | |||||||||
| 37,480 | Zurich Financial Services AG | 11,716,666 | |||||||||
| Total Switzerland | 314,601,401 | ||||||||||
| United Kingdom — 19.6% | |||||||||||
| 886,228 | 3i Group Plc | 14,323,102 | |||||||||
| 525,373 | Antofagasta Plc | 8,373,567 | |||||||||
| 776,309 | AstraZeneca Plc | 29,016,415 | |||||||||
| 348,970 | Aviva Plc | 4,206,291 | |||||||||
| 727,430 | Barclays Plc | 6,817,706 | |||||||||
| 211,739 | Barratt Developments Plc | 1,713,069 | |||||||||
| 2,326,525 | BG Group Plc | 54,838,482 | |||||||||
| 2,203,167 | BHP Billiton Plc | 70,479,564 | |||||||||
See accompanying notes to the financial statements.
12
GMO International Growth Equity Fund
(A Series of GMO Trust)
Schedule of Investments — (Continued)
(showing percentage of total net assets)
February 29, 2008
| Shares | Description | Value ($) | |||||||||
| United Kingdom — continued | |||||||||||
| 505,029 | British American Tobacco Plc | 18,936,984 | |||||||||
| 378,535 | British Sky Broadcasting Plc | 4,247,417 | |||||||||
| 716,082 | BT Group Plc | 3,222,705 | |||||||||
| 174,643 | Bunzl Plc | 2,400,125 | |||||||||
| 578,429 | Burberry Group Plc | 4,803,321 | |||||||||
| 265,859 | Capita Group Plc | 3,444,829 | |||||||||
| 715,776 | Centrica Plc | 4,570,079 | |||||||||
| 494,444 | Cobham Plc | 1,778,789 | |||||||||
| 207,227 | Daily Mail & General Trust Plc | 1,915,844 | |||||||||
| 1,108,821 | Diageo Plc | 22,658,560 | |||||||||
| 1,871,317 | DSG International Plc | 2,339,246 | |||||||||
| 167,961 | EMAP Plc | 3,066,266 | |||||||||
| 561,073 | Enterprise Inns Plc (Ordinary Shares) | 4,606,462 | |||||||||
| 2,455,575 | GlaxoSmithKline Plc | 53,601,615 | |||||||||
| 301,772 | HBOS Plc | 3,585,944 | |||||||||
| 392,848 | Imperial Tobacco Group Plc | 18,185,839 | |||||||||
| 122,879 | Kazakhmys Plc | 3,742,978 | |||||||||
| 87,487 | London Stock Exchange | 2,346,107 | |||||||||
| 670,307 | Marks & Spencer Group Plc | 5,313,482 | |||||||||
| 348,240 | National Grid Plc | 5,049,446 | |||||||||
| 272,617 | Next Plc | 6,914,088 | |||||||||
| 1,142,724 | Old Mutual Plc | 2,822,645 | |||||||||
| 105,242 | Persimmon Plc | 1,529,073 | |||||||||
| 460,070 | Reckitt Benckiser Group Plc | 24,816,753 | |||||||||
| 657,196 | Reed Elsevier Plc | 8,271,452 | |||||||||
| 1,029,316 | Reuters Group Plc | 12,156,255 | |||||||||
| 777,514 | Rio Tinto Plc | 87,476,208 | |||||||||
| 1,775,720 | Royal Bank of Scotland Group | 13,425,378 | |||||||||
| 610,577 | Royal Dutch Shell Plc A Shares (London) | 21,832,016 | |||||||||
| 104,403 | Royal Dutch Shell Plc B Shares (London) | 3,662,662 | |||||||||
| 418,044 | SABMiller Breweries Plc | 8,685,115 | |||||||||
| 260,085 | Scottish & Southern Energy Plc | 7,605,050 | |||||||||
| 828,045 | Smith & Nephew Plc | 10,758,889 | |||||||||
| 605,393 | Tesco Plc | 4,783,997 | |||||||||
See accompanying notes to the financial statements.
13
GMO International Growth Equity Fund
(A Series of GMO Trust)
Schedule of Investments — (Continued)
(showing percentage of total net assets)
February 29, 2008
| Shares | Description | Value ($) | |||||||||
| United Kingdom — continued | |||||||||||
| 323,543 | Travis Perkins Plc | 6,916,598 | |||||||||
| 493,234 | Tullow Oil Plc | 6,114,331 | |||||||||
| 410,479 | Unilever Plc | 12,932,661 | |||||||||
| 237,455 | Vedanta Resources Plc | 10,215,604 | |||||||||
| 23,156,708 | Vodafone Group Inc | 74,551,132 | |||||||||
| 331,173 | William Hill Plc | 2,463,174 | |||||||||
| 316,250 | William Morrison Supermarkets Plc | 1,853,856 | |||||||||
| 245,966 | Wolseley Plc | 3,009,898 | |||||||||
| Total United Kingdom | 692,381,069 | ||||||||||
| TOTAL COMMON STOCKS (COST $3,202,091,076) | 3,333,833,623 | ||||||||||
| PREFERRED STOCKS — 0.6% | |||||||||||
| Germany — 0.6% | |||||||||||
| 7,803 | Porsche AG (Non Voting) 0.06% | 13,529,461 | |||||||||
| 57,949 | Volkswagen AG 2.02% | 8,074,503 | |||||||||
| Total Germany | 21,603,964 | ||||||||||
| TOTAL PREFERRED STOCKS (COST $10,492,645) | 21,603,964 | ||||||||||
| RIGHTS AND WARRANTS — 0.0% | |||||||||||
| France — 0.0% | |||||||||||
| 1 | Societe Generale Rights, Expires 02/29/08 * (b) | 9 | |||||||||
| TOTAL RIGHTS AND WARRANTS (COST $7) | 9 | ||||||||||
See accompanying notes to the financial statements.
14
GMO International Growth Equity Fund
(A Series of GMO Trust)
Schedule of Investments — (Continued)
(showing percentage of total net assets)
February 29, 2008
| Shares / Par Value ($) | Description | Value ($) | |||||||||
| SHORT-TERM INVESTMENTS — 3.8% | |||||||||||
| 14,053,192 | Bank of New York Mellon Institutional Cash Reserves Fund (c) | 14,053,192 | |||||||||
| 117,900,000 | BNP Paribas Time Deposit, 3.19%, due 03/03/08 | 117,900,000 | |||||||||
| TOTAL SHORT-TERM INVESTMENTS (COST $131,953,192) | 131,953,192 | ||||||||||
| TOTAL INVESTMENTS — 98.7% (Cost $3,344,536,920) | 3,487,390,788 | ||||||||||
| Other Assets and Liabilities (net) — 1.3% | 47,302,243 | ||||||||||
| TOTAL NET ASSETS — 100.0% | $ | 3,534,693,031 | |||||||||
See accompanying notes to the financial statements.
15
GMO International Growth Equity Fund
(A Series of GMO Trust)
Schedule of Investments — (Continued)
February 29, 2008
A summary of outstanding financial instruments at February 29, 2008 is as follows:
Forward Currency Contracts
| Settlement Date | Deliver/Receive | Units of Currency | Value | Net Unrealized Appreciation (Depreciation) | |||||||||||||||
| Buys | |||||||||||||||||||
| 05/23/08 | CHF | 35,380,631 | $ | 33,985,634 | $ | 1,636,416 | |||||||||||||
| 05/23/08 | CHF | 35,380,631 | 33,985,634 | 1,653,473 | |||||||||||||||
| 05/23/08 | CHF | 35,380,631 | 33,985,634 | 1,622,242 | |||||||||||||||
| 05/23/08 | CHF | 35,380,631 | 33,985,634 | 1,612,914 | |||||||||||||||
| 05/23/08 | CHF | 35,380,631 | 33,985,634 | 1,564,709 | |||||||||||||||
| 05/23/08 | CHF | 35,380,631 | 33,985,634 | 1,577,182 | |||||||||||||||
| 05/23/08 | CHF | 35,380,631 | 33,985,634 | 1,625,794 | |||||||||||||||
| 05/23/08 | EUR | 22,075,000 | 33,416,988 | 1,471,372 | |||||||||||||||
| 05/23/08 | EUR | 2,682,576 | 4,060,866 | 119,896 | |||||||||||||||
| 05/23/08 | EUR | 2,682,576 | 4,060,866 | 119,035 | |||||||||||||||
| 05/23/08 | EUR | 2,763,866 | 4,183,922 | 122,891 | |||||||||||||||
| 05/23/08 | GBP | 10,694,000 | 21,125,676 | 417,066 | |||||||||||||||
| 05/23/08 | JPY | 6,669,876,009 | 64,503,242 | 1,944,364 | |||||||||||||||
| 05/23/08 | JPY | 5,391,636,009 | 52,141,599 | 1,801,876 | |||||||||||||||
| 05/23/08 | JPY | 5,391,636,009 | 52,141,599 | 1,789,512 | |||||||||||||||
| 05/23/08 | JPY | 5,391,636,009 | 52,141,599 | 1,796,142 | |||||||||||||||
| 05/23/08 | JPY | 5,391,636,009 | 52,141,599 | 1,685,517 | |||||||||||||||
| 05/23/08 | JPY | 5,391,636,009 | 52,141,599 | 1,830,342 | |||||||||||||||
| 05/23/08 | JPY | 5,391,636,009 | 52,141,599 | 1,675,599 | |||||||||||||||
| 05/23/08 | NOK | 75,457,000 | 14,379,153 | 743,249 | |||||||||||||||
| 05/23/08 | NZD | 26,226,089 | 20,693,914 | 16,479 | |||||||||||||||
| 05/23/08 | NZD | 27,020,819 | 21,321,002 | 13,195 | |||||||||||||||
| 05/23/08 | NZD | 26,226,089 | 20,693,914 | 15,430 | |||||||||||||||
| 05/23/08 | SEK | 154,281,000 | 24,926,817 | 1,065,234 | |||||||||||||||
| 05/23/08 | SEK | 120,044,339 | 19,395,280 | 476,955 | |||||||||||||||
| 05/23/08 | SEK | 120,044,339 | 19,395,280 | 458,727 | |||||||||||||||
| 05/23/08 | SEK | 120,044,339 | 19,395,280 | 474,868 | |||||||||||||||
| 05/23/08 | SEK | 120,044,339 | 19,395,280 | 492,148 | |||||||||||||||
| 05/23/08 | SGD | 21,191,772 | 15,243,595 | 181,388 | |||||||||||||||
| 05/23/08 | SGD | 21,191,772 | 15,243,595 | 171,746 | |||||||||||||||
| 05/23/08 | SGD | 21,191,772 | 15,243,595 | 172,818 | |||||||||||||||
| 05/23/08 | SGD | 21,191,772 | 15,243,595 | 181,816 | |||||||||||||||
| $ | 922,670,892 | $ | 30,530,395 | ||||||||||||||||
See accompanying notes to the financial statements.
16
GMO International Growth Equity Fund
(A Series of GMO Trust)
Schedule of Investments — (Continued)
February 29, 2008
| Settlement Date | Deliver/Receive | Units of Currency | Value | Net Unrealized Appreciation (Depreciation) | |||||||||||||||
| Sales | |||||||||||||||||||
| 05/23/08 | AUD | 31,259,112 | $ | 28,807,251 | $ | (359,271 | ) | ||||||||||||
| 05/23/08 | AUD | 31,259,112 | 28,807,251 | (323,949 | ) | ||||||||||||||
| 05/23/08 | AUD | 31,259,112 | 28,807,251 | (315,540 | ) | ||||||||||||||
| 05/23/08 | AUD | 31,259,112 | 28,807,251 | (342,454 | ) | ||||||||||||||
| 05/23/08 | AUD | 31,259,112 | 28,807,251 | (346,142 | ) | ||||||||||||||
| 05/23/08 | AUD | 31,259,112 | 28,807,251 | (359,396 | ) | ||||||||||||||
| 05/23/08 | AUD | 31,259,112 | 28,807,251 | (376,151 | ) | ||||||||||||||
| 05/23/08 | CAD | 22,619,862 | 22,945,051 | (503,888 | ) | ||||||||||||||
| 05/23/08 | CAD | 22,619,862 | 22,945,051 | (573,845 | ) | ||||||||||||||
| 05/23/08 | CAD | 22,619,862 | 22,945,051 | (612,673 | ) | ||||||||||||||
| 05/23/08 | CAD | 22,619,862 | 22,945,051 | (590,934 | ) | ||||||||||||||
| 05/23/08 | CAD | 22,619,862 | 22,945,051 | (607,756 | ) | ||||||||||||||
| 05/23/08 | CHF | 21,940,000 | 21,074,944 | (1,038,414 | ) | ||||||||||||||
| 05/23/08 | CHF | 22,006,000 | 21,138,342 | (1,227,698 | ) | ||||||||||||||
| 05/23/08 | CHF | 33,113,000 | 31,807,412 | (1,727,928 | ) | ||||||||||||||
| 05/23/08 | CHF | 30,871,000 | 29,653,810 | (1,610,552 | ) | ||||||||||||||
| 05/23/08 | DKK | 58,481,882 | 11,880,766 | (356,463 | ) | ||||||||||||||
| 05/23/08 | DKK | 58,481,882 | 11,880,766 | (352,926 | ) | ||||||||||||||
| 05/23/08 | DKK | 58,481,882 | 11,880,766 | (350,042 | ) | ||||||||||||||
| 05/23/08 | DKK | 58,481,882 | 11,880,766 | (359,059 | ) | ||||||||||||||
| 05/23/08 | DKK | 58,481,882 | 11,880,766 | (353,381 | ) | ||||||||||||||
| 05/23/08 | DKK | 58,481,882 | 11,880,766 | (353,972 | ) | ||||||||||||||
| 05/23/08 | DKK | 58,481,882 | 11,880,766 | (359,059 | ) | ||||||||||||||
| 05/23/08 | GBP | 9,147,962 | 18,071,524 | (340,569 | ) | ||||||||||||||
| 05/23/08 | GBP | 9,147,962 | 18,071,524 | (329,263 | ) | ||||||||||||||
| 05/23/08 | GBP | 9,147,962 | 18,071,524 | (326,948 | ) | ||||||||||||||
| 05/23/08 | GBP | 9,147,962 | 18,071,524 | (322,466 | ) | ||||||||||||||
| 05/23/08 | GBP | 9,147,962 | 18,071,524 | (335,776 | ) | ||||||||||||||
| 05/23/08 | GBP | 9,147,962 | 18,071,524 | (339,938 | ) | ||||||||||||||
| 05/23/08 | GBP | 9,147,962 | 18,071,524 | (340,853 | ) | ||||||||||||||
| 05/23/08 | HKD | 140,592,035 | 18,093,701 | (35,743 | ) | ||||||||||||||
| 05/23/08 | HKD | 144,852,400 | 18,641,995 | (36,348 | ) | ||||||||||||||
| 05/23/08 | HKD | 140,592,035 | 18,093,701 | (35,349 | ) | ||||||||||||||
| 05/23/08 | JPY | 4,324,726,000 | 41,823,693 | (1,047,088 | ) | ||||||||||||||
| 05/23/08 | NOK | 77,873,325 | 14,839,610 | (370,931 | ) | ||||||||||||||
| 05/23/08 | NOK | 77,873,325 | 14,839,610 | (356,135 | ) | ||||||||||||||
| 05/23/08 | NOK | 80,233,122 | 15,289,295 | (372,471 | ) | ||||||||||||||
| 05/23/08 | NZD | 5,296,000 | 4,178,853 | (94,604 | ) | ||||||||||||||
| 05/23/08 | NZD | 5,296,000 | 4,178,853 | (94,313 | ) | ||||||||||||||
| 05/23/08 | NZD | 5,296,000 | 4,178,853 | (93,571 | ) | ||||||||||||||
| $ | 783,874,714 | $ | (18,273,859 | ) | |||||||||||||||
See accompanying notes to the financial statements.
17
GMO International Growth Equity Fund
(A Series of GMO Trust)
Schedule of Investments — (Continued)
February 29, 2008
Futures Contracts
| Number of Contracts | Type | Expiration Date | Contract Value | Net Unrealized Appreciation (Depreciation) | |||||||||||||||
| Buys | |||||||||||||||||||
| 102 | CAC 40 | March 2008 | $ | 7,428,991 | $ | (18,026 | ) | ||||||||||||
| 560 | DAX | March 2008 | 143,433,294 | (22,523,176 | ) | ||||||||||||||
| 121 | FTSE 100 | March 2008 | 14,022,055 | 381,521 | |||||||||||||||
| 421 | HANG SENG | March 2008 | 65,492,977 | 1,824,107 | |||||||||||||||
| 17 | IBEX 35 | March 2008 | 3,408,019 | 5,916 | |||||||||||||||
| 649 | MSCI Singapore | March 2008 | 34,662,341 | (981,474 | ) | ||||||||||||||
| $ | 268,447,677 | $ | (21,311,132 | ) | |||||||||||||||
| Sales | |||||||||||||||||||
| 9 | AEX | March 2008 | $ | 1,222,870 | $ | 17,158 | |||||||||||||
| 101 | OMXS 30 | March 2008 | 1,585,573 | 9,648 | |||||||||||||||
| 593 | S&P Toronto 60 | March 2008 | 95,928,331 | (1,003,258 | ) | ||||||||||||||
| 102 | S&P/MIB | March 2008 | 26,066,894 | 3,715,502 | |||||||||||||||
| 22 | SPI 200 | March 2008 | 2,850,729 | 18,346 | |||||||||||||||
| 59 | TOPIX | March 2008 | 7,499,230 | 14,198 | |||||||||||||||
| $ | 135,153,627 | $ | 2,771,594 | ||||||||||||||||
As of February 29, 2008, for the futures contracts held, the Fund had sufficient cash and/or securities to cover any commitments or margin requirements of the relevant broker or exchange.
See accompanying notes to the financial statements.
18
GMO International Growth Equity Fund
(A Series of GMO Trust)
Schedule of Investments — (Continued)
February 29, 2008
Notes to Schedule of Investments:
* Non-income producing security.
(a) All or a portion of this security is out on loan (Note 2).
(b) As of February 29, 2008, the Fund elected to sell these rights but the sale did not occur until after the Fund's year end.
(c) All or a portion of this security represents investment of security lending collateral (Note 2).
As of February 29, 2008, 87.84% of the Net Assets of the Fund were valued using fair value prices based on models used by a third party vendor (Note 2).
Currency Abbreviations:
| AUD - Australian Dollar CAD - Canadian Dollar CHF - Swiss Franc DKK - Danish Krone EUR - Euro GBP - British Pound HKD - Hong Kong Dollar JPY - Japanese Yen NOK - Norwegian Krone NZD - New Zealand Dollar SEK - Swedish Krona SGD - Singapore Dollar | |||
See accompanying notes to the financial statements.
19
GMO International Growth Equity Fund
(A Series of GMO Trust)
Statement of Assets and Liabilities — February 29, 2008
| Assets: | |||||||
| Investments, at value, including securities on loan of $9,842,147 (cost $3,344,536,920) (Note 2) | $ | 3,487,390,788 | |||||
| Cash | 37,683 | ||||||
| Foreign currency, at value (cost $1,918,529) (Note 2) | 1,937,433 | ||||||
| Receivable for investments sold | 393,732 | ||||||
| Receivable for Fund shares sold | 30,490,483 | ||||||
| Dividends and interest receivable | 6,301,186 | ||||||
| Foreign taxes receivable | 1,077,631 | ||||||
| Unrealized appreciation on open forward currency contracts (Note 2) | 30,530,395 | ||||||
| Receivable for collateral on open futures contracts (Note 2) | 42,550,000 | ||||||
| Receivable for expenses reimbursed by Manager (Note 3) | 241,599 | ||||||
| Total assets | 3,600,950,930 | ||||||
| Liabilities: | |||||||
| Collateral on securities loaned, at value (Note 2) | 14,053,192 | ||||||
| Payable for investments purchased | 787,685 | ||||||
| Payable for Fund shares repurchased | 28,945,610 | ||||||
| Payable to affiliate for (Note 3): | |||||||
| Management fee | 1,440,178 | ||||||
| Shareholder service fee | 295,753 | ||||||
| Trustees and Chief Compliance Officer of GMO Trust fees | 3,991 | ||||||
| Unrealized depreciation on open forward currency contracts (Note 2) | 18,273,859 | ||||||
| Payable for variation margin on open futures contracts (Note 2) | 1,669,727 | ||||||
| Accrued expenses | 787,904 | ||||||
| Total liabilities | 66,257,899 | ||||||
| Net assets | $ | 3,534,693,031 | |||||
See accompanying notes to the financial statements.
20
GMO International Growth Equity Fund
(A Series of GMO Trust)
Statement of Assets and Liabilities — February 29, 2008 — (Continued)
| Net assets consist of: | |||||||
| Paid-in capital | $ | 3,223,555,710 | |||||
| Accumulated undistributed net investment income | 55,413,766 | ||||||
| Accumulated net realized gain | 118,779,228 | ||||||
| Net unrealized appreciation | 136,944,327 | ||||||
| $ | 3,534,693,031 | ||||||
| Net assets attributable to: | |||||||
| Class III shares | $ | 1,018,040,416 | |||||
| Class IV shares | $ | 2,516,652,615 | |||||
| Shares outstanding: | |||||||
| Class III | 36,778,207 | ||||||
| Class IV | 90,855,873 | ||||||
| Net asset value per share: | |||||||
| Class III | $ | 27.68 | |||||
| Class IV | $ | 27.70 | |||||
See accompanying notes to the financial statements.
21
GMO International Growth Equity Fund
(A Series of GMO Trust)
Statement of Operations — Year Ended February 29, 2008
| Investment Income: | |||||||
| Dividends (net of withholding taxes of $9,618,573) | $ | 104,135,505 | |||||
| Interest | 6,306,647 | ||||||
| Securities lending income | 3,504,446 | ||||||
| Total investment income | 113,946,598 | ||||||
| Expenses: | |||||||
| Management fee (Note 3) | 20,889,776 | ||||||
| Shareholder service fee – Class III (Note 3) | 1,566,515 | ||||||
| Shareholder service fee – Class IV (Note 3) | 2,675,629 | ||||||
| Custodian and fund accounting agent fees | 1,748,085 | ||||||
| Transfer agent fees | 49,404 | ||||||
| Audit and tax fees | 78,163 | ||||||
| Legal fees | 86,207 | ||||||
| Trustees fees and related expenses (Note 3) | 39,172 | ||||||
| Miscellaneous | 47,735 | ||||||
| Total expenses | 27,180,686 | ||||||
| Fees and expenses reimbursed by Manager (Note 3) | (1,992,670 | ) | |||||
| Expense reductions (Note 2) | (3,591 | ) | |||||
| Net expenses | 25,184,425 | ||||||
| Net investment income (loss) | 88,762,173 | ||||||
| Realized and unrealized gain (loss): | |||||||
| Net realized gain (loss) on: | |||||||
| Investments | 553,419,883 | ||||||
| Closed futures contracts | 17,569,576 | ||||||
| Foreign currency, forward contracts and foreign currency related transactions | 17,929,312 | ||||||
| Net realized gain (loss) | 588,918,771 | ||||||
| Change in net unrealized appreciation (depreciation) on: | |||||||
| Investments | (417,324,719 | ) | |||||
| Open futures contracts | (19,143,679 | ) | |||||
| Foreign currency, forward contracts and foreign currency related transactions | 6,553,460 | ||||||
| Net unrealized gain (loss) | (429,914,938 | ) | |||||
| Net realized and unrealized gain (loss) | 159,003,833 | ||||||
| Net increase (decrease) in net assets resulting from operations | $ | 247,766,006 | |||||
See accompanying notes to the financial statements.
22
GMO International Growth Equity Fund
(A Series of GMO Trust)
Statement of Changes in Net Assets
| Year Ended February 29, 2008 | Year Ended February 28, 2007 | ||||||||||
| Increase (decrease) in net assets: | |||||||||||
| Operations: | |||||||||||
| Net investment income (loss) | $ | 88,762,173 | $ | 60,256,121 | |||||||
| Net realized gain (loss) | 588,918,771 | 447,234,776 | |||||||||
| Change in net unrealized appreciation (depreciation) | (429,914,938 | ) | 117,750,593 | ||||||||
| Net increase (decrease) in net assets from operations | 247,766,006 | 625,241,490 | |||||||||
| Distributions to shareholders from: | |||||||||||
| Net investment income | |||||||||||
| Class III | (12,574,532 | ) | (14,069,563 | ) | |||||||
| Class IV | (33,113,153 | ) | (41,057,231 | ) | |||||||
| Total distributions from net investment income | (45,687,685 | ) | (55,126,794 | ) | |||||||
| Net realized gains | |||||||||||
| Class III | (165,474,422 | ) | (169,426,500 | ) | |||||||
| Class IV | (436,843,880 | ) | (223,169,718 | ) | |||||||
| Total distributions from net realized gains | (602,318,302 | ) | (392,596,218 | ) | |||||||
| (648,005,987 | ) | (447,723,012 | ) | ||||||||
| Net share transactions (Note 7): | |||||||||||
| Class III | 195,928,030 | (2,236,726,776 | ) | ||||||||
| Class IV | (76,118,558 | ) | 2,754,412,787 | ||||||||
| Increase (decrease) in net assets resulting from net share transactions | 119,809,472 | 517,686,011 | |||||||||
| Total increase (decrease) in net assets | (280,430,509 | ) | 695,204,489 | ||||||||
| Net assets: | |||||||||||
| Beginning of period | 3,815,123,540 | 3,119,919,051 | |||||||||
| End of period (including accumulated undistributed net investment income of $55,413,766 and distributions in excess of net investment income of $9,457,346, respectively) | $ | 3,534,693,031 | $ | 3,815,123,540 | |||||||
See accompanying notes to the financial statements.
23
GMO International Growth Equity Fund
(A Series of GMO Trust)
Financial Highlights
(For a Class III share outstanding throughout each period)
| Year Ended February 28/29, | |||||||||||||||||||||||
| 2008 | 2007 | 2006 | 2005 | 2004 | |||||||||||||||||||
| Net asset value, beginning of period | $ | 31.37 | $ | 29.90 | $ | 27.22 | $ | 23.67 | $ | 16.83 | |||||||||||||
| Income (loss) from investment operations: | |||||||||||||||||||||||
| Net investment income (loss)† | 0.69 | 0.77 | 0.53 | 0.40 | 0.29 | ||||||||||||||||||
| Net realized and unrealized gain (loss) | 1.28 | 4.80 | 3.57 | 3.94 | 6.81 | ||||||||||||||||||
| Total from investment operations | 1.97 | 5.57 | 4.10 | 4.34 | 7.10 | ||||||||||||||||||
| Less distributions to shareholders: | |||||||||||||||||||||||
| From net investment income | (0.40 | ) | (0.49 | ) | (0.10 | ) | (0.33 | ) | (0.26 | ) | |||||||||||||
| From net realized gains | (5.26 | ) | (3.61 | ) | (1.32 | ) | (0.46 | ) | — | ||||||||||||||
| Total distributions | (5.66 | ) | (4.10 | ) | (1.42 | ) | (0.79 | ) | (0.26 | ) | |||||||||||||
| Net asset value, end of period | $ | 27.68 | $ | 31.37 | $ | 29.90 | $ | 27.22 | $ | 23.67 | |||||||||||||
| Total Return(a) | 5.04 | % | 19.21 | % | 15.54 | % | 18.66 | % | 42.33 | % | |||||||||||||
| Ratios/Supplemental Data: | |||||||||||||||||||||||
| Net assets, end of period (000's) | $ | 1,018,040 | $ | 950,332 | $ | 3,119,919 | $ | 1,653,053 | $ | 565,104 | |||||||||||||
| Net expenses to average daily net assets | 0.67 | %(b) | 0.67 | % | 0.68 | % | 0.69 | % | 0.69 | % | |||||||||||||
| Net investment income to average daily net assets | 2.13 | % | 2.46 | % | 1.89 | % | 1.64 | % | 1.38 | % | |||||||||||||
| Portfolio turnover rate | 92 | % | 74 | % | 57 | % | 52 | % | 63 | % | |||||||||||||
| Fees and expenses reimbursed by the Manager to average daily net assets: | 0.05 | % | 0.05 | % | 0.08 | % | 0.09 | % | 0.16 | % | |||||||||||||
(a) The total returns would have been lower had certain expenses not been reimbursed during the periods shown and assumes the effect of reinvested distributions.
(b) The net expense ratio does not include the effect of expense reductions.
† Calculated using average shares outstanding throughout the period.
See accompanying notes to the financial statements.
24
GMO International Growth Equity Fund
(A Series of GMO Trust)
Financial Highlights
(For a Class IV share outstanding throughout each period)
| Year Ended February 29, 2008 | Period from July 12, 2006 (commencement of operations) through February 28, 2007 | ||||||||||
| Net asset value, beginning of period | $ | 31.38 | $ | 29.92 | |||||||
| Income (loss) from investment operations: | |||||||||||
| Net investment income (loss)† | 0.73 | 0.20 | |||||||||
| Net realized and unrealized gain (loss) | 1.26 | 4.48 | |||||||||
| Total from investment operations | 1.99 | 4.68 | |||||||||
| Less distributions to shareholders: | |||||||||||
| From net investment income | (0.41 | ) | (0.50 | ) | |||||||
| From net realized gains | (5.26 | ) | (2.72 | ) | |||||||
| Total distributions | (5.67 | ) | (3.22 | ) | |||||||
| Net asset value, end of period | $ | 27.70 | $ | 31.38 | |||||||
| Total Return(a) | 5.11 | % | 15.79 | %** | |||||||
| Ratios/Supplemental Data: | |||||||||||
| Net assets, end of period (000's) | $ | 2,516,653 | $ | 2,864,791 | |||||||
| Net expenses to average daily net assets | 0.61 | %(b) | 0.61 | %* | |||||||
| Net investment income to average daily net assets | 2.24 | % | 1.01 | %* | |||||||
| Portfolio turnover rate | 92 | % | 74 | %†† | |||||||
| Fees and expenses reimbursed by the Manager to average daily net assets: | 0.05 | % | 0.05 | %* | |||||||
(a) The total returns would have been lower had certain expenses not been reimbursed during the periods shown and assumes the effect of reinvested distributions.
(b) The net expense ratio does not include the effect of expense reductions.
† Calculated using average shares outstanding throughout the period.
* Annualized.
** Not annualized.
†† Calculation represents portfolio turnover of the Fund for the year ended February 28, 2007.
See accompanying notes to the financial statements.
25
GMO International Growth Equity Fund
(A Series of GMO Trust)
Notes to Financial Statements
February 29, 2008
1. Organization
GMO International Growth Equity Fund (the "Fund") is a series of GMO Trust (the "Trust"). The Fund is registered under the Investment Company Act of 1940, as amended, as an open-end, diversified management investment company. The Fund is advised and managed by Grantham, Mayo, Van Otterloo & Co. LLC (the "Manager" or "GMO"). The Trust was established as a Massachusetts business trust under the laws of the Commonwealth of Massachusetts on June 24, 1985. The Declaration of Trust permits the Trustees of the Trust ("Trustees") to create an unlimited number of series of shares ("Funds") and to subdivide Funds into classes.
The Fund seeks high total return. The Fund seeks to achieve its objective by outperforming the S&P/Citigroup Primary Market Index ("PMI") Europe, Pacific, Asia Composite ("EPAC") Growth Index. The Fund typically makes equity investments in companies from developed countries, other than the U.S.
As of February 29, 2008, the Fund had two classes of shares outstanding: Class III and Class IV. Each class of shares bears a different level of shareholder service fees.
2. Significant accounting policies
The following is a summary of significant accounting policies which are in conformity with accounting principles generally accepted in the United States of America ("U.S. GAAP") and which are consistently followed by the Fund in the preparation of its financial statements. The preparation of financial statements in accordance with U.S. GAAP requires management to make estimates and assumptions that affect the reported amounts and disclosures in the financial statements. Actual results could differ from those estimates. The accounting records of the Fund are maintained in U.S. dollars.
Portfolio valuation
Securities listed on a securities exchange for which market quotations are readily available are valued at the last sale price or official closing price on each business day, or if there is no such reported sale or official closing price, at the most recent quoted bid price. Unlisted securities for which market quotations are readily available are generally valued at the most recent quoted bid price. Short-term investments with a remaining maturity of sixty days or less are generally valued at amortized cost, which approximates fair value. Shares of investment funds are valued at their net asset value. Securities for which quotations are not readily available or whose values the Manager has determined to be unreliable are valued at fair value as determined in good faith by the Trustees or other persons acting at their direction pursuant to procedures approved by the Trustees. By its nature, a fair value price is a good faith est imate of the value of a security at a given point in time and may not reflect the value that would be realized if the security was sold and the differences could be material. Because many foreign equity securities markets and exchanges close prior to the close of the New York Stock Exchange ("NYSE"), closing prices for foreign securities in those markets or on those exchanges do not reflect the events that occur after that close but
26
GMO International Growth Equity Fund
(A Series of GMO Trust)
Notes to Financial Statements — (Continued)
February 29, 2008
before the close of the NYSE. As a result, foreign equity securities are generally valued using fair value prices supplied by a third party vendor based on models to the extent that these fair value prices are available.
Foreign currency translation
The market values of foreign securities, currency holdings and other assets and liabilities are translated to U.S. dollars based on the current exchange rates each business day. Income and expenses denominated in foreign currencies are translated at current exchange rates when accrued or incurred. The Fund does not isolate realized and unrealized gains and losses attributable to changes in exchange rates from gains and losses that arise from changes in the market value of investments. Such fluctuations are included with net realized and unrealized gain or loss on investments. Net realized gains and losses on foreign currency transactions represent gains and losses on disposition of currencies and forward currency contracts, currency gains and losses realized between the trade and settlement dates on securities transactions, and the difference between the amount of investment income and foreign withholding taxes recorded on the F und's accounting records and the U.S. dollar equivalent amounts actually received or paid.
Forward currency contracts
The Fund may enter into forward currency contracts including forward cross currency contracts. A forward currency contract is an agreement between two parties to buy and sell a currency at a set price on a future date. The market value of a forward currency contract fluctuates with changes in forward currency exchange rates. Forward currency contracts are marked to market daily using rates supplied by a quotation service and changes in value are recorded by the Fund as an unrealized gain or loss. Realized gains or losses equal to the difference between the value of the contract at the time it was opened and the value at the time it was closed are recorded upon delivery or receipt of the currency or, if a forward currency contract is offset by entering into another forward currency contract with the same broker, upon settlement of the net gain or loss. These contracts may involve market risk in excess of the unrealized gain or lo ss reflected in the Fund's Statement of Assets and Liabilities. In addition, the Fund could be exposed to risk if the counterparties are unable to meet the terms of the contracts or if there are movements in currency values that are unfavorable to the Fund. Forward currency contracts outstanding at the end of the period are listed in the Fund's Schedule of Investments.
Futures contracts
The Fund may purchase and sell futures contracts. Upon entering into a futures contract, the Fund is required to deposit with the futures clearing broker an amount of cash, U.S. government and agency obligations, or other liquid assets in accordance with the initial margin requirements of the broker or exchange. In addition, the Fund maintains cash or securities in an amount that at least equals the net amount payable in the event the Fund must deliver the full amount of the contracts. Futures contracts are marked to market daily and an appropriate payable or receivable for the change in value ("variation margin") is recorded by the Fund. The payable or receivable is liquidated on the following business day. Gains or losses are recognized but not considered realized until the contracts expire or are closed. Futures contracts involve, to varying degrees, risk of loss in excess of the variation margin disclosed in the
27
GMO International Growth Equity Fund
(A Series of GMO Trust)
Notes to Financial Statements — (Continued)
February 29, 2008
Statement of Assets and Liabilities. Under certain circumstances, futures exchanges may establish daily limits on the amount that the price of a futures contract can vary from the previous day's settlement price, thereby effectively preventing liquidation of unfavorable positions. Losses may arise from changes in the value of the underlying instrument if the Fund is unable to liquidate a futures position due to an illiquid secondary market for the contracts or the imposition of price limits, or if counterparties do not perform under the contract terms. Futures contracts are generally valued at the settlement price established each day by the board of trade or exchange on which they are traded. Futures contracts outstanding at the end of the period are listed in the Fund's Schedule of Investments.
Options
The Fund may write call and put options. Writing options increases the Fund's exposure to the underlying instrument by, in the case of a call option, obligating the Fund to sell the underlying instrument at a set price to the option-holder and, in the case of a put option, obligating the Fund to purchase the underlying instrument at a set price from the option-holder. When the Fund writes a call or put option, an amount equal to the premium received is recorded as a liability and subsequently marked to market to reflect the current value of the option written. Premiums received from writing options which expire are treated as realized gains. Premiums received from writing options which are exercised or closed are added to the proceeds or offset against the amounts paid on the underlying future, security or currency transaction to determine the realized gain or loss. The Fund as a writer of an option has no control over whether t he underlying future, security or currency may be sold (call) or purchased (put) and as a result bears the market risk of an unfavorable change in the price of the future, security or currency underlying the written option. In the event that the Fund writes uncovered call options (i.e. options for investments that the Fund does not own), it bears the risk of incurring substantial losses if the price of the underlying instrument increases during the term of the option. There is the risk the Fund may not be able to enter into a closing transaction because of an illiquid market. There were no open written option contracts during the period.
The Fund may also purchase put and call options. Purchasing options alters the Fund's exposure to the underlying instrument by, in the case of a call option, entitling the Fund to purchase the underlying instrument at a set price from the writer of the option and, in the case of a put option, entitling the Fund to sell the underlying instrument at a set price to the writer of the option. The Fund pays a premium as a cost for a purchased option disclosed in the Schedule of Investments which is subsequently marked to market to reflect the current value of the option. Premiums paid for purchasing options which expire are treated as realized losses. Premiums paid for purchasing options which are exercised or closed are added to the amounts paid or offset against the proceeds on the closing transaction to determine the realized gain or loss. The risk associated with purchasing put and call options is limited to the premium paid. Ther e were no purchased option contracts outstanding at the end of the period.
Exchange traded options are valued at the last sale price, or if no sale is reported, the last bid price for purchased options and the last ask price for written options. Options traded over-the-counter are valued using prices supplied by a primary pricing source chosen by the Manager.
28
GMO International Growth Equity Fund
(A Series of GMO Trust)
Notes to Financial Statements — (Continued)
February 29, 2008
Swap agreements
The Fund may enter into swap agreements. A swap is an agreement to exchange the return generated by one instrument for the return generated by another instrument. Interest rate swap agreements involve the exchange by one party with another party of their respective commitments to pay or receive interest, e.g., an exchange of floating rate payments for fixed rate payments with respect to a notional amount of principal. Total return swap agreements involve a commitment by one party in the agreement to pay interest in exchange for a market-linked return, both based on notional amounts. To the extent the total return of the security or index underlying the transaction exceeds or falls short of the offsetting interest rate obligation, the party will receive a payment from or make a payment to the counterparty, respectively. Forward spread lock swap agreements involve commitments to pay or receive a settlement amount calculated as the difference between the swap spread and a fixed spread, multiplied by the notional amount times the duration of the swap rate. The swap spread is the difference between the benchmark swap rate (market rate) and the specific treasury rate. Variance swap agreements involve commitments to pay or receive a settlement amount calculated as the difference between the annualized realized variance of returns on the underlying price and a fixed quantity, also known as the variance strike, over a period of time. In connection with these agreements, cash or securities may be set aside as collateral by the Fund's custodian or brokers in accordance with the terms of the swap agreement. The Fund earns or pays interest on cash set aside as collateral.
Swaps are marked to market daily using models that incorporate quotations from market makers and the change in value, if any, is recorded as unrealized gain or loss in the Statement of Operations. Payments received or made on swap contracts are recorded as realized gain or loss in the Statement of Operations. Gains or losses are realized upon early termination of the swap agreements. These financial instruments are not actively traded on financial markets. The values assigned to these instruments are based upon the best available information and because of the uncertainty of the valuation, these values may differ significantly from the values that would have been realized had a ready market for these instruments existed, and the differences could be material. Entering into these agreements involves, to varying degrees, elements of credit, legal, market and documentation risk in excess of the amounts recognized in the Statement o f Assets and Liabilities. Such risks involve the possibility that there will be no liquid market for these agreements, that the counterparties to the agreements may default on their obligations to perform or disagree as to the meaning of contractual terms in the agreements, or that there may be unfavorable changes in interest rates or the price of the index or security underlying these transactions. There were no swap agreements outstanding at the end of the period.
Securities lending
The Fund may lend its securities to certain qualified broker-dealers. The loans are collateralized with cash or liquid securities with a market value at least equal to the market value of the securities on loan. As with other extensions of credit, the Fund may bear the risk of loss with respect to the investment of the collateral, the risk of delay in and/or inability to exercise its rights with respect to the collateral, and the risk of delay in recovery or loss of rights in the loaned securities should the borrower of the securities fail
29
GMO International Growth Equity Fund
(A Series of GMO Trust)
Notes to Financial Statements — (Continued)
February 29, 2008
financially. If a loan is collateralized by U.S. government securities, the Fund receives a fee from the borrower. If a loan is collateralized by cash, the Fund typically invests the cash collateral for its own account in interest-bearing, short-term securities and pays a fee to the borrower that normally represents a portion of the Fund's earnings on the collateral. As of February 29, 2008, the Fund had loaned securities valued by the Fund at $9,842,147, collateralized by cash in the amount of $14,053,192 which was invested in the Bank of New York Mellon Institutional Cash Reserves Fund.
Taxes and distributions
The Fund intends to qualify each tax year as a regulated investment company under Subchapter M of the Internal Revenue Code of 1986, as amended (the "Code"). The Fund intends to distribute substantially all of its net investment income and net realized short-term and long-term capital gains, if any, after giving effect to any available capital loss carryovers for U.S. federal income tax purposes. Therefore, no provision for U.S. federal income or excise tax is necessary. Taxes on foreign interest and dividend income are generally withheld in accordance with the applicable country's tax treaty with the United States. The foreign withholding rates applicable to a Fund's investments in certain foreign jurisdictions may be higher if a significant portion of the Fund is held by non-U.S. shareholders.
The Fund's policy is to declare and pay distributions from net investment income, if any, semiannually, and from net realized short-term and long-term capital gains, if any, at least annually. All distributions are paid in shares of the Fund, at net asset value, unless the shareholder elects to receive cash distributions. Distributions to shareholders are recorded by the Fund on the ex-dividend date.
Dividends received by shareholders of the Fund which are derived from foreign source income and foreign taxes paid by the Fund may be treated, to the extent allowable under the Code, as if received and paid by the shareholders of the Fund.
The Fund may be subject to capital gains and repatriation taxes imposed by certain countries in which it invests.
Income and capital gain distributions are determined in accordance with U.S. federal income tax regulations, which may differ from U.S. GAAP. Certain capital accounts in the financial statements are periodically adjusted for permanent differences in order to reflect their tax character. These adjustments have no impact on net assets or net asset value per share. Temporary differences which arise from recognizing certain items of income, expense, gain or loss in different periods for financial statement and tax purposes will reverse at some time in the future. Distributions in excess of net investment income or net realized gains are temporary over distributions for financial statement purposes resulting from differences in the recognition or classification of income or distributions for financial statement and tax purposes.
30
GMO International Growth Equity Fund
(A Series of GMO Trust)
Notes to Financial Statements — (Continued)
February 29, 2008
U.S. GAAP and tax accounting differences primarily relate to distribution character reclassifications, foreign currency transactions, losses on wash sale transactions, derivative contract transactions and passive foreign investment company transactions.
The following reclassification represents the amount necessary to report the stated components of net assets on a tax basis, excluding certain temporary differences, as of February 29, 2008. The financial highlights exclude these adjustments.
| Accumulated Undistributed Net Investment Income | Accumulated Net Realized Gain | Paid-in Capital | |||||||||
| $ | 21,796,624 | $ | (21,796,624 | ) | $ | — | |||||
The tax character of distributions declared to shareholders is as follows:
| 2/29/2008 | 2/28/2007 | ||||||||||
| Ordinary income (including any short-term capital gains) | $ | 263,403,378 | $ | 176,144,020 | |||||||
| Long-term capital gains | 384,602,609 | 271,578,992 | |||||||||
| Total distributions | $ | 648,005,987 | $ | 447,723,012 | |||||||
Distributions in excess of tax basis earnings and profits, if significant, are reported in the financial statements as a tax return of capital.
As of February 29, 2008, the components of distributable earnings on a tax basis consisted of the following:
| Undistributed ordinary income | $ | 70,716,798 | |||||
| Undistributed long-term capital gain | $ | 122,411,183 | |||||
As of February 29, 2008, the approximate cost for U.S. federal income tax purposes and gross and net unrealized appreciation and depreciation in value of investments were as follows:
| Aggregate Cost | Gross Unrealized Appreciation | Gross Unrealized (Depreciation) | Net Unrealized Appreciation (Depreciation) | ||||||||||||
| $ | 3,348,408,494 | $ | 365,574,122 | $ | (226,591,828 | ) | $ | 138,982,294 | |||||||
31
GMO International Growth Equity Fund
(A Series of GMO Trust)
Notes to Financial Statements — (Continued)
February 29, 2008
Security transactions and related investment income
Security transactions are accounted for on trade date. Dividend income, net of applicable foreign withholding taxes, if any, is recorded on the ex-dividend date, or when the Fund is informed of the ex-dividend date, if later. Interest income is recorded on the accrual basis and is adjusted for the amortization of premiums and accretion of discounts. Interest income on inflation indexed securities, if any, is accrued daily based upon an inflation adjusted principal. Additionally, any increase or decrease in the principal or face amount of the securities adjusted for inflation is recorded as interest income or loss. Income is not recognized on securities for which collection is not expected. Non-cash dividends, if any, are recorded at the fair market value of the securities received. In determining the net gain or loss on securities sold, the cost of securities is determined on the identified cost basis.
Expenses
The majority of expenses of the Trust are directly identifiable to an individual fund. Expenses which are not readily identifiable to a specific fund are allocated taking into consideration, among other things, the nature and type of expense and the relative size of the funds. Investment income, common expenses and realized and unrealized gains and losses are allocated pro rata among the classes of shares of the Fund based on the relative net assets of each class. Shareholder service fees, which are directly attributable to a class of shares, are charged to that class's operations.
Brown Brothers Harriman & Co. ("BBH") serves as custodian and fund accounting agent of the Fund. State Street Bank and Trust Company ("State Street") serves as transfer agent of the Fund. BBH and State Street's fees may be reduced by credits that are an earnings allowance calculated on the average daily cash balances the Fund maintains with each agent. Credit balances or expense reimbursements used to reduce fees, if any, are reported as a reduction of expenses in the Statement of Operations.
Investment risks
There are certain additional risks involved in investing in foreign securities that are not inherent in investments in U.S. securities. These risks may involve adverse political and economic developments including the possible imposition of capital controls or other foreign governmental laws or restrictions. In addition, the securities of some foreign companies and securities markets are less liquid and at times may be more volatile than securities of comparable U.S. companies and U.S. securities markets.
Recently issued accounting pronouncements
In June 2006, the Financial Accounting Standards Board ("FASB") issued FASB Interpretation No. 48, Accounting for Uncertainty in Income Taxes – an Interpretation of FASB Statement No. 109 ("FIN 48"). FIN 48 clarifies the accounting for uncertainty in income taxes recognized in accordance with FASB Statement No. 109, Accounting for Income Taxes. FIN 48 prescribes a recognition threshold and measurement attribute for a tax position taken or expected to be taken in the tax return that could impact
32
GMO International Growth Equity Fund
(A Series of GMO Trust)
Notes to Financial Statements — (Continued)
February 29, 2008
the Fund's financial statements. It also provides guidance in relation to the Fund's financial statements on classification of tax benefits or liabilities, interest and penalties, accounting in interim periods, disclosure, and transition. FIN 48 is effective for fiscal years beginning after December 15, 2006 for registered investment companies. Management has evaluated the effects of applying the various provisions of FIN 48 and has determined that the adoption of FIN 48 does not have a material effect on the Fund's financial statements. The Fund's federal tax returns for the prior three fiscal years, if applicable, remain subject to examination by the Internal Revenue Service. Management will continue to monitor the rules and guidance pertaining to FIN 48 and will take action if appropriate.
In September 2006, the FASB issued Statement of Financial Accounting Standards No. 157 ("FAS 157"), "Fair Value Measurements." FAS 157 defines fair value, establishes a framework for measuring fair value in accordance with generally accepted accounting principles and expands disclosure about fair value measurements. FAS 157 is effective for fiscal years beginning after November 15, 2007. Management is currently evaluating the impact the adoption of FAS 157 will have on the Fund's financial statement disclosures.
3. Fees and other transactions with affiliates
GMO earns a management fee paid monthly at the annual rate of 0.52% of average daily net assets. The Fund has adopted a Shareholder Service Plan under which the Fund pays GMO a shareholder service fee for client and shareholder service, reporting, and other support. Pursuant to the Shareholder Service Plan, the shareholder service fee is calculated based on average daily net assets at the annual rate of 0.15% for Class III shares and 0.09% for Class IV shares.
The Manager has contractually agreed to reimburse the Fund for Fund expenses through at least June 30, 2008 to the extent the Fund's total annual operating expenses (excluding shareholder service fees, fees and expenses of the independent Trustees of the Trust, fees and expenses for legal services not approved by the Manager for the Trust, compensation and expenses of the Trust's Chief Compliance Officer ("CCO") (excluding any employee benefits), brokerage commissions, securities lending fees and expenses, interest expense, transfer taxes, and other investment-related costs (including expenses associated with investments in any company that is an investment company or would be an investment company under the 1940 Act, but for the exceptions to the definition of investment company provided in Section 3(c)(1) and 3(c)(7) of the 1940 Act), hedging transaction fees, extraordinary, non-recurring and certain other unusual expenses (in cluding taxes)) exceed 0.52% of the Fund's average daily net assets.
The Fund's portion of the fee paid by the Trust to the independent Trustees and CCO during the year ended February 29, 2008 was $33,560 and $16,861, respectively. The compensation and expenses of the CCO are included in miscellaneous expenses in the Statement of Operations. No remuneration was paid by the Fund to any other officer of the Trust.
33
GMO International Growth Equity Fund
(A Series of GMO Trust)
Notes to Financial Statements — (Continued)
February 29, 2008
4. Purchases and sales of securities
Cost of purchases and proceeds from sales of securities, excluding short-term investments, for the year ended February 29, 2008 aggregated $3,534,185,897 and $3,954,757,320, respectively.
5. Guarantees
In the normal course of business the Fund enters into contracts with third-party service providers that contain a variety of representations and warranties and which provide general indemnifications. The Fund's maximum exposure under these arrangements is unknown, as this would involve future claims that may be made against the Fund that have not yet occurred. Based on experience, management is of the view that the risk of loss in connection with these potential indemnification obligations is remote; however, there can be no assurance that material liabilities related to such obligations will not arise in the future that could adversely impact the Fund.
6. Principal shareholders and related parties
As of February 29, 2008, 31.53% of the outstanding shares of the Fund were held by two shareholders, each holding in excess of 10% of the Fund's outstanding shares. No other shareholder owned in excess of 10% of the outstanding shares of the Fund. Investment activities of these shareholders may have a material effect on the Fund.
As of February 29, 2008, 0.01% of the Fund's shares were held by two related parties comprised of certain GMO employee accounts, and 95.11% of the Fund's shares were held by accounts for which the Manager has investment discretion.
34
GMO International Growth Equity Fund
(A Series of GMO Trust)
Notes to Financial Statements — (Continued)
February 29, 2008
7. Share transactions
The Declaration of Trust permits the Trustees to issue an unlimited number of shares of beneficial interest (without par value). Transactions in Fund shares were as follows:
| Year Ended February 29, 2008 | Year Ended February 28, 2007 | ||||||||||||||||||
| Class III: | Shares | Amount | Shares | Amount | |||||||||||||||
| Shares sold | 6,367,909 | $ | 201,027,055 | 10,949,574 | $ | 338,325,961 | |||||||||||||
| Shares issued to shareholders in reinvestment of distributions | 5,685,508 | 173,931,678 | 5,869,582 | 179,928,725 | |||||||||||||||
| Shares repurchased | (5,568,633 | ) | (179,030,703 | ) | (90,878,436 | ) | (2,754,981,462 | ) | |||||||||||
| Net increase (decrease) | 6,484,784 | $ | 195,928,030 | (74,059,280 | ) | $ | (2,236,726,776 | ) | |||||||||||
| Year Ended February 29, 2008 | Period from July 12, 2006 (commencement of operations) through February 28, 2007 | ||||||||||||||||||
| Class IV: | Shares | Amount | Shares | Amount | |||||||||||||||
| Shares sold | 20,701,601 | $ | 636,413,259 | 90,200,139 | $ | 2,723,394,473 | |||||||||||||
| Shares issued to shareholders in reinvestment of distributions | 15,300,242 | 469,510,148 | 8,553,466 | 264,644,244 | |||||||||||||||
| Shares repurchased | (36,433,738 | ) | (1,182,041,965 | ) | (7,465,837 | ) | (233,625,930 | ) | |||||||||||
| Net increase (decrease) | (431,895 | ) | $ | (76,118,558 | ) | 91,287,768 | $ | 2,754,412,787 | |||||||||||
35
Report of Independent Registered Public Accounting Firm
To the Trustees of GMO Trust and the Shareholders of
GMO International Growth Equity Fund
In our opinion, the accompanying statement of assets and liabilities, including the schedule of investments, and the related statements of operations and of changes in net assets and the financial highlights present fairly, in all material respects, the financial position of GMO International Growth Equity Fund (the "Fund") at February 29, 2008, the results of its operations for the year then ended, the changes in its net assets for each of the two years in the period then ended and the financial highlights for each of the five years in the period then ended, in conformity with accounting principles generally accepted in the United States of America. These financial statements and financial highlights (hereafter referred to as "financial statements") are the responsibility of the Fund's management; our responsibility is to express an opinion on these financial statements based on our audits. We conducted our audits of these fina ncial statements in accordance with the standards of the Public Company Accounting Oversight Board (United States). Those standards require that we plan and perform the audit to obtain reasonable assurance about whether the financial statements are free of material misstatement. An audit includes examining, on a test basis, evidence supporting the amounts and disclosures in the financial statements, assessing the accounting principles used and significant estimates made by management, and evaluating the overall financial statement presentation. We believe that our audits, which included confirmation of securities at February 29, 2008 by correspondence with the custodian and brokers, provide a reasonable basis for our opinion.
PricewaterhouseCoopers LLP
Boston, Massachusetts
April 29, 2008
36
GMO International Growth Equity Fund
(A Series of GMO Trust)
Fund Expenses
February 29, 2008 (Unaudited)
Expense Examples: The following information is in relation to expenses for the six month period ended February 29, 2008.
As a shareholder of the Fund, you may incur two types of costs: (1) transaction costs, and (2) ongoing costs, including management fees, shareholder service fees and other Fund expenses. This example is intended to help you understand your ongoing costs (in dollars) of investing in the Fund and to compare these costs with the ongoing costs of investing in other mutual funds.
These examples are based on an investment of $1,000 invested at the beginning of the period and held for the entire period, September 1, 2007 through February 29, 2008.
Actual Expenses
The first line of the table for each class below provides information about actual account values and actual expenses. You may use the information in this line, together with the amount you invested, to estimate the expenses that you paid over the period. Simply divide your account value by $1,000 (for example, a $10,000,000 account value divided by $1,000 = 10,000), then multiply the result by the number in the first line under the heading entitled "Net Expense Incurred" to estimate the expenses you paid on your account during this period.
Hypothetical Example for Comparison Purposes
The second line of the table for each class below provides information about hypothetical account values and hypothetical expenses based on the Fund's actual expense ratio and an assumed rate of return of 5% per year before expenses, which is not the Fund's actual return. The hypothetical account values and expenses may not be used to estimate the actual ending account balance or expenses you paid for the period. You may use this information to compare the ongoing costs of investing in the Fund with other funds. To do so, compare this 5% hypothetical example with the 5% hypothetical examples that appear in the shareholder reports of other funds.
Please note that the expenses shown in the table are meant to highlight your ongoing costs only and do not reflect any transactional costs. Therefore, the second line of the table is useful in comparing ongoing costs only, and will not help you determine the relative total costs of owning different funds. In addition, if these transactional costs were included, your costs would have been higher.
| Annualized Net Expense Ratio | Beginning Account Value | Ending Account Value | Net Expense Incurred* | ||||||||||||||||
| Class III | |||||||||||||||||||
| 1) Actual | 0.67 | % | $ | 1,000.00 | �� | $ | 975.50 | $ | 3.29 | ||||||||||
| 2) Hypothetical | 0.67 | % | $ | 1,000.00 | $ | 1,021.53 | $ | 3.37 | |||||||||||
| Class IV | |||||||||||||||||||
| 1) Actual | 0.61 | % | $ | 1,000.00 | $ | 975.90 | $ | 3.00 | |||||||||||
| 2) Hypothetical | 0.61 | % | $ | 1,000.00 | $ | 1,021.83 | $ | 3.07 | |||||||||||
* Expenses are calculated using each Class's annualized net expense ratio for the six months ended February 29, 2008, multiplied by the average account value over the period, multiplied by 182 days, divided by 366 days in the year.
37
GMO International Growth Equity Fund
(A Series of GMO Trust)
Tax Information for the Tax Year Ended February 29, 2008 (Unaudited)
The Fund will notify shareholders of amounts for use in preparing 2008 income tax forms in January 2009.
The Fund's distributions to shareholders include $384,602,609 from long-term capital gains.
During the year ended February 29, 2008, the Fund paid foreign taxes of $9,579,582 and recognized foreign source income of $113,754,078.
For taxable, non-corporate shareholders, 28.44% of the income and short-term capital gains, if any, distributed in the Fund's fiscal year ended February 29, 2008 represents qualified dividend income subject to the 15% rate category.
The Fund hereby designates as qualified interest income and qualified short-term capital gains with respect to its taxable year ended February 29, 2008, $2,914,874 and $217,715,692, respectively, or if determined to be different, the qualified interest income and qualified short-term gains of such year.
38
Trustees and Officers (Unaudited)
The following tables list the Trust's Trustees and Officers as of the date of this report; their address and date of birth ("DOB"); their position with the Trust; the length of time holding that position with the Trust; their principal occupation(s) during the past five years; the number of portfolios in the fund complex they oversee; and other directorships they hold in companies subject to registration or reporting requirements of the Securities Exchange Act of 1934 (generally called "public companies") or in registered investment companies. The Trust's Statement of Additional Information ("SAI") includes additional information about the Trust's trustees, including changes subsequent to the date of the report. The SAI is available, without charge, upon request by writing GMO, c/o GMO Trust, 40 Rowes Wharf, Boston, MA 02110.
Independent Trustees:
| Name, Address, and DOB | Position(s) Held with Trust | Term of Office1 and Length of Time Served | Principal Occupation(s) During Past Five Years | Number of Portfolios in Fund Complex Overseen by Trustee | Other Directorships Held by Trustee | ||||||||||||||||||
| Donald W. Glazer, Esq. c/o GMO Trust 40 Rowes Wharf Boston, MA 02110 DOB: 07/26/1944 | Chairman of the Board of Trustees | Chairman of the Board of Trustees since March 2005; Lead Independent Trustee (September 2004 – March 2005); Trustee since December 2000. | Consultant – Law and Business2; Vice Chair (since 2002) and Secretary, Provant, Inc. (provider of personnel performance improvement services and training products); Author of Legal Treatises. | 47 | None. | ||||||||||||||||||
1 Each Trustee is elected to serve during the continued lifetime of the Trust until he/she dies, resigns or is removed, or if sooner, until the next meeting of Shareholders called for the purpose of electing Trustees and until the election and qualification of his/her successor.
2 As part of Mr. Glazer's work as a consultant, he provides part-time consulting services to Goodwin Procter LLP ("Goodwin"). Goodwin has provided legal services to Renewable Resources, LLC, an affiliate of GMO; GMO, in connection with its relationship with Renewable Resources; and funds managed by Renewable Resources. Mr. Glazer has represented that he has no financial interest in, and is not involved in the provision of, such legal services. In the calendar years ended December 31, 2006 and December 31, 2007, these entities paid $825,738 and $291,721 respectively, in legal fees and disbursements to Goodwin.
39
Independent Trustees — (Continued)
| Name, Address, and DOB | Position(s) Held with Trust | Term of Office1 and Length of Time Served | Principal Occupation(s) During Past Five Years | Number of Portfolios in Fund Complex Overseen by Trustee | Other Directorships Held by Trustee | ||||||||||||||||||
| Jay O. Light c/o GMO Trust 40 Rowes Wharf Boston, MA 02110 DOB: 10/03/1941 | Trustee | Since May 1996. | Dean (since April 2006), Acting Dean (August 2005 – April 2006), Senior Associate Dean (1998 – 2005), and Professor of Business Administration, Harvard Business School. | 47 | Director of Harvard Management Company, Inc.3 and Verde, Inc.; Director of Partners HealthCare System, Inc. and Chair of its Investment Committee.4 | ||||||||||||||||||
| W. Nicholas Thorndike c/o GMO Trust 40 Rowes Wharf Boston, MA 02110 DOB: 03/28/1933 | Trustee | Since March 2005. | Director or trustee of various corporations and charitable organizations, including Courier Corporation (a book publisher and manufacturer) (July 1989 – present); Putnam Funds (December 1992 – June 2004); and Providence Journal (a newspaper publisher) (December 1986 – December 2003). | 47 | Director of Courier Corporation (a book publisher and manufacturer); Member of the Investment Committee of Partners HealthCare System, Inc.4 | ||||||||||||||||||
1 Each Trustee is elected to serve during the continued lifetime of the Trust until he/she dies, resigns or is removed, or if sooner, until the next meeting of Shareholders called for the purpose of electing Trustees and until the election and qualification of his/her successor.
3 Harvard Management Company, Inc. is a client of the Manager.
4 Partners HealthCare System, Inc. is a client of the Manager.
40
Principal Officers:
| Name, Address, and DOB | Position(s) Held with Trust | Term of Office5 and Length of Time Served | Principal Occupation(s) During Past Five Years | ||||||||||||
| Scott Eston c/o GMO Trust 40 Rowes Wharf Boston, MA 02110 DOB: 01/20/1956 | President and Chief Executive Officer | President and Chief Executive Officer since October 2002; Chief Financial Officer, November 2006 – February 2007. | Chief Financial Officer, Chief Operating Officer and Member, Grantham, Mayo, Van Otterloo & Co. LLC. | ||||||||||||
| Sheppard N. Burnett c/o GMO Trust 40 Rowes Wharf Boston, MA 02110 DOB: 10/24/1968 | Treasurer and Chief Financial Officer | Chief Financial Officer since March 2007; Treasurer since November 2006; Assistant Treasurer, September 2004 – November 2006. | Fund Administration Staff, Grantham, Mayo, Van Otterloo & Co. LLC (June 2004 – present); Vice President, Director of Tax, Columbia Management Group (2002 – 2004). | ||||||||||||
| Brent C. Arvidson c/o GMO Trust 40 Rowes Wharf Boston, MA 02110 DOB: 06/26/1969 | Assistant Treasurer | Since August 1998. | Senior Fund Administrator, Grantham, Mayo, Van Otterloo & Co. LLC. | ||||||||||||
| John L. Nasrah c/o GMO Trust 40 Rowes Wharf Boston, MA 02110 DOB: 05/27/1977 | Assistant Treasurer | Since March 2007. | Fund Administrator, Grantham, Mayo, Van Otterloo & Co. LLC (September 2004 – present); Tax Analyst, Bain & Company, Inc (June 2003 – September 2004); Senior Tax Associate, PricewaterhouseCoopers LLP (2001 – 2003). | ||||||||||||
| Mahmoodur Rahman c/o GMO Trust 40 Rowes Wharf Boston, MA 02110 DOB: 11/30/1967 | Assistant Treasurer | Since September 2007. | Fund Administrator, Grantham, Mayo, Van Otterloo & Co. (April 2007 – present); Vice President and Senior Tax Manager, Massachusetts Financial Services Company (January 2000 – April 2007). | ||||||||||||
5 Officers are elected to hold such office until their successor is elected and qualified to carry out the duties and responsibilities of their office, or until he or she resigns or is removed from office.
41
Principal Officers — (Continued)
| Name, Address, and DOB | Position(s) Held with Trust | Term of Office5 and Length of Time Served | Principal Occupation(s) During Past Five Years | ||||||||||||
| Michael E. Gillespie c/o GMO Trust 40 Rowes Wharf Boston, MA 02110 DOB: 02/18/1958 | Chief Compliance Officer | Since March 2005. | Vice President of Compliance (June 2004 – February 2005) and Director of Domestic Compliance (March 2002 – June 2004), Fidelity Investments; Vice President and Senior Counsel, State Street Bank and Trust Company (May 1998 – March 2002). | ||||||||||||
| Jason B. Harrison c/o GMO Trust 40 Rowes Wharf Boston, MA 02110 DOB: 01/29/1977 | Vice President and Clerk | Vice President since November 2006; Clerk since March 2006. | Legal Counsel, Grantham, Mayo, Van Otterloo & Co. LLC (since February 2006) and Attorney, Ropes & Gray LLP (September 2002 – February 2006). | ||||||||||||
| David L. Bohan c/o GMO Trust 40 Rowes Wharf Boston, MA 02110 DOB: 06/21/1964 | Vice President and Assistant Clerk | Vice President since March 2005; Assistant Clerk since March 2006. | Legal Counsel, Grantham, Mayo, Van Otterloo & Co. LLC (September 2003 – present); Attorney, Goodwin Procter LLP (September 1996 – September 2003). | ||||||||||||
| Gregory L. Pottle c/o GMO Trust 40 Rowes Wharf Boston, MA 02110 DOB: 07/09/1971 | Vice President and Assistant Clerk | Since November 2006. | Legal Counsel, Grantham, Mayo, Van Otterloo & Co. LLC. | ||||||||||||
| Anne K. Trinque c/o GMO Trust 40 Rowes Wharf Boston, MA 02110 DOB: 04/15/1978 | Vice President and Assistant Clerk | Since September 2007. | Legal Counsel, Grantham, Mayo, Van Otterloo & Co. LLC (since January 2007); Attorney, Goodwin Procter LLP (September 2003 – January 2007). | ||||||||||||
| Cheryl Wakeham c/o GMO Trust 40 Rowes Wharf Boston, MA 02110 DOB: 10/29/1958 | Anti-Money Laundering Officer | Since December 2004. | Manager, Client Service Administration, Grantham, Mayo, Van Otterloo & Co. LLC. | ||||||||||||
5 Officers are elected to hold such office until their successor is elected and qualified to carry out the duties and responsibilities of their office, or until he or she resigns or is removed from office.
42
GMO International Small Companies Fund
(A Series of GMO Trust)
Annual Report
February 29, 2008
For a free copy of the Fund's proxy voting guidelines, shareholders may call 1-617-346-7646 (collect), visit our website at www.gmo.com, or visit the Securities and Exchange Commission's website at www.sec.gov. Information regarding how the Fund voted proxies relating to portfolio securities during the most recent 12-month period ended June 30 is available on our website at www.gmo.com, or on the Securities and Exchange Commission's website at www.sec.gov.
The Fund files its complete schedule of portfolio holdings with the Securities and Exchange Commission for the first and third quarter of each fiscal year on Form N-Q, which is available on the Commission's website at www.sec.gov. The Fund's Form N-Q may be reviewed and copied at the Commission's Public Reference Room in Washington, D.C. Information on the operation of the Public Reference Room may be obtained by calling 1-800-SEC-0330. The Fund has a policy with respect to disclosure of portfolio holdings under which it may also make available on GMO's website (www.gmo.com) a complete schedule of portfolio holdings.
This report is prepared for the general information of shareholders. It is authorized for distribution to prospective investors only when preceded or accompanied by a prospectus for the GMO Trust.
GMO International Small Companies Fund
(A Series of GMO Trust)
Portfolio Managers
Day-to-day management of the Fund's portfolio is the responsibility of the International Quantitative team at Grantham, Mayo, Van Otterloo & Co. LLC.
Management Discussion and Analysis of Fund Performance
The GMO International Small Companies Fund returned -2.0% for the fiscal year ended February 29, 2008, as compared to -1.9% for the S&P/Citigroup EMI World ex-U.S. Index. Consistent with the Fund's investment objectives and policies, the Fund was invested substantially in international equity securities throughout the period.
Stock selection was strong overall, especially within Information Technology, Industrial, and Materials stocks. Australian fertilizer company Incitec Pivot Ltd., Hong Kong shipper Pacific Basin Shipping Ltd., and Canadian mining company Aur Resources were among the most significant contributors. U.K. homebuilder Taylor Wimpey and U.K. building supply company Travis Perkins were among the greatest detractors.
Country allocation had minimal impact on relative performance as underweighting Spain and overweighting Singapore helped relative returns, but underweighting Canada and overweighting Ireland detracted somewhat. The Fund also maintains an allocation to emerging markets, which outperformed, adding additional value.
Currency allocation also added value as our underweight to the British pound and exposure to emerging markets currencies worked well. Our underweight to the Australian dollar offset some of the benefit. The U.S. dollar weakened relative to most foreign currencies, which boosted returns for U.S. investors. The MSCI EAFE Index returned 10% more in U.S. dollar terms than in local currency.
Sector exposures had a small positive impact from underweighting Consumer Discretionary and overweighting Materials.
The views expressed herein are exclusively those of Grantham, Mayo, Van Otterloo & Co. LLC Management as of the date of this report and are subject to change. GMO disclaims any responsibility to update such views. They are not meant as investment advice. References to specific securities are not recommendations of such securities and may not be representative of any GMO portfolio's current or future investments.
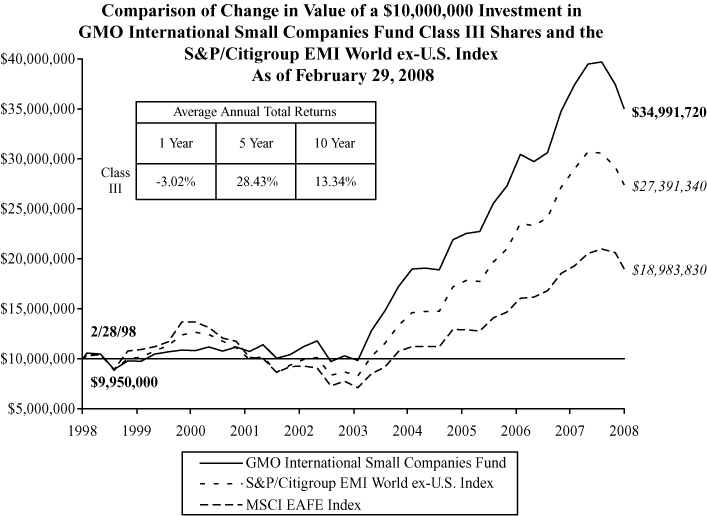
Performance data quoted represents past performance and is not indicative of future results. The investment return and principal value of an investment will fluctuate so that an investor's shares, when redeemed, may be worth more or less than their original cost. Current performance data may be lower or higher than the performance data provided herein. To obtain performance information to the most recent month-end, visit www.gmo.com. Performance shown is net of all fees after reimbursement from the Manager. Each performance figure assumes a purchase at the beginning and redemption at the end of the stated period and reflects a transaction fee of .50% on the purchase and .50% on the redemption. Transaction fees are retained by the Fund to cover trading costs. Returns would have been lower had certain expenses not been reimbursed during the periods shown and do not include the effect of taxes on distributions and redemptions. All inform ation is unaudited.
GMO International Small Companies Fund
(A Series of GMO Trust)
Investments Concentration Summary
February 29, 2008 (Unaudited)
| Asset Class Summary | % of Total Net Assets | ||||||
| Common Stocks | 93.6 | % | |||||
| Short-Term Investments | 4.7 | ||||||
| Preferred Stocks | 2.5 | ||||||
| Forward Currency Contracts | 0.3 | ||||||
| Rights and Warrants | 0.0 | ||||||
| Futures | (0.3 | ) | |||||
| Other | (0.8 | ) | |||||
| 100.0 | % | ||||||
| Country Summary | % of Equity Investments | ||||||
| Japan | 17.9 | % | |||||
| United Kingdom | 14.6 | ||||||
| Germany | 7.9 | ||||||
| Australia | 7.8 | ||||||
| Canada | 7.6 | ||||||
| France | 5.4 | ||||||
| Netherlands | 4.0 | ||||||
| Sweden | 4.0 | ||||||
| Italy | 3.9 | ||||||
| Switzerland | 3.6 | ||||||
| Singapore | 2.9 | ||||||
| Belgium | 2.1 | ||||||
| Finland | 2.0 | ||||||
| Brazil | 1.9 | ||||||
| South Korea | 1.8 | ||||||
| Hong Kong | 1.6 | ||||||
| Taiwan | 1.6 | ||||||
| Ireland | 1.4 | ||||||
| Greece | 1.3 | ||||||
| China | 0.9 | ||||||
| Thailand | 0.8 | ||||||
| Russia | 0.7 | ||||||
| Austria | 0.7 | ||||||
| India | 0.5 | ||||||
| Spain | 0.4 | ||||||
| Portugal | 0.4 | ||||||
| Malaysia | 0.4 | ||||||
| Norway | 0.4 | ||||||
| Turkey | 0.4 | ||||||
| South Africa | 0.2 | ||||||
| Denmark | 0.2 | ||||||
| Israel | 0.2 | ||||||
| Hungary | 0.2 | ||||||
| New Zealand | 0.1 | ||||||
| Philippines | 0.1 | ||||||
| Poland | 0.1 | ||||||
| Indonesia | 0.0 | ||||||
| 100.0 | % | ||||||
1
GMO International Small Companies Fund
(A Series of GMO Trust)
Investments Concentration Summary — (Continued)
February 29, 2008 (Unaudited)
| Industry Sector Summary | % of Equity Investments | ||||||
| Industrials | 22.3 | % | |||||
| Financials | 17.3 | ||||||
| Consumer Discretionary | 15.5 | ||||||
| Materials | 15.4 | ||||||
| Information Technology | 7.8 | ||||||
| Energy | 7.8 | ||||||
| Consumer Staples | 5.5 | ||||||
| Health Care | 4.7 | ||||||
| Utilities | 2.0 | ||||||
| Telecommunication Services | 1.7 | ||||||
| 100.0 | % | ||||||
2
GMO International Small Companies Fund
(A Series of GMO Trust)
Schedule of Investments
(showing percentage of total net assets)
February 29, 2008
| Shares | Description | Value ($) | |||||||||||||
| COMMON STOCKS — 93.6% | |||||||||||||||
| Australia — 7.5% | |||||||||||||||
| 52,740 | BlueScope Steel Ltd | 527,567 | |||||||||||||
| 251,627 | Boral Ltd | 1,398,754 | |||||||||||||
| 98,399 | Cabcharge Australia Ltd | 869,686 | |||||||||||||
| 31,614 | Cochlear Ltd | 1,576,136 | |||||||||||||
| 1,687,677 | Commonwealth Property Office Fund | 2,022,106 | |||||||||||||
| 939,440 | CSR Ltd | 2,926,890 | |||||||||||||
| 211,590 | David Jones Ltd | 788,959 | |||||||||||||
| 193,742 | DB RREEF Trust | 298,009 | |||||||||||||
| 393,680 | Downer Edi Ltd | 2,248,438 | |||||||||||||
| 70,552 | Flight Centre Ltd | 1,762,716 | |||||||||||||
| 491,449 | Great Southern Ltd | 768,524 | |||||||||||||
| 349,915 | Gunns Ltd | 1,055,176 | |||||||||||||
| 59,884 | Incitec Pivot Ltd | 8,133,584 | |||||||||||||
| 112,092 | Independence Group NL | 938,761 | |||||||||||||
| 839,394 | ING Industrial Fund Unit | 1,615,561 | |||||||||||||
| 863,144 | ING Office Fund | 1,056,135 | |||||||||||||
| 186,451 | JB Hi-Fi Ltd | 1,818,292 | |||||||||||||
| 527,939 | Macmahon Holdings Ltd | 825,981 | |||||||||||||
| 857,701 | Macquarie CountryWide Trust | 980,283 | |||||||||||||
| 1,685,863 | Macquarie DDR Trust | 945,891 | |||||||||||||
| 3,045,429 | Macquarie Office Trust | 3,043,784 | |||||||||||||
| 333,680 | MFS Ltd | 307,731 | |||||||||||||
| 181,970 | Minara Resources Ltd | 1,072,347 | |||||||||||||
| 202,237 | Mincor Resources | 615,577 | |||||||||||||
| 121,339 | Mirvac Group Ltd | 430,114 | |||||||||||||
| 898,701 | Mount Gibson Iron Ltd * | 2,834,373 | |||||||||||||
| 119,127 | Oxiana Ltd | 427,545 | |||||||||||||
| 1,742,850 | Pan Australian Resources Ltd * | 1,681,513 | |||||||||||||
| 764,444 | PaperlinX Ltd | 1,489,110 | |||||||||||||
| 293,109 | Queensland Gas Co Ltd * | 1,157,168 | |||||||||||||
| 210,599 | Sally Malay Mining Ltd | 946,782 | |||||||||||||
See accompanying notes to the financial statements.
3
GMO International Small Companies Fund
(A Series of GMO Trust)
Schedule of Investments — (Continued)
(showing percentage of total net assets)
February 29, 2008
| Shares | Description | Value ($) | |||||||||||||
| Australia — continued | |||||||||||||||
| 95,083 | Seek Ltd | 570,801 | |||||||||||||
| 61,809 | Sims Group Ltd | 1,847,545 | |||||||||||||
| 104,960 | Straits Resources Ltd | 732,172 | |||||||||||||
| 564,516 | Tishman Speyer Office Fund | 762,098 | |||||||||||||
| 66,078 | West Australian Newspapers Holdings Ltd | 693,712 | |||||||||||||
| Total Australia | 51,169,821 | ||||||||||||||
| Austria — 0.7% | |||||||||||||||
| 76,675 | Austrian Airlines * | 598,678 | |||||||||||||
| 16,762 | Flughafen Wien AG | 1,916,645 | |||||||||||||
| 19,232 | Mayr-Melnhof Karton AG (Bearer) | 1,957,108 | |||||||||||||
| Total Austria | 4,472,431 | ||||||||||||||
| Belgium — 2.1% | |||||||||||||||
| 92,159 | AGFA-Gevaert NV | 889,080 | |||||||||||||
| 25,508 | CMB Cie Maritime Belge | 1,894,542 | |||||||||||||
| 4,721 | Cofinimmo SA | 968,261 | |||||||||||||
| 76,191 | Cumerio | 3,469,040 | |||||||||||||
| 54,010 | Euronav SA | 2,091,117 | |||||||||||||
| 9,867 | EVS Broadcast Equipment SA | 1,014,223 | |||||||||||||
| 26,685 | GIMV NV | 1,886,158 | |||||||||||||
| 38,931 | Tessenderlo Chemie | 1,729,392 | |||||||||||||
| Total Belgium | 13,941,813 | ||||||||||||||
| Brazil — 0.3% | |||||||||||||||
| 15,856 | Companhia Saneamento Basico Sao Paulo | 376,921 | |||||||||||||
| 16,500 | Companhia Siderurgica Nacional SA | 615,664 | |||||||||||||
| 7,300 | Duratex SA (Preferred Shares) | 148,927 | |||||||||||||
| 6,000 | Tele Norte Leste Participacoes SA | 226,716 | |||||||||||||
| 6,070 | Unibanco-Uniao de Bancos Brasileiros SA GDR | 823,213 | |||||||||||||
| Total Brazil | 2,191,441 | ||||||||||||||
See accompanying notes to the financial statements.
4
GMO International Small Companies Fund
(A Series of GMO Trust)
Schedule of Investments — (Continued)
(showing percentage of total net assets)
February 29, 2008
| Shares | Description | Value ($) | |||||||||||||
| Canada — 7.3% | |||||||||||||||
| 100,100 | Ace Aviation Holdings Inc Class A * | 2,392,026 | |||||||||||||
| 98,000 | Aecon Group Inc | 1,738,461 | |||||||||||||
| 34,800 | AGF Management Ltd Class B | 830,886 | |||||||||||||
| 55,500 | Baytex Trust | 1,197,120 | |||||||||||||
| 105,300 | Biovail Corp | 1,494,581 | |||||||||||||
| 200,500 | CGI Group Inc * | 2,220,422 | |||||||||||||
| 99,800 | Daylight Resources Trust | 910,545 | |||||||||||||
| 11,900 | Dorel Industries Inc Class B | 349,776 | |||||||||||||
| 8,200 | Empire Co Ltd | 313,920 | |||||||||||||
| 169,200 | Equinox Minerals Ltd * | 971,278 | |||||||||||||
| 104,700 | Gerdau Ameristeel Corp | 1,549,890 | |||||||||||||
| 110,800 | Hudbay Minerals Inc * | 2,116,373 | |||||||||||||
| 23,500 | Industrial Alliance Insurance & Financial Services Inc | 840,437 | |||||||||||||
| 73,200 | Kingsway Financial Services Inc | 970,546 | |||||||||||||
| 50,200 | Laurentian Bank of Canada | 2,049,313 | |||||||||||||
| 41,000 | Linamar Corp | 583,185 | |||||||||||||
| 24,900 | Major Drilling Group International Inc * | 1,442,012 | |||||||||||||
| 80,900 | Mercator Minerals Ltd * | 925,511 | |||||||||||||
| 103,400 | Methanex Corp | 2,988,804 | |||||||||||||
| 163,500 | Neo Materials Technologies Inc * | 694,366 | |||||||||||||
| 229,400 | Northgate Minerals Corp * | 713,197 | |||||||||||||
| 85,000 | Oilexco Inc * | 1,298,857 | |||||||||||||
| �� | 24,500 | Open Text Corp * | 789,327 | ||||||||||||
| 73,900 | Petrobank Energy and Resources Ltd * | 4,352,535 | |||||||||||||
| 115,771 | Quebecor Inc Class B | 3,476,953 | |||||||||||||
| 63,500 | RONA Inc * | 897,419 | |||||||||||||
| 45,000 | Rothmans Inc (a) | 1,173,635 | |||||||||||||
| 87,500 | Russel Metals Inc | 2,271,400 | |||||||||||||
| 82,700 | Saskatchewan Wheat Pool Inc * | 1,076,339 | |||||||||||||
| 13,100 | ShawCor Ltd | 414,728 | |||||||||||||
| 116,500 | Sino Forest Corp * | 2,246,553 | |||||||||||||
| 20,100 | Torstar Corp Class B | 345,330 | |||||||||||||
| 102,900 | Transcontinental Inc | 1,704,110 | |||||||||||||
| 64,900 | Trican Well Service Ltd | 1,134,802 | |||||||||||||
| 67,400 | TriStar Oil & Gas Ltd * | 1,030,602 | |||||||||||||
| Total Canada | 49,505,239 | ||||||||||||||
See accompanying notes to the financial statements.
5
GMO International Small Companies Fund
(A Series of GMO Trust)
Schedule of Investments — (Continued)
(showing percentage of total net assets)
February 29, 2008
| Shares | Description | Value ($) | |||||||||||||
| China — 0.9% | |||||||||||||||
| 174,000 | Aluminum Corp of China Ltd | 337,528 | |||||||||||||
| 66,920 | Angang Steel Co Ltd Class H | 175,064 | |||||||||||||
| 304,000 | China CITIC Bank * | 165,289 | |||||||||||||
| 172,000 | China Cosco Holdings Co Ltd | 500,832 | |||||||||||||
| 594,992 | China Petroleum & Chemical Corp Class H | 650,268 | |||||||||||||
| 110,000 | China Shipping Development Co Ltd Class H | 340,226 | |||||||||||||
| 5,030 | China Telecom Corp Ltd ADR | 369,252 | |||||||||||||
| 604,000 | CNOOC Ltd | 1,003,093 | |||||||||||||
| 104,000 | Cosco Pacific Ltd | 224,316 | |||||||||||||
| 256,000 | Datang International Power Generation Co Ltd | 171,748 | |||||||||||||
| 461,600 | Denway Motors Ltd | 233,324 | |||||||||||||
| 288,000 | Huaneng Power International Inc Class H | 235,321 | |||||||||||||
| 126,000 | Jiangxi Copper Co Ltd Class H | 291,575 | |||||||||||||
| 508,000 | Peace Mark Holdings Ltd | 566,600 | |||||||||||||
| 72,000 | Shanghai Industrial Holdings Ltd | 293,608 | |||||||||||||
| 188,000 | Yanzhou Coal Mining Co Ltd Class H | 306,698 | |||||||||||||
| Total China | 5,864,742 | ||||||||||||||
| Denmark — 0.2% | |||||||||||||||
| 13,300 | D/S Norden | 1,449,610 | |||||||||||||
| Finland — 2.0% | |||||||||||||||
| 93,502 | Amer Sports Oyj Class A | 1,953,006 | |||||||||||||
| 80,707 | Nokian Renkaat Oyj | 3,318,121 | |||||||||||||
| 128,771 | OKO Bank | 2,248,393 | |||||||||||||
| 45,400 | Orion Oyj | 969,940 | |||||||||||||
| 33,186 | Outotec Oyj | 1,832,883 | |||||||||||||
| 24,200 | Rakentajain Konevuokr | 564,638 | |||||||||||||
| 132,843 | Tietoenator Oyj | 2,493,638 | |||||||||||||
| Total Finland | 13,380,619 | ||||||||||||||
See accompanying notes to the financial statements.
6
GMO International Small Companies Fund
(A Series of GMO Trust)
Schedule of Investments — (Continued)
(showing percentage of total net assets)
February 29, 2008
| Shares | Description | Value ($) | |||||||||||||
| France — 5.1% | |||||||||||||||
| 8,945 | Air France | 241,000 | |||||||||||||
| 2,145 | Areva | 2,272,069 | |||||||||||||
| 27,352 | Arkema * | 1,555,605 | |||||||||||||
| 7,903 | BIC SA | 499,697 | |||||||||||||
| 10,306 | bioMerieux | 1,177,663 | |||||||||||||
| 2,728 | Bollore | 556,868 | |||||||||||||
| 4,957 | Casino Guichard-Perrachon SA | 560,672 | |||||||||||||
| 4,044 | Cie Generale de Geophysique * | 986,571 | |||||||||||||
| 10,866 | Ciments Francais | 1,714,996 | |||||||||||||
| 7,370 | Euler Hermes SA | 753,444 | |||||||||||||
| 11,917 | Fonciere des Regions | 1,745,739 | |||||||||||||
| 43,047 | Gemalto NV * | 1,196,703 | |||||||||||||
| 22,275 | Groupe Steria SCA | 664,351 | |||||||||||||
| 16,619 | IMS International Metal Service | 611,626 | |||||||||||||
| 17,839 | Ipsen SA | 1,079,960 | |||||||||||||
| 46,654 | Maurel et Prom | 896,793 | |||||||||||||
| 35,890 | Nexans SA | 3,918,488 | |||||||||||||
| 40,272 | Publicis Groupe | 1,454,336 | |||||||||||||
| 21,960 | Rallye SA | 1,294,303 | |||||||||||||
| 44,131 | Recyclex SA * | 990,350 | |||||||||||||
| 50,590 | SCOR SE | 1,145,297 | |||||||||||||
| 51,415 | UbiSoft Entertainment SA * | 4,321,319 | |||||||||||||
| 32,128 | Valeo SA | 1,215,183 | |||||||||||||
| 3,181 | Vilmorin & Cie | 536,215 | |||||||||||||
| 20,328 | Wendel Investissement | 2,292,660 | |||||||||||||
| 24,706 | Zodiac SA | 1,285,582 | |||||||||||||
| Total France | 34,967,490 | ||||||||||||||
| Germany — 7.1% | |||||||||||||||
| 169,465 | Aixtron AG * | 2,243,320 | |||||||||||||
| 86,329 | Altana AG | 2,010,964 | |||||||||||||
| 54,378 | Arques Industries AG | 1,146,782 | |||||||||||||
| 51,767 | Balda AG * (a) | 463,595 | |||||||||||||
| 18,981 | Bechtle AG | 572,937 | |||||||||||||
See accompanying notes to the financial statements.
7
GMO International Small Companies Fund
(A Series of GMO Trust)
Schedule of Investments — (Continued)
(showing percentage of total net assets)
February 29, 2008
| Shares | Description | Value ($) | |||||||||||||
| Germany — continued | |||||||||||||||
| 30,326 | Comdirect Bank AG | 373,564 | |||||||||||||
| 14,397 | Douglas Holdings AG | 764,009 | |||||||||||||
| 8,405 | ElringKlinger AG | 876,074 | |||||||||||||
| 56,303 | GEA Group AG * | 1,821,605 | |||||||||||||
| 69,377 | Gildemeister AG | 1,616,608 | |||||||||||||
| 118,422 | Hannover Rueckversicherungs AG (Registered) (a) | 5,653,400 | |||||||||||||
| 92,725 | IKB Deutsche Industriebank AG * | 804,700 | |||||||||||||
| 2,309 | K&S AG | 671,860 | |||||||||||||
| 24,695 | Kloeckner & Co AG | 1,142,020 | |||||||||||||
| 11,644 | Krones AG | 900,519 | |||||||||||||
| 23,363 | Leonische Drahtwerke AG | 972,593 | |||||||||||||
| 44,146 | Medion AG * | 1,133,446 | |||||||||||||
| 132,109 | Norddeutsche Affinerie AG (a) | 5,335,833 | |||||||||||||
| 3,017 | Puma AG Rudolf Dassler Sport | 1,073,457 | |||||||||||||
| 6,914 | Q-Cells AG * | 557,366 | |||||||||||||
| 106,871 | Rhoen-Klinikum AG | 3,079,968 | |||||||||||||
| 2,109 | Salzgitter AG | 369,670 | |||||||||||||
| 71,157 | SGL Carbon AG * | 3,949,067 | |||||||||||||
| 13,072 | Solon AG Fuer Solartechnik * | 998,308 | |||||||||||||
| 20,199 | Stada Arzneimittel AG | 1,415,253 | |||||||||||||
| 186,560 | Suedzucker AG | 4,112,867 | |||||||||||||
| 76,772 | TUI AG * | 1,848,249 | |||||||||||||
| 18,270 | Vossloh AG | 2,521,598 | |||||||||||||
| Total Germany | 48,429,632 | ||||||||||||||
| Greece — 1.2% | |||||||||||||||
| 454,502 | Alapis Holding Industrial & Commercial SA * | 1,468,739 | |||||||||||||
| 33,052 | Babis Vovos International * | 1,013,854 | |||||||||||||
| 74,742 | Hellenic Exchanges SA | 1,801,692 | |||||||||||||
| 142,559 | Hellenic Technodomiki Tev SA | 1,746,038 | |||||||||||||
| 40,484 | Intralot SA | 755,402 | |||||||||||||
| 23,694 | Quintana Maritime Ltd | 545,673 | |||||||||||||
| 190,551 | Technical Olympic SA * | 219,886 | |||||||||||||
| 27,086 | Tsakos Energy Navigation Ltd | 886,254 | |||||||||||||
| Total Greece | 8,437,538 | ||||||||||||||
See accompanying notes to the financial statements.
8
GMO International Small Companies Fund
(A Series of GMO Trust)
Schedule of Investments — (Continued)
(showing percentage of total net assets)
February 29, 2008
| Shares | Description | Value ($) | |||||||||||||
| Hong Kong — 1.5% | |||||||||||||||
| 88,000 | Asia Satellite Telecommunications Holdings Ltd | 168,648 | |||||||||||||
| 168,400 | Dah Sing Financial Services | 1,235,824 | |||||||||||||
| 1,128,000 | Far East Consortium International Ltd | 499,310 | |||||||||||||
| 1,199,200 | HKR International Ltd | 921,242 | |||||||||||||
| 46,000 | Kingboard Chemical Holdings Ltd | 204,462 | |||||||||||||
| 1,022,000 | Midland Holdings Ltd | 1,360,872 | |||||||||||||
| 2,570,000 | Pacific Basin Shipping Ltd | 4,258,584 | |||||||||||||
| 68,000 | Ports Design Ltd | 201,038 | |||||||||||||
| 615,000 | Sun Hung Kai & Co Ltd | 594,237 | |||||||||||||
| 210,000 | VTech Holdings Ltd | 1,035,243 | |||||||||||||
| Total Hong Kong | 10,479,460 | ||||||||||||||
| Hungary — 0.2% | |||||||||||||||
| 55,440 | Magyar Telekom Nyrt | 267,563 | |||||||||||||
| 4,200 | MOL Magyar Olaj es Gazipari Nyrt (New Shares) | 572,153 | |||||||||||||
| 1,530 | Richter Gedeon Nyrt | 330,264 | |||||||||||||
| Total Hungary | 1,169,980 | ||||||||||||||
| India — 0.5% | |||||||||||||||
| 108,000 | Ambuja Cement Ltd Sponsored GDR | 326,160 | |||||||||||||
| 5,500 | Bajaj Auto Ltd Sponsored GDR | 305,250 | |||||||||||||
| 6,100 | GAIL India Ltd GDR | 384,300 | |||||||||||||
| 68,700 | Hindalco Industries Ltd GDR 144A | 331,821 | |||||||||||||
| 22,000 | Mahindra & Mahindra Ltd Sponsored GDR | 370,907 | |||||||||||||
| 32,100 | Satyam Computer Services Ltd ADR | 801,858 | |||||||||||||
| 30,700 | Tata Motors Ltd Sponsored ADR | 537,864 | |||||||||||||
| Total India | 3,058,160 | ||||||||||||||
| Indonesia — 0.0% | |||||||||||||||
| 283,500 | Bank Rakyat Indonesia | 220,078 | |||||||||||||
| Ireland — 1.4% | |||||||||||||||
| 199,914 | DCC Plc | 5,029,896 | |||||||||||||
| 1,235,119 | Fyffes Plc | 1,723,963 | |||||||||||||
See accompanying notes to the financial statements.
9
GMO International Small Companies Fund
(A Series of GMO Trust)
Schedule of Investments — (Continued)
(showing percentage of total net assets)
February 29, 2008
| Shares | Description | Value ($) | |||||||||||||
| Ireland — continued | |||||||||||||||
| 123,067 | Grafton Group Plc * | 998,703 | |||||||||||||
| 13,367 | Kerry Group Plc | 419,416 | |||||||||||||
| 1,302,945 | Total Produce Ltd | 1,120,970 | |||||||||||||
| Total Ireland | 9,292,948 | ||||||||||||||
| Israel — 0.2% | |||||||||||||||
| 76,960 | Bank Hapoalim BM | 328,828 | |||||||||||||
| 69,390 | Bank Leumi Le | 318,819 | |||||||||||||
| 11,310 | Check Point Software Technologies Ltd * | 247,915 | |||||||||||||
| 9,140 | Teva Pharmaceutical Industries Ltd Sponsored ADR | 448,500 | |||||||||||||
| Total Israel | 1,344,062 | ||||||||||||||
| Italy — 3.3% | |||||||||||||||
| 75,441 | Azimut Holding SPA | 863,001 | |||||||||||||
| 80,913 | Banca Italease SPA | 781,054 | |||||||||||||
| 142,687 | Benetton Group SPA | 1,889,232 | |||||||||||||
| 1,400,808 | Beni Stabili SPA | 1,575,838 | |||||||||||||
| 177,554 | Bulgari SPA | 1,976,879 | |||||||||||||
| 65,697 | Buzzi Unicem SPA | 1,611,794 | |||||||||||||
| 305,053 | Cementir SPA | 2,679,451 | |||||||||||||
| 86,797 | Danieli and Co SPA (Savings Shares) | 1,820,401 | |||||||||||||
| 86,211 | ERG SPA | 1,661,249 | |||||||||||||
| 78,445 | Indesit Company SPA | 978,740 | |||||||||||||
| 9,208 | Italmobiliare SPA | 830,487 | |||||||||||||
| 35,024 | Italmobiliare SPA-RNC | 2,233,737 | |||||||||||||
| 341,277 | Milano Assicurazioni SPA | 2,236,369 | |||||||||||||
| 32,461 | Pirelli & Co Real Estate SPA | 1,255,829 | |||||||||||||
| Total Italy | 22,394,061 | ||||||||||||||
| Japan — 17.2% | |||||||||||||||
| 108,200 | Aderans Co Ltd | 1,962,986 | |||||||||||||
| 212,100 | Alps Electric Co Ltd | 2,478,439 | |||||||||||||
| 136,400 | AOC Holdings Inc | 1,419,488 | |||||||||||||
| 39,000 | Avex Group Holding Inc (a) | 442,405 | |||||||||||||
See accompanying notes to the financial statements.
10
GMO International Small Companies Fund
(A Series of GMO Trust)
Schedule of Investments — (Continued)
(showing percentage of total net assets)
February 29, 2008
| Shares | Description | Value ($) | |||||||||||||
| Japan — continued | |||||||||||||||
| 317,000 | Calsonic Kansei Corp | 1,306,327 | |||||||||||||
| 30,000 | Capcom | 822,756 | |||||||||||||
| 294,000 | Central Glass Co Ltd | 1,298,111 | |||||||||||||
| 68,000 | Chiba Kogyo Bank Ltd * | 863,241 | |||||||||||||
| 148,800 | Daiei Inc * | 945,600 | |||||||||||||
| 313,000 | Daiichi Chuo Kisen Kaisha | 2,259,537 | |||||||||||||
| 34,000 | Daiichikosho Co Ltd | 335,622 | |||||||||||||
| 594,000 | Daikyo Inc | 1,402,350 | |||||||||||||
| 192,000 | Daio Paper Corp (a) | 1,383,480 | |||||||||||||
| 52,800 | Daiseki Co Ltd | 1,500,095 | |||||||||||||
| 314,000 | Daiwabo Co Ltd | 782,580 | |||||||||||||
| 307 | DeNa Co Ltd | 1,989,249 | |||||||||||||
| 62,200 | Edion Corp | 611,659 | |||||||||||||
| 64,700 | Foster Electric Co Ltd | 1,608,826 | |||||||||||||
| 186,000 | Fujitsu General Ltd * | 664,032 | |||||||||||||
| 42,800 | Futaba Industrial Co Ltd | 1,036,923 | |||||||||||||
| 58,900 | GLORY Ltd | 1,338,494 | |||||||||||||
| 289,000 | Godo Steel | 921,703 | |||||||||||||
| 57,100 | H.I.S. Co Ltd | 955,821 | |||||||||||||
| 24,000 | Hamamatsu Photonics KK | 726,544 | |||||||||||||
| 435,000 | Hanwa Co Ltd | 2,004,894 | |||||||||||||
| 428,400 | Haseko Corp * | 646,136 | |||||||||||||
| 25,200 | Hisamitsu Pharmaceutical Co Inc | 803,590 | |||||||||||||
| 663,000 | Hitachi Zosen Corp * | 667,829 | |||||||||||||
| 129,700 | Hosiden Corp | 2,225,501 | |||||||||||||
| 240,000 | Ishihara Sangyo Kaisha Ltd * | 537,982 | |||||||||||||
| 625,000 | Iwatani International Corp (a) | 1,741,256 | |||||||||||||
| 257,000 | JACCS Co Ltd | 1,080,247 | |||||||||||||
| 53,400 | Joint Corp | 689,286 | |||||||||||||
| 43,000 | Kaga Electronics Co Ltd | 540,562 | |||||||||||||
| 259 | Kakaku.com Inc | 1,469,632 | |||||||||||||
| 150,000 | Kamigumi Co Ltd | 1,131,720 | |||||||||||||
| 58,000 | Kanto Tsukuba Bank Ltd | 308,216 | |||||||||||||
| 252,000 | Kayaba Industry Co | 1,028,130 | |||||||||||||
See accompanying notes to the financial statements.
11
GMO International Small Companies Fund
(A Series of GMO Trust)
Schedule of Investments — (Continued)
(showing percentage of total net assets)
February 29, 2008
| Shares | Description | Value ($) | |||||||||||||
| Japan — continued | |||||||||||||||
| 660 | Kenedix Inc | 872,110 | |||||||||||||
| 131 | Kenedix Realty Investment Corp | 791,157 | |||||||||||||
| 400,000 | Kiyo Holdings Inc | 612,115 | |||||||||||||
| 1,488 | KK DaVinci Advisors * | 1,252,796 | |||||||||||||
| 24,000 | Kobayashi Pharmaceutical Co Ltd | 944,188 | |||||||||||||
| 72,200 | Kohnan Shoji Co Ltd | 853,789 | |||||||||||||
| 90,000 | Koito Manufacturing Co Ltd | 1,179,604 | |||||||||||||
| 85,000 | Kojima Co Ltd (a) | 446,156 | |||||||||||||
| 428,000 | Kurabo Industries Ltd | 903,481 | |||||||||||||
| 292,000 | Kyokuyo Co Ltd | 504,598 | |||||||||||||
| 104,000 | Kyudenko Corp | 523,878 | |||||||||||||
| 365,000 | Maeda Corp (a) | 1,167,438 | |||||||||||||
| 472,525 | Maruha Group Inc | 691,295 | |||||||||||||
| 156,000 | Meiji Dairies Corp | 894,193 | |||||||||||||
| 36,700 | Miraca Holdings Inc | 787,224 | |||||||||||||
| 290,000 | Mitsui Mining Co Ltd * | 1,014,863 | |||||||||||||
| 110 | Mixi Inc * | 1,282,646 | |||||||||||||
| 251,000 | Mizuho Investors Securities | 344,381 | |||||||||||||
| 192,000 | Nagase & Co | 1,956,716 | |||||||||||||
| 128,000 | Nidec Sankyo Corp | 1,047,877 | |||||||||||||
| 59,500 | Nihon Kohden Corp | 1,200,184 | |||||||||||||
| 111,000 | Nikkiso Co Ltd | 725,329 | |||||||||||||
| 191,000 | Nippon Corp | 1,255,996 | |||||||||||||
| 132,000 | Nippon Denko Co Ltd | 1,201,260 | |||||||||||||
| 266,000 | Nippon Flour Mills Co Ltd | 1,079,694 | |||||||||||||
| 722,000 | Nippon Light Metal | 1,114,460 | |||||||||||||
| 84,000 | Nippon Synthetic Chemical Industry Co Ltd | 498,084 | |||||||||||||
| 240,000 | Nippon Yakin Koguo Co Ltd | 2,278,910 | |||||||||||||
| 61,000 | Nipro Corp | 1,167,626 | |||||||||||||
| 460,000 | Nissan Shatai Co Ltd | 3,930,203 | |||||||||||||
| 33,300 | Nissha Printing Co Ltd | 1,403,642 | |||||||||||||
| 36,000 | Nissin Kogyo Co Ltd | 638,213 | |||||||||||||
| 175,000 | Ogaki Kyoritsu Bank Ltd | 963,641 | |||||||||||||
| 260,000 | Okasan Securities Co Ltd | 1,447,996 | |||||||||||||
See accompanying notes to the financial statements.
12
GMO International Small Companies Fund
(A Series of GMO Trust)
Schedule of Investments — (Continued)
(showing percentage of total net assets)
February 29, 2008
| Shares | Description | Value ($) | |||||||||||||
| Japan — continued | |||||||||||||||
| 23,800 | Okinawa Electric Power Co | 947,893 | |||||||||||||
| 197 | Osaka Securities Exchange Co Ltd | 1,013,781 | |||||||||||||
| 102,000 | Pacific Metals Co Ltd | 1,218,686 | |||||||||||||
| 450,000 | Penta Ocean Construction Co Ltd * (a) | 567,167 | |||||||||||||
| 14,880 | Point Inc | 542,824 | |||||||||||||
| 95,100 | Q.P. Corp | 945,678 | |||||||||||||
| 140,000 | Rengo Co Ltd | 756,875 | |||||||||||||
| 603 | Round One Corp | 691,146 | |||||||||||||
| 119,000 | Ryobi Ltd | 497,285 | |||||||||||||
| 23,800 | Ryohin Keikaku Co Ltd | 1,265,171 | |||||||||||||
| 100,600 | Ryosan Co | 2,401,892 | |||||||||||||
| 67,000 | Sanki Engineering | 438,325 | |||||||||||||
| 458,000 | Sankyo-Tateyama Holdings Inc | 584,895 | |||||||||||||
| 147,000 | Sankyu Inc | 701,278 | |||||||||||||
| 21,000 | Sawai Pharmaceuticals Co Ltd | 971,293 | |||||||||||||
| 141,000 | Seino Holdings Co Ltd | 934,549 | |||||||||||||
| 38,100 | Shima Seiki Manufacturing Ltd | 1,624,871 | |||||||||||||
| 34,500 | Shimachu Co | 891,872 | |||||||||||||
| 36,900 | Shinko Plantech Co Ltd | 491,039 | |||||||||||||
| 202,000 | Shinwa Kaiun Kaisha Ltd | 1,323,136 | |||||||||||||
| 41,000 | Showa Corp | 361,728 | |||||||||||||
| 100,000 | SMK Corp | 588,580 | |||||||||||||
| 39,900 | Sugi Pharmacy Co Ltd | 1,073,080 | |||||||||||||
| 543,000 | Sumitomo Light Metal Industry | 733,356 | |||||||||||||
| 161,000 | Taihei Kogyo Co Ltd | 643,201 | |||||||||||||
| 398,000 | TOA Corp * | 322,269 | |||||||||||||
| 291,000 | Toho Gas Co Ltd | 1,528,808 | |||||||||||||
| 117,800 | Tokyo Steel Manufacturing Co | 1,408,227 | |||||||||||||
| 448,000 | Topy Industries Ltd | 1,209,119 | |||||||||||||
| 79,000 | Toshiba Plant Systems & Services Corp | 691,968 | |||||||||||||
| 155,000 | Towa Real Eatate Development (a) | 214,989 | |||||||||||||
| 75,000 | Toyo Suisan Kaisha Ltd | 1,222,470 | |||||||||||||
| 463,000 | Toyo Tire & Rubber Co Ltd | 1,276,847 | |||||||||||||
| 43,000 | Tsumura & Co | 886,659 | |||||||||||||
See accompanying notes to the financial statements.
13
GMO International Small Companies Fund
(A Series of GMO Trust)
Schedule of Investments — (Continued)
(showing percentage of total net assets)
February 29, 2008
| Shares | Description | Value ($) | |||||||||||||
| Japan — continued | |||||||||||||||
| 118,000 | Uchida Yoko Co Ltd | 500,577 | |||||||||||||
| 131,000 | Uniden Corp | 814,065 | |||||||||||||
| 18,000 | Union Tool Co | 641,770 | |||||||||||||
| 70 | United Urban Investment Corp | 446,178 | |||||||||||||
| 383,000 | Unitika Ltd | 379,029 | |||||||||||||
| 411,000 | Yokohama Rubber Co | 2,114,737 | |||||||||||||
| Total Japan | 116,774,305 | ||||||||||||||
| Malaysia — 0.4% | |||||||||||||||
| 181,000 | Genting Berhad | 382,879 | |||||||||||||
| 210,385 | IOI Corp Berhad | 523,272 | |||||||||||||
| 79,500 | MISC Berhad | 222,214 | |||||||||||||
| 53,400 | Public Bank Berhad | 174,449 | |||||||||||||
| 283,000 | Resorts World Berhad | 327,313 | |||||||||||||
| 150,471 | Sime Darby Berhad * | 546,396 | |||||||||||||
| 41,222 | Tanjong Plc | 204,796 | |||||||||||||
| 79,600 | Telekom Malaysia Berhad | 281,013 | |||||||||||||
| Total Malaysia | 2,662,332 | ||||||||||||||
| Netherlands — 3.9% | |||||||||||||||
| 106,804 | Boskalis Westminster | 5,897,017 | |||||||||||||
| 47,300 | Chicago Bridge & Iron Co NV (NY Shares) | 2,200,396 | |||||||||||||
| 70,649 | CSM | 2,178,772 | |||||||||||||
| 17,073 | Fugro NV | 1,288,040 | |||||||||||||
| 27,549 | Hunter Douglas NV | 1,599,657 | |||||||||||||
| 35,735 | Koninklijke Wessanen NV | 478,196 | |||||||||||||
| 114,136 | OCE NV | 2,116,717 | |||||||||||||
| 103,963 | Qiagen NV * | 2,304,907 | |||||||||||||
| 15,003 | Smit International NV | 1,394,984 | |||||||||||||
| 55,870 | SNS Reaal | 1,177,119 | |||||||||||||
| 49,975 | Tele Atlas NV * | 2,121,654 | |||||||||||||
| 6,928 | TomTom NV * | 324,667 | |||||||||||||
| 9,625 | Vastned NV | 983,452 | |||||||||||||
| 18,456 | Wereldhave NV | 2,230,924 | |||||||||||||
| Total Netherlands | 26,296,502 | ||||||||||||||
See accompanying notes to the financial statements.
14
GMO International Small Companies Fund
(A Series of GMO Trust)
Schedule of Investments — (Continued)
(showing percentage of total net assets)
February 29, 2008
| Shares | Description | Value ($) | |||||||||||||
| New Zealand — 0.1% | |||||||||||||||
| 351,616 | Fisher & Paykel Healthcare Corp Ltd | 738,091 | |||||||||||||
| Norway — 0.4% | |||||||||||||||
| 20,200 | Frontline Ltd | 921,331 | |||||||||||||
| 294,500 | Golden Ocean Group Ltd | 1,650,552 | |||||||||||||
| Total Norway | 2,571,883 | ||||||||||||||
| Philippines — 0.1% | |||||||||||||||
| 18,600 | Ayala Corp | 195,905 | |||||||||||||
| 4,582 | Philippine Long Distance Telephone Co | 323,299 | |||||||||||||
| Total Philippines | 519,204 | ||||||||||||||
| Poland — 0.1% | |||||||||||||||
| 4,620 | KGHM Polska Miedz SA | 213,789 | |||||||||||||
| 17,370 | Polski Koncern Naftowy Orlen SA * | 294,661 | |||||||||||||
| Total Poland | 508,450 | ||||||||||||||
| Portugal — 0.4% | |||||||||||||||
| 118,287 | Banif SGPS SA (Registered Shares) | 525,623 | |||||||||||||
| 212,460 | Jeronimo Martins SGPS SA | 1,564,091 | |||||||||||||
| 140,175 | Redes Energeticas Nacionais SA * | 727,182 | |||||||||||||
| Total Portugal | 2,816,896 | ||||||||||||||
| Russia — 0.6% | |||||||||||||||
| 27,500 | Comstar United Telesystems OJSC GDR | 272,250 | |||||||||||||
| 5,590 | CTC Media Inc * | 164,122 | |||||||||||||
| 17,900 | Gazpromneft Sponsored ADR | 563,850 | |||||||||||||
| 11,650 | Mobile Telesystems Sponsored ADR | 955,999 | |||||||||||||
| 4,400 | OAO Tatneft Sponsored GDR (Registered Shares) | 552,200 | |||||||||||||
| 6,240 | Rostelecom ADR | 426,504 | |||||||||||||
| 9,800 | Surgutneftegaz Sponsored ADR | 450,800 | |||||||||||||
| 18,300 | Vimpel-Communications Sponsored ADR | 635,559 | |||||||||||||
| 2,390 | Wimm-Bill-Dann Foods ADR | 251,571 | |||||||||||||
| Total Russia | 4,272,855 | ||||||||||||||
See accompanying notes to the financial statements.
15
GMO International Small Companies Fund
(A Series of GMO Trust)
Schedule of Investments — (Continued)
(showing percentage of total net assets)
February 29, 2008
| Shares | Description | Value ($) | |||||||||||||
| Singapore — 2.8% | |||||||||||||||
| 665,000 | Allgreen Properties Ltd | 597,637 | |||||||||||||
| 296,000 | Ezra Holdings Ltd | 491,565 | |||||||||||||
| 380,000 | Indofood Agri Resources Ltd * | 696,362 | |||||||||||||
| 480,000 | Kim Eng Holdings Ltd | 751,262 | |||||||||||||
| 453,000 | KS Energy Services Ltd | 743,980 | |||||||||||||
| 386,000 | MobileOne Ltd | 551,978 | |||||||||||||
| 1,101,100 | Pacific Century Region Developments Ltd * | 225,525 | |||||||||||||
| 656,000 | Raffles Education Corp Ltd | 1,228,336 | |||||||||||||
| 424,000 | Singapore Airport Terminal Services Ltd | 711,672 | |||||||||||||
| 914,000 | Singapore Petroleum Co | 4,467,454 | |||||||||||||
| 1,381,000 | Singapore Post Ltd | 1,095,474 | |||||||||||||
| 349,000 | Sino-Environment Technology Group Ltd * | 310,445 | |||||||||||||
| 764,000 | Straits Asia Resources Ltd | 2,088,964 | |||||||||||||
| 325,000 | Tat Hong Holdings Ltd | 499,767 | |||||||||||||
| 584,000 | United Overseas Land | 1,596,507 | |||||||||||||
| 156,000 | Venture Corp Ltd | 1,124,790 | |||||||||||||
| 505,000 | Wheelock Properties Ltd | 675,337 | |||||||||||||
| 544,000 | Wing Tai Holdings Ltd | 820,738 | |||||||||||||
| Total Singapore | 18,677,793 | ||||||||||||||
| South Africa — 0.2% | |||||||||||||||
| 56,200 | African Bank Investments Ltd | 221,399 | |||||||||||||
| 12,600 | ArcelorMittal South Africa Ltd | 298,804 | |||||||||||||
| 10,900 | Barloworld Ltd | 131,250 | |||||||||||||
| 10,900 | Freeworld Coatings Ltd * | 13,626 | |||||||||||||
| 20,600 | Naspers Ltd Class N | 389,888 | |||||||||||||
| 145,950 | Sanlam Ltd | 346,847 | |||||||||||||
| 11,000 | Tiger Brands Ltd | 195,792 | |||||||||||||
| Total South Africa | 1,597,606 | ||||||||||||||
| South Korea — 1.7% | |||||||||||||||
| 14,130 | Daegu Bank | 193,273 | |||||||||||||
| 2,310 | Daelim Industrial Co Ltd | 359,454 | |||||||||||||
| 10,185 | Daewoo Engineering & Construction Co Ltd | 218,012 | |||||||||||||
See accompanying notes to the financial statements.
16
GMO International Small Companies Fund
(A Series of GMO Trust)
Schedule of Investments — (Continued)
(showing percentage of total net assets)
February 29, 2008
| Shares | Description | Value ($) | |||||||||||||
| South Korea — continued | |||||||||||||||
| 10,704 | Hana Financial Group Inc | 474,968 | |||||||||||||
| 10,340 | Hynix Semiconductor Inc * | 265,897 | |||||||||||||
| 3,741 | Hyundai Development Co | 266,777 | |||||||||||||
| 5,440 | Hyundai Mobis | 417,569 | |||||||||||||
| 12,020 | Hyundai Motor Co | 842,808 | |||||||||||||
| 4,650 | Hyundai Steel Co | 359,763 | |||||||||||||
| 16,710 | Industrial Bank of Korea | 269,411 | |||||||||||||
| 10,400 | Kookmin Bank | 640,948 | |||||||||||||
| 12,540 | Korea Exchange Bank | 175,358 | |||||||||||||
| 4,030 | Korean Air Lines Co Ltd | 304,484 | |||||||||||||
| 9,210 | KT Corp ADR * | 223,711 | |||||||||||||
| 8,590 | KT&G Corp | 708,730 | |||||||||||||
| 3,933 | LG Chemicals Ltd | 328,723 | |||||||||||||
| 5,530 | LG Corp | 384,621 | |||||||||||||
| 5,570 | LG Electronics Inc | 599,909 | |||||||||||||
| 2,910 | POSCO | 1,600,567 | |||||||||||||
| 14,990 | Pusan Bank | 198,364 | |||||||||||||
| 21,910 | Shinhan Financial Group Co Ltd | 1,180,266 | |||||||||||||
| 1,020 | SK Corp | 181,275 | |||||||||||||
| 4,439 | SK Energy Co Ltd | 602,697 | |||||||||||||
| 23,730 | SK Telecom Co Ltd ADR | 531,552 | |||||||||||||
| 2,890 | S-Oil Corp | 204,199 | |||||||||||||
| 15,800 | Woori Finance Holdings Co Ltd | 282,938 | |||||||||||||
| Total South Korea | 11,816,274 | ||||||||||||||
| Spain — 0.4% | |||||||||||||||
| 25,568 | Bolsas y Mercados Espanoles | 1,278,857 | |||||||||||||
| 25,836 | Corp Financiera Alba | 1,569,501 | |||||||||||||
| Total Spain | 2,848,358 | ||||||||||||||
| Sweden — 3.8% | |||||||||||||||
| 47,250 | Axfood AB | 1,644,730 | |||||||||||||
| 79,500 | Boliden AB | 909,111 | |||||||||||||
| 83,100 | D Carnegie AB | 1,426,913 | |||||||||||||
See accompanying notes to the financial statements.
17
GMO International Small Companies Fund
(A Series of GMO Trust)
Schedule of Investments — (Continued)
(showing percentage of total net assets)
February 29, 2008
| Shares | Description | Value ($) | |||||||||||||
| Sweden — continued | |||||||||||||||
| 102,700 | Electrolux AB Series B | 1,647,834 | |||||||||||||
| 100,255 | Getinge AB | 2,549,953 | |||||||||||||
| 108,900 | Hexagon AB | 2,226,238 | |||||||||||||
| 246,617 | Kinnevik Investment AB Class B | 4,736,653 | |||||||||||||
| 138,100 | Kungsleden AB | 1,636,604 | |||||||||||||
| 95,900 | NCC Class B | 2,520,227 | |||||||||||||
| 33,600 | Ratos AB Series B | 1,055,291 | |||||||||||||
| 195,000 | Securitas Direct AB Class B * | 832,215 | |||||||||||||
| 107,000 | Trelleborg AB Class B | 1,915,297 | |||||||||||||
| 36,175 | Vostok Gas Ltd * | 2,653,501 | |||||||||||||
| Total Sweden | 25,754,567 | ||||||||||||||
| Switzerland — 3.4% | |||||||||||||||
| 31,650 | Actelion Ltd * | 1,649,808 | |||||||||||||
| 11,736 | Baloise Holding Ltd | 1,058,454 | |||||||||||||
| 3,195 | Banque Cantonale Vaudoise | 1,650,372 | |||||||||||||
| 11,014 | Bucher Industries AG | 2,794,053 | |||||||||||||
| 2,486 | Burckhardt Compression Holding AG | 710,563 | |||||||||||||
| 9,455 | Charles Voegele Holding AG * | 842,560 | |||||||||||||
| 55,490 | Ciba Specialty Chemical Holding Reg | 2,219,627 | |||||||||||||
| 170,810 | Clariant AG * | 1,462,294 | |||||||||||||
| 1,572 | Fischer (George) AG (Registered) * | 784,315 | |||||||||||||
| 1,727 | Forbo Holdings AG (Registered) * | 865,311 | |||||||||||||
| 6,679 | Galenica AG | 2,566,115 | |||||||||||||
| 4,578 | Helvetia Patria Holding (Registered) | 1,740,259 | |||||||||||||
| 210 | Hiestand Holding AG (Registered) | 361,977 | |||||||||||||
| 7,914 | Logitech International * | 202,599 | |||||||||||||
| 5,975 | Panalpina Welttransport Holding AG | 1,002,564 | |||||||||||||
| 14,758 | PSP Swiss Property AG (Registered) * | 904,275 | |||||||||||||
| 15,885 | Swiss Steel AG (Registered) | 1,371,913 | |||||||||||||
| 11,672 | Temenos Group AG * | 292,134 | |||||||||||||
| 4,223 | Verwaltungs & Private Bank | 800,218 | |||||||||||||
| Total Switzerland | 23,279,411 | ||||||||||||||
See accompanying notes to the financial statements.
18
GMO International Small Companies Fund
(A Series of GMO Trust)
Schedule of Investments — (Continued)
(showing percentage of total net assets)
February 29, 2008
| Shares | Description | Value ($) | |||||||||||||
| Taiwan — 1.5% | |||||||||||||||
| 158,000 | Acer Inc | 286,662 | |||||||||||||
| 365,621 | Advanced Semiconductor Engineering Inc | 335,202 | |||||||||||||
| 189,408 | Asustek Computer Inc | 522,908 | |||||||||||||
| 294,256 | AU Optronics Corp | 561,260 | |||||||||||||
| 102,000 | Chi Mei Optoelectronics Corp | 134,162 | |||||||||||||
| 603,165 | China Steel Corp | 891,166 | |||||||||||||
| 389,000 | Chinatrust Financial Holding Co Ltd * | 347,770 | |||||||||||||
| 339,660 | Chunghwa Telecom Co Ltd | 844,506 | |||||||||||||
| 319,859 | Compal Electronics Inc | 288,283 | |||||||||||||
| 85,896 | Far Eastern Textile Co Ltd | 139,945 | |||||||||||||
| 202,000 | Far Eastone Telecommunications Co Ltd | 282,071 | |||||||||||||
| 216,995 | Formosa Chemicals & Fibre Co | 527,334 | |||||||||||||
| 237,939 | Formosa Plastics Corp | 641,409 | |||||||||||||
| 449,000 | Fubon Financial Holding Co Ltd | 488,655 | |||||||||||||
| 49,435 | High Tech Computer Corp | 1,020,522 | |||||||||||||
| 135,200 | Hon Hai Precision Industry Co Ltd | 806,619 | |||||||||||||
| 45,340 | MediaTek Inc | 508,511 | |||||||||||||
| 186,000 | Mega Financial Holdings Co Ltd | 132,817 | |||||||||||||
| 192,060 | Nan Ya Plastics Corp | 452,311 | |||||||||||||
| 251,395 | Quanta Computer Inc | 329,566 | |||||||||||||
| 171,760 | Siliconware Precision Industries Co | 279,901 | |||||||||||||
| 186,970 | Taiwan Mobile Co Ltd | 316,753 | |||||||||||||
| 541,761 | United Microelectronics Corp | 321,569 | |||||||||||||
| Total Taiwan | 10,459,902 | ||||||||||||||
| Thailand — 0.7% | |||||||||||||||
| 35,810 | Advanced Info Service Pcl (Foreign Registered) (b) | 117,929 | |||||||||||||
| 90,580 | Bangkok Bank Pcl NVDR (b) | 369,833 | |||||||||||||
| 168,000 | Bangkok Dusit Medical Service Pcl (Foreign Registered) (b) | 177,608 | |||||||||||||
| 19,810 | Banpu Pcl (Foreign Registered) (b) | 296,806 | |||||||||||||
| 1,326,100 | IRPC Pcl (Foreign Registered) (b) | 249,661 | |||||||||||||
| 245,410 | Kasikornbank Pcl NVDR (b) | 676,414 | |||||||||||||
| 130,680 | PTT Exploration & Production Pcl (Foreign Registered) (b) | 657,764 | |||||||||||||
| 110,450 | PTT Pcl (Foreign Registered) (b) | 1,181,180 | |||||||||||||
See accompanying notes to the financial statements.
19
GMO International Small Companies Fund
(A Series of GMO Trust)
Schedule of Investments — (Continued)
(showing percentage of total net assets)
February 29, 2008
| Shares | Description | Value ($) | |||||||||||||
| Thailand — continued | |||||||||||||||
| 36,450 | Siam Cement Pcl NVDR (b) | 247,730 | |||||||||||||
| 202,380 | Siam Commercial Bank Pcl (Foreign Registered) (b) | 554,702 | |||||||||||||
| 151,250 | Thai Oil Pcl (Foreign Registered) (b) | 374,002 | |||||||||||||
| Total Thailand | 4,903,629 | ||||||||||||||
| Turkey — 0.4% | |||||||||||||||
| 12,170 | Anadolu Efes Biracillik ve Malt Sanayii AS | 134,166 | |||||||||||||
| 15,800 | Dogan Sirketler Grubu Holdings AS * | 19,879 | |||||||||||||
| 53,030 | Eregli Demir ve Celik Fabrikalari TAS | 372,883 | |||||||||||||
| 58,960 | Haci Omer Sabanci Holding AS | 265,182 | |||||||||||||
| 43,900 | KOC Holding AS * | 165,334 | |||||||||||||
| 21,940 | Tupras-Turkiye Petrol Rafineriler AS | 556,246 | |||||||||||||
| 86,630 | Turkiye Garanti Bankasi | 513,761 | |||||||||||||
| 34,210 | Turkiye Halk Bankasi AS * | 216,475 | |||||||||||||
| 90,470 | Turkiye Vakiflar Bankasi TAO Class D | 211,494 | |||||||||||||
| Total Turkey | 2,455,420 | ||||||||||||||
| United Kingdom — 14.0% | |||||||||||||||
| 49,647 | Admiral Group Plc | 992,913 | |||||||||||||
| 266,219 | Aggreko Plc | 3,089,992 | |||||||||||||
| 31,198 | AMEC Plc | 475,906 | |||||||||||||
| 297,219 | Amlin Plc | 1,624,592 | |||||||||||||
| 85,357 | Arriva Plc | 1,149,268 | |||||||||||||
| 90,257 | Autonomy Corp Plc * | 1,678,886 | |||||||||||||
| 38,674 | Aveva Group Plc | 754,432 | |||||||||||||
| 68,910 | Babcock International Group | 771,916 | |||||||||||||
| 85,482 | Barratt Developments Plc | 691,590 | |||||||||||||
| 421,780 | BBA Aviation Plc | 1,534,641 | |||||||||||||
| 208,756 | Beazley Group Plc | 666,349 | |||||||||||||
| 47,283 | Bellway Plc | 744,226 | |||||||||||||
| 43,329 | Berkeley Group Holdings Plc * | 891,413 | |||||||||||||
| 228,368 | Bradford & Bingley Plc | 1,005,573 | |||||||||||||
| 316,345 | Brit Insurance Holdings Plc | 1,453,559 | |||||||||||||
| 73,691 | British Energy Group Plc | 820,932 | |||||||||||||
See accompanying notes to the financial statements.
20
GMO International Small Companies Fund
(A Series of GMO Trust)
Schedule of Investments — (Continued)
(showing percentage of total net assets)
February 29, 2008
| Shares | Description | Value ($) | |||||||||||||
| United Kingdom — continued | |||||||||||||||
| 111,435 | Britvic Plc | 732,746 | |||||||||||||
| 20,493 | Bunzl Plc | 281,636 | |||||||||||||
| 32,872 | Cairn Energy Plc * | 1,763,640 | |||||||||||||
| 69,421 | Close Brothers Group Plc | 901,623 | |||||||||||||
| 110,113 | Dairy Crest Group Plc | 1,149,466 | |||||||||||||
| 50,167 | Dana Petroleum Plc (Ordinary Shares) * | 1,320,578 | |||||||||||||
| 91,633 | De La Rue Plc | 1,639,279 | |||||||||||||
| 3,137,460 | Dimension Data Holdings Plc | 3,190,086 | |||||||||||||
| 346,512 | Drax Group Plc | 3,973,683 | |||||||||||||
| 302,289 | Electrocomponents Plc | 1,052,062 | |||||||||||||
| 576,814 | Game Group Plc | 2,125,321 | |||||||||||||
| 55,770 | Greene King Plc | 717,479 | |||||||||||||
| 654,118 | HMV Group Plc | 1,635,495 | |||||||||||||
| 183,075 | Inchcape Plc | 1,414,628 | |||||||||||||
| 294,848 | Inmarsat Plc | 2,879,706 | |||||||||||||
| 231,277 | Johnston Press Plc | 880,653 | |||||||||||||
| 179,311 | Kesa Electricals Plc | 757,529 | |||||||||||||
| 108,357 | Ladbrokes Plc | 650,669 | |||||||||||||
| 328,338 | LG Group Holdings Plc | 2,267,565 | |||||||||||||
| 101,471 | Luminar Group Holdings Plc | 705,335 | |||||||||||||
| 140,118 | Micro Focus International Plc | 556,704 | |||||||||||||
| 251,860 | Misys Plc | 741,729 | |||||||||||||
| 62,090 | National Express Group Plc | 1,389,065 | |||||||||||||
| 1,456,273 | Northern Foods Plc | 2,598,531 | |||||||||||||
| 1,749,000 | PartyGaming Plc * | 906,719 | |||||||||||||
| 173,232 | Pennon Group Plc | 2,193,374 | |||||||||||||
| 208,088 | Petrofac Ltd | 2,268,606 | |||||||||||||
| 92,959 | Provident Financial Plc | 1,472,745 | |||||||||||||
| 23,426 | Randgold Resources Ltd | 1,206,820 | |||||||||||||
| 38,882 | Rotork Plc | 761,997 | |||||||||||||
| 150,760 | RPS Group Plc | 884,114 | |||||||||||||
| 3,234,401 | Signet Group Plc | 3,899,210 | |||||||||||||
| 409,980 | Smith (David S.) Holdings Plc | 1,283,808 | |||||||||||||
| 450,381 | Smith News Plc | 901,284 | |||||||||||||
See accompanying notes to the financial statements.
21
GMO International Small Companies Fund
(A Series of GMO Trust)
Schedule of Investments — (Continued)
(showing percentage of total net assets)
February 29, 2008
| Shares | Description | Value ($) | |||||||||||||
| United Kingdom — continued | |||||||||||||||
| 39,813 | Soco International PLC * | 1,530,383 | |||||||||||||
| 115,509 | SSL International Plc | 1,115,271 | |||||||||||||
| 302,193 | Stagecoach Group Plc | 1,498,840 | |||||||||||||
| 208,541 | Taylor Woodrow Plc | 705,650 | |||||||||||||
| 207,572 | TDG Plc | 1,015,384 | |||||||||||||
| 636,816 | Tomkins Plc | 2,135,085 | |||||||||||||
| 131,062 | Travis Perkins Plc | 2,801,801 | |||||||||||||
| 593,886 | Trinity Mirror Plc | 3,337,152 | |||||||||||||
| 47,460 | Tullow Oil Plc | 588,334 | |||||||||||||
| 79,696 | VT Group Plc | 1,047,092 | |||||||||||||
| 186,654 | Weir Group Plc (The) | 2,855,637 | |||||||||||||
| 222,603 | WH Smith Plc | 1,646,372 | |||||||||||||
| 172,621 | William Hill Plc | 1,283,908 | |||||||||||||
| 455,219 | Wood Group (John) Plc | 3,719,752 | |||||||||||||
| 3,073,669 | Woolworths Group Plc | 654,117 | |||||||||||||
| Total United Kingdom | 95,384,851 | ||||||||||||||
| TOTAL COMMON STOCKS (COST $632,620,478) | 636,107,454 | ||||||||||||||
| PREFERRED STOCKS — 2.5% | |||||||||||||||
| Brazil — 1.6% | |||||||||||||||
| 66,100 | Aracruz SA Class B (Registered) 5.55% | 478,034 | |||||||||||||
| 38,206 | Banco Bradesco SA 0.32% | 1,192,878 | |||||||||||||
| 44,520 | Banco Itau Holding Financeira SA 2.81% | 1,121,490 | |||||||||||||
| 25,000 | Bradespar SA 0.28% | 650,464 | |||||||||||||
| 22,483 | Brasil Telecom Participacoes SA 4.46% | 313,759 | |||||||||||||
| 18,600 | Brasil Telecom SA 3.98% | 206,557 | |||||||||||||
| 35,617 | Companhia Energetica de Minas Gerais 2.29% | 678,178 | |||||||||||||
| 16,388 | Companhia Paranaense de Energia Class B 2.20% | 266,592 | |||||||||||||
| 72,700 | Companhia Vale do Rio Doce Class A 0.05% | 2,143,470 | |||||||||||||
| 14,700 | Gerdau Metalurgica SA 2.65% | 647,596 | |||||||||||||
| 20,800 | Gerdau SA 2.11% | 679,681 | |||||||||||||
| 102,822 | Itausa-Investimentos Itau SA 0.11% | 653,620 | |||||||||||||
See accompanying notes to the financial statements.
22
GMO International Small Companies Fund
(A Series of GMO Trust)
Schedule of Investments — (Continued)
(showing percentage of total net assets)
February 29, 2008
| Shares | Description | Value ($) | |||||||||||||
| Brazil — continued | |||||||||||||||
| 55,900 | Sadia SA 3.09% | 316,010 | |||||||||||||
| 9,370 | Tele Norte Leste Participacoes ADR 3.52% | 234,531 | |||||||||||||
| 19,400 | Tele Norte Leste Participacoes SA 0.19% | 484,226 | |||||||||||||
| 6,800 | Telemar Norte Leste SA Class A 3.67% | 365,916 | |||||||||||||
| Total Brazil | 10,433,002 | ||||||||||||||
| Germany — 0.4% | |||||||||||||||
| 14,778 | Draegerwerk AG 1.47% | 834,556 | |||||||||||||
| 34,859 | Hugo Boss AG 3.05% | 2,069,933 | |||||||||||||
| Total Germany | 2,904,489 | ||||||||||||||
| Italy — 0.5% | |||||||||||||||
| 111,880 | IFI Istituto Finanziario Industries * | 3,161,124 | |||||||||||||
| Russia — 0.0% | |||||||||||||||
| 330,840 | Surgutneftegaz 5.78% | 172,037 | |||||||||||||
| 1,360 | Surgutneftegaz Sponsored ADR 5.92% | 65,960 | |||||||||||||
| Total Russia | 237,997 | ||||||||||||||
| South Korea — 0.0% | |||||||||||||||
| 6,240 | Hyundai Motor Co 4.03% | 179,690 | |||||||||||||
| TOTAL PREFERRED STOCKS (COST $9,467,483) | 16,916,302 | ||||||||||||||
| RIGHTS AND WARRANTS — 0.0% | |||||||||||||||
| Brazil — 0.0% | |||||||||||||||
| 617 | Banco Bradesco SA Rights, Expires 02/22/08 * (c) | 1,624 | |||||||||||||
| Sweden — 0.0% | |||||||||||||||
| 100,255 | Getinge AB Rights, Expires 03/14/08 * | 38,615 | |||||||||||||
| TOTAL RIGHTS AND WARRANTS (COST $23,628) | 40,239 | ||||||||||||||
See accompanying notes to the financial statements.
23
GMO International Small Companies Fund
(A Series of GMO Trust)
Schedule of Investments — (Continued)
(showing percentage of total net assets)
February 29, 2008
| Par Value ($) / Shares | Description | Value ($) | |||||||||||||
| SHORT-TERM INVESTMENTS — 4.7% | |||||||||||||||
| 15,400,000 | Bank of America Time Deposit, 3.05%, due 03/03/08 | 15,400,000 | |||||||||||||
| 16,390,450 | Bank of New York Mellon Institutional Cash Reserves Fund (d) | 16,390,450 | |||||||||||||
| TOTAL SHORT-TERM INVESTMENTS (COST $31,790,450) | 31,790,450 | ||||||||||||||
| TOTAL INVESTMENTS — 100.8% (Cost $673,902,039) | 684,854,445 | ||||||||||||||
| Other Assets and Liabilities (net) — (0.8%) | (5,318,827 | ) | |||||||||||||
| TOTAL NET ASSETS — 100.0% | $ | 679,535,618 | |||||||||||||
See accompanying notes to the financial statements.
24
GMO International Small Companies Fund
(A Series of GMO Trust)
Schedule of Investments — (Continued)
February 29, 2008
A summary of outstanding financial instruments at February 29, 2008 is as follows:
Forward Currency Contracts
| Settlement Date | Deliver/Receive | Units of Currency | Value | Net Unrealized Appreciation (Depreciation) | |||||||||||||||
| Buys | |||||||||||||||||||
| 5/23/08 | CAD | 5,864,480 | $ | 5,948,789 | $ | 181,148 | |||||||||||||
| 5/23/08 | CAD | 5,864,480 | 5,948,789 | 181,488 | |||||||||||||||
| 5/23/08 | CAD | 6,042,191 | 6,129,055 | 163,657 | |||||||||||||||
| 5/23/08 | CHF | 7,105,000 | 6,824,862 | 354,713 | |||||||||||||||
| 5/23/08 | CHF | 12,623,871 | 12,126,134 | 580,086 | |||||||||||||||
| 5/23/08 | CHF | 12,252,580 | 11,769,482 | 541,871 | |||||||||||||||
| 5/23/08 | CHF | 12,252,580 | 11,769,482 | 546,190 | |||||||||||||||
| 5/23/08 | GBP | 1,331,000 | 2,629,351 | 33,089 | |||||||||||||||
| 5/23/08 | JPY | 724,197,438 | 7,003,591 | 245,849 | |||||||||||||||
| 5/23/08 | JPY | 702,897,513 | 6,797,603 | 233,295 | |||||||||||||||
| 5/23/08 | JPY | 702,897,513 | 6,797,603 | 218,445 | |||||||||||||||
| 5/23/08 | NZD | 5,643,251 | 4,452,854 | 2,812 | |||||||||||||||
| 5/23/08 | NZD | 5,643,251 | 4,452,854 | 3,546 | |||||||||||||||
| 5/23/08 | NZD | 5,814,259 | 4,587,790 | 2,839 | |||||||||||||||
| 5/23/08 | SEK | 19,569,025 | 3,161,721 | 77,751 | |||||||||||||||
| 5/23/08 | SEK | 19,569,025 | 3,161,721 | 76,104 | |||||||||||||||
| 5/23/08 | SEK | 20,162,026 | 3,257,531 | 77,720 | |||||||||||||||
| 5/23/08 | SGD | 6,241,267 | 4,489,447 | 47,580 | |||||||||||||||
| 5/23/08 | SGD | 6,430,396 | 4,625,491 | 55,849 | |||||||||||||||
| 5/23/08 | SGD | 6,241,267 | 4,489,447 | 48,930 | |||||||||||||||
| $ | 120,423,597 | $ | 3,672,962 | ||||||||||||||||
| Sales | |||||||||||||||||||
| 5/23/08 | AUD | 15,649,684 | $ | 14,422,175 | $ | (179,867 | ) | ||||||||||||
| 5/23/08 | AUD | 15,189,399 | 13,997,993 | (168,197 | ) | ||||||||||||||
| 5/23/08 | AUD | 15,189,399 | 13,997,993 | (182,779 | ) | ||||||||||||||
| 5/23/08 | CAD | 2,479,000 | 2,514,639 | (71,810 | ) | ||||||||||||||
| 5/23/08 | DKK | 5,215,600 | 1,059,564 | (32,022 | ) | ||||||||||||||
| 5/23/08 | GBP | 5,645,030 | 11,151,588 | (198,987 | ) | ||||||||||||||
| 5/23/08 | GBP | 5,478,999 | 10,823,598 | (197,206 | ) | ||||||||||||||
| 5/23/08 | GBP | 5,478,999 | 10,823,598 | (203,600 | ) | ||||||||||||||
See accompanying notes to the financial statements.
25
GMO International Small Companies Fund
(A Series of GMO Trust)
Schedule of Investments — (Continued)
February 29, 2008
Forward Currency Contracts — continued
| Settlement Date | Deliver/Receive | Units of Currency | Value | Net Unrealized Appreciation (Depreciation) | |||||||||||||||
| 5/23/08 | HKD | 19,756,479 | $ | 2,542,589 | $ | (5,023 | ) | ||||||||||||
| 5/23/08 | HKD | 19,756,479 | 2,542,589 | (4,957 | ) | ||||||||||||||
| 5/23/08 | HKD | 20,355,160 | 2,619,638 | (5,175 | ) | ||||||||||||||
| 5/23/08 | JPY | 230,619,000 | 2,230,277 | (74,254 | ) | ||||||||||||||
| 5/23/08 | JPY | 232,047,000 | 2,244,087 | (69,897 | ) | ||||||||||||||
| 5/23/08 | NOK | 5,879,410 | 1,120,386 | (27,133 | ) | ||||||||||||||
| 5/23/08 | NOK | 5,879,410 | 1,120,386 | (26,908 | ) | ||||||||||||||
| 5/23/08 | NZD | 2,761,000 | 2,178,590 | (49,321 | ) | ||||||||||||||
| 5/23/08 | NZD | 2,761,000 | 2,178,590 | (49,169 | ) | ||||||||||||||
| 5/23/08 | NZD | 2,761,000 | 2,178,590 | (48,782 | ) | ||||||||||||||
| $ | 99,746,870 | $ | (1,595,087 | ) | |||||||||||||||
Futures Contracts
| Number of Contracts | Type | Expiration Date | Contract Value | Net Unrealized Appreciation (Depreciation) | |||||||||||||||
| Buys | |||||||||||||||||||
| 163 | CAC 40 | March 2008 | $ | 11,871,819 | $ | (28,807 | ) | ||||||||||||
| 97 | DAX | March 2008 | 24,844,696 | (3,491,760 | ) | ||||||||||||||
| 96 | MSCI Singapore | March 2008 | 5,127,249 | (145,180 | ) | ||||||||||||||
| $ | 41,843,764 | $ | (3,665,747 | ) | |||||||||||||||
| Sales | |||||||||||||||||||
| 14 | IBEX 35 | March 2008 | $ | 2,806,604 | $ | 4,391 | |||||||||||||
| 467 | OMXS 30 | March 2008 | 7,331,312 | (68,714 | ) | ||||||||||||||
| 38 | S&P Toronto 60 | March 2008 | 6,147,178 | (25,310 | ) | ||||||||||||||
| 47 | SPI 200 | March 2008 | 6,090,194 | 679,279 | |||||||||||||||
| 43 | TOPIX | March 2008 | 5,465,540 | 733,921 | |||||||||||||||
| $ | 27,840,828 | $ | 1,323,567 | ||||||||||||||||
As of February 29, 2008, for the futures contracts held, the Fund had sufficient cash and/or securities to cover any commitments or margin requirements of the relevant broker or exchange.
See accompanying notes to the financial statements.
26
GMO International Small Companies Fund
(A Series of GMO Trust)
Schedule of Investments — (Continued)
February 29, 2008
Notes to Schedule of Investments:
144A - Securities exempt from registration under Rule 144A of the Securities Act of 1933. These securities may be resold in transactions exempt from registration, normally to qualified institutional investors.
ADR - American Depositary Receipt
Foreign Registered - Shares issued to foreign investors in markets that have foreign ownership limits.
GDR - Global Depository Receipt
NVDR - Non-Voting Depository Receipt
* Non-income producing security.
(a) All or a portion of this security is out on loan (Note 2).
(b) Security valued at fair value using methods determined in good faith by or at the direction of the Trustees of GMO Trust (Note 2).
(c) As of February 29, 2008, these rights have been exercised but shares have not yet been credited to the Fund.
(d) All or a portion of this security represents investment of security lending collateral (Note 2).
As of February 29, 2008, 84.69% of the Net Assets of the Fund were valued using fair value prices based on models used by a third party vendor (Note 2).
Currency Abbreviations:
AUD - Australian Dollar
CAD - Canadian Dollar
CHF - Swiss Franc
DKK - Danish Krone
GBP - British Pound
HKD - Hong Kong Dollar
JPY - Japanese Yen
NOK - Norwegian Krone
NZD - New Zealand Dollar
SEK - Swedish Krona
SGD - Singapore Dollar
See accompanying notes to the financial statements.
27
GMO International Small Companies Fund
(A Series of GMO Trust)
Statement of Assets and Liabilities — February 29, 2008
| Assets: | |||||||
| Investments, at value, including securities on loan of $15,302,858 (cost $673,902,039) (Note 2) | $ | 684,854,445 | |||||
| Cash | 77,167 | ||||||
| Foreign currency, at value (cost $3,599,802) (Note 2) | 3,615,848 | ||||||
| Receivable for investments sold | 25,486 | ||||||
| Dividends and interest receivable | 964,212 | ||||||
| Foreign taxes receivable | 28,687 | ||||||
| Unrealized appreciation on open forward currency contracts (Note 2) | 3,672,962 | ||||||
| Receivable for collateral on open futures contracts (Note 2) | 6,050,000 | ||||||
| Receivable for expenses reimbursed by Manager (Note 3) | 95,265 | ||||||
| Total assets | 699,384,072 | ||||||
| Liabilities: | |||||||
| Collateral on securities loaned, at value (Note 2) | 16,390,450 | ||||||
| Payable for investments purchased | 760,033 | ||||||
| Payable to affiliate for (Note 3): | |||||||
| Management fee | 315,048 | ||||||
| Shareholder service fee | 78,762 | ||||||
| Trustees and Chief Compliance Officer of GMO Trust fees | 752 | ||||||
| Unrealized depreciation on open forward currency contracts (Note 2) | 1,595,087 | ||||||
| Payable for variation margin on open futures contracts (Note 2) | 318,745 | ||||||
| Accrued expenses | 389,577 | ||||||
| Total liabilities | 19,848,454 | ||||||
| Net assets | $ | 679,535,618 | |||||
| Net assets consist of: | |||||||
| Paid-in capital | $ | 647,931,174 | |||||
| Distributions in excess of net investment income | (5,790,555 | ) | |||||
| Accumulated net realized gain | 26,661,560 | ||||||
| Net unrealized appreciation | 10,733,439 | ||||||
| $ | 679,535,618 | ||||||
| Net assets attributable to: | |||||||
| Class III shares | $ | 679,535,618 | |||||
| Shares outstanding: | |||||||
| Class III | 73,138,116 | ||||||
| Net asset value per share: | |||||||
| Class III | $ | 9.29 | |||||
See accompanying notes to the financial statements.
28
GMO International Small Companies Fund
(A Series of GMO Trust)
Statement of Operations — Year Ended February 29, 2008
| Investment Income: | |||||||
| Dividends (net of withholding taxes of $1,787,122) | $ | 19,628,449 | |||||
| Interest | 1,280,953 | ||||||
| Securities lending income | 729,275 | ||||||
| Total investment income | 21,638,677 | ||||||
| Expenses: | |||||||
| Management fee (Note 3) | 4,738,960 | ||||||
| Shareholder service fee – Class III (Note 3) | 1,184,740 | ||||||
| Custodian and fund accounting agent fees | 887,032 | ||||||
| Transfer agent fees | 27,515 | ||||||
| Audit and tax fees | 108,076 | ||||||
| Legal fees | 17,193 | ||||||
| Trustees fees and related expenses (Note 3) | 8,713 | ||||||
| Registration fees | 2,116 | ||||||
| Miscellaneous | 11,908 | ||||||
| Total expenses | 6,986,253 | ||||||
| Fees and expenses reimbursed by Manager (Note 3) | (1,008,265 | ) | |||||
| Expense reductions (Note 2) | (9,278 | ) | |||||
| Net expenses | 5,968,710 | ||||||
| Net investment income (loss) | 15,669,967 | ||||||
| Realized and unrealized gain (loss): | |||||||
| Net realized gain (loss) on: | |||||||
| Investments | 169,380,065 | ||||||
| Closed futures contracts | 1,769,614 | ||||||
| Foreign currency, forward contracts and foreign currency related transactions (net of CPMF tax of $1,680) (Note2) | 5,519,310 | ||||||
| Net realized gain (loss) | 176,668,989 | ||||||
| Change in net unrealized appreciation (depreciation) on: | |||||||
| Investments | (202,610,973 | ) | |||||
| Open futures contracts | (1,848,055 | ) | |||||
| Foreign currency, forward contracts and foreign currency related transactions | 1,498,844 | ||||||
| Net unrealized gain (loss) | (202,960,184 | ) | |||||
| Net realized and unrealized gain (loss) | (26,291,195 | ) | |||||
| Net increase (decrease) in net assets resulting from operations | $ | (10,621,228 | ) | ||||
See accompanying notes to the financial statements.
29
GMO International Small Companies Fund
(A Series of GMO Trust)
Statement of Changes in Net Assets
| Year Ended February 29, 2008 | Year Ended February 28, 2007 | ||||||||||
| Increase (decrease) in net assets: | |||||||||||
| Operations: | |||||||||||
| Net investment income (loss) | $ | 15,669,967 | $ | 16,269,949 | |||||||
| Net realized gain (loss) | 176,668,989 | 216,853,382 | |||||||||
| Change in net unrealized appreciation (depreciation) | (202,960,184 | ) | (45,812,700 | ) | |||||||
| Net increase (decrease) in net assets from operations | (10,621,228 | ) | 187,310,631 | ||||||||
| Distributions to shareholders from: | |||||||||||
| Net investment income | |||||||||||
| Class III | (31,841,900 | ) | (19,881,021 | ) | |||||||
| Net realized gains | |||||||||||
| Class III | (142,937,240 | ) | (326,272,225 | ) | |||||||
| (174,779,140 | ) | (346,153,246 | ) | ||||||||
| Net share transactions (Note 7): | |||||||||||
| Class III | 5,871,549 | 26,733,728 | |||||||||
| Purchase premiums and redemption fees (Notes 2 and 7): | |||||||||||
| Class III | 2,593,773 | 1,977,585 | |||||||||
| Total increase (decrease) in net assets resulting from net share transactions, purchase premiums and redemption fees | 8,465,322 | 28,711,313 | |||||||||
| Total increase (decrease) in net assets | (176,935,046 | ) | (130,131,302 | ) | |||||||
| Net assets: | |||||||||||
| Beginning of period | 856,470,664 | 986,601,966 | |||||||||
| End of period (including distributions in excess of net investment income of $5,790,555 and $11,878,059, respectively) | $ | 679,535,618 | $ | 856,470,664 | |||||||
See accompanying notes to the financial statements.
30
GMO International Small Companies Fund
(A Series of GMO Trust)
Financial Highlights
(For a Class III share outstanding throughout each period)
| Year Ended February 28/29, | |||||||||||||||||||||||
| 2008 | 2007 | 2006 | 2005 | 2004 | |||||||||||||||||||
| Net asset value, beginning of period | $ | 12.22 | $ | 14.93 | $ | 17.84 | $ | 17.09 | $ | 9.50 | |||||||||||||
| Income (loss) from investment operations: | |||||||||||||||||||||||
| Net investment income (loss) | 0.24 | † | 0.25 | † | 0.34 | † | 0.30 | † | 0.20 | ||||||||||||||
| Net realized and unrealized gain (loss) | (0.34 | ) | 2.68 | 3.44 | 3.56 | 7.94 | |||||||||||||||||
| Total from investment operations | (0.10 | ) | 2.93 | 3.78 | 3.86 | 8.14 | |||||||||||||||||
| Less distributions to shareholders: | |||||||||||||||||||||||
| From net investment income | (0.51 | ) | (0.33 | ) | (0.44 | ) | (0.54 | ) | (0.20 | ) | |||||||||||||
| From net realized gains | (2.32 | ) | (5.31 | ) | (6.25 | ) | (2.57 | ) | (0.35 | ) | |||||||||||||
| Total distributions | (2.83 | ) | (5.64 | ) | (6.69 | ) | (3.11 | ) | (0.55 | ) | |||||||||||||
| Net asset value, end of period | $ | 9.29 | $ | 12.22 | $ | 14.93 | $ | 17.84 | $ | 17.09 | |||||||||||||
| Total Return(a) | (2.04 | )% | 23.35 | % | 25.77 | % | 24.45 | % | 86.62 | % | |||||||||||||
| Ratios/Supplemental Data: | |||||||||||||||||||||||
| Net assets, end of period (000's) | $ | 679,536 | $ | 856,471 | $ | 986,602 | $ | 1,517,223 | $ | 1,592,464 | |||||||||||||
| Net expenses to average daily net assets | 0.76 | %(b) | 0.75 | % | 0.75 | % | 0.75 | % | 0.75 | % | |||||||||||||
| Net investment income to average daily net assets | 1.98 | % | 1.79 | % | 2.01 | % | 1.75 | % | 1.60 | % | |||||||||||||
| Portfolio turnover rate | 72 | % | 48 | % | 49 | % | 53 | % | 46 | % | |||||||||||||
| Fees and expenses reimbursed by the Manager to average daily net assets: | 0.13 | % | 0.09 | % | 0.11 | % | 0.11 | % | 0.13 | % | |||||||||||||
| Purchase premiums and redemption fees consisted of the following per share amounts:† | $ | 0.04 | $ | 0.03 | $ | 0.07 | $ | 0.08 | $ | 0.04 | |||||||||||||
(a) The total returns would have been lower had certain expenses not been reimbursed during the periods shown and assumes the effect of reinvested distributions. Calculation excludes purchase premiums and redemption fees which are borne by the shareholder.
(b) The net expense ratio does not include the effect of expense reductions.
† Calculated using average shares outstanding throughout the period.
See accompanying notes to the financial statements.
31
GMO International Small Companies Fund
(A Series of GMO Trust)
Notes to Financial Statements
February 29, 2008
1. Organization
GMO International Small Companies Fund (the "Fund") is a series of GMO Trust (the "Trust"). The Fund is registered under the Investment Company Act of 1940, as amended, as an open-end, diversified management investment company. The Fund is advised and managed by Grantham, Mayo, Van Otterloo & Co. LLC (the "Manager" or "GMO"). The Trust was established as a Massachusetts business trust under the laws of the Commonwealth of Massachusetts on June 24, 1985. The Declaration of Trust permits the Trustees of the Trust ("Trustees") to create an unlimited number of series of shares ("Funds") and to subdivide Funds into classes.
The Fund seeks high total return. The Fund seeks to achieve its investment objective by outperforming the S&P/Citigroup Extended Market Index World ex-U.S. Index, the Fund's benchmark. The Fund typically makes equity investments in non-U.S. companies, including non-U.S. companies in developed and emerging countries, but excluding the largest 500 non-U.S. companies in developed countries based on full, non-float adjusted market capitalization and any company in an emerging country with a full, non-float adjusted market capitalization that is greater than or equal to that of any of the 500 excluded developed country companies. The Fund may make investments in emerging countries, but these investments generally will represent 10% or less of the Fund's total assets.
The Fund currently limits subscriptions due to capacity considerations.
2. Significant accounting policies
The following is a summary of significant accounting policies which are in conformity with accounting principles generally accepted in the United States of America ("U.S. GAAP") and which are consistently followed by the Fund in the preparation of its financial statements. The preparation of financial statements in accordance with U.S. GAAP requires management to make estimates and assumptions that affect the reported amounts and disclosures in the financial statements. Actual results could differ from those estimates. The accounting records of the Fund are maintained in U.S. dollars.
Portfolio valuation
Securities listed on a securities exchange for which market quotations are readily available are valued at the last sale price or official closing price on each business day, or if there is no such reported sale or official closing price, at the most recent quoted bid price. Unlisted securities for which market quotations are readily available are generally valued at the most recent quoted bid price. Short-term investments with a remaining maturity of sixty days or less are generally valued at amortized cost, which approximates fair value. Shares of investment funds are valued at their net asset value. Securities for which quotations are not readily available or whose values the Manager has determined to be unreliable are valued at fair value as determined in good faith by the Trustees or other persons acting at their direction pursuant to procedures approved by the Trustees. By its nature, a fair value price is a good faith est imate of the value of a security
32
GMO International Small Companies Fund
(A Series of GMO Trust)
Notes to Financial Statements — (Continued)
February 29, 2008
at a given point in time and may not reflect the value that would be realized if the security was sold and the differences could be material. Because many foreign equity securities markets and exchanges close prior to the close of the New York Stock Exchange ("NYSE"), closing prices for foreign securities in those markets or on those exchanges do not reflect the events that occur after that close but before the close of the NYSE. As a result, foreign equity securities are generally valued using fair value prices supplied by a third party vendor based on models to the extent that these fair value prices are available.
Foreign currency translation
The market values of foreign securities, currency holdings and other assets and liabilities are translated to U.S. dollars based on the current exchange rates each business day. Income and expenses denominated in foreign currencies are translated at current exchange rates when accrued or incurred. The Fund does not isolate realized and unrealized gains and losses attributable to changes in exchange rates from gains and losses that arise from changes in the market value of investments. Such fluctuations are included with net realized and unrealized gain or loss on investments. Net realized gains and losses on foreign currency transactions represent gains and losses on disposition of currencies and forward currency contracts, currency gains and losses realized between the trade and settlement dates on securities transactions, and the difference between the amount of investment income and foreign withholding taxes recorded on the F und's accounting records and the U.S. dollar equivalent amounts actually received or paid.
Forward currency contracts
The Fund may enter into forward currency contracts including forward cross currency contracts. A forward currency contract is an agreement between two parties to buy and sell a currency at a set price on a future date. The market value of a forward currency contract fluctuates with changes in forward currency exchange rates. Forward currency contracts are marked to market daily using rates supplied by a quotation service and changes in value are recorded by the Fund as an unrealized gain or loss. Realized gains or losses equal to the difference between the value of the contract at the time it was opened and the value at the time it was closed are recorded upon delivery or receipt of the currency or, if a forward currency contract is offset by entering into another forward currency contract with the same broker, upon settlement of the net gain or loss. These contracts may involve market risk in excess of the unrealized gain or lo ss reflected in the Fund's Statement of Assets and Liabilities. In addition, the Fund could be exposed to risk if the counterparties are unable to meet the terms of the contracts or if there are movements in currency values that are unfavorable to the Fund. Forward currency contracts outstanding at the end of the period are listed in the Fund's Schedule of Investments.
Futures contracts
The Fund may purchase and sell futures contracts. Upon entering into a futures contract, the Fund is required to deposit with the futures clearing broker an amount of cash, U.S. government and agency obligations, or other liquid assets in accordance with the initial margin requirements of the broker or exchange. In addition, the Fund maintains cash or securities in an amount that at least equals the net amount payable in the event the Fund must deliver the full amount of the contracts. Futures contracts are
33
GMO International Small Companies Fund
(A Series of GMO Trust)
Notes to Financial Statements — (Continued)
February 29, 2008
marked to market daily and an appropriate payable or receivable for the change in value ("variation margin") is recorded by the Fund. The payable or receivable is liquidated on the following business day. Gains or losses are recognized but not considered realized until the contracts expire or are closed. Futures contracts involve, to varying degrees, risk of loss in excess of the variation margin disclosed in the Statement of Assets and Liabilities. Under certain circumstances, futures exchanges may establish daily limits on the amount that the price of a futures contract can vary from the previous day's settlement price, thereby effectively preventing liquidation of unfavorable positions. Losses may arise from changes in the value of the underlying instrument if the Fund is unable to liquidate a futures position due to an illiquid secondary market for the contracts or the imposition of price limits, or if counterparties do not perform under the contract terms. Futures contracts are generally valued at the settlement price established each day by the board of trade or exchange on which they are traded. Futures contracts outstanding at the end of the period are listed in the Fund's Schedule of Investments.
Options
The Fund may write call and put options. Writing options increases the Fund's exposure to the underlying instrument by, in the case of a call option, obligating the Fund to sell the underlying instrument at a set price to the option-holder and, in the case of a put option, obligating the Fund to purchase the underlying instrument at a set price from the option-holder. When the Fund writes a call or put option, an amount equal to the premium received is recorded as a liability and subsequently marked to market to reflect the current value of the option written. Premiums received from writing options which expire are treated as realized gains. Premiums received from writing options which are exercised or closed are added to the proceeds or offset against the amounts paid on the underlying future, security or currency transaction to determine the realized gain or loss. The Fund as a writer of an option has no control over whether t he underlying future, security or currency may be sold (call) or purchased (put) and as a result bears the market risk of an unfavorable change in the price of the future, security or currency underlying the written option. In the event that the Fund writes uncovered call options (i.e. options for investments that the Fund does not own), it bears the risk of incurring substantial losses if the price of the underlying instrument increases during the term of the option. There is the risk the Fund may not be able to enter into a closing transaction because of an illiquid market. There were no open written option contracts during the period.
The Fund may also purchase put and call options. Purchasing options alters the Fund's exposure to the underlying instrument by, in the case of a call option, entitling the Fund to purchase the underlying instrument at a set price from the writer of the option and, in the case of a put option, entitling the Fund to sell the underlying instrument at a set price to the writer of the option. The Fund pays a premium as a cost for a purchased option disclosed in the Schedule of Investments which is subsequently marked to market to reflect the current value of the option. Premiums paid for purchasing options which expire are treated as realized losses. Premiums paid for purchasing options which are exercised or closed are added to the amounts paid or offset against the proceeds on the closing transaction to determine the realized gain or loss. The risk associated with purchasing put and call options is limited to the premium paid. Ther e were no purchased option contracts outstanding at the end of the period.
34
GMO International Small Companies Fund
(A Series of GMO Trust)
Notes to Financial Statements — (Continued)
February 29, 2008
Exchange traded options are valued at the last sale price, or if no sale is reported, the last bid price for purchased options and the last ask price for written options. Options traded over-the-counter are valued using prices supplied by a primary pricing source chosen by the Manager.
Swap agreements
The Fund may enter into swap agreements. A swap is an agreement to exchange the return generated by one instrument for the return generated by another instrument. Interest rate swap agreements involve the exchange by one party with another party of their respective commitments to pay or receive interest, e.g., an exchange of floating rate payments for fixed rate payments with respect to a notional amount of principal. Total return swap agreements involve a commitment by one party in the agreement to pay interest in exchange for a market-linked return, both based on notional amounts. To the extent the total return of the security or index underlying the transaction exceeds or falls short of the offsetting interest rate obligation, the party will receive a payment from or make a payment to the counterparty, respectively. Forward spread lock swap agreements involve commitments to pay or receive a settlement amount calculated as the difference between the swap spread and a fixed spread, multiplied by the notional amount times the duration of the swap rate. The swap spread is the difference between the benchmark swap rate (market rate) and the specific treasury rate. Variance swap agreements involve commitments to pay or receive a settlement amount calculated as the difference between the annualized realized variance of returns on the underlying price and a fixed quantity, also known as the variance strike, over a period of time. In connection with these agreements, cash or securities may be set aside as collateral by the Fund's custodian or brokers in accordance with the terms of the swap agreement. The Fund earns or pays interest on cash set aside as collateral.
Swaps are marked to market daily using models that incorporate quotations from market makers and the change in value, if any, is recorded as unrealized gain or loss in the Statement of Operations. Payments received or made on swap contracts are recorded as realized gain or loss in the Statement of Operations. Gains or losses are realized upon early termination of the swap agreements. These financial instruments are not actively traded on financial markets. The values assigned to these instruments are based upon the best available information and because of the uncertainty of the valuation, these values may differ significantly from the values that would have been realized had a ready market for these instruments existed, and the differences could be material. Entering into these agreements involves, to varying degrees, elements of credit, legal, market and documentation risk in excess of the amounts recognized in the Statement o f Assets and Liabilities. Such risks involve the possibility that there will be no liquid market for these agreements, that the counterparties to the agreements may default on their obligations to perform or disagree as to the meaning of contractual terms in the agreements, or that there may be unfavorable changes in interest rates or the price of the index or security underlying these transactions. There were no swap agreements outstanding at the end of the period.
35
GMO International Small Companies Fund
(A Series of GMO Trust)
Notes to Financial Statements — (Continued)
February 29, 2008
Securities lending
The Fund may lend its securities to certain qualified broker-dealers. The loans are collateralized with cash or liquid securities with a market value at least equal to the market value of the securities on loan. As with other extensions of credit, the Fund may bear the risk of loss with respect to the investment of the collateral, the risk of delay in and/or inability to exercise its rights with respect to the collateral, and the risk of delay in recovery or loss of rights in the loaned securities should the borrower of the securities fail financially. If a loan is collateralized by U.S. government securities, the Fund receives a fee from the borrower. If a loan is collateralized by cash, the Fund typically invests the cash collateral for its own account in interest-bearing, short-term securities and pays a fee to the borrower that normally represents a portion of the Fund's earnings on the collateral. As of February 29, 2008, t he Fund had loaned securities valued by the Fund at $15,302,858, collateralized by cash in the amount of $16,390,450, which was invested in the Bank of New York Mellon Institutional Cash Reserves Fund.
Taxes and distributions
The Fund intends to qualify each tax year as a regulated investment company under Subchapter M of the Internal Revenue Code of 1986, as amended (the "Code"). The Fund intends to distribute substantially all of its net investment income and net realized short-term and long-term capital gains, if any, after giving effect to any available capital loss carryovers for U.S. federal income tax purposes. Therefore, no provision for U.S. federal income or excise tax is necessary. Taxes on foreign interest and dividend income are generally withheld in accordance with the applicable country's tax treaty with the United States. The foreign withholding rates applicable to a Fund's investments in certain foreign jurisdictions may be higher if a significant portion of the Fund is held by non-U.S. shareholders.
The Fund's policy is to declare and pay distributions from net investment income, if any, semiannually, and from net realized short-term and long-term capital gains, if any, at least annually. All distributions are paid in shares of the Fund, at net asset value, unless the shareholder elects to receive cash distributions. Distributions to shareholders are recorded by the Fund on the ex-dividend date.
Dividends received by shareholders of the Fund which are derived from foreign source income and foreign taxes paid by the Fund may be treated, to the extent allowable under the Code, as if received and paid by the shareholders of the Fund.
The Fund may be subject to capital gains and repatriation taxes imposed by certain countries in which it invests.
The Fund is subject to a Contribuição Provisória sobre Movimentações Financiera ("CPMF") tax which is applied to foreign exchange transactions representing capital inflows or outflows to/from the Brazilian market. The CPMF tax has been included in the net realized gain (loss) on investments throughout the period. For the year ended February 29, 2008, the Fund incurred $1,680 in CPMF tax which is included in net realized gain (loss) on foreign currency, forward contracts and foreign currency related transactions in the Statement of Operations.
36
GMO International Small Companies Fund
(A Series of GMO Trust)
Notes to Financial Statements — (Continued)
February 29, 2008
Income and capital gain distributions are determined in accordance with U.S. federal income tax regulations, which may differ from U.S. GAAP. Certain capital accounts in the financial statements are periodically adjusted for permanent differences in order to reflect their tax character. These adjustments have no impact on net assets or net asset value per share. Temporary differences which arise from recognizing certain items of income, expense, gain or loss in different periods for financial statement and tax purposes will reverse at some time in the future. Distributions in excess of net investment income or net realized gains are temporary over distributions for financial statement purposes resulting from differences in the recognition or classification of income or distributions for financial statement and tax purposes.
U.S. GAAP and tax accounting differences primarily relate to derivative contract transactions, foreign currency transactions and passive foreign investment company transactions.
The following reclassification represents the amount necessary to report the stated components of net assets on a tax basis, excluding certain temporary differences, as of February 29, 2008. The financial highlights exclude these adjustments.
| Distributions in Excess of Net Investment Income | Accumulated Net Realized Gain | Paid-in Capital | |||||||||
| $ | 22,259,437 | $ | (22,225,853 | ) | $ | (33,584 | ) | ||||
The tax character of distributions declared to shareholders is as follows:
| 2/29/2008 | 2/28/2007 | ||||||||||
| Ordinary income (including any short-term capital gains) | $ | 74,973,732 | $ | 84,039,934 | |||||||
| Long-term capital gains | 99,805,408 | 262,113,312 | |||||||||
| Total distributions | $ | 174,779,140 | $ | 346,153,246 | |||||||
Distributions in excess of tax basis earnings and profits, if significant, are reported in the financial statements as a tax return of capital.
As of February 29, 2008, the components of distributable earnings on a tax basis consisted of the following:
| Undistributed ordinary income | $ | 527,074 | |||||
| Undistributed long-term capital gain | $ | 26,979,416 | |||||
37
GMO International Small Companies Fund
(A Series of GMO Trust)
Notes to Financial Statements — (Continued)
February 29, 2008
As of February 29, 2008, the approximate cost for U.S. federal income tax purposes and gross and net unrealized appreciation and depreciation in value of investments were as follows:
| Aggregate Cost | Gross Unrealized Appreciation | Gross Unrealized (Depreciation) | Net Unrealized Appreciation (Depreciation) | ||||||||||||
| $ | 678,498,266 | $ | 91,061,785 | $ | (84,705,606 | ) | $ | 6,356,179 | |||||||
Security transactions and related investment income
Security transactions are accounted for on trade date. Dividend income, net of applicable foreign withholding taxes, if any, is recorded on the ex-dividend date, or when the Fund is informed of the ex-dividend date, if later. Interest income is recorded on the accrual basis and is adjusted for the amortization of premiums and accretion of discounts. Interest income on inflation indexed securities, if any, is accrued daily based upon an inflation adjusted principal. Additionally, any increase or decrease in the principal or face amount of the securities adjusted for inflation is recorded as interest income or loss. Income is not recognized on securities for which collection is not expected. Non-cash dividends, if any, are recorded at the fair market value of the securities received. In determining the net gain or loss on securities sold, the cost of securities is determined on the identified cost basis.
Expenses
The majority of expenses of the Trust are directly identifiable to an individual fund. Expenses which are not readily identifiable to a specific fund are allocated taking into consideration, among other things, the nature and type of expense and the relative size of the funds. Investment income, common expenses and realized and unrealized gains and losses are allocated pro rata among the classes of shares of the Fund based on the relative net assets of each class. Shareholder service fees, which are directly attributable to a class of shares, are charged to that class's operations.
Brown Brothers Harriman & Co. ("BBH") serves as custodian and fund accounting agent of the Fund. State Street Bank and Trust Company ("State Street") serves as transfer agent of the Fund. BBH and State Street's fees may be reduced by credits that are an earnings allowance calculated on the average daily cash balances the Fund maintains with each agent. Credit balances or expense reimbursements used to reduce fees, if any, are reported as a reduction of expenses in the Statement of Operations.
Purchases and redemptions of Fund shares
As of February 29, 2008, the premium on cash purchases and fee on cash redemptions of Fund shares were each 0.50% of the amount invested or redeemed. If the Manager determines that any portion of a cash purchase or redemption is offset by a corresponding cash redemption or purchase occurring on the same day, it will waive the purchase premium or redemption fee in an amount approximately equal to the fee with respect to that portion. In addition, the purchase premium or redemption fee charged by the Fund may be
38
GMO International Small Companies Fund
(A Series of GMO Trust)
Notes to Financial Statements — (Continued)
February 29, 2008
waived in extraordinary circumstances if the Fund will not incur transaction costs. All purchase premiums and redemption fees are paid to and recorded by the Fund as paid-in capital. The Manager will waive the purchase premium relating to the in-kind portion of a purchase transaction except to the extent of certain certain estimated or known transaction costs (e.g. stamp duties and transfer taxes) incurred by the Fund in connection with the transfer of the purchasing shareholder's securities to the Fund. In-kind redemption transactions are generally not subject to redemption fees except to the extent those transactions include a cash component. However, when a substantial portion of a Fund is being redeemed, the Fund may assess estimated or known transaction costs. There is no premium for reinvested distributions.
Investment risks
There are certain additional risks involved in investing in foreign securities that are not inherent in investments in U.S. securities. These risks may involve adverse political and economic developments including the possible imposition of capital controls or other foreign governmental laws or restrictions. In addition, the securities of some foreign companies and securities markets are less liquid and at times may be more volatile than securities of comparable U.S. companies and U.S. securities markets.
Recently issued accounting pronouncements
In June 2006, the Financial Accounting Standards Board ("FASB") issued FASB Interpretation No. 48, Accounting for Uncertainty in Income Taxes – an Interpretation of FASB Statement No. 109 ("FIN 48"). FIN 48 clarifies the accounting for uncertainty in income taxes recognized in accordance with FASB Statement No. 109, Accounting for Income Taxes. FIN 48 prescribes a recognition threshold and measurement attribute for a tax position taken or expected to be taken in the tax return that could impact the Fund's financial statements. It also provides guidance in relation to the Fund's financial statements on classification of tax benefits or liabilities, interest and penalties, accounting in interim periods, disclosure, and transition. FIN 48 is effective for fiscal years beginning after December 15, 2006 for registered investment companies. Management has evaluated the effects of applying the various provisions of FIN 48 and has determined that the adoption of FIN 48 does not have a material effect on the Fund's financial statements. The Fund's federal tax returns for the prior three fiscal years, if applicable, remain subject to examination by the Internal Revenue Service. Management will continue to monitor the rules and guidance pertaining to FIN 48 and will take action if appropriate.
In September 2006, the FASB issued Statement of Financial Accounting Standards No. 157 ("FAS 157"), "Fair Value Measurements." FAS 157 defines fair value, establishes a framework for measuring fair value in accordance with generally accepted accounting principles and expands disclosure about fair value measurements. FAS 157 is effective for fiscal years beginning after November 15, 2007. Management is currently evaluating the impact the adoption of FAS 157 will have on the Fund's financial statement disclosures.
39
GMO International Small Companies Fund
(A Series of GMO Trust)
Notes to Financial Statements — (Continued)
February 29, 2008
3. Fees and other transactions with affiliates
GMO earns a management fee paid monthly at the annual rate of 0.60% of average daily net assets. The Fund has adopted a Shareholder Service Plan under which the Fund pays GMO a shareholder service fee for client and shareholder service, reporting, and other support. Pursuant to the Shareholder Service Plan, the shareholder service fee is calculated based on average daily net assets at the annual rate of 0.15% for Class III shares.
The Manager has contractually agreed to reimburse the Fund for Fund expenses through at least June 30, 2008 to the extent the Fund's total annual operating expenses (excluding shareholder service fees, fees and expenses of the independent Trustees of the Trust, fees and expenses for legal services not approved by the Manager for the Trust, compensation and expenses of the Trust's Chief Compliance Officer ("CCO") (excluding any employee benefits), brokerage commissions, securities lending fees and expenses, interest expense, transfer taxes, and other investment-related costs (including expenses associated with investments in any company that is an investment company or would be an investment company under the 1940 Act, but for the exceptions to the definition of investment company provided in Section 3(c)(1) and 3(c)(7) of the 1940 Act), hedging transaction fees, extraordinary, non-recurring and certain other unusual expenses (including taxes)) exceed 0.60% of the Fund's average daily net assets.
The Fund's portion of the fees paid by the Trust to the independent Trustees and CCO during the year ended February 29, 2008 was $7,517 and $3,087, respectively. The compensation and expenses of the CCO are included in miscellaneous expenses in the Statement of Operations. No remuneration was paid by the Fund to any other officer of the Trust.
4. Purchases and sales of securities
Cost of purchases and proceeds from sales of securities, excluding short-term investments, for the year ended February 29, 2008 aggregated $552,079,971 and $685,474,142, respectively.
5. Guarantees
In the normal course of business the Fund enters into contracts with third-party service providers that contain a variety of representations and warranties and which provide general indemnifications. The Fund's maximum exposure under these arrangements is unknown, as this would involve future claims that may be made against the Fund that have not yet occurred. Based on experience, management is of the view that the risk of loss in connection with these potential indemnification obligations is remote; however, there can be no assurance that material liabilities related to such obligations will not arise in the future that could adversely impact the Fund.
40
GMO International Small Companies Fund
(A Series of GMO Trust)
Notes to Financial Statements — (Continued)
February 29, 2008
6. Principal shareholders and related parties
As of February 29, 2008, 42.98% of the outstanding shares of the Fund were held by two shareholders, each holding in excess of 10% of the Fund's outstanding shares. No other shareholder owned in excess of 10% of the outstanding shares of the Fund. Investment activities of these shareholders may have a material effect on the Fund.
As of February 29, 2008, 0.14% of the Fund's shares were held by eleven related parties comprised of certain GMO employee accounts, and 2.20% of the Fund's shares were held by accounts for which the Manager has investment discretion.
7. Share transactions
The Declaration of Trust permits the Trustees to issue an unlimited number of shares of beneficial interest (without par value). Transactions in Fund shares were as follows:
| Year Ended February 29, 2008 | Year Ended February 28, 2007 | ||||||||||||||||||
| Class III: | Shares | Amount | Shares | Amount | |||||||||||||||
| Shares sold | 14,345,120 | $ | 167,353,499 | 533,510 | $ | 7,500,711 | |||||||||||||
| Shares issued to shareholders in reinvestment of distributions | 16,860,674 | 173,069,697 | 26,807,328 | 341,714,636 | |||||||||||||||
| Shares repurchased | (28,165,322 | ) | (334,551,647 | ) | (23,316,825 | ) | (322,481,619 | ) | |||||||||||
| Purchase premiums | — | 803,005 | — | 26,637 | |||||||||||||||
| Redemption fees | — | 1,790,768 | — | 1,950,948 | |||||||||||||||
| Net increase (decrease) | 3,040,472 | $ | 8,465,322 | 4,024,013 | $ | 28,711,313 | |||||||||||||
8. Subsequent event
The Fund's benchmark will change to the MSCI EAFE Small Cap Index on June 1, 2008.
41
Report of Independent Registered Public Accounting Firm
To the Trustees of GMO Trust and the Shareholders of
GMO International Small Companies Fund
In our opinion, the accompanying statement of assets and liabilities, including the schedule of investments, and the related statements of operations and of changes in net assets and the financial highlights present fairly, in all material respects, the financial position of GMO International Small Companies Fund (the "Fund") at February 29, 2008, the results of its operations for the year then ended, the changes in its net assets for each of the two years in the period then ended and the financial highlights for each of the five years in the period then ended, in conformity with accounting principles generally accepted in the United States of America. These financial statements and financial highlights (hereafter referred to as "financial statements") are the responsibility of the Fund's management; our responsibility is to express an opinion on these financial statements based on our audits. We conducted our audits of these fi nancial statements in accordance with the standards of the Public Company Accounting Oversight Board (United States). Those standards require that we plan and perform the audit to obtain reasonable assurance about whether the financial statements are free of material misstatement. An audit includes examining, on a test basis, evidence supporting the amounts and disclosures in the financial statements, assessing the accounting principles used and significant estimates made by management, and evaluating the overall financial statement presentation. We believe that our audits, which included confirmation of securities at February 29, 2008 by correspondence with the custodian and brokers, provide a reasonable basis for our opinion.
PricewaterhouseCoopers LLP
Boston, Massachusetts
April 29, 2008
42
GMO International Small Companies Fund
(A Series of GMO Trust)
Fund Expenses
February 29, 2008 (Unaudited)
Expense Examples: The following information is in relation to expenses for the six month period ended February 29, 2008.
As a shareholder of the Fund, you may incur two types of costs: (1) transaction costs, including purchase premiums and redemption fees; and (2) ongoing costs, including management fees, shareholder service fees, and other Fund expenses. This example is intended to help you understand your ongoing costs (in dollars) of investing in the Fund and to compare these costs with the ongoing costs of investing in other mutual funds.
These examples are based on an investment of $1,000 invested at the beginning of the period and held for the entire period, September 1, 2007 through February 29, 2008.
Actual Expenses
The first line of the table below provides information about actual account values and actual expenses. You may use the information in this line, together with the amount you invested, to estimate the expenses that you paid over the period. Simply divide your account value by $1,000 (for example, a $10,000,000 account value divided by $1,000 = 10,000), then multiply the result by the number in the first line under the heading entitled "Net Expense Incurred" to estimate the expenses you paid on your account during this period.
Hypothetical Example for Comparison Purposes
The second line of the table below provides information about hypothetical account values and hypothetical expenses based on the Fund's actual expense ratio and an assumed rate of return of 5% per year before expenses, which is not the Fund's actual return. The hypothetical account values and expenses may not be used to estimate the actual ending account balance or expenses you paid for the period. You may use this information to compare the ongoing costs of investing in the Fund with other funds. To do so, compare this 5% hypothetical example with the 5% hypothetical examples that appear in the shareholder reports of other funds.
Please note that the expenses shown in the table are meant to highlight your ongoing costs only and do not reflect any transactional costs, such as purchase premiums and redemption fees. Therefore, the second line of the table is useful in comparing ongoing costs only, and will not help you determine the relative total costs of owning different funds. In addition, if these transactional costs were included, your costs would have been higher.
| Annualized Net Expense Ratio | Beginning Account Value | Ending Account Value | Net Expense Incurred* | ||||||||||||||||
| Class III | |||||||||||||||||||
| 1) Actual | 0.76 | % | $ | 1,000.00 | $ | 921.60 | $ | 3.63 | |||||||||||
| 2) Hypothetical | 0.76 | % | $ | 1,000.00 | $ | 1,021.08 | $ | 3.82 | |||||||||||
* Expenses are calculated using the Class's annualized net expense ratio for the six months ended February 29, 2008, multiplied by the average account value over the period, multiplied by 182 days in the period, divided by 366 days in the year.
43
GMO International Small Companies Fund
(A Series of GMO Trust)
Tax Information for the Tax Year Ended February 29, 2008 (Unaudited)
The Fund will notify shareholders of amounts for use in preparing 2008 income tax forms in January 2009.
The Fund's distributions to shareholders include $99,805,408 from long-term capital gains.
During the year ended February 29, 2008, the Fund paid foreign taxes of $1,785,894 and recognized foreign source income of $21,415,571.
For taxable, non-corporate shareholders, 13.96% of the income and short-term capital gains, if any, distributed in the Fund's fiscal year ended February 29, 2008 represents qualified dividend income subject to the 15% rate category.
The Fund hereby designates as qualified interest income and qualified short-term capital gains with respect to its taxable year ended February 29, 2008, $1,300,420 and $43,733,939, respectively, or if determined to be different, the qualified interest income and qualified short-term gains of such year.
44
GMO International Small Companies Fund
(A Series of GMO Trust)
Note Concerning Distributions (Unaudited)
The Fund previously reported estimated sources of any dividends, short-term capital gains, and long-term capital gains distributions paid on a per share basis. Pursuant to Rule 19a-1(e) of the Investment Company Act, the following serves as a correction of such estimates. 0.42% of distributions to shareholders declared from net realized gains during the Fund's fiscal year were reclassified to distributions from net investment income and are reflected as such in the Statement of Changes in Net Assets.
45
Trustees and Officers (Unaudited)
The following tables list the Trust's Trustees and Officers as of the date of this report; their address and date of birth ("DOB"); their position with the Trust; the length of time holding that position with the Trust; their principal occupation(s) during the past five years; the number of portfolios in the fund complex they oversee; and other directorships they hold in companies subject to registration or reporting requirements of the Securities Exchange Act of 1934 (generally called "public companies") or in registered investment companies. The Trust's Statement of Additional Information ("SAI") includes additional information about the Trust's trustees, including changes subsequent to the date of the report. The SAI is available, without charge, upon request by writing GMO, c/o GMO Trust, 40 Rowes Wharf, Boston, MA 02110.
Independent Trustees:
| Name, Address, and DOB | Position(s) Held with Trust | Term of Office1 and Length of Time Served | Principal Occupation(s) During Past Five Years | Number of Portfolios in Fund Complex Overseen by Trustee | Other Directorships Held by Trustee | ||||||||||||||||||
| Donald W. Glazer, Esq. c/o GMO Trust 40 Rowes Wharf Boston, MA 02110 DOB: 07/26/1944 | Chairman of the Board of Trustees | Chairman of the Board of Trustees since March 2005; Lead Independent Trustee (September 2004 – March 2005); Trustee since December 2000. | Consultant – Law and Business2; Vice Chair (since 2002) and Secretary, Provant, Inc. (provider of personnel performance improvement services and training products); Author of Legal Treatises. | 47 | None. | ||||||||||||||||||
1 Each Trustee is elected to serve during the continued lifetime of the Trust until he/she dies, resigns or is removed, or if sooner, until the next meeting of Shareholders called for the purpose of electing Trustees and until the election and qualification of his/her successor.
2 As part of Mr. Glazer's work as a consultant, he provides part-time consulting services to Goodwin Procter LLP ("Goodwin"). Goodwin has provided legal services to Renewable Resources, LLC, an affiliate of GMO; GMO, in connection with its relationship with Renewable Resources; and funds managed by Renewable Resources. Mr. Glazer has represented that he has no financial interest in, and is not involved in the provision of, such legal services. In the calendar years ended December 31, 2006 and December 31, 2007, these entities paid $825,738 and $291,721 respectively, in legal fees and disbursements to Goodwin.
46
Independent Trustees — (Continued)
| Name, Address, and DOB | Position(s) Held with Trust | Term of Office1 and Length of Time Served | Principal Occupation(s) During Past Five Years | Number of Portfolios in Fund Complex Overseen by Trustee | Other Directorships Held by Trustee | ||||||||||||||||||
| Jay O. Light c/o GMO Trust 40 Rowes Wharf Boston, MA 02110 DOB: 10/03/1941 | Trustee | Since May 1996. | Dean (since April 2006), Acting Dean (August 2005 – April 2006), Senior Associate Dean (1998 – 2005), and Professor of Business Administration, Harvard Business School. | 47 | Director of Harvard Management Company, Inc.3 and Verde, Inc.; Director of Partners HealthCare System, Inc. and Chair of its Investment Committee.4 | ||||||||||||||||||
| W. Nicholas Thorndike c/o GMO Trust 40 Rowes Wharf Boston, MA 02110 DOB: 03/28/1933 | Trustee | Since March 2005. | Director or trustee of various corporations and charitable organizations, including Courier Corporation (a book publisher and manufacturer) (July 1989 – present); Putnam Funds (December 1992 – June 2004); and Providence Journal (a newspaper publisher) (December 1986 – December 2003). | 47 | Director of Courier Corporation (a book publisher and manufacturer); Member of the Investment Committee of Partners HealthCare System, Inc.4 | ||||||||||||||||||
1 Each Trustee is elected to serve during the continued lifetime of the Trust until he/she dies, resigns or is removed, or if sooner, until the next meeting of Shareholders called for the purpose of electing Trustees and until the election and qualification of his/her successor.
3 Harvard Management Company, Inc. is a client of the Manager.
4 Partners HealthCare System, Inc. is a client of the Manager.
47
Principal Officers:
| Name, Address, and DOB | Position(s) Held with Trust | Term of Office5 and Length of Time Served | Principal Occupation(s) During Past Five Years | ||||||||||||
| Scott Eston c/o GMO Trust 40 Rowes Wharf Boston, MA 02110 DOB: 01/20/1956 | President and Chief Executive Officer | President and Chief Executive Officer since October 2002; Chief Financial Officer, November 2006 – February 2007. | Chief Financial Officer, Chief Operating Officer and Member, Grantham, Mayo, Van Otterloo & Co. LLC. | ||||||||||||
| Sheppard N. Burnett c/o GMO Trust 40 Rowes Wharf Boston, MA 02110 DOB: 10/24/1968 | Treasurer and Chief Financial Officer | Chief Financial Officer since March 2007; Treasurer since November 2006; Assistant Treasurer, September 2004 – November 2006. | Fund Administration Staff, Grantham, Mayo, Van Otterloo & Co. LLC (June 2004 – present); Vice President, Director of Tax, Columbia Management Group (2002 – 2004). | ||||||||||||
| Brent C. Arvidson c/o GMO Trust 40 Rowes Wharf Boston, MA 02110 DOB: 06/26/1969 | Assistant Treasurer | Since August 1998. | Senior Fund Administrator, Grantham, Mayo, Van Otterloo & Co. LLC. | ||||||||||||
| John L. Nasrah c/o GMO Trust 40 Rowes Wharf Boston, MA 02110 DOB: 05/27/1977 | Assistant Treasurer | Since March 2007. | Fund Administrator, Grantham, Mayo, Van Otterloo & Co. LLC (September 2004 – present); Tax Analyst, Bain & Company, Inc (June 2003 – September 2004); Senior Tax Associate, PricewaterhouseCoopers LLP (2001 – 2003). | ||||||||||||
| Mahmoodur Rahman c/o GMO Trust 40 Rowes Wharf Boston, MA 02110 DOB: 11/30/1967 | Assistant Treasurer | Since March 2007. | Fund Administrator, Grantham, Mayo, Van Otterloo & Co. (April 2007 – present); Vice President and Senior Tax Manager, Massachusetts Financial Services Company (January 2000 – April 2007). | ||||||||||||
5 Officers are elected to hold such office until their successor is elected and qualified to carry out the duties and responsibilities of their office, or until he or she resigns or is removed from office.
48
Principal Officers — (Continued)
| Name, Address, and DOB | Position(s) Held with Trust | Term of Office5 and Length of Time Served | Principal Occupation(s) During Past Five Years | ||||||||||||
| Michael E. Gillespie c/o GMO Trust 40 Rowes Wharf Boston, MA 02110 DOB: 02/18/1958 | Chief Compliance Officer | Since March 2005. | Vice President of Compliance (June 2004 – February 2005) and Director of Domestic Compliance (March 2002 – June 2004), Fidelity Investments; Vice President and Senior Counsel, State Street Bank and Trust Company (May 1998 – March 2002). | ||||||||||||
| Jason B. Harrison c/o GMO Trust 40 Rowes Wharf Boston, MA 02110 DOB: 01/29/1977 | Vice President and Clerk | Vice President since November 2006; Clerk since March 2006. | Legal Counsel, Grantham, Mayo, Van Otterloo & Co. LLC (since February 2006) and Attorney, Ropes & Gray LLP (September 2002 – February 2006). | ||||||||||||
| David L. Bohan c/o GMO Trust 40 Rowes Wharf Boston, MA 02110 DOB: 06/21/1964 | Vice President and Assistant Clerk | Vice President since March 2005; Assistant Clerk since March 2006. | Legal Counsel, Grantham, Mayo, Van Otterloo & Co. LLC (September 2003 – present); Attorney, Goodwin Procter LLP (September 1996 – September 2003). | ||||||||||||
| Gregory L. Pottle c/o GMO Trust 40 Rowes Wharf Boston, MA 02110 DOB: 07/09/1971 | Vice President and Assistant Clerk | Since November 2006. | Legal Counsel, Grantham, Mayo, Van Otterloo & Co. LLC. | ||||||||||||
| Anne K. Trinque c/o GMO Trust 40 Rowes Wharf Boston, MA 02110 DOB: 04/15/1978 | Vice President and Assistant Clerk | Since September 2007. | Legal Counsel, Grantham, Mayo, Van Otterloo & Co. LLC (since January 2007); Attorney, Goodwin Procter LLP (September 2003 – January 2007). | ||||||||||||
| Cheryl Wakeham c/o GMO Trust 40 Rowes Wharf Boston, MA 02110 DOB: 10/29/1958 | Anti-Money Laundering Officer | Since December 2004. | Manager, Client Service Administration, Grantham, Mayo, Van Otterloo & Co. LLC. | ||||||||||||
5 Officers are elected to hold such office until their successor is elected and qualified to carry out the duties and responsibilities of their office, or until he or she resigns or is removed from office.
49
GMO Alternative Asset Opportunity Fund
(A Series of GMO Trust)
Consolidated Annual Report
February 29, 2008
For a free copy of the Fund's proxy voting guidelines, shareholders may call 1-617-346-7646 (collect), visit our website at www.gmo.com, or visit the Securities and Exchange Commission's website at www.sec.gov. Information regarding how the Fund voted proxies relating to portfolio securities during the most recent 12-month period ended June 30 is available on our website at www.gmo.com, or on the Securities and Exchange Commission's website at www.sec.gov.
The Fund files its complete schedule of portfolio holdings with the Securities and Exchange Commission for the first and third quarter of each fiscal year on Form N-Q, which is available on the Commission's website at www.sec.gov. The Fund's Form N-Q may be reviewed and copied at the Commission's Public Reference Room in Washington, D.C. Information on the operation of the Public Reference Room may be obtained by calling 1-800-SEC-0330.
This report is prepared for the general information of shareholders. It is authorized for distribution to prospective investors only when preceded or accompanied by a prospectus for the GMO Trust.
GMO Alternative Asset Opportunity Fund
(A Series of GMO Trust)
Portfolio Management
Day-to-day management of the Fund's portfolio is the responsibility of the Fixed Income Division at Grantham, Mayo, Van Otterloo & Co. LLC.
Management Discussion and Analysis of Fund Performance
The GMO Alternative Asset Opportunity Fund returned +16.0% for the fiscal year ended February 29, 2008, as compared with +18.2% for the Alternative Asset Opportunity Index (50% Dow Jones-AIG Commodity Index/50% JPMorgan 3 Month Cash Index). The Fund underperformed its benchmark by 2.2% during the fiscal year.
Most commodity prices rose broadly during the fiscal year. Grain commodity prices were the biggest gainers of the fiscal year, gaining 8% to 106%. With the exception of natural gas contract prices, which fell 18%, energy contract prices rose by 50% to 60%. Metal and soft commodity prices also rose by 18% to 38% during the period. Conversely, lean hog and live cattle contract prices fell by 46% and 13%, respectively, during the fiscal year.
While correctly positioning the prices of lean hog, cocoa, gold, and soy oil contracts added value during the fiscal year, the Fund's exposure to cash management offset gains. Most of the Fund's underperformance stemmed from mark-to-market losses in the GMO Short Duration Collateral Fund (SDCF), the cash collateral pool in which the Fund invests a substantial portion of its total assets. SDCF primarily invests in high quality U.S. and foreign floating-rate fixed income securities, mainly asset-backed securities, seeking to earn a LIBOR-type return. The SDCF investment collateralizes the commodities positions, which are achieved in the futures markets.
The views expressed herein are exclusively those of Grantham, Mayo, Van Otterloo & Co. LLC Management as of the date of this report and are subject to change. GMO disclaims any responsibility to update such views. They are not meant as investment advice.
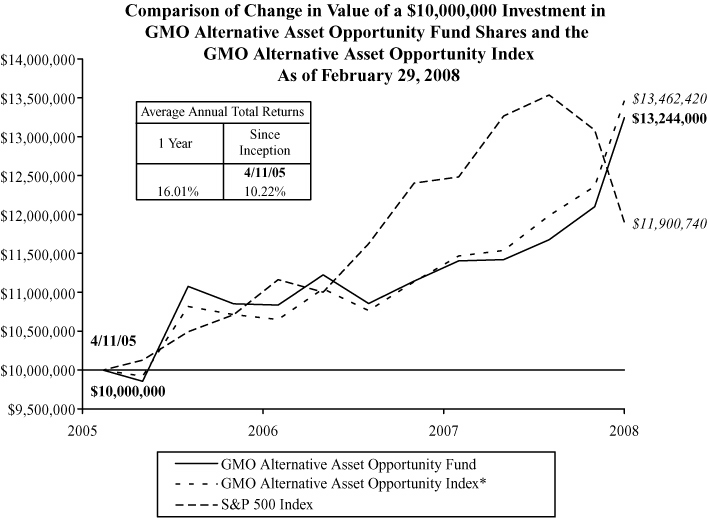
Performance data quoted represents past performance and is not indicative of future results. The investment return and principal value of an investment will fluctuate so that an investor's shares, when redeemed, may be worth more or less than their original cost. Current performance data may be lower or higher than the performance data provided herein. To obtain performance information to the most recent month-end, visit www.gmo.com. Performance shown is net of all fees after reimbursement from the Manager. Returns would have been lower had certain expenses not been reimbursed during the periods shown and do not include the effect of taxes on distributions and redemptions. All information is unaudited.
* The GMO Alternative Asset Opportunity Index is a composite benchmark computed by GMO and comprised of 50% JPMorgan U.S. 3 Month Cash Index and 50% AIG Commodity-Dow Jones Index.
GMO Alternative Asset Opportunity Fund
(A Series of GMO Trust)
Consolidated Investments Concentration Summary (a)
February 29, 2008 (Unaudited)
| Asset Class Summary* | % of Total Net Assets | ||||||
| Debt Obligations | 78.2 | % | |||||
| Short-Term Investments | 16.6 | ||||||
| Swaps | 4.8 | ||||||
| Futures | 0.4 | ||||||
| Forward Currency Contracts | (0.0 | ) | |||||
| 100.0 | % | ||||||
(a) GMO Alternative Asset SPC Ltd. is a 100% owned subsidiary of GMO Alternative Asset Opportunity Fund.
* The table above incorporates aggregate indirect asset class exposure associated with investments in other funds of GMO Trust ("underlying funds").
1
GMO Alternative Asset Opportunity Fund
(A Series of GMO Trust)
Consolidated Schedule of Investments
(showing percentage of total net assets)
February 29, 2008
| Par Value ($) / Shares | Description | Value ($) | |||||||||
| DEBT OBLIGATIONS — 14.7% | |||||||||||
| U.S. Government — 14.7% | |||||||||||
| 5,000,000 | U.S. Treasury Note, 4.63%, due 03/31/08 (a) (b) | 5,009,375 | |||||||||
| TOTAL DEBT OBLIGATIONS (COST $5,000,538) | 5,009,375 | ||||||||||
| MUTUAL FUNDS — 69.7% | |||||||||||
| Affiliated Issuers — 69.7% | |||||||||||
| 985,714 | GMO Short-Duration Collateral Fund | 23,686,705 | |||||||||
| TOTAL MUTUAL FUNDS (COST $24,691,838) | 23,686,705 | ||||||||||
| SHORT-TERM INVESTMENTS —10.4% | |||||||||||
| Money Market Funds — 0.3% | |||||||||||
| 110,203 | SSgA Cash Management Fund Plc (b) | 110,203 | |||||||||
| TOTAL MONEY MARKET FUNDS (COST $110,203) | 110,203 | ||||||||||
| Other Short-Term Investments — 10.1% | |||||||||||
| 1,000,000 | Federal Farm Credit Bank Discount Note, 2.50%, due 03/28/08 (b) | 998,125 | |||||||||
| 600,000 | Federal Home Loan Bank Discount Note, 2.50%, due 03/25/08 (b) | 599,000 | |||||||||
| 200,000 | Federal Home Loan Bank Discount Note, 2.78%, due 03/17/08 (b) | 199,753 | |||||||||
| 902,000 | Federal Home Loan Mortgage Corp. Discount Note, 2.66%, due 03/04/08 (b) | 901,800 | |||||||||
| 710,000 | Federal Home Loan Mortgage Corp. Discount Note, 2.70%, due 03/05/08 (b) | 709,787 | |||||||||
| TOTAL OTHER SHORT TERM INVESTMENTS (COST $3,408,465) | 3,408,465 | ||||||||||
| TOTAL SHORT-TERM INVESTMENTS (COST $3,518,668) | 3,518,668 | ||||||||||
| TOTAL INVESTMENTS — 94.8% (Cost $33,211,044) | 32,214,748 | ||||||||||
| Other Assets and Liabilities (net) — 5.2% | 1,757,242 | ||||||||||
| TOTAL NET ASSETS — 100.0% | $ | 33,971,990 | |||||||||
See accompanying notes to the financial statements.
2
GMO Alternative Asset Opportunity Fund
(A Series of GMO Trust)
Consolidated Schedule of Investments — (Continued)
February 29, 2008
A summary of outstanding financial instruments at February 29, 2008 is as follows:
Futures Contracts (b)
| Number of Contracts | Type | Expiration Date | Contract Value | Net Unrealized Appreciation (Depreciation) | |||||||||||||||
| Buys | |||||||||||||||||||
| 25 | Cocoa | May 2008 | $ | 694,250 | $ | 76,883 | |||||||||||||
| 7 | Coffee "C" | May 2008 | 437,850 | 35,667 | |||||||||||||||
| 3 | Copper | May 2008 | 289,125 | 8,775 | |||||||||||||||
| 13 | Corn | May 2008 | 361,725 | 18,974 | |||||||||||||||
| 7 | Crude Oil | May 2008 | 709,940 | 25,799 | |||||||||||||||
| 4 | Gasoline RBOB | April 2008 | 448,543 | (7,444 | ) | ||||||||||||||
| 4 | Gold 100 OZ | April 2008 | 390,000 | 16,298 | |||||||||||||||
| 4 | Heating Oil | April 2008 | 471,559 | 16,702 | |||||||||||||||
| 8 | Silver | May 2008 | 796,600 | (20 | ) | ||||||||||||||
| 5 | Soybean Meal | May 2008 | 191,100 | 8,285 | |||||||||||||||
| 32 | Sugar (World) | May 2008 | 523,981 | 18,138 | |||||||||||||||
| 1 | Wheat | May 2008 | 54,300 | 2,410 | |||||||||||||||
| $ | 5,368,973 | $ | 220,467 | ||||||||||||||||
| Sales | |||||||||||||||||||
| 5 | Cotton No. 2 | May 2008 | $ | 204,650 | $ | (25,547 | ) | ||||||||||||
| 16 | Lean Hogs | April 2008 | 383,680 | 22,564 | |||||||||||||||
| 44 | Live Cattle | April 2008 | 1,660,120 | 3,095 | |||||||||||||||
| 4 | Natural Gas | April 2008 | 374,640 | (15,124 | ) | ||||||||||||||
| 4 | Soybean | May 2008 | 307,300 | (19,762 | ) | ||||||||||||||
| 11 | Soybean Oil | May 2008 | 454,212 | (38,468 | ) | ||||||||||||||
| $ | 3,384,602 | $ | (73,242 | ) | |||||||||||||||
See accompanying notes to the financial statements.
3
GMO Alternative Asset Opportunity Fund
(A Series of GMO Trust)
Consolidated Schedule of Investments — (Continued)
February 29, 2008
Swap Agreements (b)
Total Return Swaps
| Notional Amount | Expiration Date | Counterparty | Pay | Receive | Market Value | ||||||||||||||||||||||
| 16,989,877 | USD | 4/14/2008 | Barclay's Capital | 3 month T-Bill | Return on DJ-AIG | ||||||||||||||||||||||
| + 0.19 | % | Commodity Total | |||||||||||||||||||||||||
| Return Index | $ | 1,682,326 | |||||||||||||||||||||||||
| Premiums to (Pay) Receive | $ | — | $ | 1,682,326 | |||||||||||||||||||||||
As of February 29, 2008, for the futures and/or swap contracts held, the Fund had sufficient cash and/or securities to cover any commitments or margin requirements of the relevant broker or exchange.
Notes to Consolidated Schedule of Investments:
(a) All or a portion of this security has been segregated to cover margin requirements on open financial futures contracts and/or open swap contracts (Note 2).
(b) All or a portion of this security is owned by GMO Alternative Asset SPC Ltd., which is a 100% owned subsidiary of GMO Alternative Asset Opportunity Fund.
Currency Abbreviations:
USD - United States Dollar
See accompanying notes to the financial statements.
4
GMO Alternative Asset Opportunity Fund
(A Series of GMO Trust)
Consolidating Statement of Assets and Liabilities — February 29, 2008
| GMO Alternative Asset Opportunity Fund | GMO Alternative Asset SPC Ltd. | Eliminations | Consolidated Totals | ||||||||||||||||
| Assets: | |||||||||||||||||||
| Investments in unaffiliated issuers, at value (consolidated cost $8,519,206) (Note 2) | $ | — | $ | 8,528,043 | $ | — | $ | 8,528,043 | |||||||||||
| Investments in affiliated issuers, at value (consolidated cost $24,691,838) (Note 2) | 33,959,297 | — | (10,272,592 | ) | 23,686,705 | ||||||||||||||
| Cash | 104,456 | — | — | 104,456 | |||||||||||||||
| Interest receivable | 37 | 98,467 | — | 98,504 | |||||||||||||||
| Receivable for open swap contracts (Note 2) | — | 1,682,326 | — | 1,682,326 | |||||||||||||||
| Receivable for expenses reimbursed by Manager (Note 3) | 13,253 | 17,081 | — | 30,334 | |||||||||||||||
| Total assets | 34,077,043 | 10,325,917 | (10,272,592 | ) | 34,130,368 | ||||||||||||||
| Liabilities: | |||||||||||||||||||
| Payable for variation margin on open futures contracts (Note 2) | — | 12,351 | — | 12,351 | |||||||||||||||
| Payable to affiliate for (Note 3): | |||||||||||||||||||
| Management fee | 11,577 | — | — | 11,577 | |||||||||||||||
| Shareholder service fee | 3,859 | — | — | 3,859 | |||||||||||||||
| Trustees and Chief Compliance Officer of GMO Trust fees | 29 | — | — | 29 | |||||||||||||||
| Accrued expenses | 89,588 | 40,974 | — | 130,562 | |||||||||||||||
| Total liabilities | 105,053 | 53,325 | — | 158,378 | |||||||||||||||
| Net assets | $ | 33,971,990 | $ | 10,272,592 | $ | (10,272,592 | ) | $ | 33,971,990 | ||||||||||
| Shareholders' capital | $ | 33,971,990 | $ | 33,971,990 | |||||||||||||||
| Shares outstanding | 1,026,006 | 1,026,006 | |||||||||||||||||
| Net asset value per share | $ | 33.11 | $ | 33.11 | |||||||||||||||
See accompanying notes to the financial statements.
5
GMO Alternative Asset Opportunity Fund
(A Series of GMO Trust)
Consolidating Statement of Operations — For the Year Ended Ended February 29, 2008
| GMO Alternative Asset Opportunity Fund | GMO Alternative Asset SPC Ltd. | Eliminations | Consolidated Totals | ||||||||||||||||
| Investment Income: | |||||||||||||||||||
| Dividend from affiliated issuers (Note 8) | $ | 5,256,485 | $ | — | $ | (3,700,000 | ) | $ | 1,556,485 | ||||||||||
| Interest | 3,590 | 1,422,086 | — | 1,425,676 | |||||||||||||||
| Dividends | — | 15,709 | — | 15,709 | |||||||||||||||
| Total income | 5,260,075 | 1,437,795 | (3,700,000 | ) | 2,997,870 | ||||||||||||||
| Expenses: | |||||||||||||||||||
| Management fee (Note 3) | 447,286 | — | — | 447,286 | |||||||||||||||
| Shareholder service fee (Note 3) | 149,096 | — | — | 149,096 | |||||||||||||||
| Custodian and transfer agent fees | 12,858 | 72,086 | — | 84,944 | |||||||||||||||
| Audit and tax fees | 74,508 | 11,362 | — | 85,870 | |||||||||||||||
| Legal fees | 10,480 | 2,760 | — | 13,240 | |||||||||||||||
| Trustees fees and related expenses (Note 3) | 1,122 | 12,382 | — | 13,504 | |||||||||||||||
| Miscellaneous | 1,420 | 9,281 | — | 10,701 | |||||||||||||||
| Total expenses | 696,770 | 107,871 | — | 804,641 | |||||||||||||||
| Fees and expenses reimbursed by Manager (Note 3) | (98,962 | ) | (107,871 | ) | — | (206,833 | ) | ||||||||||||
| Net expenses | 597,808 | — | — | 597,808 | |||||||||||||||
| Net investment income | 4,662,267 | 1,437,795 | (3,700,000 | ) | 2,400,062 | ||||||||||||||
| Realized and unrealized gain (loss): | |||||||||||||||||||
| Net realized gain (loss) on: | |||||||||||||||||||
| Investments in unaffiliated issuers | — | 3,890 | — | 3,890 | |||||||||||||||
| Investments in affiliated issuers | (2,615,869 | ) | — | 3,638,626 | 1,022,757 | ||||||||||||||
| Closed futures contracts | — | (1,627,150 | ) | — | (1,627,150 | ) | |||||||||||||
| Closed swap contracts | — | 2,808,283 | — | 2,808,283 | |||||||||||||||
| Net realized gain (loss) | (2,615,869 | ) | 1,185,023 | 3,638,626 | 2,207,780 | ||||||||||||||
| Change in net unrealized appreciation (depreciation) on: | |||||||||||||||||||
| Investments in unaffiliated issuers | — | 32,579 | — | 32,579 | |||||||||||||||
| Investments in affiliated issuers | (493,081 | ) | — | (804,457 | ) | (1,297,538 | ) | ||||||||||||
| Open futures contracts | — | 212,734 | — | 212,734 | |||||||||||||||
| Open swap contracts | — | (2,002,300 | ) | — | (2,002,300 | ) | |||||||||||||
| Net unrealized gain (loss) | (493,081 | ) | (1,756,987 | ) | (804,457 | ) | (3,054,525 | ) | |||||||||||
| Net realized and unrealized gain (loss) | (3,108,950 | ) | (571,964 | ) | 2,834,169 | (846,745 | ) | ||||||||||||
| Net increase (decrease) in net assets resulting from operations | $ | 1,553,317 | $ | 865,831 | $ | (865,831 | ) | $ | 1,553,317 | ||||||||||
See accompanying notes to the financial statements.
6
GMO Alternative Asset Opportunity Fund
(A Series of GMO Trust)
Consolidated Statement of Changes in Net Assets
| Year Ended February 29, 2008 | Year Ended February 28, 2007 | ||||||||||
| Increase (decrease) in net assets: | |||||||||||
| Operations: | |||||||||||
| Net investment income (loss) | $ | 2,400,062 | $ | 8,673,307 | |||||||
| Net realized gain (loss) | 2,207,780 | 64,042 | |||||||||
| Change in net unrealized appreciation (depreciation) | (3,054,525 | ) | 3,787,171 | ||||||||
| Net increase (decrease) in net assets from operations | 1,553,317 | 12,524,520 | |||||||||
| Fund share transactions: (Note 7) | |||||||||||
| Proceeds from sale of shares | 3,431,990 | 4,000,000 | |||||||||
| Cost of shares repurchased | (145,526,957 | ) | (23,957,500 | ) | |||||||
| Net increase (decrease) in Fund share transactions | (142,094,967 | ) | (19,957,500 | ) | |||||||
| Total increase (decrease) in net assets | (140,541,650 | ) | (7,432,980 | ) | |||||||
| Net assets: | |||||||||||
| Beginning of period | 174,513,640 | 181,946,620 | |||||||||
| End of period | $ | 33,971,990 | $ | 174,513,640 | |||||||
See accompanying notes to the financial statements.
7
GMO Alternative Asset Opportunity Fund
(A Series of GMO Trust)
Consolidated Financial Highlights
(For a share outstanding throughout each period)
| Year Ended February 28/29, | |||||||||||||||
| 2008 | 2007 | 2006(a) | |||||||||||||
| Net asset value, beginning of period | $ | 28.54 | $ | 26.63 | $ | 25.00 | |||||||||
| Income (loss) from investment operations: | |||||||||||||||
| Net investment income (loss)(b)† | 0.69 | 1.28 | 0.73 | ||||||||||||
| Net realized and unrealized gain (loss) | 3.88 | (c) | 0.63 | 0.90 | |||||||||||
| Total from investment operations | 4.57 | 1.91 | 1.63 | ||||||||||||
| Net asset value, end of period | $ | 33.11 | $ | 28.54 | $ | 26.63 | |||||||||
| Total Return(d) | 16.01 | % | 7.17 | % | 6.52 | %** | |||||||||
| Ratios/Supplemental Data: | |||||||||||||||
| Net assets, end of period (000's) | $ | 33,972 | $ | 174,514 | $ | 181,947 | |||||||||
| Net expenses to average daily net assets(e) | 0.60 | % | 0.60 | % | 0.61 | %* | |||||||||
| Net investment income to average daily net assets(b) | 2.41 | % | 4.60 | % | 3.12 | %* | |||||||||
| Portfolio turnover rate | 24 | % | 12 | % | 13 | %** | |||||||||
| Fees and expenses reimbursed by the Manager to average daily net assets: | 0.21 | % | 0.12 | % | 0.15 | %* | |||||||||
(a) Period from April 11, 2005 (commencement of operations) to February 28, 2006.
(b) Net investment income is affected by the timing of the declaration of dividends by the underlying funds in which the Fund invests.
(c) The amount shown for a share outstanding does not correspond with the aggregate net realized and unrealized gain (loss) on investments due to the timing of purchases and redemptions of Fund shares in relation to fluctuating market values of the investments of the Fund.
(d) Total returns would have been lower had certain expenses not been reimbursed during the periods shown.
(e) Net expenses exclude expenses incurred indirectly through investment in the underlying funds (See Note 3).
† Calculated using average shares outstanding throughout the period.
* Annualized.
** Not annualized.
See accompanying notes to the financial statements.
8
GMO Alternative Asset Opportunity Fund
(A Series of GMO Trust)
Notes to Consolidated Financial Statements
February 29, 2008
1. Organization
GMO Alternative Asset Opportunity Fund (the "Fund") is a series of GMO Trust (the "Trust"). The Fund is registered under the Investment Company Act of 1940, as amended, as an open-end, non-diversified management investment company. The Fund is advised and managed by Grantham, Mayo, Van Otterloo & Co. LLC (the "Manager" or "GMO"). The Trust was established as a Massachusetts business trust under the laws of the Commonwealth of Massachusetts on June 24, 1985. The Declaration of Trust permits the Trustees of the Trust ("Trustees") to create an unlimited number of series of shares ("Funds") and to subdivide Funds into classes.
The Fund seeks total return greater than that of its benchmark. The Fund's benchmark is a composite of the Dow Jones-AIG Commodity Index (50%) and the JPMorgan 3 Month Cash Index (50%). The Fund seeks indirect exposure to investment returns of commodities and, from time to time, other alternative asset classes. The Fund's investment program has two primary components. One component is intended to gain indirect exposure to the commodity markets through the Fund's investments in a wholly owned subsidiary company, which, in turn, invests in various commodity-related derivatives. The second component of the fund's investment program consists of direct and indirect investments in high quality U.S. and foreign fixed income securities. Normally, the Fund gains exposure to fixed income securities indirectly by investing in GMO Short-Duration Collateral Fund.
Shares of the Fund are not publicly offered and are principally available only to other funds of the Trust and certain accredited investors.
The Fund currently limits subscriptions due to capacity considerations.
2. Significant accounting policies
The following is a summary of significant accounting policies which are in conformity with accounting principles generally accepted in the United States of America ("U.S. GAAP") and which are consistently followed by the Fund in the preparation of its financial statements. The preparation of financial statements in accordance with U.S. GAAP requires management to make estimates and assumptions that affect the reported amounts and disclosures in the financial statements. Actual results could differ from those estimates. The accounting records of the Fund are maintained in U.S. dollars.
Basis of presentation and principles of consolidation
The accompanying consolidated financial statements include the accounts of the GMO Alternative Asset Opportunity Fund and its wholly owned investment in GMO Alternative Asset SPC Ltd. The consolidated financial statements include 100% of the assets and liabilities of GMO Alternative Asset SPC Ltd. All significant interfund accounts and transactions have been eliminated in consolidation.
9
GMO Alternative Asset Opportunity Fund
(A Series of GMO Trust)
Notes to Consolidated Financial Statements — (Continued)
February 29, 2008
Portfolio valuation
Securities listed on a securities exchange for which market quotations are readily available are valued at the last sale price or official closing price on each business day, or if there is no such reported sale or official closing price, at the most recent quoted bid price. Unlisted securities for which market quotations are readily available are generally valued at the most recent quoted bid price. Short-term investments with a remaining maturity of sixty days or less are generally valued at amortized cost, which approximates fair value. Shares of investment funds are valued at their net asset value. Securities for which quotations are not readily available or whose values the Manager has determined to be unreliable are valued at fair value as determined in good faith by the Trustees or other persons acting at their direction pursuant to procedures approved by the Trustees. By its nature, a fair value price is a good faith est imate of the value of a security at a given point in time and may not reflect the value that would be realized if the security was sold and the differences could be material.
Fixed income securities held by the Fund or the underlying funds are typically valued pursuant to prices supplied by a primary pricing source chosen by the Manager. The Manager evaluates such primary pricing sources on an ongoing basis, and may change a pricing source should it deem it appropriate. The Manager, at its discretion, may override a price supplied by a primary source by using a price provided by another source if such action is deemed appropriate. The prices provided by such primary pricing sources may differ from the value that would be realized if the securities were sold and the differences could be material.
Certain securities held by the Fund or the underlying funds are valued on the basis of a price provided by a single source. The prices provided may differ from the value that would be realized if the securities were sold and the differences could be material. As of February 29, 2008, the total value of these securities represented 22.35% of net assets.
The Fund indirectly invests through underlying funds in securities with contractual cash flows, such as asset-backed securities, collateralized mortgage obligations and commercial mortgage backed securities, including securities backed by subprime mortgage loans. The value, liquidity and related income of these securities are sensitive to changes in economic conditions, including real estate values, delinquencies and/or defaults, and may be adversely affected by shifts in the market's perception of the securities' market values and changes in interest rates.
Futures contracts
The Fund may purchase and sell futures contracts. Upon entering into a futures contract, the Fund is required to deposit with the futures clearing broker an amount of cash, U.S. government and agency obligations, or other liquid assets in accordance with the initial margin requirements of the broker or exchange. In addition, the Fund maintains cash or securities in an amount that at least equals the net amount payable in the event the Fund must deliver the full amount of the contracts. Futures contracts are marked to market daily and an appropriate payable or receivable for the change in value ("variation margin") is recorded by the Fund. The payable or receivable is liquidated on the following business day. Gains or losses are recognized but not considered realized until the contracts expire or are closed. Futures
10
GMO Alternative Asset Opportunity Fund
(A Series of GMO Trust)
Notes to Consolidated Financial Statements — (Continued)
February 29, 2008
contracts involve, to varying degrees, risk of loss in excess of the variation margin disclosed in the Consolidating Statement of Assets and Liabilities. Under certain circumstances, futures exchanges may establish daily limits on the amount that the price of a futures contract can vary from the previous day's settlement price, thereby effectively preventing liquidation of unfavorable positions. Losses may arise from changes in the value of the underlying instrument if the Fund is unable to liquidate a futures position due to an illiquid secondary market for the contracts or the imposition of price limits, or if counterparties do not perform under the contract terms. Futures contracts are generally valued at the settlement price established each day by the board of trade or exchange on which they are traded. Futures contracts outstanding at the end of the period are listed in the Fund's Consolidated Schedule of Investments.
Swap agreements
The Fund may enter into swap agreements. A swap is an agreement to exchange the return generated by one instrument for the return generated by another instrument. Interest rate swap agreements involve the exchange by one party with another party of their respective commitments to pay or receive interest, e.g., an exchange of floating rate payments for fixed rate payments with respect to a notional amount of principal. Total return swap agreements involve a commitment by one party in the agreement to pay interest in exchange for a market-linked return, both based on notional amounts. To the extent the total return of the security or index underlying the transaction exceeds or falls short of the offsetting interest rate obligation, the party will receive a payment from or make a payment to the counterparty, respectively. Forward spread lock swap agreements involve commitments to pay or receive a settlement amount calculated as the difference between the swap spread and a fixed spread, multiplied by the notional amount times the duration of the swap rate. The swap spread is the difference between the benchmark swap rate (market rate) and the specific treasury rate. In a credit default swap, one party makes a stream of payments to another party in exchange for the right to receive a specified return in the event of a default by a third party on its obligation. Credit default swaps may be used to provide a measure of protection against defaults of sovereign or corporate issuers (i.e., to reduce risk where a party owns or has exposure to the issuer) or to take an active long or short position with respect to the likelihood of a particular issuer's default. Variance swap agreements involve commitments to pay or receive a settlement amount calculated as the difference between the annualized realized variance of returns on the underlying price and a fixed quantity, also known as the variance strike, over a period of time. In connection with these agreements, cash or securities may be set aside as collateral by the Fund's custodian or brokers in accordance with the terms of the swap agreement. The Fund earns or pays interest on cash set aside as collateral.
Swaps are marked to market daily using models that incorporate quotations from market makers and the change in value, if any, is recorded as unrealized gain or loss in the Consolidating Statement of Operations. Payments received or made on swap contracts are recorded as realized gain or loss in the Consolidating Statement of Operations. Gains or losses are realized upon early termination of the swap agreements. These financial instruments are not actively traded on financial markets. The values assigned to these instruments are based upon the best available information and because of the uncertainty of the valuation, these values may differ significantly from the values that would have been realized had a ready market for these instruments existed, and the differences could be material. Entering into these agreements
11
GMO Alternative Asset Opportunity Fund
(A Series of GMO Trust)
Notes to Consolidated Financial Statements — (Continued)
February 29, 2008
involves, to varying degrees, elements of credit, legal, market and documentation risk in excess of the amounts recognized in the Consolidating Statement of Assets and Liabilities. Such risks involve the possibility that there will be no liquid market for these agreements, that the counterparties to the agreements may default on their obligations to perform or disagree as to the meaning of contractual terms in the agreements, or that there may be unfavorable changes in interest rates or the price of the index or security underlying these transactions. Swap agreements outstanding at the end of the period are listed in the Fund's Consolidated Schedule of Investments.
Repurchase agreements
The Fund may enter into repurchase agreements with banks and broker-dealers whereby the Fund acquires a security for cash and obtains a simultaneous commitment from the seller to repurchase the security at an agreed upon price and date. The Fund, through its custodian, takes possession of securities collateralizing the repurchase agreement. The collateral is marked to market daily to ensure that the market value of the underlying assets remains sufficient to protect the Fund in the event of default by the seller. Collateral for certain tri-party repurchase agreements is held at the counterparty's custodian in a segregated account for the benefit of the Fund and the counterparty. In connection with transactions in repurchase agreements, if the seller defaults or enters into insolvency proceedings and the value of the collateral declines, recovery of cash by the Fund may be delayed or limited. There were no repurchase agreements o utstanding at the end of the period.
Taxes
The Fund elected to be taxed as a partnership for federal income tax purposes. As a partnership, the Fund will not be subject to federal and state income tax. Instead, each shareholder is responsible for the tax liability or benefit related to his/her allocable share of taxable income or loss. Accordingly, no provision (benefit) for federal and state income taxes is reflected in the accompanying financial statements.
As of February 29, 2008, the approximate cost for U.S. federal income tax purposes and gross and net unrealized appreciation and depreciation in value of investments were as follows:
Aggregate Cost | Gross Unrealized Appreciation | Gross Unrealized (Depreciation) | Net Unrealized Appreciation (Depreciation) | ||||||||||||
| $ | 34,541,784 | $ | — | $ | (2,327,036 | ) | $ | (2,327,036 | ) | ||||||
Distributions
The Fund does not intend to make any distributions to its shareholders but may do so in the sole discretion of the Trustees.
12
GMO Alternative Asset Opportunity Fund
(A Series of GMO Trust)
Notes to Consolidated Financial Statements — (Continued)
February 29, 2008
Security transactions and related investment income
Security transactions are accounted for on trade date. Dividend income, net of applicable foreign withholding taxes, if any, is recorded on the ex-dividend date, or when the Fund is informed of the ex-dividend date, if later. Interest income is recorded on the accrual basis and is adjusted for the amortization of premiums and accretion of discounts. Interest income on inflation indexed securities, if any, is accrued daily based upon an inflation adjusted principal. Additionally, any increase or decrease in the principal or face amount of the securities adjusted for inflation is recorded as interest income or loss. Income is not recognized on securities for which collection is not expected. Non-cash dividends, if any, are recorded at the fair market value of the securities received. In determining the net gain or loss on securities sold, the cost of securities is determined on the identified cost basis.
Expenses
The majority of expenses of the Trust are directly identifiable to an individual fund. Expenses which are not readily identifiable to a specific fund are allocated taking into consideration, among other things, the nature and type of expense and the relative size of the funds. In addition, the Fund will also incur certain fees and expenses indirectly as a shareholder in the underlying funds. Because the underlying funds have varied expense and fee levels and the Fund may own different proportions of the underlying funds at different times, the amount of fees and expenses indirectly incurred by the Fund will vary (See Note 3).
State Street Bank and Trust Company ("State Street") serves as custodian, fund accounting agent and transfer agent of the Fund. State Street's fee may be reduced by credits that are an earnings allowance calculated on the average daily cash balances the Fund maintains with State Street. Credit balances used to reduce the fee paid to State Street, if any, are reported as a reduction of expenses in the Consolidating Statement of Operations.
Investment risks
The Fund is subject to the investment risks associated with an investment in the underlying funds, some of which may invest in foreign securities. There are certain additional risks involved in investing in foreign securities that are not inherent in investments in U.S. securities. These risks may involve adverse political and economic developments, including the possible imposition of capital controls or other foreign governmental laws or restrictions. In addition, the securities of some foreign companies and securities markets are less liquid and at times more volatile than securities of comparable U.S. companies and U.S. securities markets. The risks described above apply to an even greater extent to investments in emerging markets. The securities markets of emerging countries are generally smaller, less developed, less liquid, and more volatile than the securities markets of the U.S. and developed foreign markets. Additional ly, the investment risks associated with an investment in the underlying funds may be more pronounced to the extent that the underlying funds engage in derivative transactions. Because of the Fund's indirect exposure to the global commodity markets, the value of its shares is affected by factors particular to the commodity markets and may fluctuate more than the value of shares of a fund with a broader range of investments.
13
GMO Alternative Asset Opportunity Fund
(A Series of GMO Trust)
Notes to Consolidated Financial Statements — (Continued)
February 29, 2008
Recently issued accounting pronouncements
In June 2006, the Financial Accounting Standards Board ("FASB") issued FASB Interpretation No. 48, Accounting for Uncertainty in Income Taxes – an Interpretation of FASB Statement No. 109 ("FIN 48"). FIN 48 clarifies the accounting for uncertainty in income taxes recognized in accordance with FASB Statement No. 109, Accounting for Income Taxes. FIN 48 prescribes a recognition threshold and measurement attribute for a tax position taken or expected to be taken in the tax return that could impact the Fund's financial statements. It also provides guidance in relation to the Fund's financial statements on classification of tax benefits or liabilities, interest and penalties, accounting in interim periods, disclosure, and transition. FIN 48 is effective for fiscal years beginning after December 15, 2006 for registered investment companies. Management has evaluated the effects of applying the various provisions of FIN 48 and has determined that the adoption of FIN 48 does not have a material effect on the Fund's financial statements. The Fund's federal tax returns for the prior three fiscal years, if applicable, remain subject to examination by the Internal Revenue Service. Management will continue to monitor the rules and guidance pertaining to FIN 48 and will take action if appropriate.
In September 2006, the FASB issued Statement of Financial Accounting Standards No. 157 ("FAS 157"), "Fair Value Measurements." FAS 157 defines fair value, establishes a framework for measuring fair value in accordance with generally accepted accounting principles and expands disclosure about fair value measurements. FAS 157 is effective for fiscal years beginning after November 15, 2007. Management is currently evaluating the impact the adoption of FAS 157 will have on the Fund's financial statement disclosures.
3. Fees and other transactions with affiliates
GMO earns a management fee paid monthly at the annual rate of 0.45% of average daily net assets. The Fund has adopted a Shareholder Service Plan under which the Fund pays GMO a shareholder service fee for client and shareholder service, reporting, and other support. Pursuant to the Shareholder Service Plan, the shareholder service fee is calculated based on average daily net assets at the annual rate of 0.15%.
The Manager has contractually agreed to reimburse the Fund for Fund expenses through at least June 30, 2008 to the extent the Fund's total annual operating expenses (excluding shareholder service fees, fees and expenses of the independent Trustees of the Trust, fees and expenses for legal services not approved by the Manager for the Trust, compensation and expenses of the Trust's Chief Compliance Officer ("CCO") (excluding any employee benefits), brokerage commissions, securities lending fees and expenses, interest expense, transfer taxes, and other investment-related costs (including expenses associated with investments in any company that is an investment company or would be an investment company under the 1940 Act, but for the exceptions to the definition of investment company provided in Section 3(c)(1) and 3(c)(7) of the 1940 Act), hedging transaction fees, extraordinary, non-recurring and certain other unusual expenses (in cluding taxes)) exceed 0.45% of the Fund's average daily net assets.
14
GMO Alternative Asset Opportunity Fund
(A Series of GMO Trust)
Notes to Consolidated Financial Statements — (Continued)
February 29, 2008
The Fund incurs fees and expenses indirectly as a shareholder in the GMO Short-Duration Collateral Fund. For the year ended February 29, 2008, these indirect fees and expenses expressed as an annualized percentage of the Fund's average daily net assets were as follows:
| Indirect Net Expenses (excluding shareholder service fees and interest expense) | Indirect Shareholder Service Fees | Indirect Interest Expense | Total Indirect Expenses | ||||||||||||
| 0.001 | % | 0.000 | % | 0.000 | % | 0.001 | % | ||||||||
The Fund's portion of the fees paid by the Trust to the independent Trustees and CCO during the year ended February 29, 2008 was $846 and $301, respectively. The compensation and expenses of the CCO are included in miscellaneous expenses in the Consolidating Statement of Operations. No remuneration was paid by the Fund to any other officer of the Trust.
The Fund's investments in commodity-related derivatives are generally made through GMO Alternative Asset Opportunity SPC Ltd., a wholly owned subsidiary organized as a Bermuda limited liability company, which GMO serves as investment manager but does not receive any additional management or other fees for such services.
4. Purchases and sales of securities
For the year ended February 29, 2008, cost of purchases and proceeds from sales of investments, other than short-term obligations, were as follows:
| Purchases | Sales | ||||||||||
| U.S. Government securities | $ | 5,003,906 | $ | 15,000,000 | |||||||
| Investments (non-U.S. Government securities) | 12,156,485 | 112,800,000 | |||||||||
5. Guarantees
In the normal course of business the Fund enters into contracts with third-party service providers that contain a variety of representations and warranties and which provide general indemnifications. The Fund's maximum exposure under these arrangements is unknown, as this would involve future claims that may be made against the Fund that have not yet occurred. Based on experience, management is of the view that the risk of loss in connection with these potential indemnification obligations is remote; however, there can be no assurance that material liabilities related to such obligations will not arise in the future that could adversely impact the Fund.
15
GMO Alternative Asset Opportunity Fund
(A Series of GMO Trust)
Notes to Consolidated Financial Statements — (Continued)
February 29, 2008
6. Principal shareholders and related parties
As of February 29, 2008, 83.43% of the outstanding shares of the Fund were held by two shareholders, each holding in excess of 10% of the Fund's outstanding shares. No other shareholder owned in excess of 10% of the outstanding shares of the Fund. One of the shareholders is another fund of the Trust. Investment activities of these shareholders may have a material effect on the Fund.
As of February 29, 2008, there were no shares held by related parties, and all of the Fund's shares were held by accounts for which the Manager has investment discretion.
7. Share transactions
The Declaration of Trust permits the Trustees to issue an unlimited number of shares of beneficial interest (without par value). Transactions in Fund shares were as follows:
| Year Ended February 29, 2008 | Year Ended February 28, 2007 | ||||||||||||||||||
| Shares | Amount | Shares | Amount | ||||||||||||||||
| Shares sold | 117,663 | $ | 3,431,990 | 142,196 | $ | 4,000,000 | |||||||||||||
| Shares repurchased | (5,206,092 | ) | (145,526,957 | ) | (860,208 | ) | (23,957,500 | ) | |||||||||||
| Net increase (decrease) | (5,088,429 | ) | $ | (142,094,967 | ) | (718,012 | ) | $ | (19,957,500 | ) | |||||||||
8. Investments in affiliated issuers
A summary of the Fund's transactions in the shares of the affiliated issuer during the year ended February 29, 2008 is set forth below:
| Affiliate | Value, beginning of period | Purchases | Sales Proceeds | Dividend Income | Distributions of Realized Gains | Value, end of period | |||||||||||||||||||||
| GMO Short-Duration Collateral Fund | $ | 124,605,003 | $ | 12,156,485 | $ | 112,800,000 | $ | 1,556,485 | $ | — | $ | 23,686,705 | |||||||||||||||
| Totals | $ | 124,605,003 | $ | 12,156,485 | $ | 112,800,000 | $ | 1,556,485 | $ | — | $ | 23,686,705 | |||||||||||||||
16
Report of Independent Registered Public Accounting Firm
To the Trustees of GMO Trust and the Shareholders of
GMO Alternative Asset Opportunity Fund
In our opinion, the accompanying consolidated statement of assets and liabilities, including the consolidated schedule of investments, and the related consolidated statements of operations and of changes in net assets and the financial highlights present fairly, in all material respects, the financial position of GMO Alternative Asset Opportunity Fund (the "Fund") and subsidiary at February 29, 2008, the results of their operations for the year then ended, the changes in their net assets for each of the two years in the period then ended and the financial highlights for each of the periods indicated, in conformity with accounting principles generally accepted in the United States of America. These financial statements and financial highlights (hereafter referred to as "financial statements") are the responsibility of the Fund's management; our responsibility is to express an opinion on these financial statements based on our aud its. We conducted our audits of these financial statements in accordance with the standards of the Public Company Accounting Oversight Board (United States). Those standards require that we plan and perform the audit to obtain reasonable assurance about whether the financial statements are free of material misstatement. An audit includes examining, on a test basis, evidence supporting the amounts and disclosures in the financial statements, assessing the accounting principles used and significant estimates made by management, and evaluating the overall financial statement presentation. We believe that our audits, which included confirmation of securities at February 29, 2008 by correspondence with the custodian and brokers, provide a reasonable basis for our opinion.
PricewaterhouseCoopers LLP
Boston, Massachusetts
April 29, 2008
17
GMO Alternative Asset Opportunity Fund
(A Series of GMO Trust)
Fund Expenses
February 29, 2008 (Unaudited)
Expense Examples: The following information is in relation to expenses for the six month period ended February 29, 2008.
As a shareholder of the Fund, you may incur two types of costs: (1) transaction costs, and (2) ongoing costs, including management fees, shareholder service fees and other Fund expenses. This example is intended to help you understand your ongoing costs (in dollars) of investing in the Fund and to compare these costs with the ongoing costs of investing in other mutual funds.
These examples are based on an investment of $1,000 invested at the beginning of the period and held for the entire period, September 1, 2007 through February 29, 2008.
Actual Expenses
The first line of the table below provides information about actual account values and actual expenses. You may use the information in this line, together with the amount you invested, to estimate the expenses that you paid over the period. Simply divide your account value by $1,000 (for example, a $10,000,000 account value divided by $1,000 = 10,000), then multiply the result by the number in the first line under the heading entitled "Net Expense Incurred" to estimate the expenses you paid on your account during this period.
Hypothetical Example for Comparison Purposes
The second line of the table below provides information about hypothetical account values and hypothetical expenses based on the Fund's actual expense ratio and an assumed rate of return of 5% per year before expenses, which is not the Fund's actual return. The hypothetical account values and expenses may not be used to estimate the actual ending account balance or expenses you paid for the period. You may use this information to compare the ongoing costs of investing in the Fund with other funds. To do so, compare this 5% hypothetical example with the 5% hypothetical examples that appear in the shareholder reports of other funds.
Please note that the expenses shown in the table are meant to highlight your ongoing costs only and do not reflect any transactional costs, such as purchase premiums and redemption fees. Therefore, the second line of the table is useful in comparing ongoing costs only, and will not help you determine the relative total costs of owning different funds. In addition, if these transactional costs were included, your costs would have been higher.
| Annualized Expense Ratio | Beginning Account Value | Ending Account Value | Net Expense Incurred* | ||||||||||||||||
| 1) Actual | 0.60 | % | $ | 1,000.00 | $ | 1,181.20 | $ | 3.25 | |||||||||||
| 2) Hypothetical | 0.60 | % | $ | 1,000.00 | $ | 1,021.88 | $ | 3.02 | |||||||||||
* Expenses are calculated using the Fund's annualized net expense ratio (including indirect expenses incurred) for the six months ended February 29, 2008, multiplied by the average account value over the period, multiplied by 182 days in the period, divided by 366 days in the year.
18
Trustees and Officers (Unaudited)
The following tables list the Trust's Trustees and Officers as of the date of this report; their address and date of birth ("DOB"); their position with the Trust; the length of time holding that position with the Trust; their principal occupation(s) during the past five years; the number of portfolios in the fund complex they oversee; and other directorships they hold in companies subject to registration or reporting requirements of the Securities Exchange Act of 1934 (generally called "public companies") or in registered investment companies. The Trust's Statement of Additional Information ("SAI") includes additional information about the Trust's trustees, including changes subsequent to the date of the report. The SAI is available, without charge, upon request by writing GMO, c/o GMO Trust, 40 Rowes Wharf, Boston, MA 02110.
Independent Trustees:
| Name, Address, and DOB | Position(s) Held with Trust | Term of Office1 and Length of Time Served | Principal Occupation(s) During Past Five Years | Number of Portfolios in Fund Complex Overseen by Trustee | Other Directorships Held by Trustee | ||||||||||||||||||
| Donald W. Glazer, Esq. c/o GMO Trust 40 Rowes Wharf Boston, MA 02110 DOB: 07/26/1944 | Chairman of the Board of Trustees | Chairman of the Board of Trustees since March 2005; Lead Independent Trustee (September 2004 – March 2005); Trustee since December 2000. | Consultant – Law and Business2; Vice Chair (since 2002) and Secretary, Provant, Inc. (provider of personnel performance improvement services and training products); Author of Legal Treatises. | 47 | None. | ||||||||||||||||||
1 Each Trustee is elected to serve during the continued lifetime of the Trust until he/she dies, resigns or is removed, or if sooner, until the next meeting of Shareholders called for the purpose of electing Trustees and until the election and qualification of his/her successor.
2 As part of Mr. Glazer's work as a consultant, he provides part-time consulting services to Goodwin Procter LLP ("Goodwin"). Goodwin has provided legal services to Renewable Resources, LLC, an affiliate of GMO; GMO, in connection with its relationship with Renewable Resources; and funds managed by Renewable Resources. Mr. Glazer has represented that he has no financial interest in, and is not involved in the provision of, such legal services. In the calendar years ended December 31, 2006 and December 31, 2007, these entities paid $825,738 and $291,721 respectively, in legal fees and disbursements to Goodwin.
19
Independent Trustees — (Continued)
| Name, Address, and DOB | Position(s) Held with Trust | Term of Office1 and Length of Time Served | Principal Occupation(s) During Past Five Years | Number of Portfolios in Fund Complex Overseen by Trustee | Other Directorships Held by Trustee | ||||||||||||||||||
| Jay O. Light c/o GMO Trust 40 Rowes Wharf Boston, MA 02110 DOB: 10/03/1941 | Trustee | Since May 1996. | Dean (since April 2006), Acting Dean (August 2005 – April 2006), Senior Associate Dean (1998 – 2005), and Professor of Business Administration, Harvard Business School. | 47 | Director of Harvard Management Company, Inc.3 and Verde, Inc.; Director of Partners HealthCare System, Inc. and Chair of its Investment Committee.4 | ||||||||||||||||||
| W. Nicholas Thorndike c/o GMO Trust 40 Rowes Wharf Boston, MA 02110 DOB: 03/28/1933 | Trustee | Since March 2005. | Director or trustee of various corporations and charitable organizations, including Courier Corporation (a book publisher and manufacturer) (July 1989 – present); Putnam Funds (December 1992 – June 2004); and Providence Journal (a newspaper publisher) (December 1986 – December 2003). | 47 | Director of Courier Corporation (a book publisher and manufacturer); Member of the Investment Committee of Partners HealthCare System, Inc.4 | ||||||||||||||||||
1 Each Trustee is elected to serve during the continued lifetime of the Trust until he/she dies, resigns or is removed, or if sooner, until the next meeting of Shareholders called for the purpose of electing Trustees and until the election and qualification of his/her successor.
3 Harvard Management Company, Inc. is a client of the Manager.
4 Partners HealthCare System, Inc. is a client of the Manager.
20
Principal Officers:
| Name, Address, and DOB | Position(s) Held with Trust | Term of Office5 and Length of Time Served | Principal Occupation(s) During Past Five Years | ||||||||||||
| Scott Eston c/o GMO Trust 40 Rowes Wharf Boston, MA 02110 DOB: 01/20/1956 | President and Chief Executive Officer | President and Chief Executive Officer since October 2002; Chief Financial Officer, November 2006 – February 2007. | Chief Financial Officer, Chief Operating Officer and Member, Grantham, Mayo, Van Otterloo & Co. LLC. | ||||||||||||
| Sheppard N. Burnett c/o GMO Trust 40 Rowes Wharf Boston, MA 02110 DOB: 10/24/1968 | Treasurer and Chief Financial Officer | Chief Financial Officer since March 2007; Treasurer since November 2006; Assistant Treasurer, September 2004 – November 2006. | Fund Administration Staff, Grantham, Mayo, Van Otterloo & Co. LLC (June 2004 – present); Vice President, Director of Tax, Columbia Management Group (2002 – 2004). | ||||||||||||
| Brent C. Arvidson c/o GMO Trust 40 Rowes Wharf Boston, MA 02110 DOB: 06/26/1969 | Assistant Treasurer | Since August 1998. | Senior Fund Administrator, Grantham, Mayo, Van Otterloo & Co. LLC. | ||||||||||||
| John L. Nasrah c/o GMO Trust 40 Rowes Wharf Boston, MA 02110 DOB: 05/27/1977 | Assistant Treasurer | Since March 2007. | Fund Administrator, Grantham, Mayo, Van Otterloo & Co. LLC (September 2004 – present); Tax Analyst, Bain & Company, Inc (June 2003 – September 2004); Senior Tax Associate, PricewaterhouseCoopers LLP (2001 – 2003). | ||||||||||||
| Mahmoodur Rahman c/o GMO Trust 40 Rowes Wharf Boston, MA 02110 DOB: 11/30/1967 | Assistant Treasurer | Since September 2007. | Fund Administrator, Grantham, Mayo, Van Otterloo & Co. (April 2007 – present); Vice President and Senior Tax Manager, Massachusetts Financial Services Company (January 2000 – April 2007). | ||||||||||||
5 Officers are elected to hold such office until their successor is elected and qualified to carry out the duties and responsibilities of their office, or until he or she resigns or is removed from office.
21
Principal Officers: — (Continued)
| Name, Address, and DOB | Position(s) Held with Trust | Term of Office5 and Length of Time Served | Principal Occupation(s) During Past Five Years | ||||||||||||
| Michael E. Gillespie c/o GMO Trust 40 Rowes Wharf Boston, MA 02110 DOB: 02/18/1958 | Chief Compliance Officer | Since March 2005. | Vice President of Compliance (June 2004 – February 2005) and Director of Domestic Compliance (March 2002 – June 2004), Fidelity Investments; Vice President and Senior Counsel, State Street Bank and Trust Company (May 1998 – March 2002). | ||||||||||||
| Jason B. Harrison c/o GMO Trust 40 Rowes Wharf Boston, MA 02110 DOB: 01/29/1977 | Vice President and Clerk | Vice President since November 2006; Clerk since March 2006. | Legal Counsel, Grantham, Mayo, Van Otterloo & Co. LLC (since February 2006) and Attorney, Ropes & Gray LLP (September 2002 – February 2006). | ||||||||||||
| David L. Bohan c/o GMO Trust 40 Rowes Wharf Boston, MA 02110 DOB: 06/21/1964 | Vice President and Assistant Clerk | Vice President since March 2005; Assistant Clerk since March 2006. | Legal Counsel, Grantham, Mayo, Van Otterloo & Co. LLC (September 2003 – present); Attorney, Goodwin Procter LLP (September 1996 – September 2003). | ||||||||||||
| Gregory L. Pottle c/o GMO Trust 40 Rowes Wharf Boston, MA 02110 DOB: 07/09/1971 | Vice President and Assistant Clerk | Since November 2006. | Legal Counsel, Grantham, Mayo, Van Otterloo & Co. LLC. | ||||||||||||
| Anne K. Trinque c/o GMO Trust 40 Rowes Wharf Boston, MA 02110 DOB: 04/15/1978 | Vice President and Assistant Clerk | Since September 2007. | Legal Counsel, Grantham, Mayo, Van Otterloo & Co. LLC (since January 2007); Attorney, Goodwin Procter LLP (September 2003 – January 2007). | ||||||||||||
| Cheryl Wakeham c/o GMO Trust 40 Rowes Wharf Boston, MA 02110 DOB: 10/29/1958 | Anti-Money Laundering Officer | Since December 2004. | Manager, Client Service Administration, Grantham, Mayo, Van Otterloo & Co. LLC. | ||||||||||||
5 Officers are elected to hold such office until their successor is elected and qualified to carry out the duties and responsibilities of their office, or until he or she resigns or is removed from office.
22
GMO Core Plus Bond Fund
(A Series of GMO Trust)
Annual Report
February 29, 2008
For a free copy of the Fund's proxy voting guidelines, shareholders may call 1-617-346-7646 (collect), visit our website at www.gmo.com, or visit the Securities and Exchange Commission's website at www.sec.gov. Information regarding how the Fund voted proxies relating to portfolio securities during the most recent 12-month period ended June 30 is available on our website at www.gmo.com, or on the Securities and Exchange Commission's website at www.sec.gov.
The Fund files its complete schedule of portfolio holdings with the Securities and Exchange Commission for the first and third quarter of each fiscal year on Form N-Q, which is available on the Commission's website at www.sec.gov. The Fund's Form N-Q may be reviewed and copied at the Commission's Public Reference Room in Washington, D.C. Information on the operation of the Public Reference Room may be obtained by calling 1-800-SEC-0330. The Fund has a policy with respect to disclosure of portfolio holdings under which it may also make available on GMO's website (www.gmo.com) a complete schedule of portfolio holdings.
This report is prepared for the general information of shareholders. It is authorized for distribution to prospective investors only when preceded or accompanied by a prospectus for the GMO Trust.
GMO Core Plus Bond Fund
(A Series of GMO Trust)
Portfolio Management
Day-to-day management of the Fund's portfolio is the responsibility of the Fixed Income Division at Grantham, Mayo, Van Otterloo & Co. LLC.
Management Discussion and Analysis of Fund Performance
The Class III shares of the GMO Core Plus Bond Fund returned -2.6% for the fiscal year ended February 29, 2008, compared with the +7.3% return for the Lehman Brothers U.S. Aggregate Index. The Fund's exposure to various issues is achieved directly and indirectly through its investment in certain underlying GMO mutual funds, primarily in the GMO Emerging Country Debt Fund, the GMO World Opportunity Overlay Fund, and the GMO Short-Duration Collateral Fund.
The Fund underperformed the benchmark during the fiscal year by 9.9%. Cash management was the primary contributor to negative performance for the fiscal year, followed by interest-rate strategy, currency selection, and emerging debt exposure losses.
More than 60% of the fiscal year's underperformance was due to mark-to-market losses in the cash collateral pools of two funds in which the Fund invests a substantial portion of its total assets: the GMO Short Duration Collateral Fund (SDCF) and the GMO World Opportunity Overlay Fund (WOOF). SDCF and WOOF primarily invest cash in high quality U.S. and foreign floating-rate fixed income securities, mainly asset-backed securities, seeking to earn a LIBOR-type return. The cash positions in SDCF and WOOF collateralize derivatives positions that seek to deliver the return of the benchmark as well as create active exposures in global interest-rate and currency markets.
With the extreme price volatility of AAA-credit quality asset-backed securities during the year, the cash pools in SDCF and WOOF underperformed LIBOR by nearly 700 basis points, directly contributing to the Core Plus Bond Fund's underperformance given the Fund's 89% exposure to these two funds.
Further Fund underperformance was attributable to interest-rate and currency strategies. For much of the fiscal year, the Fund was overweight Australian, Euro-area, Swedish, Swiss, and Canadian interest-rate markets relative to Japanese, U.K., and U.S. markets. However, the U.S., U.K., and Japanese markets were among the top performers, detracting from performance. Further, the slope and volatility strategies also underperformed, leaving only the U.S. Eurodollar directional strategy and opportunistic trading with positive contributions for the year.
In currencies, the largest negative contributors were underweight positions in euros, yen, and Canadian dollars, as well as an overweight position in Australian dollars. Partially offsetting losses were gains from overweight positions in the Swiss franc, Norwegian krone, and sterling. A major risk aversion episode during the fiscal year, prompted by the turmoil in structured credit markets, persisted for much of the third and fourth quarters. Our choice of a defensive currency during this episode, the Swiss franc, was incorrect, as risk aversion manifested itself in a swift rise in the yen, in which the Fund remained underweight. In addition, a drastic change in the relative volatilities of the currencies in August resulted in a shifting of risk positions into less advantageous, and ultimately unprofitable, intra-European trades.
A relatively minor contribution to negative performance came from the small exposure to emerging debt, where spread widening on the asset class contributed negatively, as did negative contributions from country selection.
The views expressed herein are exclusively those of Grantham, Mayo, Van Otterloo & Co. LLC Management as of the date of this report and are subject to change. GMO disclaims any responsibility to update such views. They are not meant as investment advice.
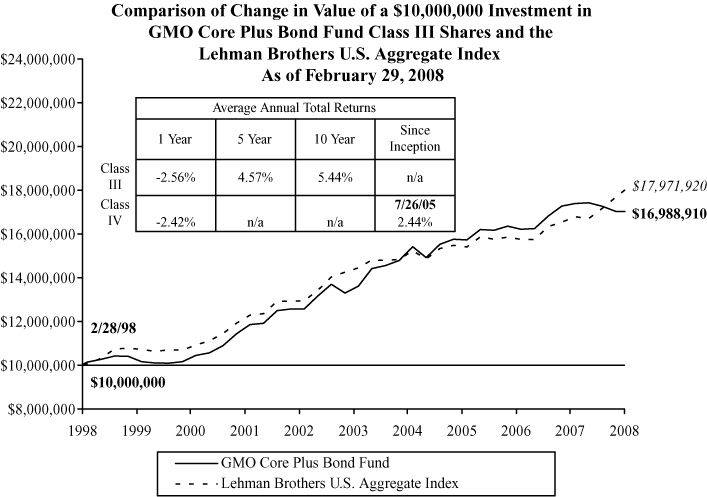
Performance data quoted represents past performance and is not indicative of future results. The investment return and principal value of an investment will fluctuate so that an investor's shares, when redeemed, may be worth more or less than their original cost. Current performance data may be lower or higher than the performance data provided herein. To obtain performance information to the most recent month-end, visit www.gmo.com. Performance shown is net of all fees after reimbursement from the Manager. Returns would have been lower had certain expenses not been reimbursed during the periods shown and do not include the effect of taxes on distributions and redemptions. All information is unaudited. Performance for Class IV will vary due to different fees.
GMO Core Plus Bond Fund
(A Series of GMO Trust)
Investments Concentration Summary
February 29, 2008 (Unaudited)
| Asset Class Summary* | % of Total Net Assets | ||||||
| Debt Obligations | 92.0 | % | |||||
| Short-Term Investments | 8.3 | ||||||
| Options Purchased | 0.3 | ||||||
| Forward Currency Contracts | 0.3 | ||||||
| Loan Participations | 0.2 | ||||||
| Preferred Stocks | 0.1 | ||||||
| Loan Assignments | 0.1 | ||||||
| Rights and Warrants | 0.0 | ||||||
| Promissory Notes | 0.0 | ||||||
| Futures | 0.0 | ||||||
| Written Options | (0.1 | ) | |||||
| Reverse Repurchase Agreements | (0.7 | ) | |||||
| Swaps | (1.2 | ) | |||||
| Other | 0.7 | ||||||
| 100.0 | % | ||||||
| Country / Region Summary** | % of Investments | ||||||
| United States | 82.2 | % | |||||
| Japan | 7.2 | ||||||
| Australia | 5.7 | ||||||
| Canada | 3.5 | ||||||
| Euro Region*** | 2.9 | ||||||
| Emerging | 2.8 | ||||||
| Switzerland | 2.6 | ||||||
| United Kingdom | (6.9 | ) | |||||
| 100.0 | % | ||||||
* The table above incorporates aggregate indirect asset class exposure associated with investments in other funds of GMO Trust ("underlying funds").
** The table above incorporates aggregate indirect country exposure associated with investments in the underlying funds. The table excludes short-term investments. The table includes exposure through the use of derivative contracts.
*** The "Euro Region" is comprised of Austria, Belgium, Finland, France, Germany, Greece, Ireland, Italy, Netherlands, Portugal and Spain.
1
GMO Core Plus Bond Fund
(A Series of GMO Trust)
Schedule of Investments
(showing percentage of total net assets)
February 29, 2008
| Par Value / Shares | Description | Value ($) | |||||||||
| DEBT OBLIGATIONS — 7.5% | |||||||||||
| Albania — 0.6% | |||||||||||
| Foreign Government Obligations | |||||||||||
| USD | 15,681,227 | Republic of Albania Par Bond, Zero Coupon, due 08/31/25 (a) (b) | 6,414,881 | ||||||||
| Canada — 0.3% | |||||||||||
| Foreign Government Obligations | |||||||||||
| CAD | 4,000,000 | Government of Canada (Cayman), 7.25%, due 06/01/08 | 4,098,511 | ||||||||
| United States — 6.6% | |||||||||||
| Corporate Debt — 2.3% | |||||||||||
| USD | 5,000,000 | Eastman Chemical Co., 7.25%, due 01/15/24 | 5,307,000 | ||||||||
| USD | 10,000,000 | General Electric Capital Corp. MTN, 5.88%, due 02/15/12 | 10,586,900 | ||||||||
| USD | 5,000,000 | Target Corp, 4.00%, due 06/15/13 | 4,891,000 | ||||||||
| USD | 5,000,000 | Verizon Global Funding Corp, 4.38%, due 06/01/13 | 5,012,700 | ||||||||
| 25,797,600 | |||||||||||
| U.S. Government — 4.3% | |||||||||||
| USD | 10,000,000 | U.S. Treasury Note, 3.25%, due 08/15/08 (c) | 10,062,500 | ||||||||
| USD | 12,000,000 | U.S. Treasury Note, 3.13%, due 10/15/08 (c) | 12,101,250 | ||||||||
| USD | 10,100,000 | U.S. Treasury Receipts, 0.00%, due 02/15/10 (b) | 9,659,007 | ||||||||
| USD | 10,100,000 | U.S. Treasury Receipts, 0.00%, due 02/15/12 (b) | 8,968,102 | ||||||||
| USD | 10,100,000 | U.S. Treasury Receipts, 0.00%, due 08/15/12 (b) | 8,797,380 | ||||||||
| 49,588,239 | |||||||||||
| Total United States | 75,385,839 | ||||||||||
| TOTAL DEBT OBLIGATIONS (COST $79,591,731) | 85,899,231 | ||||||||||
| PREFERRED STOCKS — 0.1% | |||||||||||
| United States — 0.1% | |||||||||||
| 10,000 | Home Ownership Funding 2 Preferred 144A, 13.34% | 1,544,497 | |||||||||
| TOTAL PREFERRED STOCKS (COST $2,138,851) | 1,544,497 | ||||||||||
See accompanying notes to the financial statements.
2
GMO Core Plus Bond Fund
(A Series of GMO Trust)
Schedule of Investments — (Continued)
(showing percentage of total net assets)
February 29, 2008
| Shares / Par Value ($) | Description | Value ($) | |||||||||
| MUTUAL FUNDS — 91.9% | |||||||||||
| United States — 91.9% | |||||||||||
| Affiliated Issuers | |||||||||||
| 3,732,555 | GMO Emerging Country Debt Fund, Class IV | 37,549,507 | |||||||||
| 32,466,982 | GMO Short-Duration Collateral Fund | 780,181,577 | |||||||||
| 93,858 | GMO Special Purpose Holding Fund (b) (d) | 118,261 | |||||||||
| 9,059,836 | GMO World Opportunity Overlay Fund | 232,656,595 | |||||||||
| Total United States | 1,050,505,940 | ||||||||||
| TOTAL MUTUAL FUNDS (COST $1,109,974,134) | 1,050,505,940 | ||||||||||
| SHORT-TERM INVESTMENTS — 0.9% | |||||||||||
| 3,500,000 | U.S. Treasury Bill, 1.78%, due 05/01/08 (c) (e) | 3,489,504 | |||||||||
| 4,500,000 | U.S. Treasury Bill, 1.78%, due 06/19/08 (c) (e) | 4,475,898 | |||||||||
| Money Market Funds — 0.2% | |||||||||||
| 1,713,958 | State Street Institutional Liquid Reserves Fund-Institutional Class | 1,713,958 | |||||||||
| TOTAL SHORT-TERM INVESTMENTS (COST $9,652,102) | 9,679,360 | ||||||||||
| TOTAL INVESTMENTS — 100.4% (Cost $1,201,356,818) | 1,147,629,028 | ||||||||||
| Other Assets and Liabilities (net) — (0.4%) | (4,330,847 | ) | |||||||||
| TOTAL NET ASSETS — 100.0% | $ | 1,143,298,181 | |||||||||
See accompanying notes to the financial statements.
3
GMO Core Plus Bond Fund
(A Series of GMO Trust)
Schedule of Investments — (Continued)
February 29, 2008
A summary of outstanding financial instruments at February 29, 2008 is as follows:
Forward Currency Contracts
| Settlement Date | Deliver/Receive | Units of Currency | Value | Net Unrealized Appreciation (Depreciation) | |||||||||||||||
| Buys | |||||||||||||||||||
| 3/04/08 | AUD | 24,500,000 | $ | 22,822,975 | $ | 1,159,094 | |||||||||||||
| 3/04/08 | AUD | 14,200,000 | 13,228,010 | 58,149 | |||||||||||||||
| 5/06/08 | AUD | 15,300,000 | 14,138,098 | (243,902 | ) | ||||||||||||||
| 5/06/08 | AUD | 14,800,000 | 13,676,068 | (66,028 | ) | ||||||||||||||
| 3/11/08 | CAD | 16,400,000 | 16,660,031 | 536,073 | |||||||||||||||
| 4/01/08 | CHF | 97,600,000 | 93,730,832 | 3,906,895 | |||||||||||||||
| 4/15/08 | EUR | 46,500,000 | 70,501,453 | 3,308,953 | |||||||||||||||
| 3/03/08 | GBP | 4,800,000 | 9,537,840 | 9,360 | |||||||||||||||
| 3/25/08 | GBP | 7,700,000 | 15,279,264 | 344,645 | |||||||||||||||
| 3/25/08 | GBP | 9,800,000 | 19,446,336 | 18,816 | |||||||||||||||
| 3/25/08 | GBP | 7,500,000 | 14,882,400 | 2,700 | |||||||||||||||
| 4/22/08 | JPY | 120,000,000 | 1,158,464 | 40,792 | |||||||||||||||
| 4/08/08 | NZD | 10,100,000 | 8,032,563 | 179,813 | |||||||||||||||
| 4/08/08 | NZD | 13,800,000 | 10,975,185 | (158,103 | ) | ||||||||||||||
| 4/08/08 | NZD | 16,200,000 | 12,883,913 | (228,043 | ) | ||||||||||||||
| $ | 8,869,214 | ||||||||||||||||||
| Sales | |||||||||||||||||||
| 3/04/08 | AUD | 23,400,000 | $ | 21,798,270 | $ | (1,382,238 | ) | ||||||||||||
| 3/04/08 | AUD | 15,300,000 | 14,252,715 | 246,177 | |||||||||||||||
| 3/11/08 | CAD | 40,100,000 | 40,735,808 | (75,806 | ) | ||||||||||||||
| 4/01/08 | CHF | 77,500,000 | 74,427,659 | (2,409,893 | ) | ||||||||||||||
| 4/15/08 | EUR | 15,700,000 | 23,803,716 | (259,720 | ) | ||||||||||||||
| 3/25/08 | GBP | 21,800,000 | 43,258,176 | (403,736 | ) | ||||||||||||||
| 4/22/08 | JPY | 1,460,000,000 | 14,094,649 | (523,353 | ) | ||||||||||||||
| 4/08/08 | NZD | 7,300,000 | 5,805,714 | (78,937 | ) | ||||||||||||||
| $ | (4,887,506 | ) | |||||||||||||||||
See accompanying notes to the financial statements.
4
GMO Core Plus Bond Fund
(A Series of GMO Trust)
Schedule of Investments — (Continued)
February 29, 2008
Forward Cross Currency Contracts
| Settlement Date | Deliver/Units of Currency | Receive/In Exchange For | Net Unrealized Appreciation (Depreciation) | ||||||||||||
| 3/18/08 | EUR | 34,100,000 | SEK | 320,527,290 | $ | 205,177 | |||||||||
| 3/18/08 | SEK | 200,745,390 | EUR | 21,300,000 | (214,605 | ) | |||||||||
| 4/29/08 | EUR | 34,300,000 | NOK | 270,524,100 | (314,812 | ) | |||||||||
| 4/29/08 | NOK | 92,307,150 | EUR | 11,700,000 | 101,799 | ||||||||||
| $ | (222,441 | ) | |||||||||||||
Futures Contracts
| Number of Contracts | Type | Expiration Date | Contract Value | Net Unrealized Appreciation (Depreciation) | |||||||||||||||
| Buys | |||||||||||||||||||
| 139 | Australian Government Bond 10 Yr. | March 2008 | $ | 12,719,919 | $ | 10,872 | |||||||||||||
| 529 | Australian Government Bond 3 Yr. | March 2008 | 48,446,800 | 98,786 | |||||||||||||||
| 450 | Canadian Government Bond 10 Yr. | June 2008 | 53,903,987 | 1,086,445 | |||||||||||||||
| 104 | Euro BOBL | March 2008 | 17,579,995 | 107,309 | |||||||||||||||
| 236 | Euro Bund | March 2008 | 41,940,655 | 233,270 | |||||||||||||||
| 76 | Japanese Government Bond 10 Yr. (TSE) | March 2008 | 101,296,756 | 967,196 | |||||||||||||||
| 142 | U.S. Long Bond (CBT) | June 2008 | 16,844,750 | 381,302 | |||||||||||||||
| 67 | U.S. Treasury Note 5 Yr. (CBT) | June 2008 | 7,654,750 | 102,966 | |||||||||||||||
| $ | 300,387,612 | $ | 2,988,146 | ||||||||||||||||
| Sales | |||||||||||||||||||
| 20 | Euro BOBL | March 2008 | $ | 380,768 | $ | (15,517 | ) | ||||||||||||
| 60 | Euro Bund | March 2008 | 41,940,655 | (90,274 | ) | ||||||||||||||
| 32 | U.S. Treasury Note 10 Yr. | June 2008 | 3,753,000 | (1,572 | ) | ||||||||||||||
| 324 | U.S. Treasury Note 2 Yr. (CBT) | June 2008 | 69,634,688 | (330,676 | ) | ||||||||||||||
| 618 | UK Gilt Long Bond | June 2008 | 135,460,338 | (2,315,604 | ) | ||||||||||||||
| $ | 251,169,449 | $ | (2,753,643 | ) | |||||||||||||||
See accompanying notes to the financial statements.
5
GMO Core Plus Bond Fund
(A Series of GMO Trust)
Schedule of Investments — (Continued)
February 29, 2008
Swap Agreements
Credit Default Swaps
| Notional Amount | Expiration Date | Counterparty | Receive (Pay) | Annual Premium | Deliverable On Default | Market Value | |||||||||||||||||||||||||
| 10,000,000 | USD | 12/20/2008 | Lehman Brothers | Receive | 0.27 | % | Federal Home Loan | ||||||||||||||||||||||||
| Bank System | $ | (10,538 | ) | ||||||||||||||||||||||||||||
| 350,000,000 | USD | 12/20/2008 | JP Morgan Chase Bank | (Pay) | 0.15 | % | Reference security within CDX Index | 4,339,649 | |||||||||||||||||||||||
| 5,000,000 | USD | 12/20/2009 | Deutsche Bank AG | Receive | 0.25 | % | AT&T Wireless Services, Inc. | 266 | |||||||||||||||||||||||
| 5,000,000 | USD | 12/20/2009 | Barclays Bank PLC | Receive | 0.30 | % | Boeing Capital Corp. | 662 | |||||||||||||||||||||||
| 5,000,000 | USD | 12/20/2009 | Deutsche Bank AG | Receive | 0.66 | % | Daimler AG | 5,304 | |||||||||||||||||||||||
| 5,000,000 | USD | 12/20/2009 | Barclays Bank PLC | Receive | 0.39 | % | SBC Communications, Inc. | (4,692 | ) | ||||||||||||||||||||||
| 5,000,000 | USD | 12/20/2009 | Deutsche Bank AG | Receive | 0.35 | % | The Kroger Co. | (13,451 | ) | ||||||||||||||||||||||
| 5,000,000 | USD | 12/20/2009 | Barclays Bank PLC | Receive | 0.38 | % | Weyerhaeuser Co. | (99,329 | ) | ||||||||||||||||||||||
| 5,000,000 | USD | 6/20/2010 | Barclays Bank PLC | Receive | 0.29 | % | Merrill Lynch & Co., Inc. | (196,195 | ) | ||||||||||||||||||||||
| 5,000,000 | USD | 6/20/2010 | Lehman Brothers | Receive | 0.40 | % | PSEG Power LLC | (60,559 | ) | ||||||||||||||||||||||
| 5,000,000 | USD | 6/20/2010 | Lehman Brothers | Receive | 0.20 | % | Royal Bank of Scotland PLC | (80,253 | ) | ||||||||||||||||||||||
| 5,000,000 | USD | 6/20/2010 | UBS AG | Receive | 0.52 | % | TXU Electric Delivery Co. | 21,301 | |||||||||||||||||||||||
| 5,000,000 | USD | 6/20/2010 | Barclays Bank PLC | Receive | 0.17 | % | Wachovia Corp. | (141,374 | ) | ||||||||||||||||||||||
| 5,000,000 | USD | 12/20/2010 | Barclays Bank PLC | Receive | 0.20 | % | Bank of America Corp. | (104,570 | ) | ||||||||||||||||||||||
| 5,000,000 | USD | 12/20/2010 | Barclays Bank PLC | Receive | 0.19 | % | Citigroup, Inc. | (177,023 | ) | ||||||||||||||||||||||
| 5,000,000 | USD | 12/20/2010 | Deutsche Bank AG | Receive | 0.75 | % | Enterprise Products Partners LP | (8,466 | ) | ||||||||||||||||||||||
| 5,000,000 | USD | 12/20/2010 | Citigroup | Receive | 0.39 | % | Exelon Generation Co. LLC | (96,783 | ) | ||||||||||||||||||||||
| 5,000,000 | USD | 12/20/2010 | Barclays Bank PLC | Receive | 0.45 | % | First Energy Corp. | (48,795 | ) | ||||||||||||||||||||||
| 5,000,000 | USD | 12/20/2010 | Barclays Bank PLC | Receive | 0.28 | % | JP Morgan Chase Bank | (104,703 | ) | ||||||||||||||||||||||
| 5,000,000 | USD | 12/20/2010 | UBS AG | Receive | 0.47 | % | Progress Energy, Inc. | 7,807 | |||||||||||||||||||||||
| 5,000,000 | USD | 3/20/2011 | Barclays Bank PLC | Receive | 0.25 | % | Bell South | (17,484 | ) | ||||||||||||||||||||||
| 2,000,000 | USD | 6/20/2011 | UBS AG | Receive | 0.32 | % | Boston Properties Limited Partnership | (81,994 | ) | ||||||||||||||||||||||
| 3,000,000 | USD | 6/20/2011 | Bank of America, N.A. | Receive | 0.14 | % | Credit Suisse First Boston (USA), Inc. | (56,112 | ) | ||||||||||||||||||||||
| 5,000,000 | USD | 6/20/2011 | Citigroup | Receive | 0.37 | % | Deutsche Telekom International Finance B.V. | (94,089 | ) | ||||||||||||||||||||||
See accompanying notes to the financial statements.
6
GMO Core Plus Bond Fund
(A Series of GMO Trust)
Schedule of Investments — (Continued)
February 29, 2008
| Notional Amount | Expiration Date | Counterparty | Receive (Pay) | Annual Premium | Deliverable On Default | Market Value | |||||||||||||||||||||||||
| 2,000,000 | USD | 6/20/2011 | UBS AG | Receive | 0.26 | % | ERP Operating LP | $ | (141,900 | ) | |||||||||||||||||||||
| 4,000,000 | USD | 6/20/2011 | Barclays Bank PLC | Receive | 0.20 | % | Morgan Stanley | (215,608 | ) | ||||||||||||||||||||||
| 2,000,000 | USD | 6/20/2011 | Barclays Bank PLC | Receive | 0.30 | % | Prologis | (153,357 | ) | ||||||||||||||||||||||
| 5,000,000 | USD | 6/20/2011 | Citigroup | Receive | 0.49 | % | Telecom Italia SpA | (133,756 | ) | ||||||||||||||||||||||
| 3,000,000 | USD | 6/20/2011 | Barclays Bank PLC | Receive | 0.08 | % | US Bancorp | (51,142 | ) | ||||||||||||||||||||||
| 2,000,000 | USD | 12/20/2011 | Barclays Bank PLC | Receive | 0.04 | % | UBS | (85,295 | ) | ||||||||||||||||||||||
| 2,000,000 | USD | 12/20/2011 | Barclays Bank PLC | Receive | 0.11 | % | Wachovia | (102,012 | ) | ||||||||||||||||||||||
| 5,000,000 | USD | 3/20/2013 | Barclays Bank PLC | Receive | 0.25 | % | Goldman Sachs Group, Inc. | (260,505 | ) | ||||||||||||||||||||||
| 2,000,000 | USD | 12/20/2013 | UBS AG | Receive | 0.34 | % | CIT | (418,765 | ) | ||||||||||||||||||||||
| 3,000,000 | USD | 12/20/2013 | Lehman Brothers | Receive | 0.25 | % | Mid America Energy | (68,616 | ) | ||||||||||||||||||||||
| 2,000,000 | USD | 12/20/2013 | Barclays Bank PLC | Receive | 0.25 | % | SLM Corp. | (384,174 | ) | ||||||||||||||||||||||
| 9,920,000 | USD | 3/20/2015 | JP Morgan Chase Bank | Receive | 0.70 | % | Reference security within CDX Index | 61,897 | |||||||||||||||||||||||
| 25,000,000 | USD | 6/20/2015 | JP Morgan Chase Bank | Receive | 0.65 | % | Reference security within CDX Index | (1,695,365 | ) | ||||||||||||||||||||||
| 5,000,000 | USD | 6/20/2015 | Lehman Brothers | Receive | 0.65 | % | Reference security within CDX Index | (339,073 | ) | ||||||||||||||||||||||
| 1,000,000 | USD | 12/20/2016 | UBS AG | Receive | 0.15 | % | Bank of America Corp. | (53,596 | ) | ||||||||||||||||||||||
| 1,000,000 | USD | 12/20/2016 | UBS AG | Receive | 0.12 | % | Citigroup Inc. | (90,650 | ) | ||||||||||||||||||||||
| 1,000,000 | USD | 12/20/2016 | Bank of America, N.A. | Receive | 0.17 | % | General Electric Capital Corp. | (73,779 | ) | ||||||||||||||||||||||
| 1,000,000 | USD | 12/20/2016 | Bank of America, N.A. | Receive | 0.22 | % | JP Morgan Chase Bank | (50,008 | ) | ||||||||||||||||||||||
| 1,000,000 | USD | 12/20/2016 | Barclays Bank PLC | Receive | 0.33 | % | Pacific Gas | (47,521 | ) | ||||||||||||||||||||||
| 73,000,000 | USD | 12/20/2016 | JP Morgan Chase Bank | Receive | 0.65 | % | Reference security within CDX Index | (5,051,016 | ) | ||||||||||||||||||||||
| 2,000,000 | USD | 12/20/2016 | JP Morgan Chase Bank | Receive | 0.65 | % | Reference security within CDX Index | (138,384 | ) | ||||||||||||||||||||||
| 10,000,000 | USD | 12/20/2016 | Lehman Brothers | Receive | 0.65 | % | Reference security within CDX Index | (691,920 | ) | ||||||||||||||||||||||
| 1,000,000 | USD | 12/20/2016 | Bank of America, N.A. | Receive | 0.33 | % | Well Point | (75,369 | ) | ||||||||||||||||||||||
| 5,000,000 | USD | 1/20/2024 | Goldman Sachs | (Pay) | 1.11 | % | Eastman Chemical Co. | 1,604 | |||||||||||||||||||||||
| Premiums to (Pay) Receive | $ | — | $ | (7,279,731 | ) | ||||||||||||||||||||||||||
See accompanying notes to the financial statements.
7
GMO Core Plus Bond Fund
(A Series of GMO Trust)
Schedule of Investments — (Continued)
February 29, 2008
Interest Rate Swaps
| Notional Amount | Expiration Date | Counterparty | Receive (Pay) | Fixed Rate | Variable Rate | Market Value | |||||||||||||||||||||||||
| 10,100,000 | USD | 2/15/2010 | JP Morgan | ||||||||||||||||||||||||||||
| Chase Bank | (Pay) | 0.00 | % | 3 month LIBOR | $ | (2,123,399 | ) | ||||||||||||||||||||||||
| 10,100,000 | USD | 2/15/2012 | JP Morgan Chase Bank | (Pay) | 0.00 | % | 3 month LIBOR | (2,200,564 | ) | ||||||||||||||||||||||
| 10,100,000 | USD | 8/15/2012 | JP Morgan Chase Bank | (Pay) | 0.00 | % | 3 month LIBOR | (2,197,531 | ) | ||||||||||||||||||||||
| 46,700,000 | CHF | 3/19/2013 | JP Morgan Chase Bank | Receive | 3.00 | % | 6 month CHF LIBOR | 307,654 | |||||||||||||||||||||||
| 24,300,000 | AUD | 3/19/2018 | JP Morgan Chase Bank | Receive | 7.07 | % | 6 month AUD BBSW | (307,162 | ) | ||||||||||||||||||||||
| 15,680,000 | USD | 8/31/2025 | JP Morgan Chase Bank | (Pay) | 0.00 | % | 3 month LIBOR | (2,015,196 | ) | ||||||||||||||||||||||
| Premiums to (Pay) Receive (f) | $ | 7,027,963 | $ | (8,536,198 | ) | ||||||||||||||||||||||||||
Total Return Swaps
| Notional Amount | Expiration Date | Counterparty | Pay | Receive | Market Value | ||||||||||||||||||||||
| 103,000,000 | USD | 4/30/2008 | JP Morgan | 1 month | Lehman Aggregate | ||||||||||||||||||||||
| Chase Bank | LIBOR - 0.01% | Total Return Index | $ | (94,106 | ) | ||||||||||||||||||||||
| 85,000,000 | USD | 4/30/2008 | JP Morgan Chase Bank | 1 month LIBOR - 0.10% | Lehman Mortgage Total Return Index | (213,742 | ) | ||||||||||||||||||||
| 55,000,000 | USD | 5/30/2008 | JPMorgan Chase Bank | 1 month LIBOR - 0.01% | Lehman Aggregate Total Return Index | — | |||||||||||||||||||||
| 100,000,000 | USD | 5/30/2008 | UBS AG | 1 month LIBOR - 0.09% | Lehman Mortgage Total Return Index | (285,970 | ) | ||||||||||||||||||||
| 245,000,000 | USD | 6/30/2008 | UBS AG | 1 month LIBOR - 0.09% | Lehman Mortgage Total Return Index | (700,627 | ) | ||||||||||||||||||||
| 225,000,000 | USD | 7/31/2008 | Lehman Brothers | 1 month LIBOR - 0.05% | Lehman Brothers U.S. Government Index | 1,630,090 | |||||||||||||||||||||
| 250,000,000 | USD | 8/19/2011 | Morgan Stanley | 3 month LIBOR - 0.01% | Lehman Aggregate Total Return Index | 3,842,461 | |||||||||||||||||||||
| Premiums to (Pay) Receive | $ | — | $ | 4,178,106 | |||||||||||||||||||||||
See accompanying notes to the financial statements.
8
GMO Core Plus Bond Fund
(A Series of GMO Trust)
Schedule of Investments — (Continued)
February 29, 2008
As of February 29, 2008, for the futures and/or swap contracts held, the Fund had sufficient cash and/or securities to cover any commitments or margin requirements of the relevant broker or exchange.
Notes to Schedule of Investments:
144A - Securities exempt from registration under Rule 144A of the Securities Act of 1933. These securities may be resold in transactions exempt from registration, normally to qualified institutional investors.
BBSW - Bank Bill Swap Reference Rate
LIBOR - London Interbank Offered Rate
MTN - Medium Term Note
(a) Security is backed by the U.S. Government.
(b) Security valued at fair value using methods determined in good faith by or at the direction of the Trustees of GMO Trust (Note 2).
(c) All or a portion of this security has been segregated to cover margin requirements on open financial futures contracts and/or collateral on open swap contracts (Note 2).
(d) Underlying investment represents interests in defaulted securities.
(e) Rate shown represents yield-to-maturity.
(f) Includes accretion since inception for zero coupon interest rate swaps.
Currency Abbreviations:
AUD - Australian Dollar
CAD - Canadian Dollar
CHF - Swiss Franc
EUR - Euro
GBP - British Pound
JPY - Japanese Yen
NOK - Norwegian Krone
NZD - New Zealand Dollar
SEK - Swedish Krona
USD - United States Dollar
See accompanying notes to the financial statements.
9
GMO Core Plus Bond Fund
(A Series of GMO Trust)
Statement of Assets and Liabilities — February 29, 2008
| Assets: | |||||||
| Investments in unaffiliated issuers, at value (cost $91,382,684) (Note 2) | $ | 97,123,088 | |||||
| Investments in affiliated issuers, at value (cost $1,109,974,134) (Notes 2 and 8) | 1,050,505,940 | ||||||
| Interest receivable | 551,942 | ||||||
| Unrealized appreciation on open forward currency contracts (Note 2) | 10,118,443 | ||||||
| Receivable for variation margin on open futures contracts (Note 2) | 773,193 | ||||||
| Interest receivable for open swap contracts | 4,259,412 | ||||||
| Receivable for open swap contracts (Note 2) | 10,218,695 | ||||||
| Receivable for expenses reimbursed by Manager (Note 3) | 54,214 | ||||||
| Total assets | 1,173,604,927 | ||||||
| Liabilities: | |||||||
| Payable for investments purchased | 1,400,000 | ||||||
| Payable to broker for closed futures contracts | 105,452 | ||||||
| Payable to affiliate for (Note 3): | |||||||
| Management fee | 227,954 | ||||||
| Shareholder service fee | 96,189 | ||||||
| Trustees and Chief Compliance Officer of GMO Trust fees | 1,296 | ||||||
| Unrealized depreciation on open forward currency contracts (Note 2) | 6,359,176 | ||||||
| Payable for open swap contracts (Note 2) | 21,856,518 | ||||||
| Payable for closed swap contracts (Note 2) | 24,662 | ||||||
| Accrued expenses | 235,499 | ||||||
| Total liabilities | 30,306,746 | ||||||
| Net assets | $ | 1,143,298,181 | |||||
See accompanying notes to the financial statements.
10
GMO Core Plus Bond Fund
(A Series of GMO Trust)
Statement of Assets and Liabilities — February 29, 2008 — (Continued)
| Net assets consist of: | |||||||
| Paid-in capital | $ | 1,292,610,818 | |||||
| Distributions in excess of net investment income | (42,886,045 | ) | |||||
| Accumulated net realized loss | (52,008,951 | ) | |||||
| Net unrealized depreciation | (54,417,641 | ) | |||||
| $ | 1,143,298,181 | ||||||
| Net assets attributable to: | |||||||
| Class III shares | $ | 125,505,802 | |||||
| Class IV shares | $ | 1,017,792,379 | |||||
| Shares outstanding: | |||||||
| Class III | 13,317,527 | ||||||
| Class IV | 107,863,196 | ||||||
| Net asset value per share: | |||||||
| Class III | $ | 9.42 | |||||
| Class IV | $ | 9.44 | |||||
See accompanying notes to the financial statements.
11
GMO Core Plus Bond Fund
(A Series of GMO Trust)
Statement of Operations — Year Ended February 29, 2008
| Investment Income: | |||||||
| Dividends from affiliated issuers (Note 8) | $ | 48,204,847 | |||||
| Interest | 6,983,074 | ||||||
| Dividends | 199,023 | ||||||
| Total investment income | 55,386,944 | ||||||
| Expenses: | |||||||
| Management fee (Note 3) | 3,505,853 | ||||||
| Shareholder service fee – Class III (Note 3) | 219,151 | ||||||
| Shareholder service fee – Class IV (Note 3) | 1,256,241 | ||||||
| Custodian, fund accounting agent and transfer agent fees | 519,492 | ||||||
| Audit and tax fees | 80,239 | ||||||
| Legal fees | 46,277 | ||||||
| Trustees fees and related expenses (Note 3) | 14,246 | ||||||
| Registration fees | 2,760 | ||||||
| Miscellaneous | 9,941 | ||||||
| Total expenses | 5,654,200 | ||||||
| Fees and expenses reimbursed by Manager (Note 3) | (644,186 | ) | |||||
| Expense reductions (Note 2) | (50,284 | ) | |||||
| Indirectly incurred fees waived or borne by Manager (Note 3) | (187,143 | ) | |||||
| Shareholder service fee waived (Note 3) | (44,451 | ) | |||||
| Net expenses | 4,728,136 | ||||||
| Net investment income (loss) | 50,658,808 | ||||||
| Realized and unrealized gain (loss): | |||||||
| Net realized gain (loss) on: | |||||||
| Investments in unaffiliated issuers | (6,200,099 | ) | |||||
| Investments in affiliated issuers | 1,233,890 | ||||||
| Realized gains distributions from affiliated issuers (Note 8) | 2,411,835 | ||||||
| Closed futures contracts | (49,427,272 | ) | |||||
| Closed swap contracts | 58,100,691 | ||||||
| Foreign currency, forward contracts and foreign currency related transactions | (13,785,155 | ) | |||||
| Net realized gain (loss) | (7,666,110 | ) | |||||
| Change in net unrealized appreciation (depreciation) on: | |||||||
| Investments in unaffiliated issuers | 3,887,420 | ||||||
| Investments in affiliated issuers | (54,389,587 | ) | |||||
| Open futures contracts | 3,163,853 | ||||||
| Open swap contracts | (24,657,328 | ) | |||||
| Foreign currency, forward contracts and foreign currency related transactions | (6,745,543 | ) | |||||
| Net unrealized gain (loss) | (78,741,185 | ) | |||||
| Net realized and unrealized gain (loss) | (86,407,295 | ) | |||||
| Net increase (decrease) in net assets resulting from operations | $ | (35,748,487 | ) | ||||
See accompanying notes to the financial statements.
12
GMO Core Plus Bond Fund
(A Series of GMO Trust)
Statement of Changes in Net Assets
| Year Ended February 29, 2008 | Year Ended February 28, 2007 | ||||||||||
| Increase (decrease) in net assets: | |||||||||||
| Operations: | |||||||||||
| Net investment income (loss) | $ | 50,658,808 | $ | 119,373,878 | |||||||
| Net realized gain (loss) | (7,666,110 | ) | 64,383,082 | ||||||||
| Change in net unrealized appreciation (depreciation) | (78,741,185 | ) | (4,611,340 | ) | |||||||
| Net increase (decrease) in net assets from operations | (35,748,487 | ) | 179,145,620 | ||||||||
| Distributions to shareholders from: | |||||||||||
| Net investment income | |||||||||||
| Class III | (12,275,863 | ) | (9,204,300 | ) | |||||||
| Class IV | (99,097,283 | ) | (140,512,830 | ) | |||||||
| Total distributions from net investment income | (111,373,146 | ) | (149,717,130 | ) | |||||||
| Net share transactions (Note 7): | |||||||||||
| Class III | (45,249,825 | ) | 35,129,910 | ||||||||
| Class IV | (1,033,993,070 | ) | (461,382,628 | ) | |||||||
| Increase (decrease) in net assets resulting from net share transactions | (1,079,242,895 | ) | (426,252,718 | ) | |||||||
| Total increase (decrease) in net assets | (1,226,364,528 | ) | (396,824,228 | ) | |||||||
| Net assets: | |||||||||||
| Beginning of period | 2,369,662,709 | 2,766,486,937 | |||||||||
| End of period (including distributions in excess of net investment income of $42,886,045 and $2,248,853, respectively) | $ | 1,143,298,181 | $ | 2,369,662,709 | |||||||
See accompanying notes to the financial statements.
13
GMO Core Plus Bond Fund
(A Series of GMO Trust)
Financial Highlights
(For a Class III share outstanding throughout each period)
| Year Ended February 28/29, | |||||||||||||||||||||||
| 2008 | 2007 | 2006 | 2005 | 2004 | |||||||||||||||||||
| Net asset value, beginning of period | $ | 10.49 | $ | 10.32 | $ | 10.35 | $ | 10.40 | $ | 9.95 | |||||||||||||
| Income (loss) from investment operations: | |||||||||||||||||||||||
| Net investment income (loss)(a)† | 0.37 | 0.43 | 0.15 | 0.18 | 0.25 | ||||||||||||||||||
| Net realized and unrealized gain (loss) | (0.63 | ) | 0.27 | 0.17 | 0.24 | 0.91 | |||||||||||||||||
| Total from investment operations | (0.26 | ) | 0.70 | 0.32 | 0.42 | 1.16 | |||||||||||||||||
| Less distributions to shareholders: | |||||||||||||||||||||||
| From net investment income | (0.81 | ) | (0.53 | ) | (0.35 | ) | (0.25 | ) | (0.28 | ) | |||||||||||||
| From net realized gains | — | — | — | (0.22 | ) | (0.43 | ) | ||||||||||||||||
| Total distributions | (0.81 | ) | (0.53 | ) | (0.35 | ) | (0.47 | ) | (0.71 | ) | |||||||||||||
| Net asset value, end of period | $ | 9.42 | $ | 10.49 | $ | 10.32 | $ | 10.35 | $ | 10.40 | |||||||||||||
| Total Return(b) | (2.56 | )% | 6.85 | % | 3.10 | % | 4.01 | % | 11.99 | % | |||||||||||||
| Ratios/Supplemental Data: | |||||||||||||||||||||||
| Net assets, end of period (000's) | $ | 125,506 | $ | 187,045 | $ | 148,476 | $ | 1,216,251 | $ | 602,824 | |||||||||||||
| Net expenses to average daily net assets(c) | 0.39 | %(d) | 0.39 | % | 0.39 | % | 0.39 | % | 0.39 | % | |||||||||||||
| Net investment income to average daily net assets(a) | 3.70 | % | 4.11 | % | 1.40 | % | 1.77 | % | 2.43 | % | |||||||||||||
| Portfolio turnover rate | 44 | % | 72 | % | 62 | % | 108 | % | 114 | % | |||||||||||||
| Fees and expenses reimbursed and/or waived by the Manager to average daily net assets: | 0.06 | % | 0.06 | % | 0.06 | % | 0.07 | % | 0.09 | % | |||||||||||||
(a) Net investment income is affected by the timing of the declaration of dividends by the underlying funds in which the Fund invests.
(b) The total returns would have been lower had certain expenses not been reimbursed and/or waived during the periods shown and assumes the effect of reinvested distributions.
(c) Net expenses exclude expenses incurred indirectly through investment in the underlying funds (See Note 3).
(d) The net expense ratio does not include the effect of expense reductions.
† Calculated using average shares outstanding throughout the period.
See accompanying notes to the financial statements.
14
GMO Core Plus Bond Fund
(A Series of GMO Trust)
Financial Highlights
(For a Class IV share outstanding throughout each period)
| Year Ended February 28/29, | |||||||||||||||
| 2008 | 2007 | 2006(a) | |||||||||||||
| Net asset value, beginning of period | $ | 10.50 | $ | 10.33 | $ | 10.46 | |||||||||
| Income (loss) from investment operations: | |||||||||||||||
| Net investment income (loss)(b)† | 0.36 | 0.45 | 0.23 | ||||||||||||
| Net realized and unrealized gain (loss) | (0.61 | ) | 0.26 | (0.01 | )(c) | ||||||||||
| Total from investment operations | (0.25 | ) | 0.71 | 0.22 | |||||||||||
| Less distributions to shareholders: | |||||||||||||||
| From net investment income | (0.81 | ) | (0.54 | ) | (0.35 | ) | |||||||||
| Total distributions | (0.81 | ) | (0.54 | ) | (0.35 | ) | |||||||||
| Net asset value, end of period | $ | 9.44 | $ | 10.50 | $ | 10.33 | |||||||||
| Total Return(d) | (2.42 | )% | 6.90 | % | 2.06 | %** | |||||||||
| Ratios/Supplemental Data: | |||||||||||||||
| Net assets, end of period (000's) | $ | 1,017,792 | $ | 2,182,618 | $ | 2,618,011 | |||||||||
| Net expenses to average daily net assets(e) | 0.34 | %(f) | 0.34 | % | 0.34 | %* | |||||||||
| Net investment income to average daily net assets(b) | 3.60 | % | 4.33 | % | 2.16 | %(g) | |||||||||
| Portfolio turnover rate | 44 | % | 72 | % | 62 | %‡ | |||||||||
| Fees and expenses reimbursed and/or waived by the Manager to average daily net assets: | 0.06 | % | 0.06 | % | 0.07 | %* | |||||||||
(a) Period from July 26, 2005 (commencement of operations) through February 28, 2006.
(b) Net investment income is affected by the timing of the declaration of dividends by the underlying funds in which the Fund invests.
(c) The per share amount is not in accord with the net realized and unrealized gain (loss) on investments for the period because of the timing of sales of Fund shares and the amount of the per share realized and unrealized gains and losses at such time.
(d) The total returns would have been lower had certain expenses not been reimbursed and/or waived during periods shown and assumes the effect of reinvested distributions.
(e) Net expenses exclude expenses incurred indirectly through investment in the underlying funds (See Note 3).
(f) The net expense ratio does not include the effect of expense reductions.
(g) The ratio for the period ended February 28, 2006 has not been annualized since the Fund believes it would not be appropriate because the Fund's net income is not earned ratably throughout the fiscal year.
† Calculated using average shares outstanding throughout the period.
‡ Calculation represents portfolio turnover of the Fund for the year ended February 28, 2006.
* Annualized.
** Not annualized.
See accompanying notes to the financial statements.
15
GMO Core Plus Bond Fund
(A Series of GMO Trust)
Notes to Financial Statements
February 29, 2008
1. Organization
GMO Core Plus Bond Fund (the "Fund") is a series of GMO Trust (the "Trust"). The Fund is registered under the Investment Company Act of 1940, as amended, as an open-end, non-diversified management investment company. The Fund is advised and managed by Grantham, Mayo, Van Otterloo & Co. LLC (the "Manager" or "GMO"). The Trust was established as a Massachusetts business trust under the laws of the Commonwealth of Massachusetts on June 24, 1985. The Declaration of Trust permits the Trustees of the Trust ("Trustees") to create an unlimited number of series of shares ("Funds") and to subdivide Funds into classes.
The Fund seeks total return in excess of that of the Lehman Brothers U.S. Aggregate Index. The Fund typically invests in bonds included in the Lehman Brothers U.S. Aggregate Index and in securities and instruments with similar characteristics. The Fund seeks additional returns by investing in global interest rate, currency, and emerging country debt markets. The Fund may invest a substantial portion of its total assets in shares of GMO Short-Duration Collateral Fund; in futures contracts, currency options, currency forwards, swap contracts, and other types of derivatives; in U.S. and foreign investment-grade bonds, including U.S. and foreign government securities and asset-backed securities issued by U.S. government agencies (including securities neither guaranteed nor insured by the U.S. government) and foreign governments, corporate bonds, and mortgage-backed and other asset-backed securities issued by private issuers; to a si gnificant extent in credit default swaps; in shares of GMO World Opportunity Overlay Fund; and up to 5% of the Fund's total assets in sovereign debt of emerging countries (including below investment grade securities), primarily through investment in shares of GMO Emerging Country Debt Fund ("ECDF").
As of February 29, 2008, the Fund had two classes of shares outstanding: Class III and Class IV. Each class of shares bears a different level of shareholder service fees.
The financial statements of the series of the Trust in which the Fund invests ("underlying funds") should be read in conjunction with the Fund's financial statements. These financial statements are available, without charge, upon request by calling (617) 346-7646 (collect). Shares of GMO Short-Duration Collateral Fund, GMO World Opportunity Overlay Fund and GMO Special Purpose Holding Fund are not publicly available for direct purchase.
2. Significant accounting policies
The following is a summary of significant accounting policies which are in conformity with accounting principles generally accepted in the United States of America ("U.S. GAAP") and which are consistently followed by the Fund in the preparation of its financial statements. The preparation of financial statements in accordance with U.S. GAAP requires management to make estimates and assumptions that affect the
16
GMO Core Plus Bond Fund
(A Series of GMO Trust)
Notes to Financial Statements — (Continued)
February 29, 2008
reported amounts and disclosures in the financial statements. Actual results could differ from those estimates. The accounting records of the Fund are maintained in U.S. dollars.
Portfolio valuation
Securities listed on a securities exchange for which market quotations are readily available are valued at the last sale price or official closing price on each business day, or if there is no such reported sale or official closing price, at the most recent quoted bid price. Unlisted securities for which market quotations are readily available are generally valued at the most recent quoted bid price. Short-term investments with a remaining maturity of sixty days or less are generally valued at amortized cost, which approximates fair value. Shares of investment funds are valued at their net asset value. Securities for which quotations are not readily available or whose values the Manager has determined to be unreliable are valued at fair value as determined in good faith by the Trustees or other persons acting at their direction pursuant to procedures approved by the Trustees. By its nature, a fair value price is a good faith est imate of the value of a security at a given point in time and may not reflect the value that would be realized if the security was sold and the differences could be material.
Fixed income securities held by the Fund or the underlying funds are typically valued pursuant to prices supplied by a primary pricing source chosen by the Manager. The Manager evaluates such primary pricing sources on an ongoing basis, and may change a pricing source should it deem it appropriate. The Manager, at its discretion, may override a price supplied by a primary source by using a price provided by another source if such action is deemed appropriate. The prices provided by such primary pricing sources may differ from the value that would be realized if the securities were sold and the differences could be material.
Certain securities held by the Fund or the underlying funds are valued on the basis of a price provided by a single source. The prices provided may differ from the value that would be realized if the securities were sold and the differences could be material. As of February 29, 2008, the total value of these securities represented 30.14% of net assets.
The Fund indirectly invests through underlying funds in securities with contractual cash flows, such as asset backed securities, collateralized mortgage obligations and commercial mortgage backed securities, including securities backed by subprime mortgage loans. The value, liquidity and related income of these securities are sensitive to changes in economic conditions, including real estate value, delinquencies and/or defaults, and may be adversely affected by shifts in the market's perception of the securities' market values and changes in interest rates.
GMO Special Purpose Holding Fund ("SPHF"), is an investment of the Fund, has litigation pending against various entities related to the default of certain asset-backed securities previously held by SPHF. For the year ended February 29, 2008, the Fund received $608,760 through SPHF in conjunction with settlement agreements related to the default of those securities.
17
GMO Core Plus Bond Fund
(A Series of GMO Trust)
Notes to Financial Statements — (Continued)
February 29, 2008
Foreign currency translation
The market values of foreign securities, currency holdings and other assets and liabilities are translated to U.S. dollars based on the current exchange rates each business day. Income and expenses denominated in foreign currencies are translated at current exchange rates when accrued or incurred. The Fund does not isolate realized and unrealized gains and losses attributable to changes in exchange rates from gains and losses that arise from changes in the market value of investments. Such fluctuations are included with net realized and unrealized gain or loss on investments. Net realized gains and losses on foreign currency transactions represent gains and losses on disposition of currencies and forward currency contracts, currency gains and losses realized between the trade and settlement dates on securities transactions, and the difference between the amount of investment income and foreign withholding taxes recorded on the F und's accounting records and the U.S. dollar equivalent amounts actually received or paid.
Forward currency contracts
The Fund may enter into forward currency contracts including forward cross currency contracts. A forward currency contract is an agreement between two parties to buy and sell a currency at a set price on a future date. The market value of a forward currency contract fluctuates with changes in forward currency exchange rates. Forward currency contracts are marked to market daily using rates supplied by a quotation service and changes in value are recorded by the Fund as an unrealized gain or loss. Realized gains or losses equal to the difference between the value of the contract at the time it was opened and the value at the time it was closed are recorded upon delivery or receipt of the currency or, if a forward currency contract is offset by entering into another forward currency contract with the same broker, upon settlement of the net gain or loss. These contracts may involve market risk in excess of the unrealized gain or lo ss reflected in the Fund's Statement of Assets and Liabilities. In addition, the Fund could be exposed to risk if the counterparties are unable to meet the terms of the contracts or if there are movements in currency values that are unfavorable to the Fund. Forward currency contracts outstanding at the end of the period are listed in the Fund's Schedule of Investments.
Futures contracts
The Fund may purchase and sell futures contracts. Upon entering into a futures contract, the Fund is required to deposit with the futures clearing broker an amount of cash, U.S. government and agency obligations, or other liquid assets in accordance with the initial margin requirements of the broker or exchange. In addition, the Fund maintains cash or securities in an amount that at least equals the net amount payable in the event the Fund must deliver the full amount of the contracts. Futures contracts are marked to market daily and an appropriate payable or receivable for the change in value ("variation margin") is recorded by the Fund. The payable or receivable is liquidated on the following business day. Gains or losses are recognized but not considered realized until the contracts expire or are closed. Futures contracts involve, to varying degrees, risk of loss in excess of the variation margin disclosed in the Statement of Assets and Liabilities. Under certain circumstances, futures exchanges may establish daily limits on the amount that the price of a futures contract can vary from the previous day's settlement price, thereby effectively preventing liquidation of unfavorable positions. Losses may arise from changes in the
18
GMO Core Plus Bond Fund
(A Series of GMO Trust)
Notes to Financial Statements — (Continued)
February 29, 2008
value of the underlying instrument if the Fund is unable to liquidate a futures position due to an illiquid secondary market for the contracts or the imposition of price limits, or if counterparties do not perform under the contract terms. Futures contracts are generally valued at the settlement price established each day by the board of trade or exchange on which they are traded. Futures contracts outstanding at the end of the period are listed in the Fund's Schedule of Investments.
Options
The Fund may write call and put options. Writing options increases the Fund's exposure to the underlying instrument by, in the case of a call option, obligating the Fund to sell the underlying instrument at a set price to the option-holder and, in the case of a put option, obligating the Fund to purchase the underlying instrument at a set price from the option-holder. When the Fund writes a call or put option, an amount equal to the premium received is recorded as a liability and subsequently marked to market to reflect the current value of the option written. Premiums received from writing options which expire are treated as realized gains. Premiums received from writing options which are exercised or closed are added to the proceeds or offset against the amounts paid on the underlying future, security or currency transaction to determine the realized gain or loss. The Fund as a writer of an option has no control over whether t he underlying future, security or currency may be sold (call) or purchased (put) and as a result bears the market risk of an unfavorable change in the price of the future, security or currency underlying the written option. In the event that the Fund writes uncovered call options (i.e. options for investments that the Fund does not own), it bears the risk of incurring substantial losses if the price of the underlying instrument increases during the term of the option. There is the risk the Fund may not be able to enter into a closing transaction because of an illiquid market. There were no open written option contracts during the period.
The Fund may also purchase put and call options. Purchasing options alters the Fund's exposure to the underlying instrument by, in the case of a call option, entitling the Fund to purchase the underlying instrument at a set price from the writer of the option and, in the case of a put option, entitling the Fund to sell the underlying instrument at a set price to the writer of the option. The Fund pays a premium as a cost for a purchased option disclosed in the Schedule of Investments which is subsequently marked to market to reflect the current value of the option. Premiums paid for purchasing options which expire are treated as realized losses. Premiums paid for purchasing options which are exercised or closed are added to the amounts paid or offset against the proceeds on the closing transaction to determine the realized gain or loss. The risk associated with purchasing put and call options is limited to the premium paid. Ther e were no purchased option contracts outstanding at the end of the period.
Exchange traded options are valued at the last sale price, or if no sale is reported, the last bid price for purchased options and the last ask price for written options. Options traded over-the-counter are valued using prices supplied by a primary pricing source chosen by the Manager.
19
GMO Core Plus Bond Fund
(A Series of GMO Trust)
Notes to Financial Statements — (Continued)
February 29, 2008
Indexed securities
The Fund may invest in indexed securities where the redemption values and/or coupons are linked to the prices of a specific instrument or financial statistic. The Fund uses indexed securities to increase or decrease its exposure to different underlying instruments and to gain exposure to markets in which it may be difficult to invest through conventional securities. Indexed securities may be more volatile than their underlying instruments, but any loss is limited to the amount of the original investment. There were no indexed securities held by the Fund at the end of the period.
Swap agreements
The Fund may enter into swap agreements. A swap is an agreement to exchange the return generated by one instrument for the return generated by another instrument. Interest rate swap agreements involve the exchange by one party with another party of their respective commitments to pay or receive interest, e.g., an exchange of floating rate payments for fixed rate payments with respect to a notional amount of principal. Total return swap agreements involve a commitment by one party in the agreement to pay interest in exchange for a market-linked return, both based on notional amounts. To the extent the total return of the security or index underlying the transaction exceeds or falls short of the offsetting interest rate obligation, the party will receive a payment from or make a payment to the counterparty, respectively. Forward spread lock swap agreements involve commitments to pay or receive a settlement amount calculated as the difference between the swap spread and a fixed spread, multiplied by the notional amount times the duration of the swap rate. The swap spread is the difference between the benchmark swap rate (market rate) and the specific treasury rate. In a credit default swap, one party makes a stream of payments to another party in exchange for the right to receive a specified return in the event of a default by a third party on its obligation. Credit default swaps may be used to provide a measure of protection against defaults of sovereign or corporate issuers (i.e., to reduce risk where a party owns or has exposure to the issuer) or to take an active long or short position with respect to the likelihood of a particular issuer's default. Variance swap agreements involve commitments to pay or receive a settlement amount calculated as the difference between the annualized realized variance of returns on the underlying price and a fixed quantity, also known as the variance strike, over a period of time. In connection with these agreements, cash or securities may be set aside as collateral by the Fund's custodian or brokers in accordance with the terms of the swap agreement. The Fund earns or pays interest on cash set aside as collateral.
Swaps are marked to market daily using models that incorporate quotations from market makers and the change in value, if any, is recorded as unrealized gain or loss in the Statement of Operations. Payments received or made on swap contracts are recorded as realized gain or loss in the Statement of Operations. Gains or losses are realized upon early termination of the swap agreements. These financial instruments are not actively traded on financial markets. The values assigned to these instruments are based upon the best available information and because of the uncertainty of the valuation, these values may differ significantly from the values that would have been realized had a ready market for these instruments existed, and the differences could be material. Entering into these agreements involves, to varying degrees, elements of credit, legal, market and documentation risk in excess of the amounts recognized in the
20
GMO Core Plus Bond Fund
(A Series of GMO Trust)
Notes to Financial Statements — (Continued)
February 29, 2008
Statement of Assets and Liabilities. Such risks involve the possibility that there will be no liquid market for these agreements, that the counterparties to the agreements may default on their obligations to perform or disagree as to the meaning of contractual terms in the agreements, or that there may be unfavorable changes in interest rates or the price of the index or security underlying these transactions. Swap agreements outstanding at the end of the period are listed in the Fund's Schedule of Investments.
Repurchase agreements
The Fund may enter into repurchase agreements with banks and broker-dealers whereby the Fund acquires a security for cash and obtains a simultaneous commitment from the seller to repurchase the security at an agreed upon price and date. The Fund, through its custodian, takes possession of securities collateralizing the repurchase agreement. The collateral is marked to market daily to ensure that the market value of the underlying assets remains sufficient to protect the Fund in the event of default by the seller. Collateral for certain tri-party repurchase agreements is held at the counterparty's custodian in a segregated account for the benefit of the Fund and the counterparty. In connection with transactions in repurchase agreements, if the seller defaults or enters into insolvency proceedings and the value of the collateral declines, recovery of cash by the Fund may be delayed or limited. There were no repurchase agreements o utstanding at the end of the period.
Reverse repurchase agreements
The Fund may enter into reverse repurchase agreements with banks and broker-dealers whereby the Fund sells portfolio assets concurrent with an agreement by the Fund to repurchase the same assets at a later date at a fixed price. In connection with these agreements, the Fund establishes segregated accounts with its custodian in which the Fund maintains cash, U.S. government securities or other assets equal in value to its obligations in respect of reverse repurchase agreements. Reverse repurchase agreements involve the risk that the market value of the securities the Fund has sold under the agreement may decline below the price at which the Fund is obligated to repurchase under the agreement. The market value of the securities the Fund has sold is determined daily and any additional required collateral is allocated to or sent by the Fund on the next business day. There were no reverse repurchase agreements outstanding at the end of the period.
Delayed delivery commitments
The Fund may purchase or sell securities on a when-issued or forward commitment basis. Payment and delivery may take place a month or more after the date of the transaction. The price of the underlying securities and the date when the securities will be delivered and paid for are fixed at the time the transaction is negotiated. Collateral consisting of liquid securities or cash and cash equivalents is maintained with the custodian in an amount at least equal to these commitments. There were no delayed delivery commitments outstanding at the end of the period.
21
GMO Core Plus Bond Fund
(A Series of GMO Trust)
Notes to Financial Statements — (Continued)
February 29, 2008
Securities lending
The Fund may lend its securities to certain qualified broker-dealers. The loans are collateralized with cash or liquid securities with a market value at least equal to the market value of the securities on loan. As with other extensions of credit, the Fund may bear the risk of loss with respect to the investment of the collateral, the risk of delay in and/or inability to exercise its rights with respect to the collateral, and the risk of delay in recovery or loss of rights in the loaned securities should the borrower of the securities fail financially. If a loan is collateralized by U.S. government securities, the Fund receives a fee from the borrower. If a loan is collateralized by cash, the Fund typically invests the cash collateral for its own account in interest-bearing, short-term securities and pays a fee to the borrower that normally represents a portion of the Fund's earnings on the collateral. For the year ended Februar y 29, 2008, the Fund did not participate in securities lending.
Taxes and distributions
The Fund intends to qualify each tax year as a regulated investment company under Subchapter M of the Internal Revenue Code of 1986, as amended (the "Code"). The Fund intends to distribute substantially all of its net investment income and net realized short-term and long-term capital gains, if any, after giving effect to any available capital loss carryovers for U.S. federal income tax purposes. Therefore, no provision for U.S. federal income or excise tax is necessary. Taxes on foreign interest and dividend income are generally withheld in accordance with the applicable country's tax treaty with the United States.
The Fund's policy is to declare and pay distributions from net investment income, if any, semiannually, and from net realized short-term and long-term capital gains, if any, at least annually. All distributions are paid in shares of the Fund, at net asset value, unless the shareholder elects to receive cash distributions. Distributions to shareholders are recorded by the Fund on the ex-dividend date.
Income and capital gain distributions are determined in accordance with U.S. federal income tax regulations, which may differ from U.S. GAAP. Certain capital accounts in the financial statements are periodically adjusted for permanent differences in order to reflect their tax character. These adjustments have no impact on net assets or net asset value per share. Temporary differences which arise from recognizing certain items of income, expense, gain or loss in different periods for financial statement and tax purposes will reverse at some time in the future. Distributions in excess of net investment income or net realized gains are temporary over distributions for financial statement purposes resulting from differences in the recognition or classification of income or distributions for financial statement and tax purposes.
U.S. GAAP and tax accounting differences primarily relate to capital loss carryforwards, derivative contract transactions, foreign currency transactions, losses on wash sale transactions, partnership interest tax allocations, post-October capital losses and differing treatment of accretion and amortization.
22
GMO Core Plus Bond Fund
(A Series of GMO Trust)
Notes to Financial Statements — (Continued)
February 29, 2008
The following reclassification represents the amount necessary to report the stated components of net assets on a tax basis, excluding certain temporary differences, as of February 29, 2008. The financial highlights exclude these adjustments.
| Distributions In Excess Of Net Investment Income | Accumulated Net Realized Loss | Paid-in Capital | |||||||||
| $ | 20,077,146 | $ | (20,236,622 | ) | $ | 159,476 | |||||
The tax character of distributions declared to shareholders is as follows:
| 2/29/2008 | 2/28/2007 | ||||||||||
| Ordinary income (including any short-term capital gains) | $ | 111,373,146 | $ | 149,717,130 | |||||||
| Total distributions | $ | 111,373,146 | $ | 149,717,130 | |||||||
Distributions in excess of tax basis earnings and profits, if significant, are reported in the financial statements as a tax return of capital.
As of February 29, 2008, the components of distributable earnings on a tax basis consisted of the following:
| Undistributed ordinary income | $ | 33,474,329 | |||||
As of February 29, 2008, the Fund elected to defer to March 1, 2008 post-October capital losses of $26,648,463.
As of February 29, 2008, the Fund had capital loss carryforwards available to offset future realized gains if any, to the extent permitted by the Code. Utilization of the capital loss carryforwards could be subject to limitations imposed by the Code related to share ownership activity. Such losses expire as follows:
| 2/28/2014 | $ | (34,693,380 | ) | ||||
| 2/28/2015 | (2,795,728 | ) | |||||
| 2/29/2016 | (33,008,915 | ) | |||||
| Total | $ | (70,498,023 | ) | ||||
23
GMO Core Plus Bond Fund
(A Series of GMO Trust)
Notes to Financial Statements — (Continued)
February 29, 2008
As of February 29, 2008, the approximate cost for U.S. federal income tax purposes and gross and net unrealized appreciation and depreciation in value of investments were as follows:
| Aggregate Cost | Gross Unrealized Appreciation | Gross Unrealized (Depreciation) | Net Unrealized Appreciation (Depreciation) | ||||||||||||
| $ | 1,228,297,977 | $ | 6,561,625 | $ | (87,230,574 | ) | $ | (80,668,949 | ) | ||||||
Security transactions and related investment income
Security transactions are accounted for on trade date. Dividend income, net of applicable foreign withholding taxes, if any, is recorded on the ex-dividend date, or when the Fund is informed of the ex-dividend date, if later. Interest income is recorded on the accrual basis and is adjusted for the amortization of premiums and accretion of discounts. Interest income on inflation indexed securities, if any, is accrued daily based upon an inflation adjusted principal. Additionally, any increase or decrease in the principal or face amount of the securities adjusted for inflation is recorded as interest income or loss. Income is not recognized on securities for which collection is not expected. Non-cash dividends, if any, are recorded at the fair market value of the securities received. In determining the net gain or loss on securities sold, the cost of securities is determined on the identified cost basis.
Expenses
The majority of expenses of the Trust are directly identifiable to an individual fund. Expenses which are not readily identifiable to a specific fund are allocated taking into consideration, among other things, the nature and type of expense and the relative size of the funds. Investment income, common expenses and realized and unrealized gains and losses are allocated pro rata among the classes of shares of the Fund based on the relative net assets of each class. Shareholder service fees, which are directly attributable to a class of shares, are charged to that class's operations. In addition, the Fund will also incur certain fees and expenses indirectly as a shareholder in the underlying funds. Because the underlying funds have varied expense and fee levels and the Fund may own different proportions of the underlying funds at different times, the amount of fees and expenses indirectly incurred by the Fund will vary (See Note 3 ).
State Street Bank and Trust Company ("State Street") serves as custodian, fund accounting agent and transfer agent of the Fund. State Street's fee may be reduced by credits that are an earnings allowance calculated on the average daily cash balances the Fund maintains with State Street. Credit balances used to reduce the fee paid to State Street, if any, are reported as a reduction of expenses in the Statement of Operations.
Investment risks
There are certain additional risks involved in investing in foreign securities that are not inherent in investments in U.S. securities. These risks may involve adverse political and economic developments
24
GMO Core Plus Bond Fund
(A Series of GMO Trust)
Notes to Financial Statements — (Continued)
February 29, 2008
including the possible imposition of capital controls or other foreign governmental laws or restrictions. In addition, the securities of some foreign companies and securities markets are less liquid and at times may be more volatile than securities of comparable U.S. companies and U.S. securities markets. The risks described above apply to an even greater extent to investments in emerging markets. The securities markets of emerging countries are generally smaller, less developed, less liquid, and more volatile than the securities markets of the U.S. and developed foreign markets.
Recently issued accounting pronouncements
In June 2006, the Financial Accounting Standards Board ("FASB") issued FASB Interpretation No. 48, Accounting for Uncertainty in Income Taxes - an Interpretation of FASB Statement No. 109 ("FIN 48"). FIN 48 clarifies the accounting for uncertainty in income taxes recognized in accordance with FASB Statement No. 109, Accounting for Income Taxes. FIN 48 prescribes a recognition threshold and measurement attribute for a tax position taken or expected to be taken in the tax return that could impact the Fund's financial statements. It also provides guidance in relation to the Fund's financial statements on classification of tax benefits or liabilities, interest and penalties, accounting in interim periods, disclosure, and transition. FIN 48 is effective for fiscal years beginning after December 15, 2006 for registered investment companies. Management has evaluated the effects of applying the various provisions of FIN 48 and has deter mined that the adoption of FIN 48 does not have a material effect on the Fund's financial statements. The Fund's federal tax returns for the prior three fiscal years, if applicable, remain subject to examination by the Internal Revenue Service. Management will continue to monitor the rules and guidance pertaining to FIN 48 and will take action if appropriate.
In September 2006, the FASB issued Statement of Financial Accounting Standards No. 157 ("FAS 157"), "Fair Value Measurements." FAS 157 defines fair value, establishes a framework for measuring fair value in accordance with generally accepted accounting principles and expands disclosure about fair value measurements. FAS 157 is effective for fiscal years beginning after November 15, 2007. Management is currently evaluating the impact the adoption of FAS 157 will have on the Fund's financial statement disclosures.
3. Fees and other transactions with affiliates
GMO earns a management fee paid monthly at the annual rate of 0.25% of average daily net assets. The Fund has adopted a Shareholder Service Plan under which the Fund pays GMO a shareholder service fee for client and shareholder service, reporting, and other support. Pursuant to the Shareholder Service Plan, the shareholder service fee is calculated based on average daily net assets at the annual rate of 0.15% for Class III shares and 0.10% for Class IV shares. The Manager will waive the Fund's shareholder service fee to the extent that the aggregate of any direct and indirect shareholder service fees borne by a class of shares of the Fund exceeds 0.15% for Class III shares and 0.10% for Class IV shares; provided, however, that the amount of this waiver will not exceed the respective Class's shareholder service fee.
25
GMO Core Plus Bond Fund
(A Series of GMO Trust)
Notes to Financial Statements — (Continued)
February 29, 2008
The Manager has contractually agreed to reimburse the Fund for Fund expenses through at least June 30, 2008 to the extent the Fund's total annual operating expenses (excluding shareholder service fees, expenses indirectly incurred by investment in the underlying funds, fees and expenses of the independent Trustees of the Trust, fees and expenses for legal services not approved by the Manager for the Trust, compensation and expenses of the Trust's Chief Compliance Officer ("CCO") (excluding any employee benefits), brokerage commissions, securities lending fees and expenses, interest expense, transfer taxes, and other investment-related costs (including expenses associated with investments in any company that is an investment company or would be an investment company under the 1940 Act, but for the exceptions to the definition of investment company provided in Section 3(c)(1) and 3(c)(7) of the 1940 Act), hedging transaction fees, extraordinary, non-recurring and certain other unusual expenses (including taxes) (collectively, "Excluded Fund Fees and Expenses")) exceed 0.25% of the Fund's average daily net assets. In addition, the Manager has contractually agreed to reimburse the Fund through at least June 20, 2008 to the extent that the sum of (a) the Fund's total annual operating expenses (excluding Excluded Fund Fees and Expenses) and (b) the amount of fees and expenses incurred indirectly by the Fund through its investment in ECDF (excluding ECDF's fees and expenses of the independent trustees of the Trust, fees for legal services not procured or provided by the Manager for the Trust, compensation and expenses of the Trust's CCO (excluding any employee benefits), and investment-related expenses such as brokerage commissions, hedging transaction fees, securities lending fees and expenses, interest expense and transfer taxes), exceeds 0.25% of the Fund's average daily net assets, subject to a maximum total reimbursement to the Fund equal to 0.25% of the Fund's average daily net assets.
The Fund incurs fees and expenses indirectly as a shareholder in the underlying funds. For the year ended February 29, 2008, these indirect fees and expenses expressed as an annualized percentage of the Fund's average daily net assets were as follows:
| Indirect Net Expenses (excluding shareholder service fees and interest expense) | Indirect Shareholder Service Fees | Indirect Interest Expense | Total Indirect Expenses | ||||||||||||
| 0.015 | % | 0.003 | % | 0.038 | % | 0.056 | % | ||||||||
The Fund's portion of the fees paid by the Trust to the independent Trustees and CCO during the year ended February 29, 2008 was $11,763 and $2,596, respectively. The compensation and expenses of the CCO are included in miscellaneous expenses in the Statement of Operations. No remuneration was paid by the Fund to any other officer of the Trust.
26
GMO Core Plus Bond Fund
(A Series of GMO Trust)
Notes to Financial Statements — (Continued)
February 29, 2008
4. Purchases and sales of securities
For the year ended February 29, 2008, cost of purchases and proceeds from sales of investments, other than short-term obligations, were as follows:
| Purchases | Sales | ||||||||||
| U.S. Government securities | $ | 99,432,500 | $ | 146,672,302 | |||||||
| Investments (non-U.S. Government securities) | 532,149,430 | 1,641,643,902 | |||||||||
5. Guarantees
In the normal course of business the Fund enters into contracts with third-party service providers that contain a variety of representations and warranties and which provide general indemnifications. The Fund's maximum exposure under these arrangements is unknown, as this would involve future claims that may be made against the Fund that have not yet occurred. Based on experience, management is of the view that the risk of loss in connection with these potential indemnification obligations is remote; however, there can be no assurance that material liabilities related to such obligations will not arise in the future that could adversely impact the Fund.
6. Principal shareholders and related parties
As of February 29, 2008, 41.59% of the outstanding shares of the Fund were held by one shareholder. No other shareholder owned in excess of 10% of the outstanding shares of the Fund. Investment activities of this shareholder may have a material effect on the Fund.
As of February 29, 2008, 0.01% of the Fund's shares were held by six related parties comprised of certain GMO employee accounts, and 82.40% of the Fund's shares were held by accounts for which the Manager has investment discretion.
27
GMO Core Plus Bond Fund
(A Series of GMO Trust)
Notes to Financial Statements — (Continued)
February 29, 2008
7. Share transactions
The Declaration of Trust permits the Trustees to issue an unlimited number of shares of beneficial interest (without par value). Transactions in Fund shares were as follows:
| Year Ended February 29, 2008 | Year Ended February 28, 2007 | ||||||||||||||||||
| Class III: | Shares | Amount | Shares | Amount | |||||||||||||||
| Shares sold | 7,093,489 | $ | 73,135,418 | 10,466,484 | $ | 108,425,382 | |||||||||||||
| Shares issued to shareholders in reinvestment of distributions | 1,115,417 | 10,882,545 | 574,344 | 5,967,454 | |||||||||||||||
| Shares repurchased | (12,715,568 | ) | (129,267,788 | ) | (7,600,338 | ) | (79,262,926 | ) | |||||||||||
| Net increase (decrease) | (4,506,662 | ) | $ | (45,249,825 | ) | 3,440,490 | $ | 35,129,910 | |||||||||||
| Year Ended February 29, 2008 | Year Ended February 28, 2007 | ||||||||||||||||||
| Class IV: | Shares | Amount | Shares | Amount | |||||||||||||||
| Shares sold | 12,016,620 | $ | 125,053,877 | 90,465,074 | $ | 952,490,812 | |||||||||||||
| Shares issued to shareholders in reinvestment of distributions | 10,145,742 | 99,097,283 | 13,509,020 | 140,512,830 | |||||||||||||||
| Shares repurchased | (122,110,610 | ) | (1,258,144,230 | ) | (149,605,257 | ) | (1,554,386,270 | ) | |||||||||||
| Net increase (decrease) | (99,948,248 | ) | $ | (1,033,993,070 | ) | (45,631,163 | ) | $ | (461,382,628 | ) | |||||||||
28
GMO Core Plus Bond Fund
(A Series of GMO Trust)
Notes to Financial Statements — (Continued)
February 29, 2008
8. Investments in affiliated issuers
A summary of the Fund's transactions in the securities of affiliated issuers during the year ended February 29, 2008 is set forth below:
| Affiliate | Value, beginning of period | Purchases | Sales Proceeds | Dividend Income | Distributions of Realized Gains | Value, end of period | |||||||||||||||||||||
| GMO Emerging Country Debt Fund, Class IV | $ | 73,734,690 | $ | 6,068,200 | $ | 40,200,000 | $ | 2,765,124 | $ | 1,803,075 | $ | 37,549,507 | |||||||||||||||
| GMO Short- Duration Collateral Fund | 1,648,269,872 | 483,339,722 | 1,302,350,000 | 45,439,723 | — | 780,181,577 | |||||||||||||||||||||
| GMO Special Purpose Holding Fund | 132,340 | — | — | — | 608,760 | 118,261 | |||||||||||||||||||||
| GMO World Opportunity Overlay Fund | 475,441,813 | 42,100,000 | 282,875,000 | — | — | 232,656,595 | |||||||||||||||||||||
| Totals | $ | 2,197,578,715 | $ | 531,507,922 | $ | 1,625,425,000 | $ | 48,204,847 | $ | 2,411,835 | $ | 1,050,505,940 | |||||||||||||||
29
Report of Independent Registered Public Accounting Firm
To the Trustees of GMO Trust and the Shareholders of
GMO Core Plus Bond Fund
In our opinion, the accompanying statement of assets and liabilities, including the schedule of investments, and the related statements of operations and of changes in net assets and the financial highlights present fairly, in all material respects, the financial position of GMO Core Plus Bond Fund (the "Fund") at February 29, 2008, the results of its operations for the year then ended, the changes in its net assets for each of the two years in the period then ended and the financial highlights for each of the five years in the period then ended, in conformity with accounting principles generally accepted in the United States of America. These financial statements and financial highlights (hereafter referred to as "financial statements") are the responsibility of the Fund's management; our responsibility is to express an opinion on these financial statements based on our audits. We conducted our audits of these financial stateme nts in accordance with the standards of the Public Company Accounting Oversight Board (United States). Those standards require that we plan and perform the audit to obtain reasonable assurance about whether the financial statements are free of material misstatement. An audit includes examining, on a test basis, evidence supporting the amounts and disclosures in the financial statements, assessing the accounting principles used and significant estimates made by management, and evaluating the overall financial statement presentation. We believe that our audits, which included confirmation of securities at February 29, 2008 by correspondence with the custodian and brokers, provide a reasonable basis for our opinion.
PricewaterhouseCoopers LLP
Boston, Massachusetts
April 29, 2008
30
GMO Core Plus Bond Fund
(A Series of GMO Trust)
Fund Expenses
February 29, 2008 (Unaudited)
Expense Examples: The following information is in relation to expenses for the six month period ended February 29, 2008.
As a shareholder of the Fund, you may incur two types of costs: (1) transaction costs, and (2) ongoing costs, including management fees, shareholder service fees and other Fund expenses. This example is intended to help you understand your ongoing costs (in dollars) of investing in the Fund and to compare these costs with the ongoing costs of investing in other mutual funds.
These examples are based on an investment of $1,000 invested at the beginning of the period and held for the entire period, September 1, 2007 through February 29, 2008.
Actual Expenses
The first line of the table for each class below provides information about actual account values and actual expenses. You may use the information in this line, together with the amount you invested, to estimate the expenses that you paid over the period. Simply divide your account value by $1,000 (for example, a $10,000,000 account value divided by $1,000 = 10,000), then multiply the result by the number in the first line under the heading entitled "Net Expense Incurred" to estimate the expenses you paid on your account during this period.
Hypothetical Example for Comparison Purposes
The second line of the table for each class below provides information about hypothetical account values and hypothetical expenses based on the Fund's actual expense ratio and an assumed rate of return of 5% per year before expenses, which is not the Fund's actual return. The hypothetical account values and expenses may not be used to estimate the actual ending account balance or expenses you paid for the period. You may use this information to compare the ongoing costs of investing in the Fund with other funds. To do so, compare this 5% hypothetical example with the 5% hypothetical examples that appear in the shareholder reports of other funds.
Please note that the expenses shown in the table are meant to highlight your ongoing costs only and do not reflect any transactional costs. Therefore, the second line of the table is useful in comparing ongoing costs only, and will not help you determine the relative total costs of owning different funds. In addition, if these transactional costs were included, your costs would have been higher.
| Annualized Net Expense Ratio | Beginning Account Value | Ending Account Value | Net Expense Incurred* | ||||||||||||||||
| Class III | |||||||||||||||||||
| 1) Actual | 0.43 | % | $ | 1,000.00 | $ | 988.20 | $ | 2.13 | |||||||||||
| 2) Hypothetical | 0.43 | % | $ | 1,000.00 | $ | 1,022.73 | $ | 2.16 | |||||||||||
| Class IV | |||||||||||||||||||
| 1) Actual | 0.38 | % | $ | 1,000.00 | $ | 988.70 | $ | 1.88 | |||||||||||
| 2) Hypothetical | 0.38 | % | $ | 1,000.00 | $ | 1,022.97 | $ | 1.91 | |||||||||||
* Expenses are calculated using each Class's annualized net expense ratio (including indirect expenses incurred) for the six months ended February 29, 2008, multiplied by the average account value over the period, multiplied by 182 days in the period, divided by 366 days in the year.
31
GMO Core Plus Bond Fund
(A Series of GMO Trust)
Tax Information for the Tax Year Ended February 29, 2008 (Unaudited)
The Fund will notify shareholders of amounts for use in preparing 2008 income tax forms in January 2009.
The Fund hereby designates as qualified interest income with respect to its taxable year ended February 29, 2008, $36,269,952 or if determined to be different, the qualified interest income of such year.
32
Trustees and Officers (Unaudited)
The following tables list the Trust's Trustees and Officers as of the date of this report; their address and date of birth ("DOB"); their position with the Trust; the length of time holding that position with the Trust; their principal occupation(s) during the past five years; the number of portfolios in the fund complex they oversee; and other directorships they hold in companies subject to registration or reporting requirements of the Securities Exchange Act of 1934 (generally called "public companies") or in registered investment companies. The Trust's Statement of Additional Information ("SAI") includes additional information about the Trust's trustees, including changes subsequent to the date of the report. The SAI is available, without charge, upon request by writing GMO, c/o GMO Trust, 40 Rowes Wharf, Boston, MA 02110.
Independent Trustees:
| Name, Address, and DOB | Position(s) Held with Trust | Term of Office1 and Length of Time Served | Principal Occupation(s) During Past Five Years | Number of Portfolios in Fund Complex Overseen by Trustee | Other Directorships Held by Trustee | ||||||||||||||||||
| Donald W. Glazer, Esq. c/o GMO Trust 40 Rowes Wharf Boston, MA 02110 DOB: 07/26/1944 | Chairman of the Board of Trustees | Chairman of the Board of Trustees since March 2005; Lead Independent Trustee (September 2004 –March 2005); Trustee since December 2000. | Consultant – Law and Business2; Vice Chair (since 2002) and Secretary, Provant, Inc. (provider of personnel performance improvement services and training products); Author of Legal Treatises. | 47 | None. | ||||||||||||||||||
1 Each Trustee is elected to serve during the continued lifetime of the Trust until he/she dies, resigns or is removed, or if sooner, until the next meeting of Shareholders called for the purpose of electing Trustees and until the election and qualification of his/her successor.
2 As part of Mr. Glazer's work as a consultant, he provides part-time consulting services to Goodwin Procter LLP ("Goodwin"). Goodwin has provided legal services to Renewable Resources, LLC, an affiliate of GMO; GMO, in connection with its relationship with Renewable Resources; and funds managed by Renewable Resources. Mr. Glazer has represented that he has no financial interest in, and is not involved in the provision of, such legal services. In the calendar years ended December 31, 2006 and December 31, 2007, these entities paid $825,738 and $291,721 respectively, in legal fees and disbursements to Goodwin.
33
Independent Trustees — (Continued)
| Name, Address, and DOB | Position(s) Held with Trust | Term of Office1 and Length of Time Served | Principal Occupation(s) During Past Five Years | Number of Portfolios in Fund Complex Overseen by Trustee | Other Directorships Held by Trustee | ||||||||||||||||||
| Jay O. Light c/o GMO Trust 40 Rowes Wharf Boston, MA 02110 DOB: 10/03/1941 | Trustee | Since May 1996. | Dean (since April 2006), Acting Dean (August 2005 – April 2006), Senior Associate Dean (1998 – 2005), and Professor of Business Administration, Harvard Business School. | 47 | Director of Harvard Management Company, Inc.3 and Verde, Inc.; Director of Partners HealthCare System, Inc. and Chair of its Investment Committee.4 | ||||||||||||||||||
| W. Nicholas Thorndike c/o GMO Trust 40 Rowes Wharf Boston, MA 02110 DOB: 03/28/1933 | Trustee | Since March 2005. | Director or trustee of various corporations and charitable organizations, including Courier Corporation (a book publisher and manufacturer) (July 1989 – present); Putnam Funds (December 1992 – June 2004); and Providence Journal (a newspaper publisher) (December 1986 – December 2003). | 47 | Director of Courier Corporation (a book publisher and manufacturer); Member of the Investment Committee of Partners HealthCare System, Inc.4 | ||||||||||||||||||
1 Each Trustee is elected to serve during the continued lifetime of the Trust until he/she dies, resigns or is removed, or if sooner, until the next meeting of Shareholders called for the purpose of electing Trustees and until the election and qualification of his/her successor.
3 Harvard Management Company, Inc. is a client of the Manager.
4 Partners HealthCare System, Inc. is a client of the Manager.
34
Principal Officers:
| Name, Address, and DOB | Position(s) Held with Trust | Term of Office5 and Length of Time Served | Principal Occupation(s) During Past Five Years | ||||||||||||
| Scott Eston c/o GMO Trust 40 Rowes Wharf Boston, MA 02110 DOB: 01/20/1956 | President and Chief Executive Officer | President and Chief Executive Officer since October 2002; Chief Financial Officer, November 2006 – February 2007. | Chief Financial Officer, Chief Operating Officer and Member, Grantham, Mayo, Van Otterloo & Co. LLC. | ||||||||||||
| Sheppard N. Burnett c/o GMO Trust 40 Rowes Wharf Boston, MA 02110 DOB: 10/24/1968 | Treasurer and Chief Financial Officer | Chief Financial Officer since March 2007; Treasurer since November 2006; Assistant Treasurer, September 2004 – November 2006. | Fund Administration Staff, Grantham, Mayo, Van Otterloo & Co. LLC (June 2004 – present); Vice President, Director of Tax, Columbia Management Group (2002-2004). | ||||||||||||
| Brent C. Arvidson c/o GMO Trust 40 Rowes Wharf Boston, MA 02110 DOB: 06/26/1969 | Assistant Treasurer | Since August 1998. | Senior Fund Administrator, Grantham, Mayo, Van Otterloo & Co. LLC. | ||||||||||||
| John L. Nasrah c/o GMO Trust 40 Rowes Wharf Boston, MA 02110 DOB: 05/27/1977 | Assistant Treasurer | Since March 2007. | Fund Administrator, Grantham, Mayo, Van Otterloo & Co. LLC (September 2004 – present); Tax Analyst, Bain & Company, Inc (June 2003 – September 2004); Senior Tax Associate, PricewaterhouseCoopers LLP (2001-2003). | ||||||||||||
| Mahmoodur Rahman c/o GMO Trust 40 Rowes Wharf Boston, MA 02110 DOB: 11/30/1967 | Assistant Treasurer | Since September 2007. | Fund Administrator, Grantham, Mayo, Van Otterloo & Co. (April 2007 – present); Vice President and Senior Tax Manager, Massachusetts Financial Services Company (January 2000 – April 2007). | ||||||||||||
5 Officers are elected to hold such office until their successor is elected and qualified to carry out the duties and responsibilities of their office, or until he or she resigns or is removed from office.
35
Principal Officers — (Continued)
| Name, Address, and DOB | Position(s) Held with Trust | Term of Office5 and Length of Time Served | Principal Occupation(s) During Past Five Years | ||||||||||||
| Michael E. Gillespie c/o GMO Trust 40 Rowes Wharf Boston, MA 02110 DOB: 02/18/1958 | Chief Compliance Officer | Since March 2005. | Vice President of Compliance (June 2004 – February 2005) and Director of Domestic Compliance (March 2002 – June 2004), Fidelity Investments; Vice President and Senior Counsel, State Street Bank and Trust Company (May 1998 – March 2002). | ||||||||||||
| Jason B. Harrison c/o GMO Trust 40 Rowes Wharf Boston, MA 02110 DOB: 01/29/1977 | Vice President and Clerk | Vice President since November 2006; Clerk since March 2006. | Legal Counsel, Grantham, Mayo, Van Otterloo & Co. LLC (since February 2006) and Attorney, Ropes & Gray LLP (September 2002 – February 2006). | ||||||||||||
| David L. Bohan c/o GMO Trust 40 Rowes Wharf Boston, MA 02110 DOB: 06/21/1964 | Vice President and Assistant Clerk | Vice President since March 2005; Assistant Clerk since March 2006. | Legal Counsel, Grantham, Mayo, Van Otterloo & Co. LLC (September 2003 – present); Attorney, Goodwin Procter LLP (September 1996 – September 2003). | ||||||||||||
| Gregory L. Pottle c/o GMO Trust 40 Rowes Wharf Boston, MA 02110 DOB: 07/09/1971 | Vice President and Assistant Clerk | Since November 2006. | Legal Counsel, Grantham, Mayo, Van Otterloo & Co. LLC. | ||||||||||||
| Anne K. Trinque c/o GMO Trust 40 Rowes Wharf Boston, MA 02110 DOB: 04/15/1978 | Vice President and Assistant Clerk | Since September 2007. | Legal Counsel, Grantham, Mayo, Van Otterloo & Co. LLC (since January 2007); Attorney, Goodwin Procter LLP (September 2003 – January 2007). | ||||||||||||
| Cheryl Wakeham c/o GMO Trust 40 Rowes Wharf Boston, MA 02110 DOB: 10/29/1958 | Anti-Money Laundering Officer | Since December 2004. | Manager, Client Service Administration, Grantham, Mayo, Van Otterloo & Co. LLC. | ||||||||||||
5 Officers are elected to hold such office until their successor is elected and qualified to carry out the duties and responsibilities of their office, or until he or she resigns or is removed from office.
36
GMO U.S. Small/Mid Cap Value Fund
(A Series of GMO Trust)
Annual Report
February 29, 2008
For a free copy of the Fund's proxy voting guidelines, shareholders may call 1-617-346-7646 (collect), visit our website at www.gmo.com, or visit the Securities and Exchange Commission's website at www.sec.gov. Information regarding how the Fund voted proxies relating to portfolio securities during the most recent 12-month period ended June 30 is available on our website at www.gmo.com, or on the Securities and Exchange Commission's website at www.sec.gov.
The Fund files its complete schedule of portfolio holdings with the Securities and Exchange Commission for the first and third quarter of each fiscal year on Form N-Q, which is available on the Commission's website at www.sec.gov. The Fund's Form N-Q may be reviewed and copied at the Commission's Public Reference Room in Washington, D.C. Information on the operation of the Public Reference Room may be obtained by calling 1-800-SEC-0330. The Fund has a policy with respect to disclosure of portfolio holdings under which it may also make available on GMO's website (www.gmo.com) a complete schedule of portfolio holdings.
This report is prepared for the general information of shareholders. It is authorized for distribution to prospective investors only when preceded or accompanied by a prospectus for the GMO Trust.
GMO U.S. Small/Mid Cap Value Fund
(A Series of GMO Trust)
Portfolio Management
Day-to-day management of the Fund's portfolio is the responsibility of the U.S. Quantitative team at Grantham, Mayo, Van Otterloo & Co. LLC.
Management Discussion and Analysis of Fund Performance
The GMO U.S. Small/Mid Cap Value Fund returned -18.7% for the fiscal year ended February 29, 2008, as compared to -15.5% for the Russell 2500 Value Index. The Fund was invested substantially in U.S. equity securities throughout the period.
Stock selection added to returns relative to the Russell 2500 Value Index. Selections in Consumer Discretionary, Information Technology, and Telecommunication Services added to relative returns while selections in Industrials, Consumer Staples, and Health Care detracted. In terms of individual names, overweight positions in Commerce Group, CDW Corp, and Annaly Capital Management added to relative returns. Overweight positions in Liz Claiborne, PMI Group, and First Horizon National Group detracted.
Sector selection detracted from returns relative to the Russell 2500 Value Index. Sector weightings positively impacting relative performance included overweight positions in Consumer Staples and Health Care and an underweight in Financials. Sector weightings negatively impacting relative performance included an overweight in Consumer Discretionary and underweight positions in Energy and Utilities.
The views expressed herein are exclusively those of Grantham, Mayo, Van Otterloo & Co. LLC Management as of the date of this report and are subject to change. GMO disclaims any responsibility to update such views. They are not meant as investment advice. References to specific securities are not recommendations of such securities and may not be representative of any GMO portfolio's current or future investments.
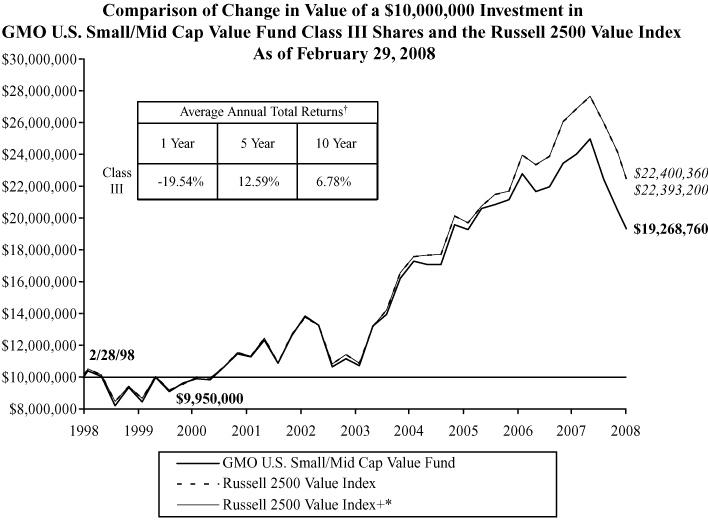
Performance data quoted represents past performance and is not indicative of future results. The investment return and principal value of an investment will fluctuate so that an investor's shares, when redeemed, may be worth more or less than their original cost. Current performance data may be lower or higher than the performance data provided herein. To obtain performance information to the most recent month-end, visit www.gmo.com. Performance shown is net of all fees after reimbursement from the Manager. Each performance figure assumes a purchase at the beginning and redemption at the end of the stated period and reflects a transaction fee of .50% on the purchase and .50% on the redemption. Transaction fees are retained by the Fund to cover trading costs. Returns would have been lower had certain expenses not been reimbursed during the periods shown and do not include the effect of taxes on distributions and redemptions. All inform ation is unaudited.
* The Russell 2500 Value + Index represents the Russell 2500 Index prior to 12/31/96 and the Russell 2500 Value Index thereafter.
† The Fund is the successor to the GMO Small/Mid Cap Value Fund, therefore, performance for the periods prior to September 16, 2005 is that of GMO Small/Mid Cap Value Fund.
GMO U.S. Small/Mid Cap Value Fund
(A Series of GMO Trust)
Investments Concentration Summary
February 29, 2008 (Unaudited)
| Asset Class Summary | % of Total Net Assets | ||||||
| Common Stocks | 99.0 | % | |||||
| Short-Term Investments | 3.3 | ||||||
| Other | (2.3 | ) | |||||
| 100.0 | % | ||||||
| Industry Sector Summary | % of Equity Investments | ||||||
| Financials | 27.7 | % | |||||
| Consumer Discretionary | 22.2 | ||||||
| Information Technology | 9.6 | ||||||
| Industrials | 9.5 | ||||||
| Consumer Staples | 8.9 | ||||||
| Health Care | 8.4 | ||||||
| Materials | 6.8 | ||||||
| Energy | 4.8 | ||||||
| Telecommunication Services | 1.1 | ||||||
| Utilities | 1.0 | ||||||
| 100.0 | % | ||||||
1
GMO U.S. Small/Mid Cap Value Fund
(A Series of GMO Trust)
Schedule of Investments
(showing percentage of total net assets)
February 29, 2008
| Shares | Description | Value ($) | |||||||||||||
| COMMON STOCKS — 99.0% | |||||||||||||||
| Consumer Discretionary — 22.0% | |||||||||||||||
| 5,600 | Advance Auto Parts, Inc. | 187,824 | |||||||||||||
| 1,800 | Aeropostale, Inc. * | 48,348 | |||||||||||||
| 960 | AH Belo Corp.-Class A * | 11,683 | |||||||||||||
| 3,200 | American Axle & Manufacturing Holdings, Inc. | 62,976 | |||||||||||||
| 5,700 | American Eagle Outfitters, Inc. | 121,809 | |||||||||||||
| 7,950 | ArvinMeritor, Inc. | 89,755 | |||||||||||||
| 6,000 | Asbury Automotive Group, Inc. | 84,120 | |||||||||||||
| 4,000 | Autoliv, Inc. | 199,600 | |||||||||||||
| 28,100 | AutoNation, Inc. * | 409,417 | |||||||||||||
| 4,800 | Belo Corp. | 56,496 | |||||||||||||
| 1,800 | Big Lots, Inc. * | 30,330 | |||||||||||||
| 7,200 | Blyth, Inc. | 142,776 | |||||||||||||
| 100 | Bob Evans Farms, Inc. | 2,895 | |||||||||||||
| 1,200 | Borders Group, Inc. | 11,112 | |||||||||||||
| 8,200 | BorgWarner, Inc. | 353,502 | |||||||||||||
| 4,900 | Brinker International, Inc. | 90,356 | |||||||||||||
| 9,100 | Brunswick Corp. | 148,239 | |||||||||||||
| 1,700 | Callaway Golf Co. | 25,908 | |||||||||||||
| 7,000 | Career Education Corp. * | 103,950 | |||||||||||||
| 2,600 | CBRL Group, Inc. | 94,692 | |||||||||||||
| 3,150 | CEC Entertainment, Inc. * | 84,514 | |||||||||||||
| 6,600 | Chico's FAS, Inc. * | 61,446 | |||||||||||||
| 2,500 | Columbia Sportswear Co. | 103,325 | |||||||||||||
| 4,100 | Cooper Tire & Rubber Co. | 74,087 | |||||||||||||
| 500 | Core-Mark Holding Co., Inc. * | 13,285 | |||||||||||||
| 3,800 | Corinthian Colleges, Inc. * | 30,210 | |||||||||||||
| 3,500 | CSK Auto Corp. * | 31,745 | |||||||||||||
| 5,100 | Discovery Holding Co.-Class A * | 115,107 | |||||||||||||
| 10,600 | Dollar Tree Stores, Inc. * | 284,398 | |||||||||||||
| 3,300 | Ethan Allen Interiors, Inc. | 89,892 | |||||||||||||
| 8,600 | Family Dollar Stores, Inc. | 164,690 | |||||||||||||
| 5,800 | Foot Locker, Inc. | 71,340 | |||||||||||||
See accompanying notes to the financial statements.
2
GMO U.S. Small/Mid Cap Value Fund
(A Series of GMO Trust)
Schedule of Investments — (Continued)
(showing percentage of total net assets)
February 29, 2008
| Shares | Description | Value ($) | |||||||||||||
| Consumer Discretionary — continued | |||||||||||||||
| 2,000 | Fossil, Inc. * | 64,360 | |||||||||||||
| 5,390 | Furniture Brands International, Inc. | 70,070 | |||||||||||||
| 3,800 | Group 1 Automotive, Inc. | 93,100 | |||||||||||||
| 2,800 | Hasbro, Inc. | 72,156 | |||||||||||||
| 1,800 | Hooker Furniture Corp. | 36,882 | |||||||||||||
| 2,900 | Interactive Data Corp. | 84,854 | |||||||||||||
| 2,000 | ITT Educational Services, Inc. * | 110,440 | |||||||||||||
| 1,940 | Jack in the Box, Inc. * | 50,964 | |||||||||||||
| 900 | Jakks Pacific, Inc. * | 25,155 | |||||||||||||
| 100 | Jarden Corp. * | 2,409 | |||||||||||||
| 8,100 | Jones Apparel Group, Inc. | 114,291 | |||||||||||||
| 3,000 | K-Swiss, Inc.-Class A | 43,530 | |||||||||||||
| 4,300 | Lear Corp. * | 118,594 | |||||||||||||
| 5,100 | Lee Enterprises, Inc. | 52,581 | |||||||||||||
| 7,400 | Leggett & Platt, Inc. | 123,580 | |||||||||||||
| 1,900 | Lithia Motors, Inc.-Class A | 19,532 | |||||||||||||
| 13,300 | Liz Claiborne, Inc. | 236,474 | |||||||||||||
| 1,300 | Matthews International Corp.-Class A | 58,318 | |||||||||||||
| 5,124 | MDC Holdings, Inc. | 214,593 | |||||||||||||
| 2,600 | Men's Wearhouse, Inc. | 59,904 | |||||||||||||
| 200 | National Presto Industries, Inc. | 10,480 | |||||||||||||
| 8,100 | New York Times Co.-Class A | 150,903 | |||||||||||||
| 100 | NVR, Inc. * | 54,068 | |||||||||||||
| 5,600 | Office Depot, Inc. * | 63,672 | |||||||||||||
| 4,500 | O'Reilly Automotive, Inc. * | 121,320 | |||||||||||||
| 500 | Oxford Industries, Inc. | 10,570 | |||||||||||||
| 10,700 | Penske Auto Group, Inc. | 193,028 | |||||||||||||
| 2,000 | Polaris Industries, Inc. | 76,360 | |||||||||||||
| 3,100 | Pomeroy IT Solutions, Inc. * | 20,367 | |||||||||||||
| 800 | Pre-Paid Legal Services, Inc. * | 38,120 | |||||||||||||
| 1,100 | R.H. Donnelley Corp. * | 7,799 | |||||||||||||
| 7,700 | RadioShack Corp. | 134,365 | |||||||||||||
| 4,800 | Regis Corp. | 120,240 | |||||||||||||
| 7,200 | Rent-A-Center, Inc. * | 123,480 | |||||||||||||
See accompanying notes to the financial statements.
3
GMO U.S. Small/Mid Cap Value Fund
(A Series of GMO Trust)
Schedule of Investments — (Continued)
(showing percentage of total net assets)
February 29, 2008
| Shares | Description | Value ($) | |||||||||||||
| Consumer Discretionary — continued | |||||||||||||||
| 4,200 | Ross Stores, Inc. | 116,970 | |||||||||||||
| 5,300 | Ruby Tuesday, Inc. | 37,683 | |||||||||||||
| 3,700 | Service Corporation International | 39,960 | |||||||||||||
| 1,100 | Snap-On, Inc. | 54,912 | |||||||||||||
| 5,000 | Sonic Automotive, Inc. | 88,900 | |||||||||||||
| 800 | Standard Motor Products, Inc. | 5,928 | |||||||||||||
| 1,500 | Stanley Works (The) | 72,810 | |||||||||||||
| 300 | Stewart Enterprises, Inc.-Class A | 1,791 | |||||||||||||
| 200 | Strayer Education, Inc. | 31,140 | |||||||||||||
| 2,000 | Tenneco, Inc. * | 50,500 | |||||||||||||
| 3,100 | The Pep Boys - Manny, Moe & Jack | 35,464 | |||||||||||||
| 3,700 | Thor Industries, Inc. | 112,776 | |||||||||||||
| 800 | Tiffany & Co. | 30,112 | |||||||||||||
| 4,000 | Timberland Co.-Class A * | 60,080 | |||||||||||||
| 10,100 | Toll Brothers, Inc. * | 214,221 | |||||||||||||
| 7,100 | TRW Automotive Holdings Corp. * | 156,768 | |||||||||||||
| 4,800 | Tuesday Morning Corp. | 25,872 | |||||||||||||
| 5,600 | Tupperware Corp. | 204,288 | |||||||||||||
| 1,300 | Tween Brands, Inc. * | 38,480 | |||||||||||||
| 3,900 | Valassis Communications, Inc. * | 43,758 | |||||||||||||
| 1,700 | Westwood One, Inc. | 3,009 | |||||||||||||
| 2,700 | Williams-Sonoma, Inc. | 63,072 | |||||||||||||
| 1,100 | Wolverine World Wide, Inc. | 29,150 | |||||||||||||
| 2,800 | Zale Corp. * | 54,096 | |||||||||||||
| Total Consumer Discretionary | 7,748,126 | ||||||||||||||
| Consumer Staples — 8.7% | |||||||||||||||
| 4,800 | Alberto-Culver Co. | 128,640 | |||||||||||||
| 8,800 | BJ's Wholesale Club, Inc. * | 277,728 | |||||||||||||
| 600 | Chattem, Inc. * | 46,740 | |||||||||||||
| 2,900 | Chiquita Brands International, Inc. * | 59,363 | |||||||||||||
| 800 | Church & Dwight Co., Inc. | 42,768 | |||||||||||||
| 2,500 | Constellation Brands, Inc.-Class A * | 48,025 | |||||||||||||
| 500 | Corn Products International, Inc. | 18,355 | |||||||||||||
See accompanying notes to the financial statements.
4
GMO U.S. Small/Mid Cap Value Fund
(A Series of GMO Trust)
Schedule of Investments — (Continued)
(showing percentage of total net assets)
February 29, 2008
| Shares | Description | Value ($) | |||||||||||||
| Consumer Staples — continued | |||||||||||||||
| 7,400 | Dean Foods Co. | 159,248 | |||||||||||||
| 2,000 | Del Monte Foods Co. | 17,960 | |||||||||||||
| 1,000 | Elizabeth Arden, Inc. * | 18,220 | |||||||||||||
| 3,500 | Energizer Holdings, Inc. * | 324,905 | |||||||||||||
| 1,900 | Estee Lauder Cos. (The), Inc.-Class A | 80,902 | |||||||||||||
| 3,000 | Flowers Foods, Inc. | 67,980 | |||||||||||||
| 3,800 | Fresh Del Monte Produce, Inc. * | 126,198 | |||||||||||||
| 1,300 | Hormel Foods Corp. | 53,118 | |||||||||||||
| 3,600 | Ingles Markets, Inc.-Class A | 86,436 | |||||||||||||
| 2,400 | JM Smucker Co. (The) | 122,856 | |||||||||||||
| 1,900 | Longs Drug Stores Corp. | 91,257 | |||||||||||||
| 100 | McCormick & Co., Inc. (Non Voting) | 3,445 | |||||||||||||
| 1,900 | Molson Coors Brewing Co.-Class B | 102,524 | |||||||||||||
| 3,800 | Nash Finch Co. | 133,266 | |||||||||||||
| 3,000 | NBTY, Inc. * | 85,680 | |||||||||||||
| 400 | Pantry (The), Inc. * | 9,624 | |||||||||||||
| 5,200 | PepsiAmericas, Inc. | 131,560 | |||||||||||||
| 6,200 | Performance Food Group Co. * | 201,500 | |||||||||||||
| 2,700 | Pilgrim's Pride Corp. | 63,342 | |||||||||||||
| 200 | Ralcorp Holdings, Inc. * | 11,090 | |||||||||||||
| 2,550 | Sanderson Farms, Inc. | 88,893 | |||||||||||||
| 38 | Seaboard Corp. | 60,420 | |||||||||||||
| 700 | Smithfield Foods, Inc. * | 19,285 | |||||||||||||
| 2,900 | Supervalu, Inc. | 76,125 | |||||||||||||
| 15,700 | Tyson Foods, Inc.-Class A | 226,237 | |||||||||||||
| 1,500 | Universal Corp. | 85,365 | |||||||||||||
| 600 | Weis Markets, Inc. | 19,446 | |||||||||||||
| Total Consumer Staples | 3,088,501 | ||||||||||||||
| Energy — 4.8% | |||||||||||||||
| 1,200 | Berry Petroleum Co. | 49,332 | |||||||||||||
| 600 | Bristow Group, Inc. * | 31,656 | |||||||||||||
| 3,400 | Cimarex Energy Co. | 179,180 | |||||||||||||
| 1,000 | Encore Acquisition Co. * | 36,800 | |||||||||||||
See accompanying notes to the financial statements.
5
GMO U.S. Small/Mid Cap Value Fund
(A Series of GMO Trust)
Schedule of Investments — (Continued)
(showing percentage of total net assets)
February 29, 2008
| Shares | Description | Value ($) | |||||||||||||
| Energy — continued | |||||||||||||||
| 1,000 | Forest Oil Corp. * | 49,330 | |||||||||||||
| 1,700 | Golar LNG Ltd. | 32,453 | |||||||||||||
| 700 | Helix Energy Solutions Group, Inc. * | 24,654 | |||||||||||||
| 3,600 | Helmerich & Payne, Inc. | 161,388 | |||||||||||||
| 1,500 | Holly Corp. | 80,085 | |||||||||||||
| 3,600 | Oil States International, Inc. * | 151,776 | |||||||||||||
| 2,200 | Overseas Shipholding Group, Inc. | 137,984 | |||||||||||||
| 8,900 | Patterson-UTI Energy, Inc. | 211,197 | |||||||||||||
| 800 | Rowan Cos., Inc. | 32,248 | |||||||||||||
| 600 | Stone Energy Corp. * | 30,456 | |||||||||||||
| 900 | Teekay Corp. | 38,682 | |||||||||||||
| 2,700 | Tidewater, Inc. | 151,605 | |||||||||||||
| 4,100 | Unit Corp. * | 226,115 | |||||||||||||
| 300 | Whiting Petroleum Corp. * | 18,366 | |||||||||||||
| 1,400 | World Fuel Services Corp. | 43,792 | |||||||||||||
| Total Energy | 1,687,099 | ||||||||||||||
| Financials — 27.6% | |||||||||||||||
| 300 | Alleghany Corp. * | 108,300 | |||||||||||||
| 1,700 | Amcore Financial, Inc. | 33,014 | |||||||||||||
| 6,950 | American Financial Group, Inc. | 179,797 | |||||||||||||
| 700 | American National Insurance Co. | 79,415 | |||||||||||||
| 3,800 | Anchor Bancorp Wisconsin, Inc. | 71,934 | |||||||||||||
| 21,100 | Annaly Capital Management, Inc. | 436,559 | |||||||||||||
| 4,800 | Anthracite Capital, Inc. REIT | 30,672 | |||||||||||||
| 3,300 | Anworth Mortgage Asset Corp. REIT | 31,317 | |||||||||||||
| 2,400 | Arch Capital Group Ltd. * | 164,352 | |||||||||||||
| 500 | Aspen Insurance Holdings Ltd. | 14,470 | |||||||||||||
| 9,300 | Associated Banc Corp. | 231,756 | |||||||||||||
| 3,050 | Astoria Financial Corp. | 79,819 | |||||||||||||
| 4,300 | Axis Capital Holdings Ltd. | 158,541 | |||||||||||||
| 4,000 | Bancorpsouth, Inc. | 89,920 | |||||||||||||
| 1,900 | Bank of Hawaii Corp. | 91,238 | |||||||||||||
| 3,700 | Brown & Brown, Inc. | 65,971 | |||||||||||||
See accompanying notes to the financial statements.
6
GMO U.S. Small/Mid Cap Value Fund
(A Series of GMO Trust)
Schedule of Investments — (Continued)
(showing percentage of total net assets)
February 29, 2008
| Shares | Description | Value ($) | |||||||||||||
| Financials — continued | |||||||||||||||
| 700 | CapitalSource, Inc. | 11,088 | |||||||||||||
| 2,400 | Cathay General Bancorp | 52,608 | |||||||||||||
| 1,300 | Central Pacific Financial Corp. | 24,037 | |||||||||||||
| 3,300 | Chemical Financial Corp. | 73,326 | |||||||||||||
| 600 | Citizens Republic Bancorp, Inc. | 6,678 | |||||||||||||
| 1,000 | City Holding Co. | 37,240 | |||||||||||||
| 4,600 | City National Corp. | 235,750 | |||||||||||||
| 1,300 | CNA Surety Corp. * | 18,343 | |||||||||||||
| 2,300 | Colonial BancGroup (The), Inc. | 27,784 | |||||||||||||
| 3,196 | Commerce Bancshares, Inc. | 133,113 | |||||||||||||
| 11,200 | Commerce Group, Inc. | 405,888 | |||||||||||||
| 3,100 | Community Bank System, Inc. | 68,510 | |||||||||||||
| 2,900 | Conseco, Inc. * | 34,017 | |||||||||||||
| 4,900 | Dime Community Bancshares | 74,578 | |||||||||||||
| 3,300 | Downey Financial Corp. | 86,427 | |||||||||||||
| 1,800 | Endurance Specialty Holdings Ltd. | 70,740 | |||||||||||||
| 2,400 | Erie Indemnity Co.-Class A | 118,440 | |||||||||||||
| 900 | F.N.B. Corp. | 12,339 | |||||||||||||
| 1,900 | FBL Financial Group, Inc.-Class A | 55,879 | |||||||||||||
| 2,400 | Federal Agricultural Mortgage Corp.-Class C | 57,696 | |||||||||||||
| 9,316 | First American Corp. | 324,476 | |||||||||||||
| 6,300 | First Bancorp Puerto Rico | 56,952 | |||||||||||||
| 6,700 | First Horizon National Corp. | 108,808 | |||||||||||||
| 6,600 | FirstMerit Corp. | 123,882 | |||||||||||||
| 4,400 | Flagstar Bancorp, Inc. | 31,504 | |||||||||||||
| 800 | Flushing Financial Corp. | 13,040 | |||||||||||||
| 7,100 | Fulton Financial Corp. | 82,573 | |||||||||||||
| 1,300 | Hanmi Financial Corp. | 9,919 | |||||||||||||
| 300 | Hanover Insurance Group (The), Inc. | 13,107 | |||||||||||||
| 1,200 | Harleysville Group, Inc. | 40,296 | |||||||||||||
| 8,500 | HCC Insurance Holdings, Inc. | 204,510 | |||||||||||||
| 6,200 | Horace Mann Educators Corp. | 107,756 | |||||||||||||
| 700 | Imperial Capital Bancorp, Inc. | 15,652 | |||||||||||||
| 3,600 | Independent Bank Corp., MI | 35,136 | |||||||||||||
See accompanying notes to the financial statements.
7
GMO U.S. Small/Mid Cap Value Fund
(A Series of GMO Trust)
Schedule of Investments — (Continued)
(showing percentage of total net assets)
February 29, 2008
| Shares | Description | Value ($) | |||||||||||||
| Financials — continued | |||||||||||||||
| 6,420 | International Bancshares Corp. | 139,186 | |||||||||||||
| 3,273 | Kansas City Life Insurance Co. | 135,273 | |||||||||||||
| 400 | Markel Corp. * | 185,900 | |||||||||||||
| 1,200 | Max Capital Group Ltd. | 33,288 | |||||||||||||
| 4,400 | Mercury General Corp. | 200,640 | |||||||||||||
| 2,566 | MFA Mortgage Investments, Inc. REIT | 24,531 | |||||||||||||
| 4,900 | Nationwide Financial Services, Inc.-Class A | 202,125 | |||||||||||||
| 200 | Navigators Group, Inc. * | 10,946 | |||||||||||||
| 2,500 | Nelnet, Inc.-Class A | 27,250 | |||||||||||||
| 100 | New York Community Bancorp, Inc. | 1,633 | |||||||||||||
| 400 | Northwest Bancorp, Inc. | 10,564 | |||||||||||||
| 1,900 | Odyssey Re Holdings Corp. | 68,742 | |||||||||||||
| 3,400 | Old National Bancorp | 52,768 | |||||||||||||
| 16,375 | Old Republic International Corp. | 224,665 | |||||||||||||
| 2,400 | Oriental Financial Group, Inc. | 49,968 | |||||||||||||
| 3,700 | Pacific Capital Bancorp | 77,515 | |||||||||||||
| 1,100 | Park District National Corp. | 66,550 | |||||||||||||
| 1,500 | PartnerRe Ltd. | 115,335 | |||||||||||||
| 8,500 | Philadelphia Consolidated Holding Corp. * | 288,320 | |||||||||||||
| 1,000 | Platinum Underwriters Holdings Ltd. | 34,500 | |||||||||||||
| 20,500 | Popular, Inc. | 226,320 | |||||||||||||
| 1,500 | Presidential Life Corp. | 25,140 | |||||||||||||
| 3,900 | Protective Life Corp. | 150,501 | |||||||||||||
| 600 | Provident Bankshares Corp. | 7,638 | |||||||||||||
| 6,800 | Reinsurance Group of America, Inc. | 372,028 | |||||||||||||
| 1,200 | RenaissanceRe Holdings Ltd. | 65,880 | |||||||||||||
| 2,500 | RLI Corp. | 130,575 | |||||||||||||
| 2,100 | S&T Bancorp | 59,535 | |||||||||||||
| 2,000 | Safety Insurance Group, Inc. | 74,180 | |||||||||||||
| 5,300 | SEI Investment Co. | 132,553 | |||||||||||||
| 3,700 | Selective Insurance Group, Inc. | 87,912 | |||||||||||||
| 800 | South Financial Group (The), Inc. | 11,544 | |||||||||||||
| 3,600 | StanCorp Financial Group, Inc. | 176,724 | |||||||||||||
| 2,200 | State Auto Financial Corp. | 59,708 | |||||||||||||
See accompanying notes to the financial statements.
8
GMO U.S. Small/Mid Cap Value Fund
(A Series of GMO Trust)
Schedule of Investments — (Continued)
(showing percentage of total net assets)
February 29, 2008
| Shares | Description | Value ($) | |||||||||||||
| Financials — continued | |||||||||||||||
| 3,800 | Stewart Information Services Corp. | 113,126 | |||||||||||||
| 600 | Student Loan Corp. | 66,300 | |||||||||||||
| 1,300 | SVB Financial Group * | 58,890 | |||||||||||||
| 13,600 | TCF Financial Corp. | 253,096 | |||||||||||||
| 4,900 | Transatlantic Holdings, Inc. | 330,260 | |||||||||||||
| 3,100 | Trustco Bank Corp., NY | 26,815 | |||||||||||||
| 4,400 | Trustmark Corp. | 86,944 | |||||||||||||
| 2,000 | United Bankshares, Inc. | 52,540 | |||||||||||||
| 1,200 | United Fire & Casualty Co. | 41,220 | |||||||||||||
| 2,000 | Unitrin, Inc. | 71,200 | |||||||||||||
| 3,827 | Washington Federal, Inc. | 86,873 | |||||||||||||
| 1,800 | Webster Financial Corp. | 50,346 | |||||||||||||
| 2,100 | Westamerica Bancorporation | 99,393 | |||||||||||||
| 900 | Whitney Holding Corp. | 21,609 | |||||||||||||
| 2,900 | Wilmington Trust Corp. | 89,320 | |||||||||||||
| 3,000 | Zenith National Insurance Corp. | 102,240 | |||||||||||||
| Total Financials | 9,719,276 | ||||||||||||||
| Health Care — 8.3% | |||||||||||||||
| 1,200 | AMERIGROUP Corp. * | 43,200 | |||||||||||||
| 7,200 | Apria Healthcare Group * | 156,312 | |||||||||||||
| 400 | Bio-Rad Laboratories, Inc. * | 37,776 | |||||||||||||
| 1,000 | Centene Corp. * | 17,920 | |||||||||||||
| 1,600 | Charles River Laboratories International, Inc. * | 93,728 | |||||||||||||
| 2,400 | Conmed Corp. * | 64,704 | |||||||||||||
| 1,000 | Covance, Inc. * | 84,410 | |||||||||||||
| 3,000 | Endo Pharmaceuticals Holdings, Inc. * | 78,780 | |||||||||||||
| 11,200 | Health Management Associates, Inc.-Class A | 59,920 | |||||||||||||
| 1,800 | Idexx Laboratories, Inc. * | 99,846 | |||||||||||||
| 1,200 | Immucor, Inc. * | 35,760 | |||||||||||||
| 2,500 | Invacare Corp. | 62,400 | |||||||||||||
| 2,900 | Invitrogen Corp. * | 245,021 | |||||||||||||
| 800 | Kinetic Concepts, Inc. * | 41,112 | |||||||||||||
| 27,900 | King Pharmaceuticals, Inc. * | 295,740 | |||||||||||||
See accompanying notes to the financial statements.
9
GMO U.S. Small/Mid Cap Value Fund
(A Series of GMO Trust)
Schedule of Investments — (Continued)
(showing percentage of total net assets)
February 29, 2008
| Shares | Description | Value ($) | |||||||||||||
| Health Care — continued | |||||||||||||||
| 2,700 | LifePoint Hospitals, Inc. * | 67,662 | |||||||||||||
| 3,200 | Lincare Holdings, Inc. * | 104,000 | |||||||||||||
| 1,400 | Molina Healthcare, Inc. * | 44,310 | |||||||||||||
| 2,600 | Omnicare, Inc. | 54,548 | |||||||||||||
| 4,400 | Owens & Minor, Inc. | 189,068 | |||||||||||||
| 1,100 | Par Pharmaceutical Cos., Inc. * | 19,459 | |||||||||||||
| 4,100 | Patterson Cos., Inc. * | 144,320 | |||||||||||||
| 2,500 | Pediatrix Medical Group, Inc. * | 165,025 | |||||||||||||
| 4,100 | PerkinElmer, Inc. | 101,762 | |||||||||||||
| 1,600 | Perrigo Co. | 53,472 | |||||||||||||
| 1,400 | Pharmaceutical Product Development, Inc. | 63,098 | |||||||||||||
| 1,000 | PharmaNet Development Group, Inc. * | 28,830 | |||||||||||||
| 1,800 | Respironics, Inc. * | 118,224 | |||||||||||||
| 1,000 | Techne Corp. * | 68,390 | |||||||||||||
| 1,500 | Universal American Corp. * | 25,770 | |||||||||||||
| 500 | Varian, Inc. * | 27,075 | |||||||||||||
| 900 | VCA Antech, Inc. * | 28,899 | |||||||||||||
| 1,900 | Waters Corp. * | 113,259 | |||||||||||||
| 3,600 | Watson Pharmaceuticals, Inc. * | 100,116 | |||||||||||||
| Total Health Care | 2,933,916 | ||||||||||||||
| Industrials — 9.4% | |||||||||||||||
| 400 | A.O. Smith Corp. | 14,572 | |||||||||||||
| 3,800 | ABM Industries, Inc. | 75,468 | |||||||||||||
| 1,300 | AGCO Corp. * | 84,318 | |||||||||||||
| 900 | Albany International Corp. | 30,897 | |||||||||||||
| 2,000 | Alliant Techsystems, Inc. * | 209,880 | |||||||||||||
| 190 | American Woodmark Corp. | 3,606 | |||||||||||||
| 100 | Applied Industrial Technologies, Inc. | 2,764 | |||||||||||||
| 2,900 | Arkansas Best Corp. | 77,459 | |||||||||||||
| 8,500 | Avis Budget Group, Inc. * | 97,155 | |||||||||||||
| 2,300 | Blount International, Inc. * | 27,439 | |||||||||||||
| 1,100 | CDI Corp. | 25,025 | |||||||||||||
| 2,300 | Ceradyne, Inc. * | 71,553 | |||||||||||||
See accompanying notes to the financial statements.
10
GMO U.S. Small/Mid Cap Value Fund
(A Series of GMO Trust)
Schedule of Investments — (Continued)
(showing percentage of total net assets)
February 29, 2008
| Shares | Description | Value ($) | |||||||||||||
| Industrials — continued | |||||||||||||||
| 3,200 | Copart, Inc. * | 133,312 | |||||||||||||
| 2,700 | Crane Co. | 111,321 | |||||||||||||
| 1,100 | Curtiss-Wright Corp. | 46,266 | |||||||||||||
| 10,400 | Deluxe Corp. | 216,632 | |||||||||||||
| 900 | Ducommun, Inc. * | 24,957 | |||||||||||||
| 700 | Ennis, Inc. | 11,172 | |||||||||||||
| 1,000 | EnPro Industries, Inc. * | 29,530 | |||||||||||||
| 200 | Esterline Technologies Corp. * | 10,480 | |||||||||||||
| 400 | FTI Consulting, Inc. * | 25,400 | |||||||||||||
| 400 | Gardner Denver, Inc. * | 14,764 | |||||||||||||
| 1,700 | Hubbell, Inc.-Class B | 77,129 | |||||||||||||
| 800 | Kaman Corp.-Class A | 19,200 | |||||||||||||
| 4,700 | Kelly Services, Inc.-Class A | 90,287 | |||||||||||||
| 2,900 | Kennametal, Inc. | 88,073 | |||||||||||||
| 2,200 | Lennox International, Inc. | 82,808 | |||||||||||||
| 1,300 | Manpower, Inc. | 73,710 | |||||||||||||
| 400 | Middleby Corp. * | 27,200 | |||||||||||||
| 1,200 | Mine Safety Appliances Co. | 48,132 | |||||||||||||
| 2,300 | Mueller Industries, Inc. | 66,079 | |||||||||||||
| 1,200 | Pall Corp. | 47,244 | |||||||||||||
| 3,700 | Pentair, Inc. | 120,694 | |||||||||||||
| 2,100 | Resources Connection, Inc. | 33,810 | |||||||||||||
| 1,800 | Rush Enterprises, Inc.-Class A * | 26,676 | |||||||||||||
| 3,700 | Simpson Manufacturing Co., Inc. | 88,652 | |||||||||||||
| 2,300 | Skywest, Inc. | 50,876 | |||||||||||||
| 3,100 | SPX Corp. | 317,130 | |||||||||||||
| 2,900 | Teleflex, Inc. | 163,995 | |||||||||||||
| 300 | Tennant Co. | 10,824 | |||||||||||||
| 2,700 | Timken Co. (The) | 81,351 | |||||||||||||
| 1,500 | United Rentals, Inc. * | 30,150 | |||||||||||||
| 2,900 | United Stationers, Inc. * | 143,144 | |||||||||||||
| 700 | Universal Forest Products, Inc. | 19,446 | |||||||||||||
| 2,300 | URS Corp. * | 92,644 | |||||||||||||
| 500 | Watson Wyatt Worldwide, Inc. | 26,525 | |||||||||||||
See accompanying notes to the financial statements.
11
GMO U.S. Small/Mid Cap Value Fund
(A Series of GMO Trust)
Schedule of Investments — (Continued)
(showing percentage of total net assets)
February 29, 2008
| Shares | Description | Value ($) | |||||||||||||
| Industrials — continued | |||||||||||||||
| 2,400 | Werner Enterprises, Inc. | 42,696 | |||||||||||||
| 400 | Woodward Governor Co. | 11,428 | |||||||||||||
| 6,000 | YRC Worldwide, Inc. * | 82,560 | |||||||||||||
| Total Industrials | 3,306,433 | ||||||||||||||
| Information Technology — 9.5% | |||||||||||||||
| 5,800 | ADC Telecommunications, Inc. * | 79,286 | |||||||||||||
| 2,300 | ADTRAN, Inc. | 42,366 | |||||||||||||
| 2,200 | Affiliated Computer Services, Inc.-Class A * | 111,650 | |||||||||||||
| 800 | Anixter International, Inc. * | 52,312 | |||||||||||||
| 5,100 | Arrow Electronics, Inc. * | 166,311 | |||||||||||||
| 5,400 | Avnet, Inc. * | 182,034 | |||||||||||||
| 900 | Brightpoint, Inc. * | 9,306 | |||||||||||||
| 1,200 | Cabot Microelectronics Corp. * | 40,188 | |||||||||||||
| 1,100 | CACI International, Inc.-Class A * | 48,026 | |||||||||||||
| 1,700 | Checkpoint Systems, Inc. * | 41,140 | |||||||||||||
| 9,500 | Compuware Corp. * | 75,620 | |||||||||||||
| 3,100 | Convergys Corp. * | 44,764 | |||||||||||||
| 300 | Diebold, Inc. | 7,236 | |||||||||||||
| 2,400 | Dycom Industries, Inc. * | 27,456 | |||||||||||||
| 6,700 | Earthlink, Inc. * | 48,441 | |||||||||||||
| 1,850 | Factset Research Systems, Inc. | 97,384 | |||||||||||||
| 1,500 | Foundry Networks, Inc. * | 17,805 | |||||||||||||
| 1,400 | Global Payments, Inc. | 55,538 | |||||||||||||
| 1,200 | Infospace, Inc. | 12,228 | |||||||||||||
| 20,050 | Ingram Micro, Inc.-Class A * | 306,164 | |||||||||||||
| 4,800 | Insight Enterprises, Inc. * | 84,144 | |||||||||||||
| 5,800 | Intersil Corp.-Class A | 134,966 | |||||||||||||
| 1,800 | j2 Global Communications, Inc. * | 38,736 | |||||||||||||
| 4,500 | Lexmark International, Inc. * | 148,635 | |||||||||||||
| 1,900 | Maximus, Inc. | 69,008 | |||||||||||||
| 6,300 | Novell, Inc. * | 46,935 | |||||||||||||
| 100 | Novellus System, Inc. * | 2,208 | |||||||||||||
| 6,200 | Plantronics, Inc. | 116,932 | |||||||||||||
See accompanying notes to the financial statements.
12
GMO U.S. Small/Mid Cap Value Fund
(A Series of GMO Trust)
Schedule of Investments — (Continued)
(showing percentage of total net assets)
February 29, 2008
| Shares | Description | Value ($) | |||||||||||||
| Information Technology — continued | |||||||||||||||
| 500 | Plexus Corp. * | 12,385 | |||||||||||||
| 900 | ScanSource, Inc. * | 30,573 | |||||||||||||
| 6,400 | Semtech Corp. * | 81,536 | |||||||||||||
| 3,000 | Sybase, Inc. * | 79,860 | |||||||||||||
| 3,200 | SYNNEX Corp. * | 66,592 | |||||||||||||
| 200 | Synopsys, Inc. * | 4,642 | |||||||||||||
| 9,497 | Tech Data Corp. * | 316,725 | |||||||||||||
| 6,100 | Total System Services, Inc. | 135,603 | |||||||||||||
| 15,800 | Western Digital Corp. * | 487,746 | |||||||||||||
| 2,100 | Zoran Corp. * | 28,833 | |||||||||||||
| Total Information Technology | 3,351,314 | ||||||||||||||
| Materials — 6.8% | |||||||||||||||
| 3,300 | AptarGroup, Inc. | 123,684 | |||||||||||||
| 1,000 | Bemis Co., Inc. | 24,820 | |||||||||||||
| 1,300 | Cabot Corp. | 35,620 | |||||||||||||
| 400 | Carpenter Technology Corp. | 25,132 | |||||||||||||
| 2,900 | Celanese Corp.-Class A | 112,810 | |||||||||||||
| 2,500 | Commercial Metals Co. | 76,150 | |||||||||||||
| 1,100 | Cytec Industries, Inc. | 63,008 | |||||||||||||
| 1,000 | Eastman Chemical Co. | 65,810 | |||||||||||||
| 3,600 | FMC Corp. | 203,796 | |||||||||||||
| 2,700 | Headwaters, Inc. * | 33,102 | |||||||||||||
| 5,200 | Lubrizol Corp. | 303,160 | |||||||||||||
| 3,800 | Olin Corp | 73,036 | |||||||||||||
| 1,200 | Owens-IIlinois, Inc. * | 67,740 | |||||||||||||
| 600 | PolyOne Corp. * | 3,900 | |||||||||||||
| 4,500 | Quanex Corp. | 231,525 | |||||||||||||
| 4,700 | Reliance Steel & Aluminum Co. | 260,897 | |||||||||||||
| 200 | Rock-Tenn Co.-Class A | 5,366 | |||||||||||||
| 1,200 | Rockwood Holdings, Inc. * | 36,828 | |||||||||||||
| 1,100 | Schnitzer Steel Industries, Inc.-Class A | 72,017 | |||||||||||||
| 300 | Sealed Air Corp. | 7,263 | |||||||||||||
| 3,500 | Sensient Technologies Corp. | 94,290 | |||||||||||||
See accompanying notes to the financial statements.
13
GMO U.S. Small/Mid Cap Value Fund
(A Series of GMO Trust)
Schedule of Investments — (Continued)
(showing percentage of total net assets)
February 29, 2008
| Shares | Description | Value ($) | |||||||||||||
| Materials — continued | |||||||||||||||
| 4,000 | Sigma Aldrich Corp. | 220,080 | |||||||||||||
| 300 | Silgan Holdings, Inc. | 14,022 | |||||||||||||
| 3,100 | Smurfit-Stone Container Corp. * | 24,645 | |||||||||||||
| 900 | Sonoco Products Co. | 25,353 | |||||||||||||
| 958 | Stepan Co. | 32,668 | |||||||||||||
| 4,100 | Temple-Inland, Inc. | 56,293 | |||||||||||||
| 5,500 | Worthington Industries, Inc. | 96,745 | |||||||||||||
| Total Materials | 2,389,760 | ||||||||||||||
| Telecommunication Services — 1.1% | |||||||||||||||
| 5,600 | CenturyTel, Inc. | 202,664 | |||||||||||||
| 5,100 | Premiere Global Services, Inc. * | 72,063 | |||||||||||||
| 2,200 | Telephone & Data Systems, Inc. | 103,180 | |||||||||||||
| Total Telecommunication Services | 377,907 | ||||||||||||||
| Utilities — 0.8% | |||||||||||||||
| 1,100 | Central Vermont Public Service | 26,345 | |||||||||||||
| 2,200 | Energen Corp. | 132,000 | |||||||||||||
| 2,000 | Energy East Corp. | 53,300 | |||||||||||||
| 300 | Equitable Resources, Inc. | 18,486 | |||||||||||||
| 700 | ONEOK, Inc. | 32,599 | |||||||||||||
| 700 | TECO Energy, Inc. | 10,486 | |||||||||||||
| Total Utilities | 273,216 | ||||||||||||||
| TOTAL COMMON STOCKS (COST $39,830,880) | 34,875,548 | ||||||||||||||
See accompanying notes to the financial statements.
14
GMO U.S. Small/Mid Cap Value Fund
(A Series of GMO Trust)
Schedule of Investments — (Continued)
(showing percentage of total net assets)
February 29, 2008
| Par Value ($) | Description | Value ($) | |||||||||||||
| SHORT-TERM INVESTMENTS — 3.3% | |||||||||||||||
| 1,174,915 | Citigroup Global Markets Repurchase Agreement, dated 02/29/08, due 03/03/08, with a maturity value of $1,174,989 and an effective yield of 0.75%, collateralized by a U.S. Treasury Bond with a rate of 8.13%, maturity date of 08/15/19 and a market value, including accrued interest, of $1,187,212. | 1,174,915 | |||||||||||||
| TOTAL SHORT-TERM INVESTMENTS (COST $1,174,915) | 1,174,915 | ||||||||||||||
| TOTAL INVESTMENTS — 102.3% (Cost $41,005,795) | 36,050,463 | ||||||||||||||
| Other Assets and Liabilities (net) — (2.3%) | (820,442 | ) | |||||||||||||
| TOTAL NET ASSETS �� 100.0% | $ | 35,230,021 | |||||||||||||
Notes to Schedule of Investments:
REIT - Real Estate Investment Trust
* Non-income producing security.
See accompanying notes to the financial statements.
15
GMO U.S. Small/Mid Cap Value Fund
(A Series of GMO Trust)
Statement of Assets and Liabilities — February 29, 2008
| Assets: | |||||||
| Investments, at value (cost $41,005,795) (Note 2) | $ | 36,050,463 | |||||
| Receivable for investments sold | 3,241,235 | ||||||
| Dividends and interest receivable | 45,262 | ||||||
| Receivable for expenses reimbursed by Manager (Note 3) | 6,293 | ||||||
| Total assets | 39,343,253 | ||||||
| Liabilities: | |||||||
| Payable for Fund shares repurchased | 4,011,296 | ||||||
| Payable to affiliate for (Note 3): | |||||||
| Management fee | 9,923 | ||||||
| Shareholder service fee | 4,802 | ||||||
| Trustees and Chief Compliance Officer of GMO Trust fees | 54 | ||||||
| Accrued expenses | 87,157 | ||||||
| Total liabilities | 4,113,232 | ||||||
| Net assets | $ | 35,230,021 | |||||
| Net assets consist of: | |||||||
| Paid-in capital | $ | 43,303,625 | |||||
| Accumulated undistributed net investment income | 31,207 | ||||||
| Distributions in excess of net realized gain | (3,149,479 | ) | |||||
| Net unrealized depreciation | (4,955,332 | ) | |||||
| $ | 35,230,021 | ||||||
| Net assets attributable to: | |||||||
| Class III shares | $ | 35,230,021 | |||||
| Shares outstanding: | |||||||
| Class III | 4,789,671 | ||||||
| Net asset value per share: | |||||||
| Class III | $ | 7.36 | |||||
See accompanying notes to the financial statements.
16
GMO U.S. Small/Mid Cap Value Fund
(A Series of GMO Trust)
Statement of Operations — Year Ended February 29, 2008
| Investment Income: | |||||||
| Dividends | $ | 877,942 | |||||
| Interest | 66,984 | ||||||
| Securities lending income | 28,722 | ||||||
| Total investment income | 973,648 | ||||||
| Expenses: | |||||||
| Management fee (Note 3) | 158,341 | ||||||
| Shareholder service fee – Class III (Note 3) | 76,617 | ||||||
| Custodian, fund accounting agent and transfer agent fees | 46,710 | ||||||
| Audit and tax fees | 47,906 | ||||||
| Legal fees | 737 | ||||||
| Trustees fees and related expenses (Note 3) | 528 | ||||||
| Miscellaneous | 474 | ||||||
| Total expenses | 331,313 | ||||||
| Fees and expenses reimbursed by Manager (Note 3) | (95,627 | ) | |||||
| Net expenses | 235,686 | ||||||
| Net investment income (loss) | 737,962 | ||||||
| Realized and unrealized gain (loss): | |||||||
| Net realized gain (loss) on: | |||||||
| Investments | (920,742 | ) | |||||
| Closed futures contracts | (102,693 | ) | |||||
| Net realized gain (loss) | (1,023,435 | ) | |||||
| Change in net unrealized appreciation (depreciation) on: | |||||||
| Investments | (9,359,464 | ) | |||||
| Open futures contracts | (2,261 | ) | |||||
| Net unrealized gain (loss) | (9,361,725 | ) | |||||
| Net realized and unrealized gain (loss) | (10,385,160 | ) | |||||
| Net increase (decrease) in net assets resulting from operations | $ | (9,647,198 | ) | ||||
See accompanying notes to the financial statements.
17
GMO U.S. Small/Mid Cap Value Fund
(A Series of GMO Trust)
Statement of Changes in Net Assets
| Year Ended February 29, 2008 | Year Ended February 28, 2007 | ||||||||||
| Increase (decrease) in net assets: | |||||||||||
| Operations: | |||||||||||
| Net investment income (loss) | $ | 737,962 | $ | 881,835 | |||||||
| Net realized gain (loss) | (1,023,435 | ) | 5,343,873 | ||||||||
| Change in net unrealized appreciation (depreciation) | (9,361,725 | ) | (1,717,958 | ) | |||||||
| Net increase (decrease) in net assets from operations | (9,647,198 | ) | 4,507,750 | ||||||||
| Distributions to shareholders from: | |||||||||||
| Net investment income | |||||||||||
| Class III | (739,082 | ) | (1,160,532 | ) | |||||||
| Net realized gains | |||||||||||
| Class III | (4,151,014 | ) | (6,589,407 | ) | |||||||
| (4,890,096 | ) | (7,749,939 | ) | ||||||||
| Net share transactions (Note 7): | |||||||||||
| Class III | (8,753,035 | ) | 8,181,959 | ||||||||
| Purchase premiums and redemption fees (Notes 2 and 7): | |||||||||||
| Class III | 68,226 | 123,054 | |||||||||
| Total increase (decrease) in net assets resulting from net share transactions, purchase premiums and redemption fees | (8,684,809 | ) | 8,305,013 | ||||||||
| Total increase (decrease) in net assets | (23,222,103 | ) | 5,062,824 | ||||||||
| Net assets: | |||||||||||
| Beginning of period | 58,452,124 | 53,389,300 | |||||||||
| End of period (including accumulated undistributed net investment income of $31,207 and $38,039, respectively) | $ | 35,230,021 | $ | 58,452,124 | |||||||
See accompanying notes to the financial statements.
18
GMO U.S. Small/Mid Cap Value Fund
(A Series of GMO Trust)
Financial Highlights
(For a Class III share outstanding throughout each period)
| Year Ended February 28/29, | |||||||||||||||||||||||
| 2008 | 2007 | 2006 | 2005 | 2004 | |||||||||||||||||||
| Net asset value, beginning of period | $ | 10.01 | $ | 10.52 | $ | 12.38 | $ | 15.51 | $ | 9.81 | |||||||||||||
| Income (loss) from investment operations: | |||||||||||||||||||||||
| Net investment income (loss) | 0.13 | † | 0.15 | † | 0.20 | † | 0.19 | † | 0.17 | ||||||||||||||
| Net realized and unrealized gain (loss) | (1.87 | ) | 0.68 | 1.11 | 1.32 | 5.78 | |||||||||||||||||
| Total from investment operations | (1.74 | ) | 0.83 | 1.31 | 1.51 | 5.95 | |||||||||||||||||
| Less distributions to shareholders: | |||||||||||||||||||||||
| From net investment income | (0.13 | ) | (0.20 | ) | (0.21 | ) | (0.16 | ) | (0.15 | ) | |||||||||||||
| From net realized gains | (0.78 | ) | (1.14 | ) | (2.96 | ) | (4.48 | ) | (0.10 | ) | |||||||||||||
| Total distributions | (0.91 | ) | (1.34 | ) | (3.17 | ) | (4.64 | ) | (0.25 | ) | |||||||||||||
| Net asset value, end of period | $ | 7.36 | $ | 10.01 | $ | 10.52 | $ | 12.38 | $ | 15.51 | |||||||||||||
| Total Return(a) | (18.73 | )% | 8.71 | % | 11.67 | % | 14.98 | % | 61.14 | % | |||||||||||||
| Ratios/Supplemental Data: | |||||||||||||||||||||||
| Net assets, end of period (000's) | $ | 35,230 | $ | 58,452 | $ | 53,389 | $ | 80,084 | $ | 179,268 | |||||||||||||
| Net expenses to average daily net assets | 0.46 | % | 0.46 | % | 0.48 | % | 0.48 | % | 0.48 | % | |||||||||||||
| Net investment income to average daily net assets | 1.44 | % | 1.46 | % | 1.71 | % | 1.48 | % | 1.21 | % | |||||||||||||
| Portfolio turnover rate | 63 | % | 79 | % | 48 | % | 66 | % | 86 | % | |||||||||||||
| Fees and expenses reimbursed by the Manager to average daily net assets: | 0.19 | % | 0.22 | % | 0.19 | % | 0.12 | % | 0.08 | % | |||||||||||||
| Purchase premiums and redemption fees consisted of the following per share amounts:† | $ | 0.01 | $ | 0.02 | $ | 0.04 | $ | 0.09 | $ | 0.04 | |||||||||||||
(a) The total returns would have been lower had certain expenses not been reimbursed during the periods. shown and assumes the effect of reinvested distributions. Calculation excludes purchase premiums and redemption fees which are borne by the shareholders.
† Calculated using average shares outstanding throughout the period.
See accompanying notes to the financial statements.
19
GMO U.S. Small/Mid Cap Value Fund
(A Series of GMO Trust)
Notes to Financial Statements
February 29, 2008
1. Organization
GMO U.S. Small/Mid Cap Value Fund (the "Fund") is a series of GMO Trust (the "Trust"). The Fund is registered under the Investment Company Act of 1940, as amended, as an open-end, diversified management investment company. The Fund is advised and managed by Grantham, Mayo, Van Otterloo & Co. LLC (the "Manager" or "GMO"). The Trust was established as a Massachusetts business trust under the laws of the Commonwealth of Massachusetts on June 24, 1985. The Declaration of Trust permits the Trustees of the Trust ("Trustees") to create an unlimited number of series of shares ("Funds") and to subdivide Funds into classes.
The Fund seeks long-term capital growth. The Fund seeks to achieve its objective by outperforming the Russell 2500 Value Index. The Fund typically makes equity investments in U.S. companies that issue stocks included in the Russell 2500 Index, and companies with similar market capitalizations.
2. Significant accounting policies
The following is a summary of significant accounting policies which are in conformity with accounting principles generally accepted in the United States of America ("U.S. GAAP") and which are consistently followed by the Fund in the preparation of its financial statements. The preparation of financial statements in accordance with U.S. GAAP requires management to make estimates and assumptions that affect the reported amounts and disclosures in the financial statements. Actual results could differ from those estimates. The accounting records of the Fund are maintained in U.S. dollars.
Portfolio valuation
Securities listed on a securities exchange for which market quotations are readily available are valued at the last sale price or official closing price on each business day, or if there is no such reported sale or official closing price, at the most recent quoted bid price. Unlisted securities for which market quotations are readily available are generally valued at the most recent quoted bid price. Short-term investments with a remaining maturity of sixty days or less are generally valued at amortized cost, which approximates fair value. Shares of investment funds are valued at their net asset value. Securities for which quotations are not readily available or whose values the Manager has determined to be unreliable are valued at fair value as determined in good faith by the Trustees or other persons acting at their direction pursuant to procedures approved by the Trustees. By its nature, a fair value price is a good faith est imate of the value of a security at a given point in time and may not reflect the value that would be realized if the security was sold and the differences could be material.
Futures contracts
The Fund may purchase and sell futures contracts. Upon entering into a futures contract, the Fund is required to deposit with the futures clearing broker an amount of cash, U.S. government and agency obligations, or other liquid assets in accordance with the initial margin requirements of the broker or
20
GMO U.S. Small/Mid Cap Value Fund
(A Series of GMO Trust)
Notes to Financial Statements — (Continued)
February 29, 2008
exchange. In addition, the Fund maintains cash or securities in an amount that at least equals the net amount payable in the event the Fund must deliver the full amount of the contracts. Futures contracts are marked to market daily and an appropriate payable or receivable for the change in value ("variation margin") is recorded by the Fund. The payable or receivable is liquidated on the following business day. Gains or losses are recognized but not considered realized until the contracts expire or are closed. Futures contracts involve, to varying degrees, risk of loss in excess of the variation margin disclosed in the Statement of Assets and Liabilities. Under certain circumstances, futures exchanges may establish daily limits on the amount that the price of a futures contract can vary from the previous day's settlement price, thereby effectively preventing liquidation of unfavorable positions. Losses may arise from changes in t he value of the underlying instrument if the Fund is unable to liquidate a futures position due to an illiquid secondary market for the contracts or the imposition of price limits, or if counterparties do not perform under the contract terms. Futures contracts are generally valued at the settlement price established each day by the board of trade or exchange on which they are traded. There were no futures contracts outstanding at the end of the period.
Swap agreements
The Fund may enter into swap agreements. A swap is an agreement to exchange the return generated by one instrument for the return generated by another instrument. Interest rate swap agreements involve the exchange by one party with another party of their respective commitments to pay or receive interest, e.g., an exchange of floating rate payments for fixed rate payments with respect to a notional amount of principal. Total return swap agreements involve a commitment by one party in the agreement to pay interest in exchange for a market-linked return, both based on notional amounts. To the extent the total return of the security or index underlying the transaction exceeds or falls short of the offsetting interest rate obligation, the party will receive a payment from or make a payment to the counterparty, respectively. Forward spread lo ck swap agreements involve commitments to pay or receive a settlement amount calculated as the difference between the swap spread and a fixed spread, multiplied by the notional amount times the duration of the swap rate. The swap spread is the difference between the benchmark swap rate (market rate) and the specific treasury rate. Variance swap agreements involve commitments to pay or receive a settlement amount calculated as the difference between the annualized realized variance of returns on the underlying price and a fixed quantity, also known as the variance strike, over a period of time. In connection with these agreements, cash or securities may be set aside as collateral by the Fund's custodian or brokers in accordance with the terms of the swap agreement. The Fund earns or pays interest on cash set aside as collateral.
Swaps are marked to market daily using models that incorporate quotations from market makers and the change in value, if any, is recorded as unrealized gain or loss in the Statement of Operations. Payments received or made on swap contracts are recorded as realized gain or loss in the Statement of Operations. Gains or losses are realized upon early termination of the swap agreements. These financial instruments are not actively traded on financial markets. The values assigned to these instruments are based upon the best available information and because of the uncertainty of the valuation, these values may differ
21
GMO U.S. Small/Mid Cap Value Fund
(A Series of GMO Trust)
Notes to Financial Statements — (Continued)
February 29, 2008
significantly from the values that would have been realized had a ready market for these instruments existed, and the differences could be material. Entering into these agreements involves, to varying degrees, elements of credit, legal, market and documentation risk in excess of the amounts recognized in the Statement of Assets and Liabilities. Such risks involve the possibility that there will be no liquid market for these agreements, that the counterparties to the agreements may default on their obligations to perform or disagree as to the meaning of contractual terms in the agreements, or that there may be unfavorable changes in interest rates or the price of the index or security underlying these transactions. There were no swap agreements outstanding at the end of the period.
Repurchase agreements
The Fund may enter into repurchase agreements with banks and broker-dealers whereby the Fund acquires a security for cash and obtains a simultaneous commitment from the seller to repurchase the security at an agreed upon price and date. The Fund, through its custodian, takes possession of securities collateralizing the repurchase agreement. The collateral is marked to market daily to ensure that the market value of the underlying assets remains sufficient to protect the Fund in the event of default by the seller. Collateral for certain tri-party repurchase agreements is held at the counterparty's custodian in a segregated account for the benefit of the Fund and the counterparty. In connection with transactions in repurchase agreements, if the seller defaults or enters into insolvency proceedings and the value of the collateral declines, recovery of cash by the Fund may be delayed or limited. Repurchase agreements outstanding at the end of the period are listed in the Fund's Schedule of Investments.
Securities lending
The Fund may lend its securities to certain qualified broker-dealers. The loans are collateralized with cash or liquid securities with a market value at least equal to the market value of the securities on loan. As with other extensions of credit, the Fund may bear the risk of loss with respect to the investment of the collateral, the risk of delay in and/or inability to exercise its rights with respect to the collateral, and the risk of delay in recovery or loss of rights in the loaned securities should the borrower of the securities fail financially. If a loan is collateralized by U.S. government securities, the Fund receives a fee from the borrower. If a loan is collateralized by cash, the Fund typically invests the cash collateral for its own account in interest-bearing, short-term securities and pays a fee to the borrower that normally represents a portion of the Fund's earnings on the collateral. As of February 29, 2008, t he Fund had no securities on loan.
Taxes and distributions
The Fund intends to qualify each tax year as a regulated investment company under Subchapter M of the Internal Revenue Code of 1986, as amended (the "Code"). The Fund intends to distribute substantially all of its net investment income and net realized short-term and long-term capital gains, if any, after giving effect to any available capital loss carryovers for U.S. federal income tax purposes. Therefore, no provision for U.S. federal income or excise tax is necessary.
22
GMO U.S. Small/Mid Cap Value Fund
(A Series of GMO Trust)
Notes to Financial Statements — (Continued)
February 29, 2008
The Fund's policy is to declare and pay distributions from net investment income, if any, quarterly, and from net realized short-term and long-term capital gains, if any, at least annually. All distributions are paid in shares of the Fund, at net asset value, unless the shareholder elects to receive cash distributions. Distributions to shareholders are recorded by the Fund on the ex-dividend date.
Income and capital gain distributions are determined in accordance with U.S. federal income tax regulations, which may differ from U.S. GAAP. Certain capital accounts in the financial statements are periodically adjusted for permanent differences in order to reflect their tax character. These adjustments have no impact on net assets or net asset value per share. Temporary differences which arise from recognizing certain items of income, expense, gain or loss in different periods for financial statement and tax purposes will reverse at some time in the future. Distributions in excess of net investment income or net realized gains are temporary over distributions for financial statement purposes resulting from differences in the recognition or classification of income or distributions for financial statement and tax purposes.
U.S. GAAP and tax accounting differences primarily relate to losses on wash sale transactions and post-October capital losses.
The following reclassification represents the amount necessary to report the stated components of net assets on a tax basis, excluding certain temporary differences, as of February 29, 2008. The financial highlights exclude these adjustments.
| Accumulated Undistributed Net Investment Income | Distributions In Excess Of Net Realized Gain | Paid-in Capital | |||||||||
| $ | (5,712 | ) | $ | 5,712 | $ | — | |||||
The tax character of distributions declared to shareholders is as follows:
| 2/29/2008 | 2/28/2007 | ||||||||||
| Ordinary income (including any short-term capital gains) | $ | 1,572,310 | $ | 2,676,756 | |||||||
| Long-term capital gains | 3,317,786 | 5,073,183 | |||||||||
| Total distributions | $ | 4,890,096 | $ | 7,749,939 | |||||||
Distributions in excess of tax basis earnings and profits, if significant, are reported in the financial statements as a tax return of capital.
As of February 29, 2008, the components of distributable earnings on a tax basis consisted of the following:
| Undistributed ordinary income | $ | 31,207 | |||||
23
GMO U.S. Small/Mid Cap Value Fund
(A Series of GMO Trust)
Notes to Financial Statements — (Continued)
February 29, 2008
As of February 29, 2008, the Fund elected to defer to March 1, 2008 post-October capital losses of $2,991,843.
As of February 29, 2008, the approximate cost for U.S. federal income tax purposes and gross and net unrealized appreciation and depreciation in value of investments were as follows:
| Aggregate Cost | Gross Unrealized Appreciation | Gross Unrealized (Depreciation) | Net Unrealized Appreciation (Depreciation) | ||||||||||||
| $ | 41,163,431 | $ | 1,991,527 | $ | (7,104,495 | ) | $ | (5,112,968 | ) | ||||||
Security transactions and related investment income
Security transactions are accounted for on trade date. Dividend income, net of applicable foreign withholding taxes, if any, is recorded on the ex-dividend date, or when the Fund is informed of the ex-dividend date, if later. Interest income is recorded on the accrual basis and is adjusted for the amortization of premiums and accretion of discounts. Interest income on inflation indexed securities, if any, is accrued daily based upon an inflation adjusted principal. Additionally, any increase or decrease in the principal or face amount of the securities adjusted for inflation is recorded as interest income or loss. Income is not recognized on securities for which collection is not expected. Non-cash dividends, if any, are recorded at the fair market value of the securities received. In determining the net gain or loss on securities sold, the cost of securities is determined on the identified cost basis.
Expenses
The majority of expenses of the Trust are directly identifiable to an individual fund. Expenses which are not readily identifiable to a specific fund are allocated taking into consideration, among other things, the nature and type of expense and the relative size of the funds.
State Street Bank and Trust Company ("State Street") serves as custodian, fund accounting agent and transfer agent of the Fund. State Street's fee may be reduced by credits that are an earnings allowance calculated on the average daily cash balances the Fund maintains with State Street. Credit balances used to reduce the fee paid to State Street, if any, are reported as a reduction of expenses in the Statement of Operations.
Purchases and redemptions of Fund shares
As of February 29, 2008, the premium on cash purchases and fee on cash redemptions of Fund shares were each 0.50% of the amount invested or redeemed. If the Manager determines that any portion of a cash purchase or redemption is offset by a corresponding cash redemption or purchase occurring on the same day, it will waive the purchase premium or redemption fee in an amount approximately equal to the fee with respect to that portion. In addition, the purchase premium or redemption fee charged by the Fund may be waived in extraordinary circumstances if the Fund will not incur transaction costs. All purchase
24
GMO U.S. Small/Mid Cap Value Fund
(A Series of GMO Trust)
Notes to Financial Statements — (Continued)
February 29, 2008
premiums and redemption fees are paid to and recorded by the Fund as paid-in capital. The Manager will waive the purchase premium relating to the in-kind portion of a purchase transaction except to the extent of certain estimated or known transaction costs (e.g. stamp duties and transfer taxes) incurred by the Fund in connection with the transfer of the purchasing shareholder's securities to the Fund. In-kind redemption transactions are generally not subject to redemption fees except to the extent those transactions include a cash component. However, when a substantial portion of a Fund is being redeemed, the Fund may assess estimated or known transaction costs. There is no premium for reinvested distributions.
Recently issued accounting pronouncements
In June 2006, the Financial Accounting Standards Board ("FASB") issued FASB Interpretation No. 48, Accounting for Uncertainty in Income Taxes – an Interpretation of FASB Statement No. 109 ("FIN 48"). FIN 48 clarifies the accounting for uncertainty in income taxes recognized in accordance with FASB Statement No. 109, Accounting for Income Taxes. FIN 48 prescribes a recognition threshold and measurement attribute for a tax position taken or expected to be taken in the tax return that could impact the Fund's financial statements. It also provides guidance in relation to the Fund's financial statements on classification of tax benefits or liabilities, interest and penalties, accounting in interim periods, disclosure, and transition. FIN 48 is effective for fiscal years beginning after December 15, 2006 for registered investment companies. Management has evaluated the effects of applying the various provisions of FIN 48 and has determined that the adoption of FIN 48 does not have a material effect on the Fund's financial statements. The Fund's federal tax returns for the prior three fiscal years, if applicable, remain subject to examination by the Internal Revenue Service. Management will continue to monitor the rules and guidance pertaining to FIN 48 and will take action if appropriate.
In September 2006, the FASB issued Statement of Financial Accounting Standards No. 157 ("FAS 157"), "Fair Value Measurements." FAS 157 defines fair value, establishes a framework for measuring fair value in accordance with generally accepted accounting principles and expands disclosure about fair value measurements. FAS 157 is effective for fiscal years beginning after November 15, 2007. Management is currently evaluating the impact the adoption of FAS 157 will have on the Fund's financial statement disclosures.
3. Fees and other transactions with affiliates
GMO earns a management fee paid monthly at the annual rate of 0.31% of average daily net assets. The Fund has adopted a Shareholder Service Plan under which the Fund pays GMO a shareholder service fee for client and shareholder service, reporting, and other support. Pursuant to the Shareholder Service Plan, the shareholder service fee is calculated based on average daily net assets at the annual rate of 0.15% for Class III shares.
The Manager has contractually agreed to reimburse the Fund for Fund expenses through at least June 30, 2008 to the extent the Fund's total annual operating expenses (excluding shareholder service fees, fees and expenses of the independent Trustees of the Trust, fees and expenses for legal services not approved by the
25
GMO U.S. Small/Mid Cap Value Fund
(A Series of GMO Trust)
Notes to Financial Statements — (Continued)
February 29, 2008
Manager for the Trust, compensation and expenses of the Trust's Chief Compliance Officer ("CCO") (excluding any employee benefits), brokerage commissions, securities lending fees and expenses, interest expense, transfer taxes, and other investment-related costs (including expenses associated with investments in any company that is an investment company or would be an investment company under the 1940 Act, but for the exceptions to the definition of investment company provided in Section 3(c)(1) and 3(c)(7) of the 1940 Act), hedging transaction fees, extraordinary, non-recurring and certain other unusual expenses (including taxes) exceed 0.31% of the Fund's average daily net assets.
The Fund's portion of the fee paid by the Trust to the independent Trustees and CCO during the year ended February 29, 2008 was $436 and $199, respectively. The compensation and expenses of the CCO are included in miscellaneous expenses in the Statement of Operations. No remuneration was paid by the Fund to any other officer of the Trust.
4. Purchases and sales of securities
Cost of purchases and proceeds from sales of securities, excluding short-term investments, for the year ended February 29, 2008 aggregated $30,911,328 and $42,286,364, respectively.
5. Guarantees
In the normal course of business the Fund enters into contracts with third-party service providers that contain a variety of representations and warranties and which provide general indemnifications. The Fund's maximum exposure under these arrangements is unknown, as this would involve future claims that may be made against the Fund that have not yet occurred. Based on experience, management is of the view that the risk of loss in connection with these potential indemnification obligations is remote; however, there can be no assurance that material liabilities related to such obligations will not arise in the future that could adversely impact the Fund.
6. Principal shareholders and related parties
As of February 29, 2008, 61.48% of the outstanding shares of the Fund were held by two shareholders, each holding in excess of 10% of the Fund's outstanding shares. No other shareholder owned in excess of 10% of the outstanding shares of the Fund. Investment activities of these shareholders may have a material effect on the Fund.
As of February 29, 2008, 0.14% of the Fund's shares were held by five related parties comprised of certain GMO employee accounts, and 61.14% of the Fund's shares were held by accounts for which the Manager has investment discretion.
26
GMO U.S. Small/Mid Cap Value Fund
(A Series of GMO Trust)
Notes to Financial Statements — (Continued)
February 29, 2008
7. Share transactions
The Declaration of Trust permits the Trustees to issue an unlimited number of shares of beneficial interest (without par value). Transactions in Fund shares were as follows:
| Year Ended February 29, 2008 | Year Ended February 28, 2007 | ||||||||||||||||||
| Class III: | Shares | Amount | Shares | Amount | |||||||||||||||
| Shares sold | 3,584 | $ | 31,432 | 1,190,034 | $ | 12,827,643 | |||||||||||||
| Shares issued to shareholders in reinvestment of distributions | 541,777 | 4,846,264 | 788,738 | 7,656,823 | |||||||||||||||
| Shares repurchased | (1,595,273 | ) | (13,630,731 | ) | (1,212,411 | ) | (12,302,507 | ) | |||||||||||
| Purchase premiums | — | 114 | — | 63,264 | |||||||||||||||
| Redemption fees | — | 68,112 | — | 59,790 | |||||||||||||||
| Net increase (decrease) | (1,049,912 | ) | $ | (8,684,809 | ) | 766,361 | $ | 8,305,013 | |||||||||||
27
Report of Independent Registered Public Accounting Firm
To the Trustees of GMO Trust and the Shareholders of
GMO U.S. Small/Mid Cap Value Fund
In our opinion, the accompanying statement of assets and liabilities, including the schedule of investments, and the related statements of operations and of changes in net assets and the financial highlights present fairly, in all material respects, the financial position of GMO U.S. Small/Mid Cap Value Fund (the "Fund") at February 29, 2008, the results of its operations for the year then ended, the changes in its net assets for each of the two years in the period then ended and the financial highlights for each of the five years in the period then ended, in conformity with accounting principles generally accepted in the United States of America. These financial statements and financial highlights (hereafter referred to as "financial statements") are the responsibility of the Fund's management; our responsibility is to express an opinion on these financial statements based on our audits. We conducted our audits of these financi al statements in accordance with the standards of the Public Company Accounting Oversight Board (United States). Those standards require that we plan and perform the audit to obtain reasonable assurance about whether the financial statements are free of material misstatement. An audit includes examining, on a test basis, evidence supporting the amounts and disclosures in the financial statements, assessing the accounting principles used and significant estimates made by management, and evaluating the overall financial statement presentation. We believe that our audits, which included confirmation of securities at February 29, 2008 by correspondence with the custodian, provide a reasonable basis for our opinion.
PricewaterhouseCoopers LLP
Boston, Massachusetts
April 29, 2008
28
GMO U.S. Small/Mid Cap Value Fund
(A Series of GMO Trust)
Fund Expenses
February 29, 2008 (Unaudited)
Expense Examples: The following information is in relation to expenses for the six month period ended February 29, 2008.
As a shareholder of the Fund, you may incur two types of costs: (1) transaction costs, including purchase premiums and redemption fees; and (2) ongoing costs, including management fees, shareholder service fees, and other Fund expenses. This example is intended to help you understand your ongoing costs (in dollars) of investing in the Fund and to compare these costs with the ongoing costs of investing in other mutual funds.
These examples are based on an investment of $1,000 invested at the beginning of the period and held for the entire period, September 1, 2007 through February 29, 2008.
Actual Expenses
The first line of the table below provides information about actual account values and actual expenses. You may use the information in this line, together with the amount you invested, to estimate the expenses that you paid over the period. Simply divide your account value by $1,000 (for example, a $10,000,000 account value divided by $1,000 = 10,000), then multiply the result by the number in the first line under the heading entitled "Net Expense Incurred" to estimate the expenses you paid on your account during this period.
Hypothetical Example for Comparison Purposes
The second line of the table below provides information about hypothetical account values and hypothetical expenses based on the Fund's actual expense ratio and an assumed rate of return of 5% per year before expenses, which is not the Fund's actual return. The hypothetical account values and expenses may not be used to estimate the actual ending account balance or expenses you paid for the period. You may use this information to compare the ongoing costs of investing in the Fund with other funds. To do so, compare this 5% hypothetical example with the 5% hypothetical examples that appear in the shareholder reports of other funds.
Please note that the expenses shown in the table are meant to highlight your ongoing costs only and do not reflect any transactional costs, such as purchase premiums and redemption fees. Therefore, the second line of the table is useful in comparing ongoing costs only, and will not help you determine the relative total costs of owning different funds. In addition, if these transactional costs were included, your costs would have been higher.
| Annualized Net Expense Ratio | Beginning Account Value | Ending Account Value | Net Expense Incurred* | ||||||||||||||||
| Class III | |||||||||||||||||||
| 1) Actual | 0.46 | % | $ | 1,000.00 | $ | 859.20 | $ | 2.13 | |||||||||||
| 2) Hypothetical | 0.46 | % | $ | 1,000.00 | $ | 1,022.58 | $ | 2.31 | |||||||||||
* Expenses are calculated using the Class's annualized net expense ratio for the six months ended February 29, 2008, multiplied by the average account value over the period, multiplied by 182 days in the period, divided by 366 days in the year.
29
GMO U.S. Small/Mid Cap Value Fund
(A Series of GMO Trust)
Tax Information for the Tax Year Ended February 29, 2008 (Unaudited)
The Fund will notify shareholders of amounts for use in preparing 2008 income tax forms in January 2009.
The Fund's distributions to shareholders include $3,317,786 from long-term capital gains.
For taxable, non-corporate shareholders, 49.65% of the income and short-term capital gains, if any, distributed in the Fund's fiscal year ended February 29, 2008 represents qualified dividend income subject to the 15% rate category.
For corporate shareholders, 49.89% of the income and short-term capital gains, if any, distributed in the Fund's fiscal year ended February 29, 2008 qualified for the dividends-received deduction.
The Fund hereby designates as qualified interest income and qualified short-term capital gains with respect to its taxable year ended February 29, 2008, $26,374 and $840,947, respectively, or if determined to be different, the qualified interest income and qualified short-term gains of such year.
30
GMO U.S. Small/Mid Cap Value Fund
(A Series of GMO Trust)
Note Concerning Distributions (Unaudited)
The Fund previously reported estimated sources of any dividends, short-term capital gains, and long-term capital gains distributions paid on a per share basis. Pursuant to Rule 19a-1(e) of the Investment Company Act, the following serves as a correction of such estimates. 0.37% of distributions to shareholders declared from net realized gains during the Fund's fiscal year were reclassified to distributions from net investment income and are reflected as such in the Statement of Changes in Net Assets.
31
Trustees and Officers (Unaudited)
The following tables list the Trust's Trustees and Officers as of the date of this report; their address and date of birth ("DOB"); their position with the Trust; the length of time holding that position with the Trust; their principal occupation(s) during the past five years; the number of portfolios in the fund complex they oversee; and other directorships they hold in companies subject to registration or reporting requirements of the Securities Exchange Act of 1934 (generally called "public companies") or in registered investment companies. The Trust's Statement of Additional Information ("SAI") includes additional information about the Trust's trustees, including changes subsequent to the date of the report. The SAI is available, without charge, upon request by writing GMO, c/o GMO Trust, 40 Rowes Wharf, Boston, MA 02110.
Independent Trustees:
| Name, Address, and DOB | Position(s) Held with Trust | Term of Office1 and Length of Time Served | Principal Occupation(s) During Past Five Years | Number of Portfolios in Fund Complex Overseen by Trustee | Other Directorships Held by Trustee | ||||||||||||||||||
| Donald W. Glazer, Esq. c/o GMO Trust 40 Rowes Wharf Boston, MA 02110 DOB: 07/26/1944 | Chairman of the Board of Trustees | Chairman of the Board of Trustees since March 2005; Lead Independent Trustee (September 2004 – March 2005); Trustee since December 2000. | Consultant – Law and Business2; Vice Chair (since 2002) and Secretary, Provant, Inc. (provider of personnel performance improvement services and training products); Author of Legal Treatises. | 47 | None. | ||||||||||||||||||
1 Each Trustee is elected to serve during the continued lifetime of the Trust until he/she dies, resigns or is removed, or if sooner, until the next meeting of Shareholders called for the purpose of electing Trustees and until the election and qualification of his/her successor.
2 As part of Mr. Glazer's work as a consultant, he provides part-time consulting services to Goodwin Procter LLP ("Goodwin"). Goodwin has provided legal services to Renewable Resources, LLC, an affiliate of GMO; GMO, in connection with its relationship with Renewable Resources; and funds managed by Renewable Resources. Mr. Glazer has represented that he has no financial interest in, and is not involved in the provision of, such legal services. In the calendar years ended December 31, 2006 and December 31, 2007, these entities paid $825,738 and $291,721 respectively, in legal fees and disbursements to Goodwin.
32
Independent Trustees — (Continued)
| Name, Address, and DOB | Position(s) Held with Trust | Term of Office1 and Length of Time Served | Principal Occupation(s) During Past Five Years | Number of Portfolios in Fund Complex Overseen by Trustee | Other Directorships Held by Trustee | ||||||||||||||||||
| Jay O. Light c/o GMO Trust 40 Rowes Wharf Boston, MA 02110 DOB: 10/03/1941 | Trustee | Since May 1996. | Dean (since April 2006), Acting Dean (August 2005 – April 2006), Senior Associate Dean (1998 – 2005), and Professor of Business Administration, Harvard Business School. | 47 | Director of Harvard Management Company, Inc.3 and Verde, Inc.; Director of Partners HealthCare System, Inc. and Chair of its Investment Committee.4 | ||||||||||||||||||
| W. Nicholas Thorndike c/o GMO Trust 40 Rowes Wharf Boston, MA 02110 DOB: 03/28/1933 | Trustee | Since March 2005. | Director or trustee of various corporations and charitable organizations, including Courier Corporation (a book publisher and manufacturer) (July 1989 – present); Putnam Funds (December 1992 – June 2004); and Providence Journal (a newspaper publisher) (December 1986 – December 2003). | 47 | Director of Courier Corporation (a book publisher and manufacturer); Member of the Investment Committee of Partners HealthCare System, Inc.4 | ||||||||||||||||||
1 Each Trustee is elected to serve during the continued lifetime of the Trust until he/she dies, resigns or is removed, or if sooner, until the next meeting of Shareholders called for the purpose of electing Trustees and until the election and qualification of his/her successor.
3 Harvard Management Company, Inc. is a client of the Manager.
4 Partners HealthCare System, Inc. is a client of the Manager.
33
Principal Officers:
| Name, Address, and DOB | Position(s) Held with Trust | Term of Office5 and Length of Time Served | Principal Occupation(s) During Past Five Years | ||||||||||||
| Scott Eston c/o GMO Trust 40 Rowes Wharf Boston, MA 02110 DOB: 01/20/1956 | President and Chief Executive Officer | President and Chief Executive Officer since October 2002; Chief Financial Officer, November 2006 – February 2007. | Chief Financial Officer, Chief Operating Officer and Member, Grantham, Mayo, Van Otterloo & Co. LLC. | ||||||||||||
| Sheppard N. Burnett c/o GMO Trust 40 Rowes Wharf Boston, MA 02110 DOB: 10/24/1968 | Treasurer and Chief Financial Officer | Chief Financial Officer since March 2007; Treasurer since November 2006; Assistant Treasurer, September 2004 – November 2006. | Fund Administration Staff, Grantham, Mayo, Van Otterloo & Co. LLC (June 2004 – present); Vice President, Director of Tax, Columbia Management Group (2002 – 2004). | ||||||||||||
| Brent C. Arvidson c/o GMO Trust 40 Rowes Wharf Boston, MA 02110 DOB: 06/26/1969 | Assistant Treasurer | Since August 1998. | Senior Fund Administrator, Grantham, Mayo, Van Otterloo & Co. LLC. | ||||||||||||
| John L. Nasrah c/o GMO Trust 40 Rowes Wharf Boston, MA 02110 DOB: 05/27/1977 | Assistant Treasurer | Since March 2007. | Fund Administrator, Grantham, Mayo, Van Otterloo & Co. LLC (September 2004 – present); Tax Analyst, Bain & Company, Inc (June 2003 – September 2004); Senior Tax Associate, PricewaterhouseCoopers LLP (2001 – 2003). | ||||||||||||
| Mahmoodur Rahman c/o GMO Trust 40 Rowes Wharf Boston, MA 02110 DOB: 11/30/1967 | Assistant Treasurer | Since September 2007. | Fund Administrator, Grantham, Mayo, Van Otterloo & Co. (April 2007 – present); Vice President and Senior Tax Manager, Massachusetts Financial Services Company (January 2000 – April 2007). | ||||||||||||
| Michael E. Gillespie c/o GMO Trust 40 Rowes Wharf Boston, MA 02110 DOB: 02/18/1958 | Chief Compliance Officer | Since March 2005. | Vice President of Compliance (June 2004 – February 2005) and Director of Domestic Compliance (March 2002 – June 2004), Fidelity Investments; Vice President and Senior Counsel, State Street Bank and Trust Company (May 1998 – March 2002). | ||||||||||||
5 Officers are elected to hold such office until their successor is elected and qualified to carry out the duties and responsibilities of their office, or until he or she resigns or is removed from office.
34
Principal Officers — (Continued)
| Name, Address, and DOB | Position(s) Held with Trust | Term of Office5 and Length of Time Served | Principal Occupation(s) During Past Five Years | ||||||||||||
| Jason B. Harrison c/o GMO Trust 40 Rowes Wharf Boston, MA 02110 DOB: 01/29/1977 | Vice President and Clerk | Vice President since November 2006; Clerk since March 2006. | Legal Counsel, Grantham, Mayo, Van Otterloo & Co. LLC (since February 2006) and Attorney, Ropes & Gray LLP (September 2002 – February 2006). | ||||||||||||
| David L. Bohan c/o GMO Trust 40 Rowes Wharf Boston, MA 02110 DOB: 06/21/1964 | Vice President and Assistant Clerk | Vice President since March 2005; Assistant Clerk since March 2006. | Legal Counsel, Grantham, Mayo, Van Otterloo & Co. LLC (September 2003 – present); Attorney, Goodwin Procter LLP (September 1996 – September 2003). | ||||||||||||
| Gregory L. Pottle c/o GMO Trust 40 Rowes Wharf Boston, MA 02110 DOB: 07/09/1971 | Vice President and Assistant Clerk | Since November 2006. | Legal Counsel, Grantham, Mayo, Van Otterloo & Co. LLC. | ||||||||||||
| Anne K. Trinque c/o GMO Trust 40 Rowes Wharf Boston, MA 02110 DOB: 04/15/1978 | Vice President and Assistant Clerk | Since September 2007. | Legal Counsel, Grantham, Mayo, Van Otterloo & Co. LLC (since January 2007); Attorney, Goodwin Procter LLP (September 2003 – January 2007). | ||||||||||||
| Cheryl Wakeham c/o GMO Trust 40 Rowes Wharf Boston, MA 02110 DOB: 10/29/1958 | Anti-Money Laundering Officer | Since December 2004. | Manager, Client Service Administration, Grantham, Mayo, Van Otterloo & Co. LLC. | ||||||||||||
5 Officers are elected to hold such office until their successor is elected and qualified to carry out the duties and responsibilities of their office, or until he or she resigns or is removed from office.
35
GMO Short-Duration Collateral Fund
(A Series of GMO Trust)
Annual Report
February 29, 2008
For a free copy of the Fund's proxy voting guidelines, shareholders may call 1-617-346-7646 (collect), visit our website at www.gmo.com, or visit the Securities and Exchange Commission's website at www.sec.gov. Information regarding how the Fund voted proxies relating to portfolio securities during the most recent 12-month period ended June 30 is available on our website at www.gmo.com, or on the Securities and Exchange Commission's website at www.sec.gov.
The Fund files its complete schedule of portfolio holdings with the Securities and Exchange Commission for the first and third quarter of each fiscal year on Form N-Q, which is available on the Commission's website at www.sec.gov. The Fund's Form N-Q may be reviewed and copied at the Commission's Public Reference Room in Washington, D.C. Information on the operation of the Public Reference Room may be obtained by calling 1-800-SEC-0330.
This report is prepared for the general information of shareholders. It is authorized for distribution to prospective investors only when preceded or accompanied by a prospectus for the GMO Trust.
GMO Short-Duration Collateral Fund
(A Series of GMO Trust)
Portfolio Management
Day-to-day management of the Fund's portfolio is the responsibility of the Fixed Income Division at Grantham, Mayo, Van Otterloo & Co. LLC.
Management Discussion and Analysis of Fund Performance
Shares of the GMO Short-Duration Collateral Fund returned -1.1% for the fiscal year ended February 29, 2008, compared with the +5.8% for the JPMorgan U.S. 3 Month Cash Index.
The Fund underperformed the benchmark during the fiscal year by 6.9%, with negative performance mostly attributable to mark-to-market valuation in subprime and other asset-backed security holdings. The Short-Duration Collateral Fund primarily invests in high quality U.S. and foreign floating-rate fixed income securities, mainly asset-backed securities, in order to earn a LIBOR-type return.
With the extreme price volatility of AAA-credit quality asset-backed securities during the year, the Fund underperformed LIBOR by nearly 700 basis points.
The views expressed herein are exclusively those of Grantham, Mayo, Van Otterloo & Co. LLC Management as of the date of this report and are subject to change. GMO disclaims any responsibility to update such views. They are not meant as investment advice.
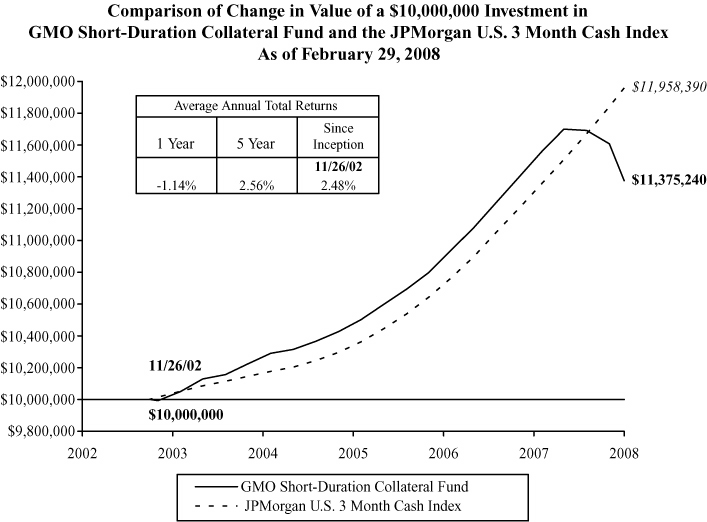
Performance data quoted represents past performance and is not indicative of future results. The investment return and principal value of an investment will fluctuate so that an investor's shares, when redeemed, may be worth more or less than their original cost. Current performance data may be lower or higher than the performance data provided herein. To obtain performance information to the most recent month-end, visit www.gmo.com. Performance shown is net of all fees after reimbursement from the Manager. Returns would have been lower had certain expenses not been reimbursed during the periods shown and do not include the effect of taxes on distributions and redemptions. All information is unaudited.
GMO Short-Duration Collateral Fund
(A Series of GMO Trust)
Investments Concentration Summary
February 29, 2008 (Unaudited)
| Asset Class Summary | % of Total Net Assets | ||||||
| Debt Obligations | 91.0 | % | |||||
| Short-Term Investments | 9.0 | ||||||
| Futures | (0.0 | ) | |||||
| Forward Currency Contracts | (0.0 | ) | |||||
| Swaps | (0.2 | ) | |||||
| Other | 0.2 | ||||||
| 100.0 | % | ||||||
| Industry Sector Summary | % of Debt Obligations | ||||||
| Credit Cards | 19.8 | % | |||||
| Residential Asset-Backed Securities (United States) | 19.5 | ||||||
| Auto Financing | 9.3 | ||||||
| Business Loans | 6.7 | ||||||
| Insured Auto Financing | 6.5 | ||||||
| Residential Mortgage-Backed Securities (European) | 5.9 | ||||||
| Student Loans | 5.3 | ||||||
| CMBS | 5.2 | ||||||
| Residential Mortgage-Backed Securities (Australian) | 3.9 | ||||||
| Investment Grade Corporate Collateralized Debt Obligations | 3.3 | ||||||
| Insured Other | 2.0 | ||||||
| CMBS Collateralized Debt Obligations | 1.4 | ||||||
| Equipment Leases | 1.3 | ||||||
| Bank Loan Collateralized Debt Obligations | 1.2 | ||||||
| Rate Reduction Bonds | 1.2 | ||||||
| Trade Receivables | 1.0 | ||||||
| U.S. Government Agency | 1.0 | ||||||
| Insurance Premiums | 0.8 | ||||||
| Insured Residential Mortgage-Backed Securities (United States) | 0.8 | ||||||
| Corporate Debt | 0.7 | ||||||
| Insured Time Share | 0.7 | ||||||
| Insured High Yield Collateralized Debt Obligations | 0.6 | ||||||
| Insured Credit Cards | 0.5 | ||||||
| Airlines | 0.4 | ||||||
| U.S. Government | 0.2 | ||||||
| Emerging Markets Collateralized Debt Obligations | 0.2 | ||||||
| Insured Residential Asset-Backed Securities (United States) | 0.2 | ||||||
| ABS Collateralized Debt Obligations | 0.1 | ||||||
| Insured Transportation | 0.1 | ||||||
| Residential Mortgage-Backed Securities (United States) | 0.1 | ||||||
| Insured Business Loans | 0.1 | ||||||
| Collateralized Loan Obligations | 0.0 | ||||||
| High Yield Collateralized Debt Obligations | 0.0 | ||||||
| Insured Residential Asset-Backed Securities (European) | 0.0 | ||||||
| 100.0 | % | ||||||
1
GMO Short-Duration Collateral Fund
(A Series of GMO Trust)
Schedule of Investments
(showing percentage of total net assets)
February 29, 2008
| Par Value ($) | Description | Value ($) | |||||||||
| DEBT OBLIGATIONS — 91.0% | |||||||||||
| Asset-Backed Securities — 89.2% | |||||||||||
| ABS Collateralized Debt Obligations — 0.1% | |||||||||||
| 15,000,000 | Paragon CDO Ltd., Series 04-1A, Class A, 144A, Variable Rate, 3 mo. LIBOR + .65%, 4.54%, due 10/20/44 | 9,750,000 | |||||||||
| Airlines — 0.3% | |||||||||||
| 23,000,000 | Aircraft Finance Trust, Series 99-1A, Class A1, 144A, Variable Rate, 1 mo. LIBOR + .48%, 3.60%, due 05/15/24 | 14,950,000 | |||||||||
| 11,240,415 | Continental Airlines Inc., Series 991A, 6.55%, due 02/02/19 | 10,987,506 | |||||||||
| Total Airlines | 25,937,506 | ||||||||||
| Auto Financing — 8.5% | |||||||||||
| 49,000,000 | BMW Vehicle Lease Trust, Series 07-1, Class A3B, Variable Rate, 1 mo. LIBOR + .24%, 3.36%, due 08/15/13 | 48,112,120 | |||||||||
| 32,000,000 | Capital Auto Receivable Asset Trust, Series 07-2, Class A4B, Variable Rate, 1 mo. LIBOR + .40%, 3.52%, due 02/18/14 | 31,017,600 | |||||||||
| 15,000,000 | Capital Auto Receivables Asset Trust, Series 07-SN1, Class A4, Variable Rate, 1 mo. LIBOR + .10%, , 3.22%, due 02/15/11 | 14,583,000 | |||||||||
| 32,000,000 | Daimler Chrysler Master Owner Trust, Series 06-A, Class A, Variable Rate, 1 mo. LIBOR + .03%, 3.15%, due 11/15/11 | 31,431,360 | |||||||||
| 31,500,000 | Ford Credit Auto Owner Trust, Series 06-C, Class A4B, Variable Rate, 1 mo. LIBOR + .04%, 3.16%, due 02/15/12 | 30,650,130 | |||||||||
| 17,000,000 | Ford Credit Auto Owner Trust, Series 07-B, Class A4B, Variable Rate, 1 mo. LIBOR + .38%, 3.50%, due 07/15/12 | 16,565,730 | |||||||||
| 40,000,000 | Ford Credit Floorplan Master Owner Trust, Series 05-1, Class A, Variable Rate, 1 mo. LIBOR + .15%, 3.27%, due 05/15/10 | 39,816,000 | |||||||||
| 58,000,000 | Ford Credit Floorplan Master Owner Trust, Series 06-3, Class A, Variable Rate, 1 mo. LIBOR + .18%, 3.30%, due 06/15/11 | 55,956,628 | |||||||||
| 14,000,000 | Ford Credit Floorplan Master Owner Trust, Series 06-4, Class A, Variable Rate, 1 mo. LIBOR + .25%, 3.37%, due 06/15/13 | 12,944,932 | |||||||||
| 5,589,935 | Nissan Auto Receivables Owner Trust, Series 04-C, Class A4, Variable Rate, 1 mo. LIBOR + .04%, 3.16%, due 03/15/10 | 5,554,998 | |||||||||
| 40,000,000 | Nissan Auto Receivables Owner Trust, Series 07-A, Class A4, Variable Rate, 1 mo. LIBOR, 3.12%, due 06/17/13 | 38,673,600 | |||||||||
See accompanying notes to the financial statements.
2
GMO Short-Duration Collateral Fund
(A Series of GMO Trust)
Schedule of Investments — (Continued)
(showing percentage of total net assets)
February 29, 2008
| Par Value ($) | Description | Value ($) | |||||||||
| Auto Financing — continued | |||||||||||
| 12,000,000 | Nissan Master Owner Trust Receivables, Series 05-A, Class A, Variable Rate, 1 mo. LIBOR + .03%, 3.15%, due 07/15/10 | 11,898,720 | |||||||||
| 37,000,000 | Nissan Master Owner Trust Receivables, Series 07-A, Class A, Variable Rate, 1 mo. LIBOR, 3.12%, due 05/15/12 | 35,843,750 | |||||||||
| 69,250,000 | Sovereign Dealer Floor Plan Master Trust, Series 06-1, Class A, 144A, Variable Rate, 1 mo. LIBOR + .05%, 3.17%, due 08/15/11 | 67,338,700 | |||||||||
| 38,000,000 | Superior Wholesale Inventory Financing Trust, Series 05-A12, Class A, Variable Rate, 1 mo. LIBOR + .18%, 3.30%, due 06/15/10 | 37,696,646 | |||||||||
| 20,000,000 | Swift Master Auto Receivables Trust, Series 07-2, Class A, Variable Rate, 1 mo. LIBOR + .65%, 3.77%, due 10/15/12 | 19,456,000 | |||||||||
| 42,000,000 | Swift Master Auto Receivables Trust, Series 07-1, Class A, Variable Rate, 1 mo. LIBOR + .10%, 3.22%, due 06/15/12 | 39,758,034 | |||||||||
| 32,000,000 | Truck Retail Installment Paper Corp., Series 05-1A, Class A, 144A, Variable Rate, 1 mo. LIBOR + .27%, 3.39%, due 12/15/16 | 30,121,600 | |||||||||
| 60,000,000 | Volkswagen Credit Auto Master Trust, Series 05-1, Class A, Variable Rate, 1 mo. LIBOR + .02%, 3.13%, due 07/21/10 | 59,663,400 | |||||||||
| 23,000,000 | World Omni Auto Receivables Trust, Series 07-A, Class A4, Variable Rate, 1 mo. LIBOR, 3.12%, due 11/15/12 | 22,250,453 | |||||||||
| Total Auto Financing | 649,333,401 | ||||||||||
| Bank Loan Collateralized Debt Obligations — 1.1% | |||||||||||
| 50,171,402 | Arran Corp. Loans No. 1 B.V., Series 06-1A, Class A3, 144A, Variable Rate, 3 mo. LIBOR + .17%, 5.10%, due 06/20/25 | 49,356,116 | |||||||||
| 36,400,000 | Omega Capital Europe Plc, Series GLOB-5A, Class A1, 144A, Variable Rate, 3 mo. LIBOR + .25%, 4.90%, due 07/05/11 | 35,278,516 | |||||||||
| Total Bank Loan Collateralized Debt Obligations | 84,634,632 | ||||||||||
| Business Loans — 6.1% | |||||||||||
| 30,961,943 | ACAS Business Loan Trust, Series 07-1A, Class A, 144A, Variable Rate, 3 mo. LIBOR + .14%, 3.21%, due 08/16/19 | 29,918,526 | |||||||||
| 5,162,224 | Bayview Commercial Asset Trust, Series 04-1, Class A, 144A, Variable Rate, 1 mo. LIBOR + .36%, 3.50%, due 04/25/34 | 4,792,878 | |||||||||
| 4,525,882 | Bayview Commercial Asset Trust, Series 04-3, Class A1, 144A, Variable Rate, 1 mo. LIBOR + .37%, 3.49%, due 01/25/35 | 4,382,865 | |||||||||
| 18,308,812 | Bayview Commercial Asset Trust, Series 05-4A, Class A2, 144A, Variable Rate, 1 mo. LIBOR + .39%, 3.51%, due 01/25/36 | 16,977,762 | |||||||||
See accompanying notes to the financial statements.
3
GMO Short-Duration Collateral Fund
(A Series of GMO Trust)
Schedule of Investments — (Continued)
(showing percentage of total net assets)
February 29, 2008
| Par Value ($) | Description | Value ($) | |||||||||
| Business Loans — continued | |||||||||||
| 13,515,851 | Bayview Commercial Asset Trust, Series 07-3, Class A1, 144A, Variable Rate, 1 mo. LIBOR + .24%, 3.38%, due 07/25/37 | 11,708,106 | |||||||||
| 40,000,000 | Bayview Commercial Asset Trust, Series 07-6A, Class A2, 144A, Variable Rate, 1 mo. LIBOR + 1.30%, 4.42%, due 12/25/37 | 38,600,000 | |||||||||
| 11,655,715 | Capitalsource Commercial Loan Trust, Series 06-1A, Class A1, 144A, Variable Rate, 1 mo. LIBOR + .12%, 3.24%, due 08/22/16 | 11,426,097 | |||||||||
| 13,947,219 | Capitalsource Commercial Loan Trust, Series 07-1A, Class A, 144A, Variable Rate, 1 mo. LIBOR + .13%, 3.24%, due 03/20/17 | 13,302,858 | |||||||||
| 20,000,000 | CNH Wholesale Master Note Trust, Series 06-1A, Class A, 144A, Variable Rate, 1 mo. LIBOR + .06%, 3.18%, due 07/15/12 | 19,671,875 | |||||||||
| 6,528,360 | GE Business Loan Trust, Series 04-1, Class A, 144A, Variable Rate, 1 mo. LIBOR + .29%, 3.41%, due 05/15/32 | 6,282,400 | |||||||||
| 8,732,468 | GE Business Loan Trust, Series 05-2A, Class A, 144A, Variable Rate, 1 mo. LIBOR + .24%, 3.36%, due 11/15/33 | 8,207,042 | |||||||||
| 5,012,836 | GE Commercial Loan Trust, Series 06-1, Class A1, 144A, Variable Rate, 3 mo. LIBOR + .08%, 3.97%, due 04/19/17 | 4,822,281 | |||||||||
| 9,999,525 | GE Commercial Loan Trust, Series 06-2, Class A1, 144A, Variable Rate, 3 mo. LIBOR + .06%, 3.95%, due 04/19/15 | 9,938,528 | |||||||||
| 35,000,000 | GE Dealer Floorplan Master Note Trust, Series 06-4, Class A, Variable Rate, 1 mo. LIBOR + .01%, 3.12%, due 10/20/11 | 34,170,150 | |||||||||
| 52,000,000 | GE Dealer Floorplan Master Trust, Series 07-2, Class A, Variable Rate, 1 mo. LIBOR + .01%, 3.13%, due 07/20/12 | 50,225,393 | |||||||||
| 12,016,843 | Lehman Brothers Small Balance Commercial, Series 05-1, Class A, 144A, Variable Rate, 1 mo. LIBOR + .25%, 3.37%, due 02/25/30 | 11,003,288 | |||||||||
| 11,452,768 | Lehman Brothers Small Balance Commercial, Series 05-2A, Class 1A, 144A, Variable Rate, 1 mo. LIBOR + .25%, 3.37%, due 09/25/30 | 10,377,568 | |||||||||
| 17,394,971 | Lehman Brothers Small Balance Commercial, Series 07-3A, Class 1A1, 144A, Variable Rate, 1 mo. LIBOR + .65%, 3.77%, due 10/25/37 | 17,013,149 | |||||||||
| 34,269,000 | Lehman Brothers Small Balance Commercial, Series 07-3A, Class 1A2, 144A, Variable Rate, 1 mo. LIBOR + .85%, 3.97%, due 10/25/37 | 31,735,686 | |||||||||
| 18,000,000 | Navistar Financial Dealer Note Master Trust, Series 05-1, Class A, Variable Rate, 1 mo. LIBOR + .11%, 3.23%, due 02/25/13 | 17,431,200 | |||||||||
| 39,000,000 | Navistar Financial Dealer Note Master Trust, Series 98-1, Class A, Variable Rate, 1 mo. LIBOR + .16%, 3.28%, due 07/25/11 | 38,855,310 | |||||||||
| 53,000,000 | Textron Financial Floorplan Master Note, Series 05-1A, Class A, 144A, Variable Rate, 1 mo. LIBOR + .12%, 3.24%, due 05/13/10 | 52,801,250 | |||||||||
See accompanying notes to the financial statements.
4
GMO Short-Duration Collateral Fund
(A Series of GMO Trust)
Schedule of Investments — (Continued)
(showing percentage of total net assets)
February 29, 2008
| Par Value ($) | Description | Value ($) | |||||||||
| Business Loans — continued | |||||||||||
| 25,000,000 | Textron Financial Floorplan Master Note, Series 07-AA, Class A, 144A, Variable Rate, 1 mo. LIBOR + .06%, 3.20%, due 03/13/12 | 24,297,500 | |||||||||
| 1,462,248 | The Money Store Business Loan Backed Trust, Series 99-1, Class AN, Variable Rate, 1 mo. LIBOR +.50%, 3.62%, due 09/15/17 | 1,443,638 | |||||||||
| Total Business Loans | 469,385,350 | ||||||||||
| CMBS — 4.8% | |||||||||||
| 14,500,000 | Banc of America Commercial Mortgage, Inc., Series 06-3, Class A2, 5.81%, due 07/10/44 | 14,633,672 | |||||||||
| 10,781,668 | Bear Stearns Commercial Mortgage Securities, Inc., Series 05-PW10, Class A1, 5.09%, due 12/11/40 | 10,713,097 | |||||||||
| 22,500,000 | Citigroup/Deutsche Bank Commercial Mortgage, Series 05-CD1, Class A2FL, Variable Rate, 1 mo. LIBOR + .12%, 3.24%, due 07/15/44 | 21,530,250 | |||||||||
| 43,000,000 | Commercial Mortgage Pass-Through Certificates, Series 06-FL12, Class AJ, 144A, Variable Rate, 1 mo. LIBOR + .13%, 3.25%, due 12/15/20 | 42,527,000 | |||||||||
| 32,000,000 | GE Capital Commercial Mortgage Corp., Series 05-C4, Class A2, 5.30%, due 11/10/45 | 32,140,000 | |||||||||
| 19,850,000 | GE Capital Commercial Mortgage Corp., Series 06-C1, Class A2, Variable Rate, 5.34%, due 03/10/44 | 19,986,469 | |||||||||
| 8,380,931 | Greenwich Capital Commercial Funding Corp., Series 06-FL4A, Class A1, 144A, Variable Rate, 1 mo. LIBOR + .09%, 3.31%, due 11/05/21 | 8,056,170 | |||||||||
| 32,000,000 | GS Mortgage Securities Corp., Series 06-GG6, Class A2, 5.51%, due 04/10/38 | 31,638,750 | |||||||||
| 8,330,127 | GS Mortgage Securities Corp., Series 07-EOP, Class A1, 144A, Variable Rate, 1 mo. LIBOR + .09%, 3.17%, due 03/06/20 | 7,830,319 | |||||||||
| 9,000,000 | GS Mortgage Securities Corp., Series 07-EOP, Class A2, 144A, Variable Rate, 1 mo. LIBOR + .13%, 3.21%, due 03/06/20 | 8,280,000 | |||||||||
| 10,181,082 | J.P. Morgan Chase Commercial Mortgage Securities Corp., Series 06-FL1A, Class A1B, 144A, Variable Rate, 1 mo. LIBOR + .12%, 3.24%, due 02/15/20 | 9,213,879 | |||||||||
| 57,000,000 | J.P. Morgan Chase Commercial Mortgage Securities Corp., Series 06-LDP7, Class A2, 5.86%, due 04/15/45 | 56,866,620 | |||||||||
| 6,985,033 | Lehman Brothers Floating Rate Commercial, Series 06-LLFA, Class A1, 144A, Variable Rate, 1 mo. LIBOR + .08%, 3.20%, due 09/15/21 | 6,954,833 | |||||||||
| 33,000,000 | Merrill Lynch Mortgage Trust, Series 06-C1, Class A2, Variable Rate, 5.61%, due 05/12/39 | 32,862,070 | |||||||||
| 12,000,000 | Morgan Stanley Capital I, Series 06-IQ11, Class A2, 5.69%, due 10/15/42 | 11,775,720 | |||||||||
| 13,000,000 | Morgan Stanley Capital I, Series 06-IQ11, Class A3, 5.74%, due 10/15/42 | 12,375,220 | |||||||||
See accompanying notes to the financial statements.
5
GMO Short-Duration Collateral Fund
(A Series of GMO Trust)
Schedule of Investments — (Continued)
(showing percentage of total net assets)
February 29, 2008
| Par Value ($) | Description | Value ($) | |||||||||
| CMBS — continued | |||||||||||
| 6,734,934 | Morgan Stanley Dean Witter Capital I, Series 03-TOP9, Class A1, 3.98%, due 11/13/36 | 6,549,319 | |||||||||
| 32,935,773 | Wachovia Bank Commercial Mortgage Trust, Series 06-WL7A, Class A1, 144A, Variable Rate, 1 mo. LIBOR + .09%, 3.21%, due 09/15/21 | 30,465,590 | |||||||||
| Total CMBS | 364,398,978 | ||||||||||
| CMBS Collateralized Debt Obligations — 1.3% | |||||||||||
| 9,000,000 | American Capital Strategies Ltd Commercial Real Estate CDO Trust, Series 07-1A, Class A, 144A, Variable Rate, 3 mo. LIBOR + .80%, 3.89%, due 11/23/52 | 5,474,516 | |||||||||
| 17,167,710 | Crest Exeter Street Solar, Series 04-1A, Class A1, 144A, Variable Rate, 3 mo. LIBOR + .35%, 5.19%, due 06/28/19 | 15,909,083 | |||||||||
| 20,000,000 | G-Force LLC, Series 05-RR2, Class A2, 144A, 5.16%, due 12/25/39 | 19,894,000 | |||||||||
| 30,000,000 | Guggenheim Structured Real Estate Funding, Series 05-2A, Class A, 144A, Variable Rate, 1 mo. LIBOR + .32%, 3.44%, due 08/26/30 | 27,450,000 | |||||||||
| 35,500,000 | Marathon Real Estate CDO, Series 06-1A, Class A1, 144A, Variable Rate, 1 mo. LIBOR + .33%, 3.45%, due 05/25/46 | 31,240,000 | |||||||||
| Total CMBS Collateralized Debt Obligations | 99,967,599 | ||||||||||
| Collateralized Loan Obligations — 0.0% | |||||||||||
| 2,822,031 | Archimedes Funding IV (Cayman) Ltd., Series 4A, Class A1, 144A, Variable Rate, 1 mo. LIBOR + .48%, 3.57%, due 02/25/13 | 2,787,064 | |||||||||
| Credit Cards — 18.0% | |||||||||||
| 14,300,000 | Advanta Business Card Master Trust, Series 05-A1, Class A1, Variable Rate, 1 mo. LIBOR + .07%, 3.19%, due 04/20/11 | 14,240,655 | |||||||||
| 20,000,000 | Advanta Business Card Master Trust, Series 05-A2, Class A2, Variable Rate, 1 mo. LIBOR + .13%, 3.24%, due 05/20/13 | 19,287,500 | |||||||||
| 7,000,000 | Advanta Business Card Master Trust, Series 05-A5, Class A5, Variable Rate, 1 mo. LIBOR + .06%, 3.18%, due 04/20/12 | 6,797,350 | |||||||||
| 30,000,000 | Advanta Business Card Master Trust, Series 07-A4, Class A4, Variable Rate, 1 mo. LIBOR + .03%, 3.14%, due 04/22/13 | 29,137,500 | |||||||||
| 17,000,000 | American Express Credit Account Master Trust, Series 04-1, Class A, Variable Rate, 1 mo. LIBOR + .08%, 3.20%, due 09/15/11 | 16,891,710 | |||||||||
| 25,000,000 | American Express Credit Account Master Trust, Series 04-4, Class A, Variable Rate, 1 mo. LIBOR + .09%, 3.21%, due 03/15/12 | 24,693,200 | |||||||||
See accompanying notes to the financial statements.
6
GMO Short-Duration Collateral Fund
(A Series of GMO Trust)
Schedule of Investments — (Continued)
(showing percentage of total net assets)
February 29, 2008
| Par Value ($) | Description | Value ($) | |||||||||
| Credit Cards — continued | |||||||||||
| 19,055,000 | American Express Credit Account Master Trust, Series 05-3, Class A, Variable Rate, 1 mo. LIBOR, 3.12%, due 01/18/11 | 19,003,552 | |||||||||
| 64,000,000 | American Express Credit Account Master Trust, Series 05-5, Class A, Variable Rate, 1 mo. LIBOR + .04%, 3.16%, due 02/15/13 | 63,032,960 | |||||||||
| 1,900,000 | American Express Credit Account Master Trust, Series 05-6, Class A, Variable Rate, 1 mo. LIBOR, 3.12%, due 03/15/11 | 1,893,616 | |||||||||
| 25,000,000 | American Express Credit Account Master Trust, Series 06-1, Class A, Variable Rate, 1 mo. LIBOR + .03%, 3.15%, due 12/15/13 | 24,339,750 | |||||||||
| 12,000,000 | American Express Issuance Trust, Series 07-1, Class A, Variable Rate, 1 mo. LIBOR + .20%, 3.32%, due 09/15/11 | 11,774,280 | |||||||||
| 25,000,000 | Arran, Series 2005-A, Class A, Variable Rate, 1 mo. LIBOR + .02%, 3.14%, due 12/15/10 | 24,687,500 | |||||||||
| 26,175,000 | Bank of America Credit Card Trust, Series 06-A10, Class A10, Variable Rate, 1 mo. LIBOR - .02%, 3.10%, due 02/15/12 | 25,891,238 | |||||||||
| 14,000,000 | Bank of America Credit Card Trust, Series 07-A13, Class A13, Variable Rate, 1 mo. LIBOR + .22%, 3.34%, due 04/16/12 | 13,877,500 | |||||||||
| 11,670,000 | Bank One Issuance Trust, Series 03-A10, Class A10, Variable Rate, 1 mo. LIBOR + .11%, 3.23%, due 06/15/11 | 11,612,817 | |||||||||
| 38,635,000 | Bank One Issuance Trust, Series 03-A3, Class A3, Variable Rate, 1 mo. LIBOR + .11%, 3.23%, due 12/15/10 | 38,611,819 | |||||||||
| 5,710,000 | Bank One Issuance Trust, Series 03-A6, Class A6, Variable Rate, 1 mo. LIBOR + .11%, 3.23%, due 02/15/11 | 5,701,226 | |||||||||
| 10,000,000 | Capital One Master Trust, Series 01-6, Class A, Variable Rate, 1 mo. LIBOR + .19%, 3.31%, due 06/15/11 | 9,958,700 | |||||||||
| 30,000,000 | Capital One Master Trust, Series 02-1A, Class A, Variable Rate, 1 mo. LIBOR + .20%, 3.32%, due 11/15/11 | 29,858,203 | |||||||||
| 15,000,000 | Capital One Multi-Asset Execution Trust, Series 04-A2, Class A2, Variable Rate, 1 mo. LIBOR + .09%, 3.21%, due 01/17/12 | 14,875,950 | |||||||||
| 15,000,000 | Capital One Multi-Asset Execution Trust, Series 04-A3, Class A3, Variable Rate, 1 mo. LIBOR + .10%, 3.22%, due 02/15/12 | 14,867,863 | |||||||||
| 26,275,000 | Capital One Multi-Asset Execution Trust, Series 04-A7, Class A7, Variable Rate, 3 mo. LIBOR + .15%, 3.22%, due 06/16/14 | 25,338,306 | |||||||||
| 30,000,000 | Capital One Multi-Asset Execution Trust, Series 06-A14, Class A, Variable Rate, 1 mo. LIBOR + .01%, 3.13%, due 08/15/13 | 29,106,000 | |||||||||
| 341,000 | Capital One Multi-Asset Execution Trust, Series 06-A7, Class A7, Variable Rate, 1 mo. LIBOR + .03%, 3.15%, due 03/17/14 | 329,962 | |||||||||
See accompanying notes to the financial statements.
7
GMO Short-Duration Collateral Fund
(A Series of GMO Trust)
Schedule of Investments — (Continued)
(showing percentage of total net assets)
February 29, 2008
| Par Value ($) | Description | Value ($) | |||||||||
| Credit Cards — continued | |||||||||||
| 9,000,000 | Capital One Multi-Asset Execution Trust, Series 07-A4, Class A4, Variable Rate, 1 mo. LIBOR + .03%, 3.15%, due 03/16/15 | 8,577,900 | |||||||||
| 20,000,000 | Capital One Multi-Asset Execution Trust, Series 07-A6, Class A6, Variable Rate, 1 mo. LIBOR + .07%, 3.19%, due 05/15/13 | 19,552,000 | |||||||||
| 49,000,000 | Charming Shoppes Master Trust, Series 07-1A, Class A1, 144A, Variable Rate, 1 mo. LIBOR + 1.25%, 4.37%, due 09/15/17 | 46,583,810 | |||||||||
| 14,000,000 | Chase Credit Card Master Trust, Series 03-5, Class A, Variable Rate, 1 mo. LIBOR + .12%, 3.24%, due 01/17/11 | 13,960,380 | |||||||||
| 30,000,000 | Chase Issuance Trust, Series 05-A3, Class A, Variable Rate, 1 mo. LIBOR + .02%, 3.14%, due 10/17/11 | 29,806,200 | |||||||||
| 14,000,000 | Chase Issuance Trust, Series 05-A9, Class A9, Variable Rate, 1 mo. + .02%, 3.14%, due 11/15/11 | 13,762,000 | |||||||||
| 29,000,000 | Chase Issuance Trust, Series 06-A7, Class A, Variable Rate, 1 mo. LIBOR + .01%, 3.13%, due 02/15/13 | 28,312,990 | |||||||||
| 5,500,000 | Chase Issuance Trust, Series 07-A1, Class A1, Variable Rate, 1 mo. LIBOR + .02%, 3.14%, due 03/15/13 | 5,382,026 | |||||||||
| 17,500,000 | Chase Issuance Trust, Series 07-A11, Class A11, Variable Rate, 1 mo. LIBOR, 3.12%, due 07/16/12 | 17,220,056 | |||||||||
| 16,000,000 | Citibank Credit Card Issuance Trust, Series 01-A7, Class A7, Variable Rate, 3 mo. LIBOR + .14%, 3.20%, due 08/15/13 | 15,620,800 | |||||||||
| 20,000,000 | Citibank Credit Card Issuance Trust, Series 04-A3, Class A3, Variable Rate, 3 mo. LIBOR + .07%, 3.79%, due 07/25/11 | 19,832,400 | |||||||||
| 10,000,000 | Citibank Credit Card Issuance Trust, Series 05-A3, Class A3, Variable Rate, 1 mo. LIBOR + .07%, 3.21%, due 04/24/14 | 9,623,200 | |||||||||
| 27,000,000 | Citibank Credit Card Issuance Trust, Series 06-A6, Class A6, Variable Rate, 1 mo. LIBOR + .01%, 3.13%, due 05/24/12 | 26,546,400 | |||||||||
| 16,000,000 | Citibank Credit Card Issuance Trust, Series 07-A1, Class A1, Variable Rate, 3 mo. LIBOR - .01%, 4.87%, due 03/22/12 | 15,774,400 | |||||||||
| 32,000,000 | Citibank Credit Card Issuance Trust, Series 07-A2, Class A2, Variable Rate, 3 mo. LIBOR - .01%, 3.06%, due 05/21/12 | 31,459,200 | |||||||||
| 12,000,000 | Discover Card Master Trust I, Series 03-4, Class A1, Variable Rate, 1 mo. LIBOR + .11%, 3.23%, due 05/15/11 | 11,923,080 | |||||||||
| 6,950,000 | Discover Card Master Trust I, Series 05-1, Class A, Variable Rate, 1 mo. LIBOR + .01%, 3.13%, due 09/16/10 | 6,945,691 | |||||||||
| 46,700,000 | Discover Card Master Trust I, Series 05-3, Class A, Variable Rate, 1 mo. LIBOR + .02%, 3.14%, due 05/15/11 | 46,378,704 | |||||||||
See accompanying notes to the financial statements.
8
GMO Short-Duration Collateral Fund
(A Series of GMO Trust)
Schedule of Investments — (Continued)
(showing percentage of total net assets)
February 29, 2008
| Par Value ($) | Description | Value ($) | |||||||||
| Credit Cards — continued | |||||||||||
| 13,000,000 | Discover Card Master Trust I, Series 05-4, Class A1, Variable Rate, 1 mo. LIBOR + .06%, 3.18%, due 06/18/13 | 12,658,750 | |||||||||
| 4,800,000 | Discover Card Master Trust I, Series 07-1, Class A, Variable Rate, 1 mo. LIBOR, 3.13%, due 08/15/12 | 4,707,024 | |||||||||
| 58,000,000 | First National Master Note Trust, Series 07-2, Class A, Variable Rate, 1 mo. LIBOR + .75%, 3.87%, due 11/15/12 | 57,492,500 | |||||||||
| 25,000,000 | GE Capital Credit Card Master Note Trust, Series 05-1, Class A, Variable Rate, 1 mo. LIBOR + .04%, 3.16%, due 03/15/13 | 24,382,014 | |||||||||
| 45,000,000 | GE Capital Credit Card Master Note Trust, Series 07-3, Class A1, Variable Rate, 1 mo. LIBOR + .01%, 3.13%, due 06/15/13 | 44,156,250 | |||||||||
| 48,000,000 | Household Credit Card Master Note Trust I, Series 07-1, Class A, Variable Rate, 1 mo. LIBOR + .05%, 3.17%, due 04/15/13 | 46,950,000 | |||||||||
| 24,000,000 | Household Credit Card Master Note Trust I, Series 07-2, Class A, Variable Rate, 1 mo. LIBOR + .55%, 3.67%, due 07/15/13 | 23,556,563 | |||||||||
| 3,000,000 | MBNA Credit Card Master Note Trust Series 01-A5, Class A5, Variable Rate, 1 mo. LIBOR + .21%, 3.33%, due 03/15/11 | 2,996,460 | |||||||||
| 31,976,000 | MBNA Credit Card Master Note Trust, Series 03-A3, Class A3, Variable Rate, 1 mo. LIBOR + .12%, 3.24%, due 08/16/10 | 31,968,646 | |||||||||
| 14,000,000 | MBNA Credit Card Master Note Trust, Series 04-A7, Class A7, Variable Rate, 1 mo. LIBOR + .10%, 3.22%, due 12/15/11 | 13,877,500 | |||||||||
| 15,000,000 | MBNA Credit Card Master Note Trust, Series 04-A8, Class A8, Variable Rate, 1 mo. LIBOR + .15%, 3.27%, due 01/15/14 | 14,609,700 | |||||||||
| 19,000,000 | MBNA Credit Card Master Note Trust, Series 05-A5, Class A5, Variable Rate, 1 mo. LIBOR, 3.12%, due 12/15/10 | 18,952,500 | |||||||||
| 75,675,000 | MBNA Credit Card Master Note Trust, Series 06-A4, Class A4, Variable Rate, 1 mo. LIBOR - .01%, 3.11%, due 09/15/11 | 75,060,141 | |||||||||
| 25,000,000 | Pillar Funding Plc, Series 04-2, Class A, 144A, Variable Rate, 3 mo. LIBOR + .14%, 5.13%, due 09/15/11 | 24,143,500 | |||||||||
| 60,500,000 | Turquoise Card Backed Securities Plc, Series 06-1A, Class A, 144A, Variable Rate, 1 mo. LIBOR + .01%, 3.13%, due 05/16/11 | 59,791,016 | |||||||||
| 17,000,000 | World Financial Network Credit Card Master Trust, Series 03-A, Class A2, Variable Rate, 1 mo. LIBOR + .37%, 3.49%, due 05/15/12 | 16,915,000 | |||||||||
| 54,100,000 | World Financial Network Credit Card Master Trust, Series 04-A, Class A, Variable Rate, 1 mo. LIBOR + .18%, 3.30%, due 03/15/13 | 52,633,349 | |||||||||
| 15,000,000 | World Financial Network Credit Card Master Trust, Series 06-A, Class A, 144A, Variable Rate, 1 mo. LIBOR + .13%, 3.25%, due 02/15/17 | 13,403,550 | |||||||||
| Total Credit Cards | 1,381,324,857 | ||||||||||
See accompanying notes to the financial statements.
9
GMO Short-Duration Collateral Fund
(A Series of GMO Trust)
Schedule of Investments — (Continued)
(showing percentage of total net assets)
February 29, 2008
| Par Value ($) | Description | Value ($) | |||||||||
| Emerging Markets Collateralized Debt Obligations — 0.2% | |||||||||||
| 16,000,000 | Santiago CDO Ltd., Series 05-1A, Class A, 144A, Variable Rate, 6 mo. LIBOR + .40%, 5.53%, due 04/18/17 | 14,720,000 | |||||||||
| Equipment Leases — 1.2% | |||||||||||
| 4,372,043 | CNH Equipment Trust, Series 04-A, Class A4A, Variable Rate, 1 mo. LIBOR + .11%, 3.23%, due 09/15/11 | 4,354,281 | |||||||||
| 21,325,258 | CNH Equipment Trust, Series 05-A, Class A4A, Variable Rate, 1 mo. LIBOR + .04%, 3.16%, due 06/15/12 | 21,097,504 | |||||||||
| 24,500,000 | CNH Equipment Trust, Series 07-B, Class A3B, Variable Rate, 1 mo. LIBOR + .60%, 3.72%, due 10/17/11 | 24,148,180 | |||||||||
| 45,000,000 | GE Equipment Midticket LLC, Series 07-1, Class A3B, Variable Rate, 1 mo. LIBOR + .25%, 3.37%, due 06/14/11 | 43,931,250 | |||||||||
| Total Equipment Leases | 93,531,215 | ||||||||||
| High Yield Collateralized Debt Obligations — 0.0% | |||||||||||
| 645,070 | SHYPPCO Finance Co., LLC, Series 1I, Class A2B, 6.64%, due 06/15/10 | 612,817 | |||||||||
| Insurance Premiums — 0.7% | |||||||||||
| 16,000,000 | AICCO Premium Finance Master Trust, Series 05-1, Class A, Variable Rate, 1 mo. LIBOR + .08%, 3.20%, due 04/15/10 | 15,894,400 | |||||||||
| 40,000,000 | AICCO Premium Finance Master Trust, Series 07-AA, Class A, 144A, Variable Rate, 1 mo. LIBOR + .05%, 3.17%, due 12/15/11 | 39,125,000 | |||||||||
| Total Insurance Premiums | 55,019,400 | ||||||||||
| Insured Auto Financing — 5.9% | |||||||||||
| 17,500,000 | Aesop Funding II LLC, Series 03-5A, Class A2, 144A, XL, Variable Rate, 1 mo. LIBOR +.38%, 3.49%, due 12/20/09 | 16,967,635 | |||||||||
| 10,000,000 | Aesop Funding II LLC, Series 05-1A, Class A3, 144A, MBIA, Variable Rate, 1 mo. LIBOR + .12%, 3.24%, due 04/20/11 | 9,121,300 | |||||||||
| 19,550,000 | AmeriCredit Automobile Receivables Trust, Series 05-BM, Class A4, MBIA, Variable Rate, 1 mo. LIBOR + .08%, 3.27%, due 05/06/12 | 18,009,888 | |||||||||
| 6,841,252 | AmeriCredit Automobile Receivables Trust, Series 06-RM, Class A1, MBIA, 5.37%, due 10/06/09 | 6,826,986 | |||||||||
| 31,000,000 | AmeriCredit Automobile Receivables Trust, Series 07-AX, Class A4, XL, Variable Rate, 1 mo. LIBOR + .04%, 3.23%, due 10/06/13 | 27,512,500 | |||||||||
See accompanying notes to the financial statements.
10
GMO Short-Duration Collateral Fund
(A Series of GMO Trust)
Schedule of Investments — (Continued)
(showing percentage of total net assets)
February 29, 2008
| Par Value ($) | Description | Value ($) | |||||||||
| Insured Auto Financing — continued | |||||||||||
| 20,000,000 | AmeriCredit Automobile Receivables Trust, Series 07-BF, Class A4, FSA, Variable Rate, 1 mo. LIBOR + .05%, 3.13%, due 12/06/13 | 18,800,000 | |||||||||
| 12,000,000 | AmeriCredit Automobile Receivables Trust, Series 07-CM, Class A3B, MBIA, Variable Rate, 1 mo. LIBOR + .03%, 3.22%, due 05/07/12 | 10,947,444 | |||||||||
| 17,000,000 | AmeriCredit Automobile Receivables Trust, Series 07-DF, Class A4B, FSA, Variable Rate, 1 mo. LIBOR + .80%, 3.99%, due 06/06/14 | 15,790,728 | |||||||||
| 31,000,000 | AmeriCredit Prime Automobile Receivables Trust, Series 07-2M, Class A4B, MBIA, Variable Rate, 1 mo. LIBOR + .50%, 3.69%, due 03/08/16 | 27,401,830 | |||||||||
| 30,000,000 | ARG Funding Corp., Series 05-2A, Class A3, 144A, AMBAC, Variable Rate, 1 mo. LIBOR + .14%, 3.26%, due 05/20/10 | 28,006,510 | |||||||||
| 6,500,560 | Capital One Auto Finance Trust, Series 04-A, Class A4, AMBAC, Variable Rate, 1 mo. LIBOR + .10%, 3.22%, due 03/15/11 | 6,211,490 | |||||||||
| 5,535,997 | Capital One Auto Finance Trust, Series 04-B, Class A4, MBIA, Variable Rate, 1 mo. LIBOR + .11%, 3.23%, due 08/15/11 | 5,258,817 | |||||||||
| 37,000,000 | Capital One Auto Finance Trust, Series 06-A, Class A4, AMBAC, Variable Rate, 1 mo. LIBOR + .01%, 3.13%, due 12/15/12 | 34,525,625 | |||||||||
| 29,000,000 | Capital One Auto Finance Trust, Series 06-B, Class A4, MBIA, Variable Rate, 1 mo. LIBOR + .02%, 3.14%, due 07/15/13 | 27,415,730 | |||||||||
| 8,000,000 | Capital One Auto Finance Trust, Series 07-A, Class A4, AMBAC, Variable Rate, 1 mo. LIBOR + .02%, 3.14%, due 11/15/13 | 7,108,240 | |||||||||
| 28,000,000 | Capital One Auto Finance Trust, Series 07-C, Class A3B, FGIC, Variable Rate, 1 mo. LIBOR + .51%, 3.63%, due 04/16/12 | 25,753,560 | |||||||||
| 9,000,000 | Hertz Vehicle Financing LLC, Series 05-1A, Class A1, 144A, MBIA, Variable Rate, 1 mo. LIBOR + .14%, 3.26%, due 02/25/10 | 8,549,081 | |||||||||
| 2,000,000 | Hertz Vehicle Financing LLC, Series 05-2A, Class A3, 144A, AMBAC, Variable Rate, 1 mo. LIBOR + .20%, 3.34%, due 02/25/11 | 1,808,260 | |||||||||
| 10,000,000 | Hertz Vehicle Financing LLC, Series 05-2A, Class A5, 144A, AMBAC, Variable Rate, 1 mo. LIBOR + .25%, 3.37%, due 11/25/11 | 8,477,208 | |||||||||
| 10,000,000 | Rental Car Finance Corp., Series 04-1A, Class A, 144A, AMBAC, Variable Rate, 1 mo. LIBOR + .20%, 3.32%, due 06/25/09 | 9,894,320 | |||||||||
| 50,000,000 | Santander Drive Auto Receivables Trust, Series 07-1, Class A4, FGIC, Variable Rate, 1 mo. LIBOR + .05%, 3.17%, due 09/15/14 | 40,322,197 | |||||||||
| 29,500,000 | Santander Drive Auto Receivables Trust, Series 07-3, Class A4B, FGIC, Variable Rate, 1 mo. LIBOR + .65%, 3.77%, due 10/15/14 | 25,277,960 | |||||||||
| 65,000,000 | Triad Auto Receivables Owner Trust, Series 07-B, Class A4B, FSA, Variable Rate, 1 mo. LIBOR + 1.20%, 4.33%, due 07/14/14 | 64,246,000 | |||||||||
See accompanying notes to the financial statements.
11
GMO Short-Duration Collateral Fund
(A Series of GMO Trust)
Schedule of Investments — (Continued)
(showing percentage of total net assets)
February 29, 2008
| Par Value ($) | Description | Value ($) | |||||||||
| Insured Auto Financing — continued | |||||||||||
| 8,740,000 | UPFC Auto Receivables Trust, Series 06-B, Class A3, AMBAC, 5.01%, due 08/15/12 | 8,652,600 | |||||||||
| Total Insured Auto Financing | 452,885,909 | ||||||||||
| Insured Business Loans — 0.1% | |||||||||||
| 4,526,144 | CNL Commercial Mortgage Loan Trust, Series 03-2A, Class A1, 144A, AMBAC, Variable Rate, 1 mo. LIBOR + .44%, 3.58%, due 10/25/30 | 4,337,139 | |||||||||
| 1,827,743 | Golden Securities Corp., Series 03-A, Class A1, 144A, AMBAC, Variable Rate, 1 mo. LIBOR + .30%, 3.56%, due 12/02/13 | 1,823,375 | |||||||||
| Total Insured Business Loans | 6,160,514 | ||||||||||
| Insured Credit Cards — 0.4% | |||||||||||
| 35,000,000 | Cabela's Master Credit Card Trust, Series 04-2A, Class A, 144A, AMBAC, Variable Rate, 1 mo. LIBOR + .12%, 3.24%, due 03/15/11 | 33,966,798 | |||||||||
| Insured High Yield Collateralized Debt Obligations — 0.6% | |||||||||||
| 25,576,923 | Augusta Funding Ltd., Series 10A, Class F-1, 144A, CapMAC, Variable Rate, 3 mo. LIBOR +.25%, 5.33%, due 06/30/17 | 25,001,442 | |||||||||
| 1,086,305 | Cigna CBO Ltd, Series 96-1, Class A2, 144A, Variable Rate, CapMAC, 6.46%, due 11/15/08 | 1,086,305 | |||||||||
| 10,000,000 | GSC Partners CDO Fund Ltd, Series 03-4A, Class A3, 144A, AMBAC, Variable Rate, 3 mo. LIBOR + .46%, 4.39%, due 12/16/15 | 9,812,000 | |||||||||
| 8,991,902 | GSC Partners CDO Fund Ltd, Series 2A, Class A, 144A, FSA, Variable Rate, 6 mo. LIBOR + .52%, 5.37%, due 05/22/13 | 8,345,190 | |||||||||
| Total Insured High Yield Collateralized Debt Obligations | 44,244,937 | ||||||||||
| Insured Other — 1.8% | |||||||||||
| 30,000,000 | DB Master Finance LLC, Series 06-1, Class A2, 144A, AMBAC, 5.78%, due 06/20/31 | 26,493,406 | |||||||||
| 60,000,000 | Dominos Pizza Master Issuer LLC, Series 07-1, Class A2, 144A, MBIA, 5.26%, due 04/25/37 | 51,861,048 | |||||||||
| 18,492,878 | Henderson Receivables LLC, Series 06-3A, Class A1, 144A, MBIA, Variable Rate, 1 mo. LIBOR + .20%, 3.32%, due 09/15/41 | 14,624,353 | |||||||||
| 17,761,817 | Henderson Receivables LLC, Series 06-4A, Class A1, 144A, MBIA, Variable Rate, 1 mo. LIBOR + .20%, 3.32%, due 12/15/41 | 14,077,305 | |||||||||
See accompanying notes to the financial statements.
12
GMO Short-Duration Collateral Fund
(A Series of GMO Trust)
Schedule of Investments — (Continued)
(showing percentage of total net assets)
February 29, 2008
| Par Value ($) | Description | Value ($) | |||||||||
| Insured Other — continued | |||||||||||
| 26,559,540 | TIB Card Receivables Fund, 144A, FGIC, Variable Rate, 3 mo. LIBOR + .25%, 4.90%, due 01/05/14 | 25,380,296 | |||||||||
| 3,488,000 | Toll Road Investment Part II, Series B, 144A, MBIA, Zero Coupon, due 02/15/30 | 735,305 | |||||||||
| 35,000,000 | Toll Road Investment Part II, Series C, 144A, MBIA, Zero Coupon, due 02/15/37 | 4,433,100 | |||||||||
| Total Insured Other | 137,604,813 | ||||||||||
| Insured Residential Asset-Backed Securities (European) — 0.0% | |||||||||||
| GBP | 337,521 | RMAC, Series 03-NS2A, Class A2A, 144A, AMBAC, Variable Rate, 3 mo. GBP LIBOR + .40%, 7.03%, due 09/12/35 | 670,537 | ||||||||
| Insured Residential Asset-Backed Securities (United States) — 0.1% | |||||||||||
| 4,819,346 | Ameriquest Mortgage Securities, Inc., Series 04-R6, Class A1, XL, Variable Rate, 1 mo. LIBOR + .21%, 3.33%, due 07/25/34 | 4,218,374 | |||||||||
| 5,450,256 | Citigroup Mortgage Loan Trust, Inc., Series 03-HE3, Class A, AMBAC, Variable Rate, 1 mo. LIBOR + .38%, 3.52%, due 12/25/33 | 4,626,177 | |||||||||
| 338,824 | Quest Trust, Series 03-X4A, Class A, 144A, AMBAC, Variable Rate, 1 mo. LIBOR + .43%, 3.57%, due 12/25/33 | 288,001 | |||||||||
| 1,418,024 | Quest Trust, Series 04-X1, Class A, 144A, AMBAC, Variable Rate, 1 mo. LIBOR + .33%, 3.47%, due 03/25/34 | 1,267,288 | |||||||||
| Total Insured Residential Asset-Backed Securities (United States) | 10,399,840 | ||||||||||
| Insured Residential Mortgage-Backed Securities (United States) — 0.7% | |||||||||||
| 931,654 | Chevy Chase Mortgage Funding Corp., Series 03-4A, Class A1, 144A, AMBAC, Variable Rate, 1 mo. LIBOR + .34%, 3.48%, due 10/25/34 | 745,323 | |||||||||
| 2,152,419 | Chevy Chase Mortgage Funding Corp., Series 04-1A, Class A2, 144A, AMBAC, Variable Rate, 1 mo. LIBOR + .33%, 3.47%, due 01/25/35 | 1,721,935 | |||||||||
| 31,078,145 | Countrywide Home Equity Loan Trust, Series 07-E, Class A, MBIA, Variable Rate, 1 mo. LIBOR + .15%, 3.27%, due 11/15/32 | 25,333,770 | |||||||||
| 10,000,000 | GMAC Mortgage Corp. Loan Trust, Series 04-HE3, Class A3, FSA, Variable Rate, 1 mo. LIBOR + .23%, 3.37%, due 10/25/34 | 9,792,578 | |||||||||
| 1,052,848 | GreenPoint Home Equity Loan Trust, Series 04-1, Class A, AMBAC, Variable Rate, 1 mo. LIBOR + .23%, 3.60%, due 07/25/29 | 879,115 | |||||||||
| 958,820 | GreenPoint Home Equity Loan Trust, Series 04-4, Class A, AMBAC, Variable Rate, 1 mo. LIBOR + .28%, 3.68%, due 08/15/30 | 815,642 | |||||||||
See accompanying notes to the financial statements.
13
GMO Short-Duration Collateral Fund
(A Series of GMO Trust)
Schedule of Investments — (Continued)
(showing percentage of total net assets)
February 29, 2008
| Par Value ($) | Description | Value ($) | |||||||||
| Insured Residential Mortgage-Backed Securities (United States) — continued | |||||||||||
| 2,203,804 | Lehman ABS Corp., Series 04-2, Class A, AMBAC, Variable Rate, 1 mo. LIBOR + .22%, 3.58%, due 06/25/34 | 1,851,195 | |||||||||
| 724,063 | Residential Funding Mortgage Securities II, Series 03-HS1, Class AII, FGIC, Variable Rate, 1 mo. LIBOR + .29%, 3.43%, due 12/25/32 | 624,504 | |||||||||
| 6,681,158 | SBI Heloc Trust, Series 05-HE1, Class 1A, 144A, FSA, Variable Rate, 1 mo. LIBOR + .19%, 3.31%, due 11/25/35 | 6,013,042 | |||||||||
| 3,912,101 | Wachovia Asset Securitization, Inc., Series 02-HE1, Class A, AMBAC, Variable Rate, 1 mo. LIBOR + .37%, 3.51%, due 09/27/32 | 3,531,088 | |||||||||
| 3,767,923 | Wachovia Asset Securitization, Inc., Series 04-HE1, Class A, MBIA, Variable Rate, 1 mo. LIBOR + .22%, 3.36%, due 06/25/34 | 3,403,592 | |||||||||
| Total Insured Residential Mortgage-Backed Securities (United States) | 54,711,784 | ||||||||||
| Insured Time Share — 0.7% | |||||||||||
| 2,673,670 | Cendant Timeshare Receivables Funding LLC, Series 04-1A, Class A2, 144A, MBIA, Variable Rate, 1 mo. LIBOR + .18%, 3.29%, due 05/20/16 | 2,389,803 | |||||||||
| 5,469,361 | Cendant Timeshare Receivables Funding LLC, Series 05-1A, Class A2, 144A, FGIC, Variable Rate, 1 mo. LIBOR + .18%, 3.30%, due 05/20/17 | 5,014,721 | |||||||||
| 9,086,393 | Sierra Receivables Funding Co., Series 06-1A, Class A2, 144A, MBIA, Variable Rate, 1 mo. LIBOR + .15%, 3.27%, due 05/20/18 | 7,694,994 | |||||||||
| 9,152,906 | Sierra Receivables Funding Co., Series 07-1A, Class A2, 144A, FGIC, Variable Rate, 1 mo. LIBOR + .15%, 3.26%, due 03/20/19 | 8,140,366 | |||||||||
| 32,253,704 | Sierra Receivables Funding Co., Series 07-2A, Class A2, 144A, MBIA, Variable Rate, 1 mo. LIBOR + 1.00%, 4.12%, due 09/20/19 | 27,797,887 | |||||||||
| Total Insured Time Share | 51,037,771 | ||||||||||
| Insured Transportation — 0.1% | |||||||||||
| 9,250,000 | GE Seaco Finance SRL, Series 04-1A, Class A, 144A, AMBAC, Variable Rate, 1 mo. LIBOR + .30%, 3.42%, due 04/17/19 | 8,301,875 | |||||||||
| Investment Grade Corporate Collateralized Debt Obligations — 3.0% | |||||||||||
| 20,000,000 | Counts Trust, Series 04-2, 144A, Variable Rate, 3 mo. LIBOR + .95%, 5.88%, due 09/20/09 | 19,601,000 | |||||||||
| 10,000,000 | Morgan Stanley ACES SPC, Series 04-12, Class A, 144A, Variable Rate, 3 mo. LIBOR + .60%, 3.70%, due 08/05/09 | 9,415,000 | |||||||||
| 7,000,000 | Morgan Stanley ACES SPC, Series 04-12, Class I, 144A, Variable Rate, 3 mo. LIBOR + 0.80%, 3.90%, due 08/05/09 | 6,405,000 | |||||||||
See accompanying notes to the financial statements.
14
GMO Short-Duration Collateral Fund
(A Series of GMO Trust)
Schedule of Investments — (Continued)
(showing percentage of total net assets)
February 29, 2008
| Par Value ($) | Description | Value ($) | |||||||||
| Investment Grade Corporate Collateralized Debt Obligations — continued | |||||||||||
| 6,000,000 | Morgan Stanley ACES SPC, Series 04-15, Class I, 144A, Variable Rate, 3 mo. LIBOR + .45%, 5.38%, due 12/20/09 | 5,673,000 | |||||||||
| 11,000,000 | Morgan Stanley ACES SPC, Series 04-15, Class II, 144A, Variable Rate, 3 mo. LIBOR + .65%, 5.58%, due 12/20/09 | 9,933,000 | |||||||||
| 3,000,000 | Morgan Stanley ACES SPC, Series 04-15, Class III, 144A, Variable Rate, 3 mo. LIBOR + .75%, 5.68%, due 12/20/09 | 2,595,000 | |||||||||
| 16,000,000 | Morgan Stanley ACES SPC, Series 05-10, Class A1, 144A, Variable Rate, 3 mo. LIBOR + .52%, 5.45%, due 03/20/10 | 14,472,000 | |||||||||
| 30,000,000 | Morgan Stanley ACES SPC, Series 05-15, Class A, 144A, Variable Rate, 3 mo. LIBOR + .40%, 5.33%, due 12/20/10 | 27,600,000 | |||||||||
| 16,000,000 | Morgan Stanley ACES SPC, Series 05-2A, Class A, 144A, Variable Rate, 3 mo. LIBOR + .45%, 5.38%, due 03/20/10 | 14,728,000 | |||||||||
| 46,000,000 | Morgan Stanley ACES SPC, Series 06-13A, Class A, 144A, Variable Rate, 3 mo. LIBOR + .29%, 5.22%, due 06/20/13 | 33,276,400 | |||||||||
| 15,000,000 | Prism Orso Trust, Series 04-MAPL, Class CERT, 144A, Variable Rate, 3 mo. LIBOR + .70%, 5.63%, due 08/01/11 | 13,902,000 | |||||||||
| 49,000,000 | Reve SPC, 144A, Variable Rate, 3 mo. LIBOR + .22%, 5.15%, due 03/20/14 | 40,425,000 | |||||||||
| 30,000,000 | Salisbury International Investments Ltd., Series EMTN, Variable Rate, 3 mo. LIBOR + .42%, 5.35%, due 06/22/10 | 28,989,000 | |||||||||
| Total Investment Grade Corporate Collateralized Debt Obligations | 227,014,400 | ||||||||||
| Rate Reduction Bonds — 1.0% | |||||||||||
| 2,078,523 | Connecticut RRB Special Purpose Trust CL&P-1, Series 01-1, Class A4, Variable Rate, 3 mo. LIBOR + .31%, 5.14%, due 12/30/10 | 2,073,327 | |||||||||
| 23,000,000 | Massachusetts RRB Special Purpose Trust, Series 05-1, Class A3, 4.13%, due 09/15/13 | 23,304,520 | |||||||||
| 30,000,000 | PG&E Energy Recovery Funding LLC, Series 05-1, Class A4, 4.37%, due 06/25/14 | 29,850,000 | |||||||||
| 18,794,586 | PG&E Energy Recovery Funding LLC, Series 05-2, Class A1, 4.85%, due 06/25/11 | 18,953,025 | |||||||||
| 6,318,850 | PSE&G Transition Funding LLC, Series 01-1, Class A4, Variable Rate, 3 mo. LIBOR + .30%, 5.29%, due 06/15/11 | 6,304,443 | |||||||||
| Total Rate Reduction Bonds | 80,485,315 | ||||||||||
See accompanying notes to the financial statements.
15
GMO Short-Duration Collateral Fund
(A Series of GMO Trust)
Schedule of Investments — (Continued)
(showing percentage of total net assets)
February 29, 2008
| Par Value ($) | Description | Value ($) | |||||||||
| Residential Asset-Backed Securities (United States) — 17.7% | |||||||||||
| 5,212,273 | Accredited Mortage Loan Trust, Series 07-1, Class A1, Variable Rate, 1 mo. LIBOR + .05%, 3.17%, due 02/25/37 | 5,016,676 | |||||||||
| 1,119,337 | Accredited Mortgage Loan Trust, Series 04-4, Class A1B, Variable Rate, 1 mo. LIBOR + .39%, 3.53%, due 01/25/35 | 1,018,815 | |||||||||
| 6,419,401 | ACE Securities Corp., Series 05-AG1, Class A2B, Variable Rate, 1 mo. LIBOR + .21%, 3.33%, due 08/25/35 | 6,074,229 | |||||||||
| 7,013,541 | ACE Securities Corp., Series 05-ASP1, Class A2B, Variable Rate, 1 mo. LIBOR + .21%, 3.35%, due 09/25/35 | 6,524,697 | |||||||||
| 7,000,000 | ACE Securities Corp., Series 05-ASP1, Class A2C, Variable Rate, 1 mo. LIBOR + .27%, 3.39%, due 09/25/35 | 5,791,660 | |||||||||
| 5,084,416 | ACE Securities Corp., Series 06-ASL1, Class A, Variable Rate, 1 mo. LIBOR + .14%, 3.28%, due 02/25/36 | 3,050,650 | |||||||||
| 36,409,000 | ACE Securities Corp., Series 06-ASP1, Class A2B, Variable Rate, 1 mo. LIBOR + .15%, 3.29%, due 12/25/35 | 34,115,233 | |||||||||
| 30,000,000 | ACE Securities Corp., Series 06-ASP2, Class A2B, Variable Rate, 1 mo. LIBOR + .14%, 3.28%, due 03/25/36 | 27,849,900 | |||||||||
| 10,000,000 | ACE Securities Corp., Series 06-ASP2, Class A2C, Variable Rate, 1 mo. LIBOR + .18%, 3.32%, due 03/25/36 | 8,531,300 | |||||||||
| 17,000,000 | ACE Securities Corp., Series 06-ASP4, Class A2B, Variable Rate, 1 mo. LIBOR + .10%, 3.24%, due 08/25/36 | 15,148,700 | |||||||||
| 24,000,000 | ACE Securities Corp., Series 06-ASP5, Class A2C, Variable Rate, 1 mo. LIBOR + .18%, 3.30%, due 10/25/36 | 19,562,880 | |||||||||
| 4,145,404 | ACE Securities Corp., Series 06-CW1, Class A2A, Variable Rate, 1 mo. LIBOR + .05%, 3.17%, due 07/25/36 | 4,018,223 | |||||||||
| 22,000,000 | ACE Securities Corp., Series 06-CW1, Class A2B, Variable Rate, 1 mo. LIBOR + .10%, 3.22%, due 07/25/36 | 20,067,520 | |||||||||
| 7,000,000 | ACE Securities Corp., Series 06-HE2, Class A2C, Variable Rate, 1 mo. LIBOR + .16%, 3.28%, due 05/25/36 | 5,768,350 | |||||||||
| 17,500,000 | ACE Securities Corp., Series 06-HE3, Class A2B, Variable Rate, 1 mo. LIBOR + .09%, 3.21%, due 06/25/36 | 16,047,325 | |||||||||
| 13,000,000 | ACE Securities Corp., Series 06-OP1, Class A2C, Variable Rate, 1 mo. LIBOR + .15%, 3.29%, due 04/25/36 | 10,328,500 | |||||||||
| 6,625,191 | ACE Securities Corp., Series 06-SL1, Class A, Variable Rate, 1 mo. LIBOR + .16%, 3.28%, due 09/25/35 | 4,306,374 | |||||||||
| 14,097,727 | ACE Securities Corp., Series 06-SL3, Class A1, Variable Rate, 1 mo. LIBOR + .10%, 3.22%, due 06/25/36 | 5,639,091 | |||||||||
See accompanying notes to the financial statements.
16
GMO Short-Duration Collateral Fund
(A Series of GMO Trust)
Schedule of Investments — (Continued)
(showing percentage of total net assets)
February 29, 2008
| Par Value ($) | Description | Value ($) | |||||||||
| Residential Asset-Backed Securities (United States) — continued | |||||||||||
| 14,036,000 | ACE Securities Corp., Series 06-SL3, Class A2, Variable Rate, 1 mo. LIBOR + .17%, 3.29%, due 06/25/36 | 4,210,800 | |||||||||
| 34,668,278 | ACE Securities Corp., Series 07-HE1, Class A2A, Variable Rate, 1 mo. LIBOR + .09%, 3.23%, due 01/25/37 | 30,242,872 | |||||||||
| 16,943,416 | ACE Securities Corp., Series 07-WM1, Class A2A, Variable Rate, 1 mo. LIBOR + .07%, 3.19%, due 11/25/36 | 15,848,702 | |||||||||
| 1,821,915 | Aegis Asset Backed Securities Trust, Series 05-5, Class 1A2, Variable Rate, 1 mo. LIBOR + .18%, 3.30%, due 12/25/35 | 1,816,504 | |||||||||
| 15,785,593 | Alliance Bancorp Trust, Series 07-S1, Class A1, 144A, Variable Rate, 1 mo. LIBOR + .20%, 3.34%, due 05/25/37 | 6,314,237 | |||||||||
| 4,100,651 | Argent Securities, Inc., Series 04-W8, Class A5, Variable Rate, 1 mo. LIBOR + .52%, 3.66%, due 05/25/34 | 3,247,203 | |||||||||
| 75,067,000 | Argent Securities, Inc., Series 06-M1, Class A2C, Variable Rate, 1 mo. LIBOR + .15%, 3.27%, due 07/25/36 | 55,744,754 | |||||||||
| 18,000,000 | Argent Securities, Inc., Series 06-M2, Class A2B, Variable Rate, 1 mo. LIBOR + .11%, 3.23%, due 09/25/36 | 16,775,820 | |||||||||
| 30,513,634 | Argent Securities, Inc., Series 06-W2, Class A2B, Variable Rate, 1 mo. LIBOR + .19%, 3.31%, due 03/25/36 | 28,362,423 | |||||||||
| 6,000,000 | Argent Securities, Inc., Series 06-W4, Class A2B, Variable Rate, 1 mo. LIBOR + .11%, 3.23%, due 05/25/36 | 5,799,660 | |||||||||
| 13,000,000 | Argent Securities, Inc., Series 06-W5, Class A2C, Variable Rate, 1 mo. LIBOR + .15%, 3.27%, due 06/25/36 | 10,873,281 | |||||||||
| 19,000,000 | Asset Backed Funding Certificates, Series 06-OPT2, Class A3B, Variable Rate, 1 mo. LIBOR + .11%, 3.23%, due 10/25/36 | 17,432,500 | |||||||||
| 13,500,000 | Asset Backed Funding Certificates, Series 06-OPT2, Class A3C, Variable Rate, 1 mo. LIBOR + .15%, 3.27%, due 10/25/36 | 11,141,719 | |||||||||
| 5,430,975 | Asset Backed Funding Certificates, Series 06-OPT3, Class A3A, Variable Rate, 1 mo. LIBOR + .06%, 3.18%, due 11/25/36 | 5,247,679 | |||||||||
| 57,744,841 | Asset Backed Funding Certificates, Series 07-NC1, Class A1, 144A, Variable Rate, 1 mo. LIBOR + .22%, 3.34%, due 05/25/37 | 53,810,974 | |||||||||
| 10,000,000 | Bayview Financial Acquisition Trust, Series 04-B, Class A1, 144A, Variable Rate, 1 mo. LIBOR + .50%, 3.63%, due 05/28/39 | 9,808,548 | |||||||||
| 10,400,000 | Bayview Financial Acquisition Trust, Series 04-B, Class A2, 144A, Variable Rate, 1 mo. LIBOR + .65%, 3.78%, due 05/28/39 | 10,275,270 | |||||||||
| 15,000,000 | Bayview Financial Acquisition Trust, Series 05-A, Class A1, 144A, Variable Rate, 1 mo. LIBOR + .50%, 3.62%, due 02/28/40 | 13,875,000 | |||||||||
See accompanying notes to the financial statements.
17
GMO Short-Duration Collateral Fund
(A Series of GMO Trust)
Schedule of Investments — (Continued)
(showing percentage of total net assets)
February 29, 2008
| Par Value ($) | Description | Value ($) | |||||||||
| Residential Asset-Backed Securities (United States) — continued | |||||||||||
| 7,891,358 | Bear Stearns Asset Backed Securities, Inc., Series 07-AQ1, Class A1, Variable Rate, 1 mo. LIBOR + .11%, 3.23%, due 11/25/36 | 7,549,741 | |||||||||
| 10,000,000 | Bear Stearns Asset Backed Securities, Inc., Series 07-AQ1, Class A2, Variable Rate, 1 mo. LIBOR + .20%, 3.32%, due 11/25/36 | 7,000,000 | |||||||||
| 12,093,974 | Bear Stearns Mortgage Funding Trust, Series 07-SL2, Class 1A, Variable Rate, 1 mo. LIBOR + .16%, 3.28%, due 02/25/37 | 5,079,469 | |||||||||
| 39,000,000 | Carrington Mortgage Loan Trust, Series 06-NC1, Class A2, Variable Rate, 1 mo. LIBOR + .16%, 3.30%, due 01/25/36 | 38,134,200 | |||||||||
| 9,610,865 | Carrington Mortgage Loan Trust, Series 07-FRE1, Class A1, Variable Rate, 1 mo. LIBOR + .12%, 3.26%, due 02/25/37 | 9,304,518 | |||||||||
| 47,000,000 | Carrington Mortgage Loan Trust, Series 07-FRE1, Class A2, Variable Rate, 1 mo. LIBOR + .20%, 3.34%, due 02/25/37 | 41,595,940 | |||||||||
| 2,812,026 | Centex Home Equity, Series 05-C, Class AV3, Variable Rate, 1 mo. LIBOR + .23%, 3.35%, due 06/25/35 | 2,801,481 | |||||||||
| 16,500,000 | Centex Home Equity, Series 06-A, Class AV3, Variable Rate, 1 mo. LIBOR + .16%, 3.28%, due 06/25/36 | 14,285,700 | |||||||||
| 641,073 | Chase Funding Mortgage Loan Trust, Series 03-3, Class 2A2, Variable Rate, 1 mo. LIBOR + .27%, 3.68%, due 04/25/33 | 592,993 | |||||||||
| 202,624 | Citigroup Mortgage Loan Trust, Inc., Series 04-OPT1, Class A1B, Variable Rate, 1 mo. LIBOR + .41%, 3.55%, due 10/25/34 | 157,864 | |||||||||
| 14,500,000 | Citigroup Mortgage Loan Trust, Inc., Series 06-HE3, Class A2C, Variable Rate, 1 mo. LIBOR + .16%, 3.28%, due 12/25/36 | 10,367,500 | |||||||||
| 5,303,236 | Citigroup Mortgage Loan Trust, Inc., Series 06-WMC1, Class A2B, Variable Rate, 1 mo. LIBOR + .15%, 3.29%, due 12/25/35 | 5,234,824 | |||||||||
| 46,500,000 | Countrywide Asset-Backed Certificates, Series 06-BC3, Class 2A2, Variable Rate, 1 mo. LIBOR + .14%, 3.26%, due 02/25/37 | 41,490,359 | |||||||||
| 23,199,364 | Countrywide Asset-Backed Certificates, Series 06-BC5, Class 2A1, Variable Rate, 1 mo. LIBOR + .08%, 3.20%, due 03/25/37 | 22,383,649 | |||||||||
| 13,287,504 | Credit-Based Asset Servicing & Securitization, Series 06-RP1, Class A1, 144A, Variable Rate, 1 mo. LIBOR + .11%, 3.23%, due 04/25/36 | 12,872,270 | |||||||||
| 634,090 | Equity One ABS, Inc., Series 04-1, Class AV2, Variable Rate, 1 mo. LIBOR + .30%, 3.44%, due 04/25/34 | 486,664 | |||||||||
| 18,500,000 | First Franklin Mortgage Loan Asset Backed Certificates, Series 06-FF5, Class 2A3, Variable Rate, 1 mo. LIBOR + .16%, 3.30%, due 04/25/36 | 15,730,781 | |||||||||
| 9,219,596 | Fremont Home Loan Trust, Series 06-A, Class 1A2, Variable Rate, 1 mo. LIBOR + .19%, 3.33%, due 05/25/36 | 7,421,775 | |||||||||
See accompanying notes to the financial statements.
18
GMO Short-Duration Collateral Fund
(A Series of GMO Trust)
Schedule of Investments — (Continued)
(showing percentage of total net assets)
February 29, 2008
| Par Value ($) | Description | Value ($) | |||||||||
| Residential Asset-Backed Securities (United States) — continued | |||||||||||
| 10,000,000 | Fremont Home Loan Trust, Series 06-B, Class 2A2, Variable Rate, 1 mo. LIBOR + .10%, 3.24%, due 08/25/36 | 9,600,000 | |||||||||
| 23,625,000 | Fremont Home Loan Trust, Series 06-B, Class 2A3, Variable Rate, 1 mo. LIBOR + .16%, 3.28%, due 08/25/36 | 16,419,375 | |||||||||
| 20,497,697 | GE-WMC Mortgage Securities, Series 05-2, Class A2B, Variable Rate, 1 mo. LIBOR + .17%, 3.29%, due 12/25/35 | 20,036,498 | |||||||||
| 19,000,000 | GE-WMC Mortgage Securities, Series 06-1, Class A2B, Variable Rate, 1 mo. LIBOR + .15%, 3.27%, due 08/25/36 | 15,027,100 | |||||||||
| 2,939,771 | Home Equity Asset Trust, Series 05-4, Class 2A2, Variable Rate, 1 mo. LIBOR + .23%, 3.37%, due 10/25/35 | 2,910,374 | |||||||||
| 5,265,336 | Household Home Equity Loan Trust, Series 05-2, Class A2, Variable Rate, 1 mo. LIBOR + .31%, 3.43%, due 01/20/35 | 4,807,087 | |||||||||
| 5,920,707 | Household Home Equity Loan Trust, Series 05-3, Class A2, Variable Rate, 1 mo. LIBOR + .29%, 3.41%, due 01/20/35 | 5,342,513 | |||||||||
| 18,176,742 | Household Home Equity Loan Trust, Series 06-1, Class A1, Variable Rate, 1 mo. LIBOR + .16%, 3.27%, due 01/20/36 | 16,654,440 | |||||||||
| 5,271,576 | IXIS Real Estate Capital Trust, Series 06-HE1, Class A2, Variable Rate, 1 mo. LIBOR + .14%, 3.28%, due 03/25/36 | 5,241,528 | |||||||||
| 38,000,000 | J.P. Morgan Mortgage Acquisition Corp., Series 06-WMC4, Class A3, Variable Rate, 1 mo. LIBOR + .12%, 3.24%, due 12/25/36 | 31,612,200 | |||||||||
| 9,666,993 | Long Beach Mortgage Loan Trust, Series 05-WL2, Class 3A1, Variable Rate, 1 mo. LIBOR + .18%, 3.32%, due 08/25/35 | 8,753,849 | |||||||||
| 10,000,000 | Master Asset-Backed Securities Trust, Series 05-FRE1, Class A4, Variable Rate, 1 mo. LIBOR + .25%, 3.37%, due 10/25/35 | 9,000,000 | |||||||||
| 14,490,000 | Master Asset-Backed Securities Trust, Series 06-AM3, Class A2, Variable Rate, 1 mo. LIBOR + .13%, 3.27%, due 10/25/36 | 13,403,250 | |||||||||
| 25,910,000 | Master Asset-Backed Securities Trust, Series 06-FRE2, Class A4, Variable Rate, 1 mo. LIBOR + .15%, 3.27%, due 03/25/36 | 17,359,700 | |||||||||
| 14,300,000 | Master Asset-Backed Securities Trust, Series 06-HE2, Class A3, Variable Rate, 1 mo. LIBOR + .15%, 3.27%, due 06/25/36 | 9,867,000 | |||||||||
| 30,390,000 | Master Asset-Backed Securities Trust, Series 06-HE3, Class A3, Variable Rate, 1 mo. LIBOR + .15%, 3.27%, due 08/25/36 | 23,704,200 | |||||||||
| 17,000,000 | Master Asset-Backed Securities Trust, Series 06-NC3, Class A4, Variable Rate, 1 mo. LIBOR + .16%, 3.28%, due 10/25/36 | 11,560,000 | |||||||||
| 42,000,000 | Master Asset-Backed Securities Trust, Series 06-WMC1, Class A2, Variable Rate, 1 mo. LIBOR + .11%, 3.25%, due 02/25/36 | 38,850,000 | |||||||||
See accompanying notes to the financial statements.
19
GMO Short-Duration Collateral Fund
(A Series of GMO Trust)
Schedule of Investments — (Continued)
(showing percentage of total net assets)
February 29, 2008
| Par Value ($) | Description | Value ($) | |||||||||
| Residential Asset-Backed Securities (United States) — continued | |||||||||||
| 10,267,067 | Master Second Lien Trust, Series 06-1, Class A, Variable Rate, 1 mo. LIBOR + .16%, 3.28%, due 03/25/36 | 4,517,509 | |||||||||
| 29,517,584 | Merrill Lynch Mortgage Investors, Series 07-HE2, Class A2A, Variable Rate, 1 mo. LIBOR + .12%, 3.26%, due 02/25/37 | 28,276,923 | |||||||||
| 5,679,211 | Morgan Stanley ABS Capital I, Series 04-SD1, Class A, Variable Rate, 1 mo. LIBOR + .40%, 3.54%, due 08/25/34 | 5,310,063 | |||||||||
| 40,000,000 | Morgan Stanley ABS Capital I, Series 07-HE4, Class A2C, Variable Rate, 1 mo. LIBOR + .23%, 3.37%, due 02/25/37 | 30,200,000 | |||||||||
| 27,500,000 | Morgan Stanley Home Equity Loans, Series 06-3, Class A3, Variable Rate, 1 mo. LIBOR + .16%, 3.28%, due 04/25/36 | 21,312,500 | |||||||||
| 23,476,386 | Morgan Stanley Home Equity Loans, Series 07-2, Class A1, Variable Rate, 1 mo. LIBOR + .10%, 3.24%, due 04/25/37 | 22,478,639 | |||||||||
| 11,500,000 | Morgan Stanley IXIS Real Estate Capital Trust, Series 06-2, Class A3, Variable Rate, 1 mo. LIBOR + .15%, 3.27%, due 11/25/36 | 8,797,500 | |||||||||
| 16,016,000 | Nomura Home Equity Loan, Inc., Series 06-FM1, Class 2A2, Variable Rate, 1 mo. LIBOR + .16%, 3.30%, due 11/25/35 | 15,542,402 | |||||||||
| 809,522 | Option One Mortgage Loan Trust, Series 05-3, Class A4, Variable Rate, 1 mo. LIBOR + .25%, 3.37%, due 08/25/35 | 777,774 | |||||||||
| 3,068,881 | People's Choice Home Loan Securities Trust, Series 05-3, Class 1A2, Variable Rate, 1 mo. LIBOR + .27%, 3.39%, due 08/25/35 | 2,915,775 | |||||||||
| 17,919,917 | People's Choice Home Loan Securities Trust, Series 05-4, Class 1A2, Variable Rate, 1 mo. LIBOR + .26%, 3.38%, due 12/25/35 | 16,038,326 | |||||||||
| 1,474,720 | RAAC Series Trust, Series 05-RP3, Class A1, 144A, Variable Rate, 1 mo. LIBOR + .23%, 3.35%, due 05/25/39 | 1,465,297 | |||||||||
| 24,235,000 | RAAC Series Trust, Series 06-SP1, Class A2, Variable Rate, 1 mo. LIBOR + .19%, 3.33%, due 09/25/45 | 23,545,817 | |||||||||
| 7,664,240 | Residential Asset Mortgage Products, Inc., Series 05-RS4, Class A3, Variable Rate, 1 mo. LIBOR + .23%, 3.35%, due 04/25/35 | 7,018,767 | |||||||||
| 7,486,962 | Residential Asset Mortgage Products, Inc., Series 05-RS8, Class A2, Variable Rate, 1 mo. LIBOR + .29%, 3.43%, due 10/25/33 | 7,178,125 | |||||||||
| 50,000,000 | Residential Asset Mortgage Products, Inc., Series 05-RS9, Class Al3, FGIC, Variable Rate, 1 mo. LIBOR + .22%, 3.36%, due 11/25/35 | 46,415,000 | |||||||||
| 19,386,897 | Residential Asset Securities Corp., Series 07-KS3, Class AI1, Variable Rate, 1 mo. LIBOR + .11%, 3.25%, due 02/25/30 | 18,652,134 | |||||||||
| 279,557 | Saxon Asset Securities Trust, Series 04-1, Class A, Variable Rate, 1 mo. LIBOR + .27%, 3.68%, due 03/25/35 | 209,667 | |||||||||
See accompanying notes to the financial statements.
20
GMO Short-Duration Collateral Fund
(A Series of GMO Trust)
Schedule of Investments — (Continued)
(showing percentage of total net assets)
February 29, 2008
| Par Value ($) | Description | Value ($) | |||||||||
| Residential Asset-Backed Securities (United States) — continued | |||||||||||
| 9,000,000 | Securitized Asset Backed Receivables LLC, Series 06-NC1, Class A2, Variable Rate, 1 mo. LIBOR + .16%, 3.30%, due 03/25/36 | 8,105,182 | |||||||||
| 9,117 | Security National Mortgage Loan Trust, Series 05-2A, Class A1, 144A, Variable Rate, 1 mo. LIBOR + .29%, 3.41%, due 02/25/36 | 9,042 | |||||||||
| 8,061,229 | Security National Mortgage Loan Trust, Series 06-2A, Class A1, 144A, Variable Rate, 1 mo. LIBOR + .29%, 3.41%, due 10/25/36 | 7,779,086 | |||||||||
| 5,715,807 | SG Mortgage Securities Trust, Series 05-OPT1, Class A2, Variable Rate, 1 mo. LIBOR + .26%, 3.38%, due 10/25/35 | 5,376,402 | |||||||||
| 7,188,976 | Soundview Home Equity Loan Trust, Series 07-NS1, Class A1, Variable Rate, 1 mo. LIBOR + .12%, 3.24%, due 01/25/37 | 6,827,280 | |||||||||
| 20,000,000 | Specialty Underwriting & Residential Finance, Series 06-BC3, Class A2C, Variable Rate, 1 mo. LIBOR + .15%, 3.27%, due 06/25/37 | 17,800,000 | |||||||||
| 13,000,000 | Structured Asset Investment Loan Trust, Series 06-1, Class A3, Variable Rate, 1 mo. LIBOR + .20%, 3.32%, due 01/25/36 | 11,315,391 | |||||||||
| 12,624,136 | Structured Asset Securities Corp., Series 05-S6, Class A2, Variable Rate, 1 mo. LIBOR + .29%, 3.41%, due 11/25/35 | 11,701,373 | |||||||||
| 29,416,076 | Yale Mortgage Loan Trust, Series 07-1, Class A, 144A, Variable Rate, 1 mo. LIBOR + .40%, 3.54%, due 06/25/37 | 27,945,273 | |||||||||
| Total Residential Asset-Backed Securities (United States) | 1,359,838,158 | ||||||||||
| Residential Mortgage-Backed Securities (Australian) — 3.5% | |||||||||||
| 9,534,095 | Australian Mortgage Securities II, Series G3, Class A1A, Variable Rate, 3 mo. LIBOR + .21%, 4.72%, due 01/10/35 | 9,319,673 | |||||||||
| 10,031,544 | Crusade Global Trust, Series 04-2, Class A1, Variable Rate, 3 mo. LIBOR + .13%, 3.20%, due 11/19/37 | 8,653,310 | |||||||||
| 4,799,440 | Crusade Global Trust, Series 05-1, Class A1, Variable Rate, 3 mo. LIBOR + .06%, 5.05%, due 06/17/37 | 4,579,866 | |||||||||
| 16,125,204 | Crusade Global Trust, Series 06-1, Class A1, 144A, Variable Rate, 3 mo. LIBOR + .06%, 3.95%, due 07/20/38 | 15,200,746 | |||||||||
| 26,328,548 | Crusade Global Trust, Series 07-1, Class A1, Variable Rate, 3 mo. LIBOR + .06%, 3.95%, due 04/19/38 | 25,258,477 | |||||||||
| 7,583,634 | Interstar Millennium Trust Series 03-3G, Class A2, Variable Rate, 3 mo. LIBOR + .25%, 5.11%, due 09/27/35 | 7,076,440 | |||||||||
| 7,713,693 | Interstar Millennium Trust, Series 03-5G, Class A2, Variable Rate, 3 mo. LIBOR + .25%, 4.18%, due 01/20/36 | 6,675,352 | |||||||||
| 7,885,299 | Interstar Millennium Trust, Series 04-2G, Class A, Variable Rate, 3 mo. LIBOR + .20%, 5.26%, due 03/14/36 | 6,711,257 | |||||||||
See accompanying notes to the financial statements.
21
GMO Short-Duration Collateral Fund
(A Series of GMO Trust)
Schedule of Investments — (Continued)
(showing percentage of total net assets)
February 29, 2008
| Par Value ($) | Description | Value ($) | |||||||||
| Residential Mortgage-Backed Securities (Australian) — continued | |||||||||||
| 3,772,383 | Interstar Millennium Trust, Series 05-1G, Class A, Variable Rate, 3 mo. LIBOR + .12%, 3.11%, due 12/08/36 | 3,387,486 | |||||||||
| 5,275,524 | Medallion Trust, Series 03-1G, Class A, Variable Rate, 3 mo. LIBOR + .19%, 5.10%, due 12/21/33 | 5,108,606 | |||||||||
| 7,184,698 | Medallion Trust, Series 04-1G, Class A1, Variable Rate, 3 mo. LIBOR + .13%, 3.22%, due 05/25/35 | 6,698,293 | |||||||||
| 3,844,214 | Medallion Trust, Series 05-1G, Class A1, Variable Rate, 3 mo. LIBOR + .08%, 3.18%, due 05/10/36 | 3,688,215 | |||||||||
| 18,138,482 | Medallion Trust, Series 06-1G, Class A1, Variable Rate, 3 mo. LIBOR + .05%, 5.11%, due 06/14/37 | 17,192,923 | |||||||||
| 12,091,457 | Medallion Trust, Series 07-1G, Class A1, Variable Rate, 3 mo. LIBOR + .04%, 3.13%, due 02/27/39 | 11,504,175 | |||||||||
| 11,115,338 | National RMBS Trust, Series 04-1, Class A1, Variable Rate, 3 mo. LIBOR + .11%, 5.04%, due 03/20/34 | 10,610,702 | |||||||||
| 26,490,898 | National RMBS Trust, Series 06-3, Class A1, 144A, Variable Rate, 3 mo. LIBOR + .07%, 3.96%, due 10/20/37 | 25,099,066 | |||||||||
| 29,144,400 | Puma Finance Ltd., Series G5, Class A1, 144A, Variable Rate, 3 mo. LIBOR + .07%, 3.14%, due 02/21/38 | 26,737,073 | |||||||||
| 31,633,670 | Superannuation Members Home Loans Global Fund, Series 07-1, Class A1, Variable Rate, 3 mo. LIBOR + .06%, 5.19%, due 12/12/35 | 29,971,795 | |||||||||
| 3,399,001 | Superannuation Members Home Loans Global Fund, Series 4A, Class A, Variable Rate, 3 mo. LIBOR + .22%, 4.76%, due 10/09/29 | 3,280,036 | |||||||||
| 1,829,278 | Superannuation Members Home Loans Global Fund, Series 6, Class A, Variable Rate, 3 mo. LIBOR + .16%, 3.26%, due 11/09/35 | 1,614,868 | |||||||||
| 4,092,489 | Superannuation Members Home Loans Global Fund, Series 7, Class A1, Variable Rate, 3 mo. LIBOR + .14%, 3.13%, due 03/09/36 | 3,986,624 | |||||||||
| 3,590,379 | Superannuation Members Home Loans Global Fund, Series 8, Class A1, Variable Rate, 3 mo. LIBOR + .07%, 4.45%, due 01/12/37 | 3,127,220 | |||||||||
| 10,534,039 | Westpac Securitization Trust, Series 05-1G, Class A1, Variable Rate, 3 mo. LIBOR + .07%, 4.95%, due 03/23/36 | 10,092,979 | |||||||||
| 25,843,486 | Westpac Securitization Trust, Series 07-1G, Class A2A, Variable Rate, 3 mo. LIBOR + .05%, 3.12%, due 05/21/38 | 23,016,467 | |||||||||
| Total Residential Mortgage-Backed Securities (Australian) | 268,591,649 | ||||||||||
See accompanying notes to the financial statements.
22
GMO Short-Duration Collateral Fund
(A Series of GMO Trust)
Schedule of Investments — (Continued)
(showing percentage of total net assets)
February 29, 2008
| Par Value ($) | Description | Value ($) | |||||||||
| Residential Mortgage-Backed Securities (European) — 5.4% | |||||||||||
| 16,600,000 | Aire Valley Mortgages, Series 06-1A, Class 1A, 144A, Variable Rate, 3 mo. LIBOR + .11%, 5.04%, due 09/20/66 | 16,236,460 | |||||||||
| 20,000,000 | Aire Valley Mortgages, Series 07-1A, Class 1A2, 144A, Variable Rate, 3 mo. LIBOR + .09%, 5.02%, due 03/20/30 | 19,288,000 | |||||||||
| 16,000,000 | Arkle Master Issuer Plc, Series 06-1A, Class 3A, 144A, Variable Rate, 3 mo. LIBOR + .05%, 3.12%, due 08/17/11 | 15,560,160 | |||||||||
| 16,000,000 | Arkle Master Issuer Plc, Series 06-1A, Class 4A1, 144A, Variable Rate, 3 mo. LIBOR + .09%, 3.16%, due 02/17/52 | 15,168,000 | |||||||||
| 1,058,516 | Arran Residential Mortgages Funding Plc, Series 06-1A, Class A1B, 144A, Variable Rate, 3 mo. LIBOR + .02%, 2.96%, due 04/12/36 | 1,052,895 | |||||||||
| 40,000,000 | Brunel Residential Mortgages, Series 07-1A, Class A4C, 144A, Variable Rate, 3 mo. LIBOR + .10%, 4.48%, due 01/13/39 | 37,460,000 | |||||||||
| 8,969,565 | Gracechurch Mortgage Financing Plc, Series 06-1, Class A1, 144A, Variable Rate, 3 mo. LIBOR + .03%, 3.10%, due 11/20/31 | 8,917,542 | |||||||||
| 6,581,352 | Gracechurch Mortgage Funding Plc, Series 1A, Class A2B, 144A, Variable Rate, 3 mo. LIBOR + .07%, 4.51%, due 10/11/41 | 6,405,959 | |||||||||
| 15,000,000 | Granite Master Issuer Plc, Series 06-2, Class A4, Variable Rate, 3 mo. LIBOR + .04%, 3.93%, due 12/20/54 | 14,221,950 | |||||||||
| 4,658,689 | Granite Master Issuer Plc, Series 07-1, Class 1A1, Variable Rate, 1 mo. LIBOR + .03%, 3.14%, due 12/20/30 | 4,565,515 | |||||||||
| 9,727,112 | Granite Mortgages Plc, Series 04-3, Class 2A1, Variable Rate, 3 mo. LIBOR + .14%, 5.07%, due 09/20/44 | 9,325,966 | |||||||||
| 49,000,000 | Holmes Financing Plc, Series 10A, Class 4A1, 144A, Variable Rate, 3 mo. LIBOR + .08%, 4.34%, due 07/15/40 | 47,216,890 | |||||||||
| 4,744,101 | Kildare Securities Ltd., Series 07-1A, Class A1, 144A, Variable Rate, 3 mo. LIBOR + .02%, 3.01%, due 06/10/14 | 4,740,780 | |||||||||
| 30,000,000 | Kildare Securities Ltd., Series 07-1A, Class A2, 144A, Variable Rate, 3 mo. LIBOR + .06%, 3.05%, due 12/10/43 | 29,628,000 | |||||||||
| 2,905,800 | Leek Finance Plc, Series 14A, Class A2B, 144A, Variable Rate, 3 mo. LIBOR + .18%, 5.09%, due 09/21/36 | 2,869,478 | |||||||||
| 7,238,750 | Leek Finance Plc, Series 15A, Class AB, 144A, Variable Rate, 3 mo. LIBOR + .14%, 5.05%, due 03/21/37 | 7,112,072 | |||||||||
| 7,705,890 | Leek Finance Plc, Series 17A, Class A2B, 144A, Variable Rate, 3 mo. LIBOR + .14%, 5.05%, due 03/23/09 | 7,582,596 | |||||||||
| 7,274,200 | Lothian Mortgages Master Issuer Plc, Series 06-1A, Class A1, 144A, Variable Rate, 1 mo. LIBOR - .03%, 3.12%, due 01/24/28 | 7,253,105 | |||||||||
See accompanying notes to the financial statements.
23
GMO Short-Duration Collateral Fund
(A Series of GMO Trust)
Schedule of Investments — (Continued)
(showing percentage of total net assets)
February 29, 2008
| Par Value ($) | Description | Value ($) | |||||||||
| Residential Mortgage-Backed Securities (European) — continued | |||||||||||
| 633,949 | Lothian Mortgages Plc, Series 3A, Class A1, 144A, Variable Rate, 3 mo. LIBOR + .14%, 3.86%, due 07/24/19 | 632,166 | |||||||||
| 14,000,000 | Mound Financing Plc, Series 5A, Class 2A, 144A, Variable Rate, 3 mo. LIBOR + .04%, 3.17%, due 05/08/16 | 13,632,500 | |||||||||
| 17,691,904 | Paragon Mortgages Plc, Series 12A, Class A2C, 144A, Variable Rate, 3 mo. LIBOR + .11%, 3.18%, due 11/15/38 | 15,772,509 | |||||||||
| 10,507,883 | Paragon Mortgages Plc, Series 14A, Class A2C, 144A, Variable Rate, 3 mo. LIBOR, 5.09%, due 09/15/39 | 9,392,261 | |||||||||
| 9,603,710 | Paragon Mortgages Plc, Series 7A, Class A1A, 144A, Variable Rate, 3 mo. LIBOR, 3.28%, due 05/15/34 | 9,069,648 | |||||||||
| 40,000,000 | Pendeford Master Issuer Plc, Series 07-1A, Class 3A, 144A, Variable Rate, 3 mo. LIBOR + .10%, 3.19%, due 02/12/16 | 38,696,000 | |||||||||
| 8,640,000 | Permanent Financing Plc, Series 4, Class 3A, Variable Rate, 3 mo. LIBOR + .14%, 3.13%, due 03/10/24 | 8,539,128 | |||||||||
| 25,040,000 | Permanent Financing Plc, Series 8, Class 2A, Variable Rate, 3 mo. LIBOR + .07%, 3.06%, due 06/10/14 | 24,917,304 | |||||||||
| 8,000,000 | Permanent Master Issuer Plc, Series 07-1, Class 4A, Variable Rate, 3 mo. LIBOR + .08%, 4.34%, due 10/15/33 | 7,589,600 | |||||||||
| 28,207,183 | RMAC Securities Plc, Series 06-NS4A, Class A1B, 144A, Variable Rate, 3 mo. LIBOR + .07%, 5.20%, due 06/12/25 | 28,122,562 | |||||||||
| Total Residential Mortgage-Backed Securities (European) | 410,969,046 | ||||||||||
| Residential Mortgage-Backed Securities (United States) — 0.1% | |||||||||||
| 1,272,812 | Chevy Chase Mortgage Funding Corp., Series 04-3A, Class A2, 144A, Variable Rate, 1 mo. LIBOR + .25%, 3.44%, due 08/25/35 | 1,018,250 | |||||||||
| 2,284,925 | GreenPoint Mortgage Funding Trust, Series 05-HE4, Class 2A3C, Variable Rate, 1 mo. LIBOR + .25%, 3.37%, due 07/25/30 | 2,250,651 | |||||||||
| 4,847,018 | Mellon Residential Funding Corp., Series 04-TBC1, Class A, 144A, Variable Rate, 1 mo. LIBOR + .25%, 3.37%, due 02/26/34 | 4,198,730 | |||||||||
| Total Residential Mortgage-Backed Securities (United States) | 7,467,631 | ||||||||||
| Student Loans — 4.9% | |||||||||||
| 22,000,000 | College Loan Corp. Trust, Series 04-1, Class A2, Variable Rate, 3 mo. LIBOR + .11%, 3.44%, due 04/25/16 | 21,920,938 | |||||||||
| 2,925,926 | College Loan Corp. Trust, Series 05-1, Class A1, Variable Rate, 3 mo. LIBOR + .03%, 3.36%, due 01/25/14 | 2,923,878 | |||||||||
See accompanying notes to the financial statements.
24
GMO Short-Duration Collateral Fund
(A Series of GMO Trust)
Schedule of Investments — (Continued)
(showing percentage of total net assets)
February 29, 2008
| Par Value ($) | Description | Value ($) | |||||||||
| Student Loans — continued | |||||||||||
| 15,500,000 | College Loan Corp. Trust, Series 06-1, Class A2, Variable Rate, 3 mo. LIBOR + .02%, 3.35%, due 04/25/22 | 15,224,100 | |||||||||
| 7,720,000 | College Loan Corp. Trust, Series 07-1, Class A1, Variable Rate, 3 mo. LIBOR + .01%, 3.34%, due 01/25/23 | 7,593,392 | |||||||||
| 26,000,000 | College Loan Corp. Trust, Series 07-2, Class A1, Variable Rate, 3 mo. LIBOR + .25%, 3.58%, due 01/25/24 | 25,748,125 | |||||||||
| 1,548,408 | Collegiate Funding Services Education Loan Trust I, Series 05-A, Class A1, Variable Rate, 3 mo. LIBOR + .02%, 4.86%, due 09/29/14 | 1,548,166 | |||||||||
| 10,808,927 | Goal Capital Funding Trust, Series 06-1, Class A1, Variable Rate, 3 mo. LIBOR, 3.09%, due 08/25/20 | 10,728,077 | |||||||||
| 7,813,192 | Goal Capital Funding Trust, Series 07-1, Class A1, Variable Rate, 3 mo. LIBOR + .02%, 4.88%, due 06/25/21 | 7,757,035 | |||||||||
| 8,514,043 | Keycorp Student Loan Trust, Series 05-A, Class 2A1, Variable Rate, 3 mo. LIBOR + .05%, 4.91%, due 09/27/21 | 8,373,987 | |||||||||
| 6,461,830 | Montana Higher Education Student Assistance Corp., Series 05-1, Class A, Variable Rate, 3 mo. LIBOR + .04%, 4.97%, due 06/20/15 | 6,383,642 | |||||||||
| 21,000,000 | National Collegiate Student Loan Trust, Series 06-1, Class A2, Variable Rate, 1 mo. LIBOR + .14%, 3.26%, due 08/25/23 | 20,084,531 | |||||||||
| 23,468,924 | National Collegiate Student Loan Trust, Series 06-A, Class A1, 144A, Variable Rate, 1 mo. LIBOR + .08%, 3.20%, due 08/26/19 | 22,694,449 | |||||||||
| 20,000,000 | Nelnet Education Loan Funding, Inc., Series 04-2A, Class A3, Variable Rate, 3 mo. LIBOR + .10%, 3.19%, due 11/25/15 | 19,792,600 | |||||||||
| 37,000,000 | Nelnet Student Loan Trust, Series 05-3, Class A3, Variable Rate, 3 mo. LIBOR + .05%, 4.93%, due 06/22/17 | 36,739,844 | |||||||||
| 26,425,826 | SLM Student Loan Trust, Series 05-1, Class A2, Variable Rate, 3 mo. LIBOR + .08%, 3.41%, due 04/27/20 | 25,368,793 | |||||||||
| 863,282 | SLM Student Loan Trust, Series 05-10, Class A2, Variable Rate, 3 mo. LIBOR + .01%, 3.34%, due 04/25/15 | 862,742 | |||||||||
| 17,000,000 | SLM Student Loan Trust, Series 05-3, Class A3, Variable Rate, 3 mo. LIBOR + .03%, 3.36%, due 07/25/16 | 16,490,000 | |||||||||
| 30,000,000 | SLM Student Loan Trust, Series 05-3, Class A4, Variable Rate, 3 mo. LIBOR + .07%, 3.40%, due 04/27/20 | 29,175,000 | |||||||||
| 36,000,000 | SLM Student Loan Trust, Series 06-A, Class A2, Variable Rate, 3 mo. LIBOR + .03%, 4.29%, due 10/15/15 | 35,640,000 | |||||||||
| 31,000,000 | SLM Student Loan Trust, Series 07-2, Class A2, Variable Rate, 3 mo. LIBOR, 3.33%, due 07/25/17 | 30,418,750 | |||||||||
See accompanying notes to the financial statements.
25
GMO Short-Duration Collateral Fund
(A Series of GMO Trust)
Schedule of Investments — (Continued)
(showing percentage of total net assets)
February 29, 2008
| Par Value ($) | Description | Value ($) | |||||||||
| Student Loans — continued | |||||||||||
| 1,912,533 | SLM Student Loan Trust, Series 07-5, Class A1, Variable Rate, 3 mo. LIBOR - .01%, 3.32%, due 07/25/13 | 1,902,073 | |||||||||
| 7,500,000 | SLM Student Loan Trust, Series 07-6, Class A2, Variable Rate, 3 mo. LIBOR + .25%, 3.58%, due 01/25/19 | 7,311,000 | |||||||||
| 19,325,099 | SLM Student Loan Trust, Series 07-A, Class A1, Variable Rate, 3 mo. LIBOR, 5.02%, due 09/15/22 | 18,358,844 | |||||||||
| Total Student Loans | 373,039,966 | ||||||||||
| Trade Receivables — 0.9% | |||||||||||
| 55,000,000 | ABS Global Finance Plc, Series 06-1A, Class A1, 144A, Variable Rate, 1 mo. LIBOR + .10%, 2.92%, due 12/17/10 | 54,087,000 | |||||||||
| 13,000,000 | SSCE Funding LLC, Series 04-1A, Class A, 144A, Variable Rate, 1 mo. LIBOR + .23%, 3.35%, due 11/15/10 | 11,960,000 | |||||||||
| Total Trade Receivables | 66,047,000 | ||||||||||
| Total Asset-Backed Securities | 6,844,840,762 | ||||||||||
| Corporate Debt — 0.7% | |||||||||||
| JPY | 3,000,000,000 | MBIA Global Funding LLC, Series EMTN, Variable Rate, JPY LIBOR, 1.03%, due 06/30/08 | 28,602,368 | ||||||||
| 22,000,000 | TIAA Global Markets, 144A, Variable Rate, 3 mo. LIBOR + .10%, 4.48%, due 01/12/11 | 21,789,052 | |||||||||
| Total Corporate Debt | 50,391,420 | ||||||||||
| U.S. Government — 0.2% | |||||||||||
| 3,000,000 | U.S. Treasury Note, 4.63%, due 03/31/08 (a) | 2,999,175 | |||||||||
| 5,000,000 | U.S. Treasury Note, 3.13%, due 09/15/08 (a) | 5,035,156 | |||||||||
| 9,000,000 | U.S. Treasury Note, 2.63%, due 05/15/08 (a) | 9,012,656 | |||||||||
| Total U.S. Government | 17,046,987 | ||||||||||
| U.S. Government Agency — 0.9% | |||||||||||
| 10,928,000 | Agency for International Development Floater (Support of Tunisia), Variable Rate, 6 mo. LIBOR, 3.00%, due 07/01/23 | 10,859,809 | |||||||||
| 804,356 | Agency for International Development Floater (Support of Honduras), Variable Rate, 3 mo. U.S. Treasury Bill x 117%, 4.11%, due 10/01/11 | 799,833 | |||||||||
See accompanying notes to the financial statements.
26
GMO Short-Duration Collateral Fund
(A Series of GMO Trust)
Schedule of Investments — (Continued)
(showing percentage of total net assets)
February 29, 2008
| Par Value ($) / Shares | Description | Value ($) | |||||||||
| U.S. Government Agency — continued | |||||||||||
| 14,250,000 | Agency for International Development Floater (Support of Morocco), Variable Rate, 6 mo. LIBOR + .15%, 3.15%, due 10/29/26 | 14,232,330 | |||||||||
| 600,000 | Agency for International Development Floater (Support of Belize), Variable Rate, 6 mo. U.S. Treasury Bill + .50%, 2.63%, due 01/01/14 | 600,006 | |||||||||
| 666,668 | Agency for International Development Floater (Support of Zimbabwe), Variable Rate, 3 mo. U.S. Treasury Bill x 115%, 4.04%, due 01/01/12 | 659,585 | |||||||||
| 371,085 | Agency for International Development Floater (Support of Peru), Series A, Variable Rate, 6 mo. U.S. Treasury Bill + .35%, 2.48%, due 05/01/14 | 369,233 | |||||||||
| 1,049,886 | Agency for International Development Floater (Support of Peru), Series A, Variable Rate, 6 mo. U.S. Treasury Bill +.35%, 2.48%, due 05/01/14 | 1,044,647 | |||||||||
| 14,250,000 | Agency for International Development Floater (Support of India), Variable Rate, 3 mo. LIBOR + .10%, 3.34%, due 02/01/27 | 14,161,080 | |||||||||
| 2,087,500 | Agency for International Development Floater (Support of C.A.B.E.I.), Variable Rate, 6 mo. U.S. Treasury Bill + .40%, 2.53%, due 10/01/12 | 2,082,302 | |||||||||
| 784,560 | Agency for International Development Floater (Support of Morocco), Variable Rate, 6 mo. U.S. Treasury Bill + .45%, 2.58%, due 11/15/14 | 781,625 | |||||||||
| 3,615,987 | Agency for International Development Floater (Support of Jamaica), Variable Rate, 6 mo. U.S. Treasury Bill + .75%, 2.88%, due 03/30/19 | 3,631,861 | |||||||||
| 17,000,000 | Agency for International Development Floater (Support of Morocco), Variable Rate, 6 mo. LIBOR - .015%, 2.98%, due 02/01/25 | 16,798,142 | |||||||||
| Total U.S. Government Agency | 66,020,453 | ||||||||||
| TOTAL DEBT OBLIGATIONS (COST $7,456,658,419) | 6,978,299,622 | ||||||||||
| SHORT-TERM INVESTMENTS — 9.0% | |||||||||||
| Money Market Funds — 1.6% | |||||||||||
| 121,924,841 | State Street Institutional Liquid Reserves Fund-Institutional Class | 121,924,841 | |||||||||
| Other Short-Term Investments — 7.4% | |||||||||||
| 50,000,000 | Amsterdam Funding Corp. Commercial Paper, 3.22%, due 03/10/08 | 49,959,750 | |||||||||
| 75,000,000 | Barton Capital Commercial Paper, 3.27%, due 03/14/08 | 74,911,437 | |||||||||
| 34,279,000 | Kittyhawk Funding Corp. Commercial Paper, 3.27%, due 03/19/08 | 34,222,954 | |||||||||
| 25,000,000 | Liberty Funding LLC Commercial Paper, 3.25%, due 03/07/08 | 24,986,458 | |||||||||
| 50,000,000 | Liberty Funding LLC Commercial Paper, 3.35%, due 03/25/08 | 49,888,333 | |||||||||
| 75,000,000 | Nieuw Amsterdam Receivables Commercial Paper, 3.25%, due 03/18/08 | 74,884,896 | |||||||||
See accompanying notes to the financial statements.
27
GMO Short-Duration Collateral Fund
(A Series of GMO Trust)
Schedule of Investments — (Continued)
(showing percentage of total net assets)
February 29, 2008
| Par Value ($) | Description | Value ($) | |||||||||
| Other Short-Term Investments — continued | |||||||||||
| 30,000,000 | Nieuw Amsterdam Receivables Commercial Paper, 3.30%, due 03/12/08 | 29,969,750 | |||||||||
| 100,000,000 | Nieuw Amsterdam Receivables Commercial Paper, 3.40%, due 03/03/08 | 99,981,111 | |||||||||
| 30,333,000 | Old Line Funding LLC Commercial Paper, 3.25%, due 03/03/08 | 30,327,523 | |||||||||
| 18,706,000 | Old Line Funding LLC Commercial Paper, 3.30%, due 03/17/08 | 18,678,565 | |||||||||
| 75,000,000 | Sheffield Receivables Commercial Paper, 3.25%, due 03/06/08 | 74,966,146 | |||||||||
| 2,000,000 | U.S. Treasury Bill, 1.78%, due 05/22/08 (b) | 1,991,956 | |||||||||
| 5,000,000 | U.S. Treasury Bill, 1.79%, due 07/24/08 (b) | 4,964,645 | |||||||||
| Total Other Short-Term Investments | 569,733,524 | ||||||||||
| TOTAL SHORT-TERM INVESTMENTS (COST $691,643,575) | 691,658,365 | ||||||||||
| TOTAL INVESTMENTS — 100.0% (Cost $8,148,301,994) | 7,669,957,987 | ||||||||||
| Other Assets and Liabilities (net) — 0.0% | 1,456,776 | ||||||||||
| TOTAL NET ASSETS — 100.0% | $ | 7,671,414,763 | |||||||||
See accompanying notes to the financial statements.
28
GMO Short-Duration Collateral Fund
(A Series of GMO Trust)
Schedule of Investments — (Continued)
February 29, 2008
A summary of outstanding financial instruments at February 29, 2008 is as follows:
Forward Currency Contracts
| Settlement Date | Deliver | Units of Currency | Value | Net Unrealized Appreciation (Depreciation) | |||||||||||||||
| Sales | |||||||||||||||||||
| 3/25/08 | GBP | 10,000,000 | $ | 19,843,200 | $ | (185,200 | ) | ||||||||||||
| 4/22/08 | JPY | 2,988,000,000 | 28,845,761 | (1,071,082 | ) | ||||||||||||||
| $ | (1,256,282 | ) | |||||||||||||||||
Futures Contracts
| Number of Contracts | Type | Expiration Date | Contract Value | Net Unrealized Appreciation (Depreciation) | |||||||||||||||
| Sales | |||||||||||||||||||
| 579 | U.S. Treasury Note 5 Yr. (CBT) | June 2008 | $ | 66,150,750 | $ | (892,437 | ) | ||||||||||||
Swap Agreements
Credit Default Swaps
| Notional Amount | Expiration Date | Counterparty | Receive (Pay) | Annual Premium | Deliverable On Default | Market Value | |||||||||||||||||||||||||
| 60,000,000 | USD | 9/20/2010 | Morgan Stanley | Receive | 0.40 | % | Credit Swap | $ | (4,536,284 | ) | |||||||||||||||||||||
| Capital Services Inc. | Eagle Creek CDO | ||||||||||||||||||||||||||||||
| 31,000,000 | USD | 3/20/2013 | Morgan Stanley Capital Services Inc. | Receive | 0.25 | % | MS Synthetic 2006-1 | (4,453,652 | ) | ||||||||||||||||||||||
| 28,000,000 | USD | 3/20/2015 | Lehman Brothers | Receive | 0.88 | % | Credit Swap AAA CDO | (6,671,404 | ) | ||||||||||||||||||||||
| Premiums to (Pay) Receive | $ | — | $ | (15,661,340 | ) | ||||||||||||||||||||||||||
See accompanying notes to the financial statements.
29
GMO Short-Duration Collateral Fund
(A Series of GMO Trust)
Schedule of Investments — (Continued)
February 29, 2008
Interest Rate Swaps
| Notional Amount | Expiration Date | Counterparty | Receive (Pay) | Fixed Rate | Variable Rate | Market Value | |||||||||||||||||||||||||
| 45,000,000 | USD | 3/4/2008 | JP Morgan | (Pay) | 3.10 | % | 3 month LIBOR | $ | 123,953 | * | |||||||||||||||||||||
| Chase Bank | |||||||||||||||||||||||||||||||
| 40,000,000 | USD | 1/24/2011 | Goldman Sachs | (Pay) | 6.07 | % | 3 month LIBOR | 1,219,090 | ** | ||||||||||||||||||||||
| 30,000,000 | USD | 2/7/2012 | Deutsche Bank AG | (Pay) | 4.33 | % | 3 month LIBOR | (1,426,254 | ) | ||||||||||||||||||||||
| 38,100,000 | USD | 2/24/2013 | JP Morgan | (Pay) | 4.54 | % | 3 month LIBOR | (1,660,431 | )* | ||||||||||||||||||||||
| Chase Bank | |||||||||||||||||||||||||||||||
| Premiums to (Pay) Receive | $ | — | $ | (1,743,642 | ) | ||||||||||||||||||||||||||
* Excludes unrealized losses of $513,041 incurred by GMO Alpha LIBOR Fund prior to transfer to the Fund on March 31, 2004.
** Excludes unrealized losses of $4,887,149 incurred by GMO Alpha LIBOR Fund prior to transfer to the Fund on November 27, 2002.
As of February 29, 2008, for the futures and/or swap contracts held, the Fund had sufficient cash and/or securities to cover any commitments or margin requirements of the relevant broker or exchange.
Notes to Schedule of Investments:
144A - Securities exempt from registration under Rule 144A of the Securities Act of 1933. These securities may be resold in transactions exempt from registration, normally to qualified institutional investors.
ACES - Aerolineas Centrales de Colombia
AMBAC - Insured as to the payment of principal and interest by AMBAC Assurance Corporation.
C.A.B.E.I. - Central American Bank of Economic Integration
CapMAC - Insured as to the payment of principal and interest by Capital Markets Assurance Corporation.
CDO - Collateralized Debt Obligation
CMBS - Collateralized Mortgage Backed Security
EMTN - Euromarket Medium Term Note
FGIC - Insured as to the payment of principal and interest by Financial Guaranty Insurance Corporation.
FSA - Insured as to the payment of principal and interest by Financial Security Assurance.
LIBOR - London Interbank Offered Rate
MBIA - Insured as to the payment of principal and interest by MBIA Insurance Corp.
RMAC - Residential Mortgage Acceptance Corp.
See accompanying notes to the financial statements.
30
GMO Short-Duration Collateral Fund
(A Series of GMO Trust)
Schedule of Investments — (Continued)
February 29, 2008
RMBS - Residential Mortgage Backed Security
Variable rate - The rates shown on variable rate notes are the current interest rates at February 29, 2008, which are subject to change based on the terms of the security.
XL - Insured as to the payment of principal and interest by XL Capital Assurance.
(a) All or a portion of this security has been segregated to cover margin requirements on open financial futures contracts and/or collateral on open swap contracts (Note 2).
(b) Rate shown represents yield-to-maturity.
Currency Abbreviations:
GBP - British Pound
JPY - Japanese Yen
USD - United States Dollar
See accompanying notes to the financial statements.
31
GMO Short-Duration Collateral Fund
(A Series of GMO Trust)
Statement of Assets and Liabilities — February 29, 2008
| Assets: | |||||||
| Investments, at value (cost $8,148,301,994) (Note 2) | $ | 7,669,957,987 | |||||
| Receivable for Fund shares sold | 16,350,000 | ||||||
| Interest receivable | 20,512,341 | ||||||
| Receivable for open swap contracts (Note 2) | 15,848 | ||||||
| Receivable for expenses reimbursed by Manager (Note 3) | 96,890 | ||||||
| Total assets | 7,706,933,066 | ||||||
| Liabilities: | |||||||
| Payable for Fund shares repurchased | 10,300,000 | ||||||
| Payable to affiliate for (Note 3): | |||||||
| Trustees and Chief Compliance Officer of GMO Trust fees | 8,690 | ||||||
| Unrealized depreciation on open forward currency contracts (Note 2) | 1,256,282 | ||||||
| Interest payable for open swap contracts | 133,968 | ||||||
| Payable for open swap contracts (Note 2) | 22,821,020 | ||||||
| Payable for variation margin on open futures contracts (Note 2) | 615,188 | ||||||
| Accrued expenses | 383,155 | ||||||
| Total liabilities | 35,518,303 | ||||||
| Net assets | $ | 7,671,414,763 | |||||
| Net assets consist of: | |||||||
| Paid-in capital | $ | 8,162,231,630 | |||||
| Accumulated undistributed net investment income | 44,272,074 | ||||||
| Accumulated net realized loss | (37,186,473 | ) | |||||
| Net unrealized depreciation | (497,902,468 | ) | |||||
| $ | 7,671,414,763 | ||||||
| Net assets attributable to: | $ | 7,671,414,763 | |||||
| Shares outstanding: | 319,302,054 | ||||||
| Net asset value per share: | $ | 24.03 | |||||
See accompanying notes to the financial statements.
32
GMO Short-Duration Collateral Fund
(A Series of GMO Trust)
Statement of Operations — Year Ended February 29, 2008
| Investment Income: | |||||||
| Interest | $ | 411,292,442 | |||||
| Dividends | 2,197,347 | ||||||
| Total investment income | 413,489,789 | ||||||
| Expenses: | |||||||
| Custodian, fund accounting agent and transfer agent fees | 819,209 | ||||||
| Audit and tax fees | 64,917 | ||||||
| Legal fees | 200,064 | ||||||
| Trustees fees and related expenses (Note 3) | 72,655 | ||||||
| Miscellaneous | 68,199 | ||||||
| Total expenses | 1,225,044 | ||||||
| Fees and expenses reimbursed by Manager (Note 3) | (1,090,039 | ) | |||||
| Expense reductions (Note 2) | (17,498 | ) | |||||
| Net expenses | 117,507 | ||||||
| Net investment income (loss) | 413,372,282 | ||||||
| Realized and unrealized gain (loss): | |||||||
| Net realized gain (loss) on: | |||||||
| Investments | 3,932,724 | ||||||
| Closed futures contracts | (5,787,157 | ) | |||||
| Closed swap contracts | 3,081,467 | ||||||
| Foreign currency, forward contracts and foreign currency related transactions | (3,242,428 | ) | |||||
| Net realized gain (loss) | (2,015,394 | ) | |||||
| Change in net unrealized appreciation (depreciation) on: | |||||||
| Investments | (487,034,708 | ) | |||||
| Open futures contracts | 36,846 | ||||||
| Open swap contracts | (26,083,894 | ) | |||||
| Foreign currency, forward contracts and foreign currency related transactions | 85,048 | ||||||
| Net unrealized gain (loss) | (512,996,708 | ) | |||||
| Net realized and unrealized gain (loss) | (515,012,102 | ) | |||||
| Net increase (decrease) in net assets resulting from operations | $ | (101,639,820 | ) | ||||
See accompanying notes to the financial statements.
33
GMO Short-Duration Collateral Fund
(A Series of GMO Trust)
Statement of Changes in Net Assets
| Year Ended February 29, 2008 | Year Ended February 28, 2007 | ||||||||||
| Increase (decrease) in net assets: | |||||||||||
| Operations: | |||||||||||
| Net investment income (loss) | $ | 413,372,282 | $ | 320,575,277 | |||||||
| Net realized gain (loss) | (2,015,394 | ) | (6,328,968 | ) | |||||||
| Change in net unrealized appreciation (depreciation) | (512,996,708 | ) | 10,162,741 | ||||||||
| Net increase (decrease) in net assets from operations | (101,639,820 | ) | 324,409,050 | ||||||||
| Distributions to shareholders from: | |||||||||||
| Net investment income | (418,731,518 | ) | (323,728,016 | ) | |||||||
| Net share transactions (Note 7): | 1,588,185,799 | 2,122,606,885 | |||||||||
| Total increase (decrease) in net assets | 1,067,814,461 | 2,123,287,919 | |||||||||
| Net assets: | |||||||||||
| Beginning of period | 6,603,600,302 | 4,480,312,383 | |||||||||
| End of period (including accumulated undistributed net investment income of $44,272,074 and $52,429,506, respectively) | $ | 7,671,414,763 | $ | 6,603,600,302 | |||||||
See accompanying notes to the financial statements.
34
GMO Short-Duration Collateral Fund
(A Series of GMO Trust)
Financial Highlights
(For a share outstanding throughout each period)
| Year Ended February 28/29, | |||||||||||||||||||||||
| 2008 | 2007 | 2006 | 2005 | 2004 | |||||||||||||||||||
| Net asset value, beginning of period | $ | 25.66 | $ | 25.60 | $ | 25.33 | $ | 25.18 | $ | 25.01 | |||||||||||||
| Income (loss) from investment operations: | |||||||||||||||||||||||
| Net investment income (loss)† | 1.38 | 1.43 | 1.01 | 0.59 | 0.56 | ||||||||||||||||||
| Net realized and unrealized gain (loss) | (1.64 | ) | 0.00 | (a) | (0.03 | ) | (0.09 | ) | 0.06 | (b) | |||||||||||||
| Total from investment operations | (0.26 | ) | 1.43 | 0.98 | 0.50 | 0.62 | |||||||||||||||||
| Less distributions to shareholders: | |||||||||||||||||||||||
| From net investment income | (1.37 | ) | (1.37 | ) | (0.71 | ) | (0.34 | ) | (0.45 | ) | |||||||||||||
| From net realized gains | — | — | — | (0.01 | ) | — | |||||||||||||||||
| Total distributions | (1.37 | ) | (1.37 | ) | (0.71 | ) | (0.35 | ) | (0.45 | ) | |||||||||||||
| Net asset value, end of period | $ | 24.03 | $ | 25.66 | $ | 25.60 | $ | 25.33 | $ | 25.18 | |||||||||||||
| Total Return(c) | (1.14 | )% | 5.68 | % | 3.89 | % | 2.01 | % | 2.48 | % | |||||||||||||
| Ratios/Supplemental Data: | |||||||||||||||||||||||
| Net assets, end of period (000's) | $ | 7,671,415 | $ | 6,603,600 | $ | 4,480,312 | $ | 3,483,889 | $ | 1,751,535 | |||||||||||||
| Net operating expenses to average daily net assets(d) | 0.00 | % | 0.00 | % | 0.00 | % | 0.00 | % | 0.00 | % | |||||||||||||
| Interest expense to average daily net assets | — | 0.01 | % | 0.02 | % | — | 0.00 | %(f) | |||||||||||||||
| Total net expenses to average daily net assets | 0.00 | %(e) | 0.01 | % | 0.02 | % | 0.00 | %(g) | 0.00 | %(g) | |||||||||||||
| Net investment income to average daily net assets | 5.41 | % | 5.50 | % | 3.96 | % | 2.31 | % | 2.51 | % | |||||||||||||
| Portfolio turnover rate | 27 | % | 68 | % | 45 | % | 34 | % | 33 | % | |||||||||||||
| Fees and expenses reimbursed by the Manager to average daily net assets: | 0.01 | % | 0.02 | % | 0.02 | % | 0.02 | % | 0.02 | % | |||||||||||||
(a) Net realized and unrealized gain (loss) was less than $0.01 per shares.
(b) The amount shown for a share outstanding does not correspond with the aggregate net realized and unrealized gain/loss for the period due to the timing of purchases and redemptions of Fund shares in relation to the fluctuating market values of the Fund.
(c) The total returns would have been lower had certain expenses not been reimbursed during the periods shown and assumes the effect of reinvested distributions.
(d) Net operating expenses were less than 0.01% to average daily net assets.
(e) The net expense ratio does not include the effect of expense reductions.
(f) Interest expense was less than 0.01% to average daily net assets.
(g) Total net expenses were less than 0.01% to average daily net assets.
† Calculated using average shares outstanding throughout the period.
See accompanying notes to the financial statements.
35
GMO Short-Duration Collateral Fund
(A Series of GMO Trust)
Notes to Financial Statements
February 29, 2008
1. Organization
GMO Short-Duration Collateral Fund (the "Fund") is a series of GMO Trust (the "Trust"). The Fund is registered under the Investment Company Act of 1940, as amended, as an open-end, non-diversified management investment company. The Fund is advised and managed by Grantham, Mayo, Van Otterloo & Co. LLC (the "Manager" or "GMO"). The Trust was established as a Massachusetts business trust under the laws of the Commonwealth of Massachusetts on June 24, 1985. The Declaration of Trust permits the Trustees of the Trust ("Trustees") to create an unlimited number of series of shares ("Funds") and to subdivide Funds into classes.
The Fund seeks total return greater than that of the JPMorgan U.S. 3 Month Cash Index. The Fund seeks to achieve its investment objective by investing primarily in high quality U.S. and foreign floating rate fixed income securities. Fixed income securities in which the Fund invests include securities issued by a wide range of private issuers and, to a lesser extent, securities issued by federal, state, local, and foreign governments (including securities neither guaranteed nor insured by the U.S. government). The Fund may invest a substantial portion of its assets in asset-backed securities, including, but not limited to, securities backed by pools of residential and commercial mortgages, credit-card receivables, home equity loans, automobile loans, educational loans, corporate and sovereign bonds, and bank loans made to corporations. In addition, the Fund may invest in government securities, corporate debt securities, money mar ket instruments, and commercial paper, and enter into credit default swaps, reverse repurchase agreements, and repurchase agreements. The Fund also may use exchange-traded and over-the-counter ("OTC") derivatives, including swap contracts, futures contracts, options on futures, options on swaps (or "swaptions"), and other types of options, and forward currency contracts. The Fund's fixed income securities primarily have floating interest rates (or may be hedged using derivatives to convert the fixed rate interest payments into floating rate interest payments), but may also include all types of interest rate, payment, and reset terms, including fixed rate, zero coupon, contingent, deferred, and payment-in-kind features. From time to time, the Fund may hold fixed income securities that are rated below investment grade.
Shares of the Fund are not publicly offered and are principally available only to other funds of the Trust and certain accredited investors.
2. Significant accounting policies
The following is a summary of significant accounting policies which are in conformity with accounting principles generally accepted in the United States of America ("U.S. GAAP") and which are consistently followed by the Fund in the preparation of its financial statements. The preparation of financial statements in accordance with U.S. GAAP requires management to make estimates and assumptions that affect the reported amounts and disclosures in the financial statements. Actual results could differ from those estimates. The accounting records of the Fund are maintained in U.S. dollars.
36
GMO Short-Duration Collateral Fund
(A Series of GMO Trust)
Notes to Financial Statements — (Continued)
February 29, 2008
Portfolio valuation
Securities listed on a securities exchange for which market quotations are readily available are valued at the last sale price or official closing price on each business day, or if there is no such reported sale or official closing price, at the most recent quoted bid price. Unlisted securities for which market quotations are readily available are generally valued at the most recent quoted bid price. Short-term investments with a remaining maturity of sixty days or less are generally valued at amortized cost, which approximates fair value. Shares of investment funds are valued at their net asset value. Securities for which quotations are not readily available or whose values the Manager has determined to be unreliable are valued at fair value as determined in good faith by the Trustees or other persons acting at their direction pursuant to procedures approved by the Trustees. By its nature, a fair value price is a good faith est imate of the value of a security at a given point in time and may not reflect the value that would be realized if the security was sold and the differences could be material.
Fixed income securities held by the Fund or the underlying funds are typically valued pursuant to prices supplied by a primary pricing source chosen by the Manager. The Manager evaluates such primary pricing sources on an ongoing basis, and may change a pricing source should it deem it appropriate. The Manager, at its discretion, may override a price supplied by a primary source by using a price provided by another source if such action is deemed appropriate. The prices provided by such primary pricing sources may differ from the value that would be realized if the securities were sold and the differences could be material.
Certain securities held by the Fund are valued on the basis of a price provided by a single source. The prices provided may differ from the value that would be realized if the securities were sold and the differences could be material. As of February 29, 2008, the total value of these securities represented 32.05% of net assets.
The Fund invests in securities with contractual cash flows, such as asset-backed securities, collateralized mortgage obligations and commercial mortgage backed securities, including securities backed by subprime mortgage loans. The value, liquidity and related income of these securities are sensitive to changes in economic conditions, including real estate values, delinquencies and/or defaults, and may be adversely affected by shifts in the market's perception of the securities' market values and changes in interest rates.
Foreign currency translation
The market values of foreign securities, currency holdings and other assets and liabilities are translated to U.S. dollars based on the current exchange rates each business day. Income and expenses denominated in foreign currencies are translated at current exchange rates when accrued or incurred. The Fund does not isolate realized and unrealized gains and losses attributable to changes in exchange rates from gains and losses that arise from changes in the market value of investments. Such fluctuations are included with net realized and unrealized gain or loss on investments. Net realized gains and losses on foreign currency transactions represent gains and losses on disposition of currencies and forward currency contracts,
37
GMO Short-Duration Collateral Fund
(A Series of GMO Trust)
Notes to Financial Statements — (Continued)
February 29, 2008
currency gains and losses realized between the trade and settlement dates on securities transactions, and the difference between the amount of investment income and foreign withholding taxes recorded on the Fund's accounting records and the U.S. dollar equivalent amounts actually received or paid.
Forward currency contracts
The Fund may enter into forward currency contracts including forward cross currency contracts. A forward currency contract is an agreement between two parties to buy and sell a currency at a set price on a future date. The market value of a forward currency contract fluctuates with changes in forward currency exchange rates. Forward currency contracts are marked to market daily using rates supplied by a quotation service and changes in value are recorded by the Fund as an unrealized gain or loss. Realized gains or losses equal to the difference between the value of the contract at the time it was opened and the value at the time it was closed are recorded upon delivery or receipt of the currency or, if a forward currency contract is offset by entering into another forward currency contract with the same broker, upon settlement of the net gain or loss. These contracts may involve market risk in excess of the unrealized gain or lo ss reflected in the Fund's Statement of Assets and Liabilities. In addition, the Fund could be exposed to risk if the counterparties are unable to meet the terms of the contracts or if there are movements in currency values that are unfavorable to the Fund. Forward currency contracts outstanding at the end of the period are listed in the Fund's Schedule of Investments.
Futures contracts
The Fund may purchase and sell futures contracts. Upon entering into a futures contract, the Fund is required to deposit with the futures clearing broker an amount of cash, U.S. government and agency obligations, or other liquid assets in accordance with the initial margin requirements of the broker or exchange. In addition, the Fund maintains cash or securities in an amount that at least equals the net amount payable in the event the Fund must deliver the full amount of the contracts. Futures contracts are marked to market daily and an appropriate payable or receivable for the change in value ("variation margin") is recorded by the Fund. The payable or receivable is liquidated on the following business day. Gains or losses are recognized but not considered realized until the contracts expire or are closed. Futures contracts involve, to varying degrees, risk of loss in excess of the variation margin disclosed in the Statement of Assets and Liabilities. Under certain circumstances, futures exchanges may establish daily limits on the amount that the price of a futures contract can vary from the previous day's settlement price, thereby effectively preventing liquidation of unfavorable positions. Losses may arise from changes in the value of the underlying instrument if the Fund is unable to liquidate a futures position due to an illiquid secondary market for the contracts or the imposition of price limits, or if counterparties do not perform under the contract terms. Futures contracts are generally valued at the settlement price established each day by the board of trade or exchange on which they are traded. Futures contracts outstanding at the end of the period are listed in the Fund's Schedule of Investments.
38
GMO Short-Duration Collateral Fund
(A Series of GMO Trust)
Notes to Financial Statements — (Continued)
February 29, 2008
Options
The Fund may write call and put options. Writing options increases the Fund's exposure to the underlying instrument by, in the case of a call option, obligating the Fund to sell the underlying instrument at a set price to the option-holder and, in the case of a put option, obligating the Fund to purchase the underlying instrument at a set price from the option-holder. When the Fund writes a call or put option, an amount equal to the premium received is recorded as a liability and subsequently marked to market to reflect the current value of the option written. Premiums received from writing options which expire are treated as realized gains. Premiums received from writing options which are exercised or closed are added to the proceeds or offset against the amounts paid on the underlying future, security or currency transaction to determine the realized gain or loss. The Fund as a writer of an option has no control over whether t he underlying future, security or currency may be sold (call) or purchased (put) and as a result bears the market risk of an unfavorable change in the price of the future, security or currency underlying the written option. In the event that the Fund writes uncovered call options (i.e. options for investments that the Fund does not own), it bears the risk of incurring substantial losses if the price of the underlying instrument increases during the term of the option. There is the risk the Fund may not be able to enter into a closing transaction because of an illiquid market. There were no open written option contracts during the period.
The Fund may also purchase put and call options. Purchasing options alters the Fund's exposure to the underlying instrument by, in the case of a call option, entitling the Fund to purchase the underlying instrument at a set price from the writer of the option and, in the case of a put option, entitling the Fund to sell the underlying instrument at a set price to the writer of the option. The Fund pays a premium as a cost for a purchased option disclosed in the Schedule of Investments which is subsequently marked to market to reflect the current value of the option. Premiums paid for purchasing options which expire are treated as realized losses. Premiums paid for purchasing options which are exercised or closed are added to the amounts paid or offset against the proceeds on the closing transaction to determine the realized gain or loss. The risk associated with purchasing put and call options is limited to the premium paid. Ther e were no purchased option contracts outstanding at the end of the period.
Exchange traded options are valued at the last sale price, or if no sale is reported, the last bid price for purchased options and the last ask price for written options. Options traded over-the-counter are valued using prices supplied by a primary pricing source chosen by the Manager.
Loan agreements
The Fund may invest in direct debt instruments which are interests in amounts owed by a corporate, governmental, or other borrower to lenders or lending syndicates. The Fund's investments in loans may be in the form of participations in loans or assignments of all or a portion of loans from third parties. A loan is often administered by a bank or other financial institution (the "lender") that acts as agent for all holders. The agent administers the terms of the loan, as specified in the loan agreement. When investing in a loan participation, the Fund has the right to receive payments of principal, interest and any fees to which it is entitled only from the lender selling the loan agreement and only upon receipt by the lender of
39
GMO Short-Duration Collateral Fund
(A Series of GMO Trust)
Notes to Financial Statements — (Continued)
February 29, 2008
payments from the borrower. The Fund generally has no right to enforce compliance with the terms of the loan agreement with the borrower. As a result, the Fund may be subject to the credit risk of both the borrower and the lender that is selling the loan agreement. When the Fund purchases assignments from lenders it acquires direct rights against the borrower on the loan. There were no loan agreements outstanding at the end of the period.
Indexed securities
The Fund may invest in indexed securities where the redemption values and/or coupons are linked to the prices of a specific instrument or financial statistic. The Fund uses indexed securities to increase or decrease its exposure to different underlying instruments and to gain exposure to markets in which it may be difficult to invest through conventional securities. Indexed securities may be more volatile than their underlying instruments, but any loss is limited to the amount of the original investment. There were no indexed securities held by the Fund at the end of the period.
Swap agreements
The Fund may enter into swap agreements. A swap is an agreement to exchange the return generated by one instrument for the return generated by another instrument. Interest rate swap agreements involve the exchange by one party with another party of their respective commitments to pay or receive interest, e.g., an exchange of floating rate payments for fixed rate payments with respect to a notional amount of principal. Total return swap agreements involve a commitment by one party in the agreement to pay interest in exchange for a market-linked return, both based on notional amounts. To the extent the total return of the security or index underlying the transaction exceeds or falls short of the offsetting interest rate obligation, the party will receive a payment from or make a payment to the counterparty, respectively. Forward spread lock swap agreements involve commitments to pay or receive a settlement amount calculated as the difference between the swap spread and a fixed spread, multiplied by the notional amount times the duration of the swap rate. The swap spread is the difference between the benchmark swap rate (market rate) and the specific treasury rate. In a credit default swap, one party makes a stream of payments to another party in exchange for the right to receive a specified return in the event of a default by a third party on its obligation. Credit default swaps may be used to provide a measure of protection against defaults of sovereign or corporate issuers (i.e., to reduce risk where a party owns or has exposure to the issuer) or to take an active long or short position with respect to the likelihood of a particular issuer's default. Variance swap agreements involve commitments to pay or receive a settlement amount calculated as the difference between the annualized realized variance of returns on the underlying price and a fixed quantity, also known as the variance strike, over a period of time. In connection with these agreements, cash or securities may be set aside as collateral by the Fund's custodian or brokers in accordance with the terms of the swap agreement. The Fund earns or pays interest on cash set aside as collateral.
Swaps are marked to market daily using models that incorporate quotations from market makers and the change in value, if any, is recorded as unrealized gain or loss in the Statement of Operations. Payments received or made on swap contracts are recorded as realized gain or loss in the Statement of Operations.
40
GMO Short-Duration Collateral Fund
(A Series of GMO Trust)
Notes to Financial Statements — (Continued)
February 29, 2008
Gains or losses are realized upon early termination of the swap agreements. These financial instruments are not actively traded on financial markets. The values assigned to these instruments are based upon the best available information and because of the uncertainty of the valuation, these values may differ significantly from the values that would have been realized had a ready market for these instruments existed, and the differences could be material. Entering into these agreements involves, to varying degrees, elements of credit, legal, market and documentation risk in excess of the amounts recognized in the Statement of Assets and Liabilities. Such risks involve the possibility that there will be no liquid market for these agreements, that the counterparties to the agreements may default on their obligations to perform or disagree as to the meaning of contractual terms in the agreements, or that there may be unfavorable cha nges in interest rates or the price of the index or security underlying these transactions. Swap agreements outstanding at the end of the period are listed in the Fund's Schedule of Investments.
Repurchase agreements
The Fund may enter into repurchase agreements with banks and broker-dealers whereby the Fund acquires a security for cash and obtains a simultaneous commitment from the seller to repurchase the security at an agreed upon price and date. The Fund, through its custodian, takes possession of securities collateralizing the repurchase agreement. The collateral is marked to market daily to ensure that the market value of the underlying assets remains sufficient to protect the Fund in the event of default by the seller. Collateral for certain tri-party repurchase agreements is held at the counterparty's custodian in a segregated account for the benefit of the Fund and the counterparty. In connection with transactions in repurchase agreements, if the seller defaults or enters into insolvency proceedings and the value of the collateral declines, recovery of cash by the Fund may be delayed or limited. There were no repurchase agreements o utstanding at the end of the period.
Reverse repurchase agreements
The Fund may enter into reverse repurchase agreements with banks and broker-dealers whereby the Fund sells portfolio assets concurrent with an agreement by the Fund to repurchase the same assets at a later date at a fixed price. In connection with these agreements, the Fund establishes segregated accounts with its custodian in which the Fund maintains cash, U.S. government securities or other assets equal in value to its obligations in respect of reverse repurchase agreements. Reverse repurchase agreements involve the risk that the market value of the securities the Fund has sold under the agreement may decline below the price at which the Fund is obligated to repurchase under the agreement. The market value of the securities the Fund has sold is determined daily and any additional required collateral is allocated to or sent by the Fund on the next business day. Interest expense incurred as a result of entering into reverse repu rchase agreements is included in the Fund's expenses. There were no reverse repurchase agreements outstanding at the end of the period.
Securities lending
The Fund may lend its securities to certain qualified broker-dealers. The loans are collateralized with cash or liquid securities with a market value at least equal to the market value of the securities on loan. As with
41
GMO Short-Duration Collateral Fund
(A Series of GMO Trust)
Notes to Financial Statements — (Continued)
February 29, 2008
other extensions of credit, the Fund may bear the risk of loss with respect to the investment of the collateral, the risk of delay in and/or inability to exercise its rights with respect to the collateral, and the risk of delay in recovery or loss of rights in the loaned securities should the borrower of the securities fail financially. If a loan is collateralized by U.S. government securities, the Fund receives a fee from the borrower. If a loan is collateralized by cash, the Fund typically invests the cash collateral for its own account in interest-bearing, short-term securities and pays a fee to the borrower that normally represents a portion of the Fund's earnings on the collateral. For the year ended February 29, 2008, the Fund did not participate in securities lending.
Taxes and distributions
The Fund intends to qualify each tax year as a regulated investment company under Subchapter M of the Internal Revenue Code of 1986, as amended (the "Code"). The Fund intends to distribute substantially all of its net investment income and net realized short-term and long-term capital gains, if any, after giving effect to any available capital loss carryovers for U.S. federal income tax purposes. Therefore, no provision for U.S. federal income or excise tax is necessary.
The Fund's policy is to declare and pay distributions from net investment income, if any, semiannually, and from net realized short-term and long-term capital gains, if any, at least annually. All distributions are paid in shares of the Fund, at net asset value, unless the shareholder elects to receive cash distributions. Distributions to shareholders are recorded by the Fund on the ex-dividend date.
Income and capital gain distributions are determined in accordance with U.S. federal income tax regulations, which may differ from U.S. GAAP. Certain capital accounts in the financial statements are periodically adjusted for permanent differences in order to reflect their tax character. These adjustments have no impact on net assets or net asset value per share. Temporary differences which arise from recognizing certain items of income, expense, gain or loss in different periods for financial statement and tax purposes will reverse at some time in the future. Distributions in excess of net investment income or net realized gains are temporary over distributions for financial statement purposes resulting from differences in the recognition or classification of income or distributions for financial statement and tax purposes.
U.S. GAAP and tax accounting differences primarily relate to derivative contract transactions, foreign currency transactions, differing treatment of accretion and amortization and capital loss carryforwards.
42
GMO Short-Duration Collateral Fund
(A Series of GMO Trust)
Notes to Financial Statements — (Continued)
February 29, 2008
The following reclassification represents the amount necessary to report the stated components of net assets on a tax basis, excluding certain temporary differences, as of February 29, 2008. The financial highlights exclude these adjustments.
| Accumulated Undistributed Net Investment Income | Accumulated Net Realized Loss | Paid-in Capital | |||||||||
| $ | (2,798,196 | ) | $ | 1,208,194 | $ | 1,590,002 | |||||
The tax character of distributions declared to shareholders is as follows:
| 2/29/2008 | 2/28/2007 | ||||||||||
| Ordinary income (including any short-term capital gains) | $ | 418,731,518 | $ | 323,728,016 | |||||||
| Total distributions | $ | 418,731,518 | $ | 323,728,016 | |||||||
Distributions in excess of tax basis earnings and profits, if significant, are reported in the financial statements as a tax return of capital.
As of February 29, 2008, the components of distributable earnings on a tax basis consisted of the following:
| Undistributed ordinary income | $ | 46,368,001 | |||||
As of February 29, 2008, the Fund elected to defer to March 1, 2008 post-October capital losses of $633,765.
As of February 29, 2008, the Fund had capital loss carryforwards available to offset future realized gains if any, to the extent permitted by the Code. Utilization of the capital loss carryforwards could be subject to limitations imposed by the Code related to share ownership activity. Such losses expire as follows:
| 2/28/2011 | $ | (29,576,884 | ) | ||||
| 2/29/2012 | (142,552 | ) | |||||
| 2/28/2014 | (614,650 | ) | |||||
| 2/28/2015 | (5,952,458 | ) | |||||
| 2/29/2016 | (1,158,601 | ) | |||||
| Total | $ | (37,445,145 | ) | ||||
43
GMO Short-Duration Collateral Fund
(A Series of GMO Trust)
Notes to Financial Statements — (Continued)
February 29, 2008
As of February 29, 2008, the approximate cost for U.S. federal income tax purposes and gross and net unrealized appreciation and depreciation in value of investments were as follows:
| Aggregate Cost | Gross Unrealized Appreciation | Gross Unrealized (Depreciation) | Net Unrealized Appreciation (Depreciation) | ||||||||||||
| $ | 8,148,649,258 | $ | 5,265,256 | $ | (483,956,527 | ) | $ | (478,691,271 | ) | ||||||
Security transactions and related investment income
Security transactions are accounted for on trade date. Dividend income, net of applicable foreign withholding taxes, if any, is recorded on the ex-dividend date, or when the Fund is informed of the ex-dividend date, if later. Interest income is recorded on the accrual basis and is adjusted for the amortization of premiums and accretion of discounts. Interest income on inflation indexed securities, if any, is accrued daily based upon an inflation adjusted principal. Additionally, any increase or decrease in the principal or face amount of the securities adjusted for inflation is recorded as interest income or loss. Income is not recognized on securities for which collection is not expected. Non-cash dividends, if any, are recorded at the fair market value of the securities received. In determining the net gain or loss on securities sold, the cost of securities is determined on the identified cost basis.
Expenses
The majority of expenses of the Trust are directly identifiable to an individual fund. Expenses which are not readily identifiable to a specific fund are allocated taking into consideration, among other things, the nature and type of expense and the relative size of the funds.
State Street Bank and Trust Company ("State Street") serves as custodian, fund accounting agent and transfer agent of the Fund. State Street's fee may be reduced by credits that are an earnings allowance calculated on the average daily cash balances the Fund maintains with State Street. Credit balances used to reduce the fee paid to State Street, if any, are reported as a reduction of expenses in the Statement of Operations.
Recently issued accounting pronouncements
In June 2006, the Financial Accounting Standards Board ("FASB") issued FASB Interpretation No. 48, Accounting for Uncertainty in Income Taxes – an Interpretation of FASB Statement No. 109 ("FIN 48"). FIN 48 clarifies the accounting for uncertainty in income taxes recognized in accordance with FASB Statement No. 109, Accounting for Income Taxes. FIN 48 prescribes a recognition threshold and measurement attribute for a tax position taken or expected to be taken in the tax return that could impact the Fund's financial statements. It also provides guidance in relation to the Fund's financial statements on classification of tax benefits or liabilities, interest and penalties, accounting in interim periods, disclosure, and transition. FIN 48 is effective for fiscal years beginning after December 15, 2006 for registered
44
GMO Short-Duration Collateral Fund
(A Series of GMO Trust)
Notes to Financial Statements — (Continued)
February 29, 2008
investment companies. Management has evaluated the effects of applying the various provisions of FIN 48 and has determined that the adoption of FIN 48 does not have a material effect on the Fund's financial statements. The Fund's federal tax returns for the prior three fiscal years, if applicable, remain subject to examination by the Internal Revenue Service. Management will continue to monitor the rules and guidance pertaining to FIN 48 and will take action if appropriate.
In September 2006, the FASB issued Statement of Financial Accounting Standards No. 157 ("FAS 157"), "Fair Value Measurements." FAS 157 defines fair value, establishes a framework for measuring fair value in accordance with generally accepted accounting principles and expands disclosure about fair value measurements. FAS 157 is effective for fiscal years beginning after November 15, 2007. Management is currently evaluating the impact the adoption of FAS 157 will have on the Fund's financial statement disclosures.
3. Fees and other transactions with affiliates
GMO does not charge the Fund any management or service fees for its services. In addition, the Manager has contractually agreed to reimburse the Fund for Fund expenses through at least June 30, 2008 (excluding fees and expenses of the independent Trustees of the Trust, fees and expenses for legal services not approved by the Manager for the Trust, compensation and expenses of the Trust's Chief Compliance Officer ("CCO") (excluding any employee benefits), brokerage commissions, securities lending fees and expenses, interest expense, transfer taxes, and other investment-related costs (including expenses associated with investments in any company that is an investment company or would be an investment company under the 1940 Act, but for the exceptions to the definition of investment company provided in Section 3(c)(1) and 3(c)(7) of the 1940 Act), hedging transaction fees, extraordinary, non-recurring and certain other unusual expe nses (including taxes)).
The Fund's portion of the fees paid by the Trust to the independent Trustees and CCO during the year ended February 29, 2008 was $62,995 and $31,179, respectively. The compensation and expenses of the CCO are included in miscellaneous expenses in the Statement of Operations. No remuneration was paid by the Fund to any other officer of the Trust.
4. Purchases and sales of securities
For the year ended February 29, 2008, cost of purchases and proceeds from sales of investments, other than short-term obligations, were as follows:
| Purchases | Sales | ||||||||||
| U.S. Government securities | $ | 14,948,320 | $ | 1,000,000 | |||||||
| Investments (non-U.S. Government securities) | 3,036,951,445 | 1,963,179,785 | |||||||||
45
GMO Short-Duration Collateral Fund
(A Series of GMO Trust)
Notes to Financial Statements — (Continued)
February 29, 2008
5. Guarantees
In the normal course of business the Fund enters into contracts with third-party service providers that contain a variety of representations and warranties and which provide general indemnifications. The Fund's maximum exposure under these arrangements is unknown, as this would involve future claims that may be made against the Fund that have not yet occurred. Based on experience, management is of the view that the risk of loss in connection with these potential indemnification obligations is remote; however, there can be no assurance that material liabilities related to such obligations will not arise in the future that could adversely impact the Fund.
6. Principal shareholders and related parties
As of February 29, 2008, 66.39% of the outstanding shares of the Fund were held by two shareholders, each holding in excess of 10% of the Fund's outstanding shares. No other shareholder owned in excess of 10% of the outstanding shares of the Fund. Each of the shareholders are other funds of the Trust. Investment activities of these shareholders may have a material effect on the Fund.
As of February 29, 2008, there were no shares held by related parties, and 99.99% of the Fund's shares were held by accounts for which the Manager has investment discretion.
7. Share transactions
The Declaration of Trust permits the Trustees to issue an unlimited number of shares of beneficial interest (without par value). Transactions in Fund shares were as follows:
| Year Ended February 29, 2008 | Year Ended February 28, 2007 | ||||||||||||||||||
| Shares | Amount | Shares | Amount | ||||||||||||||||
| Shares sold | 333,248,563 | $ | 8,426,752,200 | 219,917,838 | $ | 5,677,261,801 | |||||||||||||
| Shares issued to shareholders in reinvestment of distributions | 16,958,629 | 418,731,518 | 12,712,127 | 323,728,016 | |||||||||||||||
| Shares repurchased | (288,235,189 | ) | (7,257,297,919 | ) | (150,328,858 | ) | (3,878,382,932 | ) | |||||||||||
| Net increase (decrease) | 61,972,003 | $ | 1,588,185,799 | 82,301,107 | $ | 2,122,606,885 | |||||||||||||
46
Report of Independent Registered Public Accounting Firm
To the Trustees of GMO Trust and the Shareholders of
GMO Short-Duration Collateral Fund
In our opinion, the accompanying statement of assets and liabilities, including the schedule of investments, and the related statements of operations and of changes in net assets and the financial highlights present fairly, in all material respects, the financial position of GMO Short-Duration Collateral Fund (the "Fund") at February 29, 2008, the results of its operations for the year then ended, the changes in its net assets for each of the two years in the period then ended and the financial highlights for each of the five years in the period then ended, in conformity with accounting principles generally accepted in the United States of America. These financial statements and financial highlights (hereafter referred to as "financial statements") are the responsibility of the Fund's management; our responsibility is to express an opinion on these financial statements based on our audits. We conducted our audits of these financ ial statements in accordance with the standards of the Public Company Accounting Oversight Board (United States). Those standards require that we plan and perform the audit to obtain reasonable assurance about whether the financial statements are free of material misstatement. An audit includes examining, on a test basis, evidence supporting the amounts and disclosures in the financial statements, assessing the accounting principles used and significant estimates made by management, and evaluating the overall financial statement presentation. We believe that our audits, which included confirmation of securities at February 29, 2008 by correspondence with the custodian and brokers, provide a reasonable basis for our opinion.
PricewaterhouseCoopers LLP
Boston, Massachusetts
April 29, 2008
47
GMO Short-Duration Collateral Fund
(A Series of GMO Trust)
Fund Expenses
February 29, 2008 (Unaudited)
Expense Examples: The following information is in relation to expenses for the six month period ended February 29, 2008.
As a shareholder of the Fund, you may incur two types of costs: (1) transaction costs, and (2) ongoing costs. This example is intended to help you understand your ongoing costs (in dollars) of investing in the Fund and to compare these costs with the ongoing costs of investing in other mutual funds.
These examples are based on an investment of $1,000 invested at the beginning of the period and held for the entire period, September 1, 2007 through February 29, 2008.
Actual Expenses
The first line of the table below provides information about actual account values and actual expenses. You may use the information in this line, together with the amount you invested, to estimate the expenses that you paid over the period. Simply divide your account value by $1,000 (for example, a $10,000,000 account value divided by $1,000 = 10,000), then multiply the result by the number in the first line under the heading entitled "Net Expense Incurred" to estimate the expenses you paid on your account during this period.
Hypothetical Example for Comparison Purposes
The second line of the table below provides information about hypothetical account values and hypothetical expenses based on the Fund's actual expense ratio and an assumed rate of return of 5% per year before expenses, which is not the Fund's actual return. The hypothetical account values and expenses may not be used to estimate the actual ending account balance or expenses you paid for the period. You may use this information to compare the ongoing costs of investing in the Fund with other funds. To do so, compare this 5% hypothetical example with the 5% hypothetical examples that appear in the shareholder reports of the other funds.
Please note that the expenses shown in the table are meant to highlight your ongoing costs only and do not reflect any transactional costs. Therefore, the second line of the table is useful in comparing ongoing costs only, and will not help you determine the relative total costs of owning different funds. In addition, if these transactional costs were included, your costs would have been higher.
| Annualized Net Expense Ratio(a) | Beginning Account Value | Ending Account Value | Net Expense Incurred*(a) | ||||||||||||||||
| 1) Actual | 0.00 | % | $ | 1,000.00 | $ | 975.20 | $ | 0.00 | |||||||||||
| 2) Hypothetical | 0.00 | % | $ | 1,000.00 | $ | 1,024.86 | $ | 0.00 | |||||||||||
(a) Annualized net expense ratio rounds to less than 0.01% and net expense incurred rounds to less than $0.01.
* Expenses are calculated using the annualized net expense ratio for the six months ended February 29, 2008, multiplied by the average account value over the period, multiplied by 182 days in the period, divided by 366 days in the year.
48
GMO Short-Duration Collateral Fund
(A Series of GMO Trust)
Tax Information for the Tax Year Ended February 29, 2008 (Unaudited)
The Fund will notify shareholders of amounts for use in preparing 2008 income tax forms in January 2009.
The Fund hereby designates as qualified interest income with respect to its taxable year ended February 29, 2008, $283,376,042 or if determined to be different, the qualified interest income of such year.
49
Trustees and Officers (Unaudited)
The following tables list the Trust's Trustees and Officers as of the date of this report; their address and date of birth ("DOB"); their position with the Trust; the length of time holding that position with the Trust; their principal occupation(s) during the past five years; the number of portfolios in the fund complex they oversee; and other directorships they hold in companies subject to registration or reporting requirements of the Securities Exchange Act of 1934 (generally called "public companies") or in registered investment companies. The Trust's Statement of Additional Information ("SAI") includes additional information about the Trust's trustees, including changes subsequent to the date of the report. The SAI is available, without charge, upon request by writing GMO, c/o GMO Trust, 40 Rowes Wharf, Boston, MA 02110.
Independent Trustees:
| Name, Address, and DOB | Position(s) Held with Trust | Term of Office1 and Length of Time Served | Principal Occupation(s) During Past Five Years | Number of Portfolios in Fund Complex Overseen by Trustee | Other Directorships Held by Trustee | ||||||||||||||||||
| Donald W. Glazer, Esq. c/o GMO Trust 40 Rowes Wharf Boston, MA 02110 DOB: 07/26/1944 | Chairman of the Board of Trustees | Chairman of the Board of Trustees since March 2005; Lead Independent Trustee (September 2004 – March 2005); Trustee since December 2000. | Consultant – Law and Business2; Vice Chair (since 2002) and Secretary, Provant, Inc. (provider of personnel performance improvement services and training products); Author of Legal Treatises. | 47 | None. | ||||||||||||||||||
1 Each Trustee is elected to serve during the continued lifetime of the Trust until he/she dies, resigns or is removed, or if sooner, until the next meeting of Shareholders called for the purpose of electing Trustees and until the election and qualification of his/her successor.
2 As part of Mr. Glazer's work as a consultant, he provides part-time consulting services to Goodwin Procter LLP ("Goodwin"). Goodwin has provided legal services to Renewable Resources, LLC, an affiliate of GMO; GMO, in connection with its relationship with Renewable Resources; and funds managed by Renewable Resources. Mr. Glazer has represented that he has no financial interest in, and is not involved in the provision of, such legal services. In the calendar years ended December 31, 2006 and December 31, 2007, these entities paid $825,738 and $291,721 respectively, in legal fees and disbursements to Goodwin.
50
Independent Trustees — (Continued)
| Name, Address, and DOB | Position(s) Held with Trust | Term of Office1 and Length of Time Served | Principal Occupation(s) During Past Five Years | Number of Portfolios in Fund Complex Overseen by Trustee | Other Directorships Held by Trustee | ||||||||||||||||||
| Jay O. Light c/o GMO Trust 40 Rowes Wharf Boston, MA 02110 DOB: 10/03/1941 | Trustee | Since May 1996. | Dean (since April 2006), Acting Dean (August 2005 – April 2006), Senior Associate Dean (1998 – 2005), and Professor of Business Administration, Harvard Business School. | 47 | Director of Harvard Management Company, Inc.3 and Verde, Inc.; Director of Partners HealthCare System, Inc. and Chair of its Investment Committee.4 | ||||||||||||||||||
| W. Nicholas Thorndike c/o GMO Trust 40 Rowes Wharf Boston, MA 02110 DOB: 03/28/1933 | Trustee | Since March 2005. | Director or trustee of various corporations and charitable organizations, including Courier Corporation (a book publisher and manufacturer) (July 1989 – present); Putnam Funds (December 1992 – June 2004); and Providence Journal (a newspaper publisher) (December 1986 – December 2003). | 47 | Director of Courier Corporation (a book publisher and manufacturer); Member of the Investment Committee of Partners HealthCare System, Inc.4 | ||||||||||||||||||
1 Each Trustee is elected to serve during the continued lifetime of the Trust until he/she dies, resigns or is removed, or if sooner, until the next meeting of Shareholders called for the purpose of electing Trustees and until the election and qualification of his/her successor.
3 Harvard Management Company, Inc. is a client of the Manager.
4 Partners HealthCare System, Inc. is a client of the Manager.
51
Principal Officers:
| Name, Address, and DOB | Position(s) Held with Trust | Term of Office5 and Length of Time Served | Principal Occupation(s) During Past Five Years | ||||||||||||
| Scott Eston c/o GMO Trust 40 Rowes Wharf Boston, MA 02110 DOB: 01/20/1956 | President and Chief Executive Officer | President and Chief Executive Officer since October 2002; Chief Financial Officer, November 2006 – February 2007. | Chief Financial Officer, Chief Operating Officer and Member, Grantham, Mayo, Van Otterloo & Co. LLC. | ||||||||||||
| Sheppard N. Burnett c/o GMO Trust 40 Rowes Wharf Boston, MA 02110 DOB: 10/24/1968 | Treasurer and Chief Financial Officer | Chief Financial Officer since March 2007; Treasurer since November 2006; Assistant Treasurer, September 2004 – November 2006. | Fund Administration Staff, Grantham, Mayo, Van Otterloo & Co. LLC (June 2004 – present); Vice President, Director of Tax, Columbia Management Group (2002 – 2004). | ||||||||||||
| Brent C. Arvidson c/o GMO Trust 40 Rowes Wharf Boston, MA 02110 DOB: 06/26/1969 | Assistant Treasurer | Since August 1998. | Senior Fund Administrator, Grantham, Mayo, Van Otterloo & Co. LLC. | ||||||||||||
| John L. Nasrah c/o GMO Trust 40 Rowes Wharf Boston, MA 02110 DOB: 05/27/1977 | Assistant Treasurer | Since March 2007. | Fund Administrator, Grantham, Mayo, Van Otterloo & Co. LLC (September 2004 – present); Tax Analyst, Bain & Company, Inc (June 2003 – September 2004); Senior Tax Associate, PricewaterhouseCoopers LLP (2001 – 2003). | ||||||||||||
| Mahmoodur Rahman c/o GMO Trust 40 Rowes Wharf Boston, MA 02110 DOB: 11/30/1967 | Assistant Treasurer | Since September 2007. | Fund Administrator, Grantham, Mayo, Van Otterloo & Co. (April 2007 – present); Vice President and Senior Tax Manager, Massachusetts Financial Services Company (January 2000 – April 2007). | ||||||||||||
5 Officers are elected to hold such office until their successor is elected and qualified to carry out the duties and responsibilities of their office, or until he or she resigns or is removed from office.
52
Principal Officers — (Continued)
| Name, Address, and DOB | Position(s) Held with Trust | Term of Office5 and Length of Time Served | Principal Occupation(s) During Past Five Years | ||||||||||||
| Michael E. Gillespie c/o GMO Trust 40 Rowes Wharf Boston, MA 02110 DOB: 02/18/1958 | Chief Compliance Officer | Since March 2005. | Vice President of Compliance (June 2004 – February 2005) and Director of Domestic Compliance (March 2002 – June 2004), Fidelity Investments; Vice President and Senior Counsel, State Street Bank and Trust Company (May 1998 – March 2002). | ||||||||||||
| Jason B. Harrison c/o GMO Trust 40 Rowes Wharf Boston, MA 02110 DOB: 01/29/1977 | Vice President and Clerk | Vice President since November 2006; Clerk since March 2006. | Legal Counsel, Grantham, Mayo, Van Otterloo & Co. LLC (since February 2006) and Attorney, Ropes & Gray LLP (September 2002 – February 2006). | ||||||||||||
| David L. Bohan c/o GMO Trust 40 Rowes Wharf Boston, MA 02110 DOB: 06/21/1964 | Vice President and Assistant Clerk | Vice President since March 2005; Assistant Clerk since March 2006. | Legal Counsel, Grantham, Mayo, Van Otterloo & Co. LLC (September 2003 – present); Attorney, Goodwin Procter LLP (September 1996 – September 2003). | ||||||||||||
| Gregory L. Pottle c/o GMO Trust 40 Rowes Wharf Boston, MA 02110 DOB: 07/09/1971 | Vice President and Assistant Clerk | Since November 2006. | Legal Counsel, Grantham, Mayo, Van Otterloo & Co. LLC. | ||||||||||||
| Anne K. Trinque c/o GMO Trust 40 Rowes Wharf Boston, MA 02110 DOB: 04/15/1978 | Vice President and Assistant Clerk | Since September 2007. | Legal Counsel, Grantham, Mayo, Van Otterloo & Co. LLC (since January 2007); Attorney, Goodwin Procter LLP (September 2003 – January 2007). | ||||||||||||
| Cheryl Wakeham c/o GMO Trust 40 Rowes Wharf Boston, MA 02110 DOB: 10/29/1958 | Anti-Money Laundering Officer | Since December 2004. | Manager, Client Service Administration, Grantham, Mayo, Van Otterloo & Co. LLC. | ||||||||||||
5 Officers are elected to hold such office until their successor is elected and qualified to carry out the duties and responsibilities of their office, or until he or she resigns or is removed from office.
53
GMO Short-Duration Collateral Share Fund
(A Series of GMO Trust)
Annual Report
February 29, 2008
For a free copy of the Fund's proxy voting guidelines, shareholders may call 1-617-346-7646 (collect), visit our website at www.gmo.com, or visit the Securities and Exchange Commission's website at www.sec.gov. Information regarding how the Fund voted proxies relating to portfolio securities during the most recent 12-month period ended June 30 is available on our website at www.gmo.com, or on the Securities and Exchange Commission's website at www.sec.gov.
The Fund files its complete schedule of portfolio holdings with the Securities and Exchange Commission for the first and third quarter of each fiscal year on Form N-Q, which is available on the Commission's website at www.sec.gov. The Fund's Form N-Q may be reviewed and copied at the Commission's Public Reference Room in Washington, D.C. Information on the operation of the Public Reference Room may be obtained by calling 1-800-SEC-0330. The Fund has a policy with respect to disclosure of portfolio holdings under which it may also make available on GMO's website (www.gmo.com) a complete schedule of portfolio holdings.
This report is prepared for the general information of shareholders. It is authorized for distribution to prospective investors only when preceded or accompanied by a prospectus for the GMO Trust.
GMO Short-Duration Collateral Share Fund
(A Series of GMO Trust)
Portfolio Management
Day-to-day management of the Fund's portfolio is the responsibility of the Fixed Income Division at Grantham, Mayo, Van Otterloo & Co. LLC.
Management Discussion and Analysis of Fund Performance
Shares of the GMO Short-Duration Collateral Share Fund returned -1.3% for the fiscal year ended February 29, 2008, compared with the +5.8% for the JPMorgan U.S. 3 Month Cash Index. The Fund underperformed the benchmark during the fiscal year by 7.1%.
The fiscal year's underperformance stemmed from mark-to-market losses in the GMO Short-Duration Collateral Fund (SDCF), the cash collateral pool in which the Fund invests a substantial portion of its total assets. SDCF primarily invests in high quality U.S. and foreign floating-rate fixed income securities, mainly asset-backed securities, seeking to earn a LIBOR-type return.
With the extreme price volatility of AAA-credit quality asset-backed securities during the year, SDCF underperformed LIBOR by nearly 700 basis points, directly contributing to the Short-Duration Collateral Share Fund's underperformance given the latter's 99% exposure to the former.
The views expressed herein are exclusively those of Grantham, Mayo, Van Otterloo & Co. LLC Management as of the date of this report and are subject to change. GMO disclaims any responsibility to update such views. They are not meant as investment advice.
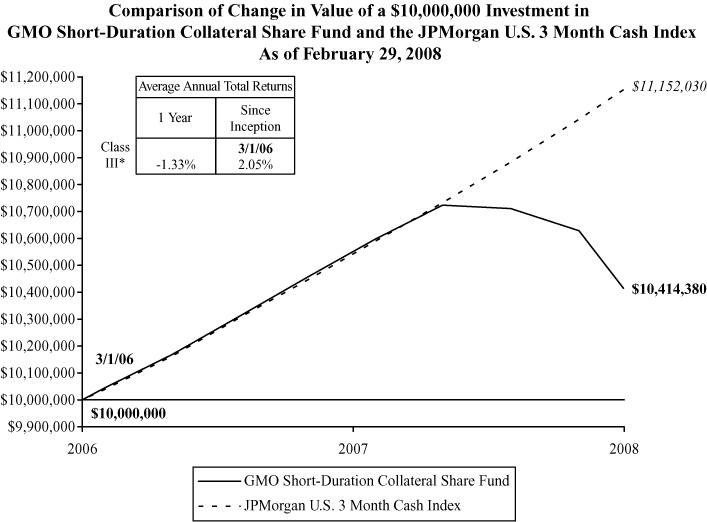
Performance data quoted represents past performance and is not indicative of future results. The investment return and principal value of an investment will fluctuate so that an investor's shares, when redeemed, may be worth more or less than their original cost. Current performance data may be lower or higher than the performance data provided herein. To obtain performance information to the most recent month-end, visit www.gmo.com. Performance shown is net of all fees after reimbursement from the Manager. Returns would have been lower had certain expenses not been reimbursed during the periods shown and do not include the effect of taxes on distributions and redemptions. All information is unaudited.
* Class III performance information represents Class VI performance from March 1, 2006 to December 28, 2006 and Class III performance thereafter.
GMO Short-Duration Collateral Share Fund
(A Series of GMO Trust)
Investments Concentration Summary
February 29, 2008 (Unaudited)
| Asset Class Summary* | % of Total Net Assets | ||||||
| Debt Obligations | 91.0 | % | |||||
| Short-Term Investments | 9.0 | ||||||
| Futures | (0.0 | ) | |||||
| Forward Currency Contracts | (0.0 | ) | |||||
| Swaps | (0.2 | ) | |||||
| Other | 0.2 | ||||||
| 100.0 | % | ||||||
* The table above incorporates aggregate indirect asset class exposure associated with investments in GMO Short-Duration Collateral Fund.
1
GMO Short-Duration Collateral Share Fund
(A Series of GMO Trust)
Investments Concentration Summary — (Continued)
February 29, 2008 (Unaudited)
| Industry Sector Summary** | % of Debt Obligations | ||||||
| Credit Cards | 19.8 | % | |||||
| Residential Asset-Backed Securities (United States) | 19.5 | ||||||
| Auto Financing | 9.3 | ||||||
| Business Loans | 6.7 | ||||||
| Insured Auto Financing | 6.5 | ||||||
| Residential Mortgage-Backed Securities (European) | 5.9 | ||||||
| Student Loans | 5.3 | ||||||
| CMBS | 5.2 | ||||||
| Residential Mortgage-Backed Securities (Australian) | 3.9 | ||||||
| Investment Grade Corporate Collateralized Debt Obligations | 3.3 | ||||||
| Insured Other | 2.0 | ||||||
| CMBS Collateralized Debt Obligations | 1.4 | ||||||
| Equipment Leases | 1.3 | ||||||
| Bank Loan Collateralized Debt Obligations | 1.2 | ||||||
| Rate Reduction Bonds | 1.2 | ||||||
| Trade Receivables | 1.0 | ||||||
| U.S. Government Agency | 1.0 | ||||||
| Insurance Premiums | 0.8 | ||||||
| Insured Residential Mortgage-Backed Securities (United States) | 0.8 | ||||||
| Corporate Debt | 0.7 | ||||||
| Insured Time Share | 0.7 | ||||||
| Insured High Yield Collateralized Debt Obligations | 0.6 | ||||||
| Insured Credit Cards | 0.5 | ||||||
| Airlines | 0.4 | ||||||
| U.S. Government | 0.2 | ||||||
| Emerging Markets Collateralized Debt Obligations | 0.2 | ||||||
| Insured Residential Asset-Backed Securities (United States) | 0.2 | ||||||
| ABS Collateralized Debt Obligations | 0.1 | ||||||
| Insured Transportation | 0.1 | ||||||
| Residential Mortgage-Backed Securities (United States) | 0.1 | ||||||
| Insured Business Loans | 0.1 | ||||||
| Collateralized Loan Obligations | 0.0 | ||||||
| High Yield Collateralized Debt Obligations | 0.0 | ||||||
| Insured Residential Asset-Backed Securities (European) | 0.0 | ||||||
| 100.0 | % | ||||||
** The table above incorporates aggregate industry sector exposure associated with investments in GMO Short-Duration Collateral Fund.
2
GMO Short-Duration Collateral Share Fund
(A Series of GMO Trust)
Schedule of Investments
(showing percentage of total net assets)
February 29, 2008
| Shares | Description | Value ($) | |||||||||
| MUTUAL FUNDS — 100.4% | |||||||||||
| Affiliated Issuers — 100.4% | |||||||||||
| 444,357 | GMO Short-Duration Collateral Fund | 10,677,894 | |||||||||
| TOTAL MUTUAL FUNDS (COST $11,334,706) | 10,677,894 | ||||||||||
| TOTAL INVESTMENTS — 100.4% (Cost $11,334,706) | 10,677,894 | ||||||||||
| Other Assets and Liabilities (net) — (0.4%) | (40,694 | ) | |||||||||
| TOTAL NET ASSETS — 100.0% | $ | 10,637,200 | |||||||||
See accompanying notes to the financial statements.
3
GMO Short-Duration Collateral Share Fund
(A Series of GMO Trust)
Statement of Assets and Liabilities — February 29, 2008
| Assets: | |||||||
| Investments in affiliated issuers, at value (cost $11,334,706) (Notes 2 and 8) | $ | 10,677,894 | |||||
| Cash | 10,697 | ||||||
| Interest receivable | 15 | ||||||
| Receivable for expenses reimbursed by Manager (Note 3) | 5,133 | ||||||
| Total assets | 10,693,739 | ||||||
| Liabilities: | |||||||
| Payable to affiliate for (Note 3): | |||||||
| Management fee | 428 | ||||||
| Shareholder service fee | 1,282 | ||||||
| Trustees and Chief Compliance Officer of GMO Trust fees | 197 | ||||||
| Accrued expenses | 54,632 | ||||||
| Total liabilities | 56,539 | ||||||
| Net assets | $ | 10,637,200 | |||||
| Net assets consist of: | |||||||
| Paid-in capital | $ | 15,648,449 | |||||
| Accumulated undistributed net investment income | 61,322 | ||||||
| Accumulated net realized loss | (4,415,759 | ) | |||||
| Net unrealized depreciation | (656,812 | ) | |||||
| $ | 10,637,200 | ||||||
| Net assets attributable to: | |||||||
| Class III shares | $ | 10,637,200 | |||||
| Shares outstanding: | |||||||
| Class III | 454,859 | ||||||
| Net asset value per share: | |||||||
| Class III | $ | 23.39 | |||||
See accompanying notes to the financial statements.
4
GMO Short-Duration Collateral Share Fund
(A Series of GMO Trust)
Statement of Operations — Year Ended February 29, 2008
| Investment Income: | |||||||
| Dividends from affiliated issuers (Note 8) | $ | 1,626,959 | |||||
| Interest | 689 | ||||||
| Total investment income | 1,627,648 | ||||||
| Expenses: | |||||||
| Management fee (Note 3) | 18,299 | ||||||
| Shareholder service fee – Class III (Note 3) | 54,896 | ||||||
| Custodian, fund accounting agent and transfer agent fees | 16,533 | ||||||
| Audit and tax fees | 32,602 | ||||||
| Legal fees | 1,995 | ||||||
| Trustees fees and related expenses (Note 3) | 150 | ||||||
| Registration fees | 3,220 | ||||||
| Miscellaneous | 349 | ||||||
| Total expenses | 128,044 | ||||||
| Fees and expenses reimbursed by Manager (Note 3) | (55,261 | ) | |||||
| Net expenses | 72,783 | ||||||
| Net investment income (loss) | 1,554,865 | ||||||
| Realized and unrealized gain (loss): | |||||||
| Net realized gain (loss) on: | |||||||
| Investments in affiliated issuers | (422,578 | ) | |||||
| Change in net unrealized appreciation (depreciation) on: | |||||||
| Investments in affiliated issuers | (877,706 | ) | |||||
| Net realized and unrealized gain (loss) | (1,300,284 | ) | |||||
| Net increase (decrease) in net assets resulting from operations | $ | 254,581 | |||||
See accompanying notes to the financial statements.
5
GMO Short-Duration Collateral Share Fund
(A Series of GMO Trust)
Statement of Changes in Net Assets
| Year Ended February 29, 2008 | Period from March 1, 2006 (commencement of operations) through February 28, 2007 | ||||||||||
| Increase (decrease) in net assets: | |||||||||||
| Operations: | |||||||||||
| Net investment income (loss) | $ | 1,554,865 | $ | 28,764,726 | |||||||
| Net realized gain (loss) | (422,578 | ) | (3,989,905 | ) | |||||||
| Change in net unrealized appreciation (depreciation) | (877,706 | ) | 220,894 | ||||||||
| Net increase (decrease) in net assets from operations | 254,581 | 24,995,715 | |||||||||
| Distributions to shareholders from: | |||||||||||
| Net investment income | |||||||||||
| Class III | (1,493,543 | ) | — | ||||||||
| Class VI | — | (28,768,002 | ) | ||||||||
| Total distributions from net investment income | (1,493,543 | ) | (28,768,002 | ) | |||||||
| Return of capital | |||||||||||
| Class VI | — | (36,666 | ) | ||||||||
| (1,493,543 | ) | (28,804,668 | ) | ||||||||
| Net share transactions (Note 7): | |||||||||||
| Class III | (28,686,720 | ) | 40,536,328 | ||||||||
| Class VI | — | 3,835,507 | |||||||||
| Increase (decrease) in net assets resulting from net share transactions | (28,686,720 | ) | 44,371,835 | ||||||||
| Total increase (decrease) in net assets | (29,925,682 | ) | 40,562,882 | ||||||||
| Net assets: | |||||||||||
| Beginning of period | 40,562,882 | — | |||||||||
| End of period (including accumulated undistributed net investment income of $61,322 and $0, respectively) | $ | 10,637,200 | $ | 40,562,882 | |||||||
See accompanying notes to the financial statements.
6
GMO Short-Duration Collateral Share Fund
(A Series of GMO Trust)
Financial Highlights
(For a Class III share outstanding throughout each period)
| Year Ended February 29, 2008 | Period from December 28, 2006 (commencement of operations) through February 28, 2007 | ||||||||||
| Net asset value, beginning of period | $ | 25.05 | $ | 24.82 | |||||||
| Income (loss) from investment operations: | |||||||||||
| Net investment income (loss)†(a) | 1.07 | (0.01 | ) | ||||||||
| Net realized and unrealized gain (loss) | (1.38 | ) | 0.24 | ||||||||
| Total from investment operations | (0.31 | ) | 0.23 | ||||||||
| Less distributions to shareholders: | |||||||||||
| From net investment income | (1.35 | ) | — | ||||||||
| Total distributions | (1.35 | ) | — | ||||||||
| Net asset value, end of period | $ | 23.39 | $ | 25.05 | |||||||
| Total Return(b) | (1.33 | )% | 0.93 | %** | |||||||
| Ratios/Supplemental Data: | |||||||||||
| Net assets, end of period (000's) | $ | 10,637 | $ | 40,563 | |||||||
| Net expenses to average daily net assets | 0.20 | % | 0.21 | %* | |||||||
| Net investment income to average daily net assets | 4.25 | % | (0.21 | )%* | |||||||
| Portfolio turnover rate | 127 | % | 125 | %**†† | |||||||
| Fees and expenses reimbursed by the Manager to average daily net assets: | 0.15 | % | 0.06 | %* | |||||||
(a) Net investment income is affected by the timing of the declaration of dividends by GMO Short-Duration Collateral Fund.
(b) The total returns would have been lower had certain expenses not been reimbursed during the periods shown and assumes the effect of reinvested distributions.
† Calculated using average shares outstanding throughout the period.
* Annualized.
** Not annualized.
†† Calculation represents portfolio turnover of the Fund for the period from March 1, 2006 (commencement of operations) through February 28, 2007.
See accompanying notes to the financial statements.
7
GMO Short-Duration Collateral Share Fund
(A Series of GMO Trust)
Notes to Financial Statements
February 29, 2008
1. Organization
GMO Short-Duration Collateral Share Fund (the "Fund") is a series of GMO Trust (the "Trust"). The Fund is registered under the Investment Company Act of 1940, as amended, as an open-end, non-diversified management investment company. The Fund is advised and managed by Grantham, Mayo, Van Otterloo & Co. LLC (the "Manager" or "GMO"). The Trust was established as a Massachusetts business trust under the laws of the Commonwealth of Massachusetts on June 24, 1985. The Declaration of Trust permits the Trustees of the Trust ("Trustees") to create an unlimited number of series of shares ("Funds") and to subdivide Funds into classes.
The Fund seeks total return in excess of that of the JPMorgan U.S. 3 Month Cash Index. The Fund invests substantially all of its assets in GMO Short-Duration Collateral Fund (an arrangement often referred to as a "master-feeder" structure) ("SDCF") and, to a limited extent, in cash and cash equivalents. The Fund's investment objective and principal investment strategies are identical to those of SDCF. SDCF seeks to achieve its investment objective by investing primarily in high quality U.S. and foreign floating rate fixed income securities. SDCF may invest a substantial portion of its assets in asset-backed securities.
As of February 29, 2008, the Fund had one class of shares outstanding, Class III. Class III shares commenced operations on December 28, 2006. Class VI shares were liquidated on February 26, 2007.
The financial statements of SDCF should be read in conjunction with the Fund's financial statements. These financial statements are available, without charge, upon request, by calling (617) 346-7646 (collect). Shares of SDCF are not publicly available for direct purchase.
2. Significant accounting policies
The following is a summary of significant accounting policies which are in conformity with accounting principles generally accepted in the United States of America ("U.S. GAAP") and which are consistently followed by the Fund in the preparation of its financial statements. The preparation of financial statements in accordance with U.S. GAAP requires management to make estimates and assumptions that affect the reported amounts and disclosures in the financial statements. Actual results could differ from those estimates. The accounting records of the Fund are maintained in U.S. dollars.
Portfolio valuation
Shares of SDCF are valued at their net asset value.
Investments held by SDCF are valued as follows. Securities listed on a securities exchange for which market quotations are readily available are valued at the last sale price or official closing price on each business day, or if there is no such reported sale or official closing price, at the most recent quoted bid price. Unlisted securities for which market quotations are readily available are generally valued at the most
8
GMO Short-Duration Collateral Share Fund
(A Series of GMO Trust)
Notes to Financial Statements — (Continued)
February 29, 2008
recent quoted bid price. Short-term investments with a remaining maturity of sixty days or less are generally valued at amortized cost, which approximates fair value. Securities for which quotations are not readily available or whose values the Manager has determined to be unreliable are valued at fair value as determined in good faith by the Trustees or other persons acting at their direction pursuant to procedures approved by the Trustees. By its nature, a fair value price is a good faith estimate of the value of a security at a given point in time and may not reflect the value that would be realized if the security was sold and the differences could be material.
Fixed income securities held by the Fund or the underlying funds are typically valued pursuant to prices supplied by a primary pricing source chosen by the Manager. The Manager evaluates such primary pricing sources on an ongoing basis, and may change a pricing source should it deem it appropriate. The Manager, at its discretion, may override a price supplied by a primary source by using a price provided by another source if such action is deemed appropriate. The prices provided by such primary pricing sources may differ from the value that would be realized if the securities were sold and the differences could be material.
Certain securities held by the Fund or the underlying funds are valued on the basis of a price provided by a single source. The prices provided may differ from the value that would be realized if the securities were sold and the differences could be material. As of February 29, 2008, the total value of these securities represented 32.17% of net assets.
The fund indirectly invests through SDCF in securities with contractual cash flows, such as asset-backed securities, collateralized mortgage obligations and commercial mortgage backed securities, including securities backed by subprime mortgage loans. The value, liquidity and related income of these securities are sensitive to changes in economic conditions, including real estate values, delinquencies and/or defaults, and may be adversely affected by shifts in the market's perception of the securities' market values and changes in interest rates.
Taxes and distributions
The Fund intends to qualify each tax year as a regulated investment company under Subchapter M of the Internal Revenue Code of 1986, as amended (the "Code"). The Fund intends to distribute substantially all of its net investment income and net realized short-term and long-term capital gains, if any, after giving effect to any available capital loss carryovers for U.S. federal income tax purposes. Therefore, no provision for U.S. federal income or excise tax is necessary.
The Fund's policy is to declare and pay distributions from net investment income, if any, semiannually, and from net realized short-term and long-term capital gains, if any, at least annually. All distributions are paid in shares of the Fund, at net asset value, unless the shareholder elects to receive cash distributions. Distributions to shareholders are recorded by the Fund on the ex-dividend date.
9
GMO Short-Duration Collateral Share Fund
(A Series of GMO Trust)
Notes to Financial Statements — (Continued)
February 29, 2008
Income and capital gain distributions are determined in accordance with U.S. federal income tax regulations, which may differ from U.S. GAAP. Certain capital accounts in the financial statements are periodically adjusted for permanent differences in order to reflect their tax character. These adjustments have no impact on net assets or net asset value per share. Temporary differences which arise from recognizing certain items of income, expense, gain or loss in different periods for financial statement and tax purposes will reverse at some time in the future. Distributions in excess of net investment income or net realized gains are temporary over distributions for financial statement purposes resulting from differences in the recognition or classification of income or distributions for financial statement and tax purposes.
U.S. GAAP and tax accounting differences primarily relate to capital loss carryforwards, losses on wash sale transactions and post-October capital losses.
The tax character of distributions declared to shareholders is as follows:
| 2/29/2008 | 2/28/2007 | ||||||||||
| Ordinary income (including any short-term capital gains) | $ | 1,493,543 | $ | 28,768,002 | |||||||
| $ | 1,493,543 | $ | 28,768,002 | ||||||||
| Tax return of capital | — | 36,666 | |||||||||
| Total distributions | $ | 1,493,543 | $ | 28,804,668 | |||||||
Distributions in excess of tax basis earnings and profits, if significant, are reported in the financial statements as a tax return of capital.
As of February 29, 2008, the components of distributable earnings on a tax basis consisted of the following:
| Undistributed ordinary income | $ | 61,322 | |||||
As of February 29, 2008, the Fund elected to defer to March 1, 2008 post-October capital losses of $858,383.
As of February 29, 2008, the Fund had capital loss carryforwards available to offset future realized gains if any, to the extent permitted by the Code. Utilization of the capital loss carryforwards could be subject to limitations imposed by the Code related to share ownership activity. Such losses expire as follows:
| 2/29/2016 | $ | (3,417,986 | ) | ||||
| Total | $ | (3,417,986 | ) | ||||
10
GMO Short-Duration Collateral Share Fund
(A Series of GMO Trust)
Notes to Financial Statements — (Continued)
February 29, 2008
As of February 29, 2008, the approximate cost for U.S. federal income tax purposes and gross and net unrealized appreciation and depreciation in value of investments were as follows:
| Aggregate Cost | Gross Unrealized Appreciation | Gross Unrealized (Depreciation) | Net Unrealized Appreciation (Depreciation) | ||||||||||||
| $ | 11,474,096 | $ | — | $ | (796,202 | ) | $ | (796,202 | ) | ||||||
Security transactions and related investment income
Security transactions are accounted for on trade date. Income dividends and capital gain distributions from SDCF are recorded on the ex-dividend date. Interest income is recorded on the accrual basis. Non-cash dividends, if any, are recorded at the fair market value of the securities received. In determining the net gain or loss on securities sold, the cost of securities is determined on the identified cost basis.
Expenses
The majority of expenses of the Trust are directly identifiable to an individual fund. Expenses which are not readily identifiable to a specific fund are allocated taking into consideration, among other things, the nature and type of expense and the relative size of the funds. In addition, the Fund will also incur certain fees and expenses indirectly as a shareholder in SDCF (See Note 3).
State Street Bank and Trust Company ("State Street") serves as custodian, fund accounting agent and transfer agent of the Fund. State Street's fee may be reduced by credits that are an earnings allowance calculated on the average daily cash balances the Fund maintains with State Street. Credit balances used to reduce the fee paid to State Street, if any, are reported as a reduction of expenses in the Statement of Operations.
Recently issued accounting pronouncements
In June 2006, the Financial Accounting Standards Board ("FASB") issued FASB Interpretation No. 48, Accounting for Uncertainty in Income Taxes – an Interpretation of FASB Statement No. 109 ("FIN 48"). FIN 48 clarifies the accounting for uncertainty in income taxes recognized in accordance with FASB Statement No. 109, Accounting for Income Taxes. FIN 48 prescribes a recognition threshold and measurement attribute for a tax position taken or expected to be taken in the tax return that could impact the Fund's financial statements. It also provides guidance in relation to the Fund's financial statements on classification of tax benefits or liabilities, interest and penalties, accounting in interim periods, disclosure, and transition. FIN 48 is effective for fiscal years beginning after December 15, 2006 for registered investment companies. Management has evaluated the effects of applying the various provisions of FIN 48 and has determined that the adoption of FIN 48 does not have a material effect on the Fund's financial statements. The Fund's federal tax returns for the prior three fiscal years, if applicable, remain subject to examination by the Internal Revenue Service. Management will continue to monitor the rules and guidance pertaining to FIN 48 and will take action if appropriate.
11
GMO Short-Duration Collateral Share Fund
(A Series of GMO Trust)
Notes to Financial Statements — (Continued)
February 29, 2008
In September 2006, the FASB issued Statement of Financial Accounting Standards No. 157 ("FAS 157"), "Fair Value Measurements." FAS 157 defines fair value, establishes a framework for measuring fair value in accordance with generally accepted accounting principles and expands disclosure about fair value measurements. FAS 157 is effective for fiscal years beginning after November 15, 2007. Management is currently evaluating the impact the adoption of FAS 157 will have on the Fund's financial statement disclosures.
3. Fees and other transactions with affiliates
GMO earns a management fee paid monthly at the annual rate of 0.05% of average daily net assets. The Fund has adopted a Shareholder Service Plan under which the Fund pays GMO a shareholder service fee for client and shareholder service, reporting, and other support. Pursuant to the Shareholder Service Plan, the shareholder service fee is calculated based on average daily net assets at the annual rate of 0.15% for Class III shares.
The Manager has contractually agreed to reimburse the Fund for Fund expenses through at least June 30, 2008 to the extent the Fund's total annual operating expenses (excluding shareholder service fees, fees and expenses of the independent Trustees of the Trust, fees and expenses for legal services not approved by the Manager for the Trust, compensation and expenses of the Trust's Chief Compliance Officer ("CCO") (excluding any employee benefits), brokerage commissions, securities lending fees and expenses, interest expense, transfer taxes, and other investment-related costs (including expenses associated with investments in any company that is an investment company or would be an investment company under the 1940 Act, but for the exceptions to the definition of investment company provided in Section 3(c)(1) and 3(c)(7) of the 1940 Act), hedging transaction fees, extraordinary, non-recurring and certain other unusual expenses (in cluding taxes)) exceed 0.05% of the Fund's average daily net assets.
The Fund incurs fees and expenses indirectly as a shareholder in SDCF. For the year ended February 29, 2008, these indirect fees and expenses expressed as an annualized percentage of the Fund's average daily net assets were as follows:
| Indirect Net Expenses (excluding shareholder service fees and interest expense) | Indirect Shareholder Service Fees | Indirect Interest Expense | Total Indirect Expenses | ||||||||||||
| 0.002 | % | 0.000 | % | 0.000 | % | 0.002 | % | ||||||||
12
GMO Short-Duration Collateral Share Fund
(A Series of GMO Trust)
Notes to Financial Statements — (Continued)
February 29, 2008
The Fund's portion of the fees paid by the Trust to the independent Trustees and CCO during the year ended February 29, 2008 was $150 and $0, respectively. The compensation and expenses of the CCO are included in miscellaneous expenses in the Statement of Operations. No remuneration was paid by the Fund to any other officer of the Trust.
4. Purchases and sales of securities
Cost of purchases and proceeds from sales of securities, excluding short-term investments and class exchanges, for the period ended February 29, 2008 aggregated $42,887,159 and $71,516,250, respectively.
5. Guarantees
In the normal course of business the Fund enters into contracts with third-party service providers that contain a variety of representations and warranties and which provide general indemnifications. The Fund's maximum exposure under these arrangements is unknown, as this would involve future claims that may be made against the Fund that have not yet occurred. Based on experience, management is of the view that the risk of loss in connection with these potential indemnification obligations is remote; however, there can be no assurance that material liabilities related to such obligations will not arise in the future that could adversely impact the Fund.
6. Principal shareholders and related parties
As of February 29, 2008, 65.95% of the outstanding shares of the Fund were held by two shareholders, each holding in excess of 10% of the Fund's outstanding shares. No other shareholder owned in excess of 10% of the outstanding shares of the Fund. Investment activities of these shareholders may have a material effect on the Fund.
As of February 29, 2008, 83.57% of the Fund's shares were held by twenty-two related parties comprised of certain GMO employee accounts.
13
GMO Short-Duration Collateral Share Fund
(A Series of GMO Trust)
Notes to Financial Statements — (Continued)
February 29, 2008
7. Share transactions
The Declaration of Trust permits the Trustees to issue an unlimited number of shares of beneficial interest (without par value). Transactions in Fund shares were as follows:
| Year Ended February 29, 2008 | Period from December 28, 2006 (commencement of operations) through February 28, 2007 | ||||||||||||||||||
| Class III | Shares | Amount | Shares | Amount | |||||||||||||||
| Shares sold | 1,953,067 | $ | 49,066,088 | 1,619,496 | $ | 40,541,330 | |||||||||||||
| Shares issued to shareholders in reinvestment of distributions | 62,533 | 1,492,040 | — | — | |||||||||||||||
| Shares repurchased | (3,180,036 | ) | (79,244,848 | ) | (201 | ) | (5,002 | ) | |||||||||||
| Net increase (decrease) | (1,164,436 | ) | $ | (28,686,720 | ) | 1,619,295 | $ | 40,536,328 | |||||||||||
| Year Ended February 29, 2008 | Period from March 1, 2006 (commencement of operations) through February 28, 2007* | ||||||||||||||||||
| Class VI | Shares | Amount | Shares | Amount | |||||||||||||||
| Shares sold | — | $ | — | 22,535,851 | $ | 565,101,317 | |||||||||||||
| Shares issued to shareholders in reinvestment of distributions | — | — | 1,160,507 | 28,803,789 | |||||||||||||||
| Shares repurchased | — | — | (23,696,358 | ) | (590,069,599 | ) | |||||||||||||
| Net increase (decrease) | — | $ | — | — | $ | 3,835,507 | |||||||||||||
* Effective February 26, 2007, all shareholders redeemed or exchanged out of Class VI.
8. Investments in Affiliated Issuers
A summary of the Fund's transactions in the shares of the affiliated issuer during the year ended February 29, 2008 is set forth below:
| Affiliate | Value, beginning of period | Purchases | Sales Proceeds | Dividend Income | Distributions of Realized Gains | Value, end of period | |||||||||||||||||||||
| GMO Short-Duration Collateral Fund | $ | 40,607,270 | $ | 42,887,159 | $ | 71,516,250 | $ | 1,626,959 | $ | — | $ | 10,677,894 | |||||||||||||||
| Totals | $ | 40,607,270 | $ | 42,887,159 | $ | 71,516,250 | $ | 1,626,959 | $ | — | $ | 10,677,894 | |||||||||||||||
14
Report of Independent Registered Public Accounting Firm
To the Trustees of GMO Trust and the Shareholders of
GMO Short-Duration Collateral Share Fund
In our opinion, the accompanying statement of assets and liabilities, including the schedule of investments, and the related statements of operations and of changes in net assets and the financial highlights present fairly, in all material respects, the financial position of GMO Short-Duration Collateral Share Fund (the "Fund") at February 29, 2008, the results of its operations for the year then ended, the changes in its net assets for each of the two years in the period then ended and the financial highlights for each of the periods indicated, in conformity with accounting principles generally accepted in the United States of America. These financial statements and financial highlights (hereafter referred to as "financial statements") are the responsibility of the Fund's management; our responsibility is to express an opinion on these financial statements based on our audits. We conducted our audits of these financial statemen ts in accordance with the standards of the Public Company Accounting Oversight Board (United States). Those standards require that we plan and perform the audit to obtain reasonable assurance about whether the financial statements are free of material misstatement. An audit includes examining, on a test basis, evidence supporting the amounts and disclosures in the financial statements, assessing the accounting principles used and significant estimates made by management, and evaluating the overall financial statement presentation. We believe that our audits, which included confirmation of securities at February 29, 2008 by correspondence with the custodian, provide a reasonable basis for our opinion.
PricewaterhouseCoopers LLP
Boston, Massachusetts
April 29, 2008
15
GMO Short-Duration Collateral Share Fund
(A Series of GMO Trust)
Fund Expenses
February 29, 2008 (Unaudited)
Expense Examples: The following information is in relation to expenses for the six month period ended February 29, 2008.
As a shareholder of the Fund, you may incur two types of costs: (1) transaction costs, and (2) ongoing costs, including management fees, shareholder service fees and other Fund expenses. This example is intended to help you understand your ongoing costs (in dollars) of investing in the Fund and to compare these costs with the ongoing costs of investing in other mutual funds.
These examples are based on an investment of $1,000 invested at the beginning of the period and held for the entire period September 1, 2007 through February 29, 2008.
Actual Expenses
The first line of the table below provides information about actual account values and actual expenses. You may use the information in this line, together with the amount you invested, to estimate the expenses that you paid over the period. Simply divide your account value by $1,000 (for example, a $10,000,000 account value divided by $1,000 = 10,000), then multiply the result by the number in the first line under the heading entitled "Net Expense Incurred" to estimate the expenses you paid on your account during this period.
Hypothetical Example for Comparison Purposes
The second line of the table below provides information about hypothetical account values and hypothetical expenses based on the Fund's actual expense ratio and an assumed rate of return of 5% per year before expenses, which is not the Fund's actual return. The hypothetical account values and expenses may not be used to estimate the actual ending account balance or expenses you paid for the period. You may use this information to compare the ongoing costs of investing in the Fund with other funds. To do so, compare this 5% hypothetical example with the 5% hypothetical examples that appear in the shareholder reports of other funds.
Please note that the expenses shown in the table are meant to highlight your ongoing costs only and do not reflect any transactional costs. Therefore, the second line of the table is useful in comparing ongoing costs only, and will not help you determine the relative total costs of owning different funds. In addition, if these transactional costs were included, your costs would have been higher.
| Annualized Net Expense Ratio | Beginning Account Value | Ending Account Value | Net Expense Incurred | ||||||||||||||||
| Class III | |||||||||||||||||||
| 1) Actual | 0.20 | % | $ | 1,000.00 | $ | 974.30 | $ | 0.98 | |||||||||||
| 2) Hypothetical | 0.20 | % | $ | 1,000.00 | $ | 1,023.87 | $ | 1.01 | |||||||||||
* Expenses are calculated using the Class's annualized net expense ratio (including indirect expenses incurred) for the six months ended February 29, 2008, multiplied by the average account value over the period, multiplied by 182 days in the period, divided by 366 days in the year.
16
GMO Short-Duration Collateral Share Fund
(A Series of GMO Trust)
Tax Information for the Tax Year Ended February 29, 2008 (Unaudited)
The Fund will notify shareholders of amounts for use in preparing 2008 income tax forms in January 2009.
The Fund hereby designates as qualified interest income with respect to its taxable year ended February 29, 2008, $961,842 or if determined to be different, the qualified interest income of such year.
17
Trustees and Officers (Unaudited)
The following tables list the Trust's Trustees and Officers as of the date of this report; their address and date of birth ("DOB"); their position with the Trust; the length of time holding that position with the Trust; their principal occupation(s) during the past five years; the number of portfolios in the fund complex they oversee; and other directorships they hold in companies subject to registration or reporting requirements of the Securities Exchange Act of 1934 (generally called "public companies") or in registered investment companies. The Trust's Statement of Additional Information ("SAI") includes additional information about the Trust's trustees, including changes subsequent to the date of the report. The SAI is available, without charge, upon request by writing GMO, c/o GMO Trust, 40 Rowes Wharf, Boston, MA 02110.
Independent Trustees:
| Name, Address, and DOB | Position(s) Held with Trust | Term of Office1 and Length of Time Served | Principal Occupation(s) During Past Five Years | Number of Portfolios in Fund Complex Overseen by Trustee | Other Directorships Held by Trustee | ||||||||||||||||||
| Donald W. Glazer, Esq. c/o GMO Trust 40 Rowes Wharf Boston, MA 02110 DOB: 07/26/1944 | Chairman of the Board of Trustees | Chairman of the Board of Trustees since March 2005; Lead Independent Trustee (September 2004 – March 2005); Trustee since December 2000. | Consultant – Law and Business2; Vice Chair (since 2002) and Secretary, Provant, Inc. (provider of personnel performance improvement services and training products); Author of Legal Treatises. | 47 | None. | ||||||||||||||||||
1 Each Trustee is elected to serve during the continued lifetime of the Trust until he/she dies, resigns or is removed, or if sooner, until the next meeting of Shareholders called for the purpose of electing Trustees and until the election and qualification of his/her successor.
2 As part of Mr. Glazer's work as a consultant, he provides part-time consulting services to Goodwin Procter LLP ("Goodwin"). Goodwin has provided legal services to Renewable Resources, LLC, an affiliate of GMO; GMO, in connection with its relationship with Renewable Resources; and funds managed by Renewable Resources. Mr. Glazer has represented that he has no financial interest in, and is not involved in the provision of, such legal services. In the calendar years ended December 31, 2006 and December 31, 2007, these entities paid $825,738 and $291,721 respectively, in legal fees and disbursements to Goodwin.
18
Independent Trustees — (Continued)
| Name, Address, and DOB | Position(s) Held with Trust | Term of Office1 and Length of Time Served | Principal Occupation(s) During Past Five Years | Number of Portfolios in Fund Complex Overseen by Trustee | Other Directorships Held by Trustee | ||||||||||||||||||
| Jay O. Light c/o GMO Trust 40 Rowes Wharf Boston, MA 02110 DOB: 10/03/1941 | Trustee | Since May 1996. | Dean (since April 2006), Acting Dean (August 2005 – April 2006), Senior Associate Dean (1998 – 2005), and Professor of Business Administration, Harvard Business School. | 47 | Director of Harvard Management Company, Inc.3 and Verde, Inc.; Director of Partners HealthCare System, Inc. and Chair of its Investment Committee.4 | ||||||||||||||||||
| W. Nicholas Thorndike c/o GMO Trust 40 Rowes Wharf Boston, MA 02110 DOB: 03/28/1933 | Trustee | Since March 2005. | Director or trustee of various corporations and charitable organizations, including Courier Corporation (a book publisher and manufacturer) (July 1989 – present); Putnam Funds (December 1992 – June 2004); and Providence Journal (a newspaper publisher) (December 1986 – December 2003). | 47 | Director of Courier Corporation (a book publisher and manufacturer); Member of the Investment Committee of Partners HealthCare System, Inc.4 | ||||||||||||||||||
1 Each Trustee is elected to serve during the continued lifetime of the Trust until he/she dies, resigns or is removed, or if sooner, until the next meeting of Shareholders called for the purpose of electing Trustees and until the election and qualification of his/her successor.
3 Harvard Management Company, Inc. is a client of the Manager.
4 Partners HealthCare System, Inc. is a client of the Manager.
19
Principal Officers:
| Name, Address, and DOB | Position(s) Held with Trust | Term of Office5 and Length of Time Served | Principal Occupation(s) During Past Five Years | ||||||||||||
| Scott Eston c/o GMO Trust 40 Rowes Wharf Boston, MA 02110 DOB: 01/20/1956 | President and Chief Executive Officer | President and Chief Executive Officer since October 2002; Chief Financial Officer, November 2006 – February 2007. | Chief Financial Officer, Chief Operating Officer and Member, Grantham, Mayo, Van Otterloo & Co. LLC. | ||||||||||||
| Sheppard N. Burnett c/o GMO Trust 40 Rowes Wharf Boston, MA 02110 DOB: 10/24/1968 | Treasurer and Chief Financial Officer | Chief Financial Officer since March 2007; Treasurer since November 2006; Assistant Treasurer, September 2004 – November 2006. | Fund Administration Staff, Grantham, Mayo, Van Otterloo & Co. LLC (June 2004 – present); Vice President, Director of Tax, Columbia Management Group (2002 – 2004). | ||||||||||||
| Brent C. Arvidson c/o GMO Trust 40 Rowes Wharf Boston, MA 02110 DOB: 06/26/1969 | Assistant Treasurer | Since August 1998. | Senior Fund Administrator, Grantham, Mayo, Van Otterloo & Co. LLC. | ||||||||||||
| John L. Nasrah c/o GMO Trust 40 Rowes Wharf Boston, MA 02110 DOB: 05/27/1977 | Assistant Treasurer | Since March 2007. | Fund Administrator, Grantham, Mayo, Van Otterloo & Co. LLC (September 2004 – present); Tax Analyst, Bain & Company, Inc (June 2003 – September 2004); Senior Tax Associate, PricewaterhouseCoopers LLP (2001 – 2003). | ||||||||||||
| Mahmoodur Rahman c/o GMO Trust 40 Rowes Wharf Boston, MA 02110 DOB: 11/30/1967 | Assistant Treasurer | Since September 2007. | Fund Administrator, Grantham, Mayo, Van Otterloo & Co. (April 2007 – present); Vice President and Senior Tax Manager, Massachusetts Financial Services Company (January 2000 – April 2007). | ||||||||||||
5 Officers are elected to hold such office until their successor is elected and qualified to carry out the duties and responsibilities of their office, or until he or she resigns or is removed from office.
20
Principal Officers — (Continued)
| Name, Address, and DOB | Position(s) Held with Trust | Term of Office5 and Length of Time Served | Principal Occupation(s) During Past Five Years | ||||||||||||
| Michael E. Gillespie c/o GMO Trust 40 Rowes Wharf Boston, MA 02110 DOB: 02/18/1958 | Chief Compliance Officer | Since March 2005. | Vice President of Compliance (June 2004 – February 2005) and Director of Domestic Compliance (March 2002 – June 2004), Fidelity Investments; Vice President and Senior Counsel, State Street Bank and Trust Company (May 1998 – March 2002). | ||||||||||||
| Jason B. Harrison c/o GMO Trust 40 Rowes Wharf Boston, MA 02110 DOB: 01/29/1977 | Vice President and Clerk | Vice President since November 2006; Clerk since March 2006. | Legal Counsel, Grantham, Mayo, Van Otterloo & Co. LLC (since February 2006) and Attorney, Ropes & Gray LLP (September 2002 – February 2006). | ||||||||||||
| David L. Bohan c/o GMO Trust 40 Rowes Wharf Boston, MA 02110 DOB: 06/21/1964 | Vice President and Assistant Clerk | Vice President since March 2005; Assistant Clerk since March 2006. | Legal Counsel, Grantham, Mayo, Van Otterloo & Co. LLC (September 2003 – present); Attorney, Goodwin Procter LLP (September 1996 – September 2003). | ||||||||||||
| Gregory L. Pottle c/o GMO Trust 40 Rowes Wharf Boston, MA 02110 DOB: 07/09/1971 | Vice President and Assistant Clerk | Since November 2006. | Legal Counsel, Grantham, Mayo, Van Otterloo & Co. LLC. | ||||||||||||
| Anne K. Trinque c/o GMO Trust 40 Rowes Wharf Boston, MA 02110 DOB: 04/15/1978 | Vice President and Assistant Clerk | Since September 2007. | Legal Counsel, Grantham, Mayo, Van Otterloo & Co. LLC (since January 2007); Attorney, Goodwin Procter LLP (September 2003 – January 2007). | ||||||||||||
| Cheryl Wakeham c/o GMO Trust 40 Rowes Wharf Boston, MA 02110 DOB: 10/29/1958 | Anti-Money Laundering Officer | Since December 2004. | Manager, Client Service Administration, Grantham, Mayo, Van Otterloo & Co. LLC. | ||||||||||||
5 Officers are elected to hold such office until their successor is elected and qualified to carry out the duties and responsibilities of their office, or until he or she resigns or is removed from office.
21
GMO U.S. Core Equity Fund
(A Series of GMO Trust)
Annual Report
February 29, 2008
For a free copy of the Fund's proxy voting guidelines, shareholders may call 1-617-346-7646 (collect), visit our website at www.gmo.com, or visit the Securities and Exchange Commission's website at www.sec.gov. Information regarding how the Fund voted proxies relating to portfolio securities during the most recent 12-month period ended June 30 is available on our website at www.gmo.com, or on the Securities and Exchange Commission's website at www.sec.gov.
The Fund files its complete schedule of portfolio holdings with the Securities and Exchange Commission for the first and third quarter of each fiscal year on Form N-Q, which is available on the Commission's website at www.sec.gov. The Fund's Form N-Q may be reviewed and copied at the Commission's Public Reference Room in Washington, D.C. Information on the operation of the Public Reference Room may be obtained by calling 1-800-SEC-0330. The Fund has a policy with respect to disclosure of portfolio holdings under which it may also make available on GMO's website (www.gmo.com) a complete schedule of portfolio holdings.
This report is prepared for the general information of shareholders. It is authorized for distribution to prospective investors only when preceded or accompanied by a prospectus for the GMO Trust.
GMO U.S. Core Equity Fund
(A Series of GMO Trust)
Portfolio Management
Day-to-day management of the Fund's portfolio is the responsibility of the U.S. Quantitative team at Grantham, Mayo, Van Otterloo & Co. LLC.
Management Discussion and Analysis of Fund Performance
The Class III shares of the GMO U.S. Core Equity Fund returned -7.3% for the fiscal year ended February 29, 2008, as compared to -3.6% for the S&P 500 Index. The Fund was invested substantially in U.S. equity securities throughout the period.
Stock selection detracted from returns relative to the S&P 500 Index. Selections in Telecommunication Services and Information Technology added to relative returns while selections in Consumer Discretionary, Financials, and Energy detracted. Individual names adding to relative returns included overweight positions in Exxon Mobil and Merck and an underweight in Wachovia. Names detracting from relative returns included overweight positions in Home Depot, Citigroup, and Lowe's Companies.
Sector selection added to returns relative to the S&P 500 Index. Sector weightings positively impacting relative performance included an underweight position in Financials and overweight positions in Health Care and Consumer Staples. Sector weightings negatively impacting relative performance included an overweight in Consumer Discretionary and underweight positions in Industrials and Materials.
The views expressed herein are exclusively those of Grantham, Mayo, Van Otterloo & Co. LLC Management as of the date of this report and are subject to change. GMO disclaims any responsibility to update such views. They are not meant as investment advice. References to specific securities are not recommendations of such securities and may not be representative of any GMO portfolio's current or future investments.
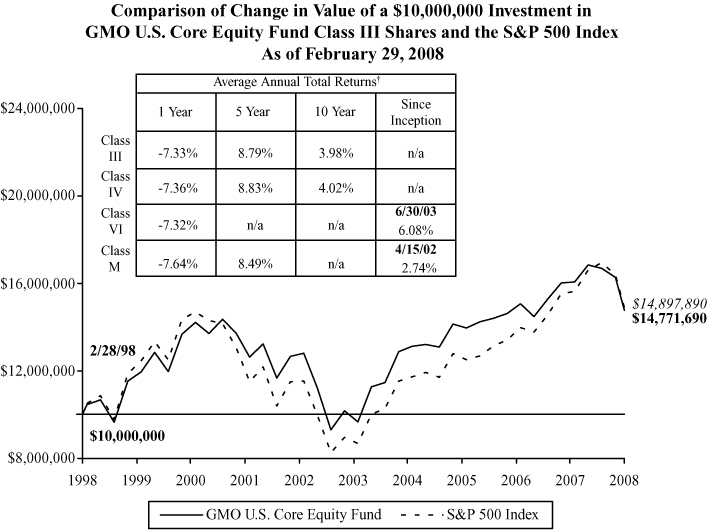
Performance data quoted represents past performance and is not indicative of future results. The investment return and principal value of an investment will fluctuate so that an investor's shares, when redeemed, may be worth more or less than their original cost. Current performance data may be lower or higher than the performance data provided herein. To obtain performance information to the most recent month-end, visit www.gmo.com. Performance shown is net of all fees after reimbursement from the Manager. Returns would have been lower had certain expenses not been reimbursed during the periods shown and do not include the effect of taxes on distributions and redemptions. All information is unaudited. Performance for Classes IV, VI and M will vary due to different fees.
† The Fund is the successor to the GMO U.S. Core Fund, therefore, performance for the periods prior to September 16, 2005 is that of GMO U.S. Core Fund.
GMO U.S. Core Equity Fund
(A Series of GMO Trust)
Investments Concentration Summary
February 29, 2008 (Unaudited)
| Asset Class Summary | % of Total Net Assets | ||||||
| Common Stocks | 95.4 | % | |||||
| Short-Term Investments | 4.4 | ||||||
| Futures | (0.0 | ) | |||||
| Other | 0.2 | ||||||
| 100.0 | % | ||||||
| Industry Sector Summary | % of Equity Investments | ||||||
| Health Care | 23.0 | % | |||||
| Energy | 17.2 | ||||||
| Information Technology | 16.8 | ||||||
| Consumer Staples | 15.0 | ||||||
| Consumer Discretionary | 9.2 | ||||||
| Industrials | 7.0 | ||||||
| Financials | 6.2 | ||||||
| Materials | 2.4 | ||||||
| Telecommunication Services | 2.2 | ||||||
| Utilities | 1.0 | ||||||
| 100.0 | % | ||||||
1
GMO U.S. Core Equity Fund
(A Series of GMO Trust)
Schedule of Investments
(showing percentage of total net assets)
February 29, 2008
| Shares | Description | Value ($) | |||||||||||||
| COMMON STOCKS — 95.4% | |||||||||||||||
| Consumer Discretionary — 8.8% | |||||||||||||||
| 70,000 | Abercrombie & Fitch Co.-Class A | 5,427,100 | |||||||||||||
| 10,600 | Advance Auto Parts, Inc. | 355,524 | |||||||||||||
| 300,400 | Amazon.com, Inc. * | 19,366,788 | |||||||||||||
| 255,500 | American Eagle Outfitters, Inc. | 5,460,035 | |||||||||||||
| 368,000 | Apollo Group, Inc.-Class A * | 22,587,840 | |||||||||||||
| 16,600 | Autoliv, Inc. | 828,340 | |||||||||||||
| 135,500 | AutoNation, Inc. * | 1,974,235 | |||||||||||||
| 49,000 | AutoZone, Inc. * | 5,638,920 | |||||||||||||
| 206,600 | Bed Bath & Beyond, Inc. * | 5,855,044 | |||||||||||||
| 22,000 | Best Buy Co., Inc. | 946,220 | |||||||||||||
| 23,600 | BorgWarner, Inc. | 1,017,396 | |||||||||||||
| 23,400 | Carnival Corp. | 920,790 | |||||||||||||
| 365,000 | Coach, Inc. * | 11,066,800 | |||||||||||||
| 138,300 | Discovery Holding Co.-Class A * | 3,121,431 | |||||||||||||
| 169,100 | Expedia, Inc. * | 3,877,463 | |||||||||||||
| 79,800 | Family Dollar Stores, Inc. | 1,528,170 | |||||||||||||
| 886,711 | Ford Motor Co. * | 5,790,223 | |||||||||||||
| 52,200 | GameStop Corp.-Class A * | 2,211,192 | |||||||||||||
| 201,300 | Gannett Co., Inc. | 6,069,195 | |||||||||||||
| 119,200 | General Motors Corp. | 2,774,976 | |||||||||||||
| 88,600 | Goodyear Tire & Rubber Co. (The) * | 2,401,060 | |||||||||||||
| 149,500 | Harley-Davidson, Inc. | 5,555,420 | |||||||||||||
| 5,400 | Harman International Industries, Inc. | 222,480 | |||||||||||||
| 69,100 | Hasbro, Inc. | 1,780,707 | |||||||||||||
| 2,600,304 | Home Depot, Inc. | 69,038,071 | |||||||||||||
| 34,600 | IAC/InterActive Corp. * | 688,540 | |||||||||||||
| 107,900 | ITT Educational Services, Inc. * | 5,958,238 | |||||||||||||
| 312,100 | Johnson Controls, Inc. | 10,255,606 | |||||||||||||
| 214,100 | Kohl's Corp. * | 9,514,604 | |||||||||||||
| 62,000 | Liberty Global, Inc.-Class A * | 2,331,200 | |||||||||||||
| 12,400 | Liberty Media Holding Corp. Capital-Class A * | 1,439,764 | |||||||||||||
| 81,600 | Liz Claiborne, Inc. | 1,450,848 | |||||||||||||
See accompanying notes to the financial statements.
2
GMO U.S. Core Equity Fund
(A Series of GMO Trust)
Schedule of Investments — (Continued)
(showing percentage of total net assets)
February 29, 2008
| Shares | Description | Value ($) | |||||||||||||
| Consumer Discretionary — continued | |||||||||||||||
| 1,438,400 | Lowe's Cos., Inc. | 34,478,448 | |||||||||||||
| 59,000 | Mattel Co. | 1,139,880 | |||||||||||||
| 274,200 | McDonald's Corp. | 14,836,962 | |||||||||||||
| 21,300 | McGraw-Hill Cos., Inc. | 871,809 | |||||||||||||
| 81,473 | MGM Mirage * | 5,017,922 | |||||||||||||
| 11,800 | Mohawk Industries, Inc. * | 842,638 | |||||||||||||
| 126,000 | Nike, Inc.-Class B | 7,585,200 | |||||||||||||
| 19,300 | Nordstrom, Inc. | 714,679 | |||||||||||||
| 490,500 | Office Depot, Inc. * | 5,576,985 | |||||||||||||
| 19,800 | Polo Ralph Lauren Corp. | 1,231,362 | |||||||||||||
| 11,500 | R.H. Donnelley Corp. * | 81,535 | |||||||||||||
| 48,400 | RadioShack Corp. | 844,580 | |||||||||||||
| 266,500 | Staples, Inc. | 5,929,625 | |||||||||||||
| 19,100 | Starbucks Corp. * | 343,227 | |||||||||||||
| 287,000 | Target Corp. | 15,099,070 | |||||||||||||
| 76,900 | Tiffany & Co. | 2,894,516 | |||||||||||||
| 35,500 | Toll Brothers, Inc. * | 752,955 | |||||||||||||
| 91,600 | VF Corp. | 6,965,264 | |||||||||||||
| 9,500 | Wynn Resorts Ltd. | 956,650 | |||||||||||||
| 31,400 | Yum! Brands, Inc. | 1,081,730 | |||||||||||||
| Total Consumer Discretionary | 324,699,257 | ||||||||||||||
| Consumer Staples — 14.3% | |||||||||||||||
| 828,300 | Altria Group, Inc. | 60,581,862 | |||||||||||||
| 216,700 | Anheuser-Busch Cos., Inc. | 10,204,403 | |||||||||||||
| 86,100 | Avon Products, Inc. | 3,276,966 | |||||||||||||
| 5,800 | Clorox Co. | 337,502 | |||||||||||||
| 30,300 | Coca Cola Enterprises, Inc. | 740,229 | |||||||||||||
| 2,039,600 | Coca-Cola Co. (The) | 119,235,016 | |||||||||||||
| 116,200 | Colgate-Palmolive Co. | 8,841,658 | |||||||||||||
| 27,900 | Costco Wholesale Corp. | 1,727,568 | |||||||||||||
| 56,300 | CVS Caremark Corp. | 2,273,394 | |||||||||||||
| 92,300 | Energizer Holdings, Inc. * | 8,568,209 | |||||||||||||
| 55,700 | Estee Lauder Cos. (The), Inc.-Class A | 2,371,706 | |||||||||||||
See accompanying notes to the financial statements.
3
GMO U.S. Core Equity Fund
(A Series of GMO Trust)
Schedule of Investments — (Continued)
(showing percentage of total net assets)
February 29, 2008
| Shares | Description | Value ($) | |||||||||||||
| Consumer Staples — continued | |||||||||||||||
| 20,400 | Kellogg Co. | 1,034,688 | |||||||||||||
| 197,800 | Kimberly-Clark Corp. | 12,892,604 | |||||||||||||
| 254,606 | Kraft Foods, Inc. | 7,936,069 | |||||||||||||
| 199,900 | Kroger Co. | 4,847,575 | |||||||||||||
| 10,400 | Pepsi Bottling Group, Inc. | 353,704 | |||||||||||||
| 11,600 | PepsiAmericas, Inc. | 293,480 | |||||||||||||
| 980,600 | PepsiCo, Inc. | 68,210,536 | |||||||||||||
| 581,600 | Procter & Gamble Co. (The) | 38,490,288 | |||||||||||||
| 150,400 | Safeway, Inc. | 4,322,496 | |||||||||||||
| 95,225 | Supervalu, Inc. | 2,499,656 | |||||||||||||
| 169,000 | Tyson Foods, Inc.-Class A | 2,435,290 | |||||||||||||
| 67,500 | UST, Inc. | 3,664,575 | |||||||||||||
| 561,300 | Walgreen Co. | 20,493,063 | |||||||||||||
| 2,828,400 | Wal-Mart Stores, Inc. | 140,260,356 | |||||||||||||
| 42,900 | WM Wrigley Jr. Co. | 2,567,994 | |||||||||||||
| Total Consumer Staples | 528,460,887 | ||||||||||||||
| Energy — 16.4% | |||||||||||||||
| 121,300 | Anadarko Petroleum Corp. | 7,731,662 | |||||||||||||
| 130,700 | Apache Corp. | 14,992,597 | |||||||||||||
| 18,200 | Baker Hughes, Inc. | 1,224,678 | |||||||||||||
| 111,300 | Cameron International Corp. * | 4,728,024 | |||||||||||||
| 1,574,600 | Chevron Corp. | 136,454,836 | |||||||||||||
| 607,468 | ConocoPhillips | 50,243,678 | |||||||||||||
| 26,000 | Denbury Resources, Inc. * | 829,140 | |||||||||||||
| 81,300 | Devon Energy Corp. | 8,351,136 | |||||||||||||
| 49,400 | Diamond Offshore Drilling, Inc. | 5,969,002 | |||||||||||||
| 2,422,100 | Exxon Mobil Corp. | 210,746,921 | |||||||||||||
| 40,900 | FMC Technologies, Inc. * | 2,317,394 | |||||||||||||
| 7,900 | Forest Oil Corp. * | 389,707 | |||||||||||||
| 104,200 | Halliburton Co. | 3,990,860 | |||||||||||||
| 57,800 | Hess Corp. | 5,385,804 | |||||||||||||
| 36,400 | Marathon Oil Corp. | 1,935,024 | |||||||||||||
| 48,800 | Murphy Oil Corp. | 3,922,544 | |||||||||||||
See accompanying notes to the financial statements.
4
GMO U.S. Core Equity Fund
(A Series of GMO Trust)
Schedule of Investments — (Continued)
(showing percentage of total net assets)
February 29, 2008
| Shares | Description | Value ($) | |||||||||||||
| Energy — continued | |||||||||||||||
| 63,200 | Noble Corp. | 3,106,280 | |||||||||||||
| 397,300 | Occidental Petroleum Corp. | 30,739,101 | |||||||||||||
| 9,600 | Rowan Cos., Inc. | 386,976 | |||||||||||||
| 587,900 | Schlumberger Ltd. | 50,823,955 | |||||||||||||
| 108,300 | Smith International, Inc. | 6,826,149 | |||||||||||||
| 49,600 | Sunoco, Inc. | 3,029,568 | |||||||||||||
| 167,429 | Transocean, Inc. * | 23,525,449 | |||||||||||||
| 324,100 | Valero Energy Corp. | 18,723,257 | |||||||||||||
| 137,800 | Weatherford International Ltd. * | 9,497,176 | |||||||||||||
| Total Energy | 605,870,918 | ||||||||||||||
| Financials — 5.9% | |||||||||||||||
| 69,400 | ACE Ltd. | 3,903,056 | |||||||||||||
| 136,900 | Aflac, Inc. | 8,543,929 | |||||||||||||
| 425,900 | Allstate Corp. (The) | 20,328,207 | |||||||||||||
| 558,500 | American International Group, Inc. | 26,171,310 | |||||||||||||
| 97,200 | AON Corp. | 4,044,492 | |||||||||||||
| 820,777 | Bank of America Corp. | 32,617,678 | |||||||||||||
| 88,800 | BB&T Corp. | 2,764,344 | |||||||||||||
| 86,000 | Brown & Brown, Inc. | 1,533,380 | |||||||||||||
| 44,500 | Charles Schwab Corp. (The) | 872,645 | |||||||||||||
| 102,300 | Chubb Corp. | 5,207,070 | |||||||||||||
| 2,109,100 | Citigroup, Inc. | 50,006,761 | |||||||||||||
| 32,200 | CNA Financial Corp. | 858,130 | |||||||||||||
| 56,300 | Comerica, Inc. | 2,040,312 | |||||||||||||
| 40,100 | Eaton Vance Corp. | 1,277,185 | |||||||||||||
| 26,800 | Fidelity National Title Group, Inc.-Class A | 471,948 | |||||||||||||
| 13,300 | Fifth Third Bancorp | 304,570 | |||||||||||||
| 30,500 | First American Corp. | 1,062,315 | |||||||||||||
| 16,600 | First Horizon National Corp. | 269,584 | |||||||||||||
| 35,600 | Franklin Resources, Inc. | 3,359,572 | |||||||||||||
| 3,500 | Goldman Sachs Group, Inc. | 593,705 | |||||||||||||
| 32,400 | Hartford Financial Services Group, Inc. | 2,264,760 | |||||||||||||
| 80,600 | Leucadia National Corp. | 3,647,956 | |||||||||||||
See accompanying notes to the financial statements.
5
GMO U.S. Core Equity Fund
(A Series of GMO Trust)
Schedule of Investments — (Continued)
(showing percentage of total net assets)
February 29, 2008
| Shares | Description | Value ($) | |||||||||||||
| Financials — continued | |||||||||||||||
| 800 | Markel Corp. * | 371,800 | |||||||||||||
| 10,900 | Moody's Corp. | 413,982 | |||||||||||||
| 85,900 | Morgan Stanley | 3,618,108 | |||||||||||||
| 303,400 | National City Corp. | 4,811,924 | |||||||||||||
| 38,300 | Old Republic International Corp. | 525,476 | |||||||||||||
| 220,200 | Progressive Corp. (The) | 4,036,266 | |||||||||||||
| 54,800 | Prudential Financial, Inc. | 3,998,756 | |||||||||||||
| 20,800 | Safeco Corp. | 962,208 | |||||||||||||
| 45,100 | SEI Investment Co. | 1,127,951 | |||||||||||||
| 6,500 | T. Rowe Price Group, Inc. | 328,445 | |||||||||||||
| 51,600 | Torchmark Corp. | 3,109,416 | |||||||||||||
| 254,300 | Travelers Cos. (The), Inc. | 11,802,063 | |||||||||||||
| 7,800 | UnionBanCal Corp. | 363,246 | |||||||||||||
| 182,200 | Unum Group | 4,174,202 | |||||||||||||
| 158,100 | US Bancorp | 5,062,362 | |||||||||||||
| 13,150 | W.R. Berkley Corp. | 378,589 | |||||||||||||
| 164,804 | Washington Mutual, Inc. | 2,439,099 | |||||||||||||
| Total Financials | 219,666,802 | ||||||||||||||
| Health Care — 21.9% | |||||||||||||||
| 442,100 | Abbott Laboratories | 23,674,455 | |||||||||||||
| 141,800 | Aetna, Inc. | 7,033,280 | |||||||||||||
| 156,100 | AmerisourceBergen Corp. | 6,512,492 | |||||||||||||
| 269,800 | Amgen, Inc. * | 12,281,296 | |||||||||||||
| 15,200 | Baxter International, Inc. | 897,104 | |||||||||||||
| 116,100 | Biogen Idec, Inc. * | 6,775,596 | |||||||||||||
| 81,652 | Bristol-Myers Squibb Co. | 1,846,152 | |||||||||||||
| 150,900 | Cardinal Health, Inc. | 8,924,226 | |||||||||||||
| 21,400 | Cerner Corp. * | 929,830 | |||||||||||||
| 101,000 | Cigna Corp. | 4,502,580 | |||||||||||||
| 8,900 | Covance, Inc. * | 751,249 | |||||||||||||
| 237,600 | Coventry Health Care, Inc. * | 12,324,312 | |||||||||||||
| 8,800 | DENTSPLY International, Inc. | 343,552 | |||||||||||||
| 384,400 | Eli Lilly & Co. | 19,227,688 | |||||||||||||
See accompanying notes to the financial statements.
6
GMO U.S. Core Equity Fund
(A Series of GMO Trust)
Schedule of Investments — (Continued)
(showing percentage of total net assets)
February 29, 2008
| Shares | Description | Value ($) | |||||||||||||
| Health Care — continued | |||||||||||||||
| 545,600 | Express Scripts, Inc. * | 32,244,960 | |||||||||||||
| 305,900 | Forest Laboratories, Inc. * | 12,165,643 | |||||||||||||
| 100,300 | Gilead Sciences, Inc. * | 4,746,196 | |||||||||||||
| 26,600 | Intuitive Surgical, Inc. * | 7,499,072 | |||||||||||||
| 8,500 | Invitrogen Corp. * | 718,165 | |||||||||||||
| 1,845,800 | Johnson & Johnson | 114,365,768 | |||||||||||||
| 7,300 | Kinetic Concepts, Inc. * | 375,147 | |||||||||||||
| 70,100 | King Pharmaceuticals, Inc. * | 743,060 | |||||||||||||
| 251,800 | McKesson Corp. | 14,795,768 | |||||||||||||
| 355,900 | Medco Health Solutions, Inc. * | 15,769,929 | |||||||||||||
| 410,200 | Medtronic, Inc. | 20,247,472 | |||||||||||||
| 2,123,700 | Merck & Co., Inc. | 94,079,910 | |||||||||||||
| 161,400 | Patterson Cos., Inc. * | 5,681,280 | |||||||||||||
| 6,277,680 | Pfizer, Inc. | 139,866,710 | |||||||||||||
| 71,400 | Quest Diagnostics, Inc. | 3,403,638 | |||||||||||||
| 413,100 | Schering-Plough Corp. | 8,964,270 | |||||||||||||
| 81,600 | St. Jude Medical, Inc. * | 3,507,168 | |||||||||||||
| 353,200 | Stryker Corp. | 22,996,852 | |||||||||||||
| 2,376,102 | UnitedHealth Group, Inc. | 110,441,221 | |||||||||||||
| 15,000 | Waters Corp. * | 894,150 | |||||||||||||
| 367,400 | WellPoint, Inc. * | 25,747,392 | |||||||||||||
| 378,200 | Wyeth | 16,497,084 | |||||||||||||
| 634,100 | Zimmer Holdings, Inc. * | 47,741,389 | |||||||||||||
| Total Health Care | 809,516,056 | ||||||||||||||
| Industrials — 6.7% | |||||||||||||||
| 611,000 | 3M Co. | 47,902,400 | |||||||||||||
| 4,400 | Boeing Co. | 364,276 | |||||||||||||
| 165,700 | Caterpillar, Inc. | 11,985,081 | |||||||||||||
| 6,500 | CH Robinson Worldwide, Inc. | 330,005 | |||||||||||||
| 17,300 | CSX Corp. | 839,396 | |||||||||||||
| 224,600 | Danaher Corp. | 16,654,090 | |||||||||||||
| 241,700 | Deere & Co. | 20,595,257 | |||||||||||||
| 19,000 | Eaton Corp. | 1,531,970 | |||||||||||||
See accompanying notes to the financial statements.
7
GMO U.S. Core Equity Fund
(A Series of GMO Trust)
Schedule of Investments — (Continued)
(showing percentage of total net assets)
February 29, 2008
| Shares | Description | Value ($) | |||||||||||||
| Industrials — continued | |||||||||||||||
| 24,500 | Emerson Electric Co. | 1,248,520 | |||||||||||||
| 30,300 | Fastenal Co. | 1,231,998 | |||||||||||||
| 26,100 | FedEx Corp. | 2,300,193 | |||||||||||||
| 12,900 | Flowserve Corp. | 1,404,810 | |||||||||||||
| 60,900 | Fluor Corp. | 8,480,325 | |||||||||||||
| 17,000 | General Dynamics Corp. | 1,391,450 | |||||||||||||
| 67,400 | Goodrich Corp. | 3,992,102 | |||||||||||||
| 6,100 | Harsco Corp. | 344,589 | |||||||||||||
| 320,800 | Honeywell International, Inc. | 18,458,832 | |||||||||||||
| 27,900 | Illinois Tool Works, Inc. | 1,369,053 | |||||||||||||
| 94,600 | Ingersoll-Rand | 3,959,956 | |||||||||||||
| 52,200 | ITT Industries, Inc. | 2,935,728 | |||||||||||||
| 93,400 | Jacobs Engineering Group, Inc. * | 7,499,086 | |||||||||||||
| 99,400 | L-3 Communications Holdings, Inc. | 10,565,226 | |||||||||||||
| 12,700 | Manpower, Inc. | 720,090 | |||||||||||||
| 63,700 | Masco Corp. | 1,190,553 | |||||||||||||
| 74,900 | McDermott International, Inc. * | 3,911,278 | |||||||||||||
| 4,900 | Northrop Grumman Corp. | 385,189 | |||||||||||||
| 8,300 | Oshkosh Truck Corp. | 332,581 | |||||||||||||
| 292,800 | Paccar, Inc. | 12,701,664 | |||||||||||||
| 53,300 | Pall Corp. | 2,098,421 | |||||||||||||
| 97,000 | Parker-Hannifin Corp. | 6,269,110 | |||||||||||||
| 90,000 | Precision Castparts Corp. | 9,935,100 | |||||||||||||
| 23,100 | Rockwell Collins, Inc. | 1,360,590 | |||||||||||||
| 25,300 | RR Donnelley & Sons Co. | 805,299 | |||||||||||||
| 14,000 | SPX Corp. | 1,432,200 | |||||||||||||
| 6,600 | Stericycle, Inc. * | 355,674 | |||||||||||||
| 93,100 | Textron, Inc. | 5,043,227 | |||||||||||||
| 43,400 | Trane, Inc. | 1,955,170 | |||||||||||||
| 43,000 | Tyco International Ltd. | 1,722,580 | |||||||||||||
| 26,300 | Union Pacific Corp. | 3,281,188 | |||||||||||||
| 107,800 | United Parcel Service, Inc.-Class B | 7,571,872 | |||||||||||||
| 277,800 | United Technologies Corp. | 19,587,678 | |||||||||||||
| 6,000 | W.W. Grainger, Inc. | 441,960 | |||||||||||||
| Total Industrials | 246,485,767 | ||||||||||||||
See accompanying notes to the financial statements.
8
GMO U.S. Core Equity Fund
(A Series of GMO Trust)
Schedule of Investments — (Continued)
(showing percentage of total net assets)
February 29, 2008
| Shares | Description | Value ($) | |||||||||||||
| Information Technology — 16.0% | |||||||||||||||
| 18,200 | Activision, Inc. * | 495,950 | |||||||||||||
| 10,600 | Adobe Systems, Inc. * | 356,690 | |||||||||||||
| 128,700 | Affiliated Computer Services, Inc.-Class A * | 6,531,525 | |||||||||||||
| 35,800 | Analog Devices, Inc. | 963,736 | |||||||||||||
| 411,000 | Apple, Inc. * | 51,383,220 | |||||||||||||
| 26,500 | Arrow Electronics, Inc. * | 864,165 | |||||||||||||
| 27,500 | Autodesk, Inc. * | 854,975 | |||||||||||||
| 70,200 | Avnet, Inc. * | 2,366,442 | |||||||||||||
| 96,100 | CA, Inc. | 2,198,768 | |||||||||||||
| 22,800 | Cadence Design Systems, Inc. * | 242,136 | |||||||||||||
| 2,577,600 | Cisco Systems, Inc. * | 62,816,112 | |||||||||||||
| 121,100 | Citrix Systems, Inc. * | 3,987,823 | |||||||||||||
| 30,200 | Cognizant Technologies Solutions Corp.-Class A * | 912,342 | |||||||||||||
| 220,600 | Corning, Inc. | 5,124,538 | |||||||||||||
| 16,400 | Cypress Semiconductor Corp. * | 356,536 | |||||||||||||
| 1,842,500 | Dell, Inc. * | 36,573,625 | |||||||||||||
| 5,100 | DST Systems, Inc. * | 358,326 | |||||||||||||
| 1,178,600 | eBay, Inc. * | 31,067,896 | |||||||||||||
| 1,750,400 | EMC Corp. * | 27,201,216 | |||||||||||||
| 270,100 | Fiserv, Inc. * | 14,212,662 | |||||||||||||
| 23,600 | FLIR Systems, Inc. * | 671,656 | |||||||||||||
| 79,500 | Google, Inc.-Class A * | 37,458,810 | |||||||||||||
| 148,900 | Hewlett-Packard Co. | 7,112,953 | |||||||||||||
| 1,007,500 | Intel Corp. | 20,099,625 | |||||||||||||
| 473,500 | International Business Machines Corp. | 53,912,710 | |||||||||||||
| 16,200 | Intersil Corp.-Class A | 376,974 | |||||||||||||
| 47,300 | Intuit, Inc. * | 1,256,288 | |||||||||||||
| 95,200 | Juniper Networks, Inc. * | 2,553,264 | |||||||||||||
| 36,100 | KLA-Tencor Corp. | 1,516,561 | |||||||||||||
| 26,100 | Lexmark International, Inc. * | 862,083 | |||||||||||||
| 50,100 | McAfee, Inc. * | 1,666,827 | |||||||||||||
| 3,578,000 | Microsoft Corp. | 97,393,160 | |||||||||||||
| 17,900 | National Semiconductor Corp. | 294,813 | |||||||||||||
| 59,300 | NCR Corp. * | 1,314,088 | |||||||||||||
See accompanying notes to the financial statements.
9
GMO U.S. Core Equity Fund
(A Series of GMO Trust)
Schedule of Investments — (Continued)
(showing percentage of total net assets)
February 29, 2008
| Shares | Description | Value ($) | |||||||||||||
| Information Technology — continued | |||||||||||||||
| 1,796,600 | Oracle Corp. * | 33,776,080 | |||||||||||||
| 1,698,800 | Qualcomm, Inc. | 71,978,156 | |||||||||||||
| 59,000 | Texas Instruments, Inc. | 1,767,640 | |||||||||||||
| 70,600 | Total System Services, Inc. | 1,569,438 | |||||||||||||
| 12,900 | Trimble Navigation Ltd. * | 352,686 | |||||||||||||
| 81,500 | VeriSign, Inc. * | 2,836,200 | |||||||||||||
| 55,600 | Western Digital Corp. * | 1,716,372 | |||||||||||||
| 54,200 | Xilinx, Inc. | 1,211,912 | |||||||||||||
| Total Information Technology | 590,566,979 | ||||||||||||||
| Materials — 2.3% | |||||||||||||||
| 43,600 | Air Products & Chemicals, Inc. | 3,981,988 | |||||||||||||
| 183,900 | Alcoa, Inc. | 6,830,046 | |||||||||||||
| 10,700 | Ball Corp. | 471,870 | |||||||||||||
| 76,800 | Celanese Corp.-Class A | 2,987,520 | |||||||||||||
| 15,200 | Crown Holdings, Inc. * | 378,632 | |||||||||||||
| 47,500 | Dow Chemical Co. (The) | 1,790,275 | |||||||||||||
| 6,900 | FMC Corp. | 390,609 | |||||||||||||
| 59,600 | Freeport-McMoRan Copper & Gold, Inc. | 6,011,256 | |||||||||||||
| 25,400 | Lubrizol Corp. | 1,480,820 | |||||||||||||
| 21,400 | Martin Marietta Materials, Inc. | 2,302,640 | |||||||||||||
| 341,400 | Monsanto Co. | 39,493,152 | |||||||||||||
| 108,200 | Owens-IIlinois, Inc. * | 6,107,890 | |||||||||||||
| 83,100 | Praxair, Inc. | 6,671,268 | |||||||||||||
| 14,500 | Reliance Steel & Aluminum Co. | 804,895 | |||||||||||||
| 42,700 | Temple-Inland, Inc. | 586,271 | |||||||||||||
| 22,400 | Vulcan Materials Co. | 1,570,240 | |||||||||||||
| 50,500 | Weyerhaeuser Co. | 3,090,600 | |||||||||||||
| Total Materials | 84,949,972 | ||||||||||||||
| Telecommunication Services — 2.1% | |||||||||||||||
| 618,767 | AT&T, Inc. | 21,551,655 | |||||||||||||
| 1,582,422 | Verizon Communications, Inc. | 57,473,567 | |||||||||||||
| Total Telecommunication Services | 79,025,222 | ||||||||||||||
See accompanying notes to the financial statements.
10
GMO U.S. Core Equity Fund
(A Series of GMO Trust)
Schedule of Investments — (Continued)
(showing percentage of total net assets)
February 29, 2008
| Shares / Par Value ($) | Description | Value ($) | |||||||||||||
| Utilities — 1.0% | |||||||||||||||
| 35,300 | American Electric Power Co., Inc. | 1,444,476 | |||||||||||||
| 22,700 | Centerpoint Energy, Inc. | 333,236 | |||||||||||||
| 37,000 | Constellation Energy Group, Inc. | 3,268,950 | |||||||||||||
| 244,400 | Duke Energy Corp. | 4,286,776 | |||||||||||||
| 51,700 | Dynegy, Inc.-Class A * | 382,580 | |||||||||||||
| 63,400 | Edison International | 3,131,960 | |||||||||||||
| 24,800 | Entergy Corp. | 2,547,952 | |||||||||||||
| 7,100 | Equitable Resources, Inc. | 437,502 | |||||||||||||
| 36,800 | FPL Group, Inc. | 2,218,672 | |||||||||||||
| 68,000 | Mirant Corp. * | 2,516,000 | |||||||||||||
| 35,600 | Northeast Utilities | 903,172 | |||||||||||||
| 82,500 | NRG Energy, Inc. * | 3,404,775 | |||||||||||||
| 29,800 | PPL Corp. | 1,352,324 | |||||||||||||
| 142,800 | Public Service Enterprise Group, Inc. | 6,297,480 | |||||||||||||
| 176,200 | Reliant Energy, Inc. * | 4,017,360 | |||||||||||||
| Total Utilities | 36,543,215 | ||||||||||||||
| TOTAL COMMON STOCKS (COST $3,783,532,273) | 3,525,785,075 | ||||||||||||||
| SHORT-TERM INVESTMENTS — 4.4% | |||||||||||||||
| 90,856,052 | Citigroup Global Markets Repurchase Agreement, dated 02/29/08, due 03/03/08, with a maturity value of $90,861,730 and an effective yield of 0.75%, collateralized by a U.S. Treasury Bond with a rate of 11.25%, maturity date of 02/15/15 and a market value, including accrued interest, of $92,363,688. | 90,856,052 | |||||||||||||
| 73,310,000 | U.S. Treasury Bill, 1.79%, due 07/24/08 (a) | 72,791,625 | |||||||||||||
| TOTAL SHORT-TERM INVESTMENTS (COST $163,495,774) | 163,647,677 | ||||||||||||||
| TOTAL INVESTMENTS — 99.8% (Cost $3,947,028,047) | 3,689,432,752 | ||||||||||||||
| Other Assets and Liabilities (net) — 0.2% | 8,532,048 | ||||||||||||||
| TOTAL NET ASSETS — 100.0% | $ | 3,697,964,800 | |||||||||||||
See accompanying notes to the financial statements.
11
GMO U.S. Core Equity Fund
(A Series of GMO Trust)
Schedule of Investments — (Continued)
February 29, 2008
A summary of outstanding financial instruments at February 29, 2008 is as follows:
Futures Contracts
| Number of Contracts | Type | Expiration Date | Contract Value | Net Unrealized Appreciation (Depreciation) | |||||||||||||||
| Buys | |||||||||||||||||||
| 1,768 | S&P 500 E-Mini | March 2008 | $ | 117,686,920 | $ | (1,464,323 | ) | ||||||||||||
As of February 29, 2008, for the futures contracts held, the Fund had sufficient cash and/or securities to cover any commitments or margin requirements of the relevant broker or exchange.
Notes to Schedule of Investments:
* Non-income producing security.
(a) Rate shown represents yield-to-maturity.
See accompanying notes to the financial statements.
12
GMO U.S. Core Equity Fund
(A Series of GMO Trust)
Statement of Assets and Liabilities — February 29, 2008
| Assets: | |||||||
| Investments, at value (cost $3,947,028,047) (Note 2) | $ | 3,689,432,752 | |||||
| Receivable for Fund shares sold | 1,042,783 | ||||||
| Dividends and interest receivable | 7,779,448 | ||||||
| Receivable for collateral on open futures contracts (Note 2) | 6,364,800 | ||||||
| Receivable for expenses reimbursed by Manager (Note 3) | 64,757 | ||||||
| Total assets | 3,704,684,540 | ||||||
| Liabilities: | |||||||
| Payable for Fund shares repurchased | 2,209,736 | ||||||
| Payable to affiliate for (Note 3): | |||||||
| Management fee | 926,413 | ||||||
| Shareholder service fee | 268,228 | ||||||
| Administration fee – Class M | 9,393 | ||||||
| Trustees and Chief Compliance Officer of GMO Trust fees | 4,249 | ||||||
| Payable for 12b-1 fee – Class M | 25,363 | ||||||
| Payable for variation margin on open futures contracts (Note 2) | 3,049,800 | ||||||
| Accrued expenses | 226,558 | ||||||
| Total liabilities | 6,719,740 | ||||||
| Net assets | $ | 3,697,964,800 | |||||
See accompanying notes to the financial statements.
13
GMO U.S. Core Equity Fund
(A Series of GMO Trust)
Statement of Assets and Liabilities — February 29, 2008 — (Continued)
| Net assets consist of: | |||||||
| Paid-in capital | $ | 3,980,067,311 | |||||
| Accumulated undistributed net investment income | 8,762,323 | ||||||
| Accumulated net realized loss | (31,805,216 | ) | |||||
| Net unrealized depreciation | (259,059,618 | ) | |||||
| $ | 3,697,964,800 | ||||||
| Net assets attributable to: | |||||||
| Class III shares | $ | 1,131,799,994 | |||||
| Class IV shares | $ | 478,084,132 | |||||
| Class VI shares | $ | 2,031,658,641 | |||||
| Class M shares | $ | 56,422,033 | |||||
| Shares outstanding: | |||||||
| Class III | 93,941,066 | ||||||
| Class IV | 39,766,699 | ||||||
| Class VI | 168,995,706 | ||||||
| Class M | 4,691,430 | ||||||
| Net asset value per share: | |||||||
| Class III | $ | 12.05 | |||||
| Class IV | $ | 12.02 | |||||
| Class VI | $ | 12.02 | |||||
| Class M | $ | 12.03 | |||||
See accompanying notes to the financial statements.
14
GMO U.S. Core Equity Fund
(A Series of GMO Trust)
Statement of Operations — Year Ended February 29, 2008
| Investment Income: | |||||||
| Dividends | $ | 86,437,648 | |||||
| Interest | 5,104,394 | ||||||
| Securities lending income | 147,149 | ||||||
| Total investment income | 91,689,191 | ||||||
| Expenses: | |||||||
| Management fee (Note 3) | 14,228,468 | ||||||
| Shareholder service fee – Class III (Note 3) | 2,447,692 | ||||||
| Shareholder service fee – Class IV (Note 3) | 569,013 | ||||||
| Shareholder service fee – Class VI (Note 3) | 1,255,511 | ||||||
| 12b-1 fee – Class M (Note 3) | 265,683 | ||||||
| Administration fee – Class M (Note 3) | 212,547 | ||||||
| Custodian, fund accounting agent and transfer agent fees | 600,666 | ||||||
| Audit and tax fees | 55,263 | ||||||
| Legal fees | 103,407 | ||||||
| Trustees fees and related expenses (Note 3) | 45,529 | ||||||
| Registration fees | 15,262 | ||||||
| Miscellaneous | 36,743 | ||||||
| Total expenses | 19,835,784 | ||||||
| Fees and expenses reimbursed by Manager (Note 3) | (797,455 | ) | |||||
| Expense reductions (Note 2) | (48,087 | ) | |||||
| Net expenses | 18,990,242 | ||||||
| Net investment income (loss) | 72,698,949 | ||||||
| Realized and unrealized gain (loss): | |||||||
| Net realized gain (loss) on: | |||||||
| Investments | 351,184,479 | ||||||
| Closed futures contracts | (2,132,587 | ) | |||||
| Net realized gain (loss) | 349,051,892 | ||||||
| Change in net unrealized appreciation (depreciation) on: | |||||||
| Investments | (612,193,297 | ) | |||||
| Open futures contracts | (1,464,323 | ) | |||||
| Net unrealized gain (loss) | (613,657,620 | ) | |||||
| Net realized and unrealized gain (loss) | (264,605,728 | ) | |||||
| Net increase (decrease) in net assets resulting from operations | $ | (191,906,779 | ) | ||||
See accompanying notes to the financial statements.
15
GMO U.S. Core Equity Fund
(A Series of GMO Trust)
Statement of Changes in Net Assets
| Year Ended February 29, 2008 | Year Ended February 28, 2007 | ||||||||||
| Increase (decrease) in net assets: | |||||||||||
| Operations: | |||||||||||
| Net investment income (loss) | $ | 72,698,949 | $ | 98,496,318 | |||||||
| Net realized gain (loss) | 349,051,892 | 341,469,404 | |||||||||
| Change in net unrealized appreciation (depreciation) | (613,657,620 | ) | (59,935,270 | ) | |||||||
| Net increase (decrease) in net assets from operations | (191,906,779 | ) | 380,030,452 | ||||||||
| Distributions to shareholders from: | |||||||||||
| Net investment income | |||||||||||
| Class III | (28,161,365 | ) | (31,321,178 | ) | |||||||
| Class IV | (10,426,216 | ) | (10,898,489 | ) | |||||||
| Class VI | (43,036,312 | ) | (53,275,433 | ) | |||||||
| Class M | (1,560,161 | ) | (1,646,618 | ) | |||||||
| Total distributions from net investment income | (83,184,054 | ) | (97,141,718 | ) | |||||||
| Net realized gains | |||||||||||
| Class III | (171,156,746 | ) | (47,632,225 | ) | |||||||
| Class IV | (61,162,205 | ) | (18,340,801 | ) | |||||||
| Class VI | (291,784,061 | ) | (88,828,637 | ) | |||||||
| Class M | (10,886,017 | ) | (3,334,260 | ) | |||||||
| Total distributions from net realized gains | (534,989,029 | ) | (158,135,923 | ) | |||||||
| (618,173,083 | ) | (255,277,641 | ) | ||||||||
| Net share transactions (Note 7): | |||||||||||
| Class III | (378,601,907 | ) | (1,095,758,448 | ) | |||||||
| Class IV | (15,629,517 | ) | (159,761,538 | ) | |||||||
| Class VI | (1,232,938,512 | ) | 1,061,683,678 | ||||||||
| Class M | (60,272,243 | ) | (27,519,549 | ) | |||||||
| Increase (decrease) in net assets resulting from net share transactions | (1,687,442,179 | ) | (221,355,857 | ) | |||||||
| Total increase (decrease) in net assets | (2,497,522,041 | ) | (96,603,046 | ) | |||||||
| Net assets: | |||||||||||
| Beginning of period | 6,195,486,841 | 6,292,089,887 | |||||||||
| End of period (including accumulated undistributed net investment income of $8,762,323 and $19,373,690, respectively) | $ | 3,697,964,800 | $ | 6,195,486,841 | |||||||
See accompanying notes to the financial statements.
16
GMO U.S. Core Equity Fund
(A Series of GMO Trust)
Financial Highlights
(For a Class III share outstanding throughout each period)
| Year Ended February 28/29, | |||||||||||||||||||||||
| 2008 | 2007 | 2006 | 2005 | 2004 | |||||||||||||||||||
| Net asset value, beginning of period | $ | 14.77 | $ | 14.50 | $ | 14.28 | $ | 13.54 | $ | 9.98 | |||||||||||||
| Income (loss) from investment operations: | |||||||||||||||||||||||
| Net investment income (loss)† | 0.22 | 0.22 | 0.24 | 0.19 | 0.16 | ||||||||||||||||||
| Net realized and unrealized gain (loss) | (1.10 | ) | 0.64 | 0.54 | 0.73 | 3.56 | |||||||||||||||||
| Total from investment operations | (0.88 | ) | 0.86 | 0.78 | 0.92 | 3.72 | |||||||||||||||||
| Less distributions to shareholders: | |||||||||||||||||||||||
| From net investment income | (0.25 | ) | (0.22 | ) | (0.24 | ) | (0.18 | ) | (0.16 | ) | |||||||||||||
| From net realized gains | (1.59 | ) | (0.37 | ) | (0.32 | ) | — | — | |||||||||||||||
| Total distributions | (1.84 | ) | (0.59 | ) | (0.56 | ) | (0.18 | ) | (0.16 | ) | |||||||||||||
| Net asset value, end of period | $ | 12.05 | $ | 14.77 | $ | 14.50 | $ | 14.28 | $ | 13.54 | |||||||||||||
| Total Return(a) | (7.33 | )% | 5.97 | % | 5.60 | % | 6.89 | % | 37.50 | % | |||||||||||||
| Ratios/Supplemental Data: | |||||||||||||||||||||||
| Net assets, end of period (000's) | $ | 1,131,800 | $ | 1,789,872 | $ | 2,841,959 | $ | 1,739,392 | $ | 1,517,458 | |||||||||||||
| Net expenses to average daily net assets | 0.46 | %(b) | 0.46 | % | 0.47 | % | 0.48 | % | 0.48 | % | |||||||||||||
| Net investment income to average daily net assets | 1.55 | % | 1.51 | % | 1.69 | % | 1.46 | % | 1.32 | % | |||||||||||||
| Portfolio turnover rate | 71 | % | 78 | % | 65 | % | 65 | % | 57 | % | |||||||||||||
| Fees and expenses reimbursed by the Manager to average daily net assets: | 0.02 | % | 0.02 | % | 0.02 | % | 0.02 | % | 0.03 | % | |||||||||||||
(a) The total returns would have been lower had certain expenses not been reimbursed during the periods shown and assumes the effect of reinvested distributions.
(b) The net expense ratio does not include the effect of expense reductions.
† Calculated using average shares outstanding throughout the period.
See accompanying notes to the financial statements.
17
GMO U.S. Core Equity Fund
(A Series of GMO Trust)
Financial Highlights
(For a Class IV share outstanding throughout each period)
| Year Ended February 28/29, | |||||||||||||||||||||||
| 2008 | 2007 | 2006 | 2005 | 2004 | |||||||||||||||||||
| Net asset value, beginning of period | $ | 14.75 | $ | 14.48 | $ | 14.26 | $ | 13.52 | $ | 9.97 | |||||||||||||
| Income (loss) from investment operations: | |||||||||||||||||||||||
| Net investment income (loss)† | 0.22 | 0.22 | 0.25 | 0.20 | 0.16 | ||||||||||||||||||
| Net realized and unrealized gain (loss) | (1.10 | ) | 0.65 | 0.54 | 0.73 | 3.55 | |||||||||||||||||
| Total from investment operations | (0.88 | ) | 0.87 | 0.79 | 0.93 | 3.71 | |||||||||||||||||
| Less distributions to shareholders: | |||||||||||||||||||||||
| From net investment income | (0.26 | ) | (0.23 | ) | (0.25 | ) | (0.19 | ) | (0.16 | ) | |||||||||||||
| From net realized gains | (1.59 | ) | (0.37 | ) | (0.32 | ) | — | — | |||||||||||||||
| Total distributions | (1.85 | ) | (0.60 | ) | (0.57 | ) | (0.19 | ) | (0.16 | ) | |||||||||||||
| Net asset value, end of period | $ | 12.02 | $ | 14.75 | $ | 14.48 | $ | 14.26 | $ | 13.52 | |||||||||||||
| Total Return(a) | (7.36 | )% | 6.05 | % | 5.66 | % | 6.96 | % | 37.50 | % | |||||||||||||
| Ratios/Supplemental Data: | |||||||||||||||||||||||
| Net assets, end of period (000's) | $ | 478,084 | $ | 602,048 | $ | 749,822 | $ | 866,206 | $ | 709,525 | |||||||||||||
| Net expenses to average daily net assets | 0.41 | %(b) | 0.41 | % | 0.43 | % | 0.44 | % | 0.44 | % | |||||||||||||
| Net investment income to average daily net assets | 1.57 | % | 1.55 | % | 1.76 | % | 1.49 | % | 1.36 | % | |||||||||||||
| Portfolio turnover rate | 71 | % | 78 | % | 65 | % | 65 | % | 57 | % | |||||||||||||
| Fees and expenses reimbursed by the Manager to average daily net assets: | 0.02 | % | 0.02 | % | 0.02 | % | 0.02 | % | 0.03 | % | |||||||||||||
(a) The total returns would have been lower had certain expenses not been reimbursed during the periods shown and assumes the effect of reinvested distributions.
(b) The net expense ratio does not include the effect of expense reductions.
† Calculated using average shares outstanding throughout the period.
See accompanying notes to the financial statements.
18
GMO U.S. Core Equity Fund
(A Series of GMO Trust)
Financial Highlights
(For a Class VI share outstanding throughout each period)
| Year Ended February 28/29, | |||||||||||||||||||||||
| 2008 | 2007 | 2006 | 2005 | 2004(a) | |||||||||||||||||||
| Net asset value, beginning of period | $ | 14.75 | $ | 14.47 | $ | 14.26 | $ | 13.52 | $ | 11.54 | |||||||||||||
| Income (loss) from investment operations: | |||||||||||||||||||||||
| Net investment income (loss)† | 0.23 | 0.23 | 0.25 | 0.21 | 0.10 | ||||||||||||||||||
| Net realized and unrealized gain (loss) | (1.11 | ) | 0.65 | 0.54 | 0.72 | 2.01 | |||||||||||||||||
| Total from investment operations | (0.88 | ) | 0.88 | 0.79 | 0.93 | 2.11 | |||||||||||||||||
| Less distributions to shareholders: | |||||||||||||||||||||||
| From net investment income | (0.26 | ) | (0.23 | ) | (0.26 | ) | (0.19 | ) | (0.13 | ) | |||||||||||||
| From net realized gains | (1.59 | ) | (0.37 | ) | (0.32 | ) | — | — | |||||||||||||||
| Total distributions | (1.85 | ) | (0.60 | ) | (0.58 | ) | (0.19 | ) | (0.13 | ) | |||||||||||||
| Net asset value, end of period | $ | 12.02 | $ | 14.75 | $ | 14.47 | $ | 14.26 | $ | 13.52 | |||||||||||||
| Total Return(b) | (7.32 | )% | 6.17 | % | 5.64 | % | 7.01 | % | 18.41 | %** | |||||||||||||
| Ratios/Supplemental Data: | |||||||||||||||||||||||
| Net assets, end of period (000's) | $ | 2,031,659 | $ | 3,671,926 | $ | 2,543,300 | $ | 1,750,325 | $ | 542,274 | |||||||||||||
| Net expenses to average daily net assets | 0.37 | %(c) | 0.37 | % | 0.38 | % | 0.39 | % | 0.39 | %* | |||||||||||||
| Net investment income to average daily net assets | 1.63 | % | 1.61 | % | 1.78 | % | 1.56 | % | 1.17 | %* | |||||||||||||
| Portfolio turnover rate | 71 | % | 78 | % | 65 | % | 65 | % | 57 | %*** | |||||||||||||
| Fees and expenses reimbursed by the Manager to average daily net assets: | 0.02 | % | 0.02 | % | 0.02 | % | 0.02 | % | 0.03 | %* | |||||||||||||
(a) Period from June 30, 2003 (commencement of operations) through February 29, 2004.
(b) The total returns would have been lower had certain expenses not been reimbursed during the periods shown and assumes the effect of reinvested distributions.
(c) The net expense ratio does not include the effect of expense reductions.
† Calculated using average shares outstanding throughout the period.
* Annualized.
** Not annualized.
*** Calculation represents the portfolio turnover rate of the Fund for the year ended February 29, 2004.
See accompanying notes to the financial statements.
19
GMO U.S. Core Equity Fund
(A Series of GMO Trust)
Financial Highlights
(For a Class M share outstanding throughout each period)
| Year Ended February 28/29, | |||||||||||||||||||||||
| 2008 | 2007 | 2006 | 2005 | 2004 | |||||||||||||||||||
| Net asset value, beginning of period | $ | 14.75 | $ | 14.47 | $ | 14.26 | $ | 13.52 | $ | 9.96 | |||||||||||||
| Income (loss) from investment operations: | |||||||||||||||||||||||
| Net investment income (loss)† | 0.18 | 0.18 | 0.20 | 0.16 | 0.12 | ||||||||||||||||||
| Net realized and unrealized gain (loss) | (1.11 | ) | 0.64 | 0.53 | 0.72 | 3.57 | |||||||||||||||||
| Total from investment operations | (0.93 | ) | 0.82 | 0.73 | 0.88 | 3.69 | |||||||||||||||||
| Less distributions to shareholders: | |||||||||||||||||||||||
| From net investment income | (0.20 | ) | (0.17 | ) | (0.20 | ) | (0.14 | ) | (0.13 | ) | |||||||||||||
| From net realized gains | (1.59 | ) | (0.37 | ) | (0.32 | ) | — | — | |||||||||||||||
| Total distributions | (1.79 | ) | (0.54 | ) | (0.52 | ) | (0.14 | ) | (0.13 | ) | |||||||||||||
| Net asset value, end of period | $ | 12.03 | $ | 14.75 | $ | 14.47 | $ | 14.26 | $ | 13.52 | |||||||||||||
| Total Return(a) | (7.64 | )% | 5.73 | % | 5.22 | % | 6.61 | % | 37.23 | % | |||||||||||||
| Ratios/Supplemental Data: | |||||||||||||||||||||||
| Net assets, end of period (000's) | $ | 56,422 | $ | 131,640 | $ | 157,009 | $ | 171,316 | $ | 141,188 | |||||||||||||
| Net expenses to average daily net assets | 0.76 | %(b) | 0.76 | % | 0.77 | % | 0.78 | % | 0.78 | % | |||||||||||||
| Net investment income to average daily net assets | 1.23 | % | 1.22 | % | 1.41 | % | 1.17 | % | 0.98 | % | |||||||||||||
| Portfolio turnover rate | 71 | % | 78 | % | 65 | % | 65 | % | 57 | % | |||||||||||||
| Fees and expenses reimbursed by the Manager to average daily net assets: | 0.02 | % | 0.02 | % | 0.02 | % | 0.02 | % | 0.03 | % | |||||||||||||
(a) The total returns would have been lower had certain expenses not been reimbursed during the periods shown and assumes the effect of reinvested distributions.
(b) The net expense ratio does not include the effect of expense reductions.
† Calculated using average shares outstanding throughout the period.
See accompanying notes to the financial statements.
20
GMO U.S. Core Equity Fund
(A Series of GMO Trust)
Notes to Financial Statements
February 29, 2008
1. Organization
GMO U.S. Core Equity Fund (the "Fund") is a series of GMO Trust (the "Trust"). The Fund is registered under the Investment Company Act of 1940, as amended, as an open-end, diversified management investment company. The Fund is advised and managed by Grantham, Mayo, Van Otterloo & Co. LLC (the "Manager" or "GMO"). The Trust was established as a Massachusetts business trust under the laws of the Commonwealth of Massachusetts on June 24, 1985. The Declaration of Trust permits the Trustees of the Trust ("Trustees") to create an unlimited number of series of shares ("Funds") and to subdivide Funds into classes.
The Fund seeks high total return. The Fund seeks to achieve its objective by outperforming the S&P 500 Index. The Fund typically makes equity investments in companies that issue stocks included in the S&P 500 Index, and companies with similar market capitalizations.
Throughout the year ended February 29, 2008, the Fund had four classes of shares outstanding: Class III, Class IV, Class VI, and Class M. Class M shares bear an administration fee and a 12b-1 fee while Classes III, IV and VI bear a shareholder service fee (See Note 3). The principal economic difference among the classes of shares is the type and level of fees borne by the classes.
2. Significant accounting policies
The following is a summary of significant accounting policies which are in conformity with accounting principles generally accepted in the United States of America ("U.S. GAAP") and which are consistently followed by the Fund in the preparation of its financial statements. The preparation of financial statements in accordance with U.S. GAAP requires management to make estimates and assumptions that affect the reported amounts and disclosures in the financial statements. Actual results could differ from those estimates. The accounting records of the Fund are maintained in U.S. dollars.
Portfolio valuation
Securities listed on a securities exchange for which market quotations are readily available are valued at the last sale price or official closing price on each business day, or if there is no such reported sale or official closing price, at the most recent quoted bid price. Unlisted securities for which market quotations are readily available are generally valued at the most recent quoted bid price. Short-term investments with a remaining maturity of sixty days or less are generally valued at amortized cost, which approximates fair value. Shares of investment funds are valued at their net asset value. Securities for which quotations are not readily available or whose values the Manager has determined to be unreliable are valued at fair value as determined in good faith by the Trustees or other persons acting at their direction pursuant to procedures approved by the Trustees. By its nature, a fair value price is a good faith est imate of the value of a security at a given point in time and may not reflect the value that would be realized if the security was sold and the differences could be material.
21
GMO U.S. Core Equity Fund
(A Series of GMO Trust)
Notes to Financial Statements — (Continued)
February 29, 2008
Futures contracts
The Fund may purchase and sell futures contracts. Upon entering into a futures contract, the Fund is required to deposit with the futures clearing broker an amount of cash, U.S. government and agency obligations, or other liquid assets in accordance with the initial margin requirements of the broker or exchange. In addition, the Fund maintains cash or securities in an amount that at least equals the net amount payable in the event the Fund must deliver the full amount of the contracts. Futures contracts are marked to market daily and an appropriate payable or receivable for the change in value ("variation margin") is recorded by the Fund. The payable or receivable is liquidated on the following business day. Gains or losses are recognized but not considered realized until the contracts expire or are closed. Futures contracts involve, to varying degrees, risk of loss in excess of the variation margin disclosed in the Statement of Assets and Liabilities. Under certain circumstances, futures exchanges may establish daily limits on the amount that the price of a futures contract can vary from the previous day's settlement price, thereby effectively preventing liquidation of unfavorable positions. Losses may arise from changes in the value of the underlying instrument if the Fund is unable to liquidate a futures position due to an illiquid secondary market for the contracts or the imposition of price limits, or if counterparties do not perform under the contract terms. Futures contracts are generally valued at the settlement price established each day by the board of trade or exchange on which they are traded. Futures contracts outstanding at the end of the period are listed in the Fund's Schedule of Investments.
Swap agreements
The Fund may enter into swap agreements. A swap is an agreement to exchange the return generated by one instrument for the return generated by another instrument. Interest rate swap agreements involve the exchange by one party with another party of their respective commitments to pay or receive interest, e.g., an exchange of floating rate payments for fixed rate payments with respect to a notional amount of principal. Total return swap agreements involve a commitment by one party in the agreement to pay interest in exchange for a market-linked return, both based on notional amounts. To the extent the total return of the security or index underlying the transaction exceeds or falls short of the offsetting interest rate obligation, the party will receive a payment from or make a payment to the counterparty, respectively. Forward spread lock swap agreements involve commitments to pay or receive a settlement amount calculated as the difference between the swap spread and a fixed spread, multiplied by the notional amount times the duration of the swap rate. The swap spread is the difference between the benchmark swap rate (market rate) and the specific treasury rate. Variance swap agreements involve commitments to pay or receive a settlement amount calculated as the difference between the annualized realized variance of returns on the underlying price and a fixed quantity, also known as the variance strike, over a period of time. In connection with these agreements, cash or securities may be set aside as collateral by the Fund's custodian or brokers in accordance with the terms of the swap agreement. The Fund earns or pays interest on cash set aside as collateral.
Swaps are marked to market daily using models that incorporate quotations from market makers and the change in value, if any, is recorded as unrealized gain or loss in the Statement of Operations. Payments
22
GMO U.S. Core Equity Fund
(A Series of GMO Trust)
Notes to Financial Statements — (Continued)
February 29, 2008
received or made on swap contracts are recorded as realized gain or loss in the Statement of Operations. Gains or losses are realized upon early termination of the swap agreements. These financial instruments are not actively traded on financial markets. The values assigned to these instruments are based upon the best available information and because of the uncertainty of the valuation, these values may differ significantly from the values that would have been realized had a ready market for these instruments existed, and the differences could be material. Entering into these agreements involves, to varying degrees, elements of credit, legal, market and documentation risk in excess of the amounts recognized in the Statement of Assets and Liabilities. Such risks involve the possibility that there will be no liquid market for these agreements, that the counterparties to the agreements may default on their obligations to perform o r disagree as to the meaning of contractual terms in the agreements, or that there may be unfavorable changes in interest rates or the price of the index or security underlying these transactions. There were no swap agreements outstanding at the end of the period.
Repurchase agreements
The Fund may enter into repurchase agreements with banks and broker-dealers whereby the Fund acquires a security for cash and obtains a simultaneous commitment from the seller to repurchase the security at an agreed upon price and date. The Fund, through its custodian, takes possession of securities collateralizing the repurchase agreement. The collateral is marked to market daily to ensure that the market value of the underlying assets remains sufficient to protect the Fund in the event of default by the seller. Collateral for certain tri-party repurchase agreements is held at the counterparty's custodian in a segregated account for the benefit of the Fund and the counterparty. In connection with transactions in repurchase agreements, if the seller defaults or enters into insolvency proceedings and the value of the collateral declines, recovery of cash by the Fund may be delayed or limited. Repurchase agreements outstanding at the end of the period are listed in the Fund's Schedule of Investments.
Securities lending
The Fund may lend its securities to certain qualified broker-dealers. The loans are collateralized with cash or liquid securities with a market value at least equal to the market value of the securities on loan. As with other extensions of credit, the Fund may bear the risk of loss with respect to the investment of the collateral, the risk of delay in and/or inability to exercise its rights with respect to the collateral, and the risk of delay in recovery or loss of rights in the loaned securities should the borrower of the securities fail financially. If a loan is collateralized by U.S. government securities, the Fund receives a fee from the borrower. If a loan is collateralized by cash, the Fund typically invests the cash collateral for its own account in interest-bearing, short-term securities and pays a fee to the borrower that normally represents a portion of the Fund's earnings on the collateral. As of February 29, 2008, t he Fund had no securities on loan.
Taxes and distributions
The Fund intends to qualify each tax year as a regulated investment company under Subchapter M of the Internal Revenue Code of 1986, as amended (the "Code"). The Fund intends to distribute substantially all of its net investment income and net realized short-term and long-term capital gains, if any, after giving
23
GMO U.S. Core Equity Fund
(A Series of GMO Trust)
Notes to Financial Statements — (Continued)
February 29, 2008
effect to any available capital loss carryovers for U.S. federal income tax purposes. Therefore, no provision for U.S. federal income or excise tax is necessary.
The Fund's policy is to declare and pay distributions from net investment income, if any, quarterly, and from net realized short-term and long-term capital gains, if any, at least annually. All distributions are paid in shares of the Fund, at net asset value, unless the shareholder elects to receive cash distributions. Distributions to shareholders are recorded by the Fund on the ex-dividend date.
Income and capital gain distributions are determined in accordance with U.S. federal income tax regulations, which may differ from U.S. GAAP. Certain capital accounts in the financial statements are periodically adjusted for permanent differences in order to reflect their tax character. These adjustments have no impact on net assets or net asset value per share. Temporary differences which arise from recognizing certain items of income, expense, gain or loss in different periods for financial statement and tax purposes will reverse at some time in the future. Distributions in excess of net investment income or net realized gains are temporary over distributions for financial statement purposes resulting from differences in the recognition or classification of income or distributions for financial statement and tax purposes.
U.S. GAAP and tax accounting differences primarily relate to losses on wash sale transactions and post-October capital losses.
The following reclassification represents the amount necessary to report the stated components of net assets on a tax basis, excluding certain temporary differences, as of February 29, 2008. The financial highlights exclude these adjustments.
| Accumulated Undistributed Net Investment Income | Accumulated Net Realized Loss | Paid-in Capital | |||||||||
| $ | (126,262 | ) | $ | 126,263 | $ | (1 | ) | ||||
The tax character of distributions declared to shareholders is as follows:
| 2/29/2008 | 2/28/2007 | ||||||||||
| Ordinary income (including any short-term capital gains) | $ | 241,940,523 | $ | 109,569,744 | |||||||
| Long-term capital gains | 376,232,560 | 145,707,897 | |||||||||
| Total distributions | $ | 618,173,083 | $ | 255,277,641 | |||||||
24
GMO U.S. Core Equity Fund
(A Series of GMO Trust)
Notes to Financial Statements — (Continued)
February 29, 2008
Distributions in excess of tax basis earnings and profits, if significant, are reported in the financial statements as a tax return of capital.
As of February 29, 2008, the components of distributable earnings on a tax basis consisted of the following:
| Undistributed ordinary income | $ | 8,762,323 | |||||
As of February 29, 2008, the Fund elected to defer to March 1, 2008 post-October capital losses of $10,237,100.
As of February 29, 2008, the approximate cost for U.S. federal income tax purposes and gross and net unrealized appreciation and depreciation in value of investments were as follows:
| Aggregate Cost | Gross Unrealized Appreciation | Gross Unrealized (Depreciation) | Net Unrealized Appreciation (Depreciation) | ||||||||||||
| $ | 3,970,060,485 | $ | 124,096,384 | $ | (404,724,117 | ) | $ | (280,627,733 | ) | ||||||
Security transactions and related investment income
Security transactions are accounted for on trade date. Dividend income, net of applicable foreign withholding taxes, if any, is recorded on the ex-dividend date, or when the Fund is informed of the ex-dividend date, if later. Interest income is recorded on the accrual basis and is adjusted for the amortization of premiums and accretion of discounts. Interest income on inflation indexed securities, if any, is accrued daily based upon an inflation adjusted principal. Additionally, any increase or decrease in the principal or face amount of the securities adjusted for inflation is recorded as interest income or loss. Income is not recognized on securities for which collection is not expected. Non-cash dividends, if any, are recorded at the fair market value of the securities received. In determining the net gain or loss on securities sold, the cost of securities is determined on the identified cost basis.
Expenses
The majority of expenses of the Trust are directly identifiable to an individual fund. Expenses which are not readily identifiable to a specific fund are allocated taking into consideration, among other things, the nature and type of expense and the relative size of the funds. Investment income, common expenses and realized and unrealized gains and losses are allocated pro rata among the classes of shares of the Fund based on the relative net assets of each class. Shareholder service, 12b-1, and administration fees, which are directly attributable to a class of shares, are charged to that class's operations.
State Street Bank and Trust Company ("State Street") serves as custodian, fund accounting agent and transfer agent of the Fund. State Street's fee may be reduced by credits that are an earnings allowance calculated on
25
GMO U.S. Core Equity Fund
(A Series of GMO Trust)
Notes to Financial Statements — (Continued)
February 29, 2008
the average daily cash balances the Fund maintains with State Street. Credit balances used to reduce the fee paid to State Street, if any, are reported as a reduction of expenses in the Statement of Operations.
Recently issued accounting pronouncements
In June 2006, the Financial Accounting Standards Board ("FASB") issued FASB Interpretation No. 48, Accounting for Uncertainty in Income Taxes – an Interpretation of FASB Statement No. 109 ("FIN 48"). FIN 48 clarifies the accounting for uncertainty in income taxes recognized in accordance with FASB Statement No. 109, Accounting for Income Taxes. FIN 48 prescribes a recognition threshold and measurement attribute for a tax position taken or expected to be taken in the tax return that could impact the Fund's financial statements. It also provides guidance in relation to the Fund's financial statements on classification of tax benefits or liabilities, interest and penalties, accounting in interim periods, disclosure, and transition. FIN 48 is effective for fiscal years beginning after December 15, 2006 for registered investment companies. Management has evaluated the effects of applying the various provisions of FIN 48 and has determined that the adoption of FIN 48 does not have a material effect on the Fund's financial statements. The Fund's federal tax returns for the prior three fiscal years, if applicable, remain subject to examination by the Internal Revenue Service. Management will continue to monitor the rules and guidance pertaining to FIN 48 and will take action if appropriate.
In September 2006, the FASB issued Statement of Financial Accounting Standards No. 157 ("FAS 157"), "Fair Value Measurements." FAS 157 defines fair value, establishes a framework for measuring fair value in accordance with generally accepted accounting principles and expands disclosure about fair value measurements. FAS 157 is effective for fiscal years beginning after November 15, 2007. Management is currently evaluating the impact the adoption of FAS 157 will have on the Fund's financial statement disclosures.
3. Fees and other transactions with affiliates
GMO earns a management fee paid monthly at the annual rate of 0.31% of average daily net assets. The Fund has adopted a Shareholder Service Plan under which the Fund pays GMO a shareholder service fee for client and shareholder service, reporting, and other support. Pursuant to the Shareholder Service Plan, the shareholder service fee is calculated based on average daily net assets of each class at the annual rate of 0.15% for Class III shares, 0.10% for Class IV shares and 0.055% for Class VI shares.
Class M shares of the Fund pay GMO an administration fee monthly at the annual rate of 0.20% of the average daily Class M net assets for support services provided to Class M shareholders.
Pursuant to a Rule 12b-1 distribution and service plan adopted by the Fund, Class M shares of the Fund may pay a fee, at the annual rate of up to 1.00% of average daily Class M net assets for any activities or expenses primarily intended to result in the sale of Class M shares of the Fund and/or the provision of certain other services incidental thereto. The Trustees currently limit payments on Class M shares to 0.25% of the Fund's average daily Class M net assets. This fee may be spent on personal services rendered to Class M shareholders of the Fund and/or maintenance of Class M shareholder accounts.
26
GMO U.S. Core Equity Fund
(A Series of GMO Trust)
Notes to Financial Statements — (Continued)
February 29, 2008
The Manager has contractually agreed to reimburse the Fund for Fund expenses through at least June 30, 2008 to the extent the Fund's total annual operating expenses (excluding shareholder service fees (Classes III, IV and VI only), administration and distribution (12b-1) fees (Class M only), fees and expenses of the independent Trustees of the Trust, fees and expenses for legal services not approved by the Manager for the Trust, compensation and expenses of the Trust's Chief Compliance Officer ("CCO") (excluding any employee benefits), brokerage commissions, securities lending fees and expenses, interest expense, transfer taxes, and other investment-related costs (including expenses associated with investments in any company that is an investment company or would be an investment company under the 1940 Act, but for the exceptions to the definition of investment company provided in Section 3(c)(1) and 3(c)(7) of the 1940 Act), he dging transaction fees, extraordinary, non-recurring and certain other unusual expenses (including taxes)) exceed 0.31% of the Fund's average daily net assets.
The Fund's portion of the fee paid by the Trust to the independent Trustees and CCO during the year ended February 29, 2008 was $38,169 and $13,801, respectively. The compensation and expenses of the CCO are included in miscellaneous expenses in the Statement of Operations. No remuneration was paid by the Fund to any other officer of the Trust.
4. Purchases and sales of securities
Cost of purchases and proceeds from sales of securities, excluding short-term investments, for the year ended February 29, 2008 aggregated $3,193,581,503 and $5,540,595,234, respectively.
5. Guarantees
In the normal course of business the Fund enters into contracts with third-party service providers that contain a variety of representations and warranties and which provide general indemnifications. The Fund's maximum exposure under these arrangements is unknown, as this would involve future claims that may be made against the Fund that have not yet occurred. Based on experience, management is of the view that the risk of loss in connection with these potential indemnification obligations is remote; however, there can be no assurance that material liabilities related to such obligations will not arise in the future that could adversely impact the Fund.
6. Principal shareholders and related parties
As of February 29, 2008, 28.99% of the outstanding shares of the Fund were held by two shareholders, each holding in excess of 10% of the Fund's outstanding shares. No other shareholder owned in excess of 10% of the outstanding shares of the Fund. Investment activities of these shareholders may have a material effect on the Fund.
27
GMO U.S. Core Equity Fund
(A Series of GMO Trust)
Notes to Financial Statements — (Continued)
February 29, 2008
As of February 29, 2008, less than 0.01% of the Fund's shares were held by three related parties comprised of certain GMO employee accounts, and 59.31% of the Fund's shares were held by accounts for which the Manager has investment discretion.
7. Share transactions
The Declaration of Trust permits the Trustees to issue an unlimited number of shares of beneficial interest (without par value). Transactions in Fund shares were as follows:
| Year Ended February 29, 2008 | Year Ended February 28, 2007 | ||||||||||||||||||
| Class III: | Shares | Amount | Shares | Amount | |||||||||||||||
| Shares sold | 10,821,336 | $ | 155,921,642 | 13,256,030 | $ | 195,569,666 | |||||||||||||
| Shares issued to shareholders in reinvestment of distributions | 13,691,161 | 193,621,517 | 5,013,426 | 73,333,042 | |||||||||||||||
| Shares repurchased | (51,723,168 | ) | (728,145,066 | ) | (93,168,340 | ) | (1,364,661,156 | ) | |||||||||||
| Net increase (decrease) | (27,210,671 | ) | $ | (378,601,907 | ) | (74,898,884 | ) | $ | (1,095,758,448 | ) | |||||||||
| Year Ended February 29, 2008 | Year Ended February 28, 2007 | ||||||||||||||||||
| Class IV: | Shares | Amount | Shares | Amount | |||||||||||||||
| Shares sold | 7,471,098 | $ | 107,806,250 | 7,111,440 | $ | 106,906,188 | |||||||||||||
| Shares issued to shareholders in reinvestment of distributions | 5,018,252 | 70,729,411 | 1,932,166 | 28,224,553 | |||||||||||||||
| Shares repurchased | (13,542,835 | ) | (194,165,178 | ) | (20,022,880 | ) | (294,892,279 | ) | |||||||||||
| Net increase (decrease) | (1,053,485 | ) | $ | (15,629,517 | ) | (10,979,274 | ) | $ | (159,761,538 | ) | |||||||||
| Year Ended February 29, 2008 | Year Ended February 28, 2007 | ||||||||||||||||||
| Class VI: | Shares | Amount | Shares | Amount | |||||||||||||||
| Shares sold | 51,884,829 | $ | 705,180,355 | 78,510,638 | $ | 1,137,111,843 | |||||||||||||
| Shares issued to shareholders in reinvestment of distributions | 23,622,907 | 334,820,373 | 9,735,284 | 142,104,070 | |||||||||||||||
| Shares repurchased | (155,480,537 | ) | (2,272,939,240 | ) | (14,993,541 | ) | (217,532,235 | ) | |||||||||||
| Net increase (decrease) | (79,972,801 | ) | $ | (1,232,938,512 | ) | 73,252,381 | $ | 1,061,683,678 | |||||||||||
28
GMO U.S. Core Equity Fund
(A Series of GMO Trust)
Notes to Financial Statements — (Continued)
February 29, 2008
| Year Ended February 29, 2008 | Year Ended February 28, 2007 | ||||||||||||||||||
| Class M: | Shares | Amount | Shares | Amount | |||||||||||||||
| Shares sold | 124,923 | $ | 1,799,606 | 191,371 | $ | 2,781,373 | |||||||||||||
| Shares issued to shareholders in reinvestment of distributions | 874,683 | 12,446,178 | 340,717 | 4,980,879 | |||||||||||||||
| Shares repurchased | (5,233,840 | ) | (74,518,027 | ) | (2,454,991 | ) | (35,281,801 | ) | |||||||||||
| Net increase (decrease) | (4,234,234 | ) | $ | (60,272,243 | ) | (1,922,903 | ) | $ | (27,519,549 | ) | |||||||||
29
Report of Independent Registered Public Accounting Firm
To the Trustees of GMO Trust and the Shareholders of
GMO U.S. Core Equity Fund
In our opinion, the accompanying statement of assets and liabilities, including the schedule of investments, and the related statements of operations and of changes in net assets and the financial highlights present fairly, in all material respects, the financial position of GMO U.S. Core Equity Fund (the "Fund") at February 29, 2008, the results of its operations for the year then ended, the changes in its net assets for each of the two years in the period then ended and the financial highlights for each of the five years in the period then ended, in conformity with accounting principles generally accepted in the United States of America. These financial statements and financial highlights (hereafter referred to as "financial statements") are the responsibility of the Fund's management; our responsibility is to express an opinion on these financial statements based on our audits. We conducted our audits of these financial state ments in accordance with the standards of the Public Company Accounting Oversight Board (United States). Those standards require that we plan and perform the audit to obtain reasonable assurance about whether the financial statements are free of material misstatement. An audit includes examining, on a test basis, evidence supporting the amounts and disclosures in the financial statements, assessing the accounting principles used and significant estimates made by management, and evaluating the overall financial statement presentation. We believe that our audits, which included confirmation of securities at February 29, 2008 by correspondence with the custodian and brokers, provide a reasonable basis for our opinion.
PricewaterhouseCoopers LLP
Boston, Massachusetts
April 29, 2008
30
GMO U.S. Core Equity Fund
(A Series of GMO Trust)
Fund Expenses
February 29, 2008 (Unaudited)
Expense Examples: The following information is in relation to expenses for the six month period ended February 29, 2008.
As a shareholder of the Fund, you may incur two types of costs: (1) transaction costs; and (2) ongoing costs, including management fees, shareholder service fees, distribution (12b-1) and/or administration fees, and other Fund expenses. This example is intended to help you understand your ongoing costs (in dollars) of investing in the Fund and to compare these costs with the ongoing costs of investing in other mutual funds.
These examples are based on an investment of $1,000 invested at the beginning of the period and held for the entire period, September 1, 2007 through February 29, 2008.
Actual Expenses
The first line of the table for each class below provides information about actual account values and actual expenses. You may use the information in this line, together with the amount you invested, to estimate the expenses that you paid over the period. Simply divide your account value by $1,000 (for example, a $10,000,000 account value divided by $1,000 = 10,000), then multiply the result by the number in the first line under the heading entitled "Net Expense Incurred" to estimate the expenses you paid on your account during this period.
Hypothetical Example for Comparison Purposes
The second line of the table for each class below provides information about hypothetical account values and hypothetical expenses based on the Fund's actual expense ratio and an assumed rate of return of 5% per year before expenses, which is not the Fund's actual return. The hypothetical account values and expenses may not be used to estimate the actual ending account balance or expenses you paid for the period. You may use this information to compare the ongoing costs of investing in the Fund with other funds. To do so, compare this 5% hypothetical example with the 5% hypothetical examples that appear in the shareholder reports of other funds.
31
GMO U.S. Core Equity Fund
(A Series of GMO Trust)
Fund Expenses — (Continued)
February 29, 2008 (Unaudited)
Please note that the expenses shown in the table are meant to highlight your ongoing costs only and do not reflect any transactional costs, such as purchase premiums and redemption fees. Therefore, the second line of the table is useful in comparing ongoing costs only, and will not help you determine the relative total costs of owning different funds. In addition, if these transactional costs were included, your costs would have been higher.
| Annualized Net Expense Ratio | Beginning Account Value | Ending Account Value | Net Expense Incurred* | ||||||||||||||||
| Class III | |||||||||||||||||||
| 1) Actual | 0.46 | % | $ | 1,000.00 | $ | 901.60 | $ | 2.17 | |||||||||||
| 2) Hypothetical | 0.46 | % | $ | 1,000.00 | $ | 1,022.58 | $ | 2.31 | |||||||||||
| Class IV | |||||||||||||||||||
| 1) Actual | 0.41 | % | $ | 1,000.00 | $ | 901.00 | $ | 1.94 | |||||||||||
| 2) Hypothetical | 0.41 | % | $ | 1,000.00 | $ | 1,022.82 | $ | 2.06 | |||||||||||
| Class VI | |||||||||||||||||||
| 1) Actual | 0.37 | % | $ | 1,000.00 | $ | 901.30 | $ | 1.75 | |||||||||||
| 2) Hypothetical | 0.37 | % | $ | 1,000.00 | $ | 1,023.02 | $ | 1.86 | |||||||||||
| Class M | |||||||||||||||||||
| 1) Actual | 0.76 | % | $ | 1,000.00 | $ | 900.00 | $ | 3.59 | |||||||||||
| 2) Hypothetical | 0.76 | % | $ | 1,000.00 | $ | 1,021.08 | $ | 3.82 | |||||||||||
* Expenses are calculated using each Class's annualized expense ratio for the six months ended February 29, 2008, multiplied by the average account value over the period, multiplied by 182 days in the period, divided by 366 days in the year.
32
GMO U.S. Core Equity Fund
(A Series of GMO Trust)
Tax Information for the Tax Year Ended February 29, 2008 (Unaudited)
The Fund will notify shareholders of amounts for use in preparing 2008 income tax forms in January 2009.
The Fund's distributions to shareholders include $376,232,560 from long-term capital gains.
For taxable, non-corporate shareholders, 40.43% of the income and short-term capital gains, if any, distributed in the Fund's fiscal year ended February 29, 2008 represents qualified dividend income subject to the 15% rate category.
For corporate shareholders, 39.56% of the income and short-term capital gains, if any, distributed in the Fund's fiscal year ended February 29, 2008 qualified for the dividends-received deduction.
The Fund hereby designates as qualified interest income and qualified short-term capital gains with respect to its taxable year ended February 29, 2008, $5,271,063 and $158,689,922, respectively, or if determined to be different, the qualified interest income and qualified short-term gains of such year.
33
Trustees and Officers (Unaudited)
The following tables list the Trust's Trustees and Officers as of the date of this report; their address and date of birth ("DOB"); their position with the Trust; the length of time holding that position with the Trust; their principal occupation(s) during the past five years; the number of portfolios in the fund complex they oversee; and other directorships they hold in companies subject to registration or reporting requirements of the Securities Exchange Act of 1934 (generally called "public companies") or in registered investment companies. The Trust's Statement of Additional Information ("SAI") includes additional information about the Trust's trustees, including changes subsequent to the date of the report. The SAI is available, without charge, upon request by writing GMO, c/o GMO Trust, 40 Rowes Wharf, Boston, MA 02110.
Independent Trustees:
| Name, Address, and DOB | Position(s) Held with Trust | Term of Office1 and Length of Time Served | Principal Occupation(s) During Past Five Years | Number of Portfolios in Fund Complex Overseen by Trustee | Other Directorships Held by Trustee | ||||||||||||||||||
| Donald W. Glazer, Esq. c/o GMO Trust 40 Rowes Wharf Boston, MA 02110 DOB: 07/26/1944 | Chairman of the Board of Trustees | Chairman of the Board of Trustees since March 2005; Lead Independent Trustee (September 2004 – March 2005); Trustee since December 2000. | Consultant – Law and Business2; Vice Chair (since 2002) and Secretary, Provant, Inc. (provider of personnel performance improvement services and training products); Author of Legal Treatises. | 47 | None. | ||||||||||||||||||
1 Each Trustee is elected to serve during the continued lifetime of the Trust until he/she dies, resigns or is removed, or if sooner, until the next meeting of Shareholders called for the purpose of electing Trustees and until the election and qualification of his/her successor.
2 As part of Mr. Glazer's work as a consultant, he provides part-time consulting services to Goodwin Procter LLP ("Goodwin"). Goodwin has provided legal services to Renewable Resources, LLC, an affiliate of GMO; GMO, in connection with its relationship with Renewable Resources; and funds managed by Renewable Resources. Mr. Glazer has represented that he has no financial interest in, and is not involved in the provision of, such legal services. In the calendar years ended December 31, 2006 and December 31, 2007, these entities paid $825,738 and $291,721 respectively, in legal fees and disbursements to Goodwin.
34
Independent Trustees — (Continued)
| Name, Address, and DOB | Position(s) Held with Trust | Term of Office1 and Length of Time Served | Principal Occupation(s) During Past Five Years | Number of Portfolios in Fund Complex Overseen by Trustee | Other Directorships Held by Trustee | ||||||||||||||||||
| Jay O. Light c/o GMO Trust 40 Rowes Wharf Boston, MA 02110 DOB: 10/03/1941 | Trustee | Since May 1996. | Dean (since April 2006), Acting Dean (August 2005 – April 2006), Senior Associate Dean (1998 – 2005), and Professor of Business Administration, Harvard Business School. | 47 | Director of Harvard Management Company, Inc.3 and Verde, Inc.; Director of Partners HealthCare System, Inc. and Chair of its Investment Committee.4 | ||||||||||||||||||
| W. Nicholas Thorndike c/o GMO Trust 40 Rowes Wharf Boston, MA 02110 DOB: 03/28/1933 | Trustee | Since March 2005. | Director or trustee of various corporations and charitable organizations, including Courier Corporation (a book publisher and manufacturer) (July 1989 – present); Putnam Funds (December 1992 – June 2004); and Providence Journal (a newspaper publisher) (December 1986 – December 2003). | 47 | Director of Courier Corporation (a book publisher and manufacturer); Member of the Investment Committee of Partners HealthCare System, Inc.4 | ||||||||||||||||||
1 Each Trustee is elected to serve during the continued lifetime of the Trust until he/she dies, resigns or is removed, or if sooner, until the next meeting of Shareholders called for the purpose of electing Trustees and until the election and qualification of his/her successor.
3 Harvard Management Company, Inc. is a client of the Manager.
4 Partners HealthCare System, Inc. is a client of the Manager.
35
Principal Officers:
| Name, Address, and DOB | Position(s) Held with Trust | Term of Office5 and Length of Time Served | Principal Occupation(s) During Past Five Years | ||||||||||||
| Scott Eston c/o GMO Trust 40 Rowes Wharf Boston, MA 02110 DOB: 01/20/1956 | President and Chief Executive Officer | President and Chief Executive Officer since October 2002; Chief Financial Officer, November 2006 – February 2007. | Chief Financial Officer, Chief Operating Officer and Member, Grantham, Mayo, Van Otterloo & Co. LLC. | ||||||||||||
| Sheppard N. Burnett c/o GMO Trust 40 Rowes Wharf Boston, MA 02110 DOB: 10/24/1968 | Treasurer and Chief Financial Officer | Chief Financial Officer since March 2007; Treasurer since November 2006; Assistant Treasurer, September 2004 – November 2006. | Fund Administration Staff, Grantham, Mayo, Van Otterloo & Co. LLC (June 2004 – present); Vice President, Director of Tax, Columbia Management Group (2002 – 2004). | ||||||||||||
| Brent C. Arvidson c/o GMO Trust 40 Rowes Wharf Boston, MA 02110 DOB: 06/26/1969 | Assistant Treasurer | Since August 1998. | Senior Fund Administrator, Grantham, Mayo, Van Otterloo & Co. LLC. | ||||||||||||
| John L. Nasrah c/o GMO Trust 40 Rowes Wharf Boston, MA 02110 DOB: 05/27/1977 | Assistant Treasurer | Since March 2007. | Fund Administrator, Grantham, Mayo, Van Otterloo & Co. LLC (September 2004 – present); Tax Analyst, Bain & Company, Inc (June 2003 – September 2004); Senior Tax Associate, PricewaterhouseCoopers LLP (2001 – 2003). | ||||||||||||
| Mahmoodur Rahman c/o GMO Trust 40 Rowes Wharf Boston, MA 02110 DOB: 11/30/1967 | Assistant Treasurer | Since September 2007. | Fund Administrator, Grantham, Mayo, Van Otterloo & Co. (April 2007 – present); Vice President and Senior Tax Manager, Massachusetts Financial Services Company (January 2000 – April 2007). | ||||||||||||
5 Officers are elected to hold such office until their successor is elected and qualified to carry out the duties and responsibilities of their office, or until he or she resigns or is removed from office.
36
Principal Officers — (Continued)
| Name, Address, and DOB | Position(s) Held with Trust | Term of Office5 and Length of Time Served | Principal Occupation(s) During Past Five Years | ||||||||||||
| Michael E. Gillespie c/o GMO Trust 40 Rowes Wharf Boston, MA 02110 DOB: 02/18/1958 | Chief Compliance Officer | Since March 2005. | Vice President of Compliance (June 2004 – February 2005) and Director of Domestic Compliance (March 2002 – June 2004), Fidelity Investments; Vice President and Senior Counsel, State Street Bank and Trust Company (May 1998 – March 2002). | ||||||||||||
| Jason B. Harrison c/o GMO Trust 40 Rowes Wharf Boston, MA 02110 DOB: 01/29/1977 | Vice President and Clerk | Vice President since November 2006; Clerk since March 2006. | Legal Counsel, Grantham, Mayo, Van Otterloo & Co. LLC (since February 2006) and Attorney, Ropes & Gray LLP (September 2002 – February 2006). | ||||||||||||
| David L. Bohan c/o GMO Trust 40 Rowes Wharf Boston, MA 02110 DOB: 06/21/1964 | Vice President and Assistant Clerk | Vice President since March 2005; Assistant Clerk since March 2006. | Legal Counsel, Grantham, Mayo, Van Otterloo & Co. LLC (September 2003 – present); Attorney, Goodwin Procter LLP (September 1996 – September 2003). | ||||||||||||
| Gregory L. Pottle c/o GMO Trust 40 Rowes Wharf Boston, MA 02110 DOB: 07/09/1971 | Vice President and Assistant Clerk | Since November 2006. | Legal Counsel, Grantham, Mayo, Van Otterloo & Co. LLC. | ||||||||||||
| Anne K. Trinque c/o GMO Trust 40 Rowes Wharf Boston, MA 02110 DOB: 04/15/1978 | Vice President and Assistant Clerk | Since September 2007. | Legal Counsel, Grantham, Mayo, Van Otterloo & Co. LLC (since January 2007); Attorney, Goodwin Procter LLP (September 2003 – January 2007). | ||||||||||||
| Cheryl Wakeham c/o GMO Trust 40 Rowes Wharf Boston, MA 02110 DOB: 10/29/1958 | Anti-Money Laundering Officer | Since December 2004. | Manager, Client Service Administration, Grantham, Mayo, Van Otterloo & Co. LLC. | ||||||||||||
5 Officers are elected to hold such office until their successor is elected and qualified to carry out the duties and responsibilities of their office, or until he or she resigns or is removed from office.
37
GMO Currency Hedged International Equity Fund
(A Series of GMO Trust)
Annual Report
February 29, 2008
For a free copy of the Fund's proxy voting guidelines, shareholders may call 1-617-346-7646 (collect), visit our website at www.gmo.com, or visit the Securities and Exchange Commission's website at www.sec.gov. Information regarding how the Fund voted proxies relating to portfolio securities during the most recent 12-month period ended June 30 is available on our website at www.gmo.com, or on the Securities and Exchange Commission's website at www.sec.gov.
The Fund files its complete schedule of portfolio holdings with the Securities and Exchange Commission for the first and third quarter of each fiscal year on Form N-Q, which is available on the Commission's website at www.sec.gov. The Fund's Form N-Q may be reviewed and copied at the Commission's Public Reference Room in Washington, D.C. Information on the operation of the Public Reference Room may be obtained by calling 1-800-SEC-0330. The Fund has a policy with respect to disclosure of portfolio holdings under which it may also make available on GMO's website (www.gmo.com) a complete schedule of portfolio holdings.
This report is prepared for the general information of shareholders. It is authorized for distribution to prospective investors only when preceded or accompanied by a prospectus for the GMO Trust.
GMO Currency Hedged International Equity Fund
(A Series of GMO Trust)
Portfolio Managers
Day-to-day management of the Fund's portfolio is the responsibility of the International Quantitative team at Grantham, Mayo, Van Otterloo & Co. LLC.
Management Discussion and Analysis of Fund Performance
The GMO Currency Hedged International Equity Fund returned -6.8% for the fiscal year ended February 29, 2008, as compared to -8.5% for the MSCI EAFE Index (Hedged). During the fiscal year the Fund was fully exposed to international equity securities through its investment in underlying GMO mutual funds.
The Fund's exposure to international equities was achieved indirectly through investments in the GMO International Intrinsic Value Fund and the GMO International Growth Equity Fund. The Fund also held currency hedges in addition to the shares of those Funds, which make predominantly unhedged investments.
Currency hedging had a negative impact on the Fund. The U.S. dollar fell against most foreign currencies, but hedging insulated the Fund's return from those gains. In U.S. dollar terms the unhedged MSCI EAFE Index returned +0.8% during the period, 9.3% more than the hedged benchmark.
The Fund is fairly evenly allocated between the GMO International Intrinsic Value Fund, which returned -1.1%, and the GMO International Growth Equity Fund, which returned +5.1% during the period. The Fund outperformed as the Growth Fund outperformed the unhedged EAFE by more than the Value Fund underperformed.
The views expressed herein are exclusively those of Grantham, Mayo, Van Otterloo & Co. LLC Management as of the date of this report and are subject to change. GMO disclaims any responsibility to update such views. They are not meant as investment advice.
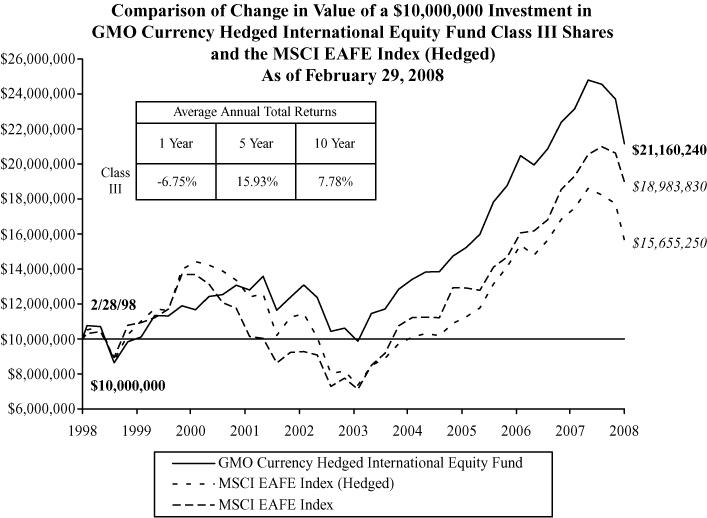
Performance data quoted represents past performance and is not indicative of future results. The investment return and principal value of an investment will fluctuate so that an investor's shares, when redeemed, may be worth more or less than their original cost. Current performance data may be lower or higher than the performance data provided herein. To obtain performance information to the most recent month-end, visit www.gmo.com. Performance shown is net of all fees after reimbursement from the Manager. Returns would have been lower had certain expenses not been reimbursed during the periods shown and do not include the effect of taxes on distributions and redemptions. All information is unaudited.
GMO Currency Hedged International Equity Fund
(A Series of GMO Trust)
Investments Concentration Summary
February 29, 2008 (Unaudited)
| Asset Class Summary* | % of Total Net Assets | ||||||
| Common Stocks | 93.9 | % | |||||
| Short-Term Investments | 7.0 | ||||||
| Preferred Stocks | 0.5 | ||||||
| Rights and Warrants | 0.0 | ||||||
| Futures | (0.6 | ) | |||||
| Forward Currency Contracts | (2.4 | ) | |||||
| Other | 1.6 | ||||||
| 100.0 | % | ||||||
| Country / Region Summary** | % of Investments | ||||||
| Euro Region*** | 37.2 | % | |||||
| United Kingdom | 21.4 | ||||||
| Japan | 20.5 | ||||||
| Australia | 4.9 | ||||||
| Switzerland | 4.9 | ||||||
| Canada | 4.5 | ||||||
| Hong Kong | 2.2 | ||||||
| Singapore | 2.2 | ||||||
| Sweden | 1.3 | ||||||
| Norway | 0.8 | ||||||
| Denmark | 0.1 | ||||||
| 100.0 | % | ||||||
* The table above incorporates aggregate indirect asset class exposure associated with investments in other funds of GMO Trust ("underlying funds").
** The table above incorporates aggregate indirect country exposure associated with investments in the underlying funds. The table excludes short-term investments. The table includes exposure through the use of derivative contracts.
*** The "Euro Region" is comprised of Austria, Belgium, Finland, France, Germany, Greece, Ireland, Italy, Netherlands, Portugal and Spain.
1
GMO Currency Hedged International Equity Fund
(A Series of GMO Trust)
Schedule of Investments
(showing percentage of total net assets)
February 29, 2008
| Shares / Par Value ($) | Description | Value ($) | |||||||||||||
| MUTUAL FUNDS — 99.3% | |||||||||||||||
| United States — 99.3% Affiliated Issuers | |||||||||||||||
| 543,215 | GMO International Growth Equity Fund, Class IV | 15,047,067 | |||||||||||||
| 501,229 | GMO International Intrinsic Value Fund, Class IV | 15,016,826 | |||||||||||||
| 30,063,893 | |||||||||||||||
| TOTAL MUTUAL FUNDS (COST $35,247,560) | 30,063,893 | ||||||||||||||
| SHORT-TERM INVESTMENTS — 3.3% | |||||||||||||||
| 1,000,000 | Royal Bank of Scotland Time Deposit, 3.10%, due 03/03/08 | 1,000,000 | |||||||||||||
| TOTAL SHORT-TERM INVESTMENTS (COST $1,000,000) | 1,000,000 | ||||||||||||||
| TOTAL INVESTMENTS — 102.6% (Cost $36,247,560) | 31,063,893 | ||||||||||||||
| Other Assets and Liabilities (net) — (2.6%) | (790,847 | ) | |||||||||||||
| TOTAL NET ASSETS — 100.0% | $ | 30,273,046 | |||||||||||||
See accompanying notes to the financial statements.
2
GMO Currency Hedged International Equity Fund
(A Series of GMO Trust)
Schedule of Investments — (Continued)
February 29, 2008
A summary of outstanding financial instruments at February 29, 2008 is as follows:
Forward Currency Contracts
| Settlement Date | Deliver/Receive | Units of Currency | Value | Net Unrealized Appreciation (Depreciation) | |||||||||||||||
| Buys | |||||||||||||||||||
| 5/23/08 | AUD | 144,000 | $ | 132,705 | $ | 2,134 | |||||||||||||
| 5/23/08 | EUR | 365,000 | 552,535 | 18,245 | |||||||||||||||
| 5/23/08 | SGD | 1,140,416 | 820,320 | 9,784 | |||||||||||||||
| $ | 1,505,560 | $ | 30,163 | ||||||||||||||||
| Sales | |||||||||||||||||||
| 5/23/08 | AUD | 1,999,261 | $ | 1,842,446 | $ | (22,979 | ) | ||||||||||||
| 5/23/08 | CAD | 433,000 | 439,225 | (13,375 | ) | ||||||||||||||
| 5/23/08 | CHF | 167,000 | 160,415 | (8,701 | ) | ||||||||||||||
| 5/23/08 | CHF | 1,498,193 | 1,439,122 | (70,016 | ) | ||||||||||||||
| 5/23/08 | CHF | 1,498,193 | 1,439,122 | (66,258 | ) | ||||||||||||||
| 5/23/08 | DKK | 7,987,333 | 1,622,650 | (48,202 | ) | ||||||||||||||
| 5/23/08 | EUR | 1,722,922 | 2,608,148 | (76,269 | ) | ||||||||||||||
| 5/23/08 | EUR | 1,722,922 | 2,608,148 | (77,511 | ) | ||||||||||||||
| 5/23/08 | EUR | 1,775,132 | 2,687,183 | (78,928 | ) | ||||||||||||||
| 5/23/08 | GBP | 408,000 | 805,992 | (18,866 | ) | ||||||||||||||
| 5/23/08 | GBP | 932,584 | 1,842,292 | (34,719 | ) | ||||||||||||||
| 5/23/08 | GBP | 932,584 | 1,842,292 | (34,230 | ) | ||||||||||||||
| 5/23/08 | GBP | 960,844 | 1,898,119 | (35,801 | ) | ||||||||||||||
| 5/23/08 | HKD | 4,963,379 | 638,769 | (1,262 | ) | ||||||||||||||
| 5/23/08 | JPY | 47,502,000 | 459,384 | (17,998 | ) | ||||||||||||||
| 5/23/08 | JPY | 203,741,650 | 1,970,351 | (68,090 | ) | ||||||||||||||
| 5/23/08 | JPY | 203,741,650 | 1,970,351 | (63,318 | ) | ||||||||||||||
| 5/23/08 | JPY | 209,915,640 | 2,030,059 | (69,930 | ) | ||||||||||||||
| 5/23/08 | NOK | 8,526,433 | 1,624,805 | (40,614 | ) | ||||||||||||||
| 5/23/08 | SEK | 4,605,797 | 744,148 | (17,754 | ) | ||||||||||||||
| 5/23/08 | SGD | 152,000 | 109,336 | (1,209 | ) | ||||||||||||||
| $ | 30,782,357 | $ | (866,030 | ) | |||||||||||||||
See accompanying notes to the financial statements.
3
GMO Currency Hedged International Equity Fund
(A Series of GMO Trust)
Schedule of Investments — (Continued)
February 29, 2008
Notes to Schedule of Investments:
As of February 29, 2008, 88.66% of the Net Assets of the Fund, through investments in the underlying funds, were valued using fair value prices based on models used by a third party vendor (Note 2).
Currency Abbreviations:
| AUD - Australian Dollar CAD - Canadian Dollar CHF - Swiss Franc DKK - Danish Krone EUR - Euro GBP - British Pound HKD - Hong Kong Dollar JPY - Japanese Yen NOK - Norwegian Krone SEK - Swedish Krona SGD - Singapore Dollar | |||
See accompanying notes to the financial statements.
4
GMO Currency Hedged International Equity Fund
(A Series of GMO Trust)
Statement of Assets and Liabilities — February 29, 2008
| Assets: | |||||||
| Investments in unaffiliated issuers, at value (cost $1,000,000) (Note 2) | $ | 1,000,000 | |||||
| Investments in affiliated issuers, at value (cost $35,247,560) (Notes 2 and 8) | 30,063,893 | ||||||
| Cash | 53,379 | ||||||
| Foreign currency, at value (cost $54,478) (Note 2) | 56,322 | ||||||
| Receivable for Fund shares sold | 1,799 | ||||||
| Unrealized appreciation on open forward currency contracts (Note 2) | 30,163 | ||||||
| Receivable for expenses reimbursed by Manager (Note 3) | 32,191 | ||||||
| Total assets | 31,237,747 | ||||||
| Liabilities: | |||||||
| Payable to affiliate for (Note 3): | |||||||
| Management fee | 13,100 | ||||||
| Shareholder service fee | 3,642 | ||||||
| Trustees and Chief Compliance Officer of GMO Trust fees | 108 | ||||||
| Unrealized depreciation on open forward currency contracts (Note 2) | 866,030 | ||||||
| Accrued expenses | 81,821 | ||||||
| Total liabilities | 964,701 | ||||||
| Net assets | $ | 30,273,046 | |||||
| Net assets consist of: | |||||||
| Paid-in capital | $ | 28,611,695 | |||||
| Accumulated undistributed net investment income | 794,785 | ||||||
| Accumulated net realized gain | 6,884,256 | ||||||
| Net unrealized depreciation | (6,017,690 | ) | |||||
| $ | 30,273,046 | ||||||
| Net assets attributable to: | |||||||
| Class III shares | $ | 30,273,046 | |||||
| Shares outstanding: | |||||||
| Class III | 5,690,948 | ||||||
| Net asset value per share: | |||||||
| Class III | $ | 5.32 | |||||
See accompanying notes to the financial statements.
5
GMO Currency Hedged International Equity Fund
(A Series of GMO Trust)
Statement of Operations — Year Ended February 29, 2008
| Investment Income: | |||||||
| Dividends from affiliated issuers (Note 8) | $ | 575,809 | |||||
| Interest | 288,601 | ||||||
| Total investment income | 864,410 | ||||||
| Expenses: | |||||||
| Management fee (Note 3) | 925,645 | ||||||
| Shareholder service fee – Class III (Note 3) | 257,124 | ||||||
| Custodian and fund accounting agent fees | 68,816 | ||||||
| Transfer agent fees | 26,873 | ||||||
| Audit and tax fees | 64,241 | ||||||
| Legal fees | 4,363 | ||||||
| Trustees fees and related expenses (Note 3) | 1,846 | ||||||
| Registration fees | 3,001 | ||||||
| Miscellaneous | 2,349 | ||||||
| Total expenses | 1,354,258 | ||||||
| Fees and expenses reimbursed by Manager (Note 3) | (168,949 | ) | |||||
| Expense reductions (Note 2) | (1,056 | ) | |||||
| Indirectly incurred fees waived or borne by Manager (Note 3) | (893,852 | ) | |||||
| Shareholder service fee waived (Note 3) | (151,805 | ) | |||||
| Net expenses | 138,596 | ||||||
| Net investment income (loss) | 725,814 | ||||||
| Realized and unrealized gain (loss): | |||||||
| Net realized gain (loss) on: | |||||||
| Investments in affiliated issuers | 37,704,150 | ||||||
| Realized gains distributions from affiliated issuers (Note 8) | 10,472,304 | ||||||
| Foreign currency, forward contracts and foreign currency related transactions | (14,266,724 | ) | |||||
| Net realized gain (loss) | 33,909,730 | ||||||
| Change in net unrealized appreciation (depreciation) on: | |||||||
| Investments in affiliated issuers | (24,991,539 | ) | |||||
| Foreign currency, forward contracts and foreign currency related transactions | 914,740 | ||||||
| Net unrealized gain (loss) | (24,076,799 | ) | |||||
| Net realized and unrealized gain (loss) | 9,832,931 | ||||||
| Net increase (decrease) in net assets resulting from operations | $ | 10,558,745 | |||||
See accompanying notes to the financial statements.
6
GMO Currency Hedged International Equity Fund
(A Series of GMO Trust)
Statement of Changes in Net Assets
| Year Ended | Year Ended | ||||||||||
| February 29, 2008 | February 28, 2007 | ||||||||||
| Increase (decrease) in net assets: | |||||||||||
| Operations: | |||||||||||
| Net investment income (loss) | $ | 725,814 | $ | 3,614,363 | |||||||
| Net realized gain (loss) | 33,909,730 | 139,338,705 | |||||||||
| Change in net unrealized appreciation (depreciation) | (24,076,799 | ) | (77,805,071 | ) | |||||||
| Net increase (decrease) in net assets from operations | 10,558,745 | 65,147,997 | |||||||||
| Distributions to shareholders from: | |||||||||||
| Net investment income | |||||||||||
| Class III | — | (9,318,611 | ) | ||||||||
| Net realized gains | |||||||||||
| Class III | (48,200,678 | ) | (155,726,954 | ) | |||||||
| (48,200,678 | ) | (165,045,565 | ) | ||||||||
| Net share transactions (Note 7): | |||||||||||
| Class III | (159,181,264 | ) | (401,820,578 | ) | |||||||
| Total increase (decrease) in net assets | (196,823,197 | ) | (501,718,146 | ) | |||||||
| Net assets: | |||||||||||
| Beginning of period | 227,096,243 | 728,814,389 | |||||||||
| End of period (including accumulated undistributed net investment income of $794,785 and distributions in excess of net investment income of $862,825, respectively) | $ | 30,273,046 | $ | 227,096,243 | |||||||
See accompanying notes to the financial statements.
7
GMO Currency Hedged International Equity Fund
(A Series of GMO Trust)
Financial Highlights
(For a Class III share outstanding throughout each period)
| Year Ended February 28/29, | |||||||||||||||||||||||
| 2008 | 2007 | 2006 | 2005 | 2004 | |||||||||||||||||||
| Net asset value, beginning of period | $ | 7.45 | $ | 9.07 | $ | 8.38 | $ | 7.33 | $ | 5.54 | |||||||||||||
| Income (loss) from investment operations: | |||||||||||||||||||||||
| Net investment income (loss)(a)† | 0.03 | 0.10 | 0.07 | 0.21 | 0.20 | ||||||||||||||||||
| Net realized and unrealized gain (loss) | (0.29 | ) | 1.17 | 2.17 | 0.84 | 1.59 | |||||||||||||||||
| Total from investment operations | (0.26 | ) | 1.27 | 2.24 | 1.05 | 1.79 | |||||||||||||||||
| Less distributions to shareholders: | |||||||||||||||||||||||
| From net investment income | — | (0.12 | ) | (0.71 | )(b) | — | — | ||||||||||||||||
| From net realized gains | (1.87 | ) | (2.77 | ) | (0.84 | ) | — | — | |||||||||||||||
| Total distributions | (1.87 | ) | (2.89 | ) | (1.55 | ) | — | — | |||||||||||||||
| Net asset value, end of period | $ | 5.32 | $ | 7.45 | $ | 9.07 | $ | 8.38 | $ | 7.33 | |||||||||||||
| Total Return(c) | (6.75 | )% | 15.60 | % | 28.42 | % | 14.32 | % | 32.31 | % | |||||||||||||
| Ratios/Supplemental Data: | |||||||||||||||||||||||
| Net assets, end of period (000's) | $ | 30,273 | $ | 227,096 | $ | 728,814 | $ | 580,905 | $ | 160,586 | |||||||||||||
| Net expenses to average daily net assets(d) | 0.08 | %(e) | 0.07 | % | 0.05 | % | 0.04 | % | 0.04 | % | |||||||||||||
| Net investment income to average daily net assets(a) | 0.42 | % | 1.23 | % | 0.82 | % | 2.64 | % | 2.98 | % | |||||||||||||
| Portfolio turnover rate | 11 | % | 18 | % | 36 | % | 3 | % | 5 | % | |||||||||||||
| Fees and expenses reimbursed and/or waived by the Manager to average daily net assets: | 0.71 | % | 0.68 | % | 0.67 | % | 0.71 | % | 0.87 | % | |||||||||||||
(a) Net investment income is affected by the timing of the declaration of dividends by the underlying funds in which the Fund invests.
(b) Distributions from net investment income include amounts (approximately $0.07 per share) from foreign currency transactions which are treated as realized capital gain for book purposes.
(c) The total returns would have been lower had certain expenses not been reimbursed and/or waived during the periods shown and assumes the effect of reinvested distributions.
(d) Net expenses exclude expenses incurred indirectly through investment in the underlying funds (See Note 3).
(e) The net expense ratio does not include the effect of expense reductions.
† Calculated using average shares outstanding throughout the period.
See accompanying notes to the financial statements.
8
GMO Currency Hedged International Equity Fund
(A Series of GMO Trust)
Notes to Financial Statements
February 29, 2008
1. Organization
GMO Currency Hedged International Equity Fund (the "Fund") is a series of GMO Trust (the "Trust"). The Fund is registered under the Investment Company Act of 1940, as amended, as an open-end, non-diversified management investment company. The Fund is advised and managed by Grantham, Mayo, Van Otterloo & Co. LLC (the "Manager" or "GMO"). The Trust was established as a Massachusetts business trust under the laws of the Commonwealth of Massachusetts on June 24, 1985. The Declaration of Trust permits the Trustees of the Trust ("Trustees") to create an unlimited number of series of shares ("Funds") and to subdivide Funds into classes.
The Fund seeks high total return. The Fund seeks to achieve its investment objective by outperforming the MSCI EAFE Index (Europe, Australasia, and Far East) (Hedged). The Fund is a fund of funds and invests in other GMO Funds. The Fund may invest to varying extents in GMO International Core Equity Fund, GMO International Intrinsic Value Fund, GMO International Growth Equity Fund, and GMO International Small Companies Fund ("underlying funds"). GMO attempts to hedge at least 70% of the foreign currency exposure in the underlying funds' investments relative to the U.S. dollar.
The financial statements of the underlying funds should be read in conjunction with the Fund's financial statements. These financial statements are available, without charge, upon request by calling (617) 346-7646 (collect) or visiting GMO's website at www.gmo.com.
2. Significant accounting policies
The following is a summary of significant accounting policies which are in conformity with accounting principles generally accepted in the United States of America ("U.S. GAAP") and which are consistently followed by the Fund in the preparation of its financial statements. The preparation of financial statements in accordance with U.S. GAAP requires management to make estimates and assumptions that affect the reported amounts and disclosures in the financial statements. Actual results could differ from those estimates. The accounting records of the Fund are maintained in U.S. dollars.
Portfolio valuation
Shares of the underlying funds and other mutual funds are valued at their net asset value.
Investments held by the underlying funds are valued as follows. Securities listed on a securities exchange for which market quotations are readily available are valued at the last sale price or official closing price on each business day, or if there is no such reported sale or official closing price, at the most recent quoted bid price. Unlisted securities for which market quotations are readily available are generally valued at the most recent quoted bid price. Short-term investments with a remaining maturity of sixty days or less are generally valued at amortized cost, which approximates fair value. Securities for which quotations are not readily available or whose values the Manager has determined to be unreliable are valued at fair value as
9
GMO Currency Hedged International Equity Fund
(A Series of GMO Trust)
Notes to Financial Statements — (Continued)
February 29, 2008
determined in good faith by the Trustees or other persons acting at their direction pursuant to procedures approved by the Trustees. By its nature, a fair value price is a good faith estimate of the value of a security at a given point in time and may not reflect the value that would be realized if the security was sold and the differences could be material. Because many foreign equity securities markets and exchanges close prior to the close of the New York Stock Exchange ("NYSE"), closing prices for foreign securities in those markets or on those exchanges do not reflect the events that occur after that close but before the close of the NYSE. As a result, foreign equity securities are generally valued using fair value prices supplied by a third party vendor based on models to the extent that these fair value prices are available.
Foreign currency translation
The market values of foreign securities, currency holdings and other assets and liabilities are translated to U.S. dollars based on the current exchange rates each business day. Income and expenses denominated in foreign currencies are translated at current exchange rates when accrued or incurred. The Fund does not isolate realized and unrealized gains and losses attributable to changes in exchange rates from gains and losses that arise from changes in the market value of investments. Such fluctuations are included with net realized and unrealized gain or loss on investments. Net realized gains and losses on foreign currency transactions represent gains and losses on disposition of currencies and forward currency contracts, currency gains and losses realized between the trade and settlement dates on securities transactions, and the difference between the amount of investment income and foreign withholding taxes recorded on the F und's accounting records and the U.S. dollar equivalent amounts actually received or paid.
Forward currency contracts
The Fund may enter into forward currency contracts including forward cross currency contracts. A forward currency contract is an agreement between two parties to buy and sell a currency at a set price on a future date. The market value of a forward currency contract fluctuates with changes in forward currency exchange rates. Forward currency contracts are marked to market daily using rates supplied by a quotation service and changes in value are recorded by the Fund as an unrealized gain or loss. Realized gains or losses equal to the difference between the value of the contract at the time it was opened and the value at the time it was closed are recorded upon delivery or receipt of the currency or, if a forward currency contract is offset by entering into another forward currency contract with the same broker, upon settlement of the net gain or loss. These contracts may involve market risk in excess of the unrealized gain or lo ss reflected in the Fund's Statement of Assets and Liabilities. In addition, the Fund could be exposed to risk if the counterparties are unable to meet the terms of the contracts or if there are movements in currency values that are unfavorable to the Fund. Forward currency contracts outstanding at the end of the period are listed in the Fund's Schedule of Investments.
Futures contracts
The Fund may purchase and sell futures contracts. Upon entering into a futures contract, the Fund is required to deposit with the futures clearing broker an amount of cash, U.S. government and agency obligations, or other liquid assets in accordance with the initial margin requirements of the broker or
10
GMO Currency Hedged International Equity Fund
(A Series of GMO Trust)
Notes to Financial Statements — (Continued)
February 29, 2008
exchange. In addition, the Fund maintains cash or securities in an amount that at least equals the net amount payable in the event the Fund must deliver the full amount of the contracts. Futures contracts are marked to market daily and an appropriate payable or receivable for the change in value ("variation margin") is recorded by the Fund. The payable or receivable is liquidated on the following business day. Gains or losses are recognized but not considered realized until the contracts expire or are closed. Futures contracts involve, to varying degrees, risk of loss in excess of the variation margin disclosed in the Statement of Assets and Liabilities. Under certain circumstances, futures exchanges may establish daily limits on the amount that the price of a futures contract can vary from the previous day's settlement price, thereby effectively preventing liquidation of unfavorable positions. Losses may arise from changes in t he value of the underlying instrument if the Fund is unable to liquidate a futures position due to an illiquid secondary market for the contracts or the imposition of price limits, or if counterparties do not perform under the contract terms. Futures contracts are generally valued at the settlement price established each day by the board of trade or exchange on which they are traded. There were no futures contracts outstanding at the end of the period.
Options
The Fund may write call and put options. Writing options increases the Fund's exposure to the underlying instrument by, in the case of a call option, obligating the Fund to sell the underlying instrument at a set price to the option-holder and, in the case of a put option, obligating the Fund to purchase the underlying instrument at a set price from the option-holder. When the Fund writes a call or put option, an amount equal to the premium received is recorded as a liability and subsequently marked to market to reflect the current value of the option written. Premiums received from writing options which expire are treated as realized gains. Premiums received from writing options which are exercised or closed are added to the proceeds or offset against the amounts paid on the underlying future, security or currency transaction to determine the realized gain or loss. The Fund as a writer of an option has no control over whether t he underlying future, security or currency may be sold (call) or purchased (put) and as a result bears the market risk of an unfavorable change in the price of the future, security or currency underlying the written option. In the event that the Fund writes uncovered call options (i.e. options for investments that the Fund does not own), it bears the risk of incurring substantial losses if the price of the underlying instrument increases during the term of the option. There is the risk the Fund may not be able to enter into a closing transaction because of an illiquid market. There were no open written option contracts during the period.
The Fund may also purchase put and call options. Purchasing options alters the Fund's exposure to the underlying instrument by, in the case of a call option, entitling the Fund to purchase the underlying instrument at a set price from the writer of the option and, in the case of a put option, entitling the Fund to sell the underlying instrument at a set price to the writer of the option. The Fund pays a premium as a cost for a purchased option disclosed in the Schedule of Investments which is subsequently marked to market to reflect the current value of the option. Premiums paid for purchasing options which expire are treated as realized losses. Premiums paid for purchasing options which are exercised or closed are added to the amounts paid or offset against the proceeds on the closing transaction to determine the realized gain or
11
GMO Currency Hedged International Equity Fund
(A Series of GMO Trust)
Notes to Financial Statements — (Continued)
February 29, 2008
loss. The risk associated with purchasing put and call options is limited to the premium paid. There were no purchased option contracts outstanding at the end of the period.
Exchange traded options are valued at the last sale price, or if no sale is reported, the last bid price for purchased options and the last ask price for written options. Options traded over-the-counter are valued using prices supplied by a primary pricing source chosen by the Manager.
Swap agreements
The Fund may enter into swap agreements. A swap is an agreement to exchange the return generated by one instrument for the return generated by another instrument. Interest rate swap agreements involve the exchange by one party with another party of their respective commitments to pay or receive interest, e.g., an exchange of floating rate payments for fixed rate payments with respect to a notional amount of principal. Total return swap agreements involve a commitment by one party in the agreement to pay interest in exchange for a market-linked return, both based on notional amounts. To the extent the total return of the security or index underlying the transaction exceeds or falls short of the offsetting interest rate obligation, the party will receive a payment from or make a payment to the counterparty, respectively. Forward spread lock swap agreements involve commitments to pay or receive a settlement amount calculated as the difference between the swap spread and a fixed spread, multiplied by the notional amount times the duration of the swap rate. The swap spread is the difference between the benchmark swap rate (market rate) and the specific treasury rate. Variance swap agreements involve commitments to pay or receive a settlement amount calculated as the difference between the annualized realized variance of returns on the underlying price and a fixed quantity, also known as the variance strike, over a period of time. In connection with these agreements, cash or securities may be set aside as collateral by the Fund's custodian or brokers in accordance with the terms of the swap agreement. The Fund earns or pays interest on cash set aside as collateral.
Swaps are marked to market daily using models that incorporate quotations from market makers and the change in value, if any, is recorded as unrealized gain or loss in the Statement of Operations. Payments received or made on swap contracts are recorded as realized gain or loss in the Statement of Operations. Gains or losses are realized upon early termination of the swap agreements. These financial instruments are not actively traded on financial markets. The values assigned to these instruments are based upon the best available information and because of the uncertainty of the valuation, these values may differ significantly from the values that would have been realized had a ready market for these instruments existed, and the differences could be material. Entering into these agreements involves, to varying degrees, elements of credit, legal, market and documentation risk in excess of the amounts recognized in the Statement o f Assets and Liabilities. Such risks involve the possibility that there will be no liquid market for these agreements, that the counterparties to the agreements may default on their obligations to perform or disagree as to the meaning of contractual terms in the agreements, or that there may be unfavorable changes in interest rates or the price of the index or security underlying these transactions. There were no swap agreements outstanding at the end of the period.
12
GMO Currency Hedged International Equity Fund
(A Series of GMO Trust)
Notes to Financial Statements — (Continued)
February 29, 2008
Securities Lending
The Fund may lend its securities to certain qualified broker-dealers. The loans are collateralized with cash or liquid securities with a market value at least equal to the market value of the securities on loan. As with other extensions of credit, the Fund may bear the risk of loss with respect to the investment of the collateral, the risk of delay in and/or inability to exercise its rights with respect to the collateral, and the risk of delay in recovery or loss of rights in the loaned securities should the borrower of the securities fail financially. If a loan is collateralized by U.S. government securities, the Fund receives a fee from the borrower. If a loan is collateralized by cash, the Fund typically invests the cash collateral for its own account in interest-bearing, short-term securities and pays a fee to the borrower that normally represents a portion of the Fund's earnings on the collateral. For the year ended Februar y 29, 2008, the Fund did not participate in securities lending.
Taxes and distributions
The Fund intends to qualify each tax year as a regulated investment company under Subchapter M of the Internal Revenue Code of 1986, as amended (the "Code"). The Fund intends to distribute substantially all of its net investment income and net realized short-term and long-term capital gains, if any, after giving effect to any available capital loss carryovers for U.S. federal income tax purposes. Therefore, no provision for U.S. federal income or excise tax is necessary. Taxes on foreign interest and dividend income are generally withheld in accordance with the applicable country's tax treaty with the United States. The foreign withholding rates applicable to a Fund's investments in certain foreign jurisdictions may be higher if a significant portion of the Fund is held by non-U.S. shareholders.
The Fund's policy is to declare and pay distributions from net investment income, if any, semiannually, and from net realized short-term and long-term capital gains, if any, at least annually. All distributions are paid in shares of the Fund, at net asset value, unless the shareholder elects to receive cash distributions. Distributions to shareholders are recorded by the Fund on the ex-dividend date.
Income and capital gain distributions are determined in accordance with U.S. federal income tax regulations, which may differ from U.S. GAAP. Certain capital accounts in the financial statements are periodically adjusted for permanent differences in order to reflect their tax character. These adjustments have no impact on net assets or net asset value per share. Temporary differences which arise from recognizing certain items of income, expense, gain or loss in different periods for financial statement and tax purposes will reverse at some time in the future. Distributions in excess of net investment income or net realized gains are temporary over distributions for financial statement purposes resulting from differences in the recognition or classification of income or distributions for financial statement and tax purposes.
U.S. GAAP and tax accounting differences primarily relate to capital loss carry forwards, derivative contract transactions, differing treatment of mutual fund distributions received, foreign currency transactions, losses on wash sale transactions and net operating losses.
13
GMO Currency Hedged International Equity Fund
(A Series of GMO Trust)
Notes to Financial Statements — (Continued)
February 29, 2008
The following reclassification represents the amount necessary to report the stated components of net assets on a tax basis, excluding certain temporary differences, as of February 29, 2008. The financial highlights exclude these adjustments.
| Accumulated Undistributed Net Investment Income | Accumulated Net Realized Gain | Paid-in Capital | |||||||||
| $ | 931,796 | $ | 10,181,236 | $ | (11,113,032 | ) | |||||
The tax character of distributions declared to shareholders is as follows:
| 2/29/2008 | 2/28/2007 | ||||||||||
| Ordinary income (including any short-term capital gains) | $ | — | $ | 13,117,818 | |||||||
| Long-term capital gains | 48,200,678 | 151,927,747 | |||||||||
| Total distributions | $ | 48,200,678 | $ | 165,045,565 | |||||||
Distributions in excess of tax basis earnings and profits, if significant, are reported in the financial statements as a tax return of capital.
As of February 29, 2008, the components of distributable earnings on a tax basis consisted of the following:
| Undistributed long-term capital gain | $ | 6,991,877 | |||||
As of February 29, 2008, the Fund had capital loss carryforwards available to offset future realized gains if any, to the extent permitted by the Code. Utilization of the capital loss carryforwards could be subject to limitations imposed by the Code related to share ownership activity. Such losses expire as follows:
| 2/28/2011 | $ | (64,645 | ) | ||||
| Total | $ | (64,645 | ) | ||||
14
GMO Currency Hedged International Equity Fund
(A Series of GMO Trust)
Notes to Financial Statements — (Continued)
February 29, 2008
As of February 29, 2008, the approximate cost for U.S. federal income tax purposes and gross and net unrealized appreciation and depreciation in value of investments were as follows:
| Aggregate Cost | Gross Unrealized Appreciation | Gross Unrealized (Depreciation) | Net Unrealized Appreciation (Depreciation) | ||||||||||||
| $ | 36,290,535 | $ | — | $ | (5,226,642 | ) | $ | (5,226,642 | ) | ||||||
Security transactions and related investment income
Security transactions are accounted for on trade date. Dividend income, net of applicable foreign withholding taxes, if any, is recorded on the ex-dividend date, or when the Fund is informed of the ex-dividend date, if later. Interest income is recorded on the accrual basis and is adjusted for the amortization of premiums and accretion of discounts. Interest income on inflation indexed securities, if any, is accrued daily based upon an inflation adjusted principal. Additionally, any increase or decrease in the principal or face amount of the securities adjusted for inflation is recorded as interest income or loss. Income is not recognized on securities for which collection is not expected. Non-cash dividends, if any, are recorded at the fair market value of the securities received. In determining the net gain or loss on securities sold, the cost of securities is determined on the identified cost basis.
Expenses
The majority of expenses of the Trust are directly identifiable to an individual fund. Expenses which are not readily identifiable to a specific fund are allocated taking into consideration, among other things, the nature and type of expense and the relative size of the funds. In addition, the Fund will also incur certain fees and expenses indirectly as a shareholder in the underlying funds. Because the underlying funds have varied expense and fee levels and the Fund may own different proportions of the underlying funds at different times, the amount of fees and expenses indirectly incurred by the Fund will vary (See Note 3).
Brown Brothers Harriman & Co. ("BBH") serves as custodian and fund accounting agent of the Fund. State Street Bank and Trust Company ("State Street") serves as transfer agent of the Fund. BBH and State Street's fees may be reduced by credits that are an earnings allowance calculated on the average daily cash balances the Fund maintains with each agent. Credit balances or expense reimbursements used to reduce fees, if any, are reported as a reduction of expenses in the Statement of Operations.
Investment risks
There are certain additional risks involved in investing in foreign securities that are not inherent in investments in U.S. securities. These risks may involve adverse political and economic developments including the possible imposition of capital controls or other foreign governmental laws or restrictions. In addition, the securities of some foreign companies and securities markets are less liquid and at times may be more volatile than securities of comparable U.S. companies and U.S. securities markets.
15
GMO Currency Hedged International Equity Fund
(A Series of GMO Trust)
Notes to Financial Statements — (Continued)
February 29, 2008
Recently issued accounting pronouncements
In June 2006, the Financial Accounting Standards Board ("FASB") issued FASB Interpretation No. 48, Accounting for Uncertainty in Income Taxes – an Interpretation of FASB Statement No. 109 ("FIN 48"). FIN 48 clarifies the accounting for uncertainty in income taxes recognized in accordance with FASB Statement No. 109, Accounting for Income Taxes. FIN 48 prescribes a recognition threshold and measurement attribute for a tax position taken or expected to be taken in the tax return that could impact the Fund's financial statements. It also provides guidance in relation to the Fund's financial statements on classification of tax benefits or liabilities, interest and penalties, accounting in interim periods, disclosure, and transition. FIN 48 is effective for fiscal years beginning after December 15, 2006 for registered investment companies. Management has evaluated the effects of applying the various provisions of FIN 48 and has determined that the adoption of FIN 48 does not have a material effect on the Fund's financial statements. The Fund's federal tax returns for the prior three fiscal years, if applicable, remain subject to examination by the Internal Revenue Service. Management will continue to monitor the rules and guidance pertaining to FIN 48 and will take action if appropriate.
In September 2006, the FASB issued Statement of Financial Accounting Standards No. 157 ("FAS 157"), "Fair Value Measurements." FAS 157 defines fair value, establishes a framework for measuring fair value in accordance with generally accepted accounting principles and expands disclosure about fair value measurements. FAS 157 is effective for fiscal years beginning after November 15, 2007. Management is currently evaluating the impact the adoption of FAS 157 will have on the Fund's financial statement disclosures.
3. Fees and other transactions with affiliates
GMO earns a management fee paid monthly at the annual rate of 0.54% of average daily net assets. The Fund has adopted a Shareholder Service Plan under which the Fund pays GMO a shareholder service fee for client and shareholder service, reporting, and other support. Pursuant to the Shareholder Service Plan, the shareholder service fee is calculated based on average daily net assets at the annual rate of 0.15% for Class III shares.
The Manager will waive the Fund's shareholder service fee to the extent that the aggregate of any direct and indirect shareholder service fees borne by the Fund exceeds 0.15%; provided, however, that the amount of this waiver will not exceed 0.15%.
The Manager has contractually agreed to reimburse the Fund for Fund expenses through at least June 30, 2008 to the extent the Fund's total annual operating expenses (excluding shareholder service fees, expenses indirectly incurred by investment in the underlying funds, fees and expenses of the independent Trustees of the Trust, fees and expenses for legal services not approved by the Manager for the Trust, compensation and expenses of the Trust's Chief Compliance Officer ("CCO") (excluding any employee benefits), brokerage commissions, securities lending fees and expenses, interest expense, transfer taxes,
16
GMO Currency Hedged International Equity Fund
(A Series of GMO Trust)
Notes to Financial Statements — (Continued)
February 29, 2008
and other investment-related costs (including expenses associated with investments in any company that is an investment company or would be an investment company under the 1940 Act, but for the exceptions to the definition of investment company provided in Section 3(c)(1) and 3(c)(7) of the 1940 Act), hedging transaction fees, extraordinary, non-recurring and certain other unusual expenses (including taxes) (collectively, "Excluded Fund Fees and Expenses") exceed 0.54% of the Fund's average daily net assets. In addition, the Manager has contractually agreed to reimburse the Fund through at least June 30, 2008 to the extent that the sum of (a) the Fund's total annual operating expenses (excluding Excluded Fund Fees and Expenses) and (b) the amount of fees and expenses incurred indirectly by the Fund through its investment in the underlying funds (excluding these Funds' Excluded Fund Fees and Expenses)), exceeds 0.54% of the Fund' s average daily net assets, subject to a maximum total reimbursement to the Fund equal to 0.54% of the Fund's average daily net assets.
The Fund incurs fees and expenses indirectly as a shareholder in the underlying funds. For the year ended February 29, 2008, these indirect fees and expenses expressed as an annualized percentage of the Fund's average daily net assets were as follows:
| Indirect Net Expenses (excluding shareholder service fees) | Indirect Shareholder Service Fees | Total Indirect Expenses | |||||||||
| 0.522 | % | 0.088 | % | 0.610 | % | ||||||
The Fund's portion of the fees paid by the Trust to the independent Trustees and CCO during the year ended February 29, 2008 was $1,570 and $693, respectively. The compensation and expenses of the CCO are included in miscellaneous expenses in the Statement of Operations. No remuneration was paid by the Fund to any other officer of the Trust.
4. Purchases and sales of securities
Cost of purchases and proceeds from sales of securities, excluding short-term investments and class exchanges, for the year ended February 29, 2008 aggregated $18,258,114 and $225,370,000, respectively.
5. Guarantees
In the normal course of business the Fund enters into contracts with third-party service providers that contain a variety of representations and warranties and which provide general indemnifications. The Fund's maximum exposure under these arrangements is unknown, as this would involve future claims that may be made against the Fund that have not yet occurred. Based on experience, management is of the view that the risk of loss in connection with these potential indemnification obligations is remote; however, there can be no assurance that material liabilities related to such obligations will not arise in the future that could adversely impact the Fund.
17
GMO Currency Hedged International Equity Fund
(A Series of GMO Trust)
Notes to Financial Statements — (Continued)
February 29, 2008
6. Principal shareholders and related parties
As of February 29, 2008, 93.62% of the outstanding shares of the Fund were held by one shareholder. No other shareholder owned in excess of 10% of the outstanding shares of the Fund. Investment activities of this shareholder may have a material effect on the Fund.
As of February 29, 2008, 0.02% of the Fund's shares were held by one related party comprised of a certain GMO employee account, and 93.62% of the Fund's shares were held by accounts for which the Manager has investment discretion.
7. Share transactions
The Declaration of Trust permits the Trustees to issue an unlimited number of shares of beneficial interest (without par value). Transactions in Fund shares were as follows:
| Year Ended February 29, 2008 | Year Ended February 28, 2007 | ||||||||||||||||||
| Class III: | Shares | Amount | Shares | Amount | |||||||||||||||
| Shares sold | 839,414 | $ | 6,424,624 | 4,383,950 | $ | 35,031,290 | |||||||||||||
| Shares issued to shareholders in reinvestment of distributions | 7,433,717 | 47,788,021 | 20,822,962 | 163,736,057 | |||||||||||||||
| Shares repurchased | (33,056,614 | ) | (213,393,909 | ) | (75,107,197 | ) | (600,587,925 | ) | |||||||||||
| Net increase (decrease) | (24,783,483 | ) | $ | (159,181,264 | ) | (49,900,285 | ) | $ | (401,820,578 | ) | |||||||||
8. Investments in affiliated issuers
A summary of the Fund's transactions in the shares of affiliated issuers during the year ended February 29, 2008 is set forth below:
| Affiliate | Value, beginning of period | Purchases | Sales Proceeds | Dividend Income | Distributions of Realized Gains | Value, end of period | |||||||||||||||||||||
| GMO International Growth Equity Fund, Class IV | $ | 111,898,773 | $ | 10,105,728 | $ | 115,160,000 | $ | 193,866 | $ | 6,181,862 | $ | 15,047,067 | |||||||||||||||
| GMO International Intrinsic Value Fund, Class IV | 112,564,395 | 8,152,386 | 110,210,000 | 381,943 | 4,290,442 | 15,016,826 | |||||||||||||||||||||
| Totals | $ | 224,463,168 | $ | 18,258,114 | $ | 225,370,000 | $ | 575,809 | $ | 10,472,304 | $ | 30,063,893 | |||||||||||||||
18
Report of Independent Registered Public Accounting Firm
To the Trustees of GMO Trust and the Shareholders of
GMO Currency Hedged International Equity Fund
In our opinion, the accompanying statement of assets and liabilities, including the schedule of investments, and the related statements of operations and of changes in net assets and the financial highlights present fairly, in all material respects, the financial position of GMO Currency Hedged International Equity Fund (the "Fund") at February 29, 2008, the results of its operations for the year then ended, the changes in its net assets for each of the two years in the period then ended and the financial highlights for each of the five years in the period then ended, in conformity with accounting principles generally accepted in the United States of America. These financial statements and financial highlights (hereafter referred to as "financial statements") are the responsibility of the Fund's management; our responsibility is to express an opinion on these financial statements based on our audits. We conducted our audits of t hese financial statements in accordance with the standards of the Public Company Accounting Oversight Board (United States). Those standards require that we plan and perform the audit to obtain reasonable assurance about whether the financial statements are free of material misstatement. An audit includes examining, on a test basis, evidence supporting the amounts and disclosures in the financial statements, assessing the accounting principles used and significant estimates made by management, and evaluating the overall financial statement presentation. We believe that our audits, which included confirmation of securities at February 29, 2008 by correspondence with the custodian, provide a reasonable basis for our opinion.
PricewaterhouseCoopers LLP
Boston, Massachusetts
April 29, 2008
19
GMO Currency Hedged International Equity Fund
(A Series of GMO Trust)
Fund Expenses
February 29, 2008 (Unaudited)
Expense Examples: The following information is in relation to expenses for the six month period ended February 29, 2008.
As a shareholder of the Fund, you may incur two types of costs: (1) transaction costs, and (2) ongoing costs, including management fees, shareholder service fees, and other Fund expenses. This example is intended to help you understand your ongoing costs (in dollars) of investing in the Fund and to compare these costs with the ongoing costs of investing in other mutual funds.
These examples are based on an investment of $1,000 invested at the beginning of the period and held for the entire period, September 1, 2007 through February 29, 2008.
Actual Expenses
The first line of the table below provides information about actual account values and actual expenses. You may use the information in this line, together with the amount you invested, to estimate the expenses that you paid over the period. Simply divide your account value by $1,000 (for example, a $10,000,000 account value divided by $1,000 = 10,000), then multiply the result by the number in the first line under the heading entitled "Net Expense Incurred" to estimate the expenses you paid on your account during this period.
Hypothetical Example for Comparison Purposes
The second line of the table below provides information about hypothetical account values and hypothetical expenses based on the Fund's actual expense ratio and an assumed rate of return of 5% per year before expenses, which is not the Fund's actual return. The hypothetical account values and expenses may not be used to estimate the actual ending account balance or expenses you paid for the period. You may use this information to compare the ongoing costs of investing in the Fund with other funds. To do so, compare this 5% hypothetical example with the 5% hypothetical examples that appear in the shareholder reports of other funds.
Please note that the expenses shown in the table are meant to highlight your ongoing costs only and do not reflect any transactional costs. Therefore, the second line of the table is useful in comparing ongoing costs only, and will not help you determine the relative total costs of owning different funds. In addition, if these transactional costs were included, your costs would have been higher.
| Annualized Net Expense Ratio | Beginning Account Value | Ending Account Value | Net Expense Incurred* | ||||||||||||||||
| Class III | |||||||||||||||||||
| 1) Actual | 0.69 | % | $ | 1,000.00 | $ | 887.30 | $ | 3.24 | |||||||||||
| 2) Hypothetical | 0.69 | % | $ | 1,000.00 | $ | 1,021.43 | $ | 3.47 | |||||||||||
* Expenses are calculated using the Class's annualized expense ratio (including indirect expenses incurred) for the six months ended February 29, 2008, multiplied by the average account value over the period, multiplied by 182 days in the period, divided by 366 days in the year.
20
GMO Currency Hedged International Equity Fund
(A Series of GMO Trust)
Tax Information for the Tax Year Ended February 29, 2008 (Unaudited)
The Fund will notify shareholders of amounts for use in preparing 2008 income tax forms in January 2009.
The Fund's distributions to shareholders include $48,200,678 from long-term capital gains.
21
Trustees and Officers (Unaudited)
The following tables list the Trust's Trustees and Officers as of the date of this report; their address and date of birth ("DOB"); their position with the Trust; the length of time holding that position with the Trust; their principal occupation(s) during the past five years; the number of portfolios in the fund complex they oversee; and other directorships they hold in companies subject to registration or reporting requirements of the Securities Exchange Act of 1934 (generally called "public companies") or in registered investment companies. The Trust's Statement of Additional Information ("SAI") includes additional information about the Trust's trustees, including changes subsequent to the date of the report. The SAI is available, without charge, upon request by writing GMO, c/o GMO Trust, 40 Rowes Wharf, Boston, MA 02110.
Independent Trustees:
| Name, Address, and DOB | Position(s) Held with Trust | Term of Office1 and Length of Time Served | Principal Occupation(s) During Past Five Years | Number of Portfolios in Fund Complex Overseen by Trustee | Other Directorships Held by Trustee | ||||||||||||||||||
| Donald W. Glazer, Esq. c/o GMO Trust 40 Rowes Wharf Boston, MA 02110 DOB: 07/26/1944 | Chairman of the Board of Trustees | Chairman of the Board of Trustees since March 2005; Lead Independent Trustee (September 2004 – March 2005); Trustee since December 2000. | Consultant – Law and Business2; Vice Chair (since 2002) and Secretary, Provant, Inc. (provider of personnel performance improvement services and training products); Author of Legal Treatises. | 47 | None. | ||||||||||||||||||
1 Each Trustee is elected to serve during the continued lifetime of the Trust until he/she dies, resigns or is removed, or if sooner, until the next meeting of Shareholders called for the purpose of electing Trustees and until the election and qualification of his/her successor.
2 As part of Mr. Glazer's work as a consultant, he provides part-time consulting services to Goodwin Procter LLP ("Goodwin"). Goodwin has provided legal services to Renewable Resources, LLC, an affiliate of GMO; GMO, in connection with its relationship with Renewable Resources; and funds managed by Renewable Resources. Mr. Glazer has represented that he has no financial interest in, and is not involved in the provision of, such legal services. In the calendar years ended December 31, 2006 and December 31, 2007, these entities paid $825,738 and $291,721 respectively, in legal fees and disbursements to Goodwin.
22
Independent Trustees — (Continued)
| Name, Address, and DOB | Position(s) Held with Trust | Term of Office1 and Length of Time Served | Principal Occupation(s) During Past Five Years | Number of Portfolios in Fund Complex Overseen by Trustee | Other Directorships Held by Trustee | ||||||||||||||||||
| Jay O. Light c/o GMO Trust 40 Rowes Wharf Boston, MA 02110 DOB: 10/03/1941 | Trustee | Since May 1996. | Dean (since April 2006), Acting Dean (August 2005 – April 2006), Senior Associate Dean (1998 – 2005), and Professor of Business Administration, Harvard Business School. | 47 | Director of Harvard Management Company, Inc.3 and Verde, Inc.; Director of Partners HealthCare System, Inc. and Chair of its Investment Committee.4 | ||||||||||||||||||
| W. Nicholas Thorndike c/o GMO Trust 40 Rowes Wharf Boston, MA 02110 DOB: 03/28/1933 | Trustee | Since March 2005. | Director or trustee of various corporations and charitable organizations, including Courier Corporation (a book publisher and manufacturer) (July 1989 – present); Putnam Funds (December 1992 – June 2004); and Providence Journal (a newspaper publisher) (December 1986 – December 2003). | 47 | Director of Courier Corporation (a book publisher and manufacturer); Member of the Investment Committee of Partners HealthCare System, Inc.4 | ||||||||||||||||||
1 Each Trustee is elected to serve during the continued lifetime of the Trust until he/she dies, resigns or is removed, or if sooner, until the next meeting of Shareholders called for the purpose of electing Trustees and until the election and qualification of his/her successor.
3 Harvard Management Company, Inc. is a client of the Manager.
4 Partners HealthCare System, Inc. is a client of the Manager.
23
Principal Officers:
| Name, Address, and DOB | Position(s) Held with Trust | Term of Office5 and Length of Time Served | Principal Occupation(s) During Past Five Years | ||||||||||||
| Scott Eston c/o GMO Trust 40 Rowes Wharf Boston, MA 02110 DOB: 01/20/1956 | President and Chief Executive Officer | President and Chief Executive Officer since October 2002; Chief Financial Officer, November 2006 – February 2007. | Chief Financial Officer, Chief Operating Officer and Member, Grantham, Mayo, Van Otterloo & Co. LLC. | ||||||||||||
| Sheppard N. Burnett c/o GMO Trust 40 Rowes Wharf Boston, MA 02110 DOB: 10/24/1968 | Treasurer and Chief Financial Officer | Chief Financial Officer since March 2007; Treasurer since November 2006; Assistant Treasurer, September 2004 – November 2006. | Fund Administration Staff, Grantham, Mayo, Van Otterloo & Co. LLC (June 2004 – present); Vice President, Director of Tax, Columbia Management Group (2002 – 2004). | ||||||||||||
| Brent C. Arvidson c/o GMO Trust 40 Rowes Wharf Boston, MA 02110 DOB: 06/26/1969 | Assistant Treasurer | Since August 1998. | Senior Fund Administrator, Grantham, Mayo, Van Otterloo & Co. LLC. | ||||||||||||
| John L. Nasrah c/o GMO Trust 40 Rowes Wharf Boston, MA 02110 DOB: 05/27/1977 | Assistant Treasurer | Since March 2007. | Fund Administrator, Grantham, Mayo, Van Otterloo & Co. LLC (September 2004 – present); Tax Analyst, Bain & Company, Inc (June 2003 – September 2004); Senior Tax Associate, PricewaterhouseCoopers LLP (2001 – 2003). | ||||||||||||
| Mahmoodur Rahman c/o GMO Trust 40 Rowes Wharf Boston, MA 02110 DOB: 11/30/1967 | Assistant Treasurer | Since September 2007. | Fund Administrator, Grantham, Mayo, Van Otterloo & Co. (April 2007 – present); Vice President and Senior Tax Manager, Massachusetts Financial Services Company (January 2000 – April 2007). | ||||||||||||
5 Officers are elected to hold such office until their successor is elected and qualified to carry out the duties and responsibilities of their office, or until he or she resigns or is removed from office.
24
Principal Officers — (Continued)
| Name, Address, and DOB | Position(s) Held with Trust | Term of Office5 and Length of Time Served | Principal Occupation(s) During Past Five Years | ||||||||||||
| Michael E. Gillespie c/o GMO Trust 40 Rowes Wharf Boston, MA 02110 DOB: 02/18/1958 | Chief Compliance Officer | Since March 2005. | Vice President of Compliance (June 2004 – February 2005) and Director of Domestic Compliance (March 2002 – June 2004), Fidelity Investments; Vice President and Senior Counsel, State Street Bank and Trust Company (May 1998 – March 2002). | ||||||||||||
| Jason B. Harrison c/o GMO Trust 40 Rowes Wharf Boston, MA 02110 DOB: 01/29/1977 | Vice President and Clerk | Vice President since November 2006; Clerk since March 2006. | Legal Counsel, Grantham, Mayo, Van Otterloo & Co. LLC (since February 2006) and Attorney, Ropes & Gray LLP (September 2002 – February 2006). | ||||||||||||
| David L. Bohan c/o GMO Trust 40 Rowes Wharf Boston, MA 02110 DOB: 06/21/1964 | Vice President and Assistant Clerk | Vice President since March 2005; Assistant Clerk since March 2006. | Legal Counsel, Grantham, Mayo, Van Otterloo & Co. LLC (September 2003 – present); Attorney, Goodwin Procter LLP (September 1996 – September 2003). | ||||||||||||
| Gregory L. Pottle c/o GMO Trust 40 Rowes Wharf Boston, MA 02110 DOB: 07/09/1971 | Vice President and Assistant Clerk | Since November 2006. | Legal Counsel, Grantham, Mayo, Van Otterloo & Co. LLC. | ||||||||||||
| Anne K. Trinque c/o GMO Trust 40 Rowes Wharf Boston, MA 02110 DOB: 04/15/1978 | Vice President and Assistant Clerk | Since September 2007. | Legal Counsel, Grantham, Mayo, Van Otterloo & Co. LLC (since January 2007); Attorney, Goodwin Procter LLP (September 2003 – January 2007). | ||||||||||||
| Cheryl Wakeham c/o GMO Trust 40 Rowes Wharf Boston, MA 02110 DOB: 10/29/1958 | Anti-Money Laundering Officer | Since December 2004. | Manager, Client Service Administration, Grantham, Mayo, Van Otterloo & Co. LLC. | ||||||||||||
5 Officers are elected to hold such office until their successor is elected and qualified to carry out the duties and responsibilities of their office, or until he or she resigns or is removed from office.
25
GMO Special Situations Fund
(A Series of GMO Trust)
Annual Report
February 29, 2008
For a free copy of the Fund's proxy voting guidelines, shareholders may call 1-617-346-7646 (collect), visit our website at www.gmo.com, or visit the Securities and Exchange Commission's website at www.sec.gov. Information regarding how the Fund voted proxies relating to portfolio securities during the most recent 12-month period ended June 30 is available on our website at www.gmo.com, or on the Securities and Exchange Commission's website at www.sec.gov.
The Fund files its complete schedule of portfolio holdings with the Securities and Exchange Commission for the first and third quarter of each fiscal year on Form N-Q, which is available on the Commission's website at www.sec.gov. The Fund's Form N-Q may be reviewed and copied at the Commission's Public Reference Room in Washington, D.C. Information on the operation of the Public Reference Room may be obtained by calling 1-800-SEC-0330.
This report is prepared for the general information of shareholders. It is authorized for distribution to prospective investors only when preceded or accompanied by a prospectus for the GMO Trust.
GMO Special Situations Fund
(A Series of GMO Trust)
Portfolio Management
Day-to-day management of the Fund's portfolio is the responsibility of the Asset Allocation Team within the Quantitative Division at Grantham, Mayo, Van Otterloo & Co. LLC.
Management Discussion and Analysis of Fund Performance
Since its inception on July 31, 2007, the GMO Special Situations Fund returned +6.6% for the period ended February 29, 2008, compared with the +2.3% return for the Citigroup 3-Month Treasury Bill Index.
Asset allocation was responsible for the entirety of the outperformance.
The views expressed herein are exclusively those of Grantham, Mayo, Van Otterloo & Co. LLC Management as of the date of this report and are subject to change. GMO disclaims any responsibility to update such views. They are not meant as investment advice.
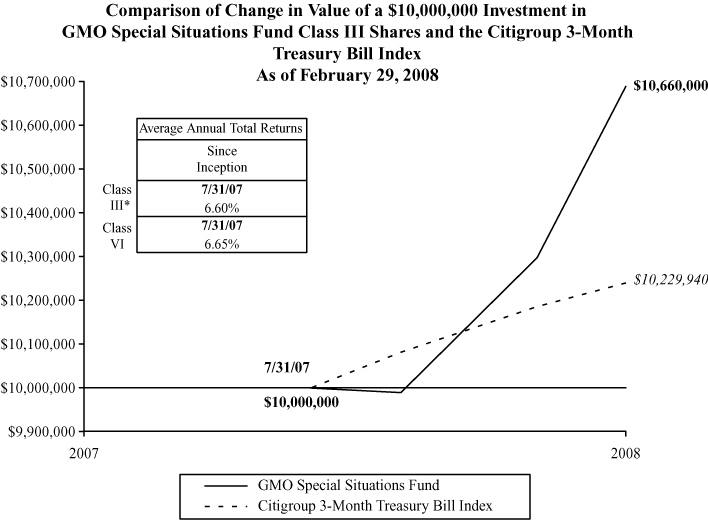
Performance data quoted represents past performance and is not indicative of future results. The investment return and principal value of an investment will fluctuate so that an investor's shares, when redeemed, may be worth more or less than their original cost. Current performance data may be lower or higher than the performance data provided herein. To obtain performance information to the most recent month-end please call 1-617-346-7646 (collect). Performance shown is net of all fees after reimbursement from the Manager. Returns would have been lower had certain expenses not been reimbursed during the periods shown and do not include the effect of taxes on distributions and redemptions. All information is unaudited. Performance for Class VI shares will vary due to different fees.
* Class III performance information represents Class VI performance from July 31, 2007 to August 13, 2007 and Class III performance thereafter.
GMO Special Situations Fund
(A Series of GMO Trust)
Investments Concentration Summary
February 29, 2008 (Unaudited)
| Asset Class Summary | % of Total Net Assets | ||||||
| Short-Term Investments | 88.1 | % | |||||
| Forward Currency Contracts | 1.1 | ||||||
| Other | 10.8 | ||||||
| 100.0 | % | ||||||
1
GMO Special Situations Fund
(A Series of GMO Trust)
Schedule of Investments
(showing percentage of total net assets)
February 29, 2008
| Shares / Par Value ($) | Description | Value ($) | |||||||||
| SHORT-TERM INVESTMENTS — 88.1% | |||||||||||
| Money Market Funds — 0.3% | |||||||||||
| 2,053,391 | State Street Institutional Liquid Reserves Fund-Institutional Class | 2,053,391 | |||||||||
| Other Short-Term Investments — 87.8% | |||||||||||
| 465,000,000 | U.S Treasury Bill, 3.11%, due 03/27/08 (a) | 463,937,088 | |||||||||
| 135,000,000 | U.S Treasury Bill, 1.76%, due 05/08/08 (a) | 134,554,500 | |||||||||
| Total Other Short-Term Investments | 598,491,588 | ||||||||||
| TOTAL SHORT-TERM INVESTMENTS (COST $600,472,829) | 600,544,979 | ||||||||||
| TOTAL INVESTMENTS — 88.1% (Cost $600,472,829) | 600,544,979 | ||||||||||
| Other Assets and Liabilities (net) — 11.9% | 80,789,763 | ||||||||||
| TOTAL NET ASSETS — 100.0% | $ | 681,334,742 | |||||||||
See accompanying notes to the financial statements.
2
GMO Special Situations Fund
(A Series of GMO Trust)
Schedule of Investments — (Continued)
February 29, 2008
A summary of outstanding financial instruments at February 29, 2008 is as follows:
Forward Currency Contracts
| Settlement Date | Deliver/ Receive | Units of Currency | Value | Net Unrealized Appreciation (Depreciation) | |||||||||||||||
| Buys | |||||||||||||||||||
| 5/23/08 | JPY | 12,407,014,233 | $ | 119,969,847 | $ | 3,839,534 | |||||||||||||
| 5/23/08 | JPY | 10,339,178,528 | 99,974,873 | 3,430,768 | |||||||||||||||
| 5/23/08 | JPY | 10,339,178,528 | 99,974,873 | 3,441,765 | |||||||||||||||
| 5/23/08 | JPY | 8,271,342,822 | 79,979,898 | 2,734,444 | |||||||||||||||
| $ | 399,899,491 | $ | 13,446,511 | ||||||||||||||||
| Sales | |||||||||||||||||||
| 5/23/08 | AUD | 112,241,486 | $ | 103,467,127 | $ | (1,380,128 | ) | ||||||||||||
| 5/23/08 | CAD | 37,756,166 | 38,300,653 | (959,533 | ) | ||||||||||||||
| 5/23/08 | GBP | 45,823,770 | 90,539,742 | (1,722,232 | ) | ||||||||||||||
| 5/23/08 | GBP | 45,823,770 | 90,539,742 | (1,698,220 | ) | ||||||||||||||
| 5/23/08 | NZD | 51,859,670 | 40,933,670 | 25,408 | |||||||||||||||
| $ | 363,780,934 | $ | (5,734,705 | ) | |||||||||||||||
Note to Schedule of Investments:
(a) Rate shown represents yield-to-maturity.
Currency Abbreviations:
AUD - Australian Dollar
CAD - Canadian Dollar
GBP - British Pound
JPY - Japanese Yen
NZD - New Zealand Dollar
See accompanying notes to the financial statements.
3
GMO Special Situations Fund
(A Series of GMO Trust)
Statement of Assets and Liabilities — February 29, 2008
| Assets: | |||||||
| Investments, at value (cost $600,472,829) (Note 2) | $ | 600,544,979 | |||||
| Cash | 101,222,292 | ||||||
| Interest receivable | 119,972 | ||||||
| Unrealized appreciation on open forward currency contracts (Note 2) | 13,471,919 | ||||||
| Receivable for expenses reimbursed by Manager (Note 3) | 22,417 | ||||||
| Total assets | 715,381,579 | ||||||
| Liabilities: | |||||||
| Payable for Fund shares repurchased | 27,922,601 | ||||||
| Payable to affiliate for (Note 3): | |||||||
| Management fee | 206,144 | ||||||
| Shareholder service fee | 37,225 | ||||||
| Trustees and Chief Compliance Officer of GMO Trust fees | 751 | ||||||
| Unrealized depreciation on open forward currency contracts (Note 2) | 5,760,113 | ||||||
| Accrued expenses | 120,003 | ||||||
| Total liabilities | 34,046,837 | ||||||
| Net assets | $ | 681,334,742 | |||||
| Net assets attributable to: | |||||||
| Class III shares | $ | 88,204,052 | |||||
| Class VI shares | $ | 593,130,690 | |||||
| Shares outstanding: | |||||||
| Class III | 4,137,904 | ||||||
| Class VI | 27,807,186 | ||||||
| Net asset value per share: | |||||||
| Class III | $ | 21.32 | |||||
| Class VI | $ | 21.33 | |||||
See accompanying notes to the financial statements.
4
GMO Special Situations Fund
(A Series of GMO Trust)
Statement of Operations — Period from July 31, 2007
(commencement of operations) through February 29, 2008
| Investment Income: | |||||||
| Dividends | $ | 77,313 | |||||
| Interest | 9,566,216 | ||||||
| Total investment income | 9,643,529 | ||||||
| Expenses: | |||||||
| Management fee (Note 3) | 1,092,706 | ||||||
| Shareholder service fee – Class III (Note 3) | 38,058 | ||||||
| Shareholder service fee – Class VI (Note 3) | 148,475 | ||||||
| Custodian, fund accounting agent and transfer agent fees | 36,878 | ||||||
| Audit and tax fees | 93,232 | ||||||
| Legal fees | 9,629 | ||||||
| Trustees fees and related expenses (Note 3) | 2,724 | ||||||
| Miscellaneous | 9,429 | ||||||
| Total expenses | 1,431,131 | ||||||
| Fees and expenses reimbursed by Manager (Note 3) | (145,170 | ) | |||||
| Net expenses | 1,285,961 | ||||||
| Net investment income (loss) | 8,357,568 | ||||||
| Realized and unrealized gain (loss): | |||||||
| Net realized gain (loss) on: | |||||||
| Investments | 11,527 | ||||||
| Foreign currency, forward contracts and foreign currency related transactions | 28,520,798 | ||||||
| Net realized gain (loss) | 28,532,325 | ||||||
| Change in net unrealized appreciation (depreciation) on: | |||||||
| Investments | 72,150 | ||||||
| Foreign currency, forward contracts and foreign currency related transactions | 7,711,806 | ||||||
| Net unrealized gain (loss) | 7,783,956 | ||||||
| Net realized and unrealized gain (loss) | 36,316,281 | ||||||
| Net increase (decrease) in net assets resulting from operations | $ | 44,673,849 | |||||
See accompanying notes to the financial statements.
5
GMO Special Situations Fund
(A Series of GMO Trust)
Statement of Changes in Net Assets
| Period from July 31, 2007 (commencement of operations) through February 29, 2008 | |||||||
| Increase (decrease) in net assets: | |||||||
| Operations: | |||||||
| Net investment income (loss) | $ | 8,357,568 | |||||
| Net realized gain (loss) | 28,532,325 | ||||||
| Change in net unrealized appreciation (depreciation) | 7,783,956 | ||||||
| Net increase (decrease) in net assets from operations | 44,673,849 | ||||||
| Net share transactions (Note 7): | |||||||
| Class III | 85,973,660 | ||||||
| Class VI | 550,687,233 | ||||||
| Increase (decrease) in net assets resulting from net share transactions | 636,660,893 | ||||||
| Total increase (decrease) in net assets | 681,334,742 | ||||||
| Net assets: | |||||||
| Beginning of period | — | ||||||
| End of period | $ | 681,334,742 | |||||
See accompanying notes to the financial statements.
6
GMO Special Situations Fund
(A Series of GMO Trust)
Financial Highlights
(For a Class III share outstanding throughout the period)
| Period from August 13, 2007 (commencement of operations) through February 29, 2008 | |||||||
| Net asset value, beginning of period | $ | 20.09 | |||||
| Income (loss) from investment operations: | |||||||
| Net investment income (loss)† | 0.31 | ||||||
| Net realized and unrealized gain (loss) | 0.92 | ||||||
| Total from investment operations | 1.23 | ||||||
| Net asset value, end of period | $ | 21.32 | |||||
| Total Return(a) | 6.12 | %** | |||||
| Ratios/Supplemental Data: | |||||||
| Net assets, end of period (000's) | $ | 88,204 | |||||
| Net expenses to average daily net assets | 0.53 | %* | |||||
| Net investment income to average daily net assets | 2.71 | %* | |||||
| Portfolio turnover rate | 0 | %††** | |||||
| Fees and expenses reimbursed by the Manager to average daily net assets: | 0.05 | %* | |||||
(a) The total return would have been lower had certain expenses not been reimbursed during the period shown.
† Calculated using average shares outstanding throughout the period.
†† Calculation represents portfolio turnover rate of the Fund for the period from July 31, 2007 (commencement of operations) through February 29, 2008.
* Annualized.
** Not annualized.
See accompanying notes to the financial statements.
7
GMO Special Situations Fund
(A Series of GMO Trust)
Financial Highlights
(For a Class VI share outstanding throughout the period)
| Period from July 31, 2007 (commencement of operations) through February 29, 2008 | |||||||
| Net asset value, beginning of period | $ | 20.00 | |||||
| Income (loss) from investment operations: | |||||||
| Net investment income (loss)† | 0.34 | ||||||
| Net realized and unrealized gain (loss) | 0.99 | ||||||
| Total from investment operations | 1.33 | ||||||
| Net asset value, end of period | $ | 21.33 | |||||
| Total Return(a) | 6.65 | %** | |||||
| Ratios/Supplemental Data: | |||||||
| Net assets, end of period (000's) | $ | 593,131 | |||||
| Net expenses to average daily net assets | 0.43 | %* | |||||
| Net investment income to average daily net assets | 2.84 | %* | |||||
| Portfolio turnover rate | 0 | %††** | |||||
| Fees and expenses reimbursed by the Manager to average daily net assets: | 0.05 | %* | |||||
(a) The total return would have been lower had certain expenses not been reimbursed during the period shown.
assumes the effect of reinvested dividends.
† Calculated using average shares outstanding throughout the period.
†† Calculation represents portfolio turnover rate of the Fund for the period from July 31, 2007 (commencement of operations) through February 29, 2008.
* Annualized.
** Not annualized.
See accompanying notes to the financial statements.
8
GMO Special Situations Fund
(A Series of GMO Trust)
Notes to Financial Statements
February 29, 2008 (Unaudited)
1. Organization
GMO Special Situations Fund (the "Fund"), which commenced operations on July 31, 2007, is a series of GMO Trust (the "Trust"). The Fund is registered under the Investment Company Act of 1940, as amended, as an open-end, non-diversified management investment company. The Fund is advised and managed by Grantham, Mayo, Van Otterloo & Co. LLC (the "Manager" or "GMO"). The Trust was established as a Massachusetts business trust under the laws of the Commonwealth of Massachusetts on June 24, 1985. The Declaration of Trust permits the Trustees of the Trust ("Trustees") to create an unlimited number of series of shares ("Funds") and to subdivide Funds into classes.
The Fund's investment objectives are capital appreciation and capital preservation. The Fund seeks to achieve its investment objectives by implementing investment strategies that are intended to complement long-only investments in global equities and fixed income instruments. The Fund may have long or short exposure to foreign and U.S. equity securities (including both growth and value style equities and equities of any market capitalization), foreign and U.S. fixed income securities (including fixed income securities of any credit quality and having any maturity or duration), currencies, and, from time to time, other alternative asset classes (e.g., instruments that seek exposure to or hedge risks of market volatility). The Fund is not restricted in its exposure to any particular asset class, and at times may be substantially exposed (long or short) to a single asset class (e.g., equity securities or fixed income securities). In addition, the Fund is not restricted in its exposure to any particular market. The Fund may have substantial exposure (long or short) to a particular country or type of country (e.g., emerging countries). The Fund could be subject to material losses from a single investment. The Fund does not seek to control risk relative to a particular securities market index or benchmark. In addition, the Fund does not seek to outperform a particular securities market index or blend of market indices.
For the period July 31, 2007 through February 29, 2008, the Fund's Class VI shares were operational and for the period August 13, 2007 through February 29, 2008, the Fund's Class III shares were operational. Each class of shares bears a different level of shareholder service fees.
Shares of the Fund are not publicly offered and are principally available only to other funds of the Trust and certain accredited investors.
The Fund currently limits subscriptions due to capacity considerations.
2. Significant accounting policies
The following is a summary of significant accounting policies which are in conformity with accounting principles generally accepted in the United States of America ("U.S. GAAP") and which are consistently followed by the Fund in the preparation of its financial statements. The preparation of financial statements in accordance with U.S. GAAP requires management to make estimates and assumptions that affect the reported amounts and disclosures in the financial statements. Actual results could differ from those estimates. The accounting records of the Fund are maintained in U.S. dollars.
9
GMO Special Situations Fund
(A Series of GMO Trust)
Notes to Financial Statements — (Continued)
February 29, 2008 (Unaudited)
Portfolio valuation
Securities listed on a securities exchange for which market quotations are readily available are valued at the last sale price or official closing price on each business day, or if there is no such reported sale or official closing price, at the most recent quoted bid price. Unlisted securities for which market quotations are readily available are generally valued at the most recent quoted bid price. Short-term investments with a remaining maturity of sixty days or less are generally valued at amortized cost, which approximates fair value. Shares of investment funds are valued at their net asset value. Securities for which quotations are not readily available or whose values the Manager has determined to be unreliable are valued at fair value as determined in good faith by the Trustees or other persons acting at their direction pursuant to procedures approved by the Trustees. By its nature, a fair value price is a good faith est imate of the value of a security at a given point in time and may not reflect the value that would be realized if the security was sold and the differences could be material.
Foreign currency translation
The market values of foreign securities, currency holdings and other assets and liabilities are translated to U.S. dollars based on the current exchange rates each business day. Income and expenses denominated in foreign currencies are translated at current exchange rates when accrued or incurred. The Fund does not isolate realized and unrealized gains and losses attributable to changes in exchange rates from gains and losses that arise from changes in the market value of investments. Such fluctuations are included with net realized and unrealized gain or loss on investments. Net realized gains and losses on foreign currency transactions represent gains and losses on disposition of currencies and forward currency contracts, currency gains and losses realized between the trade and settlement dates on securities transactions, and the difference between the amount of investment income and foreign withholding taxes recorded on the F und's accounting records and the U.S. dollar equivalent amounts actually received or paid.
Forward currency contracts
The Fund may enter into forward currency contracts including forward cross currency contracts. A forward currency contract is an agreement between two parties to buy and sell a currency at a set price on a future date. The market value of a forward currency contract fluctuates with changes in forward currency exchange rates. Forward currency contracts are marked to market daily using rates supplied by a quotation service and changes in value are recorded by the Fund as an unrealized gain or loss. Realized gains or losses equal to the difference between the value of the contract at the time it was opened and the value at the time it was closed are recorded upon delivery or receipt of the currency or, if a forward currency contract is offset by entering into another forward currency contract with the same broker, upon settlement of the net gain or loss. These contracts may involve market risk in excess of the unrealized gain or lo ss reflected in the Fund's Statement of Assets and Liabilities. In addition, the Fund could be exposed to risk if the counterparties are unable to meet the terms of the contracts or if there are movements in currency values that are unfavorable to the Fund. Forward currency contracts outstanding at the end of the period are listed in the Fund's Schedule of Investments.
10
GMO Special Situations Fund
(A Series of GMO Trust)
Notes to Financial Statements — (Continued)
February 29, 2008 (Unaudited)
Futures contracts
The Fund may purchase and sell futures contracts. Upon entering into a futures contract, the Fund is required to deposit with the futures clearing broker an amount of cash, U.S. government and agency obligations, or other liquid assets in accordance with the initial margin requirements of the broker or exchange. In addition, the Fund maintains cash or securities in an amount that at least equals the net amount payable in the event the Fund must deliver the full amount of the contracts. Futures contracts are marked to market daily and an appropriate payable or receivable for the change in value ("variation margin") is recorded by the Fund. The payable or receivable is liquidated on the following business day. Gains or losses are recognized but not considered realized until the contracts expire or are closed. Futures contracts involve, to varying degrees, risk of loss in excess of the variation margin disclosed in the Statement of Assets and Liabilities. Under certain circumstances, futures exchanges may establish daily limits on the amount that the price of a futures contract can vary from the previous day's settlement price, thereby effectively preventing liquidation of unfavorable positions. Losses may arise from changes in the value of the underlying instrument if the Fund is unable to liquidate a futures position due to an illiquid secondary market for the contracts or the imposition of price limits, or if counterparties do not perform under the contract terms. Futures contracts are generally valued at the settlement price established each day by the board of trade or exchange on which they are traded. There were no futures contracts outstanding at the end of the period.
Options
The Fund may write call and put options. Writing options increases the Fund's exposure to the underlying instrument by, in the case of a call option, obligating the Fund to sell the underlying instrument at a set price to the option-holder and, in the case of a put option, obligating the Fund to purchase the underlying instrument at a set price from the option-holder. When the Fund writes a call or put option, an amount equal to the premium received is recorded as a liability and subsequently marked to market to reflect the current value of the option written. Premiums received from writing options which expire are treated as realized gains. Premiums received from writing options which are exercised or closed are added to the proceeds or offset against the amounts paid on the underlying future, security or currency transaction to determine the realized gain or loss. The Fund as a writer of an option has no control over whether t he underlying future, security or currency may be sold (call) or purchased (put) and as a result bears the market risk of an unfavorable change in the price of the future, security or currency underlying the written option. In the event that the Fund writes uncovered call options (i.e. options for investments that the Fund does not own), it bears the risk of incurring substantial losses if the price of the underlying instrument increases during the term of the option. There is the risk the Fund may not be able to enter into a closing transaction because of an illiquid market. There were no open written option contracts during the period.
The Fund may also purchase put and call options. Purchasing options alters the Fund's exposure to the underlying instrument by, in the case of a call option, entitling the Fund to purchase the underlying instrument at a set price from the writer of the option and, in the case of a put option, entitling the Fund to sell the underlying instrument at a set price to the writer of the option. The Fund pays a premium as a cost
11
GMO Special Situations Fund
(A Series of GMO Trust)
Notes to Financial Statements — (Continued)
February 29, 2008 (Unaudited)
for a purchased option disclosed in the Schedule of Investments which is subsequently marked to market to reflect the current value of the option. Premiums paid for purchasing options which expire are treated as realized losses. Premiums paid for purchasing options which are exercised or closed are added to the amounts paid or offset against the proceeds on the closing transaction to determine the realized gain or loss. The risk associated with purchasing put and call options is limited to the premium paid. There were no purchased option contracts outstanding at the end of the period.
Exchange traded options are valued at the last sale price, or if no sale is reported, the last bid price for purchased options and the last ask price for written options. Options traded over-the-counter are valued using prices supplied by a primary pricing source chosen by the Manager.
Loan agreements
The Fund may invest in direct debt instruments which are interests in amounts owed by a corporate, governmental, or other borrower to lenders or lending syndicates. The Fund's investments in loans may be in the form of participations in loans or assignments of all or a portion of loans from third parties. A loan is often administered by a bank or other financial institution (the "lender") that acts as agent for all holders. The agent administers the terms of the loan, as specified in the loan agreement. When investing in a loan participation, the Fund has the right to receive payments of principal, interest and any fees to which it is entitled only from the lender selling the loan agreement and only upon receipt by the lender of payments from the borrower. The Fund generally has no right to enforce compliance with the terms of the loan agreement with the borrower. As a result, the Fund may be subject to the credit risk of both t he borrower and the lender that is selling the loan agreement. When the Fund purchases assignments from lenders it acquires direct rights against the borrower on the loan. There were no loan agreements outstanding at the end of the period.
Indexed securities
The Fund may invest in indexed securities where the redemption values and/or coupons are linked to the prices of a specific instrument or financial statistic. The Fund uses indexed securities to increase or decrease its exposure to different underlying instruments and to gain exposure to markets in which it may be difficult to invest through conventional securities. Indexed securities may be more volatile than their underlying instruments, but any loss is limited to the amount of the original investment. There were no indexed securities held by the Fund at the end of the period.
Swap agreements
The Fund may enter into swap agreements. A swap is an agreement to exchange the return generated by one instrument for the return generated by another instrument. Interest rate swap agreements involve the exchange by one party with another party of their respective commitments to pay or receive interest, e.g., an exchange of floating rate payments for fixed rate payments with respect to a notional amount of principal. Total return swap agreements involve a commitment by one party in the agreement to pay interest in exchange for a market-linked return, both based on notional amounts. To the extent the total
12
GMO Special Situations Fund
(A Series of GMO Trust)
Notes to Financial Statements — (Continued)
February 29, 2008 (Unaudited)
return of the security or index underlying the transaction exceeds or falls short of the offsetting interest rate obligation, the party will receive a payment from or make a payment to the counterparty, respectively. Forward spread lock swap agreements involve commitments to pay or receive a settlement amount calculated as the difference between the swap spread and a fixed spread, multiplied by the notional amount times the duration of the swap rate. The swap spread is the difference between the benchmark swap rate (market rate) and the specific treasury rate. Variance swap agreements involve commitments to pay or receive a settlement amount calculated as the difference between the annualized realized variance of returns on the underlying price and a fixed quantity, also known as the variance strike, over a period of time. In connection with these agreements, cash or securities may be set aside as collateral by the Fund's custod ian or brokers in accordance with the terms of the swap agreement. The Fund earns or pays interest on cash set aside as collateral.
Swaps are marked to market daily using models that incorporate quotations from market makers and the change in value, if any, is recorded as unrealized gain or loss in the Statement of Operations. Payments received or made on swap contracts are recorded as realized gain or loss in the Statement of Operations. Gains or losses are realized upon early termination of the swap agreements. These financial instruments are not actively traded on financial markets. The values assigned to these instruments are based upon the best available information and because of the uncertainty of the valuation, these values may differ significantly from the values that would have been realized had a ready market for these instruments existed, and the differences could be material. Entering into these agreements involves, to varying degrees, elements of credit, legal, market and documentation risk in excess of the amounts recognized in the Statement o f Assets and Liabilities. Such risks involve the possibility that there will be no liquid market for these agreements, that the counterparties to the agreements may default on their obligations to perform or disagree as to the meaning of contractual terms in the agreements, or that there may be unfavorable changes in interest rates or the price of the index or security underlying these transactions. There were no swap agreements outstanding at the end of the period.
Repurchase agreements
The Fund may enter into repurchase agreements with banks and broker-dealers whereby the Fund acquires a security for cash and obtains a simultaneous commitment from the seller to repurchase the security at an agreed upon price and date. The Fund, through its custodian, takes possession of securities collateralizing the repurchase agreement. The collateral is marked to market daily to ensure that the market value of the underlying assets remains sufficient to protect the Fund in the event of default by the seller. Collateral for certain tri-party repurchase agreements is held at the counterparty's custodian in a segregated account for the benefit of the Fund and the counterparty. In connection with transactions in repurchase agreements, if the seller defaults or enters into insolvency proceedings and the value of the collateral declines, recovery of cash by the Fund may be delayed or limited. There were no repurchase agreements o utstanding at the end of the period.
13
GMO Special Situations Fund
(A Series of GMO Trust)
Notes to Financial Statements — (Continued)
February 29, 2008 (Unaudited)
Securities lending
The Fund may lend its securities to certain qualified broker-dealers. The loans are collateralized with cash or liquid securities with a market value at least equal to the market value of the securities on loan. As with other extensions of credit, the Fund may bear the risk of loss with respect to the investment of the collateral, the risk of delay in and/or inability to exercise its rights with respect to the collateral, and the risk of delay in recovery or loss of rights in the loaned securities should the borrower of the securities fail financially. If a loan is collateralized by U.S. government securities, the Fund receives a fee from the borrower. If a loan is collateralized by cash, the Fund typically invests the cash collateral for its own account in interest-bearing, short-term securities and pays a fee to the borrower that normally represents a portion of the Fund's earnings on the collateral. For the period ended Febru ary 29, 2008, the Fund did not participate in securities lending.
Taxes
The Fund elected to be taxed as a partnership for federal income tax purposes. As a partnership, the Fund will not be subject to federal and state income tax. Instead, each shareholder is responsible for the tax liability or benefit related to his/her allocable share of taxable income or loss. Accordingly, no provision (benefit) for federal and state income taxes is reflected in the accompanying financial statements.
As of February 29, 2008, the approximate cost for U.S. federal income tax purposes and gross and net unrealized appreciation and depreciation in value of investments were as follows:
| Aggregate Cost | Gross Unrealized Appreciation | Gross Unrealized (Depreciation) | Net Unrealized Appreciation (Depreciation) | ||||||||||||
| $ | 600,472,829 | $ | 72,150 | $ | — | $ | 72,150 | ||||||||
Distributions
The Fund does not intend to make any distributions to its shareholders but may do so at the sole discretion of the Trustees.
Security transactions and related investment income
Security transactions are accounted for on trade date. Dividend income, net of applicable foreign withholding taxes, if any, is recorded on the ex-dividend date, or when the Fund is informed of the ex-dividend date, if later. Interest income is recorded on the accrual basis and is adjusted for the amortization of premiums and accretion of discounts. Interest income on inflation indexed securities, if any, is accrued daily based upon an inflation adjusted principal. Additionally, any increase or decrease in the principal or face amount of the securities adjusted for inflation is recorded as interest income or loss. Income is not recognized on securities for which collection is not expected. Non-cash dividends, if any, are recorded at the fair market value of the securities received. In determining the net gain or loss on securities sold, the cost of securities is determined on the identified cost basis.
14
GMO Special Situations Fund
(A Series of GMO Trust)
Notes to Financial Statements — (Continued)
February 29, 2008 (Unaudited)
Expenses
The majority of expenses of the Trust are directly identifiable to an individual fund. Expenses which are not readily identifiable to a specific fund are allocated taking into consideration, among other things, the nature and type of expense and the relative size of the funds. Investment income, common expenses and realized and unrealized gains and losses are allocated pro rata among the classes of shares of the Fund based on the relative net assets of each class. Shareholder service fees, which are directly attributable to a class of shares, are charged to that class's operations.
State Street Bank and Trust Company ("State Street") serves as custodian, fund accounting agent and transfer agent of the Fund. State Street's fee may be reduced by credits that are an earnings allowance calculated on the average daily cash balances the Fund maintains with State Street. Credit balances used to reduce the fee paid to State Street, if any, are reported as a reduction of expenses in the Statement of Operations.
Investment risks
There are certain additional risks involved in investing in foreign securities that are not inherent in investments in U.S. securities. These risks may involve adverse political and economic developments, including the possible imposition of capital controls or other foreign governmental laws or restrictions. In addition, the securities of some foreign companies and securities markets are less liquid and at times may be more volatile than securities of comparable U.S. companies and U.S. securities markets. The risks described above apply to an even greater extent to investments in emerging markets. The securities markets of emerging countries are generally smaller, less developed, less liquid, and more volatile than the securities markets of the U.S. and developed foreign markets.
Recently issued accounting pronouncements
In June 2006, the Financial Accounting Standards Board ("FASB") issued FASB Interpretation No. 48, Accounting for Uncertainty in Income Taxes – an Interpretation of FASB Statement No. 109 ("FIN 48"). FIN 48 clarifies the accounting for uncertainty in income taxes recognized in accordance with FASB Statement No. 109, Accounting for Income Taxes. FIN 48 prescribes a recognition threshold and measurement attribute for a tax position taken or expected to be taken in the tax return that could impact the Fund's financial statements. It also provides guidance in relation to the Fund's financial statements on classification of tax benefits or liabilities, interest and penalties, accounting in interim periods, disclosure, and transition. FIN 48 is effective for fiscal years beginning after December 15, 2006 for registered investment companies. Management has evaluated the effects of applying the various provisions of FIN 48 and has determined that the adoption of FIN 48 does not have a material effect on the Fund's financial statements. Management will continue to monitor the rules and guidance pertaining to FIN 48 and will take action if appropriate.
In September 2006, the FASB issued Statement of Financial Accounting Standards No. 157 ("FAS 157"), "Fair Value Measurements." FAS 157 defines fair value, establishes a framework for measuring fair value
15
GMO Special Situations Fund
(A Series of GMO Trust)
Notes to Financial Statements — (Continued)
February 29, 2008 (Unaudited)
in accordance with generally accepted accounting principles and expands disclosure about fair value measurements. FAS 157 is effective for fiscal years beginning after November 15, 2007. Management is currently evaluating the impact the adoption of FAS 157 will have on the Fund's financial statement disclosures.
3. Fees and other transactions with affiliates
GMO earns a management fee paid monthly at the annual rate of 0.37% of average daily net assets. The Fund has adopted a Shareholder Service Plan under which the Fund pays GMO a shareholder service fee for client and shareholder service, reporting, and other support. Pursuant to the Shareholder Service Plan, the shareholder service fee is calculated based on average daily net assets at the annual rate of 0.15% for Class III shares and 0.055% for Class VI shares.
The Manager has contractually agreed to reimburse the Fund for Fund expenses through at least June 30, 2008 to the extent the Fund's total annual operating expenses (excluding shareholder service fees, expenses indirectly incurred by investment in other Funds of the Trust, fees and expenses of the independent Trustees of the Trust, fees and expenses for legal services not approved by the Manager for the Trust, compensation and expenses of the Trust's Chief Compliance Officer ("CCO") (excluding any employee benefits), brokerage commissions, securities lending fees and expenses, interest expense, transfer taxes, and other investment-related costs (including expenses associated with investments in any company that is an investment company or would be an investment company under the 1940 Act, but for the exceptions to the definition of investment company provided in Section 3(c)(1) and 3(c)(7) of the 1940 Act), hedging transaction fees, extraordinary, non-recurring and certain other unusual expenses (including taxes)) exceed 0.37% of the Fund's average daily net assets.
The Fund's portion of the fees paid by the Trust to the independent Trustees and CCO during the period ended February 29, 2008 was $2,048 and $1,997, respectively. The compensation and expenses of the CCO are included in miscellaneous expenses in the Statement of Operations. No remuneration was paid by the Fund to any other officer of the Trust.
4. Purchases and sales of securities
Cost of purchases and proceeds from sales of securities, excluding short-term investments, for the period ended February 29, 2008 aggregated $0 and $0, respectively.
5. Guarantees
In the normal course of business the Fund enters into contracts with third-party service providers that contain a variety of representations and warranties and which provide general indemnifications. The Fund's maximum exposure under these arrangements is unknown, as this would involve future claims that may be made against the Fund that have not yet occurred. Based on experience, management is of the
16
GMO Special Situations Fund
(A Series of GMO Trust)
Notes to Financial Statements — (Continued)
February 29, 2008 (Unaudited)
view that the risk of loss in connection with these potential indemnification obligations is remote; however, there can be no assurance that material liabilities related to such obligations will not arise in the future that could adversely impact the Fund.
6. Principal shareholders and related parties
As of February 29, 2008, 78.48% of the outstanding shares of the Fund were held by three shareholders, each holding in excess of 10% of the Fund's outstanding shares. No other shareholder owned in excess of 10% of the outstanding shares of the Fund. Two of the shareholders are other funds of the Trust. Investment activities of these shareholders may have a material effect on the Fund.
As of February 29, 2008, there were no shares held by related parties, and all of the Fund's shares were held by accounts for which the Manager has investment discretion.
7. Share transactions
The Declaration of Trust permits the Trustees to issue an unlimited number of shares of beneficial interest (without par value). Transactions in Fund shares were as follows:
| Period from August 13, 2007, (commencement of operations) through February 29, 2008 | |||||||||||
| Class III: | Shares | Amount | |||||||||
| Shares sold | 4,137,904 | $ | 85,973,660 | ||||||||
| Shares issued to shareholders in reinvestment of distributions | — | — | |||||||||
| Shares repurchased | — | — | |||||||||
| Net increase (decrease) | 4,137,904 | $ | 85,973,660 | ||||||||
| Period from July 31, 2007, (commencement of operations) through February 29, 2008 | |||||||||||
| Class VI: | Shares | Amount | |||||||||
| Shares sold | 30,240,773 | $ | 602,709,982 | ||||||||
| Shares issued to shareholders in reinvestment of distributions | — | — | |||||||||
| Shares repurchased | (2,433,587 | ) | (52,022,749 | ) | |||||||
| Net increase (decrease) | 27,807,186 | $ | 550,687,233 | ||||||||
17
Report of Independent Registered Public Accounting Firm
To the Trustees of GMO Trust and the Shareholders of
GMO Special Situations Fund
In our opinion, the accompanying statement of assets and liabilities, including the schedule of investments, and the related statements of operations and of changes in net assets and the financial highlights present fairly, in all material respects, the financial position of GMO Special Situations Fund (the "Fund") at February 29, 2008, the results of its operations for the period then ended, the changes in its net assets for the period then ended and the financial highlights for the periods indicated, in conformity with accounting principles generally accepted in the United States of America. These financial statements and financial highlights (hereafter referred to as "financial statements") are the responsibility of the Fund's management; our responsibility is to express an opinion on these financial statements based on our audit. We conducted our audit of these financial statements in accordance with the standards of the Pub lic Company Accounting Oversight Board (United States). Those standards require that we plan and perform the audit to obtain reasonable assurance about whether the financial statements are free of material misstatement. An audit includes examining, on a test basis, evidence supporting the amounts and disclosures in the financial statements, assessing the accounting principles used and significant estimates made by management, and evaluating the overall financial statement presentation. We believe that our audit, which included confirmation of securities at February 29, 2008 by correspondence with the custodian and brokers, provide a reasonable basis for our opinion.
PricewaterhouseCoopers LLP
Boston, Massachusetts
April 29, 2008
18
GMO Special Situations Fund
(A Series of GMO Trust)
Fund Expenses
February 29, 2008 (Unaudited)
Expense Examples: The following information is in relation to expenses for the six month period ended February 29, 2008.
As a shareholder of the Fund, you may incur two types of costs: (1) transaction costs, and (2) ongoing costs, including management fees, shareholder service fees, and other Fund expenses. This example is intended to help you understand your ongoing costs (in dollars) of investing in the Fund and to compare these costs with the ongoing costs of investing in other mutual funds.
These examples are based on an investment of $1,000 invested at the beginning of the period and held for the entire period, September 1, 2007 through February 29, 2008.
Actual Expenses
The first line of the table below for each class provides information about actual account values and actual expenses. You may use the information in this line, together with the amount you invested, to estimate the expenses that you paid over the period. Simply divide your account value by $1,000 (for example, a $10,000,000 account value divided by $1,000 = 10,000), then multiply the result by the number in the first line under the heading entitled "Net Expense Incurred" to estimate the expenses you paid on your account during this period.
Hypothetical Example for Comparison Purposes
The second line of the table below for each class provides information about hypothetical account values and hypothetical expenses based on the Fund's actual expense ratio and an assumed rate of return of 5% per year before expenses, which is not the Fund's actual return. The hypothetical account values and expenses may not be used to estimate the actual ending account balance or expenses you paid for the period. You may use this information to compare the ongoing costs of investing in the Fund with other funds. To do so, compare this 5% hypothetical example with the 5% hypothetical examples that appear in the shareholder reports of other funds.
Please note that the expenses shown in the table are meant to highlight your ongoing costs only and do not reflect any transactional costs, such as purchase premiums and redemption fees. Therefore, the second line of the table is useful in comparing ongoing costs only, and will not help you determine the relative total costs of owning different funds. In addition, if these transactional costs were included, your costs would have been higher.
| Annualized Net Expense Ratio | Beginning Account Value | Ending Account Value | Net Expense Incurred* | ||||||||||||||||
| Class III | |||||||||||||||||||
| 1) Actual | 0.53 | % | $ | 1,000.00 | $ | 1,035.00 | $ | 2.68 | |||||||||||
| 2) Hypothetical | 0.53 | % | $ | 1,000.00 | $ | 1,022.23 | $ | 2.66 | |||||||||||
| Class VI | |||||||||||||||||||
| 1) Actual | 0.43 | % | $ | 1,000.00 | $ | 1,035.40 | $ | 2.18 | |||||||||||
| 2) Hypothetical | 0.43 | % | $ | 1,000.00 | $ | 1,022.73 | $ | 2.16 | |||||||||||
* Expenses are calculated using the annualized expense ratio for the six months ended February 29, 2008, multiplied by the average account value over the period, multiplied by 182 days in the period, divided by 366 days in the year.
19
Trustees and Officers (Unaudited)
The following tables list the Trust's Trustees and Officers as of the date of this report; their address and date of birth ("DOB"); their position with the Trust; the length of time holding that position with the Trust; their principal occupation(s) during the past five years; the number of portfolios in the fund complex they oversee; and other directorships they hold in companies subject to registration or reporting requirements of the Securities Exchange Act of 1934 (generally called "public companies") or in registered investment companies. The Trust's Statement of Additional Information ("SAI") includes additional information about the Trust's trustees, including changes subsequent to the date of the report. The SAI is available, without charge, upon request by writing GMO, c/o GMO Trust, 40 Rowes Wharf, Boston, MA 02110.
Independent Trustees:
| Name, Address, and DOB | Position(s) Held with Trust | Term of Office1 and Length of Time Served | Principal Occupation(s) During Past Five Years | Number of Portfolios in Fund Complex Overseen by Trustee | Other Directorships Held by Trustee | ||||||||||||||||||
| Donald W. Glazer, Esq. c/o GMO Trust 40 Rowes Wharf Boston, MA 02110 DOB: 07/26/1944 | Chairman of the Board of Trustees | Chairman of the Board of Trustees since March 2005; Lead Independent Trustee (September 2004 – March 2005); Trustee since December 2000. | Consultant – Law and Business2; Vice Chair (since 2002) and Secretary, Provant, Inc. (provider of personnel performance improvement services and training products); Author of Legal Treatises. | 47 | None. | ||||||||||||||||||
1 Each Trustee is elected to serve during the continued lifetime of the Trust until he/she dies, resigns or is removed, or if sooner, until the next meeting of Shareholders called for the purpose of electing Trustees and until the election and qualification of his/her successor.
2 As part of Mr. Glazer's work as a consultant, he provides part-time consulting services to Goodwin Procter LLP ("Goodwin"). Goodwin has provided legal services to Renewable Resources, LLC, an affiliate of GMO; GMO, in connection with its relationship with Renewable Resources; and funds managed by Renewable Resources. Mr. Glazer has represented that he has no financial interest in, and is not involved in the provision of, such legal services. In the calendar years ended December 31, 2006 and December 31, 2007, these entities paid $825,738 and $291,721 respectively, in legal fees and disbursements to Goodwin.
20
Independent Trustees — (Continued)
| Name, Address, and DOB | Position(s) Held with Trust | Term of Office1 and Length of Time Served | Principal Occupation(s) During Past Five Years | Number of Portfolios in Fund Complex Overseen by Trustee | Other Directorships Held by Trustee | ||||||||||||||||||
| Jay O. Light c/o GMO Trust 40 Rowes Wharf Boston, MA 02110 DOB: 10/03/1941 | Trustee | Since May 1996. | Dean (since April 2006), Acting Dean (August 2005 – April 2006), Senior Associate Dean (1998 – 2005), and Professor of Business Administration, Harvard Business School. | 47 | Director of Harvard Management Company, Inc.3 and Verde, Inc.; Director of Partners HealthCare System, Inc. and Chair of its Investment Committee.4 | ||||||||||||||||||
| W. Nicholas Thorndike c/o GMO Trust 40 Rowes Wharf Boston, MA 02110 DOB: 03/28/1933 | Trustee | Since March 2005. | Director or trustee of various corporations and charitable organizations, including Courier Corporation (a book publisher and manufacturer) (July 1989 – present); Putnam Funds (December 1992 – June 2004); and Providence Journal (a newspaper publisher) (December 1986 – December 2003). | 47 | Director of Courier Corporation (a book publisher and manufacturer); Member of the Investment Committee of Partners HealthCare System, Inc.4 | ||||||||||||||||||
1 Each Trustee is elected to serve during the continued lifetime of the Trust until he/she dies, resigns or is removed, or if sooner, until the next meeting of Shareholders called for the purpose of electing Trustees and until the election and qualification of his/her successor.
3 Harvard Management Company, Inc. is a client of the Manager.
4 Partners HealthCare System, Inc. is a client of the Manager.
21
Principal Officers:
| Name, Address, and DOB | Position(s) Held with Trust | Term of Office5 and Length of Time Served | Principal Occupation(s) During Past Five Years | ||||||||||||
| Scott Eston c/o GMO Trust 40 Rowes Wharf Boston, MA 02110 DOB: 01/20/1956 | President and Chief Executive Officer | President and Chief Executive Officer since October 2002; Chief Financial Officer, November 2006 – February 2007. | Chief Financial Officer, Chief Operating Officer and Member, Grantham, Mayo, Van Otterloo & Co. LLC. | ||||||||||||
| Sheppard N. Burnett c/o GMO Trust 40 Rowes Wharf Boston, MA 02110 DOB: 10/24/1968 | Treasurer and Chief Financial Officer | Chief Financial Officer since March 2007; Treasurer since November 2006; Assistant Treasurer, September 2004 – November 2006. | Fund Administration Staff, Grantham, Mayo, Van Otterloo & Co. LLC (June 2004 – present); Vice President, Director of Tax, Columbia Management Group (2002 – 2004). | ||||||||||||
| Brent C. Arvidson c/o GMO Trust 40 Rowes Wharf Boston, MA 02110 DOB: 06/26/1969 | Assistant Treasurer | Since August 1998. | Senior Fund Administrator, Grantham, Mayo, Van Otterloo & Co. LLC. | ||||||||||||
| John L. Nasrah c/o GMO Trust 40 Rowes Wharf Boston, MA 02110 DOB: 05/27/1977 | Assistant Treasurer | Since March 2007. | Fund Administrator, Grantham, Mayo, Van Otterloo & Co. LLC (September 2004 – present); Tax Analyst, Bain & Company, Inc (June 2003 – September 2004); Senior Tax Associate, PricewaterhouseCoopers LLP (2001 – 2003). | ||||||||||||
| Mahmoodur Rahman c/o GMO Trust 40 Rowes Wharf Boston, MA 02110 DOB: 11/30/1967 | Assistant Treasurer | Since September 2007. | Fund Administrator, Grantham, Mayo, Van Otterloo & Co. (April 2007 – present); Vice President and Senior Tax Manager, Massachusetts Financial Services Company (January 2000 – April 2007). | ||||||||||||
5 Officers are elected to hold such office until their successor is elected and qualified to carry out the duties and responsibilities of their office, or until he or she resigns or is removed from office.
22
Principal Officers — (Continued)
| Name, Address, and DOB | Position(s) Held with Trust | Term of Office5 and Length of Time Served | Principal Occupation(s) During Past Five Years | ||||||||||||
| Michael E. Gillespie c/o GMO Trust 40 Rowes Wharf Boston, MA 02110 DOB: 02/18/1958 | Chief Compliance Officer | Since March 2005. | Vice President of Compliance (June 2004 – February 2005) and Director of Domestic Compliance (March 2002 – June 2004), Fidelity Investments; Vice President and Senior Counsel, State Street Bank and Trust Company (May 1998 – March 2002). | ||||||||||||
| Jason B. Harrison c/o GMO Trust 40 Rowes Wharf Boston, MA 02110 DOB: 01/29/1977 | Vice President and Clerk | Vice President since November 2006; Clerk since March 2006. | Legal Counsel, Grantham, Mayo, Van Otterloo & Co. LLC (since February 2006) and Attorney, Ropes & Gray LLP (September 2002 – February 2006). | ||||||||||||
| David L. Bohan c/o GMO Trust 40 Rowes Wharf Boston, MA 02110 DOB: 06/21/1964 | Vice President and Assistant Clerk | Vice President since March 2005; Assistant Clerk since March 2006. | Legal Counsel, Grantham, Mayo, Van Otterloo & Co. LLC (September 2003 – present); Attorney, Goodwin Procter LLP (September 1996 – September 2003). | ||||||||||||
| Gregory L. Pottle c/o GMO Trust 40 Rowes Wharf Boston, MA 02110 DOB: 07/09/1971 | Vice President and Assistant Clerk | Since November 2006. | Legal Counsel, Grantham, Mayo, Van Otterloo & Co. LLC. | ||||||||||||
| Anne K. Trinque c/o GMO Trust 40 Rowes Wharf Boston, MA 02110 DOB: 04/15/1978 | Vice President and Assistant Clerk | Since September 2007. | Legal Counsel, Grantham, Mayo, Van Otterloo & Co. LLC (since January 2007); Attorney, Goodwin Procter LLP (September 2003 – January 2007). | ||||||||||||
| Cheryl Wakeham c/o GMO Trust 40 Rowes Wharf Boston, MA 02110 DOB: 10/29/1958 | Anti-Money Laundering Officer | Since December 2004. | Manager, Client Service Administration, Grantham, Mayo, Van Otterloo & Co. LLC. | ||||||||||||
5 Officers are elected to hold such office until their successor is elected and qualified to carry out the duties and responsibilities of their office, or until he or she resigns or is removed from office.
23
GMO Emerging Country Debt Fund
(A Series of GMO Trust)
Annual Report
February 29, 2008
For a free copy of the Fund's proxy voting guidelines, shareholders may call 1-617-346-7646 (collect), visit our website at www.gmo.com, or visit the Securities and Exchange Commission's website at www.sec.gov. Information regarding how the Fund voted proxies relating to portfolio securities during the most recent 12-month period ended June 30 is available on our website at www.gmo.com, or on the Securities and Exchange Commission's website at www.sec.gov.
The Fund files its complete schedule of portfolio holdings with the Securities and Exchange Commission for the first and third quarter of each fiscal year on Form N-Q, which is available on the Commission's website at www.sec.gov. The Fund's Form N-Q may be reviewed and copied at the Commission's Public Reference Room in Washington, D.C. Information on the operation of the Public Reference Room may be obtained by calling 1-800-SEC-0330. The Fund has a policy with respect to disclosure of portfolio holdings under which it may also make available on GMO's website (www.gmo.com) a complete schedule of portfolio holdings.
This report is prepared for the general information of shareholders. It is authorized for distribution to prospective investors only when preceded or accompanied by a prospectus for the GMO Trust.
GMO Emerging Country Debt Fund
(A Series of GMO Trust)
Portfolio Management
Day-to-day management of the Fund's portfolio is the responsibility of the Fixed Income Division at Grantham, Mayo, Van Otterloo & Co. LLC.
Management Discussion and Analysis of Fund Performance
The Class III shares of the GMO Emerging Country Debt Fund returned +5.1% for the fiscal year ended February 29, 2008, as compared to +5.5% for the JPMorgan Emerging Markets Bond Index Global (EMBIG).
The Fund underperformed the benchmark during the fiscal year by 0.4%. EMBIG spreads over U.S. Treasuries widened 119 basis points to 306 basis points, while the yield on the 10-year U.S. Treasury bond fell by 105 basis points to 3.51%. The EMBIG return of +5.5% was less than its average yield of 6.6% due to the net effect of the two components of return.
The biggest gainers of the fiscal year were Ivory Coast (+53.0%), Ecuador (+26.4%), and Iraq (+23.0%). The worst performing countries for the year were Argentina (-18.9%), Venezuela (-9.7%), and Pakistan (-3.9%). Latin American countries underperformed those outside the region, +4.0% to +7.1%.
Market selection subtracted value, primarily from the Argentina and Uruguay overweights and Malaysia underweight. Overweighting Ivory Coast and underweighting Venezuela partially offset these effects. Security selection added 21 basis points of positive alpha in total. The largest contribution came from the Republic of Congo defaulted bank loans that were restructured into performing global bonds in December. Credit default swap protection helped in Turkey and Brazil, and bond selection was positive in Pakistan and Ecuador.
The views expressed herein are exclusively those of Grantham, Mayo, Van Otterloo & Co. LLC Management as of the date of this report and are subject to change. GMO disclaims any responsibility to update such views. They are not meant as investment advice.
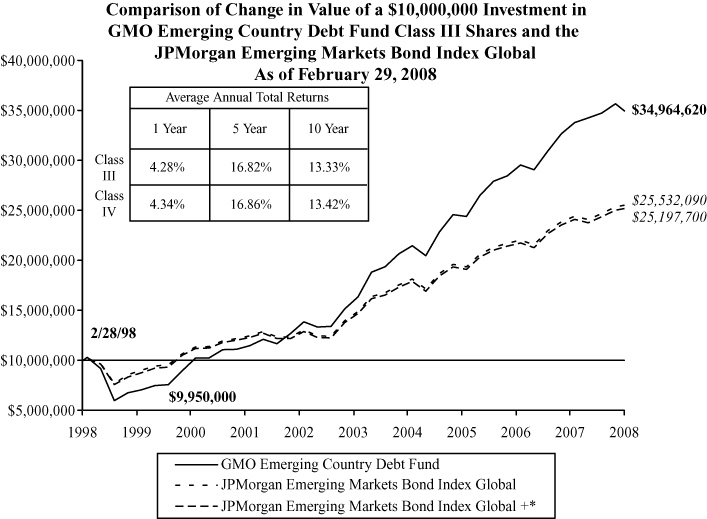
Performance data quoted represents past performance and is not indicative of future results. The investment return and principal value of an investment will fluctuate so that an investor's shares, when redeemed, may be worth more or less than their original cost. Current performance data may be lower or higher than the performance data provided herein. To obtain performance information to the most recent month-end, visit www.gmo.com. Performance shown is net of all fees after reimbursement from the Manager. Each performance figure assumes a purchase at the beginning and redemption at the end of the stated period and reflects a transaction fee of .50% on the purchase and .25% on the redemption. Transaction fees are retained by the Fund to cover trading costs. Returns would have been lower had certain expenses not been reimbursed during the periods shown and do not include the effect of taxes on distributions and redemptions. All information is unaudited. Performance for Class IV shares will vary due to different fees.
* JPMorgan EMBIG + represents the JPMorgan EMBI+ prior to 12/31/99 and the JPMorgan EMBIG thereafter. The Manager changed the benchmark due to the belief that the EMBIG is more diversified and representative of the universe of emerging country debt.
GMO Emerging Country Debt Fund
(A Series of GMO Trust)
Investments Concentration Summary
February 29, 2008 (Unaudited)
| Asset Class Summary* | % of Total Net Assets | ||||||
| Debt Obligations | 105.4 | % | |||||
| Loan Participations | 5.1 | ||||||
| Options Purchased | 3.7 | ||||||
| Short-Term Investments | 2.9 | ||||||
| Loan Assignments | 1.7 | ||||||
| Swaps | 0.8 | ||||||
| Rights and Warrants | �� | 0.7 | |||||
| Promissory Notes | 0.3 | ||||||
| Futures | (0.0 | ) | |||||
| Forward Currency Contracts | (0.4 | ) | |||||
| Written Options | (0.8 | ) | |||||
| Reverse Repurchase Agreements | (19.9 | ) | |||||
| Other | 0.5 | ||||||
| 100.0 | % | ||||||
* The table above incorporates aggregate indirect asset class exposure associated with investments in other funds of GMO Trust ("underlying funds").
1
GMO Emerging Country Debt Fund
(A Series of GMO Trust)
Investments Concentration Summary — (Continued)
February 29, 2008 (Unaudited)
| Country / Region Summary** | % of Investments | ||||||
| Russia | 13.4 | % | |||||
| Mexico | 12.5 | ||||||
| Brazil | 11.1 | ||||||
| Turkey | 8.8 | ||||||
| Philippines | 6.3 | ||||||
| Colombia | 5.4 | ||||||
| Argentina | 5.1 | ||||||
| Venezuela | 5.0 | ||||||
| Uruguay | 4.9 | ||||||
| Ukraine | 3.3 | ||||||
| Africa | 2.3 | ||||||
| Indonesia | 2.2 | ||||||
| Ecuador | 1.8 | ||||||
| El Salvador | 1.7 | ||||||
| Ivory Coast | 1.6 | ||||||
| Dominican Republic | 1.6 | ||||||
| South Africa | 1.5 | ||||||
| Vietnam | 1.5 | ||||||
| Iraq | 0.9 | ||||||
| Qatar | 0.8 | ||||||
| Jamaica | 0.7 | ||||||
| Kazakhstan | 0.7 | ||||||
| South Korea | 0.7 | ||||||
| Peru | 0.6 | ||||||
| Gabon | 0.6 | ||||||
| Egypt | 0.6 | ||||||
| Pakistan | 0.6 | ||||||
| Aruba | 0.5 | ||||||
| Panama | 0.4 | ||||||
| Serbia | 0.4 | ||||||
| India | 0.4 | ||||||
| Poland | 0.3 | ||||||
| Chile | 0.3 | ||||||
| Bosnia | 0.3 | ||||||
| Guatemala | 0.3 | ||||||
| Tunisia | 0.2 | ||||||
| Costa Rica | 0.2 | ||||||
| Trinidad | 0.2 | ||||||
| China | 0.1 | ||||||
| Thailand | 0.1 | ||||||
| Belize | 0.1 | ||||||
| Nicaragua | 0.1 | ||||||
| Malaysia | 0.1 | ||||||
| Lebanon | (0.1 | ) | |||||
| Sri Lanka | (0.1 | ) | |||||
| 100.0 | % | ||||||
** The table above incorporates aggregate indirect country exposure associated with investments in the underlying funds. The table excludes short-term investments. The table includes exposure through the use of derivative contracts.
2
GMO Emerging Country Debt Fund
(A Series of GMO Trust)
Schedule of Investments
(showing percentage of total net assets)
February 29, 2008
| Par Value | Description | Value ($) | |||||||||||||
| DEBT OBLIGATIONS — 99.3% | |||||||||||||||
| Argentina — 10.6% | |||||||||||||||
| Foreign Government Obligations | |||||||||||||||
| USD | 9,000,000 | Province of Buenos Aires, Reg S, Step Up, Variable Rate, 3.00%, due 05/15/35 | 3,352,500 | ||||||||||||
| USD | 24,087 | Republic of Argentina, 8.28%, due 12/31/33 | 18,330 | ||||||||||||
| USD | 45,719,999 | Republic of Argentina Capitalization Bond, Series 2031, 12.00%, due 06/19/31 (a) | 15,087,600 | ||||||||||||
| USD | 32,000,000 | Republic of Argentina Discount Bond, Series L-GL, Variable Rate, 6 mo. LIBOR + .81%, 5.44%, due 03/31/23 (a) | 16,000,000 | ||||||||||||
| DEM | 3,830,000 | Republic of Argentina Discount Bond, Variable Rate, 6 mo. DEM LIBOR + .81%, 3.00%, due 03/31/23 (a) | 1,486,457 | ||||||||||||
| EUR | 214,800,000 | Republic of Argentina GDP Linked, Variable Rate, 1.26%, due 12/15/35 (b) | 36,359,996 | ||||||||||||
| USD | 71,474 | Republic of Argentina GDP Linked, Variable Rate, 1.32%, due 12/15/35 (b) | 8,791 | ||||||||||||
| ARS | 28,000,000 | Republic of Argentina GDP Linked, Variable Rate, 1.38%, due 12/15/35 (b) (c) | 704,397 | ||||||||||||
| DEM | 5,000,000 | Republic of Argentina Global Bond, 9.00%, due 11/19/08 (a) (c) | 1,125,516 | ||||||||||||
| ARS | 5,999,662 | Republic of Argentina Global Bond, 2.00%, due 02/04/18 (c) | 1,951,480 | ||||||||||||
| USD | 26,545,000 | Republic of Argentina Global Bond, 12.13%, due 02/25/19 (a) | 8,494,400 | ||||||||||||
| USD | 6,931,000 | Republic of Argentina Global Bond, 12.00%, due 02/01/20 (a) | 2,217,920 | ||||||||||||
| USD | 13,540,000 | Republic of Argentina Global Bond, 8.88%, due 03/01/29 (a) | 4,332,800 | ||||||||||||
| USD | 31,390,000 | Republic of Argentina Global Bond, EMTN, Reg. S, Variable Rate, 3 mo. LIBOR + .58%, 10.29%, due 04/06/04 (a) | 10,044,800 | ||||||||||||
| USD | 198,230 | Republic of Argentina Global Bond, Series 2008, Step Up, 15.50%, due 12/19/08 (a) | 65,416 | ||||||||||||
| USD | 28,054,525 | Republic of Argentina Global Bond, Series 2018, 12.25%, due 06/19/18 (a) | 9,257,993 | ||||||||||||
| USD | 8,000,000 | Republic of Argentina Global Bond, Series BT04, 9.75%, due 09/19/27 (a) | 2,640,000 | ||||||||||||
| DEM | 20,000,000 | Republic of Argentina Global Bond, Series DM, 5.87%, due 03/31/23 (a) | 7,762,178 | ||||||||||||
| EUR | 3,500,000 | Republic of Argentina Global Bond, Series FEB, Step Down, 8.00%, due 02/26/08 (a) | 1,663,133 | ||||||||||||
| ARS | 28,000,000 | Republic of Argentina Global Bond, Step Up, 0.63%, due 12/31/38 (c) | 2,888,859 | ||||||||||||
| USD | 15,000,000 | Republic of Argentina Global Par Bond, Series L-GP, Step Up, 6.00%, due 03/31/23 (a) | 7,500,000 | ||||||||||||
| USD | 2,000,000 | Republic of Argentina Pro 4, 2.00%, due 12/28/10 (a) | 319,800 | ||||||||||||
| USD | 7,211,000 | Republic of Argentina, Series BGLO, 8.38%, due 12/20/03 (a) | 2,379,630 | ||||||||||||
| USD | 46,000,000 | Republic of Argentina, Series F, 0.00%, due 10/15/04 (a) | 11,500,000 | ||||||||||||
| EUR | 284,000,000 | Republic of Argentina, Step Up, 1.20%, due 12/31/38 | 149,179,492 | ||||||||||||
| USD | 17,000,000 | Republic of Argentina, Step Up, 1.33%, due 12/31/38 (d) | 5,635,500 | ||||||||||||
| Total Argentina | 301,976,988 | ||||||||||||||
See accompanying notes to the financial statements.
3
GMO Emerging Country Debt Fund
(A Series of GMO Trust)
Schedule of Investments — (Continued)
(showing percentage of total net assets)
February 29, 2008
| Par Value | Description | Value ($) | |||||||||||||
| Aruba — 1.2% | |||||||||||||||
| Foreign Government Obligations | |||||||||||||||
| USD | 5,000,000 | Government of Aruba, 6.19%, due 10/30/12 | 5,000,000 | ||||||||||||
| USD | 3,500,000 | Government of Aruba, 6.71%, due 10/15/13 | 3,605,000 | ||||||||||||
| USD | 3,752,000 | Government of Aruba, 6.80%, due 04/02/14 | 3,752,000 | ||||||||||||
| USD | 20,000,000 | Government of Aruba, Reg S, 6.40%, due 09/06/15 | 20,400,000 | ||||||||||||
| Total Aruba | 32,757,000 | ||||||||||||||
| Belize — 0.1% | |||||||||||||||
| Foreign Government Obligations | |||||||||||||||
| USD | 4,023,400 | Government of Belize, Reg S, Step Up, 4.25%, due 02/20/29 | 2,937,082 | ||||||||||||
| Bosnia & Herzegovina — 0.5% | |||||||||||||||
| Foreign Government Obligations | |||||||||||||||
| DEM | 23,224,480 | Bosnia & Herzegovina, Series A, Step Up, Variable Rate, 6 mo. DEM LIBOR + .81%, 5.65%, due 12/11/17 | 14,692,212 | ||||||||||||
| Brazil — 4.6% | |||||||||||||||
| Foreign Government Obligations | |||||||||||||||
| USD | 10,100,000 | Brazilian Government International Exit Bonds, 6.00%, due 09/15/13 | 10,100,000 | ||||||||||||
| USD | 395,455 | Brazilian Government International Exit Bonds Odd Lot, 6.00%, due 09/15/13 | 395,455 | ||||||||||||
| EUR | 8,000,000 | Republic of Brazil, 8.50%, due 09/24/12 | 13,513,964 | ||||||||||||
| USD | 12,500,000 | Republic of Brazil, 8.00%, due 01/15/18 (d) | 14,156,250 | ||||||||||||
| USD | 14,000,000 | Republic of Brazil, 8.75%, due 02/04/25 (d) | 17,325,000 | ||||||||||||
| USD | 64,000,000 | Republic of Brazil, 8.25%, due 01/20/34 (d) | 76,960,000 | ||||||||||||
| Total Brazil | 132,450,669 | ||||||||||||||
| China — 0.3% | |||||||||||||||
| Foreign Government Obligations | |||||||||||||||
| USD | 7,500,000 | China Government International Bond, 6.80%, due 05/23/11 | 8,330,142 | ||||||||||||
See accompanying notes to the financial statements.
4
GMO Emerging Country Debt Fund
(A Series of GMO Trust)
Schedule of Investments — (Continued)
(showing percentage of total net assets)
February 29, 2008
| Par Value | Description | Value ($) | |||||||||||||
| Colombia — 0.5% | |||||||||||||||
| Foreign Government Obligations | |||||||||||||||
| USD | 8,000,000 | Republic of Colombia, 8.70%, due 02/15/16 | 9,280,000 | ||||||||||||
| USD | 3,800,000 | Republic of Colombia, 11.85%, due 03/09/28 | 4,921,000 | ||||||||||||
| Total Colombia | 14,201,000 | ||||||||||||||
| Congo Republic (Brazzaville) — 2.1% | |||||||||||||||
| Foreign Government Obligations | |||||||||||||||
| USD | 109,865,600 | Republic of Congo, 2.50%, due 06/30/29 | 59,327,424 | ||||||||||||
| Costa Rica — 0.3% | |||||||||||||||
| Foreign Government Obligations | |||||||||||||||
| USD | 3,000,000 | Republic of Costa Rica, Reg S, 8.05%, due 01/31/13 | 3,307,500 | ||||||||||||
| USD | 3,710,000 | Republic of Costa Rica, Reg S, 10.00%, due 08/01/20 | 4,850,825 | ||||||||||||
| Total Costa Rica | 8,158,325 | ||||||||||||||
| Dominican Republic — 2.3% | |||||||||||||||
| Asset-Backed Securities — 0.4% | |||||||||||||||
| USD | 12,941,042 | Autopistas Del Nordeste Ltd., Reg S, 9.39%, due 04/15/24 | 12,682,221 | ||||||||||||
| Foreign Government Obligations — 1.9% | |||||||||||||||
| USD | 1,231,853 | Dominican Republic Bond, Variable Rate, 6 mo. LIBOR + .81%, 3.88%, due 08/30/09 | 1,228,773 | ||||||||||||
| USD | 42,557,000 | Dominican Republic Bond, Variable Rate, 6 mo. LIBOR + .81%, 5.72%, due 08/30/24 | 42,450,608 | ||||||||||||
| USD | 9,000,000 | Dominican Republic, Reg S, 8.63%, due 04/20/27 | 9,810,000 | ||||||||||||
| 53,489,381 | |||||||||||||||
| Total Dominican Republic | 66,171,602 | ||||||||||||||
See accompanying notes to the financial statements.
5
GMO Emerging Country Debt Fund
(A Series of GMO Trust)
Schedule of Investments — (Continued)
(showing percentage of total net assets)
February 29, 2008
| Par Value | Description | Value ($) | |||||||||||||
| Ecuador — 1.8% | |||||||||||||||
| Foreign Government Obligations | |||||||||||||||
| USD | 47,087,000 | Republic of Ecuador, 10.00%, due 08/15/30 (d) | 46,145,260 | ||||||||||||
| USD | 2,349,332 | Republic of Ecuador PDI (Global Bearer Capitalization Bond), PIK, Variable Rate, 6 mo. LIBOR + .81%, 3.88%, due 02/27/15 (c) | 1,825,666 | ||||||||||||
| USD | 2,000,000 | Republic of Ecuador, Reg S, 9.38%, due 12/15/15 (d) | 2,045,000 | ||||||||||||
| Total Ecuador | 50,015,926 | ||||||||||||||
| Egypt — 0.1% | |||||||||||||||
| Corporate Debt | |||||||||||||||
| USD | 1,698,396 | Petroleum Export, 144A, 5.27%, due 06/15/11 | 1,694,150 | ||||||||||||
| El Salvador — 1.4% | |||||||||||||||
| Foreign Government Obligations | |||||||||||||||
| USD | 37,000,000 | Republic of El Salvador, Reg S, 7.65%, due 06/15/35 | 39,775,000 | ||||||||||||
| Gabon — 0.8% | |||||||||||||||
| Foreign Government Obligations | |||||||||||||||
| USD | 21,000,000 | Gabonese Republic, 144A, 8.20%, due 12/12/17 | 22,023,750 | ||||||||||||
| Grenada — 0.1% | |||||||||||||||
| Foreign Government Obligations | |||||||||||||||
| USD | 6,000,000 | Government of Grenada, Reg S, Step Up, 1.00%, due 09/15/25 | 3,240,000 | ||||||||||||
| Guatemala — 0.3% | |||||||||||||||
| Foreign Government Obligations | |||||||||||||||
| USD | 6,750,000 | Republic of Guatemala, Reg S, 8.13%, due 10/06/34 | 7,897,500 | ||||||||||||
| Indonesia — 1.3% | |||||||||||||||
| Corporate Debt — 1.0% | |||||||||||||||
| USD | 31,000,000 | Majapahit Holding BV, 144A, 7.88%, due 06/29/37 (d) | 28,830,000 | ||||||||||||
| Foreign Government Obligations — 0.3% | |||||||||||||||
| USD | 8,000,000 | Republic of Indonesia, 144A, 7.75%, due 01/17/38 | 8,380,000 | ||||||||||||
| Total Indonesia | 37,210,000 | ||||||||||||||
See accompanying notes to the financial statements.
6
GMO Emerging Country Debt Fund
(A Series of GMO Trust)
Schedule of Investments — (Continued)
(showing percentage of total net assets)
February 29, 2008
| Par Value | Description | Value ($) | |||||||||||||
| Iraq — 0.4% | |||||||||||||||
| Foreign Government Obligations | |||||||||||||||
| USD | 16,000,000 | Republic of Iraq, Reg S, 5.80%, due 01/15/28 | 11,700,000 | ||||||||||||
| Ivory Coast — 1.9% | |||||||||||||||
| Foreign Government Obligations | |||||||||||||||
| FRF | 37,500,000 | Ivory Coast Discount Bond, Series FRF, Variable Rate, Step Up, 3.00%, due 03/31/28 (a) | 3,862,163 | ||||||||||||
| FRF | 85,905,000 | Ivory Coast FLIRB, Series FRF, Variable Rate, Step Up, 2.50%, due 03/29/18 (a) | 6,759,844 | ||||||||||||
| USD | 69,850,000 | Ivory Coast FLIRB, Variable Rate, Step Up, 3.00%, due 03/30/18 (a) | 24,447,500 | ||||||||||||
| FRF | 256,889,500 | Ivory Coast PDI, Series FRF, Variable Rate, Step Up, 1.90%, due 03/30/18 (a) | 20,214,574 | ||||||||||||
| Total Ivory Coast | 55,284,081 | ||||||||||||||
| Jamaica — 0.7% | |||||||||||||||
| Corporate Debt — 0.4% | |||||||||||||||
| USD | 12,000,000 | Air Jamaica Ltd., Reg S, 9.38%, due 07/08/15 | 12,720,000 | ||||||||||||
| Foreign Government Obligations — 0.3% | |||||||||||||||
| USD | 9,000,000 | Government of Jamaica, 8.00%, due 03/15/39 | 8,640,000 | ||||||||||||
| Total Jamaica | 21,360,000 | ||||||||||||||
| Malaysia — 1.1% | |||||||||||||||
| Corporate Debt | |||||||||||||||
| MYR | 45,000,000 | Transshipment Megahub Berhad, Series C, 5.45%, due 11/03/09 | 14,220,535 | ||||||||||||
| MYR | 50,000,000 | Transshipment Megahub Berhad, Series F, 6.70%, due 11/03/12 | 16,638,754 | ||||||||||||
| Total Malaysia | 30,859,289 | ||||||||||||||
| Mexico — 8.1% | |||||||||||||||
| Corporate Debt — 3.9% | |||||||||||||||
| GBP | 7,689,000 | Pemex Project Funding Master Trust, EMTN, 7.50%, due 12/18/13 | 15,679,486 | ||||||||||||
| EUR | 30,000,000 | Pemex Project Funding Master Trust, Reg S, 6.38%, due 08/05/16 | 46,906,281 | ||||||||||||
See accompanying notes to the financial statements.
7
GMO Emerging Country Debt Fund
(A Series of GMO Trust)
Schedule of Investments — (Continued)
(showing percentage of total net assets)
February 29, 2008
| Par Value | Description | Value ($) | |||||||||||||
| Corporate Debt — continued | |||||||||||||||
| EUR | 26,500,000 | Pemex Project Funding Master Trust, Reg S, 5.50%, due 02/24/25 | 35,805,568 | ||||||||||||
| ITL | 16,955,000,000 | Petroleos Mexicanos, EMTN, Variable Rate, 12 mo. EUR LIBOR, 7.12%, due 03/04/08 | 13,260,487 | ||||||||||||
| 111,651,822 | |||||||||||||||
| Foreign Government Obligations — 4.2% | |||||||||||||||
| USD | 58,000,000 | United Mexican States, 6.05%, due 01/11/40 (d) | 57,420,000 | ||||||||||||
| GBP | 29,994,000 | United Mexican States, GMTN, 6.75%, due 02/06/24 | 61,089,567 | ||||||||||||
| 118,509,567 | |||||||||||||||
| Total Mexico | 230,161,389 | ||||||||||||||
| Nicaragua — 0.2% | |||||||||||||||
| Foreign Government Obligations | |||||||||||||||
| USD | 6,173,169 | Republic of Nicaragua BPI, Series E, 5.00%, due 02/01/11 | 5,442,451 | ||||||||||||
| Pakistan — 0.6% | |||||||||||||||
| Foreign Government Obligations | |||||||||||||||
| USD | 20,000,000 | Islamic Republic of Pakistan, Reg S, 7.88%, due 03/31/36 | 17,800,000 | ||||||||||||
| Peru — 4.2% | |||||||||||||||
| Asset-Backed Securities — 0.2% | |||||||||||||||
| USD | 12,452,000 | Peru Enhanced Pass-Through Finance Ltd., 144A, 0.00%, due 05/31/25 | 4,669,500 | ||||||||||||
| Foreign Government Obligations — 4.0% | |||||||||||||||
| USD | 20,217,000 | Peru FLIRB, Series 20 Yr., Variable Rate, Step Up, 6.44%, due 03/07/17 | 20,166,458 | ||||||||||||
| USD | 25,000,000 | Peru Par Bond, Series 30 Yr., Step Up, 3.00%, due 03/07/27 | 20,000,000 | ||||||||||||
| USD | 1,726,769 | Peru Trust II, Series 98-A LB, 0.00%, due 02/28/16 | 1,396,438 | ||||||||||||
| USD | 4,748,850 | Peru Trust, Series 97-I-P, Class A3, 0.00%, due 12/31/15 | 3,231,592 | ||||||||||||
| USD | 2,011,034 | Racers, Series 1998 I-P, 0.00%, due 03/10/16 | 1,330,419 | ||||||||||||
| USD | 5,000,000 | Republic of Peru, 7.35%, due 07/21/25 | 5,600,000 | ||||||||||||
See accompanying notes to the financial statements.
8
GMO Emerging Country Debt Fund
(A Series of GMO Trust)
Schedule of Investments — (Continued)
(showing percentage of total net assets)
February 29, 2008
| Par Value | Description | Value ($) | |||||||||||||
| Foreign Government Obligations — continued | |||||||||||||||
| USD | 40,381,000 | Republic of Peru Discount Bond, Variable Rate, 6 mo. LIBOR + .81%, 6.44%, due 03/07/27 | 40,280,048 | ||||||||||||
| EUR | 13,700,000 | Republic of Peru Global Bond, 7.50%, due 10/14/14 | 22,371,033 | ||||||||||||
| 114,375,988 | |||||||||||||||
| Total Peru | 119,045,488 | ||||||||||||||
| Philippines — 6.0% | |||||||||||||||
| Corporate Debt — 1.8% | |||||||||||||||
| USD | 6,000,000 | National Power Corp., 9.88%, due 03/16/10 | 6,540,000 | ||||||||||||
| USD | 31,600,000 | National Power Corp., 9.63%, due 05/15/28 | 37,209,000 | ||||||||||||
| USD | 8,500,000 | National Power Corp., Global Bond, 8.40%, due 12/15/16 | 9,388,165 | ||||||||||||
| 53,137,165 | |||||||||||||||
| Foreign Government Obligations — 4.2% | |||||||||||||||
| USD | 59,501,000 | Central Bank of Philippines, Series A, 8.60%, due 06/15/27 | 69,318,665 | ||||||||||||
| EUR | 12,000,000 | Republic of Philippines, 9.13%, due 02/22/10 | 19,425,640 | ||||||||||||
| USD | 27,843,000 | Republic of Philippines, 8.38%, due 02/15/11 (d) | 30,383,674 | ||||||||||||
| 119,127,979 | |||||||||||||||
| Total Philippines | 172,265,144 | ||||||||||||||
| Poland — 0.6% | |||||||||||||||
| Foreign Government Obligations | |||||||||||||||
| USD | 10,000,000 | Delphes Co. No. 2 Ltd., EMTN, Reg S, 7.75%, due 05/05/09 | 10,536,480 | ||||||||||||
| USD | 6,000,000 | Poland Government International Bond, 6.25%, due 07/03/12 | 6,618,000 | ||||||||||||
| Total Poland | 17,154,480 | ||||||||||||||
| Qatar — 0.5% | |||||||||||||||
| Foreign Government Obligations | |||||||||||||||
| USD | 10,000,000 | State of Qatar, Reg S, 9.75%, due 06/15/30 | 15,575,000 | ||||||||||||
See accompanying notes to the financial statements.
9
GMO Emerging Country Debt Fund
(A Series of GMO Trust)
Schedule of Investments — (Continued)
(showing percentage of total net assets)
February 29, 2008
| Par Value | Description | Value ($) | |||||||||||||
| Russia — 15.3% | |||||||||||||||
| Corporate Debt — 9.4% | |||||||||||||||
| EUR | 40,000,000 | Gaz Capital (Gazprom), EMTN, 5.36%, due 10/31/14 | 54,805,215 | ||||||||||||
| EUR | 38,000,000 | Gaz Capital (Gazprom), EMTN, Reg S, 5.88%, due 06/01/15 | 53,651,421 | ||||||||||||
| EUR | 21,000,000 | Gaz Capital (Gazprom), Reg S, 5.44%, due 11/02/17 | 27,138,829 | ||||||||||||
| USD | 14,553,795 | Gazprom International SA, Reg S, 7.20%, due 02/01/20 | 14,935,832 | ||||||||||||
| USD | 31,433,816 | Gazstream SA, Reg S, 5.63%, due 07/22/13 (d) | 31,314,211 | ||||||||||||
| USD | 50,000,000 | RSHB Capital SA, 144A, 6.30%, due 05/15/17 | 46,640,000 | ||||||||||||
| USD | 14,000,000 | RSHB Capital SA, Reg S, 7.18%, due 05/16/13 (d) | 14,332,500 | ||||||||||||
| USD | 8,000,000 | Sberbank Capital SA, EMTN, 6.48%, due 05/15/13 | 8,115,040 | ||||||||||||
| USD | 19,000,000 | VTB Capital SA, Reg S, 6.25%, due 06/30/35 | 17,739,236 | ||||||||||||
| 268,672,284 | |||||||||||||||
| Foreign Government Obligations — 5.9% | |||||||||||||||
| USD | 146,017,921 | Russian Federation, Reg S, Step Up, 7.50%, due 03/31/30 (d) | 167,007,998 | ||||||||||||
| Total Russia | 435,680,282 | ||||||||||||||
| Serbia — 0.5% | |||||||||||||||
| Foreign Government Obligations | |||||||||||||||
| USD | 14,966,026 | Republic of Serbia, Reg S, Step Up, 3.75%, due 11/01/24 | 14,030,649 | ||||||||||||
| South Africa — 1.3% | |||||||||||||||
| Foreign Government Agency — 0.1% | |||||||||||||||
| ZAR | 163,000,000 | Eskom Holdings Ltd., 0.00%, due 12/31/32 | 2,018,866 | ||||||||||||
| Foreign Government Obligations — 1.2% | |||||||||||||||
| USD | 8,000,000 | Republic of South Africa, 5.88%, due 05/30/22 | 7,520,000 | ||||||||||||
| EUR | 20,000,000 | Republic of South Africa, EMTN, 4.50%, due 04/05/16 | 27,144,522 | ||||||||||||
| 34,664,522 | |||||||||||||||
| Total South Africa | 36,683,388 | ||||||||||||||
| Sri Lanka — 0.6% | |||||||||||||||
| Foreign Government Obligations | |||||||||||||||
| USD | 19,000,000 | Republic of Sri Lanka, 144A, 8.25%, due 10/24/12 | 16,910,000 | ||||||||||||
See accompanying notes to the financial statements.
10
GMO Emerging Country Debt Fund
(A Series of GMO Trust)
Schedule of Investments — (Continued)
(showing percentage of total net assets)
February 29, 2008
| Par Value | Description | Value ($) | |||||||||||||
| Thailand — 0.2% | |||||||||||||||
| Corporate Debt | |||||||||||||||
| USD | 5,000,000 | PTT Public Co. Ltd., 5.75%, due 08/01/14 | 5,186,645 | ||||||||||||
| Trinidad & Tobago — 0.5% | |||||||||||||||
| Corporate Debt | |||||||||||||||
| USD | 8,000,000 | First Citizens St. Lucia, Reg S, 5.13%, due 02/14/11 | 8,153,680 | ||||||||||||
| USD | 7,000,000 | First Citizens St. Lucia, Reg S, 5.46%, due 02/01/12 | 7,207,480 | ||||||||||||
| Total Trinidad & Tobago | 15,361,160 | ||||||||||||||
| Tunisia — 0.1% | |||||||||||||||
| Foreign Government Agency | |||||||||||||||
| JPY | 360,000,000 | Banque Centrale De Tunisie, Series 6BR, 4.35%, due 08/15/17 | 3,846,376 | ||||||||||||
| Turkey — 2.5% | |||||||||||||||
| Foreign Government Obligations | |||||||||||||||
| USD | 18,000,000 | Republic of Turkey, 7.38%, due 02/05/25 (d) | 18,337,500 | ||||||||||||
| USD | 56,000,000 | Republic of Turkey, 6.88%, due 03/17/36 (d) | 51,660,000 | ||||||||||||
| Total Turkey | 69,997,500 | ||||||||||||||
| Ukraine — 4.7% | |||||||||||||||
| Foreign Government Agency — 0.7% | |||||||||||||||
| USD | 9,000,000 | Credit Suisse First Boston, The EXIM of Ukraine, 6.80%, due 10/04/12 | 8,719,200 | ||||||||||||
| USD | 10,000,000 | Dresdner Kleinwort Wasserstein for CJSC, The EXIM of Ukraine, 7.75%, due 09/23/09 | 10,163,000 | ||||||||||||
| 18,882,200 | |||||||||||||||
| Foreign Government Obligations — 4.0% | |||||||||||||||
| USD | 18,000,000 | City of Kyiv, 144A, 8.25%, due 11/26/12 | 18,275,040 | ||||||||||||
| CHF | 100,000,000 | Ukraine Government, 3.50%, due 09/15/18 | 96,121,538 | ||||||||||||
| 114,396,578 | |||||||||||||||
| Total Ukraine | 133,278,778 | ||||||||||||||
See accompanying notes to the financial statements.
11
GMO Emerging Country Debt Fund
(A Series of GMO Trust)
Schedule of Investments — (Continued)
(showing percentage of total net assets)
February 29, 2008
| Par Value | Description | Value ($) | |||||||||||||
| United Kingdom — 0.0% | |||||||||||||||
| Asset-Backed Securities | |||||||||||||||
| GBP | 108,878 | RMAC, Series 03-NS2A, Class A2A, 144A, AMBAC, Variable Rate, 3 mo. GBP LIBOR + .40%, 7.03%, due 09/12/35 | 216,302 | ||||||||||||
| United States — 8.6% | |||||||||||||||
| Asset-Backed Securities — 8.3% | |||||||||||||||
| USD | 4,000,000 | Aircraft Finance Trust, Series 99-1A, Class A1, 144A, Variable Rate, 1 mo. LIBOR + .48%, 3.60%, due 05/15/24 | 2,600,000 | ||||||||||||
| USD | 45,000,000 | Chase Issuance Trust, Series 06-A5, Class A, Variable Rate, 1 mo. LIBOR + .02%, 3.14%, due 11/15/13 | 43,705,791 | ||||||||||||
| USD | 283,547 | Chevy Chase Mortgage Funding Corp., Series 03-4A, Class A1, 144A, AMBAC, Variable Rate, 1 mo. LIBOR + .34%, 3.48%, due 10/25/34 | 226,837 | ||||||||||||
| USD | 1,373,706 | CHYPS CBO, Series 97-1A, Class A2A, 144A, 6.72%, due 01/15/10 | 259,163 | ||||||||||||
| USD | 12,797,011 | Citigroup Mortgage Loan Trust, Inc., Series 05-HE3, Class A2C, 3.40%, due 09/25/35 | 12,738,144 | ||||||||||||
| USD | 1,967,889 | CNL Commercial Mortgage Loan Trust, Series 03-2A, Class A1, 144A, AMBAC, Variable Rate, 1 mo. LIBOR + .44%, 3.58%, due 10/25/30 | 1,885,712 | ||||||||||||
| USD | 32,584,560 | Countrywide Home Equity Loan Trust, Series 05-F, Class 2A, Variable Rate, 1 mo. LIBOR + .24%, 3.36%, due 12/15/35 | 24,243,238 | ||||||||||||
| USD | 22,730,306 | Countrywide Home Equity Loan Trust, Series 05-H, Class 2A, Variable Rate, 1 mo. LIBOR + .24%, 3.36%, due 12/15/35 | 17,363,453 | ||||||||||||
| USD | 19,350,214 | Countrywide Home Equity Loan Trust, Series 06-D, Class 2A, Variable Rate, 1 mo. LIBOR + .20%, 3.32%, due 05/15/36 | 13,078,422 | ||||||||||||
| USD | 8,041,471 | First Franklin Mortgage Loan Asset Backed Certificates, Series 05-FF10, Class A6M, Variable Rate, 1 mo. LIBOR + .35%, 3.49%, due 11/25/35 | 6,918,000 | ||||||||||||
| USD | 761,560 | Golden Securities Corp., Series 03-A, Class A1, 144A, AMBAC, Variable Rate, 1 mo. LIBOR + .30%, 3.56%, due 12/02/13 | 759,739 | ||||||||||||
| USD | 25,765,628 | Greenpoint Mortgage Funding Trust, Series 07-HE1, Class A1, Variable Rate, 1 mo. LIBOR + .15%, 3.29%, due 12/13/32 | 18,035,940 | ||||||||||||
| USD | 11,281,095 | GSAMP Trust, Series 05-HE6, Class A2B, 3.33%, due 11/25/35 | 9,588,930 | ||||||||||||
| USD | 9,250,000 | Home Equity Asset Trust, Series 07-1, Class 2A4, Variable Rate, 1 mo. LIBOR + .23%, 3.37%, due 05/25/37 | 5,993,075 | ||||||||||||
| USD | 10,000,000 | IXIS Real Estate Capital Trust, Series 06-HE2, Class A3, 3.30%, due 08/25/36 | 8,707,000 | ||||||||||||
| USD | 4,031,252 | Master Asset-Backed Securities Trust, Series 06-FRE1, Class A2, Variable Rate, 1 mo. LIBOR + .12%, 3.26%, due 12/25/35 | 3,910,315 | ||||||||||||
See accompanying notes to the financial statements.
12
GMO Emerging Country Debt Fund
(A Series of GMO Trust)
Schedule of Investments — (Continued)
(showing percentage of total net assets)
February 29, 2008
| Par Value | Description | Value ($) | |||||||||||||
| Asset-Backed Securities — continued | |||||||||||||||
| USD | 13,000,000 | Master Asset-Backed Securities Trust, Series 06-NC3, Class A4, Variable Rate, 1 mo. LIBOR + .16%, 3.28%, due 10/25/36 | 8,840,000 | ||||||||||||
| USD | 13,000,000 | Morgan Stanley ABS Capital I, Series 06-NC3, Class A2C, Variable Rate, 1 mo. LIBOR + .17%, 3.31%, due 03/25/36 | 10,725,000 | ||||||||||||
| USD | 10,000,000 | Morgan Stanley ACES SPC, Series 04-15, Class I, 144A, Variable Rate, 3 mo. LIBOR + .45%, 5.38%, due 12/20/09 | 9,455,000 | ||||||||||||
| USD | 15,000,000 | Morgan Stanley IXIS Real Estate Capital Trust, Series 06-2, Class A3, Variable Rate, 1 mo. LIBOR + .15%, 3.27%, due 11/25/36 | 11,475,000 | ||||||||||||
| USD | 15,200,000 | Morgan Stanley IXIS Real Estate Capital Trust, Series 06-2, Class A4, Variable Rate, 1 mo. LIBOR + .22%, 3.36%, due 11/25/36 | 10,384,640 | ||||||||||||
| USD | 12,868,000 | Option One Mortgage Loan Trust, Series 06-3, Class 2A4, Variable Rate, 1 mo. LIBOR + .22%, 3.36%, due 02/25/37 | 8,364,200 | ||||||||||||
| USD | 178,329 | Quest Trust, Series 03-X4A, Class A, 144A, AMBAC, Variable Rate, 1 mo. LIBOR + .43%, 3.57%, due 12/25/33 | 151,579 | ||||||||||||
| USD | 2,656,171 | SHYPPCO Finance Co., LLC, Series 1I, Class A2B, 6.64%, due 06/15/10 | 2,523,362 | ||||||||||||
| USD | 8,000,000 | Wamu Asset-Backed Certificates, Series 07-HE2, Class 2A4, Variable Rate, 1 mo. LIBOR + .36%, 3.50%, due 04/25/37 | 4,405,285 | ||||||||||||
| 236,337,825 | |||||||||||||||
| U.S. Government — 0.3% | |||||||||||||||
| USD | 5,000,000 | U.S. Treasury Note, 2.63%, due 05/15/08 (d) (e) | 5,007,031 | ||||||||||||
| USD | 5,000,000 | U.S. Treasury Note, 4.13%, due 08/15/08 (e) | 5,050,781 | ||||||||||||
| 10,057,812 | |||||||||||||||
| Total United States | 246,395,637 | ||||||||||||||
| Uruguay — 5.4% | |||||||||||||||
| Foreign Government Obligations | |||||||||||||||
| EUR | 2,000,000 | Republic of Uruguay, 7.00%, due 06/28/19 | 3,218,478 | ||||||||||||
| USD | 11,500,000 | Republic of Uruguay, 8.00%, due 11/18/22 | 12,402,750 | ||||||||||||
| USD | 83,651,571 | Republic of Uruguay, 7.63%, due 03/21/36 | 85,951,989 | ||||||||||||
| USD | 21,745,700 | Republic of Uruguay, PIK, 7.88%, due 01/15/33 | 23,050,442 | ||||||||||||
| USD | 400,000 | Republica Orient Uruguay, 7.25%, due 05/04/14 | 400,440 | ||||||||||||
| EUR | 10,000,000 | Republica Orient Uruguay, 6.88%, due 01/19/16 | 15,371,269 | ||||||||||||
| JPY | 1,483,200,000 | Republica Orient Uruguay, Series 3BR, Step Up, 2.50%, due 03/14/11 | 12,706,209 | ||||||||||||
| Total Uruguay | 153,101,577 | ||||||||||||||
See accompanying notes to the financial statements.
13
GMO Emerging Country Debt Fund
(A Series of GMO Trust)
Schedule of Investments — (Continued)
(showing percentage of total net assets)
February 29, 2008
| Par Value | Description | Value ($) | |||||||||||||
| Venezuela — 6.1% | |||||||||||||||
| Foreign Government Agency — 0.3% | |||||||||||||||
| USD | 16,000,000 | Petroleos De Venezuela, 5.38%, due 04/12/27 (d) | 9,624,000 | ||||||||||||
| Foreign Government Obligations — 5.8% | |||||||||||||||
| EUR | 30,000,000 | Republic of Venezuela, 11.00%, due 03/05/08 | 45,430,639 | ||||||||||||
| EUR | 8,400,000 | Republic of Venezuela, 11.13%, due 07/25/11 | 13,645,132 | ||||||||||||
| EUR | 12,000,000 | Republic of Venezuela, 7.00%, due 03/16/15 | 16,213,842 | ||||||||||||
| USD | 4,000,000 | Republic of Venezuela, 6.00%, due 12/09/20 | 3,070,000 | ||||||||||||
| USD | 74,300,000 | Republic of Venezuela, 7.65%, due 04/21/25 (d) | 63,340,750 | ||||||||||||
| USD | 12,000,000 | Republic of Venezuela, 9.38%, due 01/13/34 (d) | 11,760,000 | ||||||||||||
| USD | 14,000,000 | Republic of Venezuela, 7.00%, due 03/31/38 | 10,360,000 | ||||||||||||
| USD | 1,434,783 | Republic of Venezuela DCB IL, Variable Rate, 6 mo. LIBOR + .88%, 5.75%, due 12/18/08 | 1,434,783 | ||||||||||||
| 165,255,146 | |||||||||||||||
| Total Venezuela | 174,879,146 | ||||||||||||||
| Vietnam — 0.9% | |||||||||||||||
| Foreign Government Obligations | |||||||||||||||
| USD | 4,000,000 | Socialist Republic of Vietnam, Series 30 Yr., Variable Rate, 6.31%, due 03/13/28 | 3,880,000 | ||||||||||||
| USD | 19,750,000 | Vietnam Par Bond, Series 30 Yr., Step Up, 4.00%, due 03/12/28 | 16,787,500 | ||||||||||||
| USD | 4,434,783 | Vietnam PDI, Series 18 Yr., Variable Rate, Step Up, 6.31%, due 03/12/16 | 4,390,435 | ||||||||||||
| Total Vietnam | 25,057,935 | ||||||||||||||
| TOTAL DEBT OBLIGATIONS (COST $2,774,809,036) | 2,830,131,467 | ||||||||||||||
| LOAN ASSIGNMENTS — 1.7% | |||||||||||||||
| Indonesia — 1.0% | |||||||||||||||
| JPY | 172,800,002 | Republic of Indonesia Loan Agreement, 6 mo. JPY LIBOR + .88%, 1.58%, due 03/28/13 | 1,617,557 | ||||||||||||
| USD | 3,694,761 | Republic of Indonesia Loan Agreement, dated January 1, 1994, 3 mo. LIBOR + .88%, 6.23%, due 03/29/13 | 3,620,866 | ||||||||||||
| USD | 3,775,200 | Republic of Indonesia Loan Agreement, dated June 14, 1995, 3 mo. LIBOR + .88%, 6.25%, due 12/14/19 | 3,586,440 | ||||||||||||
See accompanying notes to the financial statements.
14
GMO Emerging Country Debt Fund
(A Series of GMO Trust)
Schedule of Investments — (Continued)
(showing percentage of total net assets)
February 29, 2008
| Par Value | Description | Value ($) | |||||||||||||
| Indonesia — continued | |||||||||||||||
| USD | 3,775,200 | Republic of Indonesia Loan Agreement, dated June 14, 1995, 3 mo. LIBOR + .88%, 6.25%, due 12/14/19 | 3,586,440 | ||||||||||||
| USD | 5,033,600 | Republic of Indonesia Loan Agreement, dated June 14, 1995, 3 mo. LIBOR + .88%, 6.25%, due 12/14/19 | 4,781,920 | ||||||||||||
| USD | 2,947,139 | Republic of Indonesia Loan Agreement, dated September 29, 1994, 7.24%, due 12/01/19 | 2,740,839 | ||||||||||||
| USD | 940,891 | Republic of Indonesia Loan Agreement, dated September 29, 1994, 7.83%, due 12/01/19 | 875,029 | ||||||||||||
| USD | 2,765,778 | Republic of Indonesia Loan Agreement, dated September 29, 1994, Variable Rate, 6.31%, due 12/01/19 | 2,572,174 | ||||||||||||
| EUR | 3,262,131 | Republic of Indonesia, Indonesia Paris Club Debt * | 3,999,066 | ||||||||||||
| Total Indonesia | 27,380,331 | ||||||||||||||
| Russia — 0.2% | |||||||||||||||
| USD | 3,955,201 | Russia Foreign Trade Obligations * (c) | 5,579,241 | ||||||||||||
| DEM | 45,916 | Russia Foreign Trade Obligations * (c) | 33,648 | ||||||||||||
| FIM | 1,740,000 | Russia Foreign Trade Obligations * (c) | 443,157 | ||||||||||||
| GBP | 14,162 | Russia Foreign Trade Obligations * (c) | 37,529 | ||||||||||||
| USD | 265,723 | Russia Foreign Trade Obligations * (c) | 368,098 | ||||||||||||
| USD | 80,572 | Russia Foreign Trade Obligations * (c) | 109,810 | ||||||||||||
| Total Russia | 6,571,483 | ||||||||||||||
| Vietnam — 0.5% | |||||||||||||||
| USD | 16,000,000 | Vietnam Shipbuilding Industry Group Loan Agreement, 6 mo. LIBOR + .15%, 6.89%, due 06/26/15 | 15,440,000 | ||||||||||||
| TOTAL LOAN ASSIGNMENTS (COST $41,359,204) | 49,391,814 | ||||||||||||||
| LOAN PARTICIPATIONS — 5.1% | |||||||||||||||
| Egypt — 0.1% | |||||||||||||||
| CHF | 5,645,535 | Paris Club Loan Agreement (Participation with Standard Chartered Bank), 0.00%, due 01/03/24 * | 3,791,501 | ||||||||||||
See accompanying notes to the financial statements.
15
GMO Emerging Country Debt Fund
(A Series of GMO Trust)
Schedule of Investments — (Continued)
(showing percentage of total net assets)
February 29, 2008
| Par Value | Description | Value ($) | |||||||||||||
| Indonesia — 1.8% | |||||||||||||||
| USD | 464,640 | Republic of Indonesia Loan Agreement (Participation with Citibank), 3 mo. LIBOR + .88%, 6.25%, due 12/14/19 | 441,408 | ||||||||||||
| USD | 464,640 | Republic of Indonesia Loan Agreement (Participation with Citibank), 3 mo. LIBOR + .88%, 6.25%, due 12/14/19 | 441,408 | ||||||||||||
| USD | 619,520 | Republic of Indonesia Loan Agreement (Participation with Citibank), 3 mo. LIBOR + .88%, 6.25%, due 12/14/19 | 588,544 | ||||||||||||
| USD | 18,838,919 | Republic of Indonesia Loan Agreement (Participation with Deutsche Bank), 3 mo. LIBOR + .88%, 6.20%, due 09/29/19 | 17,190,513 | ||||||||||||
| JPY | 1,021,596,248 | Republic of Indonesia Loan Agreement (Participation with Deutsche Bank), 3 mo. LIBOR + 0.88%, 1.58%, due 03/29/13 | 9,636,773 | ||||||||||||
| USD | 23,573,762 | Republic of Indonesia Loan Agreement (Participation with Deutsche Bank), 3 mo. LIBOR + 1.25%, 6.61%, due 02/12/13 | 21,687,861 | ||||||||||||
| Total Indonesia | 49,986,507 | ||||||||||||||
| Iraq — 1.2% | |||||||||||||||
| JPY | 4,926,803,587 | Republic of Iraq Paris Club Loan Agreement (Participation with Deutsche Bank), due 01/01/28 | 29,573,151 | ||||||||||||
| JPY | 643,772,123 | Republic of Iraq Paris Club Loan, T Chatani (Participation with Deutsche Bank), due 01/01/28 | 3,787,405 | ||||||||||||
| Total Iraq | 33,360,556 | ||||||||||||||
| Poland — 0.3% | |||||||||||||||
| JPY | 999,999,985 | Poland Paris Club Debt (Participation with Deutsche Bank), 2.22%, due 03/31/09 | 9,768,313 | ||||||||||||
| Russia — 0.8% | |||||||||||||||
| EUR | 57,042,402 | Russian Foreign Trade Obligations (Participation with GML International Ltd) * (c) | 21,784,942 | ||||||||||||
| Vietnam — 0.9% | |||||||||||||||
| JPY | 3,015,866,610 | Socialist Republic of Vietnam Loan Agreement (Participation with Deutsche Bank), Variable Rate, 6 mo. JPY LIBOR + .71%, 1.31%, due 09/01/17 | 26,126,480 | ||||||||||||
| TOTAL LOAN PARTICIPATIONS (COST $127,322,899) | 144,818,299 | ||||||||||||||
See accompanying notes to the financial statements.
16
GMO Emerging Country Debt Fund
(A Series of GMO Trust)
Schedule of Investments — (Continued)
(showing percentage of total net assets)
February 29, 2008
| Par Value / Principal Amount | Description | Value ($) | |||||||||||||
| PROMISSORY NOTES — 0.3% | |||||||||||||||
| Dominican Republic — 0.1% | |||||||||||||||
| USD | 1,186,200 | Dominican Republic Promissory Notes, 0.00%, due 3/15/2008 | 1,183,234 | ||||||||||||
| USD | 1,089,012 | Dominican Republic Promissory Notes, 0.00%, due 9/15/2009 | 975,755 | ||||||||||||
| USD | 817,249 | Dominican Republic Promissory Notes, 0.00%, due 9/15/2010 | 682,403 | ||||||||||||
| USD | 817,249 | Dominican Republic Promissory Notes, 0.00%, due 9/15/2011 | 636,637 | ||||||||||||
| Total Dominican Republic | 3,478,029 | ||||||||||||||
| Ghana — 0.0% | |||||||||||||||
| USD | 5,312,500 | Republic of Ghana Promissory Notes, 0.00%, due 8/9/2007 (a) (f) | 531,250 | ||||||||||||
| Nigeria — 0.2% | |||||||||||||||
| USD | 33,450,000 | Central Bank of Nigeria Promissory Notes, Series RC, 5.09%, due 1/5/2010 | 4,933,875 | ||||||||||||
| TOTAL PROMISSORY NOTES (COST $30,341,429) | 8,943,154 | ||||||||||||||
| OPTIONS PURCHASED — 3.7% | |||||||||||||||
| Currency Options — 3.3% | |||||||||||||||
| EUR | 50,000,000 | EUR Put/TRY Call, Expires 01/15/09, Strike 2.44 | 15,522,619 | ||||||||||||
| EUR | 45,000,000 | EUR Put/TRY Call, Expires 05/02/08, Strike 2.10 | 7,591,407 | ||||||||||||
| EUR | 45,000,000 | EUR Put/TRY Call, Expires 10/31/08, Strike 2.45 | 15,962,639 | ||||||||||||
| EUR | 23,000,000 | EUR Put/TRY Call, Expires 12/12/08, Strike 2.49 | 8,259,484 | ||||||||||||
| TRY | 44,000,000 | TRY Call/CZK Put, Expires 04/23/08, Strike 13.32 | 540,170 | ||||||||||||
| USD | 70,000,000 | USD Put/BRL Call, Expires 04/30/08, Strike 2.44 | 29,654,823 | ||||||||||||
| USD | 45,000,000 | USD Put/BRL Call, Expires 12/09/08, Strike 2.40 | 15,486,815 | ||||||||||||
| Total Currency Options | 93,017,957 | ||||||||||||||
| Options on Interest Rates — 0.0% | |||||||||||||||
| TWD | 1,849,200,000 | TWD Interest Rate Cap Call Option, Expires 03/16/10, Strike 2.19% | 257,945 | ||||||||||||
| TWD | 1,849,200,000 | TWD Interest Rate Floor Call Option, Expires 03/16/10, Strike 2.19% | 125,024 | ||||||||||||
| Total Options on Interest Rates | 382,969 | ||||||||||||||
See accompanying notes to the financial statements.
17
GMO Emerging Country Debt Fund
(A Series of GMO Trust)
Schedule of Investments — (Continued)
(showing percentage of total net assets)
February 29, 2008
| Principal Amount / Shares | Description | Value ($) | |||||||||||||
| Options on Interest Rate Swaps — 0.4% | |||||||||||||||
| KRW | 72,000,000,000 | KRW Swaption Call, Expires 02/24/09, Strike 6.05% | 3,510,000 | ||||||||||||
| KRW | 50,000,000,000 | KRW Swaption Call, Expires 03/21/11, Strike 5.64% | 1,344,000 | ||||||||||||
| KRW | 72,000,000,000 | KRW Swaption Call, Expires 04/08/09, Strike 6.20% | 3,900,960 | ||||||||||||
| KRW | 90,000,000,000 | KRW Swaption Call, Expires 04/27/09, Strike 5.42% | 2,503,800 | ||||||||||||
| KRW | 72,000,000,000 | KRW Swaption Put, Expires 02/24/09, Strike 6.05% | 50,400 | ||||||||||||
| KRW | 50,000,000,000 | KRW Swaption Put, Expires 03/21/11, Strike 5.64% | 494,500 | ||||||||||||
| KRW | 72,000,000,000 | KRW Swaption Put, Expires 04/08/09, Strike 6.20% | 41,040 | ||||||||||||
| KRW | 90,000,000,000 | KRW Swaption Put, Expires 04/27/09, Strike 5.42% | 663,300 | ||||||||||||
| Total Options on Interest Rate Swaps | 12,508,000 | ||||||||||||||
| TOTAL OPTIONS PURCHASED (COST $42,613,568) | 105,908,926 | ||||||||||||||
| MUTUAL FUNDS — 6.7% | |||||||||||||||
| United States — 6.7% | |||||||||||||||
| Affiliated Issuers | |||||||||||||||
| 5,854,092 | GMO Short-Duration Collateral Fund | 140,673,840 | |||||||||||||
| 21,409 | GMO Special Purpose Holding Fund (c) (g) | 26,976 | |||||||||||||
| 1,933,999 | GMO World Opportunity Overlay Fund | 49,665,090 | |||||||||||||
| Total United States | 190,365,906 | ||||||||||||||
| TOTAL MUTUAL FUNDS (COST $197,475,629) | 190,365,906 | ||||||||||||||
| RIGHTS AND WARRANTS — 0.8% | |||||||||||||||
| Mexico — 0.0% | |||||||||||||||
| 2,942,000 | United Mexican States Value Recovery Rights, Series F, Expires 06/30/08 ** | 40,011 | |||||||||||||
| Nigeria — 0.2% | |||||||||||||||
| 25,000 | Central Bank of Nigeria Warrants, Expires 11/15/20 ** | 5,750,000 | |||||||||||||
| Uruguay — 0.0% | |||||||||||||||
| 4,000,000 | Banco Central Del Uruguay Value Recovery Rights, VRRB, Expires 01/02/21 ** | — | |||||||||||||
See accompanying notes to the financial statements.
18
GMO Emerging Country Debt Fund
(A Series of GMO Trust)
Schedule of Investments — (Continued)
(showing percentage of total net assets)
February 29, 2008
| Shares / Par Value ($) | Description | Value ($) | |||||||||||||
| Venezuela — 0.6% | |||||||||||||||
| 164,215 | Republic of Venezuela Bond Warrants, Expires 04/15/20 ** | 5,952,794 | |||||||||||||
| 262,360 | Republic of Venezuela Recovery Warrants, Expires 04/15/20 ** | 9,510,550 | |||||||||||||
| Total Venezuela | 15,463,344 | ||||||||||||||
| TOTAL RIGHTS AND WARRANTS (COST $0) | 21,253,355 | ||||||||||||||
| SHORT-TERM INVESTMENTS — 2.3% | |||||||||||||||
| Money Market Funds — 1.3% | |||||||||||||||
| 35,996,370 | State Street Institutional Liquid Reserves Fund-Institutional Class | 35,996,370 | |||||||||||||
| Other Short-Term Investments — 1.0% | |||||||||||||||
| 8,500,000 | U.S. Treasury Bill, 1.78%, due 05/01/08 (e) (h) | 8,474,509 | |||||||||||||
| 16,500,000 | U.S. Treasury Bill, 1.78%, due 06/19/08 (d) (e) (h) | 16,411,626 | |||||||||||||
| 5,000,000 | U.S. Treasury Bill, 1.79%, due 07/24/08 (e) (h) | 4,964,645 | |||||||||||||
| 29,850,780 | |||||||||||||||
| TOTAL SHORT-TERM INVESTMENTS (COST $65,751,163) | 65,847,150 | ||||||||||||||
| TOTAL INVESTMENTS — 119.9% (Cost $3,279,672,928) | 3,416,660,071 | ||||||||||||||
| Other Assets and Liabilities (net) — (19.9%) | (567,557,850 | ) | |||||||||||||
| TOTAL NET ASSETS — 100.0% | $ | 2,849,102,221 | |||||||||||||
See accompanying notes to the financial statements.
19
GMO Emerging Country Debt Fund
(A Series of GMO Trust)
Schedule of Investments — (Continued)
February 29, 2008
A summary of outstanding financial instruments at February 29, 2008 is as follows:
Forward Currency Contracts
| Settlement Date | Deliver/Receive | Units of Currency | Value | Net Unrealized Appreciation (Depreciation) | |||||||||||||||
| Sales | |||||||||||||||||||
| 4/01/08 | CHF | 100,000,000 | $ | 96,035,689 | $ | (4,005,503 | ) | ||||||||||||
| 4/15/08 | EUR | 78,400,000 | 118,866,966 | (5,442,466 | ) | ||||||||||||||
| 3/25/08 | GBP | 35,000,000 | 69,451,200 | (648,200 | ) | ||||||||||||||
| 4/22/08 | JPY | 11,000,000,000 | 106,192,562 | (3,943,073 | ) | ||||||||||||||
| $ | 390,546,417 | $ | (14,039,242 | ) | |||||||||||||||
Forward Cross Currency Contracts
| Settlement Date | Deliver/Units of Currency | Receive/In Exchange For | Net Unrealized Appreciation (Depreciation) | ||||||||||||
| 4/14/08 | TRY | 26,305,500 | EUR | 15,000,000 | $ | 1,494,591 | |||||||||
Reverse Repurchase Agreements
| Face Value | Description | Market Value | |||||||||
| USD | 19,326,389 | Deutsche Bank, 3.15%, dated 06/15/07, to be repurchased on demand at face value plus accrued interest. | $ | (19,843,826 | ) | ||||||
| EUR | 18,440,864 | J.P. Morgan Chase Bank, 4.15%, dated 10/12/07, to be repurchased on demand at face value plus accrued interest. | (20,100,623 | ) | |||||||
| USD | 10,702,274 | Deutsche Bank, 3.15%, dated 10/18/07, to be repurchased on demand at face value plus accrued interest. | (10,868,769 | ) | |||||||
| USD | 25,388,889 | Deutsche Bank, 3.30%, dated 01/10/08, to be repurchased on demand at face value plus accrued interest. | (25,518,654 | ) | |||||||
| USD | 46,414,500 | Deutsche Bank, 4.90%, dated 01/14/08, to be repurchased on demand at face value plus accrued interest. | (46,622,463 | ) | |||||||
| USD | 24,920,000 | Deutsche Bank, 3.30%, dated 01/31/08, to be repurchased on demand at face value plus accrued interest. | (24,986,246 | ) | |||||||
See accompanying notes to the financial statements.
20
GMO Emerging Country Debt Fund
(A Series of GMO Trust)
Schedule of Investments — (Continued)
February 29, 2008
Reverse Repurchase Agreements — (Continued)
| Face Value | Description | Market Value | |||||||||
| USD | 69,807,375 | J.P. Morgan Chase Bank, 3.45%, dated 01/31/08, to be repurchased on demand at face value plus accrued interest. | $ | (70,001,381 | ) | ||||||
| USD | 19,819,000 | J.P. Morgan Chase Bank, 3.20%, dated 01/31/08, to be repurchased on demand at face value plus accrued interest. | (19,870,089 | ) | |||||||
| USD | 7,045,995 | J.P. Morgan Chase Bank, 3.65%, dated 01/31/08, to be repurchased on demand at face value plus accrued interest. | (7,066,712 | ) | |||||||
| USD | 28,283,371 | J.P. Morgan Chase Bank, 3.74%, dated 02/06/08, to be repurchased on demand at face value plus accrued interest. | (28,347,997 | ) | |||||||
| USD | 43,304,375 | Deutsche Bank, 3.30%, dated 02/11/08, to be repurchased on demand at face value plus accrued interest. | (43,375,827 | ) | |||||||
| USD | 9,681,044 | Lehman Brothers, 3.50%, dated 02/11/08, to be repurchased on demand at face value plus accrued interest. | (9,696,104 | ) | |||||||
| USD | 20,081,944 | Lehman Brothers, 3.60%, dated 02/11/08, to be repurchased on demand at face value plus accrued interest. | (20,114,076 | ) | |||||||
| USD | 14,164,583 | Deutsche Bank, 3.30%, dated 02/13/08, to be repurchased on demand at face value plus accrued interest. | (14,184,060 | ) | |||||||
| USD | 111,424,505 | Lehman Brothers, 3.50%, dated 02/13/08, to be repurchased on demand at face value plus accrued interest. | (111,532,834 | ) | |||||||
| USD | 14,650,076 | Lehman Brothers, 3.50%, dated 02/14/08, to be repurchased on demand at face value plus accrued interest. | (14,662,895 | ) | |||||||
| USD | 2,044,375 | Lehman Brothers, 3.35%, dated 02/14/08, to be repurchased on demand at face value plus accrued interest. | (2,046,087 | ) | |||||||
| USD | 17,288,542 | Deutsche Bank, 3.25%, dated 02/15/08, to be repurchased on demand at face value plus accrued interest. | (17,305,710 | ) | |||||||
See accompanying notes to the financial statements.
21
GMO Emerging Country Debt Fund
(A Series of GMO Trust)
Schedule of Investments — (Continued)
February 29, 2008
Reverse Repurchase Agreements — (Continued)
| Face Value | Description | Market Value | |||||||||
| USD | 11,923,750 | Deutsche Bank, 3.30%, dated 02/20/08, to be repurchased on demand at face value plus accrued interest. | $ | (11,933,587 | ) | ||||||
| USD | 24,697,465 | J.P. Morgan Chase Bank, 3.40%, dated 02/26/08, to be repurchased on demand at face value plus accrued interest. | (24,702,130 | ) | |||||||
| USD | 24,148,438 | Deutsche Bank, 3.10%, dated 02/27/08, to be repurchased on demand at face value plus accrued interest. | (24,150,517 | ) | |||||||
| $ | (566,930,587 | ) | |||||||||
| Average balance outstanding | $ | (449,808,013 | ) | ||||
| Average interest rate | 4.87 | % | |||||
| Maximum balance outstanding | $ | (646,459,210 | ) | ||||
| Average shares outstanding | 275,618,010 | ||||||
| Average balance per share outstanding | $ | (1.63 | ) | ||||
| Days outstanding | 366 | ||||||
Average balance outstanding was calculated based on daily balances outstanding during the period that the Fund had entered into reverse repurchase agreements.
Written Options
A summary of open written option contracts for the Fund at February 29, 2008 is as follows:
Currency Options
| Principal Amount | Expiration Date | Description | Premiums | Market Value | |||||||||||||||
| $ | 45,000,000 | 12/09/2008 | BRL Call/USD USDPut Currency Option, Strike 2.14 | $ | (590,625 | ) | $ | (9,093,413 | ) | ||||||||||
| 70,000,000 | 04/30/2008 | BRL Call/USD USDPut Currency Option, Strike 2.07 | (1,470,000 | ) | (14,339,495 | ) | |||||||||||||
| $ | (2,060,625 | ) | $ | (23,432,908 | ) | ||||||||||||||
See accompanying notes to the financial statements.
22
GMO Emerging Country Debt Fund
(A Series of GMO Trust)
Schedule of Investments — (Continued)
February 29, 2008
Swap Agreements
Credit Default Swaps
| Notional Amount | Expiration Date | Counterparty | Receive (Pay) | Annual Premium | Deliverable On Default | Market Value | |||||||||||||||||||||||||
| 6,500,000 | USD | 3/20/2008 | JP Morgan | (Pay) | 0.44 | % | Petroleos Mexicanos | ||||||||||||||||||||||||
| Chase Bank | $ | (12,955 | ) | ||||||||||||||||||||||||||||
| 100,000,000 | USD | 4/20/2008 | JP Morgan Chase Bank | (Pay) | 0.32 | % | United Mexican States | (116,931) | |||||||||||||||||||||||
| 50,000,000 | USD | 5/4/2008 | Deutsche Bank AG | (Pay) | 1.80 | % | Government of Ukraine | (327,298 | ) | ||||||||||||||||||||||
| 5,000,000 | USD | 5/30/2008 | JP Morgan Chase Bank | Receive | 8.65 | % | Republic of Turkey | 206,473 | |||||||||||||||||||||||
| 2,000,000 | USD | 9/20/2008 | UBS AG | Receive | 9.20 | % | Dominican Republic | 171,514 | |||||||||||||||||||||||
| 10,000,000 | USD | 9/20/2008 | Morgan Stanley | Receive | 5.15 | % | Republic of Colombia | 484,718 | |||||||||||||||||||||||
| 18,000,000 | USD | 11/20/2008 | Deutsche Bank AG | Receive | 1.50 | % | Credit of Uttam Galva Steels Limited | 61,586 | |||||||||||||||||||||||
| 500,000,000 | RUB | 11/20/2008 | JP Morgan Chase Bank | Receive | 0.75 | % | Red Square CDO | (66,722) | |||||||||||||||||||||||
| 9,000,000 | USD | 11/20/2008 | Deutsche Bank AG | Receive | 4.77 | % | Republic of Colombia | 390,588 | |||||||||||||||||||||||
| 14,000,000 | USD | 12/20/2008 | Deutsche Bank AG | (Pay) | 0.79 | % | Korean Deposit Insurance Corporation | (42,848 | ) | ||||||||||||||||||||||
| 5,000,000 | USD | 3/20/2009 | JP Morgan Chase Bank | Receive | 2.85 | % | Republic of Peru | 182,541 | |||||||||||||||||||||||
| 10,000,000 | USD | 3/20/2009 | JP Morgan Chase Bank | Receive | 4.30 | % | Republic of Philippines | 423,939 | |||||||||||||||||||||||
| 10,000,000 | USD | 4/17/2009 | Deutsche Bank AG | Receive | 3.90 | % | Gazprom Loan Facility | 375,619 | |||||||||||||||||||||||
| 10,000,000 | USD | 4/17/2009 | Lehman Brothers | (Pay) | 3.90 | % | Gazprom OAO | (375,619 | ) | ||||||||||||||||||||||
| 20,000,000 | USD | 4/20/2009 | JP Morgan Chase Bank | (Pay) | 0.43 | % | Republic of Brazil | (8,991 | ) | ||||||||||||||||||||||
| 8,617,782 | USD | 6/6/2009 | Deutsche Bank AG | Receive | 1.85 | % | Deutsche Bank Loan to Ukrnafta | (41,604 | ) | ||||||||||||||||||||||
| 7,000,000 | USD | 8/5/2009 | Deutsche Bank AG | Receive | 4.85 | % | Government of Ukraine | 315,727 | |||||||||||||||||||||||
| 10,000,000 | USD | 9/20/2009 | JP Morgan Chase Bank | (Pay) | 0.97 | % | Gazprom OAO | 114,375 | |||||||||||||||||||||||
| 100,000,000 | CHF | 9/20/2009 | Morgan Stanley | (Pay) | 0.78 | % | Government of Ukraine | 1,166,553 | |||||||||||||||||||||||
| 849,572,575 | RUB | 11/5/2009 | Deutsche Bank AG | Receive | 1.45 | % | Russia Post Office | (690,029 | ) | ||||||||||||||||||||||
| 10,000,000 | USD | 11/20/2009 | JP Morgan Chase Bank | (Pay) | 0.90 | % | United Mexican States | (88,980 | ) | ||||||||||||||||||||||
See accompanying notes to the financial statements.
23
GMO Emerging Country Debt Fund
(A Series of GMO Trust)
Schedule of Investments — (Continued)
February 29, 2008
Credit Default Swaps — continued
| Notional Amount | Expiration Date | Counterparty | Receive (Pay) | Annual Premium | Deliverable On Default | Market Value | |||||||||||||||||||||||||
| 10,000,000 | USD | 11/20/2009 | JP Morgan | (Pay) | 0.88 | % | United Mexican States | ||||||||||||||||||||||||
| Chase Bank | $ | (85,038 | ) | ||||||||||||||||||||||||||||
| 25,000,000 | USD | 12/29/2009 | Deutsche Bank AG | Receive | 2.25 | % | Videocon Loan Facility | 189,291 | |||||||||||||||||||||||
| 7,000,000 | USD | 2/5/2010 | Deutsche Bank AG | Receive | 4.85 | % | Government of Ukraine | 394,236 | |||||||||||||||||||||||
| 12,000,000 | USD | 3/5/2010 | Deutsche Bank AG | Receive | 9.10 | % | Republic of Turkey | 2,335,884 | |||||||||||||||||||||||
| 18,000,000 | USD | 3/20/2010 | Morgan Stanley | Receive | 0.75 | % | United Mexican States | 118,525 | |||||||||||||||||||||||
| 3,000,000 | USD | 3/29/2010 | JP Morgan Chase Bank | Receive | 4.70 | % | Arab Republic of Egypt | 245,112 | |||||||||||||||||||||||
| 85,000,000 | USD | 6/20/2010 | Deutsche Bank AG | (Pay) | 2.10 | % | Reference security within CDX Index | (1,805,542 | ) | ||||||||||||||||||||||
| 36,000,000 | USD | 6/20/2010 | Lehman Brothers | (Pay) | 2.10 | % | Reference security within CDX Index | (764,700 | ) | ||||||||||||||||||||||
| 12,000,000 | USD | 6/20/2010 | JP Morgan Chase Bank | (Pay) | 4.00 | % | Republic of Argentina | (109,008 | ) | ||||||||||||||||||||||
| 12,000,000 | USD | 6/20/2010 | JP Morgan Chase Bank | (Pay) | 3.87 | % | Republic of Argentina | (72,447 | ) | ||||||||||||||||||||||
| 150,000,000 | USD | 6/20/2010 | Deutsche Bank AG | (Pay) | 1.47 | % | Republic of Brazil | (2,405,670 | ) | ||||||||||||||||||||||
| 10,000,000 | USD | 7/20/2010 | Deutsche Bank AG | (Pay) | 3.77 | % | Republic of Argentina | 11,386 | |||||||||||||||||||||||
| 6,000,000 | USD | 7/20/2010 | Deutsche Bank AG | (Pay) | 3.80 | % | Republic of Argentina | 2,654 | |||||||||||||||||||||||
| 140,000,000 | USD | 7/20/2010 | UBS AG | (Pay) | 0.89 | % | Republic of Turkey | 2,194,351 | |||||||||||||||||||||||
| 5,000,000 | USD | 7/23/2010 | Deutsche Bank AG | Receive | 4.56 | % | Government of Ukraine | 294,931 | |||||||||||||||||||||||
| 7,000,000 | USD | 8/5/2010 | Deutsche Bank AG | Receive | 4.90 | % | Government of Ukraine | 461,089 | |||||||||||||||||||||||
| 3,000,000 | USD | 8/25/2010 | Deutsche Bank AG | Receive | 3.40 | % | Deutsche Bank Loan to Ukrtelekom | (69,467) | |||||||||||||||||||||||
| 50,000,000 | USD | 9/20/2010 | JP Morgan Chase Bank | (Pay) | 0.97 | % | Gazprom OAO | 1,351,680 | |||||||||||||||||||||||
| 35,000,000 | USD | 9/20/2010 | JP Morgan Chase Bank | (Pay) | 0.70 | % | Republic of Philippines | 814,436 | |||||||||||||||||||||||
| 20,000,000 | USD | 10/18/2010 | JP Morgan Chase Bank | Receive | 2.00 | % | VTB Leasing | (600,840 | ) | ||||||||||||||||||||||
| 5,000,000 | USD | 10/25/2010 | Deutsche Bank AG | Receive | 4.60 | % | Government of Ukraine | 374,057 | |||||||||||||||||||||||
| 10,000,000 | USD | 12/20/2010 | JP Morgan Chase Bank | (Pay) | 3.57 | % | Republic of Argentina | 104,842 | |||||||||||||||||||||||
| 5,000,000 | USD | 12/20/2010 | JP Morgan Chase Bank | (Pay) | 3.43 | % | Republic of Argentina | 71,682 | |||||||||||||||||||||||
See accompanying notes to the financial statements.
24
GMO Emerging Country Debt Fund
(A Series of GMO Trust)
Schedule of Investments — (Continued)
February 29, 2008
Credit Default Swaps — continued
| Notional Amount | Expiration Date | Counterparty | Receive (Pay) | Annual Premium | Deliverable On Default | Market Value | |||||||||||||||||||||||||
| 5,000,000 | USD | 1/25/2011 | Deutsche Bank AG | Receive | 4.63 | % | Government of Ukraine | $ | 335,401 | ||||||||||||||||||||||
| 7,000,000 | USD | 2/7/2011 | Deutsche Bank AG | Receive | 4.95 | % | Government of Ukraine | 523,831 | |||||||||||||||||||||||
| 5,000,000 | USD | 2/20/2011 | Morgan Stanley | (Pay) | 2.80 | % | Republic of Argentina | 204,036 | |||||||||||||||||||||||
| 3,000,000 | USD | 2/25/2011 | Deutsche Bank AG | Receive | 3.50 | % | Deutsche Bank Loan to Ukrtelekom | (88,131 | ) | ||||||||||||||||||||||
| 8,000,000 | USD | 3/20/2011 | Citigroup | (Pay) | 3.70 | % | Republic of Iraq | 377,900 | |||||||||||||||||||||||
| 8,000,000 | USD | 3/20/2011 | UBS AG | (Pay) | 3.55 | % | Republic of Iraq | 302,614 | |||||||||||||||||||||||
| 5,000,000 | USD | 4/26/2011 | Deutsche Bank AG | Receive | 4.66 | % | Government of Ukraine | 410,130 | |||||||||||||||||||||||
| 10,000,000 | USD | 6/20/2011 | Deutsche Bank AG | (Pay) | 1.89 | % | Islamic Republic of Pakistan | 751,977 | |||||||||||||||||||||||
| 34,000,000 | USD | 6/20/2011 | Deutsche Bank AG | (Pay) | 1.35 | % | Reference security within CDX index | 603,075 | |||||||||||||||||||||||
| 11,000,000 | USD | 6/20/2011 | JP Morgan Chase Bank | (Pay) | 1.35 | % | Reference security within CDX Index | 195,113 | |||||||||||||||||||||||
| 5,000,000 | USD | 6/20/2011 | Lehman Brothers | Receive | 1.35 | % | Reference security within CDX index | (88,688 | ) | ||||||||||||||||||||||
| 20,000,000 | USD | 6/20/2011 | Lehman Brothers | (Pay) | 1.35 | % | Reference security within CDX index | 354,750 | |||||||||||||||||||||||
| 10,000,000 | USD | 6/20/2011 | Lehman Brothers | (Pay) | 1.35 | % | Reference security within CDX index | 177,375 | |||||||||||||||||||||||
| 11,000,000 | USD | 6/20/2011 | Lehman Brothers | (Pay) | 1.35 | % | Reference security within CDX Index | 195,113 | |||||||||||||||||||||||
| 150,000,000 | USD | 6/20/2011 | Deutsche Bank AG | Receive | 1.86 | % | Republic of Brazil | 4,050,486 | |||||||||||||||||||||||
| 9,000,000 | USD | 7/17/2011 | UBS AG | Receive | 5.05 | % | Government of Ukraine | 768,174 | |||||||||||||||||||||||
| 5,000,000 | USD | 7/25/2011 | Deutsche Bank AG | Receive | 4.68 | % | Government of Ukraine | 362,680 | |||||||||||||||||||||||
| 7,000,000 | USD | 8/5/2011 | Deutsche Bank AG | Receive | 5.00 | % | Government of Ukraine | 571,133 | |||||||||||||||||||||||
| 20,000,000 | USD | 8/20/2011 | Deutsche Bank AG | (Pay) | 0.57 | % | United Mexican States | 238,189 | |||||||||||||||||||||||
| 620,000,000 | MXN | 8/20/2011 | Deutsche Bank AG | Receive | 0.40 | % | United Mexican States | (454,320 | ) | ||||||||||||||||||||||
| 3,000,000 | USD | 8/25/2011 | Deutsche Bank AG | Receive | 3.60 | % | Deutsche Bank Loan to Ukrtelekom | (108,042 | ) | ||||||||||||||||||||||
| 7,000,000 | USD | 10/20/2011 | JP Morgan Chase Bank | (Pay) | 2.75 | % | Republic of Argentina | 367,605 | |||||||||||||||||||||||
| 13,500,000 | USD | 10/20/2011 | Lehman Brothers | (Pay) | 5.02 | % | Republic of Ecuador | 73,880 | |||||||||||||||||||||||
| 5,000,000 | USD | 10/25/2011 | Deutsche Bank AG | Receive | 4.70 | % | Government of Ukraine | 433,947 | |||||||||||||||||||||||
| 19,000,000 | USD | 10/30/2011 | Deutsche Bank AG | Receive | 4.00 | % | Naftofaz Ukraine | (1,638,392 | ) | ||||||||||||||||||||||
See accompanying notes to the financial statements.
25
GMO Emerging Country Debt Fund
(A Series of GMO Trust)
Schedule of Investments — (Continued)
February 29, 2008
Credit Default Swaps — continued
| Notional Amount | Expiration Date | Counterparty | Receive (Pay) | Annual Premium | Deliverable On Default | Market Value | |||||||||||||||||||||||||
| 8,000,000 | USD | 11/20/2011 | JP Morgan | (Pay) | 2.16 | % | Republic of Argentina | ||||||||||||||||||||||||
| Chase Bank | $ | 624,329 | |||||||||||||||||||||||||||||
| 5,000,000 | USD | 12/20/2011 | JP Morgan Chase Bank | (Pay) | 0.66 | % | Petroleos Mexicanos | 80,487 | |||||||||||||||||||||||
| 65,000,000 | USD | 12/20/2011 | JP Morgan Chase Bank | (Pay) | 1.40 | % | Reference security within CDX index | 1,491,028 | |||||||||||||||||||||||
| 8,958,390 | USD | 12/20/2011 | Deutsche Bank AG | Receive | 1.60 | % | Stemcor UK Ltd. | 85,747 | |||||||||||||||||||||||
| 19,000,000 | EUR | 1/20/2012 | Deutsche Bank AG | (Pay) | 0.42 | % | Republic of Kazakhstan | 1,916,090 | |||||||||||||||||||||||
| 8,600,000,000 | KZT | 1/20/2012 | Deutsche Bank AG | Receive | 0.32 | % | Republic of Kazakhstan | (3,142,008 | ) | ||||||||||||||||||||||
| 25,000,000 | USD | 2/20/2012 | JP Morgan Chase Bank | (Pay) | 0.96 | % | Republic of Brazil | 272,352 | |||||||||||||||||||||||
| 3,000,000 | USD | 2/25/2012 | Deutsche Bank AG | Receive | 3.68 | % | Deutsche Bank Loan to Ukrtelekom | (127,547 | ) | ||||||||||||||||||||||
| 19,000,000 | USD | 5/5/2012 | Deutsche Bank AG | Receive | 4.00 | % | Naftofaz Ukraine | (1,805,887 | ) | ||||||||||||||||||||||
| 120,000,000 | USD | 6/20/2012 | Lehman Brothers | (Pay) | 1.25 | % | Reference security within CDX index | 4,624,167 | |||||||||||||||||||||||
| 50,000,000 | USD | 6/20/2012 | Morgan Stanley | (Pay) | 1.25 | % | Reference security within CDX index | 1,926,736 | |||||||||||||||||||||||
| 10,000,000 | USD | 6/20/2012 | Morgan Stanley | Receive | 2.10 | % | Republic of Panama | 240,617 | |||||||||||||||||||||||
| 5,000,000 | USD | 7/30/2012 | JP Morgan Chase Bank | Receive | 3.05 | % | Republic of Chile | 541,067 | |||||||||||||||||||||||
| 5,000,000 | USD | 8/20/2012 | Bear Stearns | Receive | 3.50 | % | Republic of Jamaica | (250,917 | ) | ||||||||||||||||||||||
| 3,000,000 | USD | 8/28/2012 | Deutsche Bank AG | Receive | 3.75 | % | Deutsche Bank Loan to Ukrtelekom | (145,315 | ) | ||||||||||||||||||||||
| 10,000,000 | USD | 9/20/2012 | JP Morgan Chase Bank | (Pay) | 1.25 | % | Gazprom OAO | 475,313 | |||||||||||||||||||||||
| 15,000,000 | USD | 9/20/2012 | JP Morgan Chase Bank | (Pay) | 1.15 | % | Republic of Peru | 89,924 | |||||||||||||||||||||||
| 85,000,000 | PEN | 9/20/2012 | JP Morgan Chase Bank | Receive | 0.92 | % | Republic of Peru | (53,786 | ) | ||||||||||||||||||||||
| 10,000,000 | USD | 10/4/2012 | JP Morgan Chase Bank | Receive | 2.95 | % | Republic of Chile | 1,167,176 | |||||||||||||||||||||||
| 4,000,000 | USD | 10/20/2012 | UBS AG | (Pay) | 4.13 | % | Petroleos de Venezuela | 257,270 | |||||||||||||||||||||||
| 4,000,000 | USD | 10/20/2012 | UBS AG | (Pay) | 3.90 | % | Petroleos de Venezuela | 294,829 | |||||||||||||||||||||||
See accompanying notes to the financial statements.
26
GMO Emerging Country Debt Fund
(A Series of GMO Trust)
Schedule of Investments — (Continued)
February 29, 2008
Credit Default Swaps — continued
| Notional Amount | Expiration Date | Counterparty | Receive (Pay) | Annual Premium | Deliverable On Default | Market Value | |||||||||||||||||||||||||
| 75,000,000 | USD | 10/20/2012 | JPMorgan | Receive | 0.79 | % | Republic of Brazil | ||||||||||||||||||||||||
| Chase Bank | $ | (1,762,688 | ) | ||||||||||||||||||||||||||||
| 15,000,000 | USD | 10/20/2012 | JP Morgan Chase Bank | Receive | 0.80 | % | Republic of Brazil | (348,374 | ) | ||||||||||||||||||||||
| 20,000,000 | USD | 10/20/2012 | JP Morgan Chase Bank | Receive | 0.80 | % | Republic of Brazil | (467,154 | ) | ||||||||||||||||||||||
| 5,000,000 | USD | 11/5/2012 | Deutsche Bank AG | Receive | 6.50 | % | Republic of Jamaica | 403,256 | |||||||||||||||||||||||
| 50,000,000 | USD | 12/20/2012 | JP Morgan Chase Bank | (Pay) | 1.75 | % | Reference security within CDX Index | 1,377,431 | |||||||||||||||||||||||
| 15,000,000 | USD | 12/20/2012 | Lehman Brothers | (Pay) | 1.75 | % | Reference security within CDX Index | 413,229 | |||||||||||||||||||||||
| 42,000,000 | USD | 12/20/2012 | Morgan Stanley | (Pay) | 1.20 | % | Reference security within CDX Index | (123,460 | ) | ||||||||||||||||||||||
| 210,000,000 | USD | 12/20/2012 | Morgan Stanley | Receive | 0.71 | % | Reference security within CDX Index | 85,022 | |||||||||||||||||||||||
| 10,000,000 | USD | 1/8/2013 | Deutsche Bank AG | Receive | 7.15 | % | Republic of Colombia | 2,391,019 | |||||||||||||||||||||||
| 10,000,000 | USD | 1/9/2013 | Deutsche Bank AG | Receive | 8.25 | % | Republic of Turkey | 2,608,087 | |||||||||||||||||||||||
| 7,000,000 | USD | 1/10/2013 | JP Morgan Chase Bank | Receive | 7.50 | % | Republic of Colombia | 1,782,297 | |||||||||||||||||||||||
| 10,000,000 | USD | 2/7/2013 | JP Morgan Chase Bank | Receive | 8.30 | % | Republic of Colombia | 2,870,283 | |||||||||||||||||||||||
| 10,000,000 | USD | 3/20/2013 | Lehman Brothers | (Pay) | 2.52 | % | Gazprom OAO | 49,176 | |||||||||||||||||||||||
| 10,000,000 | USD | 3/20/2013 | Lehman Brothers | Receive | 2.50 | % | Transneft OAO | 404 | |||||||||||||||||||||||
| 285,759,883 | RUB | 6/21/2013 | Deutsche Bank AG | Receive | 2.35 | % | VTB Leasing | (376,749 | ) | ||||||||||||||||||||||
| 9,189,672 | EUR | 6/24/2013 | JP Morgan Chase Bank | Receive | 1.37 | % | VTB Leasing | (1,119,042 | ) | ||||||||||||||||||||||
| 12,466,708 | EUR | 6/24/2013 | JP Morgan Chase Bank | Receive | 1.37 | % | VTB Leasing | (1,518,093 | ) | ||||||||||||||||||||||
| 130,000,000 | USD | 10/20/2013 | Deutsche Bank AG | Receive | 3.30 | % | Republic of Brazil | 12,417,711 | |||||||||||||||||||||||
| 80,000,000 | USD | 10/20/2013 | Deutsche Bank AG | Receive | 4.05 | % | Republic of Brazil | 10,770,307 | |||||||||||||||||||||||
| 13,500,000,000 | JPY | 10/20/2013 | Deutsche Bank AG | (Pay) | 3.20 | % | Republic of Brazil | (12,222,481 | ) | ||||||||||||||||||||||
| 8,100,000,000 | JPY | 10/20/2013 | Deutsche Bank AG | (Pay) | 3.95 | % | Republic of Brazil | (10,333,573 | ) | ||||||||||||||||||||||
| 10,000,000 | USD | 12/20/2013 | Deutsche Bank AG | Receive | 10.50 | % | Republic of Ecuador | 1,957,854 | |||||||||||||||||||||||
| 10,000,000 | USD | 12/24/2013 | JP Morgan Chase Bank | Receive | 3.80 | % | Republic of Turkey | 621,755 | |||||||||||||||||||||||
See accompanying notes to the financial statements.
27
GMO Emerging Country Debt Fund
(A Series of GMO Trust)
Schedule of Investments — (Continued)
February 29, 2008
Credit Default Swaps — continued
| Notional Amount | Expiration Date | Counterparty | Receive (Pay) | Annual Premium | Deliverable On Default | Market Value | |||||||||||||||||||||||||
| 10,000,000 | USD | 1/20/2014 | Citigroup | Receive | 4.94 | % | Republic of Colombia | $ | 1,537,721 | ||||||||||||||||||||||
| 5,000,000 | USD | 3/20/2014 | JP Morgan Chase Bank | Receive | 4.90 | % | Republic of Colombia | 854,948 | |||||||||||||||||||||||
| 10,000,000 | USD | 5/14/2014 | Deutsche Bank AG | Receive | 6.64 | % | Republic of Turkey | 2,219,962 | |||||||||||||||||||||||
| 5,000,000 | USD | 5/19/2014 | Deutsche Bank AG | Receive | 6.42 | % | Republic of Turkey | 1,045,690 | |||||||||||||||||||||||
| 7,000,000 | USD | 5/20/2014 | JP Morgan Chase Bank | Receive | 6.25 | % | Republic of Turkey | 1,397,335 | |||||||||||||||||||||||
| 10,000,000 | USD | 6/16/2014 | Deutsche Bank AG | Receive | 6.22 | % | Republic of Turkey | 1,941,765 | |||||||||||||||||||||||
| 2,000,000 | USD | 8/24/2014 | Deutsche Bank AG | (Pay) | 4.25 | % | Lebanese Republic | 189,966 | |||||||||||||||||||||||
| 600,000,000 | EUR | 3/20/2015 | Deutsche Bank AG | (Pay) | 3.72 | % | Bolivarian Republic of Venezuela | 74,272,140 | |||||||||||||||||||||||
| 800,000,000 | USD | 3/20/2015 | Deutsche Bank AG | Receive | 3.80 | % | Bolivarian Republic of Venezuela | (66,224,253 | ) | ||||||||||||||||||||||
| 412,500,000 | USD | 4/20/2015 | Deutsche Bank AG | Receive | 4.40 | % | Bolivarian Republic of Venezuela | (23,500,096 | ) | ||||||||||||||||||||||
| 300,000,000 | EUR | 4/20/2015 | Deutsche Bank AG | (Pay) | 4.32 | % | Bolivarian Republic of Venezuela | 25,550,817 | |||||||||||||||||||||||
| 10,000,000 | USD | 4/20/2015 | JP Morgan Chase Bank | Receive | 4.65 | % | Republic of Colombia | 1,654,291 | |||||||||||||||||||||||
| 15,000,000 | USD | 5/20/2015 | Deutsche Bank AG | Receive | 3.85 | % | Republic of Turkey | 962,777 | |||||||||||||||||||||||
| 56,950,000,000 | COP | 11/20/2015 | Citigroup | Receive | 1.81 | % | Republic of Colombia | 681,367 | |||||||||||||||||||||||
| 15,000,000 | USD | 2/20/2016 | Citigroup | (Pay) | 2.16 | % | Republic of Colombia | 54,574 | |||||||||||||||||||||||
| 56,700,000,000 | COP | 2/20/2016 | Citigroup | Receive | 1.46 | % | Republic of Colombia | (4,010 | ) | ||||||||||||||||||||||
| 25,000,000 | USD | 4/20/2016 | Citigroup | (Pay) | 1.90 | % | Republic of Colombia | 383,880 | |||||||||||||||||||||||
| 114,800,000,000 | COP | 4/20/2016 | Citigroup | Receive | 1.33 | % | Republic of Colombia | (166,584 | ) | ||||||||||||||||||||||
| 22,000,000 | USD | 8/20/2016 | JP Morgan Chase Bank | Receive | 1.99 | % | Republic of Brazil | 301,569 | |||||||||||||||||||||||
| 40,000,000 | USD | 8/20/2016 | Lehman Brothers | Receive | 1.98 | % | Republic of Brazil | 534,619 | |||||||||||||||||||||||
| 20,000,000 | USD | 8/20/2016 | Citigroup | (Pay) | 2.15 | % | Republic of Colombia | 155,805 | |||||||||||||||||||||||
| 97,680,000,000 | COP | 8/20/2016 | Citigroup | Receive | 1.51 | % | Republic of Colombia | 55,072 | |||||||||||||||||||||||
| 20,000,000 | USD | 8/20/2016 | Deutsche Bank AG | (Pay) | 0.87 | % | United Mexican States | 636,104 | |||||||||||||||||||||||
| 620,000,000 | MXN | 8/20/2016 | Deutsche Bank AG | Receive | 0.61 | % | United Mexican States | (1,306,072 | ) | ||||||||||||||||||||||
| 87,500,000 | USD | 2/20/2017 | Deutsche Bank AG | Receive | 2.43 | % | Bolivarian Republic of Venezuela | (16,704,698 | ) | ||||||||||||||||||||||
See accompanying notes to the financial statements.
28
GMO Emerging Country Debt Fund
(A Series of GMO Trust)
Schedule of Investments — (Continued)
February 29, 2008
Credit Default Swaps — continued
| Notional Amount | Expiration Date | Counterparty | Receive (Pay) | Annual Premium | Deliverable On Default | Market Value | |||||||||||||||||||||||||
| 350,000,000 | USD | 2/20/2017 | Deutsche Bank AG | (Pay) | 7.66 | % | Bolivarian Republic | ||||||||||||||||||||||||
| of Venezuela | $ | 336,662 | |||||||||||||||||||||||||||||
| 50,000,000 | USD | 3/20/2017 | Lehman Brothers | Receive | 1.41 | % | Republic of Brazil | (1,168,885 | ) | ||||||||||||||||||||||
| 2,500,000 | USD | 5/20/2017 | Deutsche Bank AG | (Pay) | 1.05 | % | Republic of Peru | 134,441 | |||||||||||||||||||||||
| 32,000,000 | PEN | 5/20/2017 | Deutsche Bank AG | Receive | 0.79 | % | Republic of Peru | (427,700 | ) | ||||||||||||||||||||||
| 70,000,000 | USD | 7/20/2017 | Lehman Brothers | Receive | 3.15 | % | Bolivarian Republic of Venezuela | (12,134,194 | ) | ||||||||||||||||||||||
| 4,500,000 | USD | 7/20/2017 | Bear Stearns | Receive | 3.30 | % | Republic of Jamaica | (480,278 | ) | ||||||||||||||||||||||
| 15,000,000 | USD | 7/20/2017 | Lehman Brothers | Receive | 1.04 | % | Republic of Panama | (1,152,868 | ) | ||||||||||||||||||||||
| 70,000,000 | USD | 7/20/2017 | Lehman Brothers | Receive | 2.20 | % | Republic of Turkey | (4,484,027 | ) | ||||||||||||||||||||||
| 35,000,000 | USD | 7/20/2017 | Lehman Brothers | Receive | 2.26 | % | Republic of Turkey | (2,094,034 | ) | ||||||||||||||||||||||
| 35,000,000 | USD | 7/20/2017 | UBS AG | Receive | 2.26 | % | Republic of Turkey | (2,094,034 | ) | ||||||||||||||||||||||
| 8,000,000 | USD | 8/20/2017 | JP Morgan Chase Bank | Receive | 2.20 | % | Republic of Colombia | (90,657 | ) | ||||||||||||||||||||||
| 17,000,000 | USD | 9/20/2017 | JP Morgan Chase Bank | Receive | 1.74 | % | Republic of Philippines | (1,240,230 | ) | ||||||||||||||||||||||
| 30,000,000 | USD | 9/20/2017 | JP Morgan Chase Bank | Receive | 1.77 | % | Republic of Philippines | (2,134,055 | ) | ||||||||||||||||||||||
| 21,000,000 | USD | 10/20/2017 | Deutsche Bank AG | Receive | 1.78 | % | Vneshtorg Bank Bond & Loan | (2,106,455 | ) | ||||||||||||||||||||||
| 4,000,000 | USD | 11/20/2017 | JP Morgan Chase Bank | Receive | 4.85 | % | Bolivarian Republic of Venezuela | (264,753 | ) | ||||||||||||||||||||||
| 4,000,000 | USD | 11/20/2017 | JP Morgan Chase Bank | Receive | 4.90 | % | Bolivarian Republic of Venezuela | (252,802 | ) | ||||||||||||||||||||||
| 200,000,000 | USD | 11/20/2017 | Lehman Brothers | Receive | 0.62 | % | United Mexican States | (11,333,880 | ) | ||||||||||||||||||||||
| 25,000,000 | USD | 1/20/2018 | Deutsche Bank AG | Receive | 1.50 | % | Republic of Brazil | (648,541 | ) | ||||||||||||||||||||||
| 30,000,000 | USD | 8/15/2031 | Goldman Sachs | (Pay) | 1.84 | % | United Mexican States | (1,127,951 | ) | ||||||||||||||||||||||
| 20,000,000 | USD | 8/15/2031 | Goldman Sachs | (Pay) | 1.89 | % | United Mexican States | (874,501 | ) | ||||||||||||||||||||||
| Premiums to (Pay) Receive | $ | (525,211 | ) | $ | (4,983,228 | ) | |||||||||||||||||||||||||
See accompanying notes to the financial statements.
29
GMO Emerging Country Debt Fund
(A Series of GMO Trust)
Schedule of Investments — (Continued)
February 29, 2008
Interest Rate Swaps
| Notional Amount | Expiration Date | Counterparty | Receive (Pay) | Fixed Rate | Variable Rate | Market Value | |||||||||||||||||||||||||
| 3,400,000,000 | MXN | 10/24/2008 | JP Morgan | Receive | 7.95 | % | 28-day TIIE | ||||||||||||||||||||||||
| Chase Bank | $ | 672,721 | |||||||||||||||||||||||||||||
| 963,499 | USD | 12/1/2008 | Citigroup | (Pay) | 7.10 | % | 6 month LIBOR | (21,901 | ) | ||||||||||||||||||||||
| 20,000,000 | USD | 1/4/2010 | JP Morgan Chase Bank | (Pay) | 5.11 | % | 6 month LIBOR | (815,027 | ) | ||||||||||||||||||||||
| 20,000,000 | USD | 1/4/2010 | JP Morgan Chase Bank | Receive | 5.62 | % | Floating USD rate | 1,198,735 | |||||||||||||||||||||||
| 230,000,000 | PEN | 2/19/2010 | JP Morgan Chase Bank | (Pay) | 3.15 | % | 6 month LIBOR | (881,183 | ) | ||||||||||||||||||||||
| 90,000,000,000 | KRW | 5/29/2010 | Merrill Lynch | (Pay) | 4.79 | % | 3 month KRW LIBOR | (21,158 | ) | ||||||||||||||||||||||
| 900,000,000 | TWD | 5/23/2011 | JP Morgan Chase Bank | (Pay) | 2.49 | % | 90 Day TWD-BA-TELERATE | (90,736 | ) | ||||||||||||||||||||||
| 2,500,000,000 | TWD | 6/12/2011 | JP Morgan Chase Bank | (Pay) | 2.35 | % | 90 Day TWD-BA-TELERATE | 107,815 | |||||||||||||||||||||||
| 3,000,000,000 | TWD | 7/5/2011 | JP Morgan Chase Bank | (Pay) | 2.32 | % | 90 Day TWD-BA-TELERATE | 238,222 | |||||||||||||||||||||||
| 2,500,000,000 | TWD | 8/1/2011 | JP Morgan Chase Bank | (Pay) | 2.29 | % | 90 Day TWD-BA-TELERATE | 297,928 | |||||||||||||||||||||||
| 4,500,000,000 | TWD | 9/26/2011 | JP Morgan Chase Bank | (Pay) | 2.09 | % | 90 Day TWD-BA-TELERATE | 1,618,171 | |||||||||||||||||||||||
| 2,947,173 | USD | 12/1/2011 | Citigroup | (Pay) | 6.32 | % | 6 month LIBOR | (338,849 | ) | ||||||||||||||||||||||
| 36,000,000,000 | KRW | 3/16/2014 | Deutsche Bank AG | (Pay) | 4.80 | % | Korean bond rate for 91 day certificates of deposit | (126,553 | ) | ||||||||||||||||||||||
| 36,000,000,000 | KRW | 3/16/2014 | Deutsche Bank AG | (Pay) | 5.03 | % | Korean bond rate for 91 day certificates of deposit | 243,936 | |||||||||||||||||||||||
| 230,000,000 | PEN | 2/19/2015 | JP Morgan Chase Bank | Receive | 5.70 | % | 6 month LIBOR | 743,446 | |||||||||||||||||||||||
| 1,400,000,000 | TWD | 11/24/2016 | JP Morgan Chase Bank | (Pay) | 2.15 | % | 90 Day TWD-BA-TELERATE | 2,116,187 | |||||||||||||||||||||||
| 87,500,000 | USD | 2/14/2017 | Deutsche Bank AG | Receive | 5.31 | % | 3 month LIBOR | 8,152,361 | |||||||||||||||||||||||
| 20,000,000 | SGD | 10/25/2017 | JP Morgan Chase Bank | (Pay) | 3.20 | % | 6 month SOR | 18,011 | |||||||||||||||||||||||
See accompanying notes to the financial statements.
30
GMO Emerging Country Debt Fund
(A Series of GMO Trust)
Schedule of Investments — (Continued)
February 29, 2008
Interest Rate Swaps — continued
| Notional Amount | Expiration Date | Counterparty | Receive (Pay) | Fixed Rate | Variable Rate | Market Value | |||||||||||||||||||||||||
| 20,000,000 | SGD | 10/30/2017 | JP Morgan | (Pay) | 3.20 | % | 6 month SOR | ||||||||||||||||||||||||
| Chase Bank | $ | 7,250 | |||||||||||||||||||||||||||||
| 40,000,000 | SGD | 1/17/2018 | JPMorgan Chase Bank | (Pay) | 3.00 | % | 6 month SOR | 484,887 | |||||||||||||||||||||||
| 25,000,000 | USD | 12/2/2023 | JP Morgan Chase Bank | Receive | 5.34 | % | 3 month LIBOR | 1,984,971 | |||||||||||||||||||||||
| 70,000,000 | EUR | 9/4/2026 | JP Morgan Chase Bank | (Pay) | 4.28 | % | 6 month EUR LIBOR | 4,568,894 | |||||||||||||||||||||||
| 100,000,000 | USD | 7/20/2027 | JP Morgan Chase Bank | Receive | 5.87 | % | 3 month LIBOR | 14,342,275 | |||||||||||||||||||||||
| Premiums to (Pay) Receive | $ | (5,382,619 | ) | $ | 34,500,403 | ||||||||||||||||||||||||||
Total Return Swaps
| Notional Amount | Expiration Date | Counterparty | Pay | Receive | Market Value | ||||||||||||||||||||||
| 60,000,000 | USD | 1/7/2009 | JP Morgan | 3 month | EMBI + Total Return | $ | (446,433 | ) | |||||||||||||||||||
| Chase Bank | LIBOR - 0.45% | ||||||||||||||||||||||||||
| 27,967,218 | USD | 12/19/2011 | JP Morgan Chase Bank | CER Index + 3.59% | 3 month LIBOR | (1,641,186 | ) | ||||||||||||||||||||
| 45,335,905 | USD | 12/19/2011 | JP Morgan Chase Bank | CER Index + 1.24% | 3 month LIBOR | 378,216 | |||||||||||||||||||||
| 27,967,218 | USD | 12/19/2011 | JPMorgan Chase Bank | 3 month LIBOR + 0.35% | Return on Prestamos Garatizados | (119,552 | ) | ||||||||||||||||||||
| 45,797,706 | USD | 12/19/2011 | JP Morgan Chase Bank | 3 month LIBOR + 0.35% | Return on Prestamos Garatizados | (4,896,729 | ) | ||||||||||||||||||||
| 300,000,000 | RUB | 3/26/2017 | Morgan Stanley | 6 month LIBOR + 0.25% | Return on Sukhoi | 915,056 | |||||||||||||||||||||
| Premiums to (Pay) Receive | $ | (1,780,589 | ) | $ | (5,810,628 | ) | |||||||||||||||||||||
See accompanying notes to the financial statements.
31
GMO Emerging Country Debt Fund
(A Series of GMO Trust)
Schedule of Investments — (Continued)
February 29, 2008
Variance Swaps
| Notional Amount | Expiration Date | Counterparty | Pay | Receive | Market Value | ||||||||||||||||||||||
| 210,000 | USD | 11/13/2008 | JP Morgan | Per Vega on | Per Vega on | ||||||||||||||||||||||
| Chase Bank | USD/PEN the | USD/PEN the | |||||||||||||||||||||||||
| realized variance | realized variance | ||||||||||||||||||||||||||
| above 6.5% | below 6.5% | $ | (455,865 | ) | |||||||||||||||||||||||
| 105,000 | USD | 11/19/2008 | JP Morgan Chase Bank | Per Vega on USD/PEN the realized variance above 7.0% | Per Vega on USD/PEN the realized variance below 7.0% | (183,067 | ) | ||||||||||||||||||||
| 105,000 | USD | 11/29/2008 | JP Morgan Chase Bank | Per Vega on USD/PEN the realized variance above 7.5% | Per Vega on USD/PEN the realized variance below 7.5% | (146,898 | ) | ||||||||||||||||||||
| Premiums to (Pay) Receive | $ | — | $ | (785,830 | ) | ||||||||||||||||||||||
As of February 29, 2008, for the swap contracts held, the Fund had sufficient cash and/or securities to cover any commitments or margin requirements of the relevant broker or exchange.
Notes to Schedule of Investments:
144A - Securities exempt from registration under Rule 144A of the Securities Act of 1933. These securities may be resold in transactions exempt from registration, normally to qualified institutional investors.
AMBAC - Insured as to the payment of principal and interest by AMBAC Assurance Corporation.
BPI - Indemnification payment bonds
CBO - Collateralized Bond Obligation
CDO - Collateralized Debt Obligation
DCB - Debt Conversion Bond
EMBI - Emerging Markets Bond Index
EMTN - Euromarket Medium Term Note
FLIRB - Front Loaded Interest Reduction Bond
GDP - Gross Domestic Product
GMTN - Global Medium Term Note
LIBOR - London Interbank Offered Rate
PDI - Past Due Interest
PIK - Payment In Kind
See accompanying notes to the financial statements.
32
GMO Emerging Country Debt Fund
(A Series of GMO Trust)
Schedule of Investments — (Continued)
February 29, 2008
RMAC - Residential Mortgage Acceptance Corp.
SOR - Swap Offer Rate
TIIE - Interbank Equilibrium Interest Rate
Variable, step up and step down rates - The rates shown on variable, step up and step down rate notes are the current interest rates at February 29, 2008, which are subject to change based on the terms of the security, including varying reset dates.
VRRB - Variable Rate Reduction Bond
* Non-performing. Borrower not currently paying interest.
** Non-income producing security.
(a) Security is in default.
(b) Indexed security in which price and/or coupon is linked to the prices of a specific instrument or financial statistic (Note 2).
(c) Security valued at fair value using methods determined in good faith by or at the direction of the Trustees of GMO Trust (Note 2).
(d) All or a portion of this security has been segregated to cover collateral requirements on reverse repurchase agreements (Note 2).
(e) All or a portion of this security has been segregated to cover margin requirements on open financial futures contracts and/or collateral on open swap contracts (Note 2).
(f) Past due maturity payment.
(g) Underlying investment represents interests in defaulted securities.
(h) Rate shown represents yield-to-maturity.
Currency Abbreviations:
| ARS - Argentine Peso BRL - Brazilian Real CHF - Swiss Franc COP - Colombia Peso CZ K - Czech Koruna DEM - German Mark EUR - Euro FIM - Finnish Markka | FRF - French Franc GBP - British Pound ITL - Italian Lira JPY - Japanese Yen KRW - South Korean Won KZT - Kazakhstan Tenge MXN - Mexican Peso MYR - Malaysian Ringgit | PEN - Peruvian Sol RUB - Russian Ruble SGD - Singapore Dollar TRY - Turkish Lira T WD - Taiwan Dollar USD - United States Dollar ZAR - South African Rand | |||||||||
See accompanying notes to the financial statements.
33
GMO Emerging Country Debt Fund
(A Series of GMO Trust)
Statement of Assets and Liabilities — February 29, 2008
| Assets: | |||||||
| Investments in unaffiliated issuers, at value (cost $3,082,197,299) (Note 2) | $ | 3,226,294,165 | |||||
| Investments in affiliated issuers, at value (cost $197,475,629) (Notes 2 and 8) | 190,365,906 | ||||||
| Cash | 22,286 | ||||||
| Foreign currency, at value (cost $1,283,997) (Note 2) | 1,200,082 | ||||||
| Receivable for investments sold | 18,948,602 | ||||||
| Receivable for Fund shares sold | 1,676,923 | ||||||
| Interest receivable | 53,633,613 | ||||||
| Unrealized appreciation on open forward currency contracts (Note 2) | 1,494,591 | ||||||
| Receivable for open swap contracts (Note 2) | 228,980,748 | ||||||
| Total assets | 3,722,616,916 | ||||||
| Liabilities: | |||||||
| Payable for investments purchased | 59,683,733 | ||||||
| Payable for Fund shares repurchased | 1,688,231 | ||||||
| Written options outstanding, at value (premiums $2,060,625) (Note 2) | 23,432,908 | ||||||
| Payable to affiliate for (Note 3): | |||||||
| Management fee | 799,159 | ||||||
| Shareholder service fee | 258,829 | ||||||
| Trustees and Chief Compliance Officer of GMO Trust fees | 3,349 | ||||||
| Unrealized depreciation on open forward currency contracts (Note 2) | 14,039,242 | ||||||
| Payable for open swap contracts (Note 2) | 206,060,031 | ||||||
| Payable for reverse repurchase agreements (Note 2) | 566,930,587 | ||||||
| Accrued expenses | 618,626 | ||||||
| Total liabilities | 873,514,695 | ||||||
| Net assets | $ | 2,849,102,221 | |||||
See accompanying notes to the financial statements.
34
GMO Emerging Country Debt Fund
(A Series of GMO Trust)
Statement of Assets and Liabilities — February 29, 2008 — (Continued)
| Net assets consist of: | |||||||
| Paid-in capital | $ | 2,718,284,871 | |||||
| Distributions in excess of net investment income | (38,763,889 | ) | |||||
| Accumulated net realized gain | 55,050,437 | ||||||
| Net unrealized appreciation | 114,530,802 | ||||||
| $ | 2,849,102,221 | ||||||
| Net assets attributable to: | |||||||
| Class III shares | $ | 734,921,250 | |||||
| Class IV shares | $ | 2,114,180,971 | |||||
| Shares outstanding: | |||||||
| Class III | 73,017,804 | ||||||
| Class IV | 210,058,872 | ||||||
| Net asset value per share: | |||||||
| Class III | $ | 10.06 | |||||
| Class IV | $ | 10.06 | |||||
See accompanying notes to the financial statements.
35
GMO Emerging Country Debt Fund
(A Series of GMO Trust)
Statement of Operations — Year Ended February 29, 2008
| Investment Income: | |||||||
| Interest | $ | 218,013,051 | |||||
| Dividends from affiliated issuers (Note 8) | 7,914,767 | ||||||
| Dividends | 972,170 | ||||||
| Total investment income | 226,899,988 | ||||||
| Expenses: | |||||||
| Interest expense (Note 2) | 21,897,570 | ||||||
| Management fee (Note 3) | 10,299,188 | ||||||
| Shareholder service fee – Class III (Note 3) | 1,306,815 | ||||||
| Shareholder service fee – Class IV (Note 3) | 2,071,415 | ||||||
| Custodian, fund accounting agent and transfer agent fees | 1,870,727 | ||||||
| Audit and tax fees | 122,161 | ||||||
| Legal fees | 131,852 | ||||||
| Trustees fees and related expenses (Note 3) | 28,544 | ||||||
| Registration fees | 23,534 | ||||||
| Miscellaneous | 25,771 | ||||||
| Total expenses | 37,777,577 | ||||||
| Expense reductions (Note 2) | (378 | ) | |||||
| Net expenses | 37,777,199 | ||||||
| Net investment income (loss) | 189,122,789 | ||||||
| Realized and unrealized gain (loss): | |||||||
| Net realized gain (loss) on: | |||||||
| Investments in unaffiliated issuers | 64,813,768 | ||||||
| Investments in affiliated issuers | (1,344,910 | ) | |||||
| Realized gains distributions from affiliated issuers (Note 8) | 138,860 | ||||||
| Closed futures contracts | (21,730 | ) | |||||
| Closed swap contracts | 76,751,271 | ||||||
| Written options | 3,302,920 | ||||||
| Foreign currency, forward contracts and foreign currency related transactions | (34,317,493 | ) | |||||
| Net realized gain (loss) | 109,322,686 | ||||||
| Change in net unrealized appreciation (depreciation) on: | |||||||
| Investments in unaffiliated issuers | (47,323,347 | ) | |||||
| Investments in affiliated issuers | (8,742,705 | ) | |||||
| Open futures contracts | 54,821 | ||||||
| Open swap contracts | (64,391,922 | ) | |||||
| Written options | (21,550,601 | ) | |||||
| Foreign currency, forward contracts and foreign currency related transactions | (9,293,779 | ) | |||||
| Net unrealized gain (loss) | (151,247,533 | ) | |||||
| Net realized and unrealized gain (loss) | (41,924,847 | ) | |||||
| Net increase (decrease) in net assets resulting from operations | $ | 147,197,942 | |||||
See accompanying notes to the financial statements.
36
GMO Emerging Country Debt Fund
(A Series of GMO Trust)
Statement of Changes in Net Assets
| Year Ended February 29, 2008 | Year Ended February 28, 2007 | ||||||||||
| Increase (decrease) in net assets: | |||||||||||
| Operations: | |||||||||||
| Net investment income (loss) | $ | 189,122,789 | $ | 217,900,287 | |||||||
| Net realized gain (loss) | 109,322,686 | 218,285,881 | |||||||||
| Change in net unrealized appreciation (depreciation) | (151,247,533 | ) | (153,138,794 | ) | |||||||
| Net increase (decrease) in net assets from operations | 147,197,942 | 283,047,374 | |||||||||
| Distributions to shareholders from: | |||||||||||
| Net investment income | |||||||||||
| Class III | (60,758,567 | ) | (66,047,926 | ) | |||||||
| Class IV | (147,592,816 | ) | (157,264,308 | ) | |||||||
| Total distributions from net investment income | (208,351,383 | ) | (223,312,234 | ) | |||||||
| Net realized gains | |||||||||||
| Class III | (37,184,110 | ) | (57,834,451 | ) | |||||||
| Class IV | (85,627,144 | ) | (130,680,560 | ) | |||||||
| Total distributions from net realized gains | (122,811,254 | ) | (188,515,011 | ) | |||||||
| (331,162,637 | ) | (411,827,245 | ) | ||||||||
| Net share transactions (Note 7): | |||||||||||
| Class III | (87,026,767 | ) | (106,571,551 | ) | |||||||
| Class IV | 246,523,243 | 286,023,978 | |||||||||
| Increase (decrease) in net assets resulting from net share transactions | 159,496,476 | 179,452,427 | |||||||||
| Purchase premiums and redemption fees (Notes 2 and 7): | |||||||||||
| Class III | 614,140 | 1,172,520 | |||||||||
| Class IV | 127,854 | 215,318 | |||||||||
| Increase in net assets resulting from purchase premiums and redemption fees | 741,994 | 1,387,838 | |||||||||
| Total increase (decrease) in net assets resulting from net share transactions, purchase premiums and redemption fees | 160,238,470 | 180,840,265 | |||||||||
| Total increase (decrease) in net assets | (23,726,225 | ) | 52,060,394 | ||||||||
| Net assets: | |||||||||||
| Beginning of period | 2,872,828,446 | 2,820,768,052 | |||||||||
| End of period (including distributions in excess of net investment income of $38,763,889 and $21,105,332, respectively) | $ | 2,849,102,221 | $ | 2,872,828,446 | |||||||
See accompanying notes to the financial statements.
37
GMO Emerging Country Debt Fund
(A Series of GMO Trust)
Statement of Cash Flows For the Year Ended February 29, 2008
| Cash flows from operating activities: | |||||||
| Net investment income | $ | 189,122,789 | |||||
| Net amortization of discount and premium | (29,516,729 | ) | |||||
| 159,606,060 | |||||||
| Investments purchased | (1,903,316,389 | ) | |||||
| Proceeds from sale of investments | 1,525,986,585 | ||||||
| Short term investments, net | 6,093,391 | ||||||
| Other proceeds (cost): | |||||||
| Swaps | 67,223,936 | ||||||
| Futures | 33,091 | ||||||
| Written options | 3,373,720 | ||||||
| Foreign currency and forward contracts | (30,112,683 | ) | |||||
| (330,718,349 | ) | ||||||
| Realized gain distributions from affiliated issuers | 138,860 | ||||||
| Changes in assets and liabilities: | |||||||
| (Increase) decrease in interest receivable | (6,932,623 | ) | |||||
| (Increase) decrease in receivable for closed swap contracts | 331,634 | ||||||
| Increase (decrease) in due to custodian | (343,032 | ) | |||||
| Increase (decrease) in payable to affiliate for: | |||||||
| Management fee | 32,538 | ||||||
| Trustees and Chief Compliance Officer of GMO Trust fees | (4,979 | ) | |||||
| Shareholder service fee | 6,380 | ||||||
| Increase (decrease) in accrued expenses | 68,896 | ||||||
| Net cash provided (used in) operating activities | (177,814,615 | ) | |||||
| Cash flows from financing activities* | |||||||
| Proceeds from shares sold | 205,121,398 | ||||||
| Shares repurchased | (372,714,276 | ) | |||||
| Cash distributions paid | (4,135,580 | ) | |||||
| Purchase premiums and redemption fees | 741,994 | ||||||
| Increase (decrease) in payable for reverse repurchase agreements | 349,235,665 | ||||||
| Net cash provided (used in) financing activities | 178,249,201 | ||||||
| Net increase in cash | 434,586 | ||||||
| Cash and cash equivalents, beginning of period | 787,782 | ||||||
| Cash and cash equivalents, end of period | $ | 1,222,368 | |||||
| *Supplemental disclosure of cash flow information: | |||||||
| Reinvestment of dividends and distributions | $ | 327,027,057 | |||||
See accompanying notes to the financial statements.
38
GMO Emerging Country Debt Fund
(A Series of GMO Trust)
Financial Highlights
(For a Class III share outstanding throughout each period)
| Year Ended February 28/29, | |||||||||||||||||||||||
| 2008 | 2007 | 2006 | 2005 | 2004 | |||||||||||||||||||
| Net asset value, beginning of period | $ | 10.73 | $ | 11.30 | $ | 11.09 | $ | 10.51 | $ | 9.51 | |||||||||||||
| Income (loss) from investment operations: | |||||||||||||||||||||||
| Net investment income (loss)† | 0.68 | 0.86 | 0.88 | 0.89 | 1.01 | ||||||||||||||||||
| Net realized and unrealized gain (loss) | (0.13 | ) | 0.30 | 1.14 | 1.16 | 1.81 | |||||||||||||||||
| Total from investment operations | 0.55 | 1.16 | 2.02 | 2.05 | 2.82 | ||||||||||||||||||
| Less distributions to shareholders: | |||||||||||||||||||||||
| From net investment income | (0.76 | ) | (0.94 | ) | (1.26 | ) | (1.18 | ) | (1.06 | ) | |||||||||||||
| From net realized gains | (0.46 | ) | (0.79 | ) | (0.55 | ) | (0.29 | ) | (0.76 | ) | |||||||||||||
| Total distributions | (1.22 | ) | (1.73 | ) | (1.81 | ) | (1.47 | ) | (1.82 | ) | |||||||||||||
| Net asset value, end of period | $ | 10.06 | $ | 10.73 | $ | 11.30 | $ | 11.09 | $ | 10.51 | |||||||||||||
| Total Return(a) | 5.07 | % | 10.98 | % | 19.50 | % | 20.58 | % | 30.46 | % | |||||||||||||
| Ratios/Supplemental Data: | |||||||||||||||||||||||
| Net assets, end of period (000's) | $ | 734,921 | $ | 876,598 | $ | 1,020,976 | $ | 1,088,609 | $ | 925,517 | |||||||||||||
| Net operating expenses to average daily net assets(b) | 0.57 | %(d) | 0.57 | % | 0.57 | % | 0.57 | % | 0.57 | % | |||||||||||||
| Interest expense to average daily net assets(c) | 0.74 | % | 0.48 | % | 0.22 | % | 0.08 | % | 0.08 | % | |||||||||||||
| Total net expenses to average daily net assets | 1.31 | %(d) | 1.05 | % | 0.79 | % | 0.65 | % | 0.65 | % | |||||||||||||
| Net investment income to average daily net assets | 6.36 | % | 7.91 | % | 7.75 | % | 8.22 | % | 9.44 | % | |||||||||||||
| Portfolio turnover rate | 53 | % | 83 | % | 144 | % | 121 | % | 119 | % | |||||||||||||
| Purchase premiums and redemption fees consisted of the following per share amounts:† | $ | 0.01 | $ | 0.01 | $ | 0.01 | $ | 0.01 | $ | 0.03 | |||||||||||||
(a) Calculation excludes purchase premiums and redemption fees which are borne by shareholders and assumes the effect of reinvested distributions.
(b) Net expenses exclude expenses incurred indirectly through investment in the underlying funds (See Note 3).
(c) Interest expense incurred as a result of entering into reverse repurchase agreements is included in the Fund's net expenses. Income earned on investing proceeds from reverse repurchase agreements is included in interest income.
(d) The net expense ratio does not include the effect of expense reductions.
† Calculated using average shares outstanding throughout the period.
See accompanying notes to the financial statements.
39
GMO Emerging Country Debt Fund
(A Series of GMO Trust)
Financial Highlights
(For a Class IV share outstanding throughout each period)
| Year Ended February 28/29, | |||||||||||||||||||||||
| 2008 | 2007 | 2006 | 2005 | 2004 | |||||||||||||||||||
| Net asset value, beginning of period | $ | 10.73 | $ | 11.30 | $ | 11.09 | $ | 10.51 | $ | 9.52 | |||||||||||||
| Income (loss) from investment operations: | |||||||||||||||||||||||
| Net investment income (loss)† | 0.69 | 0.87 | 0.88 | 0.90 | 1.06 | ||||||||||||||||||
| Net realized and unrealized gain (loss) | (0.13 | ) | 0.29 | 1.15 | 1.16 | 1.75 | |||||||||||||||||
| Total from investment operations | 0.56 | 1.16 | 2.03 | 2.06 | 2.81 | ||||||||||||||||||
| Less distributions to shareholders: | |||||||||||||||||||||||
| From net investment income | (0.77 | ) | (0.94 | ) | (1.27 | ) | (1.19 | ) | (1.06 | ) | |||||||||||||
| From net realized gains | (0.46 | ) | (0.79 | ) | (0.55 | ) | (0.29 | ) | (0.76 | ) | |||||||||||||
| Total distributions | (1.23 | ) | (1.73 | ) | (1.82 | ) | (1.48 | ) | (1.82 | ) | |||||||||||||
| Net asset value, end of period | $ | 10.06 | $ | 10.73 | $ | 11.30 | $ | 11.09 | $ | 10.51 | |||||||||||||
| Total Return(a) | 5.13 | % | 11.06 | % | 19.57 | % | 20.64 | % | 30.38 | % | |||||||||||||
| Ratios/Supplemental Data: | |||||||||||||||||||||||
| Net assets, end of period (000's) | $ | 2,114,181 | $ | 1,996,230 | $ | 1,799,792 | $ | 1,550,402 | $ | 1,238,209 | |||||||||||||
| Net operating expenses to average daily net assets(b) | 0.53 | %(d) | 0.52 | % | 0.52 | % | 0.52 | % | 0.52 | % | |||||||||||||
| Interest expense to average daily net assets(c) | 0.74 | % | 0.48 | % | 0.22 | % | 0.08 | % | 0.08 | % | |||||||||||||
| Total net expenses to average daily net assets | 1.27 | %(d) | 1.00 | % | 0.74 | % | 0.60 | % | 0.60 | % | |||||||||||||
| Net investment income to average daily net assets | 6.45 | % | 7.97 | % | 7.75 | % | 8.29 | % | 9.95 | % | |||||||||||||
| Portfolio turnover rate | 53 | % | 83 | % | 144 | % | 121 | % | 119 | % | |||||||||||||
| Purchase premiums and redemption fees consisted of the following per share amounts: † | $ | 0.00 | (e) | $ | 0.01 | $ | 0.00 | (e) | $ | 0.01 | $ | 0.04 | |||||||||||
(a) Calculation excludes purchase premiums and redemption fees which are borne by shareholders and assumes the effect of reinvested distributions.
(b) Net expenses exclude expenses incurred indirectly through invesment in the underlying funds (See Note 3).
(c) Interest expense incurred as a result of entering into reverse repurchase agreements is included in the Fund's net expenses. Income earned on investing proceeds from reverse repurchase agreements is included in interest income.
(d) The net expense ratio does not include the effect of expense reductions.
(e) Purchase premiums and redemption fees were less than $0.01 per share.
† Calculated using average shares outstanding throughout the period.
See accompanying notes to the financial statements.
40
GMO Emerging Country Debt Fund
(A Series of GMO Trust)
Notes to Financial Statements
February 29, 2008
1. Organization
GMO Emerging Country Debt Fund (the "Fund") is a series of GMO Trust (the "Trust"). The Fund is registered under the Investment Company Act of 1940, as amended, as an open-end, non-diversified management investment company. The Fund is advised and managed by Grantham, Mayo, Van Otterloo & Co. LLC (the "Manager" or "GMO"). The Trust was established as a Massachusetts business trust under the laws of the Commonwealth of Massachusetts on June 24, 1985. The Declaration of Trust permits the Trustees of the Trust ("Trustees") to create an unlimited number of series of shares ("Funds") and to subdivide Funds into classes.
The Fund seeks total return in excess of that of its benchmark, the JPMorgan Emerging Markets Bond Index Global. The Fund invests primarily in sovereign debt of emerging countries. In addition, the Fund may invest a portion of its assets in debt investments issued by companies tied economically to emerging countries and other fixed income securities, including asset-backed securities issued by foreign governments and foreign and domestic private issuers. A substantial portion of the Fund's holdings are typically below investment grade. Generally, at least 75% of the Fund's assets are denominated in, or hedged into, U.S. dollars.
Throughout the year ended February 29, 2008, the Fund had two classes of shares outstanding: Class III and Class IV. Each class of shares bears a different level of shareholder service fees.
The financial statements of the series of the Trust in which the Fund invests ("underlying funds") should be read in conjunction with the Fund's financial statements. These financial statements are available, without charge, upon request, by calling (617) 346-7646 (collect). Shares of GMO Short-Duration Collateral Fund, GMO Special Purpose Holding Fund and GMO World Opportunity Overlay Fund are not publicly available for direct purchase.
The Fund currently limits subscriptions due to capacity considerations.
2. Significant accounting policies
The following is a summary of significant accounting policies which are in conformity with accounting principles generally accepted in the United States of America ("U.S. GAAP") and which are consistently followed by the Fund in the preparation of its financial statements. The preparation of financial statements in accordance with U.S. GAAP requires management to make estimates and assumptions that affect the reported amounts and disclosures in the financial statements. Actual results could differ from those estimates. The accounting records of the Fund are maintained in U.S. dollars.
41
GMO Emerging Country Debt Fund
(A Series of GMO Trust)
Notes to Financial Statements — (Continued)
February 29, 2008
Portfolio valuation
Securities listed on a securities exchange for which market quotations are readily available are valued at the last sale price or official closing price on each business day, or if there is no such reported sale or official closing price, at the most recent quoted bid price. Unlisted securities for which market quotations are readily available are generally valued at the most recent quoted bid price. Short-term investments with a remaining maturity of sixty days or less are generally valued at amortized cost, which approximates fair value. Shares of investment funds are valued at their net asset value. Securities for which quotations are not readily available or whose values the Manager has determined to be unreliable are valued at fair value as determined in good faith by the Trustees or other persons acting at their direction pursuant to procedures approved by the Trustees. By its nature, a fair value price is a good faith est imate of the value of a security at a given point in time and may not reflect the value that would be realized if the security was sold and the differences could be material.
Fixed income securities held by the Fund or the underlying funds are typically valued pursuant to prices supplied by a primary pricing source chosen by the Manager. The Manager evaluates such primary pricing sources on an ongoing basis, and may change a pricing source should it deem it appropriate. The Manager, at its discretion, may override a price supplied by a primary source by using a price provided by another source if such action is deemed appropriate. The prices provided by such primary pricing sources may differ from the value that would be realized if the securities were sold and the differences could be material.
Certain securities held by the Fund or the underlying funds are valued on the basis of a price provided by a single source. The prices provided may differ from the value that would be realized if the securities were sold and the differences could be material. As of February 29, 2008, the total value of these securities represented 32.73% of net assets.
The Fund directly and indirectly invests through underlying funds in securities with contractual cash flows, such as asset-backed securities, collateralized mortgage obligations and commercial mortgage backed securities, including securities backed by subprime mortgage loans. The value, liquidity and related income of these securities are sensitive to changes in economic conditions, including real estate value, delinquencies and/or defaults, and may be adversely affected by shifts in the markets perception of the securities' market values and changes in interest rates.
GMO Special Purpose Holding Fund ("SPHF"), an investment of the Fund, has litigation pending against various entities related to the default of certain asset-backed securities previously held by SPHF. For the year ended February 29, 2008, the Fund received $138,860 through SPHF in conjunction with settlement agreements related to the default of those securities.
42
GMO Emerging Country Debt Fund
(A Series of GMO Trust)
Notes to Financial Statements — (Continued)
February 29, 2008
Foreign currency translation
The market values of foreign securities, currency holdings and other assets and liabilities are translated to U.S. dollars based on the current exchange rates each business day. Income and expenses denominated in foreign currencies are translated at current exchange rates when accrued or incurred. The Fund does not isolate realized and unrealized gains and losses attributable to changes in exchange rates from gains and losses that arise from changes in the market value of investments. Such fluctuations are included with net realized and unrealized gain or loss on investments. Net realized gains and losses on foreign currency transactions represent gains and losses on disposition of currencies and forward currency contracts, currency gains and losses realized between the trade and settlement dates on securities transactions, and the difference between the amount of investment income and foreign withholding taxes recorded on the F und's accounting records and the U.S. dollar equivalent amounts actually received or paid.
Forward currency contracts
The Fund may enter into forward currency contracts including forward cross currency contracts. A forward currency contract is an agreement between two parties to buy and sell a currency at a set price on a future date. The market value of a forward currency contract fluctuates with changes in forward currency exchange rates. Forward currency contracts are marked to market daily using rates supplied by a quotation service and changes in value are recorded by the Fund as an unrealized gain or loss. Realized gains or losses equal to the difference between the value of the contract at the time it was opened and the value at the time it was closed are recorded upon delivery or receipt of the currency or, if a forward currency contract is offset by entering into another forward currency contract with the same broker, upon settlement of the net gain or loss. These contracts may involve market risk in excess of the unrealized gain or lo ss reflected in the Fund's Statement of Assets and Liabilities. In addition, the Fund could be exposed to risk if the counterparties are unable to meet the terms of the contracts or if there are movements in currency values that are unfavorable to the Fund. Forward currency contracts outstanding at the end of the period are listed in the Fund's Schedule of Investments.
Futures contracts
The Fund may purchase and sell futures contracts. Upon entering into a futures contract, the Fund is required to deposit with the futures clearing broker an amount of cash, U.S. government and agency obligations, or other liquid assets in accordance with the initial margin requirements of the broker or exchange. In addition, the Fund maintains cash or securities in an amount that at least equals the net amount payable in the event the Fund must deliver the full amount of the contracts. Futures contracts are marked to market daily and an appropriate payable or receivable for the change in value ("variation margin") is recorded by the Fund. The payable or receivable is liquidated on the following business day. Gains or losses are recognized but not considered realized until the contracts expire or are closed. Futures contracts involve, to varying degrees, risk of loss in excess of the variation margin disclosed in the Statement of Assets and Liabilities. Under certain circumstances, futures exchanges may establish daily limits on the amount that the price of a futures contract can vary from the previous day's settlement price, thereby effectively preventing liquidation of unfavorable positions. Losses may arise from changes in the
43
GMO Emerging Country Debt Fund
(A Series of GMO Trust)
Notes to Financial Statements — (Continued)
February 29, 2008
value of the underlying instrument if the Fund is unable to liquidate a futures position due to an illiquid secondary market for the contracts or the imposition of price limits, or if counterparties do not perform under the contract terms. Futures contracts are generally valued at the settlement price established each day by the board of trade or exchange on which they are traded. There were no futures contracts outstanding at the end of the period.
Options
The Fund may write call and put options. Writing options increases the Fund's exposure to the underlying instrument by, in the case of a call option, obligating the Fund to sell the underlying instrument at a set price to the option-holder and, in the case of a put option, obligating the Fund to purchase the underlying instrument at a set price from the option-holder. When the Fund writes a call or put option, an amount equal to the premium received is recorded as a liability and subsequently marked to market to reflect the current value of the option written. Premiums received from writing options which expire are treated as realized gains. Premiums received from writing options which are exercised or closed are added to the proceeds or offset against the amounts paid on the underlying future, security or currency transaction to determine the realized gain or loss. The Fund as a writer of an option has no control over whether t he underlying future, security or currency may be sold (call) or purchased (put) and as a result bears the market risk of an unfavorable change in the price of the future, security or currency underlying the written option. In the event that the Fund writes uncovered call options (i.e. options for investments that the Fund does not own), it bears the risk of incurring substantial losses if the price of the underlying instrument increases during the term of the option. There is the risk the Fund may not be able to enter into a closing transaction because of an illiquid market. Written options outstanding at the end of the period are listed in the Fund's Schedule of Investments.
For the year ended February 29, 2008, the Fund's investment activity in written options contracts was as follows:
| Puts | Calls | ||||||||||||||||||
| Principal Amount of Contracts | Premiums | Principal Amount of Contracts | Premiums | ||||||||||||||||
| Outstanding, beginning of period | $ | — | $ | — | $ | (115,000,000 | ) | $ | (2,060,625 | ) | |||||||||
| Options written | — | — | (670,000,000 | ) | (4,829,750 | ) | |||||||||||||
| Options exercised | — | — | 380,000,000 | 3,454,750 | |||||||||||||||
| Options expired | — | — | 290,000,000 | 1,375,000 | |||||||||||||||
| Options sold | — | — | — | — | |||||||||||||||
| Outstanding, end of period | $ | — | $ | — | $ | (115,000,000 | ) | $ | (2,060,625 | ) | |||||||||
The Fund may also purchase put and call options. Purchasing options alters the Fund's exposure to the underlying instrument by, in the case of a call option, entitling the Fund to purchase the underlying instrument at a set price from the writer of the option and, in the case of a put option, entitling the Fund to
44
GMO Emerging Country Debt Fund
(A Series of GMO Trust)
Notes to Financial Statements — (Continued)
February 29, 2008
sell the underlying instrument at a set price to the writer of the option. The Fund pays a premium as a cost for a purchased option disclosed in the Schedule of Investments which is subsequently marked to market to reflect the current value of the option. Premiums paid for purchasing options which expire are treated as realized losses. Premiums paid for purchasing options which are exercised or closed are added to the amounts paid or offset against the proceeds on the closing transaction to determine the realized gain or loss. The risk associated with purchasing put and call options is limited to the premium paid. Purchased options outstanding at the end of the period are listed in the Fund's Schedule of Investments.
Exchange traded options are valued at the last sale price, or if no sale is reported, the last bid price for purchased options and the last ask price for written options. Options traded over-the-counter are valued using prices supplied by a primary pricing source chosen by the Manager.
Loan agreements
The Fund may invest in direct debt instruments which are interests in amounts owed by a corporate, governmental, or other borrower to lenders or lending syndicates. The Fund's investments in loans may be in the form of participations in loans or assignments of all or a portion of loans from third parties. A loan is often administered by a bank or other financial institution (the "lender") that acts as agent for all holders. The agent administers the terms of the loan, as specified in the loan agreement. When investing in a loan participation, the Fund has the right to receive payments of principal, interest and any fees to which it is entitled only from the lender selling the loan agreement and only upon receipt by the lender of payments from the borrower. The Fund generally has no right to enforce compliance with the terms of the loan agreement with the borrower. As a result, the Fund may be subject to the credit risk of both t he borrower and the lender that is selling the loan agreement. When the Fund purchases assignments from lenders it acquires direct rights against the borrower on the loan. Loan agreements outstanding at the end of the period are listed in the Fund's Schedule of Investments.
Indexed securities
The Fund may invest in indexed securities where the redemption values and/or coupons are linked to the prices of a specific instrument or financial statistic. The Fund uses indexed securities to increase or decrease its exposure to different underlying instruments and to gain exposure to markets in which it may be difficult to invest through conventional securities. Indexed securities may be more volatile than their underlying instruments, but any loss is limited to the amount of the original investment. Indexed securities held by the Fund at the end of the period are listed in the Fund's Schedule of Investments.
Swap agreements
The Fund may enter into swap agreements. A swap is an agreement to exchange the return generated by one instrument for the return generated by another instrument. Interest rate swap agreements involve the exchange by one party with another party of their respective commitments to pay or receive interest, e.g., an exchange of floating rate payments for fixed rate payments with respect to a notional amount of principal. Total return swap agreements involve a commitment by one party in the agreement to pay
45
GMO Emerging Country Debt Fund
(A Series of GMO Trust)
Notes to Financial Statements — (Continued)
February 29, 2008
interest in exchange for a market-linked return, both based on notional amounts. To the extent the total return of the security or index underlying the transaction exceeds or falls short of the offsetting interest rate obligation, the party will receive a payment from or make a payment to the counterparty, respectively. Forward lock swap agreements involve commitments to pay or receive a settlement amount calculated as the difference between the swap spread and a fixed spread, multiplied by the notional amount times the duration of the swap rate. The swap spread is the difference between the benchmark swap rate (market rate) and the specific treasury rate. In a credit default swap, one party makes a stream of payments to another party in exchange for the right to receive a specified return in the event of a default by a third party on its obligation. Credit default swaps may be used to provide a measure of protection against def aults of sovereign or corporate issuers (i.e., to reduce risk where a party owns or has exposure to the issuer) or to take an active long or short position with respect to the likelihood of a particular issuer's default. Variance swap agreements involve commitments to pay or receive a settlement amount calculated as the difference between the annualized realized variance of returns on the underlying price and a fixed quantity, also known as the variance strike, over a period of time. In connection with these agreements, cash or securities may be set aside as collateral by the Fund's custodian or brokers in accordance with the terms of the swap agreement. The Fund earns or pays interest on cash set aside as collateral.
Swaps are marked to market daily using standard models that incorporate quotations from market makers and the change in value, if any, is recorded as unrealized gain or loss in the Statement of Operations. Payments received or made on swap contracts are recorded as realized gain or loss in the Statement of Operations. Gains or losses are realized upon early termination of the swap agreements. These financial instruments are not actively traded on financial markets. The values assigned to these instruments are based upon the best available information and because of the uncertainty of the valuation, these values may differ significantly from the values that would have been realized had a ready market for these instruments existed, and the differences could be material. Entering into these agreements involves, to varying degrees, elements of credit, legal, market and documentation risk in excess of the amounts recognized in the St atement of Assets and Liabilities. Such risks involve the possibility that there will be no liquid market for these agreements, that the counterparties to the agreements may default on their obligations to perform or disagree as to the meaning of contractual terms in the agreements, or that there may be unfavorable changes in interest rates or the price of the index or security underlying these transactions. Swap agreements outstanding at the end of the period are listed in the Fund's Schedule of Investments.
Repurchase agreements
The Fund may enter into repurchase agreements with banks and broker-dealers whereby the Fund acquires a security for cash and obtains a simultaneous commitment from the seller to repurchase the security at an agreed upon price and date. The Fund, through its custodian, takes possession of securities collateralizing the repurchase agreement. The collateral is marked to market daily to ensure that the market value of the underlying assets remains sufficient to protect the Fund in the event of default by the seller. Collateral for certain tri-party repurchase agreements is held at the counterparty's custodian in a segregated account for
46
GMO Emerging Country Debt Fund
(A Series of GMO Trust)
Notes to Financial Statements — (Continued)
February 29, 2008
the benefit of the Fund and the counterparty. In connection with transactions in repurchase agreements, if the seller defaults or enters into insolvency proceedings and the value of the collateral declines, recovery of cash by the Fund may be delayed or limited. There were no repurchase agreements outstanding at the end of the period.
Reverse repurchase agreements
The Fund may enter into reverse repurchase agreements with banks and broker-dealers whereby the Fund sells portfolio assets concurrent with an agreement by the Fund to repurchase the same assets at a later date at a fixed price. In connection with these agreements, the Fund establishes segregated accounts with its custodian in which the Fund maintains cash, U.S. government securities or other assets equal in value to its obligations in respect of reverse repurchase agreements. Reverse repurchase agreements involve the risk that the market value of the securities the Fund has sold under the agreement may decline below the price at which the Fund is obligated to repurchase under the agreement. The market value of the securities the Fund has sold is determined daily and any additional required collateral is allocated to or sent by the Fund on the next business day. As of February 29, 2008, the Fund had entered into reverse repurcha se agreements, plus accrued interest, amounting to $566,930,587, collateralized by securities with a market value, plus accrued interest, of $576,334,739. Reverse repurchase agreements outstanding at the end of the period are listed in the Fund's Schedule of Investments. The reverse repurchase agreements were with the counterparties with the Fund having no more than $237,581,740 outstanding with any one counterparty.
Delayed delivery commitments
The Fund may purchase or sell securities on a when-issued or forward commitment basis. Payment and delivery may take place a month or more after the date of the transaction. The price of the underlying securities and the date when the securities will be delivered and paid for are fixed at the time the transaction is negotiated. Collateral consisting of liquid securities or cash and cash equivalents is maintained with the custodian in an amount at least equal to these commitments. There were no delayed delivery commitments outstanding at the end of the period.
Securities lending
The Fund may lend its securities to certain qualified broker-dealers. The loans are collateralized with cash or liquid securities with a market value at least equal to the market value of the securities on loan. As with other extensions of credit, the Fund may bear the risk of loss with respect to the investment of the collateral, the risk of delay in and/or inability to exercise its rights with respect to the collateral, and the risk of delay in recovery or loss of rights in the loaned securities should the borrower of the securities fail financially. If a loan is collateralized by U.S. government securities, the Fund receives a fee from the borrower. If a loan is collateralized by cash, the Fund typically invests the cash collateral for its own account in interest-bearing, short-term securities and pays a fee to the borrower that normally represents a portion of the Fund's earnings on the collateral. For the year ended Februar y 29, 2008, the Fund did not participate in securities lending.
47
GMO Emerging Country Debt Fund
(A Series of GMO Trust)
Notes to Financial Statements — (Continued)
February 29, 2008
Taxes and distributions
The Fund intends to qualify each tax year as a regulated investment company under Subchapter M of the Internal Revenue Code of 1986, as amended (the "Code"). The Fund intends to distribute substantially all of its net investment income and net realized short-term and long-term capital gains, if any, after giving effect to any available capital loss carryovers for U.S. federal income tax purposes. Therefore, no provision for U.S. federal income or excise tax is necessary.
The Fund's policy is to declare and pay distributions from net investment income, if any, semiannually, and from net realized short-term and long-term capital gains, if any, at least annually. All distributions are paid in shares of the Fund, at net asset value, unless the shareholder elects to receive cash distributions. Distributions to shareholders are recorded by the Fund on the ex-dividend date.
Income and capital gain distributions are determined in accordance with U.S. federal income tax regulations, which may differ from U.S. GAAP. Certain capital accounts in the financial statements are periodically adjusted for permanent differences in order to reflect their tax character. These adjustments have no impact on net assets or net asset value per share. Temporary differences which arise from recognizing certain items of income, expense, gain or loss in different periods for financial statement and tax purposes will reverse at some time in the future. Distributions in excess of net investment income or net realized gains are temporary over distributions for financial statement purposes resulting from differences in the recognition or classification of income or distributions for financial statement and tax purposes.
U.S. GAAP and tax accounting differences primarily relate to derivative contract transactions, differing treatment for defaulted bonds, foreign currency transactions, partnership interest tax allocations, differing treatment of accretion and amortization and losses on wash sale transactions.
The following reclassification represents the amount necessary to report the stated components of net assets on a tax basis, excluding certain temporary differences, as of February 29, 2008. The financial highlights exclude these adjustments.
| Distributions In Excess Of Net Investment Income | Accumulated Net Realized Gain | Paid-in Capital | |||||||||
| $ | 1,570,037 | $ | (7,284,197 | ) | $ | 5,714,160 | |||||
48
GMO Emerging Country Debt Fund
(A Series of GMO Trust)
Notes to Financial Statements — (Continued)
February 29, 2008
The tax character of distributions declared to shareholders is as follows:
| 2/29/2008 | 2/28/2007 | ||||||||||
| Ordinary income (including any short-term capital gains) | $ | 209,641,890 | $ | 275,936,961 | |||||||
| Long-term capital gains | 121,520,747 | 135,890,284 | |||||||||
| Total distributions | $ | 331,162,637 | $ | 411,827,245 | |||||||
Distributions in excess of tax basis earnings and profits, if significant, are reported in the financial statements as a tax return of capital.
As of February 29, 2008, the components of distributable earnings on a tax basis consisted of the following:
| Undistributed ordinary income | $ | 14,157,552 | |||||
| Undistributed long-term capital gain | $ | 57,157,930 | |||||
As of February 29, 2008, the approximate cost for U.S. federal income tax purposes and gross and net unrealized appreciation and depreciation in value of investments were as follows:
| Aggregate Cost | Gross Unrealized Appreciation | Gross Unrealized (Depreciation) | Net Unrealized Appreciation (Depreciation) | ||||||||||||
| $ | 3,301,078,867 | $ | 321,775,149 | $ | (206,193,945 | ) | $ | 115,581,204 | |||||||
Security transactions and related investment income
Security transactions are accounted for on trade date. Dividend income, net of applicable foreign withholding taxes, if any, is recorded on the ex-dividend date, or when the Fund is informed of the ex-dividend date, if later. Interest income is recorded on the accrual basis and is adjusted for the amortization of premiums and accretion of discounts. Interest income on inflation indexed securities, if any, is accrued daily based upon an inflation adjusted principal. Additionally, any increase or decrease in the principal or face amount of the securities adjusted for inflation is recorded as interest income or loss. Income is not recognized on securities for which collection is not expected. Non-cash dividends, if any, are recorded at the fair market value of the securities received. In determining the net gain or loss on securities sold, the cost of securities is determined on the identified cost basis.
Expenses
The majority of expenses of the Trust are directly identifiable to an individual fund. Expenses which are not readily identifiable to a specific fund are allocated taking into consideration, among other things, the
49
GMO Emerging Country Debt Fund
(A Series of GMO Trust)
Notes to Financial Statements — (Continued)
February 29, 2008
nature and type of expense and the relative size of the funds. Investment income, common expenses and realized and unrealized gains and losses are allocated pro rata among the classes of shares of the Fund based on the relative net assets of each class. Shareholder service fees, which are directly attributable to a class of shares, are charged to that class's operations. In addition, the Fund will also incur certain fees and expenses indirectly as a shareholder in the underlying funds. Because the underlying funds have varied expense and fee levels and the Fund may own different proportions of the underlying funds at different times, the amount of fees and expenses indirectly incurred by the Fund will vary (See Note 3).
State Street Bank and Trust Company ("State Street") serves as custodian, fund accounting agent and transfer agent of the Fund. State Street's fee may be reduced by credits that are an earnings allowance calculated on the average daily cash balances the Fund maintains with State Street. Credit balances used to reduce the fee paid to State Street, if any, are reported as a reduction of expenses in the Statement of Operations.
Purchases and redemptions of Fund shares
As of February 29, 2008, the premium on cash purchases of Fund shares was 0.50% of the amount invested. In the case of cash redemptions, the fee is currently 0.25% of the amount redeemed. If the Manager determines that any portion of a cash purchase or redemption is offset by a corresponding cash redemption or purchase occurring on the same day, it will waive the purchase premium or redemption fee in an amount approximately equal to the fee with respect to that portion. In addition, the purchase premium or redemption fee charged by the Fund may be waived in extraordinary circumstances if the Fund will not incur transaction costs. All purchase premiums and redemption fees are paid to and recorded by the Fund as paid-in-capital. The Manager will waive the purchase premium relating to the in-kind portion of a purchase transaction except to the extent of certain estimated or known transaction costs (e.g. stamp duties and transfer ta xes) incurred by the Fund in connection with the transfer of the purchasing shareholder's securities to the Fund. In-kind redemption transactions are generally not subject to redemption fees except to the extent those transactions include a cash component. However, when a substantial portion of a Fund is being redeemed, the Fund may assess estimated or known transaction costs. There is no premium for reinvested distributions.
Investment risks
Investments in emerging country debt present certain risks that are not inherent in many other securities. Many emerging countries present elements of political and/or economic instability, which may result in the Fund's inability to collect on a timely basis, or in full, principal and interest payments. Further, countries may impose various types of foreign currency regulations or controls which may impede the Fund's ability to repatriate amounts it receives. The Fund may acquire interests in securities or bank loans which are in default at the time of acquisition in anticipation of improving conditions in the related countries. These factors may result in significant volatility in the values of its holdings. The markets for emerging country debt are typically less liquid than those of developed markets.
50
GMO Emerging Country Debt Fund
(A Series of GMO Trust)
Notes to Financial Statements — (Continued)
February 29, 2008
The Fund owns loans and bonds representing significant exposure to the risk of default in many countries, but has the most sizable of such positions relating to Russia, Mexico and Brazil. The Fund's financial position would be substantially adversely affected in the case of a default by these countries on obligations held by the Fund, or on obligations issued by those countries generally. The Fund has purchased default protection in the form of credit default swap agreements with respect to debt associated with those countries, which may offset some of the losses that the Fund might experience in the case of a default on bonds issued by such countries; however the Fund as of February 29, 2008, has sold more of such default protection than it has purchased. In addition, it is important to note that (i) such protection would not cover losses due to defaults on loan assignments or participations, (ii) such protection will generally not be sufficient to cover all of the Fund's losses in the case of default, and (iii) due to the privately negotiated nature of such instruments, under some circumstances, the protection offered by such instruments may not be realized, even if the Fund incurs substantial losses due to weakening of the credit or virtual default by the countries.
Other matters
In July 2005, the Fund entered into litigation against the Government of Argentina ("Argentina") related to Argentina's failure to make payments on certain sovereign debt. The applicable defaulted sovereign debt, which continues to be valued according to the Fund's valuation policy, represented 1.87% of the net assets of the Fund as of February 29, 2008. The ultimate outcome of this litigation cannot be predicted. Costs associated with this action will be borne by the Fund.
Recently issued accounting pronouncements
In June 2006, the Financial Accounting Standards Board ("FASB") issued FASB Interpretation No. 48, Accounting for Uncertainty in Income Taxes - an Interpretation of FASB Statement No. 109 ("FIN 48"). FIN 48 clarifies the accounting for uncertainty in income taxes recognized in accordance with FASB Statement No. 109, Accounting for Income Taxes. FIN 48 prescribes a recognition threshold and measurement attribute for a tax position taken or expected to be taken in the tax return that could impact the Fund's financial statements. It also provides guidance in relation to the Fund's financial statements on classification of tax benefits or liabilities, interest and penalties, accounting in interim periods, disclosure, and transition. FIN 48 is effective for fiscal years beginning after December 15, 2006 for registered investment companies. Management has evaluated the effects of applying the various provisions of FIN 48 and has deter mined that the adoption of FIN 48 does not have a material effect on the Fund's financial statements. The Fund's federal tax returns for the prior three fiscal years, if applicable, remain subject to examination by the Internal Revenue Service. Management will continue to monitor the rules and guidance pertaining to FIN 48 and will take action if appropriate.
51
GMO Emerging Country Debt Fund
(A Series of GMO Trust)
Notes to Financial Statements — (Continued)
February 29, 2008
In September 2006, the FASB issued Statement of Financial Accounting Standards No. 157 ("FAS 157"), "Fair Value Measurements." FAS 157 defines fair value, establishes a framework for measuring fair value in accordance with generally accepted accounting principles and expands disclosure about fair value measurements. FAS 157 is effective for fiscal years beginning after November 15, 2007. Management is currently evaluating the impact the adoption of FAS 157 will have on the Fund's financial statement disclosures.
3. Fees and other transactions with affiliates
GMO earns a management fee paid monthly at the annual rate of 0.35% of average daily net assets. The Fund has adopted a Shareholder Service Plan under which the Fund pays GMO a shareholder service fee for client and shareholder service, reporting, and other support. Pursuant to the Shareholder Service Plan, the shareholder service fee is calculated based on average daily net assets of each class at the annual rate of 0.15% for Class III shares and 0.10% for Class IV shares.
The Fund incurs fees and expenses indirectly as a shareholder in the underlying funds. For the year ended February 29, 2008, these indirect fees and expenses expressed as an annualized percentage of the Fund's average daily net assets were as follows:
| Indirect Net Expenses (excluding shareholder service fees and interest expense) | Indirect Shareholder Service Fees | Indirect Interest Expense | Total Indirect Expenses | ||||||||||||
| < 0.001% | 0.000 | % | 0.001 | % | 0.001 | % | |||||||||
The Fund's portion of the fees paid by the Trust to the independent Trustees and Chief Compliance Officer ("CCO") during the year ended February 29, 2008 was $24,404 and $11,468, respectively. The compensation and expenses of the CCO are included in miscellaneous expenses in the Statement of Operations. No remuneration was paid by the Fund to any other officer of the Trust.
4. Purchases and sales of securities
For the year ended February 29, 2008, cost of purchases and proceeds from sales of investments, other than short-term obligations, were as follows:
| Purchases | Sales | ||||||||||
| U.S. Government securities | $ | 10,050,977 | $ | 39,710,212 | |||||||
| Investments (non-U.S. Government securities) | 1,842,222,029 | 1,674,810,246 | |||||||||
52
GMO Emerging Country Debt Fund
(A Series of GMO Trust)
Notes to Financial Statements — (Continued)
February 29, 2008
5. Guarantees
In the normal course of business the Fund enters into contracts with third-party service providers that contain a variety of representations and warranties and which provide general indemnifications. The Fund's maximum exposure under these arrangements is unknown, as this would involve future claims that may be made against the Fund that have not yet occurred. Based on experience, management is of the view that the risk of loss in connection with these potential indemnification obligations is remote; however, there can be no assurance that material liabilities related to such obligations will not arise in the future that could adversely impact the Fund.
6. Principal shareholders and related parties
As of February 29, 2008, 45.67% of the outstanding shares of the Fund were held by three shareholders, each holding in excess of 10% of the Fund's shares outstanding. No other shareholder owned in excess of 10% of the outstanding shares of the Fund. Investment activities of these shareholders may have a material effect on the Fund.
As of February 29, 2008, 0.27% of the Fund's shares were held by thirty related parties comprised of certain GMO employee accounts, and 13.51% of the Fund's shares were held by accounts for which the Manager has investment discretion.
7. Share transactions
The Declaration of Trust permits the Trustees to issue an unlimited number of shares of beneficial interest (without par value). Transactions in Fund shares were as follows:
| Year Ended February 29, 2008 | Year Ended February 28, 2007 | ||||||||||||||||||
| Class III: | Shares | Amount | Shares | Amount | |||||||||||||||
| Shares sold | 11,479,041 | $ | 123,985,827 | 21,552,542 | $ | 234,728,807 | |||||||||||||
| Shares issued to shareholders in reinvestment of distributions | 9,161,344 | 94,844,498 | 11,326,112 | 119,220,771 | |||||||||||||||
| Shares repurchased | (29,333,184 | ) | (305,857,092 | ) | (41,491,222 | ) | (460,521,129 | ) | |||||||||||
| Purchase premiums | — | 178,678 | — | 506,835 | |||||||||||||||
| Redemption fees | — | 435,462 | — | 665,685 | |||||||||||||||
| Net increase (decrease) | (8,692,799 | ) | $ | (86,412,627 | ) | (8,612,568 | ) | $ | (105,399,031 | ) | |||||||||
53
GMO Emerging Country Debt Fund
(A Series of GMO Trust)
Notes to Financial Statements — (Continued)
February 29, 2008
| Year Ended February 29, 2008 | Year Ended February 28, 2007 | ||||||||||||||||||
| Class IV: | Shares | Amount | Shares | Amount | |||||||||||||||
| Shares sold | 7,884,742 | $ | 82,812,310 | 9,748,445 | $ | 108,322,206 | |||||||||||||
| Shares issued to shareholders in reinvestment of distributions | 22,455,867 | 232,182,559 | 27,144,668 | 285,672,482 | |||||||||||||||
| Shares repurchased | (6,365,177 | ) | (68,471,626 | ) | (10,016,728 | ) | (107,970,710 | ) | |||||||||||
| Purchase premiums | — | 39,052 | — | 43,427 | |||||||||||||||
| Redemption fees | — | 88,802 | — | 171,891 | |||||||||||||||
| Net increase (decrease) | 23,975,432 | $ | 246,651,097 | 26,876,385 | $ | 286,239,296 | |||||||||||||
8. Investments in affiliated issuers
A summary of the Fund's transactions in the shares of affiliated issuers during the year ended February 29, 2008 is set forth below:
Affiliate | Value, beginning of period | Purchases | Sales Proceeds | Dividend Income | Distributions of Realized Gains | Value, end of period | |||||||||||||||||||||
| GMO Short-Duration Collateral Fund | $ | 141,294,024 | $ | 38,814,767 | $ | 30,000,000 | $ | 7,914,767 | $ | — | $ | 140,673,840 | |||||||||||||||
| GMO Special Purpose Holding Fund | 30,187 | — | — | — | 138,860 | 26,976 | |||||||||||||||||||||
| GMO World Opportunity Overlay Fund | 52,014,542 | 2,300,000 | 4,000,000 | — | — | 49,665,090 | |||||||||||||||||||||
| Totals | $ | 193,338,753 | $ | 41,114,767 | $ | 34,000,000 | $ | 7,914,767 | $ | 138,860 | $ | 190,365,906 | |||||||||||||||
54
Report of Independent Registered Public Accounting Firm
To the Trustees of GMO Trust and the Shareholders of
GMO Emerging Country Debt Fund
In our opinion, the accompanying statement of assets and liabilities, including the schedule of investments, and the related statements of operations and of changes in net assets and the financial highlights present fairly, in all material respects, the financial position of GMO Emerging Country Debt Fund (the "Fund") at February 29, 2008, the results of its operations for the year then ended, the changes in its net assets for each of the two years in the period then ended and the financial highlights for each of the five years in the period then ended, in conformity with accounting principles generally accepted in the United States of America. These financial statements and financial highlights (hereafter referred to as "financial statements") are the responsibility of the Fund's management; our responsibility is to express an opinion on these financial statements based on our audits. We conducted our audits of these financial statements in accordance with the standards of the Public Company Accounting Oversight Board (United States). Those standards require that we plan and perform the audit to obtain reasonable assurance about whether the financial statements are free of material misstatement. An audit includes examining, on a test basis, evidence supporting the amounts and disclosures in the financial statements, assessing the accounting principles used and significant estimates made by management, and evaluating the overall financial statement presentation. We believe that our audits, which included confirmation of securities at February 29, 2008 by correspondence with the custodian and brokers, provide a reasonable basis for our opinion.
PricewaterhouseCoopers LLP
Boston, Massachusetts
April 29, 2008
55
GMO Emerging Country Debt Fund
(A Series of GMO Trust)
Fund Expenses
February 29, 2008 (Unaudited)
Expense Examples: The following information is in relation to expenses for the six month period ended February 29, 2008.
As a shareholder of the Fund, you may incur two types of costs: (1) transaction costs, including purchase premiums and redemption fees; and (2) ongoing costs, including management fees, shareholder service fees, and other Fund expenses. This example is intended to help you understand your ongoing costs (in dollars) of investing in the Fund and to compare these costs with the ongoing costs of investing in other mutual funds.
These examples are based on an investment of $1,000 invested at the beginning of the period and held for the entire period, September 1, 2007 through February 29, 2008.
Actual Expenses
The first line of the table for each class below provides information about actual account values and actual expenses. You may use the information in this line, together with the amount you invested, to estimate the expenses that you paid over the period. Simply divide your account value by $1,000 (for example, a $10,000,000 account value divided by $1,000 = 10,000), then multiply the result by the number in the first line under the heading entitled "Net Expense Incurred" to estimate the expenses you paid on your account during this period.
Hypothetical Example for Comparison Purposes
The second line of the table for each class below provides information about hypothetical account values and hypothetical expenses based on the Fund's actual expense ratio and an assumed rate of return of 5% per year before expenses, which is not the Fund's actual return. The hypothetical account values and expenses may not be used to estimate the actual ending account balance or expenses you paid for the period. You may use this information to compare the ongoing costs of investing in the Fund with other funds. To do so, compare this 5% hypothetical example with the 5% hypothetical examples that appear in the shareholder reports of other funds.
Please note that the expenses shown in the table are meant to highlight your ongoing costs only and do not reflect any transactional costs, such as purchase premiums and redemption fees. Therefore, the second line of the table is useful in comparing ongoing costs only, and will not help you determine the relative total costs of owning different funds. In addition, if these transactional costs were included, your costs would have been higher.
| Annualized Expense Ratio | Beginning Account Value | Ending Account Value | Net Expense Incurred * | ||||||||||||||||
| Class III | |||||||||||||||||||
| 1) Actual | 1.46 | % | $ | 1,000.00 | $ | 1,040.60 | $ | 7.41 | |||||||||||
| 2) Hypothetical | 1.46 | % | $ | 1,000.00 | $ | 1,017.60 | $ | 7.32 | |||||||||||
| Class IV | |||||||||||||||||||
| 1) Actual | 1.41 | % | $ | 1,000.00 | $ | 1,041.10 | $ | 7.16 | |||||||||||
| 2) Hypothetical | 1.41 | % | $ | 1,000.00 | $ | 1,017.85 | $ | 7.07 | |||||||||||
* Expenses are calculated using each Class's annualized expense ratio (including interest expense and indirect expenses incurred) for the six months ended February 29, 2008, multiplied by the average account value over the period, multiplied by 182 days in the period, divided by 366 days in the year.
56
GMO Emerging Country Debt Fund
(A Series of GMO Trust)
Tax Information for the Tax Year Ended February 29, 2008 (Unaudited)
The Fund will notify shareholders of amounts for use in preparing 2008 income tax forms in January 2009.
The Fund's distributions to shareholders include $121,520,747 from long-term capital gains.
The Fund hereby designates as qualified interest income and qualified short-term capital gains with respect to its taxable year ended February 29, 2008, $9,453,959 and $1,290,506, respectively, or if determined to be different, the qualified interest income and qualified short-term gains of such year.
57
Trustees and Officers (Unaudited)
The following tables list the Trust's Trustees and Officers as of the date of this report; their address and date of birth ("DOB"); their position with the Trust; the length of time holding that position with the Trust; their principal occupation(s) during the past five years; the number of portfolios in the fund complex they oversee; and other directorships they hold in companies subject to registration or reporting requirements of the Securities Exchange Act of 1934 (generally called "public companies") or in registered investment companies. The Trust's Statement of Additional Information ("SAI") includes additional information about the Trust's trustees, including changes subsequent to the date of the report. The SAI is available, without charge, upon request by writing GMO, c/o GMO Trust, 40 Rowes Wharf, Boston, MA 02110.
Independent Trustees:
| Name, Address, and DOB | Position(s) Held with Trust | Term of Office1 and Length of Time Served | Principal Occupation(s) During Past Five Years | Number of Portfolios in Fund Complex Overseen by Trustee | Other Directorships Held by Trustee | ||||||||||||||||||
| Donald W. Glazer, Esq. c/o GMO Trust 40 Rowes Wharf Boston, MA 02110 DOB: 07/26/1944 | Chairman of the Board of Trustees | Chairman of the Board of Trustees since March 2005; Lead Independent Trustee (September 2004-March 2005); Trustee since December 2000. | Consultant—Law and Business2; Vice Chair (since 2002) and Secretary, Provant, Inc. (provider of personnel performance improvement services and training products); Author of Legal Treatises. | 47 | None. | ||||||||||||||||||
1 Each Trustee is elected to serve during the continued lifetime of the Trust until he/she dies, resigns or is removed, or if sooner, until the next meeting of Shareholders called for the purpose of electing Trustees and until the election and qualification of his/her successor.
2 As part of Mr. Glazer's work as a consultant, he provides part-time consulting services to Goodwin Procter LLP ("Goodwin"). Goodwin has provided legal services to Renewable Resources, LLC, an affiliate of GMO; GMO, in connection with its relationship with Renewable Resources; and funds managed by Renewable Resources. Mr. Glazer has represented that he has no financial interest in, and is not involved in the provision of, such legal services. In the calendar years ended December 31, 2006 and December 31, 2007, these entities paid $825,738 and $291,721 respectively, in legal fees and disbursements to Goodwin.
58
Independent Trustees — (Continued):
| Name, Address, and DOB | Position(s) Held with Trust | Term of Office1 and Length of Time Served | Principal Occupation(s) During Past Five Years | Number of Portfolios in Fund Complex Overseen by Trustee | Other Directorships Held by Trustee | ||||||||||||||||||
| Jay O. Light c/o GMO Trust 40 Rowes Wharf Boston, MA 02110 DOB: 10/03/1941 | Trustee | Since May 1996. | Dean (since April 2006), Acting Dean (August 2005-April 2006), Senior Associate Dean (1998-2005), and Professor of Business Administration, Harvard Business School. | 47 | Director of Harvard Management Company, Inc.3 and Verde, Inc.; Director of Partners HealthCare System, Inc. and Chair of its Investment Committee.4 | ||||||||||||||||||
| W. Nicholas Thorndike c/o GMO Trust 40 Rowes Wharf Boston, MA 02110 DOB: 03/28/1933 | Trustee | Since March 2005. | Director or trustee of various corporations and charitable organizations, including Courier Corporation (a book publisher and manufacturer) (July 1989-present); Putnam Funds (December 1992-June 2004); and Providence Journal (a newspaper publisher) (December 1986-December 2003). | 47 | Director of Courier Corporation (a book publisher and manufacturer); Member of the Investment Committee of Partners HealthCare System, Inc.4 | ||||||||||||||||||
1 Each Trustee is elected to serve during the continued lifetime of the Trust until he/she dies, resigns or is removed, or if sooner, until the next meeting of Shareholders called for the purpose of electing Trustees and until the election and qualification of his/her successor.
3 Harvard Management Company, Inc. is a client of the Manager.
4 Partners HealthCare System, Inc. is a client of the Manager.
59
Principal Officers:
| Name, Address, and DOB | Position(s) Held with Trust | Term of Office5 and Length of Time Served | Principal Occupation(s) During Past Five Years | ||||||||||||
| Scott Eston c/o GMO Trust 40 Rowes Wharf Boston, MA 02110 DOB: 01/20/1956 | President and Chief Executive Officer | President and Chief Executive Officer since October 2002; Chief Financial Officer, November 2006 – February 2007. | Chief Financial Officer, Chief Operating Officer and Member, Grantham, Mayo, Van Otterloo & Co. LLC. | ||||||||||||
| Sheppard N. Burnett c/o GMO Trust 40 Rowes Wharf Boston, MA 02110 DOB: 10/24/1968 | Treasurer and Chief Financial Officer | Chief Financial Officer since March 2007; Treasurer since November 2006; Assistant Treasurer, September 2004 – November 2006. | Fund Administration Staff, Grantham, Mayo, Van Otterloo & Co. LLC (June 2004-present); Vice President, Director of Tax, Columbia Management Group (2002-2004). | ||||||||||||
| Brent C. Arvidson c/o GMO Trust 40 Rowes Wharf Boston, MA 02110 DOB: 06/26/1969 | Assistant Treasurer | Since August 1998. | Senior Fund Administrator, Grantham, Mayo, Van Otterloo & Co. LLC. | ||||||||||||
| John L. Nasrah c/o GMO Trust 40 Rowes Wharf Boston, MA 02110 DOB: 05/27/1977 | Assistant Treasurer | Since March 2007. | Fund Administrator, Grantham, Mayo, Van Otterloo & Co. LLC (September 2004 – present); Tax Analyst, Bain & Company, Inc (June 2003 – September 2004); Senior Tax Associate, PricewaterhouseCoopers LLP (2001-2003). | ||||||||||||
| Mahmoodur Rahman c/o GMO Trust 40 Rowes Wharf Boston, MA 02110 DOB: 11/30/1967 | Assistant Treasurer | Since September 2007. | Fund Administrator, Grantham, Mayo, Van Otterloo & Co. (April 2007-present); Vice President and Senior Tax Manager, Massachusetts Financial Services Company (January 2000 – April 2007). | ||||||||||||
5 Officers are elected to hold such office until their successor is elected and qualified to carry out the duties and responsibilities of their office, or until he or she resigns or is removed from office.
60
Principal Officers (Continued):
| Name, Address, and DOB | Position(s) Held with Trust | Term of Office5 and Length of Time Served | Principal Occupation(s) During Past Five Years | ||||||||||||
| Michael E. Gillespie c/o GMO Trust 40 Rowes Wharf Boston, MA 02110 DOB: 02/18/1958 | Chief Compliance Officer | Since March 2005. | Vice President of Compliance (June 2004-February 2005) and Director of Domestic Compliance (March 2002-June 2004), Fidelity Investments; Vice President and Senior Counsel, State Street Bank and Trust Company (May 1998-March 2002). | ||||||||||||
| Jason B. Harrison c/o GMO Trust 40 Rowes Wharf Boston, MA 02110 DOB: 01/29/1977 | Vice President and Clerk | Vice President since November 2006; Clerk since March 2006. | Legal Counsel, Grantham, Mayo, Van Otterloo & Co. LLC (since February 2006) and Attorney, Ropes & Gray LLP (September 2002-February 2006). | ||||||||||||
| David L. Bohan c/o GMO Trust 40 Rowes Wharf Boston, MA 02110 DOB: 06/21/1964 | Vice President and Assistant Clerk | Vice President since March 2005; Assistant Clerk since March 2006. | Legal Counsel, Grantham, Mayo, Van Otterloo & Co. LLC (September 2003-present); Attorney, Goodwin Procter LLP (September 1996-September 2003). | ||||||||||||
| Gregory L. Pottle c/o GMO Trust 40 Rowes Wharf Boston, MA 02110 DOB: 07/09/1971 | Vice President and Assistant Clerk | Since November 2006. | Legal Counsel, Grantham, Mayo, Van Otterloo & Co. LLC. | ||||||||||||
| Anne K. Trinque c/o GMO Trust 40 Rowes Wharf Boston, MA 02110 DOB: 04/15/1978 | Vice President and Assistant Clerk | Since September 2007. | Legal Counsel, Grantham, Mayo, Van Otterloo & Co. LLC (since January 2007); Attorney, Goodwin Procter LLP (September 2003-January 2007). | ||||||||||||
| Cheryl Wakeham c/o GMO Trust 40 Rowes Wharf Boston, MA 02110 DOB: 10/29/1958 | Anti-Money Laundering Officer | Since December 2004. | Manager, Client Service Administration, Grantham, Mayo, Van Otterloo & Co. LLC. | ||||||||||||
5 Officers are elected to hold such office until their successor is elected and qualified to carry out the duties and responsibilities of their office, or until he or she resigns or is removed from office.
61
GMO Global (U.S.+) Equity Allocation Fund
(A Series of GMO Trust)
Annual Report
February 29, 2008
For a free copy of the Fund's proxy voting guidelines, shareholders may call 1-617-346-7646 (collect), visit our website at www.gmo.com, or visit the Securities and Exchange Commission's website at www.sec.gov. Information regarding how the Fund voted proxies relating to portfolio securities during the most recent 12-month period ended June 30 is available on our website at www.gmo.com, or on the Securities and Exchange Commission's website at www.sec.gov.
The Fund files its complete schedule of portfolio holdings with the Securities and Exchange Commission for the first and third quarter of each fiscal year on Form N-Q, which is available on the Commission's website at www.sec.gov. The Fund's Form N-Q may be reviewed and copied at the Commission's Public Reference Room in Washington, D.C. Information on the operation of the Public Reference Room may be obtained by calling 1-800-SEC-0330. The Fund has a policy with respect to disclosure of portfolio holdings under which it may also make available on GMO's website (www.gmo.com) a complete schedule of portfolio holdings.
This report is prepared for the general information of shareholders. It is authorized for distribution to prospective investors only when preceded or accompanied by a prospectus for the GMO Trust.
GMO Global (U.S.+) Equity Allocation Fund
(A Series of GMO Trust)
Portfolio Management
Day-to-day management of the Fund's portfolio is the responsibility of the Asset Allocation Team at Grantham, Mayo, Van Otterloo & Co. LLC.
Management Discussion and Analysis of Fund Performance
The GMO Global (U.S.+) Equity Allocation Fund returned +1.0% for the fiscal year ended February 29, 2008, as compared to -0.9% for the Fund's benchmark, the GMO Global Equity Index (75% S&P 500 / 25% MSCI ACWI [All Country World Index] ex-U.S. Index). During the fiscal year the Fund was exposed to global equity and fixed income securities through its investment in underlying GMO mutual funds.
Implementation was negative, detracting approximately 1.8%. The GMO U.S. Core Equity, GMO International Intrinsic Value, and GMO Emerging Markets Funds were the primary drivers of the underperformance.
Asset allocation added 3.7%. The Fund's overweight to international equities, particularly emerging equities, added to performance as did the allocation to fixed income.
The views expressed herein are exclusively those of Grantham, Mayo, Van Otterloo & Co. LLC Management as of the date of this report and are subject to change. GMO disclaims any responsibility to update such views. They are not meant as investment advice.

Performance data quoted represents past performance and is not indicative of future results. The investment return and principal value of an investment will fluctuate so that an investor's shares, when redeemed, may be worth more or less than their original cost. Current performance data may be lower or higher than the performance data provided herein. To obtain performance information to the most recent month-end, visit www.gmo.com. Performance shown is net of all fees after reimbursement from the Manager. Each performance figure assumes a purchase at the beginning and redemption at the end of the stated period and reflects a transaction fee of .10% on the purchase and .10% on the redemption. Transaction fees are retained by the Fund to cover trading costs. Returns would have been lower had certain expenses not been reimbursed during the periods shown and do not include the effect of taxes on distributions and redemptions. All information is unaudited.
* The GMO Global Equity Index is a composite benchmark computed by GMO and comprised of 75% S&P 500 Index and 25% MSCI ACWI (All Country World Index) ex-U.S. Index.
GMO Global (U.S.+) Equity Allocation Fund
(A Series of GMO Trust)
Investments Concentration Summary
February 29, 2008 (Unaudited)
| Asset Class Summary* | % of Total Net Assets | ||||||
| Common Stocks | 91.9 | % | |||||
| Cash and Cash Equivalents | 6.0 | ||||||
| Short-Term Investments | 4.6 | ||||||
| Preferred Stocks | 1.9 | ||||||
| Debt Obligations | 0.6 | ||||||
| Private Equity Securities | 0.1 | ||||||
| Investment Funds | 0.0 | ||||||
| Loan Participations | 0.0 | ||||||
| Loan Assignments | 0.0 | ||||||
| Options Purchased | 0.0 | ||||||
| Forward Currency Contracts | 0.0 | ||||||
| Rights and Warrants | 0.0 | ||||||
| Convertible Securities | 0.0 | ||||||
| Promissory Notes | 0.0 | ||||||
| Written Options | (0.0 | ) | |||||
| Reverse Repurchase Agreements | (0.1 | ) | |||||
| Swaps | (2.0 | ) | |||||
| Futures | (3.8 | ) | |||||
| Other | 0.8 | ||||||
| 100.0 | % | ||||||
* The table above incorporates aggregate indirect asset class exposure associated with investments in other funds of GMO Trust ("underlying funds").
1
GMO Global (U.S.+) Equity Allocation Fund
(A Series of GMO Trust)
Investments Concentration Summary — (Continued)
February 29, 2008 (Unaudited)
| Country / Region Summary** | % of Investments | ||||||
| United States | 70.7 | % | |||||
| Euro Region*** | 5.7 | ||||||
| United Kingdom | 3.2 | ||||||
| Japan | 3.1 | ||||||
| Brazil | 2.7 | ||||||
| Korea | 2.4 | ||||||
| Taiwan | 2.0 | ||||||
| China | 1.3 | ||||||
| Russia | 1.2 | ||||||
| Switzerland | 1.2 | ||||||
| Australia | 0.9 | ||||||
| Thailand | 0.9 | ||||||
| India | 0.8 | ||||||
| Malaysia | 0.7 | ||||||
| Hong Kong | 0.5 | ||||||
| Singapore | 0.4 | ||||||
| Turkey | 0.4 | ||||||
| Canada | 0.3 | ||||||
| South Africa | 0.3 | ||||||
| Denmark | 0.2 | ||||||
| Indonesia | 0.2 | ||||||
| Philippines | 0.2 | ||||||
| Sweden | 0.2 | ||||||
| Hungary | 0.1 | ||||||
| Israel | 0.1 | ||||||
| Mexico | 0.1 | ||||||
| Norway | 0.1 | ||||||
| Poland | 0.1 | ||||||
| 100.0 | % | ||||||
** The table above incorporates aggregate indirect country exposure associated with investments in the underlying funds except for GMO Alpha Only Fund. The table excludes short-term investments. The table includes exposure through the use of derivative contracts.
*** The "Euro Region" is comprised of Austria, Belgium, Finland, France, Germany, Greece, Ireland, Italy, Netherlands, Portugal and Spain.
2
GMO Global (U.S.+) Equity Allocation Fund
(A Series of GMO Trust)
Schedule of Investments
(showing percentage of total net assets)
February 29, 2008
| Shares / Par Value ($) | Description | Value ($) | |||||||||||||
| AFFILIATED ISSUERS — 100.0% | |||||||||||||||
| Mutual Funds — 100.0% | |||||||||||||||
| 2,043,763 | GMO Alpha Only Fund, Class IV | 22,706,205 | |||||||||||||
| 553,333 | GMO Emerging Countries Fund, Class III | 8,443,861 | |||||||||||||
| 169,236 | GMO Emerging Country Debt Fund, Class IV | 1,702,519 | |||||||||||||
| 1,790,477 | GMO Emerging Markets Fund, Class VI | 36,561,535 | |||||||||||||
| 1,056,746 | GMO International Growth Equity Fund, Class IV | 29,271,874 | |||||||||||||
| 962,189 | GMO International Intrinsic Value Fund, Class IV | 28,827,179 | |||||||||||||
| 16,087 | GMO Short-Duration Investment Fund, Class III | 135,936 | |||||||||||||
| 11,189,269 | GMO U.S. Core Equity Fund, Class VI | 134,495,007 | |||||||||||||
| 1,136 | GMO U.S. Growth Fund, Class III | 17,965 | |||||||||||||
| 4,586,818 | GMO U.S. Quality Equity Fund, Class VI | 94,350,851 | |||||||||||||
| 356,512,932 | |||||||||||||||
| Private Investment Fund — 0.0% | |||||||||||||||
| 175 | GMO SPV I, LLC (a)(b) | 49 | |||||||||||||
| TOTAL AFFILIATED ISSUERS (COST $374,500,491) | 356,512,981 | ||||||||||||||
| SHORT-TERM INVESTMENTS — 0.0% | |||||||||||||||
| 41,317 | Eurodollar Time Deposit, 2.00%, due 03/03/08 | 41,317 | |||||||||||||
| TOTAL SHORT-TERM INVESTMENTS (COST $41,317) | 41,317 | ||||||||||||||
| TOTAL INVESTMENTS — 100.0% (Cost $374,541,808) | 356,554,298 | ||||||||||||||
| Other Assets and Liabilities (net) — (0.0%) | (30,356 | ) | |||||||||||||
| TOTAL NET ASSETS — 100.0% | $ | 356,523,942 | |||||||||||||
See accompanying notes to the financial statements.
3
GMO Global (U.S.+) Equity Allocation Fund
(A Series of GMO Trust)
Schedule of Investments — (Continued)
February 29, 2008
Notes to Schedule of Investments:
(a) Security valued at fair value using methods determined in good faith by or at the direction of the Trustees of GMO Trust (Note 2).
(b) Underlying investment represents interests in defaulted securities.
As of February 29, 2008, 24.96% of the Net Assets of the Fund, through investments in the underlying funds, were valued using fair value prices based on models used by a third party vendor (Note 2).
See accompanying notes to the financial statements.
4
GMO Global (U.S.+) Equity Allocation Fund
(A Series of GMO Trust)
Statement of Assets and Liabilities — February 29, 2008
| Assets: | |||||||
| Investments in unaffiliated issuers, at value (cost $41,317) (Note 2) | $ | 41,317 | |||||
| Investments in affiliated issuers, at value (cost $374,500,491) (Notes 2 and 8) | 356,512,981 | ||||||
| Receivable for Fund shares sold | 1,799 | ||||||
| Receivable for expenses reimbursed by Manager (Note 3) | 8,787 | ||||||
| Total assets | 356,564,884 | ||||||
| Liabilities: | |||||||
| Payable to affiliate for (Note 3): | |||||||
| Trustees and Chief Compliance Officer of GMO Trust fees | 401 | ||||||
| Accrued expenses | 40,541 | ||||||
| Total liabilities | 40,942 | ||||||
| Net assets | $ | 356,523,942 | |||||
| Net assets consist of: | |||||||
| Paid-in capital | $ | 347,060,208 | |||||
| Accumulated undistributed net investment income | 3 | ||||||
| Accumulated net realized gain | 27,451,241 | ||||||
| Net unrealized depreciation | (17,987,510 | ) | |||||
| $ | 356,523,942 | ||||||
| Net assets attributable to: | |||||||
| Class III shares | $ | 356,523,942 | |||||
| Shares outstanding: | |||||||
| Class III | 34,783,389 | ||||||
| Net asset value per share: | |||||||
| Class III | $ | 10.25 | |||||
See accompanying notes to the financial statements.
5
GMO Global (U.S.+) Equity Allocation Fund
(A Series of GMO Trust)
Statement of Operations — Year Ended February 29, 2008
| Investment Income: | |||||||
| Dividends from affiliated issuers (Note 8) | $ | 6,117,674 | |||||
| Interest | 1,072 | ||||||
| Total investment income | 6,118,746 | ||||||
| Expenses: | |||||||
| Custodian, fund accounting agent and transfer agent fees | 40,913 | ||||||
| Audit and tax fees | 31,126 | ||||||
| Legal fees | 7,994 | ||||||
| Trustees fees and related expenses (Note 3) | 3,600 | ||||||
| Registration fees | 4,233 | ||||||
| Miscellaneous | 3,997 | ||||||
| Total expenses | 91,863 | ||||||
| Fees and expenses reimbursed by Manager (Note 3) | (86,756 | ) | |||||
| Expense reductions (Note 2) | (1,102 | ) | |||||
| Net expenses | 4,005 | ||||||
| Net investment income (loss) | 6,114,741 | ||||||
| Realized and unrealized gain (loss): | |||||||
| Net realized gain (loss) on: | |||||||
| Investments in affiliated issuers | 21,950,304 | ||||||
| Realized gains distributions from affiliated issuers (Note 8) | 43,454,054 | ||||||
| Net realized gain (loss) | 65,404,358 | ||||||
| Change in net unrealized appreciation (depreciation) on: | |||||||
| Investments in affiliated issuers | (67,173,593 | ) | |||||
| Net realized and unrealized gain (loss) | (1,769,235 | ) | |||||
| Net increase (decrease) in net assets resulting from operations | $ | 4,345,506 | |||||
See accompanying notes to the financial statements.
6
GMO Global (U.S.+) Equity Allocation Fund
(A Series of GMO Trust)
Statement of Changes in Net Assets
| Year Ended February 29, 2008 | Year Ended February 28, 2007 | ||||||||||
| Increase (decrease) in net assets: | |||||||||||
| Operations: | |||||||||||
| Net investment income (loss) | $ | 6,114,741 | $ | 6,254,375 | |||||||
| Net realized gain (loss) | 65,404,358 | 37,302,929 | |||||||||
| Change in net unrealized appreciation (depreciation) | (67,173,593 | ) | (6,654,177 | ) | |||||||
| Net increase (decrease) in net assets from operations | 4,345,506 | 36,903,127 | |||||||||
| Distributions to shareholders from: | |||||||||||
| Net investment income | |||||||||||
| Class III | (15,144,364 | ) | (10,728,384 | ) | |||||||
| Net realized gains | |||||||||||
| Class III | (46,141,439 | ) | (23,345,939 | ) | |||||||
| (61,285,803 | ) | (34,074,323 | ) | ||||||||
| Net share transactions (Note 7): | |||||||||||
| Class III | 59,195,425 | 25,348,028 | |||||||||
| Purchase premiums and redemption fees (Notes 2 and 7): | |||||||||||
| Class III | 32,563 | 27,852 | |||||||||
| Total increase (decrease) in net assets resulting from net share transactions, purchase premiums and redemption fees | 59,227,988 | 25,375,880 | |||||||||
| Total increase (decrease) in net assets | 2,287,691 | 28,204,684 | |||||||||
| Net assets: | |||||||||||
| Beginning of period | 354,236,251 | 326,031,567 | |||||||||
| End of period (including accumulated undistributed net investment income of $3 and $6, respectively) | $ | 356,523,942 | $ | 354,236,251 | |||||||
See accompanying notes to the financial statements.
7
GMO Global (U.S.+) Equity Allocation Fund
(A Series of GMO Trust)
Financial Highlights
(For a Class III share outstanding throughout each period)
| Year Ended February 28/29, | |||||||||||||||||||||||
| 2008 | 2007 | 2006 | 2005 | 2004 | |||||||||||||||||||
| Net asset value, beginning of period | $ | 11.96 | $ | 11.89 | $ | 11.63 | $ | 10.86 | $ | 7.51 | |||||||||||||
| Income (loss) from investment operations: | |||||||||||||||||||||||
| Net investment income (loss)(a) | 0.20 | † | 0.23 | † | 0.23 | † | 0.23 | † | 0.14 | ||||||||||||||
| Net realized and unrealized gain (loss) | 0.09 | (b) | 1.08 | 1.32 | 1.23 | 3.55 | |||||||||||||||||
| Total from investment operations | 0.29 | 1.31 | 1.55 | 1.46 | 3.69 | ||||||||||||||||||
| Less distributions to shareholders: | |||||||||||||||||||||||
| From net investment income | (0.49 | ) | (0.38 | ) | (0.34 | ) | (0.27 | ) | (0.21 | ) | |||||||||||||
| From net realized gains | (1.51 | ) | (0.86 | ) | (0.95 | ) | (0.42 | ) | (0.13 | ) | |||||||||||||
| Total distributions | (2.00 | ) | (1.24 | ) | (1.29 | ) | (0.69 | ) | (0.34 | ) | |||||||||||||
| Net asset value, end of period | $ | 10.25 | $ | 11.96 | $ | 11.89 | $ | 11.63 | $ | 10.86 | |||||||||||||
| Total Return(c) | 1.01 | % | 11.56 | % | 13.91 | % | 13.70 | % | 49.63 | % | |||||||||||||
| Ratios/Supplemental Data: | |||||||||||||||||||||||
| Net assets, end of period (000's) | $ | 356,524 | $ | 354,236 | $ | 326,032 | $ | 335,819 | $ | 222,856 | |||||||||||||
| Net expenses to average daily net assets(d)(e) | 0.00 | %(f) | 0.00 | % | 0.00 | % | 0.00 | % | 0.00 | % | |||||||||||||
| Net investment income to average daily net assets(a) | 1.63 | % | 1.90 | % | 1.99 | % | 2.11 | % | 1.99 | % | |||||||||||||
| Portfolio turnover rate | 30 | % | 15 | % | 20 | % | 17 | % | 73 | % | |||||||||||||
| Fees and expenses reimbursed by the Manager to average daily net assets: | 0.02 | % | 0.02 | % | 0.02 | % | 0.04 | % | 0.05 | % | |||||||||||||
| Purchase premiums and redemption fees consisted of the following per share amounts:† | $ | 0.00 | (g) | $ | 0.00 | (g) | $ | 0.00 | (g) | $ | 0.00 | (g) | $ | 0.01 | |||||||||
(a) Net investment income is affected by the timing of the declaration of dividends by the underlying funds in which the Fund invests.
(b) The amount shown for a share outstanding does not correspond with the aggregate net realized and unrealized gain (loss) on investments due to the timing of purchases and redemptions of Fund shares in relation to fluctuating market values of the investments of the Fund.
(c) The total returns would have been lower had certain expenses not been reimbursed and/or waived during the periods shown and assumes the effect of reinvested distributions. Calculations exclude purchase premiums and redemption fees which are borne by the shareholders.
(d) Net expenses exclude expenses incurred indirectly through investment in the underlying funds (See Note 3).
(e) Net expenses to average daily net assets were less than 0.01%.
(f) The net expense ratio does not include the effect of expense reductions.
(g) Purchase premiums and redemption fees were less than $0.01 per share.
† Calculated using average shares outstanding throughout the period.
See accompanying notes to the financial statements.
8
GMO Global (U.S.+) Equity Allocation Fund
(A Series of GMO Trust)
Notes to Financial Statements
February 29, 2008
1. Organization
GMO Global (U.S.+) Equity Allocation Fund (the "Fund") is a series of GMO Trust (the "Trust"). The Fund is registered under the Investment Company Act of 1940, as amended, as an open-end, diversified management investment company. The Fund is advised and managed by Grantham, Mayo, Van Otterloo & Co. LLC (the "Manager" or "GMO"). The Trust was established as a Massachusetts business trust under the laws of the Commonwealth of Massachusetts on June 24, 1985. The Declaration of Trust permits the Trustees of the Trust ("Trustees") to create an unlimited number of series of shares ("Funds") and to subdivide Funds into classes.
The Fund seeks total return greater than that of the GMO Global Equity Index. The GMO Global Equity Index is a composite index computed by GMO consisting of: (i) the S&P 500 Index and (ii) the MSCI ACWI (All Country World Index) ex-U.S. Index in the following proportions: 75% (S&P 500) and 25% (MSCI ACWI (All Country World Index) ex-U.S. Index). The Fund is a fund of funds and invests primarily in shares of the GMO International Equity Funds (which may include one or more of the GMO Emerging Markets Funds) and the GMO U.S. Equity Funds. The Fund may also invest in shares of other GMO Funds, including the GMO Fixed Income Funds, GMO Alpha Only Fund, and GMO Alternative Asset Opportunity Fund.
The financial statements of the series of the Trust in which the Fund invests ("underlying funds") should be read in conjunction with the Fund's financial statements. These financial statements are available, without charge, upon request, by calling (617) 346-7646 (collect).
The Fund currently limits subscriptions due to capacity considerations.
2. Significant accounting policies
The following is a summary of significant accounting policies which are in conformity with accounting principles generally accepted in the United States of America ("U.S. GAAP") and which are consistently followed by the Fund in the preparation of its financial statements. The preparation of financial statements in accordance with U.S. GAAP requires management to make estimates and assumptions that affect the reported amounts and disclosures in the financial statements. Actual results could differ from those estimates. The accounting records of the Fund are maintained in U.S. dollars.
Portfolio valuation
Shares of the underlying funds and other mutual funds are valued at their net asset value.
Investments held by the underlying funds are valued as follows. Securities listed on a securities exchange for which market quotations are readily available are valued at the last sale price or official closing price on each business day, or if there is no such reported sale or official closing price, at the most recent quoted
9
GMO Global (U.S.+) Equity Allocation Fund
(A Series of GMO Trust)
Notes to Financial Statements — (Continued)
February 29, 2008
bid price. Unlisted securities for which market quotations are readily available are generally valued at the most recent quoted bid price. Short-term investments with a remaining maturity of sixty days or less are generally valued at amortized cost, which approximates fair value. Securities for which quotations are not readily available or whose values the Manager has determined to be unreliable are valued at fair value as determined in good faith by the Trustees or other persons acting at their direction pursuant to procedures approved by the Trustees. By its nature, a fair value price is a good faith estimate of the value of a security at a given point in time and may not reflect the value that would be realized if the security was sold and the differences could be material. Because many foreign equity securities markets and exchanges close prior to the close of the New York Stock Exchange ("NYSE"), closing prices for foreign securities in those markets or on those exchanges do not reflect the events that occur after that close but before the close of the NYSE. As a result, foreign equity securities are generally valued using fair value prices supplied by a third party vendor based on models to the extent that these fair value prices are available.
Repurchase agreements
The Fund may enter into repurchase agreements with banks and broker-dealers whereby the Fund acquires a security for cash and obtains a simultaneous commitment from the seller to repurchase the security at an agreed upon price and date. The Fund, through its custodian, takes possession of securities collateralizing the repurchase agreement. The collateral is marked to market daily to ensure that the market value of the underlying assets remains sufficient to protect the Fund in the event of default by the seller. Collateral for certain tri-party repurchase agreements is held at the counterparty's custodian in a segregated account for the benefit of the Fund and the counterparty. In connection with transactions in repurchase agreements, if the seller defaults or enters into insolvency proceedings and the value of the collateral declines, recovery of cash by the Fund may be delayed or limited. There were no repurchase agreements o utstanding at the end of the period.
Taxes and distributions
The Fund intends to qualify each tax year as a regulated investment company under Subchapter M of the Internal Revenue Code of 1986, as amended (the "Code"). The Fund intends to distribute substantially all of its net investment income and net realized short-term and long-term capital gains, if any, after giving effect to any available capital loss carryovers for U.S. federal income tax purposes. Therefore, no provision for U.S. federal income or excise tax is necessary.
The Fund's policy is to declare and pay distributions from net investment income, if any, semiannually, and from net realized short-term and long-term capital gains, if any, at least annually. All distributions are paid in shares of the Fund, at net asset value, unless the shareholder elects to receive cash distributions. Distributions to shareholders are recorded by the Fund on the ex-dividend date.
Income and capital gain distributions are determined in accordance with U.S. federal income tax regulations, which may differ from U.S. GAAP. Certain capital accounts in the financial statements are periodically adjusted for permanent differences in order to reflect their tax character. These adjustments
10
GMO Global (U.S.+) Equity Allocation Fund
(A Series of GMO Trust)
Notes to Financial Statements — (Continued)
February 29, 2008
have no impact on net assets or net asset value per share. Temporary differences which arise from recognizing certain items of income, expense, gain or loss in different periods for financial statement and tax purposes will reverse at some time in the future. Distributions in excess of net investment income or net realized gains are temporary over distributions for financial statement purposes resulting from differences in the recognition or classification of income or distributions for financial statement and tax purposes.
U.S. GAAP and tax accounting differences primarily relate to differing treatment of mutual fund distributions received.
The following reclassification represents the amount necessary to report the stated components of net assets on a tax basis, excluding certain temporary differences, as of February 29, 2008. The financial highlights exclude these adjustments.
| Accumulated Undistributed Net Investment Income | Accumulated Net Realized Gain | Paid-in Capital | |||||||||
| $ | 9,029,620 | $ | (9,029,620 | ) | $ | — | |||||
The tax character of distributions declared to shareholders is as follows:
| 2/29/2008 | 2/28/2007 | ||||||||||
| Ordinary income (including any short-term capital gains) | $ | 15,140,737 | $ | 10,707,997 | |||||||
| Long-term capital gains | 46,145,066 | 23,366,326 | |||||||||
| Total distributions | $ | 61,285,803 | $ | 34,074,323 | |||||||
Distributions in excess of tax basis earnings and profits, if significant, are reported in the financial statements as a tax return of capital.
As of February 29, 2008, the components of distributable earnings on a tax basis consisted of the following:
| Undistributed long–term capital gain | $ | 27,468,794 | |||||
11
GMO Global (U.S.+) Equity Allocation Fund
(A Series of GMO Trust)
Notes to Financial Statements — (Continued)
February 29, 2008
As of February 29, 2008, the approximate cost for U.S. federal income tax purposes and gross and net unrealized appreciation and depreciation in value of investments were as follows:
| Aggregate Cost | Gross Unrealized Appreciation | Gross Unrealized (Depreciation) | Net Unrealized Appreciation (Depreciation) | ||||||||||||
| $ | 374,559,358 | $ | 3,412,560 | $ | (21,417,620 | ) | $ | (18,005,060 | ) | ||||||
Security transactions and related investment income
Security transactions are accounted for on trade date. Income dividends and capital gain distributions from the underlying funds are recorded on the ex-dividend date. Interest income is recorded on the accrual basis. Non-cash dividends, if any, are recorded at the fair market value of the securities received. In determining the net gain or loss on securities sold, the cost of securities is determined on the identified cost basis.
Expenses
The majority of expenses of the Trust are directly identifiable to an individual fund. Expenses which are not readily identifiable to a specific fund are allocated taking into consideration, among other things, the nature and type of expense and the relative size of the funds. In addition, the Fund will also incur certain fees and expenses indirectly as a shareholder in the underlying funds. Because the underlying funds have varied expense and fee levels and the Fund may own different proportions of the underlying funds at different times, the amount of fees and expenses indirectly incurred by the Fund will vary (See Note 3).
State Street Bank and Trust Company ("State Street") serves as custodian, fund accounting agent and transfer agent of the Fund. State Street's fee may be reduced by credits that are an earnings allowance calculated on the average daily cash balances the Fund maintains with State Street. Credit balances used to reduce the fee paid to State Street, if any, are reported as a reduction of expenses in the Statement of Operations.
Purchase and redemption of Fund shares
As of February 29, 2008, the premium on cash purchases and fee on cash redemptions of Fund shares were each 0.10% of the amount invested or redeemed. The redemption fee is only applicable to shares acquired on or after June 30, 2003. The Fund's purchase premium and redemption fee are approximately equal to the weighted average of the purchase premiums and redemption fees, if any, of the underlying funds in which the Fund was invested as of June 30, 2007. The level of purchase premium and redemption fee for the Fund may be adjusted to account for changes in the Fund's investments (i.e., changes in the percentage of Fund assets allocated to each underlying fund). If the Manager determines that any portion of a cash purchase or redemption is offset by a corresponding cash redemption or purchase occurring on the same day, it will waive the purchase premium or redemption fee in an amount approximately equal to the fee with respect to that portion. In addition, the purchase premium or redemption fee charged by the Fund may be waived in
12
GMO Global (U.S.+) Equity Allocation Fund
(A Series of GMO Trust)
Notes to Financial Statements — (Continued)
February 29, 2008
extraordinary circumstances if the Fund will not incur transaction costs. All purchase premiums and redemption fees are paid to and recorded by the Fund as paid-in capital. The Manager will waive the purchase premium relating to the in-kind portion of a purchase transaction except to the extent of certain estimated or known transaction costs (e.g. stamp duties and transfer taxes) incurred by the Fund in connection with the transfer of the purchasing shareholder's securities to the Fund. In-kind redemption transactions are generally not subject to redemption fees except to the extent those transactions include a cash component. However, when a substantial portion of a Fund is being redeemed, the Fund may assess estimated or known transaction costs. There is no premium for reinvested distributions.
Investment risks
The Fund is subject to the investment risks associated with an investment in the underlying funds, some of which may invest in foreign securities. There are certain additional risks involved in investing in foreign securities that are not inherent in investments in U.S. securities. These risks may involve adverse political and economic developments, including the possible imposition of capital controls or other foreign governmental laws or restrictions. In addition, the securities of some foreign companies and securities markets are less liquid and at times more volatile than securities of comparable U.S. companies and U.S. securities markets. The risks described above apply to an even greater extent to investments in emerging markets. The securities markets of emerging countries are generally smaller, less developed, less liquid, and more volatile than the securities markets of the U.S. and developed foreign markets. Additional ly, the investment risks associated with an investment in the underlying funds may be more pronounced to the extent that the underlying funds engage in derivative transactions.
Recently issued accounting pronouncements
In June 2006, the Financial Accounting Standards Board ("FASB") issued FASB Interpretation No. 48, Accounting for Uncertainty in Income Taxes – an Interpretation of FASB Statement No. 109 ("FIN 48"). FIN 48 clarifies the accounting for uncertainty in income taxes recognized in accordance with FASB Statement No. 109, Accounting for Income Taxes. FIN 48 prescribes a recognition threshold and measurement attribute for a tax position taken or expected to be taken in the tax return that could impact the Fund's financial statements. It also provides guidance in relation to the Fund's financial statements on classification of tax benefits or liabilities, interest and penalties, accounting in interim periods, disclosure, and transition. FIN 48 is effective for fiscal years beginning after December 15, 2006 for registered investment companies. Management has evaluated the effects of applying the various provisions of FIN 48 and has determined that the adoption of FIN 48 does not have a material effect on the Fund's financial statements. The Fund's federal tax returns for the prior three fiscal years, if applicable, remain subject to examination by the Internal Revenue Service. Management will continue to monitor the rules and guidance pertaining to FIN 48 and will take action if appropriate.
In September 2006, the FASB issued Statement of Financial Accounting Standards No. 157 ("FAS 157"), "Fair Value Measurements." FAS 157 defines fair value, establishes a framework for measuring fair value in accordance with generally accepted accounting principles and expands disclosure about fair value
13
GMO Global (U.S.+) Equity Allocation Fund
(A Series of GMO Trust)
Notes to Financial Statements — (Continued)
February 29, 2008
measurements. FAS 157 is effective for fiscal years beginning after November 15, 2007. Management is currently evaluating the impact the adoption of FAS 157 will have on the Fund's financial statement disclosures.
3. Fees and other transactions with affiliates
The Manager determines the allocation of the assets of the Fund among designated underlying funds. The Manager does not directly charge an advisory fee or shareholder service fee, but receives management and shareholder service fees from the underlying funds in which the Fund invests.
The Manager has contractually agreed to reimburse the Fund for Fund expenses through at least June 30, 2008 (excluding expenses indirectly incurred by investment in the underlying funds, fees and expenses of the independent Trustees of the Trust, fees and expenses for legal services not approved by the Manager for the Trust, compensation and expenses of the Trust's Chief Compliance Officer ("CCO") (excluding any employee benefits), brokerage commissions, securities lending fees and expenses, interest expense, transfer taxes, and other investment-related costs (including expenses associated with investments in any company that is an investment company or would be an investment company under the 1940 Act, but for the exceptions to the definition of investment company provided in Section 3(c)(1) and 3(c)(7) of the 1940 Act), hedging transaction fees, extraordinary, non-recurring and certain other unusual expenses (including taxes)) .
The Fund incurs fees and expenses indirectly as a shareholder in the underlying funds. For the year ended February 29, 2008, these indirect fees and expenses expressed as an annualized percentage of the Fund's average daily net assets were as follows:
| Indirect Net Expenses (excluding shareholder service fees and interest expense) | Indirect Shareholder Service Fees | Indirect Interest Expense | Total Indirect Expenses | ||||||||||||
| 0.461 | % | 0.070 | % | 0.005 | % | 0.536 | % | ||||||||
The Fund's portion of the fees paid by the Trust to the independent Trustees and CCO during the year ended February 29, 2008 was $3,140 and $1,501, respectively. The compensation and expenses of the CCO are included in miscellaneous expenses in the Statement of Operations. No remuneration was paid by the Fund to any other officer of the Trust.
4. Purchases and sales of securities
Cost of purchases and proceeds from sales of securities, excluding short-term investments and class exchanges, for the year ended February 29, 2008 aggregated $158,127,116 and $110,630,018, respectively.
14
GMO Global (U.S.+) Equity Allocation Fund
(A Series of GMO Trust)
Notes to Financial Statements — (Continued)
February 29, 2008
5. Guarantees
In the normal course of business the Fund enters into contracts with third-party service providers that contain a variety of representations and warranties and which provide general indemnifications. The Fund's maximum exposure under these arrangements is unknown, as this would involve future claims that may be made against the Fund that have not yet occurred. Based on experience, management is of the view that the risk of loss in connection with these potential indemnification obligations is remote; however, there can be no assurance that material liabilities related to such obligations will not arise in the future that could adversely impact the Fund.
6. Principal shareholders and related parties
As of February 29, 2008, 36.94% of the outstanding shares of the Fund were held by two shareholders, each holding in excess of 10% of the Fund's outstanding shares. No other shareholder owned in excess of 10% of the outstanding shares of the Fund. Investment activities of these shareholders may have a material effect on the Fund.
As of February 29, 2008, less than 0.01% of the Fund's shares were held by one related party comprised of a certain GMO employee account.
7. Share transactions
The Declaration of Trust permits the Trustees to issue an unlimited number of shares of beneficial interest (without par value). Transactions in Fund shares were as follows:
| Year Ended February 29, 2008 | Year Ended February 28, 2007 | ||||||||||||||||||
| Class III: | Shares | Amount | Shares | Amount | |||||||||||||||
| Shares sold | 1,944,098 | $ | 23,157,515 | 2,417,813 | $ | 28,924,136 | |||||||||||||
| Shares issued to shareholders in reinvestment of distributions | 4,518,134 | 52,432,161 | 2,435,155 | 28,397,989 | |||||||||||||||
| Shares repurchased | (1,300,196 | ) | (16,394,251 | ) | (2,652,478 | ) | (31,974,097 | ) | |||||||||||
| Purchase premiums | — | 23,181 | — | 27,330 | |||||||||||||||
| Redemption fees | — | 9,382 | — | 522 | |||||||||||||||
| Net increase (decrease) | 5,162,036 | $ | 59,227,988 | 2,200,490 | $ | 25,375,880 | |||||||||||||
15
GMO Global (U.S.+) Equity Allocation Fund
(A Series of GMO Trust)
Notes to Financial Statements — (Continued)
February 29, 2008
8. Investments in affiliated issuers
A summary of the Fund's transactions in the shares of affiliated issuers during the year ended February 29, 2008 is set forth below:
| Affiliate | Value, beginning of period | Purchases | Sales Proceeds | Dividend Income | Distributions of Realized Gains | Value, end of period | |||||||||||||||||||||
| GMO Alpha Only Fund, Class IV | $ | 15,041,292 | $ | 13,444,659 | $ | 6,493,850 | $ | 444,659 | $ | — | $ | 22,706,205 | |||||||||||||||
| GMO Currency Hedged International Equity Fund, Class III | 13,289,885 | 3,054,603 | 14,283,031 | — | 3,054,603 | — | |||||||||||||||||||||
| GMO Emerging Countries Fund, Class III | 6,461,494 | 2,559,214 | — | 136,223 | 2,422,991 | 8,443,861 | |||||||||||||||||||||
| GMO Emerging Country Debt Fund, Class IV | 1,619,501 | 189,298 | — | 119,378 | 69,920 | 1,702,519 | |||||||||||||||||||||
| GMO Emerging Markets Fund, Class VI | 41,750,149 | 10,157,562 | 16,455,194 | 539,093 | 9,618,469 | 36,561,535 | |||||||||||||||||||||
| GMO Inflation Indexed Plus Bond Fund, Class VI | 4,216,442 | 10,602,612 | 14,842,209 | 77,292 | 31,472 | — | |||||||||||||||||||||
| GMO International Growth Equity Fund, Class IV | 47,402,591 | 7,339,550 | 23,419,506 | 403,904 | 5,775,380 | 29,271,874 | |||||||||||||||||||||
| GMO International Intrinsic Value Fund, Class IV | 47,550,628 | 6,425,309 | 21,277,527 | 796,046 | 4,493,737 | 28,827,179 | |||||||||||||||||||||
| GMO International Small Companies Fund, Class III | 543,039 | 18,798 | 540,138 | — | 18,798 | — | |||||||||||||||||||||
| GMO Short-Duration Investment Fund, Class III | 135,401 | 8,015 | — | 8,015 | — | 135,936 | |||||||||||||||||||||
| GMO SPV I, LLC | 67 | — | — | — | 637 | 49 | |||||||||||||||||||||
| GMO Strategic Fixed Income Fund, Class VI | 7,989,820 | 21,274 | 7,998,664 | 21,274 | — | — | |||||||||||||||||||||
| GMO U.S. Core Equity Fund, Class VI | 135,437,254 | 34,014,519 | 5,076,666 | 2,666,561 | 16,097,958 | 134,495,007 | |||||||||||||||||||||
| GMO U.S. Growth Fund, Class III | 43,339 | 671 | 25,000 | 269 | 402 | 17,965 | |||||||||||||||||||||
| GMO U.S. Quality Equity Fund, Class VI | 32,542,645 | 70,284,028 | — | 904,177 | 1,863,466 | 94,350,851 | |||||||||||||||||||||
| GMO U.S. Value Fund, Class III | 215,623 | 7,004 | 218,233 | 783 | 6,221 | — | |||||||||||||||||||||
| Totals | $ | 354,239,170 | $ | 158,127,116 | $ | 110,630,018 | $ | 6,117,674 | $ | 43,454,054 | $ | 356,512,981 | |||||||||||||||
16
GMO Global (U.S.+) Equity Allocation Fund
(A Series of GMO Trust)
Notes to Financial Statements — (Continued)
February 29, 2008
9. Subsequent event
Effective June 1, 2008, the Fund's benchmark will change to the MSCI ACWI (All Country World Index). In connection with the change in benchmark, the Fund's name will change to GMO Global Equity Allocation Fund on June 1, 2008.
17
Report of Independent Registered Public Accounting Firm
To the Trustees of GMO Trust and the Shareholders of
GMO Global (U.S.+) Equity Allocation Fund
In our opinion, the accompanying statement of assets and liabilities, including the schedule of investments, and the related statements of operations and of changes in net assets and the financial highlights present fairly, in all material respects, the financial position of GMO Global (U.S.+) Equity Allocation Fund (the "Fund") at February 29, 2008, the results of its operations for the year then ended, the changes in its net assets for each of the two years in the period then ended and the financial highlights for each of the five years in the period then ended, in conformity with accounting principles generally accepted in the United States of America. These financial statements and financial highlights (hereafter referred to as "financial statements") are the responsibility of the Fund's management; our responsibility is to express an opinion on these financial statements based on our audits. We conducted our audits of these financial statements in accordance with the standards of the Public Company Accounting Oversight Board (United States). Those standards require that we plan and perform the audit to obtain reasonable assurance about whether the financial statements are free of material misstatement. An audit includes examining, on a test basis, evidence supporting the amounts and disclosures in the financial statements, assessing the accounting principles used and significant estimates made by management, and evaluating the overall financial statement presentation. We believe that our audits, which included confirmation of securities at February 29, 2008 by correspondence with the custodian, provide a reasonable basis for our opinion.
PricewaterhouseCoopers LLP
Boston, Massachusetts
April 29, 2008
18
GMO Global (U.S.+) Equity Allocation Fund
(A Series of GMO Trust)
Fund Expenses
February 29, 2008 (Unaudited)
Expense Examples: The following information is in relation to expenses for the six month period ended February 29, 2008.
As a shareholder of the Fund, you may incur two types of costs: (1) transaction costs, including purchase premiums and redemption fees; and (2) ongoing costs including indirect management fees, shareholder service fees, and other Fund expenses. This example is intended to help you understand your ongoing costs (in dollars) of investing in the Fund and to compare these costs with the ongoing costs of investing in other mutual funds.
These examples are based on an investment of $1,000 invested at the beginning of the period and held for the entire period, September 1, 2007 through February 29, 2008.
Actual Expenses
The first line of the table below provides information about actual account values and actual expenses. You may use the information in this line, together with the amount you invested, to estimate the expenses that you paid over the period. Simply divide your account value by $1,000 (for example, a $10,000,000 account value divided by $1,000 = 10,000), then multiply the result by the number in the first line under the heading entitled "Net Expense Incurred" to estimate the expenses you paid on your account during this period.
Hypothetical Example for Comparison Purposes
The second line of the table below provides information about hypothetical account values and hypothetical expenses based on the Fund's actual expense ratio and an assumed rate of return of 5% per year before expenses, which is not the Fund's actual return. The hypothetical account values and expenses may not be used to estimate the actual ending account balance or expenses you paid for the period. You may use this information to compare the ongoing costs of investing in the Fund with other funds. To do so, compare this 5% hypothetical example with the 5% hypothetical examples that appear in the shareholder reports of other funds.
Please note that the expenses shown in the table are meant to highlight your ongoing costs only and do not reflect any transactional costs, such as purchase premiums and redemption fees. Therefore, the second line of the table is useful in comparing ongoing costs only, and will not help you determine the relative total costs of owning different funds. In addition, if these transactional costs were included, your costs would have been higher.
| Annualized Net Expense Ratio | Beginning Account Value | Ending Account Value | Net Expense Incurred* | ||||||||||||||||
| Class III | |||||||||||||||||||
| 1) Actual | 0.53 | % | $ | 1,000.00 | $ | 944.20 | $ | 2.56 | |||||||||||
| 2) Hypothetical | 0.53 | % | $ | 1,000.00 | $ | 1,022.23 | $ | 2.66 | |||||||||||
* Expenses are calculated using the Class's annualized expense ratio (including indirect expenses incurred) for the six months ended February 29, 2008, multiplied by the average account value over the period, multiplied by 182 days in the period, divided by 366 days in the year.
19
GMO Global (U.S.+) Equity Allocation Fund
(A Series of GMO Trust)
Tax Information for the Tax Year Ended February 29, 2008 (Unaudited)
The Fund will notify shareholders of amounts for use in preparing 2008 income tax forms in January 2009.
The Fund's distributions to shareholders include $46,145,066 from long-term capital gains.
For taxable, non-corporate shareholders, 41.68% of the income and short-term capital gains, if any, distributed in the Fund's fiscal year ended February 29, 2008 represents qualified dividend income subject to the 15% rate category.
For corporate shareholders, 27.09% of the income and short-term capital gains, if any, distributed in the Fund's fiscal year ended February 29, 2008 qualified for the dividends-received deduction.
The Fund hereby designates as qualified interest income with respect to its taxable year ended February 29, 2008, $8,386,949 or if determined to be different, the qualified interest income of such year.
20
Trustees and Officers (Unaudited)
The following tables list the Trust's Trustees and Officers as of the date of this report; their address and date of birth ("DOB"); their position with the Trust; the length of time holding that position with the Trust; their principal occupation(s) during the past five years; the number of portfolios in the fund complex they oversee; and other directorships they hold in companies subject to registration or reporting requirements of the Securities Exchange Act of 1934 (generally called "public companies") or in registered investment companies. The Trust's Statement of Additional Information ("SAI") includes additional information about the Trust's trustees, including changes subsequent to the date of the report. The SAI is available, without charge, upon request by writing GMO, c/o GMO Trust, 40 Rowes Wharf, Boston, MA 02110.
Independent Trustees:
| Name, Address, and DOB | Position(s) Held with Trust | Term of Office1 and Length of Time Served | Principal Occupation(s) During Past Five Years | Number of Portfolios in Fund Complex Overseen by Trustee | Other Directorships Held by Trustee | ||||||||||||||||||
| Donald W. Glazer, Esq. c/o GMO Trust 40 Rowes Wharf Boston, MA 02110 DOB: 07/26/1944 | Chairman of the Board of Trustees | Chairman of the Board of Trustees since March 2005; Lead Independent Trustee (September 2004 – March 2005); Trustee since December 2000. | Consultant – Law and Business2; Vice Chair (since 2002) and Secretary, Provant, Inc. (provider of personnel performance improvement services and training products); Author of Legal Treatises. | 47 | |||||||||||||||||||
1 Each Trustee is elected to serve during the continued lifetime of the Trust until he/she dies, resigns or is removed, or if sooner, until the next meeting of Shareholders called for the purpose of electing Trustees and until the election and qualification of his/her successor.
2 As part of Mr. Glazer's work as a consultant, he provides part-time consulting services to Goodwin Procter LLP ("Goodwin"). Goodwin has provided legal services to Renewable Resources, LLC, an affiliate of GMO; GMO, in connection with its relationship with Renewable Resources; and funds managed by Renewable Resources. Mr. Glazer has represented that he has no financial interest in, and is not involved in the provision of, such legal services. In the calendar years ended December 31, 2006 and December 31, 2007, these entities paid $825,738 and $291,721 respectively, in legal fees and disbursements to Goodwin.
21
Independent Trustees — (Continued)
| Name, Address, and DOB | Position(s) Held with Trust | Term of Office1 and Length of Time Served | Principal Occupation(s) During Past Five Years | Number of Portfolios in Fund Complex Overseen by Trustee | Other Directorships Held by Trustee | ||||||||||||||||||
| Jay O. Light c/o GMO Trust 40 Rowes Wharf Boston, MA 02110 DOB: 10/03/1941 | Trustee | Since May 1996. | Dean (since April 2006), Acting Dean (August 2005 – April 2006), Senior Associate Dean (1998 – 2005), and Professor of Business Administration, Harvard Business School. | 47 | Director of Harvard Management Company, Inc.3 and Verde, Inc.; Director of Partners HealthCare System, Inc. and Chair of its Investment Committee.4 | ||||||||||||||||||
| W. Nicholas Thorndike c/o GMO Trust 40 Rowes Wharf Boston, MA 02110 DOB: 03/28/1933 | Trustee | Since March 2005. | Director or trustee of various corporations and charitable organizations, including Courier Corporation (a book publisher and manufacturer) (July 1989 – present); Putnam Funds (December 1992 – June 2004); and Providence Journal (a newspaper publisher) (December 1986 – December 2003). | 47 | Director of Courier Corporation (a book publisher and manufacturer); Member of the Investment Committee of Partners HealthCare System, Inc.4 | ||||||||||||||||||
1 Each Trustee is elected to serve during the continued lifetime of the Trust until he/she dies, resigns or is removed, or if sooner, until the next meeting of Shareholders called for the purpose of electing Trustees and until the election and qualification of his/her successor.
3 Harvard Management Company, Inc. is a client of the Manager.
4 Partners HealthCare System, Inc. is a client of the Manager.
22
Principal Officers:
| Name, Address, and DOB | Position(s) Held with Trust | Term of Office5 and Length of Time Served | Principal Occupation(s) During Past Five Years | ||||||||||||
| Scott Eston c/o GMO Trust 40 Rowes Wharf Boston, MA 02110 DOB: 01/20/1956 | President and Chief Executive Officer | President and Chief Executive Officer since October 2002; Chief Financial Officer, November 2006 – February 2007. | Chief Financial Officer, Chief Operating Officer and Member, Grantham, Mayo, Van Otterloo & Co. LLC. | ||||||||||||
| Sheppard N. Burnett c/o GMO Trust 40 Rowes Wharf Boston, MA 02110 DOB: 10/24/1968 | Treasurer and Chief Financial Officer | Chief Financial Officer since March 2007; Treasurer since November 2006; Assistant Treasurer, September 2004 – November 2006. | Fund Administration Staff, Grantham, Mayo, Van Otterloo & Co. LLC (June 2004 – present); Vice President, Director of Tax, Columbia Management Group (2002 – 2004). | ||||||||||||
| Brent C. Arvidson c/o GMO Trust 40 Rowes Wharf Boston, MA 02110 DOB: 06/26/1969 | Assistant Treasurer | Since August 1998. | Senior Fund Administrator, Grantham, Mayo, Van Otterloo & Co. LLC. | ||||||||||||
| John L. Nasrah c/o GMO Trust 40 Rowes Wharf Boston, MA 02110 DOB: 05/27/1977 | Assistant Treasurer | Since March 2007. | Fund Administrator, Grantham, Mayo, Van Otterloo & Co. LLC (September 2004 – present); Tax Analyst, Bain & Company, Inc (June 2003 – September 2004); Senior Tax Associate, PricewaterhouseCoopers LLP (2001-2003). | ||||||||||||
| Mahmoodur Rahman c/o GMO Trust 40 Rowes Wharf Boston, MA 02110 DOB: 11/30/1967 | Assistant Treasurer | Since September 2007. | Fund Administrator, Grantham, Mayo, Van Otterloo & Co. (April 2007 – present); Vice President and Senior Tax Manager, Massachusetts Financial Services Company (January 2000 – April 2007). | ||||||||||||
5 Officers are elected to hold such office until their successor is elected and qualified to carry out the duties and responsibilities of their office, or until he or she resigns or is removed from office.
23
Principal Officers — (Continued)
| Name, Address, and DOB | Position(s) Held with Trust | Term of Office5 and Length of Time Served | Principal Occupation(s) During Past Five Years | ||||||||||||
| Michael E. Gillespie c/o GMO Trust 40 Rowes Wharf Boston, MA 02110 DOB: 02/18/1958 | Chief Compliance Officer | Since March 2005. | Vice President of Compliance (June 2004 – February 2005) and Director of Domestic Compliance (March 2002 – June 2004), Fidelity Investments; Vice President and Senior Counsel, State Street Bank and Trust Company (May 1998 – March 2002). | ||||||||||||
| Jason B. Harrison c/o GMO Trust 40 Rowes Wharf Boston, MA 02110 DOB: 01/29/1977 | Vice President and Clerk | Vice President since November 2006; Clerk since March 2006. | Legal Counsel, Grantham, Mayo, Van Otterloo & Co. LLC (since February 2006) and Attorney, Ropes & Gray LLP (September 2002 – February 2006). | ||||||||||||
| David L. Bohan c/o GMO Trust 40 Rowes Wharf Boston, MA 02110 DOB: 06/21/1964 | Vice President and Assistant Clerk | Vice President since March 2005; Assistant Clerk since March 2006. | Legal Counsel, Grantham, Mayo, Van Otterloo & Co. LLC (September 2003 – present); Attorney, Goodwin Procter LLP (September 1996 – September 2003). | ||||||||||||
| Gregory L. Pottle c/o GMO Trust 40 Rowes Wharf Boston, MA 02110 DOB: 07/09/1971 | Vice President and Assistant Clerk | Since November 2006. | Legal Counsel, Grantham, Mayo, Van Otterloo & Co. LLC. | ||||||||||||
| Anne K. Trinque c/o GMO Trust 40 Rowes Wharf Boston, MA 02110 DOB: 04/15/1978 | Vice President and Assistant Clerk | Since September 2007. | Legal Counsel, Grantham, Mayo, Van Otterloo & Co. LLC (since January 2007); Attorney, Goodwin Procter LLP (September 2003 – January 2007). | ||||||||||||
| Cheryl Wakeham c/o GMO Trust 40 Rowes Wharf Boston, MA 02110 DOB: 10/29/1958 | Anti-Money Laundering Officer | Since December 2004. | Manager, Client Service Administration, Grantham, Mayo, Van Otterloo & Co. LLC. | ||||||||||||
5 Officers are elected to hold such office until their successor is elected and qualified to carry out the duties and responsibilities of their office, or until he or she resigns or is removed from office.
24
GMO International Opportunities Equity Allocation Fund
(A Series of GMO Trust)
Annual Report
February 29, 2008
For a free copy of the Fund's proxy voting guidelines, shareholders may call 1-617-346-7646 (collect), visit our website at www.gmo.com, or visit the Securities and Exchange Commission's website at www.sec.gov. Information regarding how the Fund voted proxies relating to portfolio securities during the most recent 12-month period ended June 30 is available on our website at www.gmo.com, or on the Securities and Exchange Commission's website at www.sec.gov.
The Fund files its complete schedule of portfolio holdings with the Securities and Exchange Commission for the first and third quarter of each fiscal year on Form N-Q, which is available on the Commission's website at www.sec.gov. The Fund's Form N-Q may be reviewed and copied at the Commission's Public Reference Room in Washington, D.C. Information on the operation of the Public Reference Room may be obtained by calling 1-800-SEC-0330. The Fund has a policy with respect to disclosure of portfolio holdings under which it may also make available on GMO's website (www.gmo.com) a complete schedule of portfolio holdings.
This report is prepared for the general information of shareholders. It is authorized for distribution to prospective investors only when preceded or accompanied by a prospectus for the GMO Trust.
GMO International Opportunities Equity Allocation Fund
(A Series of GMO Trust)
Portfolio Management
Day-to-day management of the Fund's portfolio is the responsibility of the Asset Allocation Team at Grantham, Mayo, Van Otterloo & Co. LLC.
Management Discussion and Analysis of Fund Performance
The GMO International Opportunities Equity Allocation Fund returned +3.6% for the fiscal year ended February 29, 2008, as compared to +0.8% for the Fund's benchmark, the MSCI EAFE Index. During the fiscal year the Fund was exposed to global equity and fixed income securities through its investment in underlying GMO mutual funds.
Implementation was negative, detracting 0.3%. The primary drivers of the underperformance were negative relative returns from the GMO International Intrinsic Value and GMO Emerging Markets Opportunities Funds.
Asset allocation added 3.0%. The Fund's overweights to emerging market equities and international growth equities were the primary drivers of the relative outperformance.
The views expressed herein are exclusively those of Grantham, Mayo, Van Otterloo & Co. LLC Management as of the date of this report and are subject to change. GMO disclaims any responsibility to update such views. They are not meant as investment advice.
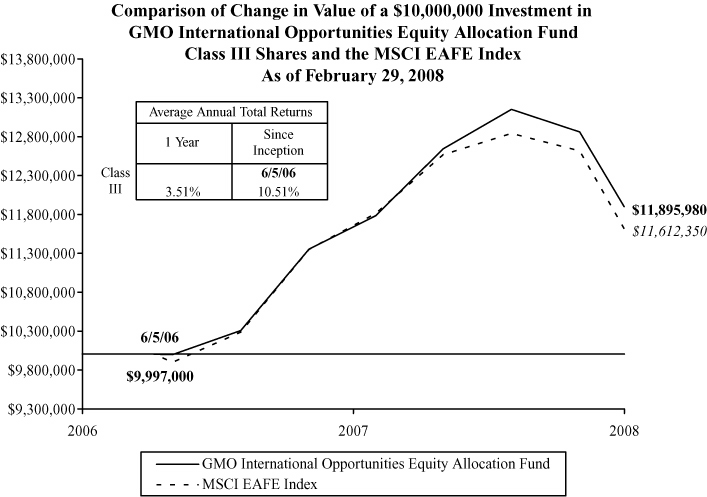
Performance data quoted represents past performance and is not indicative of future results. The investment return and principal value of an investment will fluctuate so that an investor's shares, when redeemed, may be worth more or less than their original cost. Current performance data may be lower or higher than the performance data provided herein. To obtain performance information to the most recent month-end, visit www.gmo.com. Performance shown is net of all fees after reimbursement from the Manager. Each performance figure assumes a purchase at the beginning and redemption at the end of the stated period and reflects a transaction fee of .03% on the purchase and .03% on the redemption. Transaction fees are retained by the Fund to cover trading costs. Returns would have been lower had certain expenses not been reimbursed during the periods shown and do not include the effect of taxes on distributions and redemptions. All information is unaudited.
GMO International Opportunities Equity Allocation Fund
(A Series of GMO Trust)
Investments Concentration Summary
February 29, 2008 (Unaudited)
| Asset Class Summary* | % of Total Net Assets | ||||||
| Common Stocks | 94.1 | % | |||||
| Short-Term Investments | 3.6 | ||||||
| Preferred Stocks | 1.2 | ||||||
| Forward Currency Contracts | 0.3 | ||||||
| Rights and Warrants | 0.0 | ||||||
| Futures | (0.6 | ) | |||||
| Other | 1.4 | ||||||
| 100.0 | % | ||||||
| Country / Region Summary** | % of Investments | ||||||
| Euro Region*** | 33.1 | % | |||||
| United Kingdom | 19.7 | ||||||
| Japan | 17.6 | ||||||
| Switzerland | 6.1 | ||||||
| Australia | 5.3 | ||||||
| Hong Kong | 2.9 | ||||||
| Singapore | 2.4 | ||||||
| Canada | 2.0 | ||||||
| Sweden | 1.7 | ||||||
| Denmark | 1.2 | ||||||
| China | 1.1 | ||||||
| Brazil | 1.1 | ||||||
| Korea | 1.0 | ||||||
| Taiwan | 0.9 | ||||||
| Russia | 0.8 | ||||||
| Norway | 0.8 | ||||||
| India | 0.6 | ||||||
| South Africa | 0.5 | ||||||
| Mexico | 0.4 | ||||||
| Malaysia | 0.2 | ||||||
| Israel | 0.2 | ||||||
| Thailand | 0.1 | ||||||
| Poland | 0.1 | ||||||
| Indonesia | 0.1 | ||||||
| Chile | 0.1 | ||||||
| 100.0 | % | ||||||
* The table above incorporates aggregate indirect asset class exposure associated with investments in other funds of GMO Trust ("underlying funds").
** The table above incorporates aggregate indirect country exposure associated with investments in the underlying funds. The table excludes short-term investments. The table includes exposure through the use of derivative contracts.
*** The "Euro Region" is comprised of Austria, Belgium, Finland, France, Germany, Greece, Ireland, Italy, Netherlands, Portugal and Spain.
1
GMO International Opportunities Equity Allocation Fund
(A Series of GMO Trust)
Schedule of Investments
(showing percentage of total net assets)
February 29, 2008
| Shares / Par Value ($) | Description | Value ($) | |||||||||||||
| MUTUAL FUNDS — 100.0% | |||||||||||||||
| Affiliated Issuers — 100.0% | |||||||||||||||
| 3,976,249 | GMO Emerging Markets Opportunities Fund, Class VI | 52,923,870 | |||||||||||||
| 12,162,489 | GMO International Growth Equity Fund, Class IV | 336,900,951 | |||||||||||||
| 10,966,765 | GMO International Intrinsic Value Fund, Class IV | 328,564,268 | |||||||||||||
| TOTAL MUTUAL FUNDS (COST $816,859,686) | 718,389,089 | ||||||||||||||
| SHORT-TERM INVESTMENTS — 0.0% | |||||||||||||||
| 40,397 | Eurodollar Time Deposit, 2.00%, due 03/03/08 | 40,397 | |||||||||||||
| TOTAL SHORT-TERM INVESTMENTS (COST $40,397) | 40,397 | ||||||||||||||
| TOTAL INVESTMENTS — 100.0% (Cost $816,900,083) | 718,429,486 | ||||||||||||||
| Other Assets and Liabilities (net) — (0.0%) | (39,663 | ) | |||||||||||||
| TOTAL NET ASSETS — 100.0% | $ | 718,389,823 | |||||||||||||
Notes to Schedule of Investments:
As of February 29, 2008, 87.30% of the Net Assets of the Fund, through investments in the underlying funds, were valued using fair value prices based on models used by a third party vendor (Note 2).
See accompanying notes to the financial statements.
2
GMO International Opportunities Equity Allocation Fund
(A Series of GMO Trust)
Statement of Assets and Liabilities — February 29, 2008
| Assets: | |||||||
| Investments in unaffiliated issuers, at value (cost $40,397) (Note 2) | $ | 40,397 | |||||
| Investments in affiliated issuers, at value (cost $816,859,686) (Notes 2 and 8) | 718,389,089 | ||||||
| Receivable for Fund shares sold | 534,254 | ||||||
| Receivable for expenses reimbursed by Manager (Note 3) | 17,951 | ||||||
| Total assets | 718,981,691 | ||||||
| Liabilities: | |||||||
| Payable for investments purchased | 534,252 | ||||||
| Payable to affiliate for (Note 3): | |||||||
| Trustees and Chief Compliance Officer of GMO Trust fees | 813 | ||||||
| Accrued expenses | 56,803 | ||||||
| Total liabilities | 591,868 | ||||||
| Net assets | $ | 718,389,823 | |||||
| Net assets consist of: | |||||||
| Paid-in capital | $ | 761,832,051 | |||||
| Accumulated net realized gain | 55,028,369 | ||||||
| Net unrealized depreciation | (98,470,597 | ) | |||||
| $ | 718,389,823 | ||||||
| Net assets attributable to: | |||||||
| Class III shares | $ | 718,389,823 | |||||
| Shares outstanding: | |||||||
| Class III | 34,821,517 | ||||||
| Net asset value per share: | |||||||
| Class III | $ | 20.63 | |||||
See accompanying notes to the financial statements.
3
GMO International Opportunities Equity Allocation Fund
(A Series of GMO Trust)
Statement of Operations — Year Ended February 29, 2008
| Investment Income: | |||||||
| Dividends from affiliated issuers (Note 8) | $ | 13,237,710 | |||||
| Interest | 1,145 | ||||||
| Total investment income | 13,238,855 | ||||||
| Expenses: | |||||||
| Custodian, fund accounting agent and transfer agent fees | 70,357 | ||||||
| Audit and tax fees | 31,279 | ||||||
| Legal fees | 13,060 | ||||||
| Trustees fees and related expenses (Note 3) | 6,159 | ||||||
| Registration fees | 10,150 | ||||||
| Miscellaneous | 8,012 | ||||||
| Total expenses | 139,017 | ||||||
| Fees and expenses reimbursed by Manager (Note 3) | (129,866 | ) | |||||
| Expense reductions (Note 2) | (34,238 | ) | |||||
| Net expenses | (25,087 | ) | |||||
| Net investment income (loss) | 13,263,942 | ||||||
| Realized and unrealized gain (loss): | |||||||
| Net realized gain (loss) on: | |||||||
| Investments in affiliated issuers | 3,034,369 | ||||||
| Realized gains distributions from affiliated issuers (Note 8) | 95,391,129 | ||||||
| Net realized gain (loss) | 98,425,498 | ||||||
| Change in net unrealized appreciation (depreciation) on: | |||||||
| Investments in affiliated issuers | (103,922,554 | ) | |||||
| Net realized and unrealized gain (loss) | (5,497,056 | ) | |||||
| Net increase (decrease) in net assets resulting from operations | $ | 7,766,886 | |||||
See accompanying notes to the financial statements.
4
GMO International Opportunities Equity Allocation Fund
(A Series of GMO Trust)
Statement of Changes in Net Assets
| Year Ended February 29, 2008 | Period from June 5, 2006 (commencement of operations) through February 28, 2007 | ||||||||||
| Increase (decrease) in net assets: | |||||||||||
| Operations: | |||||||||||
| Net investment income (loss) | $ | 13,263,942 | $ | 5,620,257 | |||||||
| Net realized gain (loss) | 98,425,498 | 26,438,804 | |||||||||
| Change in net unrealized appreciation (depreciation) | (103,922,554 | ) | 5,451,957 | ||||||||
| Net increase (decrease) in net assets from operations | 7,766,886 | 37,511,018 | |||||||||
| Distributions to shareholders from: | |||||||||||
| Net investment income | |||||||||||
| Class III | (38,253,569 | ) | (12,345,406 | ) | |||||||
| Net realized gains | |||||||||||
| Class III | (36,477,386 | ) | (1,643,771 | ) | |||||||
| (74,730,955 | ) | (13,989,177 | ) | ||||||||
| Net share transactions (Note 7): | |||||||||||
| Class III | 344,825,641 | 416,780,789 | |||||||||
| Purchase premiums and redemption fees (Notes 2 and 7): | |||||||||||
| Class III | 96,754 | 128,867 | |||||||||
| Total increase (decrease) in net assets resulting from net share transactions, purchase premiums and redemption fees | 344,922,395 | 416,909,656 | |||||||||
| Total increase (decrease) in net assets | 277,958,326 | 440,431,497 | |||||||||
| Net assets: | |||||||||||
| Beginning of period | 440,431,497 | — | |||||||||
| End of period (including accumulated undistributed net investment income of $0 and $4,291, respectively) | $ | 718,389,823 | $ | 440,431,497 | |||||||
See accompanying notes to the financial statements.
5
GMO International Opportunities Equity Allocation Fund
(A Series of GMO Trust)
Financial Highlights
(For a Class III share outstanding throughout each period)
| Year Ended February 29, 2008 | Period from June 5, 2006 (commencement of operations) through February 28, 2007 | ||||||||||
| Net asset value, beginning of period | $ | 22.16 | $ | 20.00 | |||||||
| Income (loss) from investment operations: | |||||||||||
| Net investment income (loss)(a)† | 0.47 | 0.53 | |||||||||
| Net realized and unrealized gain (loss) | 0.52 | 2.45 | |||||||||
| Total from investment operations | 0.99 | 2.98 | |||||||||
| Less distributions to shareholders: | |||||||||||
| From net investment income | (1.24 | ) | (0.72 | ) | |||||||
| From net realized gains | (1.28 | ) | (0.10 | ) | |||||||
| Total distributions | (2.52 | ) | (0.82 | ) | |||||||
| Net asset value, end of period | $ | 20.63 | $ | 22.16 | |||||||
| Total Return(b) | 3.57 | % | 14.93 | %** | |||||||
| Ratios/Supplemental Data: | |||||||||||
| Net assets, end of period (000's) | $ | 718,390 | $ | 440,431 | |||||||
| Net expenses to average daily net assets(c)(d) | 0.00 | %(e) | 0.00 | %* | |||||||
| Net investment income to average daily net assets(a) | 2.04 | % | 3.32 | %* | |||||||
| Portfolio turnover rate | 4 | % | 1 | %** | |||||||
| Fees and expenses reimbursed by the Manager to average daily net assets: | 0.02 | % | 0.03 | %* | |||||||
| Purchase premiums and redemption fees consisted of the following per share amounts:† | $ | 0.00 | (f) | $ | 0.01 | ||||||
(a) Net investment income is affected by the timing of the declaration of dividends by the underlying funds in which the Fund invests.
(b) The total returns would have been lower had certain expenses not been reimbursed during the periods shown and assumes the effect of reinvested distributions. Calculation excludes purchase premiums and redemption fees which are borne by the shareholder.
(c) Net expenses to average daily net assets were less than 0.01%.
(d) Net expenses exclude expenses incurred indirectly through investment in the underlying funds (See Note 3).
(e) The net expense ratio does not include the effect of expense reductions.
(f) Purchase premiums and redemption fees were less than $0.01 per share.
† Calculated using average shares outstanding throughout the period.
* Annualized.
** Not annualized.
See accompanying notes to the financial statements.
6
GMO International Opportunities Equity Allocation Fund
(A Series of GMO Trust)
Notes to Financial Statements
February 29, 2008
1. Organization
GMO International Opportunities Equity Allocation Fund (the "Fund"), is a series of GMO Trust (the "Trust"). The Fund is registered under the Investment Company Act of 1940, as amended, as an open-end, diversified management investment company. The Fund is advised and managed by Grantham, Mayo, Van Otterloo & Co. LLC (the "Manager" or "GMO"). The Trust was established as a Massachusetts business trust under the laws of the Commonwealth of Massachusetts on June 24, 1985. The Declaration of Trust permits the Trustees of the Trust ("Trustees") to create an unlimited number of series of shares ("Funds") and to subdivide Funds into classes.
The Fund seeks total return greater than that of the MSCI EAFE Index (Europe, Australasia, and Far East). The Fund is a fund of funds and invests primarily in shares of the GMO International Equity Funds (which may include one or more of the GMO Emerging Markets Funds). The Fund may also invest in shares of other GMO Funds, including the GMO Fixed Income Funds, GMO Alpha Only Fund, and GMO Alternative Asset Opportunity Fund.
The financial statements of the series of the Trust in which the Fund invests ("underlying funds") should be read in conjunction with the Fund's financial statements. These financial statements are available, without charge, upon request, by calling (617) 346-7646 (collect) or by visiting GMO's website at www.gmo.com.
2. Significant accounting policies
The following is a summary of significant accounting policies which are in conformity with accounting principles generally accepted in the United States of America ("U.S. GAAP") and which are consistently followed by the Fund in the preparation of its financial statements. The preparation of financial statements in accordance with U.S. GAAP requires management to make estimates and assumptions that affect the reported amounts and disclosures in the financial statements. Actual results could differ from those estimates. The accounting records of the Fund are maintained in U.S. dollars.
Portfolio valuation
Shares of the underlying funds and other mutual funds are valued at their net asset value.
Investments held by the underlying funds are valued as follows. Securities listed on a securities exchange for which market quotations are readily available are valued at the last sale price or official closing price on each business day, or if there is no such reported sale or official closing price, at the most recent quoted bid price. Unlisted securities for which market quotations are readily available are generally valued at the most recent quoted bid price. Short-term investments with a remaining maturity of sixty days or less are generally valued at amortized cost, which approximates fair value. Securities for which quotations are not readily available or whose values the Manager has determined to be unreliable are valued at fair value as
7
GMO International Opportunities Equity Allocation Fund
(A Series of GMO Trust)
Notes to Financial Statements — (Continued)
February 29, 2008
determined in good faith by the Trustees or other persons acting at their direction pursuant to procedures approved by the Trustees. By its nature, a fair value price is a good faith estimate of the value of a security at a given point in time and may not reflect the value that would be realized if the security was sold and the differences could be material. Because many foreign equity securities markets and exchanges close prior to the close of the New York Stock Exchange ("NYSE"), closing prices for foreign securities in those markets or on those exchanges do not reflect the events that occur after that close but before the close of the NYSE. As a result, foreign equity securities are generally valued using fair value prices supplied by a third party vendor based on models to the extent that these fair value prices are available.
Repurchase agreements
The Fund may enter into repurchase agreements with banks and broker-dealers whereby the Fund acquires a security for cash and obtains a simultaneous commitment from the seller to repurchase the security at an agreed upon price and date. The Fund, through its custodian, takes possession of securities collateralizing the repurchase agreement. The collateral is marked to market daily to ensure that the market value of the underlying assets remains sufficient to protect the Fund in the event of default by the seller. Collateral for certain tri-party repurchase agreements is held at the counterparty's custodian in a segregated account for the benefit of the Fund and the counterparty. In connection with transactions in repurchase agreements, if the seller defaults or enters into insolvency proceedings and the value of the collateral declines, recovery of cash by the Fund may be delayed or limited. There were no repurchase agreements o utstanding at the end of the period.
Taxes and distributions
The Fund intends to qualify each tax year as a regulated investment company under Subchapter M of the Internal Revenue Code of 1986, as amended (the "Code"). The Fund intends to distribute substantially all of its net investment income and net realized short-term and long-term capital gains, if any, after giving effect to any available capital loss carryovers for U.S. federal income tax purposes. Therefore, no provision for U.S. federal income or excise tax is necessary.
The Fund's policy is to declare and pay distributions from net investment income, if any, semiannually, and from net realized short-term and long-term capital gains, if any, at least annually. All distributions are paid in shares of the Fund, at net asset value, unless the shareholder elects to receive cash distributions. Distributions to shareholders are recorded by the Fund on the ex-dividend date.
Income and capital gain distributions are determined in accordance with U.S. federal income tax regulations, which may differ from U.S. GAAP. Certain capital accounts in the financial statements are periodically adjusted for permanent differences in order to reflect their tax character. These adjustments have no impact on net assets or net asset value per share. Temporary differences which arise from recognizing certain items of income, expense, gain or loss in different periods for financial statement and tax purposes will reverse at some time in the future. Distributions in excess of net investment income or net realized gains are temporary over distributions for financial statement purposes resulting
8
GMO International Opportunities Equity Allocation Fund
(A Series of GMO Trust)
Notes to Financial Statements — (Continued)
February 29, 2008
from differences in the recognition or classification of income or distributions for financial statement and tax purposes.
U.S. GAAP and tax accounting differences primarily relate to differing treatment of mutual fund distributions received.
The following reclassification represents the amount necessary to report the stated components of net assets on a tax basis, excluding certain temporary differences, as of February 29, 2008. The financial highlights exclude these adjustments.
| Distributions in Excess of Net Investment Income | Accumulated Net Realized Gain | Paid-in Capital | |||||||||
| $ | 24,985,336 | $ | (24,985,336 | ) | $ | — | |||||
The tax character of distributions declared to shareholders is as follows:
| 2/29/2008 | 2/28/2007 | ||||||||||
| Ordinary income (including any short-term capital gains) | $ | 39,207,726 | $ | 12,345,406 | |||||||
| Long-term capital gains | 35,523,229 | 1,643,771 | |||||||||
| Total distributions | $ | 74,730,955 | $ | 13,989,177 | |||||||
Distributions in excess of tax basis earnings and profits, if significant, are reported in the financial statements as a tax return of capital.
As of February 29, 2008, the components of distributable earnings on a tax basis consisted of the following:
Undistributed long-term capital gain $55,095,813
As of February 29, 2008, the approximate cost for U.S. federal income tax purposes and gross and net unrealized appreciation and depreciation in value of investments were as follows:
| Aggregate Cost | Gross Unrealized Appreciation | Gross Unrealized (Depreciation) | Net Unrealized Appreciation (Depreciation) | ||||||||||||
| $ | 816,967,527 | $ | 5,805,654 | $ | (104,343,695 | ) | $ | (98,538,041 | ) | ||||||
9
GMO International Opportunities Equity Allocation Fund
(A Series of GMO Trust)
Notes to Financial Statements — (Continued)
February 29, 2008
Security transactions and related investment income
Security transactions are accounted for on trade date. Income dividends and capital gain distributions from the underlying funds are recorded on the ex-dividend date. Interest income is recorded on the accrual basis. Non-cash dividends, if any, are recorded at the fair market value of the securities received. In determining the net gain or loss on securities sold, the cost of securities is determined on the identified cost basis.
Expenses
The majority of expenses of the Trust are directly identifiable to an individual fund. Expenses which are not readily identifiable to a specific fund are allocated taking into consideration, among other things, the nature and type of expense and the relative size of the funds. In addition, the Fund will also incur certain fees and expenses indirectly as a shareholder in the underlying funds. Because the underlying funds have varied expense and fee levels and the Fund may own different proportions of the underlying funds at different times, the amount of fees and expenses indirectly incurred by the Fund will vary (See Note 3).
State Street Bank and Trust Company ("State Street") serves as custodian, fund accounting agent and transfer agent of the Fund. State Street's fee may be reduced by credits that are an earnings allowance calculated on the average daily cash balances the Fund maintains with State Street. Credit balances used to reduce the fee paid to State Street, if any, are reported as a reduction of expenses in the Statement of Operations.
Purchases and redemptions of Fund shares
As of February 29, 2008, the premium on cash purchases and fee on cash redemptions of Fund shares are each 0.03% of the amount invested. The Fund's purchase premium or redemption fee are approximately equal to the weighted average of the purchase premiums and redemptions fees, if any, of the underlying funds in which the Fund was invested as of June 30, 2007. The level of purchase premium and redemption fee for the Fund may be adjusted to account for changes in the Fund's investments (i.e., changes in the percentage of Fund assets allocated to each underlying fund). If the Manager determines that any portion of a cash purchase or redemption is offset by a corresponding cash redemption or purchase occurring on the same day, it will waive the purchase premium or redemption fee in an amount approximately equal to the fee with respect to that portion. In addition, the purchase premium or redemption fee charged by the Fund may be wai ved in extraordinary circumstances if the Fund will not incur transaction costs. All purchase premiums and redemption fees are paid to and recorded by the Fund as paid-in capital. The Manager will waive the purchase premium relating to the in-kind portion of a purchase transaction except to the extent of certain estimated or known transaction costs (e.g. stamp duties and transfer taxes) incurred by the Fund in connection with the transfer of the purchasing shareholder's securities to the Fund. In-kind redemption transactions are generally not subject to redemption fees except to the extent those transactions include a cash component. However, when a substantial portion of a Fund is being redeemed, the Fund may assess estimated or known transaction costs. There is no premium for reinvested distributions.
10
GMO International Opportunities Equity Allocation Fund
(A Series of GMO Trust)
Notes to Financial Statements — (Continued)
February 29, 2008
Investment risks
The Fund is subject to the investment risks associated with an investment in the underlying funds, some of which may invest in foreign securities. There are certain additional risks involved in investing in foreign securities that are not inherent in investments in U.S. securities. These risks may involve adverse political and economic developments, including the possible imposition of capital controls or other foreign governmental laws or restrictions. In addition, the securities of some foreign companies and securities markets are less liquid and at times more volatile than securities of comparable U.S. companies and U.S. securities markets. The risks described above apply to an even greater extent to investments in emerging markets. The securities markets of emerging countries are generally smaller, less developed, less liquid, and more volatile than the securities markets of the U.S. and developed foreign markets. Additional ly, the investment risks associated with an investment in the underlying funds may be more pronounced to the extent that the underlying funds engage in derivative transactions.
Recently issued accounting pronouncements
In June 2006, the Financial Accounting Standards Board ("FASB") issued FASB Interpretation No. 48, Accounting for Uncertainty in Income Taxes – an Interpretation of FASB Statement No. 109 ("FIN 48"). FIN 48 clarifies the accounting for uncertainty in income taxes recognized in accordance with FASB Statement No. 109, Accounting for Income Taxes. FIN 48 prescribes a recognition threshold and measurement attribute for a tax position taken or expected to be taken in the tax return that could impact the Fund's financial statements. It also provides guidance in relation to the Fund's financial statements on classification of tax benefits or liabilities, interest and penalties, accounting in interim periods, disclosure, and transition. FIN 48 is effective for fiscal years beginning after December 15, 2006 for registered investment companies. Management has evaluated the effects of applying the various provisions of FIN 48 and has determined that the adoption of FIN 48 does not have a material effect on the Fund's financial statements. The Fund's federal tax returns for the prior three fiscal years, if applicable, remain subject to examination by the Internal Revenue Service. Management will continue to monitor the rules and guidance pertaining to FIN 48 and will take action if appropriate.
In September 2006, the FASB issued Statement of Financial Accounting Standards No. 157 ("FAS 157"), "Fair Value Measurements." FAS 157 defines fair value, establishes a framework for measuring fair value in accordance with generally accepted accounting principles and expands disclosure about fair value measurements. FAS 157 is effective for fiscal years beginning after November 15, 2007. Management is currently evaluating the impact the adoption of FAS 157 will have on the Fund's financial statement disclosures.
3. Fees and other transactions with affiliates
The Manager determines the allocation of the assets of the Fund among designated underlying funds. The Manager does not directly charge a management fee or shareholder service fee from the Fund, but receives management and shareholder service fees from the underlying funds in which the Fund invests.
11
GMO International Opportunities Equity Allocation Fund
(A Series of GMO Trust)
Notes to Financial Statements — (Continued)
February 29, 2008
The Manager has contractually agreed to reimburse the Fund for Fund expenses through at least June 30, 2008 (excluding expenses indirectly incurred by investment in the underlying funds, fees and expenses of the independent Trustees of the Trust, fees and expenses for legal services not approved by the Manager for the Trust, compensation and expenses of the Trust's Chief Compliance Officer ("CCO") (excluding any employee benefits), brokerage commissions, securities lending fees and expenses, interest expense, transfer taxes, and other investment-related costs (including expenses associated with investments in any company that is an investment company or would be an investment company under the 1940 Act, but for the exceptions to the definition of investment company provided in Section 3(c)(1) and 3(c)(7) of the 1940 Act), hedging transaction fees, extraordinary, non-recurring and certain other unusual expenses (including taxes)) .
The Fund incurs fees and expenses indirectly as a shareholder in the underlying funds. For the year ended February 29, 2008, these indirect fees and expenses expressed as an annualized percentage of the Fund's average daily net assets were as follows:
| Indirect Net Expenses (excluding shareholder service fees) | Indirect Shareholder Service Fees | Total Indirect Expenses | |||||||||
| 0.534 | % | 0.088 | % | 0.622 | % | ||||||
The Fund's portion of the fees paid by the Trust to the independent Trustees and CCO during the year ended February 29, 2008 was $5,361 and $2,983, respectively. The compensation and expenses of the CCO are included in miscellaneous expenses in the Statement of Operations. No remuneration was paid by the Fund to any other officer of the Trust.
4. Purchases and sales of securities
Cost of purchases and proceeds from sales of securities, excluding short-term investments and class exchanges, for the year ended February 29, 2008 aggregated $406,291,575 and $27,434,670, respectively.
5. Guarantees
In the normal course of business the Fund enters into contracts with third-party service providers that contain a variety of representations and warranties and which provide general indemnifications. The Fund's maximum exposure under these arrangements is unknown, as this would involve future claims that may be made against the Fund that have not yet occurred. Based on experience, management is of the view that the risk of loss in connection with these potential indemnification obligations is remote; however, there can be no assurance that material liabilities related to such obligations will not arise in the future that could adversely impact the Fund.
12
GMO International Opportunities Equity Allocation Fund
(A Series of GMO Trust)
Notes to Financial Statements — (Continued)
February 29, 2008
6. Principal shareholders and related parties
As of February 29, 2008, 13.04% of the outstanding shares of the Fund were held by one shareholder. No other shareholder owned in excess of 10% of the outstanding shares of the Fund. Investment activities of this shareholder may have a material effect on the Fund.
As of February 29, 2008, less than 0.01% of the Fund's shares were held by one related party comprised of a certain GMO employee account.
7. Share transactions
The Declaration of Trust permits the Trustees to issue an unlimited number of shares of beneficial interest (without par value). Transactions in Fund shares were as follows:
| Year Ended February 29, 2008 | Period from June 5, 2006 (commencement of operations) through February 28, 2007 | ||||||||||||||||||
| Class III: | Shares | Amount | Shares | Amount | |||||||||||||||
| Shares sold | 12,892,226 | $ | 299,095,066 | 19,331,326 | $ | 404,772,482 | |||||||||||||
| Shares issued to shareholders in reinvestment of distributions | 3,158,687 | 72,167,816 | 583,800 | 12,808,557 | |||||||||||||||
| Shares repurchased | (1,108,147 | ) | (26,437,241 | ) | (36,375 | ) | (800,250 | ) | |||||||||||
| Purchase premiums | — | 89,316 | — | 128,627 | |||||||||||||||
| Redemption fees | — | 7,438 | — | 240 | |||||||||||||||
| Net increase (decrease) | 14,942,766 | $ | 344,922,395 | 19,878,751 | $ | 416,909,656 | |||||||||||||
8. Investments in affiliated issuers
A summary of the Fund's transactions in the shares of affiliated issuers during the year ended February 29, 2008 is set forth below:
| Affiliate | Value, beginning of period | Purchases | Sales Proceeds | Dividend Income | Distributions of Realized Gains | Value, end of period | |||||||||||||||||||||
| GMO Emerging Markets Opportunities Fund, Class VI | $ | 30,555,475 | $ | 20,078,128 | $ | 2,662,842 | $ | 1,028,973 | $ | 3,132,928 | $ | 52,923,870 | |||||||||||||||
| GMO International Growth Equity Fund, Class IV | 204,814,359 | 194,984,028 | 16,425,685 | 4,126,964 | 51,312,823 | 336,900,951 | |||||||||||||||||||||
| GMO International Intrinsic Value Fund, Class IV | 205,050,535 | 191,229,419 | 8,346,143 | 8,081,773 | 40,945,378 | 328,564,268 | |||||||||||||||||||||
| Totals | $ | 440,420,369 | $ | 406,291,575 | $ | 27,434,670 | $ | 13,237,710 | $ | 95,391,129 | $ | 718,389,089 | |||||||||||||||
13
Report of Independent Registered Public Accounting Firm
To the Trustees of GMO Trust and the Shareholders of
GMO International Opportunities Equity Allocation Fund
In our opinion, the accompanying statement of assets and liabilities, including the schedule of investments, and the related statements of operations and of changes in net assets and the financial highlights present fairly, in all material respects, the financial position of GMO International Opportunities Equity Allocation Fund (the "Fund") at February 29, 2008, the results of its operations for the year then ended, the changes in its net assets for each of the two years in the period then ended and the financial highlights for each of the periods indicated, in conformity with accounting principles generally accepted in the United States of America. These financial statements and financial highlights (hereafter referred to as "financial statements") are the responsibility of the Fund's management; our responsibility is to express an opinion on these financial statements based on our audits. We conducted our audits of these fina ncial statements in accordance with the standards of the Public Company Accounting Oversight Board (United States). Those standards require that we plan and perform the audit to obtain reasonable assurance about whether the financial statements are free of material misstatement. An audit includes examining, on a test basis, evidence supporting the amounts and disclosures in the financial statements, assessing the accounting principles used and significant estimates made by management, and evaluating the overall financial statement presentation. We believe that our audits, which included confirmation of securities at February 29, 2008 by correspondence with the custodian, provide a reasonable basis for our opinion.
PricewaterhouseCoopers LLP
Boston, Massachusetts
April 29, 2008
14
GMO International Opportunities Equity Allocation Fund
(A Series of GMO Trust)
Fund Expenses
February 29, 2008 (Unaudited)
Expense Examples: The following information is in relation to expenses for the six month period ended February 29, 2008.
As a shareholder of the Fund, you may incur two types of costs: (1) transaction costs, including purchase premiums and redemption fees; and (2) ongoing costs including indirect management fees, shareholder service fees, and other Fund expenses. This example is intended to help you understand your ongoing costs (in dollars) of investing in the Fund and to compare these costs with the ongoing costs of investing in other mutual funds.
These examples are based on an investment of $1,000 invested at the beginning of the period and held for the entire period, September 1, 2007 through February 29, 2008.
Actual Expenses
The first line of the table below provides information about actual account values and actual expenses. You may use the information in this line, together with the amount you invested, to estimate the expenses that you paid over the period. Simply divide your account value by $1,000 (for example, a $10,000,000 account value divided by $1,000 = 10,000), then multiply the result by the number in the first line under the heading entitled "Net Expense Incurred" to estimate the expenses you paid on your account during this period.
Hypothetical Example for Comparison Purposes
The second line of the table below provides information about hypothetical account values and hypothetical expenses based on the Fund's actual expense ratio and an assumed rate of return of 5% per year before expenses, which is not the Fund's actual return. The hypothetical account values and expenses may not be used to estimate the actual ending account balance or expenses you paid for the period. You may use this information to compare the ongoing costs of investing in the Fund with other funds. To do so, compare this 5% hypothetical example with the 5% hypothetical examples that appear in the shareholder reports of other funds.
Please note that the expenses shown in the table are meant to highlight your ongoing costs only and do not reflect any transactional costs, such as purchase premiums and redemption fees. Therefore, the second line of the table is useful in comparing ongoing costs only, and will not help you determine the relative total costs of owning different funds. In addition, if these transactional costs were included, your costs would have been higher.
| Annualized Net Expense Ratio | Beginning Account Value | Ending Account Value | Net Expense Incurred* | ||||||||||||||||
| Class III | |||||||||||||||||||
| 1) Actual | 0.62 | % | $ | 1,000.00 | $ | 962.10 | $ | 3.02 | |||||||||||
| 2) Hypothetical | 0.62 | % | $ | 1,000.00 | $ | 1,021.78 | $ | 3.12 | |||||||||||
* Expenses are calculated using the Class's annualized net expense ratio (including indirect expenses incurred) for the six months ended February 29, 2008, multiplied by the average account value over the period, multiplied by 182 days in the period, divided by 366 days in the year.
15
GMO International Opportunities Equity Allocation Fund
(A Series of GMO Trust)
Tax Information for the Tax Year Ended February 29, 2008 (Unaudited)
The Fund will notify shareholders of amounts for use in preparing 2008 income tax forms in January 2009.
The Fund's distributions to shareholders include $35,523,229 from long-term capital gains.
For taxable, non-corporate shareholders, 40.80% of the income and short-term capital gains, if any, distributed in the Fund's fiscal year ended February 29, 2008 represents qualified dividend income subject to the 15% rate category.
The Fund hereby designates as qualified interest income and qualified short-term capital gains with respect to its taxable year ended February 29, 2008, $22,765,695 and $957,523, respectively, or if determined to be different, the qualified interest income and qualified short-term gains of such year.
16
Trustees and Officers (Unaudited)
The following tables list the Trust's Trustees and Officers as of the date of this report; their address and date of birth ("DOB"); their position with the Trust; the length of time holding that position with the Trust; their principal occupation(s) during the past five years; the number of portfolios in the fund complex they oversee; and other directorships they hold in companies subject to registration or reporting requirements of the Securities Exchange Act of 1934 (generally called "public companies") or in registered investment companies. The Trust's Statement of Additional Information ("SAI") includes additional information about the Trust's trustees, including changes subsequent to the date of the report. The SAI is available, without charge, upon request by writing GMO, c/o GMO Trust, 40 Rowes Wharf, Boston, MA 02110.
Independent Trustees:
| Name, Address, and DOB | Position(s) Held with Trust | Term of Office1 and Length of Time Served | Principal Occupation(s) During Past Five Years | Number of Portfolios in Fund Complex Overseen by Trustee | Other Directorships Held by Trustee | ||||||||||||||||||
| Donald W. Glazer, Esq. c/o GMO Trust 40 Rowes Wharf Boston, MA 02110 DOB: 07/26/1944 | Chairman of the Board of Trustees | Chairman of the Board of Trustees since March 2005; Lead Independent Trustee (September 2004 – March 2005); Trustee since December 2000. | Consultant – Law and Business2; Vice Chair (since 2002) and Secretary, Provant, Inc. (provider of personnel performance improvement services and training products); Author of Legal Treatises. | 47 | None. | ||||||||||||||||||
1 Each Trustee is elected to serve during the continued lifetime of the Trust until he/she dies, resigns or is removed, or if sooner, until the next meeting of Shareholders called for the purpose of electing Trustees and until the election and qualification of his/her successor.
2 As part of Mr. Glazer's work as a consultant, he provides part-time consulting services to Goodwin Procter LLP ("Goodwin"). Goodwin has provided legal services to Renewable Resources, LLC, an affiliate of GMO; GMO, in connection with its relationship with Renewable Resources; and funds managed by Renewable Resources. Mr. Glazer has represented that he has no financial interest in, and is not involved in the provision of, such legal services. In the calendar years ended December 31, 2006 and December 31, 2007, these entities paid $825,738 and $291,721 respectively, in legal fees and disbursements to Goodwin.
17
Independent Trustees — (Continued)
| Name, Address, and DOB | Position(s) Held with Trust | Term of Office1 and Length of Time Served | Principal Occupation(s) During Past Five Years | Number of Portfolios in Fund Complex Overseen by Trustee | Other Directorships Held by Trustee | ||||||||||||||||||
| Jay O. Light c/o GMO Trust 40 Rowes Wharf Boston, MA 02110 DOB: 10/03/1941 | Trustee | Since May 1996. | Dean (since April 2006), Acting Dean (August 2005 – April 2006), Senior Associate Dean (1998 – 2005), and Professor of Business Administration, Harvard Business School. | 47 | Director of Harvard Management Company, Inc.3 and Verde, Inc.; Director of Partners HealthCare System, Inc. and Chair of its Investment Committee.4 | ||||||||||||||||||
| W. Nicholas Thorndike c/o GMO Trust 40 Rowes Wharf Boston, MA 02110 DOB: 03/28/1933 | Trustee | Since March 2005. | Director or trustee of various corporations and charitable organizations, including Courier Corporation (a book publisher and manufacturer) (July 1989 – present); Putnam Funds (December 1992 – June 2004); and Providence Journal (a newspaper publisher) (December 1986 – December 2003). | 47 | Director of Courier Corporation (a book publisher and manufacturer); Member of the Investment Committee of Partners HealthCare System, Inc.4 | ||||||||||||||||||
1 Each Trustee is elected to serve during the continued lifetime of the Trust until he/she dies, resigns or is removed, or if sooner, until the next meeting of Shareholders called for the purpose of electing Trustees and until the election and qualification of his/her successor.
3 Harvard Management Company, Inc. is a client of the Manager.
4 Partners HealthCare System, Inc. is a client of the Manager.
18
Principal Officers:
| Name, Address, and DOB | Position(s) Held with Trust | Term of Office5 and Length of Time Served | Principal Occupation(s) During Past Five Years | ||||||||||||
| Scott Eston c/o GMO Trust 40 Rowes Wharf Boston, MA 02110 DOB: 01/20/1956 | President and Chief Executive Officer | President and Chief Executive Officer since October 2002; Chief Financial Officer, November 2006 – February 2007. | Chief Financial Officer, Chief Operating Officer and Member, Grantham, Mayo, Van Otterloo & Co. LLC. | ||||||||||||
| Sheppard N. Burnett c/o GMO Trust 40 Rowes Wharf Boston, MA 02110 DOB: 10/24/1968 | Treasurer and Chief Financial Officer | Chief Financial Officer since March 2007; Treasurer since November 2006; Assistant Treasurer, September 2004 – November 2006. | Fund Administration Staff, Grantham, Mayo, Van Otterloo & Co. LLC (June 2004 – present); Vice President, Director of Tax, Columbia Management Group (2002 – 2004). | ||||||||||||
| Brent C. Arvidson c/o GMO Trust 40 Rowes Wharf Boston, MA 02110 DOB: 06/26/1969 | Assistant Treasurer | Since August 1998. | Senior Fund Administrator, Grantham, Mayo, Van Otterloo & Co. LLC. | ||||||||||||
| John L. Nasrah c/o GMO Trust 40 Rowes Wharf Boston, MA 02110 DOB: 05/27/1977 | Assistant Treasurer | Since March 2007. | Fund Administrator, Grantham, Mayo, Van Otterloo & Co. LLC (September 2004 – present); Tax Analyst, Bain & Company, Inc (June 2003 – September 2004); Senior Tax Associate, PricewaterhouseCoopers LLP (2001 – 2003). | ||||||||||||
| Mahmoodur Rahman c/o GMO Trust 40 Rowes Wharf Boston, MA 02110 DOB: 11/30/1967 | Assistant Treasurer | Since September 2007. | Fund Administrator, Grantham, Mayo, Van Otterloo & Co. (April 2007 – present); Vice President and Senior Tax Manager, Massachusetts Financial Services Company (January 2000 – April 2007). | ||||||||||||
5 Officers are elected to hold such office until their successor is elected and qualified to carry out the duties and responsibilities of their office, or until he or she resigns or is removed from office.
19
Principal Officers — (Continued)
| Name, Address, and DOB | Position(s) Held with Trust | Term of Office5 and Length of Time Served | Principal Occupation(s) During Past Five Years | ||||||||||||
| Michael E. Gillespie c/o GMO Trust 40 Rowes Wharf Boston, MA 02110 DOB: 02/18/1958 | Chief Compliance Officer | Since March 2005. | Vice President of Compliance (June 2004 – February 2005) and Director of Domestic Compliance (March 2002 – June 2004), Fidelity Investments; Vice President and Senior Counsel, State Street Bank and Trust Company (May 1998 – March 2002). | ||||||||||||
| Jason B. Harrison c/o GMO Trust 40 Rowes Wharf Boston, MA 02110 DOB: 01/29/1977 | Vice President and Clerk | Vice President since November 2006; Clerk since March 2006. | Legal Counsel, Grantham, Mayo, Van Otterloo & Co. LLC (since February 2006) and Attorney, Ropes & Gray LLP (September 2002 – February 2006). | ||||||||||||
| David L. Bohan c/o GMO Trust 40 Rowes Wharf Boston, MA 02110 DOB: 06/21/1964 | Vice President and Assistant Clerk | Vice President since March 2005; Assistant Clerk since March 2006. | Legal Counsel, Grantham, Mayo, Van Otterloo & Co. LLC (September 2003 – present); Attorney, Goodwin Procter LLP (September 1996 – September 2003). | ||||||||||||
| Gregory L. Pottle c/o GMO Trust 40 Rowes Wharf Boston, MA 02110 DOB: 07/09/1971 | Vice President and Assistant Clerk | Since November 2006. | Legal Counsel, Grantham, Mayo, Van Otterloo & Co. LLC. | ||||||||||||
| Anne K. Trinque c/o GMO Trust 40 Rowes Wharf Boston, MA 02110 DOB: 04/15/1978 | Vice President and Assistant Clerk | Since September 2007. | Legal Counsel, Grantham, Mayo, Van Otterloo & Co. LLC (since January 2007); Attorney, Goodwin Procter LLP (September 2003 – January 2007). | ||||||||||||
| Cheryl Wakeham c/o GMO Trust 40 Rowes Wharf Boston, MA 02110 DOB: 10/29/1958 | Anti-Money Laundering Officer | Since December 2004. | Manager, Client Service Administration, Grantham, Mayo, Van Otterloo & Co. LLC. | ||||||||||||
5 Officers are elected to hold such office until their successor is elected and qualified to carry out the duties and responsibilities of their office, or until he or she resigns or is removed from office.
20
GMO Strategic Opportunities Allocation Fund
(A Series of GMO Trust)
Annual Report
February 29, 2008
For a free copy of the Fund's proxy voting guidelines, shareholders may call 1-617-346-7646 (collect), visit our website at www.gmo.com, or visit the Securities and Exchange Commission's website at www.sec.gov. Information regarding how the Fund voted proxies relating to portfolio securities during the most recent 12-month period ended June 30 is available on our website at www.gmo.com, or on the Securities and Exchange Commission's website at www.sec.gov.
The Fund files its complete schedule of portfolio holdings with the Securities and Exchange Commission for the first and third quarter of each fiscal year on Form N-Q, which is available on the Commission's website at www.sec.gov. The Fund's Form N-Q may be reviewed and copied at the Commission's Public Reference Room in Washington, D.C. Information on the operation of the Public Reference Room may be obtained by calling 1-800-SEC-0330. The Fund has a policy with respect to disclosure of portfolio holdings under which it may also make available on GMO's website (www.gmo.com) a complete schedule of portfolio holdings.
This report is prepared for the general information of shareholders. It is authorized for distribution to prospective investors only when preceded or accompanied by a prospectus for the GMO Trust.
GMO Strategic Opportunities Allocation Fund
(A Series of GMO Trust)
Portfolio Management
Day-to-day management of the Fund's portfolio is the responsibility of the Asset Allocation Team at Grantham, Mayo, Van Otterloo & Co. LLC.
Management Discussion and Analysis of Fund Performance
The GMO Strategic Opportunities Allocation Fund returned +3.2% for the fiscal year ended February 29, 2008, as compared to +1.6% for the Fund's benchmark, the GMO Strategic Opportunities Allocation Index (75% MSCI World Index / 25% Lehman Brothers U.S. Aggregate Index) for the same period. During the fiscal year the Fund was exposed to global equity and fixed income securities through its investment in underlying GMO mutual funds.
Implementation was negative, detracting 2.9%. The primary drivers of the underperformance were negative relative returns from the GMO U.S. Core Equity, GMO International Intrinsic Value, GMO Emerging Markets Opportunities, GMO Strategic Fixed Income, and GMO Inflation Indexed Plus Bond Funds.
Asset allocation added 4.5%. The Fund's underweight to equities and overweights to emerging market equities and inflation-indexed bonds were the primary drivers of the outperformance.
The views expressed herein are exclusively those of Grantham, Mayo, Van Otterloo & Co. LLC Management as of the date of this report and are subject to change. GMO disclaims any responsibility to update such views. They are not meant as investment advice.
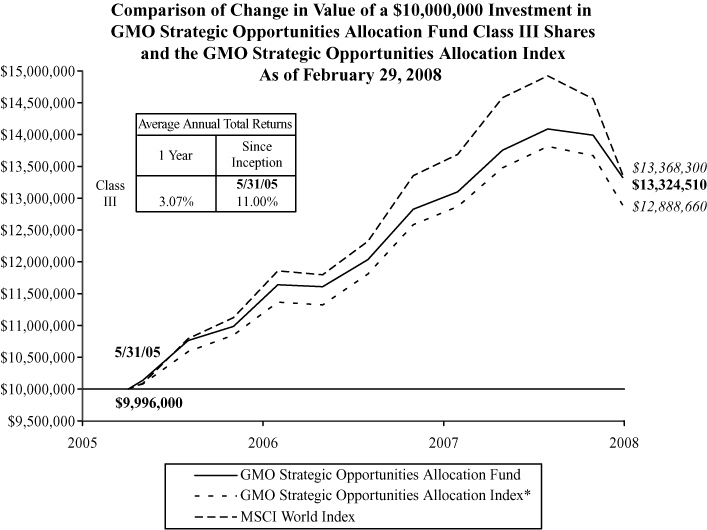
Performance data quoted represents past performance and is not indicative of future results. The investment return and principal value of an investment will fluctuate so that an investor's shares, when redeemed, may be worth more or less than their original cost. Current performance data may be lower or higher than the performance data provided herein. To obtain performance information to the most recent month-end, visit www.gmo.com. Performance shown is net of all fees after reimbursement from the Manager. Each performance figure assumes a purchase at the beginning and redemption at the end of the stated period and reflects a transaction fee of .04% on the purchase and .04% on the redemption. Transaction fees are retained by the Fund to cover trading costs. Returns would have been lower had certain expenses not been reimbursed during the periods shown and do not include the effect of taxes on distributions and redemptions. All information is unaudited.
* The GMO Strategic Opportunities Allocation Index is a composite benchmark computed by GMO and comprised of 75% MSCI World Index and 25% Lehman Brothers U.S. Aggregate Index.
GMO Strategic Opportunities Allocation Fund
(A Series of GMO Trust)
Investments Concentration Summary
February 29, 2008 (Unaudited)
| Asset Class Summary* | % of Total Net Assets | ||||||
| Common Stocks | 66.0 | % | |||||
| Debt Obligations | 21.1 | ||||||
| Short-Term Investments | 9.8 | ||||||
| Cash and Cash Equivalents | 7.8 | ||||||
| Preferred Stocks | 1.2 | ||||||
| Forward Currency Contracts | 0.1 | ||||||
| Options Purchased | 0.1 | ||||||
| Loan Participations | 0.0 | ||||||
| Loan Assignments | 0.0 | ||||||
| Rights and Warrants | 0.0 | ||||||
| Private Equity Securities | 0.0 | ||||||
| Investment Funds | 0.0 | ||||||
| Promissory Notes | 0.0 | ||||||
| Convertible Securities | 0.0 | ||||||
| Written Options | (0.0 | ) | |||||
| Reverse Repurchase Agreements | (0.2 | ) | |||||
| Swaps | (2.5 | ) | |||||
| Futures | (5.0 | ) | |||||
| Other | 1.6 | ||||||
| 100.0 | % | ||||||
* The table above incorporates aggregate indirect asset class exposure associated with investments in other funds of GMO Trust ("underlying funds").
1
GMO Strategic Opportunities Allocation Fund
(A Series of GMO Trust)
Investments Concentration Summary — (Continued)
February 29, 2008 (Unaudited)
| Country / Region Summary** | % of Investments | ||||||
| United States | 57.5 | % | |||||
| Euro Region*** | 11.9 | ||||||
| Japan | 6.3 | ||||||
| United Kingdom | 5.9 | ||||||
| Switzerland | 2.3 | ||||||
| Australia | 1.9 | ||||||
| Brazil | 1.6 | ||||||
| China | 1.6 | ||||||
| Korea | 1.5 | ||||||
| Taiwan | 1.3 | ||||||
| Russia | 1.2 | ||||||
| Hong Kong | 0.9 | ||||||
| India | 0.9 | ||||||
| Canada | 0.8 | ||||||
| Singapore | 0.8 | ||||||
| South Africa | 0.7 | ||||||
| Mexico | 0.6 | ||||||
| Denmark | 0.5 | ||||||
| Sweden | 0.5 | ||||||
| Israel | 0.2 | ||||||
| Malaysia | 0.2 | ||||||
| Norway | 0.2 | ||||||
| Poland | 0.2 | ||||||
| Argentina | 0.1 | ||||||
| Chile | 0.1 | ||||||
| Indonesia | 0.1 | ||||||
| Philippines | 0.1 | ||||||
| Thailand | 0.1 | ||||||
| 100.0 | % | ||||||
** The table above incorporates aggregate indirect country exposure associated with investments in the underlying funds except for GMO Alpha Only Fund. The table excludes short-term investments. The table includes exposure through the use of derivative contracts.
*** The "Euro Region" is comprised of Austria, Belgium, Finland, France, Germany, Greece, Ireland, Italy, Netherlands, Portugal and Spain.
2
GMO Strategic Opportunities Allocation Fund
(A Series of GMO Trust)
Schedule of Investments
(showing percentage of total net assets)
February 29, 2008
| Shares / Par Value ($) | Description | Value ($) | |||||||||||||
| MUTUAL FUNDS — 100.0% | |||||||||||||||
| Affiliated Issuer — 100.0% | |||||||||||||||
| 8,153,408 | GMO Alpha Only Fund, Class IV | 90,584,368 | |||||||||||||
| 2,808,764 | GMO Core Plus Bond Fund, Class IV | 26,514,728 | |||||||||||||
| 570,923 | GMO Emerging Country Debt Fund, Class IV | 5,743,483 | |||||||||||||
| 7,808,129 | GMO Emerging Markets Opportunities Fund, Class VI | 103,926,197 | |||||||||||||
| 585,639 | GMO International Bond Fund, Class III | 5,569,426 | |||||||||||||
| 5,651,465 | GMO International Growth Equity Fund, Class IV | 156,545,575 | |||||||||||||
| 5,328,994 | GMO International Intrinsic Value Fund, Class IV | 159,656,664 | |||||||||||||
| 2,737,777 | GMO Special Situations Fund, Class VI | 58,396,773 | |||||||||||||
| 9,190,544 | GMO Strategic Fixed Income Fund, Class VI | 216,621,119 | |||||||||||||
| 5,822,517 | GMO U.S. Core Equity Fund, Class VI | 69,986,654 | |||||||||||||
| 10,045,554 | GMO U.S. Quality Equity Fund, Class VI | 206,637,036 | |||||||||||||
| TOTAL MUTUAL FUNDS (COST $1,157,113,197) | 1,100,182,023 | ||||||||||||||
| SHORT-TERM INVESTMENTS — 0.0% | |||||||||||||||
| 46,920 | Eurodollar Time Deposit, 2.00%, due 03/03/08 | 46,920 | |||||||||||||
| TOTAL SHORT-TERM INVESTMENTS (COST $46,920) | 46,920 | ||||||||||||||
| TOTAL INVESTMENTS — 100.0% (Cost $1,157,160,117) | 1,100,228,943 | ||||||||||||||
| Other Assets and Liabilities (net) — (0.0%) | (63,435 | ) | |||||||||||||
| TOTAL NET ASSETS — 100.0% | $ | 1,100,165,508 | |||||||||||||
Notes to Schedule of Investments:
As of February 29, 2008, 35.18% of the Net Assets of the Fund, through investments in the underlying funds, were valued using fair value prices based on models used by a third party vendor (Note 2).
See accompanying notes to the financial statements.
3
GMO Strategic Opportunities Allocation Fund
(A Series of GMO Trust)
Statement of Assets and Liabilities — February 29, 2008
| Assets: | |||||||
| Investments in unaffiliated issuers, at value (cost $46,920) (Note 2) | $ | 46,920 | |||||
| Investments in affiliated issuers, at value (cost $1,157,113,197) (Notes 2 and 8) | 1,100,182,023 | ||||||
| Receivable for Fund shares sold | 6,975,230 | ||||||
| Receivable for expenses reimbursed by Manager (Note 3) | 19,488 | ||||||
| Total assets | 1,107,223,661 | ||||||
| Liabilities: | |||||||
| Payable for investments purchased | 5,568,558 | ||||||
| Payable for Fund shares repurchased | 1,424,000 | ||||||
| Payable to affiliate for (Note 3): | |||||||
| Trustees and Chief Compliance Officer of GMO Trust fees | 1,203 | ||||||
| Accrued expenses | 64,392 | ||||||
| Total liabilities | 7,058,153 | ||||||
| Net assets | $ | 1,100,165,508 | |||||
| Net assets consist of: | |||||||
| Paid-in capital | $ | 1,117,356,715 | |||||
| Accumulated undistributed net investment income | 5,027,700 | ||||||
| Accumulated net realized gain | 34,712,267 | ||||||
| Net unrealized depreciation | (56,931,174 | ) | |||||
| $ | 1,100,165,508 | ||||||
| Net assets attributable to: | |||||||
| Class III shares | $ | 1,100,165,508 | |||||
| Shares outstanding: | |||||||
| Class III | 48,475,112 | ||||||
| Net asset value per share: | |||||||
| Class III | $ | 22.70 | |||||
See accompanying notes to the financial statements.
4
GMO Strategic Opportunities Allocation Fund
(A Series of GMO Trust)
Statement of Operations — Year Ended February 29, 2008
| Investment Income: | |||||||
| Dividends from affiliated issuers (Note 8) | $ | 32,751,401 | |||||
| Interest | 1,114 | ||||||
| Total investment income | 32,752,515 | ||||||
| Expenses: | |||||||
| Custodian, fund accounting agent and transfer agent fees | 43,971 | ||||||
| Audit and tax fees | 33,754 | ||||||
| Legal fees | 17,921 | ||||||
| Trustees fees and related expenses (Note 3) | 7,328 | ||||||
| Registration fees | 11,497 | ||||||
| Miscellaneous | 10,358 | ||||||
| Total expenses | 124,829 | ||||||
| Fees and expenses reimbursed by Manager (Note 3) | (113,434 | ) | |||||
| Expense reductions (Note 2) | (17,360 | ) | |||||
| Net expenses | (5,965 | ) | |||||
| Net investment income (loss) | 32,758,480 | ||||||
| Realized and unrealized gain (loss): | |||||||
| Net realized gain (loss) on: | |||||||
| Investments in affiliated issuers | (578,425 | ) | |||||
| Realized gains distributions from affiliated issuers (Note 8) | 61,919,037 | ||||||
| Net realized gain (loss) | 61,340,612 | ||||||
| Change in net unrealized appreciation (depreciation) on: | |||||||
| Investments in affiliated issuers | (89,711,146 | ) | |||||
| Net realized and unrealized gain (loss) | (28,370,534 | ) | |||||
| Net increase (decrease) in net assets resulting from operations | $ | 4,387,946 | |||||
See accompanying notes to the financial statements.
5
GMO Strategic Opportunities Allocation Fund
(A Series of GMO Trust)
Statement of Changes in Net Assets
| Year Ended February 29, 2008 | Year Ended February 28, 2007 | ||||||||||
| Increase (decrease) in net assets: | |||||||||||
| Operations: | |||||||||||
| Net investment income (loss) | $ | 32,758,480 | $ | 13,179,426 | |||||||
| Net realized gain (loss) | 61,340,612 | 23,150,965 | |||||||||
| Change in net unrealized appreciation (depreciation) | (89,711,146 | ) | 19,527,296 | ||||||||
| Net increase (decrease) in net assets from operations | 4,387,946 | 55,857,687 | |||||||||
| Distributions to shareholders from: | |||||||||||
| Net investment income | |||||||||||
| Class III | (43,466,039 | ) | (18,854,874 | ) | |||||||
| Net realized gains | |||||||||||
| Class III | (24,846,890 | ) | (12,242,706 | ) | |||||||
| (68,312,929 | ) | (31,097,580 | ) | ||||||||
| Net share transactions (Note 7): | |||||||||||
| Class III | 634,481,810 | 137,932,946 | |||||||||
| Purchase premiums and redemption fees (Notes 2 and 7): | |||||||||||
| Class III | 234,265 | 59,034 | |||||||||
| Total increase (decrease) in net assets resulting from net share transactions, purchase premiums and redemption fees | 634,716,075 | 137,991,980 | |||||||||
| Total increase (decrease) in net assets | 570,791,092 | 162,752,087 | |||||||||
| Net assets: | |||||||||||
| Beginning of period | 529,374,416 | 366,622,329 | |||||||||
| End of period (including accumulated undistributed net investment income of $5,027,700 and $9,920, respectively) | $ | 1,100,165,508 | $ | 529,374,416 | |||||||
See accompanying notes to the financial statements.
6
GMO Strategic Opportunities Allocation Fund
(A Series of GMO Trust)
Financial Highlights
(For a Class III share outstanding throughout each period)
| Year Ended February 28/29, | |||||||||||||||
| 2008 | 2007 | 2006(a) | |||||||||||||
| Net asset value, beginning of period | $ | 23.71 | $ | 22.37 | $ | 20.00 | |||||||||
| Income (loss) from investment operations: | |||||||||||||||
| Net investment income (loss)(b)† | 0.99 | 0.69 | 0.52 | ||||||||||||
| Net realized and unrealized gain (loss) | (0.15 | ) | 2.17 | 2.34 | |||||||||||
| Total from investment operations | 0.84 | 2.86 | 2.86 | ||||||||||||
| Less distributions to shareholders: | |||||||||||||||
| From net investment income | (1.02 | ) | (0.90 | ) | (0.47 | ) | |||||||||
| From net realized gains | (0.83 | ) | (0.62 | ) | (0.02 | ) | |||||||||
| Total distributions | (1.85 | ) | (1.52 | ) | (0.49 | ) | |||||||||
| Net asset value, end of period | $ | 22.70 | $ | 23.71 | $ | 22.37 | |||||||||
| Total Return(c) | 3.15 | % | 12.98 | % | 14.42 | %** | |||||||||
| Ratios/Supplemental Data: | |||||||||||||||
| Net assets, end of period (000's) | $ | 1,100,166 | $ | 529,374 | $ | 366,622 | |||||||||
| Net expenses to average daily net assets(d)(e) | 0.00 | %(f) | 0.00 | % | 0.00 | %* | |||||||||
| Net investment income to average daily net assets(b) | 4.05 | % | 2.98 | % | 3.22 | %* | |||||||||
| Portfolio turnover rate | 47 | % | 23 | % | 10 | %** | |||||||||
| Fees and expenses reimbursed by the Manager to average daily net assets: | 0.01 | % | 0.02 | % | 0.06 | %* | |||||||||
| Purchase premiums and redemption fees consisted of the following per share amounts:† | $ | 0.01 | $ | 0.00 | (g) | $ | 0.02 | ||||||||
(a) Period from May 31, 2005 (commencement of operations) through February 28, 2006.
(b) Net investment income is affected by the timing of the declaration of dividends by the underlying funds in which the Fund invests.
(c) The total returns would have been lower had certain expenses not been reimbursed and/or waived during the periods shown and assumes the effect of reinvested distributions. Calculation excludes purchase premiums and redemption fees which are borne by the shareholder.
(d) Net expenses exclude expenses incurred indirectly through investments in the underlying funds (See Note 3).
(e) Net expenses to average daily net assets were less than 0.01%.
(f) The net expense ratio does not include the effect of expense reductions.
(g) Purchase premiums and redemption fees were less than $0.01 per share.
† Calculated using average shares outstanding throughout the period.
* Annualized.
** Not annualized.
See accompanying notes to the financial statements.
7
GMO Strategic Opportunities Allocation Fund
(A Series of GMO Trust)
Notes to Financial Statements
February 29, 2008
1. Organization
GMO Strategic Opportunities Allocation Fund (the "Fund"), which commenced operations on May 31, 2005, is a series of GMO Trust (the "Trust"). The Fund is registered under the Investment Company Act of 1940, as amended, as an open-end, diversified management investment company. The Fund is advised and managed by Grantham, Mayo, Van Otterloo & Co. LLC (the "Manager" or "GMO"). The Trust was established as a Massachusetts business trust under the laws of the Commonwealth of Massachusetts on June 24, 1985. The Declaration of Trust permits the Trustees of the Trust ("Trustees") to create an unlimited number of series of shares ("Funds") and to subdivide Funds into classes.
The Fund seeks total return greater than that of its benchmark, the GMO Strategic Opportunities Allocation Index. The GMO Strategic Opportunities Allocation Index is a composite index computed by GMO consisting of: (i) the MSCI World Index and (ii) the Lehman Brothers U.S. Aggregate Index in the following proportions: 75% (MSCI World Index) and 25% (Lehman Brothers U.S. Aggregate Index). The Fund is a fund of funds and invests in shares of other GMO Funds ("underlying funds"), which may include the GMO U.S. Equity Funds, the GMO International Equity Funds (including one or more of the GMO Emerging Markets Funds), the GMO Fixed Income Funds, GMO Alpha Only Fund, GMO Alternative Asset Opportunity Fund, and GMO Special Situations Fund.
The financial statements of the underlying funds in which the Fund invests should be read in conjunction with the Fund's financial statements. These financial statements are available, without charge, upon request, by calling (617) 346-7646 (collect) or by visiting GMO's website at www.gmo.com. Shares of GMO Special Situations Fund are not publicly available for direct purchase.
2. Significant accounting policies
The following is a summary of significant accounting policies which are in conformity with accounting principles generally accepted in the United States of America ("U.S. GAAP") and which are consistently followed by the Fund in the preparation of its financial statements. The preparation of financial statements in accordance with U.S. GAAP requires management to make estimates and assumptions that affect the reported amounts and disclosures in the financial statements. Actual results could differ from those estimates. The accounting records of the Fund are maintained in U.S. dollars.
Portfolio valuation
Shares of the underlying funds and other mutual funds are valued at their net asset value.
Investments held by the underlying funds are valued as follows. Securities listed on a securities exchange for which market quotations are readily available are valued at the last sale price or official closing price on each business day, or if there is no such reported sale or official closing price, at the most recent quoted bid price. Unlisted securities for which market quotations are readily available are generally valued at the
8
GMO Strategic Opportunities Allocation Fund
(A Series of GMO Trust)
Notes to Financial Statements — (Continued)
February 29, 2008
most recent quoted bid price. Short-term investments with a remaining maturity of sixty days or less are generally valued at amortized cost, which approximates fair value. Securities for which quotations are not readily available or whose values the Manager has determined to be unreliable are valued at fair value as determined in good faith by the Trustees or other persons acting at their direction pursuant to procedures approved by the Trustees. By its nature, a fair value price is a good faith estimate of the value of a security at a given point in time and may not reflect the value that would be realized if the security was sold and the differences could be material. Because many foreign equity securities markets and exchanges close prior to the close of the New York Stock Exchange ("NYSE"), closing prices for foreign securities in those markets or on those exchanges do not reflect the events that occur after that close but b efore the close of the NYSE. As a result, foreign equity securities are generally valued using fair value prices supplied by a third party vendor based on models to the extent that these fair value prices are available.
Fixed income securities held by the Fund or the underlying funds are typically valued pursuant to prices supplied by a primary pricing source chosen by the Manager. The Manager evaluates such primary pricing sources on an ongoing basis, and may change a pricing source should it deem it appropriate. The Manager, at its discretion, may override a price supplied by a primary source by using a price provided by another source if such action is deemed appropriate. The prices provided by such primary pricing sources may differ from the value that would be realized if the securities were sold and the differences could be material.
Certain securities held by the Fund or the underlying funds are valued on the basis of a price provided by a single source. The prices provided may differ from the value that would be realized if the securities were sold and the differences could be material. As of February 29, 2008, the total value of these securities represented 7.25% of net assets.
The Fund indirectly invests through underlying funds in securities with contractual cash flows, such as asset-backed securities, collateralized mortgage obligations and commercial mortgage backed securities, including securities backed by subprime mortgage loans. The value, liquidity and related income of these securities are sensitive to changes in economic conditions, including real estate values, delinquencies and/or defaults, and may be adversely affected by shifts in the market's perception of the securities' market values and changes in interest rates.
Repurchase agreements
The Fund may enter into repurchase agreements with banks and broker-dealers whereby the Fund acquires a security for cash and obtains a simultaneous commitment from the seller to repurchase the security at an agreed upon price and date. The Fund, through its custodian, takes possession of securities collateralizing the repurchase agreement. The collateral is marked to market daily to ensure that the market value of the underlying assets remains sufficient to protect the Fund in the event of default by the seller. Collateral for certain tri-party repurchase agreements is held at the counterparty's custodian in a segregated account for the benefit of the Fund and the counterparty. In connection with transactions in repurchase agreements, if the seller defaults or enters into insolvency proceedings and the value of the collateral declines, recovery of cash by the Fund may be delayed or limited. There were no repurchase agreements o utstanding at the end of the period.
9
GMO Strategic Opportunities Allocation Fund
(A Series of GMO Trust)
Notes to Financial Statements — (Continued)
February 29, 2008
Taxes and distributions
The Fund intends to qualify each tax year as a regulated investment company under Subchapter M of the Internal Revenue Code of 1986, as amended (the "Code"). The Fund intends to distribute substantially all of its net investment income and net realized short-term and long-term capital gains, if any, after giving effect to any available capital loss carryovers for U.S. federal income tax purposes. Therefore, no provision for U.S. federal income or excise tax is necessary.
The Fund's policy is to declare and pay distributions from net investment income, if any, semiannually, and from net realized short-term and long-term capital gains, if any, at least annually. All distributions are paid in shares of the Fund, at net asset value, unless the shareholder elects to receive cash distributions. Distributions to shareholders are recorded by the Fund on the ex-dividend date.
Income and capital gain distributions are determined in accordance with U.S. federal income tax regulations, which may differ from U.S. GAAP. Certain capital accounts in the financial statements are periodically adjusted for permanent differences in order to reflect their tax character. These adjustments have no impact on net assets or net asset value per share. Temporary differences which arise from recognizing certain items of income, expense, gain or loss in different periods for financial statement and tax purposes will reverse at some time in the future. Distributions in excess of net investment income or net realized gains are temporary over distributions for financial statement purposes resulting from differences in the recognition or classification of income or distributions for financial statement and tax purposes.
U.S. GAAP and tax accounting differences primarily relate to differing treatment of mutual fund distributions received, subscription in-kind transactions, partnership interest tax allocations and losses on wash sale transactions.
The following reclassification represents the amount necessary to report the stated components of net assets on a tax basis, excluding certain temporary differences, as of February 29, 2008. The financial highlights exclude these adjustments.
| Accumulated Undistributed Net Investment Income | Accumulated Net Realized Gain | Paid-in Capital | |||||||||
| $ | 15,725,339 | $ | (13,632,882 | ) | $ | (2,092,457 | ) | ||||
10
GMO Strategic Opportunities Allocation Fund
(A Series of GMO Trust)
Notes to Financial Statements — (Continued)
February 29, 2008
The tax character of distributions declared to shareholders is as follows:
| 2/29/2008 | 2/28/2007 | ||||||||||
| Ordinary income (including any short-term capital gains) | $ | 44,599,754 | $ | 20,019,094 | |||||||
| Long-term capital gains | 23,713,175 | 11,078,486 | |||||||||
| Total distributions | $ | 68,312,929 | $ | 31,097,580 | |||||||
Distributions in excess of tax basis earnings and profits, if significant, are reported in the financial statements as a tax return of capital.
As of February 29, 2008, the components of distributable earnings on a tax basis consisted of the following:
| Undistributed ordinary income | $ | 7,934,775 | |||||
| Undistributed long-term capital gain | $ | 36,537,471 | |||||
As of February 29, 2008, the approximate cost for U.S. federal income tax purposes and gross and net unrealized appreciation and depreciation in value of investments were as follows:
| Aggregate Cost | Gross Unrealized Appreciation | Gross Unrealized (Depreciation) | Net Unrealized Appreciation (Depreciation) | ||||||||||||
| $ | 1,160,399,734 | $ | 19,595,541 | $ | (79,766,332 | ) | $ | (60,170,791 | ) | ||||||
Security transactions and related investment income
Security transactions are accounted for on trade date. Income dividends and capital gain distributions from the underlying funds are recorded on the ex-dividend date. Interest income is recorded on the accrual basis. Non-cash dividends, if any, are recorded at the fair market value of the securities received. In determining the net gain or loss on securities sold, the cost of securities is determined on the identified cost basis.
Expenses
The majority of expenses of the Trust are directly identifiable to an individual fund. Expenses which are not readily identifiable to a specific fund are allocated taking into consideration, among other things, the nature and type of expense and the relative size of the funds. In addition, the Fund will also incur certain fees and expenses indirectly as a shareholder in the underlying funds. Because the underlying funds have varied expense and fee levels and the Fund may own different proportions of the underlying funds at different times, the amount of fees and expenses indirectly incurred by the Fund will vary (See Note 3).
11
GMO Strategic Opportunities Allocation Fund
(A Series of GMO Trust)
Notes to Financial Statements — (Continued)
February 29, 2008
State Street Bank and Trust Company ("State Street") serves as custodian, fund accounting agent and transfer agent of the Fund. State Street's fee may be reduced by credits that are an earnings allowance calculated on the average daily cash balances the Fund maintains with State Street. Credit balances used to reduce the fee paid to State Street, if any, are reported as a reduction of expenses in the Statement of Operations.
Purchases and redemptions of Fund shares
As of February 29, 2008, the premium on cash purchases and fee on cash redemptions of Fund shares were each 0.04% of the amount invested or redeemed. The Fund's purchase premium and redemption fee are approximately equal to the weighted average of the purchase premiums and redemption fees, if any, of the underlying funds in which the Fund was invested as of June 30, 2007. The level of purchase premium and redemption fee for the Fund may be adjusted to account for changes in the Fund's investments (i.e., changes in the percentage of Fund assets allocated to each underlying fund). If the Manager determines that any portion of a cash purchase or redemption is offset by a corresponding cash redemption or purchase occurring on the same day, it will waive the purchase premium or redemption fee in an amount approximately equal to the fee with respect to that portion. In addition, the purchase premium or redemption fee charged by the Fu nd may be waived in extraordinary circumstances if the Fund will not incur transaction costs. All purchase premiums and redemption fees are paid to and recorded by the Fund as paid-in capital. The Manager will waive the purchase premium relating to the in-kind portion of a purchase transaction except to the extent of certain estimated or known transaction costs (e.g. stamp duties and transfer taxes) incurred by the Fund in connection with the transfer of the purchasing shareholder's securities to the Fund. In-kind redemption transactions are generally not subject to redemption fees except to the extent those transactions include a cash component. However, when a substantial portion of a Fund is being redeemed, the Fund may assess estimated or known transaction costs. There is no premium for reinvested distributions.
Investment risks
The Fund is subject to the investment risks associated with an investment in the underlying funds, some of which may invest in foreign securities. There are certain additional risks involved in investing in foreign securities that are not inherent in investments in U.S. securities. These risks may involve adverse political and economic developments, including the possible imposition of capital controls or other foreign governmental laws or restrictions. In addition, the securities of some foreign companies and securities markets are less liquid and at times more volatile than securities of comparable U.S. companies and U.S. securities markets. The risks described above apply to an even greater extent to investments in emerging markets. The securities markets of emerging countries are generally smaller, less developed, less liquid, and more volatile than the securities markets of the U.S. and developed foreign markets. Additional ly, the investment risks associated with an investment in the underlying funds may be more pronounced to the extent that the underlying funds engage in derivative transactions.
12
GMO Strategic Opportunities Allocation Fund
(A Series of GMO Trust)
Notes to Financial Statements — (Continued)
February 29, 2008
Recently issued accounting pronouncements
In June 2006, the Financial Accounting Standards Board ("FASB") issued FASB Interpretation No. 48, Accounting for Uncertainty in Income Taxes – an Interpretation of FASB Statement No. 109 ("FIN 48"). FIN 48 clarifies the accounting for uncertainty in income taxes recognized in accordance with FASB Statement No. 109, Accounting for Income Taxes. FIN 48 prescribes a recognition threshold and measurement attribute for a tax position taken or expected to be taken in the tax return that could impact the Fund's financial statements. It also provides guidance in relation to the Fund's financial statements on classification of tax benefits or liabilities, interest and penalties, accounting in interim periods, disclosure, and transition. FIN 48 is effective for fiscal years beginning after December 15, 2006 for registered investment companies. Management has evaluated the effects of applying the various provisions of FIN 48 and has determined that the adoption of FIN 48 does not have a material effect on the Fund's financial statements. The Fund's federal tax returns for the prior three fiscal years, if applicable, remain subject to examination by the Internal Revenue Service. Management will continue to monitor the rules and guidance pertaining to FIN 48 and will take action if appropriate.
In September 2006, the FASB issued Statement of Financial Accounting Standards No. 157 ("FAS 157"), "Fair Value Measurements." FAS 157 defines fair value, establishes a framework for measuring fair value in accordance with generally accepted accounting principles and expands disclosure about fair value measurements. FAS 157 is effective for fiscal years beginning after November 15, 2007. Management is currently evaluating the impact the adoption of FAS 157 will have on the Fund's financial statement disclosures.
3. Fees and other transactions with affiliates
The Manager determines the allocation of the assets of the Fund among the designated underlying funds. The Manager does not directly charge a management fee or shareholder service fee, but receives management and shareholder service fees from the underlying funds in which the Fund invests.
The Manager has contractually agreed to reimburse the Fund for Fund expenses through at least June 30, 2008 (excluding expenses indirectly incurred by investment in the underlying funds, fees and expenses of the independent Trustees of the Trust, fees and expenses for legal services not approved by the Manager for the Trust, compensation and expenses of the Trust's Chief Compliance Officer ("CCO") (excluding any employee benefits), brokerage commissions, securities lending fees and expenses, interest expense, transfer taxes, and other investment-related costs (including expenses associated with investments in any company that is an investment company or would be an investment company under the 1940 Act, but for the exceptions to the definition of investment company provided in Section 3(c)(1) and 3(c)(7) of the 1940 Act), hedging transaction fees, extraordinary, non-recurring and certain other unusual expenses (including taxes)) .
13
GMO Strategic Opportunities Allocation Fund
(A Series of GMO Trust)
Notes to Financial Statements — (Continued)
February 29, 2008
The Fund incurs fees and expenses indirectly as a shareholder in the underlying funds. For the year ended February 29, 2008, these indirect fees and expenses expressed as an annualized percentage of the Fund's average daily net assets were as follows:
| Indirect Net Expenses (excluding shareholder service fees and interest expense) | Indirect Shareholder Service Fees | Indirect Interest Expense | Total Indirect Expenses | ||||||||||||
| 0.416 | % | 0.073 | % | 0.018 | % | 0.507 | % | ||||||||
The Fund's portion of the fees paid by the Trust to the independent Trustees and CCO during the year ended February 29, 2008 was $6,252 and $4,058, respectively. The compensation and expenses of the CCO are included in miscellaneous expenses in the Statement of Operations. No remuneration was paid by the Fund to any other officer of the Trust.
4. Purchases and sales of securities
Cost of purchases and proceeds from sales of securities, excluding short-term investments and class exchanges, for the year ended February 29, 2008 aggregated $1,051,761,852 and $390,666,627, respectively.
5. Guarantees
In the normal course of business the Fund enters into contracts with third-party service providers that contain a variety of representations and warranties and which provide general indemnifications. The Fund's maximum exposure under these arrangements is unknown, as this would involve future claims that may be made against the Fund that have not yet occurred. Based on experience, management is of the view that the risk of loss in connection with these potential indemnification obligations is remote; however, there can be no assurance that material liabilities related to such obligations will not arise in the future that could adversely impact the Fund.
6. Principal shareholders and related parties
As of February 29, 2008, 34.05% of the outstanding shares of the Fund were held by two shareholders, each holding in excess of 10% of the Fund's outstanding shares. No other shareholder owned in excess of 10% of the outstanding shares of the Fund. Investment activities of these shareholders may have a material effect on the Fund.
14
GMO Strategic Opportunities Allocation Fund
(A Series of GMO Trust)
Notes to Financial Statements — (Continued)
February 29, 2008
As of February 29, 2008, less than 0.01% of the Fund's shares were held by two related parties comprised of certain GMO employee accounts, and 99.33% of the Fund's shares were held by accounts for which the Manager has investment discretion.
7. Share transactions
The Declaration of Trust permits the Trustees to issue an unlimited number of shares of beneficial interest (without par value). Transactions in Fund shares were as follows:
| Year Ended February 29, 2008 | Year Ended February 28, 2007 | ||||||||||||||||||
| Class III: | Shares | Amount | Shares | Amount | |||||||||||||||
| Shares sold | 23,859,232 | $ | 579,450,743 | 5,179,484 | $ | 120,067,340 | |||||||||||||
| Shares issued to shareholders in reinvestment of distributions | 2,788,898 | 67,229,949 | 1,296,097 | 30,296,691 | |||||||||||||||
| Shares repurchased | (502,061 | ) | (12,198,882 | ) | (532,650 | ) | (12,431,085 | ) | |||||||||||
| Purchase premiums | — | 232,499 | — | 57,043 | |||||||||||||||
| Redemption fees | — | 1,766 | — | 1,991 | |||||||||||||||
| Net increase (decrease) | 26,146,069 | $ | 634,716,075 | 5,942,931 | $ | 137,991,980 | |||||||||||||
8. Investments in affiliated issuers
A summary of the Fund's transactions in the shares of affiliated issuers during the year ended February 29, 2008 is set forth below:
| Affiliate | Value, beginning of period | Purchases | Sales Proceeds | Dividend Income | Distributions of Realized Gains | Value, end of period | |||||||||||||||||||||
| GMO Alpha Only Fund, Class IV | $ | — | $ | 88,971,312 | $ | 60,000 | $ | 1,484,875 | $ | — | $ | 90,584,368 | |||||||||||||||
| GMO Core Plus Bond Fund, Class IV | 56,198,149 | 13,148,287 | 40,013,611 | 2,148,287 | — | 26,514,728 | |||||||||||||||||||||
| GMO Emerging Country Debt Fund, Class IV | 1,744,041 | 4,203,855 | — | 128,558 | 75,297 | 5,743,483 | |||||||||||||||||||||
| GMO Emerging Markets Opportunities Fund, Class VI | 49,013,342 | 54,303,508 | 6,010,895 | 1,952,474 | 5,351,034 | 103,926,197 | |||||||||||||||||||||
15
GMO Strategic Opportunities Allocation Fund
(A Series of GMO Trust)
Notes to Financial Statements — (Continued)
February 29, 2008
| Affiliate | Value, beginning of period | Purchases | Sales Proceeds | Dividend Income | Distributions of Realized Gains | Value, end of period | |||||||||||||||||||||
| GMO Inflation Indexed Plus Bond Fund, Class VI | $ | 74,922,001 | $ | 125,334,552 | $ | 189,321,518 | $ | 14,694,417 | $ | 313,656 | $ | — | |||||||||||||||
| GMO International Bond Fund, Class III | 4,154,505 | 1,507,445 | — | 507,445 | — | 5,569,426 | |||||||||||||||||||||
| GMO International Growth Equity Fund, Class IV | 103,554,411 | 123,510,922 | 46,263,680 | 2,225,803 | 25,883,678 | 156,545,575 | |||||||||||||||||||||
| GMO International Intrinsic Value Fund, Class IV | 105,015,610 | 124,424,556 | 39,100,000 | 4,285,535 | 20,639,021 | 159,656,664 | |||||||||||||||||||||
| GMO International Small Companies Fund, Class III | 700,667 | 24,254 | 696,923 | — | 24,254 | — | |||||||||||||||||||||
| GMO Special Situations Fund, Class VI | — | 55,500,000 | — | — | — | 58,396,773 | |||||||||||||||||||||
| GMO Strategic Fixed Income Fund, Class VI | 45,257,955 | 244,328,858 | 69,000,000 | 2,746,089 | 166,973 | 216,621,119 | |||||||||||||||||||||
| GMO U.S. Core Equity Fund, Class VI | 42,352,407 | 41,580,048 | 200,000 | 1,048,368 | 6,531,680 | 69,986,654 | |||||||||||||||||||||
| GMO U.S. Quality Equity Fund, Class VI | 46,463,280 | 174,924,255 | — | 1,529,550 | 2,933,444 | 206,637,036 | |||||||||||||||||||||
| Totals | $ | 529,376,368 | $ | 1,051,761,852 | $ | 390,666,627 | $ | 32,751,401 | $ | 61,919,037 | $ | 1,100,182,023 | |||||||||||||||
16
Report of Independent Registered Public Accounting Firm
To the Trustees of GMO Trust and the Shareholders of
GMO Strategic Opportunities Allocation Fund
In our opinion, the accompanying statement of assets and liabilities, including the schedule of investments, and the related statements of operations and of changes in net assets and the financial highlights present fairly, in all material respects, the financial position of GMO Strategic Opportunities Allocation Fund (the "Fund") at February 29, 2008, the results of its operations for the year then ended, the changes in its net assets for each of the two years in the period then ended and the financial highlights for each of the periods indicated, in conformity with accounting principles generally accepted in the United States of America. These financial statements and financial highlights (hereafter referred to as "financial statements") are the responsibility of the Fund's management; our responsibility is to express an opinion on these financial statements based on our audits. We conducted our audits of these financial state ments in accordance with the standards of the Public Company Accounting Oversight Board (United States). Those standards require that we plan and perform the audit to obtain reasonable assurance about whether the financial statements are free of material misstatement. An audit includes examining, on a test basis, evidence supporting the amounts and disclosures in the financial statements, assessing the accounting principles used and significant estimates made by management, and evaluating the overall financial statement presentation. We believe that our audits, which included confirmation of securities at February 29, 2008 by correspondence with the custodian, provide a reasonable basis for our opinion.
PricewaterhouseCoopers LLP
Boston, Massachusetts
April 29, 2008
17
GMO Strategic Opportunities Allocation Fund
(A Series of GMO Trust)
Fund Expenses
February 29, 2008 (Unaudited)
Expense Examples: The following information is in relation to expenses for the six month period ended February 29, 2008.
As a shareholder of the Fund, you may incur two types of costs: (1) transaction costs, including purchase premiums and redemption fees; and (2) ongoing costs including indirect management fees, shareholder service fees, and other Fund expenses. This example is intended to help you understand your ongoing costs (in dollars) of investing in the Fund and to compare these costs with the ongoing costs of investing in other mutual funds.
These examples are based on an investment of $1,000 invested at the beginning of the period and held for the entire period, September 1, 2007 through February 29, 2008.
Actual Expenses
The first line of the table below provides information about actual account values and actual expenses. You may use the information in this line, together with the amount you invested, to estimate the expenses that you paid over the period. Simply divide your account value by $1,000 (for example, a $10,000,000 account value divided by $1,000 = 10,000), then multiply the result by the number in the first line under the heading entitled "Net Expense Incurred" to estimate the expenses you paid on your account during this period.
Hypothetical Example for Comparison Purposes
The second line of the table below provides information about hypothetical account values and hypothetical expenses based on the Fund's actual expense ratio and an assumed rate of return of 5% per year before expenses, which is not the Fund's actual return. The hypothetical account values and expenses may not be used to estimate the actual ending account balance or expenses you paid for the period. You may use this information to compare the ongoing costs of investing in the Fund with other funds. To do so, compare this 5% hypothetical example with the 5% hypothetical examples that appear in the shareholder reports of other funds.
Please note that the expenses shown in the table are meant to highlight your ongoing costs only and do not reflect any transactional costs, such as purchase premiums and redemption fees. Therefore, the second line of the table is useful in comparing ongoing costs only, and will not help you determine the relative total costs of owning different funds. In addition, if these transactional costs were included, your costs would have been higher.
| Annualized Net Expense Ratio | Beginning Account Value | Ending Account Value | Net Expense Incurred* | ||||||||||||||||
| Class III | |||||||||||||||||||
| 1) Actual | 0.52 | % | $ | 1,000.00 | $ | 979.60 | $ | 2.56 | |||||||||||
| 2) Hypothetical | 0.52 | % | $ | 1,000.00 | $ | 1,022.28 | $ | 2.61 | |||||||||||
* Expenses are calculated using the Class's annualized net expense ratio (including indirect expenses incurred) for the six months ended February 29, 2008, multiplied by the average account value over the period, multiplied by 182 days in the period, divided by 366 days in the year.
18
GMO Strategic Opportunities Allocation Fund
(A Series of GMO Trust)
Tax Information for the Tax Year Ended February 29, 2008 (Unaudited)
The Fund will notify shareholders of amounts for use in preparing 2008 income tax forms in January 2009.
The Fund's distributions to shareholders include $23,713,175 from long-term capital gains.
For taxable, non-corporate shareholders, 29.51% of the income and short-term capital gains, if any, distributed in the Fund's fiscal year ended February 29, 2008 represents qualified dividend income subject to the 15% rate category.
For corporate shareholders, 7.20% of the income and short-term capital gains, if any, distributed in the Fund's fiscal year ended February 29, 2008 qualified for the dividends-received deduction.
The Fund hereby designates as qualified interest income and qualified short-term capital gains with respect to its taxable year ended February 29, 2008, $20,597,677 and $1,133,715, respectively, or if determined to be different, the qualified interest income and qualified short-term capital gains of such year.
19
Trustees and Officers (Unaudited)
The following tables list the Trust's Trustees and Officers as of the date of this report; their address and date of birth ("DOB"); their position with the Trust; the length of time holding that position with the Trust; their principal occupation(s) during the past five years; the number of portfolios in the fund complex they oversee; and other directorships they hold in companies subject to registration or reporting requirements of the Securities Exchange Act of 1934 (generally called "public companies") or in registered investment companies. The Trust's Statement of Additional Information ("SAI") includes additional information about the Trust's trustees, including changes subsequent to the date of the report. The SAI is available, without charge, upon request by writing GMO, c/o GMO Trust, 40 Rowes Wharf, Boston, MA 02110.
Independent Trustees:
| Name, Address, and DOB | Position(s) Held with Trust | Term of Office1 and Length of Time Served | Principal Occupation(s) During Past Five Years | Number of Portfolios in Fund Complex Overseen by Trustee | Other Directorships Held by Trustee | ||||||||||||||||||
| Donald W. Glazer, Esq. c/o GMO Trust 40 Rowes Wharf Boston, MA 02110 DOB: 07/26/1944 | Chairman of the Board of Trustees | Chairman of the Board of Trustees since March 2005; Lead Independent Trustee (September 2004 – March 2005); Trustee since December 2000. | Consultant – Law and Business2; Vice Chair (since 2002) and Secretary, Provant, Inc. (provider of personnel performance improvement services and training products); Author of Legal Treatises. | 47 | None. | ||||||||||||||||||
1 Each Trustee is elected to serve during the continued lifetime of the Trust until he/she dies, resigns or is removed, or if sooner, until the next meeting of Shareholders called for the purpose of electing Trustees and until the election and qualification of his/her successor.
2 As part of Mr. Glazer's work as a consultant, he provides part-time consulting services to Goodwin Procter LLP ("Goodwin"). Goodwin has provided legal services to Renewable Resources, LLC, an affiliate of GMO; GMO, in connection with its relationship with Renewable Resources; and funds managed by Renewable Resources. Mr. Glazer has represented that he has no financial interest in, and is not involved in the provision of, such legal services. In the calendar years ended December 31, 2006 and December 31, 2007, these entities paid $825,738 and $291,721 respectively, in legal fees and disbursements to Goodwin.
20
Independent Trustees — (Continued)
| Name, Address, and DOB | Position(s) Held with Trust | Term of Office1 and Length of Time Served | Principal Occupation(s) During Past Five Years | Number of Portfolios in Fund Complex Overseen by Trustee | Other Directorships Held by Trustee | ||||||||||||||||||
| Jay O. Light c/o GMO Trust 40 Rowes Wharf Boston, MA 02110 DOB: 10/03/1941 | Trustee | Since May 1996. | Dean (since April 2006), Acting Dean (August 2005 – April 2006), Senior Associate Dean (1998 – 2005), and Professor of Business Administration, Harvard Business School. | 47 | Director of Harvard Management Company, Inc.3 and Verde, Inc.; Director of Partners HealthCare System, Inc. and Chair of its Investment Committee.4 | ||||||||||||||||||
| W. Nicholas Thorndike c/o GMO Trust 40 Rowes Wharf Boston, MA 02110 DOB: 03/28/1933 | Trustee | Since March 2005. | Director or trustee of various corporations and charitable organizations, including Courier Corporation (a book publisher and manufacturer) (July 1989 – present); Putnam Funds (December 1992 – June 2004); and Providence Journal (a newspaper publisher) (December 1986 – December 2003). | 47 | Director of Courier Corporation (a book publisher and manufacturer); Member of the Investment Committee of Partners HealthCare System, Inc.4 | ||||||||||||||||||
1 Each Trustee is elected to serve during the continued lifetime of the Trust until he/she dies, resigns or is removed, or if sooner, until the next meeting of Shareholders called for the purpose of electing Trustees and until the election and qualification of his/her successor.
3 Harvard Management Company, Inc. is a client of the Manager.
4 Partners HealthCare System, Inc. is a client of the Manager.
21
Principal Officers:
| Name, Address, and DOB | Position(s) Held with Trust | Term of Office5 and Length of Time Served | Principal Occupation(s) During Past Five Years | ||||||||||||
| Scott Eston c/o GMO Trust 40 Rowes Wharf Boston, MA 02110 DOB: 01/20/1956 | President and Chief Executive Officer | President and Chief Executive Officer since October 2002; Chief Financial Officer, November 2006 – February 2007. | Chief Financial Officer, Chief Operating Officer and Member, Grantham, Mayo, Van Otterloo & Co. LLC. | ||||||||||||
| Sheppard N. Burnett c/o GMO Trust 40 Rowes Wharf Boston, MA 02110 DOB: 10/24/1968 | Treasurer and Chief Financial Officer | Chief Financial Officer since March 2007; Treasurer since November 2006; Assistant Treasurer, September 2004 – November 2006. | Fund Administration Staff, Grantham, Mayo, Van Otterloo & Co. LLC (June 2004 – present); Vice President, Director of Tax, Columbia Management Group (2002 – 2004). | ||||||||||||
| Brent C. Arvidson c/o GMO Trust 40 Rowes Wharf Boston, MA 02110 DOB: 06/26/1969 | Assistant Treasurer | Since August 1998. | Senior Fund Administrator, Grantham, Mayo, Van Otterloo & Co. LLC. | ||||||||||||
| John L. Nasrah c/o GMO Trust 40 Rowes Wharf Boston, MA 02110 DOB: 05/27/1977 | Assistant Treasurer | Since March 2007. | Fund Administrator, Grantham, Mayo, Van Otterloo & Co. LLC (September 2004 – present); Tax Analyst, Bain & Company, Inc (June 2003 – September 2004); Senior Tax Associate, PricewaterhouseCoopers LLP (2001 – 2003). | ||||||||||||
| Mahmoodur Rahman c/o GMO Trust 40 Rowes Wharf Boston, MA 02110 DOB: 11/30/1967 | Assistant Treasurer | Since September 2007. | Fund Administrator, Grantham, Mayo, Van Otterloo & Co. (April 2007 – present); Vice President and Senior Tax Manager, Massachusetts Financial Services Company (January 2000 – April 2007). | ||||||||||||
5 Officers are elected to hold such office until their successor is elected and qualified to carry out the duties and responsibilities of their office, or until he or she resigns or is removed from office.
22
Principal Officers — (Continued)
| Name, Address, and DOB | Position(s) Held with Trust | Term of Office5 and Length of Time Served | Principal Occupation(s) During Past Five Years | ||||||||||||
| Michael E. Gillespie c/o GMO Trust 40 Rowes Wharf Boston, MA 02110 DOB: 02/18/1958 | Chief Compliance Officer | Since March 2005. | Vice President of Compliance (June 2004 – February 2005) and Director of Domestic Compliance (March 2002 – June 2004), Fidelity Investments; Vice President and Senior Counsel, State Street Bank and Trust Company (May 1998 – March 2002). | ||||||||||||
| Jason B. Harrison c/o GMO Trust 40 Rowes Wharf Boston, MA 02110 DOB: 01/29/1977 | Vice President and Clerk | Vice President since November 2006; Clerk since March 2006. | Legal Counsel, Grantham, Mayo, Van Otterloo & Co. LLC (since February 2006) and Attorney, Ropes & Gray LLP (September 2002 – February 2006). | ||||||||||||
| David L. Bohan c/o GMO Trust 40 Rowes Wharf Boston, MA 02110 DOB: 06/21/1964 | Vice President and Assistant Clerk | Vice President since March 2005; Assistant Clerk since March 2006. | Legal Counsel, Grantham, Mayo, Van Otterloo & Co. LLC (September 2003 – present); Attorney, Goodwin Procter LLP (September 1996 – September 2003). | ||||||||||||
| Gregory L. Pottle c/o GMO Trust 40 Rowes Wharf Boston, MA 02110 DOB: 07/09/1971 | Vice President and Assistant Clerk | Since November 2006. | Legal Counsel, Grantham, Mayo, Van Otterloo & Co. LLC. | ||||||||||||
| Anne K. Trinque c/o GMO Trust 40 Rowes Wharf Boston, MA 02110 DOB: 04/15/1978 | Vice President and Assistant Clerk | Since September 2007. | Legal Counsel, Grantham, Mayo, Van Otterloo & Co. LLC (since January 2007); Attorney, Goodwin Procter LLP (September 2003 – January 2007). | ||||||||||||
| Cheryl Wakeham c/o GMO Trust 40 Rowes Wharf Boston, MA 02110 DOB: 10/29/1958 | Anti-Money Laundering Officer | Since December 2004. | Manager, Client Service Administration, Grantham, Mayo, Van Otterloo & Co. LLC. | ||||||||||||
5 Officers are elected to hold such office until their successor is elected and qualified to carry out the duties and responsibilities of their office, or until he or she resigns or is removed from office.
23
GMO U.S. Equity Allocation Fund
(A Series of GMO Trust)
Annual Report
February 29, 2008
For a free copy of the Fund's proxy voting guidelines, shareholders may call 1-617-346-7646 (collect), visit our website at www.gmo.com, or visit the Securities and Exchange Commission's website at www.sec.gov. Information regarding how the Fund voted proxies relating to portfolio securities during the most recent 12-month period ended June 30 is available on our website at www.gmo.com, or on the Securities and Exchange Commission's website at www.sec.gov.
The Fund files its complete schedule of portfolio holdings with the Securities and Exchange Commission for the first and third quarter of each fiscal year on Form N-Q, which is available on the Commission's website at www.sec.gov. The Fund's Form N-Q may be reviewed and copied at the Commission's Public Reference Room in Washington, D.C. Information on the operation of the Public Reference Room may be obtained by calling 1-800-SEC-0330. The Fund has a policy with respect to disclosure of portfolio holdings under which it may also make available on GMO's website (www.gmo.com) a complete schedule of portfolio holdings.
This report is prepared for the general information of shareholders. It is authorized for distribution to prospective investors only when preceded or accompanied by a prospectus for the GMO Trust.
GMO U.S. Equity Allocation Fund
(A Series of GMO Trust)
Portfolio Management
Day-to-day management of the Fund's portfolio is the responsibility of the Asset Allocation Team at Grantham, Mayo, Van Otterloo & Co. LLC.
Management Discussion and Analysis of Fund Performance
The GMO U.S. Equity Allocation Fund returned -6.4% for the fiscal year ended February 29, 2008, as compared to -4.5% for the Russell 3000 Index. During the fiscal year the Fund was exposed substantially to common stocks through its investment in underlying GMO mutual funds.
Implementation was negative, detracting approximately 2.7%, as the GMO U.S. Core Equity, GMO U.S. Small-Mid Cap Value, and GMO U.S. Small/Mid Cap Growth Funds underperformed their respective benchmarks.
Asset allocation added 0.8%. The Fund's overweight to large cap/quality and underweight to small cap equities added to performance.
The views expressed herein are exclusively those of Grantham, Mayo, Van Otterloo & Co. LLC Management as of the date of this report and are subject to change. GMO disclaims any responsibility to update such views. They are not meant as investment advice.
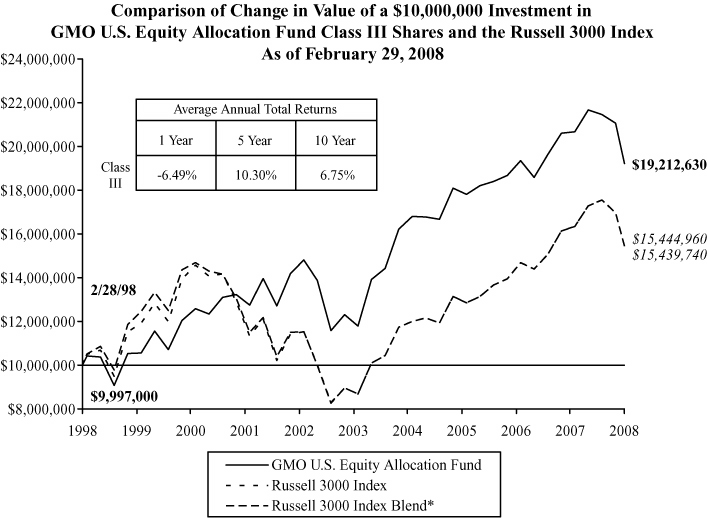
Performance data quoted represents past performance and is not indicative of future results. The investment return and principal value of an investment will fluctuate so that an investor's shares, when redeemed, may be worth more or less than their original cost. Current performance data may be lower or higher than the performance data provided herein. To obtain performance information to the most recent month-end, visit www.gmo.com. Performance shown is net of all fees after reimbursement from the Manager. Each performance figure assumes a purchase at the beginning and redemption at the end of the stated period and reflects a transaction fee of .03% on the purchase and .03% on the redemption. Transaction fees are retained by the Fund to cover trading costs. Returns would have been lower had certain expenses not been reimbursed during the periods shown and do not include the effect of taxes on distributions and redemptions. All inform ation is unaudited.
* Russell 3000 Index Blend represents the S&P 500 Index prior to 2/28/03 and the Russell 3000 Index thereafter.
GMO U.S. Equity Allocation Fund
(A Series of GMO Trust)
Investments Concentration Summary
February 29, 2008 (Unaudited)
| Asset Class Summary* | % of Total Net Assets | ||||||
| Common Stocks | 95.3 | % | |||||
| Short-Term Investments | 4.5 | ||||||
| Futures | (0.0 | ) | |||||
| Other | 0.2 | ||||||
| 100.0 | % | ||||||
* The table above incorporates aggregate indirect asset class exposure associated with investments in other funds of GMO Trust ("underlying funds").
1
GMO U.S. Equity Allocation Fund
(A Series of GMO Trust)
Schedule of Investments
(showing percentage of total net assets)
February 29, 2008
| Shares / Par Value ($) | Description | Value ($) | |||||||||||||
| MUTUAL FUNDS — 100.0% | |||||||||||||||
| Affiliated Issuers — 100.0% | |||||||||||||||
| 4,674,562 | GMO U.S. Core Equity Fund, Class VI | 56,188,236 | |||||||||||||
| 1,769,106 | GMO U.S. Quality Equity Fund, Class VI | 36,390,514 | |||||||||||||
| 90,486 | GMO U.S. Small/Mid Cap Growth Fund, Class III | 1,229,704 | |||||||||||||
| 170,755 | GMO U.S. Small/Mid Cap Value Fund, Class III | 1,256,760 | |||||||||||||
| TOTAL MUTUAL FUNDS (COST $107,626,586) | 95,065,214 | ||||||||||||||
| SHORT-TERM INVESTMENTS — 0.0% | |||||||||||||||
| 29,673 | Eurodollar Time Deposit, 2.00%, due 03/03/08 | 29,673 | |||||||||||||
| TOTAL SHORT-TERM INVESTMENTS (COST $29,673) | 29,673 | ||||||||||||||
| TOTAL INVESTMENTS — 100.0% (Cost $107,656,259) | 95,094,887 | ||||||||||||||
| Other Assets and Liabilities (net) — (0.0%) | (28,152 | ) | |||||||||||||
| TOTAL NET ASSETS — 100.0% | $ | 95,066,735 | |||||||||||||
See accompanying notes to the financial statements.
2
GMO U.S. Equity Allocation Fund
(A Series of GMO Trust)
Statement of Assets and Liabilities — February 29, 2008
| Assets: | |||||||
| Investments in unaffiliated issuers, at value (cost $29,673) (Note 2) | $ | 29,673 | |||||
| Investments in affiliated issuers, at value (cost $107,626,586) (Notes 2 and 8) | 95,065,214 | ||||||
| Receivable for expenses reimbursed by Manager (Note 3) | 3,538 | ||||||
| Total assets | 95,098,425 | ||||||
| Liabilities: | |||||||
| Payable to affiliate for (Note 3): | |||||||
| Trustees and Chief Compliance Officer of GMO Trust fees | 113 | ||||||
| Accrued expenses | 31,577 | ||||||
| Total liabilities | 31,690 | ||||||
| Net assets | $ | 95,066,735 | |||||
| Net assets consist of: | |||||||
| Paid-in capital | $ | 106,507,163 | |||||
| Accumulated net realized gain | 1,120,944 | ||||||
| Net unrealized depreciation | (12,561,372 | ) | |||||
| $ | 95,066,735 | ||||||
| Net assets attributable to: | |||||||
| Class III shares | $ | 95,066,735 | |||||
| Shares outstanding: | |||||||
| Class III | 18,597,396 | ||||||
| Net asset value per share: | |||||||
| Class III | $ | 5.11 | |||||
See accompanying notes to the financial statements.
3
GMO U.S. Equity Allocation Fund
(A Series of GMO Trust)
Statement of Operations — Year Ended February 29, 2008
| Investment Income: | |||||||
| Dividends from affiliated issuers (Note 8) | $ | 2,248,599 | |||||
| Interest | 865 | ||||||
| Total investment income | 2,249,464 | ||||||
| Expenses: | |||||||
| Custodian, fund accounting agent and transfer agent fees | 16,725 | ||||||
| Audit and tax fees | 27,822 | ||||||
| Legal fees | 3,507 | ||||||
| Trustees fees and related expenses (Note 3) | 1,211 | ||||||
| Registration fees | 1,983 | ||||||
| Miscellaneous | 1,449 | ||||||
| Total expenses | 52,697 | ||||||
| Fees and expenses reimbursed by Manager (Note 3) | (51,129 | ) | |||||
| Expense reductions (Note 2) | (263 | ) | |||||
| Net expenses | 1,305 | ||||||
| Net investment income (loss) | 2,248,159 | ||||||
| Realized and unrealized gain (loss): | |||||||
| Net realized gain (loss) on: | |||||||
| Investments in affiliated issuers | 512,433 | ||||||
| Realized gains distributions from affiliated issuers (Note 8) | 11,034,688 | ||||||
| Net realized gain (loss) | 11,547,121 | ||||||
| Change in net unrealized appreciation (depreciation) on: | |||||||
| Investments in affiliated issuers | (18,144,547 | ) | |||||
| Net realized and unrealized gain (loss) | (6,597,426 | ) | |||||
| Net increase (decrease) in net assets resulting from operations | $ | (4,349,267 | ) | ||||
See accompanying notes to the financial statements.
4
GMO U.S. Equity Allocation Fund
(A Series of GMO Trust)
Statement of Changes in Net Assets
| Year Ended February 29, 2008 | Year Ended February 28, 2007 | ||||||||||
| Increase (decrease) in net assets: | |||||||||||
| Operations: | |||||||||||
| Net investment income (loss) | $ | 2,248,159 | $ | 2,844,809 | |||||||
| Net realized gain (loss) | 11,547,121 | 12,470,796 | |||||||||
| Change in net unrealized appreciation (depreciation) | (18,144,547 | ) | (6,163,706 | ) | |||||||
| Net increase (decrease) in net assets from operations | (4,349,267 | ) | 9,151,899 | ||||||||
| Distributions to shareholders from: | |||||||||||
| Net investment income | |||||||||||
| Class III | (5,352,652 | ) | (4,188,192 | ) | |||||||
| Net realized gains | |||||||||||
| Class III | (11,494,628 | ) | (12,182,820 | ) | |||||||
| (16,847,280 | ) | (16,371,012 | ) | ||||||||
| Net share transactions (Note 7): | |||||||||||
| Class III | (33,069,596 | ) | (16,661,519 | ) | |||||||
| Purchase premiums and redemption fees (Notes 2 and 7): | |||||||||||
| Class III | 20,815 | 46,222 | |||||||||
| Total increase (decrease) in net assets resulting from net share transactions, purchase premiums and redemption fees | (33,048,781 | ) | (16,615,297 | ) | |||||||
| Total increase (decrease) in net assets | (54,245,328 | ) | (23,834,410 | ) | |||||||
| Net assets: | |||||||||||
| Beginning of period | 149,312,063 | 173,146,473 | |||||||||
| End of period (including accumulated undistributed net investment income of $0 and $27,768, respectively) | $ | 95,066,735 | $ | 149,312,063 | |||||||
See accompanying notes to the financial statements.
5
GMO U.S. Equity Allocation Fund
(A Series of GMO Trust)
Financial Highlights
(For a Class III share outstanding throughout each period)
| Year Ended February 28/29, | |||||||||||||||||||||||
| 2008 | 2007 | 2006 | 2005 | 2004 | |||||||||||||||||||
| Net asset value, beginning of period | $ | 6.38 | $ | 6.56 | $ | 6.41 | $ | 6.40 | $ | 4.53 | |||||||||||||
| Income (loss) from investment operations: | |||||||||||||||||||||||
| Net investment income (loss)(a)† | 0.11 | 0.10 | 0.10 | 0.11 | 0.08 | ||||||||||||||||||
| Net realized and unrealized gain (loss) | (0.42 | ) | 0.28 | 0.31 | 0.34 | 1.89 | |||||||||||||||||
| Total from investment operations | (0.31 | ) | 0.38 | 0.41 | 0.45 | 1.97 | |||||||||||||||||
| Less distributions to shareholders: | |||||||||||||||||||||||
| From net investment income | (0.32 | ) | (0.15 | ) | (0.12 | ) | (0.14 | ) | (0.02 | ) | |||||||||||||
| From net realized gains | (0.64 | ) | (0.41 | ) | (0.14 | ) | (0.30 | ) | (0.08 | ) | |||||||||||||
| Total distributions | (0.96 | ) | (0.56 | ) | (0.26 | ) | (0.44 | ) | (0.10 | ) | |||||||||||||
| Net asset value, end of period | $ | 5.11 | $ | 6.38 | $ | 6.56 | $ | 6.41 | $ | 6.40 | |||||||||||||
| Total Return(b)(c) | (6.43 | )% | 6.48 | % | 6.45 | % | 7.18 | % | 43.72 | % | |||||||||||||
| Ratios/Supplemental Data: | |||||||||||||||||||||||
| Net assets, end of period (000's) | $ | 95,067 | $ | 149,312 | $ | 173,146 | $ | 151,378 | $ | 73,342 | |||||||||||||
| Net expenses to average daily net assets(d) | 0.00 | %(e)(f) | 0.04 | % | 0.01 | % | 0.00 | %(e) | 0.00 | %(e) | |||||||||||||
| Net investment income to average daily net assets(a) | 1.78 | % | 1.63 | % | 1.52 | % | 1.75 | % | 1.43 | % | |||||||||||||
| Portfolio turnover rate | 26 | % | 35 | % | 13 | % | 16 | % | 17 | % | |||||||||||||
| Fees and expenses reimbursed by the Manager to average daily net assets: | 0.04 | % | 0.18 | % | 0.51 | % | 0.54 | % | 0.58 | % | |||||||||||||
| Purchase premiums and redemption fees consisted of the following per share amounts:†(g) | $ | 0.00 | $ | 0.00 | $ | 0.00 | $ | 0.00 | $ | 0.00 | |||||||||||||
(a) Net investment income is affected by the timing of the declaration of dividends by the underlying funds in which the Fund invests.
(b) The total returns would have been lower had certain expenses not been reimbursed and/or waived during the periods shown and assumes the effect of reinvested distributions.
(c) Calculation excludes purchase premiums and redemption fees which are borne by the shareholder.
(d) Net expenses exclude expenses incurred indirectly through investments in the underlying funds (See Note 3).
(e) Net expenses were less than 0.01%.
(f) The net expense ratio does not include the effect of expense reductions.
(g) Purchase premiums and redemption fees were less than $0.01 per share.
† Calculated using average shares outstanding throughout the period.
See accompanying notes to the financial statements.
6
GMO U.S. Equity Allocation Fund
(A Series of GMO Trust)
Notes to Financial Statements
February 29, 2008
1. Organization
GMO U.S. Equity Allocation Fund (the "Fund") is a series of GMO Trust (the "Trust"). The Fund is registered under the Investment Company Act of 1940, as amended, as an open-end, non-diversified management investment company. The Fund is advised and managed by Grantham, Mayo, Van Otterloo & Co. LLC (the "Manager" or "GMO"). The Trust was established as a Massachusetts business trust under the laws of the Commonwealth of Massachusetts on June 24, 1985. The Declaration of Trust permits the Trustees of the Trust ("Trustees") to create an unlimited number of series of shares ("Funds") and to subdivide Funds into classes.
The Fund seeks total return greater than that of the Russell 3000 Index. The Fund is a fund of funds and invests primarily in shares of the GMO U.S. Equity Funds ("underlying funds"). The Fund seeks exposure to the securities in the Wilshire 5000 Stock Index through its investments in each of the underlying funds.
The financial statements of the underlying funds should be read in conjunction with the Fund's financial statements. These financial statements are available, without charge, upon request, by calling (617) 346-7646 (collect) or by visiting GMO's website at www.gmo.com.
2. Significant accounting policies
The following is a summary of significant accounting policies which are in conformity with accounting principles generally accepted in the United States of America ("U.S. GAAP") and which are consistently followed by the Fund in the preparation of its financial statements. The preparation of financial statements in accordance with U.S. GAAP requires management to make estimates and assumptions that affect the reported amounts and disclosures in the financial statements. Actual results could differ from those estimates. The accounting records of the Fund are maintained in U.S. dollars.
Portfolio valuation
Shares of the underlying funds and other mutual funds are valued at their net asset value.
Investments held by the underlying funds are valued as follows. Securities listed on a securities exchange for which market quotations are readily available are valued at the last sale price or official closing price on each business day, or if there is no such reported sale or official closing price, at the most recent quoted bid price. Unlisted securities for which market quotations are readily available are generally valued at the most recent quoted bid price. Short-term investments with a remaining maturity of sixty days or less are generally valued at amortized cost, which approximates fair value. Securities for which quotations are not readily available or whose values the Manager has determined to be unreliable are valued at fair value as determined in good faith by the Trustees or other persons acting at their direction pursuant to procedures approved by the Trustees. By its nature, a fair value price is a good faith est imate of the value of a security at a given point in time and may not reflect the value that would be realized if the security was sold and the differences could be material.
7
GMO U.S. Equity Allocation Fund
(A Series of GMO Trust)
Notes to Financial Statements — (Continued)
February 29, 2008
Repurchase agreements
The Fund may enter into repurchase agreements with banks and broker-dealers whereby the Fund acquires a security for cash and obtains a simultaneous commitment from the seller to repurchase the security at an agreed upon price and date. The Fund, through its custodian, takes possession of securities collateralizing the repurchase agreement. The collateral is marked to market daily to ensure that the market value of the underlying assets remains sufficient to protect the Fund in the event of default by the seller. Collateral for certain tri-party repurchase agreements is held at the counterparty's custodian in a segregated account for the benefit of the Fund and the counterparty. In connection with transactions in repurchase agreements, if the seller defaults or enters into insolvency proceedings and the value of the collateral declines, recovery of cash by the Fund may be delayed or limited. There were no repurchase agreements o utstanding at the end of the period.
Taxes and distributions
The Fund intends to qualify each tax year as a regulated investment company under Subchapter M of the Internal Revenue Code of 1986, as amended (the "Code"). The Fund intends to distribute substantially all of its net investment income and net realized short-term and long-term capital gains, if any, after giving effect to any available capital loss carryovers for U.S. federal income tax purposes. Therefore, no provision for U.S. federal income or excise tax is necessary.
The Fund's policy is to declare and pay distributions from net investment income, if any, semiannually, and from net realized short-term and long-term capital gains, if any, at least annually. All distributions are paid in shares of the Fund, at net asset value, unless the shareholder elects to receive cash distributions. Distributions to shareholders are recorded by the Fund on the ex-dividend date.
Income and capital gain distributions are determined in accordance with U.S. federal income tax regulations, which may differ from U.S. GAAP. Certain capital accounts in the financial statements are periodically adjusted for permanent differences in order to reflect their tax character. These adjustments have no impact on net assets or net asset value per share. Temporary differences which arise from recognizing certain items of income, expense, gain or loss in different periods for financial statement and tax purposes will reverse at some time in the future. Distributions in excess of net investment income or net realized gains are temporary over distributions for financial statement purposes resulting from differences in the recognition or classification of income or distributions for financial statement and tax purposes.
U.S. GAAP and tax accounting differences primarily relate to capital loss carryforwards, differing treatment of mutual fund distributions received, and losses on wash sale transactions.
8
GMO U.S. Equity Allocation Fund
(A Series of GMO Trust)
Notes to Financial Statements — (Continued)
February 29, 2008
The following reclassification represents the amount necessary to report the stated components of net assets on a tax basis, excluding certain temporary differences, as of February 29, 2008. The financial highlights exclude these adjustments.
| Distributions In Excess Of Net Investment Income | Accumulated Net Realized Gain | Paid-in Capital | |||||||||
| $ | 3,076,725 | $ | (3,076,722 | ) | $ | (3 | ) | ||||
The tax character of distributions declared to shareholders is as follows:
| 2/29/2008 | 2/28/2007 | ||||||||||
| Ordinary income (including any short-term capital gains) | $ | 5,350,424 | $ | 4,188,192 | |||||||
| Long-term capital gains | 11,496,856 | 12,182,820 | |||||||||
| Total distributions | $ | 16,847,280 | $ | 16,371,012 | |||||||
Distributions in excess of tax basis earnings and profits, if significant, are reported in the financial statements as a tax return of capital.
As of February 29, 2008, the components of distributable earnings on a tax basis consisted of the following:
| Undistributed long-term capital gain | $ | 1,635,086 | |||||
As of February 29, 2008, the Fund had capital loss carryforwards available to offset future realized gains if any, to the extent permitted by the Code. Utilization of the capital loss carryforwards could be subject to limitations imposed by the Code related to share ownership activity. Such losses expire as follows:
| 2/29/2012 | $ | (136,192 | ) | ||||
| Total | $ | (136,192 | ) | ||||
As of February 29, 2008, the approximate cost for U.S. federal income tax purposes and gross and net unrealized appreciation and depreciation in value of investments were as follows:
Aggregate Cost | Gross Unrealized Appreciation | Gross Unrealized (Depreciation) | Net Unrealized Appreciation (Depreciation) | ||||||||||||
| $ | 108,034,209 | $ | — | $ | (12,939,322 | ) | $ | (12,939,322 | ) | ||||||
9
GMO U.S. Equity Allocation Fund
(A Series of GMO Trust)
Notes to Financial Statements — (Continued)
February 29, 2008
Security transactions and related investment income
Security transactions are accounted for on trade date. Income dividends and capital gain distributions from the underlying funds are recorded on the ex-dividend date. Interest income is recorded on the accrual basis. Non-cash dividends, if any, are recorded at the fair market value of the securities received. In determining the net gain or loss on securities sold, the cost of securities is determined on the identified cost basis.
Expenses
The majority of expenses of the Trust are directly identifiable to an individual fund. Expenses which are not readily identifiable to a specific fund are allocated taking into consideration, among other things, the nature and type of expense and the relative size of the funds. In addition, the Fund will also incur certain fees and expenses indirectly as a shareholder in the underlying funds. Because the underlying funds have varied expense and fee levels and the Fund may own different proportions of the underlying funds at different times, the amount of fees and expenses indirectly incurred by the Fund will vary (See Note 3).
State Street Bank and Trust Company ("State Street") serves as custodian, fund accounting agent and transfer agent of the Fund. State Street's fee may be reduced by credits that are an earnings allowance calculated on the average daily cash balances the Fund maintains with State Street. Credit balances used to reduce the fee paid to State Street, if any, are reported as a reduction of expenses in the Statement of Operations.
Purchases and redemptions of Fund shares
As of February 29, 2008, the premium on cash purchases and fee on cash redemptions of Fund shares were each 0.03% of the amount invested or redeemed. The redemption fee is only applicable to shares acquired on or after June 30, 2003. The Fund's purchase premium and redemption fee are approximately equal to the weighted average of the purchase premiums and redemption fees, if any, of the underlying funds in which the Fund was invested as of June 30, 2007. The level of purchase premium and redemption fee for the Fund may be adjusted to account for changes in the Fund's investments (i.e., changes in the percentage of Fund assets allocated to each underlying fund). If the Manager determines that any portion of a cash purchase or redemption is offset by a corresponding cash redemption or purchase occurring on the same day, it will waive the purchase premium or redemption fee in an amount approximately equal to the fee with respect to that portion. In addition, the purchase premium or redemption fee charged by the Fund may be waived in extraordinary circumstances if the Fund will not incur transaction costs. All purchase premiums and redemption fees are paid to and recorded by the Fund as paid-in capital. The Manager will waive the purchase premium relating to the in-kind portion of a purchase transaction except to the extent of certain estimated or known transaction costs (e.g. stamp duties and transfer taxes) incurred by the Fund in connection with the transfer of the purchasing shareholder's securities to the Fund. In-kind redemption transactions are generally not subject to redemption fees except to the extent those transactions include a cash component. However, when a substantial portion of a Fund is being redeemed, the Fund may assess estimated or known transaction costs. There is no premium for reinvested distributions.
10
GMO U.S. Equity Allocation Fund
(A Series of GMO Trust)
Notes to Financial Statements — (Continued)
February 29, 2008
Recently issued accounting pronouncements
In June 2006, the Financial Accounting Standards Board ("FASB") issued FASB Interpretation No. 48, Accounting for Uncertainty in Income Taxes – an Interpretation of FASB Statement No. 109 ("FIN 48"). FIN 48 clarifies the accounting for uncertainty in income taxes recognized in accordance with FASB Statement No. 109, Accounting for Income Taxes. FIN 48 prescribes a recognition threshold and measurement attribute for a tax position taken or expected to be taken in the tax return that could impact the Fund's financial statements. It also provides guidance in relation to the Fund's financial statements on classification of tax benefits or liabilities, interest and penalties, accounting in interim periods, disclosure, and transition. FIN 48 is effective for fiscal years beginning after December 15, 2006 for registered investment companies. Management has evaluated the effects of applying the various provisions of FIN 48 and has determined that the adoption of FIN 48 does not have a material effect on the Fund's financial statements. The Fund's federal tax returns for the prior three fiscal years, if applicable, remain subject to examination by the Internal Revenue Service. Management will continue to monitor the rules and guidance pertaining to FIN 48 and will take action if appropriate.
In September 2006, the FASB issued Statement of Financial Accounting Standards No. 157 ("FAS 157"), "Fair Value Measurements." FAS 157 defines fair value, establishes a framework for measuring fair value in accordance with generally accepted accounting principles and expands disclosure about fair value measurements. FAS 157 is effective for fiscal years beginning after November 15, 2007. Management is currently evaluating the impact the adoption of FAS 157 will have on the Fund's financial statement disclosures.
3. Fees and other transactions with affiliates
The Manager determines the allocation of the assets of the Fund among designated underlying funds. The Manager does not directly charge an advisory fee or shareholder service fee, but receives management and shareholder service fees from the underlying funds in which the Fund invests.
The Manager has contractually agreed to reimburse the Fund for Fund expenses through at least June 30, 2008 (excluding expenses indirectly incurred by investment in the underlying funds, fees and expenses of the independent Trustees of the Trust, fees and expenses for legal services not approved by the Manager for the Trust, compensation and expenses of the Trust's Chief Compliance Officer ("CCO") (excluding any employee benefits), brokerage commissions, securities lending fees and expenses, interest expense, transfer taxes, and other investment-related costs (including expenses associated with investments in any company that is an investment company or would be an investment company under the 1940 Act, but for the exceptions to the definition of investment company provided in Section 3(c)(1) and 3(c)(7) of the 1940 Act), hedging transaction fees, extraordinary, non-recurring and certain other unusual expenses (including taxes)) .
11
GMO U.S. Equity Allocation Fund
(A Series of GMO Trust)
Notes to Financial Statements — (Continued)
February 29, 2008
The Fund incurs fees and expenses indirectly as a shareholder in the underlying funds. For the year ended February 29, 2008, these indirect fees and expenses expressed as an annualized percentage of the Fund's average daily net assets were as follows:
| Indirect Net Expenses (excluding shareholder service fees) | Indirect Shareholder Service Fees | Total Indirect Expenses | |||||||||
| 0.315 | % | 0.060 | % | 0.375 | % | ||||||
The Fund's portion of the fees paid by the Trust to the independent Trustees and CCO during the year ended February 29, 2008 was $1,027 and $355, respectively. The compensation and expenses of the CCO are included in miscellaneous expenses in the Statement of Operations. No remuneration was paid by the Fund to any other officer of the Trust.
4. Purchases and sales of securities
Cost of purchases and proceeds from sales of securities, excluding short-term investments and class exchanges, for the year ended February 29, 2008 aggregated $32,161,466 and $68,774,831, respectively.
5. Guarantees
In the normal course of business the Fund enters into contracts with third-party service providers that contain a variety of representations and warranties and which provide general indemnifications. The Fund's maximum exposure under these arrangements is unknown, as this would involve future claims that may be made against the Fund that have not yet occurred. Based on experience, management is of the view that the risk of loss in connection with these potential indemnification obligations is remote; however, there can be no assurance that material liabilities related to such obligations will not arise in the future that could adversely impact the Fund.
6. Principal shareholders and related parties
As of February 29, 2008, 56.96% of the outstanding shares of the Fund were held by three shareholders, each holding in excess of 10% of the Fund's outstanding shares. No other shareholder owned in excess of 10% of the outstanding shares of the Fund. Investment activities of these shareholders may have a material effect on the Fund.
As of February 29, 2008, less than 0.01% of the Fund's shares were held by one related party comprised of a certain GMO employee account.
12
GMO U.S. Equity Allocation Fund
(A Series of GMO Trust)
Notes to Financial Statements — (Continued)
February 29, 2008
7. Share transactions
| Year Ended February 29, 2008 | Year Ended February 28, 2007 | ||||||||||||||||||
| Class III: | Shares | Amount | Shares | Amount | |||||||||||||||
| Shares sold | 1,644,319 | $ | 9,739,477 | 8,058,092 | $ | 52,537,795 | |||||||||||||
| Shares issued to shareholders in reinvestment of distributions | 2,858,946 | 16,847,279 | 2,677,850 | 16,371,012 | |||||||||||||||
| Shares repurchased | (9,315,683 | ) | (59,656,352 | ) | (13,702,053 | ) | (85,570,326 | ) | |||||||||||
| Purchase premiums | — | 2,918 | — | 21,021 | |||||||||||||||
| Redemption fees | — | 17,897 | — | 25,201 | |||||||||||||||
| Net increase (decrease) | (4,812,418 | ) | $ | (33,048,781 | ) | (2,966,111 | ) | $ | (16,615,297 | ) | |||||||||
8. Investments in affiliated issuers
A summary of the Fund's transactions in the shares of affiliated issuers during the year ended February 29, 2008 is set forth below:
| Affiliate | Value, beginning of period | Purchases | Sales Proceeds | Dividend Income | Distributions of Realized Gains | Value, end of period | |||||||||||||||||||||
| GMO U.S. Core Equity Fund, Class VI | $ | 111,984,114 | $ | 14,750,807 | $ | 56,412,967 | $ | 1,728,956 | $ | 9,667,802 | $ | 56,188,236 | |||||||||||||||
| GMO U.S. Quality Equity Fund, Class VI | 27,544,376 | 16,700,495 | 5,649,461 | 464,031 | 712,334 | 36,390,514 | |||||||||||||||||||||
| GMO U.S. Small/Mid Cap Growth Fund, Class III | 4,712,790 | 443,721 | 3,402,412 | 12,410 | 431,311 | 1,229,704 | |||||||||||||||||||||
| GMO U.S. Small/Mid Cap Value Fund, Class III | 5,069,978 | 266,443 | 3,309,991 | 43,202 | 223,241 | 1,256,760 | |||||||||||||||||||||
| Totals | $ | 149,311,258 | $ | 32,161,466 | $ | 68,774,831 | $ | 2,248,599 | $ | 11,034,688 | $ | 95,065,214 | |||||||||||||||
13
Report of Independent Registered Public Accounting Firm
To the Trustees of GMO Trust and the Shareholders of
GMO U.S. Equity Allocation Fund
In our opinion, the accompanying statement of assets and liabilities, including the schedule of investments, and the related statements of operations and of changes in net assets and the financial highlights present fairly, in all material respects, the financial position of GMO U.S. Equity Allocation Fund (the "Fund") at February 29, 2008, the results of its operations for the year then ended, the changes in its net assets for each of the two years in the period then ended and the financial highlights for each of the five years in the period then ended, in conformity with accounting principles generally accepted in the United States of America. These financial statements and financial highlights (hereafter referred to as "financial statements") are the responsibility of the Fund's management; our responsibility is to express an opinion on these financial statements based on our audits. We conducted our audits of these financial statements in accordance with the standards of the Public Company Accounting Oversight Board (United States). Those standards require that we plan and perform the audit to obtain reasonable assurance about whether the financial statements are free of material misstatement. An audit includes examining, on a test basis, evidence supporting the amounts and disclosures in the financial statements, assessing the accounting principles used and significant estimates made by management, and evaluating the overall financial statement presentation. We believe that our audits, which included confirmation of securities at February 29, 2008 by correspondence with the custodian, provide a reasonable basis for our opinion.
PricewaterhouseCoopers LLP
Boston, Massachusetts
April 29, 2008
14
GMO U.S. Equity Allocation Fund
(A Series of GMO Trust)
Fund Expenses
February 29, 2008 (Unaudited)
Expense Examples: The following information is in relation to expenses for the six month period ended February 29, 2008.
As a shareholder of the Fund, you may incur two types of costs: (1) transaction costs, including purchase premiums and redemption fees; and (2) ongoing costs, including management fees, shareholder service fees, and other Fund expenses. This example is intended to help you understand your ongoing costs (in dollars) of investing in the Fund and to compare these costs with the ongoing costs of investing in other mutual funds.
These examples are based on an investment of $1,000 invested at the beginning of the period and held for the entire period, September 1, 2007 through February 29, 2008.
Actual Expenses
The first line of the table below provides information about actual account values and actual expenses. You may use the information in this line, together with the amount you invested, to estimate the expenses that you paid over the period. Simply divide your account value by $1,000 (for example, a $10,000,000 account value divided by $1,000 = 10,000), then multiply the result by the number in the first line under the heading entitled "Net Expense Incurred" to estimate the expenses you paid on your account during this period.
Hypothetical Example for Comparison Purposes
The second line of the table below provides information about hypothetical account values and hypothetical expenses based on the Fund's actual expense ratio and an assumed rate of return of 5% per year before expenses, which is not the Fund's actual return. The hypothetical account values and expenses may not be used to estimate the actual ending account balance or expenses you paid for the period. You may use this information to compare the ongoing costs of investing in the Fund with other funds. To do so, compare this 5% hypothetical example with the 5% hypothetical examples that appear in the shareholder reports of other funds.
Please note that the expenses shown in the table are meant to highlight your ongoing costs only and do not reflect any transactional costs, such as purchase premiums and redemption fees. Therefore, the second line of the table is useful in comparing ongoing costs only, and will not help you determine the relative total costs of owning different funds. In addition, if these transactional costs were included, your costs would have been higher.
| Annualized Net Expense Ratio | Beginning Account Value | Ending Account Value | Net Expense Incurred* | ||||||||||||||||
| Class III | |||||||||||||||||||
| 1) Actual | 0.38 | % | $ | 1,000.00 | $ | 911.30 | $ | 1.81 | |||||||||||
| 2) Hypothetical | 0.38 | % | $ | 1,000.00 | $ | 1,022.97 | $ | 1.91 | |||||||||||
* Expenses are calculated using the Class's annualized net expense ratio (including indirect expenses incurred) for the six months ended February 29, 2008, multiplied by the average account value over the period, multiplied by 182 days in the period, divided by 366 days in the year.
15
GMO U.S. Equity Allocation Fund
(A Series of GMO Trust)
Tax Information for the Tax Year Ended February 29, 2008 (Unaudited)
The Fund will notify shareholders of amounts for use in preparing 2008 income tax forms in January 2009.
The Fund's distributions to shareholders include $11,496,856 from long-term capital gains.
For taxable, non-corporate shareholders, 47.02% of the income and short-term capital gains, if any, distributed in the Fund's fiscal year ended February 29, 2008 represents qualified dividend income subject to the 15% rate category.
For corporate shareholders, 46.32% of the income and short-term capital gains, if any, distributed in the Fund's fiscal year ended February 29, 2008 qualified for the dividends-received deduction.
The Fund hereby designates as qualified interest income with respect to its taxable year ended February 29, 2008, $2,901,575 or if determined to be different, the qualified interest income of such year.
16
Trustees and Officers (Unaudited)
The following tables list the Trust's Trustees and Officers as of the date of this report; their address and date of birth ("DOB"); their position with the Trust; the length of time holding that position with the Trust; their principal occupation(s) during the past five years; the number of portfolios in the fund complex they oversee; and other directorships they hold in companies subject to registration or reporting requirements of the Securities Exchange Act of 1934 (generally called "public companies") or in registered investment companies. The Trust's Statement of Additional Information ("SAI") includes additional information about the Trust's trustees, including changes subsequent to the date of the report. The SAI is available, without charge, upon request by writing GMO, c/o GMO Trust, 40 Rowes Wharf, Boston, MA 02110.
Independent Trustees:
| Name, Address, and DOB | Position(s) Held with Trust | Term of Office1 and Length of Time Served | Principal Occupation(s) During Past Five Years | Number of Portfolios in Fund Complex Overseen by Trustee | Other Directorships Held by Trustee | ||||||||||||||||||
| Donald W. Glazer, Esq. c/o GMO Trust 40 Rowes Wharf Boston, MA 02110 DOB: 07/26/1944 | Chairman of the Board of Trustees | Chairman of the Board of Trustees since March 2005; Lead Independent Trustee (September 2004 – March 2005); Trustee since December 2000. | Consultant – Law and Business2; Vice Chair (since 2002) and Secretary, Provant, Inc. (provider of personnel performance improvement services and training products); Author of Legal Treatises. | 47 | None. | ||||||||||||||||||
1 Each Trustee is elected to serve during the continued lifetime of the Trust until he/she dies, resigns or is removed, or if sooner, until the next meeting of Shareholders called for the purpose of electing Trustees and until the election and qualification of his/her successor.
2 As part of Mr. Glazer's work as a consultant, he provides part-time consulting services to Goodwin Procter LLP ("Goodwin"). Goodwin has provided legal services to Renewable Resources, LLC, an affiliate of GMO; GMO, in connection with its relationship with Renewable Resources; and funds managed by Renewable Resources. Mr. Glazer has represented that he has no financial interest in, and is not involved in the provision of, such legal services. In the calendar years ended December 31, 2006 and December 31, 2007, these entities paid $825,738 and $291,721 respectively, in legal fees and disbursements to Goodwin.
17
Independent Trustees — (Continued)
| Name, Address, and DOB | Position(s) Held with Trust | Term of Office1 and Length of Time Served | Principal Occupation(s) During Past Five Years | Number of Portfolios in Fund Complex Overseen by Trustee | Other Directorships Held by Trustee | ||||||||||||||||||
| Jay O. Light c/o GMO Trust 40 Rowes Wharf Boston, MA 02110 DOB: 10/03/1941 | Trustee | Since May 1996. | Dean (since April 2006), Acting Dean (August 2005 – April 2006), Senior Associate Dean (1998 – 2005), and Professor of Business Administration, Harvard Business School. | 47 | Director of Harvard Management Company, Inc.3 and Verde, Inc.; Director of Partners HealthCare System, Inc. and Chair of its Investment Committee.4 | ||||||||||||||||||
| W. Nicholas Thorndike c/o GMO Trust 40 Rowes Wharf Boston, MA 02110 DOB: 03/28/1933 | Trustee | Since March 2005. | Director or trustee of various corporations and charitable organizations, including Courier Corporation (a book publisher and manufacturer) (July 1989 – present); Putnam Funds (December 1992 – June 2004); and Providence Journal (a newspaper publisher) (December 1986 – December 2003). | 47 | Director of Courier Corporation (a book publisher and manufacturer); Member of the Investment Committee of Partners HealthCare System, Inc.4 | ||||||||||||||||||
1 Each Trustee is elected to serve during the continued lifetime of the Trust until he/she dies, resigns or is removed, or if sooner, until the next meeting of Shareholders called for the purpose of electing Trustees and until the election and qualification of his/her successor.
3 Harvard Management Company, Inc. is a client of the Manager.
4 Partners HealthCare System, Inc. is a client of the Manager.
18
Principal Officers:
| Name, Address, and DOB | Position(s) Held with Trust | Term of Office5 and Length of Time Served | Principal Occupation(s) During Past Five Years | ||||||||||||
| Scott Eston c/o GMO Trust 40 Rowes Wharf Boston, MA 02110 DOB: 01/20/1956 | President and Chief Executive Officer | President and Chief Executive Officer since October 2002; Chief Financial Officer, November 2006 – February 2007. | Chief Financial Officer, Chief Operating Officer and Member, Grantham, Mayo, Van Otterloo & Co. LLC. | ||||||||||||
| Sheppard N. Burnett c/o GMO Trust 40 Rowes Wharf Boston, MA 02110 DOB: 10/24/1968 | Treasurer and Chief Financial Officer | Chief Financial Officer since March 2007; Treasurer since November 2006; Assistant Treasurer, September 2004 – November 2006. | Fund Administration Staff, Grantham, Mayo, Van Otterloo & Co. LLC (June 2004 – present); Vice President, Director of Tax, Columbia Management Group (2002 – 2004). | ||||||||||||
| Brent C. Arvidson c/o GMO Trust 40 Rowes Wharf Boston, MA 02110 DOB: 06/26/1969 | Assistant Treasurer | Since August 1998. | Senior Fund Administrator, Grantham, Mayo, Van Otterloo & Co. LLC. | ||||||||||||
| John L. Nasrah c/o GMO Trust 40 Rowes Wharf Boston, MA 02110 DOB: 05/27/1977 | Assistant Treasurer | Since March 2007. | Fund Administrator, Grantham, Mayo, Van Otterloo & Co. LLC (September 2004 – present); Tax Analyst, Bain & Company, Inc (June 2003 – September 2004); Senior Tax Associate, PricewaterhouseCoopers LLP (2001 – 2003). | ||||||||||||
| Mahmoodur Rahman c/o GMO Trust 40 Rowes Wharf Boston, MA 02110 DOB: 11/30/1967 | Assistant Treasurer | Since September 2007. | Fund Administrator, Grantham, Mayo, Van Otterloo & Co. (April 2007 – present); Vice President and Senior Tax Manager, Massachusetts Financial Services Company (January 2000 – April 2007). | ||||||||||||
5 Officers are elected to hold such office until their successor is elected and qualified to carry out the duties and responsibilities of their office, or until he or she resigns or is removed from office.
19
Principal Officers — (Continued)
| Name, Address, and DOB | Position(s) Held with Trust | Term of Office5 and Length of Time Served | Principal Occupation(s) During Past Five Years | ||||||||||||
| Michael E. Gillespie c/o GMO Trust 40 Rowes Wharf Boston, MA 02110 DOB: 02/18/1958 | Chief Compliance Officer | Since March 2005. | Vice President of Compliance (June 2004 – February 2005) and Director of Domestic Compliance (March 2002 – June 2004), Fidelity Investments; Vice President and Senior Counsel, State Street Bank and Trust Company (May 1998 – March 2002). | ||||||||||||
| Jason B. Harrison c/o GMO Trust 40 Rowes Wharf Boston, MA 02110 DOB: 01/29/1977 | Vice President and Clerk | Vice President since November 2006; Clerk since March 2006. | Legal Counsel, Grantham, Mayo, Van Otterloo & Co. LLC (since February 2006) and Attorney, Ropes & Gray LLP (September 2002 – February 2006). | ||||||||||||
| David L. Bohan c/o GMO Trust 40 Rowes Wharf Boston, MA 02110 DOB: 06/21/1964 | Vice President and Assistant Clerk | Vice President since March 2005; Assistant Clerk since March 2006. | Legal Counsel, Grantham, Mayo, Van Otterloo & Co. LLC (September 2003 – present); Attorney, Goodwin Procter LLP (September 1996 – September 2003). | ||||||||||||
| Gregory L. Pottle c/o GMO Trust 40 Rowes Wharf Boston, MA 02110 DOB: 07/09/1971 | Vice President and Assistant Clerk | Since November 2006. | Legal Counsel, Grantham, Mayo, Van Otterloo & Co. LLC. | ||||||||||||
| Anne K. Trinque c/o GMO Trust 40 Rowes Wharf Boston, MA 02110 DOB: 04/15/1978 | Vice President and Assistant Clerk | Since September 2007. | Legal Counsel, Grantham, Mayo, Van Otterloo & Co. LLC (since January 2007); Attorney, Goodwin Procter LLP (September 2003 – January 2007). | ||||||||||||
| Cheryl Wakeham c/o GMO Trust 40 Rowes Wharf Boston, MA 02110 DOB: 10/29/1958 | Anti-Money Laundering Officer | Since December 2004. | Manager, Client Service Administration, Grantham, Mayo, Van Otterloo & Co. LLC. | ||||||||||||
5 Officers are elected to hold such office until their successor is elected and qualified to carry out the duties and responsibilities of their office, or until he or she resigns or is removed from office.
20
GMO World Opportunities Equity Allocation Fund
(A Series of GMO Trust)
Annual Report
February 29, 2008
For a free copy of the Fund's proxy voting guidelines, shareholders may call 1-617-346-7646 (collect), visit our website at www.gmo.com, or visit the Securities and Exchange Commission's website at www.sec.gov. Information regarding how the Fund voted proxies relating to portfolio securities during the most recent 12-month period ended June 30 is available on our website at www.gmo.com, or on the Securities and Exchange Commission's website at www.sec.gov.
The Fund files its complete schedule of portfolio holdings with the Securities and Exchange Commission for the first and third quarter of each fiscal year on Form N-Q, which is available on the Commission's website at www.sec.gov. The Fund's Form N-Q may be reviewed and copied at the Commission's Public Reference Room in Washington, D.C. Information on the operation of the Public Reference Room may be obtained by calling 1-800-SEC-0330. The Fund has a policy with respect to disclosure of portfolio holdings under which it may also make available on GMO's website (www.gmo.com) a complete schedule of portfolio holdings.
This report is prepared for the general information of shareholders. It is authorized for distribution to prospective investors only when preceded or accompanied by a prospectus for the GMO Trust.
GMO World Opportunities Equity Allocation Fund
(A Series of GMO Trust)
Portfolio Management
Day-to-day management of the Fund's portfolio is the responsibility of the Asset Allocation Team at Grantham, Mayo, Van Otterloo & Co. LLC.
Management Discussion and Analysis of Fund Performance
The GMO World Opportunities Equity Allocation Fund returned +0.7% for the fiscal year ended February 29, 2008, as compared to -0.5% for the Fund's benchmark, the MSCI World Index. During the fiscal year the Fund was fully exposed to global equity and fixed income securities through its investment in underlying GMO mutual funds.
Implementation was negative, detracting approximately 1.3% with most of the underperformance coming from the GMO U.S. Core Equity, GMO International Intrinsic Value, and GMO Emerging Markets Opportunities Funds, which underperformed their respective benchmarks.
Asset allocation added 2.6%. The Fund's allocation to emerging market equities, international growth equities, and U.S. high quality equities were the drivers of the outperformance.
The views expressed herein are exclusively those of Grantham, Mayo, Van Otterloo & Co. LLC Management as of the date of this report and are subject to change. GMO disclaims any responsibility to update such views. They are not meant as investment advice.
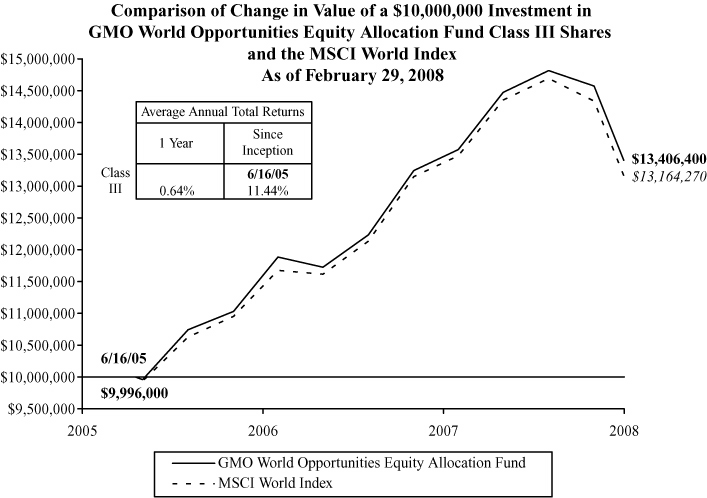
Performance data quoted represents past performance and is not indicative of future results. The investment return and principal value of an investment will fluctuate so that an investor's shares, when redeemed, may be worth more or less than their original cost. Current performance data may be lower or higher than the performance data provided herein. To obtain performance information to the most recent month-end, visit www.gmo.com. Performance shown is net of all fees after reimbursement from the Manager. Each performance figure assumes a purchase at the beginning and redemption at the end of the stated period and reflects a transaction fee of .04% on the purchase and .04% on the redemption. Transaction fees are retained by the Fund to cover trading costs. Returns would have been lower had certain expenses not been reimbursed during the periods shown and do not include the effect of taxes on distributions and redemptions. All information is unaudited.
GMO World Opportunities Equity Allocation Fund
(A Series of GMO Trust)
Investments Concentration Summary
February 29, 2008 (Unaudited)
| Asset Class Summary* | % of Total Net Assets | ||||||
| Common Stocks | 94.2 | % | |||||
| Short-Term Investments | 4.0 | ||||||
| Preferred Stocks | 1.1 | ||||||
| Forward Currency Contracts | 0.2 | ||||||
| Rights and Warrants | 0.0 | ||||||
| Futures | (0.3 | ) | |||||
| Other | 0.8 | ||||||
| 100.0 | % | ||||||
* The table above incorporates aggregate indirect asset class exposure associated with investments in other funds of GMO Trust ("underlying funds").
1
GMO World Opportunities Equity Allocation Fund
(A Series of GMO Trust)
Investments Concentration Summary — (Continued)
February 29, 2008 (Unaudited)
| Country / Region Summary** | % of Investments | ||||||
| United States | 43.8 | % | |||||
| Euro Region*** | 17.0 | ||||||
| United Kingdom | 10.0 | ||||||
| Japan | 9.2 | ||||||
| Switzerland | 3.2 | ||||||
| Australia | 2.6 | ||||||
| Hong Kong | 1.5 | ||||||
| Brazil | 1.3 | ||||||
| China | 1.3 | ||||||
| Korea | 1.2 | ||||||
| Singapore | 1.2 | ||||||
| Canada | 1.0 | ||||||
| Taiwan | 1.0 | ||||||
| Russia | 0.9 | ||||||
| India | 0.8 | ||||||
| Sweden | 0.8 | ||||||
| Denmark | 0.6 | ||||||
| Belgium | 0.5 | ||||||
| South Africa | 0.5 | ||||||
| Mexico | 0.4 | ||||||
| Norway | 0.4 | ||||||
| Israel | 0.2 | ||||||
| Malaysia | 0.2 | ||||||
| Chile | 0.1 | ||||||
| Indonesia | 0.1 | ||||||
| Poland | 0.1 | ||||||
| Thailand | 0.1 | ||||||
| 100.0 | % | ||||||
** The table above incorporates aggregate indirect country exposure associated with investments in the underlying funds. The table excludes short-term investments. The table includes exposure through the use of derivative contracts.
*** The "Euro Region" is comprised of Austria, Belgium, Finland, France, Germany, Greece, Ireland, Italy, Netherlands, Portugal and Spain.
2
GMO World Opportunities Equity Allocation Fund
(A Series of GMO Trust)
Schedule of Investments
(showing percentage of total net assets)
February 29, 2008
| Shares / Par Value ($) | Description | Value ($) | |||||||||||||
| MUTUAL FUNDS — 100.0% | |||||||||||||||
| Affiliated Issuers — 100.0% | |||||||||||||||
| 6,052,334 | GMO Emerging Markets Opportunities Fund, Class VI | 80,556,568 | |||||||||||||
| 8,119,870 | GMO International Growth Equity Fund, Class IV | 224,920,412 | |||||||||||||
| 7,389,146 | GMO International Intrinsic Value Fund, Class IV | 221,378,801 | |||||||||||||
| 18,701,273 | GMO U.S. Core Equity Fund, Class VI | 224,789,300 | |||||||||||||
| 9,368,912 | GMO U.S. Quality Equity Fund, Class VI | 192,718,528 | |||||||||||||
| TOTAL MUTUAL FUNDS (COST $1,044,113,182) | 944,363,609 | ||||||||||||||
| SHORT-TERM INVESTMENTS — 0.0% | |||||||||||||||
| 49,011 | Eurodollar Time Deposit, 2.00%, due 03/03/08 | 49,011 | |||||||||||||
| TOTAL SHORT-TERM INVESTMENTS (COST $49,011) | 49,011 | ||||||||||||||
| TOTAL INVESTMENTS — 100.0% (Cost $1,044,162,193) | 944,412,620 | ||||||||||||||
| Other Assets and Liabilities (net) — (0.0%) | (38,194 | ) | |||||||||||||
| TOTAL NET ASSETS — 100.0% | $ | 944,374,426 | |||||||||||||
Notes to Schedule of Investments:
As of February 29, 2008, 47.54% of the Net Assets of the Fund, through investments in the underlying funds, were valued using fair values prices based on models used by a third party vendor (Note 2).
See accompanying notes to the financial statements.
3
GMO World Opportunities Equity Allocation Fund
(A Series of GMO Trust)
Statement of Assets and Liabilities — February 29, 2008
| Assets: | |||||||
| Investments in unaffiliated issuers, at value (cost $49,011) (Note 2) | $ | 49,011 | |||||
| Investments in affiliated issuers, at value (cost $1,044,113,182) (Notes 2 and 8) | 944,363,609 | ||||||
| Receivable for Fund shares sold | 1,951 | ||||||
| Receivable for expenses reimbursed by Manager (Note 3) | 11,745 | ||||||
| Total assets | 944,426,316 | ||||||
| Liabilities: | |||||||
| Payable to affiliate for (Note 3): | |||||||
| Trustees and Chief Compliance Officer of GMO Trust fees | 1,115 | ||||||
| Accrued expenses | 50,775 | ||||||
| Total liabilities | 51,890 | ||||||
| Net assets | $ | 944,374,426 | |||||
| Net assets consist of: | |||||||
| Paid-in capital | $ | 996,052,050 | |||||
| Accumulated net realized gain | 48,071,949 | ||||||
| Net unrealized depreciation | (99,749,573 | ) | |||||
| $ | 944,374,426 | ||||||
| Net assets attributable to: | |||||||
| Class III shares | $ | 944,374,426 | |||||
| Shares outstanding: | |||||||
| Class III | 43,502,764 | ||||||
| Net asset value per share: | |||||||
| Class III | $ | 21.71 | |||||
See accompanying notes to the financial statements.
4
GMO World Opportunities Equity Allocation Fund
(A Series of GMO Trust)
Statement of Operations — Year Ended February 29, 2008
| Investment Income: | |||||||
| Dividends from affiliated issuers (Note 8) | $ | 16,863,079 | |||||
| Interest | 1,089 | ||||||
| Total investment income | 16,864,168 | ||||||
| Expenses: | |||||||
| Custodian, fund accounting agent and transfer agent fees | 45,637 | ||||||
| Audit and tax fees | 31,581 | ||||||
| Legal fees | 20,719 | ||||||
| Trustees fees and related expenses (Note 3) | 9,440 | ||||||
| Registration fees | 8,586 | ||||||
| Miscellaneous | 9,946 | ||||||
| Total expenses | 125,909 | ||||||
| Fees and expenses reimbursed by Manager (Note 3) | (112,173 | ) | |||||
| Expense reductions (Note 2) | (5,817 | ) | |||||
| Net expenses | 7,919 | ||||||
| Net investment income (loss) | 16,856,249 | ||||||
| Realized and unrealized gain (loss): | |||||||
| Net realized gain (loss) on: | |||||||
| Investments in affiliated issuers | (2,936,910 | ) | |||||
| Realized gains distributions from affiliated issuers (Note 8) | 120,691,474 | ||||||
| Net realized gain (loss) | 117,754,564 | ||||||
| Change in net unrealized appreciation (depreciation) on: | |||||||
| Investments in affiliated issuers | (134,909,725 | ) | |||||
| Net realized and unrealized gain (loss) | (17,155,161 | ) | |||||
| Net increase (decrease) in net assets resulting from operations | $ | (298,912 | ) | ||||
See accompanying notes to the financial statements.
5
GMO World Opportunities Equity Allocation Fund
(A Series of GMO Trust)
Statement of Changes in Net Assets
| Year Ended February 29, 2008 | Year Ended February 28, 2007 | ||||||||||
| Increase (decrease) in net assets: | |||||||||||
| Operations: | |||||||||||
| Net investment income (loss) | $ | 16,856,249 | $ | 10,502,950 | |||||||
| Net realized gain (loss) | 117,754,564 | 61,556,022 | |||||||||
| Change in net unrealized appreciation (depreciation) | (134,909,725 | ) | 18,645,399 | ||||||||
| Net increase (decrease) in net assets from operations | (298,912 | ) | 90,704,371 | ||||||||
| Distributions to shareholders from: | |||||||||||
| Net investment income | |||||||||||
| Class III | (44,014,224 | ) | (21,344,408 | ) | |||||||
| Net realized gains | |||||||||||
| Class III | (72,725,181 | ) | (23,787,413 | ) | |||||||
| (116,739,405 | ) | (45,131,821 | ) | ||||||||
| Net share transactions (Note 7): | |||||||||||
| Class III | 159,046,461 | 449,303,347 | |||||||||
| Purchase premiums and redemption fees (Notes 2 and 7): | |||||||||||
| Class III | 42,292 | 217,986 | |||||||||
| Total increase (decrease) in net assets resulting from net share transactions, purchase premiums and redemption fees | 159,088,753 | 449,521,333 | |||||||||
| Total increase (decrease) in net assets | 42,050,436 | 495,093,883 | |||||||||
| Net assets: | |||||||||||
| Beginning of period | 902,323,990 | 407,230,107 | |||||||||
| End of period | $ | 944,374,426 | $ | 902,323,990 | |||||||
See accompanying notes to the financial statements.
6
GMO World Opportunities Equity Allocation Fund
(A Series of GMO Trust)
Financial Highlights
(For a Class III share outstanding throughout each period)
| Year Ended February 28/29, | |||||||||||||||
| 2008 | 2007 | 2006(a) | |||||||||||||
| Net asset value, beginning of period | $ | 24.25 | $ | 22.49 | $ | 20.00 | |||||||||
| Income (loss) from investment operations: | |||||||||||||||
| Net investment income (loss)(b)† | 0.43 | 0.40 | 0.37 | ||||||||||||
| Net realized and unrealized gain (loss) | 0.01 | (c) | 2.93 | 2.78 | |||||||||||
| Total from investment operations | 0.44 | 3.33 | 3.15 | ||||||||||||
| Less distributions to shareholders: | |||||||||||||||
| From net investment income | (1.10 | ) | (0.73 | ) | (0.46 | ) | |||||||||
| From net realized gains | (1.88 | ) | (0.84 | ) | (0.20 | ) | |||||||||
| Total distributions | (2.98 | ) | (1.57 | ) | (0.66 | ) | |||||||||
| Net asset value, end of period | $ | 21.71 | $ | 24.25 | $ | 22.49 | |||||||||
| Total Return(d) | 0.72 | % | 14.94 | % | 15.90 | %** | |||||||||
| Ratios/Supplemental Data: | |||||||||||||||
| Net assets, end of period (000's) | $ | 944,374 | $ | 902,324 | $ | 407,230 | |||||||||
| Net expenses to average daily net assets(e)(f) | 0.00 | %(g) | 0.00 | % | 0.00 | %* | |||||||||
| Net investment income to average daily net assets(b) | 1.72 | % | 1.68 | % | 2.42 | %* | |||||||||
| Portfolio turnover rate | 20 | % | 12 | % | 5 | %** | |||||||||
| Fees and expenses reimbursed by the Manager to average daily net assets: | 0.01 | % | 0.02 | % | 0.06 | %* | |||||||||
| Purchase premiums and redemption fees consisted of the following per share amounts:† | $ | 0.00 | (h) | $ | 0.01 | $ | 0.02 | ||||||||
(a) Period from June 16, 2005 (commencement of operations) through February 28, 2006.
(b) Net investment income is affected by the timing of the declaration of dividends by the underlying funds in which the Fund invests.
(c) The amount shown for a share outstanding does not correspond with the aggregate net realized and unrealized gain (loss) on investments due to the timing of purchases and redemptions of Fund shares in relation to fluctuating market values of the investments of the Fund.
(d) The total returns would have been lower had certain expenses not been reimbursed during the periods shown and assumes the effect of reinvested distributions. Calculation excludes purchase premiums and redemption fees which are borne by the shareholders.
(e) Net expenses exclude expenses incurred indirectly through investment in the underlying funds (See Note 3).
(f) Net expenses to average daily net assets were less than 0.01%.
(g) The net expense ratio does not reflect the effect of expense reductions.
(h) Purchase premiums and redemption fees were less than $0.01 per share.
† Calculated using average shares outstanding throughout the period.
* Annualized.
** Not annualized.
See accompanying notes to the financial statements.
7
GMO World Opportunities Equity Allocation Fund
(A Series of GMO Trust)
Notes to Financial Statements
February 29, 2008
1. Organization
GMO World Opportunities Equity Allocation Fund (the "Fund") is a series of GMO Trust (the "Trust"). The Fund is registered under the Investment Company Act of 1940, as amended, as an open-end, diversified management investment company. The Fund is advised and managed by Grantham, Mayo, Van Otterloo & Co. LLC (the "Manager" or "GMO"). The Trust was established as a Massachusetts business trust under the laws of the Commonwealth of Massachusetts on June 24, 1985. The Declaration of Trust permits the Trustees of the Trust ("Trustees") to create an unlimited number of series of shares ("Funds") and to subdivide Funds into classes.
The Fund seeks total return greater than that of the MSCI World Index. The Fund is a fund of funds and invests primarily in shares of the GMO International Equity Funds (which may include one or more of the GMO Emerging Markets Funds) and the GMO U.S. Equity Funds. The Fund may also invest in shares of other GMO Funds, including the GMO Fixed Income Funds, GMO Alpha Only Fund, and GMO Alternative Asset Opportunity Fund.
The financial statements of the series of the Trust in which the Fund invests ("underlying funds") should be read in conjunction with the Fund's financial statements. These financial statements are available, without charge, upon request, by calling (617) 346-7646 (collect) or by visiting GMO's website at www.gmo.com.
2. Significant accounting policies
The following is a summary of significant accounting policies which are in conformity with accounting principles generally accepted in the United States of America ("U.S. GAAP") and which are consistently followed by the Fund in the preparation of its financial statements. The preparation of financial statements in accordance with U.S. GAAP requires management to make estimates and assumptions that affect the reported amounts and disclosures in the financial statements. Actual results could differ from those estimates. The accounting records of the Fund are maintained in U.S. dollars.
Portfolio valuation
Shares of the underlying funds and other mutual funds are valued at their net asset value.
Investments held by the underlying funds are valued as follows. Securities listed on a securities exchange for which market quotations are readily available are valued at the last sale price or official closing price on each business day, or if there is no such reported sale or official closing price, at the most recent quoted bid price. Unlisted securities for which market quotations are readily available are generally valued at the most recent quoted bid price. Short-term investments with a remaining maturity of sixty days or less are generally valued at amortized cost, which approximates fair value. Securities for which quotations are not readily available or whose values the Manager has determined to be unreliable are valued at fair value as
8
GMO World Opportunities Equity Allocation Fund
(A Series of GMO Trust)
Notes to Financial Statements — (Continued)
February 29, 2008
determined in good faith by the Trustees or other persons acting at their direction pursuant to procedures approved by the Trustees. By its nature, a fair value price is a good faith estimate of the value of a security at a given point in time and may not reflect the value that would be realized if the security was sold and the differences could be material. Because many foreign equity securities markets and exchanges close prior to the close of the New York Stock Exchange ("NYSE"), closing prices for foreign securities in those markets or on those exchanges do not reflect the events that occur after that close but before the close of the NYSE. As a result, foreign equity securities are generally valued using fair value prices supplied by a third party vendor based on models to the extent that these fair value prices are available.
Repurchase agreements
The Fund may enter into repurchase agreements with banks and broker-dealers whereby the Fund acquires a security for cash and obtains a simultaneous commitment from the seller to repurchase the security at an agreed upon price and date. The Fund, through its custodian, takes possession of securities collateralizing the repurchase agreement. The collateral is marked to market daily to ensure that the market value of the underlying assets remains sufficient to protect the Fund in the event of default by the seller. Collateral for certain tri-party repurchase agreements is held at the counterparty's custodian in a segregated account for the benefit of the Fund and the counterparty. In connection with transactions in repurchase agreements, if the seller defaults or enters into insolvency proceedings and the value of the collateral declines, recovery of cash by the Fund may be delayed or limited. There were no repurchase agreements o utstanding at the end of the period.
Taxes and distributions
The Fund intends to qualify each tax year as a regulated investment company under Subchapter M of the Internal Revenue Code of 1986, as amended (the "Code"). The Fund intends to distribute substantially all of its net investment income and net realized short-term and long-term capital gains, if any, after giving effect to any available capital loss carryovers for U.S. federal income tax purposes. Therefore, no provision for U.S. federal income or excise tax is necessary.
The Fund's policy is to declare and pay distributions from net investment income, if any, semiannually, and from net realized short-term and long-term capital gains, if any, at least annually. All distributions are paid in shares of the Fund, at net asset value, unless the shareholder elects to receive cash distributions. Distributions to shareholders are recorded by the Fund on the ex-dividend date.
Income and capital gain distributions are determined in accordance with U.S. federal income tax regulations, which may differ from U.S. GAAP. Certain capital accounts in the financial statements are periodically adjusted for permanent differences in order to reflect their tax character. These adjustments have no impact on net assets or net asset value per share. Temporary differences which arise from recognizing certain items of income, expense, gain or loss in different periods for financial statement and tax purposes will reverse at some time in the future. Distributions in excess of net investment income or net realized gains are temporary over distributions for financial statement purposes resulting from differences in the recognition or classification of income or distributions for financial statement and tax purposes.
9
GMO World Opportunities Equity Allocation Fund
(A Series of GMO Trust)
Notes to Financial Statements — (Continued)
February 29, 2008
U.S. GAAP and tax accounting differences primarily relate to differing treatment of mutual fund distributions received and losses on wash sale transactions.
The following reclassification represents the amount necessary to report the stated components of net assets on a tax basis, excluding certain temporary differences, as of February 29, 2008. The financial highlights exclude these adjustments.
| Distributions in Excess of Net Investment Income | Accumulated Net Realized Gain | Paid-in Capital | |||||||||
| $ | 27,157,975 | $ | (27,157,975 | ) | $ | — | |||||
The tax character of distributions declared to shareholders is as follows:
| 2/29/2008 | 2/28/2007 | ||||||||||
| Ordinary income (including any short-term capital gains) | $ | 44,009,605 | $ | 21,541,099 | |||||||
| Long-term capital gains | 72,729,800 | 23,590,722 | |||||||||
| Total distributions | $ | 116,739,405 | $ | 45,131,821 | |||||||
Distributions in excess of tax basis earnings and profits, if significant, are reported in the financial statements as a tax return of capital.
As of February 29, 2008, the components of distributable earnings on a tax basis consisted of the following:
| Undistributed long-term capital gain | $ | 48,642,573 | |||||
As of February 29, 2008, the approximate cost for U.S. federal income tax purposes and gross and net unrealized appreciation and depreciation in value of investments were as follows:
| Aggregate Cost | Gross Unrealized Appreciation | Gross Unrealized (Depreciation) | Net Unrealized Appreciation (Depreciation) | ||||||||||||
| $ | 1,044,732,817 | $ | 12,907,473 | $ | (113,227,670 | ) | $ | (100,320,197 | ) | ||||||
Security transactions and related investment income
Security transactions are accounted for on trade date. Income dividends and capital gain distributions from the underlying funds are recorded on the ex-dividend date. Interest income is recorded on the accrual basis. Non-cash dividends, if any, are recorded at the fair market value of the securities received. In determining the net gain or loss on securities sold, the cost of securities is determined on the identified cost basis.
10
GMO World Opportunities Equity Allocation Fund
(A Series of GMO Trust)
Notes to Financial Statements — (Continued)
February 29, 2008
Expenses
The majority of expenses of the Trust are directly identifiable to an individual fund. Expenses which are not readily identifiable to a specific fund are allocated taking into consideration, among other things, the nature and type of expense and the relative size of the funds. In addition, the Fund will also incur certain fees and expenses indirectly as a shareholder in the underlying funds. Because the underlying funds have varied expense and fee levels and the Fund may own different proportions of the underlying funds at different times, the amount of fees and expenses indirectly incurred by the Fund will vary (See Note 3).
State Street Bank and Trust Company ("State Street") serves as custodian, fund accounting agent and transfer agent of the Fund. State Street's fee may be reduced by credits that are an earnings allowance calculated on the average daily cash balances the Fund maintains with State Street. Credit balances used to reduce the fee paid to State Street, if any, are reported as a reduction of expenses in the Statement of Operations.
Purchases and redemptions of Fund shares
As of February 29, 2008, the premium on cash purchases and fee on cash redemptions of Fund shares were each 0.04% of the amount invested or redeemed. The Fund's purchase premium and redemption fee are approximately equal to the weighted average of the purchase premiums and redemption fees, if any, of the underlying funds in which the Fund was invested as of June 30, 2007. The level of purchase premium and redemption fee for the Fund may be adjusted to account for changes in the Fund's investments (i.e., changes in the percentage of Fund assets allocated to each underlying fund). If the Manager determines that any portion of a cash purchase or redemption is offset by a corresponding cash redemption or purchase occurring on the same day, it will waive the purchase premium or redemption fee in an amount approximately equal to the fee with respect to that portion. In addition, the purchase premium or redemption fee charged by the Fund may be waived in extraordinary circumstances if the Fund will not incur transaction costs. All purchase premiums and redemption fees are paid to and recorded by the Fund as paid-in capital. The Manager will waive the purchase premium relating to the in-kind portion of a purchase transaction except to the extent of certain estimated or known transaction costs (e.g. stamp duties and transfer taxes) incurred by the Fund in connection with the transfer of the purchasing shareholder's securities to the Fund. In-kind redemption transactions are generally not subject to redemption fees except to the extent those transactions include a cash component. However, when a substantial portion of a Fund is being redeemed, the Fund may assess estimated or known transaction costs. There is no premium for reinvested distributions.
Investment risks
The Fund is subject to the investment risks associated with an investment in the underlying funds, some of which may invest in foreign securities. There are certain additional risks involved in investing in foreign securities that are not inherent in investments in U.S. securities. These risks may involve adverse political and economic developments, including the possible imposition of capital controls or other foreign governmental laws or restrictions. In addition, the securities of some foreign companies and securities markets are less liquid and at times more volatile than securities of comparable U.S. companies and U.S. securities markets. The risks described above apply to an even greater extent to investments in
11
GMO World Opportunities Equity Allocation Fund
(A Series of GMO Trust)
Notes to Financial Statements — (Continued)
February 29, 2008
emerging markets. The securities markets of emerging countries are generally smaller, less developed, less liquid, and more volatile than the securities markets of the U.S. and developed foreign markets. Additionally, the investment risks associated with an investment in the underlying funds may be more pronounced to the extent that the underlying funds engage in derivative transactions.
Recently issued accounting pronouncements
In June 2006, the Financial Accounting Standards Board ("FASB") issued FASB Interpretation No. 48, Accounting for Uncertainty in Income Taxes – an Interpretation of FASB Statement No. 109 ("FIN 48"). FIN 48 clarifies the accounting for uncertainty in income taxes recognized in accordance with FASB Statement No. 109, Accounting for Income Taxes. FIN 48 prescribes a recognition threshold and measurement attribute for a tax position taken or expected to be taken in the tax return that could impact the Fund's financial statements. It also provides guidance in relation to the Fund's financial statements on classification of tax benefits or liabilities, interest and penalties, accounting in interim periods, disclosure, and transition. FIN 48 is effective for fiscal years beginning after December 15, 2006 for registered investment companies. Management has evaluated the effects of applying the various provisions of FIN 48 and has determined that the adoption of FIN 48 does not have a material effect on the Fund's financial statements. The Fund's federal tax returns for the prior three fiscal years, if applicable, remain subject to examination by the Internal Revenue Service. Management will continue to monitor the rules and guidance pertaining to FIN 48 and will take action if appropriate.
In September 2006, the FASB issued Statement of Financial Accounting Standards No. 157 ("FAS 157"), "Fair Value Measurements." FAS 157 defines fair value, establishes a framework for measuring fair value in accordance with generally accepted accounting principles and expands disclosure about fair value measurements. FAS 157 is effective for fiscal years beginning after November 15, 2007. Management is currently evaluating the impact the adoption of FAS 157 will have on the Fund's financial statement disclosures.
3. Fees and other transactions with affiliates
The Manager determines the allocation of the assets of the Fund among designated underlying funds. The Manager does not directly charge a management fee or shareholder service fee, but receives management and shareholder service fees from the underlying funds in which the Fund invests.
The Manager has contractually agreed to reimburse the Fund for Fund expenses through at least June 30, 2008 (excluding expenses indirectly incurred by investment in the underlying funds, fees and expenses of the independent Trustees of the Trust, fees and expenses for legal services not approved by the Manager for the Trust, compensation and expenses of the Trust's Chief Compliance Officer ("CCO") (excluding any employee benefits), brokerage commissions, securities lending fees and expenses, interest expense, transfer taxes, and other investment-related costs (including expenses associated with investments in any company that is an investment company or would be an investment company under the 1940 Act, but for the
12
GMO World Opportunities Equity Allocation Fund
(A Series of GMO Trust)
Notes to Financial Statements — (Continued)
February 29, 2008
exceptions to the definition of investment company provided in Section 3(c)(1) and 3(c)(7) of the 1940 Act), hedging transaction fees, extraordinary, non-recurring and certain other unusual expenses (including taxes)).
The Fund incurs fees and expenses indirectly as a shareholder in the underlying funds. For the year ended February 29, 2008, these indirect fees and expenses expressed as an annualized percentage of the Fund's average daily net assets were as follows:
| Indirect Net Expenses (excluding shareholder service fees) | Indirect Shareholder Service Fees | Total Indirect Expenses | |||||||||
| 0.456 | % | 0.077 | % | 0.533 | % | ||||||
The Fund's portion of the fees paid by the Trust to the independent Trustees and CCO during the year ended February 29, 2008, was $8,152 and $4,281, respectively. The compensation and expenses of the CCO are included in miscellaneous expenses in the Statement of Operations. No remuneration was paid by the Fund to any other officer of the Trust.
4. Purchases and sales of securities
Cost of purchases and proceeds from sales of securities, excluding short-term investments and class exchanges, for the year ended February 29, 2008 aggregated $374,013,850 and $194,138,941, respectively.
5. Guarantees
In the normal course of business the Fund enters into contracts with third-party service providers that contain a variety of representations and warranties and which provide general indemnifications. The Fund's maximum exposure under these arrangements is unknown, as this would involve future claims that may be made against the Fund that have not yet occurred. Based on experience, management is of the view that the risk of loss in connection with these potential indemnification obligations is remote; however, there can be no assurance that material liabilities related to such obligations will not arise in the future that could adversely impact the Fund.
6. Principal shareholders and related parties
As of February 29, 2008, 13.95% of the outstanding shares of the Fund were held by one shareholder. No other shareholder owned in excess of 10% of the outstanding shares of the Fund. Investment activities of this shareholder may have a material effect on the Fund.
13
GMO World Opportunities Equity Allocation Fund
(A Series of GMO Trust)
Notes to Financial Statements — (Continued)
February 29, 2008
As of February 29, 2008, less than 0.01% of the Fund's shares were held by one related party, comprised of a certain GMO employee account, and 9.24% of the Fund's shares were held by accounts for which the Manager has investment discretion.
7. Share transactions
The Declaration of Trust permits the Trustees to issue an unlimited number of shares of beneficial interest (without par value). Transactions in Fund shares were as follows:
| Year Ended February 29, 2008 | Year Ended February 28, 2007 | ||||||||||||||||||
| Class III: | Shares | Amount | Shares | Amount | |||||||||||||||
| Shares sold | 4,764,267 | $ | 122,806,681 | 20,252,428 | $ | 474,986,993 | |||||||||||||
| Shares issued to shareholders in reinvestment of distributions | 4,778,197 | 116,284,024 | 1,875,834 | 45,131,675 | |||||||||||||||
| Shares repurchased | (3,254,416 | ) | (80,044,244 | ) | (3,022,181 | ) | (70,815,321 | ) | |||||||||||
| Purchase premiums | — | 10,322 | — | 189,823 | |||||||||||||||
| Redemption fees | — | 31,970 | — | 28,163 | |||||||||||||||
| Net increase (decrease) | 6,288,048 | $ | 159,088,753 | 19,106,081 | $ | 449,521,333 | |||||||||||||
8. Investments in affiliated issuers
A summary of the Fund's transactions in the shares of affiliated issuers during the year ended February 29, 2008 is set forth below:
| Affiliate | Value, beginning of period | Purchases | Sales Proceeds | Dividend Income | Distributions of Realized Gains | Value, end of period | |||||||||||||||||||||
| GMO Currency Hedged International Equity Fund, Class III | $ | 62,894,979 | $ | 22,749,853 | $ | 73,718,947 | $ | — | $ | 16,345,829 | $ | — | |||||||||||||||
| GMO Emerging Markets Opportunities Fund, Class VI | 65,830,487 | 16,056,648 | 11,358,442 | 1,608,069 | 5,080,167 | 80,556,568 | |||||||||||||||||||||
| GMO International Growth Equity Fund, Class IV | 235,863,517 | 69,036,075 | 50,494,685 | 2,994,671 | 38,529,394 | 224,920,412 | |||||||||||||||||||||
| GMO International Intrinsic Value Fund, Class IV | 237,203,364 | 63,303,211 | 40,064,061 | 5,823,917 | 30,338,533 | 221,378,801 | |||||||||||||||||||||
14
GMO World Opportunities Equity Allocation Fund
(A Series of GMO Trust)
Notes to Financial Statements — (Continued)
February 29, 2008
| Affiliate | Value, beginning of period | Purchases | Sales Proceeds | Dividend Income | Distributions of Realized Gains | Value, end of period | |||||||||||||||||||||
| GMO International Small Companies Fund, Class III | $ | 127,930 | $ | 4,428 | $ | 127,246 | $ | — | $ | 4,428 | $ | — | |||||||||||||||
| GMO U.S. Core Equity Fund, Class VI | 217,211,140 | 75,375,100 | 17,875,560 | 4,346,993 | 26,426,057 | 224,789,300 | |||||||||||||||||||||
| GMO U.S. Quality Equity Fund, Class VI | 83,203,919 | 127,488,535 | 500,000 | 2,089,429 | 3,967,066 | 192,718,528 | |||||||||||||||||||||
| Totals | $ | 902,335,336 | $ | 374,013,850 | $ | 194,138,941 | $ | 16,863,079 | $ | 120,691,474 | $ | 944,363,609 | |||||||||||||||
15
Report of Independent Registered Public Accounting Firm
To the Trustees of GMO Trust and the Shareholders of
GMO World Opportunities Equity Allocation Fund
In our opinion, the accompanying statement of assets and liabilities, including the schedule of investments, and the related statements of operations and of changes in net assets and the financial highlights present fairly, in all material respects, the financial position of GMO World Opportunities Equity Allocation Fund (the "Fund") at February 29, 2008, the results of its operations for the year then ended, the changes in its net assets for each of the two years in the period then ended and the financial highlights for each of the periods indicated, in conformity with accounting principles generally accepted in the United States of America. These financial statements and financial highlights (hereafter referred to as "financial statements") are the responsibility of the Fund's management; our responsibility is to express an opinion on these financial statements based on our audits. We conducted our audits of these financial st atements in accordance with the standards of the Public Company Accounting Oversight Board (United States). Those standards require that we plan and perform the audit to obtain reasonable assurance about whether the financial statements are free of material misstatement. An audit includes examining, on a test basis, evidence supporting the amounts and disclosures in the financial statements, assessing the accounting principles used and significant estimates made by management, and evaluating the overall financial statement presentation. We believe that our audits, which included confirmation of securities at February 29, 2008 by correspondence with the custodian, provide a reasonable basis for our opinion.
PricewaterhouseCoopers LLP
Boston, Massachusetts
April 29, 2008
16
GMO World Opportunities Equity Allocation Fund
(A Series of GMO Trust)
Fund Expenses
February 29, 2008 (Unaudited)
Expense Examples: The following information is in relation to expenses for the six month period ended February 29, 2008.
As a shareholder of the Fund, you may incur two types of costs: (1) transaction costs, including purchase premiums and redemption fees; and (2) ongoing costs including indirect management fees, shareholder service fees, and other Fund expenses. This example is intended to help you understand your ongoing costs (in dollars) of investing in the Fund and to compare these costs with the ongoing costs of investing in other mutual funds.
These examples are based on an investment of $1,000 invested at the beginning of the period and held for the entire period, September 1, 2007 through February 29, 2008.
Actual Expenses
The first line of the table below provides information about actual account values and actual expenses. You may use the information in this line, together with the amount you invested, to estimate the expenses that you paid over the period. Simply divide your account value by $1,000 (for example, a $10,000,000 account value divided by $1,000 = 10,000), then multiply the result by the number in the first line under the heading entitled "Net Expense Incurred" to estimate the expenses you paid on your account during this period.
Hypothetical Example for Comparison Purposes
The second line of the table below provides information about hypothetical account values and hypothetical expenses based on the Fund's actual expense ratio and an assumed rate of return of 5% per year before expenses, which is not the Fund's actual return. The hypothetical account values and expenses may not be used to estimate the actual ending account balance or expenses you paid for the period. You may use this information to compare the ongoing costs of investing in the Fund with other funds. To do so, compare this 5% hypothetical example with the 5% hypothetical examples that appear in the shareholder reports of other funds.
Please note that the expenses shown in the table are meant to highlight your ongoing costs only and do not reflect any transactional costs, such as purchase premiums and redemption fees. Therefore, the second line of the table is useful in comparing ongoing costs only, and will not help you determine the relative total costs of owning different funds. In addition, if these transactional costs were included, your costs would have been higher.
| Annualized Net Expense Ratio | Beginning Account Value | Ending Account Value | Net Expense Incurred* | ||||||||||||||||
| Class III | |||||||||||||||||||
| 1) Actual | 0.53 | % | $ | 1,000.00 | $ | 946.10 | $ | 2.56 | |||||||||||
| 2) Hypothetical | 0.53 | % | $ | 1,000.00 | $ | 1,022.23 | $ | 2.66 | |||||||||||
* Expenses are calculated using the Class's annualized net expense ratio (including indirect expenses incurred) for the six months ended February 29, 2008, multiplied by the average account value over the period, multiplied by 182 days in the period, divided by 366 days in the year.
17
GMO World Opportunities Equity Allocation Fund
(A Series of GMO Trust)
Tax Information for the Tax Year Ended February 29, 2008 (Unaudited)
The Fund will notify shareholders of amounts for use in preparing 2008 income tax forms in January 2009.
The Fund's distributions to shareholders include $72,729,800 from long-term capital gains.
For taxable, non-corporate shareholders, 43.67% of the income and short-term capital gains, if any, distributed in the Fund's fiscal year ended February 29, 2008 represents qualified dividend income subject to the 15% rate category.
For corporate shareholders, 16.08% of the income and short-term capital gains, if any, distributed in the Fund's fiscal year ended February 29, 2008 qualified for the dividends-received deduction.
The Fund hereby designates as qualified interest income with respect to its taxable year ended February 29, 2008, $25,030,889 or if determined to be different, the qualified interest income of such year.
18
Trustees and Officers (Unaudited)
The following tables list the Trust's Trustees and Officers as of the date of this report; their address and date of birth ("DOB"); their position with the Trust; the length of time holding that position with the Trust; their principal occupation(s) during the past five years; the number of portfolios in the fund complex they oversee; and other directorships they hold in companies subject to registration or reporting requirements of the Securities Exchange Act of 1934 (generally called "public companies") or in registered investment companies. The Trust's Statement of Additional Information ("SAI") includes additional information about the Trust's trustees, including changes subsequent to the date of the report. The SAI is available, without charge, upon request by writing GMO, c/o GMO Trust, 40 Rowes Wharf, Boston, MA 02110.
Independent Trustees:
| Name, Address, and DOB | Position(s) Held with Trust | Term of Office1 and Length of Time Served | Principal Occupation(s) During Past Five Years | Number of Portfolios in Fund Complex Overseen by Trustee | Other Directorships Held by Trustee | ||||||||||||||||||
| Donald W. Glazer, Esq. c/o GMO Trust 40 Rowes Wharf Boston, MA 02110 DOB: 07/26/1944 | Chairman of the Board of Trustees | Chairman of the Board of Trustees since March 2005; Lead Independent Trustee (September 2004 – March 2005); Trustee since December 2000. | Consultant – Law and Business2; Vice Chair (since 2002) and Secretary, Provant, Inc. (provider of personnel performance improvement services and training products); Author of Legal Treatises. | 47 | None. | ||||||||||||||||||
1 Each Trustee is elected to serve during the continued lifetime of the Trust until he/she dies, resigns or is removed, or if sooner, until the next meeting of Shareholders called for the purpose of electing Trustees and until the election and qualification of his/her successor.
2 As part of Mr. Glazer's work as a consultant, he provides part-time consulting services to Goodwin Procter LLP ("Goodwin"). Goodwin has provided legal services to Renewable Resources, LLC, an affiliate of GMO; GMO, in connection with its relationship with Renewable Resources; and funds managed by Renewable Resources. Mr. Glazer has represented that he has no financial interest in, and is not involved in the provision of, such legal services. In the calendar years ended December 31, 2006 and December 31, 2007, these entities paid $825,738 and $291,721 respectively, in legal fees and disbursements to Goodwin.
19
Independent Trustees — (Continued)
| Name, Address, and DOB | Position(s) Held with Trust | Term of Office1 and Length of Time Served | Principal Occupation(s) During Past Five Years | Number of Portfolios in Fund Complex Overseen by Trustee | Other Directorships Held by Trustee | ||||||||||||||||||
| Jay O. Light c/o GMO Trust 40 Rowes Wharf Boston, MA 02110 DOB: 10/03/1941 | Trustee | Since May 1996. | Dean (since April 2006), Acting Dean (August 2005 – April 2006), Senior Associate Dean (1998 – 2005), and Professor of Business Administration, Harvard Business School. | 47 | Director of Harvard Management Company, Inc.3 and Verde, Inc.; Director of Partners HealthCare System, Inc. and Chair of its Investment Committee.4 | ||||||||||||||||||
| W. Nicholas Thorndike c/o GMO Trust 40 Rowes Wharf Boston, MA 02110 DOB: 03/28/1933 | Trustee | Since March 2005. | Director or trustee of various corporations and charitable organizations, including Courier Corporation (a book publisher and manufacturer) (July 1989 – present); Putnam Funds (December 1992 – June 2004); and Providence Journal (a newspaper publisher) (December 1986 – December 2003). | 47 | Director of Courier Corporation (a book publisher and manufacturer); Member of the Investment Committee of Partners HealthCare System, Inc.4 | ||||||||||||||||||
1 Each Trustee is elected to serve during the continued lifetime of the Trust until he/she dies, resigns or is removed, or if sooner, until the next meeting of Shareholders called for the purpose of electing Trustees and until the election and qualification of his/her successor.
3 Harvard Management Company, Inc. is a client of the Manager.
4 Partners HealthCare System, Inc. is a client of the Manager.
20
Principal Officers:
| Name, Address, and DOB | Position(s) Held with Trust | Term of Office5 and Length of Time Served | Principal Occupation(s) During Past Five Years | ||||||||||||
| Scott Eston c/o GMO Trust 40 Rowes Wharf Boston, MA 02110 DOB: 01/20/1956 | President and Chief Executive Officer | President and Chief Executive Officer since October 2002; Chief Financial Officer, November 2006 – February 2007. | Chief Financial Officer, Chief Operating Officer and Member, Grantham, Mayo, Van Otterloo & Co. LLC. | ||||||||||||
| Sheppard N. Burnett c/o GMO Trust 40 Rowes Wharf Boston, MA 02110 DOB: 10/24/1968 | Treasurer and Chief Financial Officer | Chief Financial Officer since March 2007; Treasurer since November 2006; Assistant Treasurer, September 2004 – November 2006. | Fund Administration Staff, Grantham, Mayo, Van Otterloo & Co. LLC (June 2004 – present); Vice President, Director of Tax, Columbia Management Group (2002 – 2004). | ||||||||||||
| Brent C. Arvidson c/o GMO Trust 40 Rowes Wharf Boston, MA 02110 DOB: 06/26/1969 | Assistant Treasurer | Since August 1998. | Senior Fund Administrator, Grantham, Mayo, Van Otterloo & Co. LLC. | ||||||||||||
| John L. Nasrah c/o GMO Trust 40 Rowes Wharf Boston, MA 02110 DOB: 05/27/1977 | Assistant Treasurer | Since March 2007. | Fund Administrator, Grantham, Mayo, Van Otterloo & Co. LLC (September 2004 – present); Tax Analyst, Bain & Company, Inc (June 2003 – September 2004); Senior Tax Associate, PricewaterhouseCoopers LLP (2001 – 2003). | ||||||||||||
| Mahmoodur Rahman c/o GMO Trust 40 Rowes Wharf Boston, MA 02110 DOB: 11/30/1967 | Assistant Treasurer | Since September 2007. | Fund Administrator, Grantham, Mayo, Van Otterloo & Co. (April 2007 – present); Vice President and Senior Tax Manager, Massachusetts Financial Services Company (January 2000 – April 2007). | ||||||||||||
5 Officers are elected to hold such office until their successor is elected and qualified to carry out the duties and responsibilities of their office, or until he or she resigns or is removed from office.
21
Principal Officers — (Continued)
| Name, Address, and DOB | Position(s) Held with Trust | Term of Office5 and Length of Time Served | Principal Occupation(s) During Past Five Years | ||||||||||||
| Michael E. Gillespie c/o GMO Trust 40 Rowes Wharf Boston, MA 02110 DOB: 02/18/1958 | Chief Compliance Officer | Since March 2005. | Vice President of Compliance (June 2004 – February 2005) and Director of Domestic Compliance (March 2002 – June 2004), Fidelity Investments; Vice President and Senior Counsel, State Street Bank and Trust Company (May 1998 – March 2002). | ||||||||||||
| Jason B. Harrison c/o GMO Trust 40 Rowes Wharf Boston, MA 02110 DOB: 01/29/1977 | Vice President and Clerk | Vice President since November 2006; Clerk since March 2006. | Legal Counsel, Grantham, Mayo, Van Otterloo & Co. LLC (since February 2006) and Attorney, Ropes & Gray LLP (September 2002 – February 2006). | ||||||||||||
| David L. Bohan c/o GMO Trust 40 Rowes Wharf Boston, MA 02110 DOB: 06/21/1964 | Vice President and Assistant Clerk | Vice President since March 2005; Assistant Clerk since March 2006. | Legal Counsel, Grantham, Mayo, Van Otterloo & Co. LLC (September 2003 – present); Attorney, Goodwin Procter LLP (September 1996 – September 2003). | ||||||||||||
| Gregory L. Pottle c/o GMO Trust 40 Rowes Wharf Boston, MA 02110 DOB: 07/09/1971 | Vice President and Assistant Clerk | Since November 2006. | Legal Counsel, Grantham, Mayo, Van Otterloo & Co. LLC. | ||||||||||||
| Anne K. Trinque c/o GMO Trust 40 Rowes Wharf Boston, MA 02110 DOB: 04/15/1978 | Vice President and Assistant Clerk | Since September 2007. | Legal Counsel, Grantham, Mayo, Van Otterloo & Co. LLC (since January 2007); Attorney, Goodwin Procter LLP (September 2003 – January 2007). | ||||||||||||
| Cheryl Wakeham c/o GMO Trust 40 Rowes Wharf Boston, MA 02110 DOB: 10/29/1958 | Anti-Money Laundering Officer | Since December 2004. | Manager, Client Service Administration, Grantham, Mayo, Van Otterloo & Co. LLC. | ||||||||||||
5 Officers are elected to hold such office until their successor is elected and qualified to carry out the duties and responsibilities of their office, or until he or she resigns or is removed from office.
22
GMO Alpha Only Fund
(A Series of GMO Trust)
Annual Report
February 29, 2008
For a free copy of the Fund's proxy voting guidelines, shareholders may call 1-617-346-7646 (collect), visit our website at www.gmo.com, or visit the Securities and Exchange Commission's website at www.sec.gov. Information regarding how the Fund voted proxies relating to portfolio securities during the most recent 12-month period ended June 30 is available on our website at www.gmo.com, or on the Securities and Exchange Commission's website at www.sec.gov.
The Fund files its complete schedule of portfolio holdings with the Securities and Exchange Commission for the first and third quarter of each fiscal year on Form N-Q, which is available on the Commission's website at www.sec.gov. The Fund's Form N-Q may be reviewed and copied at the Commission's Public Reference Room in Washington, D.C. Information on the operation of the Public Reference Room may be obtained by calling 1-800-SEC-0330. The Fund has a policy with respect to disclosure of portfolio holdings under which it may also make available on GMO's website (www.gmo.com) a complete schedule of portfolio holdings.
This report is prepared for the general information of shareholders. It is authorized for distribution to prospective investors only when preceded or accompanied by a prospectus for the GMO Trust.
GMO Alpha Only Fund
(A Series of GMO Trust)
Portfolio Management
Day-to-day management of the Fund's portfolio is the responsibility of the Asset Allocation Team within the Quantitative Division at Grantham, Mayo, Van Otterloo & Co. LLC.
Management Discussion and Analysis of Fund Performance
The Class III shares of the GMO Alpha Only Fund returned +8.7% for the fiscal year ended February 29, 2008, as compared to +4.4% for the Citigroup 3-Month Treasury Bill Index. During the fiscal year the Fund was exposed to global equity securities through its investment in underlying GMO mutual funds.
Allocation was positive while implementation was negative as the GMO U.S. Core Equity, GMO International Intrinsic Value, and GMO Emerging Markets Funds underperformed their respective benchmarks.
The views expressed herein are exclusively those of Grantham, Mayo, Van Otterloo & Co. LLC Management as of the date of this report and are subject to change. GMO disclaims any responsibility to update such views. They are not meant as investment advice.
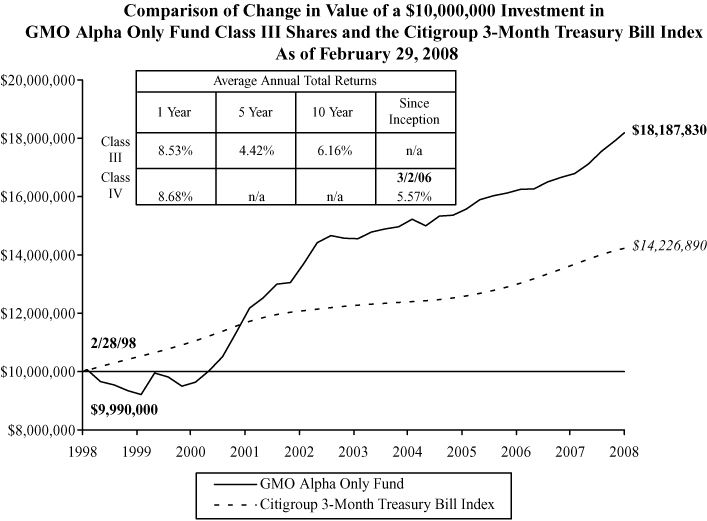
Performance data quoted represents past performance and is not indicative of future results. The investment return and principal value of an investment will fluctuate so that an investor's shares, when redeemed, may be worth more or less than their original cost. Current performance data may be lower or higher than the performance data provided herein. To obtain performance information to the most recent month-end, visit www.gmo.com. Performance shown is net of all fees after reimbursement from the Manager. Each performance figure assumes a purchase at the beginning and redemption at the end of the stated period and reflects a transaction fee of .10% on the purchase and .10% on the redemption. Transaction fees are retained by the Fund to cover trading costs. Returns would have been lower had certain expenses not been reimbursed during the periods shown and do not include the effect of taxes on distributions and redemptions. All information is unaudited. Performance for Class IV shares will vary due to different fees.
GMO Alpha Only Fund
(A Series of GMO Trust)
Investments Concentration Summary
February 29, 2008 (Unaudited)
| Asset Class Summary* | % of Total Net Assets | ||||||
| Cash and Cash Equivalents | 94.7 | % | |||||
| Common Stocks | 80.7 | ||||||
| Short-Term Investments | 9.3 | ||||||
| Preferred Stocks | 1.5 | ||||||
| Private Equity Securities | 0.1 | ||||||
| Investment Funds | 0.0 | ||||||
| Debt Obligations | 0.0 | ||||||
| Rights and Warrants | 0.0 | ||||||
| Convertible Securities | 0.0 | ||||||
| Forward Currency Contracts | (0.6 | ) | |||||
| Swaps | (31.0 | ) | |||||
| Futures | (58.2 | ) | |||||
| Other | 3.5 | ||||||
| 100.0 | % | ||||||
* The table above incorporates aggregate indirect asset class exposure associated with investments in other funds of GMO Trust ("underlying funds"). Swaps and futures concentrations assume the notional value of the respective contracts.
1
GMO Alpha Only Fund
(A Series of GMO Trust)
Schedule of Investments
(showing percentage of total net assets)
February 29, 2008
| Shares / Par Value ($) | Description | Value ($) | |||||||||||||
| MUTUAL FUNDS — 86.4% | |||||||||||||||
| United States — 86.4% | |||||||||||||||
| Affiliated Issuers | |||||||||||||||
| 12,609,071 | GMO Emerging Markets Fund, Class VI | 257,477,237 | |||||||||||||
| 20,973,613 | GMO International Growth Equity Fund, Class IV | 580,969,085 | |||||||||||||
| 19,374,037 | GMO International Intrinsic Value Fund, Class IV | 580,446,151 | |||||||||||||
| 50,930,003 | GMO U.S. Core Equity Fund, Class VI | 612,178,641 | |||||||||||||
| 16,148,468 | GMO U.S. Quality Equity Fund, Class VI | 332,173,994 | |||||||||||||
| 2,363,245,108 | |||||||||||||||
| TOTAL MUTUAL FUNDS (COST $2,566,438,713) | 2,363,245,108 | ||||||||||||||
| SHORT-TERM INVESTMENTS — 5.8% | |||||||||||||||
| 23,400,000 | ABN Amro Bank Time Deposit, 3.10%, due 03/03/08 | 23,400,000 | |||||||||||||
| 135,500,000 | ING Bank Time Deposit, 3.13%, due 03/03/08 | 135,500,000 | |||||||||||||
| TOTAL SHORT-TERM INVESTMENTS (COST $158,900,000) | 158,900,000 | ||||||||||||||
| TOTAL INVESTMENTS — 92.2% (Cost $2,725,338,713) | 2,522,145,108 | ||||||||||||||
| Other Assets and Liabilities (net) — 7.8% | 211,891,414 | ||||||||||||||
| TOTAL NET ASSETS — 100.0% | $ | 2,734,036,522 | |||||||||||||
See accompanying notes to the financial statements.
2
GMO Alpha Only Fund
(A Series of GMO Trust)
Schedule of Investments — (Continued)
February 29, 2008
A summary of outstanding financial instruments at February 29, 2008 is as follows:
Forward Currency Contracts
| Settlement Date | Deliver/Receive | Units of Currency | Value | Net Unrealized Appreciation (Depreciation) | |||||||||||||||
| Buys | |||||||||||||||||||
| 5/23/08 | AUD | 3,634,000 | $ | 3,348,961 | $ | (17,213 | ) | ||||||||||||
| 5/23/08 | CHF | 5,429,000 | 5,214,944 | 5,571 | |||||||||||||||
| 5/23/08 | DKK | 3,191,000 | 648,261 | (409 | ) | ||||||||||||||
| 5/23/08 | EUR | 20,094,000 | 30,418,163 | (20,028 | ) | ||||||||||||||
| 5/23/08 | GBP | 7,897,000 | 15,600,287 | (3,214 | ) | ||||||||||||||
| 5/23/08 | HKD | 10,893,000 | 1,401,891 | (256 | ) | ||||||||||||||
| 5/23/08 | JPY | 1,093,470,000 | 10,574,763 | 27,466 | |||||||||||||||
| 5/23/08 | NOK | 1,408,000 | 268,310 | (450 | ) | ||||||||||||||
| 5/23/08 | SEK | 9,258,000 | 1,495,793 | (3,456 | ) | ||||||||||||||
| 5/23/08 | SGD | 836,000 | 601,349 | (367 | ) | ||||||||||||||
| $ | 69,572,722 | $ | (12,356 | ) | |||||||||||||||
| Sales | |||||||||||||||||||
| 5/23/08 | AUD | 6,634,000 | $ | 6,113,651 | $ | (187,366 | ) | ||||||||||||
| 5/23/08 | AUD | 12,141,111 | 11,188,803 | (125,822 | ) | ||||||||||||||
| 5/23/08 | AUD | 12,141,111 | 11,188,803 | (122,556 | ) | ||||||||||||||
| 5/23/08 | AUD | 20,354,023 | 18,757,521 | (453,825 | ) | ||||||||||||||
| 5/23/08 | CHF | 13,015,864 | 12,502,671 | (580,215 | ) | ||||||||||||||
| 5/23/08 | CHF | 6,626,000 | 6,364,748 | (345,763 | ) | ||||||||||||||
| 5/23/08 | CHF | 22,561,044 | 21,671,501 | (1,053,853 | ) | ||||||||||||||
| 5/23/08 | CHF | 12,633,044 | 12,134,945 | (575,909 | ) | ||||||||||||||
| 5/23/08 | DKK | 7,622,056 | 1,548,443 | (46,134 | ) | ||||||||||||||
| 5/23/08 | DKK | 7,622,056 | 1,548,443 | (46,057 | ) | ||||||||||||||
| 5/23/08 | DKK | 7,140,000 | 1,450,512 | (53,607 | ) | ||||||||||||||
| 5/23/08 | DKK | 12,999,027 | 2,640,790 | (95,275 | ) | ||||||||||||||
| 5/23/08 | EUR | 17,395,038 | 26,332,493 | (774,311 | ) | ||||||||||||||
| 5/23/08 | EUR | 17,395,038 | 26,332,493 | (773,441 | ) | ||||||||||||||
| 5/23/08 | EUR | 41,559,038 | 62,911,795 | (2,391,783 | ) | ||||||||||||||
| 5/23/08 | EUR | 49,552,038 | 75,011,545 | (2,551,093 | ) | ||||||||||||||
| 5/23/08 | EUR | 17,395,038 | 26,332,493 | (771,876 | ) | ||||||||||||||
See accompanying notes to the financial statements.
3
GMO Alpha Only Fund
(A Series of GMO Trust)
Schedule of Investments — (Continued)
February 29, 2008
Forward Currency Contracts — continued
| Settlement Date | Deliver/Receive | Units of Currency | Value | Net Unrealized Appreciation (Depreciation) | |||||||||||||||
| Sales | |||||||||||||||||||
| 5/23/08 | EUR | 17,395,038 | $ | 26,332,493 | $ | (777,460 | ) | ||||||||||||
| 5/23/08 | EUR | 17,395,038 | 26,332,493 | (782,574 | ) | ||||||||||||||
| 5/23/08 | GBP | 18,768,147 | 37,075,911 | (661,577 | ) | ||||||||||||||
| 5/23/08 | GBP | 19,336,879 | 38,199,424 | (695,992 | ) | ||||||||||||||
| 5/23/08 | GBP | 18,768,147 | 37,075,911 | (697,424 | ) | ||||||||||||||
| 5/23/08 | GBP | 10,794,000 | 21,323,223 | (453,337 | ) | ||||||||||||||
| 5/23/08 | GBP | 14,715,000 | 29,069,041 | (256,335 | ) | ||||||||||||||
| 5/23/08 | HKD | 31,847,780 | 4,098,697 | (8,307 | ) | ||||||||||||||
| 5/23/08 | HKD | 51,192,081 | 6,588,240 | (12,143 | ) | ||||||||||||||
| 5/23/08 | HKD | 46,513,081 | 5,986,070 | (11,740 | ) | ||||||||||||||
| 5/23/08 | JPY | 4,399,068,633 | 42,542,648 | (1,338,519 | ) | ||||||||||||||
| 5/23/08 | JPY | 4,527,703,633 | 43,786,655 | (1,607,331 | ) | ||||||||||||||
| 5/23/08 | JPY | 2,252,668,633 | 21,785,177 | (747,673 | ) | ||||||||||||||
| 5/23/08 | JPY | 2,252,668,633 | 21,785,177 | (700,080 | ) | ||||||||||||||
| 5/23/08 | JPY | 2,252,668,633 | 21,785,177 | (750,442 | ) | ||||||||||||||
| 5/23/08 | NOK | 7,602,000 | 1,448,644 | (58,764 | ) | ||||||||||||||
| 5/23/08 | NOK | 8,693,995 | 1,656,735 | (41,412 | ) | ||||||||||||||
| 5/23/08 | NOK | 5,537,000 | 1,055,136 | (62,664 | ) | ||||||||||||||
| 5/23/08 | NOK | 8,438,289 | 1,608,008 | (38,942 | ) | ||||||||||||||
| 5/23/08 | NOK | 8,438,289 | 1,608,008 | (40,747 | ) | ||||||||||||||
| 5/23/08 | NZD | 433,000 | 341,662 | (7,157 | ) | ||||||||||||||
| 5/23/08 | NZD | 622,868 | 491,479 | (310 | ) | ||||||||||||||
| 5/23/08 | SEK | 24,184,936 | 3,907,503 | (92,369 | ) | ||||||||||||||
| 5/23/08 | SEK | 32,770,000 | 5,294,572 | (182,199 | ) | ||||||||||||||
| 5/23/08 | SEK | 24,184,936 | 3,907,503 | (92,418 | ) | ||||||||||||||
| 5/23/08 | SEK | 26,218,813 | 4,236,112 | (107,538 | ) | ||||||||||||||
| 5/23/08 | SGD | 4,652,110 | 3,346,340 | (43,922 | ) | ||||||||||||||
| 5/23/08 | SGD | 2,544,019 | 1,829,955 | (19,394 | ) | ||||||||||||||
| 5/23/08 | SGD | 2,544,019 | 1,829,955 | (21,827 | ) | ||||||||||||||
| 5/23/08 | SGD | 1,418,000 | 1,019,991 | (16,310 | ) | ||||||||||||||
| $ | 741,379,590 | $ | (21,275,793 | ) | |||||||||||||||
See accompanying notes to the financial statements.
4
GMO Alpha Only Fund
(A Series of GMO Trust)
Schedule of Investments — (Continued)
February 29, 2008
Futures Contracts
| Number of Contracts | Type | Expiration Date | Contract Value | Net Unrealized Appreciation (Depreciation) | |||||||||||||||
| Sales | |||||||||||||||||||
| 1,157 | CAC 40 | March 2008 | $ | 84,268,066 | $ | 589,641 | |||||||||||||
| 280 | DAX | March 2008 | 71,716,647 | 6,648,910 | |||||||||||||||
| 1,517 | FTSE 100 | March 2008 | 175,797,175 | 5,872,898 | |||||||||||||||
| 119 | HANG SENG | March 2008 | 18,512,267 | (471,836 | ) | ||||||||||||||
| 166 | IBEX 35 | March 2008 | 33,278,303 | 157,620 | |||||||||||||||
| 1,224 | OMXS 30 | March 2008 | 19,215,258 | (180,099 | ) | ||||||||||||||
| 536 | Russell 2000 | March 2008 | 184,062,400 | 16,513,531 | |||||||||||||||
| 414 | Russell 2000 Mini | March 2008 | 28,433,520 | 1,101,752 | |||||||||||||||
| 1,957 | S&P 500 E-MINI | March 2008 | 130,267,705 | 2,004,156 | |||||||||||||||
| 1,742 | S&P 500 | March 2008 | 579,781,150 | 50,209,845 | |||||||||||||||
| 123 | S&P/MIB | March 2008 | 31,433,607 | 2,305,757 | |||||||||||||||
| 408 | SPI 200 | March 2008 | 52,868,071 | 2,610,037 | |||||||||||||||
| 1,321 | TOPIX | March 2008 | 167,906,488 | 9,837,272 | |||||||||||||||
| $ | 1,577,540,657 | $ | 97,199,484 | ||||||||||||||||
Swap Agreements
Total Return Swaps
| Notional Amount | Expiration Date | Counterparty | Pay | Receive | Market Value | ||||||||||||||||||||||
| 163,008,881 | USD | 3/7/2008 | Citi Group | S&P Mid | 3 month | ||||||||||||||||||||||
| Cap Index | LIBOR -0.26% | $ | 19,268,730 | ||||||||||||||||||||||||
| 684,005,819 | USD | 6/17/2008 | Deutsche Bank | MSCI EAFE Equity Index | 3 month LIBOR -0.15% | 42,780,537 | |||||||||||||||||||||
| Premiums to (Pay) Receive | $ | — | $ | 62,049,267 | |||||||||||||||||||||||
As of February 29, 2008, for the futures and/or swap contracts held, the Fund had sufficient cash and/or securities to cover any commitments or margin requirements of the relevant broker or exchange.
See accompanying notes to the financial statements.
5
GMO Alpha Only Fund
(A Series of GMO Trust)
Schedule of Investments — (Continued)
February 29, 2008
Notes to Schedule of Investments:
LIBOR - London Interbank Offered Rate
As of February 29, 2008, 43.63% of the Net Assets of the Fund, through investments in the underlying funds, were valued using fair value prices based on models used by a third party vendor (Note 2).
Currency Abbreviations:
AUD - Australian Dollar
CHF - Swiss Franc
DKK - Danish Krone
EUR - Euro
GBP - British Pound
HKD - Hong Kong Dollar
JPY - Japanese Yen
NOK - Norwegian Krone
SEK - Swedish Krona
SGD - Singapore Dollar
USD - United States Dollar
See accompanying notes to the financial statements.
6
GMO Alpha Only Fund
(A Series of GMO Trust)
Statement of Assets and Liabilities — February 29, 2008
| Assets: | |||||||
| Investments in unaffiliated issuers, at value (cost $158,900,000) (Note 2) | $ | 158,900,000 | |||||
| Investments in affiliated issuers, at value (cost $2,566,438,713) (Notes 2 and 8) | 2,363,245,108 | ||||||
| Cash | 11,144 | ||||||
| Foreign currency, at value (cost $722) (Note 2) | 730 | ||||||
| Receivable for Fund shares sold | 112,894,403 | ||||||
| Interest receivable | 13,777 | ||||||
| Unrealized appreciation on open forward currency contracts (Note 2) | 33,037 | ||||||
| Receivable for collateral on open futures contracts (Note 2) | 105,706,000 | ||||||
| Receivable for collateral on open swap contracts (Note 2) | 117,156 | ||||||
| Receivable for variation margin on open futures contracts (Note 2) | 35,723,338 | ||||||
| Receivable for open swap contracts (Note 2) | 62,049,267 | ||||||
| Receivable for expenses reimbursed by Manager (Note 3) | 1,042,482 | ||||||
| Total assets | 2,839,736,442 | ||||||
| Liabilities: | |||||||
| Payable for Fund shares repurchased | 82,970,853 | ||||||
| Payable to affiliate for (Note 3): | |||||||
| Management fee | 1,009,818 | ||||||
| Shareholder service fee | 208,782 | ||||||
| Trustees and Chief Compliance Officer of GMO Trust fees | 2,322 | ||||||
| Unrealized depreciation on open forward currency contracts (Note 2) | 21,321,186 | ||||||
| Accrued expenses | 186,959 | ||||||
| Total liabilities | 105,699,920 | ||||||
| Net assets | $ | 2,734,036,522 | |||||
See accompanying notes to the financial statements.
7
GMO Alpha Only Fund
(A Series of GMO Trust)
Statement of Assets and Liabilities — February 29, 2008 — (Continued)
| Net assets consist of: | |||||||
| Paid-in capital | $ | 2,613,009,097 | |||||
| Distributions in excess of net investment income | (4,242,356 | ) | |||||
| Accumulated net realized gain | 190,502,776 | ||||||
| Net unrealized depreciation | (65,232,995 | ) | |||||
| $ | 2,734,036,522 | ||||||
| Net assets attributable to: | |||||||
| Class III shares | $ | 176,066,785 | |||||
| Class IV shares | $ | 2,557,969,737 | |||||
| Shares outstanding: | |||||||
| Class III | 15,846,259 | ||||||
| Class IV | 230,307,263 | ||||||
| Net asset value per share: | |||||||
| Class III | $ | 11.11 | |||||
| Class IV | $ | 11.11 | |||||
See accompanying notes to the financial statements.
8
GMO Alpha Only Fund
(A Series of GMO Trust)
Statement of Operations — Year Ended February 29, 2008
| Investment Income: | |||||||
| Dividends from affiliated issuers (Note 8) | $ | 30,677,610 | |||||
| Interest | 8,817,644 | ||||||
| Total investment income | 39,495,254 | ||||||
| Expenses: | |||||||
| Management fee (Note 3) | 9,547,627 | ||||||
| Shareholder service fee – Class III (Note 3) | 228,819 | ||||||
| Shareholder service fee – Class IV (Note 3) | 1,756,980 | ||||||
| Custodian and fund accounting agent fees | 207,061 | ||||||
| Transfer agent fees | 41,879 | ||||||
| Audit and tax fees | 68,349 | ||||||
| Legal fees | 48,104 | ||||||
| Trustees fees and related expenses (Note 3) | 17,911 | ||||||
| Registration fees | 28,125 | ||||||
| Miscellaneous | 15,658 | ||||||
| Total expenses | 11,960,513 | ||||||
| Fees and expenses reimbursed by Manager (Note 3) | (392,849 | ) | |||||
| Expense reductions (Note 2) | (35,002 | ) | |||||
| Indirectly incurred fees waived or borne by Manager (Note 3) | (8,193,155 | ) | |||||
| Shareholder service fee waived (Note 3) | (1,237,972 | ) | |||||
| Net expenses | 2,101,535 | ||||||
| Net investment income (loss) | 37,393,719 | ||||||
| Realized and unrealized gain (loss): | |||||||
| Net realized gain (loss) on: | |||||||
| Investments in affiliated issuers | 83,910,382 | ||||||
| Realized gains distributions from affiliated issuers (Note 8) | 223,211,919 | ||||||
| Closed futures contracts | 18,079,921 | ||||||
| Closed swap contracts | (39,386,867 | ) | |||||
| Foreign currency, forward contracts and foreign currency related transactions | (16,118,739 | ) | |||||
| Net realized gain (loss) | 269,696,616 | ||||||
| Change in net unrealized appreciation (depreciation) on: | |||||||
| Investments in affiliated issuers | (289,068,584 | ) | |||||
| Open futures contracts | 91,559,565 | ||||||
| Open swap contracts | 71,234,056 | ||||||
| Foreign currency, forward contracts and foreign currency related transactions | (20,259,810 | ) | |||||
| Net unrealized gain (loss) | (146,534,773 | ) | |||||
| Net realized and unrealized gain (loss) | 123,161,843 | ||||||
| Net increase (decrease) in net assets resulting from operations | $ | 160,555,562 | |||||
See accompanying notes to the financial statements.
9
GMO Alpha Only Fund
(A Series of GMO Trust)
Statement of Changes in Net Assets
| Year Ended February 29, 2008 | Year Ended February 28, 2007 | ||||||||||
| Increase (decrease) in net assets: | |||||||||||
| Operations: | |||||||||||
| Net investment income (loss) | $ | 37,393,719 | $ | 33,573,903 | |||||||
| Net realized gain (loss) | 269,696,616 | (31,773,569 | ) | ||||||||
| Change in net unrealized appreciation (depreciation) | (146,534,773 | ) | 44,611,020 | ||||||||
| Net increase (decrease) in net assets from operations | 160,555,562 | 46,411,354 | |||||||||
| Distributions to shareholders from: | |||||||||||
| Net investment income | |||||||||||
| Class III | (3,121,593 | ) | (3,116,898 | ) | |||||||
| Class IV | (37,623,319 | ) | (35,538,281 | ) | |||||||
| Total distributions from net investment income | (40,744,912 | ) | (38,655,179 | ) | |||||||
| Net share transactions (Note 7): | |||||||||||
| Class III | (140,995 | ) | (1,295,354,534 | ) | |||||||
| Class IV | 752,392,494 | 1,687,179,844 | |||||||||
| Increase (decrease) in net assets resulting from net share transactions | 752,251,499 | 391,825,310 | |||||||||
| Purchase premiums and redemption fees (Notes 2 and 7): | |||||||||||
| Class III | 148,551 | 121,944 | |||||||||
| Class IV | 1,407,214 | 553,818 | |||||||||
| Increase in net assets resulting from purchase premiums and redemption fees | 1,555,765 | 675,762 | |||||||||
| Total increase (decrease) in net assets resulting from net share transactions, purchase premiums and redemption fees | 753,807,264 | 392,501,072 | |||||||||
| Total increase (decrease) in net assets | 873,617,914 | 400,257,247 | |||||||||
| Net assets: | |||||||||||
| Beginning of period | 1,860,418,608 | 1,460,161,361 | |||||||||
| End of period (including distributions in excess of net investment income of $4,242,356 and $393,793, respectively) | $ | 2,734,036,522 | $ | 1,860,418,608 | |||||||
See accompanying notes to the financial statements.
10
GMO Alpha Only Fund
(A Series of GMO Trust)
Financial Highlights
(For a Class III share outstanding throughout each period)
| Year Ended February 28/29, | |||||||||||||||||||||||
| 2008 | 2007 | 2006 | 2005 | 2004 | |||||||||||||||||||
| Net asset value, beginning of period | $ | 10.42 | $ | 10.36 | $ | 10.26 | $ | 9.99 | $ | 9.63 | |||||||||||||
| Income (loss) from investment operations: | |||||||||||||||||||||||
| Net investment income (loss)(a)† | 0.21 | 0.17 | 0.16 | 0.19 | 0.17 | ||||||||||||||||||
| Net realized and unrealized gain (loss) | 0.70 | 0.10 | 0.31 | 0.08 | 0.19 | ||||||||||||||||||
| Total from investment operations | 0.91 | 0.27 | 0.47 | 0.27 | 0.36 | ||||||||||||||||||
| Less distributions to shareholders: | |||||||||||||||||||||||
| From net investment income | (0.22 | ) | (0.21 | ) | (0.37 | ) | — | — | |||||||||||||||
| Total distributions | (0.22 | ) | (0.21 | ) | (0.37 | ) | — | — | |||||||||||||||
| Net asset value, end of period | $ | 11.11 | $ | 10.42 | $ | 10.36 | $ | 10.26 | $ | 9.99 | |||||||||||||
| Total Return(b) | 8.74 | % | 2.64 | % | 4.63 | % | 2.70 | % | 3.74 | % | |||||||||||||
| Ratios/Supplemental Data: | |||||||||||||||||||||||
| Net assets, end of period (000's) | $ | 176,067 | $ | 166,626 | $ | 1,460,161 | $ | 179,488 | $ | 74,841 | |||||||||||||
| Net expenses to average daily net assets(c) | 0.16 | %(d) | 0.15 | % | 0.10 | % | 0.18 | % | 0.26 | % | |||||||||||||
| Net investment income to average daily net assets(a) | 1.91 | % | 1.66 | % | 1.52 | % | 1.94 | % | 1.72 | % | |||||||||||||
| Portfolio turnover rate | 44 | % | 22 | % | 40 | % | 19 | % | 11 | % | |||||||||||||
| Fees and expenses reimbursed and/or waived by the Manager to average daily net assets: | 0.51 | % | 0.53 | % | 0.59 | % | 0.62 | % | 0.72 | % | |||||||||||||
| Purchase premiums and redemption fees consisted of the following per share amounts:† | $ | 0.01 | $ | 0.01 | $ | 0.02 | $ | 0.01 | $ | 0.01 | |||||||||||||
(a) Net investment income is affected by the timing of the declaration of dividends by the underlying funds in which the Fund invests.
(b) The total returns would have been lower had certain expenses not been reimbursed and/or waived during the periods shown and assumes the effect of reinvested distributions. Calculation excludes purchase premiums and redemption fees which are borne by the shareholder.
(c) Net expenses exclude expenses incurred indirectly through investment in the underlying funds (See Note 3).
(d) The net expense ratio does not include the effect of expense reductions.
† Calculated using average shares outstanding throughout the period.
See accompanying notes to the financial statements.
11
GMO Alpha Only Fund
(A Series of GMO Trust)
Financial Highlights
(For a Class IV share outstanding throughout each period)
| Year Ended February 29, 2008 | Period from March 2, 2006 (commencement of operations) through February 28, 2007 | ||||||||||
| Net asset value, beginning of period | $ | 10.41 | $ | 10.37 | |||||||
| Income (loss) from investment operations: | |||||||||||
| Net investment income (loss)(a)† | 0.21 | 0.20 | |||||||||
| Net realized and unrealized gain (loss) | 0.71 | 0.06 | |||||||||
| Total from investment operations | 0.92 | 0.26 | |||||||||
| Less distributions to shareholders: | |||||||||||
| From net investment income | (0.22 | ) | (0.22 | ) | |||||||
| Total distributions | (0.22 | ) | (0.22 | ) | |||||||
| Net asset value, end of period | $ | 11.11 | $ | 10.41 | |||||||
| Total Return(b) | 8.90 | % | 2.54 | %** | |||||||
| Ratios/Supplemental Data: | |||||||||||
| Net assets, end of period (000's) | $ | 2,557,970 | $ | 1,693,793 | |||||||
| Net expenses to average daily net assets(c) | 0.11 | %(d) | 0.10 | %* | |||||||
| Net investment income to average daily net assets(a) | 1.96 | % | 1.93 | %* | |||||||
| Portfolio turnover rate | 44 | % | 22 | %†† | |||||||
| Fees and expenses reimbursed and/or waived by the Manager to average daily net assets: | 0.51 | % | 0.53 | %* | |||||||
| Purchase premiums and redemption fees consisted of the following per share amounts:† | $ | 0.01 | $ | 0.00 | (e) | ||||||
(a) Net investment income is affected by the timing of the declaration of dividends by the underlying funds in which the Fund invests.
(b) The total returns would have been lower had certain expenses not been reimbursed and/or waived during the periods shown and assumes the effect of reinvested distributions. Calculation excludes purchase premiums and redemption fees which are borne by the shareholder.
(c) Net expenses exclude expenses incurred indirectly through investment in the underlying funds (See Note 3).
(d) The net expense ratio does not include the effect of expense reductions.
(e) Purchase premiums and redemption fees were less than $0.01 per share.
† Calculated using average shares outstanding throughout the period.
†† Calculation represents porfolio turnover of the Fund for the year ended February 28, 2007.
* Annualized.
** Not annualized.
See accompanying notes to the financial statements.
12
GMO Alpha Only Fund
(A Series of GMO Trust)
Notes to Financial Statements
February 29, 2008
1. Organization
GMO Alpha Only Fund (the "Fund") is a series of GMO Trust (the "Trust"). The Fund is registered under the Investment Company Act of 1940, as amended, as an open-end, non-diversified management investment company. The Fund is advised and managed by Grantham, Mayo, Van Otterloo & Co. LLC (the "Manager" or "GMO"). The Trust was established as a Massachusetts business trust under the laws of the Commonwealth of Massachusetts on June 24, 1985. The Declaration of Trust permits the Trustees of the Trust ("Trustees") to create an unlimited number of series of shares ("Funds") and to subdivide Funds into classes.
The Fund seeks to outperform the Citigroup 3-Month Treasury Bill Index. The Fund invests primarily in shares of the GMO U.S. Equity Funds and the GMO International Equity Funds (which may include one or more of the GMO Emerging Markets Funds). The Fund also may invest in shares of GMO Emerging Country Debt Fund ("ECDF"). In addition, the Fund may invest directly in securities of the type in which the underlying funds invest. The Fund invests directly or indirectly in sub-asset classes that it expects to outperform the relevant broader asset class, and seeks to hedge some or all of the expected return (and foreign currency exposure) of the broader asset class. To the extent that the Fund's hedges are effective, the performance of the Fund's portfolio is expected to have a low correlation to the performance of the broader global asset classes in which the Fund directly or indirectly invests. Instead, the Fund is expected to produc e returns more like a short-term fixed income fund, with variation in return (alpha) resulting from aggregate outperformance or underperformance of the underlying funds and/or securities as well as the sub-asset classes in which the Fund invests relative to the relevant broader asset classes.
As of February 29, 2008, the Fund had two classes of shares outstanding: Class III and Class IV. Each class of shares bears a different level of shareholder service fees.
The financial statements of the series of the Trust in which the Fund invests ("underlying funds") should be read in conjunction with the Fund's financial statements. These financial statements are available, without charge, upon request by calling (617) 346-7646 (collect) or by visiting GMO's website at www.gmo.com.
2. Significant accounting policies
The following is a summary of significant accounting policies which are in conformity with accounting principles generally accepted in the United States of America ("U.S. GAAP") and which are consistently followed by the Fund in the preparation of its financial statements. The preparation of financial statements in accordance with U.S. GAAP requires management to make estimates and assumptions that affect the reported amounts and disclosures in the financial statements. Actual results could differ from those estimates. The accounting records of the Fund are maintained in U.S. dollars.
13
GMO Alpha Only Fund
(A Series of GMO Trust)
Notes to Financial Statements — (Continued)
February 29, 2008
Portfolio valuation
Shares of the underlying funds and other mutual funds are valued at their net asset value.
Investments held by the underlying funds are valued as follows. Securities listed on a securities exchange for which market quotations are readily available are valued at the last sale price or official closing price on each business day, or if there is no such reported sale or official closing price, at the most recent quoted bid price. Unlisted securities for which market quotations are readily available are generally valued at the most recent quoted bid price. Short-term investments with a remaining maturity of sixty days or less are generally valued at amortized cost, which approximates fair value. Securities for which quotations are not readily available or whose values the Manager has determined to be unreliable are valued at fair value as determined in good faith by the Trustees or other persons acting at their direction pursuant to procedures approved by the Trustees. By its nature, a fair value price is a good faith est imate of the value of a security at a given point in time and may not reflect the value that would be realized if the security was sold and the differences could be material. Because many foreign equity securities markets and exchanges close prior to the close of the New York Stock Exchange ("NYSE"), closing prices for foreign securities in those markets or on those exchanges do not reflect the events that occur after that close but before the close of the NYSE. As a result, foreign equity securities are generally valued using fair value prices supplied by a third party vendor based on models to the extent that these fair value prices are available.
Foreign currency translation
The market values of foreign securities, currency holdings and other assets and liabilities are translated to U.S. dollars based on the current exchange rates each business day. Income and expenses denominated in foreign currencies are translated at current exchange rates when accrued or incurred. The Fund does not isolate realized and unrealized gains and losses attributable to changes in exchange rates from gains and losses that arise from changes in the market value of investments. Such fluctuations are included with net realized and unrealized gain or loss on investments. Net realized gains and losses on foreign currency transactions represent gains and losses on disposition of currencies and forward currency contracts, currency gains and losses realized between the trade and settlement dates on securities transactions, and the difference between the amount of investment income and foreign withholding taxes recorded on the F und's accounting records and the U.S. dollar equivalent amounts actually received or paid.
Forward currency contracts
The Fund may enter into forward currency contracts including forward cross currency contracts. A forward currency contract is an agreement between two parties to buy and sell a currency at a set price on a future date. The market value of a forward currency contract fluctuates with changes in forward currency exchange rates. Forward currency contracts are marked to market daily using rates supplied by a quotation service and changes in value are recorded by the Fund as an unrealized gain or loss. Realized gains or losses equal to the difference between the value of the contract at the time it was opened and the value at the time it was closed are recorded upon delivery or receipt of the currency or, if a forward currency contract is offset by entering into another forward currency contract with the same broker, upon settlement of the net
14
GMO Alpha Only Fund
(A Series of GMO Trust)
Notes to Financial Statements — (Continued)
February 29, 2008
gain or loss. These contracts may involve market risk in excess of the unrealized gain or loss reflected in the Fund's Statement of Assets and Liabilities. In addition, the Fund could be exposed to risk if the counterparties are unable to meet the terms of the contracts or if there are movements in currency values that are unfavorable to the Fund. Forward currency contracts outstanding at the end of the period are listed in the Fund's Schedule of Investments.
Futures contracts
The Fund may purchase and sell futures contracts. Upon entering into a futures contract, the Fund is required to deposit with the futures clearing broker an amount of cash, U.S. government and agency obligations, or other liquid assets in accordance with the initial margin requirements of the broker or exchange. In addition, the Fund maintains cash or securities in an amount that at least equals the net amount payable in the event the Fund must deliver the full amount of the contracts. Futures contracts are marked to market daily and an appropriate payable or receivable for the change in value ("variation margin") is recorded by the Fund. The payable or receivable is liquidated on the following business day. Gains or losses are recognized but not considered realized until the contracts expire or are closed. Futures contracts involve, to varying degrees, risk of loss in excess of the variation margin disclosed in the Statement of Assets and Liabilities. Under certain circumstances, futures exchanges may establish daily limits on the amount that the price of a futures contract can vary from the previous day's settlement price, thereby effectively preventing liquidation of unfavorable positions. Losses may arise from changes in the value of the underlying instrument if the Fund is unable to liquidate a futures position due to an illiquid secondary market for the contracts or the imposition of price limits, or if counterparties do not perform under the contract terms. Futures contracts are generally valued at the settlement price established each day by the board of trade or exchange on which they are traded. Futures contracts outstanding at the end of the period are listed in the Fund's Schedule of Investments.
Options
The Fund may write call and put options. Writing options increases the Fund's exposure to the underlying instrument by, in the case of a call option, obligating the Fund to sell the underlying instrument at a set price to the option-holder and, in the case of a put option, obligating the Fund to purchase the underlying instrument at a set price from the option-holder. When the Fund writes a call or put option, an amount equal to the premium received is recorded as a liability and subsequently marked to market to reflect the current value of the option written. Premiums received from writing options which expire are treated as realized gains. Premiums received from writing options which are exercised or closed are added to the proceeds or offset against the amounts paid on the underlying future, security or currency transaction to determine the realized gain or loss. The Fund as a writer of an option has no control over whether t he underlying future, security or currency may be sold (call) or purchased (put) and as a result bears the market risk of an unfavorable change in the price of the future, security or currency underlying the written option. In the event that the Fund writes uncovered call options (i.e. options for investments that the Fund does not own), it bears the risk of incurring substantial losses if the price of the underlying instrument
15
GMO Alpha Only Fund
(A Series of GMO Trust)
Notes to Financial Statements — (Continued)
February 29, 2008
increases during the term of the option. There is the risk the Fund may not be able to enter into a closing transaction because of an illiquid market. There were no open written option contracts during the period.
The Fund may also purchase put and call options. Purchasing options alters the Fund's exposure to the underlying instrument by, in the case of a call option, entitling the Fund to purchase the underlying instrument at a set price from the writer of the option and, in the case of a put option, entitling the Fund to sell the underlying instrument at a set price to the writer of the option. The Fund pays a premium as a cost for a purchased option disclosed in the Schedule of Investments which is subsequently marked to market to reflect the current value of the option. Premiums paid for purchasing options which expire are treated as realized losses. Premiums paid for purchasing options which are exercised or closed are added to the amounts paid or offset against the proceeds on the closing transaction to determine the realized gain or loss. The risk associated with purchasing put and call options is limited to the premium paid. Ther e were no purchased option contracts outstanding at the end of the period.
Exchange traded options are valued at the last sale price, or if no sale is reported, the last bid price for purchased options and the last ask price for written options. Options traded over-the-counter are valued using prices supplied by a primary pricing source chosen by the Manager.
Swap agreements
The Fund may enter into swap agreements. A swap is an agreement to exchange the return generated by one instrument for the return generated by another instrument. Interest rate swap agreements involve the exchange by one party with another party of their respective commitments to pay or receive interest, e.g., an exchange of floating rate payments for fixed rate payments with respect to a notional amount of principal. Total return swap agreements involve a commitment by one party in the agreement to pay interest in exchange for a market-linked return, both based on notional amounts. To the extent the total return of the security or index underlying the transaction exceeds or falls short of the offsetting interest rate obligation, the party will receive a payment from or make a payment to the counterparty, respectively. Forward spread lock swap agreements involve commitments to pay or receive a settlement amount calculated as the difference between the swap spread and a fixed spread, multiplied by the notional amount times the duration of the swap rate. The swap spread is the difference between the benchmark swap rate (market rate) and the specific treasury rate. Variance swap agreements involve commitments to pay or receive a settlement amount calculated as the difference between the annualized realized variance of returns on the underlying price and a fixed quantity, also known as the variance strike, over a period of time. In connection with these agreements, cash or securities may be set aside as collateral by the Fund's custodian or brokers in accordance with the terms of the swap agreement. The Fund earns or pays interest on cash set aside as collateral.
Swaps are marked to market daily using models that incorporate quotations from market makers and the change in value, if any, is recorded as unrealized gain or loss in the Statement of Operations. Payments received or made on swap contracts are recorded as realized gain or loss in the Statement of Operations.
16
GMO Alpha Only Fund
(A Series of GMO Trust)
Notes to Financial Statements — (Continued)
February 29, 2008
Gains or losses are realized upon early termination of the swap agreements. These financial instruments are not actively traded on financial markets. The values assigned to these instruments are based upon the best available information and because of the uncertainty of the valuation, these values may differ significantly from the values that would have been realized had a ready market for these instruments existed, and the differences could be material. Entering into these agreements involves, to varying degrees, elements of credit, legal, market and documentation risk in excess of the amounts recognized in the Statement of Assets and Liabilities. Such risks involve the possibility that there will be no liquid market for these agreements, that the counterparties to the agreements may default on their obligations to perform or disagree as to the meaning of contractual terms in the agreements, or that there may be unfavorable cha nges in interest rates or the price of the index or security underlying these transactions. Swap agreements outstanding at the end of the period are listed in the Fund's Schedule of Investments.
Taxes and distributions
The Fund intends to qualify each tax year as a regulated investment company under Subchapter M of the Internal Revenue Code of 1986, as amended (the "Code"). The Fund intends to distribute substantially all of its net investment income and net realized short-term and long-term capital gains, if any, after giving effect to any available capital loss carryovers for U.S. federal income tax purposes. Therefore, no provision for U.S. federal income or excise tax is necessary.
The Fund's policy is to declare and pay distributions from net investment income, if any, semiannually, and from net realized short-term and long-term capital gains, if any, at least annually. All distributions are paid in shares of the Fund, at net asset value, unless the shareholder elects to receive cash distributions. Distributions to shareholders are recorded by the Fund on the ex-dividend date.
Income and capital gain distributions are determined in accordance with U.S. federal income tax regulations, which may differ from U.S. GAAP. Certain capital accounts in the financial statements are periodically adjusted for permanent differences in order to reflect their tax character. These adjustments have no impact on net assets or net asset value per share. Temporary differences which arise from recognizing certain items of income, expense, gain or loss in different periods for financial statement and tax purposes will reverse at some time in the future. Distributions in excess of net investment income or net realized gains are temporary over distributions for financial statement purposes resulting from differences in the recognition or classification of income or distributions for financial statement and tax purposes.
U.S. GAAP and tax accounting differences primarily relate to derivative contract transactions, differing treatment of mutual fund distributions received, foreign currency transactions and losses on wash sale transactions.
17
GMO Alpha Only Fund
(A Series of GMO Trust)
Notes to Financial Statements — (Continued)
February 29, 2008
The following reclassification represents the amount necessary to report the stated components of net assets on a tax basis, excluding certain temporary differences, as of February 29, 2008. The financial highlights exclude these adjustments.
| Distributions In Excess Of Net Investment Income | Accumulated Net Realized Gain | Paid-in Capital | |||||||||
| $ | (497,370 | ) | $ | 497,370 | $ | — | |||||
The tax character of distributions declared to shareholders is as follows:
| 2/29/2008 | 2/28/2007 | ||||||||||
| Ordinary income (including any short-term capital gains) | $ | 40,744,912 | $ | 38,655,179 | |||||||
| Total distributions | $ | 40,744,912 | $ | 38,655,179 | |||||||
Distributions in excess of tax basis earnings and profits, if significant, are reported in the financial statements as a tax return of capital.
As of February 29, 2008, the components of distributable earnings on a tax basis consisted of the following:
| Undistributed ordinary income | $ | 27,377,422 | |||||
| Undistributed long–term capital gain | $ | 266,059,357 | |||||
As of February 29, 2008, the approximate cost for U.S. federal income tax purposes and gross and net unrealized appreciation and depreciation in value of investments were as follows:
| Aggregate Cost | Gross Unrealized Appreciation | Gross Unrealized (Depreciation) | Net Unrealized Appreciation (Depreciation) | ||||||||||||
| $ | 2,731,066,010 | $ | 19,318,054 | $ | (228,238,956 | ) | $ | (208,920,902 | ) | ||||||
Security transactions and related investment income
Security transactions are accounted for on trade date. Income dividends and capital gain distributions from the underlying funds are recorded on the ex-dividend date. Interest income is recorded on the accrual basis. Non-cash dividends, if any, are recorded at the fair market value of the securities received. In determining the net gain or loss on securities sold, the cost of securities is determined on the identified cost basis.
18
GMO Alpha Only Fund
(A Series of GMO Trust)
Notes to Financial Statements — (Continued)
February 29, 2008
Expenses
The majority of expenses of the Trust are directly identifiable to an individual fund. Expenses which are not readily identifiable to a specific fund are allocated taking into consideration, among other things, the nature and type of expense and the relative size of the funds. Investment income, common expenses and realized and unrealized gains and losses are allocated pro rata among the classes of shares of the Fund based on the relative net assets of each class. Shareholder service fees, which are directly attributable to a class of shares, are charged to that class's operations. In addition, the Fund will also incur certain fees and expenses indirectly as a shareholder in the underlying funds. Because the underlying funds have varied expense and fee levels and the Fund may own different proportions of the underlying funds at different times, the amount of fees and expenses indirectly incurred by the Fund will vary (See Note 3 ).
Brown Brothers Harriman & Co. ("BBH") serves as custodian and fund accounting agent of the Fund. State Street Bank and Trust Company ("State Street") serves as transfer agent of the Fund. BBH and State Street's fees may be reduced by credits that are an earnings allowance calculated on the average daily cash balances the Fund maintains with each agent. Credit balances or expense reimbursements used to reduce fees, if any, are reported as a reduction of expenses in the Statement of Operations.
Purchases and redemptions of Fund shares
As of February 29, 2008, the premium on cash purchases and fee on cash redemptions of Fund shares were each 0.10% of the amount invested or redeemed. The redemption fee is only applicable to shares acquired on or after June 30, 2003. The Fund's purchase premium and redemption fee are approximately equal to the weighted average of the purchase premiums and redemption fees, if any, of the underlying funds in which the Fund was invested as of June 30, 2007 and the estimated transaction costs of investing directly in securities. The level of purchase premium and redemption fee for the Fund may be adjusted to account for changes in the Fund's investments (i.e. changes in the percentage of Fund assets allocated to each underlying fund and direct investments). If the Manager determines that any portion of a cash purchase or redemption is offset by a corresponding cash redemption or purchase occurring on the same day, it will waive the purchase premium or redemption fee in an amount approximately equal to the fee with respect to that portion. In addition, the purchase premium or redemption fee charged by the Fund may be waived in extraordinary circumstances if the Fund will not incur transaction costs. All purchase premiums and redemption fees are paid to and recorded by the Fund as paid-in capital. The Manager will waive the purchase premium relating to the in-kind portion of a purchase transaction except to the extent of certain estimated or known transaction costs (e.g. stamp duties and transfer taxes) incurred by the Fund in connection with the transfer of the purchasing shareholder's securities to the Fund. In-kind redemption transactions are generally not subject to redemption fees except to the extent those transactions include a cash component. However, when a substantial portion of a Fund is being redeemed, the Fund may assess estimated or known transaction costs. There is no premium for reinvested distributions.
19
GMO Alpha Only Fund
(A Series of GMO Trust)
Notes to Financial Statements — (Continued)
February 29, 2008
Investment risks
The Fund is subject to the investment risks associated with an investment in the underlying funds, some of which may invest in foreign securities. There are certain additional risks involved in investing in foreign securities that are not inherent in investments in U.S. securities. These risks may involve adverse political and economic developments, including the possible imposition of capital controls or other foreign governmental laws or restrictions. In addition, the securities of some foreign companies and securities markets are less liquid and at times more volatile than securities of comparable U.S. companies and U.S. securities markets. The risks described above apply to an even greater extent to investments in emerging markets. The securities markets of emerging countries are gen erally smaller, less developed, less liquid, and more volatile than the securities markets of the U.S. and developed foreign markets. Additionally, the investment risks associated with an investment in the underlying funds may be more pronounced to the extent that the underlying funds engage in derivative transactions.
Recently issued accounting pronouncements
In June 2006, the Financial Accounting Standards Board ("FASB") issued FASB Interpretation No. 48, Accounting for Uncertainty in Income Taxes – an Interpretation of FASB Statement No. 109 ("FIN 48"). FIN 48 clarifies the accounting for uncertainty in income taxes recognized in accordance with FASB Statement No. 109, Accounting for Income Taxes. FIN 48 prescribes a recognition threshold and measurement attribute for a tax position taken or expected to be taken in the tax return that could impact the Fund's financial statements. It also provides guidance in relation to the Fund's financial statements on classification of tax benefits or liabilities, interest and penalties, accounting in interim periods, disclosure, and transition. FIN 48 is effective for fiscal years beginning after December 15, 2006 for registered investment companies. Management has evaluated the effects of applying the various provisions of FIN 48 and has determined that the adoption of FIN 48 does not have a material effect on the Fund's financial statements. The Fund's federal tax returns for the prior three fiscal years, if applicable, remain subject to examination by the Internal Revenue Service. Management will continue to monitor the rules and guidance pertaining to FIN 48 and will take action if appropriate.
In September 2006, the FASB issued Statement of Financial Accounting Standards No. 157 ("FAS 157"), "Fair Value Measurements." FAS 157 defines fair value, establishes a framework for measuring fair value in accordance with generally accepted accounting principles and expands disclosure about fair value measurements. FAS 157 is effective for fiscal years beginning after November 15, 2007. Management is currently evaluating the impact the adoption of FAS 157 will have on the Fund's financial statement disclosures.
3. Fees and other transactions with affiliates
GMO earns a management fee paid monthly at the annual rate of 0.50% of average daily net assets. The Fund has adopted a Shareholder Service Plan under which the Fund pays GMO a shareholder service fee for client and shareholder service, reporting, and other support. Pursuant to the Shareholder Service Plan,
20
GMO Alpha Only Fund
(A Series of GMO Trust)
Notes to Financial Statements — (Continued)
February 29, 2008
the shareholder service fee is calculated based on average daily net assets at the annual rate of 0.15% for Class III shares and 0.10% for Class IV shares. The Manager will waive the Fund's shareholder service fee to the extent that the aggregate of any direct and indirect shareholder service fees borne by a class of shares of the Fund exceeds 0.15% for Class III shares and 0.10% for Class IV shares; provided, however, that the amount of this waiver will not exceed the respective Class' shareholder service fee.
The Manager has contractually agreed to reimburse the Fund for Fund expenses through at least June 30, 2008 to the extent the Fund's total annual operating expenses (excluding shareholder service fees, expenses indirectly incurred by investment in the underlying funds, fees and expenses of the independent Trustees of the Trust, fees and expenses for legal services not approved by the Manager for the Trust, compensation and expenses of the Trust's Chief Compliance Officer ("CCO") (excluding any employee benefits), brokerage commissions, securities lending fees and expenses, interest expense, transfer taxes, and other investment-related costs (including expenses associated with investments in any company that is an investment company or would be an investment company under the 1940 Act, but for the exceptions to the definition of investment company provided in Section 3(c)(1) and 3(c)(7) of the 1940 Act), hedging transaction fees, extraordinary, non-recurring and certain other unusual expenses (including taxes) (collectively, "Excluded Fund Fees and Expenses")) exceed 0.50% of the Fund's average daily net assets. In addition, the Manager has contractually agreed to reimburse the Fund through at least June 30, 2008 to the extent that the sum of (a) the Fund's total annual operating expenses (excluding Excluded Fund Fees and Expenses) and (b) the amount of fees and expenses incurred indirectly by the Fund through its investment in underlying funds (excluding these Funds' Excluded Fund Fees and Expenses) exceeds 0.50% of the Fund's average daily net assets, subject to a maximum total reimbursement to the Fund equal to 0.50% of the Fund's average daily net assets.
The Fund incurs fees and expenses indirectly as a shareholder in the underlying funds. For the year ended February 29, 2008, these indirect fees and expenses expressed as an annualized percentage of the Fund's average daily net assets were as follows:
| Indirect Net Expenses (excluding shareholder service fees) | Indirect Shareholder Service Fees | Total Indirect Expenses | |||||||||
| 0.445 | % | 0.065 | % | 0.510 | % | ||||||
The Fund's portion of the fees paid by the Trust to the independent Trustees and CCO during the year ended February 29, 2008 was $15,243 and $7,048, respectively. The compensation and expenses of the CCO are included in miscellaneous expenses in the Statement of Operations. No remuneration was paid by the Fund to any other officer of the Trust.
21
GMO Alpha Only Fund
(A Series of GMO Trust)
Notes to Financial Statements — (Continued)
February 29, 2008
4. Purchase and sales of securities
Cost of purchases and proceeds from sales of securities, excluding short-term investments and class exchanges, for the year ended February 29, 2008 aggregated $1,685,296,529 and $758,611,000, respectively.
5. Guarantees
In the normal course of business the Fund enters into contracts with third-party service providers that contain a variety of representations and warranties and which provide general indemnifications. The Fund's maximum exposure under these arrangements is unknown, as this would involve future claims that may be made against the Fund that have not yet occurred. Based on experience, management is of the view that the risk of loss in connection with these potential indemnification obligations is remote; however, there can be no assurance that material liabilities related to such obligations will not arise in the future that could adversely impact the Fund.
6. Principal shareholders and related parties
As of February 29, 2008, 81.86% of the outstanding shares of the Fund were held by three shareholders, each holding in excess of 10% of the Fund's outstanding shares. No other shareholder owned in excess of 10% of the outstanding shares of the Fund. Two of the shareholders are other funds of the Trust. Investment activities of these shareholders may have a material effect on the Fund.
As of February 29, 2008, 0.70% of the Fund's shares were held by twenty-six related parties comprised of certain GMO employee accounts, and 99.19% of the Fund's shares were held by accounts for which the Manager has investment discretion.
7. Share transactions
The Declaration of Trust permits the Trustees to issue an unlimited number of shares of beneficial interest (without par value). Transactions in Fund shares were as follows:
| Year Ended February 29, 2008 | Year Ended February 28, 2007 | ||||||||||||||||||
| Class III: | Shares | Amount | Shares | Amount | |||||||||||||||
| Shares sold | 7,060,158 | $ | 77,385,165 | 11,398,240 | $ | 118,203,482 | |||||||||||||
| Shares issued to shareholders in reinvestment of distributions | 219,377 | 2,393,411 | 233,076 | 2,410,625 | |||||||||||||||
| Shares repurchased | (7,426,248 | ) | (79,919,571 | ) | (136,539,471 | ) | (1,415,968,641 | ) | |||||||||||
| Purchase premiums | — | 77,245 | — | 78,587 | �� | ||||||||||||||
| Redemption fees | — | 71,306 | — | 43,357 | |||||||||||||||
| Net increase (decrease) | (146,713 | ) | $ | 7,556 | (124,908,155 | ) | $ | (1,295,232,590 | ) | ||||||||||
22
GMO Alpha Only Fund
(A Series of GMO Trust)
Notes to Financial Statements — (Continued)
February 29, 2008
| Year Ended February 29, 2008 | Period from March 2, 2006 (commencement of operations) through February 28, 2007 | ||||||||||||||||||
| Class IV: | Shares | Amount | Shares | Amount | |||||||||||||||
| Shares sold | 111,659,135 | $ | 1,226,989,475 | 177,462,267 | $ | 1,840,405,225 | |||||||||||||
| Shares issued to shareholders in reinvestment of distributions | 3,451,680 | 37,623,319 | 3,436,637 | 35,538,033 | |||||||||||||||
| Shares repurchased | (47,448,673 | ) | (512,220,300 | ) | (18,253,783 | ) | (188,763,414 | ) | |||||||||||
| Purchase premiums | — | 1,070,665 | — | 423,410 | |||||||||||||||
| Redemption fees | — | 336,549 | — | 130,408 | |||||||||||||||
| Net increase (decrease) | 67,662,142 | $ | 753,799,708 | 162,645,121 | $ | 1,687,733,662 | |||||||||||||
8. Investments in affiliated issuers
A summary of the Fund's transactions in the shares of affiliated issuers during the year ended February 29, 2008 is set forth below:
| Affiliate | Value, beginning of period | Purchases | Sales Proceeds | Dividend Income | Distributions of Realized Gains | Value, end of period | |||||||||||||||||||||
| GMO Emerging Markets Fund, Class VI | $ | 194,843,664 | $ | 200,286,842 | $ | 144,011,000 | $ | 2,575,654 | $ | 45,206,188 | $ | 257,477,237 | |||||||||||||||
| GMO International Growth Equity Fund, Class IV | 397,932,659 | 416,687,590 | 189,808,000 | 5,580,563 | 67,807,028 | 580,969,085 | |||||||||||||||||||||
| GMO International Intrinsic Value Fund, Class IV | 399,488,346 | 426,446,174 | 183,608,000 | 10,833,641 | 53,922,533 | 580,446,151 | |||||||||||||||||||||
| GMO U.S. Core Equity Fund, Class VI | 421,080,896 | 443,106,907 | 160,940,000 | 7,791,601 | 50,481,306 | 612,178,641 | |||||||||||||||||||||
| GMO U.S. Quality Equity Fund, Class VI | 228,372,215 | 198,769,016 | 80,244,000 | 3,896,151 | 5,794,864 | 332,173,994 | |||||||||||||||||||||
| Totals | $ | 1,641,717,780 | $ | 1,685,296,529 | $ | 758,611,000 | $ | 30,677,610 | $ | 223,211,919 | $ | 2,363,245,108 | |||||||||||||||
23
Report of Independent Registered Public Accounting Firm
To the Trustees of GMO Trust and the Shareholders of
GMO Alpha Only Fund
In our opinion, the accompanying statement of assets and liabilities, including the schedule of investments, and the related statements of operations and of changes in net assets and the financial highlights present fairly, in all material respects, the financial position of GMO Alpha Only Fund (the "Fund") at February 29, 2008, the results of its operations for the year then ended, the changes in its net assets for each of the two years in the period then ended and the financial highlights for each of the five years in the period then ended, in conformity with accounting principles generally accepted in the United States of America. These financial statements and financial highlights (hereafter referred to as "financial statements") are the responsibility of the Fund's management; our responsibility is to express an opinion on these financial statements based on our audits. We conducted our audits of these financial statements in accordance with the standards of the Public Company Accounting Oversight Board (United States). Those standards require that we plan and perform the audit to obtain reasonable assurance about whether the financial statements are free of material misstatement. An audit includes examining, on a test basis, evidence supporting the amounts and disclosures in the financial statements, assessing the accounting principles used and significant estimates made by management, and evaluating the overall financial statement presentation. We believe that our audits, which included confirmation of securities at February 29, 2008 by correspondence with the custodian and brokers, provide a reasonable basis for our opinion.
PricewaterhouseCoopers LLP
Boston, Massachusetts
April 29, 2008
24
GMO Alpha Only Fund
(A Series of GMO Trust)
Fund Expenses
February 29, 2008 (Unaudited)
Expense Examples: The following information is in relation to expenses for the six month period ended February 29, 2008.
As a shareholder of the Fund, you may incur two types of costs: (1) transaction costs, including purchase premiums and redemption fees; and (2) ongoing costs, including management fees, shareholder service fees, and other Fund expenses. This example is intended to help you understand your ongoing costs (in dollars) of investing in the Fund and to compare these costs with the ongoing costs of investing in other mutual funds.
These examples are based on an investment of $1,000 invested at the beginning of the period and held for the entire period, September 1, 2007 through February 29, 2008.
Actual Expenses
The first line of the table for each class below provides information about actual account values and actual expenses. You may use the information in this line, together with the amount you invested, to estimate the expenses that you paid over the period. Simply divide your account value by $1,000 (for example, a $10,000,000 account value divided by $1,000 = 10,000), then multiply the result by the number in the first line under the heading entitled "Net Expense Incurred" to estimate the expenses you paid on your account during this period.
Hypothetical Example for Comparison Purposes
The second line of the table for each class below provides information about hypothetical account values and hypothetical expenses based on the Fund's actual expense ratio and an assumed rate of return of 5% per year before expenses, which is not the Fund's actual return. The hypothetical account values and expenses may not be used to estimate the actual ending account balance or expenses you paid for the period. You may use this information to compare the ongoing costs of investing in the Fund with other funds. To do so, compare this 5% hypothetical example with the 5% hypothetical examples that appear in the shareholder reports of other funds.
Please note that the expenses shown in the table are meant to highlight your ongoing costs only and do not reflect any transactional costs, such as purchase premiums and redemption fees. Therefore, the second line of the table is useful in comparing ongoing costs only, and will not help you determine the relative total costs of owning different funds. In addition, if these transactional costs were included, your costs would have been higher.
| Annualized Expense Ratio | Beginning Account Value | Ending Account Value | Net Expense Incurred* | ||||||||||||||||
| Class III | |||||||||||||||||||
| 1) Actual | 0.67 | % | $ | 1,000.00 | $ | 1,043.40 | $ | 3.40 | |||||||||||
| 2) Hypothetical | 0.67 | % | $ | 1,000.00 | $ | 1,021.53 | $ | 3.37 | |||||||||||
| Class IV | |||||||||||||||||||
| 1) Actual | 0.62 | % | $ | 1,000.00 | $ | 1,043.90 | $ | 3.15 | |||||||||||
| 2) Hypothetical | 0.62 | % | $ | 1,000.00 | $ | 1,021.78 | $ | 3.12 | |||||||||||
* Expenses are calculated using each Class's annualized net expense ratio (including indirect expenses incurred) for the six months ended February 29, 2008, multiplied by the average account value over the period, multiplied by 182 days in the period, divided by 366 days in the year.
25
GMO Alpha Only Fund
(A Series of GMO Trust)
Tax Information for the Tax Year Ended February 29, 2008 (Unaudited)
The Fund will notify shareholders of amounts for use in preparing 2008 income tax forms in January 2009.
For taxable, non-corporate shareholders, 86.28% of the income and short-term capital gains, if any, distributed in the Fund's fiscal year ended February 29, 2008 represents qualified dividend income subject to the 15% rate category.
For corporate shareholders, 31.69% of the income and short-term capital gains, if any, distributed in the Fund's fiscal year ended February 29, 2008 qualified for the dividends-received deduction.
26
Trustees and Officers (Unaudited)
The following tables list the Trust's Trustees and Officers as of the date of this report; their address and date of birth ("DOB"); their position with the Trust; the length of time holding that position with the Trust; their principal occupation(s) during the past five years; the number of portfolios in the fund complex they oversee; and other directorships they hold in companies subject to registration or reporting requirements of the Securities Exchange Act of 1934 (generally called "public companies") or in registered investment companies. The Trust's Statement of Additional Information ("SAI") includes additional information about the Trust's trustees, including changes subsequent to the date of the report. The SAI is available, without charge, upon request by writing GMO, c/o GMO Trust, 40 Rowes Wharf, Boston, MA 02110.
Independent Trustees:
| Name, Address, and DOB | Position(s) Held with Trust | Term of Office1 and Length of Time Served | Principal Occupation(s) During Past Five Years | Number of Portfolios in Fund Complex Overseen by Trustee | Other Directorships Held by Trustee | ||||||||||||||||||
| Donald W. Glazer, Esq. c/o GMO Trust 40 Rowes Wharf Boston, MA 02110 DOB: 07/26/1944 | Chairman of the Board of Trustees | Chairman of the Board of Trustees since March 2005; Lead Independent Trustee (September 2004 – March 2005); Trustee since December 2000. | Consultant – Law and Business2; Vice Chair (since 2002) and Secretary, Provant, Inc. (provider of personnel performance improvement services and training products); Author of Legal Treatises. | 47 | None. | ||||||||||||||||||
1 Each Trustee is elected to serve during the continued lifetime of the Trust until he/she dies, resigns or is removed, or if sooner, until the next meeting of Shareholders called for the purpose of electing Trustees and until the election and qualification of his/her successor.
2 As part of Mr. Glazer's work as a consultant, he provides part-time consulting services to Goodwin Procter LLP ("Goodwin"). Goodwin has provided legal services to Renewable Resources, LLC, an affiliate of GMO; GMO, in connection with its relationship with Renewable Resources; and funds managed by Renewable Resources. Mr. Glazer has represented that he has no financial interest in, and is not involved in the provision of, such legal services. In the calendar years ended December 31, 2006 and December 31, 2007, these entities paid $825,738 and $291,721 respectively, in legal fees and disbursements to Goodwin.
27
Independent Trustees — (Continued)
| Name, Address, and DOB | Position(s) Held with Trust | Term of Office1 and Length of Time Served | Principal Occupation(s) During Past Five Years | Number of Portfolios in Fund Complex Overseen by Trustee | Other Directorships Held by Trustee | ||||||||||||||||||
| Jay O. Light c/o GMO Trust 40 Rowes Wharf Boston, MA 02110 DOB: 10/03/1941 | Trustee | Since May 1996. | Dean (since April 2006), Acting Dean (August 2005 – April 2006), Senior Associate Dean (1998 – 2005), and Professor of Business Administration, Harvard Business School. | 47 | Director of Harvard Management Company, Inc.3 and Verde, Inc.; Director of Partners HealthCare System, Inc. and Chair of its Investment Committee.4 | ||||||||||||||||||
| W. Nicholas Thorndike c/o GMO Trust 40 Rowes Wharf Boston, MA 02110 DOB: 03/28/1933 | Trustee | Since March 2005. | Director or trustee of various corporations and charitable organizations, including Courier Corporation (a book publisher and manufacturer) (July 1989 – present); Putnam Funds (December 1992 – June 2004); and Providence Journal (a newspaper publisher) (December 1986 – December 2003). | 47 | Director of Courier Corporation (a book publisher and manufacturer); Member of the Investment Committee of Partners HealthCare System, Inc.4 | ||||||||||||||||||
1 Each Trustee is elected to serve during the continued lifetime of the Trust until he/she dies, resigns or is removed, or if sooner, until the next meeting of Shareholders called for the purpose of electing Trustees and until the election and qualification of his/her successor.
3 Harvard Management Company, Inc. is a client of the Manager.
4 Partners HealthCare System, Inc. is a client of the Manager.
28
Principal Officers:
| Name, Address, and DOB | Position(s) Held with Trust | Term of Office5 and Length of Time Served | Principal Occupation(s) During Past Five Years | ||||||||||||
| Scott Eston c/o GMO Trust 40 Rowes Wharf Boston, MA 02110 DOB: 01/20/1956 | President and Chief Executive Officer | President and Chief Executive Officer since October 2002; Chief Financial Officer, November 2006 – February 2007. | Chief Financial Officer, Chief Operating Officer and Member, Grantham, Mayo, Van Otterloo & Co. LLC. | ||||||||||||
| Sheppard N. Burnett c/o GMO Trust 40 Rowes Wharf Boston, MA 02110 DOB: 10/24/1968 | Treasurer and Chief Financial Officer | Chief Financial Officer since March 2007; Treasurer since November 2006; Assistant Treasurer, September 2004 – November 2006. | Fund Administration Staff, Grantham, Mayo, Van Otterloo & Co. LLC (June 2004 – present); Vice President, Director of Tax, Columbia Management Group (2002 – 2004). | ||||||||||||
| Brent C. Arvidson c/o GMO Trust 40 Rowes Wharf Boston, MA 02110 DOB: 06/26/1969 | Assistant Treasurer | Since August 1998. | Senior Fund Administrator, Grantham, Mayo, Van Otterloo & Co. LLC. | ||||||||||||
| John L. Nasrah c/o GMO Trust 40 Rowes Wharf Boston, MA 02110 DOB: 05/27/1977 | Assistant Treasurer | Since March 2007. | Fund Administrator, Grantham, Mayo, Van Otterloo & Co. LLC (September 2004 – present); Tax Analyst, Bain & Company, Inc (June 2003 – September 2004); Senior Tax Associate, PricewaterhouseCoopers LLP (2001 – 2003). | ||||||||||||
| Mahmoodur Rahman c/o GMO Trust 40 Rowes Wharf Boston, MA 02110 DOB: 11/30/1967 | Assistant Treasurer | Since September 2007. | Fund Administrator, Grantham, Mayo, Van Otterloo & Co. (April 2007 – present); Vice President and Senior Tax Manager, Massachusetts Financial Services Company (January 2000 – April 2007). | ||||||||||||
5 Officers are elected to hold such office until their successor is elected and qualified to carry out the duties and responsibilities of their office, or until he or she resigns or is removed from office.
29
Principal Officers — (Continued)
| Name, Address, and DOB | Position(s) Held with Trust | Term of Office5 and Length of Time Served | Principal Occupation(s) During Past Five Years | ||||||||||||
| Michael E. Gillespie c/o GMO Trust 40 Rowes Wharf Boston, MA 02110 DOB: 02/18/1958 | Chief Compliance Officer | Since March 2005. | Vice President of Compliance (June 2004 – February 2005) and Director of Domestic Compliance (March 2002 – June 2004), Fidelity Investments; Vice President and Senior Counsel, State Street Bank and Trust Company (May 1998 – March 2002). | ||||||||||||
| Jason B. Harrison c/o GMO Trust 40 Rowes Wharf Boston, MA 02110 DOB: 01/29/1977 | Vice President and Clerk | Vice President since November 2006; Clerk since March 2006. | Legal Counsel, Grantham, Mayo, Van Otterloo & Co. LLC (since February 2006) and Attorney, Ropes & Gray LLP (September 2002 – February 2006). | ||||||||||||
| David L. Bohan c/o GMO Trust 40 Rowes Wharf Boston, MA 02110 DOB: 06/21/1964 | Vice President and Assistant Clerk | Vice President since March 2005; Assistant Clerk since March 2006. | Legal Counsel, Grantham, Mayo, Van Otterloo & Co. LLC (September 2003 – present); Attorney, Goodwin Procter LLP (September 1996 – September 2003). | ||||||||||||
| Gregory L. Pottle c/o GMO Trust 40 Rowes Wharf Boston, MA 02110 DOB: 07/09/1971 | Vice President and Assistant Clerk | Since November 2006. | Legal Counsel, Grantham, Mayo, Van Otterloo & Co. LLC. | ||||||||||||
| Anne K. Trinque c/o GMO Trust 40 Rowes Wharf Boston, MA 02110 DOB: 04/15/1978 | Vice President and Assistant Clerk | Since September 2007. | Legal Counsel, Grantham, Mayo, Van Otterloo & Co. LLC (since January 2007); Attorney, Goodwin Procter LLP (September 2003 – January 2007). | ||||||||||||
| Cheryl Wakeham c/o GMO Trust 40 Rowes Wharf Boston, MA 02110 DOB: 10/29/1958 | Anti-Money Laundering Officer | Since December 2004. | Manager, Client Service Administration, Grantham, Mayo, Van Otterloo & Co. LLC. | ||||||||||||
5 Officers are elected to hold such office until their successor is elected and qualified to carry out the duties and responsibilities of their office, or until he or she resigns or is removed from office.
30
GMO Inflation Indexed Plus Bond Fund
(A Series of GMO Trust)
Annual Report
February 29, 2008
For a free copy of the Fund's proxy voting guidelines, shareholders may call 1-617-346-7646 (collect), visit our website at www.gmo.com, or visit the Securities and Exchange Commission's website at www.sec.gov. Information regarding how the Fund voted proxies relating to portfolio securities during the most recent 12-month period ended June 30 is available on our website at www.gmo.com, or on the Securities and Exchange Commission's website at www.sec.gov.
The Fund files its complete schedule of portfolio holdings with the Securities and Exchange Commission for the first and third quarter of each fiscal year on Form N-Q, which is available on the Commission's website at www.sec.gov. The Fund's Form N-Q may be reviewed and copied at the Commission's Public Reference Room in Washington, D.C. Information on the operation of the Public Reference Room may be obtained by calling 1-800-SEC-0330. The Fund has a policy with respect to disclosure of portfolio holdings under which it may also make available on GMO's website (www.gmo.com) a complete schedule of portfolio holdings.
This report is prepared for the general information of shareholders. It is authorized for distribution to prospective investors only when preceded or accompanied by a prospectus for the GMO Trust.
GMO Inflation Indexed Plus Bond Fund
(A Series of GMO Trust)
Portfolio Management
Day-to-day management of the Fund's portfolio is the responsibility of the Fixed Income Division at Grantham, Mayo, Van Otterloo & Co. LLC.
Management Discussion and Analysis of Fund Performance
The Class III shares of the GMO Inflation Indexed Plus Bond Fund returned +4.0% for the fiscal year ended February 29, 2008, compared to +14.9% for the Lehman Brothers U.S. Treasury Inflation Notes Index. The Fund's exposure to various issues is achieved directly and indirectly through its investment in certain underlying GMO mutual funds, primarily in the GMO Emerging Country Debt Fund, the GMO World Opportunity Overlay Fund, and the GMO Short-Duration Collateral Fund.
The Fund underperformed the benchmark during the fiscal year by 10.9%. Cash management was the primary contributor to negative performance for the fiscal year, followed by interest-rate strategy, currency selection, and emerging debt exposure losses.
More than 50% of the fiscal year's underperformance was due to mark-to-market losses in the cash collateral pools of two funds in which the Fund invests a substantial portion of its total assets: the GMO Short Duration Collateral Fund (SDCF) and the GMO World Opportunity Overlay Fund (WOOF). SDCF and WOOF primarily invest cash in high quality U.S. and foreign floating-rate fixed income securities, mainly asset-backed securities, in order to earn a LIBOR-type return. The cash positions in SDCF and WOOF collateralize derivatives positions that seek to deliver the return of the benchmark as well as create active exposures in global interest-rate and currency markets.
With the extreme price volatility of AAA-credit quality asset-backed securities during the year, the cash pools in SDCF and WOOF underperformed LIBOR by nearly 700 basis points, directly contributing to the Inflation Indexed Plus Bond Fund's underperformance given its 70% exposure to these two funds.
Further strategy underperformance was attributable to interest-rate and currency strategies. For much of the fiscal year, the Fund was overweight Australian, Euro-area, Swedish, Swiss, and Canadian interest-rate markets relative to Japanese, U.K., and U.S. markets. However, the U.S., U.K., and Japanese markets were among the top performers, detracting from performance. Similar results came out of two other cross-sectional models implemented in swaps. Further, the slope and volatility strategies also underperformed, leaving only the U.S. Eurodollar directional strategy and opportunistic trading with positive contributions for the year.
In currencies, the largest negative contributors were underweight positions in euros, yen, and Canadian dollars, as well as an overweight position in Australian dollars. Partially offsetting losses were gains from overweight positions in the Swiss franc, Norwegian krone, and sterling. A major risk aversion episode during the fiscal year, prompted by the turmoil in structured credit markets, persisted for much of the third and fourth quarters. Our choice of a defensive currency during this episode, the Swiss franc, was incorrect, as risk aversion manifested itself in a swift rise in the yen, in which the Fund remained underweight. In addition, a drastic change in the relative volatilities of the currencies in August resulted in a shifting of risk positions into less advantageous, and ultimately unprofitable, intra-European trades.
A relatively minor contribution to negative performance came from the small exposure to emerging debt, where spread widening on the asset class contributed negatively, as did negative contributions from country selection.
The views expressed herein are exclusively those of Grantham, Mayo, Van Otterloo & Co. LLC Management as of the date of this report and are subject to change. GMO disclaims any responsibility to update such views. They are not meant as investment advice.
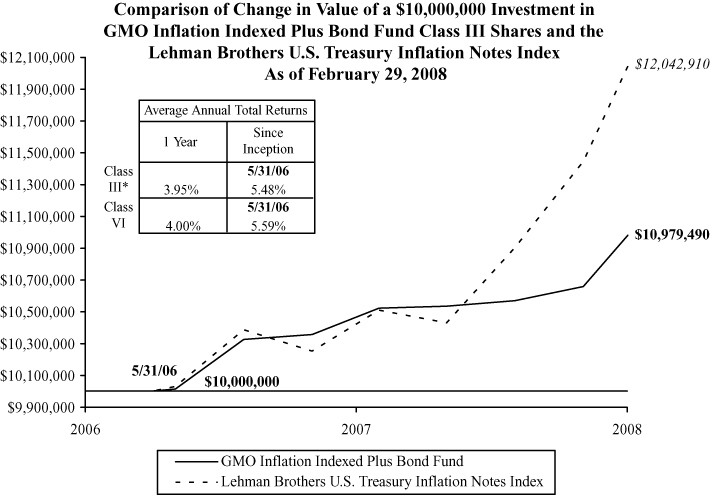
Performance data quoted represents past performance and is not indicative of future results. The investment return and principal value of an investment will fluctuate so that an investor's shares, when redeemed, may be worth more or less than their original cost. Current performance data may be lower or higher than the performance data provided herein. To obtain performance information to the most recent month-end, visit www.gmo.com. Performance shown is net of all fees after reimbursement from the Manager. Returns would have been lower had certain expenses not been reimbursed during the periods shown and do not include the effect of taxes on distributions and redemptions. All information is unaudited. Performance for Class VI shares will vary due to different fees.
* Class III performance information represents Class VI performance from May 31, 2006 to June 29, 2006 and Class III performance thereafter.
GMO Inflation Indexed Plus Bond Fund
(A Series of GMO Trust)
Investments Concentration Summary
February 29, 2008 (Unaudited)
| Asset Class Summary* | % of Total Net Assets | ||||||
| Debt Obligations | 91.0 | % | |||||
| Short-Term Investments | 8.4 | ||||||
| Swaps | 1.8 | ||||||
| Options Purchased | 0.3 | ||||||
| Loan Participations | 0.2 | ||||||
| Loan Assignments | 0.1 | ||||||
| Rights and Warrants | 0.0 | ||||||
| Promissory Notes | 0.0 | ||||||
| Written Options | (0.1 | ) | |||||
| Futures | (0.2 | ) | |||||
| Reverse Repurchase Agreements | (0.6 | ) | |||||
| Forward Currency Contracts | (0.8 | ) | |||||
| Other | (0.1 | ) | |||||
| 100.0 | % | ||||||
| Country / Region Summary** | % of Investments | ||||||
| United States | 82.9 | % | |||||
| Japan | 7.3 | ||||||
| Australia | 4.8 | ||||||
| Canada | 3.5 | ||||||
| Euro Region*** | 3.1 | ||||||
| Switzerland | 2.6 | ||||||
| Emerging | 2.6 | ||||||
| United Kingdom | (6.8 | ) | |||||
| 100.0 | % | ||||||
* The table above incorporates aggregate indirect asset class exposure associated with investments in other funds of GMO Trust ("underlying funds").
** The table above incorporates aggregate indirect country exposure associated with investments in the underlying funds. The table excludes short-term investments. The table includes exposure through the use of derivative contracts.
*** The "Euro Region" is comprised of Austria, Belgium, Finland, France, Germany, Greece, Ireland, Italy, Netherlands, Portugal and Spain.
1
GMO Inflation Indexed Plus Bond Fund
(A Series of GMO Trust)
Schedule of Investments
(showing percentage of total net assets)
February 29, 2008
| Par Value ($) / Shares | Description | Value ($) | |||||||||||||
| DEBT OBLIGATIONS — 23.7% | |||||||||||||||
| Corporate Debt — 6.8% | |||||||||||||||
| 13,850,000 | JP Morgan & Co. Series MTN, Variable Rate, CPI + 4.00%, 5.89%, due 02/15/12 | 15,574,325 | |||||||||||||
| U.S. Government — 16.9% | |||||||||||||||
| 9,739,725 | U.S. Treasury Inflation Indexed Bond, 3.63%, due 04/15/28 (a) | 12,838,175 | |||||||||||||
| 8,020,800 | U.S. Treasury Inflation Indexed Bond, 1.75%, due 01/15/28 (a) | 8,057,144 | |||||||||||||
| 16,500,150 | U.S. Treasury Inflation Indexed Note, 1.63%, due 01/15/15 (a) (b) | 17,487,581 | |||||||||||||
| Total U.S. Government | 38,382,900 | ||||||||||||||
| TOTAL DEBT OBLIGATIONS (COST $52,407,138) | 53,957,225 | ||||||||||||||
| MUTUAL FUNDS — 73.0% | |||||||||||||||
| Affiliated Issuers — 73.0% | |||||||||||||||
| 671,595 | GMO Emerging Country Debt Fund, Class III | 6,756,250 | |||||||||||||
| 4,784,046 | GMO Short-Duration Collateral Fund | 114,960,626 | |||||||||||||
| 28,918 | GMO Special Purpose Holding Fund (c) (d) | 36,437 | |||||||||||||
| 1,739,719 | GMO World Opportunity Overlay Fund | 44,675,992 | |||||||||||||
| TOTAL MUTUAL FUNDS (COST $168,119,760) | 166,429,305 | ||||||||||||||
| SHORT-TERM INVESTMENTS — 2.6% | |||||||||||||||
| Money Market Funds — 2.6% | |||||||||||||||
| 5,821,180 | State Street Institutional Liquid Reserves Fund-Institutional Class | 5,821,180 | |||||||||||||
| TOTAL SHORT-TERM INVESTMENTS (COST $5,821,180) | 5,821,180 | ||||||||||||||
| TOTAL INVESTMENTS — 99.3% (Cost $226,348,078) | 226,207,710 | ||||||||||||||
| Other Assets and Liabilities (net) — 0.7% | 1,644,087 | ||||||||||||||
| TOTAL NET ASSETS — 100.0% | $ | 227,851,797 | |||||||||||||
See accompanying notes to the financial statements.
2
GMO Inflation Indexed Plus Bond Fund
(A Series of GMO Trust)
Schedule of Investments — (Continued)
February 29, 2008
A summary of outstanding financial instruments at February 29, 2008 is as follows:
Forward Currency Contracts
| Settlement Date | Deliver/ Receive | Units of Currency | Value | Net Unrealized Appreciation (Depreciation) | |||||||||||||||
| Buys | |||||||||||||||||||
| 3/04/08 | AUD | 75,200,000 | $ | 70,052,560 | $ | 3,578,728 | |||||||||||||
| 3/04/08 | AUD | 600,000 | 558,930 | 2,457 | |||||||||||||||
| 5/06/08 | AUD | 3,000,000 | 2,772,176 | (47,824 | ) | ||||||||||||||
| 5/06/08 | AUD | 3,000,000 | 2,772,176 | (13,384 | ) | ||||||||||||||
| 3/11/08 | CAD | 72,500,000 | 73,649,528 | 2,042,710 | |||||||||||||||
| 4/01/08 | CHF | 295,200,000 | 283,497,354 | 11,824,245 | |||||||||||||||
| 4/15/08 | EUR | 100,200,000 | 151,919,260 | 7,130,260 | |||||||||||||||
| 4/15/08 | EUR | 300,000 | 454,848 | 15,372 | |||||||||||||||
| 3/25/08 | GBP | 63,000,000 | 125,012,160 | 1,040,557 | |||||||||||||||
| 3/25/08 | GBP | 1,800,000 | 3,571,776 | 37,964 | |||||||||||||||
| 3/25/08 | GBP | 1,400,000 | 2,778,048 | 504 | |||||||||||||||
| 4/08/08 | NZD | 33,500,000 | 26,642,658 | 576,137 | |||||||||||||||
| 4/08/08 | NZD | 2,700,000 | 2,147,319 | (30,933 | ) | ||||||||||||||
| 4/08/08 | NZD | 3,300,000 | 2,624,501 | (46,453 | ) | ||||||||||||||
| $ | 748,453,294 | $ | 26,110,340 | ||||||||||||||||
| Sales | |||||||||||||||||||
| 3/04/08 | AUD | 72,800,000 | $ | 67,816,840 | $ | (4,300,296 | ) | ||||||||||||
| 3/04/08 | AUD | 3,000,000 | 2,794,650 | 48,270 | |||||||||||||||
| 3/11/08 | CAD | 76,400,000 | 77,611,364 | (343,717 | ) | ||||||||||||||
| 4/01/08 | CHF | 191,200,000 | 183,620,237 | (8,763,553 | ) | ||||||||||||||
| 4/01/08 | CHF | 100,000,000 | 96,035,689 | (5,524,846 | ) | ||||||||||||||
| 4/15/08 | EUR | 50,000,000 | 75,808,014 | (3,562,514 | ) | ||||||||||||||
| 4/15/08 | EUR | 45,000,000 | 68,227,213 | (2,761,055 | ) | ||||||||||||||
| 3/25/08 | GBP | 64,600,000 | 128,187,072 | (1,196,392 | ) | ||||||||||||||
| 4/22/08 | JPY | 197,500,000 | 1,906,639 | (70,796 | ) | ||||||||||||||
| 4/22/08 | JPY | 60,000,000 | 579,232 | (20,396 | ) | ||||||||||||||
| 4/08/08 | NZD | 33,000,000 | 26,245,007 | (435,047 | ) | ||||||||||||||
| $ | 728,831,957 | $ | (26,930,342 | ) | |||||||||||||||
See accompanying notes to the financial statements.
3
GMO Inflation Indexed Plus Bond Fund
(A Series of GMO Trust)
Schedule of Investments — (Continued)
February 29, 2008
Forward Cross Currency Contracts
| Settlement Date | Deliver/Units of Currency | Receive/In Exchange For | Net Unrealized Appreciation (Depreciation) | ||||||||||||
| 3/18/08 | EUR | 103,800,000 | SEK | 975,692,880 | $ | 626,433 | |||||||||
| 3/18/08 | SEK | 957,186,620 | EUR | 101,300,000 | (1,420,650 | ) | |||||||||
| 4/29/08 | EUR | 6,400,000 | NOK | 50,476,800 | (58,740 | ) | |||||||||
| 4/29/08 | NOK | 14,990,050 | EUR | 1,900,000 | 16,531 | ||||||||||
| $ | (836,426 | ) | |||||||||||||
Futures Contracts
| Number of Contracts | Type | Expiration Date | Contract Value | Net Unrealized Appreciation (Depreciation) | |||||||||||||||
| Buys | |||||||||||||||||||
| 10 | Australian Government Bond 3 Yr. | March 2008 | $ | 915,819 | $ | 4,529 | |||||||||||||
| 88 | Canadian Government Bond 10 Yr. | June 2008 | 10,541,224 | 212,460 | |||||||||||||||
| 23 | Euro BOBL | March 2008 | 3,887,883 | 15,385 | |||||||||||||||
| 44 | Euro Bund | March 2008 | 7,819,444 | 41,872 | |||||||||||||||
| 15 | Japanese Government Bond 10 Yr. (TSE) | March 2008 | 19,992,781 | 79,223 | |||||||||||||||
| $ | 43,157,151 | $ | 353,469 | ||||||||||||||||
| Sales | |||||||||||||||||||
| 427 | Australian Government Bond 10 Yr. | March 2008 | $ | 39,074,859 | $ | (28,756 | ) | ||||||||||||
| 5 | Euro BOBL | March 2008 | 845,192 | (3,879 | ) | ||||||||||||||
| 8 | Euro Bund | March 2008 | 1,421,717 | (12,037 | ) | ||||||||||||||
| 9 | U.S. Long Bond (CBT) | June 2008 | 1,067,625 | (24,208 | ) | ||||||||||||||
| 60 | U.S. Treasury Note 10 Yr. | June 2008 | 7,036,875 | (125,762 | ) | ||||||||||||||
| 102 | U.S. Treasury Note 2 Yr. (CBT) | June 2008 | 21,922,031 | (134,107 | ) | ||||||||||||||
| 12 | U.S. Treasury Note 5 Yr. (CBT) | June 2008 | 1,371,000 | (18,496 | ) | ||||||||||||||
| 120 | UK Gilt Long Bond | June 2008 | 26,302,978 | (449,631 | ) | ||||||||||||||
| $ | 99,042,277 | $ | (796,876 | ) | |||||||||||||||
See accompanying notes to the financial statements.
4
GMO Inflation Indexed Plus Bond Fund
(A Series of GMO Trust)
Schedule of Investments — (Continued)
February 29, 2008
Reverse Repurchase Agreements
| Average balance outstanding | $ | (160,880,217 | ) | ||||
| Average interest rate | 1.19 | % | |||||
| Maximum balance outstanding | $ | (186,334,000 | ) | ||||
| Average shares outstanding | 147,274,257 | ||||||
| Average balance per share outstanding | $ | (1.09 | ) | ||||
| Days outstanding | 92 | ||||||
Average balance outstanding was calculated based on daily balances outstanding during the period that the Fund had entered into reverse repurchase agreements. There were no reverse repurchase agreements outstanding at the end of the period.
Swap Agreements
Interest Rate Swaps
| Notional Amount | Expiration Date | Counterparty | Receive (Pay) | Fixed Rate | Variable Rate | Market Value | |||||||||||||||||||||||||
| 9,300,000 | CHF | 3/19/2013 | JP Morgan | Receive | 3.00 | % | 6 month | ||||||||||||||||||||||||
| Chase Bank | CHF LIBOR | $ | 61,267 | ||||||||||||||||||||||||||||
| 54,900,000 | AUD | 3/19/2018 | JP Morgan Chase Bank | Receive | 7.07 | % | 6 month AUD BBSW | (693,958 | ) | ||||||||||||||||||||||
| Premiums to (Pay) Receive | $ | 31,770 | $ | (632,691 | ) | ||||||||||||||||||||||||||
Total Return Swaps
| Notional Amount | Expiration Date | Counterparty | Pay | Receive | Market Value | ||||||||||||||||||||||
| 160,000,000 | USD | 5/14/2008 | Barclays Bank PLC | 2.50% to | Barclays TIPS | ||||||||||||||||||||||
| maturity | Index Total Return | $ | 5,022,524 | ||||||||||||||||||||||||
| Premiums to (Pay) Receive | $ | — | $ | 5,022,524 | |||||||||||||||||||||||
As of February 29, 2008, for the futures and/or swap contracts held, the Fund had sufficient cash and/or securities to cover any commitments or margin requirements of the relevant broker or exchange.
See accompanying notes to the financial statements.
5
GMO Inflation Indexed Plus Bond Fund
(A Series of GMO Trust)
Schedule of Investments — (Continued)
February 29, 2008
Notes to Schedule of Investments:
BBSW - Bank Bill Swap Reference Rate
CPI - Consumer Price Index
LIBOR - London Interbank Offered Rate
MTN - Medium Term Note
TIPS - Treasury Inflation Protected Securities
Variable rate - The rates shown on variable rate notes are the current interest rates at February 29, 2008, which are subject to change based on the terms of the security.
(a) Indexed security in which price and/or coupon is linked to the prices of a specific instrument or financial statistic (Note 2).
(b) All or a portion of this security has been segregated to cover margin requirements on open financial futures contracts and/or collateral on open swap contracts (Note 2).
(c) Security valued at fair value using methods determined in good faith by or at the direction of the Trustees of GMO Trust (Note 2).
(d) Underlying investment represents interests in defaulted securities.
Currency Abbreviations:
AUD - Australian Dollar
CAD - Canadian Dollar
CHF - Swiss Franc
EUR - Euro
GBP - British Pound
JPY - Japanese Yen
NOK - Norwegian Krone
NZD - New Zealand Dollar
SEK - Swedish Krona
USD - United States Dollar
See accompanying notes to the financial statements.
6
GMO Inflation Indexed Plus Bond Fund
(A Series of GMO Trust)
Statement of Assets and Liabilities — February 29, 2008
| Assets: | |||||||
| Investments in unaffiliated issuers, at value (cost $58,228,318) (Note 2) | $ | 59,778,405 | |||||
| Investments in affiliated issuers, at value (cost $168,119,760) (Notes 2 and 8) | 166,429,305 | ||||||
| Receivable for Fund shares sold | 2,748 | ||||||
| Interest receivable | 230,704 | ||||||
| Unrealized appreciation on open forward currency contracts (Note 2) | 26,940,168 | ||||||
| Receivable for open swap contracts (Note 2) | 5,083,791 | ||||||
| Receivable for closed swap contracts (Note 2) | 106,666 | ||||||
| Receivable for expenses reimbursed by Manager (Note 3) | 78,212 | ||||||
| Total assets | 258,649,999 | ||||||
| Liabilities: | |||||||
| Payable to affiliate for (Note 3): | |||||||
| Management fee | 222,432 | ||||||
| Shareholder service fee | 62,795 | ||||||
| Trustees and Chief Compliance Officer of GMO Trust fees | 1,016 | ||||||
| Unrealized depreciation on open forward currency contracts (Note 2) | 28,596,596 | ||||||
| Payable for open swap contracts (Note 2) | 693,958 | ||||||
| Payable for variation margin on open futures contracts (Note 2) | 885,409 | ||||||
| Accrued expenses | 335,996 | ||||||
| Total liabilities | 30,798,202 | ||||||
| Net assets | $ | 227,851,797 | |||||
| Net assets consist of: | |||||||
| Paid-in capital | $ | 505,360,653 | |||||
| Distributions in excess of net investment income | (126,305,693 | ) | |||||
| Accumulated net realized loss | (153,384,563 | ) | |||||
| Net unrealized appreciation | 2,181,400 | ||||||
| $ | 227,851,797 | ||||||
| Net assets attributable to: | |||||||
| Class III shares | $ | 137,492,158 | |||||
| Class VI shares | $ | 90,359,639 | |||||
| Shares outstanding: | |||||||
| Class III | 5,846,005 | ||||||
| Class VI | 3,843,181 | ||||||
| Net asset value per share: | |||||||
| Class III | $ | 23.52 | |||||
| Class VI | $ | 23.51 | |||||
See accompanying notes to the financial statements.
7
GMO Inflation Indexed Plus Bond Fund
(A Series of GMO Trust)
Statement of Operations — Year Ended February 29, 2008
| Investment Income: | |||||||
| Dividends from affiliated issuers (Note 8) | $ | 141,857,199 | |||||
| Interest | 19,488,717 | ||||||
| Total investment income | 161,345,916 | ||||||
| Expenses: | |||||||
| Management fee (Note 3) | 7,029,418 | ||||||
| Shareholder service fee – Class III (Note 3) | 362,310 | ||||||
| Shareholder service fee – Class IV (Note 3) | 166,315 | ||||||
| Shareholder service fee – Class VI (Note 3) | 1,322,152 | ||||||
| Custodian, fund accounting agent and transfer agent fees | 923,853 | ||||||
| Audit and tax fees | 84,038 | ||||||
| Legal fees | 82,912 | ||||||
| Trustees fees and related expenses (Note 3) | 23,144 | ||||||
| Registration fees | 23,366 | ||||||
| Interest expense (Note 2) | 1,920,718 | ||||||
| Miscellaneous | 19,431 | ||||||
| Total expenses | 11,957,657 | ||||||
| Fees and expenses reimbursed by Manager (Note 3) | (1,103,298 | ) | |||||
| Expense reductions (Note 2) | (310 | ) | |||||
| Indirectly incurred fees waived or borne by Manager (Note 3) | (359,244 | ) | |||||
| Shareholder service fee waived (Note 3) | (127,822 | ) | |||||
| Net expenses | 10,366,983 | ||||||
| Net investment income (loss) | 150,978,933 | ||||||
See accompanying notes to the financial statements.
8
GMO Inflation Indexed Plus Bond Fund
(A Series of GMO Trust)
Statement of Operations — Year Ended February 29, 2008 — (Continued)
| Realized and unrealized gain (loss): | |||||||
| Net realized gain (loss) on: | |||||||
| Investments in unaffiliated issuers | $ | 7,647,924 | |||||
| Investments in affiliated issuers | (186,629,546 | ) | |||||
| Realized gains distributions from affiliated issuers (Note 8) | 3,932,304 | ||||||
| Closed futures contracts | (111,142,215 | ) | |||||
| Closed swap contracts | 340,875,631 | ||||||
| Foreign currency, forward contracts and foreign currency related transactions | (65,025,759 | ) | |||||
| Net realized gain (loss) | (10,341,661 | ) | |||||
| Change in net unrealized appreciation (depreciation) on: | |||||||
| Investments in unaffiliated issuers | (2,453,003 | ) | |||||
| Investments in affiliated issuers | (647,015 | ) | |||||
| Open futures contracts | 8,442,738 | ||||||
| Open swap contracts | (28,598,488 | ) | |||||
| Foreign currency, forward contracts and foreign currency related transactions | (7,209,864 | ) | |||||
| Net unrealized gain (loss) | (30,465,632 | ) | |||||
| Net realized and unrealized gain (loss) | (40,807,293 | ) | |||||
| Net increase (decrease) in net assets resulting from operations | $ | 110,171,640 | |||||
See accompanying notes to the financial statements.
9
GMO Inflation Indexed Plus Bond Fund
(A Series of GMO Trust)
Statement of Changes in Net Assets
| Year Ended February 29, 2008 | Period from May 31, 2006 (commencement of operations) through February 28, 2007 | ||||||||||
| Increase (decrease) in net assets: | |||||||||||
| Operations: | |||||||||||
| Net investment income (loss) | $ | 150,978,933 | $ | 54,489,316 | |||||||
| Net realized gain (loss) | (10,341,661 | ) | 942,418 | ||||||||
| Change in net unrealized appreciation (depreciation) | (30,465,632 | ) | 32,647,032 | ||||||||
| Net increase (decrease) in net assets from operations | 110,171,640 | 88,078,766 | |||||||||
| Distributions to shareholders from:* | |||||||||||
| Net investment income | |||||||||||
| Class III | (26,975,972 | ) | (9,719,161 | ) | |||||||
| Class IV | (14,948,171 | ) | (5,271,677 | ) | |||||||
| Class VI | (347,623,757 | ) | (58,674,899 | ) | |||||||
| Total distributions from net investment income | (389,547,900 | ) | (73,665,737 | ) | |||||||
| Net realized gains | |||||||||||
| Class III | (643,125 | ) | (511,535 | ) | |||||||
| Class IV | (654,425 | ) | (275,565 | ) | |||||||
| Class VI | (7,445,282 | ) | (3,015,693 | ) | |||||||
| Total distributions from net realized gains | (8,742,832 | ) | (3,802,793 | ) | |||||||
| (398,290,732 | ) | (77,468,530 | ) | ||||||||
| Net share transactions (Note 7): | |||||||||||
| Class III | (103,779,537 | ) | 258,555,425 | ||||||||
| Class IV | (83,542,832 | ) | 94,165,574 | ||||||||
| Class VI | (1,526,536,264 | ) | 1,866,498,287 | ||||||||
| Increase (decrease) in net assets resulting from net share transactions | (1,713,858,633 | ) | 2,219,219,286 | ||||||||
| Total increase (decrease) in net assets | (2,001,977,725 | ) | 2,229,829,522 | ||||||||
| Net assets: | |||||||||||
| Beginning of period | 2,229,829,522 | — | |||||||||
| End of period (including distributions in excess of net investment income of $126,305,693 and $2,070,467, respectively) | $ | 227,851,797 | $ | 2,229,829,522 | |||||||
* The Fund distributed $96,096,773 from ordinary income in January and February 2008. The final tax classification of these distributions may change as it will depend on the Fund's taxable income for the full tax year ended December 31, 2008.
See accompanying notes to the financial statements.
10
GMO Inflation Indexed Plus Bond Fund
(A Series of GMO Trust)
Financial Highlights
(For a Class III share outstanding throughout each period)
| Year Ended February 29, 2008 | Period from June 29, 2006 (commencement of operations) through February 28, 2007 | ||||||||||
| Net asset value, beginning of period | $ | 25.47 | $ | 24.96 | |||||||
| Income (loss) from investment operations: | |||||||||||
| Net investment income (loss)(a)† | 1.13 | 0.75 | |||||||||
| Net realized and unrealized gain (loss) | (0.21 | ) | 0.68 | ||||||||
| Total from investment operations | 0.92 | 1.43 | |||||||||
| Less distributions to shareholders: | |||||||||||
| From net investment income | (2.81 | ) | (0.87 | ) | |||||||
| From net realized gains | (0.06 | ) | (0.05 | ) | |||||||
| Total distributions | (2.87 | ) | (0.92 | ) | |||||||
| Net asset value, end of period | $ | 23.52 | $ | 25.47 | |||||||
| Total Return(b) | 3.95 | % | 5.79 | %** | |||||||
| Ratios/Supplemental Data: | |||||||||||
| Net assets, end of period (000's) | $ | 137,492 | $ | 260,205 | |||||||
| Net operating expenses to average daily net assets(c) | 0.37 | %(d) | 0.39 | %* | |||||||
| Interest expense to average daily net assets | 0.07 | % | — | ||||||||
| Total net expenses to average daily net assets | 0.44 | %(d) | 0.39 | %* | |||||||
| Net investment income to average daily net assets(a) | 4.51 | % | 4.37 | %* | |||||||
| Portfolio turnover rate | 131 | % | 37 | %†† | |||||||
| Fees and expenses reimbursed and/or waived by the Manager to average daily net assets: | 0.06 | % | 0.06 | %* | |||||||
(a) Net investment income is affected by the timing of the declaration of dividends by the underlying funds in which the Fund invests.
(b) The total returns would have been lower had certain expenses not been reimbursed and/or waived during the periods shown and assumes the effect of reinvested distributions.
(c) Net expenses exclude expenses incurred indirectly through investment in underlying funds (See Note 3).
(d) The net expense ratio does not include the effect of expense reductions.
† Calculated using average shares outstanding throughout the period.
* Annualized.
** Not annualized.
†† Calculation represents portfolio turnover of the Fund for the period from May 31, 2006 (commencement of operations) through February 28, 2007.
See accompanying notes to the financial statements.
11
GMO Inflation Indexed Plus Bond Fund
(A Series of GMO Trust)
Financial Highlights
(For a Class IV share outstanding throughout each period)
| Period from March 1, 2007 through February 13, 2008 | Period from July 18, 2006 (commencement of operations) through February 28, 2007 | ||||||||||
| Net asset value, beginning of period | $ | 25.48 | $ | 25.07 | |||||||
| Income (loss) from investment operations: | |||||||||||
| Net investment income (loss)(a)† | 1.22 | 0.65 | |||||||||
| Net realized and unrealized gain (loss) | (0.76 | ) | 0.69 | ||||||||
| Total from investment operations | 0.46 | 1.34 | |||||||||
| Less distributions to shareholders: | |||||||||||
| From net investment income | (2.81 | ) | (0.88 | ) | |||||||
| From net realized gains | (0.06 | ) | (0.05 | ) | |||||||
| Total distributions | (2.87 | ) | (0.93 | ) | |||||||
| Net asset value, end of period | $ | 23.07 | (e) | $ | 25.48 | ||||||
| Total Return(b) | 1.94 | %** | 5.39 | %** | |||||||
| Ratios/Supplemental Data: | |||||||||||
| Net assets, end of period (000's) | $ | — | $ | 94,783 | |||||||
| Net operating expenses to average daily net assets(c) | 0.33 | %*(d) | 0.33 | %* | |||||||
| Interest expense to average daily net assets | 0.07 | %* | — | ||||||||
| Total net expenses to average daily net assets | 0.40 | %*(d) | 0.33 | %* | |||||||
| Net investment income to average daily net assets(a) | 5.05 | %* | 4.10 | %* | |||||||
| Portfolio turnover rate | 131 | %††† | 37 | %†† | |||||||
| Fees and expenses reimbursed and/or waived by the Manager to average daily net assets: | 0.06 | %* | 0.06 | %* | |||||||
(a) Net investment income is affected by the timing of the declaration of dividends by the underlying funds in which the Fund invests.
(b) The total returns would have been lower had certain expenses not been reimbursed and/or waived during the periods shown and assumes the effect of reinvested distributions.
(c) Net expenses exclude expenses incurred indirectly through investment in underlying funds (See Note 3).
(d) The net expense ratio does not include the effect of expense reductions.
(e) Represents the ending net asset value per share upon the liquidation of the class.
† Calculated using average shares outstanding throughout the period.
* Annualized.
** Not annualized.
†† Calculation represents portfolio turnover of the Fund for the period from May 31, 2006 (commencement of operations) through February 28, 2007.
††† Calculation represents portfolio turnover of the Fund for the year ended February 29, 2008.
See accompanying notes to the financial statements.
12
GMO Inflation Indexed Plus Bond Fund
(A Series of GMO Trust)
Financial Highlights
(For a Class VI share outstanding throughout each period)
| Year Ended February 29, 2008 | Period from May 31, 2006 (commencement of operations) through February 28, 2007 | ||||||||||
| Net asset value, beginning of period | $ | 25.48 | $ | 25.00 | |||||||
| Income (loss) from investment operations: | |||||||||||
| Net investment income (loss)(a)† | 1.38 | 0.83 | |||||||||
| Net realized and unrealized gain (loss) | (0.45 | ) | 0.60 | ||||||||
| Total from investment operations | 0.93 | 1.43 | |||||||||
| Less distributions to shareholders: | |||||||||||
| From net investment income | (2.84 | ) | (0.90 | ) | |||||||
| From net realized gains | (0.06 | ) | (0.05 | ) | |||||||
| Total distributions | (2.90 | ) | (0.95 | ) | |||||||
| Net asset value, end of period | $ | 23.51 | $ | 25.48 | |||||||
| Total Return(b) | 4.00 | % | 5.75 | %** | |||||||
| Ratios/Supplemental Data: | |||||||||||
| Net assets, end of period (000's) | $ | 90,360 | $ | 1,874,841 | |||||||
| Net operating expenses to average daily net assets(c) | 0.29 | %(d) | 0.29 | %* | |||||||
| Interest expense to average daily net assets | 0.07 | % | — | ||||||||
| Total net expenses to average daily net assets | 0.36 | %(d) | 0.29 | %* | |||||||
| Net investment income to average daily net assets(a) | 5.48 | % | 4.33 | %* | |||||||
| Portfolio turnover rate | 131 | % | 37 | %** | |||||||
| Fees and expenses reimbursed and/or waived by the Manager to average daily net assets: | 0.06 | % | 0.06 | %* | |||||||
(a) Net investment income is affected by the timing of the declaration of dividends by the underlying funds in which the Fund invests.
(b) The total returns would have been lower had certain expenses not been reimbursed and/or waived during the periods shown and assumes the effect of reinvested distributions.
(c) Net expenses exclude expenses incurred indirectly through investment in underlying funds (See Note 3).
(d) The net expense ratio does not include the effect of expense reductions.
† Calculated using average shares outstanding throughout the period.
* Annualized.
** Not annualized.
See accompanying notes to the financial statements.
13
GMO Inflation Indexed Plus Bond Fund
(A Series of GMO Trust)
Notes to Financial Statements
February 29, 2008
1. Organization
GMO Inflation Indexed Plus Bond Fund (the "Fund") is a series of GMO Trust (the "Trust"). The Fund is registered under the Investment Company Act of 1940, as amended, as an open-end, non-diversified management investment company. The Fund is advised and managed by Grantham, Mayo, Van Otterloo & Co. LLC (the "Manager" or "GMO"). The Trust was established as a Massachusetts business trust under the laws of the Commonwealth of Massachusetts on June 24, 1985. The Declaration of Trust permits the Trustees of the Trust ("Trustees") to create an unlimited number of series of shares ("Funds") and to subdivide Funds into classes.
The Fund seeks total return in excess of that of the Lehman Brothers U.S. Treasury Inflation Notes Index. The Fund primarily makes investments that are indexed or otherwise "linked" to general measures of inflation in the country of issue. The Fund seeks additional returns by investing in global interest rate, currency, and emerging country debt markets. The Fund may invest a substantial portion of its assets in shares of GMO Short-Duration Collateral Fund; in inflation indexed bonds issued by the U.S. and foreign governments and their agencies or instrumentalities (including securities neither guaranteed nor insured by the U.S. government), including Inflation-Protected Securities issued by the U.S. Treasury (TIPS), and inflation indexed bonds issued by corporations; in shares of GMO World Opportunity Overlay Fund; in futures contracts, swap contracts, currency forwards, currency options and other types of derivatives; up to 5% of the Fund's total assets in sovereign debt of emerging countries (including below investment grade securities), primarily through investment in shares of GMO Emerging Country Debt Fund; and in non-inflation indexed (or nominal) fixed income securities issued by the U.S. and foreign governments and their agencies or instrumentalities (including securities neither guaranteed nor insured by the U.S. Government) and by corporations (to gain direct exposure to such securities and/or for use as part of a synthetic position).
As of February 29, 2008, the Fund had two classes of shares outstanding: Class III and Class VI. Class IV shares were liquidated on February 13, 2008. Class VI, Class III and Class IV commenced operations on May 31, 2006, June 29, 2006 and July 18, 2006, respectively. Each class of shares bears a different level of shareholder service fees.
The financial statements of the series of the Trust in which the Fund invests ("underlying funds") should be read in conjunction with the Fund's financial statements. These financial statements are available, without charge, upon request, by calling (617) 346-7646 (collect). Shares of GMO Short-Duration Collateral Fund, GMO Special Purpose Holding Fund and GMO World Opportunity Overlay Fund are not publicly available.
2. Significant accounting policies
The following is a summary of significant accounting policies which are in conformity with accounting principles generally accepted in the United States of America ("U.S. GAAP") and which are consistently followed by the Fund in the preparation of its financial statements. The preparation of financial statements
14
GMO Inflation Indexed Plus Bond Fund
(A Series of GMO Trust)
Notes to Financial Statements — (Continued)
February 29, 2008
in accordance with U.S. GAAP requires management to make estimates and assumptions that affect the reported amounts and disclosures in the financial statements. Actual results could differ from those estimates. The accounting records of the Fund are maintained in U.S. dollars.
Portfolio valuation
Securities listed on a securities exchange for which market quotations are readily available are valued at the last sale price or official closing price on each business day, or if there is no such reported sale or official closing price, at the most recent quoted bid price. Unlisted securities for which market quotations are readily available are generally valued at the most recent quoted bid price. Short-term investments with a remaining maturity of sixty days or less are generally valued at amortized cost, which approximates fair value. Shares of investment funds are valued at their net asset value. Securities for which quotations are not readily available or whose values the Manager has determined to be unreliable are valued at fair value as determined in good faith by the Trustees or other persons acting at their direction pursuant to procedures approved by the Trustees. By its nature, a fair value price is a good faith est imate of the value of a security at a given point in time and may not reflect the value that would be realized if the security was sold and the differences could be material.
Fixed income securities held by the Fund or the underlying funds are typically valued pursuant to prices supplied by a primary pricing source chosen by the Manager. The Manager evaluates such primary pricing sources on an ongoing basis, and may change a pricing source should it deem it appropriate. The Manager, at its discretion, may override a price supplied by a primary source by using a price provided by another source if such action is deemed appropriate. The prices provided by such primary pricing sources may differ from the value that would be realized if the securities were sold and the differences could be material.
Certain securities held by the Fund or the underlying funds are valued on the basis of a price provided by a single source. The prices provided may differ from the value that would be realized if the securities were sold and the differences could be material. As of February 29, 2008, the total value of these securities represented 30.78% of net assets.
The Fund indirectly invests through underlying funds in securities with contractual cash flows, such as asset-backed securities, collateralized mortgage obligations and commercial mortgage backed securities, including securities backed by subprime mortgage loans. The value, liquidity and related income of these securities are sensitive to changes in economic conditions, including real estate values, delinquencies and/or defaults, and may be adversely affected by shifts in the market's perception of the securities' market values and changes in interest rates.
GMO Special Purpose Holding Fund ("SPHF"), an investment of the Fund, has litigation pending against various entities related to the default of certain asset-backed securities previously held by SPHF. For the year ended February 29, 2008, the Fund received $187,563 through SPHF in conjunction with settlement agreements related to the default of those securities.
15
GMO Inflation Indexed Plus Bond Fund
(A Series of GMO Trust)
Notes to Financial Statements — (Continued)
February 29, 2008
Foreign currency translation
The market values of foreign securities, currency holdings and other assets and liabilities are translated to U.S. dollars based on the current exchange rates each business day. Income and expenses denominated in foreign currencies are translated at current exchange rates when accrued or incurred. The Fund does not isolate realized and unrealized gains and losses attributable to changes in exchange rates from gains and losses that arise from changes in the market value of investments. Such fluctuations are included with net realized and unrealized gain or loss on investments. Net realized gains and losses on foreign currency transactions represent gains and losses on disposition of currencies and forward currency contracts, currency gains and losses realized between the trade and settlement dates on securities transactions, and the difference between the amount of investment income and foreign withholding taxes recorded on the F und's accounting records and the U.S. dollar equivalent amounts actually received or paid.
Forward currency contracts
The Fund may enter into forward currency contracts including forward cross currency contracts. A forward currency contract is an agreement between two parties to buy and sell a currency at a set price on a future date. The market value of a forward currency contract fluctuates with changes in forward currency exchange rates. Forward currency contracts are marked to market daily using rates supplied by a quotation service and changes in value are recorded by the Fund as an unrealized gain or loss. Realized gains or losses equal to the difference between the value of the contract at the time it was opened and the value at the time it was closed are recorded upon delivery or receipt of the currency or, if a forward currency contract is offset by entering into another forward currency contract with the same broker, upon settlement of the net gain or loss. These contracts may involve market risk in excess of the unrealized gain or lo ss reflected in the Fund's Statement of Assets and Liabilities. In addition, the Fund could be exposed to risk if the counterparties are unable to meet the terms of the contracts or if there are movements in currency values that are unfavorable to the Fund. Forward currency contracts outstanding at the end of the period are listed in the Fund's Schedule of Investments.
Futures contracts
The Fund may purchase and sell futures contracts. Upon entering into a futures contract, the Fund is required to deposit with the futures clearing broker an amount of cash, U.S. government and agency obligations, or other liquid assets in accordance with the initial margin requirements of the broker or exchange. In addition, the Fund maintains cash or securities in an amount that at least equals the net amount payable in the event the Fund must deliver the full amount of the contracts. Futures contracts are marked to market daily and an appropriate payable or receivable for the change in value ("variation margin") is recorded by the Fund. The payable or receivable is liquidated on the following business day. Gains or losses are recognized but not considered realized until the contracts expire or are closed. Futures contracts involve, to varying degrees, risk of loss in excess of the variation margin disclosed in the Statement of Assets and Liabilities. Under certain circumstances, futures exchanges may establish daily limits on the amount that the price of a futures contract can vary from the previous day's settlement price, thereby effectively preventing liquidation of unfavorable positions. Losses may arise from changes in the
16
GMO Inflation Indexed Plus Bond Fund
(A Series of GMO Trust)
Notes to Financial Statements — (Continued)
February 29, 2008
value of the underlying instrument if the Fund is unable to liquidate a futures position due to an illiquid secondary market for the contracts or the imposition of price limits, or if counterparties do not perform under the contract terms. Futures contracts are generally valued at the settlement price established each day by the board of trade or exchange on which they are traded. Futures contracts outstanding at the end of the period are listed in the Fund's Schedule of Investments.
Options
The Fund may write call and put options. Writing options increases the Fund's exposure to the underlying instrument by, in the case of a call option, obligating the Fund to sell the underlying instrument at a set price to the option-holder and, in the case of a put option, obligating the Fund to purchase the underlying instrument at a set price from the option-holder. When the Fund writes a call or put option, an amount equal to the premium received is recorded as a liability and subsequently marked to market to reflect the current value of the option written. Premiums received from writing options which expire are treated as realized gains. Premiums received from writing options which are exercised or closed are added to the proceeds or offset against the amounts paid on the underlying future, security or currency transaction to determine the realized gain or loss. The Fund as a writer of an option has no control over whether t he underlying future, security or currency may be sold (call) or purchased (put) and as a result bears the market risk of an unfavorable change in the price of the future, security or currency underlying the written option. In the event that the Fund writes uncovered call options (i.e. options for investments that the Fund does not own), it bears the risk of incurring substantial losses if the price of the underlying instrument increases during the term of the option. There is the risk the Fund may not be able to enter into a closing transaction because of an illiquid market. There were no open written option contracts during the period.
The Fund may also purchase put and call options. Purchasing options alters the Fund's exposure to the underlying instrument by, in the case of a call option, entitling the Fund to purchase the underlying instrument at a set price from the writer of the option and, in the case of a put option, entitling the Fund to sell the underlying instrument at a set price to the writer of the option. The Fund pays a premium as a cost for a purchased option disclosed in the Schedule of Investments which is subsequently marked to market to reflect the current value of the option. Premiums paid for purchasing options which expire are treated as realized losses. Premiums paid for purchasing options which are exercised or closed are added to the amounts paid or offset against the proceeds on the closing transaction to determine the realized gain or loss. The risk associated with purchasing put and call options is limited to the premium paid. Ther e were no purchased option contracts outstanding at the end of the period.
Exchange traded options are valued at the last sale price, or if no sale is reported, the last bid price for purchased options and the last ask price for written options. Options traded over-the-counter are valued using prices supplied by a primary pricing source chosen by the Manager.
17
GMO Inflation Indexed Plus Bond Fund
(A Series of GMO Trust)
Notes to Financial Statements — (Continued)
February 29, 2008
Loan agreements
The Fund may invest in direct debt instruments which are interests in amounts owed by a corporate, governmental, or other borrower to lenders or lending syndicates. The Fund's investments in loans may be in the form of participations in loans or assignments of all or a portion of loans from third parties. A loan is often administered by a bank or other financial institution (the "lender") that acts as agent for all holders. The agent administers the terms of the loan, as specified in the loan agreement. When investing in a loan participation, the Fund has the right to receive payments of principal, interest and any fees to which it is entitled only from the lender selling the loan agreement and only upon receipt by the lender of payments from the borrower. The Fund generally has no right to enforce compliance with the terms of the loan agreement with the borrower. As a result, the Fund may be subject to the credit risk of both t he borrower and the lender that is selling the loan agreement. When the Fund purchases assignments from lenders it acquires direct rights against the borrower on the loan. There were no loan agreements outstanding at the end of the period.
Indexed securities
The Fund invests in indexed securities where the redemption values and/or coupons are linked to the prices of a specific instrument or financial statistic. The Fund uses indexed securities to increase or decrease its exposure to different underlying instruments and to gain exposure to markets in which it may be difficult to invest through conventional securities. Indexed securities may be more volatile than their underlying instruments, but any loss is limited to the amount of the original investment. Indexed securities held by the Fund at the end of the period are listed in the Fund's Schedule of Investments.
Swap agreements
The Fund may enter into swap agreements. A swap is an agreement to exchange the return generated by one instrument for the return generated by another instrument. Interest rate swap agreements involve the exchange by one party with another party of their respective commitments to pay or receive interest, e.g., an exchange of floating rate payments for fixed rate payments with respect to a notional amount of principal. Total return swap agreements involve a commitment by one party in the agreement to pay interest in exchange for a market-linked return, both based on notional amounts. To the extent the total return of the security or index underlying the transaction exceeds or falls short of the offsetting interest rate obligation, the party will receive a payment from or make a payment to the counterparty, respectively. Forward spread lock swap agreements involve commitments to pay or receive a settlement amount calculated as the difference between the swap spread and a fixed spread, multiplied by the notional amount times the duration of the swap rate. The swap spread is the difference between the benchmark swap rate (market rate) and the specific treasury rate. In a credit default swap, one party makes a stream of payments to another party in exchange for the right to receive a specified return in the event of a default by a third party on its obligation. Credit default swaps may be used to provide a measure of protection against defaults of sovereign or corporate issuers (i.e., to reduce risk where a party owns or has exposure to the issuer) or to take an active long or short position with respect to the likelihood of a particular issuer's default. Variance swap agreements involve commitments to pay or receive a settlement amount calculated
18
GMO Inflation Indexed Plus Bond Fund
(A Series of GMO Trust)
Notes to Financial Statements — (Continued)
February 29, 2008
as the difference between the annualized realized variance of returns on the underlying price and a fixed quantity, also known as the variance strike, over a period of time. In connection with these agreements, cash or securities may be set aside as collateral by the Fund's custodian or brokers in accordance with the terms of the swap agreement. The Fund earns or pays interest on cash set aside as collateral.
Swaps are marked to market daily using models that incorporate quotations from market makers and the change in value, if any, is recorded as unrealized gain or loss in the Statement of Operations. Payments received or made on swap contracts are recorded as realized gain or loss in the Statement of Operations. Gains or losses are realized upon early termination of the swap agreements. These financial instruments are not actively traded on financial markets. The values assigned to these instruments are based upon the best available information and because of the uncertainty of the valuation, these values may differ significantly from the values that would have been realized had a ready market for these instruments existed, and the differences could be material. Entering into these agreements involves, to varying degrees, elements of credit, legal, market and documentation risk in excess of the amounts recognized in the Statement o f Assets and Liabilities. Such risks involve the possibility that there will be no liquid market for these agreements, that the counterparties to the agreements may default on their obligations to perform or disagree as to the meaning of contractual terms in the agreements, or that there may be unfavorable changes in interest rates or the price of the index or security underlying these transactions. Swap agreements outstanding at the end of the period are listed in the Fund's Schedule of Investments.
Repurchase agreements
The Fund may enter into repurchase agreements with banks and broker-dealers whereby the Fund acquires a security for cash and obtains a simultaneous commitment from the seller to repurchase the security at an agreed upon price and date. The Fund, through its custodian, takes possession of securities collateralizing the repurchase agreement. The collateral is marked to market daily to ensure that the market value of the underlying assets remains sufficient to protect the Fund in the event of default by the seller. Collateral for certain tri-party repurchase agreements is held at the counterparty's custodian in a segregated account for the benefit of the Fund and the counterparty. In connection with transactions in repurchase agreements, if the seller defaults or enters into insolvency proceedings and the value of the collateral declines, recovery of cash by the Fund may be delayed or limited. There were no repurchase agreements o utstanding at the end of the period.
Reverse repurchase agreements
The Fund may enter into reverse repurchase agreements with banks and broker-dealers whereby the Fund sells portfolio assets concurrent with an agreement by the Fund to repurchase the same assets at a later date at a fixed price. In connection with these agreements, the Fund establishes segregated accounts with its custodian in which the Fund maintains cash, U.S. government securities or other assets equal in value to its obligations in respect of reverse repurchase agreements. Reverse repurchase agreements involve the risk that the market value of the securities the Fund has sold under the agreement may decline below the price at which the Fund is obligated to repurchase under the agreement. The market value of the securities the Fund has sold is determined daily and any additional required collateral is allocated to or sent by the Fund on the next business day. There were no reverse repurchase agreements outstanding at the end of the period.
19
GMO Inflation Indexed Plus Bond Fund
(A Series of GMO Trust)
Notes to Financial Statements — (Continued)
February 29, 2008
Securities lending
The Fund may lend its securities to certain qualified broker-dealers. The loans are collateralized with cash or liquid securities with a market value at least equal to the market value of the securities on loan. As with other extensions of credit, the Fund may bear the risk of loss with respect to the investment of the collateral, the risk of delay in and/or inability to exercise its rights with respect to the collateral, and the risk of delay in recovery or loss of rights in the loaned securities should the borrower of the securities fail financially. If a loan is collateralized by U.S. government securities, the Fund receives a fee from the borrower. If a loan is collateralized by cash, the Fund typically invests the cash collateral for its own account in interest-bearing, short-term securities and pays a fee to the borrower that normally represents a portion of the Fund's earnings on the collateral. For the year ended Februar y 29, 2008, the Fund did not participate in securities lending.
Taxes and distributions
The Fund intends to qualify each tax year as a regulated investment company under Subchapter M of the Internal Revenue Code of 1986, as amended (the "Code"). The Fund has adopted a tax year-end of December 31. Unless otherwise indicated, all applicable tax disclosures reflect tax adjusted balances as of December 31, 2007. The Fund intends to distribute substantially all of its net investment income and net realized short-term and long-term capital gains, if any, after giving effect to any available capital loss carryovers for U.S. federal income tax purposes. Therefore, no provision for U.S. federal income or excise tax is necessary.
The Fund's policy is to declare and pay distributions from net investment income, if any, semiannually, and from net realized short-term and long-term capital gains, if any, at least annually. All distributions are paid in shares of the Fund, at net asset value, unless the shareholder elects to receive cash distributions. Distributions to shareholders are recorded by the Fund on the ex-dividend date.
Income and capital gain distributions are determined in accordance with U.S. federal income tax regulations, which may differ from U.S. GAAP. Certain capital accounts in the financial statements are periodically adjusted for permanent differences in order to reflect their tax character. These adjustments have no impact on net assets or net asset value per share. Temporary differences which arise from recognizing certain items of income, expense, gain or loss in different periods for financial statement and tax purposes will reverse at some time in the future. Distributions in excess of net investment income or net realized gains are temporary over distributions for financial statement purposes resulting from differences in the recognition or classification of income or distributions for financial statement and tax purposes.
U.S. GAAP and tax accounting differences as of December 31, 2007 primarily relate to capital loss carryforwards, derivative contract transactions, differing treatment of mutual fund distributions received, foreign currency transactions, losses on wash sale transactions, partnership interest tax allocations and post-October capital and currency losses.
20
GMO Inflation Indexed Plus Bond Fund
(A Series of GMO Trust)
Notes to Financial Statements — (Continued)
February 29, 2008
The following reclassification represents the amount necessary to report the stated components of net assets on a tax basis, excluding certain temporary differences, as of December 31, 2007. The financial highlights exclude these adjustments.
| Distributions in Excess of Net Investment Income | Accumulated Net Realized Loss | Paid-in Capital | |||||||||
| $ | 114,333,741 | $ | (114,333,741 | ) | $ | — | |||||
The tax character of distributions declared to shareholders is as follows:
| 12/31/2007 | 12/31/2006 | ||||||||||
| Ordinary income (including any short-term capital gains) | $ | 302,193,959 | $ | 77,468,530 | |||||||
| Total distributions | $ | 302,193,959 | $ | 77,468,530 | |||||||
Distributions in excess of tax basis earnings and profits, if significant, are reported in the financial statements as a tax return of capital.
As of December 31, 2007, the Fund elected to defer to January 1, 2008 post-October capital and currency losses of $11,560,236 and $27,059,368, respectively.
As of December 31, 2007, the Fund had capital loss carryforwards available to offset future realized gains if any, to the extent permitted by the Code. Utilization of the capital loss carryforwards could be subject to limitations imposed by the Code related to share ownership activity. Such losses expire as follows:
| 12/31/2015 | $ | (33,561,953 | ) | ||||
| Total | $ | (33,561,953 | ) | ||||
As of February 29, 2008, the approximate cost for U.S. federal income tax purposes and gross and net unrealized appreciation and depreciation in value of investments were as follows:
Aggregate Cost | Gross Unrealized Appreciation | Gross Unrealized (Depreciation) | Net Unrealized Appreciation (Depreciation) | ||||||||||||
| $ | 235,802,616 | $ | 1,633,889 | $ | (11,228,795 | ) | $ | (9,594,906 | ) | ||||||
21
GMO Inflation Indexed Plus Bond Fund
(A Series of GMO Trust)
Notes to Financial Statements — (Continued)
February 29, 2008
The Fund made distributions from net investment income to shareholders subsequent to the close of its tax year ended December 31, 2007. Such distributions were made in connection with significant redemption activity in January and February 2008. The stated components of net assets in the Statement of Assets and Liabilities have not been adjusted to reflect permanent U.S. GAAP to tax accounting differences, if any, occurring subsequent to December 31, 2007. Any such differences will have no impact on the Fund's net assets or net asset value per share.
The final tax classification of the distributions made after December 31, 2007 will depend on the Fund's taxable income for the full tax year ended December 31, 2008. Additionally, utilization of certain capital losses realized through the Fund's fiscal year ended February 29, 2008 and/or losses which may be realized in tax years subsequent to December 31, 2007 could be subject to limitations imposed by the Code.
Security transactions and related investment income
Security transactions are accounted for on trade date. Dividend income, net of applicable foreign withholding taxes, if any, is recorded on the ex-dividend date, or when the Fund is informed of the ex-dividend date, if later. Interest income is recorded on the accrual basis and is adjusted for the amortization of premiums and accretion of discounts. Interest income on inflation indexed securities, if any, is accrued daily based upon an inflation adjusted principal. Additionally, any increase or decrease in the principal or face amount of the securities adjusted for inflation is recorded as interest income or loss. Income is not recognized on securities for which collection is not expected. Non-cash dividends, if any, are recorded at the fair market value of the securities received. In determining the net gain or loss on securities sold, the cost of securities is determined on the identified cost basis.
Expenses
The majority of expenses of the Trust are directly identifiable to an individual fund. Expenses which are not readily identifiable to a specific fund are allocated taking into consideration, among other things, the nature and type of expense and the relative size of the funds. Investment income, common expenses and realized and unrealized gains and losses are allocated pro rata among the classes of shares of the Fund based on the relative net assets of each class. Shareholder service fees, which are directly attributable to a class of shares, are charged to that class's operations. In addition, the Fund will also incur certain fees and expenses indirectly as a shareholder in the underlying funds. Because the underlying funds have varied expense and fee levels and the Fund may own different proportions of the underlying funds at different times, the amount of fees and expenses indirectly incurred by the Fund will vary (See Note 3 ).
State Street Bank and Trust Company ("State Street") serves as custodian, fund accounting agent and transfer agent of the Fund. State Street's fee may be reduced by credits that are an earnings allowance calculated on the average daily cash balances the Fund maintains with State Street. Credit balances used to reduce the fee paid to State Street, if any, are reported as a reduction of expenses in the Statement of Operations.
22
GMO Inflation Indexed Plus Bond Fund
(A Series of GMO Trust)
Notes to Financial Statements — (Continued)
February 29, 2008
Recently issues accounting pronouncements
In June 2006, the Financial Accounting Standards Board ("FASB") issued FASB Interpretation No. 48, Accounting for Uncertainty in Income Taxes – an Interpretation of FASB Statement No. 109 ("FIN 48"). FIN 48 clarifies the accounting for uncertainty in income taxes recognized in accordance with FASB Statement No. 109, Accounting for Income Taxes. FIN 48 prescribes a recognition threshold and measurement attribute for a tax position taken or expected to be taken in the tax return that could impact the Fund's financial statements. It also provides guidance in relation to the Fund's financial statements on classification of tax benefits or liabilities, interest and penalties, accounting in interim periods, disclosure, and transition. FIN 48 is effective for fiscal years beginning after December 15, 2006 for registered investment companies. Management has evaluated the effects of applying the various provisions of FIN 48 and has determined that the adoption of FIN 48 does not have a material effect on the Fund's financial statements. The Fund's federal tax returns for the prior three fiscal years, if applicable, remain subject to examination by the Internal Revenue Service. Management will continue to monitor the rules and guidance pertaining to FIN 48 and will take action if appropriate.
In September 2006, the FASB issued Statement of Financial Accounting Standards No. 157 ("FAS 157"), "Fair Value Measurements." FAS 157 defines fair value, establishes a framework for measuring fair value in accordance with generally accepted accounting principles and expands disclosure about fair value measurements. FAS 157 is effective for fiscal years beginning after November 15, 2007. Management is currently evaluating the impact the adoption of FAS 157 will have on the Fund's financial statement disclosures.
3. Fees and other transactions with affiliates
GMO earns a management fee paid monthly at the annual rate of 0.25% of average daily net assets. The Fund has adopted a Shareholder Service Plan under which the Fund pays GMO a shareholder service fee for client and shareholder service, reporting, and other support. Pursuant to the Shareholder Service Plan, the shareholder service fee is calculated based on average daily net assets of each class at the annual rate of 0.15% for Class III shares, 0.10% for Class IV shares and 0.055% for Class VI shares. The Manager will waive the Fund's shareholder service fee to the extent that the aggregate of any direct and indirect shareholder service fees borne by a class of shares of the Fund exceeds 0.15% for Class III shares, 0.10% for Class IV shares and 0.055% for Class VI shares; provided, however, that the amount of this waiver will not exceed the respective Class' shareholder service fee.
The Manager has contractually agreed to reimburse the Fund for Fund expenses through at least June 30, 2008 to the extent the Fund's total annual operating expenses (excluding shareholder service fees, expenses indirectly incurred by investment in the underlying funds, fees and expenses of the independent Trustees of the Trust, fees and expenses for legal services not approved by the Manager for the Trust, compensation and expenses of the Trust's Chief Compliance Officer ("CCO") (excluding any employee benefits), brokerage commissions, securities lending fees and expenses, interest expense, transfer taxes, and other investment-related
23
GMO Inflation Indexed Plus Bond Fund
(A Series of GMO Trust)
Notes to Financial Statements — (Continued)
February 29, 2008
costs (including expenses associated with investments in any company that is an investment company or would be an investment company under the 1940 Act, but for the exceptions to the definition of investment company provided in Section 3(c)(1) and 3(c)(7) of the 1940 Act), hedging transaction fees, extraordinary, non-recurring and certain other unusual expenses (including taxes) (collectively, "Excluded Fund Fees and Expenses")) exceed 0.25% of the Fund's average daily net assets. In addition, the Manager has contractually agreed to reimburse the Fund through at least June 30, 2008 to the extent that the sum of (a) the Fund's total annual operating expenses (excluding Excluded Fund Fees and Expenses) and (b) the amount of fees and expenses incurred indirectly by the Fund through its investment in ECDF (excluding ECDF's fees and expenses of the independent trustees of the Trust, fees for legal services not procured or provided by the Manager for the Trust, compensation and expenses of the Trust's CCO (excluding any employee benefits), and investment-related expenses such as brokerage commissions, hedging transaction fees, securities lending fees and expenses, interest expense and transfer taxes), exceeds 0.25% of the Fund's average daily net assets, subject to a maximum total reimbursement to the Fund equal to 0.25% of the Fund's average daily net assets.
The Fund incurs fees and expenses indirectly as a shareholder in underlying funds. For the year ended February 29, 2008, these indirect fees and expenses expressed as an annualized percentage of the Fund's average daily net assets were as follows:
| Indirect Net Expenses (excluding shareholder service fees and interest expense) | Indirect Shareholder Service Fees | Indirect Interest Expense | Total Indirect Expenses | ||||||||||||
| 0.014 | % | 0.005 | % | 0.037 | % | 0.056 | % | ||||||||
The Fund's portion of the fees paid by the Trust to the independent Trustees and CCO during the year ended February 29, 2008 was $21,795 and $15,163, respectively. The compensation and expenses of the CCO are included in miscellaneous expenses in the Statement of Operations. No remuneration was paid by the Fund to any other officer of the Trust.
4. Purchases and sales of securities
For the year ended February 29, 2008, cost of purchases and proceeds from sales of investments, other than short-term obligations and class exchanges, were as follows:
| Purchases | Sales | ||||||||||
| U.S. Government securities | $ | 377,293,110 | $ | 704,235,437 | |||||||
| Investments (non-U.S. Government securities) | 3,144,617,536 | 4,602,147,520 | |||||||||
24
GMO Inflation Indexed Plus Bond Fund
(A Series of GMO Trust)
Notes to Financial Statements — (Continued)
February 29, 2008
5. Guarantees
In the normal course of business the Fund enters into contracts with third-party service providers that contain a variety of representations and warranties and which provide general indemnifications. The Fund's maximum exposure under these arrangements is unknown, as this would involve future claims that may be made against the Fund that have not yet occurred. Based on experience, management is of the view that the risk of loss in connection with these potential indemnification obligations is remote; however, there can be no assurance that material liabilities related to such obligations will not arise in the future that could adversely impact the Fund.
6. Principal shareholders and related parties
As of February 29, 2008, 96.37% of the outstanding shares of the Fund were held by three shareholders, each holding in excess of 10% of the Fund's outstanding shares. No other shareholder owned in excess of 10% of the outstanding shares of the Fund. Investment activities of these shareholders may have a material effect on the Fund.
As of February 29, 2008, 0.10% of the Fund's shares were held by twelve related parties comprised of certain GMO employee accounts.
7. Share transactions
The Declaration of Trust permits the Trustees to issue an unlimited number of shares of beneficial interest (without par value). Transactions in Fund shares were as follows:
| Year Ended February 29, 2008 | Period from June 29, 2006 (commencement of operations) through February 28, 2007 | ||||||||||||||||||
| Class III: | Shares | Amount | Shares | Amount | |||||||||||||||
| Shares sold | 7,753,239 | $ | 195,318,795 | 15,451,865 | $ | 389,950,136 | |||||||||||||
| Shares issued to shareholders in reinvestment of distributions | 1,015,942 | 24,078,255 | 316,658 | 7,932,294 | |||||||||||||||
| Shares repurchased | (13,137,888 | ) | (323,176,587 | ) | (5,553,811 | ) | (139,327,005 | ) | |||||||||||
| Net increase (decrease) | (4,368,707 | ) | $ | (103,779,537 | ) | 10,214,712 | $ | 258,555,425 | |||||||||||
25
GMO Inflation Indexed Plus Bond Fund
(A Series of GMO Trust)
Notes to Financial Statements — (Continued)
February 29, 2008
| Period Ended February 13, 2008* | Period from July 18, 2006 (commencement of operations) through February 28, 2007 | ||||||||||||||||||
| Class IV: | Shares | Amount | Shares | Amount | |||||||||||||||
| Shares sold | 7,496,338 | $ | 190,386,804 | 7,531,845 | $ | 189,718,619 | |||||||||||||
| Shares issued to shareholders in reinvestment of distributions | 637,724 | 15,178,849 | 221,447 | 5,547,242 | |||||||||||||||
| Shares repurchased | (11,854,634 | ) | (289,108,485 | ) | (4,032,720 | ) | (101,100,287 | ) | |||||||||||
| Net increase (decrease) | (3,720,572 | ) | $ | (83,542,832 | ) | 3,720,572 | $ | 94,165,574 | |||||||||||
| Year Ended February 29, 2008 | Period from May 31, 2006 (commencement of operations) through February 28, 2007 | ||||||||||||||||||
| Class VI: | Shares | Amount | Shares | Amount | |||||||||||||||
| Shares sold | 81,536,209 | $ | 2,064,407,172 | 71,907,875 | $ | 1,824,498,863 | |||||||||||||
| Shares issued to shareholders in reinvestment of distributions | 14,977,254 | 355,069,039 | 2,462,698 | 61,690,592 | |||||||||||||||
| Shares repurchased | (166,263,657 | ) | (3,946,012,475 | ) | (777,198 | ) | (19,691,168 | ) | |||||||||||
| Net increase (decrease) | (69,750,194 | ) | $ | (1,526,536,264 | ) | 73,593,375 | $ | 1,866,498,287 | |||||||||||
* Effective February 13, 2008, all shareholders redeemed or exchanged out of Class IV.
26
GMO Inflation Indexed Plus Bond Fund
(A Series of GMO Trust)
Notes to Financial Statements — (Continued)
February 29, 2008
8. Investments in affiliated issuers
A summary of the Fund's transactions in the securities of affiliated issuers during the year ended February 29, 2008 is set forth below:
| Affiliate | Value, beginning of period | Purchases | Sales Proceeds | Dividend Income | Distributions of Realized Gains | Value, end of period | |||||||||||||||||||||
| GMO Emerging Country Debt Fund, Class III | $ | 66,616,399 | $ | 73,779,918 | $ | 125,900,000 | $ | 7,435,177 | $ | 3,744,741 | $ | 6,756,250 | |||||||||||||||
| GMO Short-Duration Collateral Fund | 1,294,006,779 | 2,571,222,022 | 3,587,887,869 | 134,422,022 | — | 114,960,626 | |||||||||||||||||||||
| GMO Special Purpose Holding Fund | 40,775 | — | — | — | 187,563 | 36,437 | |||||||||||||||||||||
| GMO World Opportunity Overlay Fund | 447,312,841 | 498,125,000 | 883,610,000 | — | — | 44,675,992 | |||||||||||||||||||||
| Totals | $ | 1,807,976,794 | $ | 3,143,126,940 | $ | 4,597,397,869 | $ | 141,857,199 | $ | 3,932,304 | $ | 166,429,305 | |||||||||||||||
9. Subsequent Event
Subsequent to February 29, 2008, the Fund received redemption requests in the amount of $95,908,901.
27
Report of Independent Registered Public Accounting Firm
To the Trustees of GMO Trust and the Shareholders of
GMO Inflation Indexed Plus Bond Fund
In our opinion, the accompanying statement of assets and liabilities, including the schedule of investments, and the related statements of operations and of changes in net assets and the financial highlights present fairly, in all material respects, the financial position of GMO Inflation Indexed Plus Bond Fund (the "Fund") at February 29, 2008, the results of its operations for the year then ended, the changes in its net assets for each of the periods indicated and the financial highlights for each of the periods indicated, in conformity with accounting principles generally accepted in the United States of America. These financial statements and financial highlights (hereafter referred to as "financial statements") are the responsibility of the Fund's management; our responsibility is to express an opinion on these financial statements based on our audits. We conducted our audits of these financial statements in accordance with the standards of the Public Company Accounting Oversight Board (United States). Those standards require that we plan and perform the audit to obtain reasonable assurance about whether the financial statements are free of material misstatement. An audit includes examining, on a test basis, evidence supporting the amounts and disclosures in the financial statements, assessing the accounting principles used and significant estimates made by management, and evaluating the overall financial statement presentation. We believe that our audits, which included confirmation of securities at February 29, 2008 by correspondence with the custodian and brokers, provide a reasonable basis for our opinion.
PricewaterhouseCoopers LLP
Boston, Massachusetts
April 29, 2008
28
GMO Inflation Indexed Plus Bond Fund
(A Series of GMO Trust)
Fund Expenses
February 29, 2008 (Unaudited)
Expense Examples: The following information is in relation to expenses for the six month period ended February 29, 2008.
As a shareholder of the Fund, you may incur two types of costs: (1) transaction costs, and (2) ongoing costs, including management fees, shareholder service fees, and other Fund expenses. This example is intended to help you understand your ongoing costs (in dollars) of investing in the Fund and to compare these costs with the ongoing costs of investing in other mutual funds.
These examples are based on an investment of $1,000 invested at the beginning of the period and held for the entire period, September 1, 2007 through February 29, 2008.
Actual Expenses
The first line of the table below provides information about actual account values and actual expenses. You may use the information in this line, together with the amount you invested, to estimate the expenses that you paid over the period. Simply divide your account value by $1,000 (for example, a $10,000,000 account value divided by $1,000 = 10,000), then multiply the result by the number in the first line under the heading entitled "Net Expense Incurred" to estimate the expenses you paid on your account during this period.
Hypothetical Example for Comparison Purposes
The second line of the table below provides information about hypothetical account values and hypothetical expenses based on the Fund's actual expense ratio and an assumed rate of return of 5% per year before expenses, which is not the Fund's actual return. The hypothetical account values and expenses may not be used to estimate the actual ending account balance or expenses you paid for the period. You may use this information to compare the ongoing costs of investing in the Fund with other funds. To do so, compare this 5% hypothetical example with the 5% hypothetical examples that appear in the shareholder reports of other funds.
Please note that the expenses shown in the table are meant to highlight your ongoing costs only and do not reflect any transactional costs. Therefore, the second line of the table is useful in comparing ongoing costs only, and will not help you determine the relative total costs of owning different funds. In addition, if these transactional costs were included, your costs would have been higher.
| Annualized Net Expense Ratio | Beginning Account Value | Ending Account Value | Net Expense Incurred* | ||||||||||||||||
| Class III | |||||||||||||||||||
| 1) Actual | 0.54 | % | $ | 1,000.00 | $ | 1,044.40 | $ | 2.74 | |||||||||||
| 2) Hypothetical | 0.54 | % | $ | 1,000.00 | $ | 1,022.18 | $ | 2.72 | |||||||||||
| Class VI | |||||||||||||||||||
| 1) Actual | 0.45 | % | $ | 1,000.00 | $ | 1,044.50 | $ | 2.29 | |||||||||||
| 2) Hypothetical | 0.45 | % | $ | 1,000.00 | $ | 1,022.63 | $ | 2.26 | |||||||||||
* Expenses are calculated using each Class's annualized expense ratio (including interest expense and indirect expenses incurred) for the six months ended February 29, 2008, multiplied by the average account value over the period, multiplied by 182 days in the period, divided by 366 days in the year.
29
GMO Inflation Indexed Plus Bond Fund
(A Series of GMO Trust)
Tax Information for the Tax Year Ended December 31, 2007 (Unaudited)
The Fund will notify shareholders of amounts for use in preparing 2008 income tax forms in January 2009.
The Fund hereby designates as qualified interest income and qualified short-term capital gains with respect to its taxable year ended December 31, 2007, $101,771,326 and $8,742,832, respectively, or if determined to be different, the qualified interest income and qualified short-term gains of such year.
30
Trustees and Officers (Unaudited)
The following tables list the Trust's Trustees and Officers as of the date of this report; their address and date of birth ("DOB"); their position with the Trust; the length of time holding that position with the Trust; their principal occupation(s) during the past five years; the number of portfolios in the fund complex they oversee; and other directorships they hold in companies subject to registration or reporting requirements of the Securities Exchange Act of 1934 (generally called "public companies") or in registered investment companies. The Trust's Statement of Additional Information ("SAI") includes additional information about the Trust's trustees, including changes subsequent to the date of the report. The SAI is available, without charge, upon request by writing GMO, c/o GMO Trust, 40 Rowes Wharf, Boston, MA 02110.
Independent Trustees:
| Name, Address, and DOB | Position(s) Held with Trust | Term of Office1 and Length of Time Served | Principal Occupation(s) During Past Five Years | Number of Portfolios in Fund Complex Overseen by Trustee | Other Directorships Held by Trustee | ||||||||||||||||||
| Donald W. Glazer, Esq. c/o GMO Trust 40 Rowes Wharf Boston, MA 02110 DOB: 07/26/1944 | Chairman of the Board of Trustees | Chairman of the Board of Trustees since March 2005; Lead Independent Trustee (September 2004 – March 2005); Trustee since December 2000. | Consultant – Law and Business2; Vice Chair (since 2002) and Secretary, Provant, Inc. (provider of personnel performance improvement services and training products); Author of Legal Treatises. | 47 | None. | ||||||||||||||||||
1 Each Trustee is elected to serve during the continued lifetime of the Trust until he/she dies, resigns or is removed, or if sooner, until the next meeting of Shareholders called for the purpose of electing Trustees and until the election and qualification of his/her successor.
2 As part of Mr. Glazer's work as a consultant, he provides part-time consulting services to Goodwin Procter LLP ("Goodwin"). Goodwin has provided legal services to Renewable Resources, LLC, an affiliate of GMO; GMO, in connection with its relationship with Renewable Resources; and funds managed by Renewable Resources. Mr. Glazer has represented that he has no financial interest in, and is not involved in the provision of, such legal services. In the calendar years ended December 31, 2006 and December 31, 2007, these entities paid $825,738 and $291,721 respectively, in legal fees and disbursements to Goodwin.
31
Independent Trustees — (Continued)
| Name, Address, and DOB | Position(s) Held with Trust | Term of Office1 and Length of Time Served | Principal Occupation(s) During Past Five Years | Number of Portfolios in Fund Complex Overseen by Trustee | Other Directorships Held by Trustee | ||||||||||||||||||
| Jay O. Light c/o GMO Trust 40 Rowes Wharf Boston, MA 02110 DOB: 10/03/1941 | Trustee | Since May 1996. | Dean (since April 2006), Acting Dean (August 2005 – April 2006), Senior Associate Dean (1998 – 2005), and Professor of Business Administration, Harvard Business School. | 47 | Director of Harvard Management Company, Inc.3 and Verde, Inc.; Director of Partners HealthCare System, Inc. and Chair of its Investment Committee.4 | ||||||||||||||||||
| W. Nicholas Thorndike c/o GMO Trust 40 Rowes Wharf Boston, MA 02110 DOB: 03/28/1933 | Trustee | Since March 2005. | Director or trustee of various corporations and charitable organizations, including Courier Corporation (a book publisher and manufacturer) (July 1989 – present); Putnam Funds (December 1992 – June 2004); and Providence Journal (a newspaper publisher) (December 1986 – December 2003). | 47 | Director of Courier Corporation (a book publisher and manufacturer); Member of the Investment Committee of Partners HealthCare System, Inc.4 | ||||||||||||||||||
1 Each Trustee is elected to serve during the continued lifetime of the Trust until he/she dies, resigns or is removed, or if sooner, until the next meeting of Shareholders called for the purpose of electing Trustees and until the election and qualification of his/her successor.
3 Harvard Management Company, Inc. is a client of the Manager.
4 Partners HealthCare System, Inc. is a client of the Manager.
32
Principal Officers:
| Name, Address, and DOB | Position(s) Held with Trust | Term of Office5 and Length of Time Served | Principal Occupation(s) During Past Five Years | ||||||||||||
| Scott Eston c/o GMO Trust 40 Rowes Wharf Boston, MA 02110 DOB: 01/20/1956 | President and Chief Executive Officer | President and Chief Executive Officer since October 2002; Chief Financial Officer, November 2006 – February 2007. | Chief Financial Officer, Chief Operating Officer and Member, Grantham, Mayo, Van Otterloo & Co. LLC. | ||||||||||||
| Sheppard N. Burnett c/o GMO Trust 40 Rowes Wharf Boston, MA 02110 DOB: 10/24/1968 | Treasurer and Chief Financial Officer | Chief Financial Officer since March 2007; Treasurer since November 2006; Assistant Treasurer, September 2004 – November 2006. | Fund Administration Staff, Grantham, Mayo, Van Otterloo & Co. LLC (June 2004 – present); Vice President, Director of Tax, Columbia Management Group (2002 – 2004). | ||||||||||||
| Brent C. Arvidson c/o GMO Trust 40 Rowes Wharf Boston, MA 02110 DOB: 06/26/1969 | Assistant Treasurer | Since August 1998. | Senior Fund Administrator, Grantham, Mayo, Van Otterloo & Co. LLC. | ||||||||||||
| John L. Nasrah c/o GMO Trust 40 Rowes Wharf Boston, MA 02110 DOB: 05/27/1977 | Assistant Treasurer | Since March 2007. | Fund Administrator, Grantham, Mayo, Van Otterloo & Co. LLC (September 2004 – present); Tax Analyst, Bain & Company, Inc (June 2003 – September 2004); Senior Tax Associate, PricewaterhouseCoopers LLP (2001 – 2003). | ||||||||||||
| Mahmoodur Rahman c/o GMO Trust 40 Rowes Wharf Boston, MA 02110 DOB: 11/30/1967 | Assistant Treasurer | Since September 2007. | Fund Administrator, Grantham, Mayo, Van Otterloo & Co. (April 2007 – present); Vice President and Senior Tax Manager, Massachusetts Financial Services Company (January 2000 – April 2007). | ||||||||||||
5 Officers are elected to hold such office until their successor is elected and qualified to carry out the duties and responsibilities of their office, or until he or she resigns or is removed from office.
33
Principal Officers — (Continued)
| Name, Address, and DOB | Position(s) Held with Trust | Term of Office5 and Length of Time Served | Principal Occupation(s) During Past Five Years | ||||||||||||
| Michael E. Gillespie c/o GMO Trust 40 Rowes Wharf Boston, MA 02110 DOB: 02/18/1958 | Chief Compliance Officer | Since March 2005. | Vice President of Compliance (June 2004 – February 2005) and Director of Domestic Compliance (March 2002 – June 2004), Fidelity Investments; Vice President and Senior Counsel, State Street Bank and Trust Company (May 1998 – March 2002). | ||||||||||||
| Jason B. Harrison c/o GMO Trust 40 Rowes Wharf Boston, MA 02110 DOB: 01/29/1977 | Vice President and Clerk | Vice President since November 2006; Clerk since March 2006. | Legal Counsel, Grantham, Mayo, Van Otterloo & Co. LLC (since February 2006) and Attorney, Ropes & Gray LLP (September 2002 – February 2006). | ||||||||||||
| David L. Bohan c/o GMO Trust 40 Rowes Wharf Boston, MA 02110 DOB: 06/21/1964 | Vice President and Assistant Clerk | Vice President since March 2005; Assistant Clerk since March 2006. | Legal Counsel, Grantham, Mayo, Van Otterloo & Co. LLC (September 2003 – present); Attorney, Goodwin Procter LLP (September 1996 – September 2003). | ||||||||||||
| Gregory L. Pottle c/o GMO Trust 40 Rowes Wharf Boston, MA 02110 DOB: 07/09/1971 | Vice President and Assistant Clerk | Since November 2006. | Legal Counsel, Grantham, Mayo, Van Otterloo & Co. LLC. | ||||||||||||
| Anne K. Trinque c/o GMO Trust 40 Rowes Wharf Boston, MA 02110 DOB: 04/15/1978 | Vice President and Assistant Clerk | Since September 2007. | Legal Counsel, Grantham, Mayo, Van Otterloo & Co. LLC (since January 2007); Attorney, Goodwin Procter LLP (September 2003 – January 2007). | ||||||||||||
| Cheryl Wakeham c/o GMO Trust 40 Rowes Wharf Boston, MA 02110 DOB: 10/29/1958 | Anti-Money Laundering Officer | Since December 2004. | Manager, Client Service Administration, Grantham, Mayo, Van Otterloo & Co. LLC. | ||||||||||||
5 Officers are elected to hold such office until their successor is elected and qualified to carry out the duties and responsibilities of their office, or until he or she resigns or is removed from office.
34
GMO International Bond Fund
(A Series of GMO Trust)
Annual Report
February 29, 2008
For a free copy of the Fund's proxy voting guidelines, shareholders may call 1-617-346-7646 (collect), visit our website at www.gmo.com, or visit the Securities and Exchange Commission's website at www.sec.gov. Information regarding how the Fund voted proxies relating to portfolio securities during the most recent 12-month period ended June 30 is available on our website at www.gmo.com, or on the Securities and Exchange Commission's website at www.sec.gov.
The Fund files its complete schedule of portfolio holdings with the Securities and Exchange Commission for the first and third quarter of each fiscal year on Form N-Q, which is available on the Commission's website at www.sec.gov. The Fund's Form N-Q may be reviewed and copied at the Commission's Public Reference Room in Washington, D.C. Information on the operation of the Public Reference Room may be obtained by calling 1-800-SEC-0330. The Fund has a policy with respect to disclosure of portfolio holdings under which it may also make available on GMO's website (www.gmo.com) a complete schedule of portfolio holdings.
This report is prepared for the general information of shareholders. It is authorized for distribution to prospective investors only when preceded or accompanied by a prospectus for the GMO Trust.
GMO International Bond Fund
(A Series of GMO Trust)
Portfolio Management
Day-to-day management of the Fund's portfolio is the responsibility of the Fixed Income Division at Grantham, Mayo, Van Otterloo & Co. LLC.
Management Discussion and Analysis of Fund Performance
The GMO International Bond Fund returned +8.1% for the fiscal year ended February 29, 2008, compared to +18.0% for the JPMorgan Non-U.S. Government Bond Index. The Fund's exposure to various issues is achieved directly and indirectly through its investment in certain underlying GMO mutual funds, primarily in the GMO Emerging Country Debt Fund, the GMO World Opportunity Overlay Fund, and the GMO Short-Duration Collateral Fund.
The Fund underperformed the benchmark during the fiscal year by 9.9%. Cash management was the primary contributor to negative performance for the fiscal year, followed by interest-rate strategy, currency selection, and emerging debt exposure losses.
About 65% of the fiscal year's underperformance was due to mark-to-market losses in the cash collateral pools of two funds in which the Fund invests a substantial portion of its total assets: the GMO Short Duration Collateral Fund (SDCF) and the GMO World Opportunity Overlay Fund (WOOF). SDCF and WOOF primarily invest cash in high quality U.S. and foreign floating-rate fixed income securities, mainly asset-backed securities, seeking to earn a LIBOR-type return. The cash positions in SDCF and WOOF collateralize derivatives positions that seek to deliver the return of the benchmark as well as create active exposures in global interest-rate and currency markets.
With the extreme price volatility of AAA-credit quality asset-backed securities during the year, the cash pools in SDCF and WOOF underperformed LIBOR by nearly 700 basis points, directly contributing to the International Bond Fund's underperformance given its 90% exposure to these two funds.
Further Fund underperformance was attributable to interest-rate and currency strategies. For much of the fiscal year, the strategy was overweight Australian, Euro-area, Swedish, Swiss, and Canadian interest-rate markets relative to Japanese, U.K., and U.S. markets. However, the U.S., U.K., and Japanese markets were among the top performers, detracting from performance. Similar results came out of two other cross-sectional models implemented in swaps. Further, the slope and volatility strategies also underperformed, leaving only the U.S. Eurodollar directional strategy and opportunistic trading with positive contributions for the year.
In currencies, the largest negative contributors were underweight positions in euros, yen, and Canadian dollars, as well as an overweight position in Australian dollars. Partially offsetting losses were gains from overweight positions in the Swiss franc, Norwegian krone, and sterling. A major risk aversion episode during the fiscal year, prompted by the turmoil in structured credit markets, persisted for much of the third and fourth quarters. Our choice of a defensive currency during this episode, the Swiss franc, was incorrect, as risk aversion manifested itself in a swift rise in the yen, in which the Fund remained underweight. In addition, a drastic change in the relative volatilities of the currencies in August resulted in a shifting of risk positions into less advantageous, and ultimately unprofitable, intra-European trades.
A relatively minor contribution to negative performance came from the small exposure to emerging debt, where spread widening on the asset class contributed negatively, as did negative contributions from country selection.
The views expressed herein are exclusively those of Grantham, Mayo, Van Otterloo & Co. LLC Management as of the date of this report and are subject to change. GMO disclaims any responsibility to update such views. They are not meant as investment advice.
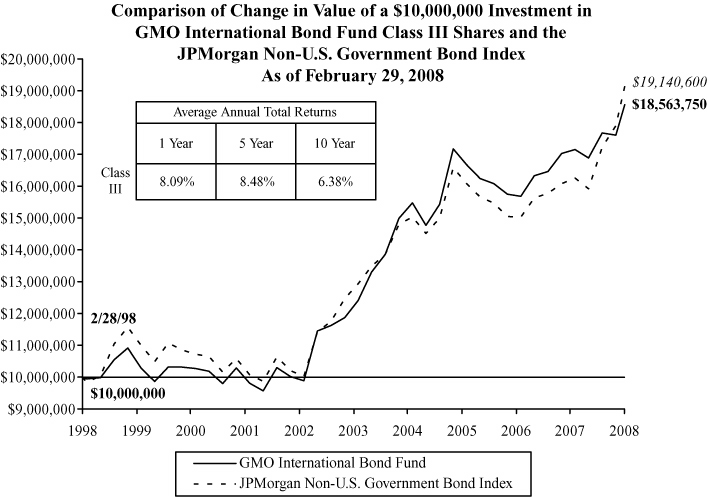
Performance data quoted represents past performance and is not indicative of future results. The investment return and principal value of an investment will fluctuate so that an investor's shares, when redeemed, may be worth more or less than their original cost. Current performance data may be lower or higher than the performance data provided herein. To obtain performance information to the most recent month-end, visit www.gmo.com. Performance shown is net of all fees after reimbursement from the Manager. Returns would have been lower had certain expenses not been reimbursed during the periods shown and do not include the effect of taxes on distributions and redemptions. All information is unaudited.
GMO International Bond Fund
(A Series of GMO Trust)
Investments Concentration Summary
February 29, 2008 (Unaudited)
| Asset Class Summary* | % of Total Net Assets | ||||||
| Debt Obligations | 86.3 | % | |||||
| Short-Term Investments | 9.4 | ||||||
| Forward Currency Contracts | 4.1 | ||||||
| Futures | 1.3 | ||||||
| Options Purchased | 0.3 | ||||||
| Loan Participations | 0.2 | ||||||
| Swaps | 0.1 | ||||||
| Loan Assignments | 0.1 | ||||||
| Rights and Warrants | 0.0 | ||||||
| Promissory Notes | 0.0 | ||||||
| Written Options | (0.1 | ) | |||||
| Reverse Repurchase Agreements | (0.6 | ) | |||||
| Other | (1.1 | ) | |||||
| 100.0 | % | ||||||
| Country / Region Summary** | % of Investments | ||||||
| Euro Region*** | 45.0 | % | |||||
| Japan | 42.2 | ||||||
| Australia | 6.6 | ||||||
| Canada | 6.0 | ||||||
| Emerging | 2.9 | ||||||
| Switzerland | 2.8 | ||||||
| United Kingdom | (0.7 | ) | |||||
| United States | (4.8 | ) | |||||
| 100.0 | % | ||||||
* The table above incorporates aggregate indirect asset class exposure associated with investments in other funds of GMO Trust ("underlying funds").
** The table above incorporates aggregate indirect country exposure associated with investments in the underlying funds. The table excludes short-term investments. The table includes exposure through the use of derivative contracts.
*** The "Euro Region" is comprised of Austria, Belgium, Finland, France, Germany, Greece, Ireland, Italy, Netherlands, Portugal and Spain.
1
GMO International Bond Fund
(A Series of GMO Trust)
Schedule of Investments
(showing percentage of total net assets)
February 29, 2008
| Par Value / Shares | Description | Value ($) | |||||||||||||
| DEBT OBLIGATIONS — 1.0% | |||||||||||||||
| Australia — 0.1% | |||||||||||||||
| Asset-Backed Securities | |||||||||||||||
| USD | 461,608 | Medallion Trust, Series 03-1G, Class A, Variable Rate, 3 mo. LIBOR + .19%, 5.10%, due 12/21/33 | 447,003 | ||||||||||||
| Canada — 0.9% | |||||||||||||||
| Foreign Government Obligations | |||||||||||||||
| CAD | 2,000,000 | Government of Canada (Cayman), 7.25%, due 06/01/08 | 2,049,256 | ||||||||||||
| CAD | 2,000,000 | Province of British Columbia, 7.88%, due 11/30/23 | 2,762,550 | ||||||||||||
| Total Canada | 4,811,806 | ||||||||||||||
| United Kingdom — 0.0% | |||||||||||||||
| Asset-Backed Securities | |||||||||||||||
| GBP | 43,551 | RMAC, Series 03-NS2A, Class A2A, 144A, AMBAC, Variable Rate, 3 mo. GBP LIBOR + .40%, 7.03%, due 09/12/35 | 86,521 | ||||||||||||
| TOTAL DEBT OBLIGATIONS (COST $3,403,557) | 5,345,330 | ||||||||||||||
| MUTUAL FUNDS — 92.8% | |||||||||||||||
| United States — 92.8% | |||||||||||||||
| Affiliated Issuers | |||||||||||||||
| 1,561,790 | GMO Emerging Country Debt Fund, Class III | 15,711,607 | |||||||||||||
| 15,084,980 | GMO Short-Duration Collateral Fund | 362,492,061 | |||||||||||||
| 37,466 | GMO Special Purpose Holding Fund (a) (b) | 47,207 | |||||||||||||
| 3,873,078 | GMO World Opportunity Overlay Fund | 99,460,635 | |||||||||||||
| Total United States | 477,711,510 | ||||||||||||||
| TOTAL MUTUAL FUNDS (COST $501,928,790) | 477,711,510 | ||||||||||||||
See accompanying notes to the financial statements.
2
GMO International Bond Fund
(A Series of GMO Trust)
Schedule of Investments — (Continued)
(showing percentage of total net assets)
February 29, 2008
| Shares / Par Value ($) | Description | Value ($) | |||||||||||||
| SHORT-TERM INVESTMENTS — 1.8% | |||||||||||||||
| Money Market Funds — 0.2% | |||||||||||||||
| 1,100,887 | State Street Institutional Liquid Reserves Fund-Institutional Class | 1,100,887 | |||||||||||||
| Other Short-Term Investments — 1.6% | |||||||||||||||
| 5,000,000 | U.S. Treasury Bill, 1.78%, due 05/01/08 (c) (d) | 4,985,005 | |||||||||||||
| 3,000,000 | U.S. Treasury Bill, 3.04%, due 03/20/08 (c) (d) | 2,993,809 | |||||||||||||
| 7,978,814 | |||||||||||||||
| TOTAL SHORT-TERM INVESTMENTS (COST $9,068,009) | 9,079,701 | ||||||||||||||
| TOTAL INVESTMENTS — 95.6% (Cost $514,400,356) | 492,136,541 | ||||||||||||||
| Other Assets and Liabilities (net) — 4.4% | 22,433,958 | ||||||||||||||
| TOTAL NET ASSETS — 100.0% | $ | 514,570,499 | |||||||||||||
See accompanying notes to the financial statements.
3
GMO International Bond Fund
(A Series of GMO Trust)
Schedule of Investments — (Continued)
February 29, 2008
A summary of outstanding financial instruments at February 29, 2008 is as follows:
Forward Currency Contracts
| Settlement Date | Deliver/ Receive | Units of Currency | Value | Net Unrealized Appreciation (Depreciation) | |||||||||||||||
| Buys | |||||||||||||||||||
| 3/04/08 | AUD | 12,200,000 | $ | 11,364,910 | $ | 581,121 | |||||||||||||
| 3/04/08 | AUD | 4,800,000 | 4,471,440 | 19,656 | |||||||||||||||
| 5/06/08 | AUD | 8,600,000 | 7,946,904 | (137,096 | ) | ||||||||||||||
| 5/06/08 | AUD | 7,600,000 | 7,022,846 | (33,906 | ) | ||||||||||||||
| 3/11/08 | CAD | 5,600,000 | 5,688,791 | 174,663 | |||||||||||||||
| 4/01/08 | CHF | 42,800,000 | 41,103,275 | 1,706,928 | |||||||||||||||
| 4/15/08 | EUR | 188,600,000 | 285,947,829 | 13,420,829 | |||||||||||||||
| 4/15/08 | EUR | 4,100,000 | 6,216,257 | 210,085 | |||||||||||||||
| 3/25/08 | GBP | 14,700,000 | 29,169,504 | 200,864 | |||||||||||||||
| 3/25/08 | GBP | 6,700,000 | 13,294,944 | 204,132 | |||||||||||||||
| 3/25/08 | GBP | 2,900,000 | 5,754,528 | 1,044 | |||||||||||||||
| 4/22/08 | JPY | 20,090,000,000 | 193,946,234 | 7,201,486 | |||||||||||||||
| 4/22/08 | JPY | 710,000,000 | 6,854,247 | 241,353 | |||||||||||||||
| 4/08/08 | NZD | 4,500,000 | 3,578,865 | 80,115 | |||||||||||||||
| 4/08/08 | NZD | 4,500,000 | 3,578,865 | (51,555 | ) | ||||||||||||||
| 4/08/08 | NZD | 8,400,000 | 6,680,547 | (118,245 | ) | ||||||||||||||
| $ | 632,619,986 | $ | 23,701,474 | ||||||||||||||||
| Sales | |||||||||||||||||||
| 3/04/08 | AUD | 8,400,000 | $ | 7,825,020 | $ | (496,188 | ) | ||||||||||||
| 3/04/08 | AUD | 8,600,000 | 8,011,330 | 138,374 | |||||||||||||||
| 3/11/08 | CAD | 6,400,000 | 6,501,476 | 30,003 | |||||||||||||||
| 4/01/08 | CHF | 33,400,000 | 32,075,920 | (1,073,601 | ) | ||||||||||||||
| 4/15/08 | EUR | 12,600,000 | 19,103,620 | (873,940 | ) | ||||||||||||||
| 4/15/08 | EUR | 4,500,000 | 6,822,721 | (21,061 | ) | ||||||||||||||
| 4/08/08 | NZD | 2,200,000 | 1,749,667 | (23,789 | ) | ||||||||||||||
| $ | 82,089,754 | $ | (2,320,202 | ) | |||||||||||||||
See accompanying notes to the financial statements.
4
GMO International Bond Fund
(A Series of GMO Trust)
Schedule of Investments — (Continued)
February 29, 2008
Forward Cross Currency Contracts
| Settlement Date | Deliver/Units of Currency | Receive/In Exchange For | Net Unrealized Appreciation (Depreciation) | ||||||||||||
| 3/18/08 | EUR | 17,700,000 | SEK | 166,412,485 | $ | 112,834 | |||||||||
| 3/18/08 | SEK | 96,019,460 | EUR | 10,200,000 | (84,593 | ) | |||||||||
| 4/29/08 | EUR | 14,700,000 | NOK | 115,938,900 | (134,919 | ) | |||||||||
| 4/29/08 | NOK | 35,502,750 | EUR | 4,500,000 | 39,153 | ||||||||||
| $ | (67,525 | ) | |||||||||||||
Futures Contracts
| Number of Contracts | Type | Expiration Date | Contract Value | Net Unrealized Appreciation (Depreciation) | |||||||||||||||
| Buys | |||||||||||||||||||
| 91 | Australian Government Bond 10 Yr. | March 2008 | $ | 8,327,429 | $ | 9,108 | |||||||||||||
| 251 | Australian Government Bond 3 Yr. | March 2008 | 22,987,045 | 44,093 | |||||||||||||||
| 278 | Canadian Government Bond 10 Yr. | June 2008 | 33,300,686 | 671,182 | |||||||||||||||
| 492 | Euro BOBL | March 2008 | 83,166,898 | 1,310,459 | |||||||||||||||
| 945 | Euro Bund | March 2008 | 167,940,334 | 2,318,686 | |||||||||||||||
| 177 | Japanese Government Bond 10 Yr. (TSE) | March 2008 | 235,914,813 | 3,401,087 | |||||||||||||||
| $ | 551,637,205 | $ | 7,754,615 | ||||||||||||||||
| Sales | |||||||||||||||||||
| 5 | Euro BOBL | March 2008 | $ | 845,192 | $ | (3,879 | ) | ||||||||||||
| 18 | Euro Bund | March 2008 | 3,198,863 | (27,082 | ) | ||||||||||||||
| 860 | Federal Fund 30 day | March 2008 | 348,811,653 | (53,887 | ) | ||||||||||||||
| 21 | U.S. Long Bond (CBT) | June 2008 | 2,491,125 | (56,485 | ) | ||||||||||||||
| 133 | U.S. Treasury Note 10 Yr. | June 2008 | 15,598,406 | (278,772 | ) | ||||||||||||||
| 284 | U.S. Treasury Note 2 Yr. (CBT) | June 2008 | 61,037,813 | (391,148 | ) | ||||||||||||||
| 35 | U.S. Treasury Note 5 Yr. (CBT) | June 2008 | 3,998,750 | (52,611 | ) | ||||||||||||||
| 27 | UK Gilt Long Bond | June 2008 | 5,918,170 | (101,167 | ) | ||||||||||||||
| $ | 441,899,972 | $ | (965,031 | ) | |||||||||||||||
See accompanying notes to the financial statements.
5
GMO International Bond Fund
(A Series of GMO Trust)
Schedule of Investments — (Continued)
February 29, 2008
Swap Agreements
Interest Rate Swaps
| Notional Amount | Expiration Date | Counterparty | Receive (Pay) | Fixed Rate | Variable Rate | Market Value | |||||||||||||||||||||||||
| 20,500,000 | CHF | 3/19/2013 | JP Morgan Chase Bank | Receive | 3.00 | % | 6 month | ||||||||||||||||||||||||
| CHF LIBOR | $ | 135,052 | |||||||||||||||||||||||||||||
| 8,300,000 | AUD | 3/19/2018 | JP Morgan Chase Bank | Receive | 7.07 | % | 6 month AUD BBSW | (104,915 | ) | ||||||||||||||||||||||
| 5,000,000 | EUR | 3/21/2030 | UBS Warburg | Receive | 5.90 | % | 3 month Floating Rate EUR LIBOR | 1,409,729 | |||||||||||||||||||||||
| Premiums to (Pay) Receive | $ | 67,229 | $ | 1,439,866 | |||||||||||||||||||||||||||
As of February 29, 2008, for the futures and/or swap contracts held, the Fund had sufficient cash and/or securities to cover any commitments or margin requirements of the relevant broker or exchange.
Notes to Schedule of Investments:
144A - Securities exempt from registration under Rule 144A of the Securities Act of 1933. These securities may be resold in transactions exempt from registration, normally to qualified institutional investors.
AMBAC - Insured as to the payment of principal and interest by AMBAC Assurance Corporation.
BBSW - Bank Bill Swap Reference Rate
LIBOR - London Interbank Offered Rate
RMAC - Residential Mortgage Acceptance Corp.
Variable rate - The rates shown on variable rate notes are the current interest rates at February 29, 2008, which are subject to change based on the terms of the security.
(a) Security valued at fair value using methods determined in good faith by or at the direction of the Trustees of GMO Trust (Note 2).
(b) Underlying investment represents interests in defaulted securities.
(c) Rate shown represents yield-to-maturity.
(d) All or a portion of this security has been segregated to cover margin requirements on open financial futures contracts and/or collateral on open swap contracts (Note 2).
See accompanying notes to the financial statements.
6
GMO International Bond Fund
(A Series of GMO Trust)
Schedule of Investments — (Continued)
February 29, 2008
Currency Abbreviations:
| AUD - Australian Dollar CAD - Canadian Dollar CHF - Swiss Franc EUR - Euro GBP - B ritish Pound | JPY - Japanese Yen NOK - Norwegian Krone NZD - New Zealand Dollar SEK - Swedish Krona USD - United States Dollar | ||||||
See accompanying notes to the financial statements.
7
GMO International Bond Fund
(A Series of GMO Trust)
Statement of Assets and Liabilities — February 29, 2008
| Assets: | |||||||
| Investments in unaffiliated issuers, at value (cost $12,471,566) (Note 2) | $ | 14,425,031 | |||||
| Investments in affiliated issuers, at value (cost $501,928,790) (Notes 2 and 8) | 477,711,510 | ||||||
| Receivable from broker for closed futures contracts | 29,710 | ||||||
| Receivable for Fund shares sold | 3,051,714 | ||||||
| Interest receivable | 162,164 | ||||||
| Unrealized appreciation on open forward currency contracts (Note 2) | 24,362,640 | ||||||
| Receivable for variation margin on open futures contracts (Note 2) | 2,964,350 | ||||||
| Interest receivable for open swap contracts | 234,388 | ||||||
| Receivable for open swap contracts (Note 2) | 1,544,781 | ||||||
| Receivable for expenses reimbursed by Manager (Note 3) | 36,747 | ||||||
| Other expense reimbursement from Manager (Note 2) | 830,768 | ||||||
| Total assets | 525,353,803 | ||||||
| Liabilities: | |||||||
| Payable for investments purchased | 3,500,000 | ||||||
| Payable for Fund shares repurchased | 3,031,395 | ||||||
| Payable to affiliate for (Note 3): | |||||||
| Management fee | 99,330 | ||||||
| Shareholder service fee | 59,598 | ||||||
| Trustees and Chief Compliance Officer of GMO Trust fees | 533 | ||||||
| Unrealized depreciation on open forward currency contracts (Note 2) | 3,048,893 | ||||||
| Payable for open swap contracts (Note 2) | 104,915 | ||||||
| Accrued expenses | 938,640 | ||||||
| Total liabilities | 10,783,304 | ||||||
| Net assets | $ | 514,570,499 | |||||
| Net assets consist of: | |||||||
| Paid-in capital | $ | 530,664,897 | |||||
| Accumulated undistributed net investment income | 199,241 | ||||||
| Accumulated net realized loss | (23,675,091 | ) | |||||
| Net unrealized appreciation | 7,381,452 | ||||||
| $ | 514,570,499 | ||||||
| Net assets attributable to: | |||||||
| Class III shares | $ | 514,570,499 | |||||
| Shares outstanding: | |||||||
| Class III | 54,082,170 | ||||||
| Net asset value per share: | |||||||
| Class III | $ | 9.51 | |||||
See accompanying notes to the financial statements.
8
GMO International Bond Fund
(A Series of GMO Trust)
Statement of Operations — Year Ended February 29, 2008
| Investment Income: | |||||||
| Dividends from affiliated issuers (Note 8) | $ | 22,359,042 | |||||
| Interest | 1,291,609 | ||||||
| Dividends | 74,313 | ||||||
| Total investment income | 23,724,964 | ||||||
| Expenses: | |||||||
| Management fee (Note 3) | 1,281,046 | ||||||
| Shareholder service fee – Class III (Note 3) | 768,628 | ||||||
| Custodian, fund accounting agent and transfer agent fees | 196,152 | ||||||
| Audit and tax fees | 60,401 | ||||||
| Legal fees | 16,754 | ||||||
| Trustees fees and related expenses (Note 3) | 4,864 | ||||||
| Registration fees | 5,249 | ||||||
| Miscellaneous | 6,590 | ||||||
| Total expenses | 2,339,684 | ||||||
| Fees and expenses reimbursed by Manager (Note 3) | (281,248 | ) | |||||
| Expense reductions (Note 2) | (55,802 | ) | |||||
| Indirectly incurred fees waived or borne by Manager (Note 3) | (68,134 | ) | |||||
| Shareholder service fee waived (Note 3) | (24,238 | ) | |||||
| Net expenses | 1,910,262 | ||||||
| Net investment income (loss) | 21,814,702 | ||||||
| Realized and unrealized gain (loss): | |||||||
| Net realized gain (loss) on: | |||||||
| Investments in unaffiliated issuers | (729,744 | ) | |||||
| Investments in affiliated issuers | (1,179,464 | ) | |||||
| Realized g ains distributions from affiliated issuers (Note 8) | 917,264 | ||||||
| Closed futures contracts | (9,158,287 | ) | |||||
| Closed swap contracts | (1,836,915 | ) | |||||
| Foreign currency, forward contracts and foreign currency related transactions | 24,153,870 | ||||||
| Net realized gain (loss) | 12,166,724 | ||||||
| Change in net unrealized appreciation (depreciation) on: | |||||||
| Investments in unaffiliated issuers | 35,747 | ||||||
| Investments in affiliated issuers | (27,476,505 | ) | |||||
| Open futures contracts | 10,166,157 | ||||||
| Open swap contracts | (269,895 | ) | |||||
| Foreign currency, forward contracts and foreign currency related transactions | 22,507,217 | ||||||
| Net unrealized gain (loss) | 4,962,721 | ||||||
| Net realized and unrealized gain (loss) | 17,129,445 | ||||||
| Net increase (decrease) in net assets resulting from operations | $ | 38,944,147 | |||||
See accompanying notes to the financial statements.
9
GMO International Bond Fund
(A Series of GMO Trust)
Statement of Changes in Net Assets
| Year Ended February 29, 2008 | Year Ended February 28, 2007 | ||||||||||
| Increase (decrease) in net assets: | |||||||||||
| Operations: | |||||||||||
| Net investment income (loss) | $ | 21,814,702 | $ | 18,495,917 | |||||||
| Net realized gain (loss) | 12,166,724 | 20,285,772 | |||||||||
| Change in net unrealized appreciation (depreciation) | 4,962,721 | (3,538,755 | ) | ||||||||
| Net increase (decrease) in net assets from operations | 38,944,147 | 35,242,934 | |||||||||
| Distributions to shareholders from: | |||||||||||
| Net investment income | |||||||||||
| Class III | (48,502,819 | ) | (23,666,074 | ) | |||||||
| Net realized gains | |||||||||||
| Class III | — | (3,983,947 | ) | ||||||||
| (48,502,819 | ) | (27,650,021 | ) | ||||||||
| Net share transactions (Note 7): | |||||||||||
| Class III | 74,650,906 | 19,357,480 | |||||||||
| Total increase (decrease) in net assets | 65,092,234 | 26,950,393 | |||||||||
| Net assets: | |||||||||||
| Beginning of period | 449,478,265 | 422,527,872 | |||||||||
| End of period (including accumulated undistributed net investment income of $199,241 and $7,216,931, respectively) | $ | 514,570,499 | $ | 449,478,265 | |||||||
See accompanying notes to the financial statements.
10
GMO International Bond Fund
(A Series of GMO Trust)
Financial Highlights
(For a Class III share outstanding throughout each period)
| Year Ended February 28/29, | |||||||||||||||||||||||
| 2008 | 2007 | 2006 | 2005 | 2004 | |||||||||||||||||||
| Net asset value, beginning of period | $ | 9.73 | $ | 9.57 | $ | 10.61 | $ | 10.38 | $ | 9.94 | |||||||||||||
| Income (loss) from investment operations: | |||||||||||||||||||||||
| Net investment income (loss)(a)† | 0.41 | 0.41 | 0.21 | 0.17 | 0.20 | ||||||||||||||||||
| Net realized and unrealized gain (loss) | 0.31 | 0.38 | (0.93 | ) | 1.02 | 1.94 | |||||||||||||||||
| Total from investment operations | 0.72 | 0.79 | (0.72 | ) | 1.19 | 2.14 | |||||||||||||||||
| Less distributions to shareholders: | |||||||||||||||||||||||
| From net investment income | (0.94 | ) | (0.54 | ) | (0.31 | ) | (0.91 | ) | (0.71 | ) | |||||||||||||
| From net realized gains | — | (0.09 | ) | (0.01 | ) | (0.05 | ) | (0.99 | ) | ||||||||||||||
| Total distributions | (0.94 | ) | (0.63 | ) | (0.32 | ) | (0.96 | ) | (1.70 | ) | |||||||||||||
| Net asset value, end of period | $ | 9.51 | $ | 9.73 | $ | 9.57 | $ | 10.61 | $ | 10.38 | |||||||||||||
| Total Return(b) | 8.09 | % | 8.32 | % | (6.83 | )% | 11.81 | % | 23.17 | % | |||||||||||||
| Ratios/Supplemental Data: | |||||||||||||||||||||||
| Net assets, end of period (000's) | $ | 514,570 | $ | 449,478 | $ | 422,528 | $ | 438,365 | $ | 271,015 | |||||||||||||
| Net expenses to average daily net assets(c) | 0.38 | %(d) | 0.39 | % | 0.39 | % | 0.39 | % | 0.39 | % | |||||||||||||
| Net investment income to average daily net assets(a) | 4.26 | % | 4.17 | % | 2.13 | % | 1.65 | % | 1.98 | % | |||||||||||||
| Portfolio turnover rate | 51 | % | 32 | % | 36 | % | 51 | % | 26 | % | |||||||||||||
| Fees and expenses reimbursed and/or waived by the Manager to average daily net assets: | 0.07 | % | 0.26 | %†† | 0.08 | % | 0.09 | % | 0.12 | % | |||||||||||||
(a) Net investment income is affected by the timing of the declaration of the dividends by the underlying funds in which the Fund invests.
(b) The total returns would have been lower had certain expenses not been reimbursed and/or waived during the periods shown and assumes the effect of reinvested distributions.
(c) Net expenses exclude expenses incurred indirectly through investment in the underlying funds (See Note 3).
(d) The net expense ratio does not include the effect of expense reductions.
† Calculated using average shares outstanding throughout the period.
†† Includes 0.19% non-recurring Internal Revenue Code Section 860 expense reimbursed by the Manager (Note 2).
See accompanying notes to the financial statements.
11
GMO International Bond Fund
(A Series of GMO Trust)
Notes to Financial Statements
February 29, 2008
1. Organization
GMO International Bond Fund (the "Fund") is a series of GMO Trust (the "Trust"). The Fund is registered under the Investment Company Act of 1940, as amended, as an open-end, non-diversified management investment company. The Fund is advised and managed by Grantham, Mayo, Van Otterloo & Co. LLC (the "Manager" or "GMO"). The Trust was established as a Massachusetts business trust under the laws of the Commonwealth of Massachusetts on June 24, 1985. The Declaration of Trust permits the Trustees of the Trust ("Trustees") to create an unlimited number of series of shares ("Funds") and to subdivide Funds into classes.
The Fund seeks total return in excess of that of the JPMorgan Non-U.S. Government Bond Index. The Fund typically invests in bonds (including synthetic bonds) included in the JPMorgan Non-U.S. Government Bond Index and in securities and instruments with similar characteristics. The Fund seeks additional returns by investing in global interest rate, currency, and emerging country debt markets. The Fund may invest a substantial portion of its total assets in shares of GMO Short-Duration Collateral Fund; in futures contracts, currency options, currency forwards, swap contracts, and other types of derivatives; in investment-grade bonds denominated in various currencies, including foreign and U.S. government securities and asset-backed securities issued by foreign governments and U.S. government agencies (including securities neither guaranteed nor insured by the U.S. government), corporate bonds, and mortgage-backed and other asset-b acked securities issued by private issuers; in shares of GMO World Opportunity Overlay Fund; and up to 5% of the Fund's total assets in sovereign debt of emerging countries (including below investment grade securities), primarily through investment in shares of GMO Emerging Country Debt Fund ("ECDF").
The financial statements of the series of the Trust in which the Fund invests ("underlying funds") should be read in conjunction with the Fund's financial statements. These financial statements are available, upon request, without charge by calling (617) 346-7646 (collect). Shares of the GMO Short-Duration Collateral Fund, the GMO World Opportunity Overlay Fund and the GMO Special Purpose Holding Fund are not publicly available for direct purchase.
2. Significant accounting policies
The following is a summary of significant accounting policies which are in conformity with accounting principles generally accepted in the United States of America ("U.S. GAAP") and which are consistently followed by the Fund in the preparation of its financial statements. The preparation of financial statements in accordance with U.S. GAAP requires management to make estimates and assumptions that affect the reported amounts and disclosures in the financial statements. Actual results could differ from those estimates. The accounting records of the Fund are maintained in U.S. dollars.
12
GMO International Bond Fund
(A Series of GMO Trust)
Notes to Financial Statements — (Continued)
February 29, 2008
Portfolio valuation
Securities listed on a securities exchange for which market quotations are readily available are valued at the last sale price or official closing price on each business day, or if there is no such reported sale or official closing price, at the most recent quoted bid price. Unlisted securities for which market quotations are readily available are generally valued at the most recent quoted bid price. Short-term investments with a remaining maturity of sixty days or less are generally valued at amortized cost, which approximates fair value. Shares of investment funds are valued at their net asset value. Securities for which quotations are not readily available or whose values the Manager has determined to be unreliable are valued at fair value as determined in good faith by the Trustees or other persons acting at their direction pursuant to procedures approved by the Trustees. By its nature, a fair value price is a good faith est imate of the value of a security at a given point in time and may not reflect the value that would be realized if the security was sold and the differences could be material.
Fixed income securities held by the Fund or the underlying funds are typically valued pursuant to prices supplied by a primary pricing source chosen by the Manager. The Manager evaluates such primary pricing sources on an ongoing basis, and may change a pricing source should it deem it appropriate. The Manager, at its discretion, may override a price supplied by a primary source by using a price provided by another source if such action is deemed appropriate. The prices provided by such primary pricing sources may differ from the value that would be realized if the securities were sold and the differences could be material.
Certain securities held by the Fund or the underlying funds are valued on the basis of a price provided by a single source. The prices provided may differ from the value that would be realized if the securities were sold and the differences could be material. As of February 29, 2008, the total value of these securities represented 30.30% of net assets.
The Fund indirectly invests through underlying funds in securities with contractual cash flows, such as asset backed-securities, collateralized mortgage obligations and commercial mortgage backed securities, including securities backed by subprime mortgage loans. The value, liquidity and related income of these securities are sensitive to changes in economic conditions, including real estate values, delinquencies and/or defaults, and may be adversely affected by shifts in the market's perception of the securities' market values and changes in interest rates.
GMO Special Purpose Holding Fund ("SPHF"), an investment of the Fund, has litigation pending against various entities related to the default of certain asset-backed securities previously held by SPHF. For the year ended February 29, 2008, the Fund received $243,003 There were no indexed securities held by the Fund at the end of the period. through SPHF in conjunction with settlement agreements related to the default of those securities.
13
GMO International Bond Fund
(A Series of GMO Trust)
Notes to Financial Statements — (Continued)
February 29, 2008
Foreign currency translation
The market values of foreign securities, currency holdings and other assets and liabilities are translated to U.S. dollars based on the current exchange rates each business day. Income and expenses denominated in foreign currencies are translated at current exchange rates when accrued or incurred. The Fund does not isolate realized and unrealized gains and losses attributable to changes in exchange rates from gains and losses that arise from changes in the market value of investments. Such fluctuations are included with net realized and unrealized gain or loss on investments. Net realized gains and losses on foreign currency transactions represent gains and losses on disposition of currencies and forward currency contracts, currency gains and losses realized between the trade and settlement dates on securities transactions, and the difference between the amount of investment income and foreign withholding taxes recorded on the F und's accounting records and the U.S. dollar equivalent amounts actually received or paid.
Forward currency contracts
The Fund may enter into forward currency contracts including forward cross currency contracts. A forward currency contract is an agreement between two parties to buy and sell a currency at a set price on a future date. The market value of a forward currency contract fluctuates with changes in forward currency exchange rates. Forward currency contracts are marked to market daily using rates supplied by a quotation service and changes in value are recorded by the Fund as an unrealized gain or loss. Realized gains or losses equal to the difference between the value of the contract at the time it was opened and the value at the time it was closed are recorded upon delivery or receipt of the currency or, if a forward currency contract is offset by entering into another forward currency contract with the same broker, upon settlement of the net gain or loss. These contracts may involve market risk in excess of the unrealized gain or lo ss reflected in the Fund's Statement of Assets and Liabilities. In addition, the Fund could be exposed to risk if the counterparties are unable to meet the terms of the contracts or if there are movements in currency values that are unfavorable to the Fund. Forward currency contracts outstanding at the end of the period are listed in the Fund's Schedule of Investments.
Futures contracts
The Fund may purchase and sell futures contracts. Upon entering into a futures contract, the Fund is required to deposit with the futures clearing broker an amount of cash, U.S. government and agency obligations, or other liquid assets in accordance with the initial margin requirements of the broker or exchange. In addition, the Fund maintains cash or securities in an amount that at least equals the net amount payable in the event the Fund must deliver the full amount of the contracts. Futures contracts are marked to market daily and an appropriate payable or receivable for the change in value ("variation margin") is recorded by the Fund. The payable or receivable is liquidated on the following business day. Gains or losses are recognized but not considered realized until the contracts expire or are closed. Futures contracts involve, to varying degrees, risk of loss in excess of the variation margin disclosed in the Statement of Assets and Liabilities. Under certain circumstances, futures exchanges may establish daily limits on the amount that the price of a futures contract can vary from the previous day's settlement price, thereby effectively preventing liquidation of unfavorable positions. Losses may arise from changes in the
14
GMO International Bond Fund
(A Series of GMO Trust)
Notes to Financial Statements — (Continued)
February 29, 2008
value of the underlying instrument if the Fund is unable to liquidate a futures position due to an illiquid secondary market for the contracts or the imposition of price limits, or if counterparties do not perform under the contract terms. Futures contracts are generally valued at the settlement price established each day by the board of trade or exchange on which they are traded. Futures contracts outstanding at the end of the period are listed in the Fund's Schedule of Investments.
Options
The Fund may write call and put options. Writing options increases the Fund's exposure to the underlying instrument by, in the case of a call option, obligating the Fund to sell the underlying instrument at a set price to the option-holder and, in the case of a put option, obligating the Fund to purchase the underlying instrument at a set price from the option-holder. When the Fund writes a call or put option, an amount equal to the premium received is recorded as a liability and subsequently marked to market to reflect the current value of the option written. Premiums received from writing options which expire are treated as realized gains. Premiums received from writing options which are exercised or closed are added to the proceeds or offset against the amounts paid on the underlying future, security or currency transaction to determine the realized gain or loss. The Fund as a writer of an option has no control over whether t he underlying future, security or currency may be sold (call) or purchased (put) and as a result bears the market risk of an unfavorable change in the price of the future, security or currency underlying the written option. In the event that the Fund writes uncovered call options (i.e. options for investments that the Fund does not own), it bears the risk of incurring substantial losses if the price of the underlying instrument increases during the term of the option. There is the risk the Fund may not be able to enter into a closing transaction because of an illiquid market. There were no open written option contracts during the period.
The Fund may also purchase put and call options. Purchasing options alters the Fund's exposure to the underlying instrument by, in the case of a call option, entitling the Fund to purchase the underlying instrument at a set price from the writer of the option and, in the case of a put option, entitling the Fund to sell the underlying instrument at a set price to the writer of the option. The Fund pays a premium as a cost for a purchased option disclosed in the Schedule of Investments which is subsequently marked to market to reflect the current value of the option. Premiums paid for purchasing options which expire are treated as realized losses. Premiums paid for purchasing options which are exercised or closed are added to the amounts paid or offset against the proceeds on the closing transaction to determine the realized gain or loss. The risk associated with purchasing put and call options is limited to the premium paid. Ther e were no purchased option contracts outstanding at the end of the period.
Exchange traded options are valued at the last sale price, or if no sale is reported, the last bid price for purchased options and the last ask price for written options. Options traded over-the-counter are valued using prices supplied by a primary pricing source chosen by the Manager.
15
GMO International Bond Fund
(A Series of GMO Trust)
Notes to Financial Statements — (Continued)
February 29, 2008
Indexed securities
The Fund may invest in indexed securities where the redemption values and/or coupons are linked to the prices of a specific instrument or financial statistic. The Fund uses indexed securities to increase or decrease its exposure to different underlying instruments and to gain exposure to markets in which it may be difficult to invest through conventional securities. Indexed securities may be more volatile than their underlying instruments, but any loss is limited to the amount of the original investment. There were no indexed securities held by the Fund at the end of the period.
Swap agreements
The Fund may enter into swap agreements. A swap is an agreement to exchange the return generated by one instrument for the return generated by another instrument. Interest rate swap agreements involve the exchange by one party with another party of their respective commitments to pay or receive interest, e.g., an exchange of floating rate payments for fixed rate payments with respect to a notional amount of principal. Total return swap agreements involve a commitment by one party in the agreement to pay interest in exchange for a market-linked return, both based on notional amounts. To the extent the total return of the security or index underlying the transaction exceeds or falls short of the offsetting interest rate obligation, the party will receive a payment from or make a payment to the counterparty, respectively. Forward spread lock swap agreements involve commitments to pay or receive a settlement amount calculated as the difference between the swap spread and a fixed spread, multiplied by the notional amount times the duration of the swap rate. The swap spread is the difference between the benchmark swap rate (market rate) and the specific treasury rate. In a credit default swap, one party makes a stream of payments to another party in exchange for the right to receive a specified return in the event of a default by a third party on its obligation. Credit default swaps may be used to provide a measure of protection against defaults of sovereign or corporate issuers (i.e., to reduce risk where a party owns or has exposure to the issuer) or to take an active long or short position with respect to the likelihood of a particular issuer's default. Variance swap agreements involve commitments to pay or receive a settlement amount calculated as the difference between the annualized realized variance of returns on the underlying price and a fixed quantity, also known as the variance strike, over a period of time. In connection with these agreements, cash or securities may be set aside as collateral by the Fund's custodian or brokers in accordance with the terms of the swap agreement. The Fund earns or pays interest on cash set aside as collateral.
Swaps are marked to market daily using models that incorporate quotations from market makers and the change in value, if any, is recorded as unrealized gain or loss in the Statement of Operations. Payments received or made on swap contracts are recorded as realized gain or loss in the Statement of Operations. Gains or losses are realized upon early termination of the swap agreements. These financial instruments are not actively traded on financial markets. The values assigned to these instruments are based upon the best available information and because of the uncertainty of the valuation, these values may differ significantly from the values that would have been realized had a ready market for these instruments existed, and the differences could be material. Entering into these agreements involves, to varying degrees, elements of credit, legal, market and documentation risk in excess of the amounts recognized in the
16
GMO International Bond Fund
(A Series of GMO Trust)
Notes to Financial Statements — (Continued)
February 29, 2008
Statement of Assets and Liabilities. Such risks involve the possibility that there will be no liquid market for these agreements, that the counterparties to the agreements may default on their obligations to perform or disagree as to the meaning of contractual terms in the agreements, or that there may be unfavorable changes in interest rates or the price of the index or security underlying these transactions. Swap agreements outstanding at the end of the period are listed in the Fund's Schedule of Investments.
Repurchase agreements
The Fund may enter into repurchase agreements with banks and broker-dealers whereby the Fund acquires a security for cash and obtains a simultaneous commitment from the seller to repurchase the security at an agreed upon price and date. The Fund, through its custodian, takes possession of securities collateralizing the repurchase agreement. The collateral is marked to market daily to ensure that the market value of the underlying assets remains sufficient to protect the Fund in the event of default by the seller. Collateral for certain tri-party repurchase agreements is held at the counterparty's custodian in a segregated account for the benefit of the Fund and the counterparty. In connection with transactions in repurchase agreements, if the seller defaults or enters into insolvency proceedings and the value of the collateral declines, recovery of cash by the Fund may be delayed or limited. There were no repurchase agreements o utstanding at the end of the period.
Reverse repurchase agreements
The Fund may enter into reverse repurchase agreements with banks and broker-dealers whereby the Fund sells portfolio assets concurrent with an agreement by the Fund to repurchase the same assets at a later date at a fixed price. In connection with these agreements, the Fund establishes segregated accounts with its custodian in which the Fund maintains cash, U.S. government securities or other assets equal in value to its obligations in respect of reverse repurchase agreements. Reverse repurchase agreements involve the risk that the market value of the securities the Fund has sold under the agreement may decline below the price at which the Fund is obligated to repurchase under the agreement. The market value of the securities the Fund has sold is determined daily and any additional required collateral is allocated to or sent by the Fund on the next business day. There were no reverse repurchase agreements outstanding at the end of the period.
Securities lending
The Fund may lend its securities to certain qualified broker-dealers. The loans are collateralized with cash or liquid securities with a market value at least equal to the market value of the securities on loan. As with other extensions of credit, the Fund may bear the risk of loss with respect to the investment of the collateral, the risk of delay in and/or inability to exercise its rights with respect to the collateral, and the risk of delay in recovery or loss of rights in the loaned securities should the borrower of the securities fail financially. If a loan is collateralized by U.S. government securities, the Fund receives a fee from the borrower. If a loan is collateralized by cash, the Fund typically invests the cash collateral for its own account in interest-bearing, short-term securities and pays a fee to the borrower that normally represents a portion of the Fund's earnings on the collateral. For the year ended Februar y 29, 2008, the Fund did not participate in securities lending.
17
GMO International Bond Fund
(A Series of GMO Trust)
Notes to Financial Statements — (Continued)
February 29, 2008
Taxes and distributions
The Fund intends to qualify each tax year as a regulated investment company under Subchapter M of the Internal Revenue Code of 1986, as amended (the "Code"). The Fund intends to distribute substantially all of its net investment income and net realized short-term and long-term capital gains, if any, after giving effect to any available capital loss carryovers for U.S. federal income tax purposes. Therefore, no provision for U.S. federal income or excise tax is necessary. Taxes on foreign interest and dividend income are generally withheld in accordance with the applicable country's tax treaty with the United States.
The Fund's policy is to declare and pay distributions from net investment income, if any, semiannually, and from net realized short-term and long-term capital gains, if any, at least annually. All distributions are paid in shares of the Fund, at net asset value, unless the shareholder elects to receive cash distributions. Distributions to shareholders are recorded by the Fund on the ex-dividend date.
Income and capital gain distributions are determined in accordance with U.S. federal income tax regulations, which may differ from U.S. GAAP. Certain capital accounts in the financial statements are periodically adjusted for permanent differences in order to reflect their tax character. These adjustments have no impact on net assets or net asset value per share. Temporary differences which arise from recognizing certain items of income, expense, gain or loss in different periods for financial statement and tax purposes will reverse at some time in the future. Distributions in excess of net investment income or net realized gains are temporary over distributions for financial statement purposes resulting from differences in the recognition or classification of income or distributions for financial statement and tax purposes.
U.S. GAAP and tax accounting differences primarily relate to capital loss carryforwards, derivative contract transactions, foreign currency transactions, losses on wash sale transactions, partnership interest tax allocations and post-October capital losses.
The following reclassification represents the amount necessary to report the stated components of net assets on a tax basis, excluding certain temporary differences, as of February 29, 2008. The financial highlights exclude these adjustments.
| Accumulated Undistributed Net Investment Income | Accumulated Net Realized Loss | Paid-in Capital | |||||||||
| $ | 19,670,427 | $ | (19,760,026 | ) | $ | 89,599 | |||||
18
GMO International Bond Fund
(A Series of GMO Trust)
Notes to Financial Statements — (Continued)
February 29, 2008
The tax character of distributions declared to shareholders is as follows:
| 2/29/2008 | 2/28/2007 | ||||||||||
| Ordinary income (including any short-term capital gains) | $ | 48,502,819 | $ | 26,029,938 | |||||||
| Long-term capital gains | — | 1,620,083 | |||||||||
| Total distributions | $ | 48,502,819 | $ | 27,650,021 | |||||||
Distributions in excess of tax basis earnings and profits, if significant, are reported in the financial statements as a tax return of capital.
As of February 29, 2008, the components of distributable earnings on a tax basis consisted of the following:
| Undistributed ordinary income | $ | 37,517,170 | |||||
As of February 29, 2008, the Fund elected to defer to March 1, 2008 post-October capital losses of $4,962,396.
As of February 29, 2008, the Fund had capital loss carryforwards available to offset future realized gains if any, to the extent permitted by the Code. Utilization of the capital loss carryforwards could be subject to limitations imposed by the Code related to share ownership activity. Such losses expire as follows:
| 2/28/2015 | $ | (23,687,952 | ) | ||||
| 2/29/2016 | (507,910 | ) | |||||
| Total | $ | (24,195,862 | ) | ||||
As of February 29, 2008, the approximate cost for U.S. federal income tax purposes and gross and net unrealized appreciation and depreciation in value of investments were as follows:
| Aggregate Cost | Gross Unrealized Appreciation | Gross Unrealized (Depreciation) | Net Unrealized Appreciation (Depreciation) | ||||||||||||
| $ | 527,487,902 | $ | 2,015,276 | $ | (37,366,637 | ) | $ | (35,351,361 | ) | ||||||
On October 12, 2006, the Fund paid a dividend under Code Section 860 of $0.09229 per share to shareholders of record as of October 11, 2006. It is anticipated the Fund will be required to make a payment, estimated to be, $830,768 to the Internal Revenue Service ("IRS") related to such dividend, which has been included in accrued expenses on the Statement of Assets and Liabilities. The Manager will make a reimbursement payment to the Fund concurrent with the Fund's payment to the IRS.
19
GMO International Bond Fund
(A Series of GMO Trust)
Notes to Financial Statements — (Continued)
February 29, 2008
Security transactions and related investment income
Security transactions are accounted for on trade date. Dividend income, net of applicable foreign withholding taxes, if any, is recorded on the ex-dividend date, or when the Fund is informed of the ex-dividend date, if later. Interest income is recorded on the accrual basis and is adjusted for the amortization of premiums and accretion of discounts. Interest income on inflation indexed securities, if any, is accrued daily based upon an inflation adjusted principal. Additionally, any increase or decrease in the principal or face amount of the securities adjusted for inflation is recorded as interest income or loss. Income is not recognized on securities for which collection is not expected. Non-cash dividends, if any, are recorded at the fair market value of the securities received. In determining the net gain or loss on securities sold, the cost of securities is determined on the identified cost basis.
Expenses
The majority of expenses of the Trust are directly identifiable to an individual fund. Expenses which are not readily identifiable to a specific fund are allocated taking into consideration, among other things, the nature and type of expense and the relative size of the funds. In addition, the Fund will also incur certain fees and expenses indirectly as a shareholder in the underlying funds. Because the underlying funds have varied expense and fee levels and the Fund may own different proportions of the underlying funds at different times, the amount of fees and expenses indirectly incurred by the Fund will vary (See Note 3).
State Street Bank and Trust Company ("State Street") serves as custodian, fund accounting agent and transfer agent of the Fund. State Street's fee may be reduced by credits that are an earnings allowance calculated on the average daily cash balances the Fund maintains with State Street. Credit balances used to reduce the fee paid to State Street, if any, are reported as a reduction of expenses in the Statement of Operations.
Investment risks
There are certain additional risks involved in investing in foreign securities that are not inherent in investments in domestic securities. These risks may involve adverse political and economic developments, including the possible imposition of capital controls or other foreign governmental laws or restrictions. In addition, the securities of some foreign companies and securities markets are less liquid and at times may be more volatile than securities of comparable U.S. companies and U.S. securities markets. The risks described above apply to an even greater extent to investments in emerging markets. The securities markets of emerging countries are generally smaller, less developed, less liquid, and more volatile than the securities markets of the U.S. and developed foreign markets.
Recently issued accounting pronouncements
In June 2006, the Financial Accounting Standards Board ("FASB") issued FASB Interpretation No. 48, Accounting for Uncertainty in Income Taxes – an Interpretation of FASB Statement No. 109 ("FIN 48"). FIN 48 clarifies the accounting for uncertainty in income taxes recognized in accordance with FASB Statement No. 109, Accounting for Income Taxes. FIN 48 prescribes a recognition threshold and measurement attribute for a tax position taken or expected to be taken in the tax return that could impact
20
GMO International Bond Fund
(A Series of GMO Trust)
Notes to Financial Statements — (Continued)
February 29, 2008
the Fund's financial statements. It also provides guidance in relation to the Fund's financial statements on classification of tax benefits or liabilities, interest and penalties, accounting in interim periods, disclosure, and transition. FIN 48 is effective for fiscal years beginning after December 15, 2006 for registered investment companies. Management has evaluated the effects of applying the various provisions of FIN 48 and has determined that the adoption of FIN 48 does not have a material effect on the Fund's financial statements. The Fund's federal tax returns for the prior three fiscal years, if applicable, remain subject to examination by the Internal Revenue Service. Management will continue to monitor the rules and guidance pertaining to FIN 48 and will take action if appropriate.
In September 2006, the FASB issued Statement of Financial Accounting Standards No. 157 ("FAS 157"), "Fair Value Measurements." FAS 157 defines fair value, establishes a framework for measuring fair value in accordance with generally accepted accounting principles and expands disclosure about fair value measurements. FAS 157 is effective for fiscal years beginning after November 15, 2007. Management is currently evaluating the impact the adoption of FAS 157 will have on the Fund's financial statement disclosures.
3. Fees and other transactions with affiliates
GMO earns a management fee paid monthly at the annual rate of 0.25% of average daily net assets. The Fund has adopted a Shareholder Service Plan under which the Fund pays GMO a shareholder service fee for client and shareholder service, reporting, and other support. Pursuant to the Shareholder Service Plan, the shareholder service fee is calculated based on average daily net assets at the annual rate of 0.15% for Class III shares. The Manager will waive the Fund's shareholder service fee to the extent that the aggregate of any direct and indirect shareholder service fees borne by the Fund exceeds 0.15%; provided, however, that the amount of this waiver will not exceed 0.15%.
The Manager has contractually agreed to reimburse the Fund for Fund expenses through at least June 30, 2008 to the extent the Fund's total annual operating expenses (excluding shareholder service fees, expenses indirectly incurred by investment in the underlying funds, fees and expenses of the independent Trustees of the Trust, fees and expenses for legal services not approved by the Manager for the Trust, compensation and expenses of the Trust's Chief Compliance Officer ("CCO") (excluding any employee benefits), brokerage commissions, securities lending fees and expenses, interest expense, transfer taxes, and other investment-related costs (including expenses associated with investments in any company that is an investment company or would be an investment company under the 1940 Act, but for the exceptions to the definition of investment company provided in Section 3(c)(1) and 3(c)(7) of the 1940 Act), hedging transaction fees, extraordinary, non-recurring and certain other unusual expenses (including taxes) (collectively, "Excluded Fund Fees and Expenses")) exceed 0.25% of the Fund's average daily net assets. In addition, the Manager has contractually agreed to reimburse the Fund through at least June 30, 2008 to the extent that the sum of (a) the Fund's total annual operating expenses (excluding Excluded Fund Fees and Expenses) and (b) the amount of fees and expenses incurred indirectly by the Fund through its investment in ECDF (excluding ECDF's Excluded Fund Fees and Expenses), exceeds 0.25% of the Fund's
21
GMO International Bond Fund
(A Series of GMO Trust)
Notes to Financial Statements — (Continued)
February 29, 2008
average daily net assets, subject to a maximum total reimbursement to the Fund equal to 0.25% of the Fund's average daily net assets.
The Fund incurs fees and expenses indirectly as a shareholder in the underlying funds. For the year ended February 29, 2008, these indirect fees and expenses expressed as an annualized percentage of the Fund's average daily net assets were as follows:
| Indirect Net Expenses (excluding shareholder service fees and interest expense) | Indirect Shareholder Service Fees | Indirect Interest Expense | Total Indirect Expenses | ||||||||||||
| 0.015 | % | 0.004 | % | 0.038 | % | 0.057 | % | ||||||||
The Fund's portion of the fees paid by the Trust to the independent Trustees and CCO during the year ended February 29, 2008 was $4,221 and $2,170, respectively. The compensation and expenses of the CCO are included in miscellaneous expenses in the Statement of Operations. No remuneration was paid by the Fund to any other officer of the Trust.
4. Purchases and sales of securities
For the year ended February 29, 2008, cost of purchases and proceeds from sales of investments, other than short-term obligations and class exchanges, were as follows:
| Purchases | Sales | ||||||||||
| U.S. Government securities | $ | — | $ | 12,768,620 | |||||||
| Investments (non-U.S. Government securities) | 319,892,589 | 240,676,553 | |||||||||
5. Guarantees
In the normal course of business the Fund enters into contracts with third-party service providers that contain a variety of representations and warranties and which provide general indemnifications. The Fund's maximum exposure under these arrangements is unknown, as this would involve future claims that may be made against the Fund that have not yet occurred. Based on experience, management is of the view that the risk of loss in connection with these potential indemnification obligations is remote; however, there can be no assurance that material liabilities related to such obligations will not arise in the future that could adversely impact the Fund.
22
GMO International Bond Fund
(A Series of GMO Trust)
Notes to Financial Statements — (Continued)
February 29, 2008
6. Principal shareholders and related parties
As of February 29, 2008, 55.82% of the outstanding shares of the Fund were held by four shareholders, each holding in excess of 10% of the Fund's outstanding shares. No other shareholder owned in excess of 10% of the outstanding shares of the Fund. Investment activities of these shareholders may have a material effect on the Fund.
As of February 29, 2008, 1.37% of the Fund's shares were held by sixteen related parties comprised of certain GMO employee accounts, and 57.30% of the Fund's shares were held by accounts for which the Manager has investment discretion.
7. Share transactions
The Declaration of Trust permits the Trustees to issue an unlimited number of shares of beneficial interest (without par value). Transactions in Fund shares were as follows:
| Year Ended February 29, 2008 | Year Ended February 28, 2007 | ||||||||||||||||||
| Class III: | Shares | Amount | Shares | Amount | |||||||||||||||
| Shares sold | 17,938,459 | $ | 170,818,174 | 8,919,195 | $ | 87,630,458 | |||||||||||||
| Shares issued to shareholders in reinvestment of distributions | 5,136,298 | 46,494,576 | 2,731,073 | 26,403,882 | |||||||||||||||
| Shares repurchased | (15,192,711 | ) | (142,661,844 | ) | (9,612,832 | ) | (94,676,860 | ) | |||||||||||
| Net increase (decrease) | 7,882,046 | $ | 74,650,906 | 2,037,436 | $ | 19,357,480 | |||||||||||||
23
GMO International Bond Fund
(A Series of GMO Trust)
Notes to Financial Statements — (Continued)
February 29, 2008
8. Investments in affiliated issuers
A summary of the Fund's transactions in the securities of affiliated issuers during the year ended February 29, 2008 is set forth below:
| Affiliate | Value, beginning of period | Purchases | Sales Proceeds | Dividend Income | Distributions of Realized Gains | Value, end of period | |||||||||||||||||||||
| GMO Emerging Country Debt Fund, Class III | $ | 14,983,428 | $ | 4,441,758 | $ | 2,600,000 | $ | 1,167,497 | $ | 674,261 | $ | 15,711,607 | |||||||||||||||
| GMO Short-Duration Collateral Fund | 316,596,798 | 264,691,545 | 192,700,000 | 21,191,545 | — | 362,492,061 | |||||||||||||||||||||
| GMO Special Purpose Holding Fund | 52,827 | — | — | — | 243,003 | 47,207 | |||||||||||||||||||||
| GMO World Opportunity Overlay Fund | 90,176,123 | 50,550,000 | 39,825,000 | — | — | 99,460,635 | |||||||||||||||||||||
| Totals | $ | 421,809,176 | $ | 319,683,303 | $ | 235,125,000 | $ | 22,359,042 | $ | 917,264 | $ | 477,711,510 | |||||||||||||||
24
Report of Independent Registered Public Accounting Firm
To the Trustees of GMO Trust and the Shareholders of
GMO International Bond Fund
In our opinion, the accompanying statement of assets and liabilities, including the schedule of investments, and the related statements of operations and of changes in net assets and the financial highlights present fairly, in all material respects, the financial position of GMO International Bond Fund (the "Fund") at February 29, 2008, the results of its operations for the year then ended, the changes in its net assets for each of the two years in the period then ended and the financial highlights for each of the five years in the period then ended, in conformity with accounting principles generally accepted in the United States of America. These financial statements and financial highlights (hereafter referred to as "financial statements") are the responsibility of the Fund's management; our responsibility is to express an opinion on these financial statements based on our audits. We conducted our audits of these financial sta tements in accordance with the standards of the Public Company Accounting Oversight Board (United States). Those standards require that we plan and perform the audit to obtain reasonable assurance about whether the financial statements are free of material misstatement. An audit includes examining, on a test basis, evidence supporting the amounts and disclosures in the financial statements, assessing the accounting principles used and significant estimates made by management, and evaluating the overall financial statement presentation. We believe that our audits, which included confirmation of securities at February 29, 2008 by correspondence with the custodian and brokers, provide a reasonable basis for our opinion.
PricewaterhouseCoopers LLP
Boston, Massachusetts
April 29, 2008
25
GMO International Bond Fund
(A Series of GMO Trust)
Fund Expenses
February 29, 2008 (Unaudited)
Expense Examples: The following information is in relation to expenses for the six month period ended February 29, 2008.
As a shareholder of the Fund, you may incur two types of costs: (1) transaction costs, and (2) ongoing costs, including management fees, shareholder service fees, and other Fund expenses. This example is intended to help you understand your ongoing costs (in dollars) of investing in the Fund and to compare these costs with the ongoing costs of investing in other mutual funds.
These examples are based on an investment of $1,000 invested at the beginning of the period and held for the entire period, September 1, 2007 through February 29, 2008.
Actual Expenses
The first line of the table below provides information about actual account values and actual expenses. You may use the information in this line, together with the amount you invested, to estimate the expenses that you paid over the period. Simply divide your account value by $1,000 (for example, a $10,000,000 account value divided by $1,000 = 10,000), then multiply the result by the number in the first line under the heading entitled "Net Expense Incurred" to estimate the expenses you paid on your account during this period.
Hypothetical Example for Comparison Purposes
The second line of the table below provides information about hypothetical account values and hypothetical expenses based on the Fund's actual expense ratio and an assumed rate of return of 5% per year before expenses, which is not the Fund's actual return. The hypothetical account values and expenses may not be used to estimate the actual ending account balance or expenses you paid for the period. You may use this information to compare the ongoing costs of investing in the Fund with other funds. To do so, compare this 5% hypothetical example with the 5% hypothetical examples that appear in the shareholder reports of other funds.
Please note that the expenses shown in the table are meant to highlight your ongoing costs only and do not reflect any transactional costs. Therefore, the second line of the table is useful in comparing ongoing costs only, and will not help you determine the relative total costs of owning different funds. In addition, if these transactional costs were included, your costs would have been higher.
| Annualized Net Expense Ratio | Beginning Account Value | Ending Account Value | Net Expense Incurred* | ||||||||||||||||
| Class III | |||||||||||||||||||
| 1) Actual | 0.43 | % | $ | 1,000.00 | $ | 1,074.80 | $ | 2.22 | |||||||||||
| 2) Hypothetical | 0.43 | % | $ | 1,000.00 | $ | 1,022.73 | $ | 2.16 | |||||||||||
* Expenses are calculated using the Class's annualized net expense ratio (including indirect expenses incurred) for the six months ended February 29, 2008, multiplied by the average account value over the period, multiplied by 182 days in the period, divided by 366 days in the year.
26
GMO International Bond Fund
(A Series of GMO Trust)
Tax Information for the Tax Year Ended February 29, 2008 (Unaudited)
The Fund will notify shareholders of amounts for use in preparing 2008 income tax forms in January 2009.
The Fund hereby designates as qualified interest income with respect to its taxable year ended February 29, 2008, $12,222,860 or if determined to be different, the qualified interest income of such year.
27
Trustees and Officers (Unaudited)
The following tables list the Trust's Trustees and Officers as of the date of this report; their address and date of birth ("DOB"); their position with the Trust; the length of time holding that position with the Trust; their principal occupation(s) during the past five years; the number of portfolios in the fund complex they oversee; and other directorships they hold in companies subject to registration or reporting requirements of the Securities Exchange Act of 1934 (generally called "public companies") or in registered investment companies. The Trust's Statement of Additional Information ("SAI") includes additional information about the Trust's trustees, including changes subsequent to the date of the report. The SAI is available, without charge, upon request by writing GMO, c/o GMO Trust, 40 Rowes Wharf, Boston, MA 02110.
Independent Trustees:
| Name, Address, and DOB | Position(s) Held with Trust | Term of Office1 and Length of Time Served | Principal Occupation(s) During Past Five Years | Number of Portfolios in Fund Complex Overseen by Trustee | Other Directorships Held by Trustee | ||||||||||||||||||
| Donald W. Glazer, Esq. c/o GMO Trust 40 Rowes Wharf Boston, MA 02110 DOB: 07/26/1944 | Chairman of the Board of Trustees | Chairman of the Board of Trustees since March 2005; Lead Independent Trustee (September 2004 – March 2005); Trustee since December 2000. | Consultant – Law and Business2; Vice Chair (since 2002) and Secretary, Provant, Inc. (provider of personnel performance improvement services and training products); Author of Legal Treatises. | 47 | None. | ||||||||||||||||||
1 Each Trustee is elected to serve during the continued lifetime of the Trust until he/she dies, resigns or is removed, or if sooner, until the next meeting of Shareholders called for the purpose of electing Trustees and until the election and qualification of his/her successor.
2 As part of Mr. Glazer's work as a consultant, he provides part-time consulting services to Goodwin Procter LLP ("Goodwin"). Goodwin has provided legal services to Renewable Resources, LLC, an affiliate of GMO; GMO, in connection with its relationship with Renewable Resources; and funds managed by Renewable Resources. Mr. Glazer has represented that he has no financial interest in, and is not involved in the provision of, such legal services. In the calendar years ended December 31, 2006 and December 31, 2007, these entities paid $825,738 and $291,721 respectively, in legal fees and disbursements to Goodwin.
28
Independent Trustees — (Continued)
| Name, Address, and DOB | Position(s) Held with Trust | Term of Office1 and Length of Time Served | Principal Occupation(s) During Past Five Years | Number of Portfolios in Fund Complex Overseen by Trustee | Other Directorships Held by Trustee | ||||||||||||||||||
| Jay O. Light c/o GMO Trust 40 Rowes Wharf Boston, MA 02110 DOB: 10/03/1941 | Trustee | Since May 1996. | Dean (since April 2006), Acting Dean (August 2005 – April 2006), Senior Associate Dean (1998 – 2005), and Professor of Business Administration, Harvard Business School. | 47 | Director of Harvard Management Company, Inc.3 and Verde, Inc.; Director of Partners HealthCare System, Inc. and Chair of its Investment Committee.4 | ||||||||||||||||||
| W. Nicholas Thorndike c/o GMO Trust 40 Rowes Wharf Boston, MA 02110 DOB: 03/28/1933 | Trustee | Since March 2005. | Director or trustee of various corporations and charitable organizations, including Courier Corporation (a book publisher and manufacturer) (July 1989 – present); Putnam Funds (December 1992 – June 2004); and Providence Journal (a newspaper publisher) (December 1986 – December 2003). | 47 | Director of Courier Corporation (a book publisher and manufacturer); Member of the Investment Committee of Partners HealthCare System, Inc.4 | ||||||||||||||||||
1 Each Trustee is elected to serve during the continued lifetime of the Trust until he/she dies, resigns or is removed, or if sooner, until the next meeting of Shareholders called for the purpose of electing Trustees and until the election and qualification of his/her successor.
3 Harvard Management Company, Inc. is a client of the Manager.
4 Partners HealthCare System, Inc. is a client of the Manager.
29
Principal Officers:
| Name, Address, and DOB | Position(s) Held with Trust | Term of Office5 and Length of Time Served | Principal Occupation(s) During Past Five Years | ||||||||||||
| Scott Eston c/o GMO Trust 40 Rowes Wharf Boston, MA 02110 DOB: 01/20/1956 | President and Chief Executive Officer | President and Chief Executive Officer since October 2002; Chief Financial Officer, November 2006 – February 2007. | Chief Financial Officer, Chief Operating Officer and Member, Grantham, Mayo, Van Otterloo & Co. LLC. | ||||||||||||
| Sheppard N. Burnett c/o GMO Trust 40 Rowes Wharf Boston, MA 02110 DOB: 10/24/1968 | Treasurer and Chief Financial Officer | Chief Financial Officer since March 2007; Treasurer since November 2006; Assistant Treasurer, September 2004 – November 2006. | Fund Administration Staff, Grantham, Mayo, Van Otterloo & Co. LLC (June 2004 – present); Vice President, Director of Tax, Columbia Management Group (2002 – 2004). | ||||||||||||
| Brent C. Arvidson c/o GMO Trust 40 Rowes Wharf Boston, MA 02110 DOB: 06/26/1969 | Assistant Treasurer | Since August 1998. | Senior Fund Administrator, Grantham, Mayo, Van Otterloo & Co. LLC. | ||||||||||||
| John L. Nasrah c/o GMO Trust 40 Rowes Wharf Boston, MA 02110 DOB: 05/27/1977 | Assistant Treasurer | Since March 2007. | Fund Administrator, Grantham, Mayo, Van Otterloo & Co. LLC (September 2004 – present); Tax Analyst, Bain & Company, Inc (June 2003 – September 2004); Senior Tax Associate, PricewaterhouseCoopers LLP (2001 – 2003). | ||||||||||||
| Mahmoodur Rahman c/o GMO Trust 40 Rowes Wharf Boston, MA 02110 DOB: 11/30/1967 | Assistant Treasurer | Since September 2007. | Fund Administrator, Grantham, Mayo, Van Otterloo & Co. (April 2007 – present); Vice President and Senior Tax Manager, Massachusetts Financial Services Company (January 2000 – April 2007). | ||||||||||||
5 Officers are elected to hold such office until their successor is elected and qualified to carry out the duties and responsibilities of their office, or until he or she resigns or is removed from office.
30
Principal Officers — (Continued)
| Name, Address, and DOB | Position(s) Held with Trust | Term of Office5 and Length of Time Served | Principal Occupation(s) During Past Five Years | ||||||||||||
| Michael E. Gillespie c/o GMO Trust 40 Rowes Wharf Boston, MA 02110 DOB: 02/18/1958 | Chief Compliance Officer | Since March 2005. | Vice President of Compliance (June 2004 – February 2005) and Director of Domestic Compliance (March 2002 – June 2004), Fidelity Investments; Vice President and Senior Counsel, State Street Bank and Trust Company (May 1998 – March 2002). | ||||||||||||
| Jason B. Harrison c/o GMO Trust 40 Rowes Wharf Boston, MA 02110 DOB: 01/29/1977 | Vice President and Clerk | Vice President since November 2006; Clerk since March 2006. | Legal Counsel, Grantham, Mayo, Van Otterloo & Co. LLC (since February 2006) and Attorney, Ropes & Gray LLP (September 2002 – February 2006). | ||||||||||||
| David L. Bohan c/o GMO Trust 40 Rowes Wharf Boston, MA 02110 DOB: 06/21/1964 | Vice President and Assistant Clerk | Vice President since March 2005; Assistant Clerk since March 2006. | Legal Counsel, Grantham, Mayo, Van Otterloo & Co. LLC (September 2003 – present); Attorney, Goodwin Procter LLP (September 1996 – September 2003). | ||||||||||||
| Gregory L. Pottle c/o GMO Trust 40 Rowes Wharf Boston, MA 02110 DOB: 07/09/1971 | Vice President and Assistant Clerk | Since November 2006. | Legal Counsel, Grantham, Mayo, Van Otterloo & Co. LLC. | ||||||||||||
| Anne K. Trinque c/o GMO Trust 40 Rowes Wharf Boston, MA 02110 DOB: 04/15/1978 | Vice President and Assistant Clerk | Since September 2007. | Legal Counsel, Grantham, Mayo, Van Otterloo & Co. LLC (since January 2007); Attorney, Goodwin Procter LLP (September 2003 – January 2007). | ||||||||||||
| Cheryl Wakeham c/o GMO Trust 40 Rowes Wharf Boston, MA 02110 DOB: 10/29/1958 | Anti-Money Laundering Officer | Since December 2004. | Manager, Client Service Administration, Grantham, Mayo, Van Otterloo & Co. LLC. | ||||||||||||
5 Officers are elected to hold such office until their successor is elected and qualified to carry out the duties and responsibilities of their office, or until he or she resigns or is removed from office.
31
GMO Benchmark-Free Allocation Fund
(A Series of GMO Trust)
Annual Report
February 29, 2008
For a free copy of the Fund's proxy voting guidelines, shareholders may call 1-617-346-7646 (collect), visit our website at www.gmo.com, or visit the Securities and Exchange Commission's website at www.sec.gov. Information regarding how the Fund voted proxies relating to portfolio securities during the most recent 12-month period ended June 30 is available on our website at www.gmo.com, or on the Securities and Exchange Commission's website at www.sec.gov.
The Fund files its complete schedule of portfolio holdings with the Securities and Exchange Commission for the first and third quarter of each fiscal year on Form N-Q, which is available on the Commission's website at www.sec.gov. The Fund's Form N-Q may be reviewed and copied at the Commission's Public Reference Room in Washington, D.C. Information on the operation of the Public Reference Room may be obtained by calling 1-800-SEC-0330. The Fund has a policy with respect to disclosure of portfolio holdings under which it may also make available on GMO's website (www.gmo.com) a complete schedule of portfolio holdings.
This report is prepared for the general information of shareholders. It is authorized for distribution to prospective investors only when preceded or accompanied by a prospectus for the GMO Trust.
GMO Benchmark-Free Allocation Fund
(A Series of GMO Trust)
Portfolio Management
Day-to-day management of the Fund's portfolio is the responsibility of the Asset Allocation Team at Grantham, Mayo, Van Otterloo & Co. LLC.
Management Discussion and Analysis of Fund Performance
The GMO Benchmark-Free Allocation Fund returned +8.6% for the fiscal year ended February 29, 2008, as compared to +4.2% for the CPI Index. During the period, the Fund was exposed to a range of asset classes through its investment in underlying GMO mutual funds.
Implementation was negative, detracting approximately 2.7%, as several of the underlying GMO mutual funds underperformed their respective benchmarks. The GMO Inflation Index Plus Bond, GMO Strategic Fixed Income, and GMO Emerging Markets Funds were the primary drivers of the underperformance.
Asset allocation contributed 7.1%. The Fund's overweight to emerging equities, exposure to inflation-indexed bonds, and U.S. high quality equities drove much of the outperformance.
The views expressed herein are exclusively those of Grantham, Mayo, Van Otterloo & Co. LLC Management as of the date of this report and are subject to change. GMO disclaims any responsibility to update such views. They are not meant as investment advice.
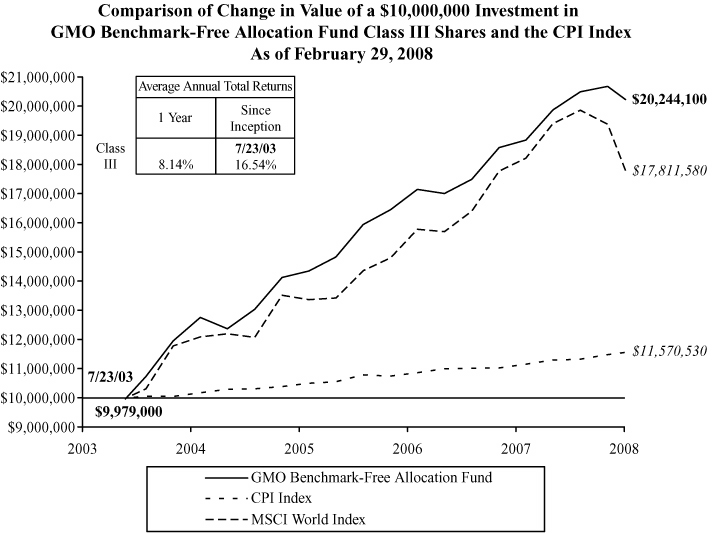
Performance data quoted represents past performance and is not indicative of future results. The investment return and principal value of an investment will fluctuate so that an investor's shares, when redeemed, may be worth more or less than their original cost. Current performance data may be lower or higher than the performance data provided herein. To obtain performance information to the most recent month-end, visit www.gmo.com. Performance shown is net of all fees after reimbursement from the Manager. Each performance figure assumes a purchase at the beginning and redemption at the end of the stated period and reflects a transaction fee of .21% on the purchase and .21% on the redemption. Transaction fees are retained by the Fund to cover trading costs. Returns would have been lower had certain expenses not been reimbursed during the periods shown and do not include the effect of taxes on distributions and redemptions. All information is unaudited.
GMO Benchmark-Free Allocation Fund
(A Series of GMO Trust)
Investments Concentration Summary
February 29, 2008 (Unaudited)
| Asset Class Summary* | % of Total Net Assets | ||||||
| Common Stocks | 51.9 | % | |||||
| Debt Obligations | 31.0 | ||||||
| Cash and Cash Equivalents | 23.9 | ||||||
| Short-Term Investments | 11.0 | ||||||
| Preferred Stocks | 2.8 | ||||||
| Options Purchased | 0.1 | ||||||
| Private Equity Securities | 0.1 | ||||||
| Loan Participations | 0.1 | ||||||
| Investment Funds | 0.1 | ||||||
| Loan Assignments | 0.0 | ||||||
| Rights and Warrants | 0.0 | ||||||
| Promissory Notes | 0.0 | ||||||
| Convertible Securities | 0.0 | ||||||
| Written Options | (0.0 | ) | |||||
| Forward Currency Contracts | (0.1 | ) | |||||
| Reverse Repurchase Agreements | (0.5 | ) | |||||
| Swaps | (7.6 | ) | |||||
| Futures | (14.7 | ) | |||||
| Other | 1.9 | ||||||
| 100.0 | % | ||||||
* The table above incorporates aggregate indirect asset class exposure associated with investments in other funds of GMO Trust ("underlying funds").
1
GMO Benchmark-Free Allocation Fund
(A Series of GMO Trust)
Investments Concentration Summary — (Continued)
February 29, 2008 (Unaudited)
| Country/Region Summary** | % of Investments | ||||||
| United States | 82.0 | % | |||||
| Brazil | 5.4 | ||||||
| Korea | 4.5 | ||||||
| Taiwan | 3.8 | ||||||
| China | 2.3 | ||||||
| Russia | 2.3 | ||||||
| Thailand | 1.6 | ||||||
| India | 1.3 | ||||||
| Malaysia | 1.2 | ||||||
| Turkey | 0.9 | ||||||
| Philippines | 0.6 | ||||||
| Indonesia | 0.4 | ||||||
| Mexico | 0.4 | ||||||
| South Africa | 0.4 | ||||||
| Israel | 0.3 | ||||||
| Argentina | 0.1 | ||||||
| Colombia | 0.1 | ||||||
| Hungary | 0.1 | ||||||
| Poland | 0.1 | ||||||
| Ukraine | 0.1 | ||||||
| Uruguay | 0.1 | ||||||
| Venezuela | 0.1 | ||||||
| Hong Kong | (0.3 | ) | |||||
| Sweden | (0.3 | ) | |||||
| Japan | (2.2 | ) | |||||
| United Kingdom | (2.3 | ) | |||||
| Euro Region*** | (3.0 | ) | |||||
| 100.0 | % | ||||||
** The table above incorporates aggregate indirect country exposure associated with investments in the underlying funds except for GMO Alpha Only Fund. The table excludes short-term investments. The table includes exposure through the use of derivative contracts.
*** The "Euro Region" is comprised of Austria, Belgium, Finland, France, Germany, Greece, Ireland, Italy, Netherlands, Portugal and Spain.
2
GMO Benchmark-Free Allocation Fund
(A Series of GMO Trust)
Schedule of Investments
(showing percentage of total net assets)
February 29, 2008
| Shares/ Par Value ($) | Description | Value ($) | |||||||||||||
| MUTUAL FUNDS — 100.0% | |||||||||||||||
| Affiliated Issuers — 100.0% | |||||||||||||||
| 36,636,846 | GMO Alpha Only Fund, Class IV | 407,035,363 | |||||||||||||
| 751,593 | GMO Alternative Asset Opportunity Fund | 24,885,255 | |||||||||||||
| 3,275,266 | GMO Emerging Country Debt Fund, Class IV | 32,949,175 | |||||||||||||
| 13,997,219 | GMO Emerging Markets Fund, Class VI | 285,823,205 | |||||||||||||
| 3,784,670 | GMO Special Situations Fund, Class VI | 80,727,015 | |||||||||||||
| 20,736,062 | GMO Strategic Fixed Income Fund, Class VI | 488,748,982 | |||||||||||||
| 234 | GMO U.S. Core Equity Fund, Class VI | 2,807 | |||||||||||||
| 14,093,568 | GMO U.S. Quality Equity Fund, Class VI | 289,904,690 | |||||||||||||
| TOTAL MUTUAL FUNDS (COST $1,614,790,659) | 1,610,076,492 | ||||||||||||||
| SHORT-TERM INVESTMENTS — 0.0% | |||||||||||||||
| 37,276 | Eurodollar Time Deposit, 2.00%, due 03/03/08 | 37,276 | |||||||||||||
| TOTAL SHORT-TERM INVESTMENTS (COST $37,276) | 37,276 | ||||||||||||||
| TOTAL INVESTMENTS — 100.0% (Cost $1,614,827,935) | 1,610,113,768 | ||||||||||||||
| Other Assets and Liabilities (net) — (0.0%) | (47,536 | ) | |||||||||||||
| TOTAL NET ASSETS — 100.0% | $ | 1,610,066,232 | |||||||||||||
Notes to Schedule of Investments:
As of February 29, 2008, 21.78% of the Net Assets of the Fund, through investments in the underlying funds, were valued using fair value prices based on models used by a third party vendor (Note 2).
See accompanying notes to the financial statements.
3
GMO Benchmark-Free Allocation Fund
(A Series of GMO Trust)
Statement of Assets and Liabilities — February 29, 2008
| Assets: | |||||||
| Investments in unaffiliated issuers, at value (cost $37,276) (Note 2) | $ | 37,276 | |||||
| Investments in affiliated issuers, at value (cost $1,614,790,659) (Notes 2 and 8) | 1,610,076,492 | ||||||
| Receivable for investments sold | 344,317 | ||||||
| Receivable for Fund shares sold | 5,683 | ||||||
| Receivable for expenses reimbursed by Manager (Note 3) | 18,502 | ||||||
| Total assets | 1,610,482,270 | ||||||
| Liabilities: | |||||||
| Payable for Fund shares repurchased | 350,000 | ||||||
| Payable to affiliate for (Note 3): | |||||||
| Trustees and Chief Compliance Officer of GMO Trust fees | 1,784 | ||||||
| Accrued expenses | 64,254 | ||||||
| Total liabilities | 416,038 | ||||||
| Net assets | $ | 1,610,066,232 | |||||
| Net assets consist of: | |||||||
| Paid-in capital | $ | 1,585,231,071 | |||||
| Accumulated undistributed net investment income | 5,684,233 | ||||||
| Accumulated net realized gain | 23,865,095 | ||||||
| Net unrealized depreciation | (4,714,167 | ) | |||||
| $ | 1,610,066,232 | ||||||
| Net assets attributable to: | |||||||
| Class III shares | $ | 1,610,066,232 | |||||
| Shares outstanding: | |||||||
| Class III | 63,637,308 | ||||||
| Net asset value per share: | |||||||
| Class III | $ | 25.30 | |||||
See accompanying notes to the financial statements.
4
GMO Benchmark-Free Allocation Fund
(A Series of GMO Trust)
Statement of Operations — Year Ended February 29, 2008
| Investment Income: | |||||||
| Dividends from affiliated issuers (Note 8) | $ | 62,952,316 | |||||
| Interest | 1,149 | ||||||
| Total investment income | 62,953,465 | ||||||
| Expenses: | |||||||
| Custodian, fund accounting agent and transfer agent fees | 46,153 | ||||||
| Audit and tax fees | 34,086 | ||||||
| Legal fees | 30,032 | ||||||
| Trustees fees and related expenses (Note 3) | 14,092 | ||||||
| Registration fees | 11,397 | ||||||
| Miscellaneous | 12,891 | ||||||
| Total expenses | 148,651 | ||||||
| Fees and expenses reimbursed by Manager (Note 3) | (128,249 | ) | |||||
| Expense reductions (Note 2) | (2 | ) | |||||
| Net expenses | 20,400 | ||||||
| Net investment income (loss) | 62,933,065 | ||||||
| Realized and unrealized gain (loss): | |||||||
| Net realized gain (loss) on: | |||||||
| Investments in affiliated issuers | 60,938,373 | ||||||
| Realized gains distributions from affiliated issuers (Note 8) | 84,609,250 | ||||||
| Net realized gain (loss) | 145,547,623 | ||||||
| Change in net unrealized appreciation (depreciation) on: | |||||||
| Investments in affiliated issuers | (101,039,835 | ) | |||||
| Net realized and unrealized gain (loss) | 44,507,788 | ||||||
| Net increase (decrease) in net assets resulting from operations | $ | 107,440,853 | |||||
See accompanying notes to the financial statements.
5
GMO Benchmark-Free Allocation Fund
(A Series of GMO Trust)
Statement of Changes in Net Assets
| Year Ended February 29, 2008 | Year Ended February 28, 2007 | ||||||||||
| Increase (decrease) in net assets: | |||||||||||
| Operations: | |||||||||||
| Net investment income (loss) | $ | 62,933,065 | $ | 36,545,339 | |||||||
| Net realized gain (loss) | 145,547,623 | 88,320,293 | |||||||||
| Change in net unrealized appreciation (depreciation) | (101,039,835 | ) | (12,988,280 | ) | |||||||
| Net increase (decrease) in net assets from operations | 107,440,853 | 111,877,352 | |||||||||
| Distributions to shareholders from: | |||||||||||
| Net investment income | |||||||||||
| Class III | (64,024,461 | ) | (52,951,501 | ) | |||||||
| Net realized gains | |||||||||||
| Class III | (155,574,713 | ) | (93,632,773 | ) | |||||||
| (219,599,174 | ) | (146,584,274 | ) | ||||||||
| Net share transactions (Note 7): | |||||||||||
| Class III | 425,678,284 | 123,416,222 | |||||||||
| Purchase premiums and redemption fees (Notes 2 and 7): | |||||||||||
| Class III | 149,820 | 62,428 | |||||||||
| Total increase (decrease) in net assets resulting from net share transactions, purchase premiums and redemption fees | 425,828,104 | 123,478,650 | |||||||||
| Total increase (decrease) in net assets | 313,669,783 | 88,771,728 | |||||||||
| Net assets: | |||||||||||
| Beginning of period | 1,296,396,449 | 1,207,624,721 | |||||||||
| End of period (including accumulated undistributed net investment income of $5,684,233 and distributions in excess of net investment income of $2,817,336, respectively) | $ | 1,610,066,232 | $ | 1,296,396,449 | |||||||
See accompanying notes to the financial statements.
6
GMO Benchmark-Free Allocation Fund
(A Series of GMO Trust)
Financial Highlights
(For a Class III share outstanding throughout each period)
| Year Ended February 28/29, | |||||||||||||||||||||||
| 2008 | 2007 | 2006 | 2005 | 2004(a) | |||||||||||||||||||
| Net asset value, beginning of period | $ | 26.92 | $ | 27.76 | $ | 26.50 | $ | 24.28 | $ | 20.00 | |||||||||||||
| Income (loss) from investment operations: | |||||||||||||||||||||||
| Net investment income (loss)(b) | 1.19 | † | 0.80 | † | 1.26 | † | 0.98 | † | 0.61 | ||||||||||||||
| Net realized and unrealized gain (loss) | 1.18 | 1.63 | 2.93 | 3.00 | 4.53 | ||||||||||||||||||
| Total from investment operations | 2.37 | 2.43 | 4.19 | 3.98 | 5.14 | ||||||||||||||||||
| Less distributions to shareholders: | |||||||||||||||||||||||
| From net investment income | (1.12 | ) | (1.16 | ) | (1.51 | ) | (0.99 | ) | (0.75 | ) | |||||||||||||
| From net realized gains | (2.87 | ) | (2.11 | ) | (1.42 | ) | (0.77 | ) | (0.11 | ) | |||||||||||||
| Total distributions | (3.99 | ) | (3.27 | ) | (2.93 | ) | (1.76 | ) | (0.86 | ) | |||||||||||||
| Net asset value, end of period | $ | 25.30 | $ | 26.92 | $ | 27.76 | $ | 26.50 | $ | 24.28 | |||||||||||||
| Total Return(c) | 8.60 | % | 9.31 | % | 16.50 | % | 16.74 | % | 25.92 | %** | |||||||||||||
| Ratios/Supplemental Data: | |||||||||||||||||||||||
| Net assets, end of period (000's) | $ | 1,610,066 | $ | 1,296,396 | $ | 1,207,625 | $ | 1,068,099 | $ | 287,490 | |||||||||||||
| Net expenses to average daily net assets(d)(e) | 0.00 | %(f) | 0.00 | % | 0.00 | % | 0.00 | % | 0.00 | %* | |||||||||||||
| Net investment income to average daily net assets(b) | 4.30 | % | 2.94 | % | 4.64 | % | 3.92 | % | 5.05 | %* | |||||||||||||
| Portfolio turnover rate | 57 | % | 45 | % | 47 | % | 50 | % | 24 | %** | |||||||||||||
| Fees and expenses reimbursed and/or waived by the Manager to average daily net assets: | 0.01 | % | 0.01 | % | 0.01 | % | 0.02 | % | 0.07 | %* | |||||||||||||
| Purchase premiums and redemption fees consisted of the following per share amounts:† | $ | 0.00 | (g) | $ | 0.00 | (g) | $ | 0.00 | (g) | $ | 0.07 | $ | 0.13 | ||||||||||
(a) Period from July 23, 2003 (commencement of operations) through February 29, 2004.
(b) Net investment income is affected by the timing of the declaration of dividends by the underlying funds in which the Fund invests.
(c) The total returns would have been lower had certain expenses not been reimbursed and/or waived during the periods shown and assumes the effect of reinvested distributions. Calculation excludes purchase premiums and redemption fees which are borne by the shareholders.
(d) Net expenses exclude expenses incurred indirectly through investment in the underlying funds (See Note 3).
(e) Net expenses to average daily net assets were less than 0.01%.
(f) The net expense ratio does not include the effect of expense reductions.
(g) Purchase premiums and redemptions fees were less than $0.01 per share.
† Calculated using average shares outstanding throughout the period.
* Annualized.
** Not annualized.
See accompanying notes to the financial statements.
7
GMO Benchmark-Free Allocation Fund
(A Series of GMO Trust)
Notes to Financial Statements
February 29, 2008
1. Organization
GMO Benchmark-Free Allocation Fund (the "Fund") is a series of GMO Trust (the "Trust"). The Fund is registered under the Investment Company Act of 1940, as amended, as an open-end, diversified management investment company. The Fund is advised and managed by Grantham, Mayo, Van Otterloo & Co. LLC (the "Manager" or "GMO"). The Trust was established as a Massachusetts business trust under the laws of the Commonwealth of Massachusetts on June 24, 1985. The Declaration of Trust permits the Trustees of the Trust ("Trustees") to create an unlimited number of series of shares ("Funds") and to subdivide Funds into classes.
The Fund seeks a positive total return. The Fund does not seek to control risk relative to a particular securities market index or benchmark. In addition, the Fund does not seek to outperform a particular securities market index or blend of market indices (i.e., the Fund seeks positive return, not relative return). The Fund is a fund of funds and invests in shares of other GMO Funds ("underlying funds"), which may include the GMO International Equity Funds (including one or more of the GMO Emerging Markets Funds), the GMO U.S. Equity Funds, the GMO Fixed Income Funds, GMO Alpha Only Fund, GMO Special Situations Fund and GMO Alternative Asset Opportunity Fund. The Fund is not restricted in its exposure to any particular asset class, and at times may be substantially invested in underlying funds that primarily invest in a single asset class. In addition, the Fund is not restricted in its exposure to any particular market.
The financial statements of the underlying funds should be read in conjunction with the Fund's financial statements. These financial statements are available, without charge, upon request by calling (617) 346-7646 (collect). Shares of GMO Special Situations Fund are not publicly available for direct purchase.
The Fund currently limits subscriptions due to capacity considerations.
2. Significant accounting policies
The following is a summary of significant accounting policies which are in conformity with accounting principles generally accepted in the United States of America ("U.S. GAAP") and which are consistently followed by the Fund in the preparation of its financial statements. The preparation of financial statements in accordance with U.S. GAAP requires management to make estimates and assumptions that affect the reported amounts and disclosures in the financial statements. Actual results could differ from those estimates. The accounting records of the Fund are maintained in U.S. dollars.
Portfolio valuation
Shares of the underlying funds and other mutual funds are valued at their net asset value.
8
GMO Benchmark-Free Allocation Fund
(A Series of GMO Trust)
Notes to Financial Statements — (Continued)
February 29, 2008
Investments held by the underlying funds are valued as follows. Securities listed on a securities exchange for which market quotations are readily available are valued at the last sale price or official closing price on each business day, or if there is no such reported sale or official closing price, at the most recent quoted bid price. Unlisted securities for which market quotations are readily available are generally valued at the most recent quoted bid price. Short-term investments with a remaining maturity of sixty days or less are generally valued at amortized cost, which approximates fair value. Securities for which quotations are not readily available or whose values the Manager has determined to be unreliable are valued at fair value as determined in good faith by the Trustees or other persons acting at their direction pursuant to procedures approved by the Trustees. By its nature, a fair value price is a good faith est imate of the value of a security at a given point in time and may not reflect the value that would be realized if the security was sold and the differences could be material. Because many foreign equity securities markets and exchanges close prior to the close of the New York Stock Exchange ("NYSE"), closing prices for foreign securities in those markets or on those exchanges do not reflect the events that occur after that close but before the close of the NYSE. As a result, foreign equity securities are generally valued using fair value prices supplied by a third party vendor based on models to the extent that these fair value prices are available.
Fixed income securities held by the Fund or the underlying funds are typically valued pursuant to prices supplied by a primary pricing source chosen by the Manager. The Manager evaluates such primary pricing sources on an ongoing basis, and may change a pricing source should it deem it appropriate. The Manager, at its discretion, may override a price supplied by a primary source by using a price provided by another source if such action is deemed appropriate. The prices provided by such primary pricing sources may differ from the value that would be realized if the securities were sold and the differences could be material.
Certain securities held by the Fund or the underlying funds are valued on the basis of a price provided by a single source. The prices provided may differ from the value that would be realized if the securities were sold and the differences could be material. As of February 29, 2008, the total value of these securities represented 10.57% of net assets.
The Fund indirectly invests through underlying funds in securities with contractual cash flows, such as asset-backed securities, collateralized mortgage obligations and commercial mortgage backed securities, including securities backed by subprime mortgage loans. The value, liquidity and related income of these securities are sensitive to changes in economic conditions, including real estate values, delinquencies and/or defaults, and may be adversely affected by shifts in the market's perception of the securities' market values and changes in interest rates.
Repurchase agreements
The Fund may enter into repurchase agreements with banks and broker-dealers whereby the Fund acquires a security for cash and obtains a simultaneous commitment from the seller to repurchase the security at an agreed upon price and date. The Fund, through its custodian, takes possession of securities collateralizing the repurchase agreement. The collateral is marked to market daily to ensure that the market value of the
9
GMO Benchmark-Free Allocation Fund
(A Series of GMO Trust)
Notes to Financial Statements — (Continued)
February 29, 2008
underlying assets remains sufficient to protect the Fund in the event of default by the seller. Collateral for certain tri-party repurchase agreements is held at the counterparty's custodian in a segregated account for the benefit of the Fund and the counterparty. In connection with transactions in repurchase agreements, if the seller defaults or enters into insolvency proceedings and the value of the collateral declines, recovery of cash by the Fund may be delayed or limited. There were no repurchase agreements outstanding at the end of the period.
Taxes and distributions
The Fund intends to qualify each tax year as a regulated investment company under Subchapter M of the Internal Revenue Code of 1986, as amended (the "Code"). The Fund intends to distribute substantially all of its net investment income and net realized short-term and long-term capital gains, if any, after giving effect to any available capital loss carryovers for U.S. federal income tax purposes. Therefore, no provision for U.S. federal income or excise tax is necessary.
The Fund's policy is to declare and pay distributions from net investment income, if any, semiannually, and from net realized short-term and long-term capital gains, if any, at least annually. All distributions are paid in shares of the Fund, at net asset value, unless the shareholder elects to receive cash distributions. Distributions to shareholders are recorded by the Fund on the ex-dividend date.
Income and capital gain distributions are determined in accordance with U.S. federal income tax regulations, which may differ from U.S. GAAP. Certain capital accounts in the financial statements are periodically adjusted for permanent differences in order to reflect their tax character. These adjustments have no impact on net assets or net asset value per share. Temporary differences which arise from recognizing certain items of income, expense, gain or loss in different periods for financial statement and tax purposes will reverse at some time in the future. Distributions in excess of net investment income or net realized gains are temporary over distributions for financial statement purposes resulting from differences in the recognition or classification of income or distributions for financial statement and tax purposes.
U.S. GAAP and tax accounting differences primarily relate to differing treatment of mutual fund distributions received, losses on wash sale transactions and partnership interest tax allocations.
The following reclassification represents the amount necessary to report the stated components of net assets on a tax basis, excluding certain temporary differences, as of February 29, 2008. The financial highlights exclude these adjustments.
| Accumulated Undistributed Net Investment Income | Accumulated Net Realized Gain | Paid-in Capital | |||||||||
| $ | 9,592,965 | $ | (9,592,965 | ) | $ | — | |||||
10
GMO Benchmark-Free Allocation Fund
(A Series of GMO Trust)
Notes to Financial Statements — (Continued)
February 29, 2008
The tax character of distributions declared to shareholders is as follows:
| 2/29/2008 | 2/28/2007 | ||||||||||
| Ordinary income (including any short-term capital gains) | $ | 64,214,608 | $ | 52,995,026 | |||||||
| Long-term capital gains | 155,384,566 | 93,589,248 | |||||||||
| Total distributions | $ | 219,599,174 | $ | 146,584,274 | |||||||
Distributions in excess of tax basis earnings and profits, if significant, are reported in the financial statements as a tax return of capital.
As of February 29, 2008, the components of distributable earnings on a tax basis consisted of the following:
| Undistributed ordinary income | $ | 19,902,507 | |||||
| Undistributed long-term capital gain | $ | 19,678,942 | |||||
As of February 29, 2008, the approximate cost for U.S. federal income tax purposes and gross and net unrealized appreciation and depreciation in value of investments were as follows:
| Aggregate Cost | Gross Unrealized Appreciation | Gross Unrealized (Depreciation) | Net Unrealized Appreciation (Depreciation) | ||||||||||||
| $ | 1,624,860,056 | $ | 28,340,863 | $ | (43,087,151 | ) | $ | (14,746,288 | ) | ||||||
Security transactions and related investment income
Security transactions are accounted for on trade date. Income dividends and capital gain distributions from the underlying funds are recorded on the ex-dividend date. Interest income is recorded on the accrual basis. Non-cash dividends, if any, are recorded at the fair market value of the securities received. In determining the net gain or loss on securities sold, the cost of securities is determined on the identified cost basis.
Expenses
The majority of expenses of the Trust are directly identifiable to an individual fund. Expenses which are not readily identifiable to a specific fund are allocated taking into consideration, among other things, the nature and type of expense and the relative size of the funds. In addition, the Fund will also incur certain fees and expenses indirectly as a shareholder in the underlying funds. Because the underlying funds have varied expense and fee levels and the Fund may own different proportions of the underlying funds at different times, the amount of fees and expenses indirectly incurred by the Fund will vary (See Note 3).
11
GMO Benchmark-Free Allocation Fund
(A Series of GMO Trust)
Notes to Financial Statements — (Continued)
February 29, 2008
State Street Bank and Trust Company ("State Street") serves as custodian, fund accounting agent and transfer agent of the Fund. State Street's fee may be reduced by credits that are an earnings allowance calculated on the average daily cash balances the Fund maintains with State Street. Credit balances used to reduce the fee paid to State Street, if any, are reported as a reduction of expenses in the Statement of Operations.
Purchase and redemption of Fund shares
As of February 29, 2008, the premium on cash purchases and fee on cash redemptions of Fund shares were 0.21% and 0.21%, of the amount invested or redeemed, respectively. The Fund's purchase premium and redemption fee are approximately equal to the weighted average of the purchase premiums and redemptions fees, if any, of the underlying funds in which the Fund was invested as of June 30, 2007. The level of purchase premium and redemption fee for the Fund may be adjusted to account for changes in the Fund's investments (i.e., changes in the percentage of Fund assets allocated to each underlying fund). If the Manager determines that any portion of a cash purchase or redemption is offset by a corresponding cash redemption or purchase occurring on the same day, it will waive the purchase premium or redemption fee in an amount approximately equal to the fee with respect to that portion. In addition, the purchase premium or redemption fee charged by the Fund may be waived in extraordinary circumstances if the Fund will not incur transaction costs. All purchase premiums and redemption fees are paid to and recorded by the Fund as paid-in capital. The Manager will waive the purchase premium relating to the in-kind portion of a purchase transaction except to the extent of certain estimated or known transaction costs (e.g. stamp duties and transfer taxes) incurred by the Fund in connection with the transfer of the purchasing shareholder's securities to the Fund. In-kind redemption transactions are generally not subject to redemption fees except to the extent those transactions include a cash component. However, when a substantial portion of a Fund is being redeemed, the Fund may assess estimated or known transaction costs. There is no premium for reinvested distributions.
Investment risks
The Fund is subject to the investment risks associated with an investment in the underlying funds, some of which may invest in foreign securities. There are certain additional risks involved in investing in foreign securities that are not inherent in investments in U.S. securities. These risks may involve adverse political and economic developments, including the possible imposition of capital controls or other foreign governmental laws or restrictions. In addition, the securities of some foreign companies and securities markets are less liquid and at times more volatile than securities of comparable U.S. companies and U.S. securities markets. The risks described above apply to an even greater extent to investments in emerging markets. The securities markets of emerging countries are generally smaller, less developed, less liquid, and more volatile than the securities markets of the U.S. and developed foreign markets. Additional ly, the investment risks associated with an investment in the underlying funds may be more pronounced to the extent that the underlying funds engage in derivative transactions.
12
GMO Benchmark-Free Allocation Fund
(A Series of GMO Trust)
Notes to Financial Statements — (Continued)
February 29, 2008
Recently issued accounting pronouncements
In June 2006, the Financial Accounting Standards Board ("FASB") issued FASB Interpretation No. 48, Accounting for Uncertainty in Income Taxes – an Interpretation of FASB Statement No. 109 ("FIN 48"). FIN 48 clarifies the accounting for uncertainty in income taxes recognized in accordance with FASB Statement No. 109, Accounting for Income Taxes. FIN 48 prescribes a recognition threshold and measurement attribute for a tax position taken or expected to be taken in the tax return that could impact the Fund's financial statements. It also provides guidance in relation to the Fund's financial statements on classification of tax benefits or liabilities, interest and penalties, accounting in interim periods, disclosure, and transition. FIN 48 is effective for fiscal years beginning after December 15, 2006 for registered investment companies. Management has evaluated the effects of applying the various provisions of FIN 48 and has determined that the adoption of FIN 48 does not have a material effect on the Fund's financial statements. The Fund's federal tax returns for the prior three fiscal years, if applicable, remain subject to examination by the Internal Revenue Service. Management will continue to monitor the rules and guidance pertaining to FIN 48 and will take action if appropriate.
In September 2006, the FASB issued Statement of Financial Accounting Standards No. 157 ("FAS 157"), "Fair Value Measurements." FAS 157 defines fair value, establishes a framework for measuring fair value in accordance with generally accepted accounting principles and expands disclosure about fair value measurements. FAS 157 is effective for fiscal years beginning after November 15, 2007. Management is currently evaluating the impact the adoption of FAS 157 will have on the Fund's financial statement disclosures.
3. Fees and other transactions with affiliates
The Manager determines the allocation of the assets of the Fund among designated underlying funds. The Manager does not directly charge a management or shareholder service fee from the Fund, but receives management and shareholder service fees from the underlying funds in which the Fund invests.
The Manager has contractually agreed to reimburse the Fund for Fund expenses through at least June 30, 2008 (excluding expenses indirectly incurred by investment in the underlying funds, fees and expenses of the independent Trustees of the Trust, fees and expenses for legal services not approved by the Manager for the Trust, compensation and expenses of the Trust's Chief Compliance Officer ("CCO") (excluding any employee benefits), brokerage commissions, securities lending fees and expenses, interest expense, transfer taxes, and other investment-related costs (including expenses associated with investments in any company that is an investment company or would be an investment company under the 1940 Act, but for the exceptions to the definition of investment company provided in Section 3(c)(1) and 3(c)(7) of the 1940 Act), hedging transaction fees, extraordinary, non-recurring and certain other unusual expenses (including taxes)) .
13
GMO Benchmark-Free Allocation Fund
(A Series of GMO Trust)
Notes to Financial Statements — (Continued)
February 29, 2008
The Fund incurs fees and expenses indirectly as a shareholder in the underlying funds. For the year ended February 29, 2008, these indirect fees and expenses expressed as an annualized percentage of the Fund's average daily net assets were as follows:
| Indirect Net Expenses (excluding shareholder service fees and interest expense) | Indirect Shareholder Service Fees | Indirect Interest Expense | Total Indirect Expenses | ||||||||||||
| 0.481 | % | 0.069 | % | 0.037 | % | 0.587 | % | ||||||||
The Fund's portion of the fees paid by the Trust to the independent Trustees and CCO during the year ended February 29, 2008 was $12,252 and $6,290, respectively. The compensation and expenses of the CCO are included in miscellaneous expenses in the Statement of Operations. No remuneration was paid by the Fund to any other officer of the Trust.
4. Purchases and sales of securities
Cost of purchases and proceeds from sales of securities, excluding short-term investments and class exchanges, for the year ended February 29, 2008 aggregated $1,191,304,534 and $837,535,464, respectively.
5. Guarantees
In the normal course of business the Fund enters into contracts with third-party service providers that contain a variety of representations and warranties and which provide general indemnifications. The Fund's maximum exposure under these arrangements is unknown, as this would involve future claims that may be made against the Fund that have not yet occurred. Based on experience, management is of the view that the risk of loss in connection with these potential indemnification obligations is remote; however, there can be no assurance that material liabilities related to such obligations will not arise in the future that could adversely impact the Fund.
6. Principal shareholders and related parties
As of February 29, 2008, 22.41% of the outstanding shares of the Fund were held by two shareholders, each holding in excess of 10% of the Fund's outstanding shares. No other shareholder owned in excess of 10% of the outstanding shares of the Fund. Investment activities of these shareholders may have a material effect on the Fund.
14
GMO Benchmark-Free Allocation Fund
(A Series of GMO Trust)
Notes to Financial Statements — (Continued)
February 29, 2008
As of February 29, 2008, 1.20% of the Fund's shares were held by twenty-four related parties comprised of certain GMO employee accounts, and 97.20% of the Fund's shares were held by accounts for which the Manager has investment discretion.
7. Share transactions
The Declaration of Trust permits the Trustees to issue an unlimited number of shares of beneficial interest (without par value). Transactions in Fund shares were as follows:
| Year Ended February 29, 2008 | Year Ended February 28, 2007 | ||||||||||||||||||
| Class III: | Shares | Amount | Shares | Amount | |||||||||||||||
| Shares sold | 9,819,038 | $ | 279,628,825 | 230,453 | $ | 6,218,922 | |||||||||||||
| Shares issued to shareholders in reinvestment of distributions | 7,959,463 | 209,394,517 | 5,166,625 | 136,960,268 | |||||||||||||||
| Shares repurchased | (2,301,160 | ) | (63,345,058 | ) | (737,840 | ) | (19,762,968 | ) | |||||||||||
| Purchase premiums | — | 7,597 | — | 15,111 | |||||||||||||||
| Redemption fees | — | 142,223 | — | 47,317 | |||||||||||||||
| Net increase (decrease) | 15,477,341 | $ | 425,828,104 | 4,659,238 | $ | 123,478,650 | |||||||||||||
8. Investments in affiliated issuers
A summary of the Fund's transactions in the shares of affiliated issuers during the year ended February 29, 2008 is set forth below:
| Affiliate | Value, beginning of period | Purchases | Sales Proceeds | Dividend Income | Distributions of Realized Gains | Value, end of period | |||||||||||||||||||||
| GMO Alpha Only Fund, Class IV | $ | 298,510,368 | $ | 157,569,432 | $ | 68,925,486 | $ | 6,980,691 | $ | — | $ | 407,035,363 | |||||||||||||||
| GMO Alternative Asset Opportunity Fund | 52,680,617 | 3,350,395 | 33,755,731 | — | — | 24,885,255 | |||||||||||||||||||||
| GMO Emerging Country Debt Fund, Class IV | 27,366,474 | 9,336,128 | 1,747,200 | 2,230,807 | 1,197,168 | 32,949,175 | |||||||||||||||||||||
| GMO Emerging Markets Fund, Class VI | 350,694,222 | 129,052,080 | 187,175,204 | 4,119,950 | 73,004,594 | 285,823,205 | |||||||||||||||||||||
15
GMO Benchmark-Free Allocation Fund
(A Series of GMO Trust)
Notes to Financial Statements — (Continued)
February 29, 2008
| Affiliate | Value, beginning of period | Purchases | Sales Proceeds | Dividend Income | Distributions of Realized Gains | Value, end of period | |||||||||||||||||||||
| GMO Inflation Indexed Plus Bond Fund, Class VI | $ | 162,776,234 | $ | 239,149,363 | $ | 373,329,293 | $ | 38,060,586 | $ | 682,784 | $ | — | |||||||||||||||
| GMO International Growth Equity Fund, Class IV | 39,254,064 | 1,415,956 | 42,470,420 | — | 1,415,956 | — | |||||||||||||||||||||
| GMO International Intrinsic Value Fund, Class IV | 38,941,954 | 889,041 | 41,771,769 | — | 889,041 | — | |||||||||||||||||||||
| GMO International Small Companies Fund, Class III | 13,336,722 | 461,656 | 13,265,466 | — | 461,656 | — | |||||||||||||||||||||
| GMO Special Situations Fund, Class VI | — | 75,701,034 | — | — | — | 80,727,015 | |||||||||||||||||||||
| GMO Strategic Fixed Income Fund, Class VI | 225,145,879 | 347,885,887 | 71,693,353 | 7,449,920 | 459,071 | 488,748,982 | |||||||||||||||||||||
| GMO U.S. Core Equity Fund, Class VI | — | 3,282 | — | 14 | 187 | 2,807 | |||||||||||||||||||||
| GMO U.S. Quality Equity Fund, Class VI | 87,702,351 | 226,490,280 | 3,401,542 | 4,110,348 | 6,498,793 | 289,904,690 | |||||||||||||||||||||
| Totals | $ | 1,296,408,885 | $ | 1,191,304,534 | $ | 837,535,464 | $ | 62,952,316 | $ | 84,609,250 | $ | 1,610,076,492 | |||||||||||||||
16
Report of Independent Registered Public Accounting Firm
To the Trustees of GMO Trust and the Shareholders of
GMO Benchmark-Free Allocation Fund
In our opinion, the accompanying statement of assets and liabilities, including the schedule of investments, and the related statements of operations and of changes in net assets and the financial highlights present fairly, in all material respects, the financial position of GMO Benchmark-Free Allocation Fund (the "Fund") at February 29, 2008, the results of its operations for the year then ended, the changes in its net assets for each of the two years in the period then ended and the financial highlights for each of the periods indicated, in conformity with accounting principles generally accepted in the United States of America. These financial statements and financial highlights (hereafter referred to as "financial statements") are the responsibility of the Fund's management; our responsibility is to express an opinion on these financial statements based on our audits. We conducted our audits of these financial statements in accordance with the standards of the Public Company Accounting Oversight Board (United States). Those standards require that we plan and perform the audit to obtain reasonable assurance about whether the financial statements are free of material misstatement. An audit includes examining, on a test basis, evidence supporting the amounts and disclosures in the financial statements, assessing the accounting principles used and significant estimates made by management, and evaluating the overall financial statement presentation. We believe that our audits, which included confirmation of securities at February 29, 2008 by correspondence with the custodian, provide a reasonable basis for our opinion.
PricewaterhouseCoopers LLP
Boston, Massachusetts
April 29, 2008
17
GMO Benchmark-Free Allocation Fund
(A Series of GMO Trust)
Fund Expenses
February 29, 2008 (Unaudited)
Expense Examples: The following information is in relation to expenses for the six month period ended February 29, 2008.
As a shareholder of the Fund, you may incur two types of costs: (1) transaction costs, including purchase premiums and redemption fees; and (2) ongoing costs including indirect management fees, shareholder service fees, and other Fund expenses. This example is intended to help you understand your ongoing costs (in dollars) of investing in the Fund and to compare these costs with the ongoing costs of investing in other mutual funds.
These examples are based on an investment of $1,000 invested at the beginning of the period and held for the entire period, September 1, 2007 through February 29, 2008.
Actual Expenses
The first line of the table below provides information about actual account values and actual expenses. You may use the information in this line, together with the amount you invested, to estimate the expenses that you paid over the period. Simply divide your account value by $1,000 (for example, a $10,000,000 account value divided by $1,000 = 10,000), then multiply the result by the number in the first line under the heading entitled "Net Expense Incurred" to estimate the expenses you paid on your account during this period.
Hypothetical Example for Comparison Purposes
The second line of the table below provides information about hypothetical account values and hypothetical expenses based on the Fund's actual expense ratio and an assumed rate of return of 5% per year before expenses, which is not the Fund's actual return. The hypothetical account values and expenses may not be used to estimate the actual ending account balance or expenses you paid for the period. You may use this information to compare the ongoing costs of investing in the Fund with other funds. To do so, compare this 5% hypothetical example with the 5% hypothetical examples that appear in the shareholder reports of other funds.
Please note that the expenses shown in the table are meant to highlight your ongoing costs only and do not reflect any transactional costs, such as purchase premiums and redemption fees. Therefore, the second line of the table is useful in comparing ongoing costs only, and will not help you determine the relative total costs of owning different funds. In addition, if these transactional costs were included, your costs would have been higher.
| Annualized Net Expense Ratio | Beginning Account Value | Ending Account Value | Net Expense Incurred* | ||||||||||||||||
| Class III | |||||||||||||||||||
| 1) Actual | 0.59 | % | $ | 1,000.00 | $ | 1,011.50 | $ | 2.95 | |||||||||||
| 2) Hypothetical | 0.59 | % | $ | 1,000.00 | $ | 1,021.93 | $ | 2.97 | |||||||||||
* Expenses are calculated using the Class's annualized expense ratio (including indirect expenses incurred) for the six months ended February 29, 2008, multiplied by the average account value over the period, multiplied by 182 days in the period, divided by 366 days in the year.
18
GMO Benchmark-Free Allocation Fund
(A Series of GMO Trust)
Tax Information for the Tax Year Ended February 29, 2008 (Unaudited)
The Fund will notify shareholders of amounts for use in preparing 2008 income tax forms in January 2009.
The Fund's distributions to shareholders include $155,384,566 from long-term capital gains.
For taxable, non-corporate shareholders, 18.96% of the income and short-term capital gains, if any, distributed in the Fund's fiscal year ended February 29, 2008 represents qualified dividend income subject to the 15% rate category.
For corporate shareholders, 9.84% of the income and short-term capital gains, if any, distributed in the Fund's fiscal year ended February 29, 2008 qualified for the dividends-received deduction.
The Fund hereby designates as qualified interest income and qualified short-term capital gains with respect to its taxable year ended February 29, 2008, $25,262,582 and $190,147, respectively, or if determined to be different, the qualified interest income and qualified short-term gains of such year.
19
Trustees and Officers (Unaudited)
The following tables list the Trust's Trustees and Officers as of the date of this report; their address and date of birth ("DOB"); their position with the Trust; the length of time holding that position with the Trust; their principal occupation(s) during the past five years; the number of portfolios in the fund complex they oversee; and other directorships they hold in companies subject to registration or reporting requirements of the Securities Exchange Act of 1934 (generally called "public companies") or in registered investment companies. The Trust's Statement of Additional Information ("SAI") includes additional information about the Trust's trustees, including changes subsequent to the date of the report. The SAI is available, without charge, upon request by writing GMO, c/o GMO Trust, 40 Rowes Wharf, Boston, MA 02110.
Independent Trustees:
| Name, Address, and DOB | Position(s) Held with Trust | Term of Office1 and Length of Time Served | Principal Occupation(s) During Past Five Years | Number of Portfolios in Fund Complex Overseen by Trustee | Other Directorships Held by Trustee | ||||||||||||||||||
| Donald W. Glazer, Esq. c/o GMO Trust 40 Rowes Wharf Boston, MA 02110 DOB: 07/26/1944 | Chairman of the Board of Trustees | Chairman of the Board of Trustees since March 2005; Lead Independent Trustee (September 2004 – March 2005); Trustee since December 2000. | Consultant – Law and Business2; Vice Chair (since 2002) and Secretary, Provant, Inc. (provider of personnel performance improvement services and training products); Author of Legal Treatises. | 47 | None. | ||||||||||||||||||
1 Each Trustee is elected to serve during the continued lifetime of the Trust until he/she dies, resigns or is removed, or if sooner, until the next meeting of Shareholders called for the purpose of electing Trustees and until the election and qualification of his/her successor.
2 As part of Mr. Glazer's work as a consultant, he provides part-time consulting services to Goodwin Procter LLP ("Goodwin"). Goodwin has provided legal services to Renewable Resources, LLC, an affiliate of GMO; GMO, in connection with its relationship with Renewable Resources; and funds managed by Renewable Resources. Mr. Glazer has represented that he has no financial interest in, and is not involved in the provision of, such legal services. In the calendar years ended December 31, 2006 and December 31, 2007, these entities paid $825,738 and $291,721 respectively, in legal fees and disbursements to Goodwin.
20
Independent Trusteess — (Continued)
| Name, Address, and DOB | Position(s) Held with Trust | Term of Office1 and Length of Time Served | Principal Occupation(s) During Past Five Years | Number of Portfolios in Fund Complex Overseen by Trustee | Other Directorships Held by Trustee | ||||||||||||||||||
| Jay O. Light c/o GMO Trust 40 Rowes Wharf Boston, MA 02110 DOB: 10/03/1941 | Trustee | Since May 1996. | Dean (since April 2006), Acting Dean (August 2005 – April 2006), Senior Associate Dean (1998 – 2005), and Professor of Business Administration, Harvard Business School. | 47 | Director of Harvard Management Company, Inc.3 and Verde, Inc.; Director of Partners HealthCare System, Inc. and Chair of its Investment Committee.4 | ||||||||||||||||||
| W. Nicholas Thorndike c/o GMO Trust 40 Rowes Wharf Boston, MA 02110 DOB: 03/28/1933 | Trustee | Since March 2005. | Director or trustee of various corporations and charitable organizations, including Courier Corporation (a book publisher and manufacturer) (July 1989 – present); Putnam Funds (December 1992 – June 2004); and Providence Journal (a newspaper publisher) (December 1986 – December 2003). | 47 | Director of Courier Corporation (a book publisher and manufacturer); Member of the Investment Committee of Partners HealthCare System, Inc.4 | ||||||||||||||||||
1 Each Trustee is elected to serve during the continued lifetime of the Trust until he/she dies, resigns or is removed, or if sooner, until the next meeting of Shareholders called for the purpose of electing Trustees and until the election and qualification of his/her successor.
3 Harvard Management Company, Inc. is a client of the Manager.
4 Partners HealthCare System, Inc. is a client of the Manager.
21
Principal Officers:
| Name, Address, and DOB | Position(s) Held with Trust | Term of Office5 and Length of Time Served | Principal Occupation(s) During Past Five Years | ||||||||||||
| Scott Eston c/o GMO Trust 40 Rowes Wharf Boston, MA 02110 DOB: 01/20/1956 | President and Chief Executive Officer | President and Chief Executive Officer since October 2002; Chief Financial Officer, November 2006 – February 2007. | Chief Financial Officer, Chief Operating Officer and Member, Grantham, Mayo, Van Otterloo & Co. LLC. | ||||||||||||
| Sheppard N. Burnett c/o GMO Trust 40 Rowes Wharf Boston, MA 02110 DOB: 10/24/1968 | Treasurer and Chief Financial Officer | Chief Financial Officer since March 2007; Treasurer since November 2006; Assistant Treasurer, September 2004 – November 2006. | Fund Administration Staff, Grantham, Mayo, Van Otterloo & Co. LLC (June 2004 – present); Vice President, Director of Tax, Columbia Management Group (2002 – 2004). | ||||||||||||
| Brent C. Arvidson c/o GMO Trust 40 Rowes Wharf Boston, MA 02110 DOB: 06/26/1969 | Assistant Treasurer | Since August 1998. | Senior Fund Administrator, Grantham, Mayo, Van Otterloo & Co. LLC. | ||||||||||||
| John L. Nasrah c/o GMO Trust 40 Rowes Wharf Boston, MA 02110 DOB: 05/27/1977 | Assistant Treasurer | Since March 2007. | Fund Administrator, Grantham, Mayo, Van Otterloo & Co. LLC (September 2004 – present); Tax Analyst, Bain & Company, Inc (June 2003 – September 2004); Senior Tax Associate, PricewaterhouseCoopers LLP (2001 – 2003). | ||||||||||||
| Mahmoodur Rahman c/o GMO Trust 40 Rowes Wharf Boston, MA 02110 DOB: 11/30/1967 | Assistant Treasurer | Since September 2007. | Fund Administrator, Grantham, Mayo, Van Otterloo & Co. (April 2007 – present); Vice President and Senior Tax Manager, Massachusetts Financial Services Company (January 2000 – April 2007). | ||||||||||||
5 Officers are elected to hold such office until their successor is elected and qualified to carry out the duties and responsibilities of their office, or until he or she resigns or is removed from office.
22
Principal Officers — (Continued)
| Name, Address, and DOB | Position(s) Held with Trust | Term of Office5 and Length of Time Served | Principal Occupation(s) During Past Five Years | ||||||||||||
| Michael E. Gillespie c/o GMO Trust 40 Rowes Wharf Boston, MA 02110 DOB: 02/18/1958 | Chief Compliance Officer | Since March 2005. | Vice President of Compliance (June 2004 – February 2005) and Director of Domestic Compliance (March 2002 – June 2004), Fidelity Investments; Vice President and Senior Counsel, State Street Bank and Trust Company (May 1998 – March 2002). | ||||||||||||
| Jason B. Harrison c/o GMO Trust 40 Rowes Wharf Boston, MA 02110 DOB: 01/29/1977 | Vice President and Clerk | Vice President since November 2006; Clerk since March 2006. | Legal Counsel, Grantham, Mayo, Van Otterloo & Co. LLC (since February 2006) and Attorney, Ropes & Gray LLP (September 2002 – February 2006). | ||||||||||||
| David L. Bohan c/o GMO Trust 40 Rowes Wharf Boston, MA 02110 DOB: 06/21/1964 | Vice President and Assistant Clerk | Vice President since March 2005; Assistant Clerk since March 2006. | Legal Counsel, Grantham, Mayo, Van Otterloo & Co. LLC (September 2003 – present); Attorney, Goodwin Procter LLP (September 1996 – September 2003). | ||||||||||||
| Gregory L. Pottle c/o GMO Trust 40 Rowes Wharf Boston, MA 02110 DOB: 07/09/1971 | Vice President and Assistant Clerk | Since November 2006. | Legal Counsel, Grantham, Mayo, Van Otterloo & Co. LLC. | ||||||||||||
| Anne K. Trinque c/o GMO Trust 40 Rowes Wharf Boston, MA 02110 DOB: 04/15/1978 | Vice President and Assistant Clerk | Since September 2007. | Legal Counsel, Grantham, Mayo, Van Otterloo & Co. LLC (since January 2007); Attorney, Goodwin Procter LLP (September 2003 – January 2007). | ||||||||||||
| Cheryl Wakeham c/o GMO Trust 40 Rowes Wharf Boston, MA 02110 DOB: 10/29/1958 | Anti-Money Laundering Officer | Since December 2004. | Manager, Client Service Administration, Grantham, Mayo, Van Otterloo & Co. LLC. | ||||||||||||
5 Officers are elected to hold such office until their successor is elected and qualified to carry out the duties and responsibilities of their office, or until he or she resigns or is removed from office.
23
GMO Global Balanced Asset Allocation Fund
(A Series of GMO Trust)
Annual Report
February 29, 2008
For a free copy of the Fund's proxy voting guidelines, shareholders may call 1-617-346-7646 (collect), visit our website at www.gmo.com, or visit the Securities and Exchange Commission's website at www.sec.gov. Information regarding how the Fund voted proxies relating to portfolio securities during the most recent 12-month period ended June 30 is available on our website at www.gmo.com, or on the Securities and Exchange Commission's website at www.sec.gov.
The Fund files its complete schedule of portfolio holdings with the Securities and Exchange Commission for the first and third quarter of each fiscal year on Form N-Q, which is available on the Commission's website at www.sec.gov. The Fund's Form N-Q may be reviewed and copied at the Commission's Public Reference Room in Washington, D.C. Information on the operation of the Public Reference Room may be obtained by calling 1-800-SEC-0330. The Fund has a policy with respect to disclosure of portfolio holdings under which it may also make available on GMO's website (www.gmo.com) a complete schedule of portfolio holdings.
This report is prepared for the general information of shareholders. It is authorized for distribution to prospective investors only when preceded or accompanied by a prospectus for the GMO Trust.
GMO Global Balanced Asset Allocation Fund
(A Series of GMO Trust)
Portfolio Management
Day-to-day management of the Fund's portfolio is the responsibility of the Asset Allocation Team at Grantham, Mayo, Van Otterloo & Co. LLC.
Management Discussion and Analysis of Fund Performance
The GMO Global Balanced Asset Allocation Fund returned +4.1% for the fiscal year ended February 29, 2008, as compared to +4.0% for the Fund's benchmark, the GMO Global Balanced Index (48.75% S&P 500 Index, 16.25% MSCI ACWI [All Country World Index] ex-U.S. Index and 35% Lehman Brothers U.S. Aggregate Index prior to 3/31/2007 and 65% MSCI ACWI [All Country World Index] Index and 35% Lehman Brothers U.S. Aggregate Index thereafter). During the fiscal year the Fund was exposed to global equity and fixed income securities through its investment in underlying GMO mutual funds.
Implementation was negative, detracting 2.9% from returns as the GMO U.S. Core Equity, GMO International Intrinsic Value, GMO Emerging Markets, GMO Inflation Indexed Plus Bond, and GMO Strategic Fixed Income Funds underperformed their respective benchmarks.
Asset allocation added 3.0%. The Fund's underweight to U.S. equities, and overweights to emerging equities and inflation-indexed bonds were the primary drivers of the outperformance.
The views expressed herein are exclusively those of Grantham, Mayo, Van Otterloo & Co. LLC Management as of the date of this report and are subject to change. GMO disclaims any responsibility to update such views. They are not meant as investment advice.
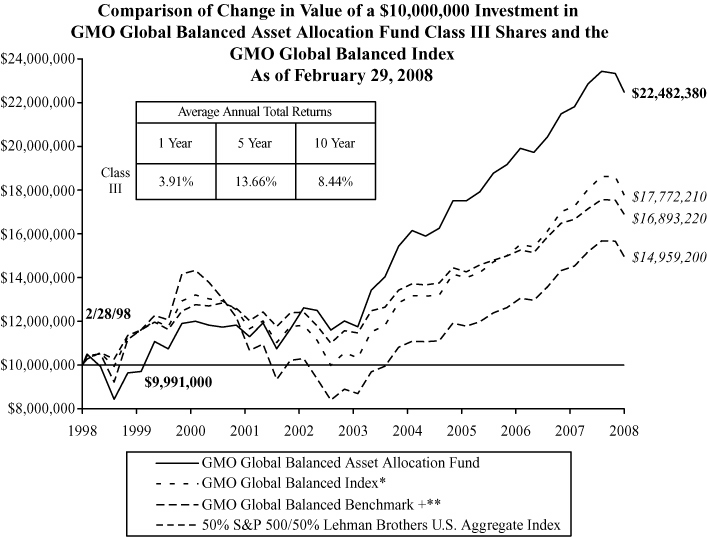
Performance data quoted represents past performance and is not indicative of future results. The investment return and principal value of an investment will fluctuate so that an investor's shares, when redeemed, may be worth more or less than their original cost. Current performance data may be lower or higher than the performance data provided herein. To obtain performance information to the most recent month-end, visit www.gmo.com. Performance shown is net of all fees after reimbursement from the Manager. Each performance figure assumes a purchase at the beginning and redemption at the end of the stated period and reflects a transaction fee of .09% on the purchase and .09% on the redemption. Transaction fees are retained by the Fund to cover trading costs. Returns would have been lower had certain expenses not been reimbursed during the periods shown and do not include the effect of taxes on distributions and redemptions. All information is unaudited.
* The GMO Global Balanced Index is a composite benchmark computed by GMO and comprised of 48.75% S&P 500 Index, 16.25% MSCI ACWI (All Country World Index) ex-U.S. Index and 35% Lehman Brothers U.S. Aggregate Index prior to 3/31/2007 and 65% MSCI ACWI (All Country World Index) Index and 35% Lehman Brothers U.S. Aggregate Index thereafter.
** The GMO Global Balanced Benchmark + is comprised of MSCI ACWI (All Country World Index) prior to 6/30/2002 and GMO Global Balanced Index thereafter.
GMO Global Balanced Asset Allocation Fund
(A Series of GMO Trust)
Investments Concentration Summary
February 29, 2008 (Unaudited)
| Asset Class Summary* | % of Total Net Assets | ||||||
| Common Stocks | 59.2 | % | |||||
| Debt Obligations | 25.9 | ||||||
| Cash and Cash Equivalents | 15.1 | ||||||
| Short-Term Investments | 10.4 | ||||||
| Preferred Stocks | 1.8 | ||||||
| Private Equity Securities | 0.1 | ||||||
| Options Purchased | 0.1 | ||||||
| Investment Funds | 0.0 | ||||||
| Loan Participations | 0.0 | ||||||
| Loan Assignments | 0.0 | ||||||
| Rights and Warrants | 0.0 | ||||||
| Forward Currency Contracts | 0.0 | ||||||
| Convertible Securities | 0.0 | ||||||
| Promissory Notes | 0.0 | ||||||
| Written Options | (0.0 | ) | |||||
| Reverse Repurchase Agreements | (0.2 | ) | |||||
| Swaps | (4.8 | ) | |||||
| Futures | (9.4 | ) | |||||
| Other | 1.8 | ||||||
| 100.0 | % | ||||||
* The table above incorporates aggregate indirect asset class exposure associated with investments in other funds of GMO Trust ("underlying funds").
1
GMO Global Balanced Asset Allocation Fund
(A Series of GMO Trust)
Investments Concentration Summary — (Continued)
February 29, 2008 (Unaudited)
| Country / Region Summary** | % of Investments | ||||||
| United States | 64.6 | % | |||||
| Euro Region*** | 9.7 | ||||||
| Japan | 4.6 | ||||||
| United Kingdom | 4.1 | ||||||
| Brazil | 2.6 | ||||||
| Korea | 2.3 | ||||||
| Taiwan | 1.9 | ||||||
| Switzerland | 1.8 | ||||||
| China | 1.2 | ||||||
| Russia | 1.0 | ||||||
| Thailand | 0.8 | ||||||
| India | 0.6 | ||||||
| Malaysia | 0.6 | ||||||
| Singapore | 0.6 | ||||||
| Canada | 0.5 | ||||||
| Hong Kong | 0.5 | ||||||
| Turkey | 0.4 | ||||||
| Denmark | 0.3 | ||||||
| Indonesia | 0.3 | ||||||
| Norway | 0.3 | ||||||
| Philippines | 0.3 | ||||||
| South Africa | 0.3 | ||||||
| Sweden | 0.3 | ||||||
| Hungary | 0.1 | ||||||
| Israel | 0.1 | ||||||
| Mexico | 0.1 | ||||||
| Poland | 0.1 | ||||||
| 100.0 | % | ||||||
** The table above incorporates aggregate indirect country exposure associated with investments in the underlying funds except for GMO Alpha Only Fund. The table excludes short-term investments. The table includes exposure through the use of derivative contracts.
*** The "Euro Region" is comprised of Austria, Belgium, Finland, France, Germany, Greece, Ireland, Italy, Netherlands, Portugal and Spain.
2
GMO Global Balanced Asset Allocation Fund
(A Series of GMO Trust)
Schedule of Investments
(showing percentage of total net assets)
February 29, 2008
| Shares / Par Value ($) | Description | Value ($) | |||||||||||||
| MUTUAL FUNDS — 100.0% | |||||||||||||||
| Affiliated Issuers — 100.0% | |||||||||||||||
| 48,242,552 | GMO Alpha Only Fund, Class IV | 535,974,748 | |||||||||||||
| 5,210,567 | GMO Core Plus Bond Fund, Class IV | 49,187,750 | |||||||||||||
| 4,964,011 | GMO Domestic Bond Fund, Class VI | 47,058,826 | |||||||||||||
| 1,618,654 | GMO Emerging Countries Fund, Class III | 24,700,654 | |||||||||||||
| 1,071,724 | GMO Emerging Country Debt Fund, Class IV | 10,781,541 | |||||||||||||
| 15,954,336 | GMO Emerging Markets Fund, Class VI | 325,787,540 | |||||||||||||
| 2,081,395 | GMO International Bond Fund, Class III | 19,794,069 | |||||||||||||
| 9,497,185 | GMO International Core Equity Fund, Class VI | 353,485,226 | |||||||||||||
| 6,445,525 | GMO International Growth Equity Fund, Class IV | 178,541,031 | |||||||||||||
| 5,911,275 | GMO International Intrinsic Value Fund, Class IV | 177,101,792 | |||||||||||||
| 359,061 | GMO Short-Duration Investment Fund, Class III | 3,034,068 | |||||||||||||
| 8,595,280 | GMO Special Situations Fund, Class VI | 183,337,321 | |||||||||||||
| 35,030,805 | GMO Strategic Fixed Income Fund, Class VI | 825,676,074 | |||||||||||||
| 6,946,692 | GMO U.S. Core Equity Fund, Class VI | 83,499,236 | |||||||||||||
| 26,581,499 | GMO U.S. Quality Equity Fund, Class VI | 546,781,435 | |||||||||||||
| TOTAL MUTUAL FUNDS (COST $3,516,628,328) | 3,364,741,311 | ||||||||||||||
| SHORT-TERM INVESTMENTS — 0.0% | |||||||||||||||
| 30,364 | Eurodollar Time Deposit, 2.00%, due 03/03/08 | 30,364 | |||||||||||||
| TOTAL SHORT-TERM INVESTMENTS (COST $30,364) | 30,364 | ||||||||||||||
| TOTAL INVESTMENTS — 100.0% (Cost $3,516,658,692) | 3,364,771,675 | ||||||||||||||
| Other Assets and Liabilities (net) — 0.0% | 83,311 | ||||||||||||||
| TOTAL NET ASSETS — 100.0% | $ | 3,364,854,986 | |||||||||||||
See accompanying notes to the financial statements.
3
GMO Global Balanced Asset Allocation Fund
(A Series of GMO Trust)
Schedule of Investments – (Continued)
February 29, 2008
Notes to Schedule of Investments:
As of February 29, 2008, 32.32% of the Net Assets of the Fund, through investments in the underlying funds, were valued using fair values prices based on models used by a third party vendor (Note 2).
See accompanying notes to the financial statements.
4
GMO Global Balanced Asset Allocation Fund
(A Series of GMO Trust)
Statement of Assets and Liabilities — February 29, 2008
| Assets: | |||||||
| Investments in unaffiliated issuers, at value (cost $30,364) (Note 2) | $ | 30,364 | |||||
| Investments in affiliated issuers, at value (cost $3,516,628,328) (Notes 2 and 8) | 3,364,741,311 | ||||||
| Receivable for investments sold | 534,403,448 | ||||||
| Receivable for Fund shares sold | 12,000 | ||||||
| Receivable for expenses reimbursed by Manager (Note 3) | 30,537 | ||||||
| Total assets | 3,899,217,660 | ||||||
| Liabilities: | |||||||
| Due to custodian | 1,800 | ||||||
| Payable for Fund shares repurchased | 534,260,300 | ||||||
| Payable to affiliate for (Note 3): | |||||||
| Trustees and Chief Compliance Officer of GMO Trust fees | 4,240 | ||||||
| Accrued expenses | 96,334 | ||||||
| Total liabilities | 534,362,674 | ||||||
| Net assets | $ | 3,364,854,986 | |||||
| Net assets consist of: | |||||||
| Paid-in capital | $ | 3,396,043,762 | |||||
| Accumulated undistributed net investment income | 18,656,535 | ||||||
| Accumulated net realized gain | 102,041,706 | ||||||
| Net unrealized depreciation | (151,887,017 | ) | |||||
| $ | 3,364,854,986 | ||||||
| Net assets attributable to: | |||||||
| Class III shares | $ | 3,364,854,986 | |||||
| Shares outstanding: | |||||||
| Class III | 295,888,056 | ||||||
| Net asset value per share: | |||||||
| Class III | $ | 11.37 | |||||
See accompanying notes to the financial statements.
5
GMO Global Balanced Asset Allocation Fund
(A Series of GMO Trust)
Statement of Operations — Year Ended February 29, 2008
| Investment Income: | |||||||
| Dividends from affiliated issuers (Note 8) | $ | 138,509,806 | |||||
| Interest | 1,316 | ||||||
| Total investment income | 138,511,122 | ||||||
| Expenses: | |||||||
| Custodian, fund accounting agent and transfer agent fees | 47,536 | ||||||
| Audit and tax fees | 36,946 | ||||||
| Legal fees | 78,789 | ||||||
| Chief Compliance Officer (Note 3) | 15,058 | ||||||
| Trustees fees and related expenses (Note 3) | 33,292 | ||||||
| Registration fees | 31,371 | ||||||
| Miscellaneous | 16,862 | ||||||
| Total expenses | 259,854 | ||||||
| Fees and expenses reimbursed by Manager (Note 3) | (211,454 | ) | |||||
| Expense reductions (Note 2) | (57,505 | ) | |||||
| Net expenses | (9,105 | ) | |||||
| Net investment income (loss) | 138,520,227 | ||||||
| Realized and unrealized gain (loss): | |||||||
| Net realized gain (loss) on: | |||||||
| Investments in affiliated issuers | 41,592,867 | ||||||
| Realized gains distributions from affiliated issuers (Note 8) | 214,605,150 | ||||||
| Net realized gain (loss) | 256,198,017 | ||||||
| Change in net unrealized appreciation (depreciation) on: | |||||||
| Investments in affiliated issuers | (284,868,880 | ) | |||||
| Net realized and unrealized gain (loss) | (28,670,863 | ) | |||||
| Net increase (decrease) in net assets resulting from operations | $ | 109,849,364 | |||||
See accompanying notes to the financial statements.
6
GMO Global Balanced Asset Allocation Fund
(A Series of GMO Trust)
Statement of Changes in Net Assets
| Year Ended February 29, 2008 | Year Ended February 28, 2007 | ||||||||||
| Increase (decrease) in net assets: | |||||||||||
| Operations: | |||||||||||
| Net investment income (loss) | $ | 138,520,227 | $ | 77,547,567 | |||||||
| Net realized gain (loss) | 256,198,017 | 141,698,243 | |||||||||
| Change in net unrealized appreciation (depreciation) | (284,868,880 | ) | (2,413,878 | ) | |||||||
| Net increase (decrease) in net assets from operations | 109,849,364 | 216,831,932 | |||||||||
| Distributions to shareholders from: | |||||||||||
| Net investment income | |||||||||||
| Class III | (163,753,134 | ) | (104,092,536 | ) | |||||||
| Net realized gains | |||||||||||
| Class III | (185,650,495 | ) | (76,782,210 | ) | |||||||
| (349,403,629 | ) | (180,874,746 | ) | ||||||||
| Net share transactions (Note 7): | |||||||||||
| Class III | 524,385,283 | 1,229,975,659 | |||||||||
| Purchase premiums and redemption fees (Notes 2 and 7): | |||||||||||
| Class III | 860,204 | 1,039,471 | |||||||||
| Total increase (decrease) in net assets resulting from net share transactions, purchase premiums and redemption fees | 525,245,487 | 1,231,015,130 | |||||||||
| Total increase (decrease) in net assets | 285,691,222 | 1,266,972,316 | |||||||||
| Net assets: | |||||||||||
| Beginning of period | 3,079,163,764 | 1,812,191,448 | |||||||||
| End of period (including accumulated undistributed net investment income of $18,656,535 and distributions in excess of net investment income of $2,547,096, respectively) | $ | 3,364,854,986 | $ | 3,079,163,764 | |||||||
See accompanying notes to the financial statements.
7
GMO Global Balanced Asset Allocation Fund
(A Series of GMO Trust)
Financial Highlights
(For a Class III share outstanding throughout each period)
| Year Ended February 28/29, | |||||||||||||||||||||||
| 2008 | 2007 | 2006 | 2005 | 2004 | |||||||||||||||||||
| Net asset value, beginning of period | $ | 12.01 | $ | 11.76 | $ | 11.33 | $ | 10.74 | $ | 8.13 | |||||||||||||
| Income (loss) from investment operations: | |||||||||||||||||||||||
| Net investment income (loss)(a) | 0.48 | † | 0.39 | † | 0.36 | † | 0.27 | † | 0.18 | ||||||||||||||
| Net realized and unrealized gain (loss) | 0.05 | 0.66 | 0.86 | 0.90 | 2.68 | ||||||||||||||||||
| Total from investment operations | 0.53 | 1.05 | 1.22 | 1.17 | 2.86 | ||||||||||||||||||
| Less distributions to shareholders: | |||||||||||||||||||||||
| From net investment income | (0.53 | ) | (0.43 | ) | (0.37 | ) | (0.32 | ) | (0.23 | ) | |||||||||||||
| From net realized gains | (0.64 | ) | (0.37 | ) | (0.42 | ) | (0.26 | ) | (0.02 | ) | |||||||||||||
| Total distributions | (1.17 | ) | (0.80 | ) | (0.79 | ) | (0.58 | ) | (0.25 | ) | |||||||||||||
| Net asset value, end of period | $ | 11.37 | $ | 12.01 | $ | 11.76 | $ | 11.33 | $ | 10.74 | |||||||||||||
| Total Return(b)(c) | 4.10 | % | 9.22 | % | 11.05 | % | 11.07 | % | 35.53 | % | |||||||||||||
| Ratios/Supplemental Data: | |||||||||||||||||||||||
| Net assets, end of period (000's) | $ | 3,364,855 | $ | 3,079,164 | $ | 1,812,191 | $ | 1,030,238 | $ | 453,807 | |||||||||||||
| Net expenses to average daily net assets(d)(e) | 0.00 | %(f) | 0.00 | % | 0.00 | % | 0.00 | % | 0.00 | % | |||||||||||||
| Net investment income to average daily net assets(a) | 3.89 | % | 3.28 | % | 3.17 | % | 2.53 | % | 2.19 | % | |||||||||||||
| Portfolio turnover rate | 76 | % | 23 | % | 16 | % | 10 | % | 59 | % | |||||||||||||
| Fees and expenses reimbursed by the Manager to average daily net assets: | 0.01 | % | 0.01 | % | 0.01 | % | 0.02 | % | 0.03 | % | |||||||||||||
| Purchase premiums and redemption fees consisted of the following per share amounts:† | $ | 0.00 | (g) | $ | 0.01 | $ | 0.01 | $ | 0.01 | $ | 0.01 | ||||||||||||
(a) Net investment income is affected by the timing of the declaration of dividends by the underlying funds in which the Fund invests.
(b) The total returns would have been lower had certain expenses not been reimbursed and/or waived during the periods shown and assumes the effect of reinvested distributions.
(c) Calculation excludes purchase premiums and redemption fees which are borne by the shareholder.
(d) Net expenses exclude expenses incurred indirectly through investment in the underlying funds (See Note 3).
(e) Net expenses to average daily net assets were less than 0.01%.
(f) The net expense ratio does not include the effect of expense reductions.
(g) Purchase premiums and redemption fees were less than $0.01 per share.
† Calculated using average shares outstanding throughout the period.
See accompanying notes to the financial statements.
8
GMO Global Balanced Asset Allocation Fund
(A Series of GMO Trust)
Notes to Financial Statements
February 29, 2008
1. Organization
GMO Global Balanced Asset Allocation Fund (the "Fund") is a series of GMO Trust (the "Trust"). The Fund is registered under the Investment Company Act of 1940, as amended, as an open-end, diversified management investment company. The Fund is advised and managed by Grantham, Mayo, Van Otterloo & Co. LLC (the "Manager" or "GMO"). The Trust was established as a Massachusetts business trust under the laws of the Commonwealth of Massachusetts on June 24, 1985. The Declaration of Trust permits the Trustees of the Trust ("Trustees") to create an unlimited number of series of shares ("Funds") and to subdivide Funds into classes.
The Fund seeks total return greater than that of the GMO Global Balanced Index. The Fund is a fund of funds and invests in shares of other GMO Funds, which may include the GMO International Equity Funds (including one or more of the GMO Emerging Markets Funds), GMO U.S. Equity Funds, GMO Fixed Income Funds, GMO Alpha Only Fund, GMO Alternative Asset Opportunity Fund and GMO Special Situations Fund. The GMO Global Balanced Index is a composite index computed by GMO consisting of: (i) the MSCI ACWI (All Country World Index) Index and (ii) the Lehman Brothers U.S. Aggregate Index in the following proportions: 65% MSCI ACWI (All Country World Index) Index and 35% Lehman Brothers U.S. Aggregate Index. From June 30, 2002 through March 31, 2007, the GMO Global Balanced Index consisted of: (i) the S&P 500 Index; (ii) the MSCI ACWI (All Country World Index) ex-U.S. Index; and (iii) the Lehman Brothers U.S. Aggregate Index in the foll owing proportions: 48.75% S&P 500 Index, 16.25% MSCI ACWI (All Country World Index) ex-U.S. Index, and 35% Lehman Brothers U.S. Aggregate Index.
The financial statements of the series of the Trust in which the Fund invests ("underlying funds") should be read in conjunction with the Fund's financial statements. These financial statements are available, without charge, upon request, by calling (617) 346-7646 (collect). Shares of GMO Special Situations Fund are not publicly available for direct purchase.
2. Significant accounting policies
The following is a summary of significant accounting policies which are in conformity with accounting principles generally accepted in the United States of America ("U.S. GAAP") and which are consistently followed by the Fund in the preparation of its financial statements. The preparation of financial statements in accordance with U.S. GAAP requires management to make estimates and assumptions that affect the reported amounts and disclosures in the financial statements. Actual results could differ from those estimates. The accounting records of the Fund are maintained in U.S. dollars.
Portfolio valuation
Shares of the underlying funds and other mutual funds are valued at their net asset value.
9
GMO Global Balanced Asset Allocation Fund
(A Series of GMO Trust)
Notes to Financial Statements — (Continued)
February 29, 2008
Investments held by the underlying funds are valued as follows. Securities listed on a securities exchange for which market quotations are readily available are valued at the last sale price or official closing price on each business day, or if there is no such reported sale or official closing price, at the most recent quoted bid price. Unlisted securities for which market quotations are readily available are generally valued at the most recent quoted bid price. Short-term investments with a remaining maturity of sixty days or less are generally valued at amortized cost, which approximates fair value. Securities for which quotations are not readily available or whose values the Manager has determined to be unreliable are valued at fair value as determined in good faith by the Trustees or other persons acting at their direction pursuant to procedures approved by the Trustees. By its nature, a fair value price is a good faith est imate of the value of a security at a given point in time and may not reflect the value that would be realized if the security was sold and the differences could be material. Because many foreign equity securities markets and exchanges close prior to the close of the New York Stock Exchange ("NYSE"), closing prices for foreign securities in those markets or on those exchanges do not reflect the events that occur after that close but before the close of the NYSE. As a result, foreign equity securities are generally valued using fair value prices supplied by a third party vendor based on models to the extent that these fair value prices are available.
Fixed income securities held by the Fund or the underlying funds are typically valued pursuant to prices supplied by a primary pricing source chosen by the Manager. The Manager evaluates such primary pricing sources on an ongoing basis, and may change a pricing source should it deem it appropriate. The Manager, at its discretion, may override a price supplied by a primary source by using a price provided by another source if such action is deemed appropriate. The prices provided by such primary pricing sources may differ from the value that would be realized if the securities were sold and the differences could be material.
Certain securities held by the Fund or the underlying funds are valued on the basis of a price provided by a single source. The prices provided may differ from the value that would be realized if the securities were sold and the differences could be material. As of February 29, 2008, the total value of these securities represented 8.96% of net assets.
The Fund indirectly invests through underlying funds in securities with contractual cash flows, such as asset-backed securities, collateralized mortgage obligations and commercial mortgage backed securities, including securities backed by subprime mortgage loans. The value, liquidity and related income of these securities are sensitive to changes in economic conditions, including real estate values, delinquencies and/or defaults, and may be adversely affected by shifts in the market's perception of the securities' market values and changes in interest rates.
Repurchase agreements
The Fund may enter into repurchase agreements with banks and broker-dealers whereby the Fund acquires a security for cash and obtains a simultaneous commitment from the seller to repurchase the security at an agreed upon price and date. The Fund, through its custodian, takes possession of securities collateralizing
10
GMO Global Balanced Asset Allocation Fund
(A Series of GMO Trust)
Notes to Financial Statements — (Continued)
February 29, 2008
the repurchase agreement. The collateral is marked to market daily to ensure that the market value of the underlying assets remains sufficient to protect the Fund in the event of default by the seller. Collateral for certain tri-party repurchase agreements is held at the counterparty's custodian in a segregated account for the benefit of the Fund and the counterparty. In connection with transactions in repurchase agreements, if the seller defaults or enters into insolvency proceedings and the value of the collateral declines, recovery of cash by the Fund may be delayed or limited. There were no repurchase agreements outstanding at the end of the period.
Taxes and distributions
The Fund intends to qualify each tax year as a regulated investment company under Subchapter M of the Internal Revenue Code of 1986, as amended (the "Code"). The Fund intends to distribute substantially all of its net investment income and net realized short-term and long-term capital gains, if any, after giving effect to any available capital loss carryovers for U.S. federal income tax purposes. Therefore, no provision for U.S. federal income or excise tax is necessary.
The Fund's policy is to declare and pay distributions from net investment income, if any, semiannually, and from net realized short-term and long-term capital gains, if any, at least annually. All distributions are paid in shares of the Fund, at net asset value, unless the shareholder elects to receive cash distributions. Distributions to shareholders are recorded by the Fund on the ex-dividend date.
Income and capital gain distributions are determined in accordance with U.S. federal income tax regulations, which may differ from U.S. GAAP. Certain capital accounts in the financial statements are periodically adjusted for permanent differences in order to reflect their tax character. These adjustments have no impact on net assets or net asset value per share. Temporary differences which arise from recognizing certain items of income, expense, gain or loss in different periods for financial statement and tax purposes will reverse at some time in the future. Distributions in excess of net investment income or net realized gains are temporary over distributions for financial statement purposes resulting from differences in the recognition or classification of income or distributions for financial statement and tax purposes.
U.S. GAAP and tax accounting differences primarily relate to differing treatment of mutual fund distributions received, losses on wash sale transactions, partnership interest tax allocations and redemption in-kind transactions.
The following reclassification represents the amount necessary to report the stated components of net assets on a tax basis, excluding certain temporary differences, as of February 29, 2008. The financial highlights exclude these adjustments.
11
GMO Global Balanced Asset Allocation Fund
(A Series of GMO Trust)
Notes to Financial Statements — (Continued)
February 29, 2008
| Accumulated Undistributed Net Investment Income | Accumulated Net Realized Gain | Paid-in Capital | |||||||||
| $ | 46,436,538 | $ | (53,033,315 | ) | $ | 6,596,777 | |||||
The tax character of distributions declared to shareholders is as follows:
| 2/29/2008 | 2/28/2007 | ||||||||||
| Ordinary income (including any short-term capital gains) | $ | 165,809,077 | $ | 104,092,536 | |||||||
| Long-term capital gains | 183,594,552 | 76,782,210 | |||||||||
| Total distributions | $ | 349,403,629 | $ | 180,874,746 | |||||||
Distributions in excess of tax basis earnings and profits, if significant, are reported in the financial statements as a tax return of capital.
As of February 29, 2008, the components of distributable earnings on a tax basis consisted of the following:
| Undistributed ordinary income | $ | 31,938,487 | |||||
| Undistributed long-term capital gain | $ | 107,504,961 | |||||
As of February 29, 2008, the Fund had capital loss carryforwards available to offset future realized gains if any, to the extent permitted by the Code. Utilization of the capital loss carryforwards could be subject to limitations imposed by the Code related to share ownership activity. Such losses expire as follows:
| 2/28/2010 | $ | (1,276 | ) | ||||
| Total | $ | (1,276 | ) | ||||
As of February 29, 2008, the approximate cost for U.S. federal income tax purposes and gross and net unrealized appreciation and depreciation in value of investments were as follows:
Aggregate Cost | Gross Unrealized Appreciation | Gross Unrealized (Depreciation) | Net Unrealized Appreciation (Depreciation) | ||||||||||||
| $ | 3,535,402,623 | $ | 27,871,816 | $ | (198,502,764 | ) | $ | (170,630,948 | ) | ||||||
For the period ended February 29, 2008, the Fund had net realized gains attributed to redemption in-kind transactions of $6,601,132.
12
GMO Global Balanced Asset Allocation Fund
(A Series of GMO Trust)
Notes to Financial Statements — (Continued)
February 29, 2008
Security transactions and related investment income
Security transactions are accounted for on trade date. Income dividends and capital gain distributions from the underlying funds are recorded on the ex-dividend date. Interest income is recorded on the accrual basis. Non-cash dividends, if any, are recorded at the fair market value of the securities received. In determining the net gain or loss on securities sold, the cost of securities is determined on the identified cost basis.
Expenses
The majority of expenses of the Trust are directly identifiable to an individual fund. Expenses which are not readily identifiable to a specific fund are allocated taking into consideration, among other things, the nature and type of expense and the relative size of the funds. In addition, the Fund will also incur certain fees and expenses indirectly as a shareholder in the underlying funds. Because the underlying funds have varied expense and fee levels and the Fund may own different proportions of the underlying funds at different times, the amount of fees and expenses indirectly incurred by the Fund will vary (See Note 3).
State Street Bank and Trust Company ("State Street") serves as custodian, fund accounting agent and transfer agent of the Fund. State Street's fee may be reduced by credits that are an earnings allowance calculated on the average daily cash balances the Fund maintains with State Street. Credit balances used to reduce the fee paid to State Street, if any, are reported as a reduction of expenses in the Statement of Operations.
Purchases and redemptions of Fund shares
As of February 29, 2008, the premium on cash purchases and fee on cash redemptions of Fund shares were each 0.09% of the amount invested or redeemed. The redemption fee is only applicable to shares acquired on or after June 30, 2003. The Fund's purchase premium and redemption fee are approximately equal to the weighted average of the purchase premiums and redemption fees, if any, of the underlying funds in which the Fund was invested as of June 30, 2007. The level of purchase premium and redemption fee for the Fund may be adjusted to account for changes in the Fund's investments (i.e., changes in the percentage of Fund assets allocated to each underlying fund). If the Manager determines that any portion of a cash purchase or redemption is offset by a corresponding cash redemption or purchase occurring on the same day, it will waive the purchase premium or redemption fee in an amount approximately equal to the fee with respect to that portion. In addition, the purchase premium or redemption fee charged by the Fund may be waived in extraordinary circumstances if the Fund will not incur transaction costs. All purchase premiums and redemption fees are paid to and recorded by the Fund as paid-in capital. The Manager will waive the purchase premium relating to the in-kind portion of a purchase transaction except to the extent of certain estimated or known transaction costs (e.g. stamp duties and transfer taxes) incurred by the Fund in connection with the transfer of the purchasing shareholder's securities to the Fund. In-kind redemption transactions are generally not subject to redemption fees except to the extent those transactions include a cash component. However, when a substantial portion of a Fund is being redeemed,
13
GMO Global Balanced Asset Allocation Fund
(A Series of GMO Trust)
Notes to Financial Statements — (Continued)
February 29, 2008
the Fund may assess estimated or known transaction costs. There is no premium for reinvested distributions.
Investment risks
The Fund is subject to the investment risks associated with an investment in the underlying funds, some of which may invest in foreign securities. There are certain additional risks involved in investing in foreign securities that are not inherent in investments in U.S. securities. These risks may involve adverse political and economic developments, including the possible imposition of capital controls or other foreign governmental laws or restrictions. In addition, the securities of some foreign companies and securities markets are less liquid and at times more volatile than securities of comparable U.S. companies and U.S. securities markets. The risks described above apply to an even greater extent to investments in emerging markets. The securities markets of emerging countries are generally smaller, less developed, less liquid, and more volatile than the securities markets of the U.S. and developed foreign markets. Additional ly, the investment risks associated with an investment in the underlying funds may be more pronounced to the extent that the underlying funds engage in derivative transactions.
Recently issued accounting pronouncements
In June 2006, the Financial Accounting Standards Board ("FASB") issued FASB Interpretation No. 48, Accounting for Uncertainty in Income Taxes – an Interpretation of FASB Statement No. 109 ("FIN 48"). FIN 48 clarifies the accounting for uncertainty in income taxes recognized in accordance with FASB Statement No. 109, Accounting for Income Taxes. FIN 48 prescribes a recognition threshold and measurement attribute for a tax position taken or expected to be taken in the tax return that could impact the Fund's financial statements. It also provides guidance in relation to the Fund's financial statements on classification of tax benefits or liabilities, interest and penalties, accounting in interim periods, disclosure, and transition. FIN 48 is effective for fiscal years beginning after December 15, 2006 for registered investment companies. Management has evaluated the effects of applying the various provisions of FIN 48 and has determined that the adoption of FIN 48 does not have a material effect on the Fund's financial statements. The Fund's federal tax returns for the prior three fiscal years, if applicable, remain subject to examination by the Internal Revenue Service. Management will continue to monitor the rules and guidance pertaining to FIN 48 and will take action if appropriate.
In September 2006, the FASB issued Statement of Financial Accounting Standards No. 157 ("FAS 157"), "Fair Value Measurements." FAS 157 defines fair value, establishes a framework for measuring fair value in accordance with generally accepted accounting principles and expands disclosure about fair value measurements. FAS 157 is effective for fiscal years beginning after November 15, 2007. Management is currently evaluating the impact the adoption of FAS 157 will have on the Fund's financial statement disclosures.
14
GMO Global Balanced Asset Allocation Fund
(A Series of GMO Trust)
Notes to Financial Statements — (Continued)
February 29, 2008
3. Fees and other transactions with affiliates
The Manager determines the allocation of the assets of the Fund among designated underlying funds. The Manager does not directly charge a management fee or shareholder service fee to the Fund, but receives management and shareholder service fees from the underlying funds in which the Fund invests.
The Manager has contractually agreed to reimburse the Fund for Fund expenses through at least June 30, 2008 (excluding expenses indirectly incurred by investment in the underlying funds, fees and expenses of the independent Trustees of the Trust, fees and expenses for legal services not approved by the Manager for the Trust, compensation and expenses of the Trust's Chief Compliance Officer ("CCO") (excluding any employee benefits), brokerage commissions, securities lending fees and expenses, interest expense, transfer taxes, and other investment-related costs (including expenses associated with investments in any company that is an investment company or would be an investment company under the 1940 Act, but for the exceptions to the definition of investment company provided in Section 3(c)(1) and 3(c)(7) of the 1940 Act), hedging transaction fees, extraordinary, non-recurring and certain other unusual expenses (including taxes)) .
The Fund incurs fees and expenses indirectly as a shareholder in the underlying funds. For the year ended February 29, 2008, these indirect fees and expenses expressed as an annualized percentage of the Fund's average daily net assets were as follows:
| Indirect Net Expenses (excluding shareholder service fees and interest expense) | Indirect Shareholder Service Fees | Indirect Interest Expense | Total Indirect Expenses | ||||||||||||
| 0.432 | % | 0.070 | % | 0.021 | % | 0.523 | % | ||||||||
The Fund's portion of the fees paid by the Trust to the independent Trustees and CCO during the year ended February 29, 2008 was $28,784 and $15,058, respectively. The compensation and expenses of the CCO are included in miscellaneous expenses in the Statement of Operations. No remuneration was paid by the Fund to any other officer of the Trust.
4. Purchases and sales of securities
Cost of purchases and proceeds from sales of securities, excluding short-term investments and class exchanges, for the year ended February 29, 2008 aggregated $3,212,061,908 and $2,683,242,531, respectively.
15
GMO Global Balanced Asset Allocation Fund
(A Series of GMO Trust)
Notes to Financial Statements — (Continued)
February 29, 2008
5. Guarantees
In the normal course of business the Fund enters into contracts with third-party service providers that contain a variety of representations and warranties and which provide general indemnifications. The Fund's maximum exposure under these arrangements is unknown, as this would involve future claims that may be made against the Fund that have not yet occurred. Based on experience, management is of the view that the risk of loss in connection with these potential indemnification obligations is remote; however, there can be no assurance that material liabilities related to such obligations will not arise in the future that could adversely impact the Fund.
6. Principal shareholders and related parties
As of February 29, 2008, 14.05% of the outstanding shares of the Fund were held by one shareholder. No other shareholder owned in excess of 10% of the outstanding shares of the Fund. Investment activities of this shareholder may have a material effect on the Fund.
As of February 29, 2008, 0.07% of the Fund's shares were held by fifteen related parties comprised of certain GMO employee accounts.
7. Share transactions
The Declaration of Trust permits the Trustees to issue an unlimited number of shares of beneficial interest (without par value). Transactions in Fund shares were as follows:
| Year Ended February 29, 2008 | Year Ended February 28, 2007 | ||||||||||||||||||
| Class III: | Shares | Amount | Shares | Amount | |||||||||||||||
| Shares sold | 71,503,366 | $ | 884,679,303 | 96,416,659 | $ | 1,162,398,617 | |||||||||||||
| Shares issued to shareholders in reinvestment of distributions | 28,319,819 | 339,998,843 | 14,544,192 | 171,981,824 | |||||||||||||||
| Shares repurchased | (60,342,225 | ) | (700,292,863 | ) | (8,670,747 | ) | (104,404,782 | ) | |||||||||||
| Purchase premiums | — | 770,412 | — | 982,849 | |||||||||||||||
| Redemption fees | — | 89,792 | — | 56,622 | |||||||||||||||
| Net increase (decrease) | 39,480,960 | $ | 525,245,487 | 102,290,104 | $ | 1,231,015,130 | |||||||||||||
16
GMO Global Balanced Asset Allocation Fund
(A Series of GMO Trust)
Notes to Financial Statements — (Continued)
February 29, 2008
8. Investments in affiliated issuers
A summary of the Fund's transactions in the shares of affiliated issuers during the year ended February 29, 2008 is set forth below:
| Affiliate | Value, beginning of period | Purchases | Sales Proceeds | Dividend Income | Distributions of Realized Gaines | Value, end of period | |||||||||||||||||||||
| GMO Alpha Only Fund, Class IV | $ | 380,002,186 | $ | 365,957,517 | $ | 235,335,214 | $ | 9,531,981 | $ | — | $ | 535,974,748 | |||||||||||||||
| GMO Alternative Asset Opportunity Fund, Class III | 62,157,956 | 81,595 | 60,714,048 | — | — | — | |||||||||||||||||||||
| GMO Core Plus Bond Fund, Class IV | 333,599,965 | 30,585,594 | 299,802,878 | 12,018,404 | — | 49,187,750 | |||||||||||||||||||||
| GMO Domestic Bond Fund, Class VI | 20,617,931 | 35,674,047 | 8,225,536 | 2,295,912 | — | 47,058,826 | |||||||||||||||||||||
| GMO Emerging Countries Fund, Class III | 21,889,917 | 8,710,245 | 3,943,408 | 462,107 | 8,219,499 | 24,700,654 | |||||||||||||||||||||
| GMO Emerging Country Debt Fund, Class IV | 11,833,586 | 1,400,642 | 1,675,124 | 873,442 | 511,577 | 10,781,541 | |||||||||||||||||||||
| GMO Emerging Markets Fund, Class VI | 275,288,575 | 124,006,412 | 58,155,880 | 5,024,777 | 88,521,015 | 325,787,540 | |||||||||||||||||||||
| GMO Inflation Indexed Plus Bond Fund, Class VI | 328,859,382 | 450,711,234 | 732,474,094 | 63,610,142 | 1,378,036 | — | |||||||||||||||||||||
| GMO International Bond Fund, Class III | 21,923,157 | 4,389,742 | 6,190,995 | 2,060,770 | — | 19,794,069 | |||||||||||||||||||||
| GMO International Core Equity Fund, Class VI | — | 545,754,532 | 146,849,712 | 7,814,178 | 21,417,380 | 353,485,226 | |||||||||||||||||||||
| GMO International Growth Equity Fund, Class IV | 271,341,941 | 56,715,312 | 123,024,975 | 3,033,004 | 40,757,306 | 178,541,031 | |||||||||||||||||||||
| GMO International Intrinsic Value Fund, Class IV | 271,767,810 | 51,550,431 | 108,941,665 | 5,899,697 | 31,814,808 | 177,101,792 | |||||||||||||||||||||
| GMO International Small Companies Fund, Class III | 4,237,261 | 152,419 | 4,220,247 | — | 146,870 | — | |||||||||||||||||||||
| GMO Short-Duration Investment Fund, Class III | 3,489,627 | 206,559 | 469,351 | 206,559 | — | 3,034,068 | |||||||||||||||||||||
| GMO Special Situations Fund, Class VI | — | 198,000,000 | 27,922,601 | — | — | 183,337,321 | |||||||||||||||||||||
| GMO Strategic Fixed Income Fund, Class VI | 307,603,773 | 875,419,406 | 328,927,357 | 17,732,681 | 1,087,637 | 825,676,074 | |||||||||||||||||||||
| GMO U.S. Core Equity Fund, Class VI | 489,370,403 | 56,562,573 | 447,434,047 | 1,610,649 | 9,564,858 | 83,499,236 | |||||||||||||||||||||
| GMO U.S. Quality Equity Fund, Class VI | 274,837,403 | 406,118,796 | 88,567,947 | 6,328,778 | 11,128,535 | 546,781,435 | |||||||||||||||||||||
| GMO U.S. Value Fund, Class III | 377,075 | 64,852 | 367,452 | 6,725 | 57,629 | — | |||||||||||||||||||||
| Totals | $ | 3,079,197,948 | $ | 3,212,061,908 | $ | 2,683,242,531 | $ | 138,509,806 | $ | 214,605,150 | $ | 3,364,741,311 | |||||||||||||||
17
Report of Independent Registered Public Accounting Firm
To the Trustees of GMO Trust and the Shareholders of
GMO Global Balanced Asset Allocation Fund
In our opinion, the accompanying statement of assets and liabilities, including the schedule of investments, and the related statements of operations and of changes in net assets and the financial highlights present fairly, in all material respects, the financial position of GMO Global Balanced Asset Allocation Fund (the "Fund") at February 29, 2008, the results of its operations for the year then ended, the changes in its net assets for each of the two years in the period then ended and the financial highlights for each of the five years in the period then ended, in conformity with accounting principles generally accepted in the United States of America. These financial statements and financial highlights (hereafter referred to as "financial statements") are the responsibility of the Fund's management; our responsibility is to express an opinion on these financial statements based on our audits. We conducted our audits of these financial statements in accordance with the standards of the Public Company Accounting Oversight Board (United States). Those standards require that we plan and perform the audit to obtain reasonable assurance about whether the financial statements are free of material misstatement. An audit includes examining, on a test basis, evidence supporting the amounts and disclosures in the financial statements, assessing the accounting principles used and significant estimates made by management, and evaluating the overall financial statement presentation. We believe that our audits, which included confirmation of securities at February 29, 2008 by correspondence with the custodian, provide a reasonable basis for our opinion.
PricewaterhouseCoopers LLP
Boston, Massachusetts
April 29, 2008
18
GMO Global Balanced Asset Allocation Fund
(A Series of GMO Trust)
Fund Expenses
February 29, 2008 (Unaudited)
Expense Examples: The following information is in relation to expenses for the six month period ended February 29, 2008.
As a shareholder of the Fund, you may incur two types of costs: (1) transaction costs, including purchase premiums and redemption fees; and (2) ongoing costs including indirect management fees, shareholder service fees, and other Fund expenses. This example is intended to help you understand your ongoing costs (in dollars) of investing in the Fund and to compare these costs with the ongoing costs of investing in other mutual funds.
These examples are based on an investment of $1,000 invested at the beginning of the period and held for the entire period, September 1, 2007 through February 29, 2008.
Actual Expenses
The first line of the table below provides information about actual account values and actual expenses. You may use the information in this line, together with the amount you invested, to estimate the expenses that you paid over the period. Simply divide your account value by $1,000 (for example, a $10,000,000 account value divided by $1,000 = 10,000), then multiply the result by the number in the first line under the heading entitled "Net Expense Incurred" to estimate the expenses you paid on your account during this period.
Hypothetical Example for Comparison Purposes
The second line of the table below provides information about hypothetical account values and hypothetical expenses based on the Fund's actual expense ratio and an assumed rate of return of 5% per year before expenses, which is not the Fund's actual return. The hypothetical account values and expenses may not be used to estimate the actual ending account balance or expenses you paid for the period. You may use this information to compare the ongoing costs of investing in the Fund with other funds. To do so, compare this 5% hypothetical example with the 5% hypothetical examples that appear in the shareholder reports of other funds.
Please note that the expenses shown in the table are meant to highlight your ongoing costs only and do not reflect any transactional costs, such as purchase premiums and redemption fees. Therefore, the second line of the table is useful in comparing ongoing costs only, and will not help you determine the relative total costs of owning different funds. In addition, if these transactional costs were included, your costs would have been higher.
| Annualized Net Expense Ratio | Beginning Account Value | Ending Account Value | Net Expense Incurred* | ||||||||||||||||
| Class III | |||||||||||||||||||
| 1) Actual | 0.53 | % | $ | 1,000.00 | $ | 989.90 | $ | 2.62 | |||||||||||
| 2) Hypothetical | 0.53 | % | $ | 1,000.00 | $ | 1,022.23 | $ | 2.66 | |||||||||||
* Expenses are calculated using the Class's annualized expense ratio (including indirect expenses incurred) for the six months ended February 29, 2008, multiplied by the average account value over the period, multiplied by 182 days in the period, divided by 366 days in the year.
19
GMO Global Balanced Asset Allocation Fund
(A Series of GMO Trust)
Tax Information for the Tax Year Ended February 29, 2008 (Unaudited)
The Fund will notify shareholders of amounts for use in preparing 2008 income tax forms in January 2009.
The Fund's distributions to shareholders include $183,594,552 from long-term capital gains.
For taxable, non-corporate shareholders, 23.37% of the income and short-term capital gains, if any, distributed in the Fund's fiscal year ended February 29, 2008 represents qualified dividend income subject to the 15% rate category.
For corporate shareholders, 6.75% of the income and short-term capital gains, if any, distributed in the Fund's fiscal year ended February 29, 2008 qualified for the dividends-received deduction.
The Fund hereby designates as qualified interest income and qualified short-term capital gains with respect to its taxable year ended February 29, 2008, $70,273,184 and $2,055,943, respectively, or if determined to be different, the qualified interest income and qualified short-term gains of such year.
20
Trustees and Officers (Unaudited)
The following tables list the Trust's Trustees and Officers as of the date of this report; their address and date of birth ("DOB"); their position with the Trust; the length of time holding that position with the Trust; their principal occupation(s) during the past five years; the number of portfolios in the fund complex they oversee; and other directorships they hold in companies subject to registration or reporting requirements of the Securities Exchange Act of 1934 (generally called "public companies") or in registered investment companies. The Trust's Statement of Additional Information ("SAI") includes additional information about the Trust's trustees, including changes subsequent to the date of the report. The SAI is available, without charge, upon request by writing GMO, c/o GMO Trust, 40 Rowes Wharf, Boston, MA 02110.
Independent Trustees:
| Name, Address, and DOB | Position(s) Held with Trust | Term of Office1 and Length of Time Served | Principal Occupation(s) During Past Five Years | Number of Portfolios in Fund Complex Overseen by Trustee | Other Directorships Held by Trustee | ||||||||||||||||||
| Donald W. Glazer, Esq. c/o GMO Trust 40 Rowes Wharf Boston, MA 02110 DOB: 07/26/1944 | Chairman of the Board of Trustees | Chairman of the Board of Trustees since March 2005; Lead Independent Trustee (September 2004 – March 2005); Trustee since December 2000. | Consultant – Law and Business2, Vice Chair (since 2002) and Secretary, Provant, Inc. (provider of personnel performance improvement services and training products); Author of Legal Treatises. | 47 | None. | ||||||||||||||||||
1 Each Trustee is elected to serve during the continued lifetime of the Trust until he/she dies, resigns or is removed, or if sooner, until the next meeting of Shareholders called for the purpose of electing Trustees and until the election and qualification of his/her successor.
2 As part of Mr. Glazer's work as a consultant, he provides part-time consulting services to Goodwin Procter LLP ("Goodwin"). Goodwin has provided legal services to Renewable Resources, LLC, an affiliate of GMO; GMO, in connection with its relationship with Renewable Resources; and funds managed by Renewable Resources. Mr. Glazer has represented that he has no financial interest in, and is not involved in the provision of, such legal services. In the calendar years ended December 31, 2006 and December 31, 2007, these entities paid $825,738 and $291,721 respectively, in legal fees and disbursements to Goodwin.
21
Independent Trustees — (Continued)
| Name, Address, and DOB | Position(s) Held with Trust | Term of Office1 and Length of Time Served | Principal Occupation(s) During Past Five Years | Number of Portfolios in Fund Complex Overseen by Trustee | Other Directorships Held by Trustee | ||||||||||||||||||
| Jay O. Light c/o GMO Trust 40 Rowes Wharf Boston, MA 02110 DOB: 10/03/1941 | Trustee | Since May 1996. | Dean (since April 2006), Acting Dean (August 2005 – April 2006), Senior Associate Dean (1998 – 2005), and Professor of Business Administration, Harvard Business School. | 47 | Director of Harvard Management Company, Inc.3 and Verde, Inc.; Director of Partners HealthCare System, Inc. and Chair of its Investment Committee.4 | ||||||||||||||||||
| W. Nicholas Thorndike c/o GMO Trust 40 Rowes Wharf Boston, MA 02110 DOB: 03/28/1933 | Trustee | Since March 2005. | Director or trustee of various corporations and charitable organizations, including Courier Corporation (a book publisher and manufacturer) (July 1989 – present); Putnam Funds (December 1992 – June 2004); and Providence Journal (a newspaper publisher) (December 1986 – December 2003). | 47 | Director of Courier Corporation (a book publisher and manufacturer); Member of the Investment Committee of Partners HealthCare System, Inc.4 | ||||||||||||||||||
1 Each Trustee is elected to serve during the continued lifetime of the Trust until he/she dies, resigns or is removed, or if sooner, until the next meeting of Shareholders called for the purpose of electing Trustees and until the election and qualification of his/her successor.
3 Harvard Management Company, Inc. is a client of the Manager.
4 Partners HealthCare System, Inc. is a client of the Manager.
22
Principal Officers:
| Name, Address, and DOB | Position(s) Held with Trust | Term of Office5 and Length of Time Served | Principal Occupation(s) During Past Five Years | ||||||||||||
| Scott Eston c/o GMO Trust 40 Rowes Wharf Boston, MA 02110 DOB: 01/20/1956 | President and Chief Executive Officer | President and Chief Executive Officer since October 2002; Chief Financial Officer, November 2006 – February 2007. | Chief Financial Officer, Chief Operating Officer and Member, Grantham, Mayo, Van Otterloo & Co. LLC. | ||||||||||||
| Sheppard N. Burnett c/o GMO Trust 40 Rowes Wharf Boston, MA 02110 DOB: 10/24/1968 | Treasurer and Chief Financial Officer | Chief Financial Officer since March 2007; Treasurer since November 2006; Assistant Treasurer, September 2004 – November 2006. | Fund Administration Staff, Grantham, Mayo, Van Otterloo & Co. LLC (June 2004 – present); Vice President, Director of Tax, Columbia Management Group (2002 – 2004). | ||||||||||||
| Brent C. Arvidson c/o GMO Trust 40 Rowes Wharf Boston, MA 02110 DOB: 06/26/1969 | Assistant Treasurer | Since August 1998. | Senior Fund Administrator, Grantham, Mayo, Van Otterloo & Co. LLC. | ||||||||||||
| John L. Nasrah c/o GMO Trust 40 Rowes Wharf Boston, MA 02110 DOB: 05/27/1977 | Assistant Treasurer | Since March 2007. | Fund Administrator, Grantham, Mayo, Van Otterloo & Co. LLC (September 2004 – present); Tax Analyst, Bain & Company, Inc (June 2003 – September 2004); Senior Tax Associate, PricewaterhouseCoopers LLP (2001 – 2003). | ||||||||||||
| Mahmoodur Rahman c/o GMO Trust 40 Rowes Wharf Boston, MA 02110 DOB: 11/30/1967 | Assistant Treasurer | Since September 2007. | Fund Administrator, Grantham, Mayo, Van Otterloo & Co. (April 2007 – present); Vice President and Senior Tax Manager, Massachusetts Financial Services Company (January 2000 – April 2007). | ||||||||||||
5 Officers are elected to hold such office until their successor is elected and qualified to carry out the duties and responsibilities of their office, or until he or she resigns or is removed from office.
23
Principal Officers — (Continued)
| Name, Address, and DOB | Position(s) Held with Trust | Term of Office5 and Length of Time Served | Principal Occupation(s) During Past Five Years | ||||||||||||
| Michael E. Gillespie c/o GMO Trust 40 Rowes Wharf Boston, MA 02110 DOB: 02/18/1958 | Chief Compliance Officer | Since March 2005. | Vice President of Compliance (June 2004 – February 2005) and Director of Domestic Compliance (March 2002 – June 2004), Fidelity Investments; Vice President and Senior Counsel, State Street Bank and Trust Company (May 1998 – March 2002). | ||||||||||||
| Jason B. Harrison c/o GMO Trust 40 Rowes Wharf Boston, MA 02110 DOB: 01/29/1977 | Vice President and Clerk | Vice President since November 2006; Clerk since March 2006. | Legal Counsel, Grantham, Mayo, Van Otterloo & Co. LLC (since February 2006) and Attorney, Ropes & Gray LLP (September 2002 – February 2006). | ||||||||||||
| David L. Bohan c/o GMO Trust 40 Rowes Wharf Boston, MA 02110 DOB: 06/21/1964 | Vice President and Assistant Clerk | Vice President since March 2005; Assistant Clerk since March 2006. | Legal Counsel, Grantham, Mayo, Van Otterloo & Co. LLC (September 2003 – present); Attorney, Goodwin Procter LLP (September 1996 – September 2003). | ||||||||||||
| Gregory L. Pottle c/o GMO Trust 40 Rowes Wharf Boston, MA 02110 DOB: 07/09/1971 | Vice President and Assistant Clerk | Since November 2006. | Legal Counsel, Grantham, Mayo, Van Otterloo & Co. LLC. | ||||||||||||
| Anne K. Trinque c/o GMO Trust 40 Rowes Wharf Boston, MA 02110 DOB: 04/15/1978 | Vice President and Assistant Clerk | Since September 2007. | Legal Counsel, Grantham, Mayo, Van Otterloo & Co. LLC (since January 2007); Attorney, Goodwin Procter LLP (September 2003 – January 2007). | ||||||||||||
| Cheryl Wakeham c/o GMO Trust 40 Rowes Wharf Boston, MA 02110 DOB: 10/29/1958 | Anti-Money Laundering Officer | Since December 2004. | Manager, Client Service Administration, Grantham, Mayo, Van Otterloo & Co. LLC. | ||||||||||||
5 Officers are elected to hold such office until their successor is elected and qualified to carry out the duties and responsibilities of their office, or until he or she resigns or is removed from office.
24
GMO International Equity Allocation Fund
(A Series of GMO Trust)
Annual Report
February 29, 2008
For a free copy of the Fund's proxy voting guidelines, shareholders may call 1-617-346-7646 (collect), visit our website at www.gmo.com, or visit the Securities and Exchange Commission's website at www.sec.gov. Information regarding how the Fund voted proxies relating to portfolio securities during the most recent 12-month period ended June 30 is available on our website at www.gmo.com, or on the Securities and Exchange Commission's website at www.sec.gov.
The Fund files its complete schedule of portfolio holdings with the Securities and Exchange Commission for the first and third quarter of each fiscal year on Form N-Q, which is available on the Commission's website at www.sec.gov. The Fund's Form N-Q may be reviewed and copied at the Commission's Public Reference Room in Washington, D.C. Information on the operation of the Public Reference Room may be obtained by calling 1-800-SEC-0330. The Fund has a policy with respect to disclosure of portfolio holdings under which it may also make available on GMO's website (www.gmo.com) a complete schedule of portfolio holdings.
This report is prepared for the general information of shareholders. It is authorized for distribution to prospective investors only when preceded or accompanied by a prospectus for the GMO Trust.
GMO International Equity Allocation Fund
(A Series of GMO Trust)
Portfolio Management
Day-to-day management of the Fund's portfolio is the responsibility of the Asset Allocation Team at Grantham, Mayo, Van Otterloo & Co. LLC.
Management Discussion and Analysis of Fund Performance
The GMO International Equity Allocation Fund returned +7.8% for the fiscal year ended February 29, 2008, as compared to +7.3% for the MSCI ACWI (All Country World Index) ex-U.S. Index. During the fiscal year the Fund was exposed to international equity securities through its investment in underlying GMO mutual funds.
Implementation detracted 0.9%, as the GMO Emerging Markets and GMO International Value Funds underperformed their respective benchmarks.
Asset allocation added 1.4%. The Fund's overweight to emerging equities was the primary driver of performance.
The views expressed herein are exclusively those of Grantham, Mayo, Van Otterloo & Co. LLC Management as of the date of this report and are subject to change. GMO disclaims any responsibility to update such views. They are not meant as investment advice.
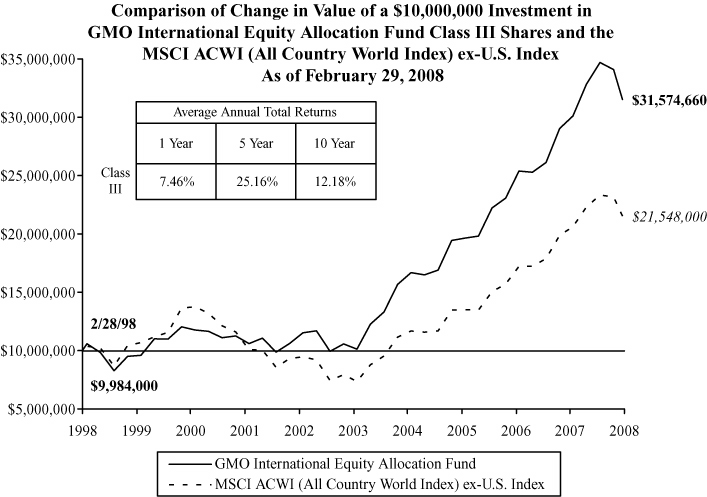
Performance data quoted represents past performance and is not indicative of future results. The investment return and principal value of an investment will fluctuate so that an investor's shares, when redeemed, may be worth more or less than their original cost. Current performance data may be lower or higher than the performance data provided herein. To obtain performance information to the most recent month-end, visit www.gmo.com. Performance shown is net of all fees after reimbursement from the Manager. Each performance figure assumes a purchase at the beginning and redemption at the end of the stated period and reflects a transaction fee of .16% on the purchase and .16% on the redemption. Transaction fees are retained by the Fund to cover trading costs. Returns would have been lower had certain expenses not been reimbursed during the periods shown and do not include the effect of taxes on distributions and redemptions. All information is unaudited.
GMO International Equity Allocation Fund
(A Series of GMO Trust)
Investments Concentration Summary
February 29, 2008 (Unaudited)
| Asset Class Summary* | % of Total Net Assets | ||||||
| Common Stocks | 91.2 | % | |||||
| Preferred Stocks | 3.7 | ||||||
| Short-Term Investments | 3.6 | ||||||
| Forward Currency Contracts | 0.3 | ||||||
| Private Equity Securities | 0.1 | ||||||
| Investment Funds | 0.1 | ||||||
| Debt Obligations | 0.0 | ||||||
| Rights and Warrants | 0.0 | ||||||
| Convertible Securities | 0.0 | ||||||
| Futures | (0.5 | ) | |||||
| Other | 1.5 | ||||||
| 100.0 | % | ||||||
* The table above incorporates aggregate indirect asset class exposure associated with investments in other funds of GMO Trust ("underlying funds").
1
GMO International Equity Allocation Fund
(A Series of GMO Trust)
Investments Concentration Summary — (Continued)
February 29, 2008 (Unaudited)
| Country / Region Summary** | % of Investments | ||||||
| Euro Region*** | 27.7 | % | |||||
| United Kingdom | 15.7 | ||||||
| Japan | 14.4 | ||||||
| Brazil | 5.1 | ||||||
| Switzerland | 5.0 | ||||||
| Korea | 4.5 | ||||||
| Australia | 4.3 | ||||||
| Taiwan | 3.7 | ||||||
| China | 2.3 | ||||||
| Hong Kong | 2.3 | ||||||
| Russia | 2.0 | ||||||
| Singapore | 1.9 | ||||||
| Canada | 1.6 | ||||||
| Thailand | 1.6 | ||||||
| India | 1.3 | ||||||
| Sweden | 1.3 | ||||||
| Malaysia | 1.1 | ||||||
| Denmark | 1.0 | ||||||
| Turkey | 0.7 | ||||||
| Norway | 0.6 | ||||||
| South Africa | 0.5 | ||||||
| Indonesia | 0.4 | ||||||
| Philippines | 0.4 | ||||||
| Hungary | 0.2 | ||||||
| Israel | 0.2 | ||||||
| Poland | 0.2 | ||||||
| 100.0 | % | ||||||
** The table above incorporates aggregate indirect country exposure associated with investments in the underlying funds. The table excludes short-term investments. The table includes exposure through the use of derivative contracts.
*** The "Euro Region" is comprised of Austria, Belgium, Finland, France, Germany, Greece, Ireland, Italy, Netherlands, Portugal and Spain.
2
GMO International Equity Allocation Fund
(A Series of GMO Trust)
Schedule of Investments
(showing percentage of total net assets)
February 29, 2008
| Shares / Par Value ($) | Description | Value ($) | |||||||||||||
| MUTUAL FUNDS — 100.0% | |||||||||||||||
| Affiliated Issuers — 100.0% | |||||||||||||||
| 1,594,440 | GMO Emerging Countries Fund, Class III | 24,331,147 | |||||||||||||
| 8,109,529 | GMO Emerging Markets Fund, Class VI | 165,596,573 | |||||||||||||
| 10,249,580 | GMO International Growth Equity Fund, Class IV | 283,913,374 | |||||||||||||
| 9,403,102 | GMO International Intrinsic Value Fund, Class IV | 281,716,937 | |||||||||||||
| TOTAL MUTUAL FUNDS (COST $700,107,606) | 755,558,031 | ||||||||||||||
| SHORT-TERM INVESTMENTS — 0.0% | |||||||||||||||
| 19,355 | Eurodollar Time Deposit, 2.00%, due 03/03/08 | 19,355 | |||||||||||||
| TOTAL SHORT-TERM INVESTMENTS (COST $19,355) | 19,355 | ||||||||||||||
| TOTAL INVESTMENTS — 100.0% (Cost $700,126,961) | 755,577,386 | ||||||||||||||
| Other Assets and Liabilities (net) — (0.0%) | (35,361 | ) | |||||||||||||
| TOTAL NET ASSETS — 100.0% | $ | 755,542,025 | |||||||||||||
Notes to Schedule of Investments:
As of February 29, 2008, 82.04% of the Net Assets of the Fund, through investments in the underlying funds, were valued using fair value prices based on models used by a third party vendor (Note 2).
See accompanying notes to the financial statements.
3
GMO International Equity Allocation Fund
(A Series of GMO Trust)
Statement of Assets and Liabilities — February 29, 2008
| Assets: | |||||||
| Investments in unaffiliated issuers, at value (cost $19,355) (Note 2) | $ | 19,355 | |||||
| Investments in affiliated issuers, at value (cost $700,107,606) (Notes 2 and 8) | 755,558,031 | ||||||
| Receivable for Fund shares sold | 3,749 | ||||||
| Receivable for expenses reimbursed by Manager (Note 3) | 8,729 | ||||||
| Total assets | 755,589,864 | ||||||
| Liabilities: | |||||||
| Payable to affiliate for (Note 3): | |||||||
| Trustees and Chief Compliance Officer of GMO Trust fees | 881 | ||||||
| Accrued expenses | 46,958 | ||||||
| Total liabilities | 47,839 | ||||||
| Net assets | $ | 755,542,025 | |||||
| Net assets consist of: | |||||||
| Paid-in capital | $ | 602,838,131 | |||||
| Accumulated net realized gain | 97,253,469 | ||||||
| Net unrealized appreciation | 55,450,425 | ||||||
| $ | 755,542,025 | ||||||
| Net assets attributable to: | |||||||
| Class III shares | $ | 755,542,025 | |||||
| Shares outstanding: | |||||||
| Class III | 45,936,690 | ||||||
| Net asset value per share: | |||||||
| Class III | $ | 16.45 | |||||
See accompanying notes to the financial statements.
4
GMO International Equity Allocation Fund
(A Series of GMO Trust)
Statement of Operations — Year Ended February 29, 2008
| Investment Income: | |||||||
| Dividends from affiliated issuers (Note 8) | $ | 13,693,703 | |||||
| Interest | 981 | ||||||
| Total investment income | 13,694,684 | ||||||
| Expenses: | |||||||
| Custodian, fund accounting agent and transfer agent fees | 46,599 | ||||||
| Audit and tax fees | 31,432 | ||||||
| Legal fees | 17,568 | ||||||
| Trustees fees and related expenses (Note 3) | 7,980 | ||||||
| Registration fees | 3,997 | ||||||
| Miscellaneous | 7,520 | ||||||
| Total expenses | 115,096 | ||||||
| Fees and expenses reimbursed by Manager (Note 3) | (103,617 | ) | |||||
| Expense reductions (Note 2) | (3 | ) | |||||
| Net expenses | 11,476 | ||||||
| Net investment income (loss) | 13,683,208 | ||||||
| Realized and unrealized gain (loss): | |||||||
| Net realized gain (loss) on: | |||||||
| Investments in affiliated issuers | 29,873,470 | ||||||
| Realized gains distributions from affiliated issuers (Note 8) | 134,728,510 | ||||||
| Net realized gain (loss) | 164,601,980 | ||||||
| Change in net unrealized appreciation (depreciation) on: | |||||||
| Investments in affiliated issuers | (115,404,606 | ) | |||||
| Net realized and unrealized gain (loss) | 49,197,374 | ||||||
| Net increase (decrease) in net assets resulting from operations | $ | 62,880,582 | |||||
See accompanying notes to the financial statements.
5
GMO International Equity Allocation Fund
(A Series of GMO Trust)
Statement of Changes in Net Assets
| Year Ended February 29, 2008 | Year Ended February 28, 2007 | ||||||||||
| Increase (decrease) in net assets: | |||||||||||
| Operations: | |||||||||||
| Net investment income (loss) | $ | 13,683,208 | $ | 13,139,578 | |||||||
| Net realized gain (loss) | 164,601,980 | 100,493,550 | |||||||||
| Change in net unrealized appreciation (depreciation) | (115,404,606 | ) | 11,639,862 | ||||||||
| Net increase (decrease) in net assets from operations | 62,880,582 | 125,272,990 | |||||||||
| Distributions to shareholders from: | |||||||||||
| Net investment income | |||||||||||
| Class III | (42,033,244 | ) | (32,342,398 | ) | |||||||
| Net realized gains | |||||||||||
| Class III | (90,134,712 | ) | (58,801,341 | ) | |||||||
| (132,167,956 | ) | (91,143,739 | ) | ||||||||
| Net share transactions (Note 7): | |||||||||||
| Class III | 65,994,952 | 65,087,399 | |||||||||
| Purchase premiums and redemption fees (Notes 2 and 7): | |||||||||||
| Class III | 77,341 | 20,199 | |||||||||
| Total increase (decrease) in net assets resulting from net share transactions, purchase premiums and redemption fees | 66,072,293 | 65,107,598 | |||||||||
| Total increase (decrease) in net assets | (3,215,081 | ) | 99,236,849 | ||||||||
| Net assets: | |||||||||||
| Beginning of period | 758,757,106 | 659,520,257 | |||||||||
| End of period | $ | 755,542,025 | $ | 758,757,106 | |||||||
See accompanying notes to the financial statements.
6
GMO International Equity Allocation Fund
(A Series of GMO Trust)
Financial Highlights
(For a Class III share outstanding throughout each period)
| Year Ended February 28/29, | |||||||||||||||||||||||
| 2008 | 2007 | 2006 | 2005 | 2004 | |||||||||||||||||||
| Net asset value, beginning of period | $ | 17.96 | $ | 17.13 | $ | 15.19 | $ | 12.83 | $ | 8.23 | |||||||||||||
| Income (loss) from investment operations: | |||||||||||||||||||||||
| Net investment income (loss)(a)† | 0.31 | 0.33 | 0.18 | 0.29 | 0.25 | ||||||||||||||||||
| Net realized and unrealized gain (loss) | 1.32 | 2.85 | 2.90 | 2.65 | 4.60 | ||||||||||||||||||
| Total from investment operations | 1.63 | 3.18 | 3.08 | 2.94 | 4.85 | ||||||||||||||||||
| Less distributions to shareholders: | |||||||||||||||||||||||
| From net investment income | (1.00 | ) | (0.83 | ) | (0.47 | ) | (0.42 | ) | (0.25 | ) | |||||||||||||
| From net realized gains | (2.14 | ) | (1.52 | ) | (0.67 | ) | (0.16 | ) | — | ||||||||||||||
| Total distributions | (3.14 | ) | (2.35 | ) | (1.14 | ) | (0.58 | ) | (0.25 | ) | |||||||||||||
| Net asset value, end of period | $ | 16.45 | $ | 17.96 | $ | 17.13 | $ | 15.19 | $ | 12.83 | |||||||||||||
| Total Return(b)(c) | 7.81 | % | 19.33 | % | 21.15 | % | 23.25 | % | 60.41 | % | |||||||||||||
| Ratios/Supplemental Data: | |||||||||||||||||||||||
| Net assets, end of period (000's) | $ | 755,542 | $ | 758,757 | $ | 659,520 | $ | 489,026 | $ | 256,277 | |||||||||||||
| Net expenses to average daily net assets(d)(e) | 0.00 | %(f) | 0.00 | % | 0.00 | % | 0.00 | % | 0.00 | % | |||||||||||||
| Net investment income to average daily net assets(a) | 1.66 | % | 1.87 | % | 1.15 | % | 2.18 | % | 2.35 | % | |||||||||||||
| Portfolio turnover rate | 9 | % | 4 | % | 7 | % | 15 | % | 43 | % | |||||||||||||
| Fees and expenses reimbursed by the Manager to average daily net assets: | 0.01 | % | 0.01 | % | 0.02 | % | 0.03 | % | 0.05 | % | |||||||||||||
| Purchase premiums and redemption fees consisted of the following per share amounts:† | $ | 0.00 | (g) | $ | 0.00 | (g) | $ | 0.00 | (g) | $ | 0.01 | $ | 0.02 | ||||||||||
(a) Net investment income is affected by the timing of the declaration of dividends by the underlying funds in which the Fund invests.
(b) The total returns would have been lower had certain expenses not been reimbursed during the periods shown and assumes the effect of reinvested distributions.
(c) Calculation excludes purchase premiums and redemption fees which are borne by the shareholder.
(d) Net expenses exclude expenses incurred indirectly through investment in the underlying funds (See Note 3).
(e) Net expenses to average daily net assets were less than 0.01%.
(f) The net expense ratio does not include the effect of expense reductions.
(g) Purchase premiums and redemption fees were less than $0.01 per share.
† Calculated using average shares outstanding throughout the period.
See accompanying notes to the financial statements.
7
GMO International Equity Allocation Fund
(A Series of GMO Trust)
Notes to Financial Statements
February 29, 2008
1. Organization
GMO International Equity Allocation Fund (the "Fund") is a series of GMO Trust (the "Trust"). The Fund is registered under the Investment Company Act of 1940, as amended, as an open-end, diversified management investment company. The Fund is advised and managed by Grantham, Mayo, Van Otterloo & Co. LLC (the "Manager" or "GMO"). The Trust was established as a Massachusetts business trust under the laws of the Commonwealth of Massachusetts on June 24, 1985. The Declaration of Trust permits the Trustees of the Trust ("Trustees") to create an unlimited number of series of shares ("Funds") and to subdivide Funds into classes.
The Fund seeks total return greater than that of the MSCI ACWI (All Country World Index) ex-U.S. Index. The Fund is a fund of funds and invests primarily in shares of the GMO International Equity Funds (which may include one or more of the GMO Emerging Markets Funds). The Fund may also invest in shares of other GMO Funds, including the GMO Fixed Income Funds, GMO Alpha Only Fund, and GMO Alternative Asset Opportunity Fund.
The financial statements of the series of the Trust in which the Fund invests ("underlying funds") should be read in conjunction with the Fund's financial statements. These financial statements are available, without charge, upon request, by calling (617) 346-7646 (collect) or by visiting GMO's website at www.gmo.com.
The Fund currently limits subscriptions due to capacity considerations.
2. Significant accounting policies
The following is a summary of significant accounting policies which are in conformity with accounting principles generally accepted in the United States of America ("U.S. GAAP") and which are consistently followed by the Fund in the preparation of its financial statements. The preparation of financial statements in accordance with U.S. GAAP requires management to make estimates and assumptions that affect the reported amounts and disclosures in the financial statements. Actual results could differ from those estimates. The accounting records of the Fund are maintained in U.S. dollars.
Portfolio valuation
Shares of the underlying funds and other mutual funds are valued at their net asset value.
Investments held by the underlying funds are valued as follows. Securities listed on a securities exchange for which market quotations are readily available are valued at the last sale price or official closing price on each business day, or if there is no such reported sale or official closing price, at the most recent quoted bid price. Unlisted securities for which market quotations are readily available are generally valued at the most recent quoted bid price. Short-term investments with a remaining maturity of sixty days or less are generally valued at amortized cost, which approximates fair value. Securities for which quotations are not readily available or whose values the Manager has determined to be unreliable are valued at fair value as
8
GMO International Equity Allocation Fund
(A Series of GMO Trust)
Notes to Financial Statements — (Continued)
February 29, 2008
determined in good faith by the Trustees or other persons acting at their direction pursuant to procedures approved by the Trustees. By its nature, a fair value price is a good faith estimate of the value of a security at a given point in time and may not reflect the value that would be realized if the security was sold and the differences could be material. Because many foreign equity securities markets and exchanges close prior to the close of the New York Stock Exchange ("NYSE"), closing prices for foreign securities in those markets or on those exchanges do not reflect the events that occur after that close but before the close of the NYSE. As a result, foreign equity securities are generally valued using fair value prices supplied by a third party vendor based on models to the extent that these fair value prices are available.
Repurchase agreements
The Fund may enter into repurchase agreements with banks and broker-dealers whereby the Fund acquires a security for cash and obtains a simultaneous commitment from the seller to repurchase the security at an agreed upon price and date. The Fund, through its custodian, takes possession of securities collateralizing the repurchase agreement. The collateral is marked to market daily to ensure that the market value of the underlying assets remains sufficient to protect the Fund in the event of default by the seller. Collateral for certain tri-party repurchase agreements is held at the counterparty's custodian in a segregated account for the benefit of the Fund and the counterparty. In connection with transactions in repurchase agreements, if the seller defaults or enters into insolvency proceedings and the value of the collateral declines, recovery of cash by the Fund may be delayed or limited. There were no repurchase agreements o utstanding at the end of the period.
Taxes and distributions
The Fund intends to qualify each tax year as a regulated investment company under Subchapter M of the Internal Revenue Code of 1986, as amended (the "Code"). The Fund intends to distribute substantially all of its net investment income and net realized short-term and long-term capital gains, if any, after giving effect to any available capital loss carryovers for U.S. federal income tax purposes. Therefore, no provision for U.S. federal income or excise tax is necessary.
The Fund's policy is to declare and pay distributions from net investment income, if any, semiannually, and from net realized short-term and long-term capital gains, if any, at least annually. All distributions are paid in shares of the Fund, at net asset value, unless the shareholder elects to receive cash distributions. Distributions to shareholders are recorded by the Fund on the ex-dividend date.
Income and capital gain distributions are determined in accordance with U.S. federal income tax regulations, which may differ from U.S. GAAP. Certain capital accounts in the financial statements are periodically adjusted for permanent differences in order to reflect their tax character. These adjustments have no impact on net assets or net asset value per share. Temporary differences which arise from recognizing certain items of income, expense, gain or loss in different periods for financial statement and tax purposes will reverse at some time in the future. Distributions in excess of net investment income or net realized gains are temporary over distributions for financial statement purposes resulting from differences in the recognition or classification of income or distributions for financial statement and tax purposes.
9
GMO International Equity Allocation Fund
(A Series of GMO Trust)
Notes to Financial Statements — (Continued)
February 29, 2008
U.S. GAAP and tax accounting differences primarily relate to differing treatment of mutual fund distributions received.
The following reclassification represents the amount necessary to report the stated components of net assets on a tax basis, excluding certain temporary differences, as of February 29, 2008. The financial highlights exclude these adjustments.
| Distributions In Excess Of Net Investment Income | Accumulated Net Realized Gain | Paid-in Capital | |||||||||
| $ | 28,350,036 | $ | (28,350,037 | ) | $ | 1 | |||||
The tax character of distributions declared to shareholders is as follows:
| 2/29/2008 | 2/28/2007 | ||||||||||
| Ordinary income (including any short-term capital gains) | $ | 42,017,444 | $ | 32,338,744 | |||||||
| Long-term capital gains | 90,150,512 | 58,804,995 | |||||||||
| Total distributions | $ | 132,167,956 | $ | 91,143,739 | |||||||
Distributions in excess of tax basis earnings and profits, if significant, are reported in the financial statements as a tax return of capital.
As of February 29, 2008, the components of distributable earnings on a tax basis consisted of the following:
| Undistributed long-term capital gain | $ | 97,253,469 | |||||
As of February 29, 2008, the approximate cost for U.S. federal income tax purposes and gross and net unrealized appreciation and depreciation in value of investments were as follows:
| Aggregate Cost | Gross Unrealized Appreciation | Gross Unrealized (Depreciation) | Net Unrealized Appreciation (Depreciation) | ||||||||||||
| $ | 700,126,961 | $ | 79,859,610 | $ | (24,409,185 | ) | $ | 55,450,425 | |||||||
Security transactions and related investment income
Security transactions are accounted for on trade date. Income dividends and capital gain distributions from the underlying funds are recorded on the ex-dividend date. Interest income is recorded on the accrual basis. Non-cash dividends, if any, are recorded at the fair market value of the securities received. In determining the net gain or loss on securities sold, the cost of securities is determined on the identified cost basis.
10
GMO International Equity Allocation Fund
(A Series of GMO Trust)
Notes to Financial Statements — (Continued)
February 29, 2008
Expenses
The majority of expenses of the Trust are directly identifiable to an individual fund. Expenses which are not readily identifiable to a specific fund are allocated taking into consideration, among other things, the nature and type of expense and the relative size of the funds. In addition, the Fund will also incur certain fees and expenses indirectly as a shareholder in the underlying funds. Because the underlying funds have varied expense and fee levels and the Fund may own different proportions of the underlying funds at different times, the amount of fees and expenses indirectly incurred by the Fund will vary (See Note 3).
State Street Bank and Trust Company ("State Street") serves as custodian, fund accounting agent and transfer agent of the Fund. State Street's fee may be reduced by credits that are an earnings allowance calculated on the average daily cash balances the Fund maintains with State Street. Credit balances used to reduce the fee paid to State Street, if any, are reported as a reduction of expenses in the Statement of Operations.
Purchases and redemptions of Fund shares
As of February 29, 2008, the premium on cash purchases and fee on cash redemptions of Fund shares are each 0.16% of the amount invested. The redemption fee is only applicable to shares acquired on or after June 30, 2003. The Fund's purchase premium or redemption fee are approximately equal to the weighted average of the purchase premiums and redemptions fees, if any, of the underlying funds in which the Fund was invested as of June 30, 2007. The level of purchase premium and redemption fee for the Fund may be adjusted to account for changes in the Fund's investments (i.e., changes in the percentage of Fund assets allocated to each underlying fund). If the Manager determines that any portion of a cash purchase or redemption is offset by a corresponding cash redemption or purchase occurring on the same day, it will waive the purchase premium or redemption fee in an amount approximately equal to the fee with respect to that portion . In addition, the purchase premium or redemption fee charged by the Fund may be waived in extraordinary circumstances if the Fund will not incur transaction costs. All purchase premiums and redemption fees are paid to and recorded by the Fund as paid-in capital. The Manager will waive the purchase premium relating to the in-kind portion of a purchase transaction except to the extent of certain estimated or known transaction costs (e.g. stamp duties and transfer taxes) incurred by the Fund in connection with the transfer of the purchasing shareholder's securities to the Fund. In-kind redemption transactions are generally not subject to redemption fees except to the extent those transactions include a cash component. However, when a substantial portion of a Fund is being redeemed, the Fund may assess estimated or known transaction costs. There is no premium for reinvested distributions.
Investment risks
The Fund is subject to the investment risks associated with an investment in the underlying funds, some of which may invest in foreign securities. There are certain additional risks involved in investing in foreign securities that are not inherent in investments in U.S. securities. These risks may involve adverse political and economic developments, including the possible imposition of capital controls or other foreign governmental laws or restrictions. In addition, the securities of some foreign companies and securities markets are less liquid and at times more volatile than securities of comparable U.S. companies and U.S. securities markets. The risks described above apply to an even greater extent to investments in
11
GMO International Equity Allocation Fund
(A Series of GMO Trust)
Notes to Financial Statements — (Continued)
February 29, 2008
emerging markets. The securities markets of emerging countries are generally smaller, less developed, less liquid, and more volatile than the securities markets of the U.S. and developed foreign markets. Additionally, the investment risks associated with an investment in the underlying funds may be more pronounced to the extent that the underlying funds engage in derivative transactions.
Recently issued accounting pronouncements
In June 2006, the Financial Accounting Standards Board ("FASB") issued FASB Interpretation No. 48, Accounting for Uncertainty in Income Taxes – an Interpretation of FASB Statement No. 109 ("FIN 48"). FIN 48 clarifies the accounting for uncertainty in income taxes recognized in accordance with FASB Statement No. 109, Accounting for Income Taxes. FIN 48 prescribes a recognition threshold and measurement attribute for a tax position taken or expected to be taken in the tax return that could impact the Fund's financial statements. It also provides guidance in relation to the Fund's financial statements on classification of tax benefits or liabilities, interest and penalties, accounting in interim periods, disclosure, and transition. FIN 48 is effective for fiscal years beginning after December 15, 2006 for registered investment companies. Management has evaluated the effects of applying the various provisions of FIN 48 and has determined that the adoption of FIN 48 does not have a material effect on the Fund's financial statements. The Fund's federal tax returns for the prior three fiscal years, if applicable, remain subject to examination by the Internal Revenue Service. Management will continue to monitor the rules and guidance pertaining to FIN 48 and will take action if appropriate.
In September 2006, the FASB issued Statement of Financial Accounting Standards No. 157 ("FAS 157"), "Fair Value Measurements." FAS 157 defines fair value, establishes a framework for measuring fair value in accordance with generally accepted accounting principles and expands disclosure about fair value measurements. FAS 157 is effective for fiscal years beginning after November 15, 2007. Management is currently evaluating the impact the adoption of FAS 157 will have on the Fund's financial statement disclosures.
3. Fees and other transactions with affiliates
The Manager determines the allocation of the assets of the Fund among the designated underlying funds. The Manager does not directly charge a management fee or shareholder service fee, but receives management and shareholder service fees from the underlying funds in which the Fund invests.
The Manager has contractually agreed to reimburse the Fund for Fund expenses through at least June 30, 2008 (excluding expenses indirectly incurred by investment in the underlying funds, fees and expenses of the independent Trustees of the Trust, fees and expenses for legal services not approved by the Manager for the Trust, compensation and expenses of the Trust's Chief Compliance Officer ("CCO") (excluding any employee benefits), brokerage commissions, securities lending fees and expenses, interest expense, transfer taxes, and other investment-related costs (including expenses associated with investments in any company that is an investment company or would be an investment company under the 1940 Act, but for the exceptions to the
12
GMO International Equity Allocation Fund
(A Series of GMO Trust)
Notes to Financial Statements — (Continued)
February 29, 2008
definition of investment company provided in Section 3(c)(1) and 3(c)(7) of the 1940 Act), hedging transaction fees, extraordinary, non-recurring and certain other unusual expenses (including taxes)).
The Fund incurs fees and expenses indirectly as a shareholder in the underlying funds. For the year ended February 29, 2008, these indirect fees and expenses expressed as an annualized percentage of the Fund's average daily net assets were as follows:
| Indirect Net Expenses (excluding shareholder service fees) | Indirect Shareholder Service Fees | Total Indirect Expenses | |||||||||
| 0.631 | % | 0.084 | % | 0.715 | % | ||||||
The Fund's portion of the fees paid by the Trust to the independent Trustees and CCO during the year ended February 29, 2008 was $6,876 and $3,486, respectively. The compensation and expenses of the CCO are included in miscellaneous expenses in the Statement of Operations. No remuneration was paid by the Fund to any other officer of the Trust.
4. Purchases and sales of securities
Cost of purchases and proceeds from sales of securities, excluding short-term investments and class exchanges, for the year ended February 29, 2008 aggregated $153,880,308 and $71,563,297, respectively.
5. Guarantees
In the normal course of business the Fund enters into contracts with third-party service providers that contain a variety of representations and warranties and which provide general indemnifications. The Fund's maximum exposure under these arrangements is unknown, as this would involve future claims that may be made against the Fund that have not yet occurred. Based on experience, management is of the view that the risk of loss in connection with these potential indemnification obligations is remote; however, there can be no assurance that material liabilities related to such obligations will not arise in the future that could adversely impact the Fund.
6. Principal shareholders and related parties
As of February 29, 2008, 29.14% of the outstanding shares of the Fund were held by two shareholders, each holding in excess of 10% of the Fund's outstanding shares. No other shareholder owned in excess of 10% of the outstanding shares of the Fund. Investment activities of these shareholders may have a material effect on the Fund.
As of February 29, 2008, 0.02% of the Fund's shares were held by four related parties comprised of certain GMO employee accounts.
13
GMO International Equity Allocation Fund
(A Series of GMO Trust)
Notes to Financial Statements — (Continued)
February 29, 2008
7. Share transactions
| Year Ended February 29, 2008 | Year Ended February 28, 2007 | ||||||||||||||||||
| Class III: | Shares | Amount | Shares | Amount | |||||||||||||||
| Shares sold | 25,844 | $ | 478,479 | 77,925 | $ | 1,404,568 | |||||||||||||
| Shares issued to shareholders in reinvestment of distributions | 6,819,633 | 126,019,627 | 4,812,509 | 84,216,341 | |||||||||||||||
| Shares repurchased | (3,144,468 | ) | (60,503,154 | ) | (1,145,352 | ) | (20,533,510 | ) | |||||||||||
| Purchase premiums | — | 742 | — | 2,056 | |||||||||||||||
| Redemption fees | — | 76,599 | — | 18,143 | |||||||||||||||
| Net increase (decrease) | 3,701,009 | $ | 66,072,293 | 3,745,082 | $ | 65,107,598 | |||||||||||||
8. Investments in affiliated issuers
A summary of the Fund's transactions in the shares of affiliated issuers during the year ended February 29, 2008 is set forth below:
| Affiliate | Value, beginning of period | Purchases | Sales Proceeds | Dividend Income | Distributions of Realized Gains | Value, end of period | |||||||||||||||||||||
| GMO Emerging Countries Fund, Class III | $ | 18,624,705 | $ | 7,374,423 | $ | 7,000 | $ | 392,529 | $ | 6,981,895 | $ | 24,331,147 | |||||||||||||||
| GMO Emerging Markets Fund, Class VI | 146,067,671 | 44,329,944 | 22,307,561 | 2,366,774 | 41,863,170 | 165,596,573 | |||||||||||||||||||||
| GMO International Growth Equity Fund, Class IV | 295,016,842 | 54,167,876 | 30,806,933 | 3,707,736 | 48,009,094 | 283,913,374 | |||||||||||||||||||||
| GMO International Intrinsic Value Fund, Class IV | 297,957,461 | 47,969,798 | 17,342,231 | 7,226,664 | 37,836,085 | 281,716,937 | |||||||||||||||||||||
| GMO International Small Companies Fund, Class III | 1,105,478 | 38,267 | 1,099,572 | — | 38,266 | — | |||||||||||||||||||||
| Totals | $ | 758,772,157 | $ | 153,880,308 | $ | 71,563,297 | $ | 13,693,703 | $ | 134,728,510 | $ | 755,558,031 | |||||||||||||||
14
Report of Independent Registered Public Accounting Firm
To the Trustees of GMO Trust and the Shareholders of
GMO International Equity Allocation Fund
In our opinion, the accompanying statement of assets and liabilities, including the schedule of investments, and the related statements of operations and of changes in net assets and the financial highlights present fairly, in all material respects, the financial position of GMO International Equity Allocation Fund (the "Fund") at February 29, 2008, the results of its operations for the year then ended, the changes in its net assets for each of the two years in the period then ended and the financial highlights for each of the five years in the period then ended, in conformity with accounting principles generally accepted in the United States of America. These financial statements and financial highlights (hereafter referred to as "financial statements") are the responsibility of the Fund's management; our responsibility is to express an opinion on these financial statements based on our audits. We conducted our audits of these financial statements in accordance with the standards of the Public Company Accounting Oversight Board (United States). Those standards require that we plan and perform the audit to obtain reasonable assurance about whether the financial statements are free of material misstatement. An audit includes examining, on a test basis, evidence supporting the amounts and disclosures in the financial statements, assessing the accounting principles used and significant estimates made by management, and evaluating the overall financial statement presentation. We believe that our audits, which included confirmation of securities at February 29, 2008 by correspondence with the custodian, provide a reasonable basis for our opinion.
PricewaterhouseCoopers LLP
Boston, Massachusetts
April 29, 2008
15
GMO International Equity Allocation Fund
(A Series of GMO Trust)
Fund Expenses
February 29, 2008 (Unaudited)
Expense Examples: The following information is in relation to expenses for the six month period ended February 29, 2008.
As a shareholder of the Fund, you may incur two types of costs: (1) transaction costs, including purchase premiums and redemption fees; and (2) ongoing costs including indirect management fees, shareholder service fees, and other Fund expenses. This example is intended to help you understand your ongoing costs (in dollars) of investing in the Fund and to compare these costs with the ongoing costs of investing in other mutual funds.
These examples are based on an investment of $1,000 invested at the beginning of the period and held for the entire period, September 1, 2007 through February 29, 2008.
Actual Expenses
The first line of the table below provides information about actual account values and actual expenses. You may use the information in this line, together with the amount you invested, to estimate the expenses that you paid over the period. Simply divide your account value by $1,000 (for example, a $10,000,000 account value divided by $1,000 = 10,000), then multiply the result by the number in the first line under the heading entitled "Net Expense Incurred" to estimate the expenses you paid on your account during this period.
Hypothetical Example for Comparison Purposes
The second line of the table below provides information about hypothetical account values and hypothetical expenses based on the Fund's actual expense ratio and an assumed rate of return of 5% per year before expenses, which is not the Fund's actual return. The hypothetical account values and expenses may not be used to estimate the actual ending account balance or expenses you paid for the period. You may use this information to compare the ongoing costs of investing in the Fund with other funds. To do so, compare this 5% hypothetical example with the 5% hypothetical examples that appear in the shareholder reports of other funds.
Please note that the expenses shown in the table are meant to highlight your ongoing costs only and do not reflect any transactional costs, such as purchase premiums and redemption fees. Therefore, the second line of the table is useful in comparing ongoing costs only, and will not help you determine the relative total costs of owning different funds. In addition, if these transactional costs were included, your costs would have been higher.
| Annualized Net Expense Ratio | Beginning Account Value | Ending Account Value | Net Expense Incurred* | ||||||||||||||||
| Class III | |||||||||||||||||||
| 1) Actual | 0.73 | % | $ | 1,000.00 | $ | 973.20 | $ | 3.58 | |||||||||||
| 2) Hypothetical | 0.73 | % | $ | 1,000.00 | $ | 1,021.23 | $ | 3.67 | |||||||||||
* Expenses are calculated using the Class's annualized net expense ratio (including indirect expenses incurred) for the six months ended February 29, 2008, multiplied by the average account value over the period, multiplied by 182 days in the period, divided by 366 days in the year.
16
GMO International Equity Allocation Fund
(A Series of GMO Trust)
Tax Information for the Tax Year Ended February 29, 2008 (Unaudited)
The Fund will notify shareholders of amounts for use in preparing 2008 income tax forms in January 2009.
The Fund's distributions to shareholders include $90,150,512 from long-term capital gains.
For taxable, non-corporate shareholders, 36.57% of the income and short-term capital gains, if any, distributed in the Fund's fiscal year ended February 29, 2008 represents qualified dividend income subject to the 15% rate category.
The Fund hereby designates as qualified interest income with respect to its taxable year ended February 29, 2008, $25,720,142 or if determined to be different, the qualified interest income of such year.
17
Trustees and Officers (Unaudited)
The following tables list the Trust's Trustees and Officers as of the date of this report; their address and date of birth ("DOB"); their position with the Trust; the length of time holding that position with the Trust; their principal occupation(s) during the past five years; the number of portfolios in the fund complex they oversee; and other directorships they hold in companies subject to registration or reporting requirements of the Securities Exchange Act of 1934 (generally called "public companies") or in registered investment companies. The Trust's Statement of Additional Information ("SAI") includes additional information about the Trust's trustees, including changes subsequent to the date of the report. The SAI is available, without charge, upon request by writing GMO, c/o GMO Trust, 40 Rowes Wharf, Boston, MA 02110.
Independent Trustees:
| Name, Address, and DOB | Position(s) Held with Trust | Term of Office1 and Length of Time Served | Principal Occupation(s) During Past Five Years | Number of Portfolios in Fund Complex Overseen by Trustee | Other Directorships Held by Trustee | ||||||||||||||||||
| Donald W. Glazer, Esq. c/o GMO Trust 40 Rowes Wharf Boston, MA 02110 DOB: 07/26/1944 | Chairman of the Board of Trustees | Chairman of the Board of Trustees since March 2005; Lead Independent Trustee (September 2004 – March 2005); Trustee since December 2000. | Consultant – Law and Business2; Vice Chair (since 2002) and Secretary, Provant, Inc. (provider of personnel performance improvement services and training products); Author of Legal Treatises. | 47 | None. | ||||||||||||||||||
1 Each Trustee is elected to serve during the continued lifetime of the Trust until he/she dies, resigns or is removed, or if sooner, until the next meeting of Shareholders called for the purpose of electing Trustees and until the election and qualification of his/her successor.
2 As part of Mr. Glazer's work as a consultant, he provides part-time consulting services to Goodwin Procter LLP ("Goodwin"). Goodwin has provided legal services to Renewable Resources, LLC, an affiliate of GMO; GMO, in connection with its relationship with Renewable Resources; and funds managed by Renewable Resources. Mr. Glazer has represented that he has no financial interest in, and is not involved in the provision of, such legal services. In the calendar years ended December 31, 2006 and December 31, 2007, these entities paid $825,738 and $291,721 respectively, in legal fees and disbursements to Goodwin.
18
Independent Trustees — (Continued)
| Name, Address, and DOB | Position(s) Held with Trust | Term of Office1 and Length of Time Served | Principal Occupation(s) During Past Five Years | Number of Portfolios in Fund Complex Overseen by Trustee | Other Directorships Held by Trustee | ||||||||||||||||||
| Jay O. Light c/o GMO Trust 40 Rowes Wharf Boston, MA 02110 DOB: 10/03/1941 | Trustee | Since May 1996. | Dean (since April 2006), Acting Dean (August 2005 – April 2006), Senior Associate Dean (1998 – 2005), and Professor of Business Administration, Harvard Business School. | 47 | Director of Harvard Management Company, Inc.3 and Verde, Inc.; Director of Partners HealthCare System, Inc. and Chair of its Investment Committee.4 | ||||||||||||||||||
| W. Nicholas Thorndike c/o GMO Trust 40 Rowes Wharf Boston, MA 02110 DOB: 03/28/1933 | Trustee | Since March 2005. | Director or trustee of various corporations and charitable organizations, including Courier Corporation (a book publisher and manufacturer) (July 1989 – present); Putnam Funds (December 1992 – June 2004); and Providence Journal (a newspaper publisher) (December 1986 – December 2003). | 47 | Director of Courier Corporation (a book publisher and manufacturer); Member of the Investment Committee of Partners HealthCare System, Inc.4 | ||||||||||||||||||
1 Each Trustee is elected to serve during the continued lifetime of the Trust until he/she dies, resigns or is removed, or if sooner, until the next meeting of Shareholders called for the purpose of electing Trustees and until the election and qualification of his/her successor.
3 Harvard Management Company, Inc. is a client of the Manager.
4 Partners HealthCare System, Inc. is a client of the Manager.
19
Principal Officers:
| Name, Address, and DOB | Position(s) Held with Trust | Term of Office5 and Length of Time Served | Principal Occupation(s) During Past Five Years | ||||||||||||
| Scott Eston c/o GMO Trust 40 Rowes Wharf Boston, MA 02110 DOB: 01/20/1956 | President and Chief Executive Officer | President and Chief Executive Officer since October 2002; Chief Financial Officer, November 2006 – February 2007. | Chief Financial Officer, Chief Operating Officer and Member, Grantham, Mayo, Van Otterloo & Co. LLC. | ||||||||||||
| Sheppard N. Burnett c/o GMO Trust 40 Rowes Wharf Boston, MA 02110 DOB: 10/24/1968 | Treasurer and Chief Financial Officer | Chief Financial Officer since March 2007; Treasurer since November 2006; Assistant Treasurer, September 2004 – November 2006. | Fund Administration Staff, Grantham, Mayo, Van Otterloo & Co. LLC (June 2004 – present); Vice President, Director of Tax, Columbia Management Group (2002 – 2004). | ||||||||||||
| Brent C. Arvidson c/o GMO Trust 40 Rowes Wharf Boston, MA 02110 DOB: 06/26/1969 | Assistant Treasurer | Since August 1998. | Senior Fund Administrator, Grantham, Mayo, Van Otterloo & Co. LLC. | ||||||||||||
| John L. Nasrah c/o GMO Trust 40 Rowes Wharf Boston, MA 02110 DOB: 05/27/1977 | Assistant Treasurer | Since March 2007. | Fund Administrator, Grantham, Mayo, Van Otterloo & Co. LLC (September 2004 – present); Tax Analyst, Bain & Company, Inc (June 2003 – September 2004); Senior Tax Associate, PricewaterhouseCoopers LLP (2001 – 2003). | ||||||||||||
| Mahmoodur Rahman c/o GMO Trust 40 Rowes Wharf Boston, MA 02110 DOB: 11/30/1967 | Assistant Treasurer | Since September 2007. | Fund Administrator, Grantham, Mayo, Van Otterloo & Co. (April 2007 – present); Vice President and Senior Tax Manager, Massachusetts Financial Services Company (January 2000 – April 2007). | ||||||||||||
5 Officers are elected to hold such office until their successor is elected and qualified to carry out the duties and responsibilities of their office, or until he or she resigns or is removed from office.
20
Principal Officers — (Continued)
| Name, Address, and DOB | Position(s) Held with Trust | Term of Office5 and Length of Time Served | Principal Occupation(s) During Past Five Years | ||||||||||||
| Michael E. Gillespie c/o GMO Trust 40 Rowes Wharf Boston, MA 02110 DOB: 02/18/1958 | Chief Compliance Officer | Since March 2005. | Vice President of Compliance (June 2004 – February 2005) and Director of Domestic Compliance (March 2002 – June 2004), Fidelity Investments; Vice President and Senior Counsel, State Street Bank and Trust Company (May 1998 – March 2002). | ||||||||||||
| Jason B. Harrison c/o GMO Trust 40 Rowes Wharf Boston, MA 02110 DOB: 01/29/1977 | Vice President and Clerk | Vice President since November 2006; Clerk since March 2006. | Legal Counsel, Grantham, Mayo, Van Otterloo & Co. LLC (since February 2006) and Attorney, Ropes & Gray LLP (September 2002 – February 2006). | ||||||||||||
| David L. Bohan c/o GMO Trust 40 Rowes Wharf Boston, MA 02110 DOB: 06/21/1964 | Vice President and Assistant Clerk | Vice President since March 2005; Assistant Clerk since March 2006. | Legal Counsel, Grantham, Mayo, Van Otterloo & Co. LLC (September 2003 – present); Attorney, Goodwin Procter LLP (September 1996 – September 2003). | ||||||||||||
| Gregory L. Pottle c/o GMO Trust 40 Rowes Wharf Boston, MA 02110 DOB: 07/09/1971 | Vice President and Assistant Clerk | Since November 2006. | Legal Counsel, Grantham, Mayo, Van Otterloo & Co. LLC. | ||||||||||||
| Anne K. Trinque c/o GMO Trust 40 Rowes Wharf Boston, MA 02110 DOB: 04/15/1978 | Vice President and Assistant Clerk | Since September 2007. | Legal Counsel, Grantham, Mayo, Van Otterloo & Co. LLC (since January 2007); Attorney, Goodwin Procter LLP (September 2003 – January 2007). | ||||||||||||
| Cheryl Wakeham c/o GMO Trust 40 Rowes Wharf Boston, MA 02110 DOB: 10/29/1958 | Anti-Money Laundering Officer | Since December 2004. | Manager, Client Service Administration, Grantham, Mayo, Van Otterloo & Co. LLC. | ||||||||||||
5 Officers are elected to hold such office until their successor is elected and qualified to carry out the duties and responsibilities of their office, or until he or she resigns or is removed from office.
21
Item 2. Code of Ethics.
As of February 29, 2008, the registrant has adopted a Code of Ethics that applies to the Principal Executive Officer and Principal Financial Officer pursuant to the Sarbanes-Oxley Act of 2002. During the year ended February 29, 2008, there were no amendments to a provision of the Code of Ethics nor were there any waivers granted from a provision of the Code of Ethics. A copy of the registrant’s Code of Ethics is filed with this Form N-CSR under item 12 (a).
Item 3. Audit Committee Financial Expert.
The registrant’s Board of Trustees has determined that the registrant does not have an “audit committee financial expert” (as such term has been defined in Form N-CSR) serving on its audit committee. The registrant’s Board believes that, although none of its members individually meets all required elements of the definition of an “audit committee financial expert”, the members of the registrant’s audit committee collectively possess the knowledge and experience necessary to execute all of the audit committee’s functions, duties and powers.
Item 4. Principal Accountant Fees and Services. *
(a) AUDIT FEES: The aggregate fees billed to the registrant for professional services rendered by its independent auditors, PricewaterhouseCoopers LLP for the audit of the registrant’s annual financial statements for 2008 and 2007 were $2,154,900 and $1,984,100, respectively.
(b) AUDIT-RELATED FEES: The aggregate fees billed to the registrant in 2008 and 2007 for engagements for audit-related services rendered by PricewaterhouseCoopers LLP that related directly to the operations and financial reporting of the Funds were $64,212 and $142,402, respectively. The aggregate fees billed in 2008 and 2007 to the registrant’s Investment Advisor, and any entity controlling, controlled, or under common control with the Advisor that provides ongoing services to the Funds (each, a “Service Affiliate”) for engagements for audit-related services rendered by PricewaterhouseCoopers LLP that related directly to the operations and financial reporting of the Funds were $250,000 and $409,700, respectively.
(c) TAX FEES: The aggregate fees billed to the registrant in 2008 and 2007 for professional services rendered by PricewaterhouseCoopers LLP for tax compliance, tax advice, and tax planning, including the preparation of Form 1120 RIC, Form 8613 and review of excise tax distribution calculations were $904,314 and $885,694, respectively. The aggregate fees billed in 2008 and 2007 to the registrant’s Service Affiliates for engagements for tax services rendered by PricewaterhouseCoopers LLP that related directly to the operations and financial reporting of the Funds were $9,800 and $5,810, respectively.
(d) ALL OTHER FEES: No such fees were billed by PricewaterhouseCoopers LLP to the registrant or to the registrant’s Service Affiliates that related directly to the operations and financial reporting of the Funds in 2008 or 2007.
(e) (1) The Audit Committee has adopted an Audit and Non-Audit Services Pre-Approval Policy (the “Policy”), which sets forth the procedures and the conditions pursuant to which services to be performed by the independent auditor are to be preapproved. Under the Policy, the Audit Committee pre-approves, on an annual basis, the following services: (1) the engagement, scope and terms of the annual audit; (2) certain audit-related services; (3) certain tax services that the Committee believes would not impair, and are consistent with the SEC’s rules on, auditor independence; and (4) certain permissible non-audit services that the Committee believes are routine and recurring services and that would not impair and are consistent with the SEC’s rules on auditor independence, subject to certain limitations on the projected fees associated with each service. All other types of services not included on the schedule to the policy, or for which the projected fees exceed those provided in the schedule, require the specific pre-approval by the Audit Committee or the Chairperson of the Committee (if timing necessitates that preapproval is required before the Committee’s next regularly scheduled meeting) if they are to be provided by the independent auditor.
(e) (2) None.
(f) Not applicable.
(g) NON-AUDIT FEES: The aggregate fees billed by PricewaterhouseCoopers LLP in 2008 and 2007 for non-audit services rendered to the registrant, the registrant’s Service Affiliates were $1,229,726 and $1,445,706, respectively. For the fiscal year ended February 29, 2008, this amount reflects the amounts disclosed above in Item 4(b),(c),(d), plus $1,400 in fees billed to the Funds’ Service Affiliates for non-audit services that did not relate directly to the operations and financial reporting of the Funds. For the fiscal year ended February 28, 2007, this amount reflects the amounts disclosed above in Item 4(b),(c),(d), plus $2,100 in fees billed to the Funds’ Service Affiliates for non-audit services that did not relate directly to the operations and financial reporting of the Funds.
(h) The Trust’s Audit Committee has considered whether the provision of non-audit services by registrant’s independent registered public accounting firm to the registrant’s Investment Advisor, and any entity controlling, controlled, or under common control with the Advisor that provided ongoing services to the registrant that were not pre-approved by the Committee (because such services did not relate directly to the operations and financial reporting of the registrant) was compatible with maintaining the independence of the independent registered public accounting firm.
*Includes information regarding all series of GMO Trust.
Item 5. Audit Committee of Listed Registrants.
Not applicable to this filing.
Item 6. Schedule of Investments.
The complete schedule of investments for each series of the registrant is included as part of the annual reports to shareholders filed under Item 1 of this Form N-CSR.
Item 7. Disclosure of Proxy Voting Policies and Procedures for Closed-End Management Investment Companies.
Not applicable to this registrant.
Item 8. Portfolio Managers of Closed-End Management Investment Companies.
Not applicable to this registrant.
Item 9. Purchases of Equity Securities by Closed-End Management Investment Company and Affiliated Purchasers.
Not applicable to this registrant.
Item 10. Submission of Matters to a Vote of Security Holders.
There were no material changes to the procedures by which shareholders may recommend nominees to the registrant’s Board of Trustees.
Item 11. Controls and Procedures.
(a) The registrant’s Principal Executive Officer and Principal Financial Officer have concluded as of a date within 90 days of the filing of this report, based on their evaluation of the registrant’s disclosure controls and procedures (as defined in Rule 30a-3(c) under the Investment Company Act of 1940 (17 CFR 270.30a-3(c))) that the design and operation of such procedures are effective to provide reasonable assurance that information required to be disclosed by the registrant on Form N-CSR is recorded, processed, summarized, and reported within the time periods specified in the Commission’s rules and forms.
(b) There were no changes in the registrant’s internal control over financial reporting (as defined in Rule 30a-3(d) under the Investment Company Act of 1940 (17 CFR 270.30a-3(d))) that occurred during the second fiscal quarter of the period covered by this report that has materially affected, or is reasonably likely to materially affect, the registrant’s internal control over financial reporting.
Item 12. Exhibits.
(a)(1) Code of Ethics described in Item 2 is attached hereto as EX-99.CODEETH.
(a)(2) Certifications by the Principal Executive Officer and Principal Financial Officer of the registrant as required by Rule 30a-2(a) under the Investment Company Act of 1940 (17 CFR 270.30a-2(a)) are attached hereto as EX-99.CERT.
(a)(3) Not applicable to this registrant.
(b) Certifications by the Principal Executive Officer and Principal Financial Officer of the registrant pursuant to Section 906 of the Sarbanes-Oxley Act of 2002 and required by Rule 30a-2(b) under the Investment Company Act of 1940 (17 CFR 270.30a-2(b)) are attached hereto as EX-99.906 CERT.
SIGNATURES
Pursuant to the requirements of the Securities Exchange Act of 1934 and the Investment Company Act of 1940, the registrant has duly caused this report to be signed on its behalf by the undersigned, thereunto duly authorized.
(Registrant) | GMO Trust | ||
|
| ||
By (Signature and Title): | /s/ Scott E. Eston |
| |
| Scott E. Eston, Chief Executive Officer | ||
|
| ||
| Date: | April 30, 2008 |
|
Pursuant to the requirements of the Securities Exchange Act of 1934 and the Investment Company Act of 1940, this report has been signed below by the following persons on behalf of the registrant and in the capacities and on the dates indicated.
By (Signature and Title): | /s/ Scott E. Eston |
| |
| Scott E. Eston, Principal Executive Officer | ||
|
| ||
| Date: | April 30, 2008 |
|
|
|
| |
|
|
| |
By (Signature and Title): | /s/ Sheppard N. Burnett |
| |
| Sheppard N. Burnett, Principal Financial Officer | ||
|
| ||
| Date: | April 30, 2008 |
|