UNITED STATES
SECURITIES AND EXCHANGE COMMISSION
Washington, D.C. 20549
FORM N-CSR
CERTIFIED SHAREHOLDER REPORT OF REGISTERED
MANAGEMENT INVESTMENT COMPANIES
Investment Company Act file number | 811-04347 | |||||||
| ||||||||
GMO Trust | ||||||||
(Exact name of registrant as specified in charter) | ||||||||
| ||||||||
40 Rowes Wharf, Boston, MA |
| 02110 | ||||||
(Address of principal executive offices) |
| (Zip code) | ||||||
| ||||||||
J.B. Kittredge, Chief Executive Officer, 40 Rowes Wharf, Boston, MA 02110 | ||||||||
(Name and address of agent for service) | ||||||||
| ||||||||
Registrant’s telephone number, including area code: | 617-346-7646 |
| ||||||
| ||||||||
Date of fiscal year end: | 02/28/09 |
| ||||||
| ||||||||
Date of reporting period: | 02/28/09 |
| ||||||
Item 1. Reports to Stockholders.
The annual reports for each series of the registrant for the periods ended February 28, 2009 are filed herewith.
GMO Developed World Stock Fund
(A Series of GMO Trust)
Annual Report
February 28, 2009
For a free copy of the Fund's proxy voting guidelines, shareholders may call 1-617-346-7646 (collect) or visit the Securities and Exchange Commission's website at www.sec.gov. Information regarding how the Fund voted proxies relating to portfolio securities during the most recent 12-month period ended June 30 is available on GMO's website at www.gmo.com, or on the Securities and Exchange Commission's website at www.sec.gov.
The Fund files its complete schedule of portfolio holdings with the Securities and Exchange Commission for the first and third quarter of each fiscal year on Form N-Q, which is available on the Commission's website at www.sec.gov. The Fund's Form N-Q may be reviewed and copied at the Commission's Public Reference Room in Washington, D.C. Information on the operation of the Public Reference Room may be obtained by calling 1-800-SEC-0330. The Fund has a policy with respect to disclosure of portfolio holdings under which it may also make available on GMO's website at www.gmo.com a complete schedule of portfolio holdings.
This report is prepared for the general information of shareholders. It is authorized for distribution to prospective investors only when preceded or accompanied by a prospectus for the GMO Trust, which contains a complete discussion of the risks associated with an investment in this Fund and other important information. The GMO Trust prospectus can be obtained at www.gmo.com.
GMO Developed World Stock Fund
(A Series of GMO Trust)
Portfolio Management
Day-to-day management of the Fund's portfolio is the responsibility of the Quantitative Equity team at Grantham, Mayo, Van Otterloo & Co. LLC.
Management Discussion and Analysis of Fund Performance
The Class III shares of the GMO Developed World Stock Fund returned -45.6% for the fiscal year ended February 28, 2009, as compared to -47.1% for the MSCI World Index. The Fund was invested substantially in global equity securities throughout the period.
Country allocation had a slight positive impact on relative performance. This was the result of positions in several countries and holding small cash balances in a falling market.
Sector weightings had the most significant positive impact on performance relative to the index. During the period, our underweight to Financials and overweight to Health Care contributed.
Currency allocation had a positive impact on relative performance as our underweight in the British pound and Australian dollar and overweight in the Japanese yen added value. The U.S. dollar strengthened relative to most foreign currencies, which detracted from returns for U.S. investors. The MSCI World Index returned almost 5% more in local currency terms than in U.S. dollars.
Stock selection had mixed results. Holdings in Royal Bank of Scotland and Barclays PLC underperformed and were among the most significant detractors from returns. Among the contributors were holdings in U.S. pharmaceutical Johnson & Johnson and U.S. retailer Wal-Mart Stores, both of which outperformed.
Among GMO's global quantitative stock selection disciplines, stocks ranked highly by intrinsic value (with its boost of high quality) outperformed strongly. Stocks with strong momentum had index-like returns. Those selected by quality-adjusted value underperformed significantly.
The views expressed herein are exclusively those of Grantham, Mayo, Van Otterloo & Co. LLC Management as of the date of this report and are subject to change. GMO disclaims any responsibility to update such views. They are not meant as investment advice. References to specific securities are not recommendations of such securities and may not be representative of any GMO portfolio's current or future investments.

Performance data quoted represents past performance and is not indicative of future results. The investment return and principal value of an investment will fluctuate so that an investor's shares, when redeemed, may be worth more or less than their original cost. Current performance data may be lower or higher than the performance data provided herein. To obtain performance information to the most recent month-end, visit www.gmo.com. Performance shown is net of all fees after reimbursement from the Manager. Each performance figure assumes a purchase at the beginning and redemption at the end of the stated period and reflects a transaction fee of .25% on the purchase and .25% on the redemption. Transaction fees are retained by the Fund to cover trading costs. Returns would have been lower had certain expenses not been reimbursed during the periods shown and do not include the effect of taxes on distributions and redemptions. All information is unaudited. Performance for Class IV will vary due to different fees.
GMO Developed World Stock Fund
(A Series of GMO Trust)
Investments Concentration Summary
February 28, 2009 (Unaudited)
| Asset Class Summary | % of Total Net Assets | ||||||
| Common Stocks | 93.2 | % | |||||
| Short-Term Investments | 5.9 | ||||||
| Rights and Warrants | 0.0 | ||||||
| Forward Currency Contracts | (0.4 | ) | |||||
| Futures | (0.7 | ) | |||||
| Other | 2.0 | ||||||
| 100.0 | % | ||||||
| Country Summary | % of Equity Investments | ||||||
| United States | 56.1 | % | |||||
| Japan | 13.5 | ||||||
| United Kingdom | 9.0 | ||||||
| France | 7.4 | ||||||
| Germany | 2.8 | ||||||
| Switzerland | 2.7 | ||||||
| Italy | 2.0 | ||||||
| Canada | 1.7 | ||||||
| Singapore | 1.5 | ||||||
| Hong Kong | 1.1 | ||||||
| Netherlands | 0.9 | ||||||
| Australia | 0.6 | ||||||
| Spain | 0.3 | ||||||
| Sweden | 0.3 | ||||||
| Belgium | 0.1 | ||||||
| Finland | 0.0 | ||||||
| 100.0 | % | ||||||
1
GMO Developed World Stock Fund
(A Series of GMO Trust)
Investments Concentration Summary — (Continued)
February 28, 2009 (Unaudited)
| Industry Sector Summary | % of Equity Investments | ||||||
| Health Care | 21.2 | % | |||||
| Energy | 13.7 | ||||||
| Consumer Staples | 13.6 | ||||||
| Financials | 10.4 | ||||||
| Information Technology | 9.7 | ||||||
| Industrials | 9.6 | ||||||
| Consumer Discretionary | 9.3 | ||||||
| Materials | 5.1 | ||||||
| Utilities | 4.6 | ||||||
| Telecommunication Services | 2.8 | ||||||
| 100.0 | % | ||||||
2
GMO Developed World Stock Fund
(A Series of GMO Trust)
Schedule of Investments
(showing percentage of total net assets)
February 28, 2009
| Shares | Description | Value ($) | |||||||||||||
| COMMON STOCKS — 93.2% | |||||||||||||||
| Australia — 0.5% | |||||||||||||||
| 377,275 | Telstra Corp Ltd | 850,256 | |||||||||||||
| 25,295 | Woodside Petroleum Ltd | 575,698 | |||||||||||||
| Total Australia | 1,425,954 | ||||||||||||||
| Belgium — 0.1% | |||||||||||||||
| 75,924 | Dexia | 158,162 | |||||||||||||
| Canada — 1.6% | |||||||||||||||
| 5,600 | Agrium Inc | 194,429 | |||||||||||||
| 17,000 | Bank of Nova Scotia | 383,642 | |||||||||||||
| 13,300 | Canadian National Railway Co | 427,164 | |||||||||||||
| 15,100 | Canadian Natural Resources | 485,450 | |||||||||||||
| 22,800 | Canadian Pacific Railway Ltd | 645,182 | |||||||||||||
| 15,500 | EnCana Corp | 611,618 | |||||||||||||
| 22,800 | Husky Energy Inc | 487,471 | |||||||||||||
| 7,900 | Potash Corp of Saskatchewan Inc | 663,073 | |||||||||||||
| 4,500 | Research In Motion Ltd * | 179,830 | |||||||||||||
| 26,700 | Talisman Energy Inc | 250,798 | |||||||||||||
| Total Canada | 4,328,657 | ||||||||||||||
| Finland — 0.0% | |||||||||||||||
| 6,817 | Fortum Oyj | 117,080 | |||||||||||||
| France — 6.9% | |||||||||||||||
| 5,313 | Air Liquide SA | 387,703 | |||||||||||||
| 7,637 | Alstom | 358,357 | |||||||||||||
| 37,732 | ArcelorMittal | 723,199 | |||||||||||||
| 54,733 | AXA | 498,905 | |||||||||||||
| 83,407 | BNP Paribas | 2,701,151 | |||||||||||||
| 11,559 | Casino Guichard-Perrachon SA | 714,130 | |||||||||||||
| 19,114 | Cie de Saint-Gobain | 436,031 | |||||||||||||
| 8,252 | CNP Assurances | 530,773 | |||||||||||||
See accompanying notes to the financial statements.
3
GMO Developed World Stock Fund
(A Series of GMO Trust)
Schedule of Investments — (Continued)
(showing percentage of total net assets)
February 28, 2009
| Shares | Description | Value ($) | |||||||||||||
| France — continued | |||||||||||||||
| 23,039 | Credit Agricole SA | 223,109 | |||||||||||||
| 20,679 | France Telecom SA | 462,129 | |||||||||||||
| 35,293 | GDF Suez | 1,114,545 | |||||||||||||
| 29,881 | Peugeot SA | 508,466 | |||||||||||||
| 32,517 | Renault SA | 466,921 | |||||||||||||
| 60,800 | Sanofi-Aventis | 3,124,945 | |||||||||||||
| 32,408 | Societe Generale | 1,004,571 | |||||||||||||
| 104,547 | Total SA | 4,911,780 | |||||||||||||
| 2,696 | Vallourec SA | 209,842 | |||||||||||||
| Total France | 18,376,557 | ||||||||||||||
| Germany — 2.6% | |||||||||||||||
| 9,172 | BASF AG | 254,428 | |||||||||||||
| 26,489 | Bayerische Motoren Werke AG | 655,221 | |||||||||||||
| 4,549 | Beiersdorf AG | 188,413 | |||||||||||||
| 20,342 | Deutsche Post AG (Registered) | 194,598 | |||||||||||||
| 52,791 | Deutsche Telekom AG (Registered) | 638,392 | |||||||||||||
| 25,237 | Hannover Rueckversicherungs AG (Registered) | 899,709 | |||||||||||||
| 18,167 | K&S AG | 808,679 | |||||||||||||
| 5,590 | MAN AG | 225,008 | |||||||||||||
| 7,583 | Muenchener Rueckversicherungs-Gesellschaft AG (Registered) | 924,043 | |||||||||||||
| 6,154 | Salzgitter AG | 380,084 | |||||||||||||
| 18,430 | SAP AG | 592,057 | |||||||||||||
| 16,286 | Solarworld AG | 279,790 | |||||||||||||
| 37,885 | Suedzucker AG | 671,019 | |||||||||||||
| 17,390 | ThyssenKrupp AG | 307,063 | |||||||||||||
| Total Germany | 7,018,504 | ||||||||||||||
| Hong Kong — 1.0% | |||||||||||||||
| 133,000 | CLP Holdings Ltd | 983,208 | |||||||||||||
| 55,400 | Esprit Holdings Ltd | 298,352 | |||||||||||||
| 49,700 | Hang Seng Bank Ltd | 549,783 | |||||||||||||
| 138,500 | Hong Kong Electric Holdings Ltd | 853,924 | |||||||||||||
| Total Hong Kong | 2,685,267 | ||||||||||||||
See accompanying notes to the financial statements.
4
GMO Developed World Stock Fund
(A Series of GMO Trust)
Schedule of Investments — (Continued)
(showing percentage of total net assets)
February 28, 2009
| Shares | Description | Value ($) | |||||||||||||
| Italy — 1.9% | |||||||||||||||
| 249,056 | ENI SPA | 4,971,054 | |||||||||||||
| 120,146 | UniCredit SPA | 152,178 | |||||||||||||
| Total Italy | 5,123,232 | ||||||||||||||
| Japan — 12.6% | |||||||||||||||
| 23,000 | Asahi Breweries Ltd | 287,993 | |||||||||||||
| 10,100 | Astellas Pharma Inc | 335,153 | |||||||||||||
| 18,000 | Bridgestone Corp | 245,156 | |||||||||||||
| 13,800 | Canon Inc | 348,272 | |||||||||||||
| 14,100 | Chubu Electric Power Co Inc | 347,634 | |||||||||||||
| 167,000 | Cosmo Oil Co Ltd | 462,883 | |||||||||||||
| 21,800 | Daiichi Sankyo Co Ltd | 350,238 | |||||||||||||
| 7,900 | Eisai Co Ltd | 242,031 | |||||||||||||
| 17,100 | Fast Retailing Co Ltd | 1,717,696 | |||||||||||||
| 167,000 | Fuji Heavy Industries Ltd | 532,120 | |||||||||||||
| 114,000 | Hitachi Ltd | 283,873 | |||||||||||||
| 103,500 | Honda Motor Co Ltd | 2,474,974 | |||||||||||||
| 54 | INPEX Corp | 365,325 | |||||||||||||
| 144,000 | Itochu Corp | 645,685 | |||||||||||||
| 19,700 | JFE Holdings Inc | 426,267 | |||||||||||||
| 15,600 | Kansai Electric Power Co Inc | 375,082 | |||||||||||||
| 15,000 | Kao Corp | 285,063 | |||||||||||||
| 56,000 | Kawasaki Kisen Kaisha Ltd | 176,051 | |||||||||||||
| 89 | KDDI Corp | 466,242 | |||||||||||||
| 2,300 | Keyence Corp | 434,100 | |||||||||||||
| 9,000 | Kirin Holdings Co Ltd | 86,869 | |||||||||||||
| 4,700 | Kyocera Corp | 276,011 | |||||||||||||
| 127,000 | Marubeni Corp | 394,275 | |||||||||||||
| 229,000 | Mazda Motor Corp | 289,319 | |||||||||||||
| 145,000 | Mitsubishi Heavy Industries Ltd | 405,991 | |||||||||||||
| 5,000 | Nintendo Co Ltd | 1,427,498 | |||||||||||||
| 173,000 | Nippon Mining Holdings Inc | 600,853 | |||||||||||||
| 200,000 | Nippon Oil Corp | 953,166 | |||||||||||||
| 23,200 | Nippon Telegraph & Telephone Corp | 992,019 | |||||||||||||
See accompanying notes to the financial statements.
5
GMO Developed World Stock Fund
(A Series of GMO Trust)
Schedule of Investments — (Continued)
(showing percentage of total net assets)
February 28, 2009
| Shares | Description | Value ($) | |||||||||||||
| Japan — continued | |||||||||||||||
| 71,000 | Nippon Yusen KK | 292,886 | |||||||||||||
| 391,000 | Nissan Motor Co | 1,193,623 | |||||||||||||
| 681 | NTT Docomo Inc | 1,060,876 | |||||||||||||
| 246,000 | Osaka Gas Co Ltd | 879,573 | |||||||||||||
| 44,000 | Panasonic Corp | 509,441 | |||||||||||||
| 677 | Rakuten Inc | 348,364 | |||||||||||||
| 81,000 | Ricoh Company Ltd | 914,953 | |||||||||||||
| 6,300 | Sankyo Co Ltd | 282,740 | |||||||||||||
| 89,400 | Seven & I Holdings Co Ltd | 1,981,268 | |||||||||||||
| 36,400 | Shin-Etsu Chemical Co Ltd | 1,620,587 | |||||||||||||
| 65,400 | Showa Shell Sekiyu KK | 543,401 | |||||||||||||
| 388,600 | Sojitz Corp | 436,705 | |||||||||||||
| 53,400 | SUMCO Corp | 661,642 | |||||||||||||
| 90,300 | Sumitomo Corp | 753,953 | |||||||||||||
| 258,000 | Sumitomo Metal Industries Ltd | 483,306 | |||||||||||||
| 10,450 | T&D Holdings Inc | 233,882 | |||||||||||||
| 181,000 | Taisei Corp | 320,450 | |||||||||||||
| 29,000 | Taisho Pharmaceutical Co Ltd | 520,567 | |||||||||||||
| 33,000 | Takeda Pharmaceutical Co Ltd | 1,332,864 | |||||||||||||
| 17,900 | Tokio Marine Holdings Inc | 406,526 | |||||||||||||
| 26,300 | Tokyo Electric Power Co Inc (The) | 742,450 | |||||||||||||
| 181,000 | Tokyo Gas Co Ltd | 725,076 | |||||||||||||
| 83,000 | TonenGeneral Sekiyu KK | 784,268 | |||||||||||||
| 63,200 | Toyota Tsusho Kaisha | 510,418 | |||||||||||||
| Total Japan | 33,767,658 | ||||||||||||||
| Netherlands — 0.9% | |||||||||||||||
| 161,505 | Aegon NV | 574,809 | |||||||||||||
| 15,412 | Heineken NV | 411,512 | |||||||||||||
| 235,059 | ING Groep NV | 1,062,535 | |||||||||||||
| 11,627 | Koninklijke DSM NV | 265,717 | |||||||||||||
| Total Netherlands | 2,314,573 | ||||||||||||||
See accompanying notes to the financial statements.
6
GMO Developed World Stock Fund
(A Series of GMO Trust)
Schedule of Investments — (Continued)
(showing percentage of total net assets)
February 28, 2009
| Shares | Description | Value ($) | |||||||||||||
| Singapore — 1.4% | |||||||||||||||
| 276,000 | Sembcorp Industries Ltd | 370,199 | |||||||||||||
| 119,200 | Singapore Airlines Ltd | 776,681 | |||||||||||||
| 363,000 | Singapore Technologies Engineering Ltd | 536,215 | |||||||||||||
| 1,010,600 | Singapore Telecommunications | 1,590,516 | |||||||||||||
| 85,000 | United Overseas Bank Ltd | 541,633 | |||||||||||||
| Total Singapore | 3,815,244 | ||||||||||||||
| Spain — 0.3% | |||||||||||||||
| 10,986 | Gas Natural SDG SA | 196,940 | |||||||||||||
| 37,918 | Repsol YPF SA | 579,154 | |||||||||||||
| Total Spain | 776,094 | ||||||||||||||
| Sweden — 0.2% | |||||||||||||||
| 54,169 | Electrolux AB Series B | 368,550 | |||||||||||||
| 45,900 | Svenska Cellulosa AB Class B | 297,079 | |||||||||||||
| Total Sweden | 665,629 | ||||||||||||||
| Switzerland — 2.5% | |||||||||||||||
| 32,295 | ABB Ltd * | 389,842 | |||||||||||||
| 8,900 | Alcon Inc | 733,004 | |||||||||||||
| 85,157 | Novartis AG (Registered) | 3,106,809 | |||||||||||||
| 3,720 | Syngenta AG (Registered) | 795,253 | |||||||||||||
| 2,779 | Synthes Inc | 322,490 | |||||||||||||
| 141,444 | UBS AG (Registered) * | 1,324,473 | |||||||||||||
| Total Switzerland | 6,671,871 | ||||||||||||||
| United Kingdom — 8.4% | |||||||||||||||
| 100,030 | AstraZeneca Plc | 3,172,131 | |||||||||||||
| 238,856 | Aviva Plc | 981,352 | |||||||||||||
| 959,030 | Barclays Plc | 1,258,169 | |||||||||||||
| 90,235 | BG Group Plc | 1,289,854 | |||||||||||||
| 159,910 | BP Plc | 1,018,749 | |||||||||||||
| 21,537 | British American Tobacco Plc | 550,493 | |||||||||||||
| 482,136 | BT Group Plc | 615,958 | |||||||||||||
See accompanying notes to the financial statements.
7
GMO Developed World Stock Fund
(A Series of GMO Trust)
Schedule of Investments — (Continued)
(showing percentage of total net assets)
February 28, 2009
| Shares | Description | Value ($) | |||||||||||||
| United Kingdom — continued | |||||||||||||||
| 142,840 | Cable & Wireless Plc | 279,537 | |||||||||||||
| 77,221 | Compass Group Plc | 339,266 | |||||||||||||
| 273,102 | GlaxoSmithKline Plc | 4,142,083 | |||||||||||||
| 136,449 | HSBC Holdings Plc | 949,022 | |||||||||||||
| 356,199 | Kingfisher Plc | 638,336 | |||||||||||||
| 1,295,525 | Lloyds Banking Group Plc | 1,063,470 | |||||||||||||
| 27,699 | Next Plc | 459,331 | |||||||||||||
| 667,837 | Old Mutual Plc | 392,469 | |||||||||||||
| 22,109 | Rio Tinto Plc | 564,380 | |||||||||||||
| 1,706,198 | Royal Bank of Scotland Group Plc | 555,690 | |||||||||||||
| 24,702 | Royal Dutch Shell Group Class A (Amsterdam) | 540,028 | |||||||||||||
| 128,687 | Royal Dutch Shell Plc A Shares (London) | 2,825,233 | |||||||||||||
| 173,387 | Tomkins Plc | 278,553 | |||||||||||||
| 191,026 | Wolseley Plc | 482,433 | |||||||||||||
| Total United Kingdom | 22,396,537 | ||||||||||||||
| United States — 52.3% | |||||||||||||||
| 44,100 | 3M Co. | 2,004,786 | |||||||||||||
| 69,300 | Abbott Laboratories | 3,280,662 | |||||||||||||
| 16,400 | Accenture Ltd.-Class A | 478,716 | |||||||||||||
| 6,600 | ACE Ltd. | 240,966 | |||||||||||||
| 20,000 | Aflac, Inc. | 335,200 | |||||||||||||
| 41,300 | Allstate Corp. (The) | 695,079 | |||||||||||||
| 16,300 | Altera Corp. | 249,879 | |||||||||||||
| 78,300 | Altria Group, Inc. | 1,208,952 | |||||||||||||
| 10,100 | AMDOCS Ltd * | 169,175 | |||||||||||||
| 21,700 | Amgen, Inc. * | 1,061,781 | |||||||||||||
| 4,300 | Amphenol Corp.-Class A | 109,306 | |||||||||||||
| 19,000 | Anadarko Petroleum Corp. | 664,050 | |||||||||||||
| 11,400 | Aon Corp. | 435,936 | |||||||||||||
| 9,100 | Apache Corp. | 537,719 | |||||||||||||
| 4,200 | Apollo Group, Inc.-Class A * | 304,500 | |||||||||||||
| 7,600 | Assurant, Inc. | 155,040 | |||||||||||||
| 56,200 | Automatic Data Processing, Inc. | 1,919,230 | |||||||||||||
See accompanying notes to the financial statements.
8
GMO Developed World Stock Fund
(A Series of GMO Trust)
Schedule of Investments — (Continued)
(showing percentage of total net assets)
February 28, 2009
| Shares | Description | Value ($) | |||||||||||||
| United States — continued | |||||||||||||||
| 42,400 | AutoNation, Inc. * | 423,152 | |||||||||||||
| 2,600 | AutoZone, Inc. * | 369,798 | |||||||||||||
| 141,291 | Bank of America Corp. | 558,099 | |||||||||||||
| 10,000 | Bard (C.R.), Inc. | 802,600 | |||||||||||||
| 31,100 | Baxter International, Inc. | 1,583,301 | |||||||||||||
| 17,000 | Becton, Dickinson & Co. | 1,052,130 | |||||||||||||
| 28,100 | Best Buy Co., Inc. | 809,842 | |||||||||||||
| 1,500 | BlackRock, Inc. | 145,215 | |||||||||||||
| 5,900 | Boston Properties, Inc. REIT | 218,831 | |||||||||||||
| 10,400 | Burlington Northern Santa Fe Corp. | 611,208 | |||||||||||||
| 22,600 | Capital One Financial Corp. | 272,330 | |||||||||||||
| 38,700 | CenterPoint Energy, Inc. | 399,384 | |||||||||||||
| 21,300 | CH Robinson Worldwide, Inc. | 881,394 | |||||||||||||
| 26,705 | Chevron Corp. | 1,621,261 | |||||||||||||
| 137,900 | Citigroup, Inc. | 206,850 | |||||||||||||
| 37,300 | Coach, Inc. * | 521,454 | |||||||||||||
| 151,500 | Coca-Cola Co. (The) | 6,188,775 | |||||||||||||
| 21,200 | Cognizant Technology Solutions Corp.-Class A * | 390,080 | |||||||||||||
| 9,000 | Colgate-Palmolive Co. | 541,620 | |||||||||||||
| 25,200 | Comcast Corp-Class A (Non-Voting) | 306,180 | |||||||||||||
| 30,100 | Comcast Corp.-Class A | 393,106 | |||||||||||||
| 16,700 | Comerica, Inc. | 250,667 | |||||||||||||
| 24,300 | Computer Sciences Corp. * | 844,182 | |||||||||||||
| 50,653 | ConocoPhillips | 1,891,890 | |||||||||||||
| 28,900 | Convergys Corp. * | 186,405 | |||||||||||||
| 8,900 | Costco Wholesale Corp. | 376,826 | |||||||||||||
| 10,400 | Covidien Ltd. | 329,368 | |||||||||||||
| 17,100 | D.R. Horton, Inc. | 144,495 | |||||||||||||
| 16,100 | Devon Energy Corp. | 703,087 | |||||||||||||
| 17,300 | DirecTV Group (The), Inc. * | 344,962 | |||||||||||||
| 13,500 | Dow Chemical Co. (The) | 96,660 | |||||||||||||
| 22,600 | DTE Energy Co. | 605,002 | |||||||||||||
| 54,800 | Duke Energy Corp. | 738,156 | |||||||||||||
| 30,000 | Ecolab, Inc. | 953,400 | |||||||||||||
See accompanying notes to the financial statements.
9
GMO Developed World Stock Fund
(A Series of GMO Trust)
Schedule of Investments — (Continued)
(showing percentage of total net assets)
February 28, 2009
| Shares | Description | Value ($) | |||||||||||||
| United States — continued | |||||||||||||||
| 77,600 | Eli Lilly & Co. | 2,279,888 | |||||||||||||
| 19,500 | Emerson Electric Co. | 521,625 | |||||||||||||
| 9,900 | EOG Resources, Inc. | 495,396 | |||||||||||||
| 12,200 | Equity Residential REIT | 214,720 | |||||||||||||
| 26,600 | Expeditors International of Washington, Inc. | 732,830 | |||||||||||||
| 7,800 | Express Scripts, Inc. * | 392,340 | |||||||||||||
| 7,900 | Fastenal Co. | 237,948 | |||||||||||||
| 18,292 | Fidelity National Title Group, Inc.-Class A | 303,098 | |||||||||||||
| 12,700 | First American Corp. | 294,259 | |||||||||||||
| 4,500 | First Solar, Inc. * | 475,830 | |||||||||||||
| 5,700 | FirstEnergy Corp. | 242,592 | |||||||||||||
| 16,600 | Fiserv, Inc. * | 541,492 | |||||||||||||
| 13,900 | FLIR Systems, Inc. * | 283,699 | |||||||||||||
| 10,200 | Fluor Corp. | 339,150 | |||||||||||||
| 19,100 | Forest Laboratories, Inc. * | 409,504 | |||||||||||||
| 47,300 | Gannett Co., Inc. | 153,252 | |||||||||||||
| 33,600 | General Dynamics Corp. | 1,472,352 | |||||||||||||
| 10,700 | General Mills, Inc. | 561,536 | |||||||||||||
| 12,400 | Genuine Parts Co. | 348,936 | |||||||||||||
| 10,900 | Gilead Sciences, Inc. * | 488,320 | |||||||||||||
| 11,000 | Google, Inc.-Class A * | 3,717,890 | |||||||||||||
| 27,600 | Halliburton Co. | 450,156 | |||||||||||||
| 27,900 | Hartford Financial Services Group (The), Inc. | 170,190 | |||||||||||||
| 13,100 | HCP, Inc. REIT | 239,337 | |||||||||||||
| 6,500 | Health Care REIT, Inc. | 200,005 | |||||||||||||
| 10,100 | Hess Corp. | 552,369 | |||||||||||||
| 23,900 | Hewlett-Packard Co. | 693,817 | |||||||||||||
| 51,500 | Home Depot, Inc. | 1,075,835 | |||||||||||||
| 13,900 | Hospitality Properties Trust REIT | 158,460 | |||||||||||||
| 39,200 | Hudson City Bancorp, Inc. | 406,504 | |||||||||||||
| 36,400 | Illinois Tool Works, Inc. | 1,011,920 | |||||||||||||
| 33,300 | International Business Machines Corp. | 3,064,599 | |||||||||||||
| 230,500 | Johnson & Johnson | 11,525,000 | |||||||||||||
| 40,700 | KeyCorp. | 285,307 | |||||||||||||
See accompanying notes to the financial statements.
10
GMO Developed World Stock Fund
(A Series of GMO Trust)
Schedule of Investments — (Continued)
(showing percentage of total net assets)
February 28, 2009
| Shares | Description | Value ($) | |||||||||||||
| United States — continued | |||||||||||||||
| 48,500 | Kimberly-Clark Corp. | 2,284,835 | |||||||||||||
| 15,235 | Kraft Foods, Inc.-Class A | 347,053 | |||||||||||||
| 3,000 | Leucadia National Corp. * | 43,890 | |||||||||||||
| 18,000 | Lexmark International, Inc. * | 308,520 | |||||||||||||
| 10,200 | Lincare Holdings, Inc. * | 214,914 | |||||||||||||
| 4,800 | Lockheed Martin Corp. | 302,928 | |||||||||||||
| 37,700 | Lowe's Cos., Inc. | 597,168 | |||||||||||||
| 40,100 | Macy's Inc | 315,587 | |||||||||||||
| 22,800 | Marathon Oil Corp. | 530,556 | |||||||||||||
| 17,700 | Marsh & McLennan Cos., Inc. | 317,361 | |||||||||||||
| 5,900 | MasterCard, Inc.-Class A | 932,377 | |||||||||||||
| 38,600 | McDonald's Corp. | 2,016,850 | |||||||||||||
| 30,500 | McGraw-Hill Cos. (The), Inc. | 601,765 | |||||||||||||
| 13,800 | Medco Health Solutions, Inc. * | 560,004 | |||||||||||||
| 51,400 | Medtronic, Inc. | 1,520,926 | |||||||||||||
| 144,800 | Merck & Co., Inc. | 3,504,160 | |||||||||||||
| 54,000 | Microsoft Corp. | 872,100 | |||||||||||||
| 16,300 | Monsanto Co. | 1,243,201 | |||||||||||||
| 15,100 | Morgan Stanley | 295,054 | |||||||||||||
| 8,300 | Murphy Oil Corp. | 347,023 | |||||||||||||
| 35,300 | Nike, Inc.-Class B | 1,466,009 | |||||||||||||
| 46,100 | NiSource, Inc. | 403,375 | |||||||||||||
| 8,100 | Noble Energy, Inc. | 368,874 | |||||||||||||
| 10,700 | Norfolk Southern Corp. | 339,404 | |||||||||||||
| 13,500 | Nucor Corp. | 454,275 | |||||||||||||
| 600 | NVR, Inc. * | 199,662 | |||||||||||||
| 20,000 | Occidental Petroleum Corp. | 1,037,400 | |||||||||||||
| 45,025 | Old Republic International Corp. | 408,827 | |||||||||||||
| 50,300 | Oracle Corp. * | 781,662 | |||||||||||||
| 51,200 | Paychex, Inc. | 1,129,472 | |||||||||||||
| 14,700 | Pepco Holdings, Inc. | 220,500 | |||||||||||||
| 90,100 | PepsiCo, Inc. | 4,337,414 | |||||||||||||
| 362,800 | Pfizer, Inc. | 4,466,068 | |||||||||||||
| 9,200 | PG&E Corp. | 351,624 | |||||||||||||
See accompanying notes to the financial statements.
11
GMO Developed World Stock Fund
(A Series of GMO Trust)
Schedule of Investments — (Continued)
(showing percentage of total net assets)
February 28, 2009
| Shares | Description | Value ($) | |||||||||||||
| United States — continued | |||||||||||||||
| 38,700 | Philip Morris International, Inc. | 1,295,289 | |||||||||||||
| 11,000 | Pinnacle West Capital Corp. | 288,860 | |||||||||||||
| 11,100 | Plum Creek Timber Co., Inc. | 291,153 | |||||||||||||
| 6,500 | PPG Industries, Inc. | 201,890 | |||||||||||||
| 18,600 | Praxair, Inc. | 1,055,550 | |||||||||||||
| 36,200 | Procter & Gamble Co. (The) | 1,743,754 | |||||||||||||
| 16,800 | Progress Energy, Inc. | 595,056 | |||||||||||||
| 6,900 | Public Storage REIT | 382,812 | |||||||||||||
| 31,200 | Qualcomm, Inc. | 1,043,016 | |||||||||||||
| 68,400 | Regions Financial Corp. | 233,928 | |||||||||||||
| 13,600 | Rockwell Collins, Inc. | 424,320 | |||||||||||||
| 9,400 | Ryder System, Inc. | 214,884 | |||||||||||||
| 17,400 | Schlumberger Ltd. | 662,244 | |||||||||||||
| 14,800 | Sigma-Aldrich Corp. | 528,360 | |||||||||||||
| 18,500 | Southern Co. | 560,735 | |||||||||||||
| 16,500 | Southwestern Energy Co. * | 474,705 | |||||||||||||
| 29,600 | Stryker Corp. | 996,632 | |||||||||||||
| 13,542 | Supervalu, Inc. | 211,391 | |||||||||||||
| 46,800 | Sysco Corp. | 1,006,200 | |||||||||||||
| 39,400 | TJX Cos. (The), Inc. | 877,438 | |||||||||||||
| 9,900 | Torchmark Corp. | 203,940 | |||||||||||||
| 9,800 | Travelers Cos. (The), Inc. | 354,270 | |||||||||||||
| 27,200 | Tyco Electronics Ltd. | 257,856 | |||||||||||||
| 18,100 | Union Pacific Corp. | 679,112 | |||||||||||||
| 39,400 | United Parcel Service, Inc.-Class B | 1,622,492 | |||||||||||||
| 47,300 | United Technologies Corp. | 1,931,259 | |||||||||||||
| 35,915 | UnitedHealth Group, Inc. | 705,730 | |||||||||||||
| 44,900 | Valero Energy Corp. | 870,162 | |||||||||||||
| 10,400 | VF Corp. | 539,760 | |||||||||||||
| 8,100 | Visa, Inc.-Class A | 459,351 | |||||||||||||
| 5,900 | Vornado Realty Trust REIT | 193,107 | |||||||||||||
| 9,500 | W.W. Grainger, Inc. | 628,520 | |||||||||||||
| 175,900 | Wal-Mart Stores, Inc. | 8,661,316 | |||||||||||||
| 13,700 | WellPoint, Inc. * | 464,704 | |||||||||||||
See accompanying notes to the financial statements.
12
GMO Developed World Stock Fund
(A Series of GMO Trust)
Schedule of Investments — (Continued)
(showing percentage of total net assets)
February 28, 2009
| Shares / Par Value ($) | Description | Value ($) | |||||||||
| United States — continued | |||||||||||
| 12,900 | Wells Fargo & Co. | 156,090 | |||||||||
| 27,500 | Western Union Co. | 306,900 | |||||||||
| 6,400 | Whirlpool Corp. | 142,272 | |||||||||
| 36,800 | Xcel Energy, Inc. | 652,832 | |||||||||
| 21,000 | Xilinx, Inc. | 371,280 | |||||||||
| 22,600 | XTO Energy, Inc. | 715,516 | |||||||||
| Total United States | 140,078,367 | ||||||||||
| TOTAL COMMON STOCKS (COST $446,219,087) | 249,719,386 | ||||||||||
| RIGHTS AND WARRANTS — 0.0% | |||||||||||
| France — 0.0% | |||||||||||
| 23,262 | Cie de Saint-Gobain Warrants, Expires 03/06/09 * | 34,209 | |||||||||
| TOTAL RIGHTS AND WARRANTS (COST $136,847) | 34,209 | ||||||||||
| SHORT-TERM INVESTMENTS — 5.9% | |||||||||||
| 2,500,000 | Bank of America Time Deposit, 0.08%, due 03/02/09 | 2,500,000 | |||||||||
| 5,824,660 | Brown Brothers Harriman Time Deposit, 0.02% - 2.29%, due 03/02/09 | 5,824,660 | |||||||||
| 2,499,692 | Citibank Time Deposit, 0.05% - 0.09%, due 03/02/09 | 2,499,692 | |||||||||
| 19,962 | Hong Kong & Shanghai Banking Corp. Time Deposit, 0.01%, due 03/02/09 | 19,962 | |||||||||
| 2,500,000 | HSBC Bank USA Time Deposit, 0.08%, due 03/02/09 | 2,500,000 | |||||||||
| 2,500,000 | JPMorgan Chase Time Deposit, 0.08%, due 03/02/09 | 2,500,000 | |||||||||
| 60,708 | Societe Generale Time Deposit, 0.33%, due 03/02/09 | 60,708 | |||||||||
| TOTAL SHORT-TERM INVESTMENTS (COST $15,905,022) | 15,905,022 | ||||||||||
| TOTAL INVESTMENTS — 99.1% (Cost $462,260,956) | 265,658,617 | ||||||||||
| Other Assets and Liabilities (net) — 0.9% | 2,339,969 | ||||||||||
| TOTAL NET ASSETS — 100.0% | $ | 267,998,586 | |||||||||
See accompanying notes to the financial statements.
13
GMO Developed World Stock Fund
(A Series of GMO Trust)
Schedule of Investments — (Continued)
February 28, 2009
A summary of outstanding financial instruments at February 28, 2009 is as follows:
Forward Currency Contracts
| Settlement Date | Deliver/Receive | Units of Currency | Value | Net Unrealized Appreciation (Depreciation) | |||||||||||||||
| Buys | |||||||||||||||||||
| 4/24/09 | CAD | 6,380,120 | $ | 5,015,374 | $ | (28,917 | ) | ||||||||||||
| 4/24/09 | CAD | 6,380,120 | 5,015,374 | (23,515 | ) | ||||||||||||||
| 4/24/09 | CAD | 890,000 | 699,624 | (21,838 | ) | ||||||||||||||
| 4/24/09 | CHF | 6,696,520 | 5,730,698 | 15,670 | |||||||||||||||
| 4/24/09 | CHF | 5,571,520 | 4,767,954 | 7,273 | |||||||||||||||
| 4/24/09 | CHF | 5,571,520 | 4,767,954 | 12,925 | |||||||||||||||
| 4/24/09 | CHF | 5,571,520 | 4,767,954 | 19,243 | |||||||||||||||
| 4/24/09 | DKK | 4,535,854 | 770,441 | 3,828 | |||||||||||||||
| 4/24/09 | EUR | 801,000 | 1,015,206 | (19,334 | ) | ||||||||||||||
| 4/24/09 | GBP | 2,612,885 | 3,740,219 | (45,394 | ) | ||||||||||||||
| 4/24/09 | GBP | 388,000 | 555,403 | (9,874 | ) | ||||||||||||||
| 4/24/09 | JPY | 574,600,174 | 5,894,056 | (336,023 | ) | ||||||||||||||
| 4/24/09 | JPY | 446,911,246 | 4,584,266 | (275,943 | ) | ||||||||||||||
| 4/24/09 | JPY | 397,800,855 | 4,080,507 | (278,200 | ) | ||||||||||||||
| 4/24/09 | NZD | 469,710 | 234,411 | (3,638 | ) | ||||||||||||||
| 4/24/09 | SEK | 43,052,742 | 4,779,719 | (153,051 | ) | ||||||||||||||
| 4/24/09 | SEK | 43,052,742 | 4,779,719 | (99,387 | ) | ||||||||||||||
| 4/24/09 | SGD | 5,599,872 | 3,616,819 | (51,426 | ) | ||||||||||||||
| $ | 64,815,698 | $ | (1,287,601 | ) | |||||||||||||||
| Sales | |||||||||||||||||||
| 4/24/09 | AUD | 2,180,760 | $ | 1,389,364 | $ | (2,989 | ) | ||||||||||||
| 4/24/09 | EUR | 3,001,582 | 3,804,273 | (16,577 | ) | ||||||||||||||
| 4/24/09 | EUR | 2,121,730 | 2,689,129 | 32,605 | |||||||||||||||
| 4/24/09 | EUR | 3,001,582 | 3,804,273 | (23,540 | ) | ||||||||||||||
| 4/24/09 | GBP | 3,581,824 | 5,127,209 | (32,924 | ) | ||||||||||||||
| 4/24/09 | GBP | 5,372,736 | 7,690,814 | (28,352 | ) | ||||||||||||||
| 4/24/09 | HKD | 18,460,666 | 2,381,470 | 182 | |||||||||||||||
| 4/24/09 | JPY | 237,000,448 | 2,431,071 | 215,411 | |||||||||||||||
| 4/24/09 | SGD | 6,896,797 | 4,454,470 | 126,445 | |||||||||||||||
| $ | 33,772,073 | $ | 270,261 | ||||||||||||||||
See accompanying notes to the financial statements.
14
GMO Developed World Stock Fund
(A Series of GMO Trust)
Schedule of Investments — (Continued)
February 28, 2009
Futures Contracts
| Number of Contracts | Type | Expiration Date | Contract Value | Net Unrealized Appreciation (Depreciation) | |||||||||||||||
| Buys | |||||||||||||||||||
| 2 | AEX | March 2009 | $ | 109,816 | $ | (10,225 | ) | ||||||||||||
| 34 | CAC 40 | March 2009 | 1,148,712 | (89,233 | ) | ||||||||||||||
| 26 | DAX | March 2009 | 3,132,891 | (557,146 | ) | ||||||||||||||
| 52 | FTSE 100 | March 2009 | 2,807,630 | (319,834 | ) | ||||||||||||||
| 1 | Hang Seng | March 2009 | 80,813 | (1,415 | ) | ||||||||||||||
| 5 | MSCI Singapore | March 2009 | 122,472 | (1,867 | ) | ||||||||||||||
| 8 | OMXS 30 | March 2009 | 56,149 | (1,328 | ) | ||||||||||||||
| 7 | S&P/MIB | March 2009 | 671,232 | (220,985 | ) | ||||||||||||||
| 2 | S&P Toronto 60 | March 2009 | 153,687 | (16,829 | ) | ||||||||||||||
| 117 | TOPIX | March 2009 | 8,979,002 | (902,324 | ) | ||||||||||||||
| $ | 17,262,404 | $ | (2,121,186 | ) | |||||||||||||||
| Sales | |||||||||||||||||||
| 6 | IBEX 35 | March 2009 | $ | 571,689 | $ | 23,599 | |||||||||||||
| 33 | S&P 500 E-Mini Index | March 2009 | 1,211,430 | 171,728 | |||||||||||||||
| 22 | SPI 200 | March 2009 | 1,149,228 | 105,513 | |||||||||||||||
| $ | 2,932,347 | $ | 300,840 | ||||||||||||||||
As of February 28, 2009, for the futures contracts held, the Fund had sufficient cash and/or securities to cover any commitments or margin requirements of the relevant broker or exchange.
See accompanying notes to the financial statements.
15
GMO Developed World Stock Fund
(A Series of GMO Trust)
Schedule of Investments — (Continued)
February 28, 2009
Notes to Schedule of Investments:
REIT - Real Estate Investment Trust
* Non-income producing security.
Currency Abbreviations:
AUD - Australian Dollar
CAD - Canadian Dollar
CHF - Swiss Franc
DKK - Danish Krone
EUR - Euro
GBP - British Pound
HKD - Hong Kong Dollar
JPY - Japanese Yen
NZD - New Zealand Dollar
SEK - Swedish Krona
SGD - Singapore Dollar
See accompanying notes to the financial statements.
16
GMO Developed World Stock Fund
(A Series of GMO Trust)
Statement of Assets and Liabilities — February 28, 2009
| Assets: | |||||||
| Investments, at value (cost $462,260,956) (Note 2) | $ | 265,658,617 | |||||
| Foreign currency, at value (cost $142) (Note 2) | 136 | ||||||
| Receivable for investments sold | 153,533 | ||||||
| Dividends receivable | 963,950 | ||||||
| Foreign taxes receivable | 57,229 | ||||||
| Unrealized appreciation on open forward currency contracts (Note 2) | 433,582 | ||||||
| Receivable for collateral on open futures contracts (Note 2) | 2,825,911 | ||||||
| Receivable for expenses reimbursed by Manager (Note 3) | 16,538 | ||||||
| Total assets | 270,109,496 | ||||||
| Liabilities: | |||||||
| Payable for investments purchased | 101,893 | ||||||
| Payable to affiliate for (Note 3): | |||||||
| Management fee | 100,831 | ||||||
| Shareholder service fee | 28,864 | ||||||
| Trustees and Chief Compliance Officer of GMO Trust fees | 1,047 | ||||||
| Payable for variation margin on open futures contracts (Note 2) | 143,975 | ||||||
| Unrealized depreciation on open forward currency contracts (Note 2) | 1,450,922 | ||||||
| Miscellaneous payable | 101,852 | ||||||
| Accrued expenses | 181,526 | ||||||
| Total liabilities | 2,110,910 | ||||||
| Net assets | $ | 267,998,586 | |||||
See accompanying notes to the financial statements.
17
GMO Developed World Stock Fund
(A Series of GMO Trust)
Statement of Assets and Liabilities — February 28, 2009 — (Continued)
| Net assets consist of: | |||||||
| Paid-in capital | $ | 512,234,166 | |||||
| Accumulated undistributed net investment income | 3,794,038 | ||||||
| Distributions in excess of net realized gain | (48,575,741 | ) | |||||
| Net unrealized depreciation | (199,453,877 | ) | |||||
| $ | 267,998,586 | ||||||
| Net assets attributable to: | |||||||
| Class III shares | $ | 155,560,332 | |||||
| Class IV shares | $ | 112,438,254 | |||||
| Shares outstanding: | |||||||
| Class III | 13,719,101 | ||||||
| Class IV | 9,907,339 | ||||||
| Net asset value per share: | |||||||
| Class III | $ | 11.34 | |||||
| Class IV | $ | 11.35 | |||||
See accompanying notes to the financial statements.
18
GMO Developed World Stock Fund
(A Series of GMO Trust)
Statement of Operations — Year Ended February 28, 2009
| Investment Income: | |||||||
| Dividends (net of withholding taxes of $701,531) | $ | 13,254,496 | |||||
| Interest | 257,990 | ||||||
| Securities lending income | 224,067 | ||||||
| Total investment income | 13,736,553 | ||||||
| Expenses: | |||||||
| Management fee (Note 3) | 1,855,185 | ||||||
| Shareholder service fee – Class III (Note 3) | 345,373 | ||||||
| Shareholder service fee – Class IV (Note 3) | 174,814 | ||||||
| Custodian and fund accounting agent fees | 332,711 | ||||||
| Transfer agent fees | 41,829 | ||||||
| Audit and tax fees | 77,429 | ||||||
| Legal fees | 10,174 | ||||||
| Trustees fees and related expenses (Note 3) | 5,946 | ||||||
| Registration fees | 3,033 | ||||||
| Miscellaneous | 8,379 | ||||||
| Total expenses | 2,854,873 | ||||||
| Fees and expenses reimbursed by Manager (Note 3) | (470,537 | ) | |||||
| Expense reductions (Note 2) | (6,397 | ) | |||||
| Net expenses | 2,377,939 | ||||||
| Net investment income (loss) | 11,358,614 | ||||||
| Realized and unrealized gain (loss): | |||||||
| Net realized gain (loss) on: | |||||||
| Investments | (40,364,908 | ) | |||||
| Closed futures contracts | (8,976,566 | ) | |||||
| Foreign currency, forward contracts and foreign currency related transactions | 2,801,989 | ||||||
| Net realized gain (loss) | (46,539,485 | ) | |||||
| Change in net unrealized appreciation (depreciation) on: | |||||||
| Investments | (182,845,007 | ) | |||||
| Open futures contracts | 516,916 | ||||||
| Foreign currency, forward contracts and foreign currency related transactions | (3,161,715 | ) | |||||
| Net unrealized gain (loss) | (185,489,806 | ) | |||||
| Net realized and unrealized gain (loss) | (232,029,291 | ) | |||||
| Net increase (decrease) in net assets resulting from operations | $ | (220,670,677 | ) | ||||
See accompanying notes to the financial statements.
19
GMO Developed World Stock Fund
(A Series of GMO Trust)
Statement of Changes in Net Assets
| Year Ended February 28, 2009 | Year Ended February 29, 2008 | ||||||||||
| Increase (decrease) in net assets: | |||||||||||
| Operations: | |||||||||||
| Net investment income (loss) | $ | 11,358,614 | $ | 11,232,424 | |||||||
| Net realized gain (loss) | (46,539,485 | ) | 39,545,032 | ||||||||
| Change in net unrealized appreciation (depreciation) | (185,489,806 | ) | (63,583,976 | ) | |||||||
| Net increase (decrease) in net assets from operations | (220,670,677 | ) | (12,806,520 | ) | |||||||
| Distributions to shareholders from: | |||||||||||
| Net investment income | |||||||||||
| Class III | (7,860,790 | ) | (8,471,254 | ) | |||||||
| Class IV | (6,163,416 | ) | (5,941,447 | ) | |||||||
| Total distributions from net investment income | (14,024,206 | ) | (14,412,701 | ) | |||||||
| Net realized gains | |||||||||||
| Class III | (2,479,946 | ) | (22,082,339 | ) | |||||||
| Class IV | (1,952,911 | ) | (15,851,765 | ) | |||||||
| Total distributions from net realized gains | (4,432,857 | ) | (37,934,104 | ) | |||||||
| (18,457,063 | ) | (52,346,805 | ) | ||||||||
| Net share transactions (Note 7): | |||||||||||
| Class III | (17,180,224 | ) | 66,739,553 | ||||||||
| Class IV | 8,116,327 | 21,793,212 | |||||||||
| Increase (decrease) in net assets resulting from net share transactions | (9,063,897 | ) | 88,532,765 | ||||||||
| Purchase premiums and redemption fees (Notes 2 and 7): | |||||||||||
| Class III | 173,735 | 253,528 | |||||||||
| Increase in net assets resulting from purchase premiums and redemption fees | 173,735 | 253,528 | |||||||||
| Total increase (decrease) in net assets resulting from net share transactions, purchase premiums and redemption fees | (8,890,162 | ) | 88,786,293 | ||||||||
| Total increase (decrease) in net assets | (248,017,902 | ) | 23,632,968 | ||||||||
| Net assets: | |||||||||||
| Beginning of period | 516,016,488 | 492,383,520 | |||||||||
| End of period (including accumulated undistributed net investment income of $3,794,038 and $4,927,285, respectively) | $ | 267,998,586 | $ | 516,016,488 | |||||||
See accompanying notes to the financial statements.
20
GMO Developed World Stock Fund
(A Series of GMO Trust)
Financial Highlights
(For a Class III share outstanding throughout each period)
| Year Ended February 28, | |||||||||||||||||||
| 2009 | 2008 | 2007 | 2006(a) | ||||||||||||||||
| Net asset value, beginning of period | $ | 21.88 | $ | 24.58 | $ | 22.24 | $ | 20.00 | |||||||||||
| Income (loss) from investment operations: | |||||||||||||||||||
| Net investment income (loss)† | 0.51 | 0.54 | 0.43 | 0.15 | |||||||||||||||
| Net realized and unrealized gain (loss) | (10.20 | ) | (0.74 | ) | 2.84 | 2.15 | |||||||||||||
| Total from investment operations | (9.69 | ) | (0.20 | ) | 3.27 | 2.30 | |||||||||||||
| Less distributions to shareholders: | |||||||||||||||||||
| From net investment income | (0.64 | ) | (0.67 | ) | (0.32 | ) | (0.06 | ) | |||||||||||
| From net realized gains | (0.21 | ) | (1.83 | ) | (0.61 | ) | — | ||||||||||||
| Total distributions | (0.85 | ) | (2.50 | ) | (0.93 | ) | (0.06 | ) | |||||||||||
| Net asset value, end of period | $ | 11.34 | $ | 21.88 | $ | 24.58 | $ | 22.24 | |||||||||||
| Total Return(b) | (45.56 | )% | (1.73 | )% | 14.87 | % | 11.51 | %** | |||||||||||
| Ratios/Supplemental Data: | |||||||||||||||||||
| Net assets, end of period (000's) | $ | 155,560 | $ | 309,609 | $ | 282,446 | $ | 179,466 | |||||||||||
| Net expenses to average daily net assets | 0.61 | %(c) | 0.62 | %(c) | 0.62 | % | 0.62 | %* | |||||||||||
| Net investment income to average daily net assets | 2.79 | % | 2.15 | % | 1.83 | % | 1.27 | %* | |||||||||||
| Portfolio turnover rate | 50 | % | 53 | % | 43 | % | 15 | %††** | |||||||||||
| Fees and expenses reimbursed by the Manager to average daily net assets: | 0.12 | % | 0.11 | % | 0.12 | % | 0.20 | %* | |||||||||||
| Purchase premiums and redemption fees consisted of the following per share amounts:† | $ | 0.01 | $ | 0.02 | $ | 0.03 | $ | 0.07 | |||||||||||
(a) Period from August 1, 2005 (commencement of operations) through February 28, 2006.
(b) The total returns would have been lower had certain expenses not been reimbursed during the periods shown and assumes the effect of reinvested distributions. Calculation excludes purchase premiums and redemption fees which are borne by the shareholder.
(c) The net expense ratio does not include the effect of expense reductions, except for reimbursements related to securities lending transactions (Note 2).
† Calculated using average shares outstanding throughout the period.
†† Calculation represents portfolio turnover of the Fund for the period August 1, 2005 through February 28, 2006.
* Annualized.
** Not annualized.
See accompanying notes to the financial statements.
21
GMO Developed World Stock Fund
(A Series of GMO Trust)
Financial Highlights
(For a Class IV share outstanding throughout each period)
| Year Ended February 28, | |||||||||||||||||||
| 2009 | 2008 | 2007 | 2006(a) | ||||||||||||||||
| Net asset value, beginning of period | $ | 21.90 | $ | 24.59 | $ | 22.25 | $ | 20.24 | |||||||||||
| Income (loss) from investment operations: | |||||||||||||||||||
| Net investment income (loss)† | 0.51 | 0.56 | 0.45 | 0.12 | |||||||||||||||
| Net realized and unrealized gain (loss) | (10.20 | ) | (0.74 | ) | 2.82 | 1.95 | |||||||||||||
| Total from investment operations | (9.69 | ) | (0.18 | ) | 3.27 | 2.07 | |||||||||||||
| Less distributions to shareholders: | |||||||||||||||||||
| From net investment income | (0.65 | ) | (0.68 | ) | (0.32 | ) | (0.06 | ) | |||||||||||
| From net realized gains | (0.21 | ) | (1.83 | ) | (0.61 | ) | — | ||||||||||||
| Total distributions | (0.86 | ) | (2.51 | ) | (0.93 | ) | (0.06 | ) | |||||||||||
| Net asset value, end of period | $ | 11.35 | $ | 21.90 | $ | 24.59 | $ | 22.25 | |||||||||||
| Total Return(b) | (45.52 | )% | (1.66 | )% | 14.88 | % | 10.23 | %** | |||||||||||
| Ratios/Supplemental Data: | |||||||||||||||||||
| Net assets, end of period (000's) | $ | 112,438 | $ | 206,408 | $ | 209,937 | $ | 137,409 | |||||||||||
| Net expenses to average daily net assets | 0.56 | %(c) | 0.57 | %(c) | 0.57 | % | 0.57 | %* | |||||||||||
| Net investment income to average daily net assets | 2.82 | % | 2.22 | % | 1.93 | % | 1.20 | %* | |||||||||||
| Portfolio turnover rate | 50 | % | 53 | % | 43 | % | 15 | %††** | |||||||||||
| Fees and expenses reimbursed by the Manager to average daily net assets: | 0.12 | % | 0.11 | % | 0.12 | % | 0.17 | %* | |||||||||||
| Purchase premiums and redemption fees consisted of the following per share amounts:† | — | (d) | — | (d) | $ | 0.02 | $ | 0.06 | |||||||||||
(a) Period from September 1, 2005 (commencement of operations) through February 28, 2006.
(b) The total returns would have been lower had certain expenses not been reimbursed during the periods shown and assumes the effect of reinvested distributions. Calculation excludes purchase premiums and redemption fees which are borne by the shareholder.
(c) The net expense ratio does not include the effect of expense reductions, except for reimbursements related to securities lending transactions (Note 2).
(d) For the years ended February 28, 2009 and February 29, 2008, the class received no purchase premiums or redemptions fees.
† Calculated using average shares outstanding throughout the period.
†† Calculation represents portfolio turnover of the Fund for the period August 1, 2005 through February 28, 2006.
* Annualized.
** Not annualized.
See accompanying notes to the financial statements.
22
GMO Developed World Stock Fund
(A Series of GMO Trust)
Notes to Financial Statements
February 28, 2009
1. Organization
GMO Developed World Stock Fund (the "Fund") is a series of GMO Trust (the "Trust"). The Fund is registered under the Investment Company Act of 1940, as amended, as an open-end, non-diversified management investment company. The Fund is advised and managed by Grantham, Mayo, Van Otterloo & Co. LLC (the "Manager" or "GMO"). The Trust was established as a Massachusetts business trust under the laws of The Commonwealth of Massachusetts on June 24, 1985. The Declaration of Trust permits the Trustees of the Trust ("Trustees") to create an unlimited number of series of shares ("Funds") and to subdivide Funds into classes.
The Fund seeks high total return. The Fund seeks to achieve its investment objective by outperforming the MSCI World Index. The Fund typically makes equity investments in companies from the world's developed markets, including the U.S.
Throughout the year ended February 28, 2009, the Fund had two classes of shares outstanding: Class III and Class IV. Each class of shares bears a different level of shareholder service fees.
2. Significant accounting policies
The following is a summary of significant accounting policies followed by the Fund in the preparation of its financial statements. These policies are in conformity with accounting principles generally accepted in the United States of America ("U.S. GAAP") and have been consistently followed by the Fund in preparing its financial statements. The preparation of financial statements in accordance with U.S. GAAP requires management to make estimates and assumptions that affect the reported amounts and disclosures in the financial statements. Actual results could differ from those estimates. The accounting records of the Fund are maintained in U.S. dollars.
Portfolio valuation
Securities listed on a securities exchange for which market quotations are readily available are valued at the last sale price or official closing price on each business day, or if there is no such reported sale or official closing price, at the most recent quoted bid price. Unlisted securities for which market quotations are readily available are generally valued at the most recent quoted bid price. Debt instruments with a remaining maturity of sixty days or less are generally valued at amortized cost, which approximates fair value. Shares of investment funds are generally valued at their net asset value. Securities for which quotations are not readily available or whose values the Manager has determined to be unreliable are valued at fair value as determined in good faith by the Trustees or persons acting at their direction pursuant to procedures approved by the Trustees. By its nature, a fair value price is a good faith estim ate of the value of a security at a given point in time and may not reflect the value that would be realized if the security were sold. The difference between a fair value price and the value realized upon a sale could be material. Because many foreign equity securities markets and exchanges close prior to the close of the
23
GMO Developed World Stock Fund
(A Series of GMO Trust)
Notes to Financial Statements — (Continued)
February 28, 2009
New York Stock Exchange ("NYSE"), closing prices for foreign securities in those markets or on those exchanges do not reflect the events that occur after that close but before the close of the NYSE. As a result, the Fund generally values foreign equity securities using fair value prices, which are based on adjustments to closing prices supplied by a third party vendor based on that vendor's proprietary models. As of February 28, 2009, 37.86% of the net assets of the Fund were valued using fair value prices based on models used by a third party vendor.
In September 2006, the Financial Accounting Standards Board ("FASB") issued Statement of Financial Accounting Standards No. 157, Fair Value Measurements ("SFAS 157"). SFAS 157 is effective for the Fund's current fiscal year. While the adoption of SFAS 157 does not have an effect on the Fund's net asset value, it does require additional disclosures about fair value measurements. SFAS 157 establishes a three-level hierarchy for disclosure of fair value measurements. The valuation hierarchy is based upon the reliability of inputs to the valuation of the Fund's investments. The three levels are defined as follows:
Level 1 – Valuations based on quoted prices for identical securities in active markets.
Level 2 – Valuations determined using other significant direct or indirect observable inputs.
Level 3 – Valuations based on inputs that are unobservable and significant.
The inputs or methodology used for valuing securities are not necessarily an indication of the risk associated with investing in those securities.
The following is a summary of the fair valuations according to inputs used as of February 28, 2009 in valuing the Fund's investments:
| Asset Valuation Inputs | Investments in Securities | Other Financial Instruments* | |||||||||
| Level 1 - Quoted Prices | $ | 164,151,859 | $ | 171,728 | |||||||
| Level 2 - Other Significant Observable Inputs | 101,506,758 | 562,694 | |||||||||
| Level 3 - Significant Unobservable Inputs | — | — | |||||||||
| Total | $ | 265,658,617 | $ | 734,422 | |||||||
* Other financial instruments include forward currency contracts and futures contracts.
24
GMO Developed World Stock Fund
(A Series of GMO Trust)
Notes to Financial Statements — (Continued)
February 28, 2009
| Liability Valuation Inputs | Investments in Securities | Other Financial Instruments** | |||||||||
| Level 1 - Quoted Prices | $ | — | $ | (16,829 | ) | ||||||
| Level 2 - Other Significant Observable Inputs | — | (3,555,279 | ) | ||||||||
| Level 3 - Significant Unobservable Inputs | — | — | |||||||||
| Total | $ | — | $ | (3,572,108 | ) | ||||||
** Other financial instruments include forward currency contracts and futures contracts.
The Fund held no investments or other financial instruments at either February 29, 2008 or February 28, 2009, whose fair value was determined using Level 3 inputs.
Foreign currency translation
The market values of foreign securities, currency holdings and related assets and liabilities are translated to U.S. dollars based on the 4 p.m. New York time exchange rates each business day. Income and expenses denominated in foreign currencies are translated at the 4 p.m. New York time exchange rates on the business day the income and expenses are accrued or incurred. The Fund does not isolate realized and unrealized gains and losses attributable to changes in exchange rates from gains and losses that arise from changes in the market value of investments. Such fluctuations are included with net realized and unrealized gain or loss on investments. Net realized gains and losses on foreign currency transactions represent gains and losses on disposition of currencies and forward currency contracts, currency gains and losses realized between the trade and settlement dates on securities transactions, and the difference between the amount of investment income and foreign withholding taxes recorded on the Fund's accounting records and the U.S. dollar equivalent amounts actually received or paid.
Forward currency contracts
The Fund may enter into forward currency contracts including forward cross currency contracts. A forward currency contract is an agreement between two parties to buy and sell a currency at a set price on a future date. The market value of a forward currency contract fluctuates with changes in forward currency exchange rates. Forward currency contracts are marked to market daily using rates supplied by a quotation service and changes in value are recorded by the Fund as an unrealized gain or loss. Realized gains or losses equal to the difference between the value of the contract at the time it was opened and the value at the time it was closed are recorded upon delivery or receipt of the currency or, if a forward currency contract is offset by entering into another forward currency contract with the same broker, upon settlement of the net gain or loss. These contracts may involve market risk in excess of the unrealized gain or lo ss reflected in the Fund's Statement of Assets and Liabilities. They expose the Fund to the risk of unfavorable movements in currency values and the risk that the counterparty will be unable or unwilling to meet the terms of the contracts. Forward currency contracts outstanding at the end of the period are listed in the Fund's Schedule of Investments.
25
GMO Developed World Stock Fund
(A Series of GMO Trust)
Notes to Financial Statements — (Continued)
February 28, 2009
Futures contracts
The Fund may purchase and sell futures contracts. Upon entering into a futures contract, the Fund is required to deposit cash, U.S. government and agency obligations, or other liquid assets with the futures clearing broker in accordance with the initial margin requirements of the broker or exchange. In addition, the Fund maintains cash or securities in an amount that at least equals the net amount payable in the event the Fund must deliver the full amount of the contract. Futures contracts are marked to market daily and an appropriate payable or receivable for the change in value ("variation margin") is recorded by the Fund. The payable or receivable is settled on the following business day. Gains or losses are recognized but not considered realized until the contracts expire or are closed. Futures contracts involve, to varying degrees, risk of loss in excess of the variation margin disclosed in the Statement of Assets and Liabi lities. Under some circumstances, futures exchanges may establish daily limits on the amount that the price of a futures contract can vary from the previous day's settlement price, thereby effectively preventing liquidation of unfavorable positions. Losses may arise from changes in the value of the underlying instrument if the Fund is unable to liquidate a futures position due to an illiquid secondary market for the contract or the imposition of price limits, or if counterparties do not perform under the contract terms. Futures contracts are generally valued at the settlement price established each day by the board of trade or exchange on which they are traded. Because many foreign exchanges close prior to the close of the New York Stock Exchange ("NYSE"), closing prices for foreign futures in those markets or on those exchanges do not reflect the events that occur after that close but before the close of the NYSE. As a result, the Fund generally values foreign futures using fair value prices, which are base d on adjustments to closing prices supplied by a third party vendor based on that vendor's proprietary models. Futures contracts outstanding at the end of the period are listed in the Fund's Schedule of Investments.
Options
The Fund may write (i.e., sell) call and put options. Writing options alters the Fund's exposure to the underlying instrument by, in the case of a call option, obligating the Fund to sell the underlying instrument at a set price to the option-holder and, in the case of a put option, obligating the Fund to purchase the underlying instrument at a set price from the option-holder. In the case of an index option, settlement will be in cash. When the Fund writes a call or put option, an amount equal to the premium received is recorded as a liability and subsequently marked to market to reflect the current value of the option written. Premiums received from writing options that expire are treated as realized gains. Premiums received from writing options that are exercised or closed are deducted from the amounts paid on the underlying future, security or currency transaction to determine the realized gain or loss. The Fund as a writer of an option has no control over whether the underlying future, security or currency may be sold (call) or purchased (put) and as a result bears the market risk of an unfavorable change in the price of the future, security or currency underlying the option. In the event that the Fund writes uncovered put or call options (i.e. options for investments that the Fund does not own), it bears the risk of substantial losses if the price of the underlying instrument increases during the term of the option. Options expose the Fund to the risk the Fund may not be able to enter into a closing transaction because of an illiquid market. The Fund had no open written option contracts during the period.
26
GMO Developed World Stock Fund
(A Series of GMO Trust)
Notes to Financial Statements — (Continued)
February 28, 2009
The Fund may also purchase put and call options. Purchasing options alters the Fund's exposure to the underlying instrument by, in the case of a call option, entitling the Fund to purchase the underlying instrument at a set price from the writer of the option and, in the case of a put option, entitling the Fund to sell the underlying instrument at a set price to the writer of the option. The Fund pays a premium for a purchased option. That premium is disclosed in the Schedule of Investments and is subsequently marked to market to reflect the current value of the option. Premiums paid for purchasing options that expire are treated as realized losses. Premiums paid for purchasing options that are exercised or closed are deducted from the proceeds on the closing transaction to determine the realized gain or loss. The risk associated with purchasing put and call options is limited to the premium paid. The Fund had no purchased optio n contracts outstanding at the end of the period.
The Fund values exchange traded options at the last sale price, or if no sale is reported, the last bid price for options it has purchased and the last ask price for options it has written. The Fund values options traded over-the-counter using inputs provided by primary pricing sources and industry standard models.
Swap agreements
The Fund may enter into various types of swap agreements, including without limitation, interest rate, total return, credit default and variance swap agreements. A swap agreement is an agreement to exchange the return generated by one instrument for the return generated by another instrument. When entering into a swap agreement, the Fund and/or the swap counterparty may post or receive cash or securities as collateral. The party posting the collateral typically receives the interest associated with or payments related to the collateral and has the risk of loss related to the collateral.
Interest rate swap agreements involve an exchange by the parties of their respective commitments to pay or right to receive interest, e.g., an exchange of floating rate interest payments for fixed rate interest payments with respect to the notional amount of principal.
Total return swap agreements involve a commitment by one party to pay interest to the other party in exchange for a payment to it from the other party based on the return of a reference instrument (e.g., a security or basket of securities), both based on notional amounts. To the extent the return of the reference instrument exceeds or falls short of the interest payments, one party will receive a payment from or make a payment to the other party.
In a credit default swap agreement, one party makes payments to another party in exchange for the right to receive a specified return if a credit event occurs with respect to a referenced entity or entities. Buying credit default protection reduces the buyer's exposure in the event of an issuer's default (e.g., it reduces risk where a party owns a security issued by or otherwise has exposure to the issuer). Selling credit default protection subjects the seller to exposure to an issuer's default. A seller of credit default protection receives payments in return for its obligation to pay the principal amount of a debt security (or other agreed-upon value) to the other party upon the occurrence of a credit event (e.g., issuer default or similar
27
GMO Developed World Stock Fund
(A Series of GMO Trust)
Notes to Financial Statements — (Continued)
February 28, 2009
event). If no credit event occurs, the seller has no payment obligations. For credit default swap agreements on asset-backed securities, a credit event may be triggered by such events as the issuer's failure to pay interest or principal, an agreement of the holders of an asset-backed security to a maturity extension, a rating downgrade on the security or a write-down on the collateral underlying the security. For credit default swap agreements on corporate or sovereign issuers, a credit event may be triggered by such events as the issuer's bankruptcy, failure to pay interest or principal, repudiation/moratorium or restructuring.
Variance swap agreements involve an agreement by two parties to exchange cash flows based on the measured variance (or square of volatility) of a specified underlying asset. One party agrees to exchange a "fixed rate" or strike price payment for the "floating rate" or realized price variance on the underlying asset with respect to the notional amount. At inception, the strike price chosen is generally fixed at a level such that the fair value of the swap is zero. At the expiration date, the amount paid by one party to the other is the difference between the realized price variance of the underlying asset and the strike price multiplied by the notional amount. A receiver of the realized price variance would receive a payment when the realized price variance of the underlying asset is greater than the strike price and would make a payment when that variance is less than the strike price. A payer of the realized price variance woul d make a payment when the realized price variance of the underlying asset is greater than the strike price and would receive a payment when that variance is less than the strike price. This type of agreement is essentially a forward contract on the future realized price variance of the underlying asset.
The Fund prices its swap agreements daily using models that may incorporate quotations from market makers and records the change in value, if any, as unrealized gain or loss in the Statement of Operations. Payments received or made on swap agreements are recorded as realized gain or loss in the Statement of Operations. Gains or losses are realized upon termination of the swap agreements.
Swap agreements often are not actively traded on financial markets. The values assigned to them may differ significantly from the values that would be realized upon termination, and the differences could be material. Entering into swap agreements involves credit, legal, market and documentation risk that is not reflected in the amounts reported in the Statement of Assets and Liabilities. Such risks include the possibility that the party with whom the Fund contracts may default on its obligations to perform or disagree as to the meaning of contractual terms, or that the collateral that party posts may be insufficient or not timely received by the Fund. Credit risk may be particularly acute in an environment where financial services firms are exposed to systemic risks of the type evidenced by the insolvency of Lehman Brothers and subsequent market disruptions. The Fund had no swap agreements outstanding at the end of the period.
Repurchase agreements
The Fund may enter into repurchase agreements. Under a repurchase agreement the Fund acquires a security for cash and obtains a simultaneous commitment from the seller to repurchase the security at an agreed upon price and date. The Fund, through its custodian, takes possession of securities collateralizing
28
GMO Developed World Stock Fund
(A Series of GMO Trust)
Notes to Financial Statements — (Continued)
February 28, 2009
the repurchase agreement. The collateral is marked to market daily to ensure that the market value of the underlying assets is at least equal to the amount owed to the Fund in the event of default by the seller. If the seller of a repurchase agreement defaults or enters into insolvency proceedings and the value of the collateral declines, the Fund's recovery of cash may be delayed or limited. The Fund had no repurchase agreements outstanding at the end of the period.
Securities lending
The Fund may lend its securities to qualified brokers. The loans are collateralized with cash or liquid securities with a market value at least equal to the market value of the securities upon entering into the loan. As with other extensions of credit, the Fund may bear the risk of loss with respect to the investment of the collateral, the risk of delay in and/or inability to exercise its rights with respect to the collateral, and the risk of delay in recovery or loss of rights in the loaned securities should the borrower of the securities fail financially. If a loan is collateralized by U.S. government securities, the Fund receives a fee from the borrower. If a loan is collateralized by cash, the Fund typically invests the cash collateral for its own account. As of February 28, 2009 the Fund had no securities on loan.
Taxes and distributions
The Fund intends to qualify each tax year as a regulated investment company under Subchapter M of the Internal Revenue Code of 1986, as amended (the "Code"). The Fund intends to distribute substantially all of its net investment income and all of its net realized short-term and long-term capital gain, if any, after giving effect to any available capital loss carryforwards for U.S. federal income tax purposes. Therefore, no provision for U.S. federal income or excise tax is necessary. Taxes on foreign interest and dividend income are generally withheld in accordance with the applicable country's tax treaty with the United States. The foreign withholding rates applicable to a Fund's investments in certain foreign jurisdictions may be higher if a significant portion of the Fund is held by non-U.S. shareholders.
The Fund's policy is to declare and pay distributions from net investment income, if any, semiannually, and from net realized short-term and long-term capital gain, if any, at least annually. All distributions are paid in shares of the Fund, at net asset value, unless the shareholder elects to receive cash distributions. Distributions to shareholders are recorded by the Fund on the ex-dividend date.
Foreign taxes paid by the Fund may be treated, to the extent permissible under the Code and if the Fund so elects, as if paid by the shareholders of the Fund.
The Fund may be subject to capital gains and repatriation taxes imposed by certain countries in which it invests.
Income and capital gain distributions are determined in accordance with U.S. federal income tax regulations, which may differ from U.S. GAAP. Certain capital accounts in the financial statements are periodically adjusted for permanent differences in order to reflect their tax character. These adjustments
29
GMO Developed World Stock Fund
(A Series of GMO Trust)
Notes to Financial Statements — (Continued)
February 28, 2009
have no impact on net assets or net asset value per share. Temporary differences that arise from recognizing certain items of income, expense, gain or loss in different periods for financial statement and tax purposes will reverse at some time in the future. Distributions in excess of net investment income or net realized gains are temporary over-distributions for financial statement purposes resulting from differences in the recognition or classification of income or distributions for financial statement and tax purposes.
U.S. GAAP and tax accounting differences primarily relate to capital loss carryforwards, derivative contract transactions, foreign currency transactions, losses on wash sale transactions and post-October capital losses.
The following reclassification represents the amount necessary to report the stated components of net assets on a tax basis, excluding certain temporary differences, as of February 28, 2009, The financial highlights exclude these adjustments.
| Accumulated Undistributed Net Investment Income | Distributions In Excess of Net Realized Gain | Paid-in Capital | |||||||||
| $ | 1,532,345 | $ | (1,532,345 | ) | $ | — | |||||
The tax character of distributions declared to shareholders is as follows:
| 2/28/2009 | 2/29/2008 | ||||||||||
| Ordinary income (including any net short-term capital gain) | $ | 14,034,754 | $ | 22,308,523 | |||||||
| Net long-term capital gain | 4,422,309 | 30,038,282 | |||||||||
| Total distributions | $ | 18,457,063 | $ | 52,346,805 | |||||||
Distributions in excess of tax basis earnings and profits, if significant, are reported in the financial statements as a return of capital for tax purposes.
As of February 28, 2009, the components of distributable earnings on a tax basis consisted of the following:
| Undistributed ordinary income (including any net short-term capital gain) | $ | 2,711,661 | |||||
As of February 28, 2009 the Fund elected to defer to March 1, 2009 post-October capital losses of $32,763,918.
30
GMO Developed World Stock Fund
(A Series of GMO Trust)
Notes to Financial Statements — (Continued)
February 28, 2009
As of February 28, 2009, the Fund had capital loss carryforwards available to offset future realized gains if any, to the extent permitted by the Code. Utilization of the capital loss carryforwards could be subject to limitations imposed by the Code related to share ownership activity. Such losses expire as follows:
| 2/28/2017 | $ | (12,590,155 | ) | ||||
| Total | $ | (12,590,155 | ) | ||||
As of February 28, 2009, the approximate cost for U.S. federal income tax purposes and gross and net unrealized appreciation (depreciation) in value of investments were as follows:
| Aggregate Cost | Gross Unrealized Appreciation | Gross Unrealized (Depreciation) | Net Unrealized Appreciation (Depreciation) | ||||||||||||
| $ | 465,208,979 | $ | 1,496,482 | $ | (201,046,844 | ) | $ | (199,550,362 | ) | ||||||
The Fund is subject to the provisions of Financial Accounting Standards Board Interpretation No. 48 ("FIN 48"), Accounting for Uncertainty in Income Taxes — an Interpretation of FASB Statement No. 109. FIN 48 sets forth a minimum threshold for financial statement recognition of a tax position taken or expected to be taken in a tax return that could affect the Fund's financial statements. The Fund did not have any unrecognized tax benefits or liabilities at February 28, 2009, nor did it have any increases or decreases in unrecognized tax benefits or liabilities for the period then ended. The Fund is subject to examination prior to the expiration of the statute of limitations by U.S. federal and state tax authorities for tax returns filed.
Security transactions and related investment income
Security transactions in the financial statements are accounted for on the trade date. Dividend income, net of applicable foreign withholding taxes, if any, is recorded on the ex-dividend date or, if later, when the Fund is informed of the ex-dividend date. Interest income is recorded on the accrual basis and is adjusted for the amortization of premiums and accretion of discounts. Principal on inflation indexed securities is adjusted for inflation and any increase or decrease is recorded as interest income or loss. Income is not recognized on securities for which collection is not expected. Non-cash dividends, if any, are recorded at the fair market value of the asset received. In determining the net gain or loss on securities sold, the Fund uses the identified cost basis for the purposes of determining the cost basis.
Expenses
The majority of the expenses of the Trust are directly identifiable to an individual fund. Expenses that are not readily identifiable to a specific fund are allocated taking into consideration, among other things, the nature and type of expense and the relative size of the funds. Investment income, common expenses and realized and unrealized gains and losses are allocated pro rata among the classes of shares of the Fund
31
GMO Developed World Stock Fund
(A Series of GMO Trust)
Notes to Financial Statements — (Continued)
February 28, 2009
based on the relative net assets of each class. Shareholder service fees, which are directly attributable to a class of shares, are charged to that class's operations.
Brown Brothers Harriman & Co. ("BBH") serves as custodian and fund accounting agent of the Fund. State Street Bank and Trust Company ("State Street") serves as transfer agent of the Fund. BBH and State Street's fees may be reduced by an earnings allowance calculated on the average daily cash balances the Fund maintains with each agent. The Fund receives the benefit of the earnings allowance. In addition, Goldman Sachs Agency Lending, the Fund's securities lending agent, has agreed to reimburse the Fund for certain transactional expenses related to securities lending activity. Credit balances or expense reimbursements used to reduce fees, if any, are reported as a reduction of expenses in the Statement of Operations.
Purchases and redemptions of Fund shares
As of February 28, 2009, the premium on cash purchases and fee on cash redemptions of Fund shares were each 0.25% of the amount invested or redeemed. An additional purchase premium and redemption fee of 0.005% is charged for any purchases/redemptions (or any portion of a purchase/redemption) effected in a currency other than the U.S. dollar. The Fund may impose a new purchase premium and/or redemption fee, or modify or eliminate and existing purchase premium and/or redemption fee, at any time. If the Manager determines that any portion of a cash purchase or redemption is offset by a corresponding cash redemption or purchase on the same day, the Fund will ordinarily waive or reduce the purchase premium or redemption fee with respect to that portion. In addition, the Fund may waive or reduce the purchase premium or redemption fee in extraordinary circumstances if the purchase or redemption will not cause the Fund to incur transact ion costs. All purchase premiums and redemption fees are paid to the Fund and recorded by the Fund as paid-in-capital. The Fund will waive or reduce the purchase premium relating to the in-kind portion of a purchase transaction except for estimated or known transaction costs (e.g. stamp duties and transfer taxes) incurred by the Fund as a result of the transfer of the purchasing shareholder's securities to the Fund. In-kind redemption transactions are generally not subject to redemption fees except when they include a cash component. However, when a substantial portion of a Fund is being redeemed, the Fund may charge a redemption fee based on estimated or known transaction costs resulting from those redemptions. The Fund charges no premium for reinvested distributions.
Investment risks
The Fund is subject to risks involved in investing in foreign securities that are not presented by investments in U.S. securities. These risks may involve adverse political and economic developments, including expropriation and the possible imposition of capital controls or other foreign governmental laws or restrictions. In addition, the securities of some foreign companies and securities markets are less liquid and at times may be more volatile than securities of comparable U.S. companies and U.S. securities markets.
32
GMO Developed World Stock Fund
(A Series of GMO Trust)
Notes to Financial Statements — (Continued)
February 28, 2009
Recently issued accounting pronouncement
In March 2008, FASB issued Statement of Financial Accounting Standards No. 161, Disclosures about Derivative Instruments and Hedging Activities ("SFAS 161"). SFAS 161 is effective for fiscal years and interim periods beginning after November 15, 2008. SFAS 161 requires enhanced disclosures about the Fund's derivative and hedging activities. The Manager is currently evaluating the impact the adoption of SFAS 161 will have on the Fund's financial statement disclosures.
3. Fees and other transactions with affiliates
Effective June 30, 2008, GMO receives a management fee for the services it provides to the Fund. That fee is paid monthly at the annual rate of 0.45% of average daily net assets. For the period from March 1, 2008 through June 29, 2008, the management fee rate was 0.47% of average daily net assets. The Fund has adopted a Shareholder Service Plan under which the Fund pays GMO a shareholder service fee for client and shareholder service, reporting, and other support. Pursuant to the Shareholder Service Plan, the shareholder service fee is calculated based on average daily net assets at the annual rate of 0.15% for Class III shares and 0.10% for Class IV shares.
Through at least June 30, 2009, the Manager has contractually agreed to reimburse the Fund for Fund expenses incurred through that date to the extent the Fund's total annual operating expenses (excluding "Excluded Expenses", as defined below) exceed 0.45% of the Fund's average daily net assets. Excluded Expenses include shareholder service fees, fees and expenses of the independent Trustees of the Trust, fees and expenses for legal services not approved by the Manager for the Trust, compensation and expenses of the Trust's Chief Compliance Officer ("CCO") (excluding any employee benefits), brokerage commissions, securities lending fees and expenses, interest expense, transfer taxes, and other investment-related costs (including expenses associated with investments in any company that is an investment company or would be an investment company under the 1940 Act, but for the exceptions to the definition of investment company provi ded in Section 3(c)(1) and 3(c)(7) of the 1940 Act), hedging transaction fees, extraordinary, non-recurring and certain other unusual expenses (including taxes).
The Fund's portion of the fees paid by the Trust to the Trust's independent Trustees and CCO during the year ended February 28, 2009, was $4,762 and $2,990, respectively. The compensation and expenses of the CCO are included in miscellaneous expenses in the Statement of Operations. The Fund paid no remuneration to any other officer of the Trust.
4. Purchases and sales of securities
Cost of purchases and proceeds from sales of securities, excluding short-term investments, for the year ended February 28, 2009 aggregated $192,356,311 and $211,660,162, respectively.
33
GMO Developed World Stock Fund
(A Series of GMO Trust)
Notes to Financial Statements — (Continued)
February 28, 2009
5. Guarantees
In the normal course of business the Fund enters into contracts with third-party service providers that contain a variety of representations and warranties and that provide general indemnifications. The Fund's maximum exposure under these arrangements is unknown, as it involves future claims that may be made against the Fund that have not yet occurred. Based on experience, management is of the view that the risk of loss in connection with its indemnification obligations is remote; however, there can be no assurance that such obligations will not result in material liabilities that adversely affect the Fund.
6. Principal shareholders and related parties
As of February 28, 2009, 52.26% of the outstanding shares of the Fund were held by three shareholders, each holding more than 10% of the Fund's outstanding shares. On that date, no other shareholder owned more than 10% of the outstanding shares of the Fund. Redemptions from (or investments into) the Fund by or on behalf of these large shareholders may have a material effect on the Fund.
As of February 28, 2009, no shares of the Fund were held by senior management of the Manager and GMO Trust officers and none of the Fund's shares were held by accounts for which the Manager had investment discretion.
7. Share transactions
The Declaration of Trust permits the Trust to issue an unlimited number of shares of beneficial interest (without par value). Transactions in Fund shares were as follows:
| Year Ended February 28, 2009 | Year Ended February 29, 2008 | ||||||||||||||||||
| Class III: | Shares | Amount | Shares | Amount | |||||||||||||||
| Shares sold | 1,345,030 | $ | 22,152,501 | 2,679,838 | $ | 67,974,333 | |||||||||||||
| Shares issued to shareholders in reinvestment of distributions | 465,528 | 7,953,416 | 1,157,471 | 28,331,295 | |||||||||||||||
| Shares repurchased | (2,243,384 | ) | (47,286,141 | ) | (1,177,880 | ) | (29,566,075 | ) | |||||||||||
| Purchase premiums | — | 55,520 | — | 170,362 | |||||||||||||||
| Redemption fees | — | 118,215 | — | 83,166 | |||||||||||||||
| Net increase (decrease) | (432,826 | ) | $ | (17,006,489 | ) | 2,659,429 | $ | 66,993,081 | |||||||||||
34
GMO Developed World Stock Fund
(A Series of GMO Trust)
Notes to Financial Statements — (Continued)
February 28, 2009
| Year Ended February 28, 2009 | Year Ended February 29, 2008 | ||||||||||||||||||
| Class IV: | Shares | Amount | Shares | Amount | |||||||||||||||
| Shares sold | — | $ | — | — | $ | — | |||||||||||||
| Shares issued to shareholders in reinvestment of distributions | 482,092 | 8,116,327 | 889,056 | 21,793,212 | |||||||||||||||
| Shares repurchased | — | — | — | — | |||||||||||||||
| Purchase premiums | — | — | — | — | |||||||||||||||
| Redemption fees | — | — | — | — | |||||||||||||||
| Net increase (decrease) | 482,092 | $ | 8,116,327 | 889,056 | $ | 21,793,212 | |||||||||||||
35
Report of Independent Registered Public Accounting Firm
To the Trustees of GMO Trust and the Shareholders of
GMO Developed World Stock Fund:
In our opinion, the accompanying statement of assets and liabilities, including the schedule of investments, and the related statements of operations and of changes in net assets and the financial highlights present fairly, in all material respects, the financial position of GMO Developed World Stock Fund (the "Fund") at February 28, 2009 , the results of its operations for the year then ended, the changes in its net assets for each of the two years in the period then ended and the financial highlights for each of the periods indicated, in conformity with accounting principles generally accepted in the United States of America. These financial statements and financial highlights (hereafter referred to as "financial statements") are the responsibility of the Fund's management. Our responsibility is to express an opinion on these financial statements based on our audits. We conducted our audits of these financial statements in acc ordance with the standards of the Public Company Accounting Oversight Board (United States). Those standards require that we plan and perform the audit to obtain reasonable assurance about whether the financial statements are free of material misstatement. An audit includes examining, on a test basis, evidence supporting the amounts and disclosures in the financial statements, assessing the accounting principles used and significant estimates made by management, and evaluating the overall financial statement presentation. We believe that our audits, which included confirmation of securities at February 28, 2009 by correspondence with the custodian and brokers, provide a reasonable basis for our opinion.
PricewaterhouseCoopers LLP
Boston, Massachusetts
April 29, 2009
36
GMO Developed World Stock Fund
(A Series of GMO Trust)
Fund Expenses
February 28, 2009 (Unaudited)
Expense Examples: The following information is in relation to expenses for the six month period ended February 28, 2009.
As a shareholder of the Fund, you may incur two types of costs: (1) transaction costs, including purchase premiums and redemption fees; and (2) ongoing costs, including management fees, shareholder service fees, and other Fund expenses. This example is intended to help you understand your ongoing costs (in dollars) of investing in the Fund and to compare these costs with the ongoing costs of investing in other mutual funds.
These examples are based on an investment of $1,000 invested at the beginning of the period and held for the entire period, September 1, 2008 through February 28, 2009.
Actual Expenses
The first line of the table for each class below provides information about actual account values and actual expenses. You may use the information in this line, together with the amount you invested, to estimate the expenses that you paid over the period. Simply divide your account value by $1,000 (for example, a $10,000,000 account value divided by $1,000 = 10,000), then multiply the result by the number in the first line under the heading entitled "Net Expense Incurred" to estimate the expenses you paid on your account during this period.
Hypothetical Example for Comparison Purposes
The second line of the table for each class below provides information about hypothetical account values and hypothetical expenses based on the Fund's actual expense ratio and an assumed rate of return of 5% per year before expenses, which is not the Fund's actual return. The hypothetical account values and expenses may not be used to estimate the actual ending account balance or expenses you paid for the period. You may use this information to compare the ongoing costs of investing in the Fund with other funds. To do so, compare this 5% hypothetical example with the 5% hypothetical examples that appear in the shareholder reports of other funds.
Please note that the expenses shown in the table are meant to highlight your ongoing costs only and do not reflect any transactional costs, such as purchase premiums and redemption fees. Therefore, the second line of the table is useful in comparing ongoing costs only, and will not help you determine the relative total costs of owning different funds. In addition, if these transactional costs were included, your costs would have been higher.
| Annualized Net Expense Ratio | Beginning Account Value | Ending Account Value | Net Expense Incurred* | ||||||||||||||||
| Class III | |||||||||||||||||||
| 1) Actual | 0.60 | % | $ | 1,000.00 | $ | 574.80 | $ | 2.34 | |||||||||||
| 2) Hypothetical | 0.60 | % | $ | 1,000.00 | $ | 1,021.82 | $ | 3.01 | |||||||||||
| Class IV | |||||||||||||||||||
| 1) Actual | 0.55 | % | $ | 1,000.00 | $ | 575.10 | $ | 2.15 | |||||||||||
| 2) Hypothetical | 0.55 | % | $ | 1,000.00 | $ | 1,022.07 | $ | 2.76 | |||||||||||
* Expenses are calculated using each Class's annualized net expense ratio for the six months ended February 28, 2009, multiplied by the average account value over the period, multiplied by 181 days in the period, divided by 365 days in the year.
37
GMO Developed World Stock Fund
(A Series of GMO Trust)
Tax Information for the Tax Year Ended February 28, 2009 (Unaudited)
The Fund will notify shareholders of amounts for use in preparing 2009 income tax forms in January 2010.
The Fund's distributions to shareholders include $4,422,309 from long-term capital gains.
For taxable, non-corporate shareholders, 78.44% of the income and short-term capital gains, if any, distributed in the Fund's fiscal year ended February 28, 2009 represents qualified dividend income subject to the 15% rate category.
For corporate shareholders, 36.22% of the income and short-term capital gains, if any, distributed in the Fund's fiscal year ended February 28, 2009 qualified for the dividends-received deduction.
38
Trustees and Officers (Unaudited)
The following tables list the Trust's Trustees and Officers as of the date of this report; their address and date of birth ("DOB"); their position with the Trust; the length of time holding that position with the Trust; their principal occupation(s) during the past five years; the number of portfolios in the fund complex they oversee; and other directorships they hold in companies subject to registration or reporting requirements of the Securities Exchange Act of 1934 (generally called "public companies") or in registered investment companies. The Trust's Statement of Additional Information ("SAI") includes additional information about the Trust's trustees, including changes subsequent to the date of the report. The SAI is available, without charge, upon request by writing GMO, c/o GMO Trust, 40 Rowes Wharf, Boston, MA 02110.
Independent Trustees:
| Name, Address, and DOB | Position(s) Held with Trust | Term of Office1 and Length of Time Served | Principal Occupation(s) During Past Five Years | Number of Portfolios in Fund Complex Overseen by Trustee | Other Directorships Held by Trustee | ||||||||||||||||||
| Donald W. Glazer, Esq. c/o GMO Trust 40 Rowes Wharf Boston, MA 02110 DOB: 07/26/1944 | Chairman of the Board of Trustees | Chairman of the Board of Trustees since March 2005; Lead Independent Trustee (September 2004 – March 2005); Trustee since December 2000. | Consultant – Law and Business2; Author of Legal Treatises. | 59 | None. | ||||||||||||||||||
1 Each Trustee is elected to serve during the continued lifetime of the Trust until he/she dies, resigns or is removed, or if sooner, until the next meeting of Shareholders called for the purpose of electing Trustees and until the election and qualification of his/her successor.
2 As part of Mr. Glazer's work as a consultant, he provides part-time consulting services to Goodwin Procter LLP ("Goodwin"). Goodwin has provided legal services to Renewable Resources, LLC, an affiliate of GMO; GMO, in connection with its relationship with Renewable Resources; and funds managed by Renewable Resources. Mr. Glazer has represented that he has no financial interest in, and is not involved in the provision of, such legal services. In the calendar years ended December 31, 2007 and December 31, 2008, these entities paid $789,416 and $183,864 respectively, in legal fees and disbursements to Goodwin. In correspondence with the Staff of the Securities and Exchange Commission beginning in August 2006, the Independent Trustees' legal counsel provided the Staff with information regarding Mr. Glazer's relationship with Goodwin and h is other business activities. On September 11, 2007, based on information that had been given to the Staff as of that date, the Staff provided oral no-action assurance consistent with the opinion of the Independent Trustees' legal counsel that Mr. Glazer is not an "interested person" of the Trust.
39
Independent Trustees — (Continued)
| Name, Address, and DOB | Position(s) Held with Trust | Term of Office1 and Length of Time Served | Principal Occupation(s) During Past Five Years | Number of Portfolios in Fund Complex Overseen by Trustee | Other Directorships Held by Trustee | ||||||||||||||||||
| W. Nicholas Thorndike c/o GMO Trust 40 Rowes Wharf Boston, MA 02110 DOB: 03/28/1933 | Trustee | Since March 2005. | Director or trustee of various corporations and charitable organizations, including Courier Corporation (a book publisher and manufacturer) (July 1989 – present); Putnam Funds (December 1992 – June 2004); and Providence Journal (a newspaper publisher) (December 1986 – December 2003). | 59 | Director of Courier Corporation (a book publisher and manufacturer); Member of the Investment Committee of Partners HealthCare System, Inc.3 | ||||||||||||||||||
| Peter Tufano c/o GMO Trust 40 Rowes Wharf Boston, MA 02110 DOB: 04/22/1957 | Trustee | Since December 2008. | Sylvan C. Coleman Professor of Financial Management, Harvard Business School (since 1989). | 59 | Trustee of State Street Navigator Securities Lending Trust (3 Portfolios). | ||||||||||||||||||
1 Each Trustee is elected to serve during the continued lifetime of the Trust until he/she dies, resigns or is removed, or if sooner, until the next meeting of Shareholders called for the purpose of electing Trustees and until the election and qualification of his/her successor.
3 Partners HealthCare System, Inc. is a client of the Manager.
40
Principal Officers:
| Name, Address, and DOB | Position(s) Held with Trust | Term of Office4 and Length of Time Served | Principal Occupation(s) During Past Five Years5 | ||||||||||||
| J.B. Kittredge DOB: 08/22/1954 | President and Chief Executive Officer | Since March 2009. | General Counsel, Grantham, Mayo, Van Otterloo & Co. LLC (October 2005 – Present); Partner, Ropes & Gray LLP. | ||||||||||||
| Sheppard N. Burnett c/o GMO Trust 40 Rowes Wharf Boston, MA 02110 DOB: 10/24/1968 | Treasurer and Chief Financial Officer | Chief Financial Officer since March 2007; Treasurer since November 2006; Assistant Treasurer, September 2004 – November 2006. | Fund Administration Staff, Grantham, Mayo, Van Otterloo & Co. LLC (June 2004 – present); Vice President, Director of Tax, Columbia Management Group (2002 – 2004). | ||||||||||||
| Brent C. Arvidson c/o GMO Trust 40 Rowes Wharf Boston, MA 02110 DOB: 06/26/1969 | Assistant Treasurer | Since August 1998. | Senior Fund Administrator, Grantham, Mayo, Van Otterloo & Co. LLC. | ||||||||||||
| John L. Nasrah c/o GMO Trust 40 Rowes Wharf Boston, MA 02110 DOB: 05/27/1977 | Assistant Treasurer | Since March 2007. | Fund Administrator, Grantham, Mayo, Van Otterloo & Co. LLC (September 2004 – present); Tax Analyst, Bain & Company, Inc. (June 2003 – September 2004). | ||||||||||||
| Mahmoodur Rahman c/o GMO Trust 40 Rowes Wharf Boston, MA 02110 DOB: 11/30/1967 | Assistant Treasurer | Since September 2007. | Fund Administrator, Grantham, Mayo, Van Otterloo & Co. LLC (April 2007 – present); Vice President and Senior Tax Manager, Massachusetts Financial Services Company (January 2000 – April 2007). | ||||||||||||
| Michael E. Gillespie c/o GMO Trust 40 Rowes Wharf Boston, MA 02110 DOB: 02/18/1958 | Chief Compliance Officer | Since March 2005. | Vice President of Compliance (June 2004 – February 2005) and Director of Domestic Compliance (March 2002 – June 2004), Fidelity Investments. | ||||||||||||
4 Each officer is elected to hold such office until his or her successor is duly elected and qualified to carry out the duties and responsibilities of the office, or until he or she resigns or is removed from office.
5 Each of Messrs. Burnett, Arvidson, Bohan, and Pottle serves as an officer and/or director of certain pooled investment vehicles of which GMO or an affiliate of GMO serves as the investment adviser.
41
Principal Officers — (Continued)
| Name, Address, and DOB | Position(s) Held with Trust | Term of Office4 and Length of Time Served | Principal Occupation(s) During Past Five Years5 | ||||||||||||
| Jason B. Harrison c/o GMO Trust 40 Rowes Wharf Boston, MA 02110 DOB: 01/29/1977 | Vice President and Clerk | Vice President since November 2006; Clerk since March 2006. | Legal Counsel, Grantham, Mayo, Van Otterloo & Co. LLC (since February 2006) and Attorney, Ropes & Gray LLP (September 2002 – February 2006). | ||||||||||||
| David L. Bohan c/o GMO Trust 40 Rowes Wharf Boston, MA 02110 DOB: 06/21/1964 | Vice President and Assistant Clerk | Vice President since March 2005; Assistant Clerk since March 2006. | Legal Counsel, Grantham, Mayo, Van Otterloo & Co. LLC. | ||||||||||||
| Gregory L. Pottle c/o GMO Trust 40 Rowes Wharf Boston, MA 02110 DOB: 07/09/1971 | Vice President and Assistant Clerk | Since November 2006. | Legal Counsel, Grantham, Mayo, Van Otterloo & Co. LLC. | ||||||||||||
| Anne K. Trinque c/o GMO Trust 40 Rowes Wharf Boston, MA 02110 DOB: 04/15/1978 | Vice President and Assistant Clerk | Since September 2007. | Legal Counsel, Grantham, Mayo, Van Otterloo & Co. LLC (January 2007 – present); Attorney, Goodwin Procter LLP (September 2003 – January 2007). | ||||||||||||
| Cheryl Wakeham c/o GMO Trust 40 Rowes Wharf Boston, MA 02110 DOB: 10/29/1958 | Vice President and Anti-Money Laundering Officer | Since December 2004. | Manager, Client Service Administration, Grantham, Mayo, Van Otterloo & Co. LLC. | ||||||||||||
4 Each officer is elected to hold such office until his or her successor is duly elected and qualified to carry out the duties and responsibilities of the office, or until he or she resigns or is removed from office.
5 Each of Messrs. Burnett, Arvidson, Bohan, and Pottle serves as an officer and/or director of certain pooled investment vehicles of which GMO or an affiliate of GMO serves as the investment adviser.
42
GMO Emerging Countries Fund
(A Series of GMO Trust)
Annual Report
February 28, 2009
For a free copy of the Fund's proxy voting guidelines, shareholders may call 1-617-346-7646 (collect) or visit the Securities and Exchange Commission's website at www.sec.gov. Information regarding how the Fund voted proxies relating to portfolio securities during the most recent 12-month period ended June 30 is available on GMO's website at www.gmo.com, or on the Securities and Exchange Commission's website at www.sec.gov.
The Fund files its complete schedule of portfolio holdings with the Securities and Exchange Commission for the first and third quarter of each fiscal year on Form N-Q, which is available on the Commission's website at www.sec.gov. The Fund's Form N-Q may be reviewed and copied at the Commission's Public Reference Room in Washington, D.C. Information on the operation of the Public Reference Room may be obtained by calling 1-800-SEC-0330. The Fund has a policy with respect to disclosure of portfolio holdings under which it may also make available on GMO's website at www.gmo.com a complete schedule of portfolio holdings.
This report is prepared for the general information of shareholders. It is authorized for distribution to prospective investors only when preceded or accompanied by a prospectus for the GMO Trust, which contains a complete discussion of the risks associated with an investment in this Fund and other important information. The GMO Trust prospectus can be obtained at www.gmo.com.
GMO Emerging Countries Fund
(A Series of GMO Trust)
Portfolio Management
Day-to-day management of the Fund's portfolio is the responsibility of the Emerging Markets team at Grantham, Mayo, Van Otterloo & Co. LLC.
Management Discussion and Analysis of Fund Performance
The Class III shares of the GMO Emerging Countries Fund returned -58.6% for the fiscal year ended February 28, 2009, as compared to -56.3% for the S&P/IFCI (Investable) Composite Index. Consistent with the Fund's investment objectives and policies, the Fund was invested substantially in emerging markets equities throughout the fiscal year.
Country selection detracted 1.5% from performance during the period. The Fund's underweights in Russia and India and overweight in Brazil contributed to relative performance. The Fund's overweights in Korea, Hungary, and Pakistan and underweights in China and Israel detracted from relative performance.
Stock selection was successful in Taiwan while it detracted from performance in Korea, Russia, Israel, Mexico, and Indonesia.
The views expressed herein are exclusively those of Grantham, Mayo, Van Otterloo & Co. LLC Management as of the date of this report and are subject to change. GMO disclaims any responsibility to update such views. They are not meant as investment advice.
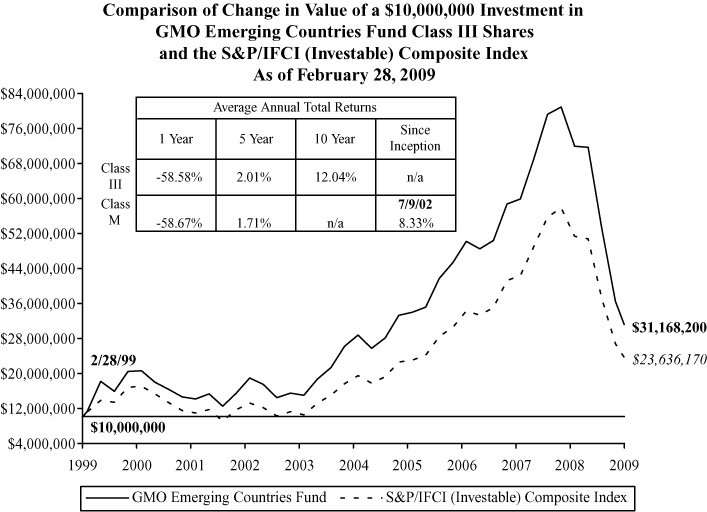
Performance data quoted represents past performance and is not indicative of future results. The investment return and principal value of an investment will fluctuate so that an investor's shares, when redeemed, may be worth more or less than their original cost. Current performance data may be lower or higher than the performance data provided herein. To obtain performance information to the most recent month-end, visit www.gmo.com. Performance shown is net of all fees after reimbursement from the Manager. Returns would have been lower had certain expenses not been reimbursed during the periods shown and do not include the effect of taxes on distributions and redemptions. All information is unaudited. Performance for Class M shares will vary due to different fees.
GMO Emerging Countries Fund
(A Series of GMO Trust)
Investments Concentration Summary
February 28, 2009 (Unaudited)
| Asset Class Summary | % of Total Net Assets | ||||||
| Common Stocks | 84.3 | % | |||||
| Preferred Stocks | 12.3 | ||||||
| Short-Term Investments | 1.9 | ||||||
| Investment Funds | 0.1 | ||||||
| Forward Currency Contracts | 0.0 | ||||||
| Rights and Warrants | 0.0 | ||||||
| Other | 1.4 | ||||||
| 100.0 | % | ||||||
| Country Summary | % of Equity Investments | ||||||
| Brazil | 19.2 | % | |||||
| South Korea | 18.1 | ||||||
| Taiwan | 13.6 | ||||||
| China | 12.0 | ||||||
| South Africa | 7.6 | ||||||
| Turkey | 5.5 | ||||||
| Thailand | 5.0 | ||||||
| Russia | 3.4 | ||||||
| Malaysia | 3.0 | ||||||
| India | 2.4 | ||||||
| Mexico | 1.7 | ||||||
| Israel | 1.5 | ||||||
| Poland | 1.2 | ||||||
| Chile | 1.1 | ||||||
| Egypt | 1.1 | ||||||
| Indonesia | 0.8 | ||||||
| Philippines | 0.8 | ||||||
| Czech Republic | 0.7 | ||||||
| Hungary | 0.7 | ||||||
| Morocco | 0.4 | ||||||
| United States* | 0.1 | ||||||
| Argentina | 0.1 | ||||||
| Peru | 0.0 | ||||||
| 100.0 | % | ||||||
* Represents an investment to equitize cash in the iShares® MSCI Emerging Markets Index Fund, which is a separate investment portfolio of iShares, Inc., a registered investment company. The iShares® MSCI Emerging Markets Index Fund invests in global emerging markets and seeks investment results that correspond generally to the price and yield performance, before fees and expenses, of the MSCI Emerging Markets Index. iShares® is a registered trademark of Barclays Global Investors, N.A. ("BGI"). Neither BGI nor the iShares® Funds make any representations regarding the advisability of investing in the iShares® MSCI Emerging Markets Index Fund.
1
GMO Emerging Countries Fund
(A Series of GMO Trust)
Investments Concentration Summary — (Continued)
February 28, 2009 (Unaudited)
| Industry Sector Summary | % of Equity Investments | ||||||
| Financials | 22.9 | % | |||||
| Information Technology | 13.5 | ||||||
| Telecommunication Services | 12.5 | ||||||
| Energy | 12.4 | ||||||
| Materials | 11.8 | ||||||
| Industrials | 8.0 | ||||||
| Consumer Discretionary | 6.1 | ||||||
| Utilities | 6.0 | ||||||
| Consumer Staples | 5.3 | ||||||
| Health Care | 1.3 | ||||||
| Miscellaneous* | 0.2 | ||||||
| 100.0 | % | ||||||
* Represents an investment to equitize cash in the iShares® MSCI Emerging Markets Index Fund, which is a separate investment portfolio of iShares, Inc., a registered investment company. The iShares® MSCI Emerging Markets Index Fund invests in global emerging markets and seeks investment results that correspond generally to the price and yield performance, before fees and expenses, of the MSCI Emerging Markets Index. iShares® is a registered trademark of Barclays Global Investors, N.A. ("BGI"). Neither BGI nor the iShares® Funds make any representations regarding the advisability of investing in the iShares® MSCI Emerging Markets Index Fund.
2
GMO Emerging Countries Fund
(A Series of GMO Trust)
Schedule of Investments
(showing percentage of total net assets)
February 28, 2009
| Shares | Description | Value ($) | |||||||||||||
| COMMON STOCKS — 84.3% | |||||||||||||||
| Argentina — 0.1% | |||||||||||||||
| 5,060 | Cresud SA Sponsored ADR | 36,280 | |||||||||||||
| 22,280 | Petrobras Energia Participaciones SA Sponsored ADR | 111,846 | |||||||||||||
| Total Argentina | 148,126 | ||||||||||||||
| Brazil — 6.7% | |||||||||||||||
| 76,400 | Banco do Brasil SA | 442,477 | |||||||||||||
| 3,000 | Banco Nossa Caixa SA | 87,689 | |||||||||||||
| 3,200 | Brasil Telecom Participacoes SA | 80,756 | |||||||||||||
| 4,100 | Cia de Saneamento de Minas Gerais-Copasa MG * | 35,644 | |||||||||||||
| 33,509 | Companhia Saneamento Basico Sao Paulo | 336,856 | |||||||||||||
| 81,600 | Companhia Vale do Rio Doce | 1,053,355 | |||||||||||||
| 5,700 | CPFL Energia SA | 74,962 | |||||||||||||
| 20,400 | Cyrela Brazil Realty SA | 60,055 | |||||||||||||
| 23,200 | EDP-Energias Do Brasil SA | 227,013 | |||||||||||||
| 31,100 | Electrobras (Centro) | 340,729 | |||||||||||||
| 68,700 | Empresa Brasileira de Aeronautica SA | 189,317 | |||||||||||||
| 9,100 | Empresa Brasileira de Aeronautica SA Sponsored ADR | 98,371 | |||||||||||||
| 38,200 | Fertilizantes Heringer SA * | 63,576 | |||||||||||||
| 27,300 | Gerdau SA | 114,045 | |||||||||||||
| 34,448 | Investimentos Itau SA | 147,651 | |||||||||||||
| 31,300 | JBS SA | 60,338 | |||||||||||||
| 53,200 | Natura Cosmeticos SA | 482,747 | |||||||||||||
| 72,940 | Petroleo Brasileiro SA (Petrobras) | 997,381 | |||||||||||||
| 32,660 | Petroleo Brasileiro SA (Petrobras) ADR | 905,662 | |||||||||||||
| 53,900 | Redecard SA | 563,478 | |||||||||||||
| 8,523 | Souza Cruz SA | 171,073 | |||||||||||||
| 11,800 | Tele Norte Leste Participacoes SA | 175,169 | |||||||||||||
| 22,920 | Uniao de Bancos Brasileiros SA | 120,763 | |||||||||||||
| 5,020 | Unibanco-Uniao de Bancos Brasileiros SA GDR | 262,697 | |||||||||||||
| 28,325 | Usinas Siderurgicas de Minas Gerais SA | 291,612 | |||||||||||||
| Total Brazil | 7,383,416 | ||||||||||||||
See accompanying notes to the financial statements.
3
GMO Emerging Countries Fund
(A Series of GMO Trust)
Schedule of Investments — (Continued)
(showing percentage of total net assets)
February 28, 2009
| Shares | Description | Value ($) | |||||||||||||
| Chile — 1.0% | |||||||||||||||
| 1,912 | Banco de Chile ADR | 69,788 | |||||||||||||
| 6,110 | Banco Santander Chile SA ADR | 213,422 | |||||||||||||
| 4,080 | Compania Cervecerias Unidas ADR | 108,691 | |||||||||||||
| 3,560 | Embotelladora Andina SA ADR A Shares | 44,286 | |||||||||||||
| 5,830 | Embotelladora Andina SA ADR B Shares | 83,369 | |||||||||||||
| 4,000 | Empresa Nacional de Electricidad SA Sponsored ADR | 145,040 | |||||||||||||
| 16,850 | Enersis SA Sponsored ADR | 242,977 | |||||||||||||
| 30,330 | Lan Airlines SA Sponsored ADR | 250,223 | |||||||||||||
| Total Chile | 1,157,796 | ||||||||||||||
| China — 11.6% | |||||||||||||||
| 196,000 | Agile Property Holdings Ltd | 64,841 | |||||||||||||
| 3,810,000 | Bank of China Ltd Class H | 1,049,571 | |||||||||||||
| 602,400 | Chaoda Modern Agriculture Holdings Ltd | 344,239 | |||||||||||||
| 926,000 | China Construction Bank Class H | 464,167 | |||||||||||||
| 54,000 | China Huiyuan Juice Group Ltd | 62,357 | |||||||||||||
| 122,397 | China International Marine Containers Co Ltd Class B | 68,597 | |||||||||||||
| 174,000 | China Life Insurance Co Ltd Class H | 481,299 | |||||||||||||
| 208,500 | China Merchants Bank Co Ltd Class H | 302,510 | |||||||||||||
| 224,664 | China Mobile Ltd | 1,951,907 | |||||||||||||
| 3,872 | China Mobile Ltd Sponsored ADR | 167,851 | |||||||||||||
| 1,337,083 | China Petroleum & Chemical Corp Class H | 684,054 | |||||||||||||
| 182,000 | China Railway Construction Corp Ltd Class H * | 219,754 | |||||||||||||
| 488,000 | China Railway Group Ltd Class H * | 265,437 | |||||||||||||
| 44,000 | China Resources Power Holdings Co Ltd | 81,418 | |||||||||||||
| 142,000 | China Shipping Development Co Ltd Class H | 108,980 | |||||||||||||
| 704,000 | China Telecom Corp Ltd Class H | 236,193 | |||||||||||||
| 176,000 | CNOOC Ltd | 151,294 | |||||||||||||
| 194,000 | Cosco Pacific Ltd | 139,951 | |||||||||||||
| 506,000 | Datang International Power Generation Co Ltd | 209,923 | |||||||||||||
| 580,000 | Dongfeng Motor Group Co Ltd | 210,379 | |||||||||||||
| 823,000 | Huaneng Power International Inc Class H | 536,105 | |||||||||||||
| 1,188,000 | Industrial and Commercial Bank of China Ltd Class H | 478,478 | |||||||||||||
| 126,000 | Kingboard Chemical Holdings Ltd | 203,938 | |||||||||||||
See accompanying notes to the financial statements.
4
GMO Emerging Countries Fund
(A Series of GMO Trust)
Schedule of Investments — (Continued)
(showing percentage of total net assets)
February 28, 2009
| Shares | Description | Value ($) | |||||||||||||
| China — continued | |||||||||||||||
| 17,950 | Mindray Medical International Ltd ADR | 327,588 | |||||||||||||
| 10,580 | Netease.Com Inc ADR * | 216,678 | |||||||||||||
| 384,000 | Nine Dragons Paper Holdings Ltd | 102,922 | |||||||||||||
| 200,000 | Parkson Retail Group Ltd | 159,907 | |||||||||||||
| 1,605,553 | PetroChina Co Ltd Class H | 1,137,266 | |||||||||||||
| 128,000 | PICC Property & Casualty Co Ltd Class H * | 57,010 | |||||||||||||
| 28,000 | Ping An Insurance (Group) Co of China Ltd Class H | 132,097 | |||||||||||||
| 21,280 | Shanda Interactive Entertainment Ltd Sponsored ADR * | 698,410 | |||||||||||||
| 76,400 | Shanghai Industrial Holdings Ltd | 172,660 | |||||||||||||
| 416,000 | Shenzhen Investment Ltd | 65,308 | |||||||||||||
| 282,000 | Shimao Property Holdings Ltd | 143,915 | |||||||||||||
| 15,400 | Sina.com * | 330,638 | |||||||||||||
| 10,270 | Suntech Power Holdings Co Ltd ADR * | 62,544 | |||||||||||||
| 88,000 | Tencent Holdings Ltd | 502,739 | |||||||||||||
| 190,000 | Want Want China Holdings Ltd | 74,422 | |||||||||||||
| 168,000 | Yanzhou Coal Mining Co Ltd Class H | 94,928 | |||||||||||||
| 82,000 | Zhuzhou CSR Times Electric Co Ltd Class H | 74,038 | |||||||||||||
| Total China | 12,836,313 | ||||||||||||||
| Czech Republic — 0.7% | |||||||||||||||
| 4,900 | Central European Media Enterprises Ltd Class A * | 28,438 | |||||||||||||
| 16,860 | CEZ AS | 505,127 | |||||||||||||
| 9,300 | New World Resources NV Class A | 25,618 | |||||||||||||
| 1,245 | Pegas Nonwovens SA | 13,797 | |||||||||||||
| 116 | Philip Morris CR AS | 29,922 | |||||||||||||
| 3,800 | Telefonica 02 Czech Republic AS | 64,060 | |||||||||||||
| 13,320 | Unipetrol | 67,102 | |||||||||||||
| Total Czech Republic | 734,064 | ||||||||||||||
| Egypt — 1.1% | |||||||||||||||
| 9,612 | Alexandria Mineral Oils Co | 59,494 | |||||||||||||
| 35,620 | Commercial International Bank | 216,079 | |||||||||||||
| 5,367 | Egyptian Co for Mobile Services | 131,219 | |||||||||||||
| 430 | El Ezz Aldekhela Steel Alexa Co | 47,093 | |||||||||||||
See accompanying notes to the financial statements.
5
GMO Emerging Countries Fund
(A Series of GMO Trust)
Schedule of Investments — (Continued)
(showing percentage of total net assets)
February 28, 2009
| Shares | Description | Value ($) | |||||||||||||
| Egypt — continued | |||||||||||||||
| 37,000 | El Ezz Steel Rebars SAE | 45,457 | |||||||||||||
| 4,870 | ElSwedy Cables Holding Co * | 34,351 | |||||||||||||
| 5,200 | Orascom Construction Industries | 102,914 | |||||||||||||
| 31,620 | Orascom Telecom Holding SAE | 104,938 | |||||||||||||
| 5,800 | Oriental Weavers Co | 20,812 | |||||||||||||
| 19,800 | Palm Hills Developments SAE * | 22,349 | |||||||||||||
| 46,827 | Sidi Kerir Petrochemicals Co | 67,663 | |||||||||||||
| 182,300 | Talaat Moustafa Group * | 83,354 | |||||||||||||
| 107,254 | Telecom Egypt | 275,359 | |||||||||||||
| Total Egypt | 1,211,082 | ||||||||||||||
| Hungary — 0.7% | |||||||||||||||
| 380 | Egis Gyogyszergyar Nyrt | 15,825 | |||||||||||||
| 110,680 | Magyar Telekom Nyrt | 254,482 | |||||||||||||
| 2,960 | MOL Magyar Olaj es Gazipari Nyrt | 110,372 | |||||||||||||
| 37,870 | OTP Bank Nyrt * | 254,191 | |||||||||||||
| 900 | Richter Gedeon Nyrt | 92,943 | |||||||||||||
| Total Hungary | 727,813 | ||||||||||||||
| India — 2.3% | |||||||||||||||
| 50,570 | Canara Bank Ltd | 160,431 | |||||||||||||
| 4,400 | Hero Honda Motors Ltd | 79,143 | |||||||||||||
| 85,700 | Hindustan Unilever Ltd | 424,140 | |||||||||||||
| 55,100 | Indiabulls Financial Services Ltd | 101,849 | |||||||||||||
| 9,024 | Jindal Steel & Power Ltd | 180,406 | |||||||||||||
| 16,900 | Maruti Suzuki India Ltd | 220,561 | |||||||||||||
| 23,300 | Punjab National Bank Ltd | 151,878 | |||||||||||||
| 141,000 | Reliance Communications Ltd | 422,360 | |||||||||||||
| 24,600 | Reliance Energy Ltd | 232,088 | |||||||||||||
| 43,766 | Reliance Power Ltd * | 83,667 | |||||||||||||
| 11,400 | State Bank of India | 225,930 | |||||||||||||
| 190,430 | Steel Authority of India Ltd | 279,428 | |||||||||||||
| Total India | 2,561,881 | ||||||||||||||
See accompanying notes to the financial statements.
6
GMO Emerging Countries Fund
(A Series of GMO Trust)
Schedule of Investments — (Continued)
(showing percentage of total net assets)
February 28, 2009
| Shares | Description | Value ($) | |||||||||||||
| Indonesia — 0.8% | |||||||||||||||
| 260,000 | Aneka Tambang Tbk PT | 25,739 | |||||||||||||
| 2,907,751 | Bakrie & Brothers Tbk PT * | 12,038 | |||||||||||||
| 537,000 | Bank Central Asia Tbk PT | 104,092 | |||||||||||||
| 509,000 | Bank CIMB Niaga Tbk PT | 16,554 | |||||||||||||
| 335,500 | Bank Mandiri Tbk PT | 47,748 | |||||||||||||
| 634,000 | Bank Negara Indonesia (Persero) Tbk PT | 36,437 | |||||||||||||
| 3,978,500 | Bumi Resources Tbk PT | 245,131 | |||||||||||||
| 45,500 | Gudang Garam Tbk PT | 19,586 | |||||||||||||
| 879,500 | Indah Kiat Pulp and Paper Corp Tbk PT * | 65,736 | |||||||||||||
| 283,500 | Indofood Sukses Makmur Tbk PT | 20,490 | |||||||||||||
| 669,500 | Kalbe Farma Tbk PT | 35,740 | |||||||||||||
| 341,500 | Perusahaan Gas Negara PT | 53,526 | |||||||||||||
| 306,500 | Telekomunikasi Indonesia Tbk PT | 161,307 | |||||||||||||
| 52,500 | United Tractors Tbk PT | 23,088 | |||||||||||||
| Total Indonesia | 867,212 | ||||||||||||||
| Israel — 1.5% | |||||||||||||||
| 3,560 | Africa Israel Properties Ltd * | 31,763 | |||||||||||||
| 129,940 | Bank Hapoalim BM * | 222,193 | |||||||||||||
| 238,270 | Bank Leumi Le | 408,155 | |||||||||||||
| 29,430 | Bezeq Israeli Telecommunication Corp Ltd | 44,404 | |||||||||||||
| 3,790 | Check Point Software Technologies Ltd * | 83,266 | |||||||||||||
| 540 | Delek Group Ltd | 35,726 | |||||||||||||
| 3,663 | IDB Development Corp Ltd | 36,037 | |||||||||||||
| 65,160 | Israel Discount Bank Ltd | 42,279 | |||||||||||||
| 9,830 | Jerusalem Economy Ltd * | 34,584 | |||||||||||||
| 15,610 | Teva Pharmaceutical Industries Ltd Sponsored ADR | 695,894 | |||||||||||||
| Total Israel | 1,634,301 | ||||||||||||||
| Malaysia — 2.9% | |||||||||||||||
| 26,199 | British American Tobacco Malaysia Berhad | 315,854 | |||||||||||||
| 270,400 | Genting Berhad | 250,394 | |||||||||||||
| 45,600 | Hong Leong Financial Group Berhad | 56,121 | |||||||||||||
| 53,800 | Kulim Malaysia Berhad | 71,810 | |||||||||||||
See accompanying notes to the financial statements.
7
GMO Emerging Countries Fund
(A Series of GMO Trust)
Schedule of Investments — (Continued)
(showing percentage of total net assets)
February 28, 2009
| Shares | Description | Value ($) | |||||||||||||
| Malaysia — continued | |||||||||||||||
| 43,400 | MISC Berhad | 99,804 | |||||||||||||
| 257,300 | MISC Berhad (Foreign Registered) | 584,645 | |||||||||||||
| 53,309 | PPB Group Berhad | 138,582 | |||||||||||||
| 119,005 | Public Bank Berhad | 280,945 | |||||||||||||
| 415,378 | Resorts World Berhad | 245,955 | |||||||||||||
| 591,800 | RHB Capital Berhad | 592,870 | |||||||||||||
| 78,699 | Tanjong Plc | 293,535 | |||||||||||||
| 196,700 | Tenaga Nasional Berhad | 340,314 | |||||||||||||
| Total Malaysia | 3,270,829 | ||||||||||||||
| Mexico — 1.6% | |||||||||||||||
| 64,200 | Alfa SA de CV Class A | 89,787 | |||||||||||||
| 792,729 | Cemex SA de CV CPO * | 426,814 | |||||||||||||
| 22,400 | Desarrolladora Homex SA de CV * | 47,065 | |||||||||||||
| 11,640 | Fomento Economico Mexicano Sponsored ADR | 268,186 | |||||||||||||
| 604,916 | Grupo Mexico SA Class B | 345,156 | |||||||||||||
| 44,380 | Telefonos de Mexico SA de CV Class L Sponsored ADR | 609,781 | |||||||||||||
| Total Mexico | 1,786,789 | ||||||||||||||
| Morocco — 0.4% | |||||||||||||||
| 380 | Attijariwafa Bank | 11,522 | |||||||||||||
| 502 | Banque Centrale Populaire | 15,058 | |||||||||||||
| 1,044 | Banque Marocaine du Commerce Exterieur | 29,612 | |||||||||||||
| 119 | Compagnie Generale Immobiliere | 28,495 | |||||||||||||
| 16,519 | Maroc Telecom | 304,336 | |||||||||||||
| 220 | ONA SA | 34,496 | |||||||||||||
| 70 | Societe Nationale De Siderurgie | 21,938 | |||||||||||||
| Total Morocco | 445,457 | ||||||||||||||
| Peru — 0.0% | |||||||||||||||
| 7,022 | Compania Minera Milpo SA | 10,694 | |||||||||||||
| 378 | Sociedad Minera Cerro Verde SA | 3,859 | |||||||||||||
| 18,387 | Volcan Compania Minera SA Class B | 5,317 | |||||||||||||
| Total Peru | 19,870 | ||||||||||||||
See accompanying notes to the financial statements.
8
GMO Emerging Countries Fund
(A Series of GMO Trust)
Schedule of Investments — (Continued)
(showing percentage of total net assets)
February 28, 2009
| Shares | Description | Value ($) | |||||||||||||
| Philippines — 0.7% | |||||||||||||||
| 196,700 | Aboitiz Power Corp | 16,727 | |||||||||||||
| 634,500 | Alliance Global Group Inc * | 19,207 | |||||||||||||
| 22,212 | Ayala Corp | 86,264 | |||||||||||||
| 44 | Ayala Land Inc | 5 | |||||||||||||
| 148,300 | Bank of the Philippine Islands | 103,544 | |||||||||||||
| 1,016,800 | Benpres Holdings Corp * | 25,861 | |||||||||||||
| 196,800 | First Gen Corp * | 61,460 | |||||||||||||
| 1,300 | Globe Telecom Inc | 20,668 | |||||||||||||
| 16,200 | Manila Electric Co | 29,489 | |||||||||||||
| 59,100 | Metropolitan Bank & Trust Co | 24,783 | |||||||||||||
| 8,280 | Philippine Long Distance Telephone Co | 364,402 | |||||||||||||
| 827,200 | PNOC Energy Development Corp | 41,558 | |||||||||||||
| 101,300 | SM Prime Holdings Inc | 14,964 | |||||||||||||
| 1,262,600 | Vista Land & Lifescapes Inc | 21,153 | |||||||||||||
| Total Philippines | 830,085 | ||||||||||||||
| Poland — 1.2% | |||||||||||||||
| 6,100 | Bank Handlowy W Warszawie SA | 56,440 | |||||||||||||
| 17,620 | KGHM Polska Miedz SA | 163,137 | |||||||||||||
| 60,500 | Polski Koncern Naftowy Orlen SA | 339,459 | |||||||||||||
| 38,140 | Polskie Gornictwo Naftowe I Gazownictwo SA | 35,770 | |||||||||||||
| 42,950 | Powszechna Kasa Oszczednosci Bank Polski SA | 223,817 | |||||||||||||
| 95,360 | Telekomunikacja Polska SA | 459,727 | |||||||||||||
| Total Poland | 1,278,350 | ||||||||||||||
| Russia — 3.2% | |||||||||||||||
| 39,320 | Aeroflot - Russian Airlines | 29,115 | |||||||||||||
| 76,370 | Cherepovets MK Severstal GDR (Registered Shares) | 277,223 | |||||||||||||
| 66,940 | KamAZ * | 31,726 | |||||||||||||
| 6,080 | Lukoil Sponsored ADR | 194,803 | |||||||||||||
| 9,630 | Mobile Telesystems Sponsored ADR | 228,135 | |||||||||||||
| 124,144 | OAO Gazprom Sponsored GDR | 1,612,631 | |||||||||||||
| 2,550 | OAO Tatneft Sponsored GDR (Registered Shares) | 90,780 | |||||||||||||
| 3,150 | Rostelecom Sponsored ADR | 151,578 | |||||||||||||
See accompanying notes to the financial statements.
9
GMO Emerging Countries Fund
(A Series of GMO Trust)
Schedule of Investments — (Continued)
(showing percentage of total net assets)
February 28, 2009
| Shares | Description | Value ($) | |||||||||||||
| Russia — continued | |||||||||||||||
| 531,050 | Sberbank RF | 208,065 | |||||||||||||
| 109,700 | Surgutneftegaz Sponsored ADR | 627,484 | |||||||||||||
| 70,500 | VTB Bank GDR | 75,435 | |||||||||||||
| Total Russia | 3,526,975 | ||||||||||||||
| South Africa — 7.3% | |||||||||||||||
| 39,852 | Absa Group Ltd | 348,947 | |||||||||||||
| 17,545 | Adcock Ingram Holdings Ltd * | 66,032 | |||||||||||||
| 8,100 | AngloGold Ashanti Ltd | 239,666 | |||||||||||||
| 30,567 | ArcelorMittal South Africa Ltd | 222,667 | |||||||||||||
| 72,667 | Aveng Ltd | 184,017 | |||||||||||||
| 31,179 | Bidvest Group Ltd | 255,167 | |||||||||||||
| 9,261 | British American Tobacco Plc * | 233,931 | |||||||||||||
| 331,300 | FirstRand Ltd | 392,904 | |||||||||||||
| 59,900 | Foschini Ltd | 244,780 | |||||||||||||
| 19,700 | Gold Fields Ltd | 202,074 | |||||||||||||
| 45,300 | Grindrod Ltd | 58,638 | |||||||||||||
| 42,300 | Harmony Gold Mining Co Ltd * | 510,373 | |||||||||||||
| 7,300 | Highveld Steel and Vanadium Corp Ltd | 50,889 | |||||||||||||
| 45,300 | Imperial Holdings Ltd | 198,024 | |||||||||||||
| 46,000 | Investec Ltd | 136,446 | |||||||||||||
| 44,600 | JD Group Ltd | 129,468 | |||||||||||||
| 38,900 | Massmart Holdings Ltd | 278,027 | |||||||||||||
| 38,700 | MTN Group Ltd | 327,736 | |||||||||||||
| 21,800 | Naspers Ltd Class N | 330,658 | |||||||||||||
| 12,500 | Nedbank Group Ltd | 92,513 | |||||||||||||
| 14,528 | Reinet Investments SCA * | 13,227 | |||||||||||||
| 87,507 | Remgro Ltd | 573,014 | |||||||||||||
| 29,700 | Reunert Ltd | 109,236 | |||||||||||||
| 131,600 | RMB Holdings Ltd | 249,078 | |||||||||||||
| 251,300 | Sanlam Ltd | 377,875 | |||||||||||||
| 19,600 | Sasol Ltd | 488,806 | |||||||||||||
| 72,068 | Standard Bank Group Ltd | 461,114 | |||||||||||||
| 264,000 | Steinhoff International Holdings Ltd | 292,169 | |||||||||||||
See accompanying notes to the financial statements.
10
GMO Emerging Countries Fund
(A Series of GMO Trust)
Schedule of Investments — (Continued)
(showing percentage of total net assets)
February 28, 2009
| Shares | Description | Value ($) | |||||||||||||
| South Africa — continued | |||||||||||||||
| 46,900 | Telkom South Africa Ltd | 458,515 | |||||||||||||
| 25,524 | Tiger Brands Ltd | 318,456 | |||||||||||||
| 94,000 | Truworths International Ltd | 288,580 | |||||||||||||
| Total South Africa | 8,133,027 | ||||||||||||||
| South Korea — 17.2% | |||||||||||||||
| 210 | Amorepacific Corp | 74,844 | |||||||||||||
| 57,039 | Busan Bank | 189,057 | |||||||||||||
| 3,110 | CJ Corp | 65,919 | |||||||||||||
| 40,140 | Daegu Bank | 150,194 | |||||||||||||
| 9,146 | Daelim Industrial Co Ltd | 235,646 | |||||||||||||
| 2,070 | DC Chemical Co Ltd | 284,518 | |||||||||||||
| 6,350 | Dongbu Insurance Co Ltd | 58,385 | |||||||||||||
| 8,610 | Dongkuk Steel Mill Co Ltd | 117,736 | |||||||||||||
| 6,610 | GS Engineering & Construction Corp | 200,061 | |||||||||||||
| 5,920 | GS Holdings Corp | 96,768 | |||||||||||||
| 37,270 | Hana Financial Group Inc | 441,061 | |||||||||||||
| 4,330 | Hanjin Heavy Industries & Construction Co Ltd | 68,563 | |||||||||||||
| 7,841 | Hanjin Heavy Industries & Construction Holdings Co Ltd | 62,472 | |||||||||||||
| 16,200 | Hanjin Shipping | 159,285 | |||||||||||||
| 14,100 | Hankook Tire Co Ltd | 114,511 | |||||||||||||
| 5,158 | Honam Petrochemical Corp * | 155,120 | |||||||||||||
| 1,860 | Hyundai Elevator Co Ltd | 64,988 | |||||||||||||
| 2,570 | Hyundai Heavy Industries Co Ltd | 291,308 | |||||||||||||
| 5,945 | Hyundai Mipo Dockyard | 452,397 | |||||||||||||
| 24,390 | Hyundai Mobis | 1,171,218 | |||||||||||||
| 26,340 | Hyundai Motor Co | 824,498 | |||||||||||||
| 8,840 | Hyundai Steel Co | 195,022 | |||||||||||||
| 13,222 | Hyunjin Materials Co Ltd * | 226,052 | |||||||||||||
| 55,440 | Industrial Bank of Korea * | 210,648 | |||||||||||||
| 5,890 | INTOPS Co Ltd | 56,240 | |||||||||||||
| 61,690 | KB Financial Group Inc * | 1,182,749 | |||||||||||||
| 800 | KB Financial Group Inc ADR * | 15,056 | |||||||||||||
| 2,094 | Keangnam Enterprises Ltd * | 6,869 | |||||||||||||
See accompanying notes to the financial statements.
11
GMO Emerging Countries Fund
(A Series of GMO Trust)
Schedule of Investments — (Continued)
(showing percentage of total net assets)
February 28, 2009
| Shares | Description | Value ($) | |||||||||||||
| South Korea — continued | |||||||||||||||
| 34,840 | Kia Motors Corp * | 149,978 | |||||||||||||
| 35,150 | Korea Electric Power Corp * | 544,309 | |||||||||||||
| 59,690 | Korea Exchange Bank | 208,668 | |||||||||||||
| 6,430 | Korea Kumho Petrochemical Co Ltd * | 69,635 | |||||||||||||
| 2,760 | Korea Line Corp | 94,738 | |||||||||||||
| 5,700 | Korea Zinc Co Ltd | 327,421 | |||||||||||||
| 4,210 | Korean Air Lines Co Ltd * | 83,038 | |||||||||||||
| 7,500 | KT Corp | 182,268 | |||||||||||||
| 20,330 | KT Corp Sponsored ADR * | 244,367 | |||||||||||||
| 20,663 | KT&G Corp | 1,059,284 | |||||||||||||
| 8,470 | Kumho Industrial Co Ltd * | 63,296 | |||||||||||||
| 5,050 | LG Chem Ltd | 274,004 | |||||||||||||
| 14,820 | LG Corp | 387,512 | |||||||||||||
| 10,760 | LG Dacom Corp | 121,480 | |||||||||||||
| 16,510 | LG Display Co Ltd | 274,179 | |||||||||||||
| 15,620 | LG International Corp | 156,892 | |||||||||||||
| 37,740 | LG Telecom Ltd | 217,016 | |||||||||||||
| 1,380 | Lotte Shopping Co Ltd | 146,263 | |||||||||||||
| 2,238 | NCSoft Corp | 101,508 | |||||||||||||
| 5,720 | POSCO | 1,154,683 | |||||||||||||
| 8,340 | S-Oil Corp | 283,422 | |||||||||||||
| 29,710 | Samho International Co Ltd * | 48,201 | |||||||||||||
| 5,348 | Samsung Electronics Co Ltd | 1,644,874 | |||||||||||||
| 5,880 | Samsung Fire & Marine Insurance Co Ltd | 596,604 | |||||||||||||
| 2,636 | Samsung SDI Co Ltd | 97,683 | |||||||||||||
| 3,330 | Samsung Securities Co Ltd | 112,634 | |||||||||||||
| 5,560 | Seoul Semiconductor Co Ltd * | 80,923 | |||||||||||||
| 40,485 | Shinhan Financial Group Co Ltd * | 594,953 | |||||||||||||
| 6,145 | SK Energy Co Ltd | 285,364 | |||||||||||||
| 17,677 | SK Holdings Co Ltd | 971,314 | |||||||||||||
| 39,060 | SK Networks Co Ltd | 182,620 | |||||||||||||
| 1,146 | SK Telecom Co Ltd | 139,298 | |||||||||||||
| 43,530 | SK Telecom Co Ltd ADR | 582,867 | |||||||||||||
| 5,720 | STX Engine Co Ltd * | 55,819 | |||||||||||||
See accompanying notes to the financial statements.
12
GMO Emerging Countries Fund
(A Series of GMO Trust)
Schedule of Investments — (Continued)
(showing percentage of total net assets)
February 28, 2009
| Shares | Description | Value ($) | |||||||||||||
| South Korea — continued | |||||||||||||||
| 22,640 | Sungwoo Hitech Co Ltd | 49,183 | |||||||||||||
| 50,481 | Woori Finance Holdings Co Ltd * | 202,096 | |||||||||||||
| 9,640 | Woori Investment & Securities Co Ltd | 84,137 | |||||||||||||
| Total South Korea | 19,043,716 | ||||||||||||||
| Taiwan — 13.2% | |||||||||||||||
| 263,000 | Acer Inc | 344,360 | |||||||||||||
| 176,000 | Asia Cement Corp | 129,938 | |||||||||||||
| 66,000 | Asia Optical Co Inc | 70,109 | |||||||||||||
| 263,733 | Asustek Computer Inc | 249,022 | |||||||||||||
| 173,500 | Catcher Technology Co Ltd | 289,630 | |||||||||||||
| 530,339 | China Development Financial Holding Corp | 89,238 | |||||||||||||
| 937,000 | Chinatrust Financial Holding Co Ltd | 280,294 | |||||||||||||
| 658,755 | Chunghwa Telecom Co Ltd | 1,014,194 | |||||||||||||
| 647,557 | Compal Electronics Inc | 368,749 | |||||||||||||
| 96,000 | Delta Electronics Inc | 151,174 | |||||||||||||
| 42,260 | Dynapack International Technology Corp | 87,392 | |||||||||||||
| 135,000 | Far Eastone Telecommunications Co Ltd | 130,407 | |||||||||||||
| 667,983 | First Financial Holding Co Ltd | 264,596 | |||||||||||||
| 206,000 | Formosa Plastics Corp | 278,808 | |||||||||||||
| 91,000 | Foxconn Technology Co Ltd | 207,618 | |||||||||||||
| 603,000 | Fubon Financial Holding Co Ltd | 320,288 | |||||||||||||
| 90,940 | High Tech Computer Corp | 986,251 | |||||||||||||
| 477,990 | Hon Hai Precision Industry Co Ltd | 938,937 | |||||||||||||
| 344,000 | Hung Sheng Construction Co Ltd | 61,746 | |||||||||||||
| 305,000 | Inventec Co Ltd | 89,285 | |||||||||||||
| 570,845 | Lite-On Technology Corp | 333,179 | |||||||||||||
| 464,000 | Macronix International Co Ltd | 148,068 | |||||||||||||
| 136,097 | MediaTek Inc | 1,167,408 | |||||||||||||
| 48,970 | Motech Industries Inc | 107,955 | |||||||||||||
| 330,417 | Nan Ya Plastics Corp | 311,605 | |||||||||||||
| 159,198 | Novatek Microelectronics Corp Ltd | 192,271 | |||||||||||||
| 610,000 | Pou Chen Corp | 260,233 | |||||||||||||
| 80,000 | Powertech Technology Inc | 121,683 | |||||||||||||
See accompanying notes to the financial statements.
13
GMO Emerging Countries Fund
(A Series of GMO Trust)
Schedule of Investments — (Continued)
(showing percentage of total net assets)
February 28, 2009
| Shares | Description | Value ($) | |||||||||||||
| Taiwan — continued | |||||||||||||||
| 608,000 | Prince Housing Development Corp | 77,629 | |||||||||||||
| 2,050,000 | ProMOS Technologies Inc * | 69,250 | |||||||||||||
| 658,431 | Quanta Computer Inc | 664,804 | |||||||||||||
| 107,000 | Radiant Opto-Electronics Corp | 80,412 | |||||||||||||
| 220,000 | Synnex Technology International Corp | 249,622 | |||||||||||||
| 759,000 | Taishin Financial Holding Co Ltd | 105,675 | |||||||||||||
| 586,213 | Taiwan Cement Corp | 433,927 | |||||||||||||
| 239,950 | Taiwan Cooperative Bank | 98,749 | |||||||||||||
| 144,000 | Taiwan Fertilizer Co Ltd | 216,244 | |||||||||||||
| 279,787 | Taiwan Mobile Co Ltd | 363,559 | |||||||||||||
| 1,940,330 | Taiwan Semiconductor Manufacturing Co Ltd | 2,450,915 | |||||||||||||
| 42,000 | Transcend Information Inc | 83,723 | |||||||||||||
| 49,000 | U-Ming Marine Transport Corp | 62,041 | |||||||||||||
| 224,000 | Wistron Corp | 169,195 | |||||||||||||
| 1,362,000 | Yuanta Financial Holding Co Ltd | 489,769 | |||||||||||||
| Total Taiwan | 14,609,952 | ||||||||||||||
| Thailand — 4.8% | |||||||||||||||
| 393,690 | Advanced Info Service Pcl (Foreign Registered) (a) | 870,481 | |||||||||||||
| 168,250 | Bangkok Bank Pcl NVDR (a) | 342,507 | |||||||||||||
| 340,300 | Bangkok Dusit Medical Service Pcl (Foreign Registered) (a) | 159,943 | |||||||||||||
| 631,570 | Bank of Ayudhya Pcl (Foreign Registered) (a) | 155,511 | |||||||||||||
| 180,000 | Bank of Ayudhya Pcl NVDR (a) | 43,587 | |||||||||||||
| 41,000 | Banpu Pcl (Foreign Registered) (a) | 236,816 | |||||||||||||
| 937,640 | BEC World Pcl (Foreign Registered) (a) | 497,091 | |||||||||||||
| 34,000 | Electricity Generating Pcl NVDR (a) | 66,356 | |||||||||||||
| 3,092,950 | IRPC Pcl (Foreign Registered) (a) | 158,405 | |||||||||||||
| 1,808,670 | Italian Thai Development Pcl (Foreign Registered) (a) | 114,315 | |||||||||||||
| 273,010 | Kasikornbank Pcl (Foreign Registered) (a) | 332,682 | |||||||||||||
| 39,000 | Kasikornbank Pcl NVDR (a) | 47,524 | |||||||||||||
| 1,289,000 | Krung Thai Bank Pcl (Foreign Registered) (a) | 146,335 | |||||||||||||
| 68,200 | PTT Exploration & Production Pcl (Foreign Registered) (a) | 165,641 | |||||||||||||
| 219,722 | PTT Pcl (Foreign Registered) (a) | 937,479 | |||||||||||||
| 49,859 | Siam Cement Pcl (Foreign Registered) (a) | 137,551 | |||||||||||||
See accompanying notes to the financial statements.
14
GMO Emerging Countries Fund
(A Series of GMO Trust)
Schedule of Investments — (Continued)
(showing percentage of total net assets)
February 28, 2009
| Shares | Description | Value ($) | |||||||||||||
| Thailand — continued | |||||||||||||||
| 37,180 | Siam Cement Pcl NVDR (a) | 102,059 | |||||||||||||
| 655,000 | Siam City Bank PCL (Foreign Registered) * (a) | 134,214 | |||||||||||||
| 338,000 | Siam Commercial Bank Pcl (Foreign Registered) (a) | 517,051 | |||||||||||||
| 285,770 | Thai Oil Pcl (Foreign Registered) (a) | 187,200 | |||||||||||||
| Total Thailand | 5,352,748 | ||||||||||||||
| Turkey — 5.3% | |||||||||||||||
| 186,338 | Akbank TAS | 429,517 | |||||||||||||
| 20,240 | Anadolu Efes Biracilik ve Malt Sanayii AS | 127,857 | |||||||||||||
| 569,970 | Dogan Sirketler Grubu Holdings AS * | 171,987 | |||||||||||||
| 26,516 | Enka Insaat ve Sanayi AS | 96,335 | |||||||||||||
| 118,330 | Eregli Demir ve Celik Fabrikalari TAS | 238,915 | |||||||||||||
| 151,470 | Haci Omer Sabanci Holding AS | 219,779 | |||||||||||||
| 256,242 | KOC Holding AS * | 320,314 | |||||||||||||
| 114,000 | Sekerbank TAS | 59,035 | |||||||||||||
| 47,500 | Tekfen Holding AS | 73,377 | |||||||||||||
| 40,384 | Tupras-Turkiye Petrol Rafineriler AS | 366,283 | |||||||||||||
| 67,730 | Turk Hava Yollari Anonim Ortakligi * | 222,978 | |||||||||||||
| 159,100 | Turk Sise ve Cam Fabrikalari AS * | 89,063 | |||||||||||||
| 139,180 | Turk Telekomunikasyon AS * | 318,458 | |||||||||||||
| 243,987 | Turkcell Iletisim Hizmet AS | 1,208,210 | |||||||||||||
| 656,290 | Turkiye Garanti Bankasi * | 800,241 | |||||||||||||
| 60,160 | Turkiye Halk Bankasi AS | 126,597 | |||||||||||||
| 217,520 | Turkiye IS Bankasi Class C | 421,311 | |||||||||||||
| 245,375 | Turkiye Sinai Kalkinma Bankasi AS * | 96,773 | |||||||||||||
| 297,970 | Turkiye Vakiflar Bankasi TAO Class D | 190,216 | |||||||||||||
| 144,900 | Vestel Elektronik Sanayi * | 67,852 | |||||||||||||
| 225,300 | Yapi ve Kredi Bankasi AS * | 219,442 | |||||||||||||
| Total Turkey | 5,864,540 | ||||||||||||||
| TOTAL COMMON STOCKS (COST $144,498,873) | 93,424,342 | ||||||||||||||
See accompanying notes to the financial statements.
15
GMO Emerging Countries Fund
(A Series of GMO Trust)
Schedule of Investments — (Continued)
(showing percentage of total net assets)
February 28, 2009
| Shares | Description | Value ($) | |||||||||||||
| PREFERRED STOCKS — 12.3% | |||||||||||||||
| Brazil — 11.9% | |||||||||||||||
| 127,700 | Aracruz SA Class B (Registered) 11.82% | 91,314 | |||||||||||||
| 113,012 | Banco Bradesco SA 0.84% | 978,234 | |||||||||||||
| 132,125 | Banco Itau Holding Financeira SA 0.65% | 1,226,551 | |||||||||||||
| 24,700 | Bradespar SA 1.89% | 231,362 | |||||||||||||
| 25,300 | Brasil Telecom Participacoes SA 6.99% | 158,694 | |||||||||||||
| 14,300 | Brasil Telecom SA 6.36% | 69,903 | |||||||||||||
| 14,500 | Companhia Brasileira de Distribuicao Grupo Pao de Acucar 0.79% | 174,565 | |||||||||||||
| 12,200 | Companhia de Bebidas das Americas 4.31% | 489,194 | |||||||||||||
| 3,900 | Companhia de Transmissao de Energia Eletrica Paulista 1.82% | 73,877 | |||||||||||||
| 68,793 | Companhia Energetica de Minas Gerais 2.63% | 956,497 | |||||||||||||
| 42,200 | Companhia Paranaense de Energia Class B 1.17% | 393,519 | |||||||||||||
| 146,156 | Companhia Vale do Rio Doce Class A 4.07% | 1,639,778 | |||||||||||||
| 14,100 | Duratex SA 2.64% | 90,152 | |||||||||||||
| 22,500 | Electrobras (Centro) SA Class B 6.65% | 228,161 | |||||||||||||
| 21,600 | Eletropaulo Metropolitana SA 7.61% | 264,558 | |||||||||||||
| 66,800 | Gerdau Metalurgica SA 2.46% | 466,209 | |||||||||||||
| 100,708 | Gerdau SA 1.29% | 533,145 | |||||||||||||
| 263,027 | Itausa-Investimentos Itau SA 0.81% | 777,620 | |||||||||||||
| 23,900 | Net Servicos de Comunicacoa SA * | 151,411 | |||||||||||||
| 183,424 | Petroleo Brasileiro SA (Petrobras) 0.10% | 2,024,920 | |||||||||||||
| 28,300 | Petroleo Brasileiro SA Sponsored ADR 0.10% | 633,354 | |||||||||||||
| 115,900 | Sadia SA 1.33% | 138,611 | |||||||||||||
| 12,230 | Tele Norte Leste Participacoes ADR 1.03% | 148,228 | |||||||||||||
| 31,600 | Tele Norte Leste Participacoes SA 0.71% | 391,796 | |||||||||||||
| 9,400 | Telecomunicacoes de Sao Paulo SA 10.06% | 173,700 | |||||||||||||
| 5,700 | Telemar Norte Leste SA Class A 3.13% | 111,240 | |||||||||||||
| 53,400 | Usinas Siderrurgicas de Minas Gerais SA Class A 1.93% | 579,017 | |||||||||||||
| Total Brazil | 13,195,610 | ||||||||||||||
| Russia — 0.1% | |||||||||||||||
| 500 | Transneft 3.44% | 95,607 | |||||||||||||
See accompanying notes to the financial statements.
16
GMO Emerging Countries Fund
(A Series of GMO Trust)
Schedule of Investments — (Continued)
(showing percentage of total net assets)
February 28, 2009
| Shares / Par Value ($) | Description | Value ($) | |||||||||||||
| South Korea — 0.3% | |||||||||||||||
| 8,770 | Hyundai Motor Co 5.64% | 100,565 | |||||||||||||
| 1,492 | Samsung Electronics Co Ltd (Non Voting) 3.79% | 264,258 | |||||||||||||
| Total South Korea | 364,823 | ||||||||||||||
| TOTAL PREFERRED STOCKS (COST $19,463,294) | 13,656,040 | ||||||||||||||
| INVESTMENT FUNDS — 0.1% | |||||||||||||||
| United States — 0.1% | |||||||||||||||
| 8,205 | iShares MSCI Emerging Markets Index Fund (b) | 174,192 | |||||||||||||
| TOTAL INVESTMENT FUNDS (COST $203,131) | 174,192 | ||||||||||||||
| RIGHTS AND WARRANTS — 0.0% | |||||||||||||||
| Brazil — 0.0% | |||||||||||||||
| 205 | Net Servicos de Comunicacao SA Rights, Expires 12/31/49 * | 119 | |||||||||||||
| South Korea — 0.0% | |||||||||||||||
| 5,880 | Shinhan Financial Group Co Ltd Rights, Expires 03/19/09 * | 12,270 | |||||||||||||
| TOTAL RIGHTS AND WARRANTS (COST $31,068) | 12,389 | ||||||||||||||
| SHORT-TERM INVESTMENTS — 1.9% | |||||||||||||||
| 59,894 | Banco Santander Time Deposit, 0.02%, due 03/02/09 | 59,894 | |||||||||||||
| 15,809 | Brown Brothers Harriman Time Deposit, 0.08%-9.25%, due 03/02/09 | 15,809 | |||||||||||||
| 2,000,000 | Royal Bank of Canada Time Deposit, 0.20%, due 03/02/09 | 2,000,000 | |||||||||||||
| TOTAL SHORT-TERM INVESTMENTS (COST $2,075,703) | 2,075,703 | ||||||||||||||
| TOTAL INVESTMENTS — 98.6% (Cost $166,272,069) | 109,342,666 | ||||||||||||||
| Other Assets and Liabilities (net) — 1.4% | 1,507,516 | ||||||||||||||
| TOTAL NET ASSETS — 100.0% | $ | 110,850,182 | |||||||||||||
See accompanying notes to the financial statements.
17
GMO Emerging Countries Fund
(A Series of GMO Trust)
Schedule of Investments — (Continued)
February 28, 2009
A summary of outstanding financial instruments at February 28, 2009 is as follows:
Forward Currency Contracts
| Settlement Date | Deliver/Receive | Units of Currency | Value | Net Unrealized Appreciation (Depreciation) | |||||||||||||||
| Buys | |||||||||||||||||||
| 4/29/09 | HUF | 25,668,900 | $ | 107,329 | $ | 329 | |||||||||||||
| Sales | |||||||||||||||||||
| 4/29/09 | HUF | 194,979,400 | $ | 815,262 | $ | 31,738 | |||||||||||||
Notes to Schedule of Investments:
ADR - American Depositary Receipt
CPO - Ordinary Participation Certificate (Certificado de Participacion Ordinares), representing a bundle of shares of the multiple series of one issuer that trade together as a unit.
Foreign Registered - Shares issued to foreign investors in markets that have foreign ownership limits.
GDR - Global Depository Receipt
MTN - Medium Term Note
NVDR - Non-Voting Depository Receipt
* Non-income producing security.
(a) Security valued at fair value using methods determined in good faith by or at the direction of the Trustees of GMO Trust (Note 2).
(b) Represents an investment to equitize cash in the iShares® MSCI Emerging Markets Index Fund, which is a separate investment portfolio of iShares, Inc., a registered investment company. The iShares® MSCI Emerging Markets Index Fund invests in global emerging markets and seeks investment results that correspond generally to the price and yield performance, before fees and expenses, of the MSCI Emerging Markets Index. iShares® is a registered trademark of Barclays Global Investors, N.A. ("BGI"). Neither BGI nor the iShares® Funds make any representations regarding the advisability of investing in the iShares® MSCI Emerging Markets Index Fund.
Currency Abbreviations:
HUF - Hungarian Forint
See accompanying notes to the financial statements.
18
GMO Emerging Countries Fund
(A Series of GMO Trust)
Statement of Assets and Liabilities — February 28, 2009
| Assets: | |||||||
| Investments, at value (cost $166,272,069) (Note 2) | $ | 109,342,666 | |||||
| Cash | 1,550,649 | ||||||
| Foreign currency, at value (cost $271,083) (Note 2) | 267,814 | ||||||
| Receivable for investments sold | 2,909,320 | ||||||
| Receivable for Fund shares sold | 38,529 | ||||||
| Dividends and interest receivable | 507,306 | ||||||
| Foreign taxes receivable | 228,138 | ||||||
| Unrealized appreciation on open forward currency contracts (Note 2) | 32,067 | ||||||
| Receivable for expenses reimbursed by Manager (Note 3) | 34,385 | ||||||
| Miscellaneous receivable | 179,611 | ||||||
| Total assets | 115,090,485 | ||||||
| Liabilities: | |||||||
| Payable for investments purchased | 3,515,768 | ||||||
| Payable for Fund shares repurchased | 61,085 | ||||||
| Payable to affiliate for (Note 3): | |||||||
| Management fee | 59,929 | ||||||
| Shareholder service fee | 11,091 | ||||||
| Administration fee – Class M | 3,653 | ||||||
| Trustees and Chief Compliance Officer of GMO Trust fees | 350 | ||||||
| Payable for 12b-1 fee – Class M | 9,128 | ||||||
| Miscellaneous payable | 123,164 | ||||||
| Accrued expenses | 456,135 | ||||||
| Total liabilities | 4,240,303 | ||||||
| Net assets | $ | 110,850,182 | |||||
See accompanying notes to the financial statements.
19
GMO Emerging Countries Fund
(A Series of GMO Trust)
Statement of Assets and Liabilities — February 28, 2009 — (Continued)
| Net assets consist of: | |||||||
| Paid-in capital | $ | 252,654,640 | |||||
| Distributions in excess of net investment income | (49,506 | ) | |||||
| Distributions in excess of net realized gain | (84,781,410 | ) | |||||
| Net unrealized depreciation | (56,973,542 | ) | |||||
| $ | 110,850,182 | ||||||
| Net assets attributable to: | |||||||
| Class III shares | $ | 89,902,027 | |||||
| Class M shares | $ | 20,948,155 | |||||
| Shares outstanding: | |||||||
| Class III | 17,756,717 | ||||||
| Class M | 4,189,761 | ||||||
| Net asset value per share: | |||||||
| Class III | $ | 5.06 | |||||
| Class M | $ | 5.00 | |||||
See accompanying notes to the financial statements.
20
GMO Emerging Countries Fund
(A Series of GMO Trust)
Statement of Operations — Year Ended February 28, 2009
| Investment Income: | |||||||
| Dividends (net of withholding taxes of $1,187,351) | $ | 8,712,502 | |||||
| Interest | 139,469 | ||||||
| Securities lending income | 14,832 | ||||||
| Total investment income | 8,866,803 | ||||||
| Expenses: | |||||||
| Management fee (Note 3) | 1,702,677 | ||||||
| Shareholder service fee – Class III (Note 3) | 350,077 | ||||||
| 12b-1 fee – Class M (Note 3) | 71,415 | ||||||
| Administration fee – Class M (Note 3) | 57,132 | ||||||
| Custodian and fund accounting agent fees | 1,105,543 | ||||||
| Transfer agent fees | 51,252 | ||||||
| Audit and tax fees | 124,552 | ||||||
| Legal fees | 36,928 | ||||||
| Trustees fees and related expenses (Note 3) | 4,801 | ||||||
| Registration fees | 28,365 | ||||||
| Miscellaneous | 10,224 | ||||||
| Total expenses | 3,542,966 | ||||||
| Fees and expenses reimbursed by Manager (Note 3) | (399,673 | ) | |||||
| Expense reductions (Note 2) | (5,865 | ) | |||||
| Net expenses | 3,137,428 | ||||||
| Net investment income (loss) | 5,729,375 | ||||||
| Realized and unrealized gain (loss): | |||||||
| Net realized gain (loss) on: | |||||||
| Investments (net of foreign capital gains tax of $14,592) (Note 2) | (78,022,210 | ) | |||||
| Foreign currency, forward contracts and foreign currency related transactions (net of CPMF tax of $554) (Note 2) | (1,133,517 | ) | |||||
| Net realized gain (loss) | (79,155,727 | ) | |||||
| Change in net unrealized appreciation (depreciation) on: | |||||||
| Investments (net of change in foreign capital gains tax accrual of $(17,159)) (Note 2) | (130,134,573 | ) | |||||
| Foreign currency, forward contracts and foreign currency related transactions | (74,637 | ) | |||||
| Net unrealized gain (loss) | (130,209,210 | ) | |||||
| Net realized and unrealized gain (loss) | (209,364,937 | ) | |||||
| Net increase (decrease) in net assets resulting from operations | $ | (203,635,562 | ) | ||||
See accompanying notes to the financial statements.
21
GMO Emerging Countries Fund
(A Series of GMO Trust)
Statement of Changes in Net Assets
| Year Ended February 28, 2009 | Year Ended February 29, 2008 | ||||||||||
| Increase (decrease) in net assets: | |||||||||||
| Operations: | |||||||||||
| Net investment income (loss) | $ | 5,729,375 | $ | 5,408,824 | |||||||
| Net realized gain (loss) | (79,155,727 | ) | 118,746,655 | ||||||||
| Change in net unrealized appreciation (depreciation) | (130,209,210 | ) | (14,494,242 | ) | |||||||
| Net increase (decrease) in net assets from operations | (203,635,562 | ) | 109,661,237 | ||||||||
| Distributions to shareholders from: | |||||||||||
| Net investment income | |||||||||||
| Class III | (3,618,944 | ) | (6,266,144 | ) | |||||||
| Class M | (355,007 | ) | (465,425 | ) | |||||||
| Total distributions from net investment income | (3,973,951 | ) | (6,731,569 | ) | |||||||
| Net realized gains | |||||||||||
| Class III | (45,733,749 | ) | (113,812,595 | ) | |||||||
| Class M | (3,890,739 | ) | (10,207,292 | ) | |||||||
| Total distributions from net realized gains | (49,624,488 | ) | (124,019,887 | ) | |||||||
| (53,598,439 | ) | (130,751,456 | ) | ||||||||
| Net share transactions (Note 7): | |||||||||||
| Class III | (62,229,331 | ) | 51,505,212 | ||||||||
| Class M | 27,387,567 | 3,819,194 | |||||||||
| Increase (decrease) in net assets resulting from net share transactions | (34,841,764 | ) | 55,324,406 | ||||||||
| Total increase (decrease) in net assets | (292,075,765 | ) | 34,234,187 | ||||||||
| Net assets: | |||||||||||
| Beginning of period | 402,925,947 | 368,691,760 | |||||||||
| End of period (including distributions in excess of net investment income of $49,506 and $1,034,768, respectively) | $ | 110,850,182 | $ | 402,925,947 | |||||||
See accompanying notes to the financial statements.
22
GMO Emerging Countries Fund
(A Series of GMO Trust)
Financial Highlights
(For a Class III share outstanding throughout each period)
| Year Ended February 28/29, | |||||||||||||||||||||||
| 2009 | 2008 | 2007 | 2006 | 2005 | |||||||||||||||||||
| Net asset value, beginning of period | $ | 15.26 | $ | 16.04 | $ | 19.20 | $ | 15.99 | $ | 14.99 | |||||||||||||
| Income (loss) from investment operations: | |||||||||||||||||||||||
| Net investment income (loss)† | 0.24 | 0.23 | 0.32 | 0.28 | 0.30 | ||||||||||||||||||
| Net realized and unrealized gain (loss) | (8.10 | ) | 4.87 | 2.50 | 5.09 | 3.43 | |||||||||||||||||
| Total from investment operations | (7.86 | ) | 5.10 | 2.82 | 5.37 | 3.73 | |||||||||||||||||
| Less distributions to shareholders: | |||||||||||||||||||||||
| From net investment income | (0.22 | ) | (0.30 | ) | (0.36 | ) | (0.35 | ) | (0.31 | ) | |||||||||||||
| From net realized gains | (2.12 | ) | (5.58 | ) | (5.62 | ) | (1.81 | ) | (2.42 | ) | |||||||||||||
| Total distributions | (2.34 | ) | (5.88 | ) | (5.98 | ) | (2.16 | ) | (2.73 | ) | |||||||||||||
| Net asset value, end of period | $ | 5.06 | $ | 15.26 | $ | 16.04 | $ | 19.20 | $ | 15.99 | |||||||||||||
| Total Return | (58.58 | )%(a) | 30.68 | %(a) | 16.20 | % | 36.38 | %(a) | 28.76 | %(a) | |||||||||||||
| Ratios/Supplemental Data: | |||||||||||||||||||||||
| Net assets, end of period (000's) | $ | 89,902 | $ | 371,540 | $ | 339,268 | $ | 346,018 | $ | 249,005 | |||||||||||||
| Net expenses to average daily net assets | 1.16 | %(b) | 1.11 | %(b) | 1.06 | % | 1.10 | % | 1.10 | % | |||||||||||||
| Net investment income to average daily net assets | 2.25 | % | 1.31 | % | 1.74 | % | 1.68 | % | 2.12 | % | |||||||||||||
| Portfolio turnover rate | 128 | % | 72 | % | 58 | % | 35 | % | 53 | % | |||||||||||||
| Fees and expenses reimbursed by the Manager to average daily net assets: | 0.14 | % | 0.03 | % | — | 0.01 | % | 0.05 | % | ||||||||||||||
(a) The total returns would have been lower had certain expenses not been reimbursed during the periods shown and assumes the effect of reinvested distributions.
(b) The net expense ratio does not include the effect of expense reductions, except for reimbursements related to securities lending transactions (Note 2).
† Calculated using average shares outstanding throughout the period.
See accompanying notes to the financial statements.
23
GMO Emerging Countries Fund
(A Series of GMO Trust)
Financial Highlights
(For a Class M share outstanding throughout each period)
| Year Ended February 28/29, | |||||||||||||||||||||||
| 2009 | 2008 | 2007 | 2006 | 2005 | |||||||||||||||||||
| Net asset value, beginning of period | $ | 15.07 | $ | 15.90 | $ | 19.05 | $ | 15.87 | $ | 14.91 | |||||||||||||
| Income (loss) from investment operations: | |||||||||||||||||||||||
| Net investment income (loss)† | 0.16 | 0.18 | 0.30 | 0.27 | 0.26 | ||||||||||||||||||
| Net realized and unrealized gain (loss) | (7.92 | ) | 4.82 | 2.44 | 5.00 | 3.39 | |||||||||||||||||
| Total from investment operations | (7.76 | ) | 5.00 | 2.74 | 5.27 | 3.65 | |||||||||||||||||
| Less distributions to shareholders: | |||||||||||||||||||||||
| From net investment income | (0.19 | ) | (0.25 | ) | (0.27 | ) | (0.28 | ) | (0.27 | ) | |||||||||||||
| From net realized gains | (2.12 | ) | (5.58 | ) | (5.62 | ) | (1.81 | ) | (2.42 | ) | |||||||||||||
| Total distributions | (2.31 | ) | (5.83 | ) | (5.89 | ) | (2.09 | ) | (2.69 | ) | |||||||||||||
| Net asset value, end of period | $ | 5.00 | $ | 15.07 | $ | 15.90 | $ | 19.05 | $ | 15.87 | |||||||||||||
| Total Return | (58.67 | )%(a) | 30.29 | %(a) | 15.89 | % | 35.99 | %(a) | 28.30 | %(a) | |||||||||||||
| Ratios/Supplemental Data: | |||||||||||||||||||||||
| Net assets, end of period (000's) | $ | 20,948 | $ | 31,386 | $ | 29,423 | $ | 57,136 | $ | 69,109 | |||||||||||||
| Net expenses to average daily net assets | 1.48 | %(b) | 1.41 | %(b) | 1.36 | % | 1.39 | % | 1.40 | % | |||||||||||||
| Net investment income to average daily net assets | 1.68 | % | 0.99 | % | 1.63 | % | 1.65 | % | 1.82 | % | |||||||||||||
| Portfolio turnover rate | 128 | % | 72 | % | 58 | % | 35 | % | 53 | % | |||||||||||||
| Fees and expenses reimbursed by the Manager to average daily net assets: | 0.23 | % | 0.03 | % | — | 0.01 | % | 0.05 | % | ||||||||||||||
(a) The total returns would have been lower had certain expenses not been reimbursed during the periods shown and assumes the effect of reinvested distributions.
(b) The net expense ratio does not include the effect of expense reductions, except for reimbursements related to securities lending transactions (Note 2).
† Calculated using average shares outstanding throughout the period.
See accompanying notes to the financial statements.
24
GMO Emerging Countries Fund
(A Series of GMO Trust)
Notes to Financial Statements
February 28, 2009
1. Organization
GMO Emerging Countries Fund (the "Fund") is a series of GMO Trust (the "Trust"). The Fund is registered under the Investment Company Act of 1940, as amended, as an open-end, non-diversified management investment company. The Fund is advised and managed by Grantham, Mayo, Van Otterloo & Co. LLC (the "Manager" or "GMO"). The Trust was established as a Massachusetts business trust under the laws of The Commonwealth of Massachusetts on June 24, 1985. The Declaration of Trust permits the Trustees of the Trust ("Trustees") to create an unlimited number of series of shares ("Funds") and to subdivide Funds into classes.
The Fund seeks high total return. The Fund seeks to achieve its investment objective by outperforming the S&P/IFCI (Investable) Composite Index. The Fund typically makes equity investments in companies whose stocks are traded in the securities markets of the world's non-developed countries ("emerging countries"), which excludes countries that are included in the MSCI EAFE Index. The Fund normally invests at least 80% of its assets in investments tied economically to emerging countries.
Throughout the year ended February 28, 2009, the Fund had two classes of shares outstanding: Class III and Class M. Class M shares bear an administration fee and a 12b-1 fee while Class III shares bear a shareholder service fee (See Note 3). The principal economic difference between the classes of shares is the type and level of fees.
The Fund currently limits subscriptions due to capacity considerations.
2. Significant accounting policies
The following is a summary of significant accounting policies followed by the Fund in the preparation of its financial statements. These policies are in conformity with accounting principles generally accepted in the United States of America ("U.S. GAAP") and have been consistently followed by the Fund in preparing its financial statements. The preparation of financial statements in accordance with U.S. GAAP requires management to make estimates and assumptions that affect the reported amounts and disclosures in the financial statements. Actual results could differ from those estimates. The accounting records of the Fund are maintained in U.S. dollars.
Portfolio valuation
Securities listed on a securities exchange for which market quotations are readily available are valued at the last sale price or official closing price on each business day, or if there is no such reported sale or official closing price, at the most recent quoted bid price. Unlisted securities for which market quotations are readily available are generally valued at the most recent quoted bid price. Debt instruments with a remaining maturity of sixty days or less are generally valued at amortized cost, which approximates fair value. Shares of investment funds are generally valued at their net asset value. Securities for which quotations are not readily available or whose values the Manager has determined to be unreliable are
25
GMO Emerging Countries Fund
(A Series of GMO Trust)
Notes to Financial Statements — (Continued)
February 28, 2009
valued at fair value as determined in good faith by the Trustees or persons acting at their direction pursuant to procedures approved by the Trustees. By its nature, a fair value price is a good faith estimate of the value of a security at a given point in time and may not reflect the value that would be realized if the security were sold. The difference between a fair value price and the value realized upon a sale could be material. Because many foreign equity securities markets and exchanges close prior to the close of the New York Stock Exchange ("NYSE"), closing prices for foreign securities in those markets or on those exchanges do not reflect the events that occur after that close but before the close of the NYSE. As a result, the Fund generally values foreign equity securities using fair value prices, which are based on adjustments to closing prices supplied by a third party vendor based on that vendor's proprietary model s. As of February 28, 2009, 62.93% of the net assets of the Fund were valued using fair value prices based on models used by a third party vendor.
In September 2006, the Financial Accounting Standards Board ("FASB") issued Statement of Financial Accounting Standards No. 157, Fair Value Measurements ("SFAS 157"). SFAS 157 is effective for the Fund's current fiscal year. While the adoption of SFAS 157 does not have an effect on the Fund's net asset value, it does require additional disclosures about fair value measurements. SFAS 157 establishes a three-level hierarchy for disclosure of fair value measurements. The valuation hierarchy is based upon the reliability of inputs to the valuation of the Fund's investments. The three levels are defined as follows:
Level 1 – Valuations based on quoted prices for identical securities in active markets.
Level 2 – Valuations determined using other significant direct or indirect observable inputs.
Level 3 – Valuations based on inputs that are unobservable and significant. The Fund utilized the following fair value techniques on Level 3 investments: The Fund's securities in Thailand were subject to a premium adjustment upon exceeding foreign ownership limitations.
The inputs or methodology used for valuing securities are not necessarily an indication of the risk associated with investing in those securities.
The following is a summary of the fair valuations according to inputs used as of February 28, 2009 in valuing the Fund's investments:
| Asset Valuation Inputs | Investments in Securities | Other Financial Instruments* | |||||||||
| Level 1 - Quoted Prices | $ | 34,219,077 | $ | — | |||||||
| Level 2 - Other Significant Observable Inputs | 69,770,841 | 32,067 | |||||||||
| Level 3 - Significant Unobservable Inputs | 5,352,748 | — | |||||||||
| Total | $ | 109,342,666 | $ | 32,067 | |||||||
* Other financial instruments include forward currency contracts.
26
GMO Emerging Countries Fund
(A Series of GMO Trust)
Notes to Financial Statements — (Continued)
February 28, 2009
| Liability Valuation Inputs | Investments in Securities | Other Financial Instruments | |||||||||
| Level 1 - Quoted Prices | $ | — | $ | — | |||||||
| Level 2 - Other Significant Observable Inputs | — | — | |||||||||
| Level 3 - Significant Unobservable Inputs | — | — | |||||||||
| Total | $ | — | $ | — | |||||||
The following is a reconciliation of investments in which significant unobservable inputs (Level 3) were used in determining value:
| Investments in Securities | Other Financial Instruments | ||||||||||
| Balance as of February 29, 2008 | $ | 20,880,690 | $ | — | |||||||
| Realized gain (loss) | (4,423,366 | ) | — | ||||||||
| Change in unrealized appreciation/depreciation | (7,812,044 | ) | — | ||||||||
| Net purchases (sales) | (3,292,532 | ) | — | ||||||||
| Net transfers in and/or out of Level 3 | — | — | |||||||||
| Balance as of February 28, 2009 | $ | 5,352,748 | $ | — | |||||||
Foreign currency translation
The market values of foreign securities, currency holdings and related assets and liabilities are translated to U.S. dollars based on the 4 p.m. New York time exchange rates each business day. Income and expenses denominated in foreign currencies are translated at the 4 p.m. New York time exchange rates on the business day the income and expenses are accrued or incurred. The Fund does not isolate realized and unrealized gains and losses attributable to changes in exchange rates from gains and losses that arise from changes in the market value of investments. Such fluctuations are included with net realized and unrealized gain or loss on investments. Net realized gains and losses on foreign currency transactions represent gains and losses on disposition of currencies and forward currency contracts, currency gains and losses realized between the trade and settlement dates on securities transactions, and the difference between the amount of investment income and foreign withholding taxes recorded on the Fund's accounting records and the U.S. dollar equivalent amounts actually received or paid.
Forward currency contracts
The Fund may enter into forward currency contracts including forward cross currency contracts. A forward currency contract is an agreement between two parties to buy and sell a currency at a set price on a future date. The market value of a forward currency contract fluctuates with changes in forward currency exchange rates. Forward currency contracts are marked to market daily using rates supplied by a quotation service and changes in value are recorded by the Fund as an unrealized gain or loss. Realized gains or
27
GMO Emerging Countries Fund
(A Series of GMO Trust)
Notes to Financial Statements — (Continued)
February 28, 2009
losses equal to the difference between the value of the contract at the time it was opened and the value at the time it was closed are recorded upon delivery or receipt of the currency or, if a forward currency contract is offset by entering into another forward currency contract with the same broker, upon settlement of the net gain or loss. These contracts may involve market risk in excess of the unrealized gain or loss reflected in the Fund's Statement of Assets and Liabilities. They expose the Fund to the risk of unfavorable movements in currency values and the risk that the counterparty will be unable or unwilling to meet the terms of the contracts. Forward currency contracts outstanding at the end of the period are listed in the Fund's Schedule of Investments.
Futures contracts
The Fund may purchase and sell futures contracts. Upon entering into a futures contract, the Fund is required to deposit cash, U.S. government and agency obligations, or other liquid assets with the futures clearing broker in accordance with the initial margin requirements of the broker or exchange. In addition, the Fund maintains cash or securities in an amount that at least equals the net amount payable in the event the Fund must deliver the full amount of the contract. Futures contracts are marked to market daily and an appropriate payable or receivable for the change in value ("variation margin") is recorded by the Fund. The payable or receivable is settled on the following business day. Gains or losses are recognized but not considered realized until the contracts expire or are closed. Futures contracts involve, to varying degrees, risk of loss in excess of the variation margin disclosed in the Statement of Assets and Liabi lities. Under some circumstances, futures exchanges may establish daily limits on the amount that the price of a futures contract can vary from the previous day's settlement price, thereby effectively preventing liquidation of unfavorable positions. Losses may arise from changes in the value of the underlying instrument if the Fund is unable to liquidate a futures position due to an illiquid secondary market for the contract or the imposition of price limits, or if counterparties do not perform under the contract terms. Futures contracts are generally valued at the settlement price established each day by the board of trade or exchange on which they are traded. Because many foreign exchanges close prior to the close of the New York Stock Exchange ("NYSE"), closing prices for foreign futures in those markets or on those exchanges do not reflect the events that occur after that close but before the close of the NYSE. As a result, the Fund generally values foreign futures using fair value prices, which are base d on adjustments to closing prices supplied by a third party vendor based on that vendor's proprietary models. The Fund had no futures contracts outstanding at the end of the period.
Options
The Fund may write (i.e., sell) call and put options. Writing options alters the Fund's exposure to the underlying instrument by, in the case of a call option, obligating the Fund to sell the underlying instrument at a set price to the option-holder and, in the case of a put option, obligating the Fund to purchase the underlying instrument at a set price from the option-holder. In the case of an index option, settlement will be in cash. When the Fund writes a call or put option, an amount equal to the premium received is recorded as a liability and subsequently marked to market to reflect the current value of the option written. Premiums received from writing options that expire are treated as realized gains. Premiums received from
28
GMO Emerging Countries Fund
(A Series of GMO Trust)
Notes to Financial Statements — (Continued)
February 28, 2009
writing options that are exercised or closed are deducted from the amounts paid on the underlying future, security or currency transaction to determine the realized gain or loss. The Fund as a writer of an option has no control over whether the underlying future, security or currency may be sold (call) or purchased (put) and as a result bears the market risk of an unfavorable change in the price of the future, security or currency underlying the option. In the event that the Fund writes uncovered put or call options (i.e. options for investments that the Fund does not own), it bears the risk of substantial losses if the price of the underlying instrument increases during the term of the option. Options expose the Fund to the risk the Fund may not be able to enter into a closing transaction because of an illiquid market. The Fund had no open written option contracts during the period.
The Fund may also purchase put and call options. Purchasing options alters the Fund's exposure to the underlying instrument by, in the case of a call option, entitling the Fund to purchase the underlying instrument at a set price from the writer of the option and, in the case of a put option, entitling the Fund to sell the underlying instrument at a set price to the writer of the option. The Fund pays a premium for a purchased option. That premium is disclosed in the Schedule of Investments and is subsequently marked to market to reflect the current value of the option. Premiums paid for purchasing options that expire are treated as realized losses. Premiums paid for purchasing options that are exercised or closed are deducted from the proceeds on the closing transaction to determine the realized gain or loss. The risk associated with purchasing put and call options is limited to the premium paid. The Fund had no purchased optio n contracts outstanding at the end of the period.
The Fund values exchange traded options at the last sale price, or if no sale is reported, the last bid price for options it has purchased and the last ask price for options it has written. The Fund values options traded over-the-counter using inputs provided by primary pricing sources and industry standard models.
Indexed securities
The Fund may invest in indexed securities. Indexed securities are securities whose redemption values and/or coupons are linked to the prices of a specific instrument or financial statistic. The Fund uses indexed securities to increase or decrease its exposure to different underlying instruments and to gain exposure to markets in which investing through conventional securities is difficult. The Fund had no indexed securities outstanding at the end of the period.
Swap agreements
The Fund may enter into various types of swap agreements, including without limitation, interest rate, total return, credit default and variance swap agreements. A swap agreement is an agreement to exchange the return generated by one instrument for the return generated by another instrument. When entering into a swap agreement, the Fund and/or the swap counterparty may post or receive cash or securities as collateral. The party posting the collateral typically receives the interest associated with or payments related to the collateral and has the risk of loss related to the collateral.
29
GMO Emerging Countries Fund
(A Series of GMO Trust)
Notes to Financial Statements — (Continued)
February 28, 2009
Interest rate swap agreements involve an exchange by the parties of their respective commitments to pay or right to receive interest, e.g., an exchange of floating rate interest payments for fixed rate interest payments with respect to the notional amount of principal.
Total return swap agreements involve a commitment by one party to pay interest to the other party in exchange for a payment to it from the other party based on the return of a reference instrument (e.g., a security or basket of securities), both based on notional amounts. To the extent the return of the reference instrument exceeds or falls short of the interest payments, one party will receive a payment from or make a payment to the other party.
In a credit default swap agreement, one party makes payments to another party in exchange for the right to receive a specified return if a credit event occurs with respect to a referenced entity or entities. Buying credit default protection reduces the buyer's exposure in the event of an issuer's default (e.g., it reduces risk where a party owns a security issued by or otherwise has exposure to the issuer). Selling credit default protection subjects the seller to exposure to an issuer's default. A seller of credit default protection receives payments in return for its obligation to pay the principal amount of a debt security (or other agreed-upon value) to the other party upon the occurrence of a credit event (e.g., issuer default or similar event). If no credit event occurs, the seller has no payment obligations. For credit default swap agreements on asset-backed securities, a credit event may be triggered by such events as the issuer's failure to pay interest or principal, an agreement of the holders of an asset-backed security to a maturity extension, a rating downgrade on the security or a write-down on the collateral underlying the security. For credit default swap agreements on corporate or sovereign issuers, a credit event may be triggered by such events as the issuer's bankruptcy, failure to pay interest or principal, repudiation/moratorium or restructuring.
Variance swap agreements involve an agreement by two parties to exchange cash flows based on the measured variance (or square of volatility) of a specified underlying asset. One party agrees to exchange a "fixed rate" or strike price payment for the "floating rate" or realized price variance on the underlying asset with respect to the notional amount. At inception, the strike price chosen is generally fixed at a level such that the fair value of the swap is zero. At the expiration date, the amount paid by one party to the other is the difference between the realized price variance of the underlying asset and the strike price multiplied by the notional amount. A receiver of the realized price variance would receive a payment when the realized price variance of the underlying asset is greater than the strike price and would make a payment when that variance is less than the strike price. A payer of the realized price variance woul d make a payment when the realized price variance of the underlying asset is greater than the strike price and would receive a payment when that variance is less than the strike price. This type of agreement is essentially a forward contract on the future realized price variance of the underlying asset.
The Fund prices its swap agreements daily using models that may incorporate quotations from market makers and records the change in value, if any, as unrealized gain or loss in the Statement of Operations.
30
GMO Emerging Countries Fund
(A Series of GMO Trust)
Notes to Financial Statements — (Continued)
February 28, 2009
Payments received or made on swap agreements are recorded as realized gain or loss in the Statement of Operations. Gains or losses are realized upon termination of the swap agreements.
Swap agreements often are not actively traded on financial markets. The values assigned to them may differ significantly from the values that would be realized upon termination, and the differences could be material. Entering into swap agreements involves credit, legal, market and documentation risk that is not reflected in the amounts reported in the Statement of Assets and Liabilities. Such risks include the possibility that the party with whom the Fund contracts may default on its obligations to perform or disagree as to the meaning of contractual terms, or that the collateral that party posts may be insufficient or not timely received by the Fund. Credit risk may be particularly acute in an environment where financial services firms are exposed to systemic risks of the type evidenced by the insolvency of Lehman Brothers and subsequent market disruptions. The Fund had no swap agreements outstanding at the end of the period.
Securities lending
The Fund may lend its securities to qualified brokers. The loans are collateralized with cash or liquid securities with a market value at least equal to the market value of the securities upon entering into the loan. As with other extensions of credit, the Fund may bear the risk of loss with respect to the investment of the collateral, the risk of delay in and/or inability to exercise its rights with respect to the collateral, and the risk of delay in recovery or loss of rights in the loaned securities should the borrower of the securities fail financially. If a loan is collateralized by U.S. government securities, the Fund receives a fee from the borrower. If a loan is collateralized by cash, the Fund typically invests the cash collateral for its own account. The Fund had no securities on loan at February 28, 2009.
Taxes and distributions
The Fund intends to qualify each tax year as a regulated investment company under Subchapter M of the Internal Revenue Code of 1986, as amended (the "Code"). The Fund intends to distribute substantially all of its net investment income and all of its net realized short-term and long-term capital gain, if any, after giving effect to any available capital loss carryforwards for U.S. federal income tax purposes. Therefore, no provision for U.S. federal income or excise tax is necessary. Taxes on foreign interest and dividend income are generally withheld in accordance with the applicable country's tax treaty with the United States. The foreign withholding rates applicable to a Fund's investments in certain foreign jurisdictions may be higher if a significant portion of the Fund is held by non-U.S. shareholders.
The Fund's policy is to declare and pay distributions from net investment income, if any, semiannually, and from net realized short-term and long-term capital gain, if any, at least annually. All distributions are paid in shares of the Fund, at net asset value, unless the shareholder elects to receive cash distributions. Distributions to shareholders are recorded by the Fund on the ex-dividend date.
31
GMO Emerging Countries Fund
(A Series of GMO Trust)
Notes to Financial Statements — (Continued)
February 28, 2009
Foreign taxes paid by the Fund may be treated, to the extent permissible under the Code and if the Fund so elects, as if paid by the shareholders of the Fund.
The Fund may be subject to capital gains and repatriation taxes imposed by certain countries in which it invests. The accrual for capital gains and repatriation taxes is included in net unrealized gain (loss) in the Statement of Operations. For the year ended February 28, 2009, the Fund incurred $14,592 in capital gains taxes, which is included in net realized gain (loss) in the Statement of Operations.
The Fund is currently subject to a Taiwanese security transaction tax of 0.30% of the transaction amount on equities, which must be paid by the Fund upon the sale or transfer of any portfolio securities subject to that tax.
The Fund is subject to a Contribuição Provisória sobre Movimentações Financiera ("CPMF") tax which is applied to foreign exchange transactions representing capital inflows or outflows to/from the Brazilian market. For the year ended February 28, 2009, the Fund incurred $554 in CPMF tax, which is included in net realized gain (loss) on foreign currency, forward contracts and foreign currency related transactions in the Statement of Operations.
Income and capital gain distributions are determined in accordance with U.S. federal income tax regulations, which may differ from U.S. GAAP. Certain capital accounts in the financial statements are periodically adjusted for permanent differences in order to reflect their tax character. These adjustments have no impact on net assets or net asset value per share. Temporary differences that arise from recognizing certain items of income, expense, gain or loss in different periods for financial statement and tax purposes will reverse at some time in the future. Distributions in excess of net investment income or net realized gains are temporary over-distributions for financial statement purposes resulting from differences in the recognition or classification of income or distributions for financial statement and tax purposes.
U.S. GAAP and tax accounting differences primarily relate to foreign currency transactions, losses on wash sale transactions, passive foreign investment company transactions, adjustments related to securities on loan and post-October capital losses.
The following reclassification represents the amount necessary to report the stated components of net assets on a tax basis, excluding certain temporary differences, as of February 28, 2009. The financial highlights exclude these adjustments.
| Distributions In Excess of Net Investment Income | Distributions In Excess of Net Realized Gain | Paid-in Capital | |||||||||
| $ | (770,162 | ) | $ | 770,162 | $ | — | |||||
32
GMO Emerging Countries Fund
(A Series of GMO Trust)
Notes to Financial Statements — (Continued)
February 28, 2009
The tax character of distributions declared to shareholders is as follows:
| 2/28/2009 | 2/28/2008 | ||||||||||
| Ordinary income (including any net short-term capital gain) | $ | 7,965,253 | $ | 22,711,741 | |||||||
| Net long-term capital gain | 45,633,186 | 108,039,715 | |||||||||
| Total distributions | $ | 53,598,439 | $ | 130,751,456 | |||||||
Distributions in excess of tax basis earnings and profits, if significant, are reported in the financial statements as a return of capital for tax purposes.
As of February 28, 2009, the components of distributable earnings on a tax basis consisted of the following:
| Undistributed ordinary income (including net any short-term capital gain) | $ | 35,641 | |||||
| Undistributed net long-term capital gain | $ | 479,385 | |||||
As of February 28, 2009, the Fund elected to defer to March 1, 2009 post-October capital losses of $72,060,837.
As of February 28, 2009, the approximate cost for U.S. federal income tax purposes and gross and net unrealized appreciation (depreciation) in value of investments were as follows:
Aggregate Cost | Gross Unrealized Appreciation | Gross Unrealized (Depreciation) | Net Unrealized Appreciation (Depreciation) | ||||||||||||
| $ | 179,398,575 | $ | 1,216,165 | $ | (71,272,074 | ) | $ | (70,055,909 | ) | ||||||
The Fund is subject to the provisions of Financial Accounting Standards Board Interpretation No. 48 ("FIN 48"), Accounting for Uncertainty in Income Taxes — an Interpretation of FASB Statement No. 109. FIN 48 sets forth a minimum threshold for financial statement recognition of a tax position taken or expected to be taken in a tax return that could affect the Fund's financial statements. The Fund did not have any unrecognized tax benefits or liabilities at February 28, 2009, nor did it have any increases or decreases in unrecognized tax benefits or liabilities for the period then ended. The Fund is subject to examination prior to the expiration of the statute of limitations by U.S. federal and state tax authorities for tax returns filed.
33
GMO Emerging Countries Fund
(A Series of GMO Trust)
Notes to Financial Statements — (Continued)
February 28, 2009
Security transactions and related investment income
Security transactions in the financial statements are accounted for on the trade date. Dividend income, net of applicable foreign withholding taxes, if any, is recorded on the ex-dividend date or, if later, when the Fund is informed of the ex-dividend date. Interest income is recorded on the accrual basis and is adjusted for the amortization of premiums and accretion of discounts. Principal on inflation indexed securities is adjusted for inflation and any increase or decrease is recorded as interest income or loss. Income is not recognized on securities for which collection is not expected. Non-cash dividends, if any, are recorded at the fair market value of the asset received. In determining the net gain or loss on securities sold, the Fund uses the identified cost basis for the purposes of determining the cost basis.
Expenses
The majority of the expenses of the Trust are directly identifiable to an individual fund. Expenses that are not readily identifiable to a specific fund are allocated taking into consideration, among other things, the nature and type of expense and the relative size of the funds. Investment income, common expenses and realized and unrealized gains and losses are allocated pro rata among the classes of shares of the Fund based on the relative net assets of each class. Shareholder service fees, 12b-1, and administration fees, which are directly attributable to a class of shares, are charged to that class's operations.
Brown Brothers Harriman & Co. ("BBH") serves as custodian and fund accounting agent of the Fund. State Street Bank and Trust Company ("State Street") serves as transfer agent of the Fund. BBH and State Street's fees may be reduced by an earnings allowance calculated on the average daily cash balances the Fund maintains with each agent. The Fund receives the benefit of the earnings allowance. In addition, Goldman Sachs Agency Lending, the Fund's securities lending agent, has agreed to reimburse the Fund for certain transactional expenses related to securities lending activity. Credit balances or expense reimbursements used to reduce fees, if any, are reported as a reduction of expenses in the Statement of Operations.
Investment risks
Investments in securities of issuers in emerging countries present risks that are not presented by many other investments. Many emerging countries are subject to political and/or economic instability. The securities markets of emerging countries are generally smaller and less developed than the securities markets of the U.S. and developed foreign markets. Further, countries may expropriate or impose various types of foreign currency regulations or controls that impede the Fund's ability to repatriate amounts it receives. The Fund may acquire interests in securities of companies in some countries based on the Manager's expectations that conditions in those countries will improve. These factors may result in significant volatility in the values of the Fund's holdings. The markets in emerging countries are typically less liquid than those of developed markets. Accordingly, the Fund may not be able to realize in an actual sale amoun ts approximating the values it has placed on its holdings.
34
GMO Emerging Countries Fund
(A Series of GMO Trust)
Notes to Financial Statements — (Continued)
February 28, 2009
Among other trading agreements, the Fund is party to International Swaps and Derivatives Association, Inc. Master Agreements ("ISDA Agreements") with select counterparties that generally govern over-the-counter derivative transactions entered into by the Fund. The ISDA Master Agreements typically include standard representations and warranties as well as contractual terms related to collateral, events of default, termination events, and other standard provisions. Termination events may include the decline in the net assets of the Fund below a certain level over a specified period of time and may entitle a counterparty to elect to terminate early with respect to some or all the transactions under the ISDA Agreement with that counterparty. Such an election by one or more of the counterparties could have a material impact on the Fund's operations. Due to declines in the net assets of the Fund during the year ended February 28, 2009 , one or more counterparties may be entitled to terminate early but none has taken such action.
Recently issued accounting pronouncement
In March 2008, FASB issued Statement of Financial Accounting Standards No. 161, Disclosures about Derivative Instruments and Hedging Activities ("SFAS 161"). SFAS 161 is effective for fiscal years and interim periods beginning after November 15, 2008. SFAS 161 requires enhanced disclosures about the Fund's derivative and hedging activities. The Manager is currently evaluating the impact the adoption of SFAS 161 will have on the Fund's financial statement disclosures.
3. Fees and other transactions with affiliates
GMO receives a management fee for the services it provides to the Fund. That fee is paid monthly at the annual rate of 0.65% of average daily net assets. The Fund has adopted a Shareholder Service Plan under which the Fund pays GMO a shareholder service fee for client and shareholder service, reporting, and other support. Pursuant to the Shareholder Service Plan, the shareholder service fee is calculated based on average daily net assets at the annual rate of 0.15% for Class III shares.
Holders of Class M shares of the Fund pay GMO an administration fee for support services provided to Class M shareholders. That fee is paid monthly at the annual rate of 0.20% of the average daily net assets of Class M shares. Pursuant to a Rule 12b-1 distribution and service plan adopted by the Fund, holders of Class M shares of the Fund may pay a fee, at the annual rate of up to 1.00% of average daily net assets of Class M shares for any activities or expenses primarily intended to result in the sale of Class M shares of the Fund and/or for the provision of services to Class M shareholders. The Trustees currently limit payments on Class M shares to 0.25% of the Fund's average daily net assets Class M shares.
Through at least June 30, 2009, The Manager has contractually agreed to reimburse the Fund for Fund expenses incurred through that date to the extent the Fund's total annual operating expenses (excluding "Excluded Expenses", as defined below) exceed 1.00% of the Fund's average daily net assets. Excluded Expenses include shareholder service fees, administration and distribution (12b-1) fees, expenses indirectly incurred by investment in the underlying funds, fees and expenses of the independent Trustees of the Trust, fees and expenses for legal services not approved by the Manager for the Trust, compensation
35
GMO Emerging Countries Fund
(A Series of GMO Trust)
Notes to Financial Statements — (Continued)
February 28, 2009
and expenses of the Trust's Chief Compliance Officer ("CCO") (excluding any employee benefits), brokerage commissions, securities lending fees and expenses, transfer taxes, and other investment-related costs (including expenses associated with investments in any company that is an investment company or would be an investment company under the 1940 Act, but for the exceptions to the definition of investment company provided in Section 3(c)(1) and 3(c)(7) of the 1940 Act), hedging transaction fees, extraordinary, non-recurring and certain other unusual expenses (including taxes).
The Fund's portion of the fees paid by the Trust to the Trust's independent Trustees and CCO during the year ended February 28, 2009 was $4,316 and $1,856, respectively. The compensation and expenses of the CCO are included in miscellaneous expenses in the Statement of Operations. The Fund paid no remuneration to any other officer of the Trust.
4. Purchases and sales of securities
Cost of purchases and proceeds from sales of securities, excluding short-term investments, for the year ended February 28, 2009 aggregated $325,812,499 and $395,557,434, respectively.
5. Guarantees
In the normal course of business the Fund enters into contracts with third-party service providers that contain a variety of representations and warranties and that provide general indemnifications. The Fund's maximum exposure under these arrangements is unknown, as it involves future claims that may be made against the Fund that have not yet occurred. Based on experience, management is of the view that the risk of loss in connection with its indemnification obligations is remote; however, there can be no assurance that such obligations will not result in material liabilities that adversely affect the Fund.
6. Principal shareholders and related parties
As of February 28, 2009, 65.46% of the outstanding shares of the Fund were held by four shareholders, each holding more than 10% of the Fund's outstanding shares. On that date, no other shareholder owned more than 10% of the outstanding shares of the Fund. Redemptions from (or investments into) the Fund by or on behalf of these large shareholders may have a material effect on the Fund.
As of February 28, 2009, 0.16% of the Fund's shares were held by senior management of the Manager and GMO Trust officers and 2.58% of the Fund's shares were held by accounts for which the Manager had investment discretion.
36
GMO Emerging Countries Fund
(A Series of GMO Trust)
Notes to Financial Statements — (Continued)
February 28, 2009
7. Share transactions
The Declaration of Trust permits the Trust to issue an unlimited number of shares of beneficial interest (without par value). Transactions in Fund shares were as follows:
| Year Ended February 28, 2009 | Year Ended February 29, 2008 | ||||||||||||||||||
| Class III: | Shares | Amount | Shares | Amount | |||||||||||||||
| Shares sold | 8,395,532 | $ | 66,791,311 | 957,007 | $ | 16,034,781 | |||||||||||||
| Shares issued to shareholders in reinvestment of distributions | 4,479,699 | 46,605,889 | 6,663,042 | 113,483,330 | |||||||||||||||
| Shares repurchased | (19,463,147 | ) | (175,626,531 | ) | (4,425,134 | ) | (78,012,899 | ) | |||||||||||
| Net increase (decrease) | (6,587,916 | ) | $ | (62,229,331 | ) | 3,194,915 | $ | 51,505,212 | |||||||||||
| Year Ended February 28, 2009 | Year Ended February 29, 2008 | ||||||||||||||||||
| Class M: | Shares | Amount | Shares | Amount | |||||||||||||||
| Shares sold | 6,833,888 | $ | 59,787,842 | 628,963 | $ | 10,927,518 | |||||||||||||
| Shares issued to shareholders in reinvestment of distributions | 433,569 | 4,245,746 | 634,368 | 10,672,717 | |||||||||||||||
| Shares repurchased | (5,160,510 | ) | (36,646,021 | ) | (1,031,321 | ) | (17,781,041 | ) | |||||||||||
| Net increase (decrease) | 2,106,947 | $ | 27,387,567 | 232,010 | $ | 3,819,194 | |||||||||||||
37
Report of Independent Registered Public Accounting Firm
To the Trustees of GMO Trust and the Shareholders of
GMO Emerging Countries Fund:
In our opinion, the accompanying statement of assets and liabilities, including the schedule of investments, and the related statements of operations and of changes in net assets and the financial highlights present fairly, in all material respects, the financial position of GMO Emerging Countries Fund (the "Fund") at February 28, 2009, the results of its operations for the year then ended, the changes in its net assets for each of the two years in the period then ended and the financial highlights for each of the five years in the period then ended, in conformity with accounting principles generally accepted in the United States of America. These financial statements and financial highlights (hereafter referred to as "financial statements") are the responsibility of the Fund's management. Our responsibility is to express an opinion on these financial statements based on our audits. We conducted our audits of these financial sta tements in accordance with the standards of the Public Company Accounting Oversight Board (United States). Those standards require that we plan and perform the audit to obtain reasonable assurance about whether the financial statements are free of material misstatement. An audit includes examining, on a test basis, evidence supporting the amounts and disclosures in the financial statements, assessing the accounting principles used and significant estimates made by management, and evaluating the overall financial statement presentation. We believe that our audits, which included confirmation of securities at February 28, 2009 by correspondence with the custodian and brokers, provide a reasonable basis for our opinion.
PricewaterhouseCoopers LLP
Boston, Massachusetts
April 29, 2009
38
GMO Emerging Countries Fund
(A Series of GMO Trust)
Fund Expenses
February 28, 2009 (Unaudited)
Expense Examples: The following information is in relation to expenses for the six month period ended February 28, 2009.
As a shareholder of the Fund, you may incur two types of costs: (1) transaction costs; and (2) ongoing costs, including management fees, shareholder service fees, distribution (12b-1) and/or administration fees, and other Fund expenses. This example is intended to help you understand your ongoing costs (in dollars) of investing in the Fund and to compare these costs with the ongoing costs of investing in other mutual funds.
This example is based on an investment of $1,000 invested at the beginning of the period and held for the entire period, September 1, 2008 through February 28, 2009.
Actual Expenses
The first line of the table for each class below provides information about actual account values and actual expenses. You may use the information in this line, together with the amount you invested, to estimate the expenses that you paid over the period. Simply divide your account value by $1,000 (for example, an $10,000,000 account value divided by $1,000 = 10,000), then multiply the result by the number in the first line under the heading entitled "Net Expense Incurred" to estimate the expenses you paid on your account during this period.
Hypothetical Example for Comparison Purposes
The second line of the table for each class below provides information about hypothetical account values and hypothetical expenses based on the Fund's actual expense ratio and an assumed rate of return of 5% per year before expenses, which is not the Fund's actual return. The hypothetical account values and expenses may not be used to estimate the actual ending account balance or expenses you paid for the period. You may use this information to compare the ongoing costs of investing in the Fund with other funds. To do so, compare this 5% hypothetical example with the 5% hypothetical examples that appear in the shareholder reports of other funds.
Please note that the expenses shown in the table are meant to highlight your ongoing costs only and do not reflect any transactional costs, such as purchase premiums and redemption fees. Therefore, the second line of the table is useful in comparing ongoing costs only, and will not help you determine the relative total costs of owning different funds. In addition, if these transactional costs were included, your costs would have been higher.
| Annualized Expense Ratio | Beginning Account Value | Ending Account Value | Net Expense Incurred* | ||||||||||||||||
| Class III | |||||||||||||||||||
| 1) Actual | 1.19 | % | $ | 1,000.00 | $ | 497.00 | $ | 4.42 | |||||||||||
| 2) Hypothetical | 1.19 | % | $ | 1,000.00 | $ | 1,018.89 | $ | 5.96 | |||||||||||
| Class M | |||||||||||||||||||
| 1) Actual | 1.49 | % | $ | 1,000.00 | $ | 496.70 | $ | 5.53 | |||||||||||
| 2) Hypothetical | 1.49 | % | $ | 1,000.00 | $ | 1,017.41 | $ | 7.45 | |||||||||||
* Expenses are calculated using each Class's annualized expense ratio for the six months ended February 28, 2009, multiplied by the average account value over the period, multiplied by 181 days in the period, divided by 365 days in the year.
39
GMO Emerging Countries Fund
(A Series of GMO Trust)
Tax Information for the Tax Year Ended February 28, 2009 (Unaudited)
The Fund will notify shareholders of amounts for use in preparing 2009 income tax forms in January 2010.
The Fund's distributions to shareholders include $45,633,186 from long-term capital gains.
During the year ended February 28, 2009, the Fund paid foreign taxes of $1,197,971 and recognized foreign source income of $9,899,853.
For taxable, non-corporate shareholders, 100.00% of the income and short-term capital gains, if any, distributed in the Fund's fiscal year ended February 28, 2009 represents qualified dividend income subject to the 15% rate category.
The Fund hereby designates as qualified short-term capital gains with respect to its taxable year ended February 28, 2009, $3,991,302 or if determined to be different, the qualified short-term capital gains of such year.
40
Trustees and Officers (Unaudited)
The following tables list the Trust's Trustees and Officers as of the date of this report; their address and date of birth ("DOB"); their position with the Trust; the length of time holding that position with the Trust; their principal occupation(s) during the past five years; the number of portfolios in the fund complex they oversee; and other directorships they hold in companies subject to registration or reporting requirements of the Securities Exchange Act of 1934 (generally called "public companies") or in registered investment companies. The Trust's Statement of Additional Information ("SAI") includes additional information about the Trust's trustees, including changes subsequent to the date of the report. The SAI is available, without charge, upon request by writing GMO, c/o GMO Trust, 40 Rowes Wharf, Boston, MA 02110.
Independent Trustees:
| Name, Address, and DOB | Position(s) Held with Trust | Term of Office1 and Length of Time Served | Principal Occupation(s) During Past Five Years | Number of Portfolios in Fund Complex Overseen by Trustee | Other Directorships Held by Trustee | ||||||||||||||||||
| Donald W. Glazer, Esq. c/o GMO Trust 40 Rowes Wharf Boston, MA 02110 DOB: 07/26/1944 | Chairman of the Board of Trustees | Chairman of the Board of Trustees since March 2005; Lead Independent Trustee (September 2004 – March 2005); Trustee since December 2000. | Consultant – Law and Business2; Author of Legal Treatises. | 59 | None. | ||||||||||||||||||
1 Each Trustee is elected to serve during the continued lifetime of the Trust until he/she dies, resigns or is removed, or if sooner, until the next meeting of Shareholders called for the purpose of electing Trustees and until the election and qualification of his/her successor.
2 As part of Mr. Glazer's work as a consultant, he provides part-time consulting services to Goodwin Procter LLP ("Goodwin"). Goodwin has provided legal services to Renewable Resources, LLC, an affiliate of GMO; GMO, in connection with its relationship with Renewable Resources; and funds managed by Renewable Resources. Mr. Glazer has represented that he has no financial interest in, and is not involved in the provision of, such legal services. In the calendar years ended December 31, 2007 and December 31, 2008, these entities paid $789,416 and $183,864 respectively, in legal fees and disbursements to Goodwin. In correspondence with the Staff of the Securities and Exchange Commission beginning in August 2006, the Independent Trustees' legal counsel provided the Staff with information regarding Mr. Glazer's relationship with Goodwin and h is other business activities. On September 11, 2007, based on information that had been given to the Staff as of that date, the Staff provided oral no-action assurance consistent with the opinion of the Independent Trustees' legal counsel that Mr. Glazer is not an "interested person" of the Trust.
41
Independent Trustees — (Continued)
| Name, Address, and DOB | Position(s) Held with Trust | Term of Office1 and Length of Time Served | Principal Occupation(s) During Past Five Years | Number of Portfolios in Fund Complex Overseen by Trustee | Other Directorships Held by Trustee | ||||||||||||||||||
| W. Nicholas Thorndike c/o GMO Trust 40 Rowes Wharf Boston, MA 02110 DOB: 03/28/1933 | Trustee | Since March 2005. | Director or trustee of various corporations and charitable organizations, including Courier Corporation (a book publisher and manufacturer) (July 1989 – present); Putnam Funds (December 1992 – June 2004); and Providence Journal (a newspaper publisher) (December 1986 – December 2003). | 59 | Director of Courier Corporation (a book publisher and manufacturer); Member of the Investment Committee of Partners HealthCare System, Inc.3 | ||||||||||||||||||
| Peter Tufano c/o GMO Trust 40 Rowes Wharf Boston, MA 02110 DOB: 04/22/1957 | Trustee | Since December 2008. | Sylvan C. Coleman Professor of Financial Management, Harvard Business School (since 1989). | 59 | Trustee of State Street Navigator Securities Lending Trust (3 Portfolios). | ||||||||||||||||||
1 Each Trustee is elected to serve during the continued lifetime of the Trust until he/she dies, resigns or is removed, or if sooner, until the next meeting of Shareholders called for the purpose of electing Trustees and until the election and qualification of his/her successor.
3 Partners HealthCare System, Inc. is a client of the Manager.
42
Principal Officers:
| Name, Address, and DOB | Position(s) Held with Trust | Term of Office4 and Length of Time Served | Principal Occupation(s) During Past Five Years5 | ||||||||||||
| J.B. Kittredge DOB: 08/22/1954 | President and Chief Executive Officer | Since March 2009. | General Counsel, Grantham, Mayo, Van Otterloo & Co. LLC (October 2005 – Present); Partner, Ropes & Gray LLP. | ||||||||||||
| Sheppard N. Burnett c/o GMO Trust 40 Rowes Wharf Boston, MA 02110 DOB: 10/24/1968 | Treasurer and Chief Financial Officer | Chief Financial Officer since March 2007; Treasurer since November 2006; Assistant Treasurer, September 2004 – November 2006. | Fund Administration Staff, Grantham, Mayo, Van Otterloo & Co. LLC (June 2004 – present); Vice President, Director of Tax, Columbia Management Group (2002 – 2004). | ||||||||||||
| Brent C. Arvidson c/o GMO Trust 40 Rowes Wharf Boston, MA 02110 DOB: 06/26/1969 | Assistant Treasurer | Since August 1998. | Senior Fund Administrator, Grantham, Mayo, Van Otterloo & Co. LLC. | ||||||||||||
| John L. Nasrah c/o GMO Trust 40 Rowes Wharf Boston, MA 02110 DOB: 05/27/1977 | Assistant Treasurer | Since March 2007. | Fund Administrator, Grantham, Mayo, Van Otterloo & Co. LLC (September 2004 – present); Tax Analyst, Bain & Company, Inc. (June 2003 – September 2004). | ||||||||||||
| Mahmoodur Rahman c/o GMO Trust 40 Rowes Wharf Boston, MA 02110 DOB: 11/30/1967 | Assistant Treasurer | Since September 2007. | Fund Administrator, Grantham, Mayo, Van Otterloo & Co. LLC (April 2007 – present); Vice President and Senior Tax Manager, Massachusetts Financial Services Company (January 2000 – April 2007). | ||||||||||||
| Michael E. Gillespie c/o GMO Trust 40 Rowes Wharf Boston, MA 02110 DOB: 02/18/1958 | Chief Compliance Officer | Since March 2005. | Vice President of Compliance (June 2004 – February 2005) and Director of Domestic Compliance (March 2002 – June 2004), Fidelity Investments. | ||||||||||||
4 Each officer is elected to hold such office until his or her successor is duly elected and qualified to carry out the duties and responsibilities of the office, or until he or she resigns or is removed from office.
5 Each of Messrs. Burnett, Arvidson, Bohan, and Pottle serves as an officer and/or director of certain pooled investment vehicles of which GMO or an affiliate of GMO serves as the investment adviser.
43
Principal Officers — (Continued)
| Name, Address, and DOB | Position(s) Held with Trust | Term of Office4 and Length of Time Served | Principal Occupation(s) During Past Five Years5 | ||||||||||||
| Jason B. Harrison c/o GMO Trust 40 Rowes Wharf Boston, MA 02110 DOB: 01/29/1977 | Vice President and Clerk | Vice President since November 2006; Clerk since March 2006. | Legal Counsel, Grantham, Mayo, Van Otterloo & Co. LLC (since February 2006) and Attorney, Ropes & Gray LLP (September 2002 – February 2006). | ||||||||||||
| David L. Bohan c/o GMO Trust 40 Rowes Wharf Boston, MA 02110 DOB: 06/21/1964 | Vice President and Assistant Clerk | Vice President since March 2005; Assistant Clerk since March 2006. | Legal Counsel, Grantham, Mayo, Van Otterloo & Co. LLC. | ||||||||||||
| Gregory L. Pottle c/o GMO Trust 40 Rowes Wharf Boston, MA 02110 DOB: 07/09/1971 | Vice President and Assistant Clerk | Since November 2006. | Legal Counsel, Grantham, Mayo, Van Otterloo & Co. LLC. | ||||||||||||
| Anne K. Trinque c/o GMO Trust 40 Rowes Wharf Boston, MA 02110 DOB: 04/15/1978 | Vice President and Assistant Clerk | Since September 2007. | Legal Counsel, Grantham, Mayo, Van Otterloo & Co. LLC (January 2007 – present); Attorney, Goodwin Procter LLP (September 2003 – January 2007). | ||||||||||||
| Cheryl Wakeham c/o GMO Trust 40 Rowes Wharf Boston, MA 02110 DOB: 10/29/1958 | Vice President and Anti-Money Laundering Officer | Since December 2004. | Manager, Client Service Administration, Grantham, Mayo, Van Otterloo & Co. LLC. | ||||||||||||
4 Each officer is elected to hold such office until his or her successor is duly elected and qualified to carry out the duties and responsibilities of the office, or until he or she resigns or is removed from office.
5 Each of Messrs. Burnett, Arvidson, Bohan, and Pottle serves as an officer and/or director of certain pooled investment vehicles of which GMO or an affiliate of GMO serves as the investment adviser.
44
GMO Global Growth Fund
(A Series of GMO Trust)
Annual Report
February 28, 2009
For a free copy of the Fund's proxy voting guidelines, shareholders may call 1-617-346-7646 (collect) or visit the Securities and Exchange Commission's website at www.sec.gov. Information regarding how the Fund voted proxies relating to portfolio securities during the most recent 12-month period ended June 30 is available on GMO's website at www.gmo.com, or on the Securities and Exchange Commission's website at www.sec.gov.
The Fund files its complete schedule of portfolio holdings with the Securities and Exchange Commission for the first and third quarter of each fiscal year on Form N-Q, which is available on the Commission's website at www.sec.gov. The Fund's Form N-Q may be reviewed and copied at the Commission's Public Reference Room in Washington, D.C. Information on the operation of the Public Reference Room may be obtained by calling 1-800-SEC-0330. The Fund has a policy with respect to disclosure of portfolio holdings under which it may also make available on GMO's website at www.gmo.com a complete schedule of portfolio holdings.
This report is prepared for the general information of shareholders. It is authorized for distribution to prospective investors only when preceded or accompanied by a prospectus for the GMO Trust, which contains a complete discussion of the risks associated with an investment in this Fund and other important information. The GMO Trust prospectus can be obtained at www.gmo.com.
GMO Global Growth Fund
(A Series of GMO Trust)
Portfolio Management
Day-to-day management of the Fund's portfolio is the responsibility of the Quantitative Equity team at Grantham, Mayo, Van Otterloo & Co. LLC.
Management Discussion and Analysis of Fund Performance
The GMO Global Growth Fund returned -42.4% for the fiscal year ended February 28, 2009, as compared to -47.1% for the MSCI World Index and -45.2% for the MSCI World Growth Index (the Fund's benchmark). The Fund was invested substantially in global equity securities throughout the period.
Stock selection had a strong positive impact on performance relative to the Fund's benchmark. Among the most significant contributors were holdings in U.S. pharmaceutical Johnson & Johnson and U.S. oil company ExxonMobil, both of which outperformed. Holdings in Royal Bank of Scotland and Barclays underperformed, which hurt returns.
Among GMO's global quantitative stock selection disciplines, stocks ranked highly by intrinsic value (with its boost of high quality) outperformed significantly. Momentum had mixed results. Price momentum worked well while earnings revision momentum did not.
Country allocation had a slight positive impact on performance relative to the Fund's benchmark. Our small underweights in Japan and Germany and holding small cash balances in a falling market were mainly responsible.
Sector weightings had a negative impact on performance relative to the Fund's benchmark. During the period, an overweight position in Energy detracted despite our overweight in Health Care, which helped.
Currency allocation had a positive impact on performance relative to the Fund's benchmark as our underweight in the British pound and Australian dollar added value. The U.S. dollar strengthened relative to most foreign currencies, which detracted from returns for U.S. investors. The MSCI World Index returned almost 5% more in local currency terms than in U.S. dollars.
The views expressed herein are exclusively those of Grantham, Mayo, Van Otterloo & Co. LLC Management as of the date of this report and are subject to change. GMO disclaims any responsibility to update such views. They are not meant as investment advice. References to specific securities are not recommendations of such securities and may not be representative of any GMO portfolio's current or future investments.
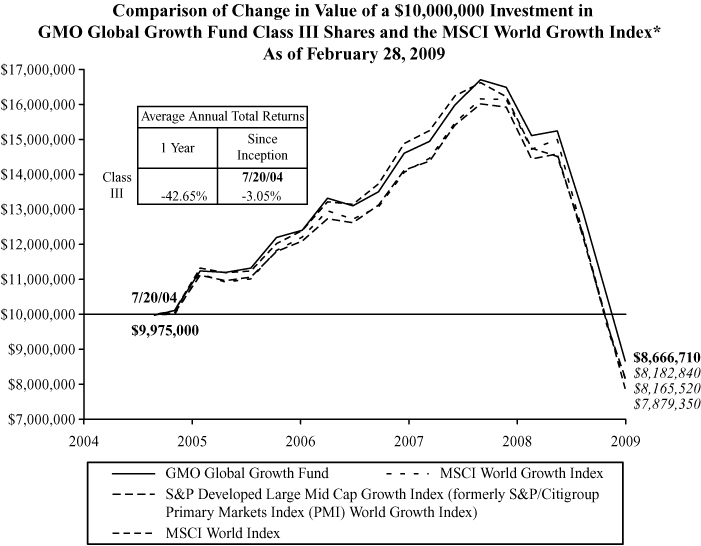
Performance data quoted represents past performance and is not indicative of future results. The investment return and principal value of an investment will fluctuate so that an investor's shares, when redeemed, may be worth more or less than their original cost. Current performance data may be lower or higher than the performance data provided herein. To obtain performance information to the most recent month-end, visit www.gmo.com. Performance shown is net of all fees after reimbursement from the Manager. Each performance figure assumes a purchase at the beginning and redemption at the end of the stated period and reflects a transaction fee of .25% on the purchase and .25% on the redemption. Transaction fees are retained by the Fund to cover trading costs. Returns would have been lower had certain expenses not been reimbursed during the periods shown and do not include the effect of taxes on distributions and redemptions. All information is unaudited.
* Effective January 1, 2009, the benchmark for the Global Growth Fund was changed from the S&P Developed Large Mid Cap Growth Index to the MSCI World Growth Index.This change was applicable retroactively as well as going forward.
GMO Global Growth Fund
(A Series of GMO Trust)
Investments Concentration Summary
February 28, 2009 (Unaudited)
| Asset Class Summary | % of Total Net Assets | ||||||
| Common Stocks | 100.1 | % | |||||
| Short-Term Investments | 1.7 | ||||||
| Forward Currency Contracts | (0.6 | ) | |||||
| Other | (1.2 | ) | |||||
| 100.0 | % | ||||||
| Country Summary | % of Equity Investments | ||||||
| United States | 59.0 | % | |||||
| United Kingdom | 11.6 | ||||||
| Japan | 8.3 | ||||||
| France | 4.7 | ||||||
| Canada | 4.6 | ||||||
| Switzerland | 4.3 | ||||||
| Germany | 2.5 | ||||||
| Singapore | 1.2 | ||||||
| Hong Kong | 0.8 | ||||||
| Denmark | 0.7 | ||||||
| Italy | 0.7 | ||||||
| Australia | 0.6 | ||||||
| Netherlands | 0.5 | ||||||
| Norway | 0.3 | ||||||
| Finland | 0.1 | ||||||
| Spain | 0.1 | ||||||
| 100.0 | % | ||||||
| Industry Sector Summary | % of Equity Investments | ||||||
| Health Care | 21.0 | % | |||||
| Consumer Staples | 15.6 | ||||||
| Information Technology | 14.5 | ||||||
| Energy | 11.5 | ||||||
| Industrials | 10.0 | ||||||
| Consumer Discretionary | 9.2 | ||||||
| Materials | 6.7 | ||||||
| Financials | 6.2 | ||||||
| Utilities | 2.7 | ||||||
| Telecommunication Services | 2.6 | ||||||
| 100.0 | % | ||||||
1
GMO Global Growth Fund
(A Series of GMO Trust)
Schedule of Investments
(showing percentage of total net assets)
February 28, 2009
| Shares | Description | Value ($) | |||||||||
| COMMON STOCKS — 100.1% | |||||||||||
| Australia — 0.6% | |||||||||||
| 799 | CSL Ltd | 18,478 | |||||||||
| 938 | Woodside Petroleum Ltd | 21,348 | |||||||||
| Total Australia | 39,826 | ||||||||||
| Canada — 4.6% | |||||||||||
| 200 | Agnico-Eagle Mines Ltd | 10,053 | |||||||||
| 600 | Agrium Inc | 20,832 | |||||||||
| 900 | Bank of Nova Scotia | 20,311 | |||||||||
| 700 | Canadian National Railway Co | 22,482 | |||||||||
| 600 | Canadian Natural Resources | 19,289 | |||||||||
| 600 | Canadian Pacific Railway Ltd | 16,979 | |||||||||
| 900 | EnCana Corp | 35,513 | |||||||||
| 1,000 | Husky Energy Inc | 21,380 | |||||||||
| 300 | Imperial Oil Ltd | 9,371 | |||||||||
| 900 | Petro-Canada | 19,865 | |||||||||
| 700 | Potash Corp of Saskatchewan Inc | 58,753 | |||||||||
| 800 | Research In Motion Ltd * | 31,970 | |||||||||
| 700 | Suncor Energy Inc | 14,559 | |||||||||
| 1,400 | Talisman Energy Inc | 13,151 | |||||||||
| Total Canada | 314,508 | ||||||||||
| Denmark — 0.7% | |||||||||||
| 671 | Novo-Nordisk A/S Class B | 32,673 | |||||||||
| 375 | Vestas Wind Systems A/S * | 16,329 | |||||||||
| Total Denmark | 49,002 | ||||||||||
| Finland — 0.1% | |||||||||||
| 201 | Fortum Oyj | 3,452 | |||||||||
| France — 4.7% | |||||||||||
| 1,279 | ArcelorMittal | 24,514 | |||||||||
| 1,148 | BNP Paribas | 37,178 | |||||||||
See accompanying notes to the financial statements.
2
GMO Global Growth Fund
(A Series of GMO Trust)
Schedule of Investments — (Continued)
(showing percentage of total net assets)
February 28, 2009
| Shares | Description | Value ($) | |||||||||
| France — continued | |||||||||||
| 925 | Electricite de France | 35,847 | |||||||||
| 282 | GDF Suez | 8,906 | |||||||||
| 341 | Pernod-Ricard SA | 18,568 | |||||||||
| 937 | Peugeot SA | 15,944 | |||||||||
| 1,952 | Sanofi-Aventis | 100,327 | |||||||||
| 890 | Societe Generale | 27,588 | |||||||||
| 869 | Total SA | 40,827 | |||||||||
| 147 | Vallourec SA | 11,442 | |||||||||
| Total France | 321,141 | ||||||||||
| Germany — 2.5% | |||||||||||
| 3,109 | Deutsche Telekom AG (Registered) | 37,597 | |||||||||
| 1,226 | E.ON AG | 31,526 | |||||||||
| 832 | K&S AG | 37,035 | |||||||||
| 300 | Linde AG | 19,279 | |||||||||
| 145 | RWE AG | 9,223 | |||||||||
| 1,114 | SAP AG | 35,787 | |||||||||
| Total Germany | 170,447 | ||||||||||
| Hong Kong — 0.8% | |||||||||||
| 2,000 | CLP Holdings Ltd | 14,785 | |||||||||
| 3,000 | Esprit Holdings Ltd | 16,156 | |||||||||
| 200 | Hang Seng Bank Ltd | 2,213 | |||||||||
| 14,800 | Hong Kong & China Gas | 22,319 | |||||||||
| Total Hong Kong | 55,473 | ||||||||||
| Italy — 0.7% | |||||||||||
| 2,220 | ENI SPA | 44,310 | |||||||||
| Japan — 8.3% | |||||||||||
| 300 | Astellas Pharma Inc | 9,955 | |||||||||
| 500 | Daiichi Sankyo Co Ltd | 8,033 | |||||||||
| 400 | Fast Retailing Co Ltd | 40,180 | |||||||||
| 4,000 | Hitachi Ltd | 9,961 | |||||||||
See accompanying notes to the financial statements.
3
GMO Global Growth Fund
(A Series of GMO Trust)
Schedule of Investments — (Continued)
(showing percentage of total net assets)
February 28, 2009
| Shares | Description | Value ($) | |||||||||
| Japan — continued | |||||||||||
| 2,800 | Honda Motor Co Ltd | 66,956 | |||||||||
| 4 | KDDI Corp | 20,955 | |||||||||
| 5,000 | Marubeni Corp | 15,523 | |||||||||
| 900 | Mitsubishi Corp | 11,197 | |||||||||
| 6,000 | Mitsubishi Heavy Industries Ltd | 16,800 | |||||||||
| 200 | Nintendo Co Ltd | 57,100 | |||||||||
| 3,500 | Nippon Mining Holdings Inc | 12,156 | |||||||||
| 4,000 | Nippon Oil Corp | 19,063 | |||||||||
| 2,000 | Nippon Yusen KK | 8,250 | |||||||||
| 7,700 | Nissan Motor Co | 23,506 | |||||||||
| 19 | NTT Docomo Inc | 29,599 | |||||||||
| 5,000 | Osaka Gas Co Ltd | 17,878 | |||||||||
| 1,000 | Panasonic Corp | 11,578 | |||||||||
| 2,300 | Seven & I Holdings Co Ltd | 50,972 | |||||||||
| 900 | Shin-Etsu Chemical Co Ltd | 40,069 | |||||||||
| 700 | SoftBank Corp | 8,470 | |||||||||
| 1,000 | SUMCO Corp | 12,390 | |||||||||
| 8,000 | Sumitomo Metal Industries Ltd | 14,986 | |||||||||
| 500 | Takeda Pharmaceutical Co Ltd | 20,195 | |||||||||
| 600 | Tokio Marine Holdings Inc | 13,627 | |||||||||
| 400 | Tokyo Electric Power Co Inc (The) | 11,292 | |||||||||
| 1,000 | TonenGeneral Sekiyu KK | 9,449 | |||||||||
| Total Japan | 560,140 | ||||||||||
| Netherlands — 0.5% | |||||||||||
| 3,394 | ING Groep NV | 15,342 | |||||||||
| 900 | Unilever NV | 17,245 | |||||||||
| Total Netherlands | 32,587 | ||||||||||
| Norway — 0.4% | |||||||||||
| 1,438 | StatoilHydro ASA | 23,875 | |||||||||
See accompanying notes to the financial statements.
4
GMO Global Growth Fund
(A Series of GMO Trust)
Schedule of Investments — (Continued)
(showing percentage of total net assets)
February 28, 2009
| Shares | Description | Value ($) | |||||||||
| Singapore — 1.2% | |||||||||||
| 2,800 | Singapore Airlines Ltd | 18,244 | |||||||||
| 15,000 | Singapore Technologies Engineering Ltd | 22,158 | |||||||||
| 26,320 | Singapore Telecommunications | 41,423 | |||||||||
| Total Singapore | 81,825 | ||||||||||
| Spain — 0.1% | |||||||||||
| 426 | Gas Natural SDG SA | 7,637 | |||||||||
| Switzerland — 4.3% | |||||||||||
| 1,878 | ABB Ltd * | 22,670 | |||||||||
| 500 | Alcon Inc | 41,180 | |||||||||
| 1,173 | Nestle SA (Registered) | 38,346 | |||||||||
| 2,512 | Novartis AG (Registered) | 91,646 | |||||||||
| 198 | Roche Holding AG (Non Voting) | 22,476 | |||||||||
| 115 | Syngenta AG (Registered) | 24,584 | |||||||||
| 5,371 | UBS AG (Registered) * | 50,294 | |||||||||
| Total Switzerland | 291,196 | ||||||||||
| United Kingdom — 11.6% | |||||||||||
| 2,932 | AstraZeneca Plc | 92,979 | |||||||||
| 8,024 | BAE Systems Plc | 42,362 | |||||||||
| 16,782 | Barclays Plc | 22,017 | |||||||||
| 5,270 | BG Group Plc | 75,331 | |||||||||
| 1,021 | BHP Billiton Plc | 15,912 | |||||||||
| 10,684 | BP Plc | 68,065 | |||||||||
| 2,468 | British American Tobacco Plc | 63,083 | |||||||||
| 5,402 | Centrica Plc | 20,775 | |||||||||
| 4,597 | GlaxoSmithKline Plc | 69,722 | |||||||||
| 1,960 | HSBC Holdings Plc | 13,632 | |||||||||
| 1,191 | Imperial Tobacco Group Plc | 28,515 | |||||||||
| 2,703 | Lloyds Banking Group Plc | 2,219 | |||||||||
| 1,227 | Next Plc | 20,347 | |||||||||
| 25,270 | Old Mutual Plc | 14,850 | |||||||||
| 1,332 | Reckitt Benckiser Group Plc | 50,970 | |||||||||
See accompanying notes to the financial statements.
5
GMO Global Growth Fund
(A Series of GMO Trust)
Schedule of Investments — (Continued)
(showing percentage of total net assets)
February 28, 2009
| Shares | Description | Value ($) | |||||||||
| United Kingdom — continued | |||||||||||
| 4,130 | Reed Elsevier Plc | 30,853 | |||||||||
| 749 | Rio Tinto Plc | 19,120 | |||||||||
| 35,586 | Royal Bank of Scotland Group Plc | 11,590 | |||||||||
| 1,921 | Royal Dutch Shell Plc A Shares (London) | 42,174 | |||||||||
| 1,183 | Unilever Plc | 22,853 | |||||||||
| 23,640 | Vodafone Group Plc | 41,888 | |||||||||
| 1,835 | Xstrata Plc | 18,078 | |||||||||
| Total United Kingdom | 787,335 | ||||||||||
| United States — 59.0% | |||||||||||
| 1,800 | 3M Co. | 81,828 | |||||||||
| 2,600 | Abbott Laboratories | 123,084 | |||||||||
| 1,100 | Accenture Ltd.-Class A | 32,109 | |||||||||
| 300 | ACE Ltd. | 10,953 | |||||||||
| 1,000 | Adobe Systems, Inc. * | 16,700 | |||||||||
| 800 | Aflac, Inc. | 13,408 | |||||||||
| 900 | Altera Corp. | 13,797 | |||||||||
| 200 | Amazon.com, Inc. * | 12,958 | |||||||||
| 1,100 | Amgen, Inc. * | 53,823 | |||||||||
| 600 | Anadarko Petroleum Corp. | 20,970 | |||||||||
| 400 | Aon Corp. | 15,296 | |||||||||
| 200 | Apache Corp. | 11,818 | |||||||||
| 300 | Apollo Group, Inc.-Class A * | 21,750 | |||||||||
| 700 | Archer-Daniels-Midland Co. | 18,662 | |||||||||
| 600 | Assurant, Inc. | 12,240 | |||||||||
| 1,700 | Automatic Data Processing, Inc. | 58,055 | |||||||||
| 100 | AutoZone, Inc. * | 14,223 | |||||||||
| 500 | Avon Products, Inc. | 8,795 | |||||||||
| 300 | Bard (C.R.), Inc. | 24,078 | |||||||||
| 1,400 | Baxter International, Inc. | 71,274 | |||||||||
| 700 | Becton, Dickinson & Co. | 43,323 | |||||||||
| 100 | BlackRock, Inc. | 9,681 | |||||||||
| 700 | Broadcom Corp.-Class A * | 11,515 | |||||||||
| 400 | Burlington Northern Santa Fe Corp. | 23,508 | |||||||||
See accompanying notes to the financial statements.
6
GMO Global Growth Fund
(A Series of GMO Trust)
Schedule of Investments — (Continued)
(showing percentage of total net assets)
February 28, 2009
| Shares | Description | Value ($) | |||||||||
| United States — continued | |||||||||||
| 1,100 | CA, Inc. | 18,645 | |||||||||
| 500 | Cardinal Health, Inc. | 16,225 | |||||||||
| 500 | CH Robinson Worldwide, Inc. | 20,690 | |||||||||
| 1,400 | Charles Schwab Corp. (The) | 17,794 | |||||||||
| 500 | Chevron Corp. | 30,355 | |||||||||
| 200 | Clorox Co. | 9,720 | |||||||||
| 900 | Coach, Inc. * | 12,582 | |||||||||
| 1,800 | Coca-Cola Co. (The) | 73,530 | |||||||||
| 700 | Cognizant Technology Solutions Corp.-Class A * | 12,880 | |||||||||
| 600 | Colgate-Palmolive Co. | 36,108 | |||||||||
| 800 | Comcast Corp.-Class A | 10,448 | |||||||||
| 300 | ConocoPhillips | 11,205 | |||||||||
| 1,700 | Corning, Inc. | 17,935 | |||||||||
| 400 | Covidien Ltd. | 12,668 | |||||||||
| 500 | CSX Corp. | 12,340 | |||||||||
| 1,000 | Dell, Inc. * | 8,530 | |||||||||
| 400 | Devon Energy Corp. | 17,468 | |||||||||
| 200 | Diamond Offshore Drilling, Inc. | 12,528 | |||||||||
| 1,000 | DirecTV Group (The), Inc. * | 19,940 | |||||||||
| 500 | Dollar Tree, Inc. * | 19,410 | |||||||||
| 800 | Ecolab, Inc. | 25,424 | |||||||||
| 400 | EOG Resources, Inc. | 20,016 | |||||||||
| 700 | Equity Residential REIT | 12,320 | |||||||||
| 700 | Expeditors International of Washington, Inc. | 19,285 | |||||||||
| 300 | Express Scripts, Inc. * | 15,090 | |||||||||
| 400 | Family Dollar Stores, Inc. | 10,976 | |||||||||
| 300 | Fastenal Co. | 9,036 | |||||||||
| 200 | First Solar, Inc. * | 21,148 | |||||||||
| 900 | FLIR Systems, Inc. * | 18,369 | |||||||||
| 1,000 | Forest Laboratories, Inc. * | 21,440 | |||||||||
| 900 | Gap (The), Inc. | 9,711 | |||||||||
| 200 | Genentech, Inc. * | 17,110 | |||||||||
| 1,100 | General Dynamics Corp. | 48,202 | |||||||||
| 200 | General Mills, Inc. | 10,496 | |||||||||
See accompanying notes to the financial statements.
7
GMO Global Growth Fund
(A Series of GMO Trust)
Schedule of Investments — (Continued)
(showing percentage of total net assets)
February 28, 2009
| Shares | Description | Value ($) | |||||||||
| United States — continued | |||||||||||
| 1,000 | Gilead Sciences, Inc. * | 44,800 | |||||||||
| 300 | Google, Inc.-Class A * | 101,397 | |||||||||
| 1,000 | Halliburton Co. | 16,310 | |||||||||
| 500 | Health Care REIT, Inc. | 15,385 | |||||||||
| 400 | Hess Corp. | 21,876 | |||||||||
| 2,100 | Hewlett-Packard Co. | 60,963 | |||||||||
| 1,200 | Hudson City Bancorp, Inc. | 12,444 | |||||||||
| 700 | Illinois Tool Works, Inc. | 19,460 | |||||||||
| 1,700 | International Business Machines Corp. | 156,451 | |||||||||
| 900 | Intuit, Inc. * | 20,511 | |||||||||
| 100 | ITT Educational Services, Inc. * | 11,350 | |||||||||
| 5,900 | Johnson & Johnson | 295,000 | |||||||||
| 1,100 | Juniper Networks, Inc. * | 15,631 | |||||||||
| 500 | Kellogg Co. | 19,460 | |||||||||
| 900 | Kroger Co. (The) | 18,603 | |||||||||
| 400 | Linear Technology Corp. | 8,720 | |||||||||
| 300 | Lockheed Martin Corp. | 18,933 | |||||||||
| 1,000 | Marsh & McLennan Cos., Inc. | 17,930 | |||||||||
| 200 | MasterCard, Inc.-Class A | 31,606 | |||||||||
| 800 | Mattel, Inc. | 9,472 | |||||||||
| 300 | McAfee, Inc. * | 8,385 | |||||||||
| 2,200 | McDonald's Corp. | 114,950 | |||||||||
| 700 | McGraw-Hill Cos. (The), Inc. | 13,811 | |||||||||
| 700 | Medco Health Solutions, Inc. * | 28,406 | |||||||||
| 1,700 | Medtronic, Inc. | 50,303 | |||||||||
| 1,700 | Merck & Co., Inc. | 41,140 | |||||||||
| 3,000 | Microsoft Corp. | 48,450 | |||||||||
| 800 | Monsanto Co. | 61,016 | |||||||||
| 500 | Mosaic Co. (The) | 21,525 | |||||||||
| 500 | National Oilwell Varco, Inc. * | 13,365 | |||||||||
| 1,100 | Nike, Inc.-Class B | 45,683 | |||||||||
| 200 | Noble Energy, Inc. | 9,108 | |||||||||
| 600 | Norfolk Southern Corp. | 19,032 | |||||||||
| 300 | Northern Trust Corp. | 16,665 | |||||||||
See accompanying notes to the financial statements.
8
GMO Global Growth Fund
(A Series of GMO Trust)
Schedule of Investments — (Continued)
(showing percentage of total net assets)
February 28, 2009
| Shares | Description | Value ($) | |||||||||
| United States — continued | |||||||||||
| 300 | Nucor Corp. | 10,095 | |||||||||
| 500 | Occidental Petroleum Corp. | 25,935 | |||||||||
| 1,900 | Oracle Corp. * | 29,526 | |||||||||
| 1,500 | Paychex, Inc. | 33,090 | |||||||||
| 3,800 | PepsiCo, Inc. | 182,932 | |||||||||
| 300 | Praxair, Inc. | 17,025 | |||||||||
| 200 | Priceline.com Inc. * | 16,972 | |||||||||
| 1,300 | Procter & Gamble Co. (The) | 62,621 | |||||||||
| 300 | Public Storage REIT | 16,644 | |||||||||
| 1,400 | Qualcomm, Inc. | 46,802 | |||||||||
| 200 | Raytheon Co. | 7,994 | |||||||||
| 400 | Rockwell Collins, Inc. | 12,480 | |||||||||
| 400 | Ross Stores, Inc. | 11,808 | |||||||||
| 600 | Schering-Plough Corp. | 10,434 | |||||||||
| 400 | Schlumberger Ltd. | 15,224 | |||||||||
| 200 | Sherwin-Williams Co. (The) | 9,190 | |||||||||
| 400 | Sigma-Aldrich Corp. | 14,280 | |||||||||
| 800 | Southwestern Energy Co. * | 23,016 | |||||||||
| 400 | St. Jude Medical, Inc. * | 13,264 | |||||||||
| 800 | State Street Corp. | 20,216 | |||||||||
| 1,100 | Stryker Corp. | 37,037 | |||||||||
| 300 | Sunoco, Inc. | 10,035 | |||||||||
| 1,200 | Symantec Corp. * | 16,596 | |||||||||
| 1,900 | Sysco Corp. | 40,850 | |||||||||
| 800 | TJX Cos. (The), Inc. | 17,816 | |||||||||
| 1,400 | Tyco Electronics Ltd. | 13,272 | |||||||||
| 700 | Union Pacific Corp. | 26,264 | |||||||||
| 1,000 | United Parcel Service, Inc.-Class B | 41,180 | |||||||||
| 1,400 | United Technologies Corp. | 57,162 | |||||||||
| 300 | VF Corp. | 15,570 | |||||||||
| 200 | W.W. Grainger, Inc. | 13,232 | |||||||||
| 5,800 | Wal-Mart Stores, Inc. | 285,592 | |||||||||
| 1,300 | Weatherford International Ltd. * | 13,871 | |||||||||
| 1,400 | Western Union Co. | 15,624 | |||||||||
See accompanying notes to the financial statements.
9
GMO Global Growth Fund
(A Series of GMO Trust)
Schedule of Investments — (Continued)
(showing percentage of total net assets)
February 28, 2009
| Shares / Par Value ($) | Description | Value ($) | |||||||||
| United States — continued | |||||||||||
| 1,000 | Xilinx, Inc. | 17,680 | |||||||||
| 500 | XTO Energy, Inc. | 15,830 | |||||||||
| Total United States | 3,998,772 | ||||||||||
| TOTAL COMMON STOCKS (COST $10,563,014) | 6,781,526 | ||||||||||
| SHORT-TERM INVESTMENTS — 1.7% | |||||||||||
| 4,254 | Brown Brothers Harriman Time Deposit, 0.01%-2.29%, due 03/02/09 | 4,254 | |||||||||
| 112,367 | Citibank Time Deposit, 0.08%, due 03/02/09 | 112,367 | |||||||||
| TOTAL SHORT-TERM INVESTMENTS (COST $116,621) | 116,621 | ||||||||||
| TOTAL INVESTMENTS — 101.8% (Cost $10,679,635) | 6,898,147 | ||||||||||
| Other Assets and Liabilities (net) — (1.8%) | (123,061 | ) | |||||||||
| TOTAL NET ASSETS — 100.0% | $ | 6,775,086 | |||||||||
See accompanying notes to the financial statements.
10
GMO Global Growth Fund
(A Series of GMO Trust)
Schedule of Investments — (Continued)
February 28, 2009
A summary of outstanding financial instruments at February 28, 2009 is as follows:
Forward Currency Contracts
| Settlement Date | Deliver/Receive | Units of Currency | Value | Net Unrealized Appreciation (Depreciation) | |||||||||||||||
| Buys | |||||||||||||||||||
| 4/24/09 | CHF | 214,729 | $ | 183,759 | $ | (1,685 | ) | ||||||||||||
| 4/24/09 | CHF | 89,963 | 76,988 | 128 | |||||||||||||||
| 4/24/09 | CHF | 87,317 | 74,724 | 203 | |||||||||||||||
| 4/24/09 | CHF | 87,317 | 74,724 | 426 | |||||||||||||||
| 4/24/09 | EUR | 131,654 | 166,861 | 1,034 | |||||||||||||||
| 4/24/09 | GBP | 30,519 | 43,686 | (530 | ) | ||||||||||||||
| 4/24/09 | JPY | 18,413,646 | 188,881 | (11,456 | ) | ||||||||||||||
| 4/24/09 | JPY | 17,872,068 | 183,325 | (11,274 | ) | ||||||||||||||
| 4/24/09 | JPY | 17,872,068 | 183,325 | (11,183 | ) | ||||||||||||||
| 4/24/09 | NOK | 166,473 | 23,639 | (1,231 | ) | ||||||||||||||
| 4/24/09 | NZD | 20,901 | 10,431 | (176 | ) | ||||||||||||||
| 4/24/09 | SEK | 973,865 | 108,119 | (3,316 | ) | ||||||||||||||
| 4/24/09 | SEK | 973,865 | 108,119 | (2,248 | ) | ||||||||||||||
| 4/24/09 | SGD | 57,791 | 37,326 | (531 | ) | ||||||||||||||
| $ | 1,463,907 | $ | (41,839 | ) | |||||||||||||||
| Sales | |||||||||||||||||||
| 4/24/09 | AUD | 55,003 | $ | 35,042 | $ | (105 | ) | ||||||||||||
| 4/24/09 | CAD | 44,760 | 35,186 | 251 | |||||||||||||||
| 4/24/09 | DKK | 186,761 | 31,722 | (301 | ) | ||||||||||||||
| 4/24/09 | DKK | 133,793 | 22,726 | 273 | |||||||||||||||
| 4/24/09 | EUR | 245,025 | 310,550 | 3,765 | |||||||||||||||
| 4/24/09 | GBP | 77,446 | 110,860 | (712 | ) | ||||||||||||||
| 4/24/09 | GBP | 116,168 | 166,289 | (613 | ) | ||||||||||||||
| 4/24/09 | HKD | 78,969 | 10,187 | 2 | |||||||||||||||
| 4/24/09 | NOK | 257,129 | 36,512 | (37 | ) | ||||||||||||||
| 4/24/09 | SGD | 49,856 | 32,201 | 914 | |||||||||||||||
| $ | 791,275 | $ | 3,437 | ||||||||||||||||
See accompanying notes to the financial statements.
11
GMO Global Growth Fund
(A Series of GMO Trust)
Schedule of Investments — (Continued)
February 28, 2009
Notes to Schedule of Investments:
REIT - Real Estate Investment Trust
* Non-income producing security.
Currency Abbreviations:
AUD - Australian Dollar
CAD - Canadian Dollar
CHF - Swiss Franc
DKK - Danish Krone
EUR - Euro
GBP - British Pound
HKD - Hong Kong Dollar
JPY - Japanese Yen
NOK - Norwegian Krone
NZD - New Zealand Dollar
SEK - Swedish Krona
SGD - Singapore Dollar
See accompanying notes to the financial statements.
12
GMO Global Growth Fund
(A Series of GMO Trust)
Statement of Assets and Liabilities — February 28, 2009
| Assets: | |||||||
| Investments, at value (cost $10,679,635) (Note 2) | $ | 6,898,147 | |||||
| Foreign currency, at value (cost $316) (Note 2) | 295 | ||||||
| Dividends receivable | 21,726 | ||||||
| Foreign taxes receivable | 4,386 | ||||||
| Unrealized appreciation on open forward currency contracts (Note 2) | 6,996 | ||||||
| Receivable for expenses reimbursed by Manager (Note 3) | 18,831 | ||||||
| Total assets | 6,950,381 | ||||||
| Liabilities: | |||||||
| Payable to affiliate for (Note 3): | |||||||
| Management fee | 2,544 | ||||||
| Shareholder service fee | 848 | ||||||
| Trustees and Chief Compliance Officer of GMO Trust fees | 81 | ||||||
| Unrealized depreciation on open forward currency contracts (Note 2) | 45,398 | ||||||
| Miscellaneous payable | 2,239 | ||||||
| Accrued expenses | 124,185 | ||||||
| Total liabilities | 175,295 | ||||||
| Net assets | $ | 6,775,086 | |||||
| Net assets consist of: | |||||||
| Paid-in capital | $ | 16,244,089 | |||||
| Accumulated undistributed net investment income | 62,510 | ||||||
| Distributions in excess of net realized gain | (5,711,291 | ) | |||||
| Net unrealized depreciation | (3,820,222 | ) | |||||
| $ | 6,775,086 | ||||||
| Net assets attributable to: | |||||||
| Class III shares | $ | 6,775,086 | |||||
| Shares outstanding: | |||||||
| Class III | 519,848 | ||||||
| Net asset value per share: | |||||||
| Class III | $ | 13.03 | |||||
See accompanying notes to the financial statements.
13
GMO Global Growth Fund
(A Series of GMO Trust)
Statement of Operations — Year Ended February 28, 2009
| Investment Income: | |||||||
| Dividends (net of withholding taxes of $41,910) | $ | 630,751 | |||||
| Securities lending income | 8,755 | ||||||
| Interest | 8,488 | ||||||
| Total investment income | 647,994 | ||||||
| Expenses: | |||||||
| Management fee (Note 3) | 108,471 | ||||||
| Shareholder service fee – Class III (Note 3) | 35,366 | ||||||
| Custodian and fund accounting agent fees | 163,463 | ||||||
| Transfer agent fees | 27,399 | ||||||
| Audit and tax fees | 81,761 | ||||||
| Legal fees | 581 | ||||||
| Trustees fees and related expenses (Note 3) | 305 | ||||||
| Registration fees | 2,304 | ||||||
| Miscellaneous | 3,663 | ||||||
| Total expenses | 423,313 | ||||||
| Fees and expenses reimbursed by Manager (Note 3) | (279,052 | ) | |||||
| Expense reductions (Note 2) | (2,832 | ) | |||||
| Net expenses | 141,429 | ||||||
| Net investment income (loss) | 506,565 | ||||||
| Realized and unrealized gain (loss): | |||||||
| Net realized gain (loss) on: | |||||||
| Investments | (5,540,402 | ) | |||||
| Closed futures contracts | (42,652 | ) | |||||
| Foreign currency, forward contracts and foreign currency related transactions | (547 | ) | |||||
| Net realized gain (loss) | (5,583,601 | ) | |||||
| Change in net unrealized appreciation (depreciation) on: | |||||||
| Investments | (3,110,559 | ) | |||||
| Foreign currency, forward contracts and foreign currency related transactions | (118,686 | ) | |||||
| Net unrealized gain (loss) | (3,229,245 | ) | |||||
| Net realized and unrealized gain (loss) | (8,812,846 | ) | |||||
| Net increase (decrease) in net assets resulting from operations | $ | (8,306,281 | ) | ||||
See accompanying notes to the financial statements.
14
GMO Global Growth Fund
(A Series of GMO Trust)
Statement of Changes in Net Assets
| Year Ended February 28, 2009 | Year Ended February 29, 2008 | ||||||||||
| Increase (decrease) in net assets: | |||||||||||
| Operations: | |||||||||||
| Net investment income (loss) | $ | 506,565 | $ | 267,831 | |||||||
| Net realized gain (loss) | (5,583,601 | ) | 10,165,594 | ||||||||
| Change in net unrealized appreciation (depreciation) | (3,229,245 | ) | (12,289,738 | ) | |||||||
| Net increase (decrease) in net assets from operations | (8,306,281 | ) | (1,856,313 | ) | |||||||
| Distributions to shareholders from: | |||||||||||
| Net investment income | |||||||||||
| Class III | (354,277 | ) | (576,031 | ) | |||||||
| Net realized gains | |||||||||||
| Class III | (238,054 | ) | (1,987,132 | ) | |||||||
| (592,331 | ) | (2,563,163 | ) | ||||||||
| Net share transactions (Note 7): | |||||||||||
| Class III | (18,893,652 | ) | (31,353,712 | ) | |||||||
| Purchase premiums and redemption fees (Notes 2 and 7): | |||||||||||
| Class III | 48,776 | 67,093 | |||||||||
| Total increase (decrease) in net assets resulting from net share transactions, purchase premiums and redemption fees | (18,844,876 | ) | (31,286,619 | ) | |||||||
| Total increase (decrease) in net assets | (27,743,488 | ) | (35,706,095 | ) | |||||||
| Net assets: | |||||||||||
| Beginning of period | 34,518,574 | 70,224,669 | |||||||||
| End of period (including accumulated undistributed net investment income of $62,510 and distributions in excess of net investment income of $89,207, respectively) | $ | 6,775,086 | $ | 34,518,574 | |||||||
See accompanying notes to the financial statements.
15
GMO Global Growth Fund
(A Series of GMO Trust)
Financial Highlights
(For a Class III share outstanding throughout each period)
| Year Ended February 28/29, | |||||||||||||||||||||||
| 2009 | 2008 | 2007 | 2006 | 2005(a) | |||||||||||||||||||
| Net asset value, beginning of period | $ | 23.82 | $ | 24.59 | $ | 25.13 | $ | 22.67 | $ | 20.00 | |||||||||||||
| Income (loss) from investment operations: | |||||||||||||||||||||||
| Net investment income (loss)† | 0.48 | 0.40 | 0.31 | 0.33 | 0.15 | ||||||||||||||||||
| Net realized and unrealized gain (loss) | (10.40 | ) | 0.45 | (b) | 2.56 | 2.72 | 2.79 | ||||||||||||||||
| Total from investment operations | (9.92 | ) | 0.85 | 2.87 | 3.05 | 2.94 | |||||||||||||||||
| Less distributions to shareholders: | |||||||||||||||||||||||
| From net investment income | (0.70 | ) | (0.49 | ) | (0.17 | ) | (0.10 | ) | (0.27 | ) | |||||||||||||
| From net realized gains | (0.17 | ) | (1.13 | ) | (3.24 | ) | (0.49 | ) | — | ||||||||||||||
| Total distributions | (0.87 | ) | (1.62 | ) | (3.41 | ) | (0.59 | ) | (0.27 | ) | |||||||||||||
| Net asset value, end of period | $ | 13.03 | $ | 23.82 | $ | 24.59 | $ | 25.13 | $ | 22.67 | |||||||||||||
| Total Return(c) | (42.36 | )% | 3.10 | % | 12.45 | % | 13.61 | % | 14.72 | %** | |||||||||||||
| Ratios/Supplemental Data: | |||||||||||||||||||||||
| Net assets, end of period (000's) | $ | 6,775 | $ | 34,519 | $ | 70,225 | $ | 52,195 | $ | 57,960 | |||||||||||||
| Net expenses to average daily net assets | 0.61 | %(d) | 0.62 | %(d) | 0.62 | % | 0.62 | % | 0.62 | %* | |||||||||||||
| Net investment income to average daily net assets | 2.15 | % | 1.58 | % | 1.27 | % | 1.40 | % | 1.17 | %* | |||||||||||||
| Portfolio turnover rate | 58 | % | 158 | % | 43 | % | 53 | % | 40 | %** | |||||||||||||
| Fees and expenses reimbursed by the Manager to average daily net assets: | 1.18 | % | 1.37 | % | 0.37 | % | 0.34 | % | 0.51 | %* | |||||||||||||
| Purchase premiums and redemption fees consisted of the following per share amounts:† | $ | 0.05 | $ | 0.10 | $ | 0.01 | $ | 0.02 | — | (e) | |||||||||||||
(a) Period from July 20, 2004 (commencement of operations) through February 28, 2005.
(b) The amount shown for a share outstanding does not correspond with the aggregate net realized and unrealized gain (loss) on investments due to the timing of purchases and redemptions of Fund shares in relation to fluctuating market values of the investments of the Fund.
(c) The total returns would have been lower had certain expenses not been reimbursed during the periods shown and assumes the effect of reinvested distributions. Calculation excludes purchase premiums and redemption fees which are borne by the shareholder.
(d) The net expense ratio does not include the effect of expense reductions, except for reimbursements related to securities lending transactions (Note 2).
(e) For the period ended February 28, 2005, the Fund received no purchase premiums or redemption fees.
† Calculated using average shares outstanding throughout the period.
* Annualized.
** Not annualized.
See accompanying notes to the financial statements.
16
GMO Global Growth Fund
(A Series of GMO Trust)
Notes to Financial Statements
February 28, 2009
1. Organization
GMO Global Growth Fund (the "Fund") is a series of GMO Trust (the "Trust"). The Fund is registered under the Investment Company Act of 1940, as amended, as an open-end, non-diversified management investment company. The Fund is advised and managed by Grantham, Mayo, Van Otterloo & Co. LLC (the "Manager" or "GMO"). The Trust was established as a Massachusetts business trust under the laws of The Commonwealth of Massachusetts on June 24, 1985. The Declaration of Trust permits the Trustees of the Trust ("Trustees") to create an unlimited number of series of shares ("Funds") and to subdivide Funds into classes.
The Fund seeks high total return. The Fund seeks to achieve its objective by outperforming the Morgan Stanley Capital International ("MSCI") World Growth Index. The Fund typically makes equity investments in companies from the world's developed countries, including the U.S. Effective January 1, 2009, the Fund changed its benchmark from the S&P Developed Large Mid Cap Growth Index (formerly S&P/Citigroup Primary Markets Index (PMI) World Growth Index) to the MSCI World Growth Index to better reflect a more appropriate, comparative, broad-based market index for the Fund.
2. Significant accounting policies
The following is a summary of significant accounting policies followed by the Fund in the preparation of its financial statements. These policies are in conformity with accounting principles generally accepted in the United States of America ("U.S. GAAP") and have been consistently followed by the Fund in preparing its financial statements. The preparation of financial statements in accordance with U.S. GAAP requires management to make estimates and assumptions that affect the reported amounts and disclosures in the financial statements. Actual results could differ from those estimates. The accounting records of the Fund are maintained in U.S. dollars.
Portfolio valuation
Securities listed on a securities exchange for which market quotations are readily available are valued at the last sale price or official closing price on each business day, or if there is no such reported sale or official closing price, at the most recent quoted bid price. Unlisted securities for which market quotations are readily available are generally valued at the most recent quoted bid price. Debt instruments with a remaining maturity of sixty days or less are generally valued at amortized cost, which approximates fair value. Shares of investment funds are generally valued at their net asset value. Securities for which quotations are not readily available or whose values the Manager has determined to be unreliable are valued at fair value as determined in good faith by the Trustees or persons acting at their direction pursuant to procedures approved by the Trustees. By its nature, a fair value price is a good faith estim ate of the value of a security at a given point in time and may not reflect the value that would be realized if the security were sold. The difference between a fair value price and the value realized upon a sale could be material. Because many foreign equity securities markets and exchanges close prior to the close of the
17
GMO Global Growth Fund
(A Series of GMO Trust)
Notes to Financial Statements — (Continued)
February 28, 2009
New York Stock Exchange ("NYSE"), closing prices for foreign securities in those markets or on those exchanges do not reflect the events that occur after that close but before the close of the NYSE. As a result, the Fund generally values foreign equity securities using fair value prices, which are based on adjustments to closing prices supplied by a third party vendor based on that vendor's proprietary models. As of February 28, 2009, 34.47% of the net assets of the Fund were valued using fair value prices based on models used by a third party vendor.
In September 2006, the Financial Accounting Standards Board ("FASB") issued Statement of Financial Accounting Standards No. 157, Fair Value Measurements ("SFAS 157"). SFAS 157 is effective for the Fund's current fiscal year. While the adoption of SFAS 157 does not have an effect on the Fund's net asset value, it does require additional disclosures about fair value measurements. SFAS 157 establishes a three-level hierarchy for disclosure of fair value measurements. The valuation hierarchy is based upon the reliability of inputs to the valuation of the Fund's investments. The three levels are defined as follows:
Level 1 – Valuations based on quoted prices for identical securities in active markets.
Level 2 – Valuations determined using other significant direct or indirect observable inputs.
Level 3 – Valuations based on inputs that are unobservable and significant.
The inputs or methodology used for valuing securities are not necessarily an indication of the risk associated with investing in those securities.
The following is a summary of the fair valuations according to inputs used as of February 28, 2009 in valuing the Fund's investments:
| Asset Valuation Inputs | Investments in Securities | Other Financial Instruments* | |||||||||
| Level 1 - Quoted Prices | $ | 4,562,727 | $ | — | |||||||
| Level 2 - Other Significant Observable Inputs | 2,335,420 | 6,996 | |||||||||
| Level 3 - Significant Unobservable Inputs | — | — | |||||||||
| Total | $ | 6,898,147 | $ | 6,996 | |||||||
* Other financial instruments include forward currency contracts.
18
GMO Global Growth Fund
(A Series of GMO Trust)
Notes to Financial Statements — (Continued)
February 28, 2009
| Liability Valuation Inputs | Investments in Securities | Other Financial Instruments** | |||||||||
| Level 1 - Quoted Prices | $ | — | $ | — | |||||||
| Level 2 - Other Significant Observable Inputs | — | (45,398 | ) | ||||||||
| Level 3 - Significant Unobservable Inputs | — | — | |||||||||
| Total | $ | — | $ | (45,398 | ) | ||||||
** Other financial instruments include forward currency contracts.
The Fund held no investments or other financial instruments at either February 29, 2008 or February 28, 2009, whose fair value was determined using Level 3 inputs.
Foreign currency translation
The market values of foreign securities, currency holdings and related assets and liabilities are translated to U.S. dollars based on the 4 p.m. New York time exchange rates each business day. Income and expenses denominated in foreign currencies are translated at the 4 p.m. New York time exchange rates on the business day the income and expenses are accrued or incurred. The Fund does not isolate realized and unrealized gains and losses attributable to changes in exchange rates from gains and losses that arise from changes in the market value of investments. Such fluctuations are included with net realized and unrealized gain or loss on investments. Net realized gains and losses on foreign currency transactions represent gains and losses on disposition of currencies and forward currency contracts, currency gains and losses realized between the trade and settlement dates on securities transactions, and the difference between the amount of investment income and foreign withholding taxes recorded on the Fund's accounting records and the U.S. dollar equivalent amounts actually received or paid.
Forward currency contracts
The Fund may enter into forward currency contracts including forward cross currency contracts. A forward currency contract is an agreement between two parties to buy and sell a currency at a set price on a future date. The market value of a forward currency contract fluctuates with changes in forward currency exchange rates. Forward currency contracts are marked to market daily using rates supplied by a quotation service and changes in value are recorded by the Fund as an unrealized gain or loss. Realized gains or losses equal to the difference between the value of the contract at the time it was opened and the value at the time it was closed are recorded upon delivery or receipt of the currency or, if a forward currency contract is offset by entering into another forward currency contract with the same broker, upon settlement of the net gain or loss. These contracts may involve market risk in excess of the unrealized gain or lo ss reflected in the Fund's Statement of Assets and Liabilities. They expose the Fund to the risk of unfavorable movements in currency values and the risk that the counterparty will be unable or unwilling to meet the terms of the contracts. Forward currency contracts outstanding at the end of the period are listed in the Fund's Schedule of Investments.
19
GMO Global Growth Fund
(A Series of GMO Trust)
Notes to Financial Statements — (Continued)
February 28, 2009
Futures contracts
The Fund may purchase and sell futures contracts. Upon entering into a futures contract, the Fund is required to deposit cash, U.S. government and agency obligations, or other liquid assets with the futures clearing broker in accordance with the initial margin requirements of the broker or exchange. In addition, the Fund maintains cash or securities in an amount that at least equals the net amount payable in the event the Fund must deliver the full amount of the contract. Futures contracts are marked to market daily and an appropriate payable or receivable for the change in value ("variation margin") is recorded by the Fund. The payable or receivable is settled on the following business day. Gains or losses are recognized but not considered realized until the contracts expire or are closed. Futures contracts involve, to varying degrees, risk of loss in excess of the variation margin disclosed in the Statement of Assets and Liabi lities. Under some circumstances, futures exchanges may establish daily limits on the amount that the price of a futures contract can vary from the previous day's settlement price, thereby effectively preventing liquidation of unfavorable positions. Losses may arise from changes in the value of the underlying instrument if the Fund is unable to liquidate a futures position due to an illiquid secondary market for the contract or the imposition of price limits, or if counterparties do not perform under the contract terms. Futures contracts are generally valued at the settlement price established each day by the board of trade or exchange on which they are traded. Because many foreign exchanges close prior to the close of the New York Stock Exchange ("NYSE"), closing prices for foreign futures in those markets or on those markets or on those exchanges do not reflect the events that occur after that close but before the close of the NYSE. As a result, the Fund generally values foreign futures using fair value pr ices, which are based on adjustments to closing prices supplied by a third party vendor based on that vendor's proprietary models. The Fund had no futures contracts outstanding at the end of the period.
Options
The Fund may write (i.e., sell) call and put options. Writing options alters the Fund's exposure to the underlying instrument by, in the case of a call option, obligating the Fund to sell the underlying instrument at a set price to the option-holder and, in the case of a put option, obligating the Fund to purchase the underlying instrument at a set price from the option-holder. In the case of an index option, settlement will be in cash. When the Fund writes a call or put option, an amount equal to the premium received is recorded as a liability and subsequently marked to market to reflect the current value of the option written. Premiums received from writing options that expire are treated as realized gains. Premiums received from writing options that are exercised or closed are deducted from the amounts paid on the underlying future, security or currency transaction to determine the realized gain or loss. The Fund as a writer of an option has no control over whether the underlying future, security or currency may be sold (call) or purchased (put) and as a result bears the market risk of an unfavorable change in the price of the future, security or currency underlying the option. In the event that the Fund writes uncovered put or call options (i.e. options for investments that the Fund does not own), it bears the risk of substantial losses if the price of the underlying instrument increases during the term of the option. Options expose the Fund to the risk the Fund may not be able to enter into a closing transaction because of an illiquid market. The Fund had no open written option contracts during the period.
20
GMO Global Growth Fund
(A Series of GMO Trust)
Notes to Financial Statements — (Continued)
February 28, 2009
The Fund may also purchase put and call options. Purchasing options alters the Fund's exposure to the underlying instrument by, in the case of a call option, entitling the Fund to purchase the underlying instrument at a set price from the writer of the option and, in the case of a put option, entitling the Fund to sell the underlying instrument at a set price to the writer of the option. The Fund pays a premium for a purchased option. That premium is disclosed in the Schedule of Investments and is subsequently marked to market to reflect the current value of the option. Premiums paid for purchasing options that expire are treated as realized losses. Premiums paid for purchasing options that are exercised or closed are deducted from the proceeds on the closing transaction to determine the realized gain or loss. The risk associated with purchasing put and call options is limited to the premium paid. The Fund had no purchased optio n contracts outstanding at the end of the period.
The Fund values exchange traded options at the last sale price, or if no sale is reported, the last bid price for options it has purchased and the last ask price for options it has written. The Fund values options traded over-the-counter using inputs provided by primary pricing sources and industry standard models.
Swap agreements
The Fund may enter into various types of swap agreements, including without limitation, interest rate, total return, credit default and variance swap agreements. A swap agreement is an agreement to exchange the return generated by one instrument for the return generated by another instrument. When entering into a swap agreement, the Fund and/or the swap counterparty may post or receive cash or securities as collateral. The party posting the collateral typically receives the interest associated with or payments related to the collateral and has the risk of loss related to the collateral.
Interest rate swap agreements involve an exchange by the parties of their respective commitments to pay or right to receive interest, e.g., an exchange of floating rate interest payments for fixed rate interest payments with respect to the notional amount of principal.
Total return swap agreements involve a commitment by one party to pay interest to the other party in exchange for a payment to it from the other party based on the return of a reference instrument (e.g., a security or basket of securities), both based on notional amounts. To the extent the return of the reference instrument exceeds or falls short of the interest payments, one party will receive a payment from or make a payment to the other party.
In a credit default swap agreement, one party makes payments to another party in exchange for the right to receive a specified return if a credit event occurs with respect to a referenced entity or entities. Buying credit default protection reduces the buyer's exposure in the event of an issuer's default (e.g., it reduces risk where a party owns a security issued by or otherwise has exposure to the issuer). Selling credit default protection subjects the seller to exposure to an issuer's default. A seller of credit default protection receives payments in return for its obligation to pay the principal amount of a debt security (or other agreed-upon value) to the other party upon the occurrence of a credit event (e.g., issuer default or similar
21
GMO Global Growth Fund
(A Series of GMO Trust)
Notes to Financial Statements — (Continued)
February 28, 2009
event). If no credit event occurs, the seller has no payment obligations. For credit default swap agreements on asset-backed securities, a credit event may be triggered by such events as the issuer's failure to pay interest or principal, an agreement of the holders of an asset-backed security to a maturity extension, a rating downgrade on the security or a write-down on the collateral underlying the security. For credit default swap agreements on corporate or sovereign issuers, a credit event may be triggered by such events as the issuer's bankruptcy, failure to pay interest or principal, repudiation/moratorium or restructuring.
Variance swap agreements involve an agreement by two parties to exchange cash flows based on the measured variance (or square of volatility) of a specified underlying asset. One party agrees to exchange a "fixed rate" or strike price payment for the "floating rate" or realized price variance on the underlying asset with respect to the notional amount. At inception, the strike price chosen is generally fixed at a level such that the fair value of the swap is zero. At the expiration date, the amount paid by one party to the other is the difference between the realized price variance of the underlying asset and the strike price multiplied by the notional amount. A receiver of the realized price variance would receive a payment when the realized price variance of the underlying asset is greater than the strike price and would make a payment when that variance is less than the strike price. A payer of the realized price variance woul d make a payment when the realized price variance of the underlying asset is greater than the strike price and would receive a payment when that variance is less than the strike price. This type of agreement is essentially a forward contract on the future realized price variance of the underlying asset.
The Fund prices its swap agreements daily using models that may incorporate quotations from market makers and records the change in value, if any, as unrealized gain or loss in the Statement of Operations. Payments received or made on swap agreements are recorded as realized gain or loss in the Statement of Operations. Gains or losses are realized upon termination of the swap agreements.
Swap agreements often are not actively traded on financial markets. The values assigned to them may differ significantly from the values that would be realized upon termination, and the differences could be material. Entering into swap agreements involves credit, legal, market and documentation risk that is not reflected in the amounts reported in the Statement of Assets and Liabilities. Such risks include the possibility that the party with whom the Fund contracts may default on its obligations to perform or disagree as to the meaning of contractual terms, or that the collateral that party posts may be insufficient or not timely received by the Fund. Credit risk may be particularly acute in an environment where financial services firms are exposed to systemic risks of the type evidenced by the insolvency of Lehman Brothers and subsequent market disruptions. The Fund had no swap agreements outstanding at the end of the period.
Repurchase agreements
The Fund may enter into repurchase agreements. Under a repurchase agreement the Fund acquires a security for cash and obtains a simultaneous commitment from the seller to repurchase the security at an agreed upon price and date. The Fund, through its custodian, takes possession of securities collateralizing
22
GMO Global Growth Fund
(A Series of GMO Trust)
Notes to Financial Statements — (Continued)
February 28, 2009
the repurchase agreement. The collateral is marked to market daily to ensure that the market value of the underlying assets is at least equal to the amount owed to the Fund in the event of default by the seller. If the seller of a repurchase agreement defaults or enters into insolvency proceedings and the value of the collateral declines, the Fund's recovery of cash may be delayed or limited. The Fund had no repurchase agreements outstanding at the end of the period.
Securities lending
The Fund may lend its securities to qualified brokers. The loans are collateralized with cash or liquid securities with a market value at least equal to the market value of the securities upon entering into the loan. As with other extensions of credit, the Fund may bear the risk of loss with respect to the investment of the collateral, the risk of delay in and/or inability to exercise its rights with respect to the collateral, and the risk of delay in recovery or loss of rights in the loaned securities should the borrower of the securities fail financially. If a loan is collateralized by U.S. government securities, the Fund receives a fee from the borrower. If a loan is collateralized by cash, the Fund typically invests the cash collateral for its own account. The Fund had no securities on loan at February 28, 2009.
Taxes and distributions
The Fund intends to qualify each tax year as a regulated investment company under Subchapter M of the Internal Revenue Code of 1986, as amended (the "Code"). The Fund intends to distribute substantially all of its net investment income and all of its net realized short-term and long-term capital gain, if any, after giving effect to any available capital loss carryforwards for U.S. federal income tax purposes. Therefore, no provision for U.S. federal income or excise tax is necessary. Taxes on foreign interest and dividend income are generally withheld in accordance with the applicable country's tax treaty with the United States. The foreign withholding rates applicable to a Fund's investments in certain foreign jurisdictions may be higher if a significant portion of the Fund is held by non-U.S. shareholders.
The Fund's policy is to declare and pay distributions from net investment income, if any, semiannually, and from net realized short-term and long-term capital gain, if any, at least annually. All distributions are paid in shares of the Fund, at net asset value, unless the shareholder elects to receive cash distributions. Distributions to shareholders are recorded by the Fund on the ex-dividend date.
Foreign taxes paid by the Fund may be treated, to the extent permissible under the Code and if the Fund so elects, as if paid by the shareholders of the Fund.
The Fund may be subject to capital gains and repatriation taxes imposed by certain countries in which it invests.
Income and capital gain distributions are determined in accordance with U.S. federal income tax regulations, which may differ from U.S. GAAP. Certain capital accounts in the financial statements are periodically adjusted for permanent differences in order to reflect their tax character. These adjustments
23
GMO Global Growth Fund
(A Series of GMO Trust)
Notes to Financial Statements — (Continued)
February 28, 2009
have no impact on net assets or net asset value per share. Temporary differences that arise from recognizing certain items of income, expense, gain or loss in different periods for financial statement and tax purposes will reverse at some time in the future. Distributions in excess of net investment income or net realized gains are temporary over-distributions for financial statement purposes resulting from differences in the recognition or classification of income or distributions for financial statement and tax purposes.
U.S. GAAP and tax accounting differences primarily relate to differing treatment of dividend reserves, losses on wash sale transactions, derivative contract transactions, capital loss carryforwards, and post-October capital losses.
The following reclassification represents the amount necessary to report the stated components of net assets on a tax basis, excluding certain temporary differences, as of February 28, 2009. The financial highlights exclude these adjustments.
| Accumulated Undistributed Net Investment Income | Distributions in Excess of Net Realized Gain | Paid-in Capital | |||||||||
| $ | (571 | ) | $ | 571 | $ | — | |||||
The tax character of distributions declared to shareholders is as follows:
| 2/28/2009 | 2/29/2008 | ||||||||||
| Ordinary income (including any net short-term capital gain) | $ | 592,331 | $ | 680,833 | |||||||
| Net long-term capital gain | — | 1,882,330 | |||||||||
| Total distributions | $ | 592,331 | $ | 2,563,163 | |||||||
Distributions in excess of tax basis earnings and profits, if significant, are reported in the financial statements as a return of capital for tax purposes.
As of February 28, 2009, the components of distributable earnings on a tax basis consisted of the following:
| Undistributed ordinary income (including any net short-term capital gain) | $ | 34,436 | |||||
As of February 28, 2009, the Fund elected to defer to March 1, 2009 post-October capital losses of $1,243,070.
24
GMO Global Growth Fund
(A Series of GMO Trust)
Notes to Financial Statements — (Continued)
February 28, 2009
As of February 28, 2009, the Fund had capital loss carryforwards available to offset future realized gains if any, to the extent permitted by the Code. Utilization of the capital loss carryforwards could be subject to limitations imposed by the Code related to share ownership activity. Such losses expire as follows:
| 2/28/2017 | $ | (4,230,858 | ) | ||||
| Total | $ | (4,230,858 | ) | ||||
As of February 28, 2009, the approximate cost for U.S. federal income tax purposes and gross and net unrealized appreciation (depreciation) in value of investments were as follows:
| Aggregate Cost | Gross Unrealized Appreciation | Gross Unrealized (Depreciation) | Net Unrealized Appreciation (Depreciation) | ||||||||||||
| $ | 10,914,759 | $ | 12,213 | $ | (4,028,825 | ) | $ | (4,016,612 | ) | ||||||
The Fund is subject to the provisions of Financial Accounting Standards Board Interpretation No. 48 ("FIN 48"), Accounting for Uncertainty in Income Taxes — an Interpretation of FASB Statement No. 109. FIN 48 sets forth a minimum threshold for financial statement recognition of a tax position taken or expected to be taken in a tax return that could affect the Fund's financial statements. The Fund did not have any unrecognized tax benefits or liabilities at February 28, 2009, nor did it have any increases or decreases in unrecognized tax benefits or liabilities for the period then ended. The Fund is subject to examination prior to the expiration of the statute of limitations by U.S. federal and state tax authorities for tax returns filed.
Security transactions and related investment income
Security transactions in the financial statements are accounted for on the trade date. Dividend income, net of applicable foreign withholding taxes, if any, is recorded on the ex-dividend date or, if later, when the Fund is informed of the ex-dividend date. Interest income is recorded on the accrual basis and is adjusted for the amortization of premiums and accretion of discounts. Principal on inflation indexed securities is adjusted for inflation and any increase or decrease is recorded as interest income or loss. Income is not recognized on securities for which collection is not expected. Non-cash dividends, if any, are recorded at the fair market value of the asset received. In determining the net gain or loss on securities sold, the Fund uses the identified cost basis for the purposes of determining the cost basis.
Expenses
The majority of the expenses of the Trust are directly identifiable to an individual fund. Expenses that are not readily identifiable to a specific fund are allocated taking into consideration, among other things, the nature and type of expense and the relative size of the funds.
25
GMO Global Growth Fund
(A Series of GMO Trust)
Notes to Financial Statements — (Continued)
February 28, 2009
Brown Brothers Harriman & Co. ("BBH") serves as custodian and fund accounting agent of the Fund. State Street Bank and Trust Company ("State Street") serves as transfer agent of the Fund. BBH and State Street's fees may be reduced by an earnings allowance calculated on the average daily cash balances the Fund maintains with each agent. The Fund receives the benefit of the earnings allowance. In addition, Goldman Sachs Agency Lending, the Fund's securities lending agent, has agreed to reimburse the Fund for certain transactional expenses related to securities lending activity. Credit balances or expense reimbursements used to reduce fees, if any, are reported as a reduction of expenses in the Statement of Operations.
Purchases and redemptions of Fund shares
As of February 28, 2009, the premium on cash purchases and fee on cash redemptions of Fund shares were each 0.25% of the amount invested or redeemed. An additional purchase premium and redemption fee of 0.005% is charged for any purchases/redemptions (or any portion of a purchase/redemption) effected in a currency other than the U.S. dollar. The Fund may impose a new purchase premium and/or redemption fee, or modify or eliminate an existing purchase premium and/or redemption fee, at any time. If the Manager determines that any portion of a cash purchase or redemption is offset by a corresponding cash redemption or purchase on the same day, the Fund will ordinarily waive or reduce the purchase premium or redemption fee with respect to that portion. In addition, the Fund may waive or reduce the purchase premium or redemption fee in extraordinary circumstances if the purchase or redemption will not cause the Fund to incur transacti on costs. All purchase premiums and redemption fees are paid to the Fund and recorded by the Fund as paid-in-capital. The Fund will waive or reduce the purchase premium relating to the in-kind portion of a purchase transaction except for estimated or known transaction costs (e.g. stamp duties and transfer taxes) incurred by the Fund as a result of the transfer of the purchasing shareholder's securities to the Fund. In-kind redemption transactions are generally not subject to redemption fees except when they include a cash component. However, when a substantial portion of a Fund is being redeemed, the Fund may charge a redemption fee based on estimated or known transaction costs resulting from those redemptions. The Fund charges no premium for reinvested distributions.
Investment risks
The Fund is subject to risks involved in investing in foreign securities that are not presented by investments in U.S. securities. These risks may involve adverse political and economic developments, including expropriation and the possible imposition of capital controls or other foreign governmental laws or restrictions. In addition, the securities of some foreign companies and securities markets are less liquid and at times may be more volatile than securities of comparable U.S. companies and U.S. securities markets.
Among other trading agreements, the Fund is party to International Swaps and Derivatives Association, Inc. Master Agreements ("ISDA Agreements") with select counterparties that generally govern over-the-counter derivative transactions entered into by the Fund. The ISDA Master Agreements typically include standard representations and warranties as well as contractual terms related to collateral, events of default, termination events, and other standard provisions. Termination events may include the decline in the net assets of the Fund below a certain level over a specified period of time and may entitle a counterparty to elect to terminate early with respect to some or all the transactions under the ISDA Agreement with that
26
GMO Global Growth Fund
(A Series of GMO Trust)
Notes to Financial Statements — (Continued)
February 28, 2009
counterparty. Such an election by one or more of the counterparties could have a material impact on the Fund's operations. Due to declines in the net assets of the Fund during the year ended February 28, 2009, one or more counterparties may be entitled to terminate early but none has taken such action.
Recently issued accounting pronouncement
In March 2008, FASB issued Statement of Financial Accounting Standards No. 161, Disclosures about Derivative Instruments and Hedging Activities ("SFAS 161"). SFAS 161 is effective for fiscal years and interim periods beginning after November 15, 2008. SFAS 161 requires enhanced disclosures about the Fund's derivative and hedging activities. The Manager is currently evaluating the impact the adoption of SFAS 161 will have on the Fund's financial statement disclosures.
3. Fees and other transactions with affiliates
GMO receives a management fee for the services it provides to the Fund. Effective June 30, 2008, that fee is paid monthly at the annual rate of 0.45% of average daily net assets. For the period from March 1, 2008 through June 29, 2008, the management fee rate was 0.47% of average daily net assets. The Fund has adopted a Shareholder Service Plan under which the Fund pays GMO a shareholder service fee for client and shareholder service, reporting, and other support. Pursuant to the Shareholder Service Plan, the shareholder service fee is calculated based on average daily net assets at the annual rate of 0.15% for Class III shares.
Through at least June 30, 2009, the Manager has contractually agreed to reimburse the Fund for Fund expenses incurred through that date to the extent the Fund's total annual operating expenses (excluding "Excluded Expenses", as defined below) exceed 0.45% of the Fund's average daily net assets. Excluded Expenses include shareholder service fees, fees and expenses of the independent Trustees of the Trust, fees and expenses for legal services not approved by the Manager for the Trust, compensation and expenses of the Trust's Chief Compliance Officer ("CCO") (excluding any employee benefits), brokerage commissions, securities lending fees and expenses, interest expense, transfer taxes, and other investment-related costs (including expenses associated with investments in any company that is an investment company or would be an investment company under the 1940 Act, but for the exceptions to the definition of investment company provi ded in Section 3(c)(1) and 3(c)(7) of the 1940 Act), hedging transaction fees, extraordinary, non-recurring and certain other unusual expenses (including taxes).
The Fund's portion of the fees paid by the Trust to the Trust's independent Trustees and CCO during the year ended February 28, 2009 was $305 and $120, respectively. The compensation and expenses of the CCO are included in miscellaneous expenses in the Statement of Operations. The Fund paid no remuneration to any other officer of the Trust.
4. Purchases and sales of securities
Cost of purchases and proceeds from sales of securities, excluding short-term investments, for the year ended February 28, 2009 aggregated $13,705,683 and $32,230,827, respectively.
27
GMO Global Growth Fund
(A Series of GMO Trust)
Notes to Financial Statements — (Continued)
February 28, 2009
5. Guarantees
In the normal course of business the Fund enters into contracts with third-party service providers that contain a variety of representations and warranties and that provide general indemnifications. The Fund's maximum exposure under these arrangements is unknown, as it involves future claims that may be made against the Fund that have not yet occurred. Based on experience, management is of the view that the risk of loss in connection with its indemnification obligations is remote; however, there can be no assurance that such obligations will not result in material liabilities that adversely affect the Fund.
6. Principal shareholders and related parties
As of February 28, 2009, 98.71% of the outstanding shares of the Fund were held by two shareholders, each holding more than 10% of the Fund's outstanding shares. On that date, no other shareholder owned more than 10% of the outstanding shares of the Fund. Redemptions from (or investments into) the Fund by or on behalf of these large shareholders may have a material effect on the Fund.
As of February 28, 2009, 0.08% of the Fund's shares were held by senior management of the Manager and GMO Trust officers and none of the Fund's shares were held by accounts for which the Manager had investment discretion.
7. Share transactions
The Declaration of Trust permits the Trust to issue an unlimited number of shares of beneficial interest (without par value). Transactions in Fund shares were as follows:
| Year Ended February 28, 2009 | Year Ended February 29, 2008 | ||||||||||||||||||
| Class III: | Shares | Amount | Shares | Amount | |||||||||||||||
| Shares sold | 799 | $ | 12,435 | 920,964 | $ | 23,778,708 | |||||||||||||
| Shares issued to shareholders in reinvestment of distributions | 33,458 | 591,973 | 102,111 | 2,562,902 | |||||||||||||||
| Shares repurchased | (963,289 | ) | (19,498,060 | ) | (2,430,110 | ) | (57,695,322 | ) | |||||||||||
| Purchase premiums | — | 31 | — | 59,409 | |||||||||||||||
| Redemption fees | — | 48,745 | — | 7,684 | |||||||||||||||
| Net increase (decrease) | (929,032 | ) | $ | (18,844,876 | ) | (1,407,035 | ) | $ | (31,286,619 | ) | |||||||||
8. Subsequent event
Pursuant to a plan of liquidation adopted by the Board of Trustees of the Fund on March 12, 2009, the Fund was liquidated on March 31, 2009.
28
Report of Independent Registered Public Accounting Firm
To the Trustees of GMO Trust and the Shareholders of
GMO Global Growth Fund:
In our opinion, the accompanying statement of assets and liabilities, including the schedule of investments, and the related statements of operations and of changes in net assets and the financial highlights present fairly, in all material respects, the financial position of GMO Global Growth Fund (the "Fund") at February 28, 2009, the results of its operations for the year then ended, the changes in its net assets for each of the two years in the period then ended and the financial highlights for each of the periods indicated, in conformity with accounting principles generally accepted in the United States of America. These financial statements and financial highlights (hereafter referred to as "financial statements") are the responsibility of the Fund's management. Our responsibility is to express an opinion on these financial statements based on our audits. We conducted our audits of these financial statements in accordance w ith the standards of the Public Company Accounting Oversight Board (United States). Those standards require that we plan and perform the audit to obtain reasonable assurance about whether the financial statements are free of material misstatement. An audit includes examining, on a test basis, evidence supporting the amounts and disclosures in the financial statements, assessing the accounting principles used and significant estimates made by management, and evaluating the overall financial statement presentation. We believe that our audits, which included confirmation of securities at February 28, 2009 by correspondence with the custodian and brokers, provide a reasonable basis for our opinion.
The Trustees of the Trust approved a plan to liquidate the Fund on March 12, 2009 and the Fund was subsequently liquidated on March 31, 2009 (see Note 8).
PricewaterhouseCoopers LLP
Boston, Massachusetts
April 29, 2009
29
GMO Global Growth Fund
(A Series of GMO Trust)
Fund Expenses
February 28, 2009 (Unaudited)
Expense Examples: The following information is in relation to expenses for the six month period ended February 28, 2009.
As a shareholder of the Fund, you may incur two types of costs: (1) transaction costs, including purchase premiums and redemption fees; and (2) ongoing costs, including management fees, shareholder service fees, and other Fund expenses. This example is intended to help you understand your ongoing costs (in dollars) of investing in the Fund and to compare these costs with the ongoing costs of investing in other mutual funds.
These examples are based on an investment of $1,000 invested at the beginning of the period and held for the entire period, September 1, 2008 through February 28, 2009.
Actual Expenses
The first line of the table below provides information about actual account values and actual expenses. You may use the information in this line, together with the amount you invested, to estimate the expenses that you paid over the period. Simply divide your account value by $1,000 (for example, a $10,000,000 account value divided by $1,000 = 10,000), then multiply the result by the number in the first line under the heading entitled "Net Expense Incurred" to estimate the expenses you paid on your account during this period.
Hypothetical Example for Comparison Purposes
The second line of the table below provides information about hypothetical account values and hypothetical expenses based on the Fund's actual expense ratio and an assumed rate of return of 5% per year before expenses, which is not the Fund's actual return. The hypothetical account values and expenses may not be used to estimate the actual ending account balance or expenses you paid for the period. You may use this information to compare the ongoing costs of investing in the Fund with other funds. To do so, compare this 5% hypothetical example with the 5% hypothetical examples that appear in the shareholder reports of other funds.
Please note that the expenses shown in the table are meant to highlight your ongoing costs only and do not reflect any transactional costs. Therefore, the second line of the table is useful in comparing ongoing costs only, and will not help you determine the relative total costs of owning different funds. In addition, if these transactional costs were included, your costs would have been higher.
| Annualized Net Expense Ratio | Beginning Account Value | Ending Account Value | Net Expense Incurred* | ||||||||||||||||
| Class III | |||||||||||||||||||
| 1) Actual | 0.60 | % | $ | 1,000.00 | $ | 595.70 | $ | 2.37 | |||||||||||
| 2) Hypothetical | 0.60 | % | $ | 1,000.00 | $ | 1,021.82 | $ | 3.01 | |||||||||||
* Expenses are calculated using the Class's annualized net expense ratio for the six months ended February 28, 2009, multiplied by the average account value over the period, multiplied by 181 days in the period, divided by 365 days in the year.
30
GMO Global Growth Fund
(A Series of GMO Trust)
Tax Information for the Tax Year Ended February 28, 2009 (Unaudited)
The Fund will notify shareholders of amounts for use in preparing 2009 income tax forms in January 2010.
For taxable, non-corporate shareholders, 100.00% of the income and short-term capital gains, if any, distributed in the Fund's fiscal year ended February 28, 2009 represents qualified dividend income subject to the 15% rate category.
For corporate shareholders, 34.67% of the income and short-term capital gains, if any, distributed in the Fund's fiscal year ended February 28, 2009 qualified for the dividends-received deduction.
The Fund hereby designates as qualified short-term capital gains with respect to its taxable year ended February 28, 2009, $238,054 or if determined to be different, the qualified short-term capital gains of such year.
31
Trustees and Officers (Unaudited)
The following tables list the Trust's Trustees and Officers as of the date of this report; their address and date of birth ("DOB"); their position with the Trust; the length of time holding that position with the Trust; their principal occupation(s) during the past five years; the number of portfolios in the fund complex they oversee; and other directorships they hold in companies subject to registration or reporting requirements of the Securities Exchange Act of 1934 (generally called "public companies") or in registered investment companies. The Trust's Statement of Additional Information ("SAI") includes additional information about the Trust's trustees, including changes subsequent to the date of the report. The SAI is available, without charge, upon request by writing GMO, c/o GMO Trust, 40 Rowes Wharf, Boston, MA 02110.
Independent Trustees:
| Name, Address, and DOB | Position(s) Held with Trust | Term of Office1 and Length of Time Served | Principal Occupation(s) During Past Five Years | Number of Portfolios in Fund Complex Overseen by Trustee | Other Directorships Held by Trustee | ||||||||||||||||||
| Donald W. Glazer, Esq. c/o GMO Trust 40 Rowes Wharf Boston, MA 02110 DOB: 07/26/1944 | Chairman of the Board of Trustees | Chairman of the Board of Trustees since March 2005; Lead Independent Trustee (September 2004 – March 2005); Trustee since December 2000. | Consultant – Law and Business2; Author of Legal Treatises. | 59 | None. | ||||||||||||||||||
1 Each Trustee is elected to serve during the continued lifetime of the Trust until he/she dies, resigns or is removed, or if sooner, until the next meeting of Shareholders called for the purpose of electing Trustees and until the election and qualification of his/her successor.
2 As part of Mr. Glazer's work as a consultant, he provides part-time consulting services to Goodwin Procter LLP ("Goodwin"). Goodwin has provided legal services to Renewable Resources, LLC, an affiliate of GMO; GMO, in connection with its relationship with Renewable Resources; and funds managed by Renewable Resources. Mr. Glazer has represented that he has no financial interest in, and is not involved in the provision of, such legal services. In the calendar years ended December 31, 2007 and December 31, 2008, these entities paid $789,416 and $183,864 respectively, in legal fees and disbursements to Goodwin. In correspondence with the Staff of the Securities and Exchange Commission beginning in August 2006, the Independent Trustees' legal counsel provided the Staff with information regarding Mr. Glazer's relationship with Goodwin and h is other business activities. On September 11, 2007, based on information that had been given to the Staff as of that date, the Staff provided oral no-action assurance consistent with the opinion of the Independent Trustees' legal counsel that Mr. Glazer is not an "interested person" of the Trust.
32
Independent Trustees — (Continued)
| Name, Address, and DOB | Position(s) Held with Trust | Term of Office1 and Length of Time Served | Principal Occupation(s) During Past Five Years | Number of Portfolios in Fund Complex Overseen by Trustee | Other Directorships Held by Trustee | ||||||||||||||||||
| W. Nicholas Thorndike c/o GMO Trust 40 Rowes Wharf Boston, MA 02110 DOB: 03/28/1933 | Trustee | Since March 2005. | Director or trustee of various corporations and charitable organizations, including Courier Corporation (a book publisher and manufacturer) (July 1989 – present); Putnam Funds (December 1992 – June 2004); and Providence Journal (a newspaper publisher) (December 1986 – December 2003). | 59 | Director of Courier Corporation (a book publisher and manufacturer); Member of the Investment Committee of Partners HealthCare System, Inc.3 | ||||||||||||||||||
| Peter Tufano c/o GMO Trust 40 Rowes Wharf Boston, MA 02110 DOB: 04/22/1957 | Trustee | Since December 2008. | Sylvan C. Coleman Professor of Financial Management, Harvard Business School (since 1989). | 59 | Trustee of State Street Navigator Securities Lending Trust (3 Portfolios). | ||||||||||||||||||
1 Each Trustee is elected to serve during the continued lifetime of the Trust until he/she dies, resigns or is removed, or if sooner, until the next meeting of Shareholders called for the purpose of electing Trustees and until the election and qualification of his/her successor.
3 Partners HealthCare System, Inc. is a client of the Manager.
33
Principal Officers:
| Name, Address, and DOB | Position(s) Held with Trust | Term of Office4 and Length of Time Served | Principal Occupation(s) During Past Five Years5 | ||||||||||||
| J.B. Kittredge DOB: 08/22/1954 | President and Chief Executive Officer | Since March 2009. | General Counsel, Grantham, Mayo, Van Otterloo & Co. LLC (October 2005 – Present); Partner, Ropes & Gray LLP. | ||||||||||||
| Sheppard N. Burnett c/o GMO Trust 40 Rowes Wharf Boston, MA 02110 DOB: 10/24/1968 | Treasurer and Chief Financial Officer | Chief Financial Officer since March 2007; Treasurer since November 2006; Assistant Treasurer, September 2004 – November 2006. | Fund Administration Staff, Grantham, Mayo, Van Otterloo & Co. LLC (June 2004 – present); Vice President, Director of Tax, Columbia Management Group (2002 – 2004). | ||||||||||||
| Brent C. Arvidson c/o GMO Trust 40 Rowes Wharf Boston, MA 02110 DOB: 06/26/1969 | Assistant Treasurer | Since August 1998. | Senior Fund Administrator, Grantham, Mayo, Van Otterloo & Co. LLC. | ||||||||||||
| John L. Nasrah c/o GMO Trust 40 Rowes Wharf Boston, MA 02110 DOB: 05/27/1977 | Assistant Treasurer | Since March 2007. | Fund Administrator, Grantham, Mayo, Van Otterloo & Co. LLC (September 2004 – present); Tax Analyst, Bain & Company, Inc. (June 2003 – September 2004). | ||||||||||||
| Mahmoodur Rahman c/o GMO Trust 40 Rowes Wharf Boston, MA 02110 DOB: 11/30/1967 | Assistant Treasurer | Since September 2007. | Fund Administrator, Grantham, Mayo, Van Otterloo & Co. LLC (April 2007 – present); Vice President and Senior Tax Manager, Massachusetts Financial Services Company (January 2000 – April 2007). | ||||||||||||
| Michael E. Gillespie c/o GMO Trust 40 Rowes Wharf Boston, MA 02110 DOB: 02/18/1958 | Chief Compliance Officer | Since March 2005. | Vice President of Compliance (June 2004 – February 2005) and Director of Domestic Compliance (March 2002 – June 2004), Fidelity Investments. | ||||||||||||
4 Each officer is elected to hold such office until his or her successor is duly elected and qualified to carry out the duties and responsibilities of the office, or until he or she resigns or is removed from office.
5 Each of Messrs. Burnett, Arvidson, Bohan, and Pottle serves as an officer and/or director of certain pooled investment vehicles of which GMO or an affiliate of GMO serves as the investment adviser.
34
Principal Officers — (Continued)
| Name, Address, and DOB | Position(s) Held with Trust | Term of Office4 and Length of Time Served | Principal Occupation(s) During Past Five Years5 | ||||||||||||
| Jason B. Harrison c/o GMO Trust 40 Rowes Wharf Boston, MA 02110 DOB: 01/29/1977 | Vice President and Clerk | Vice President since November 2006; Clerk since March 2006. | Legal Counsel, Grantham, Mayo, Van Otterloo & Co. LLC (since February 2006) and Attorney, Ropes & Gray LLP (September 2002 – February 2006). | ||||||||||||
| David L. Bohan c/o GMO Trust 40 Rowes Wharf Boston, MA 02110 DOB: 06/21/1964 | Vice President and Assistant Clerk | Vice President since March 2005; Assistant Clerk since March 2006. | Legal Counsel, Grantham, Mayo, Van Otterloo & Co. LLC. | ||||||||||||
| Gregory L. Pottle c/o GMO Trust 40 Rowes Wharf Boston, MA 02110 DOB: 07/09/1971 | Vice President and Assistant Clerk | Since November 2006. | Legal Counsel, Grantham, Mayo, Van Otterloo & Co. LLC. | ||||||||||||
| Anne K. Trinque c/o GMO Trust 40 Rowes Wharf Boston, MA 02110 DOB: 04/15/1978 | Vice President and Assistant Clerk | Since September 2007. | Legal Counsel, Grantham, Mayo, Van Otterloo & Co. LLC (January 2007 – present); Attorney, Goodwin Procter LLP (September 2003 – January 2007). | ||||||||||||
| Cheryl Wakeham c/o GMO Trust 40 Rowes Wharf Boston, MA 02110 DOB: 10/29/1958 | Vice President and Anti-Money Laundering Officer | Since December 2004. | Manager, Client Service Administration, Grantham, Mayo, Van Otterloo & Co. LLC. | ||||||||||||
4 Each officer is elected to hold such office until his or her successor is duly elected and qualified to carry out the duties and responsibilities of the office, or until he or she resigns or is removed from office.
5 Each of Messrs. Burnett, Arvidson, Bohan, and Pottle serves as an officer and/or director of certain pooled investment vehicles of which GMO or an affiliate of GMO serves as the investment adviser.
35
GMO Taiwan Fund
(A Series of GMO Trust)
Annual Report
February 28, 2009
For a free copy of the Fund's proxy voting guidelines, shareholders may call 1-617-346-7646 (collect) or visit the Securities and Exchange Commission's website at www.sec.gov. Information regarding how the Fund voted proxies relating to portfolio securities during the most recent 12-month period ended June 30 is available on the Securities and Exchange Commission's website at www.sec.gov.
The Fund files its complete schedule of portfolio holdings with the Securities and Exchange Commission for the first and third quarter of each fiscal year on Form N-Q, which is available on the Commission's website at www.sec.gov. The Fund's Form N-Q may be reviewed and copied at the Commission's Public Reference Room in Washington, D.C. Information on the operation of the Public Reference Room may be obtained by calling 1-800-SEC-0330.
This report is prepared for the general information of shareholders. It is authorized for distribution to prospective investors only when preceded or accompanied by a private placement memorandum, which contains a complete discussion of the risks associated with an investment in this Fund and other important information. The private placement memorandum can be obtained by calling 1-617-346-7646 (collect).
GMO Taiwan Fund
(A Series of GMO Trust)
Portfolio Management
Day-to-day management of the Fund's portfolio is the responsibility of the Emerging Markets team at Grantham, Mayo, Van Otterloo & Co. LLC.
Management Discussion and Analysis of Fund Performance
The GMO Taiwan Fund returned -47.1% for the fiscal year ended February 28, 2009, as compared to -51.3% for the MSCI Taiwan Index. Consistent with the Fund's investment objectives and policies, throughout the period the Fund was invested substantially in emerging market equities tied economically to Taiwan.
Performance was helped by an overweight in the Telecommunication Services sector and an underweight in the Information Technology sector. The underweight in the Consumer Staples and Energy sectors detracted from performance. Stock selection in the Financials and Information Technology sectors added to performance while stock selection in the Telecommunication Services and Materials sectors detracted from performance.
The views expressed herein are exclusively those of Grantham, Mayo, Van Otterloo & Co. LLC Management as of the date of this report and are subject to change. GMO disclaims any responsibility to update such views. They are not meant as investment advice.

Performance data quoted represents past performance and is not indicative of future results. The investment return and principal value of an investment will fluctuate so that an investor's shares, when redeemed, may be worth more or less than their original cost. Current performance data may be lower or higher than the performance data provided herein. To obtain performance information to the most recent month-end, visit www.gmo.com. Performance shown is net of all fees after reimbursement from the Manager. Each performance figure assumes a purchase at the beginning and redemption at the end of the stated period and reflects a transaction fee of .15% on the purchase and .45% on the redemption. Transaction fees are retained by the Fund to cover trading costs. Returns would have been lower had certain expenses not been reimbursed during the periods shown and do not include the effect of taxes on distributions and redemptions. All information is unaudited.
GMO Taiwan Fund
(A Series of GMO Trust)
Investments Concentration Summary
February 28, 2009 (Unaudited)
| Asset Class Summary | % of Total Net Assets | ||||||
| Common Stocks | 97.9 | % | |||||
| Short-Term Investments | 1.8 | ||||||
| Other | 0.3 | ||||||
| 100.0 | % | ||||||
| Industry Sector Summary | % of Equity Investments | ||||||
| Information Technology | 60.3 | % | |||||
| Telecommunication Services | 13.4 | ||||||
| Financials | 11.4 | ||||||
| Materials | 9.4 | ||||||
| Industrials | 3.8 | ||||||
| Consumer Discretionary | 1.6 | ||||||
| Energy | 0.1 | ||||||
| Consumer Staples | 0.0 | ||||||
| 100.0 | % | ||||||
1
GMO Taiwan Fund
(A Series of GMO Trust)
Schedule of Investments
(showing percentage of total net assets)
February 28, 2009
| Shares | Description | Value ($) | |||||||||||||
| COMMON STOCKS — 97.9% | |||||||||||||||
| Taiwan — 97.9% | |||||||||||||||
| 1,965,000 | Acer Inc | 2,572,881 | |||||||||||||
| 6,968 | Altek Corp | 5,858 | |||||||||||||
| 5,084 | Arima Computer Corp * | 476 | |||||||||||||
| 1,602,000 | Asia Cement Corp | 1,182,732 | |||||||||||||
| 2,470,599 | Asustek Computer Inc | 2,332,787 | |||||||||||||
| 129,344 | AU Optronics Corp | 94,220 | |||||||||||||
| 1,173,000 | Catcher Technology Co Ltd | 1,958,134 | |||||||||||||
| 276,394 | Chi Mei Optoelectronics Corp | 88,262 | |||||||||||||
| 7,082,000 | China Bills Finance Corp * | 1,268,015 | |||||||||||||
| 5,683,806 | China Development Financial Holding Corp | 956,394 | |||||||||||||
| 4,530 | China Motor Corp | 1,457 | |||||||||||||
| 135,688 | China Steel Corp | 85,780 | |||||||||||||
| 7,290,628 | Chinatrust Financial Holding Co Ltd | 2,180,917 | |||||||||||||
| 7,000 | Chunghwa Picture Tubes Ltd | 588 | |||||||||||||
| 5,426,630 | Chunghwa Telecom Co Ltd | 8,354,632 | |||||||||||||
| 6,537 | Chunghwa Telecom Co Ltd ADR | 100,343 | |||||||||||||
| 4,589,831 | Compal Electronics Inc | 2,613,661 | |||||||||||||
| 5,700 | Continental Engineering Corp | 1,235 | |||||||||||||
| 193,270 | Coretronic Corp | 100,805 | |||||||||||||
| 1,874 | D-Link Corp | 1,018 | |||||||||||||
| 685,420 | Delta Electronics Inc | 1,079,348 | |||||||||||||
| 532,965 | DFI Inc | 518,956 | |||||||||||||
| 1,867,879 | Dimerco Express Taiwan Corp | 1,027,102 | |||||||||||||
| 179,382 | Far Eastern Department Stores Ltd | 69,603 | |||||||||||||
| 2,058,685 | Far Eastern Textile Co Ltd | 1,216,729 | |||||||||||||
| 2,526,507 | Far Eastone Telecommunications Co Ltd | 2,440,553 | |||||||||||||
| 5,372,448 | First Financial Holding Co Ltd | 2,128,093 | |||||||||||||
| 990,169 | Formosa Chemicals & Fibre Co | 987,836 | |||||||||||||
| 18,000 | Formosa International Hotels Corp | 139,798 | |||||||||||||
| 41,077 | Formosa Petrochemical Corp | 66,854 | |||||||||||||
| 97,424 | Formosa Plastics Corp | 131,857 | |||||||||||||
| 4,155,000 | Fubon Financial Holding Co Ltd | 2,206,956 | |||||||||||||
See accompanying notes to the financial statements.
2
GMO Taiwan Fund
(A Series of GMO Trust)
Schedule of Investments — (Continued)
(showing percentage of total net assets)
February 28, 2009
| Shares | Description | Value ($) | |||||||||||||
| Taiwan — continued | |||||||||||||||
| 2,000 | Gigabyte Technology Co Ltd | 838 | |||||||||||||
| 45,430 | Gloria Material Technology Corp | 15,488 | |||||||||||||
| 675,254 | High Tech Computer Corp | 7,323,180 | |||||||||||||
| 3,717,285 | Hon Hai Precision Industry Co Ltd | 7,302,028 | |||||||||||||
| 1,000 | Hotai Motor Company Ltd | 1,302 | |||||||||||||
| 96,000 | Huaku Development Co Ltd | 93,086 | |||||||||||||
| 2,882 | Innolux Display Corp | 2,432 | |||||||||||||
| 280,630 | KGI Securities Co Ltd | 58,772 | |||||||||||||
| 25,594 | Kinpo Electronics | 4,426 | |||||||||||||
| 87,000 | Largan Precision Co Ltd | 611,286 | |||||||||||||
| 1,630,588 | Les Enphants Co Ltd | 728,510 | |||||||||||||
| 3,967,407 | Lite-On Technology Corp | 2,315,615 | |||||||||||||
| 862,826 | MediaTek Inc | 7,401,121 | |||||||||||||
| 5,250 | Mercuries & Associates Ltd | 1,274 | |||||||||||||
| 1,079 | Micro-Star International Co Ltd | 450 | |||||||||||||
| 2,056,000 | Mitac International Corp | 741,929 | |||||||||||||
| 367,810 | Motech Industries Inc | 810,845 | |||||||||||||
| 2,173,000 | Nan Ya Plastics Corp | 2,049,282 | |||||||||||||
| 30,000 | Nan Ya Printed Circuit Board Corp | 59,243 | |||||||||||||
| 1,000 | Nien Hsing Textile Co Ltd | 218 | |||||||||||||
| 9,109 | Oriental Union Chemical | 3,486 | |||||||||||||
| 17,000 | Prodisc Technology Inc (a) (b) * | 470 | |||||||||||||
| 10,800 | Qisda Corp | 1,951 | |||||||||||||
| 4,015,709 | Quanta Computer Inc | 4,054,577 | |||||||||||||
| 14,802 | Sampo Corp * | 1,412 | |||||||||||||
| 2,521 | Shinkong Synthetic Fibers | 278 | |||||||||||||
| 1,583,000 | Synnex Technology International Corp | 1,796,141 | |||||||||||||
| 2,403 | Systex Corp | 1,264 | |||||||||||||
| 611,000 | Taishin Financial Holding Co Ltd | 85,069 | |||||||||||||
| 4,251,607 | Taiwan Cement Corp | 3,147,125 | |||||||||||||
| 1,057,000 | Taiwan Fertilizer Co Ltd | 1,587,293 | |||||||||||||
| 1,759,539 | Taiwan Mobile Co Ltd | 2,286,366 | |||||||||||||
| 12,087,567 | Taiwan Semiconductor Manufacturing Co Ltd | 15,268,333 | |||||||||||||
| 9,889 | Tsann Kuen Enterprises Co Ltd | 3,244 | |||||||||||||
See accompanying notes to the financial statements.
3
GMO Taiwan Fund
(A Series of GMO Trust)
Schedule of Investments — (Continued)
(showing percentage of total net assets)
February 28, 2009
| Shares / Par Value ($) | Description | Value ($) | |||||||||||||
| Taiwan — continued | |||||||||||||||
| 2,409 | TXC Corp | 1,834 | |||||||||||||
| 542,000 | U-Ming Marine Transport Corp | 686,251 | |||||||||||||
| 5,250 | Uni-President Enterprises Corp | 3,871 | |||||||||||||
| 231,789 | Unimicron Technology Corp | 103,249 | |||||||||||||
| 16,000 | USI Corp | 4,601 | |||||||||||||
| 9,760 | Wan Hai Lines Ltd | 3,654 | |||||||||||||
| 639,933 | Waterland Financial Holdings | 101,757 | |||||||||||||
| 1,842,786 | Wistron Corp | 1,391,916 | |||||||||||||
| 2,968,195 | Ya Hsin Industrial Co Ltd (a) (b) * | 850 | |||||||||||||
| 14,716 | Yang Ming Marine Transport | 3,722 | |||||||||||||
| 3,084 | Yieh Phui Enterprise | 769 | |||||||||||||
| 5,898,000 | Yuanta Financial Holding Co Ltd | 2,120,893 | |||||||||||||
| 2,000 | Yungtay Engineering Co Ltd | 743 | |||||||||||||
| Total Taiwan | 98,096,324 | ||||||||||||||
| TOTAL COMMON STOCKS (COST $125,928,272) | 98,096,324 | ||||||||||||||
| SHORT-TERM INVESTMENTS — 1.8% | |||||||||||||||
| 700,000 | BNP Paribas Time Deposit, 0.23%, due 03/02/09 | 700,000 | |||||||||||||
| 1,000,000 | Royal Bank of Canada Time Deposit, 0.20%, due 03/02/09 | 1,000,000 | |||||||||||||
| 97,284 | Royal Bank of Scotland Time Deposit, 0.08%, due 03/02/09 | 97,284 | |||||||||||||
| TOTAL SHORT-TERM INVESTMENTS (COST $1,797,284) | 1,797,284 | ||||||||||||||
| TOTAL INVESTMENTS — 99.7% (Cost $127,725,556) | 99,893,608 | ||||||||||||||
| Other Assets and Liabilities (net) — 0.3% | 282,452 | ||||||||||||||
| TOTAL NET ASSETS — 100.0% | $ | 100,176,060 | |||||||||||||
See accompanying notes to the financial statements.
4
GMO Taiwan Fund
(A Series of GMO Trust)
Schedule of Investments — (Continued)
February 28, 2009
Notes to Schedule of Investments:
ADR - American Depositary Receipt
* Non-income producing security.
(a) Bankrupt issuer.
(b) Security valued at fair value using methods determined in good faith by or at the direction of the Trustees of GMO Trust (Note 2).
See accompanying notes to the financial statements.
5
GMO Taiwan Fund
(A Series of GMO Trust)
Statement of Assets and Liabilities — February 28, 2009
| Assets: | |||||||
| Investments, at value (cost $127,725,556) (Note 2) | $ | 99,893,608 | |||||
| Foreign currency, at value (cost $3,369,048) (Note 2) | 3,368,837 | ||||||
| Receivable for investments sold | 3,450,229 | ||||||
| Interest receivable | 20 | ||||||
| Total assets | 106,712,694 | ||||||
| Liabilities: | |||||||
| Payable for investments purchased | 3,005,883 | ||||||
| Payable for Fund shares repurchased | 3,218,000 | ||||||
| Payable to affiliate for (Note 3): | |||||||
| Management fee | 66,061 | ||||||
| Shareholder service fee | 12,234 | ||||||
| Trustees and Chief Compliance Officer of GMO Trust fees | 303 | ||||||
| Accrued expenses | 234,153 | ||||||
| Total liabilities | 6,536,634 | ||||||
| Net assets | $ | 100,176,060 | |||||
| Net assets consist of: | |||||||
| Paid-in capital | $ | 181,279,962 | |||||
| Accumulated undistributed net investment income | 2,148,460 | ||||||
| Distributions in excess of net realized gain | (55,418,600 | ) | |||||
| Net unrealized depreciation | (27,833,762 | ) | |||||
| $ | 100,176,060 | ||||||
| Net assets attributable to: | |||||||
| Class III shares | $ | 100,176,060 | |||||
| Shares outstanding: | |||||||
| Class III | 9,055,632 | ||||||
| Net asset value per share: | |||||||
| Class III | $ | 11.06 | |||||
See accompanying notes to the financial statements.
6
GMO Taiwan Fund
(A Series of GMO Trust)
Statement of Operations — Year Ended February 28, 2009
| Investment Income: | |||||||
| Dividends (net of withholding taxes of $1,860,426) | $ | 7,461,822 | |||||
| Interest | 60,012 | ||||||
| Total investment income | 7,521,834 | ||||||
| Expenses: | |||||||
| Management fee (Note 3) | 1,285,293 | ||||||
| Shareholder service fee – Class III (Note 3) | 238,017 | ||||||
| Custodian and fund accounting agent fees | 459,381 | ||||||
| Transfer agent fees | 26,972 | ||||||
| Audit and tax fees | 78,367 | ||||||
| Legal fees | 6,496 | ||||||
| Trustees fees and related expenses (Note 3) | 1,948 | ||||||
| Miscellaneous | 3,573 | ||||||
| Total expenses | 2,100,047 | ||||||
| Expense reductions (Note 2) | (948 | ) | |||||
| Net expenses | 2,099,099 | ||||||
| Net investment income (loss) | 5,422,735 | ||||||
| Realized and unrealized gain (loss): | |||||||
| Net realized gain (loss) on: | |||||||
| Investments | (53,951,301 | ) | |||||
| Foreign currency, forward contracts and foreign currency related transactions | (525,369 | ) | |||||
| Net realized gain (loss) | (54,476,670 | ) | |||||
| Change in net unrealized appreciation (depreciation) on: | |||||||
| Investments | (38,053,910 | ) | |||||
| Foreign currency, forward contracts and foreign currency related transactions | (29,725 | ) | |||||
| Net unrealized gain (loss) | (38,083,635 | ) | |||||
| Net realized and unrealized gain (loss) | (92,560,305 | ) | |||||
| Net increase (decrease) in net assets resulting from operations | $ | (87,137,570 | ) | ||||
See accompanying notes to the financial statements.
7
GMO Taiwan Fund
(A Series of GMO Trust)
Statement of Changes in Net Assets
| Year Ended February 28, 2009 | Year Ended February 29, 2008 | ||||||||||
| Increase (decrease) in net assets: | |||||||||||
| Operations: | |||||||||||
| Net investment income (loss) | $ | 5,422,735 | $ | 5,859,879 | |||||||
| Net realized gain (loss) | (54,476,670 | ) | 59,520,538 | ||||||||
| Change in net unrealized appreciation (depreciation) | (38,083,635 | ) | (38,936,381 | ) | |||||||
| Net increase (decrease) in net assets from operations | (87,137,570 | ) | 26,444,036 | ||||||||
| Distributions to shareholders from: | |||||||||||
| Net investment income | |||||||||||
| Class III | (2,600,079 | ) | (6,074,310 | ) | |||||||
| Net realized gains | |||||||||||
| Class III | (7,935,155 | ) | (75,886,885 | ) | |||||||
| (10,535,234 | ) | (81,961,195 | ) | ||||||||
| Net share transactions (Note 7): | |||||||||||
| Class III | (22,811,861 | ) | (41,624,038 | ) | |||||||
| Purchase premiums and redemption fees (Notes 2 and 7): | |||||||||||
| Class III | 301,595 | 613,631 | |||||||||
| Total increase (decrease) in net assets resulting from net share transactions, purchase premiums and redemption fees | (22,510,266 | ) | (41,010,407 | ) | |||||||
| Total increase (decrease) in net assets | (120,183,070 | ) | (96,527,566 | ) | |||||||
| Net assets: | |||||||||||
| Beginning of period | 220,359,130 | 316,886,696 | |||||||||
| End of period (including accumulated undistributed net investment income of $2,148,460 and distributions in excess of net investment income of $134,693, respectively) | $ | 100,176,060 | $ | 220,359,130 | |||||||
See accompanying notes to the financial statements.
8
GMO Taiwan Fund
(A Series of GMO Trust)
Financial Highlights
(For a Class III share outstanding throughout each period)
| Year Ended February 28/29, | |||||||||||||||||||||||
| 2009 | 2008 | 2007 | 2006 | 2005 | |||||||||||||||||||
| Net asset value, beginning of period | $ | 22.42 | $ | 30.98 | $ | 28.34 | $ | 26.79 | $ | 29.67 | |||||||||||||
| Income (loss) from investment operations: | |||||||||||||||||||||||
| Net investment income (loss)† | 0.59 | 0.61 | 0.46 | 0.52 | 0.13 | ||||||||||||||||||
| Net realized and unrealized gain (loss) | (10.80 | ) | 1.50 | 4.32 | 1.91 | (1.45 | ) | ||||||||||||||||
| Total from investment operations | (10.21 | ) | 2.11 | 4.78 | 2.43 | (1.32 | ) | ||||||||||||||||
| Less distributions to shareholders: | |||||||||||||||||||||||
| From net investment income | (0.30 | ) | (0.85 | ) | (0.39 | ) | (0.59 | ) | — | ||||||||||||||
| From net realized gains | (0.85 | ) | (9.82 | ) | (1.75 | ) | (0.29 | ) | (1.56 | ) | |||||||||||||
| Total distributions | (1.15 | ) | (10.67 | ) | (2.14 | ) | (0.88 | ) | (1.56 | ) | |||||||||||||
| Net asset value, end of period | $ | 11.06 | $ | 22.42 | $ | 30.98 | $ | 28.34 | $ | 26.79 | |||||||||||||
| Total Return(a) | (47.14 | )% | 6.97 | %(b) | 17.12 | % | 9.13 | % | (3.82 | )% | |||||||||||||
| Ratios/Supplemental Data: | |||||||||||||||||||||||
| Net assets, end of period (000's) | $ | 100,176 | $ | 220,359 | $ | 316,887 | $ | 291,250 | $ | 224,466 | |||||||||||||
| Net expenses to average daily net assets | 1.32 | %(c) | 1.29 | %(c) | 1.26 | % | 1.28 | % | 1.34 | % | |||||||||||||
| Net investment income to average daily net assets | 3.42 | % | 1.98 | % | 1.56 | % | 1.95 | % | 0.53 | % | |||||||||||||
| Portfolio turnover rate | 88 | % | 94 | % | 41 | % | 31 | % | 88 | % | |||||||||||||
| Purchase premiums and redemption fees consisted of the following per share amounts:† | $ | 0.03 | $ | 0.06 | $ | 0.03 | $ | 0.04 | $ | 0.05 | |||||||||||||
(a) Calculation excludes purchase premiums and redemption fees which are borne by the shareholder and assumes the effect of reinvested distributions.
(b) The effect of losses in the amount of $56,687, resulting from compliance violations and the Manager's reimbursement of such losses, had no effect on the total return.
(c) The net expense ratio does not include the effect of expense reductions.
† Calculated using average shares outstanding throughout the period.
See accompanying notes to the financial statements.
9
GMO Taiwan Fund
(A Series of GMO Trust)
Notes to Financial Statements
February 28, 2009
1. Organization
GMO Taiwan Fund (the "Fund") is a series of GMO Trust (the "Trust"). The Fund is registered under the Investment Company Act of 1940, as amended, as an open-end, non-diversified management investment company. The Fund is advised and managed by Grantham, Mayo, Van Otterloo & Co. LLC (the "Manager" or "GMO"). The Trust was established as a Massachusetts business trust under the laws of The Commonwealth of Massachusetts on June 24, 1985. The Declaration of Trust permits the Trustees of the Trust ("Trustees") to create an unlimited number of series of shares ("Funds") and to subdivide Funds into classes.
The Fund seeks high total return. The Fund seeks to achieve its objective by outperforming the MSCI Taiwan Index. The Fund typically makes equity investments in companies doing business in, or otherwise tied economically to, Taiwan.
Shares of the Fund are not publicly offered and are principally available to other GMO funds and certain accredited investors.
2. Significant accounting policies
The following is a summary of significant accounting policies followed by the Fund in the preparation of its financial statements. These policies are in conformity with accounting principles generally accepted in the United States of America ("U.S. GAAP") and have been consistently followed by the Fund in preparing its financial statements. The preparation of financial statements in accordance with U.S. GAAP requires management to make estimates and assumptions that affect the reported amounts and disclosures in the financial statements. Actual results could differ from those estimates. The accounting records of the Fund are maintained in U.S. dollars.
Portfolio valuation
Securities listed on a securities exchange for which market quotations are readily available are valued at the last sale price or official closing price on each business day, or if there is no such reported sale or official closing price, at the most recent quoted bid price. Unlisted securities for which market quotations are readily available are generally valued at the most recent quoted bid price. Debt instruments with a remaining maturity of sixty days or less are generally valued at amortized cost, which approximates fair value. Shares of investment funds are generally valued at their net asset value. Securities for which quotations are not readily available or whose values the Manager has determined to be unreliable are valued at fair value as determined in good faith by the Trustees or persons acting at their direction pursuant to procedures approved by the Trustees. By its nature, a fair value price is a good faith estim ate of the value of a security at a given point in time and may not reflect the value that would be realized if the security were sold. The difference between a fair value price and the value realized upon a sale could be material. Because many foreign equity securities markets and exchanges close prior to the close of the New York Stock Exchange ("NYSE"), closing prices for foreign securities in those markets or on those exchanges do not reflect the events that occur after that close but before the close of the NYSE. As a
10
GMO Taiwan Fund
(A Series of GMO Trust)
Notes to Financial Statements — (Continued)
February 28, 2009
result, the Fund generally values foreign equity securities using fair value prices, which are based on adjustments to closing prices supplied by a third party vendor based on that vendor's proprietary models. As of February 28, 2009, 97.82% of the net assets of the Fund were valued using fair value prices based on models used by a third party vendor.
In September 2006, the Financial Accounting Standards Board ("FASB") issued Statement of Financial Accounting Standards No. 157, Fair Value Measurements ("SFAS 157"). SFAS 157 is effective for the Fund's current fiscal year. While the adoption of SFAS 157 does not have an effect on the Fund's net asset value, it does require additional disclosures about fair value measurements. SFAS 157 establishes a three-level hierarchy for disclosure of fair value measurements. The valuation hierarchy is based upon the reliability of inputs to the valuation of the Fund's investments. The three levels are defined as follows:
Level 1 – Valuations based on quoted prices for identical securities in active markets.
Level 2 – Valuations determined using other significant direct or indirect observable inputs.
Level 3 – Valuations based on inputs that are unobservable and significant. The Fund utilized the following fair value techniques on Level 3 investments: The Fund considered certain bankrupt securities to be worthless.
The inputs or methodology used for valuing securities are not necessarily an indication of the risk associated with investing in those securities.
The following is a summary of the fair valuations according to inputs used as of February 28, 2009 in valuing the Fund's investments:
| Asset Valuation Inputs | Investments in Securities | Other Financial Instruments | |||||||||
| Level 1 - Quoted Prices | $ | 1,897,628 | $ | — | |||||||
| Level 2 - Other Significant Observable Inputs | 97,994,660 | — | |||||||||
| Level 3 - Significant Unobservable Inputs | 1,320 | — | |||||||||
| Total | $ | 99,893,608 | $ | — | |||||||
| Liability Valuation Inputs | Investments in Securities | Other Financial Instruments | |||||||||
| Level 1 - Quoted Prices | $ | — | $ | — | |||||||
| Level 2 - Other Significant Observable Inputs | — | — | |||||||||
| Level 3 - Significant Unobservable Inputs | — | — | |||||||||
| Total | $ | — | $ | — | |||||||
11
GMO Taiwan Fund
(A Series of GMO Trust)
Notes to Financial Statements — (Continued)
February 28, 2009
The following is a reconciliation of investments in which significant unobservable inputs (Level 3) were used in determining value:
| Investments in Securities | Other Financial Instruments | ||||||||||
| Balance as of February 29, 2008 | $ | 960 | $ | — | |||||||
| Realized gain (loss) | — | — | |||||||||
| Change in unrealized appreciation/depreciation | (2,435 | ) | — | ||||||||
| Net purchases (sales) | — | — | |||||||||
| Net transfers in and/or out of Level 3 | 2,795 | — | |||||||||
| Balance as of February 28, 2009 | $ | 1,320 | $ | — | |||||||
Foreign currency translation
The market values of foreign securities, currency holdings and related assets and liabilities are translated to U.S. dollars based on the 4 p.m. New York time exchange rates each business day. Income and expenses denominated in foreign currencies are translated at the 4 p.m. New York time exchange rates on the business day the income and expenses are accrued or incurred. The Fund does not isolate realized and unrealized gains and losses attributable to changes in exchange rates from gains and losses that arise from changes in the market value of investments. Such fluctuations are included with net realized and unrealized gain or loss on investments. Net realized gains and losses on foreign currency transactions represent gains and losses on disposition of currencies and forward currency contracts, currency gains and losses realized between the trade and settlement dates on securities transactions, and the difference between the amount of investment income and foreign withholding taxes recorded on the Fund's accounting records and the U.S. dollar equivalent amounts actually received or paid.
Forward currency contracts
The Fund may enter into forward currency contracts including forward cross currency contracts. A forward currency contract is an agreement between two parties to buy and sell a currency at a set price on a future date. The market value of a forward currency contract fluctuates with changes in forward currency exchange rates. Forward currency contracts are marked to market daily using rates supplied by a quotation service and changes in value are recorded by the Fund as an unrealized gain or loss. Realized gains or losses equal to the difference between the value of the contract at the time it was opened and the value at the time it was closed are recorded upon delivery or receipt of the currency or, if a forward currency contract is offset by entering into another forward currency contract with the same broker, upon settlement of the net gain or loss. These contracts may involve market risk in excess of the unrealized gain or lo ss reflected in the Fund's Statement of Assets and Liabilities. They expose the Fund to the risk of unfavorable movements in currency values and the risk that the counterparty will be unable or unwilling to meet the terms of the contracts. The Fund had no forward currency contracts outstanding at the end of the period.
12
GMO Taiwan Fund
(A Series of GMO Trust)
Notes to Financial Statements — (Continued)
February 28, 2009
Futures contracts
The Fund may purchase and sell futures contracts. Upon entering into a futures contract, the Fund is required to deposit cash, U.S. government and agency obligations, or other liquid assets with the futures clearing broker in accordance with the initial margin requirements of the broker or exchange. In addition, the Fund maintains cash or securities in an amount that at least equals the net amount payable in the event the Fund must deliver the full amount of the contract. Futures contracts are marked to market daily and an appropriate payable or receivable for the change in value ("variation margin") is recorded by the Fund. The payable or receivable is settled on the following business day. Gains or losses are recognized but not considered realized until the contracts expire or are closed. Futures contracts involve, to varying degrees, risk of loss in excess of the variation margin disclosed in the Statement of Assets and Liabi lities. Under some circumstances, futures exchanges may establish daily limits on the amount that the price of a futures contract can vary from the previous day's settlement price, thereby effectively preventing liquidation of unfavorable positions. Losses may arise from changes in the value of the underlying instrument if the Fund is unable to liquidate a futures position due to an illiquid secondary market for the contract or the imposition of price limits, or if counterparties do not perform under the contract terms. Futures contracts are generally valued at the settlement price established each day by the board of trade or exchange on which they are traded. The Fund had no futures contracts outstanding at the end of the period.
Options
The Fund may write (i.e., sell) call and put options. Writing options alters the Fund's exposure to the underlying instrument by, in the case of a call option, obligating the Fund to sell the underlying instrument at a set price to the option-holder and, in the case of a put option, obligating the Fund to purchase the underlying instrument at a set price from the option-holder. In the case of an index option, settlement will be in cash. When the Fund writes a call or put option, an amount equal to the premium received is recorded as a liability and subsequently marked to market to reflect the current value of the option written. Premiums received from writing options that expire are treated as realized gains. Premiums received from writing options that are exercised or closed are deducted from the amounts paid on the underlying future, security or currency transaction to determine the realized gain or loss. The Fund as a writer of an option has no control over whether the underlying future, security or currency may be sold (call) or purchased (put) and as a result bears the market risk of an unfavorable change in the price of the future, security or currency underlying the option. In the event that the Fund writes uncovered put or call options (i.e. options for investments that the Fund does not own), it bears the risk of substantial losses if the price of the underlying instrument increases during the term of the option. Options expose the Fund to the risk the Fund may not be able to enter into a closing transaction because of an illiquid market. The Fund had no open written option contracts during the period.
The Fund may also purchase put and call options. Purchasing options alters the Fund's exposure to the underlying instrument by, in the case of a call option, entitling the Fund to purchase the underlying instrument at a set price from the writer of the option and, in the case of a put option, entitling the Fund to sell the underlying instrument at a set price to the writer of the option. The Fund pays a premium for a
13
GMO Taiwan Fund
(A Series of GMO Trust)
Notes to Financial Statements — (Continued)
February 28, 2009
purchased option. That premium is disclosed in the Schedule of Investments and is subsequently marked to market to reflect the current value of the option. Premiums paid for purchasing options that expire are treated as realized losses. Premiums paid for purchasing options that are exercised or closed are deducted from the proceeds on the closing transaction to determine the realized gain or loss. The risk associated with purchasing put and call options is limited to the premium paid. The Fund had no purchased option contracts outstanding at the end of the period.
The Fund values exchange traded options at the last sale price, or if no sale is reported, the last bid price for options it has purchased and the last ask price for options it has written. The Fund values options traded over-the-counter using inputs provided by primary pricing sources and industry standard models.
Indexed securities
The Fund may invest in indexed securities. Indexed securities are securities whose redemption values and/or coupons are linked to the prices of a specific instrument or financial statistic. The Fund uses indexed securities to increase or decrease its exposure to different underlying instruments and to gain exposure to markets in which investing through conventional securities is difficult. The Fund had no indexed securities outstanding at the end of the period.
Swap agreements
The Fund may enter into various types of swap agreements, including without limitation, interest rate, total return, credit default and variance swap agreements. A swap agreement is an agreement to exchange the return generated by one instrument for the return generated by another instrument. When entering into a swap agreement, the Fund and/or the swap counterparty may post or receive cash or securities as collateral. The party posting the collateral typically receives the interest associated with or payments related to the collateral and has the risk of loss related to the collateral.
Interest rate swap agreements involve an exchange by the parties of their respective commitments to pay or right to receive interest, e.g., an exchange of floating rate interest payments for fixed rate interest payments with respect to the notional amount of principal.
Total return swap agreements involve a commitment by one party to pay interest to the other party in exchange for a payment to it from the other party based on the return of a reference instrument (e.g., a security or basket of securities), both based on notional amounts. To the extent the return of the reference instrument exceeds or falls short of the interest payments, one party will receive a payment from or make a payment to the other party.
In a credit default swap agreement, one party makes payments to another party in exchange for the right to receive a specified return if a credit event occurs with respect to a referenced entity or entities. Buying credit default protection reduces the buyer's exposure in the event of an issuer's default (e.g., it reduces risk where a party owns a security issued by or otherwise has exposure to the issuer). Selling credit default
14
GMO Taiwan Fund
(A Series of GMO Trust)
Notes to Financial Statements — (Continued)
February 28, 2009
protection subjects the seller to exposure to an issuer's default. A seller of credit default protection receives payments in return for its obligation to pay the principal amount of a debt security (or other agreed-upon value) to the other party upon the occurrence of a credit event (e.g., issuer default or similar event). If no credit event occurs, the seller has no payment obligations. For credit default swap agreements on asset-backed securities, a credit event may be triggered by such events as the issuer's failure to pay interest or principal, an agreement of the holders of an asset-backed security to a maturity extension, a rating downgrade on the security or a write-down on the collateral underlying the security. For credit default swap agreements on corporate or sovereign issuers, a credit event may be triggered by such events as the issuer's bankruptcy, failure to pay interest or principal, repudiation/moratorium or re structuring.
Variance swap agreements involve an agreement by two parties to exchange cash flows based on the measured variance (or square of volatility) of a specified underlying asset. One party agrees to exchange a "fixed rate" or strike price payment for the "floating rate" or realized price variance on the underlying asset with respect to the notional amount. At inception, the strike price chosen is generally fixed at a level such that the fair value of the swap is zero. At the expiration date, the amount paid by one party to the other is the difference between the realized price variance of the underlying asset and the strike price multiplied by the notional amount. A receiver of the realized price variance would receive a payment when the realized price variance of the underlying asset is greater than the strike price and would make a payment when that variance is less than the strike price. A payer of the realized price variance woul d make a payment when the realized price variance of the underlying asset is greater than the strike price and would receive a payment when that variance is less than the strike price. This type of agreement is essentially a forward contract on the future realized price variance of the underlying asset.
The Fund prices its swap agreements daily using models that may incorporate quotations from market makers and records the change in value, if any, as unrealized gain or loss in the Statement of Operations. Payments received or made on swap agreements are recorded as realized gain or loss in the Statement of Operations. Gains or losses are realized upon termination of the swap agreements.
Swap agreements often are not actively traded on financial markets. The values assigned to them may differ significantly from the values that would be realized upon termination, and the differences could be material. Entering into swap agreements involves credit, legal, market and documentation risk that is not reflected in the amounts reported in the Statement of Assets and Liabilities. Such risks include the possibility that the party with whom the Fund contracts may default on its obligations to perform or disagree as to the meaning of contractual terms, or that the collateral that party posts may be insufficient or not timely received by the Fund. Credit risk may be particularly acute in an environment where financial services firms are exposed to systemic risks of the type evidenced by the insolvency of Lehman Brothers and subsequent market disruptions. The Fund had no swap agreements outstanding at the end of the period.
15
GMO Taiwan Fund
(A Series of GMO Trust)
Notes to Financial Statements — (Continued)
February 28, 2009
Securities lending
The Fund may lend its securities to qualified brokers. The loans are collateralized with cash or liquid securities with a market value at least equal to the market value of the securities upon entering into the loan. As with other extensions of credit, the Fund may bear the risk of loss with respect to the investment of the collateral, the risk of delay in and/or inability to exercise its rights with respect to the collateral, and the risk of delay in recovery or loss of rights in the loaned securities should the borrower of the securities fail financially. If a loan is collateralized by U.S. government securities, the Fund receives a fee from the borrower. If a loan is collateralized by cash, the Fund typically invests the cash collateral for its own account. For the year from March 1, 2008 through February 28, 2009, the Fund did not participate in securities lending.
Taxes and distributions
The Fund intends to qualify each tax year as a regulated investment company under Subchapter M of the Internal Revenue Code of 1986, as amended (the "Code"). The Fund intends to distribute substantially all of its net investment income and all of its net realized short-term and long-term capital gain, if any, after giving effect to any available capital loss carryforwards for U.S. federal income tax purposes. Therefore, no provision for U.S. federal income or excise tax is necessary. Taxes on Taiwan-source interest and dividend income are withheld in accordance with applicable Taiwanese law.
The Fund's policy is to declare and pay distributions from net investment income, if any, semiannually, and from net realized short-term and long-term capital gain, if any, at least annually. All distributions are paid in shares of the Fund, at net asset value, unless the shareholder elects to receive cash distributions. Distributions to shareholders are recorded by the Fund on the ex-dividend date.
Foreign taxes paid by the Fund may be treated, to the extent permissible under the Code and if the Fund so elects, as if paid by the shareholders of the Fund.
The Fund is currently subject to a Taiwanese security transaction tax of 0.30% of the transaction amount on equities, which must be paid by the Fund upon the sale or transfer of any portfolio securities subject to that tax.
Income and capital gain distributions are determined in accordance with U.S. federal income tax regulations, which may differ from U.S. GAAP. Certain capital accounts in the financial statements are periodically adjusted for permanent differences in order to reflect their tax character. These adjustments have no impact on net assets or net asset value per share. Temporary differences that arise from recognizing certain items of income, expense, gain or loss in different periods for financial statement and tax purposes will reverse at some time in the future. Distributions in excess of net investment income or net realized gains are temporary over-distributions for financial statement purposes resulting from differences in the recognition or classification of income or distributions for financial statement and tax purposes.
16
GMO Taiwan Fund
(A Series of GMO Trust)
Notes to Financial Statements — (Continued)
February 28, 2009
U.S. GAAP and tax accounting differences primarily relate to capital loss carryforwards, losses on wash sale transactions, foreign currency transactions, and post-October capital losses.
The following reclassification represents the amount necessary to report the stated components of net assets on a tax basis, excluding certain temporary differences, as of February 28, 2009. The financial highlights exclude these adjustments.
| Accumulated Undistributed Net Investment Income | Distributions in Excess of Net Realized Gain | Paid-in Capital | |||||||||
| $ | (539,503 | ) | $ | 539,503 | $ | — | |||||
The tax character of distributions declared to shareholders is as follows:
| 2/28/2009 | 2/29/2008 | ||||||||||
| Ordinary income (including any net short-term capital gain) | $ | 2,614,212 | $ | 16,985,992 | |||||||
| Net long-term capital gain | 7,921,022 | 64,975,203 | |||||||||
| Total distributions | $ | 10,535,234 | $ | 81,961,195 | |||||||
Distributions in excess of tax basis earnings and profits, if significant, are reported in the financial statements as a return of capital for tax purposes.
As of February 28, 2009, the components of distributable earnings on a tax basis consisted of the following:
| Undistributed ordinary income (including any net short-term capital gain) | $ | 2,158,489 | |||||
As of February 28, 2009, the Fund elected to defer to March 1, 2009 post-October capital losses of $32,757,923.
As of February 28, 2009, the Fund had capital loss carryforwards available to offset future realized gains if any, to the extent permitted by the Code. Utilization of the capital loss carryforwards could be subject to limitations imposed by the Code related to share ownership activity. Such losses expire as follows:
| 2/28/2017 | $ | (15,146,428 | ) | ||||
| Total | $ | (15,146,428 | ) | ||||
17
GMO Taiwan Fund
(A Series of GMO Trust)
Notes to Financial Statements — (Continued)
February 28, 2009
As of February 28, 2009, the approximate cost for U.S. federal income tax purposes and gross and net unrealized appreciation (depreciation) in value of investments were as follows:
| Aggregate Cost | Gross Unrealized Appreciation | Gross Unrealized (Depreciation) | Net Unrealized Appreciation (Depreciation) | ||||||||||||
| $ | 135,249,833 | $ | 1,130,404 | $ | (36,486,629 | ) | $ | (35,356,225 | ) | ||||||
The Fund is subject to the provisions of Financial Accounting Standards Board Interpretation No. 48 ("FIN 48"), Accounting for Uncertainty in Income Taxes — an Interpretation of FASB Statement No. 109. FIN 48 sets forth a minimum threshold for financial statement recognition of a tax position taken or expected to be taken in a tax return that could affect the Fund's financial statements. The Fund did not have any unrecognized tax benefits or liabilities at February 28, 2009, nor did it have any increases or decreases in unrecognized tax benefits or liabilities for the period then ended. The Fund is subject to examination prior to the expiration of the statute of limitations by U.S. federal and state tax authorities for tax returns filed.
Security transactions and related investment income
Security transactions in the financial statements are accounted for on the trade date. Dividend income, net of applicable foreign withholding taxes, if any, is recorded on the ex-dividend date or, if later, when the Fund is informed of the ex-dividend date. Interest income is recorded on the accrual basis and is adjusted for the amortization of premiums and accretion of discounts. Principal on inflation indexed securities is adjusted for inflation and any increase or decrease is recorded as interest income or loss. Income is not recognized on securities for which collection is not expected. Non-cash dividends, if any, are recorded at the fair market value of the asset received. In determining the net gain or loss on securities sold, the Fund uses the identified cost basis for the purposes of determining the cost basis.
Taiwanese companies typically declare dividends in the third calendar quarter of each year.
Dividend and interest income generated in Taiwan is subject to a 20% withholding tax. Stock dividends received (except those which have resulted from capitalization of capital surplus) are taxable at 20% of the par value of the stock dividends received.
Expenses
The majority of the expenses of the Trust are directly identifiable to an individual fund. Expenses that are not readily identifiable to a specific fund are allocated taking into consideration, among other things, the nature and type of expense and the relative size of the funds.
Brown Brothers Harriman & Co. ("BBH") serves as custodian and fund accounting agent of the Fund. State Street Bank and Trust Company ("State Street") serves as transfer agent of the Fund. BBH and State Street's
18
GMO Taiwan Fund
(A Series of GMO Trust)
Notes to Financial Statements — (Continued)
February 28, 2009
fees may be reduced by an earnings allowance calculated on the average daily cash balances the Fund maintains with each agent. The Fund receives the benefit of the earnings allowance. In addition, Goldman Sachs Agency Lending, the Fund's securities lending agent, has agreed to reimburse the Fund for certain transactional expenses related to securities lending activity. Credit balances or expense reimbursements used to reduce fees, if any, are reported as a reduction of expenses in the Statement of Operations.
Purchases and redemptions of Fund shares
As of February 28, 2009, the premium on cash purchases of Fund shares was 0.15% of the amount invested and the fee on cash redemptions was 0.45% of the amount redeemed. The Fund may impose a new purchase premium and/or redemption fee, or modify or eliminate an existing purchase premium and/or redemption fee, at any time. If the Manager determines that any portion of a cash purchase or redemption is offset by a corresponding cash redemption or purchase on the same day, the Fund will ordinarily waive or reduce the purchase premium or redemption fee with respect to that portion. In addition, the Fund may waive or reduce the purchase premium or redemption fee in extraordinary circumstances if the purchase or redemption will not cause the Fund to incur transaction costs. All purchase premiums and redemption fees are paid to the Fund and recorded by the Fund as paid-in capital. The Fund will waive or reduce the purchase premium relati ng to the in-kind portion of a purchase transaction except for estimated or known transaction costs (e.g. stamp duties and transfer taxes) incurred by the Fund as a result of the transfer of the purchasing shareholder's securities to the Fund. In-kind redemption transactions are generally not subject to redemption fees except when they include a cash component. However, when a substantial portion of a Fund is being redeemed, the Fund may charge a redemption fee based on estimated or known transaction costs resulting from those redemptions. The Fund charges no premium for reinvested distributions.
Investment risks
Investments in emerging countries, such as Taiwan, present certain risks that are not presented by many other securities. Many emerging countries are subject to political and/or economic instability which may result in the Fund's inability to collect on a timely basis, or in full, principal and interest payments. The securities markets of emerging countries are generally smaller and less developed than the securities markets of the U.S. and developed foreign markets. Further, countries may expropriate or impose various types of foreign currency regulations or controls that impede the Fund's ability to repatriate amounts it receives. These factors may result in significant volatility in the values of the Fund's holdings. Due to the liquidity of the Taiwanese markets, the Fund may not be able to realize in an actual sale amounts approximating those used to value its holdings. The Fund may concentrate investments in the securities of a small number of issuers. As a result, the value of the Fund's shares can be expected to change in light of factors affecting those issuers and may fluctuate more widely than the value of shares of a portfolio that invests in a broader range of securities.
The Manager is registered with the Securities and Futures Commission of Taiwan as a Qualified Foreign Institutional Investor ("QFII") in Taiwan and is therefore authorized to invest directly in the Taiwanese
19
GMO Taiwan Fund
(A Series of GMO Trust)
Notes to Financial Statements — (Continued)
February 28, 2009
securities market, subject to certain limitations including a maximum investment amount. The Fund is listed as a sub-account under the Manager's QFII license and is authorized to invest directly in the Taiwanese securities market. The Fund's ability to continue to invest directly in Taiwan is subject to the risk that the Manager's QFII license or the Fund's sub-account under the Manager's QFII license may be terminated or suspended by the Securities and Futures Commission. If the license were terminated or suspended, the Fund could be required to liquidate or seek exposure to the Taiwanese market through the purchase of American Depositary Receipts ("ADRs") and Global Depository Receipts ("GDRs"), shares of other funds which are licensed to invest directly, or derivative instruments.
Recently issued accounting pronouncement
In March 2008, FASB issued Statement of Financial Accounting Standards No. 161, Disclosures about Derivative Instruments and Hedging Activities ("SFAS 161"). SFAS 161 is effective for fiscal years and interim periods beginning after November 15, 2008. SFAS 161 requires enhanced disclosures about the Fund's derivative and hedging activities. The Manager is currently evaluating the impact the adoption of SFAS 161 will have on the Fund's financial statement disclosures.
3. Fees and other transactions with affiliates
GMO receives a management fee for the services it provides to the Fund. That fee is paid monthly at the annual rate of 0.81% of average daily net assets. The Fund has adopted a Shareholder Service Plan under which the Fund pays GMO a shareholder service fee for client and shareholder service, reporting, and other support. Pursuant to the Shareholder Service Plan, the shareholder service fee is calculated based on average daily net assets at the annual rate of 0.15% for class III shares.
The Fund's portion of the fees paid by the Trust to the Trust's independent Trustees and Chief Compliance Officer ("CCO") during the year ended February 28, 2009 was $1,794 and $1,124, respectively. The compensation and expenses of the CCO are included in miscellaneous expenses in the Statement of Operations. The Fund paid no remuneration to any other officer of the Trust.
4. Purchases and sales of securities
Cost of purchases and proceeds from sales of securities, excluding short-term investments, for the year ended February 28, 2009 aggregated $135,340,851 and $159,016,520, respectively.
5. Guarantees
In the normal course of business the Fund enters into contracts with third-party service providers that contain a variety of representations and warranties and that provide general indemnifications. The Fund's maximum exposure under these arrangements is unknown, as it involves future claims that may be made against the Fund that have not yet occurred. Based on experience, management is of the view that the risk
20
GMO Taiwan Fund
(A Series of GMO Trust)
Notes to Financial Statements — (Continued)
February 28, 2009
of loss in connection with its indemnification obligations is remote; however, there can be no assurance that such obligations will not result in material liabilities that adversely affect the Fund.
6. Principal shareholders and related parties
As of February 28, 2009, 98.91% of the outstanding shares of the Fund were held by two shareholders, each holding more than 10% of the Fund's outstanding shares. On that date, no other shareholder owned more than 10% of the outstanding shares of the Fund. Redemptions from (or investments into) the Fund by or on behalf of these large shareholders may have a material effect on the Fund.
As of February 28, 2009, no shares of the Fund were held by senior management of the Manager and GMO Trust officers and all of the Fund's shares were held by accounts for which the Manager had investment discretion.
7. Share transactions
The Declaration of Trust permits the Trust to issue an unlimited number of shares of beneficial interest (without par value). Transactions in Fund shares were as follows:
| Year Ended February 28, 2009 | Year Ended February 29, 2008 | ||||||||||||||||||
| Class III: | Shares | Amount | Shares | Amount | |||||||||||||||
| Shares sold | 2,164,635 | $ | 25,246,074 | 294,310 | $ | 9,579,509 | |||||||||||||
| Shares issued to shareholders in reinvestment of distributions | 646,035 | 10,535,234 | 3,387,026 | 81,961,194 | |||||||||||||||
| Shares repurchased | (3,583,100 | ) | (58,593,169 | ) | (4,083,581 | ) | (133,164,741 | ) | |||||||||||
| Purchase premiums | — | 37,926 | — | 14,390 | |||||||||||||||
| Redemption fees | — | 263,669 | — | 599,241 | |||||||||||||||
| Net increase (decrease) | (772,430 | ) | $ | (22,510,266 | ) | (402,245 | ) | $ | (41,010,407 | ) | |||||||||
21
Report of Independent Registered Public Accounting Firm
To the Trustees of GMO Trust and the Shareholders of
GMO Taiwan Fund:
In our opinion, the accompanying statement of assets and liabilities, including the schedule of investments, and the related statements of operations and of changes in net assets and the financial highlights present fairly, in all material respects, the financial position of GMO Taiwan Fund (the "Fund") at February 28, 2009, the results of its operations for the year then ended, the changes in its net assets for each of the two years in the period then ended and the financial highlights for each of the five years in the period then ended, in conformity with accounting principles generally accepted in the United States of America. These financial statements and financial highlights (hereafter referred to as "financial statements") are the responsibility of the Fund's management. Our responsibility is to express an opinion on these financial statements based on our audits. We conducted our audits of these financial statements in a ccordance with the standards of the Public Company Accounting Oversight Board (United States). Those standards require that we plan and perform the audit to obtain reasonable assurance about whether the financial statements are free of material misstatement. An audit includes examining, on a test basis, evidence supporting the amounts and disclosures in the financial statements, assessing the accounting principles used and significant estimates made by management, and evaluating the overall financial statement presentation. We believe that our audits, which included confirmation of securities at February 28, 2009 by correspondence with the custodian and brokers, provide a reasonable basis for our opinion.
PricewaterhouseCoopers LLP
Boston, Massachusetts
April 29, 2009
22
GMO Taiwan Fund
(A Series of GMO Trust)
Fund Expenses
February 28, 2009 (Unaudited)
Expense Examples: The following information is in relation to expenses for the six month period ended February 28, 2009.
As a shareholder of the Fund, you may incur two types of costs: (1) transaction costs, including purchase premiums and redemption fees; and (2) ongoing costs, including management fees, shareholder service fees, and other Fund expenses. This example is intended to help you understand your ongoing costs (in dollars) of investing in the Fund and to compare these costs with the ongoing costs of investing in other mutual funds.
These examples are based on an investment of $1,000 invested at the beginning of the period and held for the entire period, September 1, 2008 through February 28, 2009.
Actual Expenses
The first line of the table below provides information about actual account values and actual expenses. You may use the information in this line, together with the amount you invested, to estimate the expenses that you paid over the period. Simply divide your account value by $1,000 (for example, a $10,000,000 account value divided by $1,000 = 10,000), then multiply the result by the number in the first line under the heading entitled "Net Expense Incurred" to estimate the expenses you paid on your account during this period.
Hypothetical Example for Comparison Purposes
The second line of the table below provides information about hypothetical account values and hypothetical expenses based on the Fund's actual expense ratio and an assumed rate of return of 5% per year before expenses, which is not the Fund's actual return. The hypothetical account values and expenses may not be used to estimate the actual ending account balance or expenses you paid for the period. You may use this information to compare the ongoing costs of investing in the Fund with other funds. To do so, compare this 5% hypothetical example with the 5% hypothetical examples that appear in the shareholder reports of other funds.
Please note that the expenses shown in the table are meant to highlight your ongoing costs only and do not reflect any transactional costs, such as purchase premiums and redemption fees. Therefore, the second line of the table is useful in comparing ongoing costs only, and will not help you determine the relative total costs of owning different funds. In addition, if these transactional costs were included, your costs would have been higher.
| Annualized Net Expense Ratio | Beginning Account Value | Ending Account Value | Net Expense Incurred* | ||||||||||||||||
| Class III | |||||||||||||||||||
| 1) Actual | 1.29 | % | $ | 1,000.00 | $ | 621.10 | $ | 5.19 | |||||||||||
| 2) Hypothetical | 1.29 | % | $ | 1,000.00 | $ | 1,018.40 | $ | 6.46 | |||||||||||
* Expenses are calculated using the Class's annualized net expense ratio for the six months ended February 28, 2009, multiplied by the average account value over the period, multiplied by 181 days in the period, divided by 365 days in the year.
23
GMO Taiwan Fund
(A Series of GMO Trust)
Tax Information for the Tax Year Ended February 28, 2009 (Unaudited)
The Fund will notify shareholders of amounts for use in preparing 2009 income tax forms in January 2010.
The Fund's distributions to shareholders include $7,921,022 from long-term capital gains.
During the year ended February 28, 2009, the Fund paid foreign taxes of $1,860,426 and recognized foreign source income of $9,322,248.
24
Trustees and Officers (Unaudited)
The following tables list the Trust's Trustees and Officers as of the date of this report; their address and date of birth ("DOB"); their position with the Trust; the length of time holding that position with the Trust; their principal occupation(s) during the past five years; the number of portfolios in the fund complex they oversee; and other directorships they hold in companies subject to registration or reporting requirements of the Securities Exchange Act of 1934 (generally called "public companies") or in registered investment companies. The Trust's Statement of Additional Information ("SAI") includes additional information about the Trust's trustees, including changes subsequent to the date of the report. The SAI is available, without charge, upon request by writing GMO, c/o GMO Trust, 40 Rowes Wharf, Boston, MA 02110.
Independent Trustees:
| Name, Address, and DOB | Position(s) Held with Trust | Term of Office1 and Length of Time Served | Principal Occupation(s) During Past Five Years | Number of Portfolios in Fund Complex Overseen by Trustee | Other Directorships Held by Trustee | ||||||||||||||||||
| Donald W. Glazer, Esq. c/o GMO Trust 40 Rowes Wharf Boston, MA 02110 DOB: 07/26/1944 | Chairman of the Board of Trustees | Chairman of the Board of Trustees since March 2005; Lead Independent Trustee (September 2004 – March 2005); Trustee since December 2000. | Consultant – Law and Business2; Author of Legal Treatises. | 59 | None. | ||||||||||||||||||
1 Each Trustee is elected to serve during the continued lifetime of the Trust until he/she dies, resigns or is removed, or if sooner, until the next meeting of Shareholders called for the purpose of electing Trustees and until the election and qualification of his/her successor.
2 As part of Mr. Glazer's work as a consultant, he provides part-time consulting services to Goodwin Procter LLP ("Goodwin"). Goodwin has provided legal services to Renewable Resources, LLC, an affiliate of GMO; GMO, in connection with its relationship with Renewable Resources; and funds managed by Renewable Resources. Mr. Glazer has represented that he has no financial interest in, and is not involved in the provision of, such legal services. In the calendar years ended December 31, 2007 and December 31, 2008, these entities paid $789,416 and $183,864 respectively, in legal fees and disbursements to Goodwin. In correspondence with the Staff of the Securities and Exchange Commission beginning in August 2006, the Independent Trustees' legal counsel provided the Staff with information regarding Mr. Glazer's relationship with Goodwin and h is other business activities. On September 11, 2007, based on information that had been given to the Staff as of that date, the Staff provided oral no-action assurance consistent with the opinion of the Independent Trustees' legal counsel that Mr. Glazer is not an "interested person" of the Trust.
25
Independent Trustees — (Continued)
| Name, Address, and DOB | Position(s) Held with Trust | Term of Office1 and Length of Time Served | Principal Occupation(s) During Past Five Years | Number of Portfolios in Fund Complex Overseen by Trustee | Other Directorships Held by Trustee | ||||||||||||||||||
| W. Nicholas Thorndike c/o GMO Trust 40 Rowes Wharf Boston, MA 02110 DOB: 03/28/1933 | Trustee | Since March 2005. | Director or trustee of various corporations and charitable organizations, including Courier Corporation (a book publisher and manufacturer) (July 1989 – present); Putnam Funds (December 1992 – June 2004); and Providence Journal (a newspaper publisher) (December 1986 – December 2003). | 59 | Director of Courier Corporation (a book publisher and manufacturer); Member of the Investment Committee of Partners HealthCare System, Inc.3 | ||||||||||||||||||
| Peter Tufano c/o GMO Trust 40 Rowes Wharf Boston, MA 02110 DOB: 04/22/1957 | Trustee | Since December 2008. | Sylvan C. Coleman Professor of Financial Management, Harvard Business School (since 1989). | 59 | Trustee of State Street Navigator Securities Lending Trust (3 Portfolios). | ||||||||||||||||||
1 Each Trustee is elected to serve during the continued lifetime of the Trust until he/she dies, resigns or is removed, or if sooner, until the next meeting of Shareholders called for the purpose of electing Trustees and until the election and qualification of his/her successor.
3 Partners HealthCare System, Inc. is a client of the Manager.
26
Principal Officers:
| Name, Address, and DOB | Position(s) Held with Trust | Term of Office4 and Length of Time Served | Principal Occupation(s) During Past Five Years5 | ||||||||||||
| J.B. Kittredge DOB: 08/22/1954 | President and Chief Executive Officer | Since March 2009. | General Counsel, Grantham, Mayo, Van Otterloo & Co. LLC (October 2005 – Present); Partner, Ropes & Gray LLP. | ||||||||||||
| Sheppard N. Burnett c/o GMO Trust 40 Rowes Wharf Boston, MA 02110 DOB: 10/24/1968 | Treasurer and Chief Financial Officer | Chief Financial Officer since March 2007; Treasurer since November 2006; Assistant Treasurer, September 2004 – November 2006. | Fund Administration Staff, Grantham, Mayo, Van Otterloo & Co. LLC (June 2004 – present); Vice President, Director of Tax, Columbia Management Group (2002 – 2004). | ||||||||||||
| Brent C. Arvidson c/o GMO Trust 40 Rowes Wharf Boston, MA 02110 DOB: 06/26/1969 | Assistant Treasurer | Since August 1998. | Senior Fund Administrator, Grantham, Mayo, Van Otterloo & Co. LLC. | ||||||||||||
| John L. Nasrah c/o GMO Trust 40 Rowes Wharf Boston, MA 02110 DOB: 05/27/1977 | Assistant Treasurer | Since March 2007. | Fund Administrator, Grantham, Mayo, Van Otterloo & Co. LLC (September 2004 – present); Tax Analyst, Bain & Company, Inc. (June 2003 – September 2004). | ||||||||||||
| Mahmoodur Rahman c/o GMO Trust 40 Rowes Wharf Boston, MA 02110 DOB: 11/30/1967 | Assistant Treasurer | Since September 2007. | Fund Administrator, Grantham, Mayo, Van Otterloo & Co. LLC (April 2007 – present); Vice President and Senior Tax Manager, Massachusetts Financial Services Company (January 2000 – April 2007). | ||||||||||||
| Michael E. Gillespie c/o GMO Trust 40 Rowes Wharf Boston, MA 02110 DOB: 02/18/1958 | Chief Compliance Officer | Since March 2005. | Vice President of Compliance (June 2004 – February 2005) and Director of Domestic Compliance (March 2002 – June 2004), Fidelity Investments. | ||||||||||||
4 Each officer is elected to hold such office until his or her successor is duly elected and qualified to carry out the duties and responsibilities of the office, or until he or she resigns or is removed from office.
5 Each of Messrs. Burnett, Arvidson, Bohan, and Pottle serves as an officer and/or director of certain pooled investment vehicles of which GMO or an affiliate of GMO serves as the investment adviser.
27
Principal Officers — (Continued)
| Name, Address, and DOB | Position(s) Held with Trust | Term of Office4 and Length of Time Served | Principal Occupation(s) During Past Five Years5 | ||||||||||||
| Jason B. Harrison c/o GMO Trust 40 Rowes Wharf Boston, MA 02110 DOB: 01/29/1977 | Vice President and Clerk | Vice President since November 2006; Clerk since March 2006. | Legal Counsel, Grantham, Mayo, Van Otterloo & Co. LLC (since February 2006) and Attorney, Ropes & Gray LLP (September 2002 – February 2006). | ||||||||||||
| David L. Bohan c/o GMO Trust 40 Rowes Wharf Boston, MA 02110 DOB: 06/21/1964 | Vice President and Assistant Clerk | Vice President since March 2005; Assistant Clerk since March 2006. | Legal Counsel, Grantham, Mayo, Van Otterloo & Co. LLC. | ||||||||||||
| Gregory L. Pottle c/o GMO Trust 40 Rowes Wharf Boston, MA 02110 DOB: 07/09/1971 | Vice President and Assistant Clerk | Since November 2006. | Legal Counsel, Grantham, Mayo, Van Otterloo & Co. LLC. | ||||||||||||
| Anne K. Trinque c/o GMO Trust 40 Rowes Wharf Boston, MA 02110 DOB: 04/15/1978 | Vice President and Assistant Clerk | Since September 2007. | Legal Counsel, Grantham, Mayo, Van Otterloo & Co. LLC (January 2007 – present); Attorney, Goodwin Procter LLP (September 2003 – January 2007). | ||||||||||||
| Cheryl Wakeham c/o GMO Trust 40 Rowes Wharf Boston, MA 02110 DOB: 10/29/1958 | Vice President and Anti-Money Laundering Officer | Since December 2004. | Manager, Client Service Administration, Grantham, Mayo, Van Otterloo & Co. LLC. | ||||||||||||
4 Each officer is elected to hold such office until his or her successor is duly elected and qualified to carry out the duties and responsibilities of the office, or until he or she resigns or is removed from office.
5 Each of Messrs. Burnett, Arvidson, Bohan, and Pottle serves as an officer and/or director of certain pooled investment vehicles of which GMO or an affiliate of GMO serves as the investment adviser.
28
GMO Special Purpose Holding Fund
(A Series of GMO Trust)
Consolidated Annual Report
February 28, 2009
For a free copy of the Fund's proxy voting guidelines, shareholders may call 1-617-346-7646 (collect) or visit GMO's website at www.gmo.com, or visit the Securities and Exchange Commission's website at www.sec.gov. Information regarding how the Fund voted proxies relating to portfolio securities during the most recent 12-month period ended June 30 is available on our website at www.gmo.com, or on the Securities and Exchange Commission's website at www.sec.gov.
The Fund files its complete schedule of portfolio holdings with the Securities and Exchange Commission for the first and third quarter of each fiscal year on Form N-Q, which is available on the Commission's website at www.sec.gov. The Fund's Form N-Q may be reviewed and copied at the Commission's Public Reference Room in Washington, D.C. Information on the operation of the Public Reference Room may be obtained by calling 1-800-SEC-0330.
This report is prepared for the general information of shareholders. It is authorized for distribution to prospective investors only when preceded or accompanied by a private placement memorandum, which contains a complete discussion of the risks associated with an investment in this Fund and other important information. The private placement memorandum can be obtained by calling (617) 346-7646 (collect).
GMO Special Purpose Holding Fund
(A Series of GMO Trust)
Portfolio Management
Day-to-day management of the Fund's portfolio is the responsibility of the Fixed Income team at Grantham, Mayo, Van Otterloo & Co. LLC.
Management Discussion and Analysis of Fund Performance
The GMO Special Purpose Holding Fund returned +137.7% for the fiscal year ended February 28, 2009.
The Fund outperformed the JPMorgan U.S. 3 Month Cash Index during the fiscal year by 134.2%. The Fund's investments consist primarily of: (i) units of GMO SPV I, LLC, a special purpose vehicle that holds an interest in liquidating trusts related to certain defaulted asset-backed securities issued by NPF VI, Inc. and NPF XII, Inc. and (ii) cash and cash items. The Fund's return for the period was driven by a payment received from the liquidating trusts in May 2008.
The views expressed herein are exclusively those of Grantham, Mayo, Van Otterloo & Co. LLC Management as of the date of this report and are subject to change. GMO disclaims any responsibility to update such views. They are not meant as investment advice.

Performance data quoted represents past performance and is not indicative of future results. The investment return and principal value of an investment will fluctuate so that an investor's shares, when redeemed, may be worth more or less than their original cost. Current performance data may be lower or higher than the performance data provided herein. To obtain performance information to the most recent month-end, visit www.gmo.com. Performance shown is net of all fees after reimbursement from the Manager. Returns would have been lower had certain expenses not been reimbursed during the periods shown and do not include the effect of taxes on distributions and redemptions. All information is unaudited.
* This total assumes the effect of reinvested dividends, which are prohibited on this Fund. An investor could not have achieved this return due to this prohibition.
GMO Special Purpose Holding Fund
(A Series of GMO Trust)
Consolidated Investments Concentration Summary (a)
February 28, 2009 (Unaudited)
| Asset Class Summary | % of Total Net Assets | ||||||
| Debt Obligations | 0.0 | % | |||||
| Other | 100.0 | ||||||
| 100.0 | % | ||||||
(a) GMO SPV I, LLC is a 74.9% owned subsidiary of GMO Special Purpose Holding Fund.
1
GMO Special Purpose Holding Fund
(A Series of GMO Trust)
Consolidated Schedule of Investments
(showing percentage of total net assets)
February 28, 2009
| Shares | Description | Value ($) | |||||||||||||
| DEBT OBLIGATIONS — 0.0% (a) | |||||||||||||||
| Asset-Backed Securities — 0.0% | |||||||||||||||
| Health Care Receivables — 0.0% | |||||||||||||||
| Interest related to the Bankruptcy Estate of NPF VI Inc. Series 02-1 Class A (b) (c) | — | ||||||||||||||
| Interest related to the Bankruptcy Estate of NPF XII Inc. Series 00-3 Class A (b) (c) | — | ||||||||||||||
| Interest related to the Bankruptcy Estate of NPF XII Inc. Series 02-1 Class A (b) (c) | — | ||||||||||||||
| — | |||||||||||||||
| Total Asset-Backed Securities | — | ||||||||||||||
| TOTAL DEBT OBLIGATIONS (COST $0) | — | ||||||||||||||
| SHORT-TERM INVESTMENTS — 9.8% | |||||||||||||||
| Money Market Funds — 9.8% | |||||||||||||||
| 19,935 | State Street Institutional Liquid Reserves Fund-Institutional Class | 19,935 | |||||||||||||
| 19,935 | State Street Institutional Treasury Plus Money Market Fund-Institutional Class | 19,935 | |||||||||||||
| TOTAL SHORT-TERM INVESTMENTS (COST $39,870) | 39,870 | ||||||||||||||
| TOTAL INVESTMENTS — 9.8% (Cost $39,870) | 39,870 | ||||||||||||||
| Other Assets and Liabilities (net) — 90.2% | 366,965 | ||||||||||||||
| TOTAL NET ASSETS — 100.0% | $ | 406,835 | |||||||||||||
Notes to Consolidated Schedule of Investments:
(a) Owned by GMO SPV I, LLC. GMO SPV I, LLC is a 74.9% subsidiary of GMO Special Purpose Holding Fund.
(b) Security in default.
(c) Security valued at fair value using methods determined in good faith by or at the direction of the Trustees of GMO Trust (Note 2).
See accompanying notes to the financial statements.
2
GMO Special Purpose Holding Fund
(A Series of GMO Trust)
Consolidating Statement of Assets and Liabilities — February 28, 2009
| GMO Special Purpose Holding Fund | GMO SPV I, LLC | Minority Interest | Eliminations | Consolidated Totals | |||||||||||||||||||
| Assets: | |||||||||||||||||||||||
| Investments in affiliated issuers, at value (cost $0) (Note 2) | $ | 276,862 | $ | — | $ | — | $ | (276,862 | ) | $ | — | ||||||||||||
| Investments in unaffiliated issuers, at value (cost $39,870) (Note 2) | 39,870 | — | — | — | 39,870 | ||||||||||||||||||
| Cash | 164,857 | 416,919 | — | — | 581,776 | ||||||||||||||||||
| Dividends receivable | 21 | — | — | — | 21 | ||||||||||||||||||
| Receivable for expenses reimbursed by Manager (Note 3) | 3,071 | 3,864 | — | — | 6,935 | ||||||||||||||||||
| Total assets | 484,681 | 420,783 | — | (276,862 | ) | 628,602 | |||||||||||||||||
| Liabilities: | |||||||||||||||||||||||
| Accrued expenses | 77,846 | 48,414 | — | — | 126,260 | ||||||||||||||||||
| Minority interest | — | — | 95,507 | — | 95,507 | ||||||||||||||||||
| Total liabilities | 77,846 | 48,414 | 95,507 | — | 221,767 | ||||||||||||||||||
| Net assets | $ | 406,835 | $ | 372,369 | $ | (95,507 | ) | $ | (276,862 | ) | $ | 406,835 | |||||||||||
| Shares outstanding | 554,071 | 554,071 | |||||||||||||||||||||
| Net asset value per share | $ | 0.73 | $ | 0.73 | |||||||||||||||||||
See accompanying notes to the financial statements.
3
GMO Special Purpose Holding Fund
(A Series of GMO Trust)
Consolidating Statement of Operations — Year Ended February 28, 2009
| GMO Special Purpose Holding Fund | GMO SPV I, LLC | Minority Interest | Eliminations | Consolidated Totals | |||||||||||||||||||
| Investment Income: | |||||||||||||||||||||||
| Interest | $ | 2,223 | $ | 3,649 | $ | — | $ | — | $ | 5,872 | |||||||||||||
| Dividends | 166 | — | — | — | 166 | ||||||||||||||||||
| Total income | 2,389 | 3,649 | — | — | 6,038 | ||||||||||||||||||
| Expenses: | |||||||||||||||||||||||
| Custodian and transfer agent fees | 1,420 | 26,754 | — | — | 28,174 | ||||||||||||||||||
| Audit and tax fees | 43,529 | 12,382 | — | — | 55,911 | ||||||||||||||||||
| Trustees fees and related expenses (Note 3) | 1 | — | — | — | 1 | ||||||||||||||||||
| Legal fees | — | 5,220 | — | — | 5,220 | ||||||||||||||||||
| Miscellaneous | 1,238 | 547 | — | — | 1,785 | ||||||||||||||||||
| Total expenses | 46,188 | 44,903 | — | — | 91,091 | ||||||||||||||||||
| Fees and expenses reimbursed by Manager (Note 3) | (46,187 | ) | (39,683 | ) | — | — | (85,870 | ) | |||||||||||||||
| Net expenses | 1 | 5,220 | — | — | 5,221 | ||||||||||||||||||
| Net income (loss) | 2,388 | (1,571 | ) | — | — | 817 | |||||||||||||||||
| Minority Interest | — | — | 403 | — | 403 | ||||||||||||||||||
| Net investment income (loss) after minority interest | 2,388 | (1,571 | ) | 403 | — | 1,220 | |||||||||||||||||
| Realized and unrealized gain (loss): | |||||||||||||||||||||||
| Net realized gain (loss) on: | |||||||||||||||||||||||
| Investments in unaffiliated issuers | — | 1,294,501 | — | — | 1,294,501 | ||||||||||||||||||
| Realized gains distributions from affiliated issuers | 962,366 | — | — | (962,366 | ) | — | |||||||||||||||||
| Net realized gain (loss) | 962,366 | 1,294,501 | — | (962,366 | ) | 1,294,501 | |||||||||||||||||
| Change in net unrealized appreciation (depreciation) on: | |||||||||||||||||||||||
| Investments | — | — | — | — | — | ||||||||||||||||||
| Net unrealized gain (loss) | — | — | — | — | — | ||||||||||||||||||
| Net realized and unrealized gain (loss) | 962,366 | 1,294,501 | — | (962,366 | ) | 1,294,501 | |||||||||||||||||
| Minority interest in realized and unrealized gain (loss) | — | — | (330,967 | ) | — | (330,967 | ) | ||||||||||||||||
| Net increase (decrease) in net assets resulting from operations | $ | 964,754 | $ | 1,292,930 | $ | (330,564 | ) | $ | (962,366 | ) | $ | 964,754 | |||||||||||
See accompanying notes to the financial statements.
4
GMO Special Purpose Holding Fund
(A Series of GMO Trust)
Consolidated Statement of Changes in Net Assets
| Year Ended February 28, 2009 | Year Ended February 29, 2008 | ||||||||||
| Increase (decrease) in net assets: | |||||||||||
| Operations: | |||||||||||
| Net investment income (loss) | $ | 1,220 | $ | 36,556 | |||||||
| Net realized gain (loss) | 1,294,501 | 4,638,699 | |||||||||
| Change in net unrealized appreciation (depreciation) | — | — | |||||||||
| 1,295,721 | 4,675,255 | ||||||||||
| Minority Interest | (330,967 | ) | (1,164,398 | ) | |||||||
| Net increase (decrease) in net assets from operations | 964,754 | 3,510,857 | |||||||||
| Cash distributions to shareholders | (1,254,756 | ) | (3,593,689 | ) | |||||||
| (1,254,756 | ) | (3,593,689 | ) | ||||||||
| Fund share transactions: (Note 7) | |||||||||||
| Proceeds from sale of shares | — | — | |||||||||
| Cost of shares repurchased | — | — | |||||||||
| Net increase (decrease) from Fund share transactions | — | — | |||||||||
| Total increase (decrease) in net assets | (290,002 | ) | (82,832 | ) | |||||||
| Net assets: | |||||||||||
| Beginning of period | 696,837 | 779,669 | |||||||||
| End of period | $ | 406,835 | $ | 696,837 | |||||||
See accompanying notes to the financial statements.
5
GMO Special Purpose Holding Fund
(A Series of GMO Trust)
Consolidated Financial Highlights
(For a share outstanding throughout each period)
| Year Ended February 28/29, | |||||||||||||||||||||||
| 2009 | 2008 | 2007 | 2006 | 2005 | |||||||||||||||||||
| Net asset value, beginning of period | $ | 1.26 | $ | 1.41 | $ | 8.22 | $ | 15.51 | $ | 24.11 | |||||||||||||
| Income from investment operations: | |||||||||||||||||||||||
| Net investment income (loss)† | 0.00 | (a) | 0.06 | 0.02 | (0.08 | ) | 0.41 | ||||||||||||||||
| Net realized and unrealized gain (loss) | 1.73 | 6.28 | 41.16 | 8.57 | 9.08 | ||||||||||||||||||
| Total from investment operations | 1.73 | 6.34 | 41.18 | 8.49 | 9.49 | ||||||||||||||||||
| Less distributions to shareholders: | |||||||||||||||||||||||
| From net investment income | — | — | — | — | (0.74 | ) | |||||||||||||||||
| From cash distributions | (2.26 | ) | (6.49 | ) | (47.99 | ) | (15.78 | ) | (17.29 | ) | |||||||||||||
| From return of capital | — | — | — | — | (0.06 | ) | |||||||||||||||||
| Total distributions | (2.26 | ) | (6.49 | ) | (47.99 | ) | (15.78 | ) | (18.09 | ) | |||||||||||||
| Net asset value, end of period | $ | 0.73 | $ | 1.26 | $ | 1.41 | $ | 8.22 | $ | 15.51 | |||||||||||||
| Total Return(b)(c) | 137.67 | % | 517.54 | % | 3613.95 | % | 124.75 | % | 36.35 | % | |||||||||||||
| Ratios/Supplemental Data: | |||||||||||||||||||||||
| Net assets, end of period (000's) | $ | 407 | $ | 697 | $ | 780 | $ | 4,553 | $ | 8,595 | |||||||||||||
| Net expenses to average daily net assets | 0.81 | % | 0.00 | %(d) | 0.85 | % | 1.26 | % | (0.01 | )% | |||||||||||||
| Net investment income to average daily net assets | 0.25 | % | 3.91 | % | 1.05 | % | (0.65 | )% | 1.83 | % | |||||||||||||
| Portfolio turnover rate | 0 | % | 0 | % | 0 | % | 0 | % | 0 | % | |||||||||||||
| Fees and expenses reimbursed by the Manager to average daily net assets: | 15.56 | % | 8.84 | % | 3.74 | % | 1.39 | % | 0.67 | % | |||||||||||||
(a) Net investment income (loss) was less than $0.01 per share.
(b) The total returns would have been lower had certain expenses not been reimbursed during the periods shown and assumes the effect of reinvested distributions.
(c) Had the effect of reinvested distributions not been assumed and income from investment operations been retained, the total returns would have been 1.93%, 7.61%, 97.84%, 25.27%, and 39.36% for the fiscal years ended 2009, 2008, 2007, 2006, and 2005, respectively.
(d) Net expenses as a percentage of average daily net assets was less than 0.01%.
† Calculated using average shares outstanding throughout the period.
See accompanying notes to the financial statements.
6
GMO Special Purpose Holding Fund
(A Series of GMO Trust)
Consolidated Notes to Financial Statements
February 28, 2009
1. Organization
GMO Special Purpose Holding Fund (the "Fund") is a series of GMO Trust (the "Trust"). The Fund is registered under the Investment Company Act of 1940, as amended, as an open-end, non-diversified management investment company. The Fund is advised and managed by Grantham, Mayo, Van Otterloo & Co. LLC (the "Manager" or "GMO"). The Trust was established as a Massachusetts business trust under the laws of the Commonwealth of Massachusetts on June 24, 1985. The Declaration of Trust permits the Trustees of the Trust ("Trustees") to create an unlimited number of series of shares ("Funds") and to subdivide Funds into classes.
The Fund seeks total return. The Fund's investments consist primarily of: (i) units of GMO SPV I, LLC ("SPV"), a special purpose vehicle that holds an interest in liquidating trusts related to certain defaulted asset-backed securities (the "NPF Securities") issued by NPF VI, Inc. and NPF XII, Inc., and (ii) cash and cash items. The Fund expects that any new investments will be made primarily in cash, cash items, and high quality debt securities.
Shares of the Fund are not publicly offered and are principally available only to other GMO Funds of the Trust and certain accredited investors. Presently the Fund is closed to new investment.
In April 2004, a plan of liquidation ("the Plan") was approved by the bankruptcy court with respect to National Century Financial Enterprises and the NPF Securities. Pursuant to the Plan, the Fund received a cash distribution, less expenses associated with the transaction and an interest in additional amounts recovered by the bankruptcy estate. The Fund, together with other creditors, are continuing to pursue various claims resulting from its holdings of the NPF Securities. The ultimate amount of losses and costs associated with the NPF Securities that may be recovered by the Fund (through its investment in SPV) is not known at this time.
The Fund has litigation pending against various entities related to the default of the NPF Securities. For the year ended February 28, 2009, the Fund indirectly received $962,366 in conjunction with a settlement agreement related to the default of those securities. The outcome of the lawsuits against the remaining defendants is not known and any potential recoveries are not reflected in the net asset value of the Fund. To the extent additional recoveries are realized, such recoveries may be material to the net asset value of the Fund.
2. Significant accounting policies
The following is a summary of significant accounting policies followed by the Fund in the preparation of its financial statements. These policies are in conformity with accounting principles generally accepted in the United States of America ("U.S. GAAP") and have been consistently followed by the Fund in preparing its financial statements. The preparation of financial statements in accordance with U.S. GAAP
7
GMO Special Purpose Holding Fund
(A Series of GMO Trust)
Consolidated Notes to Financial Statements — (Continued)
February 28, 2009
requires management to make estimates and assumptions that affect the reported amounts and disclosures in the financial statements. Actual results could differ from those estimates. The accounting records of the Fund are maintained in U.S. dollars.
Basis of presentation and principles of consolidation
The accompanying consolidated financial statements include the accounts of the Fund and its majority owned investment in SPV. The consolidated financial statements include 100% of the assets and liabilities of SPV and the ownership interests of minority participants are recorded as "Minority Interest". All significant interfund accounts and transactions have been eliminated in consolidation.
Portfolio valuation
Securities listed on a securities exchange for which market quotations are readily available are valued at the last sale price or official closing price on each business day, or if there is no such reported sale or official closing price, at the most recent quoted bid price. Unlisted securities for which market quotations are readily available are generally valued at the most recent quoted bid price. Short-term investments with a remaining maturity of sixty days or less are generally valued at amortized cost, which approximates fair value. Shares of investment funds are generally valued at their net asset value. Securities for which quotations are not readily available or whose values the Manager has determined to be unreliable are valued at fair value as determined in good faith by the Trustees or other persons acting at their direction pursuant to procedures approved by the Trustees. By its nature, a fair value price is a good faith estimate of the value of a security at a given point in time and may not reflect the value that would be realized if the security was sold and the differences could be material.
In September 2006, the Financial Accounting Standards Board ("FASB") issued Statement of Financial Accounting Standards No. 157, Fair Value Measurements ("SFAS 157"). SFAS 157 is effective for the Fund's current fiscal year. While the adoption of SFAS 157 does not have an effect on the Fund's net asset value, it does require additional disclosures about fair value measurements. SFAS 157 establishes a three-level hierarchy for disclosure of fair value measurements. The valuation hierarchy is based upon the reliability of inputs to the valuation of the Fund's investments. The three levels are defined as follows:
Level 1 – Valuations based on quoted prices for identical securities in active markets.
Level 2 – Valuations determined using other significant direct or indirect observable inputs.
Level 3 – Valuations based on inputs that are unobservable and significant.
The inputs or methodology used for valuing securities are not necessarily an indication of the risk associated with investing in those securities.
8
GMO Special Purpose Holding Fund
(A Series of GMO Trust)
Consolidated Notes to Financial Statements — (Continued)
February 28, 2009
The following is a summary of the fair valuations according to inputs used as of February 28, 2009 in valuing the Fund's investments at value:
| Asset Valuation Inputs | Investments in Securities | Other Financial Instruments | |||||||||
| Level 1 - Quoted Prices | $ | — | $ | — | |||||||
| Level 2 - Other Significant Observable Inputs | 39,870 | — | |||||||||
| Level 3 - Significant Unobservable Inputs* | — | — | |||||||||
| Total | $ | 39,870 | $ | — | |||||||
| Liability Valuation Inputs | Investments in Securities | Other Financial Instruments | |||||||||
| Level 1 - Quoted Prices | $ | — | $ | — | |||||||
| Level 2 - Other Significant Observable Inputs | — | — | |||||||||
| Level 3 - Significant Unobservable Inputs | — | — | |||||||||
| Total | $ | — | $ | — | |||||||
* Represents the interest in securities that are in default and have no value at February 29, 2008 or February 28, 2009.
Repurchase agreements
The Fund may enter into repurchase agreements. Under a repurchase agreement the Fund acquires a security for cash and obtains a simultaneous commitment from the seller to repurchase the security at an agreed upon price and date. The Fund, through its custodian, takes possession of securities collateralizing the repurchase agreement. The collateral is marked to market daily to ensure that the market value of the underlying assets is at least equal to the amount owed to the Fund in the event of default by the seller. If the seller of a repurchase agreements defaults or enters into insolvency proceedings and the value of the collateral declines, the Fund's recovery of cash may be delayed or limited. The Fund had no repurchase agreements outstanding at the end of the period.
Taxes
Effective April 1, 2004, the Fund elected to be treated as a partnership for U.S. federal income tax purposes. As a partnership, the Fund is not itself subject to federal income tax. Instead, each shareholder is required to take into account in determining its tax liability its distributive share of items of Fund income, gain, loss, deduction, credit, and tax preference for each taxable year substantially as though such items have been realized directly by the shareholder and without regard to whether any distribution by the Fund has been or will be received. Accordingly, no provision (benefit) for federal and state income taxes is reflected in the accompanying financial statements.
9
GMO Special Purpose Holding Fund
(A Series of GMO Trust)
Consolidated Notes to Financial Statements — (Continued)
February 28, 2009
As of February 28, 2009, the approximate cost for U.S. federal income tax purposes and gross and net unrealized appreciation and depreciation in value of investments were as follows:
| Aggregate Cost | Gross Unrealized Appreciation | Gross Unrealized (Depreciation) | Net Unrealized Appreciation (Depreciation) | ||||||||||||
| $ | 39,870 | $ | — | $ | — | $ | — | ||||||||
SPV is also treated as a partnership for U.S. federal income tax purposes and is subject to the same rules as the Fund with respect to federal income taxation of partnerships.
The Fund is subject to the provisions of Financial Accounting Standards Board Interpretation No. 48 ("FIN 48"), Accounting for Uncertainty in Income Taxes — an Interpretation of FASB Statement No. 109. FIN 48 sets forth a minimum threshold for financial statement recognition of a tax position taken or expected to be taken in a tax return that could affect the Fund's financial statements. The Fund did not have any unrecognized tax benefits or liabilities at February 28, 2009, nor did it have any increases or decreases in unrecognized tax benefits or liabilities for the period then ended. The Fund is subject to examination prior to the expiration of the statute of limitations by U.S. federal and state tax authorities for tax returns filed.
Distributions
The Fund will distribute proceeds and other cash receipts received from its underlying investments. Distributions made by the Fund, other than a distribution in partial or complete redemption of a shareholder's interest in the Fund, are reported in the Fund's financial statements as cash distributions.
Security transactions and related investment income
Security transactions in the financial statements are accounted for on trade date. Interest income is recorded on the accrual basis and is adjusted for the amortization of premiums and accretion of discounts. Income is not recognized on securities for which collection is not expected. In determining the net gain or loss on securities sold, the Fund uses the identified cost basis for the purposes of determining the cost basis.
Expenses
The majority of the expenses of the Trust are directly identifiable to an individual fund. Expenses which are not readily identifiable to a specific fund are allocated taking into consideration, among other things, the nature and type of expense and the relative size of the funds.
State Street Bank and Trust Company ("State Street") serves as custodian, fund accounting agent and transfer agent of the Fund. State Street's fees may be reduced by an earnings allowance calculated on the average daily cash balances the Fund maintains with State Street. The Fund receives the benefit of the
10
GMO Special Purpose Holding Fund
(A Series of GMO Trust)
Consolidated Notes to Financial Statements — (Continued)
February 28, 2009
earnings allowance. In addition, Goldman Sachs Agency Lending, the Fund's securities lending agent, has agreed to reimburse the Fund for certain transactional expenses related to securities lending activity. Credit balances or expense reimbursements used to reduce fees, if any, are reported as a reduction of expenses in the Statement of Operations.
Recently issued accounting pronouncement
In March 2008, FASB issued Statement of Financial Accounting Standards No. 161, Disclosures about Derivative Instruments and Hedging Activities ("SFAS 161"). SFAS 161 is effective for fiscal years and interim periods beginning after November 15, 2008. SFAS 161 requires enhanced disclosures about the Fund's derivative and hedging activities. The Manager is currently evaluating the impact the adoption of SFAS 161 will have on the Fund's financial statement disclosures.
In December, 2007, FASB issued SFAS No. 160, an amendment of Accounting Research Bulletin No. 51, Noncontrolling Interests in Consolidated Financial Statements. SFAS 160 is effective for fiscal years and interim periods beginning on or after December 15, 2008. SFAS 160 requires enhanced disclosures in consolidated financial statements that identifies and distinguishes between the interests of the parent's owners and the interests of the noncontrolling owners of a subsidiary. The Manager is currently evaluating the impact the adoption of SFAS 160 will have on the Fund's financial statements.
3. Fees and other transactions with affiliates
GMO does not charge the Fund any management or service fees for its services. In addition, the Manager has contractually agreed to reimburse the Fund for Fund expenses through at least June 30, 2009 (excluding "Excluded Expenses", as defined below). Excluded Expenses include expenses, fees and expenses of the independent Trustees of the Trust, fees and expenses for legal services not approved by the Manager for the Trust, compensation and expenses of the Trust's Chief Compliance Officer ("CCO") (excluding any employee benefits), brokerage commissions, securities lending fees and expenses, interest expense, transfer taxes, and other investment-related costs (including expenses associated with investments in any company that is an investment company or would be an investment company under the 1940 Act, but for the exceptions to the definition of investment company provided in Section 3(c)(1) and 3(c)(7) of the 1940 Act), hedging t ransaction fees, extraordinary, non-recurring and certain other unusual expenses (including taxes). The costs incurred in connection with the Fund's pursuit of legal claims arising from the Fund's investment in the NPF securities are being treated for the purposes of the expense reimbursement as extraordinary expenses.
The Fund's portion of the fees paid by the Trust to the Trust's independent Trustees and CCO during the period ended February 28, 2009 was $1 and $0, respectively. The compensation and expenses of the CCO are included in miscellaneous expenses in the Consolidating Statement of Operations. No remuneration was paid by the Fund to any other officer of the Trust.
11
GMO Special Purpose Holding Fund
(A Series of GMO Trust)
Consolidated Notes to Financial Statements — (Continued)
February 28, 2009
4. Purchases and sales of securities
There were no purchases or sales of securities, excluding short-term investments, for the year ended February 28, 2009.
5. Guarantees
In the normal course of business the Fund enters into contracts with third-party service providers that contain a variety of representations and warranties and that provide general indemnifications. The Fund's maximum exposure under these arrangements is unknown, as it involves future claims that may be made against the Fund that have not yet occurred. Based on experience, management is of the view that the risk of loss in connection with its indemnification obligations is remote; however, there can be no assurance that in the future such obligations will not result in material liabilities that adversely affect the Fund.
6. Principal shareholders and related parties
As of February 28, 2009, 61.72% of the shares outstanding of the Fund were held by three shareholders, each holding more than 10% of the Fund's outstanding shares. On that date, no other shareholder owned more than 10% of the outstanding shares of the Fund. One of the shareholders is another fund of the Trust. Redemptions from (or investments into) the Fund by or on behalf of these large shareholders may have a material effect on the Fund.
As of February 28, 2009, no shares of the Fund were held by senior management of the Manager and GMO Trust officers, and 99.95% of the Fund's shares were held by accounts for which the Manager had investment discretion.
7. Share transactions
The Declaration of Trust permits the Trust to issue an unlimited number of shares of beneficial interest (without par value). Transactions in Fund shares were as follows:
| Year Ended February 28, 2009 | Year Ended February 29, 2008 | ||||||||||
| Shares sold | — | — | |||||||||
| Shares repurchased | — | — | |||||||||
| Net decrease | — | — | |||||||||
| Fund shares: | |||||||||||
| Beginning of period | 554,071 | 554,071 | |||||||||
| End of period | 554,071 | 554,071 | |||||||||
12
Report of Independent Registered Public Accounting Firm
To the Trustees of GMO Trust and the Shareholders of
GMO Special Purpose Holding Fund:
In our opinion, the accompanying statement of assets and liabilities, including the consolidated schedule of investments, and the related consolidated statements of operations and of changes in net assets and the financial highlights present fairly, in all material respects, the financial position of GMO Special Purpose Holding Fund (the "Fund") and subsidiary at February 28, 2009, the results of its operations for the year then ended, the changes in its net assets for each of the periods indicated and the financial highlights for each of the periods indicated, in conformity with accounting principles generally accepted in the United States of America. These financial statements and financial highlights (hereafter referred to as "financial statements") are the responsibility of the Fund's management. Our responsibility is to express an opinion on these financial statements based on our audits. We conducted our audits of these fi nancial statements in accordance with the standards of the Public Company Accounting Oversight Board (United States). Those standards require that we plan and perform the audit to obtain reasonable assurance about whether the financial statements are free of material misstatement. An audit includes examining, on a test basis, evidence supporting the amounts and disclosures in the financial statements, assessing the accounting principles used and significant estimates made by management, and evaluating the overall financial statement presentation. We believe that our audits, which included confirmation of securities at February 28, 2009 by correspondence with the custodian and brokers, provide a reasonable basis for our opinion.
PricewaterhouseCoopers LLP
Boston, Massachusetts
April 29, 2009
13
GMO Special Purpose Holding Fund
(A Series of GMO Trust)
Fund Expenses
February 28, 2009 (Unaudited)
Expense Examples: The following information is in relation to expenses for the six month period ended February 28, 2009.
As a shareholder of the Fund, you may incur two types of costs: (1) transaction costs, and (2) ongoing costs, including management fees, shareholder service fees, and other Fund expenses. This example is intended to help you understand your ongoing costs (in dollars) of investing in the Fund and to compare these costs with the ongoing costs of investing in other mutual funds.
These examples are based on an investment of $1,000 invested at the beginning of the period and held for the entire period, September 1, 2008 through February 28, 2009.
Actual Expenses
The first line of the table below provides information about actual account values and actual expenses. You may use the information in this line, together with the amount you invested, to estimate the expenses that you paid over the period. Simply divide your account value by $1,000 (for example, a $10,000,000 account value divided by $1,000 = 10,000), then multiply the result by the number in the first line under the heading entitled "Net Expense Incurred" to estimate the expenses you paid on your account during this period.
Hypothetical Example for Comparison Purposes
The second line of the table below provides information about hypothetical account values and hypothetical expenses based on the Fund's actual expense ratio and an assumed rate of return of 5% per year before expenses, which is not the Fund's actual return. The hypothetical account values and expenses may not be used to estimate the actual ending account balance or expenses you paid for the period. You may use this information to compare the ongoing costs of investing in the Fund with other funds. To do so, compare this 5% hypothetical example with the 5% hypothetical examples that appear in the shareholder reports of other funds.
Please note that the expenses shown in the table are meant to highlight your ongoing costs only and do not reflect any transactional costs, such as purchase premiums and redemption fees. Therefore, the second line of the table is useful in comparing ongoing costs only, and will not help you determine the relative total costs of owning different funds. In addition, if these transactional costs were included, your costs would have been higher.
| Annualized Net Expense Ratio | Beginning Account Value | Ending Account Value | Net Expense Incurred* | ||||||||||||||||
| 1) Actual | 1.95 | % | $ | 1,000.00 | $ | 1,000.00 | $ | 9.67 | |||||||||||
| 2) Hypothetical | 1.95 | % | $ | 1,000.00 | $ | 1,015.12 | $ | 9.74 | |||||||||||
* Expenses are calculated using the annualized net expense ratio for the six months ended February 28, 2009, multiplied by the average account value over the period, multiplied by 181 days in the period, divided by 365 days in the year.
14
Trustees and Officers (Unaudited)
The following tables list the Trust's Trustees and Officers as of the date of this report; their address and date of birth ("DOB"); their position with the Trust; the length of time holding that position with the Trust; their principal occupation(s) during the past five years; the number of portfolios in the fund complex they oversee; and other directorships they hold in companies subject to registration or reporting requirements of the Securities Exchange Act of 1934 (generally called "public companies") or in registered investment companies. The Trust's Statement of Additional Information ("SAI") includes additional information about the Trust's trustees, including changes subsequent to the date of the report. The SAI is available, without charge, upon request by writing GMO, c/o GMO Trust, 40 Rowes Wharf, Boston, MA 02110.
Independent Trustees:
| Name, Address, and DOB | Position(s) Held with Trust | Term of Office1 and Length of Time Served | Principal Occupation(s) During Past Five Years | Number of Portfolios in Fund Complex Overseen by Trustee | Other Directorships Held by Trustee | ||||||||||||||||||
| Donald W. Glazer, Esq. c/o GMO Trust 40 Rowes Wharf Boston, MA 02110 DOB: 07/26/1944 | Chairman of the Board of Trustees | Chairman of the Board of Trustees since March 2005; Lead Independent Trustee (September 2004 – March 2005); Trustee since December 2000. | Consultant – Law and Business2; Author of Legal Treatises. | 59 | None. | ||||||||||||||||||
1 Each Trustee is elected to serve during the continued lifetime of the Trust until he/she dies, resigns or is removed, or if sooner, until the next meeting of Shareholders called for the purpose of electing Trustees and until the election and qualification of his/her successor.
2 As part of Mr. Glazer's work as a consultant, he provides part-time consulting services to Goodwin Procter LLP ("Goodwin"). Goodwin has provided legal services to Renewable Resources, LLC, an affiliate of GMO; GMO, in connection with its relationship with Renewable Resources; and funds managed by Renewable Resources. Mr. Glazer has represented that he has no financial interest in, and is not involved in the provision of, such legal services. In the calendar years ended December 31, 2007 and December 31, 2008, these entities paid $789,416 and $183,864 respectively, in legal fees and disbursements to Goodwin. In correspondence with the Staff of the Securities and Exchange Commission beginning in August 2006, the Independent Trustees' legal counsel provided the Staff with information regarding Mr. Glazer's relationship with Goodwin and h is other business activities. On September 11, 2007, based on information that had been given to the Staff as of that date, the Staff provided oral no-action assurance consistent with the opinion of the Independent Trustees' legal counsel that Mr. Glazer is not an "interested person" of the Trust.
15
Independent Trustees — (Continued)
| Name, Address, and DOB | Position(s) Held with Trust | Term of Office1 and Length of Time Served | Principal Occupation(s) During Past Five Years | Number of Portfolios in Fund Complex Overseen by Trustee | Other Directorships Held by Trustee | ||||||||||||||||||
| W. Nicholas Thorndike c/o GMO Trust 40 Rowes Wharf Boston, MA 02110 DOB: 03/28/1933 | Trustee | Since March 2005. | Director or trustee of various corporations and charitable organizations, including Courier Corporation (a book publisher and manufacturer) (July 1989 – present); Putnam Funds (December 1992 – June 2004); and Providence Journal (a newspaper publisher) (December 1986 – December 2003). | 59 | Director of Courier Corporation (a book publisher and manufacturer); Member of the Investment Committee of Partners HealthCare System, Inc.3 | ||||||||||||||||||
| Peter Tufano c/o GMO Trust 40 Rowes Wharf Boston, MA 02110 DOB: 04/22/1957 | Trustee | Since December 2008. | Sylvan C. Coleman Professor of Financial Management, Harvard Business School (since 1989). | 59 | Trustee of State Street Navigator Securities Lending Trust (3 Portfolios). | ||||||||||||||||||
1 Each Trustee is elected to serve during the continued lifetime of the Trust until he/she dies, resigns or is removed, or if sooner, until the next meeting of Shareholders called for the purpose of electing Trustees and until the election and qualification of his/her successor.
3 Partners HealthCare System, Inc. is a client of the Manager.
16
Principal Officers:
| Name, Address, and DOB | Position(s) Held with Trust | Term of Office4 and Length of Time Served | Principal Occupation(s) During Past Five Years5 | ||||||||||||
| J.B. Kittredge DOB: 08/22/1954 | President and Chief Executive Officer | Since March 2009. | General Counsel, Grantham, Mayo, Van Otterloo & Co. LLC (October 2005 – Present); Partner, Ropes & Gray LLP. | ||||||||||||
| Sheppard N. Burnett c/o GMO Trust 40 Rowes Wharf Boston, MA 02110 DOB: 10/24/1968 | Treasurer and Chief Financial Officer | Chief Financial Officer since March 2007; Treasurer since November 2006; Assistant Treasurer, September 2004 – November 2006. | Fund Administration Staff, Grantham, Mayo, Van Otterloo & Co. LLC (June 2004 – present); Vice President, Director of Tax, Columbia Management Group (2002 – 2004). | ||||||||||||
| Brent C. Arvidson c/o GMO Trust 40 Rowes Wharf Boston, MA 02110 DOB: 06/26/1969 | Assistant Treasurer | Since August 1998. | Senior Fund Administrator, Grantham, Mayo, Van Otterloo & Co. LLC. | ||||||||||||
| John L. Nasrah c/o GMO Trust 40 Rowes Wharf Boston, MA 02110 DOB: 05/27/1977 | Assistant Treasurer | Since March 2007. | Fund Administrator, Grantham, Mayo, Van Otterloo & Co. LLC (September 2004 – present); Tax Analyst, Bain & Company, Inc. (June 2003 – September 2004). | ||||||||||||
| Mahmoodur Rahman c/o GMO Trust 40 Rowes Wharf Boston, MA 02110 DOB: 11/30/1967 | Assistant Treasurer | Since September 2007. | Fund Administrator, Grantham, Mayo, Van Otterloo & Co. LLC (April 2007 – present); Vice President and Senior Tax Manager, Massachusetts Financial Services Company (January 2000 – April 2007). | ||||||||||||
| Michael E. Gillespie c/o GMO Trust 40 Rowes Wharf Boston, MA 02110 DOB: 02/18/1958 | Chief Compliance Officer | Since March 2005. | Vice President of Compliance (June 2004 – February 2005) and Director of Domestic Compliance (March 2002 – June 2004), Fidelity Investments. | ||||||||||||
4 Each officer is elected to hold such office until his or her successor is duly elected and qualified to carry out the duties and responsibilities of the office, or until he or she resigns or is removed from office.
5 Each of Messrs. Burnett, Arvidson, Bohan, and Pottle serves as an officer and/or director of certain pooled investment vehicles of which GMO or an affiliate of GMO serves as the investment adviser.
17
Principal Officers — (Continued)
| Name, Address, and DOB | Position(s) Held with Trust | Term of Office4 and Length of Time Served | Principal Occupation(s) During Past Five Years5 | ||||||||||||
| Jason B. Harrison c/o GMO Trust 40 Rowes Wharf Boston, MA 02110 DOB: 01/29/1977 | Vice President and Clerk | Vice President since November 2006; Clerk since March 2006. | Legal Counsel, Grantham, Mayo, Van Otterloo & Co. LLC (since February 2006) and Attorney, Ropes & Gray LLP (September 2002 – February 2006). | ||||||||||||
| David L. Bohan c/o GMO Trust 40 Rowes Wharf Boston, MA 02110 DOB: 06/21/1964 | Vice President and Assistant Clerk | Vice President since March 2005; Assistant Clerk since March 2006. | Legal Counsel, Grantham, Mayo, Van Otterloo & Co. LLC. | ||||||||||||
| Gregory L. Pottle c/o GMO Trust 40 Rowes Wharf Boston, MA 02110 DOB: 07/09/1971 | Vice President and Assistant Clerk | Since November 2006. | Legal Counsel, Grantham, Mayo, Van Otterloo & Co. LLC. | ||||||||||||
| Anne K. Trinque c/o GMO Trust 40 Rowes Wharf Boston, MA 02110 DOB: 04/15/1978 | Vice President and Assistant Clerk | Since September 2007. | Legal Counsel, Grantham, Mayo, Van Otterloo & Co. LLC (January 2007 – present); Attorney, Goodwin Procter LLP (September 2003 – January 2007). | ||||||||||||
| Cheryl Wakeham c/o GMO Trust 40 Rowes Wharf Boston, MA 02110 DOB: 10/29/1958 | Vice President and Anti-Money Laundering Officer | Since December 2004. | Manager, Client Service Administration, Grantham, Mayo, Van Otterloo & Co. LLC. | ||||||||||||
4 Each officer is elected to hold such office until his or her successor is duly elected and qualified to carry out the duties and responsibilities of the office, or until he or she resigns or is removed from office.
5 Each of Messrs. Burnett, Arvidson, Bohan, and Pottle serves as an officer and/or director of certain pooled investment vehicles of which GMO or an affiliate of GMO serves as the investment adviser.
18
GMO U.S. Growth Fund
(A Series of GMO Trust)
Annual Report
February 28, 2009
For a free copy of the Fund's proxy voting guidelines, shareholders may call 1-617-346-7646 (collect) or visit the Securities and Exchange Commission's website at www.sec.gov. Information regarding how the Fund voted proxies relating to portfolio securities during the most recent 12-month period ended June 30 is available on GMO's website at www.gmo.com, or on the Securities and Exchange Commission's website at www.sec.gov.
The Fund files its complete schedule of portfolio holdings with the Securities and Exchange Commission for the first and third quarter of each fiscal year on Form N-Q, which is available on the Commission's website at www.sec.gov. The Fund's Form N-Q may be reviewed and copied at the Commission's Public Reference Room in Washington, D.C. Information on the operation of the Public Reference Room may be obtained by calling 1-800-SEC-0330. The Fund has a policy with respect to disclosure of portfolio holdings under which it may also make available on GMO's website at www.gmo.com a complete schedule of portfolio holdings.
This report is prepared for the general information of shareholders. It is authorized for distribution to prospective investors only when preceded or accompanied by a prospectus for the GMO Trust, which contains a complete discussion of the risks associated with an investment in this Fund and other important information. The GMO Trust prospectus can be obtained at www.gmo.com.
GMO U.S. Growth Fund
(A Series of GMO Trust)
Portfolio Management
Day-to-day management of the Fund's portfolio is the responsibility of the Quantitative Equity team at Grantham, Mayo, Van Otterloo & Co. LLC.
Management Discussion and Analysis of Fund Performance
The Class III shares of the GMO U.S. Growth Fund returned -32.8% for the fiscal year ended February 28, 2009, as compared to -40.0% for the Russell 1000 Growth Index. Consistent with the Fund's investment objectives and policies, the Fund was invested primarily in U.S. equity securities throughout the period.
Stock selection added to returns relative to the Russell 1000 Growth Index. Stock selections within Energy, Consumer Discretionary, and Consumer Staples added to relative returns while stock selections within Health Care, Industrials, and Utilities detracted. In terms of individual stocks, overweight positions in Wal-Mart Stores, Exxon Mobil, and Johnson & Johnson were among the positions adding to relative returns. Underweight positions in McDonald's and IBM and an overweight in UnitedHealth Group were among the positions detracting from relative returns.
Sector selection added to returns relative to the Russell 1000 Growth Index. Sector weightings positively impacting relative performance included overweight positions in Consumer Staples and Health Care and an underweight in Industrials. Sector weightings negatively impacting relative performance included an overweight in Energy and an underweight in Information Technology.
The views expressed herein are exclusively those of Grantham, Mayo, Van Otterloo & Co. LLC Management as of the date of this report and are subject to change. GMO disclaims any responsibility to update such views. They are not meant as investment advice. References to specific securities are not recommendations of such securities and may not be representative of any GMO portfolio's current or future investments.
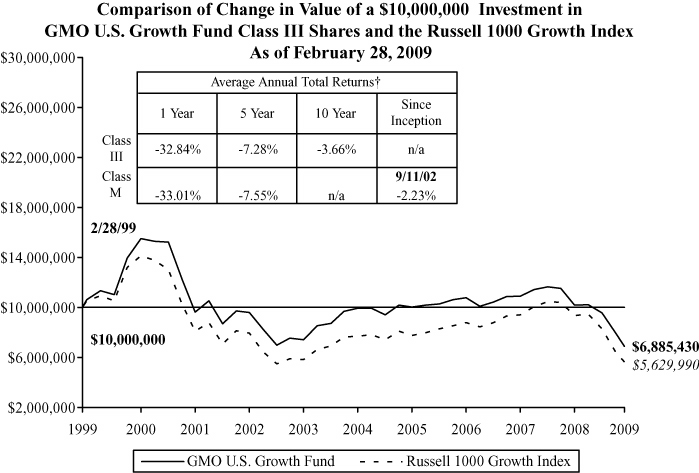
Performance data quoted represents past performance and is not indicative of future results. The investment return and principal value of an investment will fluctuate so that an investor's shares, when redeemed, may be worth more or less than their original cost. Current performance data may be lower or higher than the performance data provided herein. To obtain performance information to the most recent month-end, visit www.gmo.com. Performance shown is net of all fees after reimbursement from the Manager. Returns would have been lower had certain expenses not been reimbursed during the periods shown and do not include the effect of taxes on distributions and redemptions. All information is unaudited. Performance for Class M shares will vary due to different fees.
† The Fund is the successor to the GMO Growth Fund, therefore, performance for the periods prior to September 16, 2005 is that of GMO Growth Fund.
GMO U.S. Growth Fund
(A Series of GMO Trust)
Investments Concentration Summary
February 28, 2009 (Unaudited)
| Asset Class Summary | % of Total Net Assets | ||||||
| Common Stocks | 96.3 | % | |||||
| Short-Term Investments | 3.5 | ||||||
| Futures | (0.4 | ) | |||||
| Other | 0.6 | ||||||
| 100.0 | % | ||||||
| Industry Sector Summary | % of Equity Investments | ||||||
| Health Care | 23.2 | % | |||||
| Information Technology | 22.4 | ||||||
| Consumer Staples | 22.1 | ||||||
| Energy | 11.3 | ||||||
| Consumer Discretionary | 9.0 | ||||||
| Industrials | 6.8 | ||||||
| Financials | 3.1 | ||||||
| Materials | 0.9 | ||||||
| Telecommunication Services | 0.8 | ||||||
| Utilities | 0.4 | ||||||
| 100.0 | % | ||||||
1
GMO U.S. Growth Fund
(A Series of GMO Trust)
Schedule of Investments
(showing percentage of total net assets)
February 28, 2009
| Shares | Description | Value ($) | |||||||||||||
| COMMON STOCKS — 96.3% | |||||||||||||||
| Consumer Discretionary — 8.7% | |||||||||||||||
| 1,300 | Abercrombie & Fitch Co.-Class A | 28,587 | |||||||||||||
| 2,000 | Advance Auto Parts, Inc. | 76,500 | |||||||||||||
| 1,400 | Aeropostale, Inc. * | 32,466 | |||||||||||||
| 1,100 | American Eagle Outfitters, Inc. | 10,736 | |||||||||||||
| 1,800 | Apollo Group, Inc.-Class A * | 130,500 | |||||||||||||
| 1,300 | AutoNation, Inc. * | 12,974 | |||||||||||||
| 850 | AutoZone, Inc. * | 120,895 | |||||||||||||
| 4,600 | Bed Bath & Beyond, Inc. * | 97,980 | |||||||||||||
| 1,800 | Best Buy Co., Inc. | 51,876 | |||||||||||||
| 1,500 | Big Lots, Inc. * | 23,265 | |||||||||||||
| 200 | Black & Decker Corp. | 4,734 | |||||||||||||
| 1,400 | Cablevision Systems Corp.-Class A | 18,186 | |||||||||||||
| 600 | Carter's, Inc. * | 9,786 | |||||||||||||
| 4,100 | Coach, Inc. * | 57,318 | |||||||||||||
| 17,500 | Comcast Corp.-Class A | 228,550 | |||||||||||||
| 700 | Corinthian Colleges, Inc. * | 13,790 | |||||||||||||
| 2,400 | DirecTV Group (The), Inc. * | 47,856 | |||||||||||||
| 1,300 | Dollar Tree, Inc. * | 50,466 | |||||||||||||
| 400 | DreamWorks Animation SKG, Inc.-Class A * | 7,716 | |||||||||||||
| 1,700 | Family Dollar Stores, Inc. | 46,648 | |||||||||||||
| 300 | Genuine Parts Co. | 8,442 | |||||||||||||
| 2,700 | H&R Block, Inc. | 51,570 | |||||||||||||
| 1,000 | Harley-Davidson, Inc. | 10,100 | |||||||||||||
| 2,700 | Hasbro, Inc. | 61,803 | |||||||||||||
| 8,100 | Home Depot, Inc. | 169,209 | |||||||||||||
| 800 | ITT Educational Services, Inc. * | 90,800 | |||||||||||||
| 1,200 | Johnson Controls, Inc. | 13,656 | |||||||||||||
| 4,200 | Kohl's Corp. * | 147,588 | |||||||||||||
| 700 | Leggett & Platt, Inc. | 8,001 | |||||||||||||
| 1,100 | Limited Brands, Inc. | 8,459 | |||||||||||||
| 7,868 | Lowe's Cos., Inc. | 124,629 | |||||||||||||
| 8,200 | McDonald's Corp. | 428,450 | |||||||||||||
See accompanying notes to the financial statements.
2
GMO U.S. Growth Fund
(A Series of GMO Trust)
Schedule of Investments — (Continued)
(showing percentage of total net assets)
February 28, 2009
| Shares | Description | Value ($) | |||||||||||||
| Consumer Discretionary — continued | |||||||||||||||
| 600 | McGraw-Hill Cos. (The), Inc. | 11,838 | |||||||||||||
| 300 | Mohawk Industries, Inc. * | 6,777 | |||||||||||||
| 600 | NetFlix, Inc. * | 21,684 | |||||||||||||
| 1,500 | Nike, Inc.-Class B | 62,295 | |||||||||||||
| 1,000 | O'Reilly Automotive, Inc. * | 33,360 | |||||||||||||
| 900 | Omnicom Group, Inc. | 21,627 | |||||||||||||
| 700 | Panera Bread Co.-Class A * | 30,828 | |||||||||||||
| 1,800 | PetSmart, Inc. | 36,072 | |||||||||||||
| 800 | Polo Ralph Lauren Corp. | 27,576 | |||||||||||||
| 700 | Rent-A-Center, Inc. * | 12,264 | |||||||||||||
| 2,900 | Ross Stores, Inc. | 85,608 | |||||||||||||
| 1,100 | Sherwin-Williams Co. (The) | 50,545 | |||||||||||||
| 500 | Snap-On, Inc. | 11,795 | |||||||||||||
| 7,700 | Staples, Inc. | 122,815 | |||||||||||||
| 1,700 | Starbucks Corp. * | 15,555 | |||||||||||||
| 110 | Strayer Education, Inc. | 18,673 | |||||||||||||
| 4,000 | Target Corp. | 113,240 | |||||||||||||
| 2,800 | Time Warner Cable, Inc.-Class A * | 51,044 | |||||||||||||
| 1,760 | TJX Cos. (The), Inc. | 39,195 | |||||||||||||
| 300 | Tractor Supply Co. * | 9,372 | |||||||||||||
| 3,800 | Urban Outfitters, Inc. * | 63,232 | |||||||||||||
| 600 | Yum! Brands, Inc. | 15,768 | |||||||||||||
| Total Consumer Discretionary | 3,054,699 | ||||||||||||||
| Consumer Staples — 21.3% | |||||||||||||||
| 22,584 | Altria Group, Inc. | 348,697 | |||||||||||||
| 2,400 | Avon Products, Inc. | 42,216 | |||||||||||||
| 300 | BJ's Wholesale Club, Inc. * | 8,964 | |||||||||||||
| 2,200 | Campbell Soup Co. | 58,894 | |||||||||||||
| 600 | Church & Dwight Co., Inc. | 29,352 | |||||||||||||
| 600 | Clorox Co. | 29,160 | |||||||||||||
| 20,300 | Coca-Cola Co. (The) | 829,255 | |||||||||||||
| 4,700 | Colgate-Palmolive Co. | 282,846 | |||||||||||||
| 1,800 | Costco Wholesale Corp. | 76,212 | |||||||||||||
See accompanying notes to the financial statements.
3
GMO U.S. Growth Fund
(A Series of GMO Trust)
Schedule of Investments — (Continued)
(showing percentage of total net assets)
February 28, 2009
| Shares | Description | Value ($) | |||||||||||||
| Consumer Staples — continued | |||||||||||||||
| 1,800 | CVS Caremark Corp. | 46,332 | |||||||||||||
| 600 | Dean Foods Co. * | 12,270 | |||||||||||||
| 1,500 | Estee Lauder Cos. (The), Inc.-Class A | 33,975 | |||||||||||||
| 1,200 | Flowers Foods, Inc. | 26,772 | |||||||||||||
| 6,900 | General Mills, Inc. | 362,112 | |||||||||||||
| 1,200 | Hershey Co. (The) | 40,428 | |||||||||||||
| 1,900 | HJ Heinz Co. | 62,073 | |||||||||||||
| 300 | JM Smucker Co. (The) | 11,136 | |||||||||||||
| 1,600 | Kellogg Co. | 62,272 | |||||||||||||
| 3,400 | Kimberly-Clark Corp. | 160,174 | |||||||||||||
| 3,144 | Kraft Foods, Inc.-Class A | 71,620 | |||||||||||||
| 6,500 | Kroger Co. (The) | 134,355 | |||||||||||||
| 600 | McCormick & Co., Inc. (Non Voting) | 18,810 | |||||||||||||
| 1,100 | NBTY, Inc. * | 16,357 | |||||||||||||
| 14,200 | PepsiCo, Inc. | 683,588 | |||||||||||||
| 12,984 | Philip Morris International, Inc. | 434,575 | |||||||||||||
| 18,900 | Procter & Gamble Co. (The) | 910,413 | |||||||||||||
| 400 | Ralcorp Holdings, Inc. * | 24,240 | |||||||||||||
| 400 | Supervalu, Inc. | 6,244 | |||||||||||||
| 3,100 | Sysco Corp. | 66,650 | |||||||||||||
| 45,900 | Wal-Mart Stores, Inc. | 2,260,116 | |||||||||||||
| 15,100 | Walgreen Co. | 360,286 | |||||||||||||
| Total Consumer Staples | 7,510,394 | ||||||||||||||
| Energy — 10.9% | |||||||||||||||
| 1,250 | Apache Corp. | 73,862 | |||||||||||||
| 1,100 | Baker Hughes, Inc. | 32,241 | |||||||||||||
| 4,500 | BJ Services Co. | 43,515 | |||||||||||||
| 1,200 | Cabot Oil & Gas Corp. | 24,444 | |||||||||||||
| 3,300 | Chesapeake Energy Corp. | 51,612 | |||||||||||||
| 10,000 | Chevron Corp. | 607,100 | |||||||||||||
| 200 | Cimarex Energy Co. | 3,930 | |||||||||||||
| 700 | CNX Gas Corp. * | 15,267 | |||||||||||||
| 600 | Comstock Resources, Inc. * | 18,258 | |||||||||||||
See accompanying notes to the financial statements.
4
GMO U.S. Growth Fund
(A Series of GMO Trust)
Schedule of Investments — (Continued)
(showing percentage of total net assets)
February 28, 2009
| Shares | Description | Value ($) | |||||||||||||
| Energy — continued | |||||||||||||||
| 2,629 | ConocoPhillips | 98,193 | |||||||||||||
| 600 | Devon Energy Corp. | 26,202 | |||||||||||||
| 500 | Encore Acquisition Co. * | 10,040 | |||||||||||||
| 1,600 | ENSCO International, Inc. | 39,328 | |||||||||||||
| 1,900 | EOG Resources, Inc. | 95,076 | |||||||||||||
| 1,300 | EXCO Resources, Inc. * | 11,843 | |||||||||||||
| 26,200 | Exxon Mobil Corp. | 1,778,980 | |||||||||||||
| 500 | Foundation Coal Holdings, Inc. | 8,040 | |||||||||||||
| 3,200 | Halliburton Co. | 52,192 | |||||||||||||
| 1,300 | Helmerich & Payne, Inc. | 30,758 | |||||||||||||
| 2,330 | Hess Corp. | 127,428 | |||||||||||||
| 400 | Mariner Energy, Inc. * | 3,700 | |||||||||||||
| 3,900 | Nabors Industries Ltd. * | 37,869 | |||||||||||||
| 1,300 | Noble Corp. | 31,967 | |||||||||||||
| 800 | Noble Energy, Inc. | 36,432 | |||||||||||||
| 2,900 | Occidental Petroleum Corp. | 150,423 | |||||||||||||
| 2,500 | Patterson-UTI Energy, Inc. | 21,475 | |||||||||||||
| 200 | Penn Virginia Corp. | 2,770 | |||||||||||||
| 1,100 | Petrohawk Energy Corp. * | 18,722 | |||||||||||||
| 1,500 | Pioneer Natural Resources Co. | 21,885 | |||||||||||||
| 1,000 | Plains Exploration & Production Co. * | 19,140 | |||||||||||||
| 600 | Range Resources Corp. | 21,342 | |||||||||||||
| 3,700 | Southwestern Energy Co. * | 106,449 | |||||||||||||
| 200 | St. Mary Land & Exploration Co. | 2,716 | |||||||||||||
| 800 | Sunoco, Inc. | 26,760 | |||||||||||||
| 300 | Tidewater, Inc. | 10,596 | |||||||||||||
| 383 | Transocean Ltd. * | 22,892 | |||||||||||||
| 600 | Unit Corp. * | 12,822 | |||||||||||||
| 4,000 | Valero Energy Corp. | 77,520 | |||||||||||||
| 1,400 | W&T Offshore, Inc. | 11,270 | |||||||||||||
| 2,200 | Weatherford International Ltd. * | 23,474 | |||||||||||||
| 500 | Whiting Petroleum Corp. * | 11,650 | |||||||||||||
| 1,000 | XTO Energy, Inc. | 31,660 | |||||||||||||
| Total Energy | 3,851,843 | ||||||||||||||
See accompanying notes to the financial statements.
5
GMO U.S. Growth Fund
(A Series of GMO Trust)
Schedule of Investments — (Continued)
(showing percentage of total net assets)
February 28, 2009
| Shares | Description | Value ($) | |||||||||||||
| Financials — 3.0% | |||||||||||||||
| 1,200 | Aflac, Inc. | 20,112 | |||||||||||||
| 1,200 | Annaly Capital Management, Inc. REIT | 16,680 | |||||||||||||
| 400 | Aon Corp. | 15,296 | |||||||||||||
| 300 | Arch Capital Group Ltd. * | 16,200 | |||||||||||||
| 500 | Arthur J. Gallagher & Co. | 7,935 | |||||||||||||
| 700 | Assurant, Inc. | 14,280 | |||||||||||||
| 400 | Axis Capital Holdings Ltd. | 8,952 | |||||||||||||
| 2,304 | Bank of America Corp. | 9,101 | |||||||||||||
| 240 | BlackRock, Inc. | 23,234 | |||||||||||||
| 1,300 | Brown & Brown, Inc. | 21,931 | |||||||||||||
| 300 | Capital One Financial Corp. | 3,615 | |||||||||||||
| 600 | Capitol Federal Financial | 22,218 | |||||||||||||
| 500 | Chubb Corp. | 19,520 | |||||||||||||
| 400 | Digital Realty Trust, Inc. REIT | 11,956 | |||||||||||||
| 500 | Equity Residential REIT | 8,800 | |||||||||||||
| 100 | Everest Re Group Ltd. | 6,513 | |||||||||||||
| 1,300 | Goldman Sachs Group (The), Inc. | 118,404 | |||||||||||||
| 300 | Hancock Holding Co. | 8,508 | |||||||||||||
| 300 | Hanover Insurance Group (The), Inc. | 10,551 | |||||||||||||
| 1,100 | HCC Insurance Holdings, Inc. | 24,145 | |||||||||||||
| 900 | HCP, Inc. REIT | 16,443 | |||||||||||||
| 4,500 | Hudson City Bancorp, Inc. | 46,665 | |||||||||||||
| 500 | International Bancshares Corp. | 5,005 | |||||||||||||
| 800 | JPMorgan Chase & Co. | 18,280 | |||||||||||||
| 900 | Knight Capital Group, Inc.-Class A * | 15,831 | |||||||||||||
| 2,000 | Marsh & McLennan Cos., Inc. | 35,860 | |||||||||||||
| 1,600 | MetLife, Inc. | 29,536 | |||||||||||||
| 900 | Moody's Corp. | 16,155 | |||||||||||||
| 1,800 | Morgan Stanley | 35,172 | |||||||||||||
| 900 | NewAlliance Bancshares, Inc. | 10,278 | |||||||||||||
| 200 | Odyssey Re Holdings Corp. | 9,292 | |||||||||||||
| 200 | PartnerRe Ltd. | 12,380 | |||||||||||||
| 700 | People's United Financial, Inc. | 12,187 | |||||||||||||
| 400 | Prosperity Bancshares, Inc. | 10,208 | |||||||||||||
See accompanying notes to the financial statements.
6
GMO U.S. Growth Fund
(A Series of GMO Trust)
Schedule of Investments — (Continued)
(showing percentage of total net assets)
February 28, 2009
| Shares | Description | Value ($) | |||||||||||||
| Financials — continued | |||||||||||||||
| 800 | Prudential Financial, Inc. | 13,128 | |||||||||||||
| 400 | Public Storage REIT | 22,192 | |||||||||||||
| 1,100 | SEI Investments Co. | 13,024 | |||||||||||||
| 400 | Simon Property Group, Inc. REIT | 13,240 | |||||||||||||
| 1,100 | SLM Corp. * | 5,060 | |||||||||||||
| 700 | St. Joe Co. (The) * | 12,873 | |||||||||||||
| 900 | T. Rowe Price Group, Inc. | 20,466 | |||||||||||||
| 4,800 | Travelers Cos. (The), Inc. | 173,520 | |||||||||||||
| 72 | UDR, Inc. REIT | 570 | |||||||||||||
| 300 | UMB Financial Corp. | 11,379 | |||||||||||||
| 1,500 | US Bancorp | 21,465 | |||||||||||||
| 600 | Valley National Bancorp | 6,858 | |||||||||||||
| 600 | Ventas, Inc. REIT | 12,942 | |||||||||||||
| 1,300 | W.R. Berkley Corp. | 27,053 | |||||||||||||
| 2,800 | Wells Fargo & Co. | 33,880 | |||||||||||||
| 200 | Westamerica Bancorporation | 7,974 | |||||||||||||
| Total Financials | 1,056,867 | ||||||||||||||
| Health Care — 22.4% | |||||||||||||||
| 13,800 | Abbott Laboratories | 653,292 | |||||||||||||
| 400 | Aetna, Inc. | 9,548 | |||||||||||||
| 700 | Allergan, Inc. | 27,118 | |||||||||||||
| 600 | AmerisourceBergen Corp. | 19,056 | |||||||||||||
| 17,700 | Amgen, Inc. * | 866,061 | |||||||||||||
| 300 | Bard (C.R.), Inc. | 24,078 | |||||||||||||
| 4,100 | Baxter International, Inc. | 208,731 | |||||||||||||
| 1,200 | Becton, Dickinson & Co. | 74,268 | |||||||||||||
| 1,600 | Biogen Idec, Inc. * | 73,664 | |||||||||||||
| 800 | BioMarin Pharmaceutical, Inc. * | 9,600 | |||||||||||||
| 18,700 | Bristol-Myers Squibb Co. | 344,267 | |||||||||||||
| 2,000 | Cardinal Health, Inc. | 64,900 | |||||||||||||
| 1,500 | Celgene Corp. * | 67,095 | |||||||||||||
| 900 | Cephalon, Inc. * | 59,031 | |||||||||||||
| 700 | Cigna Corp. | 11,032 | |||||||||||||
See accompanying notes to the financial statements.
7
GMO U.S. Growth Fund
(A Series of GMO Trust)
Schedule of Investments — (Continued)
(showing percentage of total net assets)
February 28, 2009
| Shares | Description | Value ($) | |||||||||||||
| Health Care — continued | |||||||||||||||
| 700 | Covance, Inc. * | 26,586 | |||||||||||||
| 2,400 | Coventry Health Care, Inc. * | 27,648 | |||||||||||||
| 600 | Covidien Ltd. | 19,002 | |||||||||||||
| 900 | Cubist Pharmaceuticals, Inc. * | 12,789 | |||||||||||||
| 500 | DaVita, Inc. * | 23,460 | |||||||||||||
| 1,300 | Edwards Lifesciences Corp. * | 72,293 | |||||||||||||
| 6,100 | Eli Lilly & Co. | 179,218 | |||||||||||||
| 1,200 | Endo Pharmaceuticals Holdings, Inc. * | 22,776 | |||||||||||||
| 2,600 | Express Scripts, Inc. * | 130,780 | |||||||||||||
| 7,200 | Forest Laboratories, Inc. * | 154,368 | |||||||||||||
| 3,000 | Genentech, Inc. * | 256,650 | |||||||||||||
| 500 | Genzyme Corp. * | 30,465 | |||||||||||||
| 14,200 | Gilead Sciences, Inc. * | 636,160 | |||||||||||||
| 300 | Health Net, Inc. * | 3,960 | |||||||||||||
| 500 | Humana, Inc. * | 11,835 | |||||||||||||
| 600 | Idexx Laboratories, Inc. * | 18,060 | |||||||||||||
| 1,000 | Illumina, Inc. * | 31,330 | |||||||||||||
| 500 | Immucor, Inc. * | 11,220 | |||||||||||||
| 17,764 | Johnson & Johnson | 888,200 | |||||||||||||
| 1,300 | King Pharmaceuticals, Inc. * | 9,542 | |||||||||||||
| 600 | LifePoint Hospitals, Inc. * | 12,612 | |||||||||||||
| 2,400 | McKesson Corp. | 98,448 | |||||||||||||
| 9,400 | Medtronic, Inc. | 278,146 | |||||||||||||
| 6,100 | Merck & Co., Inc. | 147,620 | |||||||||||||
| 2,300 | Mylan, Inc. * | 28,589 | |||||||||||||
| 400 | Myriad Genetics, Inc. * | 31,540 | |||||||||||||
| 900 | Omnicare, Inc. | 23,337 | |||||||||||||
| 700 | Patterson Cos., Inc. * | 12,649 | |||||||||||||
| 1,100 | Perrigo Co. | 22,099 | |||||||||||||
| 43,576 | Pfizer, Inc. | 536,421 | |||||||||||||
| 400 | Psychiatric Solutions, Inc. * | 6,776 | |||||||||||||
| 1,000 | Quest Diagnostics, Inc. | 45,830 | |||||||||||||
| 8,000 | Schering-Plough Corp. | 139,120 | |||||||||||||
See accompanying notes to the financial statements.
8
GMO U.S. Growth Fund
(A Series of GMO Trust)
Schedule of Investments — (Continued)
(showing percentage of total net assets)
February 28, 2009
| Shares | Description | Value ($) | |||||||||||||
| Health Care — continued | |||||||||||||||
| 100 | St. Jude Medical, Inc. ** | 3,316 | |||||||||||||
| 800 | Steris Corp. | 18,448 | |||||||||||||
| 3,500 | Stryker Corp. | 117,845 | |||||||||||||
| 300 | Techne Corp. | 14,655 | |||||||||||||
| 1,500 | Tenet Healthcare Corp. * | 1,665 | |||||||||||||
| 500 | Thoratec Corp. * | 11,420 | |||||||||||||
| 25,994 | UnitedHealth Group, Inc. | 510,782 | |||||||||||||
| 300 | Universal Health Services, Inc.-Class B | 11,049 | |||||||||||||
| 1,200 | Valeant Pharmaceuticals International * | 20,880 | |||||||||||||
| 900 | Varian Medical Systems, Inc. * | 27,459 | |||||||||||||
| 800 | Vertex Pharmaceuticals, Inc. * | 24,184 | |||||||||||||
| 400 | Waters Corp. * | 14,088 | |||||||||||||
| 500 | Watson Pharmaceuticals, Inc. * | 14,135 | |||||||||||||
| 3,100 | WellPoint, Inc. * | 105,152 | |||||||||||||
| 300 | West Pharmaceutical Services, Inc. | 9,210 | |||||||||||||
| 9,000 | Wyeth | 367,380 | |||||||||||||
| 4,400 | Zimmer Holdings, Inc. * | 154,088 | |||||||||||||
| Total Health Care | 7,887,026 | ||||||||||||||
| Industrials — 6.5% | |||||||||||||||
| 4,800 | 3M Co. | 218,208 | |||||||||||||
| 400 | Acuity Brands, Inc. | 9,168 | |||||||||||||
| 400 | Brink's Co. (The) | 9,548 | |||||||||||||
| 5,250 | Burlington Northern Santa Fe Corp. | 308,543 | |||||||||||||
| 300 | Caterpillar, Inc. | 7,383 | |||||||||||||
| 2,100 | CH Robinson Worldwide, Inc. | 86,898 | |||||||||||||
| 500 | Cintas Corp. | 10,145 | |||||||||||||
| 100 | Clean Harbors, Inc. * | 4,858 | |||||||||||||
| 1,400 | Copart, Inc. * | 37,828 | |||||||||||||
| 7,000 | CSX Corp. | 172,760 | |||||||||||||
| 1,000 | Danaher Corp. | 50,760 | |||||||||||||
| 700 | Donaldson Co., Inc. | 17,087 | |||||||||||||
| 600 | Dover Corp. | 14,964 | |||||||||||||
| 200 | Dun & Bradstreet Corp. | 14,794 | |||||||||||||
See accompanying notes to the financial statements.
9
GMO U.S. Growth Fund
(A Series of GMO Trust)
Schedule of Investments — (Continued)
(showing percentage of total net assets)
February 28, 2009
| Shares | Description | Value ($) | |||||||||||||
| Industrials — continued | |||||||||||||||
| 300 | EMCOR Group, Inc. * | 4,623 | |||||||||||||
| 2,600 | Emerson Electric Co. | 69,550 | |||||||||||||
| 2,200 | Fastenal Co. | 66,264 | |||||||||||||
| 500 | FedEx Corp. | 21,605 | |||||||||||||
| 320 | Flowserve Corp. | 16,150 | |||||||||||||
| 700 | Gardner Denver, Inc. * | 13,244 | |||||||||||||
| 400 | GATX Corp. | 7,308 | |||||||||||||
| 2,400 | General Dynamics Corp. | 105,168 | |||||||||||||
| 200 | Huron Consulting Group, Inc. * | 8,254 | |||||||||||||
| 1,800 | JB Hunt Transport Services, Inc. | 36,684 | |||||||||||||
| 800 | Joy Global, Inc. | 13,968 | |||||||||||||
| 1,100 | Kansas City Southern * | 19,459 | |||||||||||||
| 700 | Knight Transportation, Inc. | 9,072 | |||||||||||||
| 400 | L-3 Communications Holdings, Inc. | 27,060 | |||||||||||||
| 500 | Landstar System, Inc. | 15,825 | |||||||||||||
| 500 | Lockheed Martin Corp. | 31,555 | |||||||||||||
| 400 | Manpower, Inc. | 11,152 | |||||||||||||
| 700 | MSC Industrial Direct Co., Inc.-Class A | 21,413 | |||||||||||||
| 100 | Nordson Corp. | 2,490 | |||||||||||||
| 2,400 | Norfolk Southern Corp. | 76,128 | |||||||||||||
| 800 | Owens Corning, Inc. * | 6,680 | |||||||||||||
| 675 | Paccar, Inc. | 16,922 | |||||||||||||
| 700 | Parker-Hannifin Corp. | 23,359 | |||||||||||||
| 600 | Quanta Services, Inc. * | 10,560 | |||||||||||||
| 600 | Robert Half International, Inc. | 9,222 | |||||||||||||
| 700 | Rockwell Collins, Inc. | 21,840 | |||||||||||||
| 700 | Ryder System, Inc. | 16,002 | |||||||||||||
| 2,800 | Southwest Airlines Co. | 16,492 | |||||||||||||
| 600 | Tetra Tech, Inc. * | 13,440 | |||||||||||||
| 700 | Trinity Industries, Inc. | 5,166 | |||||||||||||
| 1,300 | Tyco International Ltd. | 26,065 | |||||||||||||
| 6,500 | Union Pacific Corp. | 243,880 | |||||||||||||
| 2,100 | United Parcel Service, Inc.-Class B | 86,478 | |||||||||||||
| 3,400 | United Technologies Corp. | 138,822 | |||||||||||||
See accompanying notes to the financial statements.
10
GMO U.S. Growth Fund
(A Series of GMO Trust)
Schedule of Investments — (Continued)
(showing percentage of total net assets)
February 28, 2009
| Shares | Description | Value ($) | |||||||||||||
| Industrials — continued | |||||||||||||||
| 300 | URS Corp. * | 9,276 | |||||||||||||
| 900 | UTi Worldwide Inc | 11,061 | |||||||||||||
| 400 | W.W. Grainger, Inc. | 26,464 | |||||||||||||
| 1,200 | Wabtec Corp. | 32,112 | |||||||||||||
| 1,200 | Waste Management, Inc. | 32,400 | |||||||||||||
| 300 | Watson Wyatt Worldwide, Inc. | 14,733 | |||||||||||||
| Total Industrials | 2,300,890 | ||||||||||||||
| Information Technology — 21.6% | |||||||||||||||
| 6,100 | Accenture Ltd.-Class A | 178,059 | |||||||||||||
| 1,200 | Activision Blizzard, Inc. * | 12,036 | |||||||||||||
| 2,500 | Adobe Systems, Inc. * | 41,750 | |||||||||||||
| 400 | Affiliated Computer Services, Inc.-Class A * | 18,652 | |||||||||||||
| 600 | Alliance Data Systems Corp. * | 17,760 | |||||||||||||
| 1,500 | Altera Corp. | 22,995 | |||||||||||||
| 900 | Amphenol Corp.-Class A | 22,878 | |||||||||||||
| 560 | Apple, Inc. * | 50,013 | |||||||||||||
| 3,100 | Automatic Data Processing, Inc. | 105,865 | |||||||||||||
| 1,600 | BMC Software, Inc. * | 47,408 | |||||||||||||
| 200 | CACI International, Inc.-Class A * | 8,554 | |||||||||||||
| 74,600 | Cisco Systems, Inc. * | 1,086,922 | |||||||||||||
| 1,200 | Citrix Systems, Inc. * | 24,696 | |||||||||||||
| 600 | Cognizant Technology Solutions Corp.-Class A * | 11,040 | |||||||||||||
| 1,900 | Compuware Corp. * | 11,229 | |||||||||||||
| 12,500 | Dell, Inc. * | 106,625 | |||||||||||||
| 400 | Diebold, Inc. | 8,848 | |||||||||||||
| 12,500 | eBay, Inc. * | 135,875 | |||||||||||||
| 1,000 | F5 Networks, Inc. * | 20,000 | |||||||||||||
| 400 | Factset Research Systems, Inc. | 15,416 | |||||||||||||
| 700 | Fiserv, Inc. * | 22,834 | |||||||||||||
| 500 | FLIR Systems, Inc. * | 10,205 | |||||||||||||
| 700 | Gartner, Inc. * | 7,077 | |||||||||||||
| 1,400 | Global Payments, Inc. | 42,952 | |||||||||||||
| 1,310 | Google, Inc.-Class A * | 442,767 | |||||||||||||
See accompanying notes to the financial statements.
11
GMO U.S. Growth Fund
(A Series of GMO Trust)
Schedule of Investments — (Continued)
(showing percentage of total net assets)
February 28, 2009
| Shares | Description | Value ($) | |||||||||||||
| Information Technology — continued | |||||||||||||||
| 4,500 | Hewlett-Packard Co. | 130,635 | |||||||||||||
| 1,200 | Ingram Micro, Inc.-Class A * | 13,068 | |||||||||||||
| 2,608 | Intel Corp. | 33,226 | |||||||||||||
| 7,530 | International Business Machines Corp. | 692,986 | |||||||||||||
| 500 | Lam Research Corp. * | 9,780 | |||||||||||||
| 600 | Lexmark International, Inc. * | 10,284 | |||||||||||||
| 1,600 | LSI Corp. * | 4,640 | |||||||||||||
| 830 | MasterCard, Inc.-Class A | 131,165 | |||||||||||||
| 800 | McAfee, Inc. * | 22,360 | |||||||||||||
| 90,100 | Microsoft Corp. | 1,455,115 | |||||||||||||
| 2,100 | NetApp, Inc. * | 28,224 | |||||||||||||
| 65,000 | Oracle Corp. * | 1,010,100 | |||||||||||||
| 800 | Parametric Technology Corp. * | 6,512 | |||||||||||||
| 800 | Perot Systems Corp.-Class A * | 9,104 | |||||||||||||
| 2,800 | QLogic Corp. * | 25,816 | |||||||||||||
| 36,800 | Qualcomm, Inc. | 1,230,224 | |||||||||||||
| 300 | Quality Systems, Inc. | 11,613 | |||||||||||||
| 500 | Red Hat, Inc. * | 6,845 | |||||||||||||
| 1,100 | Salesforce.com, Inc. * | 30,800 | |||||||||||||
| 1,100 | Sybase, Inc. * | 29,898 | |||||||||||||
| 3,800 | Symantec Corp. * | 52,554 | |||||||||||||
| 600 | Visa, Inc.-Class A | 34,026 | |||||||||||||
| 1,600 | Western Digital Corp. * | 21,856 | |||||||||||||
| 8,900 | Western Union Co. | 99,324 | |||||||||||||
| 1,800 | Xilinx, Inc. | 31,824 | |||||||||||||
| Total Information Technology | 7,604,435 | ||||||||||||||
| Materials — 0.8% | |||||||||||||||
| 300 | Ball Corp. | 12,087 | |||||||||||||
| 600 | Compass Minerals International, Inc. | 31,332 | |||||||||||||
| 400 | Crown Holdings, Inc. * | 8,432 | |||||||||||||
| 600 | FMC Corp. | 24,258 | |||||||||||||
| 100 | Martin Marietta Materials, Inc. | 7,656 | |||||||||||||
| 1,230 | Monsanto Co. | 93,812 | |||||||||||||
See accompanying notes to the financial statements.
12
GMO U.S. Growth Fund
(A Series of GMO Trust)
Schedule of Investments — (Continued)
(showing percentage of total net assets)
February 28, 2009
| Shares | Description | Value ($) | |||||||||||||
| Materials — continued | |||||||||||||||
| 1,500 | Nucor Corp. | 50,475 | |||||||||||||
| 1,000 | Pactiv Corp. * | 15,830 | |||||||||||||
| 900 | Reliance Steel & Aluminum Co. | 21,411 | |||||||||||||
| 300 | Rock-Tenn Co.-Class A | 8,283 | |||||||||||||
| 600 | Sigma-Aldrich Corp. | 21,420 | |||||||||||||
| Total Materials | 294,996 | ||||||||||||||
| Telecommunication Services — 0.7% | |||||||||||||||
| 4,645 | AT&T, Inc. | 110,412 | |||||||||||||
| 1,400 | Frontier Communications Corp. | 10,080 | |||||||||||||
| 1,600 | MetroPCS Communications, Inc. * | 23,200 | |||||||||||||
| 3,800 | Verizon Communications, Inc. | 108,414 | |||||||||||||
| 1,300 | Windstream Corp. | 9,698 | |||||||||||||
| Total Telecommunication Services | 261,804 | ||||||||||||||
| Utilities — 0.4% | |||||||||||||||
| 500 | Aqua America, Inc. | 9,200 | |||||||||||||
| 600 | Exelon Corp. | 28,332 | |||||||||||||
| 600 | FirstEnergy Corp. | 25,536 | |||||||||||||
| 500 | Hawaiian Electric Industries, Inc. | 6,935 | |||||||||||||
| 300 | New Jersey Resources Corp. | 10,521 | |||||||||||||
| 300 | NSTAR | 9,651 | |||||||||||||
| 300 | PG&E Corp. | 11,466 | |||||||||||||
| 400 | Piedmont Natural Gas Co., Inc. | 9,656 | |||||||||||||
| 800 | Southern Co. | 24,248 | |||||||||||||
| Total Utilities | 135,545 | ||||||||||||||
| TOTAL COMMON STOCKS (COST $48,744,738) | 33,958,499 | ||||||||||||||
See accompanying notes to the financial statements.
13
GMO U.S. Growth Fund
(A Series of GMO Trust)
Schedule of Investments — (Continued)
(showing percentage of total net assets)
February 28, 2009
| Shares | Description | Value ($) | |||||||||||||
| SHORT-TERM INVESTMENTS — 3.5% | |||||||||||||||
| Money Market Funds — 3.5% | |||||||||||||||
| 1,237,056 | State Street Institutional Treasury Money Market Fund-Institutional Class | 1,237,056 | |||||||||||||
| TOTAL SHORT-TERM INVESTMENTS (COST $1,237,056) | 1,237,056 | ||||||||||||||
| TOTAL INVESTMENTS — 99.8% (Cost $49,981,794) | 35,195,555 | ||||||||||||||
| Other Assets and Liabilities (net) — 0.2% | 87,540 | ||||||||||||||
| TOTAL NET ASSETS — 100.0% | $ | 35,283,095 | |||||||||||||
See accompanying notes to the financial statements.
14
GMO U.S. Growth Fund
(A Series of GMO Trust)
Schedule of Investments — (Continued)
February 28, 2009
A summary of outstanding financial instruments at February 28, 2009 is as follows:
Futures Contracts
| Number of Contracts | Type | Expiration Date | Contract Value | Net Unrealized Appreciation (Depreciation) | |||||||||||||||
| Buys | |||||||||||||||||||
| 20 | S&P 500 E-Mini Index | March 2009 | $ | 734,200 | $ | (151,550 | ) | ||||||||||||
As of February 28, 2009, for the futures contracts held, the Fund had sufficient cash and/or securities to cover any commitments or margin requirements of the relevant broker or exchange.
Notes to Schedule of Investments:
REIT - Real Estate Investment Trust
* Non-income producing security.
See accompanying notes to the financial statements.
15
GMO U.S. Growth Fund
(A Series of GMO Trust)
Statement of Assets and Liabilities — February 28, 2009
| Assets: | |||||||
| Investments, at value (cost $49,981,794) (Note 2) | $ | 35,195,555 | |||||
| Cash | 77 | ||||||
| Dividends and interest receivable | 94,996 | ||||||
| Receivable for collateral on open futures contracts (Note 2) | 99,000 | ||||||
| Receivable for expenses reimbursed by Manager (Note 3) | 12,135 | ||||||
| Total assets | 35,401,763 | ||||||
| Liabilities: | |||||||
| Payable to affiliate for (Note 3): | |||||||
| Management fee | 9,135 | ||||||
| Shareholder service fee | 4,354 | ||||||
| Administration fee – Class M | 88 | ||||||
| Trustees and Chief Compliance Officer of GMO Trust fees | 56 | ||||||
| Payable for 12b-1 fee – Class M | 241 | ||||||
| Payable for variation margin on open futures contracts (Note 2) | 17,800 | ||||||
| Accrued expenses | 86,994 | ||||||
| Total liabilities | 118,668 | ||||||
| Net assets | $ | 35,283,095 | |||||
| Net assets consist of: | |||||||
| Paid-in capital | $ | 71,210,869 | |||||
| Accumulated undistributed net investment income | 94,859 | ||||||
| Accumulated net realized loss | (21,084,844 | ) | |||||
| Net unrealized depreciation | (14,937,789 | ) | |||||
| $ | 35,283,095 | ||||||
| Net assets attributable to: | |||||||
| Class III shares | $ | 34,758,057 | |||||
| Class M shares | $ | 525,038 | |||||
| Shares outstanding: | |||||||
| Class III | 3,319,559 | ||||||
| Class M | 50,257 | ||||||
| Net asset value per share: | |||||||
| Class III | $ | 10.47 | |||||
| Class M | $ | 10.45 | |||||
See accompanying notes to the financial statements.
16
GMO U.S. Growth Fund
(A Series of GMO Trust)
Statement of Operations — Year Ended February 28, 2009
| Investment Income: | |||||||
| Dividends | $ | 1,686,486 | |||||
| Interest | 38,297 | ||||||
| Total investment income | 1,724,783 | ||||||
| Expenses: | |||||||
| Management fee (Note 3) | 327,610 | ||||||
| Shareholder service fee – Class III (Note 3) | 123,660 | ||||||
| 12b-1 fee – Class M (Note 3) | 58,101 | ||||||
| Administration fee – Class M (Note 3) | 46,481 | ||||||
| Custodian, fund accounting agent and transfer agent fees | 87,958 | ||||||
| Audit and tax fees | 59,841 | ||||||
| Legal fees | 2,851 | ||||||
| Trustees fees and related expenses (Note 3) | 1,142 | ||||||
| Registration fees | 21,298 | ||||||
| Miscellaneous | 4,700 | ||||||
| Total expenses | 733,642 | ||||||
| Fees and expenses reimbursed by Manager (Note 3) | (175,580 | ) | |||||
| Expense reductions (Note 2) | (15 | ) | |||||
| Net expenses | 558,047 | ||||||
| Net investment income (loss) | 1,166,736 | ||||||
| Realized and unrealized gain (loss): | |||||||
| Net realized gain (loss) on: | |||||||
| Investments | (15,721,837 | ) | |||||
| Closed futures contracts | (800,637 | ) | |||||
| Net realized gain (loss) | (16,522,474 | ) | |||||
| Change in net unrealized appreciation (depreciation) on: | |||||||
| Investments | (421,437 | ) | |||||
| Open futures contracts | (18,729 | ) | |||||
| Net unrealized gain (loss) | (440,166 | ) | |||||
| Net realized and unrealized gain (loss) | (16,962,640 | ) | |||||
| Net increase (decrease) in net assets resulting from operations | $ | (15,795,904 | ) | ||||
See accompanying notes to the financial statements.
17
GMO U.S. Growth Fund
(A Series of GMO Trust)
Statement of Changes in Net Assets
| Year Ended February 28, 2009 | Year Ended February 29, 2008 | ||||||||||
| Increase (decrease) in net assets: | |||||||||||
| Operations: | |||||||||||
| Net investment income (loss) | $ | 1,166,736 | $ | 2,313,049 | |||||||
| Net realized gain (loss) | (16,522,474 | ) | 15,904,427 | ||||||||
| Change in net unrealized appreciation (depreciation) | (440,166 | ) | (25,882,761 | ) | |||||||
| Net increase (decrease) in net assets from operations | (15,795,904 | ) | (7,665,285 | ) | |||||||
| Distributions to shareholders from: | |||||||||||
| Net investment income | |||||||||||
| Class III | (1,064,873 | ) | (1,963,020 | ) | |||||||
| Class M | (246,973 | ) | (451,426 | ) | |||||||
| Total distributions from net investment income | (1,311,846 | ) | (2,414,446 | ) | |||||||
| Net realized gains | |||||||||||
| Class III | — | (3,938,829 | ) | ||||||||
| Class M | — | (1,625,736 | ) | ||||||||
| Total distributions from net realized gains | — | (5,564,565 | ) | ||||||||
| (1,311,846 | ) | (7,979,011 | ) | ||||||||
| Net share transactions (Note 7): | |||||||||||
| Class III | (77,034,776 | ) | (85,518,384 | ) | |||||||
| Class M | (68,971,923 | ) | (10,707,607 | ) | |||||||
| Increase (decrease) in net assets resulting from net share transactions | (146,006,699 | ) | (96,225,991 | ) | |||||||
| Total increase (decrease) in net assets | (163,114,449 | ) | (111,870,287 | ) | |||||||
| Net assets: | |||||||||||
| Beginning of period | 198,397,544 | 310,267,831 | |||||||||
| End of period (including accumulated undistributed net investment income of $94,859 and $244,055, respectively) | $ | 35,283,095 | $ | 198,397,544 | |||||||
See accompanying notes to the financial statements.
18
GMO U.S. Growth Fund
(A Series of GMO Trust)
Financial Highlights
(For a Class III share outstanding throughout each period)
| Year Ended February 28/29, | |||||||||||||||||||||||
| 2009 | 2008 | 2007 | 2006 | 2005 | |||||||||||||||||||
| Net asset value, beginning of period | $ | 15.82 | $ | 17.24 | $ | 18.17 | $ | 18.26 | $ | 19.03 | |||||||||||||
| Income (loss) from investment operations: | |||||||||||||||||||||||
| Net investment income (loss)† | 0.18 | 0.17 | 0.15 | 0.15 | 0.16 | ||||||||||||||||||
| Net realized and unrealized gain (loss) | (5.32 | ) | (1.06 | ) | 0.07 | 0.86 | (0.02 | )(a) | |||||||||||||||
| Total from investment operations | (5.14 | ) | (0.89 | ) | 0.22 | 1.01 | 0.14 | ||||||||||||||||
| Less distributions to shareholders: | |||||||||||||||||||||||
| From net investment income | (0.21 | ) | (0.17 | ) | (0.15 | ) | (0.16 | ) | (0.14 | ) | |||||||||||||
| From net realized gains | — | (0.36 | ) | (1.00 | ) | (0.94 | ) | (0.77 | ) | ||||||||||||||
| Total distributions | (0.21 | ) | (0.53 | ) | (1.15 | ) | (1.10 | ) | (0.91 | ) | |||||||||||||
| Net asset value, end of period | $ | 10.47 | $ | 15.82 | $ | 17.24 | $ | 18.17 | $ | 18.26 | |||||||||||||
| Total Return(b) | (32.84 | )% | (5.49 | )% | 1.24 | % | 5.64 | % | 0.94 | % | |||||||||||||
| Ratios/Supplemental Data: | |||||||||||||||||||||||
| Net assets, end of period (000's) | $ | 34,758 | $ | 129,666 | $ | 224,554 | $ | 342,203 | $ | 357,499 | |||||||||||||
| Net expenses to average daily net assets | 0.46 | %(c) | 0.46 | %(c) | 0.46 | % | 0.48 | % | 0.48 | % | |||||||||||||
| Net investment income to average daily net assets | 1.19 | % | 0.94 | % | 0.85 | % | 0.84 | % | 0.89 | % | |||||||||||||
| Portfolio turnover rate | 70 | % | 97 | % | 111 | % | 94 | % | 136 | % | |||||||||||||
| Fees and expenses reimbursed by the Manager to average daily net assets: | 0.19 | % | 0.07 | % | 0.05 | % | 0.04 | % | 0.04 | % | |||||||||||||
(a) The amount shown for a share outstanding does not correspond with the aggregate net realized and unrealized gain (loss) on investments due to the timing of purchases and redemptions of Fund shares in relation to fluctuating market values of the investments of the Fund.
(b) The total returns would have been lower had certain expenses not been reimbursed during the periods shown and assumes the effect of reinvested distributions.
(c) The net expense ratio does not include the effect of expense reductions.
† Calculated using average shares outstanding throughout the period.
See accompanying notes to the financial statements.
19
GMO U.S. Growth Fund
(A Series of GMO Trust)
Financial Highlights
(For a Class M share outstanding throughout each period)
| Year Ended February 28/29, | |||||||||||||||||||||||
| 2009 | 2008 | 2007 | 2006 | 2005 | |||||||||||||||||||
| Net asset value, beginning of period | $ | 15.76 | $ | 17.16 | $ | 18.10 | $ | 18.19 | $ | 18.97 | |||||||||||||
| Income (loss) from investment operations: | |||||||||||||||||||||||
| Net investment income (loss)† | 0.13 | 0.11 | 0.10 | 0.10 | 0.11 | ||||||||||||||||||
| Net realized and unrealized gain (loss) | (5.30 | ) | (1.05 | ) | 0.06 | 0.85 | (0.02 | )(a) | |||||||||||||||
| Total from investment operations | (5.17 | ) | (0.94 | ) | 0.16 | 0.95 | 0.09 | ||||||||||||||||
| Less distributions to shareholders: | |||||||||||||||||||||||
| From net investment income | (0.14 | ) | (0.10 | ) | (0.10 | ) | (0.10 | ) | (0.10 | ) | |||||||||||||
| From net realized gains | — | (0.36 | ) | (1.00 | ) | (0.94 | ) | (0.77 | ) | ||||||||||||||
| Total distributions | (0.14 | ) | (0.46 | ) | (1.10 | ) | (1.04 | ) | (0.87 | ) | |||||||||||||
| Net asset value, end of period | $ | 10.45 | $ | 15.76 | $ | 17.16 | $ | 18.10 | $ | 18.19 | |||||||||||||
| Total Return(b) | (33.01 | )% | (5.79 | )% | 0.91 | % | 5.33 | % | 0.65 | % | |||||||||||||
| Ratios/Supplemental Data: | |||||||||||||||||||||||
| Net assets, end of period (000's) | $ | 525 | $ | 68,732 | $ | 85,714 | $ | 253,332 | $ | 269,227 | |||||||||||||
| Net expenses to average daily net assets | 0.76 | %(c) | 0.76 | %(c) | 0.76 | % | 0.77 | % | 0.78 | % | |||||||||||||
| Net investment income to average daily net assets | 0.80 | % | 0.64 | % | 0.56 | % | 0.54 | % | 0.61 | % | |||||||||||||
| Portfolio turnover rate | 70 | % | 97 | % | 111 | % | 94 | % | 136 | % | |||||||||||||
| Fees and expenses reimbursed by the Manager to average daily net assets: | 0.10 | % | 0.07 | % | 0.05 | % | 0.04 | % | 0.04 | % | |||||||||||||
(a) The amount shown for a share outstanding does not correspond with the aggregate net realized and unrealized gain (loss) on investments due to the timing of purchases and redemptions of Fund shares in relation to fluctuating market values of the investments of the Fund.
(b) The total returns would have been lower had certain expenses not been reimbursed during the periods shown and assumes the effect of reinvested distributions.
(c) The net expense ratio does not include the effect of expense reductions.
† Calculated using average shares outstanding throughout the period.
See accompanying notes to the financial statements.
20
GMO U.S. Growth Fund
(A Series of GMO Trust)
Notes to Financial Statements
February 28, 2009
1. Organization
GMO U.S. Growth Fund (the "Fund") is a series of GMO Trust (the "Trust"). The Fund is registered under the Investment Company Act of 1940, as amended, as an open-end, non-diversified management investment company. The Fund is advised and managed by Grantham, Mayo, Van Otterloo & Co. LLC (the "Manager" or "GMO"). The Trust was established as a Massachusetts business trust under the laws of The Commonwealth of Massachusetts on June 24, 1985. The Declaration of Trust permits the Trustees of the Trust ("Trustees") to create an unlimited number of series of shares ("Funds") and to subdivide Funds into classes.
The Fund seeks long-term capital growth. The Fund seeks to achieve its objective by outperforming the Russell 1000 Growth Index. The Fund typically makes equity investments in U.S. companies that issue stocks included in the Russell 1000 Index, and in companies with similar market capitalizations.
Throughout the year ended February 28, 2009, the Fund had two classes of shares outstanding: Class III and Class M. Class M shares bear an administration fee and a 12b-1 fee, while Class III shares bear a shareholder service fee (See Note 3). The principal economic difference between the classes of shares is the type and level of fees.
2. Significant accounting policies
The following is a summary of significant accounting policies followed by the Fund in the preparation of its financial statements. These policies are in conformity with accounting principles generally accepted in the United States of America ("U.S. GAAP") and have been consistently followed by the Fund in preparing its financial statements. The preparation of financial statements in accordance with U.S. GAAP requires management to make estimates and assumptions that affect the reported amounts and disclosures in the financial statements. Actual results could differ from those estimates. The accounting records of the Fund are maintained in U.S. dollars.
Portfolio valuation
Securities listed on a securities exchange for which market quotations are readily available are valued at the last sale price or official closing price on each business day, or if there is no such reported sale or official closing price, at the most recent quoted bid price. Unlisted securities for which market quotations are readily available are generally valued at the most recent quoted bid price. Debt instruments with a remaining maturity of sixty days or less are generally valued at amortized cost, which approximates fair value. Shares of investment funds are generally valued at their net asset value. Securities for which quotations are not readily available or whose values the Manager has determined to be unreliable are valued at fair value as determined in good faith by the Trustees or persons acting at their direction pursuant to procedures approved by the Trustees. By its nature, a fair value price is a good faith estim ate of the value of a security at a given point in time and may not reflect the value that would be realized if the security were sold. The difference between a fair value price and the value realized upon a sale could be material.
21
GMO U.S. Growth Fund
(A Series of GMO Trust)
Notes to Financial Statements — (Continued)
February 28, 2009
In September 2006, the Financial Accounting Standards Board ("FASB") issued Statement of Financial Accounting Standards No. 157, Fair Value Measurements ("SFAS 157"). SFAS 157 is effective for the Fund's current fiscal year. While the adoption of SFAS 157 does not have an effect on the Fund's net asset value, it does require additional disclosures about fair value measurements. SFAS 157 establishes a three-level hierarchy for disclosure of fair value measurements. The valuation hierarchy is based upon the reliability of inputs to the valuation of the Fund's investments. The three levels are defined as follows:
Level 1 – Valuations based on quoted prices for identical securities in active markets.
Level 2 – Valuations determined using other significant direct or indirect observable inputs.
Level 3 – Valuations based on inputs that are unobservable and significant.
The inputs or methodology used for valuing securities are not necessarily an indication of the risk associated with investing in those securities.
The following is a summary of the fair valuations according to inputs used as of February 28, 2009 in valuing the Fund's investments:
| Asset Valuation Inputs | Investments in Securities | Other Financial Instruments | |||||||||
| Level 1 - Quoted Prices | $ | 33,958,499 | $ | — | |||||||
| Level 2 - Other Significant Observable Inputs | 1,237,056 | — | |||||||||
| Level 3 - Significant Unobservable Inputs | — | — | |||||||||
| Total | $ | 35,195,555 | $ | — | |||||||
| Liability Valuation Inputs | Investments in Securities | Other Financial Instruments* | |||||||||
| Level 1 - Quoted Prices | $ | — | $ | (151,550 | ) | ||||||
| Level 2 - Other Significant Observable Inputs | — | — | |||||||||
| Level 3 - Significant Unobservable Inputs | — | — | |||||||||
| Total | $ | — | $ | (151,550 | ) | ||||||
* Other financial instruments include futures contracts.
The Fund held no investments or other financial instruments at either February 29, 2008 or February 28, 2009, whose fair value was determined using Level 3 inputs.
22
GMO U.S. Growth Fund
(A Series of GMO Trust)
Notes to Financial Statements — (Continued)
February 28, 2009
Futures contracts
The Fund may purchase and sell futures contracts. Upon entering into a futures contract, the Fund is required to deposit cash, U.S. government and agency obligations, or other liquid assets with the futures clearing broker in accordance with the initial margin requirements of the broker or exchange. In addition, the Fund maintains cash or securities in an amount that at least equals the net amount payable in the event the Fund must deliver the full amount of the contract. Futures contracts are marked to market daily and an appropriate payable or receivable for the change in value ("variation margin") is recorded by the Fund. The payable or receivable is settled on the following business day. Gains or losses are recognized but not considered realized until the contracts expire or are closed. Futures contracts involve, to varying degrees, risk of loss in excess of the variation margin disclosed in the Statement of Assets and Liabi lities. Under some circumstances, futures exchanges may establish daily limits on the amount that the price of a futures contract can vary from the previous day's settlement price, thereby effectively preventing liquidation of unfavorable positions. Losses may arise from changes in the value of the underlying instrument if the Fund is unable to liquidate a futures position due to an illiquid secondary market for the contract or the imposition of price limits, or if counterparties do not perform under the contract terms. Futures contracts are generally valued at the settlement price established each day by the board of trade or exchange on which they are traded. Futures contracts outstanding at the end of the period are listed in the Fund's Schedule of Investments.
Swap agreements
The Fund may enter into various types of swap agreements, including without limitation, interest rate, total return, credit default and variance swap agreements. A swap agreement is an agreement to exchange the return generated by one instrument for the return generated by another instrument. When entering into a swap agreement, the Fund and/or the swap counterparty may post or receive cash or securities as collateral. The party posting the collateral typically receives the interest associated with or payments related to the collateral and has the risk of loss related to the collateral.
Interest rate swap agreements involve an exchange by the parties of their respective commitments to pay or right to receive interest, e.g., an exchange of floating rate interest payments for fixed rate interest payments with respect to the notional amount of principal.
Total return swap agreements involve a commitment by one party to pay interest to the other party in exchange for a payment to it from the other party based on the return of a reference instrument (e.g., a security or basket of securities), both based on notional amounts. To the extent the return of the reference instrument exceeds or falls short of the interest payments, one party will receive a payment from or make a payment to the other party.
In a credit default swap agreement, one party makes payments to another party in exchange for the right to receive a specified return if a credit event occurs with respect to a referenced entity or entities. Buying credit default protection reduces the buyer's exposure in the event of an issuer's default (e.g., it reduces
23
GMO U.S. Growth Fund
(A Series of GMO Trust)
Notes to Financial Statements — (Continued)
February 28, 2009
risk where a party owns a security issued by or otherwise has exposure to the issuer). Selling credit default protection subjects the seller to exposure to an issuer's default. A seller of credit default protection receives payments in return for its obligation to pay the principal amount of a debt security (or other agreed-upon value) to the other party upon the occurrence of a credit event (e.g., issuer default or similar event). If no credit event occurs, the seller has no payment obligations. For credit default swap agreements on asset-backed securities, a credit event may be triggered by such events as the issuer's failure to pay interest or principal, an agreement of the holders of an asset-backed security to a maturity extension, a rating downgrade on the security or a write-down on the collateral underlying the security. For credit default swap agreements on corporate or sovereign issuers, a credit event may be triggered by such events as the issuer's bankruptcy, failure to pay interest or principal, repudiation/moratorium or restructuring.
Variance swap agreements involve an agreement by two parties to exchange cash flows based on the measured variance (or square of volatility) of a specified underlying asset. One party agrees to exchange a "fixed rate" or strike price payment for the "floating rate" or realized price variance on the underlying asset with respect to the notional amount. At inception, the strike price chosen is generally fixed at a level such that the fair value of the swap is zero. At the expiration date, the amount paid by one party to the other is the difference between the realized price variance of the underlying asset and the strike price multiplied by the notional amount. A receiver of the realized price variance would receive a payment when the realized price variance of the underlying asset is greater than the strike price and would make a payment when that variance is less than the strike price. A payer of the realized price variance woul d make a payment when the realized price variance of the underlying asset is greater than the strike price and would receive a payment when that variance is less than the strike price. This type of agreement is essentially a forward contract on the future realized price variance of the underlying asset.
The Fund prices its swap agreements daily using models that may incorporate quotations from market makers and records the change in value, if any, as unrealized gain or loss in the Statement of Operations. Payments received or made on swap agreements are recorded as realized gain or loss in the Statement of Operations. Gains or losses are realized upon termination of the swap agreements.
Swap agreements often are not actively traded on financial markets. The values assigned to them may differ significantly from the values that would be realized upon termination, and the differences could be material. Entering into swap agreements involves credit, legal, market and documentation risk that is not reflected in the amounts reported in the Statement of Assets and Liabilities. Such risks include the possibility that the party with whom the Fund contracts may default on its obligations to perform or disagree as to the meaning of contractual terms, or that the collateral that party posts may be insufficient or not timely received by the Fund. Credit risk may be particularly acute in an environment where financial services firms are exposed to systemic risks of the type evidenced by the insolvency of Lehman Brothers and subsequent market disruptions. The Fund had no swap agreements outstanding at the end of the period.
24
GMO U.S. Growth Fund
(A Series of GMO Trust)
Notes to Financial Statements — (Continued)
February 28, 2009
Repurchase agreements
The Fund may enter into repurchase agreements. Under a repurchase agreement the Fund acquires a security for cash and obtains a simultaneous commitment from the seller to repurchase the security at an agreed upon price and date. The Fund, through its custodian, takes possession of securities collateralizing the repurchase agreement. The collateral is marked to market daily to ensure that the market value of the underlying assets is at least equal to the amount owed to the Fund in the event of default by the seller. If the seller of a repurchase agreement defaults or enters into insolvency proceedings and the value of the collateral declines, the Fund's recovery of cash may be delayed or limited. The Fund had no repurchase agreements outstanding at the end of the period.
Securities lending
The Fund may lend its securities to qualified brokers. The loans are collateralized with cash or liquid securities with a market value at least equal to the market value of the securities upon entering into the loan. As with other extensions of credit, the Fund may bear the risk of loss with respect to the investment of the collateral, the risk of delay in and/or inability to exercise its rights with respect to the collateral, and the risk of delay in recovery or loss of rights in the loaned securities should the borrower of the securities fail financially. If a loan is collateralized by U.S. government securities, the Fund receives a fee from the borrower. If a loan is collateralized by cash, the Fund typically invests the cash collateral for its own account. For the year from March 1, 2008 through February 28, 2009, the Fund did not participate in securities lending.
Taxes and distributions
The Fund intends to qualify each tax year as a regulated investment company under Subchapter M of the Internal Revenue Code of 1986, as amended (the "Code"). The Fund intends to distribute substantially all of its net investment income and all of its net realized short-term and long-term capital gain, if any, after giving effect to any available capital loss carryforwards for U.S. federal income tax purposes. Therefore, no provision for U.S. federal income or excise tax is necessary.
The Fund's policy is to declare and pay distributions from net investment income, if any, quarterly, and from net realized short-term and long-term capital gain, if any, at least annually. All distributions are paid in shares of the Fund, at net asset value, unless the shareholder elects to receive cash distributions. Distributions to shareholders are recorded by the Fund on the ex-dividend date.
Income and capital gain distributions are determined in accordance with U.S. federal income tax regulations, which may differ from U.S. GAAP. Certain capital accounts in the financial statements are periodically adjusted for permanent differences in order to reflect their tax character. These adjustments have no impact on net assets or net asset value per share. Temporary differences that arise from recognizing certain items of income, expense, gain or loss in different periods for financial statement and tax purposes will reverse at some time in the future. Distributions in excess of net investment income or net realized gains are temporary over-distributions for financial statement purposes resulting from differences in the recognition or classification of income or distributions for financial statement and tax purposes.
25
GMO U.S. Growth Fund
(A Series of GMO Trust)
Notes to Financial Statements — (Continued)
February 28, 2009
U.S. GAAP and tax accounting differences primarily relate to capital loss carryforwards, derivative contract transactions, losses on wash sale transactions, and post-October capital losses.
The following reclassification represents the amount necessary to report the stated components of net assets on a tax basis, excluding certain temporary differences, as of February 28, 2009. The financial highlights exclude these adjustments.
| Accumulated Undistributed Net Investment Income | Accumulated Net Realized Loss | Paid-in Capital | |||||||||
| $ | (4,086 | ) | $ | 4,086 | $ | — | |||||
The tax character of distributions declared to shareholders is as follows:
| 2/28/2009 | 2/29/2008 | ||||||||||
| Ordinary income (including any net short-term capital gain) | $ | 1,311,846 | $ | 2,427,666 | |||||||
| Net long-term capital gain | — | 5,551,345 | |||||||||
| Total distributions | $ | 1,311,846 | $ | 7,979,011 | |||||||
Distributions in excess of tax basis earnings and profits, if significant, are reported in the financial statements as a return of capital for tax purposes.
As of February 28, 2009, the components of distributable earnings on a tax basis consisted of the following:
| Undistributed ordinary income (including any net short-term capital gain) | $ | 94,859 | |||||
As of February 28, 2009, the Fund elected to defer to March 1, 2009 post-October capital losses of $4,390,997.
As of February 28, 2009, the Fund had capital loss carryforwards available to offset future realized gains if any, to the extent permitted by the Code. Such losses expire as follows:
| 2/28/2011 | $ | (2,843,668 | ) | ||||
| 2/29/2012 | (782,016 | ) | |||||
| 2/28/2017 | (11,615,801 | ) | |||||
| Total | $ | (15,241,485 | ) | ||||
26
GMO U.S. Growth Fund
(A Series of GMO Trust)
Notes to Financial Statements — (Continued)
February 28, 2009
As of February 28, 2009, the approximate cost for U.S. federal income tax purposes and gross and net unrealized appreciation (depreciation) in value of investments were as follows:
| Aggregate Cost | Gross Unrealized Appreciation | Gross Unrealized (Depreciation) | Net Unrealized Appreciation (Depreciation) | ||||||||||||
| $ | 51,585,706 | $ | 131,180 | $ | (16,521,331 | ) | $ | (16,390,151 | ) | ||||||
Utilization of the capital loss carryforwards, post-October capital losses and future losses, if any, realized subsequent to February 28, 2009, could be subject to limitations imposed by the Code related to share ownership activity.
The Fund is subject to the provisions of Financial Accounting Standards Board Interpretation No. 48 ("FIN 48"), Accounting for Uncertainty in Income Taxes — an Interpretation of FASB Statement No. 109. FIN 48 sets forth a minimum threshold for financial statement recognition of a tax position taken or expected to be taken in a tax return that could affect the Fund's financial statements. The Fund did not have any unrecognized tax benefits or liabilities at February 28, 2009, nor did it have any increases or decreases in unrecognized tax benefits or liabilities for the period then ended. The Fund is subject to examination prior to the expiration of the statute of limitations by U.S. federal and state tax authorities for tax returns filed.
Security transactions and related investment income
Security transactions in the financial statements are accounted for on the trade date. Dividend income, net of applicable foreign withholding taxes, if any, is recorded on the ex-dividend date or, if later, when the Fund is informed of the ex-dividend date. Interest income is recorded on the accrual basis and is adjusted for the amortization of premiums and accretion of discounts. Principal on inflation indexed securities is adjusted for inflation and any increase or decrease is recorded as interest income or loss. Income is not recognized on securities for which collection is not expected. Non-cash dividends, if any, are recorded at the fair market value of the asset received. In determining the net gain or loss on securities sold, the Fund uses the identified cost basis for the purposes of determining the cost basis.
Expenses
The majority of the expenses of the Trust are directly identifiable to an individual fund. Expenses that are not readily identifiable to a specific fund are allocated taking into consideration, among other things, the nature and type of expense and the relative size of the funds. Investment income, common expenses and realized and unrealized gains and losses are allocated pro rata among the classes of shares of the Fund based on the relative net assets of each class. Shareholder service fees, 12b-1, and administration fees, which are directly attributable to a class of shares, are charged to that class's operations.
27
GMO U.S. Growth Fund
(A Series of GMO Trust)
Notes to Financial Statements — (Continued)
February 28, 2009
State Street Bank and Trust Company ("State Street") serves as custodian, fund accounting agent and transfer agent of the Fund. State Street's fees may be reduced by an earnings allowance calculated on the average daily cash balances the Fund maintains with State Street. The Fund receives the benefit of the earnings allowance. In addition, Goldman Sachs Agency Lending, the Fund's securities lending agent, has agreed to reimburse the Fund for certain transactional expenses related to securities lending activity. Credit balances or expense reimbursements used to reduce fees, if any, are reported as a reduction of expenses in the Statement of Operations.
Recently issued accounting pronouncement
In March 2008, FASB issued Statement of Financial Accounting Standards No. 161, Disclosures about Derivative Instruments and Hedging Activities ("SFAS 161"). SFAS 161 is effective for fiscal years and interim periods beginning after November 15, 2008. SFAS 161 requires enhanced disclosures about the Fund's derivative and hedging activities. The Manager is currently evaluating the impact the adoption of SFAS 161 will have on the Fund's financial statement disclosures.
3. Fees and other transactions with affiliates
GMO receives a management fee for the services it provides to the Fund. That fee is paid monthly at the annual rate of 0.31% of average daily net assets. The Fund has adopted a Shareholder Service Plan under which the Fund pays GMO a shareholder service fee for client and shareholder service, reporting, and other support. Pursuant to the Shareholder Service Plan, the shareholder service fee is calculated based on average daily net assets at the annual rate of 0.15% for Class III shares.
Holders of Class M shares of the Fund pay GMO an administration fee for support services provided to Class M shareholders. That fee is paid monthly at the annual rate of 0.20% of the average net assets daily of Class M shares. Pursuant to a Rule 12b-1 distribution and service plan adopted by the Fund, holders of Class M shares of the Fund may pay a fee, at the annual rate of up to 1.00% of average daily net assets of Class M shares for any activities or expenses primarily intended to result in the sale of Class M shares of the Fund and/or the provision of services to Class M shareholders. The Trustees currently limit payments on Class M shares to 0.25% of the Fund's average daily net assets of Class M shares.
Through at least June 30, 2009, the Manager has contractually agreed to reimburse the Fund for Fund expenses incurred through that date to the extent the Fund's total annual operating expenses (excluding "Excluded Expenses", as defined below) exceed 0.31% of the Fund's average daily net assets. Excluded Expenses include shareholder service fees, administration and distribution (12b-1) fees, fees and expenses of the independent Trustees of the Trust, fees and expenses for legal services not approved by the Manager for the Trust, compensation and expenses of the Trust's Chief Compliance Officer ("CCO") (excluding any employee benefits), brokerage commissions, securities lending fees and expenses, interest expense, transfer taxes, and other investment-related costs (including expenses associated with investments in any
28
GMO U.S. Growth Fund
(A Series of GMO Trust)
Notes to Financial Statements — (Continued)
February 28, 2009
company that is an investment company or would be an investment company under the 1940 Act, but for the exceptions to the definition of investment company provided in Section 3(c)(1) and 3(c)(7) of the 1940 Act), hedging transaction fees, extraordinary, non-recurring and certain other unusual expenses (including taxes).
The Fund's portion of the fees paid by the Trust to the Trust's independent Trustees and CCO during the year ended February 28, 2009 was $1,050 and $761, respectively. The compensation and expenses of the CCO are included in miscellaneous expenses in the Statement of Operations. The Fund paid no remuneration to any other officer of the Trust.
4. Purchases and sales of securities
Cost of purchases and proceeds from sales of securities, excluding short-term investments, for the year ended February 28, 2009 aggregated $70,877,126 and $211,377,723, respectively.
5. Guarantees
In the normal course of business the Fund enters into contracts with third-party service providers that contain a variety of representations and warranties and that provide general indemnifications. The Fund's maximum exposure under these arrangements is unknown, as it involves future claims that may be made against the Fund that have not yet occurred. Based on experience, management is of the view that the risk of loss in connection with its indemnification obligations is remote; however, there can be no assurance that such obligations will not result in material liabilities that adversely affect the Fund.
6. Principal shareholders and related parties
As of February 28, 2009, 92.40% of the outstanding shares of the Fund were held by one shareholder. On that date, no other shareholder owned more than 10% of the outstanding shares of the Fund. Redemptions from (or investments into) the Fund by or on behalf of this large shareholder may have a material effect on the Fund.
As of February 28, 2009, less than 0.01% of the Fund's shares were held by senior management of the Manager and GMO Trust officers and 0.05% of the Fund's shares were held by accounts for which the Manager had investment discretion.
29
GMO U.S. Growth Fund
(A Series of GMO Trust)
Notes to Financial Statements — (Continued)
February 28, 2009
7. Share transactions
The Declaration of Trust permits the Trust to issue an unlimited number of shares of beneficial interest (without par value). Transactions in Fund shares were as follows:
| Year Ended February 28, 2009 | Year Ended February 29, 2008 | ||||||||||||||||||
| Class III: | Shares | Amount | Shares | Amount | |||||||||||||||
| Shares sold | 108,893 | $ | 1,725,962 | 302,944 | $ | 5,156,583 | |||||||||||||
| Shares issued to shareholders in reinvestment of distributions | 72,485 | 1,064,140 | 327,572 | 5,900,873 | |||||||||||||||
| Shares repurchased | (5,059,040 | ) | (79,824,878 | ) | (5,457,694 | ) | (96,575,840 | ) | |||||||||||
| Net increase (decrease) | (4,877,662 | ) | $ | (77,034,776 | ) | (4,827,178 | ) | $ | (85,518,384 | ) | |||||||||
| Year Ended February 28, 2009 | Year Ended February 29, 2008 | ||||||||||||||||||
| Class M: | Shares | Amount | Shares | Amount | |||||||||||||||
| Shares sold | 93,630 | $ | 1,517,398 | 290,213 | $ | 5,119,051 | |||||||||||||
| Shares issued to shareholders in reinvestment of distributions | 15,520 | 246,973 | 115,575 | 2,077,162 | |||||||||||||||
| Shares repurchased | (4,419,327 | ) | (70,736,294 | ) | (1,039,952 | ) | (17,903,820 | ) | |||||||||||
| Net increase (decrease) | (4,310,177 | ) | $ | (68,971,923 | ) | (634,164 | ) | $ | (10,707,607 | ) | |||||||||
30
Report of Independent Registered Public Accounting Firm
To the Trustees of GMO Trust and the Shareholders of
GMO U.S. Growth Fund:
In our opinion, the accompanying statement of assets and liabilities, including the schedule of investments, and the related statements of operations and of changes in net assets and the financial highlights present fairly, in all material respects, the financial position of GMO U.S. Growth Fund (the "Fund") at February 28, 2009, the results of its operations for the year then ended, the changes in its net assets for each of the two years in the period then ended and the financial highlights for each of the five years in the period then ended, in conformity with accounting principles generally accepted in the United States of America. These financial statements and financial highlights (hereafter referred to as "financial statements") are the responsibility of the Fund's management. Our responsibility is to express an opinion on these financial statements based on our audits. We conducted our audits of these financial statements in accordance with the standards of the Public Company Accounting Oversight Board (United States). Those standards require that we plan and perform the audit to obtain reasonable assurance about whether the financial statements are free of material misstatement. An audit includes examining, on a test basis, evidence supporting the amounts and disclosures in the financial statements, assessing the accounting principles used and significant estimates made by management, and evaluating the overall financial statement presentation. We believe that our audits, which included confirmation of securities at February 28, 2009 by correspondence with the custodian and brokers, provide a reasonable basis for our opinion.
PricewaterhouseCoopers LLP
Boston, Massachusetts
April 29, 2009
31
GMO U.S. Growth Fund
(A Series of GMO Trust)
Fund Expenses
February 28, 2009 (Unaudited)
Expense Examples: The following information is in relation to expenses for the six month period ended February 28, 2009.
As a shareholder of the Fund, you may incur two types of costs: (1) transaction costs, and (2) ongoing costs, including management fees, shareholder service fees, and other Fund expenses. This example is intended to help you understand your ongoing costs (in dollars) of investing in the Fund and to compare these costs with the ongoing costs of investing in other mutual funds.
These examples are based on an investment of $1,000 invested at the beginning of the period and held for the entire period, September 1, 2008 through February 28, 2009.
Actual Expenses
The first line of the table for each class below provides information about actual account values and actual expenses. You may use the information in this line, together with the amount you invested, to estimate the expenses that you paid over the period. Simply divide your account value by $1,000 (for example, a $10,000,000 account value divided by $1,000 = 10,000), then multiply the result by the number in the first line under the heading entitled "Net Expense Incurred" to estimate the expenses you paid on your account during this period.
Hypothetical Example for Comparison Purposes
The second line of the table for each class below provides information about hypothetical account values and hypothetical expenses based on the Fund's actual expense ratio and an assumed rate of return of 5% per year before expenses, which is not the Fund's actual return. The hypothetical account values and expenses may not be used to estimate the actual ending account balance or expenses you paid for the period. You may use this information to compare the ongoing costs of investing in the Fund with other funds. To do so, compare this 5% hypothetical example with the 5% hypothetical examples that appear in the shareholder reports of other funds.
Please note that the expenses shown in the table are meant to highlight your ongoing costs only and do not reflect any transactional costs, such as purchase premiums and redemption fees. Therefore, the second line of the table is useful in comparing ongoing costs only, and will not help you determine the relative total costs of owning different funds. In addition, if these transactional costs were included, your costs would have been higher.
| Annualized Net Expense Ratio | Beginning Account Value | Ending Account Value | Net Expense Incurred* | ||||||||||||||||
| Class III | |||||||||||||||||||
| 1) Actual | 0.46 | % | $ | 1,000.00 | $ | 664.50 | $ | 1.90 | |||||||||||
| 2) Hypothetical | 0.46 | % | $ | 1,000.00 | $ | 1,022.51 | $ | 2.31 | |||||||||||
| Class M | |||||||||||||||||||
| 1) Actual | 0.76 | % | $ | 1,000.00 | $ | 663.80 | $ | 3.14 | |||||||||||
| 2) Hypothetical | 0.76 | % | $ | 1,000.00 | $ | 1,021.03 | $ | 3.81 | |||||||||||
* Expenses are calculated using each Class's annualized net expense ratio for the six months ended February 28, 2009, multiplied by the average account value over the period, multiplied by 181 days in the period, divided by 365 days in the year.
32
GMO U.S. Growth Fund
(A Series of GMO Trust)
Tax Information for the Tax Year Ended February 28, 2009 (Unaudited)
The Fund will notify shareholders of amounts for use in preparing 2009 income tax forms in January 2010.
For taxable, non-corporate shareholders, 100.00% of the income and short-term capital gains, if any, distributed in the Fund's fiscal year ended February 28, 2009 represents qualified dividend income subject to the 15% rate category.
For corporate shareholders, 100.00% of the income and short-term capital gains, if any, distributed in the Fund's fiscal year ended February 28, 2009 qualified for the dividends-received deduction.
The Fund hereby designates as qualified interest income with respect to its taxable year ended February 28, 2009, $23,021 or if determined to be different, the qualified interest income of such year.
33
Trustees and Officers (Unaudited)
The following tables list the Trust's Trustees and Officers as of the date of this report; their address and date of birth ("DOB"); their position with the Trust; the length of time holding that position with the Trust; their principal occupation(s) during the past five years; the number of portfolios in the fund complex they oversee; and other directorships they hold in companies subject to registration or reporting requirements of the Securities Exchange Act of 1934 (generally called "public companies") or in registered investment companies. The Trust's Statement of Additional Information ("SAI") includes additional information about the Trust's trustees, including changes subsequent to the date of the report. The SAI is available, without charge, upon request by writing GMO, c/o GMO Trust, 40 Rowes Wharf, Boston, MA 02110.
Independent Trustees:
| Name, Address, and DOB | Position(s) Held with Trust | Term of Office1 and Length of Time Served | Principal Occupation(s) During Past Five Years | Number of Portfolios in Fund Complex Overseen by Trustee | Other Directorships Held by Trustee | ||||||||||||||||||
| Donald W. Glazer, Esq. c/o GMO Trust 40 Rowes Wharf Boston, MA 02110 DOB: 07/26/1944 | Chairman of the Board of Trustees | Chairman of the Board of Trustees since March 2005; Lead Independent Trustee (September 2004 – March 2005); Trustee since December 2000. | Consultant – Law and Business2; Author of Legal Treatises. | 59 | None. | ||||||||||||||||||
1 Each Trustee is elected to serve during the continued lifetime of the Trust until he/she dies, resigns or is removed, or if sooner, until the next meeting of Shareholders called for the purpose of electing Trustees and until the election and qualification of his/her successor.
2 As part of Mr. Glazer's work as a consultant, he provides part-time consulting services to Goodwin Procter LLP ("Goodwin"). Goodwin has provided legal services to Renewable Resources, LLC, an affiliate of GMO; GMO, in connection with its relationship with Renewable Resources; and funds managed by Renewable Resources. Mr. Glazer has represented that he has no financial interest in, and is not involved in the provision of, such legal services. In the calendar years ended December 31, 2007 and December 31, 2008, these entities paid $789,416 and $183,864 respectively, in legal fees and disbursements to Goodwin. In correspondence with the Staff of the Securities and Exchange Commission beginning in August 2006, the Independent Trustees' legal counsel provided the Staff with information regarding Mr. Glazer's relationship with Goodwin and h is other business activities. On September 11, 2007, based on information that had been given to the Staff as of that date, the Staff provided oral no-action assurance consistent with the opinion of the Independent Trustees' legal counsel that Mr. Glazer is not an "interested person" of the Trust.
34
Independent Trustees — (Continued)
| Name, Address, and DOB | Position(s) Held with Trust | Term of Office1 and Length of Time Served | Principal Occupation(s) During Past Five Years | Number of Portfolios in Fund Complex Overseen by Trustee | Other Directorships Held by Trustee | ||||||||||||||||||
| W. Nicholas Thorndike c/o GMO Trust 40 Rowes Wharf Boston, MA 02110 DOB: 03/28/1933 | Trustee | Since March 2005. | Director or trustee of various corporations and charitable organizations, including Courier Corporation (a book publisher and manufacturer) (July 1989 – present); Putnam Funds (December 1992 – June 2004); and Providence Journal (a newspaper publisher) (December 1986 – December 2003). | 59 | Director of Courier Corporation (a book publisher and manufacturer); Member of the Investment Committee of Partners HealthCare System, Inc.3 | ||||||||||||||||||
| Peter Tufano c/o GMO Trust 40 Rowes Wharf Boston, MA 02110 DOB: 04/22/1957 | Trustee | Since December 2008. | Sylvan C. Coleman Professor of Financial Management, Harvard Business School (since 1989). | 59 | Trustee of State Street Navigator Securities Lending Trust (3 Portfolios). | ||||||||||||||||||
1 Each Trustee is elected to serve during the continued lifetime of the Trust until he/she dies, resigns or is removed, or if sooner, until the next meeting of Shareholders called for the purpose of electing Trustees and until the election and qualification of his/her successor.
3 Partners HealthCare System, Inc. is a client of the Manager.
35
Principal Officers:
| Name, Address, and DOB | Position(s) Held with Trust | Term of Office4 and Length of Time Served | Principal Occupation(s) During Past Five Years5 | ||||||||||||
| J.B. Kittredge DOB: 08/22/1954 | President and Chief Executive Officer | Since March 2009. | General Counsel, Grantham, Mayo, Van Otterloo & Co. LLC (October 2005 – Present); Partner, Ropes & Gray LLP. | ||||||||||||
| Sheppard N. Burnett c/o GMO Trust 40 Rowes Wharf Boston, MA 02110 DOB: 10/24/1968 | Treasurer and Chief Financial Officer | Chief Financial Officer since March 2007; Treasurer since November 2006; Assistant Treasurer, September 2004 – November 2006. | Fund Administration Staff, Grantham, Mayo, Van Otterloo & Co. LLC (June 2004 – present); Vice President, Director of Tax, Columbia Management Group (2002 – 2004). | ||||||||||||
| Brent C. Arvidson c/o GMO Trust 40 Rowes Wharf Boston, MA 02110 DOB: 06/26/1969 | Assistant Treasurer | Since August 1998. | Senior Fund Administrator, Grantham, Mayo, Van Otterloo & Co. LLC. | ||||||||||||
| John L. Nasrah c/o GMO Trust 40 Rowes Wharf Boston, MA 02110 DOB: 05/27/1977 | Assistant Treasurer | Since March 2007. | Fund Administrator, Grantham, Mayo, Van Otterloo & Co. LLC (September 2004 – present); Tax Analyst, Bain & Company, Inc. (June 2003 – September 2004). | ||||||||||||
| Mahmoodur Rahman c/o GMO Trust 40 Rowes Wharf Boston, MA 02110 DOB: 11/30/1967 | Assistant Treasurer | Since September 2007. | Fund Administrator, Grantham, Mayo, Van Otterloo & Co. LLC (April 2007 – present); Vice President and Senior Tax Manager, Massachusetts Financial Services Company (January 2000 – April 2007). | ||||||||||||
| Michael E. Gillespie c/o GMO Trust 40 Rowes Wharf Boston, MA 02110 DOB: 02/18/1958 | Chief Compliance Officer | Since March 2005. | Vice President of Compliance (June 2004 – February 2005) and Director of Domestic Compliance (March 2002 – June 2004), Fidelity Investments. | ||||||||||||
4 Each officer is elected to hold such office until his or her successor is duly elected and qualified to carry out the duties and responsibilities of the office, or until he or she resigns or is removed from office.
5 Each of Messrs. Burnett, Arvidson, Bohan, and Pottle serves as an officer and/or director of certain pooled investment vehicles of which GMO or an affiliate of GMO serves as the investment adviser.
36
Principal Officers — (Continued)
| Name, Address, and DOB | Position(s) Held with Trust | Term of Office4 and Length of Time Served | Principal Occupation(s) During Past Five Years5 | ||||||||||||
| Jason B. Harrison c/o GMO Trust 40 Rowes Wharf Boston, MA 02110 DOB: 01/29/1977 | Vice President and Clerk | Vice President since November 2006; Clerk since March 2006. | Legal Counsel, Grantham, Mayo, Van Otterloo & Co. LLC (since February 2006) and Attorney, Ropes & Gray LLP (September 2002 – February 2006). | ||||||||||||
| David L. Bohan c/o GMO Trust 40 Rowes Wharf Boston, MA 02110 DOB: 06/21/1964 | Vice President and Assistant Clerk | Vice President since March 2005; Assistant Clerk since March 2006. | Legal Counsel, Grantham, Mayo, Van Otterloo & Co. LLC. | ||||||||||||
| Gregory L. Pottle c/o GMO Trust 40 Rowes Wharf Boston, MA 02110 DOB: 07/09/1971 | Vice President and Assistant Clerk | Since November 2006. | Legal Counsel, Grantham, Mayo, Van Otterloo & Co. LLC. | ||||||||||||
| Anne K. Trinque c/o GMO Trust 40 Rowes Wharf Boston, MA 02110 DOB: 04/15/1978 | Vice President and Assistant Clerk | Since September 2007. | Legal Counsel, Grantham, Mayo, Van Otterloo & Co. LLC (January 2007 – present); Attorney, Goodwin Procter LLP (September 2003 – January 2007). | ||||||||||||
| Cheryl Wakeham c/o GMO Trust 40 Rowes Wharf Boston, MA 02110 DOB: 10/29/1958 | Vice President and Anti-Money Laundering Officer | Since December 2004. | Manager, Client Service Administration, Grantham, Mayo, Van Otterloo & Co. LLC. | ||||||||||||
4 Each officer is elected to hold such office until his or her successor is duly elected and qualified to carry out the duties and responsibilities of the office, or until he or she resigns or is removed from office.
5 Each of Messrs. Burnett, Arvidson, Bohan, and Pottle serves as an officer and/or director of certain pooled investment vehicles of which GMO or an affiliate of GMO serves as the investment adviser.
37
GMO Currency Hedged International Bond Fund
(A Series of GMO Trust)
Annual Report
February 28, 2009
For a free copy of the Fund's proxy voting guidelines, shareholders may call 1-617-346-7646 (collect) or visit the Securities and Exchange Commission's website at www.sec.gov. Information regarding how the Fund voted proxies relating to portfolio securities during the most recent 12-month period ended June 30 is available on GMO's website at www.gmo.com, or on the Securities and Exchange Commission's website at www.sec.gov.
The Fund files its complete schedule of portfolio holdings with the Securities and Exchange Commission for the first and third quarter of each fiscal year on Form N-Q, which is available on the Commission's website at www.sec.gov. The Fund's Form N-Q may be reviewed and copied at the Commission's Public Reference Room in Washington, D.C. Information on the operation of the Public Reference Room may be obtained by calling 1-800-SEC-0330. The Fund has a policy with respect to disclosure of portfolio holdings under which it may also make available on GMO's website at www.gmo.com a complete schedule of portfolio holdings.
This report is prepared for the general information of shareholders. It is authorized for distribution to prospective investors only when preceded or accompanied by a prospectus for the GMO Trust, which contains a complete discussion of the risks associated with an investment in this Fund and other important information. The GMO Trust prospectus can be obtained at www.gmo.com.
GMO Currency Hedged International Bond Fund
(A Series of GMO Trust)
Portfolio Management
Day-to-day management of the Fund's portfolio is the responsibility of the Fixed Income team at Grantham, Mayo, Van Otterloo & Co. LLC.
Management Discussion and Analysis of Fund Performance
The GMO Currency Hedged International Bond Fund returned -13.9% for the fiscal year ended February 28, 2009, compared to the +5.5% return for the JPMorgan Non-U.S. Government Bond Index (Hedged) (ex-Japan). The Fund's exposure to various investments is achieved directly and indirectly through its investment in certain underlying GMO mutual funds, including the GMO Emerging Country Debt Fund (ECDF), the GMO World Opportunity Overlay Fund (WOOF), and the GMO Short-Duration Collateral Fund (SDCF).
The Fund underperformed the benchmark during the fiscal year by 19.4%. Exposures to SDCF and WOOF were by far the largest negative contributor during the fiscal year, followed by negative contributions from developed interest-rate strategies, currency selection, and exposure to emerging country debt via ECDF.
Nearly 80% of the fiscal year's underperformance was due to price declines in the two funds in which the Fund invests a substantial portion of its total assets: SDCF and WOOF. These funds invest primarily in asset-backed securities. The positions in SDCF and WOOF collateralize derivatives positions that seek to deliver the return of the benchmark as well as create active exposures in global interest-rate and currency markets.
As the fiscal year was marked by sharply deteriorating liquidity conditions in securitized credit markets, spreads widened to all-time highs in the asset-backed securities held indirectly in the Currency Hedged International Bond Fund via holdings of SDCF and WOOF. Such ABS exposure contributed -1,852 bps to the Fund's performance. To increase flexibility, the Fund began holding more cash assets directly. In addition to widening spreads, both SDCF and WOOF's portfolios suffered credit downgrades during the year. SDCF had 123 downgraded securities, and WOOF had 82, representing 27.4% and 25.5% of their respective market values from the beginning of the year. At fiscal year end, 73% of SDCF's portfolio was rated AAA, 8% was rated AA, 2% was rated A, 12% was rated BBB and 5% was rated below BBB. At fiscal year end, 74% of WOOF's portfolio was rated AAA, 6% was rated AA, 2% was rated A, 12% was rated BBB and 6% was rated below BBB.
Further underperformance was attributable to interest-rate and currency strategies. Given the unhealthy market conditions for interest-rates and currencies, characterized by impaired liquidity and choppy, gapping prices, the Fund temporarily suspended model-based positions in interest rates and currencies starting in October.
In interest-rate strategies, underperformance of U.S. Treasury principal strips versus LIBOR and other opportunistic trades contributed to developed interest-rate strategy losses. Before model-based interest-rate positions were suspended, Euro-area, U.S., Swedish, and Swiss market positions had contributed positively. Further, the slope and volatility strategies also added value during this time.
Currency contribution was concentrated before positions were suspended in October. Negative relative currency performance during this time came mainly from the strategy's Swedish krona, Norwegian krone, yen, and New Zealand dollar positions.
A small exposure to emerging country debt also detracted value as spread widening on that asset class contributed negatively, as did both security and country selection.
The views expressed herein are exclusively those of Grantham, Mayo, Van Otterloo & Co. LLC Management as of the date of this report and are subject to change. GMO disclaims any responsibility to update such views. They are not meant as investment advice. References to specific securities are not recommendations of such securities and may not be representative of any GMO portfolio's current or future investments.
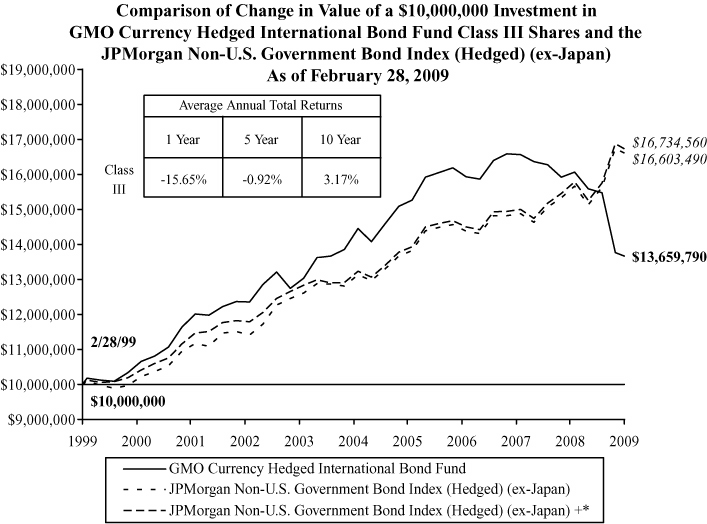
Performance data quoted represents past performance and is not indicative of future results. The investment return and principal value of an investment will fluctuate so that an investor's shares, when redeemed, may be worth more or less than their original cost. Current performance data may be lower or higher than the performance data provided herein. To obtain performance information to the most recent month-end, visit www.gmo.com. Performance shown is net of all fees after reimbursement from the Manager. Each performance figure assumes a redemption at the end of the stated period and reflects a transaction fee of 2.00% on the redemption. Transaction fees are retained by the Fund to cover trading costs. Returns would have been lower had certain expenses not been reimbursed during the periods shown and do not include the effect of taxes on distributions and redem ptions. All information is unaudited.
* JPMorgan Non-U.S. Government Bond Index (Hedged) (ex-Japan) + represents the JPMorgan Non-U.S. Government Bond Index (Hedged) prior to 12/31/03 and the JPMorgan Non-U.S. Government Bond Index (Hedged) (ex-Japan) thereafter.
GMO Currency Hedged International Bond Fund
(A Series of GMO Trust)
Investments Concentration Summary
February 29, 2009 (Unaudited)
| Asset Class Summary* | % of Total Net Assets | ||||||
| Debt Obligations | 75.8 | % | |||||
| Short-Term Investments | 22.3 | ||||||
| Options Purchased | 1.6 | ||||||
| Futures | 0.2 | ||||||
| Loan Participations | 0.1 | ||||||
| Forward Currency Contracts | 0.1 | ||||||
| Loan Assignments | 0.0 | ||||||
| Rights and Warrants | 0.0 | ||||||
| Promissory Notes | 0.0 | ||||||
| Reverse Repurchase Agreements | (0.0 | ) | |||||
| Written Options | (0.6 | ) | |||||
| Swaps | (1.0 | ) | |||||
| Other | 1.5 | ||||||
| 100.0 | % | ||||||
| Country / Region Summary** | % of Investments | ||||||
| Euro Region*** | 78.8 | % | |||||
| United Kingdom | 14.6 | ||||||
| Canada | 4.2 | ||||||
| Emerging | 2.7 | ||||||
| Australia | 0.3 | ||||||
| United States | (0.6 | ) | |||||
| 100.0 | % | ||||||
* The table above incorporates aggregate indirect asset class exposure associated with investments in other funds of GMO Trust ("underlying funds").
** The table above incorporates aggregate indirect country exposure associated with investments in the underlying funds. The table excludes short-term investments. The table includes exposure through the use of derivative contracts.
*** The "Euro Region" is comprised of Austria, Belgium, France, Germany, Greece, Ireland, Italy, Netherlands, Portugal and Spain.
1
GMO Currency Hedged International Bond Fund
(A Series of GMO Trust)
Schedule of Investments
(showing percentage of total net assets)
February 28, 2009
| Par Value/ Shares | Description | Value ($) | |||||||||||||
| DEBT OBLIGATIONS — 3.0% | |||||||||||||||
| United States — 3.0% | |||||||||||||||
| U.S. Government | |||||||||||||||
| USD | 3,885,420 | U.S. Treasury Inflation Indexed Bond, 0.88%, due 04/15/10 (a) (b) | 3,833,208 | ||||||||||||
| TOTAL DEBT OBLIGATIONS (COST $3,977,883) | 3,833,208 | ||||||||||||||
| MUTUAL FUNDS — 76.8% | |||||||||||||||
| United States — 76.8% | |||||||||||||||
| Affiliated Issuers | |||||||||||||||
| 537,733 | GMO Emerging Country Debt Fund, Class III | 3,145,736 | |||||||||||||
| 4,332,356 | GMO Short-Duration Collateral Fund | 74,083,286 | |||||||||||||
| 5,496 | GMO Special Purpose Holding Fund (c) (d) | 4,012 | |||||||||||||
| 1,107,586 | GMO World Opportunity Overlay Fund | 20,324,202 | |||||||||||||
| Total United States | 97,557,236 | ||||||||||||||
| TOTAL MUTUAL FUNDS (COST $131,940,854) | 97,557,236 | ||||||||||||||
| SHORT-TERM INVESTMENTS — 19.5% | |||||||||||||||
| Money Market Funds — 19.5% | |||||||||||||||
| 12,385,900 | State Street Institutional Liquid Reserves Fund-Institutional Class | 12,385,900 | |||||||||||||
| 12,385,901 | State Street Institutional Treasury Plus Money Market Fund- Institutional Class | 12,385,901 | |||||||||||||
| TOTAL SHORT-TERM INVESTMENTS (COST $24,771,801) | 24,771,801 | ||||||||||||||
| TOTAL INVESTMENTS — 99.3% (Cost $160,690,538) | 126,162,245 | ||||||||||||||
| Other Assets and Liabilities (net) — 0.7% | 918,910 | ||||||||||||||
| TOTAL NET ASSETS — 100.0% | $ | 127,081,155 | |||||||||||||
See accompanying notes to the financial statements.
2
GMO Currency Hedged International Bond Fund
(A Series of GMO Trust)
Schedule of Investments — (Continued)
February 28, 2009
A summary of outstanding financial instruments at February 28, 2009 is as follows:
Futures Contracts
| Number of Contracts | Type | Expiration Date | Contract Value | Net Unrealized Appreciation (Depreciation) | |||||||||||||||
| Buys | |||||||||||||||||||
| 5 | Australian Government Bond 10 Yr. | March 2009 | $ | 361,104 | $ | (1,814 | ) | ||||||||||||
| 8 | Australian Government Bond 3 Yr. | March 2009 | 551,174 | 3,385 | |||||||||||||||
| 51 | Canadian Government Bond 10 Yr. | June 2009 | 4,978,414 | (42,756 | ) | ||||||||||||||
| 425 | Euro Bund | March 2009 | 67,309,475 | 434,534 | |||||||||||||||
| 52 | Euro BOBL | March 2009 | 7,713,115 | 118,299 | |||||||||||||||
| 402 | Federal Funds 30 day | March 2009 | 167,119,743 | (2,032 | ) | ||||||||||||||
| 105 | UK Gilt Long Bond | June 2009 | 17,841,177 | (246,505 | ) | ||||||||||||||
| $ | 265,874,202 | $ | 263,111 | ||||||||||||||||
Swap Agreements
Credit Default Swaps
| Notional Amount | Expiration Date | Counterparty | Receiveu (Pay) | Annual Premium | Implied Credit Spread (1) | Deliverable on Default | Maximum Potential Amount of Future Payments by the Fund Under the Contract (2) | Market Value | |||||||||||||||||||||||||||||||||||
| 35,000,000 | USD | 3/20/2014 | Deutsche Bank | (Pay) | 1.70 | % | 1.86 | % | Republic | N/A | $ | 206,312 | |||||||||||||||||||||||||||||||
| of Italy | |||||||||||||||||||||||||||||||||||||||||||
| 25,000,000 | USD | 3/20/2019 | Deutsche Bank AG | Receive | 1.66 | % | 1.81 | % | Republic of Italy | 25,000,000 | USD | (257,155 | ) | ||||||||||||||||||||||||||||||
| $ | (50,843 | ) | |||||||||||||||||||||||||||||||||||||||||
| Premiums to (Pay) Receive | $ | — | |||||||||||||||||||||||||||||||||||||||||
u Receive - Fund receives premium and sells credit protection.
(Pay) - Fund pays premium and buys credit protection.
See accompanying notes to the financial statements.
3
GMO Currency Hedged International Bond Fund
(A Series of GMO Trust)
Schedule of Investments — (Continued)
February 28, 2009
(1) Implied credit spreads, represented in absolute terms, utilized in determining the market value of credit default swap agreements on the reference security, as of February 28, 2009, serve as an indicator of the current status of the payment/performance risk and reflect the likelihood or risk of default for the credit derivative. The implied credit spread of a particular referenced entity reflects the cost of buying/selling protection and may include upfront payments required to be made to enter into the agreement. Wider credit spreads represent a deterioration of the referenced entity's credit soundness and a greater likelihood or risk of default or other credit event occurring as defined under the terms of the agreement.
(2) The maximum potential amount the Fund could be required to make as a seller of credit protection if a credit event occurs as defined under the terms of that particular swap agreement.
Interest Rate Swaps
| Notional Amount | Expiration Date | Counterparty | Receive (Pay)# | Fixed Rate | Variable Rate | Market Value | |||||||||||||||||||||||||
| 40,000,000 | EUR | 1/23/2012 | Deutsche Bank AG | Receive | 2.71 | % | 6 month EUR LIBOR | $ | 19,010 | ||||||||||||||||||||||
| $ | 19,010 | ||||||||||||||||||||||||||||||
| Premiums to (Pay) Receive | $ | — | |||||||||||||||||||||||||||||
# Receive - Fund receives fixed rate and pays variable rate.
As of February 28, 2009, for the futures and/or swap contracts held, the Fund had sufficient cash and/or securities to cover any commitments or margin requirements of the relevant broker or exchange.
Notes to Schedule of Investments:
EUR LIBOR - London Interbank Offered Rate denominated in Euros.
(a) Indexed security in which price and/or coupon is linked to the prices of a specific instrument or financial statistic (Note 2).
(b) All or a portion of this security has been segregated to cover margin requirements on open financial futures contracts (Note 2).
(c) Underlying investment represents interests in defaulted securities.
(d) Security valued at fair value using methods determined in good faith by or at the direction of the Trustees of GMO Trust (Note 2).
Currency Abbreviations:
EUR - Euro
USD - United States Dollar
See accompanying notes to the financial statements.
4
GMO Currency Hedged International Bond Fund
(A Series of GMO Trust)
Statement of Assets and Liabilities — February 28, 2009
| Assets: | |||||||
| Investments in unaffiliated issuers, at value (cost $28,749,684) (Note 2) | $ | 28,605,009 | |||||
| Investments in affiliated issuers, at value (cost $131,940,854) (Notes 2 and 8) | 97,557,236 | ||||||
| Cash | 886,822 | ||||||
| Dividends and interest receivable | 20,454 | ||||||
| Receivable for variation margin on open futures contracts (Note 2) | 159,165 | ||||||
| Receivable for open swap contracts (Note 2) | 225,322 | ||||||
| Receivable for expenses reimbursed by Manager (Note 3) | 18,273 | ||||||
| Total assets | 127,472,281 | ||||||
| Liabilities: | |||||||
| Payable to affiliate for (Note 3): | |||||||
| Management fee | 24,232 | ||||||
| Shareholder service fee | 14,539 | ||||||
| Trustees and Chief Compliance Officer of GMO Trust fees | 367 | ||||||
| Payable for open swap contracts (Note 2) | 257,155 | ||||||
| Accrued expenses | 94,833 | ||||||
| Total liabilities | 391,126 | ||||||
| Net assets | $ | 127,081,155 | |||||
| Net assets consist of: | |||||||
| Paid-in capital | $ | 167,844,635 | |||||
| Distributions in excess of net investment income | (17,694,103 | ) | |||||
| Accumulated net realized gain | 11,248,995 | ||||||
| Net unrealized depreciation | (34,318,372 | ) | |||||
| $ | 127,081,155 | ||||||
| Net assets attributable to: | |||||||
| Class III shares | $ | 127,081,155 | |||||
| Shares outstanding: | |||||||
| Class III | 18,160,957 | ||||||
| Net asset value per share: | |||||||
| Class III | $ | 7.00 | |||||
See accompanying notes to the financial statements.
5
GMO Currency Hedged International Bond Fund
(A Series of GMO Trust)
Statement of Operations — Year Ended February 28, 2009
| Investment Income: | |||||||
| Dividends from affiliated issuers (Note 8) | $ | 5,016,284 | |||||
| Dividends | 72,695 | ||||||
| Interest | 16,915 | ||||||
| Total investment income | 5,105,894 | ||||||
| Expenses: | |||||||
| Management fee (Note 3) | 351,634 | ||||||
| Shareholder service fee – Class III (Note 3) | 210,980 | ||||||
| Custodian, fund accounting agent and transfer agent fees | 82,618 | ||||||
| Audit and tax fees | 78,478 | ||||||
| Legal fees | 6,113 | ||||||
| Trustees fees and related expenses (Note 3) | 3,533 | ||||||
| Registration fees | 368 | ||||||
| Miscellaneous | 1,947 | ||||||
| Total expenses | 735,671 | ||||||
| Fees and expenses reimbursed by Manager (Note 3) | (165,938 | ) | |||||
| Expense reductions (Note 2) | (7 | ) | |||||
| Indirectly incurred fees waived or borne by Manager (Note 3) | (17,122 | ) | |||||
| Shareholder service fee waived (Note 3) | (6,066 | ) | |||||
| Net expenses | 546,538 | ||||||
| Net investment income (loss) | 4,559,356 | ||||||
| Realized and unrealized gain (loss): | |||||||
| Net realized gain (loss) on: | |||||||
| Investments in unaffiliated issuers | 633,117 | ||||||
| Investments in affiliated issuers | (3,725,544 | ) | |||||
| Realized gains distributions from affiliated issuers (Note 8) | 111,247 | ||||||
| Closed futures contracts | 8,881,335 | ||||||
| Closed swap contracts | 836,186 | ||||||
| Written options | (403,073 | ) | |||||
| Foreign currency, forward contracts and foreign currency related transactions | (1,484,102 | ) | |||||
| Net realized gain (loss) | 4,849,166 | ||||||
| Change in net unrealized appreciation (depreciation) on: | |||||||
| Investments in unaffiliated issuers | (144,675 | ) | |||||
| Investments in affiliated issuers | (27,295,967 | ) | |||||
| Open futures contracts | (2,282,983 | ) | |||||
| Open swap contracts | (54,746 | ) | |||||
| Foreign currency, forward contracts and foreign currency related transactions | (511,227 | ) | |||||
| Net unrealized gain (loss) | (30,289,598 | ) | |||||
| Net realized and unrealized gain (loss) | (25,440,432 | ) | |||||
| Net increase (decrease) in net assets resulting from operations | $ | (20,881,076 | ) | ||||
See accompanying notes to the financial statements.
6
GMO Currency Hedged International Bond Fund
(A Series of GMO Trust)
Statement of Changes in Net Assets
| Year Ended February 28, 2009 | Year Ended February 29, 2008 | ||||||||||
| Increase (decrease) in net assets: | |||||||||||
| Operations: | |||||||||||
| Net investment income (loss) | $ | 4,559,356 | $ | 7,963,490 | |||||||
| Net realized gain (loss) | 4,849,166 | (14,143,454 | ) | ||||||||
| Change in net unrealized appreciation (depreciation) | (30,289,598 | ) | (1,305,226 | ) | |||||||
| Net increase (decrease) in net assets from operations | (20,881,076 | ) | (7,485,190 | ) | |||||||
| Distributions to shareholders from: | |||||||||||
| Net investment income | |||||||||||
| Class III | (9,430,411 | ) | (315,341 | ) | |||||||
| Return of capital | |||||||||||
| Class III | — | (2,600,431 | ) | ||||||||
| (9,430,411 | ) | (2,915,772 | ) | ||||||||
| Net share transactions (Note 7): | |||||||||||
| Class III | 1,411,572 | (108,068,985 | ) | ||||||||
| Redemption fees (Notes 2 and 7): | |||||||||||
| Class III | 29,275 | — | |||||||||
| Total increase (decrease) in net assets resulting from net share transactions and redemption fees | 1,440,847 | (108,068,985 | ) | ||||||||
| Total increase (decrease) in net assets | (28,870,640 | ) | (118,469,947 | ) | |||||||
| Net assets: | |||||||||||
| Beginning of period | 155,951,795 | 274,421,742 | |||||||||
| End of period (including distributions in excess of net investment income of $17,694,103 and $21,511,882, respectively) | $ | 127,081,155 | $ | 155,951,795 | |||||||
See accompanying notes to the financial statements.
7
GMO Currency Hedged International Bond Fund
(A Series of GMO Trust)
Financial Highlights
(For a Class III share outstanding throughout each period)
| Year Ended February 28/29, | |||||||||||||||||||||||
| 2009 | 2008 | 2007 | 2006 | 2005 | |||||||||||||||||||
| Net asset value, beginning of period | $ | 8.79 | $ | 9.21 | $ | 9.04 | $ | 9.59 | $ | 9.16 | |||||||||||||
| Income (loss) from investment operations: | |||||||||||||||||||||||
| Net investment income (loss)(a)† | 0.26 | 0.33 | 0.17 | 0.18 | 0.14 | ||||||||||||||||||
| Net realized and unrealized gain (loss) | (1.49 | ) | (0.62 | ) | 0.15 | 0.39 | 0.44 | ||||||||||||||||
| Total from investment operations | (1.23 | ) | (0.29 | ) | 0.32 | 0.57 | 0.58 | ||||||||||||||||
| Less distributions to shareholders: | |||||||||||||||||||||||
| From net investment income | (0.56 | ) | (0.01 | ) | — | (1.00 | )(b) | (0.15 | ) | ||||||||||||||
| From net realized gains | — | — | (0.14 | ) | (0.12 | ) | — | ||||||||||||||||
| Return of capital | — | (0.12 | ) | (0.01 | ) | — | — | ||||||||||||||||
| Total distributions | (0.56 | ) | (0.13 | ) | (0.15 | ) | (1.12 | ) | (0.15 | ) | |||||||||||||
| Net asset value, end of period | $ | 7.00 | $ | 8.79 | $ | 9.21 | $ | 9.04 | $ | 9.59 | |||||||||||||
| Total Return(c) | (13.93 | )% | (3.08 | )% | 3.58 | % | 6.01 | % | 6.35 | % | |||||||||||||
| Ratios/Supplemental Data: | |||||||||||||||||||||||
| Net assets, end of period (000's) | $ | 127,081 | $ | 155,952 | $ | 274,422 | $ | 953,894 | $ | 1,015,009 | |||||||||||||
| Net expenses to average daily net assets(d) | 0.39 | %(e) | 0.38 | %(e) | 0.39 | % | 0.39 | % | 0.39 | % | |||||||||||||
| Net investment income to average daily net assets(a) | 3.24 | % | 3.62 | % | 1.93 | % | 1.91 | % | 1.51 | % | |||||||||||||
| Portfolio turnover rate | 28 | % | 55 | % | 25 | % | 49 | % | 44 | % | |||||||||||||
| Fees and expenses reimbursed and/or waived by the Manager to average daily net assets: | 0.13 | % | 0.09 | % | 0.06 | % | 0.06 | % | 0.09 | % | |||||||||||||
| Redemption fees consisted of the following per share amounts:† | $ | 0.00 | (f) | — | — | — | — | ||||||||||||||||
(a) Net investment income is affected by the timing of the declaration of dividends by the underlying funds in which the Fund invests.
(b) Distributions from net investment income include amounts (approximately $0.49 per share) from foreign currency transactions which are treated as realized capital gain for book purposes.
(c) The total returns would have been lower had certain expenses not been reimbursed during the periods shown and assumes the effect of reinvested distributions. Calculation excludes redemption fees which are borne by the shareholder.
(d) Net expenses exclude expenses incurred indirectly through investment in the underlying funds (See Note 3).
(e) The net expense ratio does not include the effect of expense reductions.
(f) Redemption fees were less than $0.01 per share.
† Calculated using average shares outstanding throughout the period.
See accompanying notes to the financial statements.
8
GMO Currency Hedged International Bond Fund
(A Series of GMO Trust)
Notes to Financial Statements
February 28, 2009
1. Organization
GMO Currency Hedged International Bond Fund (the "Fund") is a series of GMO Trust (the "Trust"). The Fund is registered under the Investment Company Act of 1940, as amended, as an open-end, non-diversified management investment company. The Fund is advised and managed by Grantham, Mayo, Van Otterloo & Co. LLC (the "Manager" or "GMO"). The Trust was established as a Massachusetts business trust under the laws of The Commonwealth of Massachusetts on June 24, 1985. The Declaration of Trust permits the Trustees of the Trust ("Trustees") to create an unlimited number of series of shares ("Funds") and to subdivide Funds into classes.
The Fund seeks total return greater than that of the JPMorgan Non-U.S. Government Bond Index (Hedged) (ex-Japan). The Fund typically invests in bonds included in the JPMorgan Non-U.S. Government Bond Index (Hedged) (ex-Japan) and in securities and instruments with similar characteristics. The Fund seeks additional returns by seeking to exploit differences in global interest rates and currency and emerging country debt markets. The Fund may invest a substantial portion of its assets in shares of GMO Short-Duration Collateral Fund; futures contracts, currency options, currency forwards, swap contracts, and other types of derivatives; investment-grade bonds denominated in various currencies, including foreign and U.S. government securities and asset-backed securities issued by foreign governments and U.S. government agencies (including securities neither guaranteed nor insured by the U.S. government), corporate bonds, and mortgage- backed and other asset-backed securities issued by private issuers; shares of GMO World Opportunity Overlay Fund; and up to 5% of the Fund's total assets in sovereign debt of emerging countries (including below investment grade securities (also known as "junk bonds")), primarily through investment in shares of GMO Emerging Country Debt Fund ("ECDF").
The financial statements of the series of the Trust in which the Fund invests ("underlying funds") should be read in conjunction with the Fund's financial statements. These financial statements are available, without charge, upon request by calling (617) 346-7646 (collect). Shares of GMO Special Purpose Holding Fund, GMO World Opportunity Overlay Fund and GMO Short-Duration Collateral Fund are not publicly available.
The Fund directly and indirectly (through underlying funds) invests in securities with contractual cash flows, such as collateralized mortgage obligations and commercial mortgage-backed securities, including securities backed by sub-prime mortgage loans, credit card receivables and auto loan receivables. The value, liquidity and related income of these securities are sensitive to changes in economic conditions, including real estate values, delinquencies and/or defaults, and may be adversely affected by changes in interest rates and shifts in the market's perception of the securities' market values.
The Fund will, if deemed prudent by the Manager, take temporary defensive measures (until the Manager has determined that normal conditions have returned or that it is otherwise prudent to resume investing in accordance with the Fund's normal investment strategies) and may not achieve its investment objectives
9
GMO Currency Hedged International Bond Fund
(A Series of GMO Trust)
Notes to Financial Statements — (Continued)
February 28, 2009
during those periods. Recent changes in the credit markets have reduced the liquidity of all types of fixed income securities, including asset-backed securities. The Fund took temporary defensive measures during the last year.
2. Significant accounting policies
The following is a summary of significant accounting policies followed by the Fund in the preparation of its financial statements. These policies are in conformity with accounting principles generally accepted in the United States of America ("U.S. GAAP") and have been consistently followed by the Fund in preparing its financial statements. The preparation of financial statements in accordance with U.S. GAAP requires management to make estimates and assumptions that affect the reported amounts and disclosures in the financial statements. Actual results could differ from those estimates. The accounting records of the Fund are maintained in U.S. dollars.
Portfolio valuation
Securities listed on a securities exchange for which market quotations are readily available are valued at the last sale price or official closing price on each business day, or if there is no such reported sale or official closing price, at the most recent quoted bid price. Unlisted securities for which market quotations are readily available are generally valued at the most recent quoted bid price. Debt instruments with a remaining maturity of sixty days or less are generally valued at amortized cost, which approximates fair value. Shares of investment funds are generally valued at their net asset value. Securities for which quotations are not readily available or whose values the Manager has determined to be unreliable are valued at fair value as determined in good faith by the Trustees or persons acting at their direction pursuant to procedures approved by the Trustees. By its nature, a fair value price is a good faith estim ate of the value of a security at a given point in time and may not reflect the value that would be realized if the security were sold. The difference between a fair value price and the value realized upon a sale could be material.
Typically the Fund and the underlying funds value debt instruments based on prices supplied by a primary pricing source chosen by the Manager. The Manager evaluates primary pricing sources on an ongoing basis and may change a pricing source should the Manager deem it appropriate. If it deems appropriate, the Manager, at its discretion, may override a price supplied by a primary source by using a price provided by another source. The prices provided by primary pricing sources may differ from the value that would be realized if the securities were sold, and the differences could be material.
Certain securities held by the Fund and underlying funds are valued on the basis of prices provided by a single source. As of February 28, 2009, the total value of these securities represented 28.50% of the net assets. The single source prices provided may differ from the value that would be realized if the securities were sold, and the differences could be material. In addition, although alternative prices are available for other securities held by the Fund, those alternative sources would not necessarily confirm the security
10
GMO Currency Hedged International Bond Fund
(A Series of GMO Trust)
Notes to Financial Statements — (Continued)
February 28, 2009
price used by the Fund. Therefore, the existence of those alternative sources does not necessarily provide greater certainty about the prices used by the Fund.
GMO Special Purpose Holding Fund ("SPHF"), an investment of the Fund, has litigation pending against various entities related to the default of certain asset-backed securities previously held by SPHF. The outcome of the lawsuits against the remaining defendants is not known and any potential recoveries are not reflected in the net asset value of SPHF. For the year ended February 28, 2009, the Fund received $12,445 through SPHF in connection with settlement agreements related to that litigation.
In September 2006, the Financial Accounting Standards Board ("FASB") issued Statement of Financial Accounting Standards No. 157, Fair Value Measurements ("SFAS 157"). SFAS 157 is effective for the Fund's current fiscal year. While the adoption of SFAS 157 does not have an effect on the Fund's net asset value, it does require additional disclosures about fair value measurements. SFAS 157 establishes a three-level hierarchy for disclosure of fair value measurements. The valuation hierarchy is based upon the reliability of inputs to the valuation of the Fund's investments. The three levels are defined as follows:
Level 1 – Valuations based on quoted prices for identical securities in active markets.
Level 2 – Valuations determined using other significant direct or indirect observable inputs.
Level 3 – Valuations based on inputs that are unobservable and significant. The Fund utilized the following fair value techniques on Level 3 investments: The Fund considered certain bankrupt securities to be worthless.
The inputs or methodology used for valuing securities are not necessarily an indication of the risk associated with investing in those securities.
The following is a summary of the fair valuations according to inputs used as of February 28, 2009 in valuing the Fund's investments:
| Asset Valuation Inputs | Investments in Securities | Other Financial Instruments* | |||||||||
| Level 1 - Quoted Prices | $ | 3,145,736 | $ | 556,218 | |||||||
| Level 2 - Other Significant Observable Inputs | 123,012,497 | 19,010 | |||||||||
| Level 3 - Significant Unobservable Inputs | 4,012 | 206,312 | |||||||||
| Total | $ | 126,162,245 | $ | 781,540 | |||||||
* Other financial instruments include futures contracts and swap agreements.
For the underlying fund's summary of valuation inputs please refer to the respective fund's portfolio valuation note.
11
GMO Currency Hedged International Bond Fund
(A Series of GMO Trust)
Notes to Financial Statements — (Continued)
February 28, 2009
| Liability Valuation Inputs | Investments in Securities | Other Financial Instruments** | |||||||||
| Level 1 - Quoted Prices | $ | — | $ | (293,107 | ) | ||||||
| Level 2 - Other Significant Observable Inputs | — | — | |||||||||
| Level 3 - Significant Unobservable Inputs | — | (257,155 | ) | ||||||||
| Total | $ | — | $ | (550,262 | ) | ||||||
** Other financial instruments include futures contracts and swap agreements.
The following is a reconciliation of investments in which significant unobservable inputs (Level 3) were used in determining value:
| Investments in Securities | Other Financial Instruments*** | ||||||||||
| Balance as of February 29, 2008 | $ | 6,924 | $ | — | |||||||
| Accrued discounts/premiums | — | — | |||||||||
| Realized gain (loss) | — | — | |||||||||
| Realized gain distributions received | 9,506 | — | |||||||||
| Realized gain distributions paid | (12,445 | ) | — | ||||||||
| Change in unrealized appreciation/depreciation | 27 | (50,843 | ) | ||||||||
| Net purchases (sales) | — | — | |||||||||
| Net transfers in and/or out of Level 3 | — | — | |||||||||
| Balance as of February 28, 2009 | $ | 4,012 | $ | (50,843 | ) | ||||||
*** Other financial instruments include swap agreements.
Foreign currency translation
The market values of foreign securities, currency holdings and related assets and liabilities are translated to U.S. dollars based on the 4 p.m. New York time exchange rates each business day. Income and expenses denominated in foreign currencies are translated at the 4 p.m. New York time exchange rates on the business day the income and expenses are accrued or incurred. The Fund does not isolate realized and unrealized gains and losses attributable to changes in exchange rates from gains and losses that arise from changes in the market value of investments. Such fluctuations are included with net realized and unrealized gain or loss on investments. Net realized gains and losses on foreign currency transactions represent gains and losses on disposition of currencies and forward currency contracts, currency gains and losses realized between the trade and settlement dates on securities transactions, and the difference between the amount of investment income and foreign withholding taxes recorded on the Fund's accounting records and the U.S. dollar equivalent amounts actually received or paid.
12
GMO Currency Hedged International Bond Fund
(A Series of GMO Trust)
Notes to Financial Statements — (Continued)
February 28, 2009
Forward currency contracts
The Fund may enter into forward currency contracts including forward cross currency contracts. A forward currency contract is an agreement between two parties to buy and sell a currency at a set price on a future date. The market value of a forward currency contract fluctuates with changes in forward currency exchange rates. Forward currency contracts are marked to market daily using rates supplied by a quotation service and changes in value are recorded by the Fund as an unrealized gain or loss. Realized gains or losses equal to the difference between the value of the contract at the time it was opened and the value at the time it was closed are recorded upon delivery or receipt of the currency or, if a forward currency contract is offset by entering into another forward currency contract with the same broker, upon settlement of the net gain or loss. These contracts may involve market risk in excess of the unrealized gain or lo ss reflected in the Fund's Statement of Assets and Liabilities. They expose the Fund to the risk of unfavorable movements in currency values and the risk that the counterparty will be unable or unwilling to meet the terms of the contracts. The Fund had no forward currency contracts outstanding at the end of the period.
Futures contracts
The Fund may purchase and sell futures contracts. Upon entering into a futures contract, the Fund is required to deposit cash, U.S. government and agency obligations, or other liquid assets with the futures clearing broker in accordance with the initial margin requirements of the broker or exchange. In addition, the Fund maintains cash or securities in an amount that at least equals the net amount payable in the event the Fund must deliver the full amount of the contract. Futures contracts are marked to market daily and an appropriate payable or receivable for the change in value ("variation margin") is recorded by the Fund. The payable or receivable is settled on the following business day. Gains or losses are recognized but not considered realized until the contracts expire or are closed. Futures contracts involve, to varying degrees, risk of loss in excess of the variation margin disclosed in the Statement of Assets and Liabi lities. Under some circumstances, futures exchanges may establish daily limits on the amount that the price of a futures contract can vary from the previous day's settlement price, thereby effectively preventing liquidation of unfavorable positions. Losses may arise from changes in the value of the underlying instrument if the Fund is unable to liquidate a futures position due to an illiquid secondary market for the contract or the imposition of price limits, or if counterparties do not perform under the contract terms. Futures contracts are generally valued at the settlement price established each day by the board of trade or exchange on which they are traded. Futures contracts outstanding at the end of the period are listed in the Fund's Schedule of Investments.
Options
The Fund may write (i.e., sell) call and put options. Writing options alters the Fund's exposure to the underlying instrument by, in the case of a call option, obligating the Fund to sell the underlying instrument at a set price to the option-holder and, in the case of a put option, obligating the Fund to purchase the underlying instrument at a set price from the option-holder. In the case of an index option, settlement will be in cash. When the Fund writes a call or put option, an amount equal to the premium received is recorded as a liability and subsequently marked to market to reflect the current value of the option written.
13
GMO Currency Hedged International Bond Fund
(A Series of GMO Trust)
Notes to Financial Statements — (Continued)
February 28, 2009
Premiums received from writing options that expire are treated as realized gains. Premiums received from writing options that are exercised or closed are deducted from the amounts paid on the underlying future, security or currency transaction to determine the realized gain or loss. The Fund as a writer of an option has no control over whether the underlying future, security or currency may be sold (call) or purchased (put) and as a result bears the market risk of an unfavorable change in the price of the future, security or currency underlying the option. In the event that the Fund writes uncovered put or call options (i.e. options for investments that the Fund does not own), it bears the risk of substantial losses if the price of the underlying instrument increases during the term of the option. Options expose the Fund to the risk the Fund may not be able to enter into a closing transaction because of an illiquid market.
For the year ended February 28, 2009, the Fund's investment activity in options contracts written by the Fund was as follows:
| Puts | Calls | ||||||||||||||||||
| Principal Amount of Contracts | Premiums | Principal Amount of Contracts | Premiums | ||||||||||||||||
| Outstanding, beginning of year | $ | — | $ | — | $ | — | $ | — | |||||||||||
| Options written | — | — | JPY | (1,672,000,000 | ) | (156,460 | ) | ||||||||||||
| Options exercised | — | — | JPY | 1,672,000,000 | 156,460 | ||||||||||||||
| Options expired | — | — | — | — | |||||||||||||||
| Options sold | — | — | — | — | |||||||||||||||
| Outstanding, end of year | $ | — | $ | — | $ | — | $ | — | |||||||||||
The Fund may also purchase put and call options. Purchasing options alters the Fund's exposure to the underlying instrument by, in the case of a call option, entitling the Fund to purchase the underlying instrument at a set price from the writer of the option and, in the case of a put option, entitling the Fund to sell the underlying instrument at a set price to the writer of the option. The Fund pays a premium for a purchased option. That premium is disclosed in the Schedule of Investments and is subsequently marked to market to reflect the current value of the option. Premiums paid for purchasing options that expire are treated as realized losses. Premiums paid for purchasing options that are exercised or closed are deducted from the proceeds on the closing transaction to determine the realized gain or loss. The risk associated with purchasing put and call options is limited to the premium paid. The Fund had no purchased optio n contracts outstanding at the end of the period.
The Fund values exchange traded options at the last sale price, or if no sale is reported, the last bid price for options it has purchased and the last ask price for options it has written. The Fund values options traded over-the-counter using inputs provided by primary pricing sources and industry standard models.
14
GMO Currency Hedged International Bond Fund
(A Series of GMO Trust)
Notes to Financial Statements — (Continued)
February 28, 2009
Indexed securities
The Fund may invest in indexed securities. Indexed securities are securities whose redemption values and/or coupons are linked to the prices of a specific instrument or financial statistic. The Fund uses indexed securities to increase or decrease its exposure to different underlying instruments and to gain exposure to markets in which investing through conventional securities is difficult. Indexed securities held by the Fund at the end of the period are listed in the Fund's Schedule of Investments.
Swap agreements
The Fund may enter into various types of swap agreements, including without limitation, interest rate, total return, credit default and variance swap agreements. A swap agreement is an agreement to exchange the return generated by one instrument for the return generated by another instrument. When entering into a swap agreement, the Fund and/or the swap counterparty may post or receive cash or securities as collateral. The party posting the collateral typically receives the interest associated with or payments related to the collateral and has the risk of loss related to the collateral.
Interest rate swap agreements involve an exchange by the parties of their respective commitments to pay or right to receive interest, e.g., an exchange of floating rate interest payments for fixed rate interest payments with respect to the notional amount of principal.
Total return swap agreements involve a commitment by one party to pay interest to the other party in exchange for a payment to it from the other party based on the return of a reference instrument (e.g., a security or basket of securities), both based on notional amounts. To the extent the return of the reference instrument exceeds or falls short of the interest payments, one party will receive a payment from or make a payment to the other party.
In a credit default swap agreement, one party makes payments to another party in exchange for the right to receive a specified return if a credit event occurs with respect to a referenced entity or entities. Buying credit default protection reduces the buyer's exposure in the event of an issuer's default (e.g., it reduces risk where a party owns a security issued by or otherwise has exposure to the issuer). Selling credit default protection subjects the seller to exposure to an issuer's default. A seller of credit default protection receives payments in return for its obligation to pay the principal amount of a debt security (or other agreed-upon value) to the other party upon the occurrence of a credit event (e.g., issuer default or similar event). If no credit event occurs, the seller has no payment obligations. For credit default swap agreements on asset-backed securities, a credit event may be triggered by such events as the issuer's failure to pay interest or principal, an agreement of the holders of an asset-backed security to a maturity extension, a rating downgrade on the security or a write-down on the collateral underlying the security. For credit default swap agreements on corporate or sovereign issuers, a credit event may be triggered by such events as the issuer's bankruptcy, failure to pay interest or principal, repudiation/moratorium or restructuring.
15
GMO Currency Hedged International Bond Fund
(A Series of GMO Trust)
Notes to Financial Statements — (Continued)
February 28, 2009
Variance swap agreements involve an agreement by two parties to exchange cash flows based on the measured variance (or square of volatility) of a specified underlying asset. One party agrees to exchange a "fixed rate" or strike price payment for the "floating rate" or realized price variance on the underlying asset with respect to the notional amount. At inception, the strike price chosen is generally fixed at a level such that the fair value of the swap is zero. At the expiration date, the amount paid by one party to the other is the difference between the realized price variance of the underlying asset and the strike price multiplied by the notional amount. A receiver of the realized price variance would receive a payment when the realized price variance of the underlying asset is greater than the strike price and would make a payment when that variance is less than the strike price. A payer of the realized price variance woul d make a payment when the realized price variance of the underlying asset is greater than the strike price and would receive a payment when that variance is less than the strike price. This type of agreement is essentially a forward contract on the future realized price variance of the underlying asset.
The Fund prices its swap agreements daily using models that may incorporate quotations from market makers and records the change in value, if any, as unrealized gain or loss in the Statement of Operations. Payments received or made on swap agreements are recorded as realized gain or loss in the Statement of Operations. Gains or losses are realized upon termination of the swap agreements.
Swap agreements often are not actively traded on financial markets. The values assigned to them may differ significantly from the values that would be realized upon termination, and the differences could be material. Entering into swap agreements involves credit, legal, market and documentation risk that is not reflected in the amounts reported in the Statement of Assets and Liabilities. Such risks include the possibility that the party with whom the Fund contracts may default on its obligations to perform or disagree as to the meaning of contractual terms, or that the collateral that party posts may be insufficient or not timely received by the Fund. Credit risk may be particularly acute in an environment where financial services firms are exposed to systemic risks of the type evidenced by the insolvency of Lehman Brothers and subsequent market disruptions. Swap agreements outstanding at the end of the period are listed in the Fund's Schedule of Investments.
Repurchase agreements
The Fund may enter into repurchase agreements. Under a repurchase agreement the Fund acquires a security for cash and obtains a simultaneous commitment from the seller to repurchase the security at an agreed upon price and date. The Fund, through its custodian, takes possession of securities collateralizing the repurchase agreement. The collateral is marked to market daily to ensure that the market value of the underlying assets is at least equal to the amount owed to the Fund in the event of default by the seller. If the seller of a repurchase agreement defaults or enters into insolvency proceedings and the value of the collateral declines, the Fund's recovery of cash may be delayed or limited. The Fund had no repurchase agreements outstanding at the end of the period.
16
GMO Currency Hedged International Bond Fund
(A Series of GMO Trust)
Notes to Financial Statements — (Continued)
February 28, 2009
Reverse repurchase agreements
The Fund may enter into reverse repurchase agreements. Under a reverse repurchase agreement the Fund sells portfolio assets subject to an agreement by the Fund to repurchase the same assets at a later date at a fixed price. In connection with these agreements, the Fund establishes segregated accounts with its custodian in which the Fund maintains cash, U.S. government securities or other assets equal in value to its obligations under the reverse repurchase agreement into which it has entered. Reverse repurchase agreements expose the Fund to the risk that the market value of the securities the Fund has sold under the agreement may decline below the price at which the Fund is obligated to repurchase them under the agreement. If the buyer in a reverse repurchase agreement files for bankruptcy or becomes insolvent, the Fund's use of proceeds from the sale of its securities may be restricted while the other party or its trustee or re ceiver determines whether to honor the Fund's right to repurchase the securities. Furthermore, in that situation the Fund may be unable to recover the securities it sold and as a result would realize a loss equal to the difference between the value of the securities and the payment it received for them. This loss would be greater to the extent the buyer paid less than the value of the securities the Fund sold to it (e.g., a buyer may pay $95 for a bond with a market value of $100). The market value of the securities the Fund has sold is determined daily and any additional required collateral is allocated to or sent by the Fund on the next business day. The Fund had no reverse repurchase agreements outstanding at the end of the period.
Securities lending
The Fund may lend its securities to qualified brokers. The loans are collateralized with cash or liquid securities with a market value at least equal to the market value of the securities upon entering into the loan. As with other extensions of credit, the Fund may bear the risk of loss with respect to the investment of the collateral, the risk of delay in and/or inability to exercise its rights with respect to the collateral, and the risk of delay in recovery or loss of rights in the loaned securities should the borrower of the securities fail financially. If a loan is collateralized by U.S. government securities, the Fund receives a fee from the borrower. If a loan is collateralized by cash, the Fund typically invests the cash collateral for its own account. For the year from March 1, 2008 through February 28, 2009, the Fund did not participate in securities lending.
Taxes and distributions
The Fund intends to qualify each tax year as a regulated investment company under Subchapter M of the Internal Revenue Code of 1986, as amended (the "Code"). The Fund intends to distribute substantially all of its net investment income and all of its net realized short-term and long-term capital gain, if any, after giving effect to any available capital loss carryforwards for U.S. federal income tax purposes. Therefore, no provision for U.S. federal income or excise tax is necessary.
The Fund's policy is to declare and pay distributions from net investment income, if any, semiannually, and from net realized short-term and long-term capital gain, if any, at least annually. All distributions are paid in shares of the Fund, at net asset value, unless the shareholder elects to receive cash distributions. Distributions to shareholders are recorded by the Fund on the ex-dividend date.
17
GMO Currency Hedged International Bond Fund
(A Series of GMO Trust)
Notes to Financial Statements — (Continued)
February 28, 2009
Income and capital gain distributions are determined in accordance with U.S. federal income tax regulations, which may differ from U.S. GAAP. Certain capital accounts in the financial statements are periodically adjusted for permanent differences in order to reflect their tax character. These adjustments have no impact on net assets or net asset value per share. Temporary differences that arise from recognizing certain items of income, expense, gain or loss in different periods for financial statement and tax purposes will reverse at some time in the future. Distributions in excess of net investment income or net realized gains are temporary over-distributions for financial statement purposes resulting from differences in the recognition or classification of income or distributions for financial statement and tax purposes.
U.S. GAAP and tax accounting differences primarily relate to capital loss carryforwards, partnership interest tax allocations, losses on wash sale transactions, foreign currency transactions, derivative contract transactions, and post-October capital losses.
The following reclassification represents the amount necessary to report the stated components of net assets on a tax basis, excluding certain temporary differences, as of February 28, 2009. The financial highlights exclude these adjustments.
| Distributions In Excess of Net Investment Income | Accumulated Net Realized Gain | Paid-in Capital | |||||||||
| $ | 8,688,834 | $ | (7,812,231 | ) | $ | (876,603 | ) | ||||
The tax character of distributions declared to shareholders is as follows:
| 2/28/2009 | 2/29/2008 | ||||||||||
| Ordinary income (including any net short-term capital gain) | $ | 9,430,411 | $ | 315,341 | |||||||
| Tax return of capital | — | 2,600,431 | |||||||||
| Total distributions | $ | 9,430,411 | $ | 2,915,772 | |||||||
Distributions in excess of tax basis earnings and profits, if significant, are reported in the financial statements as a return of capital for tax purposes.
As of February 28, 2009, the components of distributable earnings on a tax basis consisted of the following:
| Undistributed ordinary income (including any net short-term capital gain) | $ | 4,304,774 | |||||
18
GMO Currency Hedged International Bond Fund
(A Series of GMO Trust)
Notes to Financial Statements — (Continued)
February 28, 2009
As of February 28, 2009, the Fund elected to defer March 1, 2009 post-October capital losses of $5,084,075.
As of February 28, 2009, the Fund had capital loss carryforwards available to offset future realized gains if any, to the extent permitted by the Code. Utilization of the capital loss carryforwards could be subject to limitations imposed by the Code related to share ownership activity. Such losses expire as follows:
| 2/28/2017 | $ | (3,082,431 | ) | ||||
| Total | $ | (3,082,431 | ) | ||||
As of February 28, 2009, the approximate cost for U.S. federal income tax purposes and gross and net unrealized appreciation (depreciation) in value of investments were as follows:
Aggregate Cost | Gross Unrealized Appreciation | Gross Unrealized (Depreciation) | Net Unrealized Appreciation (Depreciation) | ||||||||||||
| $ | 163,290,247 | $ | 4,012 | $ | (37,132,014 | ) | $ | (37,128,002 | ) | ||||||
The Fund is subject to the provisions of Financial Accounting Standards Board Interpretation No. 48 ("FIN 48"), Accounting for Uncertainty in Income Taxes — an Interpretation of FASB Statement No. 109. FIN 48 sets forth a minimum threshold for financial statement recognition of a tax position taken or expected to be taken in a tax return that could affect the Fund's financial statements. The Fund did not have any unrecognized tax benefits or liabilities at February 28, 2009, nor did it have any increases or decreases in unrecognized tax benefits or liabilities for the period then ended. The Fund is subject to examination prior to the expiration of the statute of limitations by U.S. federal and state tax authorities for tax returns filed.
Security transactions and related investment income
Security transactions in the financial statements are accounted for on the trade date. Dividend income, net of applicable foreign withholding taxes, if any, is recorded on the ex-dividend date or, if later, when the Fund is informed of the ex-dividend date. Interest income is recorded on the accrual basis and is adjusted for the amortization of premiums and accretion of discounts. Principal on inflation indexed securities is adjusted for inflation and any increase or decrease is recorded as interest income or loss. Income is not recognized on securities for which collection is not expected. Non-cash dividends, if any, are recorded at the fair market value of the asset received. In determining the net gain or loss on securities sold, the Fund uses the identified cost basis for the purposes of determining the cost basis.
19
GMO Currency Hedged International Bond Fund
(A Series of GMO Trust)
Notes to Financial Statements — (Continued)
February 28, 2009
Expenses
The majority of the expenses of the Trust are directly identifiable to an individual fund. Expenses that are not readily identifiable to a specific fund are allocated taking into consideration, among other things, the nature and type of expense and the relative size of the funds. In addition, the Fund incurs fees and expenses indirectly as a shareholder in the underlying funds. Because the underlying funds have different expense and fee levels and the Fund may own different proportions of the underlying funds at different times, the amount of fees and expenses indirectly incurred by the Fund will vary (See Note 3).
State Street Bank and Trust Company ("State Street") serves as custodian, fund accounting agent and transfer agent of the Fund. State Street's fees may be reduced by an earnings allowance calculated on the average daily cash balances the Fund maintains with State Street. The Fund receives the benefit of the earnings allowance. In addition, Goldman Sachs Agency Lending, the Fund's securities lending agent, has agreed to reimburse the Fund for certain transactional expenses related to securities lending activity. Credit balances or expense reimbursements used to reduce fees, if any, are reported as a reduction of expenses in the Statement of Operations.
Purchases and redemptions of Fund shares
Effective October 8, 2008, the Fund instituted a fee on cash redemptions of 0.93% of the amount redeemed. Effective October 21, 2008, the fee on cash redemptions was changed to 2.00% of the amount redeemed. As of February 28, 2009, the fee on cash redemptions was 2.00% of the amount redeemed. The Fund may impose a new purchase premium and/or redemption fee, or modify or eliminate an existing purchase premium and/or redemption fee, at any time. If the Manager determines that any portion of a cash redemption is offset by a corresponding cash purchase on the same day, the Fund will ordinarily waive or reduce the redemption fee with respect to that portion. In addition, the Fund may waive or reduce the redemption fee in extraordinary circumstances if the purchase or redemption will not cause the Fund to incur transaction costs. All redemption fees are paid to the Fund and recorded by the Fund as paid-in-capital. In-kind redemption t ransactions are generally not subject to redemption fees except when they include a cash component. However, when a substantial portion of a Fund is being redeemed, the Fund may charge a redemption fee based on estimated or known transaction costs resulting from those redemptions.
Investment risks
The Fund is subject to risks involved in investing in foreign securities that are not presented by investments in U.S. securities. These risks may involve adverse political and economic developments, including expropriation and the possible imposition of capital controls or other foreign governmental laws or restrictions. In addition, the securities of some foreign companies and securities markets are less liquid and at times may be more volatile than securities of comparable U.S. companies and U.S. securities markets. The risks described above apply to an even greater extent to investments in emerging markets. The securities markets of emerging countries are generally smaller, less developed, less liquid, and more volatile than the securities markets of the U.S. and developed foreign markets. Additionally, the investment
20
GMO Currency Hedged International Bond Fund
(A Series of GMO Trust)
Notes to Financial Statements — (Continued)
February 28, 2009
risks associated with an investment in the underlying funds may be greater to the extent that the underlying funds engage in derivative transactions.
To manage the Fund's cash collateral needs in extraordinary market conditions, the Manager reserves the right to reduce or eliminate the Fund's derivative exposures, including those that are intended to cause the Fund to track its benchmark more closely. A reduction in those exposures without replacing them with benchmark securities will tend to cause the performance of the Fund to track its benchmark less closely and make the Fund's performance more dependent on the performance of the asset-backed securities it holds directly or indirectly.
To address in part the cash management issues described above, the Fund expects to honor nearly all redemptions of its shares in-kind for the foreseeable future. If redeeming shareholders from the Fund choose to sell assets received in-kind immediately and current adverse market conditions continue, they may experience difficulty selling the assets at favorable prices. To the extent that the Fund honors redemptions in cash, redeeming shareholders will bear the redemption fees described in the Purchases and Redemptions of Fund Shares note.
Recently issued accounting pronouncement
In March 2008, FASB issued Statement of Financial Accounting Standards No. 161, Disclosures about Derivative Instruments and Hedging Activities ("SFAS 161"). SFAS 161 is effective for fiscal years and interim periods beginning after November 15, 2008. SFAS 161 requires enhanced disclosures about the Fund's derivative and hedging activities. The Manager is currently evaluating the impact the adoption of SFAS 161 will have on the Fund's financial statement disclosures.
3. Fees and other transactions with affiliates
GMO receives a management fee for the services it provides to the Fund. That fee is paid monthly at the annual rate of 0.25% of average daily net assets. The Fund has adopted a Shareholder Service Plan under which the Fund pays GMO a shareholder service fee for client and shareholder service, reporting, and other support. Pursuant to the Shareholder Service Plan, the shareholder service fee is calculated based on average daily net assets at the annual rate of 0.15% for Class III shares.
Through at least June 30, 2009, the Manager has contractually agreed to reimburse the Fund for Fund expenses incurred through that date to the extent the Fund's total annual operating expenses (excluding "Excluded Expenses", as defined below) exceed 0.25% of the Fund's average daily net assets. Excluded Expenses include shareholder service fees, expenses indirectly incurred by investment in the underlying funds, fees and expenses of the independent Trustees of the Trust, fees and expenses for legal services not approved by the Manager for the Trust, compensation and expenses of the Trust's Chief Compliance Officer ("CCO") (excluding any employee benefits), brokerage commissions, securities lending fees and expenses, interest expense, transfer taxes, and other investment-related costs (including expenses
21
GMO Currency Hedged International Bond Fund
(A Series of GMO Trust)
Notes to Financial Statements — (Continued)
February 28, 2009
associated with investments in any company that is an investment company or would be an investment company under the 1940 Act, but for the exceptions to the definition of investment company provided in Section 3(c)(1) and 3(c)(7) of the 1940 Act), hedging transaction fees, extraordinary, non-recurring and certain other unusual expenses (including taxes) (collectively, "Excluded Fund Fees and Expenses"). In addition, the Manager has contractually agreed to reimburse the Fund through at least June 30, 2009 to the extent that the sum of (a) the Fund's total annual operating expenses (excluding Excluded Fund Fees and Expenses) and (b) the amount of fees and expenses incurred indirectly by the Fund through its investment in ECDF (excluding ECDF's Excluded Fund Fees and Expenses), exceeds 0.25% of the Fund's average daily net assets, subject to a maximum total reimbursement to the Fund equal to 0.25% of the Fund's average daily net as sets.
The Fund incurs fees and expenses indirectly as a shareholder in the underlying funds. For the year ended February 28, 2009, these indirect fees and expenses expressed as an annualized percentage of the Fund's average daily net assets were as follows:
| Indirect Net Expenses (excluding shareholder service fees and interest expense) | Indirect Shareholder Service Fees | Indirect Interest Expense | Total Indirect Expenses | ||||||||||||
| 0.017 | % | 0.004 | % | 0.007 | % | 0.028 | % | ||||||||
The Fund's portion of the fees paid by the Trust to the Trust's independent Trustees and CCO during the year ended February 28, 2009 was $3,441 and $938, respectively. The compensation and expenses of the CCO are included in miscellaneous expenses in the Statement of Operations. The Fund paid no remuneration to any other officer of the Trust.
4. Purchases and sales of securities
For the year ended February 28, 2009, cost of purchases and proceeds from sales of investments, other than short-term obligations, were as follows:
| Purchases | Sales | ||||||||||
| U.S. Government securities | $ | 3,994,826 | $ | — | |||||||
| Investments (non-U.S. Government securities) | 32,259,045 | 45,143,923 | |||||||||
22
GMO Currency Hedged International Bond Fund
(A Series of GMO Trust)
Notes to Financial Statements — (Continued)
February 28, 2009
5. Guarantees
In the normal course of business the Fund enters into contracts with third-party service providers that contain a variety of representations and warranties and that provide general indemnifications. The Fund's maximum exposure under these arrangements is unknown, as it involves future claims that may be made against the Fund that have not yet occurred. Based on experience, management is of the view that the risk of loss in connection with its indemnification obligations is remote; however, there can be no assurance that such obligations will not result in material liabilities that adversely affect the Fund.
6. Principal shareholders and related parties
As of February 28, 2009, 99.23% of the outstanding shares of the Fund were held by three shareholders, each holding more than 10% of the Fund's outstanding shares. On that date, no other shareholder owned more than 10% of the outstanding shares of the Fund. Redemptions from (or investments into) the Fund by or on behalf of these large shareholders may have a material effect on the Fund.
As of February 28, 2009, 0.01% of the Fund's shares were held by senior management of the Manager and GMO Trust officers and 86.84% of the Fund's shares were held by accounts for which the Manager had investment discretion.
7. Share transactions
The Declaration of Trust permits the Trust to issue an unlimited number of shares of beneficial interest (without par value). Transactions in Fund shares were as follows:
| Year Ended February 28, 2009 | Year Ended February 29, 2008 | ||||||||||||||||||
| Class III: | Shares | Amount | Shares | Amount | |||||||||||||||
| Shares sold | 1,419 | $ | 10,498 | 5,140,961 | $ | 46,315,270 | |||||||||||||
| Shares issued to shareholders in reinvestment of distributions | 1,349,847 | 9,367,939 | 335,743 | 2,900,816 | |||||||||||||||
| Shares repurchased | (940,742 | ) | (7,966,865 | ) | (17,538,414 | ) | (157,285,071 | ) | |||||||||||
| Redemption fees | — | 29,275 | — | — | |||||||||||||||
| Net increase (decrease) | 410,524 | $ | 1,440,847 | (12,061,710 | ) | $ | (108,068,985 | ) | |||||||||||
23
GMO Currency Hedged International Bond Fund
(A Series of GMO Trust)
Notes to Financial Statements — (Continued)
February 28, 2009
8. Investments in affiliated issuers
A summary of the Fund's transactions in the shares of other funds of the Trust during the year ended February 28, 2009 is set forth below:
| Affiliate | Value, beginning of period | Purchases | Sales Proceeds | Dividend Income | Distributions of Realized Gains | Value, end of period | |||||||||||||||||||||
| GMO Emerging Country Debt Fund, Class III | $ | 4,677,363 | $ | 464,774 | $ | — | $ | 365,973 | $ | 98,802 | $ | 3,145,736 | |||||||||||||||
| GMO Short-Duration Collateral Fund | 114,475,125 | 29,284,160 | 39,100,000 | 4,650,311 | u | — | 74,083,286 | ||||||||||||||||||||
| GMO Special Purpose Holding Fund | 6,924 | — | — | — | 12,445 | 4,012 | |||||||||||||||||||||
| GMO World Opportunity Overlay Fund | 31,276,870 | 2,000,000 | 4,900,000 | — | — | 20,324,202 | |||||||||||||||||||||
| Totals | $ | 150,436,282 | $ | 31,748,934 | $ | 44,000,000 | $ | 5,016,284 | $ | 111,247 | $ | 97,557,236 | |||||||||||||||
u The Fund received total distributions in the amount of $14,256,780, of which $9,606,469 was a return of capital.
24
Report of Independent Registered Public Accounting Firm
To the Trustees of GMO Trust and the Shareholders of
GMO Currency Hedged International Bond Fund:
In our opinion, the accompanying statement of assets and liabilities, including the schedule of investments, and the related statements of operations and of changes in net assets and the financial highlights present fairly, in all material respects, the financial position of GMO Currency Hedged International Bond Fund (the "Fund") at February 28, 2009, the results of its operations for the year then ended, the changes in its net assets for each of the two years in the period then ended and the financial highlights for each of the five years in the period then ended, in conformity with accounting principles generally accepted in the United States of America. These financial statements and financial highlights (hereafter referred to as "financial statements") are the responsibility of the Fund's management. Our responsibility is to express an opinion on these financial statements based on our audits. We conducted our audits of the se financial statements in accordance with the standards of the Public Company Accounting Oversight Board (United States). Those standards require that we plan and perform the audit to obtain reasonable assurance about whether the financial statements are free of material misstatement. An audit includes examining, on a test basis, evidence supporting the amounts and disclosures in the financial statements, assessing the accounting principles used and significant estimates made by management, and evaluating the overall financial statement presentation. We believe that our audits, which included confirmation of securities at February 28, 2009 by correspondence with the custodian and brokers, provide a reasonable basis for our opinion.
PricewaterhouseCoopers LLP
Boston, Massachusetts
April 29, 2009
25
GMO Currency Hedged International Bond Fund
(A Series of GMO Trust)
Fund Expenses
February 28, 2009 (Unaudited)
Expense Examples: The following information is in relation to expenses for the six month period ended February 28, 2009.
As a shareholder of the Fund, you may incur two types of costs: (1) transaction costs, including redemption fees; and (2) ongoing costs, including management fees, shareholder service fees, and other Fund expenses. This example is intended to help you understand your ongoing costs (in dollars) of investing in the Fund and to compare these costs with the ongoing costs of investing in other mutual funds.
These examples are based on an investment of $1,000 invested at the beginning of the period and held for the entire period, September 1, 2008 through February 28, 2009.
Actual Expenses
The first line of the table below provides information about actual account values and actual expenses. You may use the information in this line, together with the amount you invested, to estimate the expenses that you paid over the period. Simply divide your account value by $1,000 (for example, a $10,000,000 account value divided by $1,000 = 10,000), then multiply the result by the number in the first line under the heading entitled "Net Expense Incurred" to estimate the expenses you paid on your account during this period.
Hypothetical Example for Comparison Purposes
The second line of the table below provides information about hypothetical account values and hypothetical expenses based on the Fund's actual expense ratio and an assumed rate of return of 5% per year before expenses, which is not the Fund's actual return. The hypothetical account values and expenses may not be used to estimate the actual ending account balance or expenses you paid for the period. You may use this information to compare the ongoing costs of investing in the Fund with other funds. To do so, compare this 5% hypothetical example with the 5% hypothetical examples that appear in the shareholder reports of other funds.
Please note that the expenses shown in the table are meant to highlight your ongoing costs only and do not reflect any transactional costs. Therefore, the second line of the table is useful in comparing ongoing costs only, and will not help you determine the relative total costs of owning different funds. In addition, if these transactional costs were included, your costs would have been higher.
| Annualized Net Expense Ratio | Beginning Account Value | Ending Account Value | Net Expense Incurred* | ||||||||||||||||
| Class III | |||||||||||||||||||
| 1) Actual | 0.42 | % | $ | 1,000.00 | $ | 884.90 | $ | 1.96 | |||||||||||
| 2) Hypothetical | 0.42 | % | $ | 1,000.00 | $ | 1,022.71 | $ | 2.11 | |||||||||||
* Expenses are calculated using the Class's annualized expense ratio (including indirect expenses incurred) for the six months ended February 28, 2009, multiplied by the average account value over the period, multiplied by 181 days in the period, divided by 365 days in the year.
26
GMO Currency Hedged International Bond Fund
(A Series of GMO Trust)
Tax Information for the Tax Year Ended February 28, 2009 (Unaudited)
The Fund will notify shareholders of amounts for use in preparing 2009 income tax forms in early 2010.
The Fund hereby designates as qualified interest income with respect to its taxable year ended February 28, 2009, $1,906,829 or if determined to be different, the qualified interest income of such year.
27
Trustees and Officers (Unaudited)
The following tables list the Trust's Trustees and Officers as of the date of this report; their address and date of birth ("DOB"); their position with the Trust; the length of time holding that position with the Trust; their principal occupation(s) during the past five years; the number of portfolios in the fund complex they oversee; and other directorships they hold in companies subject to registration or reporting requirements of the Securities Exchange Act of 1934 (generally called "public companies") or in registered investment companies. The Trust's Statement of Additional Information ("SAI") includes additional information about the Trust's trustees, including changes subsequent to the date of the report. The SAI is available, without charge, upon request by writing GMO, c/o GMO Trust, 40 Rowes Wharf, Boston, MA 02110.
Independent Trustees:
| Name, Address, and DOB | Position(s) Held with Trust | Term of Office1 and Length of Time Served | Principal Occupation(s) During Past Five Years | Number of Portfolios in Fund Complex Overseen by Trustee | Other Directorships Held by Trustee | ||||||||||||||||||
| Donald W. Glazer, Esq. c/o GMO Trust 40 Rowes Wharf Boston, MA 02110 DOB: 07/26/1944 | Chairman of the Board of Trustees | Chairman of the Board of Trustees since March 2005; Lead Independent Trustee (September 2004 – March 2005); Trustee since December 2000. | Consultant – Law and Business2; Author of Legal Treatises. | 59 | None. | ||||||||||||||||||
1 Each Trustee is elected to serve during the continued lifetime of the Trust until he/she dies, resigns or is removed, or if sooner, until the next meeting of Shareholders called for the purpose of electing Trustees and until the election and qualification of his/her successor.
2 As part of Mr. Glazer's work as a consultant, he provides part-time consulting services to Goodwin Procter LLP ("Goodwin"). Goodwin has provided legal services to Renewable Resources, LLC, an affiliate of GMO; GMO, in connection with its relationship with Renewable Resources; and funds managed by Renewable Resources. Mr. Glazer has represented that he has no financial interest in, and is not involved in the provision of, such legal services. In the calendar years ended December 31, 2007 and December 31, 2008, these entities paid $789,416 and $183,864 respectively, in legal fees and disbursements to Goodwin. In correspondence with the Staff of the Securities and Exchange Commission beginning in August 2006, the Independent Trustees' legal counsel provided the Staff with information regarding Mr. Glazer's relationship with Goodwin and h is other business activities. On September 11, 2007, based on information that had been given to the Staff as of that date, the Staff provided oral no-action assurance consistent with the opinion of the Independent Trustees' legal counsel that Mr. Glazer is not an "interested person" of the Trust.
28
Independent Trustees — (Continued)
| Name, Address, and DOB | Position(s) Held with Trust | Term of Office1 and Length of Time Served | Principal Occupation(s) During Past Five Years | Number of Portfolios in Fund Complex Overseen by Trustee | Other Directorships Held by Trustee | ||||||||||||||||||
| W. Nicholas Thorndike c/o GMO Trust 40 Rowes Wharf Boston, MA 02110 DOB: 03/28/1933 | Trustee | Since March 2005 | Director or trustee of various corporations and charitable organizations, including Courier Corporation (a book publisher and manufacturer) (July 1989 – present); Putnam Funds (December 1992 – June 2004); and Providence Journal (a newspaper publisher) (December 1986 – December 2003). | 59 | Director of Courier Corporation (a book publisher and manufacturer); Member of the Investment Committee of Partners HealthCare System, Inc.3 | ||||||||||||||||||
| Peter Tufano c/o GMO Trust 40 Rowes Wharf Boston, MA 02110 DOB: 04/22/1957 | Trustee | Since December 2008. | Sylvan C. Coleman Professor of Financial Management, Harvard Business School (since 1989). | 59 | Trustee of State Street Navigator Securities Lending Trust (3 Portfolios). | ||||||||||||||||||
1 Each Trustee is elected to serve during the continued lifetime of the Trust until he/she dies, resigns or is removed, or if sooner, until the next meeting of Shareholders called for the purpose of electing Trustees and until the election and qualification of his/her successor.
3 Partners HealthCare System, Inc. is a client of the Manager.
29
Principal Officers:
| Name, Address, and DOB | Position(s) Held with Trust | Term of Office4 and Length of Time Served | Principal Occupation(s) During Past Five Years5 | ||||||||||||
| J.B. Kittredge DOB: 08/22/1954 | President and Chief Executive Officer | Since March 2009. | General Counsel, Grantham, Mayo, Van Otterloo & Co. LLC (October 2005 – Present); Partner, Ropes & Gray LLP. | ||||||||||||
| Sheppard N. Burnett c/o GMO Trust 40 Rowes Wharf Boston, MA 02110 DOB: 10/24/1968 | Treasurer and Chief Financial Officer | Chief Financial Officer since March 2007; Treasurer since November 2006; Assistant Treasurer, September 2004 – November 2006. | Fund Administration Staff, Grantham, Mayo, Van Otterloo & Co. LLC (June 2004 – present); Vice President, Director of Tax, Columbia Management Group (2002 – 2004). | ||||||||||||
| Brent C. Arvidson c/o GMO Trust 40 Rowes Wharf Boston, MA 02110 DOB: 06/26/1969 | Assistant Treasurer | Since August 1998. | Senior Fund Administrator, Grantham, Mayo, Van Otterloo & Co. LLC. | ||||||||||||
| John L. Nasrah c/o GMO Trust 40 Rowes Wharf Boston, MA 02110 DOB: 05/27/1977 | Assistant Treasurer | Since March 2007. | Fund Administrator, Grantham, Mayo, Van Otterloo & Co. LLC (September 2004 – present); Tax Analyst, Bain & Company, Inc. (June 2003 – September 2004). | ||||||||||||
| Mahmoodur Rahman c/o GMO Trust 40 Rowes Wharf Boston, MA 02110 DOB: 11/30/1967 | Assistant Treasurer | Since September 2007. | Fund Administrator, Grantham, Mayo, Van Otterloo & Co. LLC (April 2007 – present); Vice President and Senior Tax Manager, Massachusetts Financial Services Company (January 2000 – April 2007). | ||||||||||||
| Michael E. Gillespie c/o GMO Trust 40 Rowes Wharf Boston, MA 02110 DOB: 02/18/1958 | Chief Compliance Officer | Since March 2005. | Vice President of Compliance (June 2004 – February 2005) and Director of Domestic Compliance (March 2002 – June 2004), Fidelity Investments. | ||||||||||||
4 Each officer is elected to hold such office until his or her successor is duly elected and qualified to carry out the duties and responsibilities of the office, or until he or she resigns or is removed from office.
5 Each of Messrs. Burnett, Arvidson, Bohan, and Pottle serves as an officer and/or director of certain pooled investment vehicles of which GMO or an affiliate of GMO serves as the investment adviser.
30
Principal Officers — (Continued)
| Name, Address, and DOB | Position(s) Held with Trust | Term of Office4 and Length of Time Served | Principal Occupation(s) During Past Five Years5 | ||||||||||||
| Jason B. Harrison c/o GMO Trust 40 Rowes Wharf Boston, MA 02110 DOB: 01/29/1977 | Vice President and Clerk | Vice President since November 2006; Clerk since March 2006. | Legal Counsel, Grantham, Mayo, Van Otterloo & Co. LLC (since February 2006) and Attorney, Ropes & Gray LLP (September 2002 – February 2006). | ||||||||||||
| David L. Bohan c/o GMO Trust 40 Rowes Wharf Boston, MA 02110 DOB: 06/21/1964 | Vice President and Assistant Clerk | Vice President since March 2005; Assistant Clerk since March 2006. | Legal Counsel, Grantham, Mayo, Van Otterloo & Co. LLC. | ||||||||||||
| Gregory L. Pottle c/o GMO Trust 40 Rowes Wharf Boston, MA 02110 DOB: 07/09/1971 | Vice President and Assistant Clerk | Since November 2006. | Legal Counsel, Grantham, Mayo, Van Otterloo & Co. LLC. | ||||||||||||
| Anne K. Trinque c/o GMO Trust 40 Rowes Wharf Boston, MA 02110 DOB: 04/15/1978 | Vice President and Assistant Clerk | Since September 2007. | Legal Counsel, Grantham, Mayo, Van Otterloo & Co. LLC (January 2007 – present); Attorney, Goodwin Procter LLP (September 2003 – January 2007). | ||||||||||||
| Cheryl Wakeham c/o GMO Trust 40 Rowes Wharf Boston, MA 02110 DOB: 10/29/1958 | Vice President and Anti-Money Laundering Officer | Since December 2004. | Manager, Client Service Administration, Grantham, Mayo, Van Otterloo & Co. LLC. | ||||||||||||
4 Each officer is elected to hold such office until his or her successor is duly elected and qualified to carry out the duties and responsibilities of the office, or until he or she resigns or is removed from office.
5 Each of Messrs. Burnett, Arvidson, Bohan, and Pottle serves as an officer and/or director of certain pooled investment vehicles of which GMO or an affiliate of GMO serves as the investment adviser.
31
GMO U.S. Quality Equity Fund
(A Series of GMO Trust)
Annual Report
February 28, 2009
For a free copy of the Fund's proxy voting guidelines, shareholders may call 1-617-346-7646 (collect) or visit the Securities and Exchange Commission's website at www.sec.gov. Information regarding how the Fund voted proxies relating to portfolio securities during the most recent 12-month period ended June 30 is available on GMO's website at www.gmo.com, or on the Securities and Exchange Commission's website at www.sec.gov.
The Fund files its complete schedule of portfolio holdings with the Securities and Exchange Commission for the first and third quarter of each fiscal year on Form N-Q, which is available on the Commission's website at www.sec.gov. The Fund's Form N-Q may be reviewed and copied at the Commission's Public Reference Room in Washington, D.C. Information on the operation of the Public Reference Room may be obtained by calling 1-800-SEC-0330. The Fund has a policy with respect to disclosure of portfolio holdings under which it may also make available on GMO's website at www.gmo.com a complete schedule of portfolio holdings.
This report is prepared for the general information of shareholders. It is authorized for distribution to prospective investors only when preceded or accompanied by a prospectus for the GMO Trust, which contains a complete discussion of the risks associated with an investment in this Fund and other important information. The GMO Trust prospectus can be obtained at www.gmo.com.
GMO U.S. Quality Equity Fund
(A Series of GMO Trust)
Portfolio Management
Day-to-day management of the Fund's portfolio is the responsibility of the Quantitative Equity team at Grantham, Mayo, Van Otterloo & Co. LLC.
Management Discussion and Analysis of Fund Performance
The Class III shares of the GMO U.S. Quality Equity Fund returned -29.4% for the fiscal year ended February 28, 2009, as compared to -43.3% for the S&P 500 Index. Consistent with the Fund's investment objectives and policies, the Fund was invested primarily in U.S. equity securities throughout the period.
Stock selection added to returns relative to the S&P 500 Index. Selections within Energy, Information Technology, and Consumer Discretionary added to relative returns while stock selections within Health Care and Telecommunication Services detracted. Overweight positions in Wal-Mart Stores and Johnson & Johnson and not owning GE added to relative returns. An overweight in UnitedHealth Group, an underweight in ConocoPhillips, and not owning Apple detracted from returns versus the benchmark.
Sector selection added to returns relative to the S&P 500 Index. Sector weightings positively impacting relative performance included not owning Financials and overweight positions in Consumer Staples and Health Care. Sector weightings negatively impacting relative performance included not owning Utilities and underweight positions in Consumer Discretionary and Telecommunication Services.
The views expressed herein are exclusively those of Grantham, Mayo, Van Otterloo & Co. LLC Management as of the date of this report and are subject to change. GMO disclaims any responsibility to update such views. They are not meant as investment advice. References to specific securities are not recommendations of such securities and may not be representative of any GMO portfolio's current or future investments.
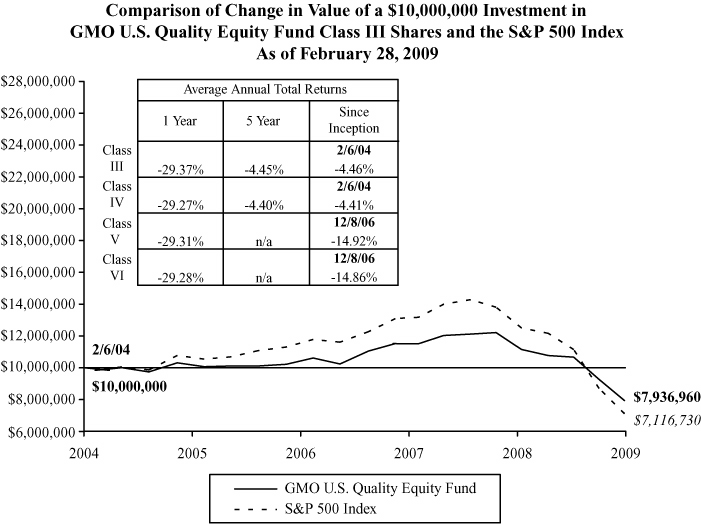
Performance data quoted represents past performance and is not indicative of future results. The investment return and principal value of an investment will fluctuate so that an investor's shares, when redeemed, may be worth more or less than their original cost. Current performance data, may be lower or higher than the performance data provided herein. To obtain performance information to the most recent month-end, visit www.gmo.com. Performance shown is net of all fees after reimbursement from the Manager. Returns would have been lower had certain expenses not been reimbursed during the periods shown and do not include the effect of taxes on distributions and redemptions. All information is unaudited. Performance for Classes IV, V and VI will vary due to different fees.
GMO U.S. Quality Equity Fund
(A Series of GMO Trust)
Investments Concentration Summary
February 28, 2009 (Unaudited)
| Asset Class Summary | % of Total Net Assets | ||||||
| Common Stocks | 93.9 | % | |||||
| Short-Term Investments | 4.1 | ||||||
| Futures | (0.1 | ) | |||||
| Other | 2.1 | ||||||
| 100.0 | % | ||||||
| Industry Sector Summary | % of Equity Investments | ||||||
| Consumer Staples | 28.2 | % | |||||
| Health Care | 26.9 | ||||||
| Information Technology | 23.1 | ||||||
| Energy | 13.3 | ||||||
| Telecommunication Services | 4.0 | ||||||
| Industrials | 2.7 | ||||||
| Consumer Discretionary | 1.8 | ||||||
| 100.0 | % | ||||||
1
GMO U.S. Quality Equity Fund
(A Series of GMO Trust)
Schedule of Investments
(showing percentage of total net assets)
February 28, 2009
| Shares | Description | Value ($) | |||||||||||||
| COMMON STOCKS — 93.9% | |||||||||||||||
| Consumer Discretionary — 1.7% | |||||||||||||||
| 2,680,600 | Home Depot, Inc. | 55,997,734 | |||||||||||||
| 1,463,000 | Lowe's Cos., Inc. | 23,173,920 | |||||||||||||
| 1,087,200 | McDonald's Corp. | 56,806,200 | |||||||||||||
| 394,400 | Target Corp. | 11,165,464 | |||||||||||||
| Total Consumer Discretionary | 147,143,318 | ||||||||||||||
| Consumer Staples — 26.5% | |||||||||||||||
| 1,316,800 | Avon Products, Inc. | 23,162,512 | |||||||||||||
| 441,400 | Campbell Soup Co. | 11,816,278 | |||||||||||||
| 394,500 | Clorox Co. | 19,172,700 | |||||||||||||
| 11,215,500 | Coca-Cola Co. (The) | 458,153,175 | |||||||||||||
| 1,945,500 | Colgate-Palmolive Co. | 117,080,190 | |||||||||||||
| 470,100 | Estee Lauder Cos. (The), Inc.-Class A | 10,647,765 | |||||||||||||
| 730,100 | General Mills, Inc. | 38,315,648 | |||||||||||||
| 367,800 | Hershey Co. (The) | 12,391,182 | |||||||||||||
| 358,700 | HJ Heinz Co. | 11,718,729 | |||||||||||||
| 901,400 | Kellogg Co. | 35,082,488 | |||||||||||||
| 1,229,500 | Kimberly-Clark Corp. | 57,921,745 | |||||||||||||
| 1,194,900 | Kraft Foods, Inc.-Class A | 27,219,822 | |||||||||||||
| 7,784,100 | PepsiCo, Inc. | 374,726,574 | |||||||||||||
| 9,113,700 | Procter & Gamble Co. (The) | 439,006,929 | |||||||||||||
| 12,164,300 | Wal-Mart Stores, Inc. | 598,970,132 | |||||||||||||
| 2,225,200 | Walgreen Co. | 53,093,272 | |||||||||||||
| Total Consumer Staples | 2,288,479,141 | ||||||||||||||
| Energy — 12.5% | |||||||||||||||
| 7,234,500 | Chevron Corp. | 439,206,495 | |||||||||||||
| 3,306,600 | ConocoPhillips | 123,501,510 | |||||||||||||
| 7,599,500 | Exxon Mobil Corp. | 516,006,050 | |||||||||||||
| Total Energy | 1,078,714,055 | ||||||||||||||
See accompanying notes to the financial statements.
2
GMO U.S. Quality Equity Fund
(A Series of GMO Trust)
Schedule of Investments — (Continued)
(showing percentage of total net assets)
February 28, 2009
| Shares | Description | Value ($) | |||||||||||||
| Health Care — 25.3% | |||||||||||||||
| 5,485,305 | Abbott Laboratories | 259,674,339 | |||||||||||||
| 3,584,860 | Amgen, Inc.* | 175,407,200 | |||||||||||||
| 1,325,400 | Bristol-Myers Squibb Co. | 24,400,614 | |||||||||||||
| 3,967,473 | Eli Lilly & Co. | 116,564,357 | |||||||||||||
| 139,700 | Forest Laboratories, Inc.* | 2,995,168 | |||||||||||||
| 9,942,900 | Johnson & Johnson | 497,145,000 | |||||||||||||
| 4,534,030 | Medtronic, Inc. | 134,161,948 | |||||||||||||
| 6,589,600 | Merck & Co., Inc. | 159,468,320 | |||||||||||||
| 39,141,100 | Pfizer, Inc. | 481,826,941 | |||||||||||||
| 6,735,494 | UnitedHealth Group, Inc. | 132,352,457 | |||||||||||||
| 234,500 | WellPoint, Inc.* | 7,954,240 | |||||||||||||
| 4,119,720 | Wyeth | 168,166,970 | |||||||||||||
| 799,700 | Zimmer Holdings, Inc.* | 28,005,494 | |||||||||||||
| Total Health Care | 2,188,123,048 | ||||||||||||||
| Industrials — 2.5% | |||||||||||||||
| 2,312,400 | 3M Co. | 105,121,704 | |||||||||||||
| 3,500 | Danaher Corp. | 177,660 | |||||||||||||
| 1,304,400 | United Parcel Service, Inc.-Class B | 53,715,192 | |||||||||||||
| 1,483,900 | United Technologies Corp. | 60,587,637 | |||||||||||||
| Total Industrials | 219,602,193 | ||||||||||||||
| Information Technology — 21.7% | |||||||||||||||
| 21,976,800 | Cisco Systems, Inc.* | 320,201,976 | |||||||||||||
| 2,084,800 | Dell, Inc.* | 17,783,344 | |||||||||||||
| 2,731,373 | eBay, Inc.* | 29,690,024 | |||||||||||||
| 302,840 | Google, Inc.-Class A* | 102,356,892 | |||||||||||||
| 776,500 | Hewlett-Packard Co. | 22,541,795 | |||||||||||||
| 2,808,030 | International Business Machines Corp. | 258,423,001 | |||||||||||||
| 32,687,100 | Microsoft Corp. | 527,896,665 | |||||||||||||
| 26,696,100 | Oracle Corp.* | 414,857,394 | |||||||||||||
| 5,594,800 | Qualcomm, Inc. | 187,034,164 | |||||||||||||
| Total Information Technology | 1,880,785,255 | ||||||||||||||
See accompanying notes to the financial statements.
3
GMO U.S. Quality Equity Fund
(A Series of GMO Trust)
Schedule of Investments — (Continued)
(showing percentage of total net assets)
February 28, 2009
| Shares / Par Value ($) | Description | Value ($) | |||||||||||||
| Telecommunication Services — 3.7% | |||||||||||||||
| 6,974,395 | AT&T, Inc. | 165,781,369 | |||||||||||||
| 5,522,300 | Verizon Communications, Inc. | 157,551,219 | |||||||||||||
| Total Telecommunication Services | 323,332,588 | ||||||||||||||
| TOTAL COMMON STOCKS (COST $10,899,165,346) | 8,126,179,598 | ||||||||||||||
| SHORT-TERM INVESTMENTS — 4.1% | |||||||||||||||
| Money Market Funds — 0.6% | |||||||||||||||
| 53,741,616 | State Street Institutional Treasury Money Market Fund-Institutional Class | 53,741,616 | |||||||||||||
| Other Short-Term Investments — 3.5% | |||||||||||||||
| 300,000,000 | U.S. Treasury Bill, 0.35%, due 07/23/09 (a) | 299,580,600 | |||||||||||||
| TOTAL SHORT-TERM INVESTMENTS (COST $353,429,616) | 353,322,216 | ||||||||||||||
| TOTAL INVESTMENTS — 98.0% (Cost $11,252,594,962) | 8,479,501,814 | ||||||||||||||
| Other Assets and Liabilities (net) — 2.0% | 171,978,286 | ||||||||||||||
| TOTAL NET ASSETS — 100.0% | $ | 8,651,480,100 | |||||||||||||
See accompanying notes to the financial statements.
4
GMO U.S. Quality Equity Fund
(A Series of GMO Trust)
Schedule of Investments — (Continued)
February 28, 2009
A summary of outstanding financial instruments at February 28, 2009 is as follows:
Futures Contracts
| Number of Contracts | Type | Expiration Date | Contract Value | Net Unrealized Appreciation (Depreciation) | |||||||||||||||
| Buys | |||||||||||||||||||
| 4,640 | S&P 500 E-Mini Index | March 2009 | $ | 170,334,400 | $ | (4,944,495 | ) | ||||||||||||
As of February 28, 2009, for the futures contracts held, the Fund had sufficient cash and/or securities to cover any commitments or margin requirements of the relevant broker or exchange.
Notes to Schedule of Investments:
* Non-income producing security.
(a) Rate shown represents yield-to-maturity.
See accompanying notes to the financial statements.
5
GMO U.S. Quality Equity Fund
(A Series of GMO Trust)
Statement of Assets and Liabilities — February 28, 2009
| Assets: | |||||||
| Investments, at value (cost $11,252,594,962) (Note 2) | $ | 8,479,501,814 | |||||
| Cash | 61,927,444 | ||||||
| Receivable for Fund shares sold | 65,712,301 | ||||||
| Dividends and interest receivable | 38,303,690 | ||||||
| Receivable for collateral on open futures contracts (Note 2) | 11,880,000 | ||||||
| Receivable for expenses reimbursed by Manager (Note 3) | 147,533 | ||||||
| Total assets | 8,657,472,782 | ||||||
| Liabilities: | |||||||
| Payable for Fund shares repurchased | 240,966 | ||||||
| Payable to affiliate for (Note 3): | |||||||
| Management fee | 2,344,528 | ||||||
| Shareholder service fee | 562,174 | ||||||
| Trustees and Chief Compliance Officer of GMO Trust fees | 30,372 | ||||||
| Payable for variation margin on open futures contracts (Note 2) | 2,191,848 | ||||||
| Accrued expenses | 622,794 | ||||||
| Total liabilities | 5,992,682 | ||||||
| Net assets | $ | 8,651,480,100 | |||||
See accompanying notes to the financial statements.
6
GMO U.S. Quality Equity Fund
(A Series of GMO Trust)
Statement of Assets and Liabilities — February 28, 2009 — (Continued)
| Net assets consist of: | |||||||
| Paid-in capital | $ | 12,207,050,675 | |||||
| Accumulated undistributed net investment income | 45,038,026 | ||||||
| Distributions in excess of net realized gain | (822,570,958 | ) | |||||
| Net unrealized depreciation | (2,778,037,643 | ) | |||||
| $ | 8,651,480,100 | ||||||
| Net assets attributable to: | |||||||
| Class III shares | $ | 1,952,578,578 | |||||
| Class IV shares | $ | 787,276,448 | |||||
| Class V shares | $ | 637,833,956 | |||||
| Class VI shares | $ | 5,273,791,118 | |||||
| Shares outstanding: | |||||||
| Class III | 137,748,815 | ||||||
| Class IV | 55,499,435 | ||||||
| Class V | 44,998,900 | ||||||
| Class VI | 372,002,289 | ||||||
| Net asset value per share: | |||||||
| Class III | $ | 14.17 | |||||
| Class IV | $ | 14.19 | |||||
| Class V | $ | 14.17 | |||||
| Class VI | $ | 14.18 | |||||
See accompanying notes to the financial statements.
7
GMO U.S. Quality Equity Fund
(A Series of GMO Trust)
Statement of Operations — Year Ended February 28, 2009
| Investment Income: | |||||||
| Dividends | $ | 224,637,613 | |||||
| Interest | 4,666,194 | ||||||
| Total investment income | 229,303,807 | ||||||
| Expenses: | |||||||
| Management fee (Note 3) | 29,784,343 | ||||||
| Shareholder service fee - Class III (Note 3) | 2,851,187 | ||||||
| Shareholder service fee - Class IV (Note 3) | 437,421 | ||||||
| Shareholder service fee - Class V (Note 3) | 572,187 | ||||||
| Shareholder service fee - Class VI (Note 3) | 3,319,259 | ||||||
| Custodian, fund accounting agent and transfer agent fees | 1,037,874 | ||||||
| Audit and tax fees | 56,105 | ||||||
| Legal fees | 245,654 | ||||||
| Trustees fees and related expenses (Note 3) | 139,744 | ||||||
| Registration fees | 107,458 | ||||||
| Miscellaneous | 108,565 | ||||||
| Total expenses | 38,659,797 | ||||||
| Fees and expenses reimbursed by Manager (Note 3) | (1,475,298 | ) | |||||
| Expense reductions (Note 2) | (14,352 | ) | |||||
| Net expenses | 37,170,147 | ||||||
| Net investment income (loss) | 192,133,660 | ||||||
| Realized and unrealized gain (loss): | |||||||
| Net realized gain (loss) on: | |||||||
| Investments | (809,480,574 | ) | |||||
| Closed futures contracts | 8,384,943 | ||||||
| Net realized gain (loss) | (801,095,631 | ) | |||||
| Change in net unrealized appreciation (depreciation) on: | |||||||
| Investments | (2,480,683,386 | ) | |||||
| Open futures contracts | (3,178,430 | ) | |||||
| Net unrealized gain (loss) | (2,483,861,816 | ) | |||||
| Net realized and unrealized gain (loss) | (3,284,957,447 | ) | |||||
| Net increase (decrease) in net assets resulting from operations | $ | (3,092,823,787 | ) | ||||
See accompanying notes to the financial statements.
8
GMO U.S. Quality Equity Fund
(A Series of GMO Trust)
Statement of Changes in Net Assets
| Year Ended February 28, 2009 | Year Ended February 29, 2008 | ||||||||||
| Increase (decrease) in net assets: | |||||||||||
| Operations: | |||||||||||
| Net investment income (loss) | $ | 192,133,660 | $ | 121,864,661 | |||||||
| Net realized gain (loss) | (801,095,631 | ) | 186,050,940 | ||||||||
| Change in net unrealized appreciation (depreciation) | (2,483,861,816 | ) | (588,383,993 | ) | |||||||
| Net increase (decrease) in net assets from operations | (3,092,823,787 | ) | (280,468,392 | ) | |||||||
| Distributions to shareholders from: | |||||||||||
| Net investment income | |||||||||||
| Class III | (34,569,204 | ) | (31,023,169 | ) | |||||||
| Class IV | (7,116,929 | ) | (11,111,773 | ) | |||||||
| Class V | (12,924,490 | ) | (7,018,463 | ) | |||||||
| Class VI | (118,045,144 | ) | (60,979,925 | ) | |||||||
| Total distributions from net investment income | (172,655,767 | ) | (110,133,330 | ) | |||||||
| Net realized gains | |||||||||||
| Class III | (11,560,804 | ) | (50,769,370 | ) | |||||||
| Class IV | (2,647,196 | ) | (13,927,910 | ) | |||||||
| Class V | (3,886,453 | ) | (12,819,629 | ) | |||||||
| Class VI | (33,978,058 | ) | (101,916,040 | ) | |||||||
| Total distributions from net realized gains | (52,072,511 | ) | (179,432,949 | ) | |||||||
| (224,728,278 | ) | (289,566,279 | ) | ||||||||
| Net share transactions (Note 7): | |||||||||||
| Class III | 635,314,415 | 572,435,769 | |||||||||
| Class IV | 511,082,914 | (356,639,901 | ) | ||||||||
| Class V | 200,968,133 | 450,705,666 | |||||||||
| Class VI | 2,284,883,800 | 3,017,011,171 | |||||||||
| Increase (decrease) in net assets resulting from net share transactions | 3,632,249,262 | 3,683,512,705 | |||||||||
| Total increase (decrease) in net assets | 314,697,197 | 3,113,478,034 | |||||||||
| Net assets: | |||||||||||
| Beginning of period | 8,336,782,903 | 5,223,304,869 | |||||||||
| End of period (including accumulated undistributed net investment income of $45,038,026 and $25,580,711, respectively) | $ | 8,651,480,100 | $ | 8,336,782,903 | |||||||
See accompanying notes to the financial statements.
9
GMO U.S. Quality Equity Fund
(A Series of GMO Trust)
Financial Highlights
(For a Class III share outstanding throughout each period)
| Year Ended February 28/29, | |||||||||||||||||||||||
| 2009 | 2008 | 2007 | 2006 | 2005 | |||||||||||||||||||
| Net asset value, beginning of period | $ | 20.56 | $ | 21.78 | $ | 20.81 | $ | 20.03 | $ | 19.93 | |||||||||||||
| Income (loss) from investment operations: | |||||||||||||||||||||||
| Net investment income (loss)† | 0.37 | 0.39 | 0.35 | 0.32 | 0.39 | ||||||||||||||||||
| Net realized and unrealized gain (loss) | (6.30 | ) | (0.70 | ) | 1.12 | 0.72 | (0.05 | ) | |||||||||||||||
| Total from investment operations | (5.93 | ) | (0.31 | ) | 1.47 | 1.04 | 0.34 | ||||||||||||||||
| Less distributions to shareholders: | |||||||||||||||||||||||
| From net investment income | (0.34 | ) | (0.36 | ) | (0.34 | ) | (0.22 | ) | (0.24 | ) | |||||||||||||
| From net realized gains | (0.12 | ) | (0.55 | ) | (0.16 | ) | (0.04 | ) | — | ||||||||||||||
| Total distributions | (0.46 | ) | (0.91 | ) | (0.50 | ) | (0.26 | ) | (0.24 | ) | |||||||||||||
| Net asset value, end of period | $ | 14.17 | $ | 20.56 | $ | 21.78 | $ | 20.81 | $ | 20.03 | |||||||||||||
| Total Return(a) | (29.37 | )% | (1.76 | )% | 7.18 | % | 5.28 | % | 1.72 | % | |||||||||||||
| Ratios/Supplemental Data: | |||||||||||||||||||||||
| Net assets, end of period (000's) | $ | 1,952,579 | $ | 2,003,758 | $ | 1,575,300 | $ | 1,108,088 | $ | 463,848 | |||||||||||||
| Net expenses to average daily net assets | 0.48 | %(b) | 0.48 | %(b) | 0.48 | % | 0.48 | % | 0.48 | % | |||||||||||||
| Net investment income to average daily net assets | 2.03 | % | 1.74 | % | 1.64 | % | 1.58 | % | 1.98 | % | |||||||||||||
| Portfolio turnover rate | 36 | % | 46 | % | 50 | % | 52 | % | 66 | % | |||||||||||||
| Fees and expenses reimbursed by the Manager to average daily net assets: | 0.02 | % | 0.02 | % | 0.02 | % | 0.02 | % | 0.04 | % | |||||||||||||
(a) The total returns would have been lower had certain expenses not been reimbursed during the periods shown and assumes the effect of reinvested distributions.
(b) The net expense ratio does not include the effect of expense reductions.
† Calculated using average shares outstanding throughout the period.
See accompanying notes to the financial statements.
10
GMO U.S. Quality Equity Fund
(A Series of GMO Trust)
Financial Highlights
(For a Class IV share outstanding throughout each period)
| Year Ended February 28/29, | |||||||||||||||||||||||
| 2009 | 2008 | 2007 | 2006 | 2005 | |||||||||||||||||||
| Net asset value, beginning of period | $ | 20.57 | $ | 21.80 | $ | 20.82 | $ | 20.03 | $ | 19.93 | |||||||||||||
| Income (loss) from investment operations: | |||||||||||||||||||||||
| Net investment income (loss)† | 0.39 | 0.40 | 0.37 | 0.32 | 0.38 | ||||||||||||||||||
| Net realized and unrealized gain (loss) | (6.30 | ) | (0.71 | ) | 1.11 | 0.74 | (0.03 | ) | |||||||||||||||
| Total from investment operations | (5.91 | ) | (0.31 | ) | 1.48 | 1.06 | 0.35 | ||||||||||||||||
| Less distributions to shareholders: | |||||||||||||||||||||||
| From net investment income | (0.35 | ) | (0.37 | ) | (0.34 | ) | (0.23 | ) | (0.25 | ) | |||||||||||||
| From net realized gains | (0.12 | ) | (0.55 | ) | (0.16 | ) | (0.04 | ) | — | ||||||||||||||
| Total distributions | (0.47 | ) | (0.92 | ) | (0.50 | ) | (0.27 | ) | (0.25 | ) | |||||||||||||
| Net asset value, end of period | $ | 14.19 | $ | 20.57 | $ | 21.80 | $ | 20.82 | $ | 20.03 | |||||||||||||
| Total Return(a) | (29.27 | )% | (1.77 | )% | 7.19 | % | 5.37 | % | 1.75 | % | |||||||||||||
| Ratios/Supplemental Data: | |||||||||||||||||||||||
| Net assets, end of period (000's) | $ | 787,276 | $ | 432,046 | $ | 800,458 | $ | 2,005,417 | $ | 938,586 | |||||||||||||
| Net expenses to average daily net assets | 0.44 | %(b) | 0.44 | %(b) | 0.44 | % | 0.44 | % | 0.44 | % | |||||||||||||
| Net investment income to average daily net assets | 2.11 | % | 1.78 | % | 1.79 | % | 1.62 | % | 1.92 | % | |||||||||||||
| Portfolio turnover rate | 36 | % | 46 | % | 50 | % | 52 | % | 66 | % | |||||||||||||
| Fees and expenses reimbursed by the Manager to average daily net assets: | 0.02 | % | 0.02 | % | 0.02 | % | 0.02 | % | 0.04 | % | |||||||||||||
(a) The total returns would have been lower had certain expenses not been reimbursed during the periods shown and assumes the effect of reinvested distributions.
(b) The net expense ratio does not include the effect of expense reductions.
† Calculated using average shares outstanding throughout the period.
See accompanying notes to the financial statements.
11
GMO U.S. Quality Equity Fund
(A Series of GMO Trust)
Financial Highlights
(For a Class V share outstanding throughout each period)
| Year Ended February 28/29, | |||||||||||||||
| 2009 | 2008 | 2007(a) | |||||||||||||
| Net asset value, beginning of period | $ | 20.56 | $ | 21.79 | $ | 21.91 | |||||||||
| Income (loss) from investment operations: | |||||||||||||||
| Net investment income (loss)† | 0.39 | 0.41 | 0.07 | ||||||||||||
| Net realized and unrealized gain (loss) | (6.30 | ) | (0.72 | ) | 0.04 | ||||||||||
| Total from investment operations | (5.91 | ) | (0.31 | ) | 0.11 | ||||||||||
| Less distributions to shareholders: | |||||||||||||||
| From net investment income | (0.36 | ) | (0.37 | ) | (0.09 | ) | |||||||||
| From net realized gains | (0.12 | ) | (0.55 | ) | (0.14 | ) | |||||||||
| Total distributions | (0.48 | ) | (0.92 | ) | (0.23 | ) | |||||||||
| Net asset value, end of period | $ | 14.17 | $ | 20.56 | $ | 21.79 | |||||||||
| Total Return(b) | (29.31 | )% | (1.75 | )% | 0.49 | %** | |||||||||
| Ratios/Supplemental Data: | |||||||||||||||
| Net assets, end of period (000's) | $ | 637,834 | $ | 663,616 | $ | 259,430 | |||||||||
| Net expenses to average daily net assets | 0.42 | %(c) | 0.42 | %(c) | 0.42 | %* | |||||||||
| Net investment income to average daily net assets | 2.11 | % | 1.83 | % | 1.40 | %* | |||||||||
| Portfolio turnover rate | 36 | % | 46 | % | 50 | %†† | |||||||||
| Fees and expenses reimbursed by the Manager to average daily net assets: | 0.02 | % | 0.02 | % | 0.02 | %* | |||||||||
(a) Period from December 8, 2006 (commencement of operations) through February 28, 2007.
(b) The total returns would have been lower had certain expenses not been reimbursed during the periods shown and assumes the effect of reinvested distributions.
(c) The net expense ratio does not include the effect of expense reductions.
† Calculated using average shares outstanding throughout the period.
†† Calculation represents portfolio turnover of the Fund for the year ended February 28, 2007.
* Annualized.
** Not annualized.
See accompanying notes to the financial statements.
12
GMO U.S. Quality Equity Fund
(A Series of GMO Trust)
Financial Highlights
(For a Class VI share outstanding throughout each period)
| Year Ended February 28/29, | |||||||||||||||
| 2009 | 2008 | 2007(a) | |||||||||||||
| Net asset value, beginning of period | $ | 20.57 | $ | 21.79 | $ | 21.91 | |||||||||
| Income (loss) from investment operations: | |||||||||||||||
| Net investment income (loss)† | 0.40 | 0.41 | 0.07 | ||||||||||||
| Net realized and unrealized gain (loss) | (6.31 | ) | (0.70 | ) | 0.04 | ||||||||||
| Total from investment operations | (5.91 | ) | (0.29 | ) | 0.11 | ||||||||||
| Less distributions to shareholders: | |||||||||||||||
| From net investment income | (0.36 | ) | (0.38 | ) | (0.09 | ) | |||||||||
| From net realized gains | (0.12 | ) | (0.55 | ) | (0.14 | ) | |||||||||
| Total distributions | (0.48 | ) | (0.93 | ) | (0.23 | ) | |||||||||
| Net asset value, end of period | $ | 14.18 | $ | 20.57 | $ | 21.79 | |||||||||
| Total Return(b) | (29.28 | )% | (1.67 | )% | 0.49 | %** | |||||||||
| Ratios/Supplemental Data: | |||||||||||||||
| Net assets, end of period (000's) | $ | 5,273,791 | $ | 5,237,363 | $ | 2,588,116 | |||||||||
| Net expenses to average daily net assets | 0.39 | %(c) | 0.39 | %(c) | 0.39 | %* | |||||||||
| Net investment income to average daily net assets | 2.16 | % | 1.84 | % | 1.43 | %* | |||||||||
| Portfolio turnover rate | 36 | % | 46 | % | 50 | %†† | |||||||||
| Fees and expenses reimbursed by the Manager to average daily net assets: | 0.02 | % | 0.02 | % | 0.02 | %* | |||||||||
(a) Period from December 8, 2006 (commencement of operations) through February 28, 2007.
(b) The total returns would have been lower had certain expenses not been reimbursed during the periods shown and assumes the effect of reinvested distributions.
(c) The net expense ratio does not include the effect of expense reductions.
† Calculated using average shares outstanding throughout the period.
†† Calculation represents portfolio turnover of the Fund for the year ended February 28, 2007.
* Annualized.
** Not annualized.
See accompanying notes to the financial statements.
13
GMO U.S. Quality Equity Fund
(A Series of GMO Trust)
Notes to Financial Statements
February 28, 2009
1. Organization
GMO U.S. Quality Equity Fund (the "Fund") is a series of GMO Trust (the "Trust"). The Fund is registered under the Investment Company Act of 1940, as amended, as an open-end, non-diversified management investment company. The Fund is advised and managed by Grantham, Mayo, Van Otterloo & Co. LLC (the "Manager" or "GMO"). The Trust was established as a Massachusetts business trust under the laws of The Commonwealth of Massachusetts on June 24, 1985. The Declaration of Trust permits the Trustees of the Trust ("Trustees") to create an unlimited number of series of shares ("Funds") and to subdivide Funds into classes.
The Fund seeks high total return. The Fund seeks to achieve its objective by outperforming the S&P 500 Index. The Fund typically makes equity investments in companies that issue stocks included in the S&P 500 Index, and in companies with similar market capitalizations. The Fund may hold fewer than 100 stocks. The Fund reserves the right to make tactical allocations of up to 20% of its net assets to investments in cash and other high quality investments.
As of February 28, 2009, the Fund had four classes of shares outstanding: Class III, Class IV, Class V and Class VI. Each class of shares bears a different level of shareholder service fees.
2. Significant accounting policies
The following is a summary of significant accounting policies followed by the Fund in the preparation of its financial statements. These policies are in conformity with accounting principles generally accepted in the United States of America ("U.S. GAAP") and have been consistently followed by the Fund in preparing its financial statements. The preparation of financial statements in accordance with U.S. GAAP requires management to make estimates and assumptions that affect the reported amounts and disclosures in the financial statements. Actual results could differ from those estimates. The accounting records of the Fund are maintained in U.S. dollars.
Portfolio valuation
Securities listed on a securities exchange for which market quotations are readily available are valued at the last sale price or official closing price on each business day, or if there is no such reported sale or official closing price, at the most recent quoted bid price. Unlisted securities for which market quotations are readily available are generally valued at the most recent quoted bid price. Debt instruments with a remaining maturity of sixty days or less are generally valued at amortized cost, which approximates fair value. Shares of investment funds are generally valued at their net asset value. Securities for which quotations are not readily available or whose values the Manager has determined to be unreliable are valued at fair value as determined in good faith by the Trustees or persons acting at their direction pursuant to procedures approved by the Trustees. By its nature, a fair value price is a good faith estim ate of the value of a security at a given point in time and may not reflect the value that would be realized if
14
GMO U.S. Quality Equity Fund
(A Series of GMO Trust)
Notes to Financial Statements — (Continued)
February 28, 2009
the security were sold. The difference between a fair value price and the value realized upon a sale could be material.
In September 2006, the Financial Accounting Standards Board ("FASB") issued Statement of Financial Accounting Standards No. 157, Fair Value Measurements ("SFAS 157"). SFAS 157 is effective for the Fund's current fiscal year. While the adoption of SFAS 157 does not have an effect on the Fund's net asset value, it does require additional disclosures about fair value measurements. SFAS 157 establishes a three-level hierarchy for disclosure of fair value measurements. The valuation hierarchy is based upon the reliability of inputs to the valuation of the Fund's investments. The three levels are defined as follows:
Level 1 – Valuations based on quoted prices for identical securities in active markets.
Level 2 – Valuations determined using other significant direct or indirect observable inputs.
Level 3 – Valuations based on inputs that are unobservable and significant.
The inputs or methodology used for valuing securities are not necessarily an indication of the risk associated with investing in those securities.
The following is a summary of the fair valuations according to inputs used as of February 28, 2009 in valuing the Fund's investments:
| Asset Valuation Inputs | Investments in Securities | Other Financial Instruments | |||||||||
| Level 1 - Quoted Prices | $ | 8,425,760,198 | $ | — | |||||||
| Level 2 - Other Significant Observable Inputs | 53,741,616 | — | |||||||||
| Level 3 - Significant Unobservable Inputs | — | — | |||||||||
| Total | $ | 8,479,501,814 | $ | — | |||||||
| Liability Valuation Inputs | Investments in Securities | Other Financial Instruments* | |||||||||
| Level 1 - Quoted Prices | $ | — | $ | (4,944,495 | ) | ||||||
| Level 2 - Other Significant Observable Inputs | — | — | |||||||||
| Level 3 - Significant Unobservable Inputs | — | — | |||||||||
| Total | $ | — | $ | (4,944,495 | ) | ||||||
* Other financial instruments include futures contracts.
15
GMO U.S. Quality Equity Fund
(A Series of GMO Trust)
Notes to Financial Statements — (Continued)
February 28, 2009
The Fund held no investments or other financial instruments at either February 29, 2008 or February 28, 2009, whose fair value was determined using Level 3 inputs.
Futures contracts
The Fund may purchase and sell futures contracts. Upon entering into a futures contract, the Fund is required to deposit cash, U.S. government and agency obligations, or other liquid assets with the futures clearing broker in accordance with the initial margin requirements of the broker or exchange. In addition, the Fund maintains cash or securities in an amount that at least equals the net amount payable in the event the Fund must deliver the full amount of the contract. Futures contracts are marked to market daily and an appropriate payable or receivable for the change in value ("variation margin") is recorded by the Fund. The payable or receivable is settled on the following business day. Gains or losses are recognized but not considered realized until the contracts expire or are closed. Futures contracts involve, to varying degrees, risk of loss in excess of the variation margin disclosed in the Statement of Assets and Liabi lities. Under some circumstances, futures exchanges may establish daily limits on the amount that the price of a futures contract can vary from the previous day's settlement price, thereby effectively preventing liquidation of unfavorable positions. Losses may arise from changes in the value of the underlying instrument if the Fund is unable to liquidate a futures position due to an illiquid secondary market for the contract or the imposition of price limits, or if counterparties do not perform under the contract terms. Futures contracts are generally valued at the settlement price established each day by the board of trade or exchange on which they are traded. Futures contracts outstanding at the end of the period are listed in the Fund's Schedule of Investments.
Swap agreements
The Fund may enter into various types of swap agreements, including without limitation, interest rate, total return, credit default and variance swap agreements. A swap agreement is an agreement to exchange the return generated by one instrument for the return generated by another instrument. When entering into a swap agreement, the Fund and/or the swap counterparty may post or receive cash or securities as collateral. The party posting the collateral typically receives the interest associated with or payments related to the collateral and has the risk of loss related to the collateral.
Interest rate swap agreements involve an exchange by the parties of their respective commitments to pay or right to receive interest, e.g., an exchange of floating rate interest payments for fixed rate interest payments with respect to the notional amount of principal.
Total return swap agreements involve a commitment by one party to pay interest to the other party in exchange for a payment to it from the other party based on the return of a reference instrument (e.g., a security or basket of securities), both based on notional amounts. To the extent the return of the reference instrument exceeds or falls short of the interest payments, one party will receive a payment from or make a payment to the other party.
16
GMO U.S. Quality Equity Fund
(A Series of GMO Trust)
Notes to Financial Statements — (Continued)
February 28, 2009
In a credit default swap agreement, one party makes payments to another party in exchange for the right to receive a specified return if a credit event occurs with respect to a referenced entity or entities. Buying credit default protection reduces the buyer's exposure in the event of an issuer's default (e.g., it reduces risk where a party owns a security issued by or otherwise has exposure to the issuer). Selling credit default protection subjects the seller to exposure to an issuer's default. A seller of credit default protection receives payments in return for its obligation to pay the principal amount of a debt security (or other agreed-upon value) to the other party upon the occurrence of a credit event (e.g., issuer default or similar event). If no credit event occurs, the seller has no payment obligations. For credit default swap agreements on asset-backed securities, a credit event may be triggered by such events as the issuer's failure to pay interest or principal, an agreement of the holders of an asset-backed security to a maturity extension, a rating downgrade on the security or a write-down on the collateral underlying the security. For credit default swap agreements on corporate or sovereign issuers, a credit event may be triggered by such events as the issuer's bankruptcy, failure to pay interest or principal, repudiation/moratorium or restructuring.
Variance swap agreements involve an agreement by two parties to exchange cash flows based on the measured variance (or square of volatility) of a specified underlying asset. One party agrees to exchange a "fixed rate" or strike price payment for the "floating rate" or realized price variance on the underlying asset with respect to the notional amount. At inception, the strike price chosen is generally fixed at a level such that the fair value of the swap is zero. At the expiration date, the amount paid by one party to the other is the difference between the realized price variance of the underlying asset and the strike price multiplied by the notional amount. A receiver of the realized price variance would receive a payment when the realized price variance of the underlying asset is greater than the strike price and would make a payment when that variance is less than the strike price. A payer of the realized price variance woul d make a payment when the realized price variance of the underlying asset is greater than the strike price and would receive a payment when that variance is less than the strike price. This type of agreement is essentially a forward contract on the future realized price variance of the underlying asset.
The Fund prices its swap agreements daily using models that may incorporate quotations from market makers and records the change in value, if any, as unrealized gain or loss in the Statement of Operations. Payments received or made on swap agreements are recorded as realized gain or loss in the Statement of Operations. Gains or losses are realized upon termination of the swap agreements.
Swap agreements often are not actively traded on financial markets. The values assigned to them may differ significantly from the values that would be realized upon termination, and the differences could be material. Entering into swap agreements involves credit, legal, market and documentation risk that is not reflected in the amounts reported in the Statement of Assets and Liabilities. Such risks include the possibility that the party with whom the Fund contracts may default on its obligations to perform or disagree as to the meaning of contractual terms, or that the collateral that party posts may be insufficient or not timely received by the Fund. Credit risk may be particularly acute in an environment where financial services firms are exposed to systemic risks of the type evidenced by the insolvency of Lehman
17
GMO U.S. Quality Equity Fund
(A Series of GMO Trust)
Notes to Financial Statements — (Continued)
February 28, 2009
Brothers and subsequent market disruptions. The Fund had no swap agreements outstanding at the end of the period.
Repurchase agreements
The Fund may enter into repurchase agreements. Under a repurchase agreement the Fund acquires a security for cash and obtains a simultaneous commitment from the seller to repurchase the security at an agreed upon price and date. The Fund, through its custodian, takes possession of securities collateralizing the repurchase agreement. The collateral is marked to market daily to ensure that the market value of the underlying assets is at least equal to the amount owed to the Fund in the event of default by the seller. If the seller of a repurchase agreement defaults or enters into insolvency proceedings and the value of the collateral declines, the Fund's recovery of cash may be delayed or limited. The Fund had no repurchase agreements outstanding at the end of the period.
Securities lending
The Fund may lend its securities to qualified brokers. The loans are collateralized with cash or liquid securities with a market value at least equal to the market value of the securities upon entering into the loan. As with other extensions of credit, the Fund may bear the risk of loss with respect to the investment of the collateral, the risk of delay in and/or inability to exercise its rights with respect to the collateral, and the risk of delay in recovery or loss of rights in the loaned securities should the borrower of the securities fail financially. If a loan is collateralized by U.S. government securities, the Fund receives a fee from the borrower. If a loan is collateralized by cash, the Fund typically invests the cash collateral for its own account. For the year from March 1, 2008 through February 28, 2009, the Fund did not participate in securities lending.
Taxes and distributions
The Fund intends to qualify each tax year as a regulated investment company under Subchapter M of the Internal Revenue Code of 1986, as amended (the "Code"). The Fund intends to distribute substantially all of its net investment income and all of its net realized short-term and long-term capital gain, if any, after giving effect to any available capital loss carryforwards for U.S. federal income tax purposes. Therefore, no provision for U.S. federal income or excise tax is necessary.
The Fund's policy is to declare and pay distributions from net investment income, if any, quarterly, and from net realized short-term and long-term capital gain, if any, at least annually. All distributions are paid in shares of the Fund, at net asset value, unless the shareholder elects to receive cash distributions. Distributions to shareholders are recorded by the Fund on the ex-dividend date.
Income and capital gain distributions are determined in accordance with U.S. federal income tax regulations, which may differ from U.S. GAAP. Certain capital accounts in the financial statements are periodically adjusted for permanent differences in order to reflect their tax character. These adjustments have no impact on net assets or net asset value per share. Temporary differences that arise from recognizing
18
GMO U.S. Quality Equity Fund
(A Series of GMO Trust)
Notes to Financial Statements — (Continued)
February 28, 2009
certain items of income, expense, gain or loss in different periods for financial statement and tax purposes will reverse at some time in the future. Distributions in excess of net investment income or net realized gains are temporary over-distributions for financial statement purposes resulting from differences in the recognition or classification of income or distributions for financial statement and tax purposes.
U.S. GAAP and tax accounting differences primarily relate to capital loss carryforwards, derivative contract transactions, post-October capital losses and losses on wash sale transactions.
The following reclassification represents the amount necessary to report the stated components of net assets on a tax basis, excluding certain temporary differences, as of February 28, 2009. The financial highlights exclude these adjustments.
| Accumulated Undistributed Net Investment Income | Distributions In Excess of Net Realized Gain | Paid-in Capital | |||||||||
| $ | (20,578 | ) | $ | 20,578 | $ | — | |||||
The tax character of distributions declared to shareholders is as follows:
| 2/28/2009 | 2/29/2008 | ||||||||||
| Ordinary income (including any net short-term capital gain) | $ | 172,676,344 | $ | 110,133,330 | |||||||
| Net long-term capital gain | 52,051,934 | 179,432,949 | |||||||||
| Total distributions | $ | 224,728,278 | $ | 289,566,279 | |||||||
Distributions in excess of tax basis earnings and profits, if significant, are reported in the financial statements as a return of capital for tax purposes.
As of February 28, 2009, the components of distributable earnings on a tax basis consisted of the following:
| Undistributed ordinary income (including any net short-term capital gain) | $ | 45,038,026 | |||||
As of February 28, 2009, the Fund elected to defer to March 1, 2009 post-October capital losses of $269,802,905.
19
GMO U.S. Quality Equity Fund
(A Series of GMO Trust)
Notes to Financial Statements — (Continued)
February 28, 2009
As of February 28, 2009, the Fund had capital loss carryforwards available to offset future realized gains if any, to the extent permitted by the Code. Utilization of the capital loss carryforwards could be subject to limitations imposed by the Code related to share ownership activity. Such losses expire as follows:
| 2/28/2017 | $ | (288,464,155 | ) | ||||
| Total | $ | (288,464,155 | ) | ||||
As of February 28, 2009, the approximate cost for U.S. federal income tax purposes and gross and net unrealized appreciation (depreciation) in value of investments were as follows:
| Aggregate Cost | Gross Unrealized Appreciation | Gross Unrealized (Depreciation) | Net Unrealized Appreciation (Depreciation) | ||||||||||||
| $ | 11,521,843,355 | $ | 28,158,068 | $ | (3,070,499,609 | ) | $ | (3,042,341,541 | ) | ||||||
The Fund is subject to the provisions of Financial Accounting Standards Board Interpretation No. 48 ("FIN 48"), Accounting for Uncertainty in Income Taxes — an Interpretation of FASB Statement No. 109. FIN 48 sets forth a minimum threshold for financial statement recognition of a tax position taken or expected to be taken in a tax return that could affect the Fund's financial statements. The Fund did not have any unrecognized tax benefits or liabilities at February 28, 2009, nor did it have any increases or decreases in unrecognized tax benefits or liabilities for the period then ended. The Fund is subject to examination prior to the expiration of the statute of limitations by U.S. federal and state tax authorities for tax returns filed.
Security transactions and related investment income
Security transactions in the financial statements are accounted for on the trade date. Dividend income, net of applicable foreign withholding taxes, if any, is recorded on the ex-dividend date or, if later, when the Fund is informed of the ex-dividend date. Interest income is recorded on the accrual basis and is adjusted for the amortization of premiums and accretion of discounts. Principal on inflation indexed securities is adjusted for inflation and any increase or decrease is recorded as interest income or loss. Income is not recognized on securities for which collection is not expected. Non-cash dividends, if any, are recorded at the fair market value of the asset received. In determining the net gain or loss on securities sold, the Fund uses the identified cost basis for the purposes of determining the cost basis.
Expenses
The majority of the expenses of the Trust are directly identifiable to an individual fund. Expenses that are not readily identifiable to a specific fund are allocated taking into consideration, among other things, the nature and type of expense and the relative size of the funds. Investment income, common expenses and realized and unrealized gains and losses are allocated pro rata among the classes of shares of the Fund
20
GMO U.S. Quality Equity Fund
(A Series of GMO Trust)
Notes to Financial Statements — (Continued)
February 28, 2009
based on the relative net assets of each class. Shareholder service fees, which are directly attributable to a class of shares, are charged to that class's operations.
State Street Bank and Trust Company ("State Street") serves as custodian, fund accounting agent and transfer agent of the Fund. State Street's fees may be reduced by an earnings allowance calculated on the average daily cash balances the Fund maintains with State Street. The Fund receives the benefit of the earnings allowance. In addition, Goldman Sachs Agency Lending, the Fund's securities lending agent, has agreed to reimburse the Fund for certain transactional expenses related to securities lending activity. Credit balances or expense reimbursements used to reduce fees, if any, are reported as a reduction of expenses in the Statement of Operations.
Recently issued accounting pronouncement
In March 2008, FASB issued Statement of Financial Accounting Standards No. 161, Disclosures about Derivative Instruments and Hedging Activities ("SFAS 161"). SFAS 161 is effective for fiscal years and interim periods beginning after November 15, 2008. SFAS 161 requires enhanced disclosures about the Fund's derivative and hedging activities. The Manager is currently evaluating the impact the adoption of SFAS 161 will have on the Fund's financial statement disclosures.
3. Fees and other transactions with affiliates
GMO receives a management fee for the services it provides to the Fund. That fee is paid monthly at the annual rate of 0.33% of average daily net assets. The Fund has adopted a Shareholder Service Plan under which the Fund pays GMO a shareholder service fee for client and shareholder service, reporting, and other support. Pursuant to the Shareholder Service Plan, the shareholder service fee is calculated based on average daily net assets of each class at the annual rate of 0.15% for Class III shares, 0.105% for Class IV shares, 0.085% for Class V shares and 0.055% for Class VI shares.
Through at least June 30, 2009, the Manager has contractually agreed to reimburse the Fund for Fund expenses incurred through that date to the extent the Fund's total annual operating expenses (excluding "Excluded Expenses", as defined below) exceed 0.33% of the Fund's average daily net assets. Excluded Expenses include shareholder service fees, fees and expenses of the independent Trustees of the Trust, fees and expenses for legal services not approved by the Manager for the Trust, compensation and expenses of the Trust's Chief Compliance Officer ("CCO") (excluding any employee benefits), brokerage commissions, securities lending fees and expenses, interest expense, transfer taxes, and other investment-related costs (including expenses associated with investments in any company that is an investment company or would be an investment company under the 1940 Act, but for the exceptions to the definition of investment company provi ded in Section 3(c)(1) and 3(c)(7) of the 1940 Act), hedging transaction fees, extraordinary, non-recurring and certain other unusual expenses (including taxes).
21
GMO U.S. Quality Equity Fund
(A Series of GMO Trust)
Notes to Financial Statements — (Continued)
February 28, 2009
The Fund's portion of the fees paid by the Trust to the Trust's independent Trustees and CCO during the year ended February 28, 2009 was $107,065 and $65,748, respectively. The compensation and expenses of the CCO are included in miscellaneous expenses in the Statement of Operations. The Fund paid no remuneration to any other officer of the Trust.
4. Purchases and sales of securities
Cost of purchases and proceeds from sales of securities, excluding short-term investments, for the year ended February 28, 2009 aggregated $6,650,923,374 and $3,103,523,609, respectively.
5. Guarantees
In the normal course of business the Fund enters into contracts with third-party service providers that contain a variety of representations and warranties and that provide general indemnifications. The Fund's maximum exposure under these arrangements is unknown, as it involves future claims that may be made against the Fund that have not yet occurred. Based on experience, management is of the view that the risk of loss in connection with its indemnification obligations is remote; however, there can be no assurance that such obligations will not result in material liabilities that adversely affect the Fund.
6. Principal shareholders and related parties
As of February 28, 2009, 21.26% of the outstanding shares of the Fund were held by one shareholder. On that date, no other shareholder owned more than 10% of the outstanding shares of the Fund. Redemptions from (or investments into) the Fund or on behalf of this large shareholder may have a material effect on the Fund.
As of February 28, 2009, 0.41% of the Fund's shares were held by senior management of the Manager and GMO Trust officers and 62.80% of the Fund's shares were held by accounts for which the Manager had investment discretion.
22
GMO U.S. Quality Equity Fund
(A Series of GMO Trust)
Notes to Financial Statements — (Continued)
February 28, 2009
7. Share transactions
The Declaration of Trust permits the Trust to issue an unlimited number of shares of beneficial interest (without par value). Transactions in Fund shares were as follows:
| Year Ended February 28, 2009 | Year Ended February 29, 2008 | ||||||||||||||||||
| Class III: | Shares | Amount | Shares | Amount | |||||||||||||||
| Shares sold | 56,850,636 | $ | 949,977,379 | 50,996,071 | $ | 1,139,966,142 | |||||||||||||
| Shares issued to shareholders in reinvestment of distributions | 1,903,117 | 35,704,632 | 3,122,803 | 70,870,252 | |||||||||||||||
| Shares repurchased | (18,454,345 | ) | (350,367,596 | ) | (28,982,283 | ) | (638,400,625 | ) | |||||||||||
| Net increase (decrease) | 40,299,408 | $ | 635,314,415 | 25,136,591 | $ | 572,435,769 | |||||||||||||
| Year Ended February 28, 2009 | Year Ended February 29, 2008 | ||||||||||||||||||
| Class IV: | Shares | Amount | Shares | Amount | |||||||||||||||
| Shares sold | 61,336,699 | $ | 958,117,182 | 28,155,555 | $ | 619,378,521 | |||||||||||||
| Shares issued to shareholders in reinvestment of distributions | 341,350 | 6,328,384 | 821,509 | 18,645,946 | |||||||||||||||
| Shares repurchased | (27,177,224 | ) | (453,362,652 | ) | (44,697,168 | ) | (994,664,368 | ) | |||||||||||
| Net increase (decrease) | 34,500,825 | $ | 511,082,914 | (15,720,104 | ) | $ | (356,639,901 | ) | |||||||||||
| Year Ended February 28, 2009 | Year Ended February 29, 2008 | ||||||||||||||||||
| Class V: | Shares | Amount | Shares | Amount | |||||||||||||||
| Shares sold | 55,629,177 | $ | 871,553,660 | 32,154,927 | $ | 708,017,030 | |||||||||||||
| Shares issued to shareholders in reinvestment of distributions | 839,435 | 15,553,597 | 832,035 | 18,891,284 | |||||||||||||||
| Shares repurchased | (43,740,533 | ) | (686,139,124 | ) | (12,624,095 | ) | (276,202,648 | ) | |||||||||||
| Net increase (decrease) | 12,728,079 | $ | 200,968,133 | 20,362,867 | $ | 450,705,666 | |||||||||||||
23
GMO U.S. Quality Equity Fund
(A Series of GMO Trust)
Notes to Financial Statements — (Continued)
February 28, 2009
| Year Ended February 28, 2009 | Year Ended February 29, 2008 | ||||||||||||||||||
| Class VI: | Shares | Amount | Shares | Amount | |||||||||||||||
| Shares sold | 207,622,713 | $ | 3,716,913,789 | 143,722,533 | $ | 3,181,476,095 | |||||||||||||
| Shares issued to shareholders in reinvestment of distributions | 7,874,939 | 146,139,703 | 6,951,875 | 157,780,829 | |||||||||||||||
| Shares repurchased | (98,156,063 | ) | (1,578,169,692 | ) | (14,796,108 | ) | (322,245,753 | ) | |||||||||||
| Net increase (decrease) | 117,341,589 | $ | 2,284,883,800 | 135,878,300 | $ | 3,017,011,171 | |||||||||||||
8. Subsequent event
Effective June 1, 2009, the Fund's name will change to GMO Quality Fund. Concurrent with this name change, the Fund will no longer be bound by its policy to invest at least 80% of its assets in equity investments tied economically to the U.S.
24
Report of Independent Registered Public Accounting Firm
To the Trustees of GMO Trust and the Shareholders of
GMO U.S. Quality Equity Fund:
In our opinion, the accompanying statement of assets and liabilities, including the schedule of investments, and the related statements of operations and of changes in net assets and the financial highlights present fairly, in all material respects, the financial position of GMO U.S. Quality Equity Fund (the "Fund") at February 28, 2009, the results of its operations for the year then ended, the changes in its net assets for each of the two years in the period then ended and the financial highlights for each of the periods indicated, in conformity with accounting principles generally accepted in the United States of America. These financial statements and financial highlights (hereafter referred to as "financial statements") are the responsibility of the Fund's management. Our responsibility is to express an opinion on these financial statements based on our audits. We conducted our audits of these financial statements in accord ance with the standards of the Public Company Accounting Oversight Board (United States). Those standards require that we plan and perform the audit to obtain reasonable assurance about whether the financial statements are free of material misstatement. An audit includes examining, on a test basis, evidence supporting the amounts and disclosures in the financial statements, assessing the accounting principles used and significant estimates made by management, and evaluating the overall financial statement presentation. We believe that our audits, which included confirmation of securities at February 28, 2009 by correspondence with the custodian and brokers, provide a reasonable basis for our opinion.
PricewaterhouseCoopers LLP
Boston, Massachusetts
April 29, 2009
25
GMO U.S. Quality Equity Fund
(A Series of GMO Trust)
Fund Expenses
February 28, 2009 (Unaudited)
Expense Examples: The following information is in relation to expenses for the six month period ended February 28, 2009.
As a shareholder of the Fund, you may incur two types of costs: (1) transaction costs, and (2) ongoing costs, including management fees, shareholder service fees and other Fund expenses. This example is intended to help you understand your ongoing costs (in dollars) of investing in the Fund and to compare these costs with the ongoing costs of investing in other mutual funds.
These examples are based on an investment of $1,000 invested at the beginning of the period and held for the entire period, September 1, 2008 through February 28, 2009.
Actual Expenses
The first line of the table for each class below provides information about actual account values and actual expenses. You may use the information in this line, together with the amount you invested, to estimate the expenses that you paid over the period. Simply divide your account value by $1,000 (for example, a $10,000,000 account value divided by $1,000 = 10,000), then multiply the result by the number in the first line under the heading entitled "Net Expense Incurred" to estimate the expenses you paid on your account during this period.
Hypothetical Example for Comparison Purposes
The second line of the table for each class below provides information about hypothetical account values and hypothetical expenses based on the Fund's actual expense ratio and an assumed rate of return of 5% per year before expenses, which is not the Fund's actual return. The hypothetical account values and expenses may not be used to estimate the actual ending account balance or expenses you paid for the period. You may use this information to compare the ongoing costs of investing in the Fund with other funds. To do so, compare this 5% hypothetical example with the 5% hypothetical examples that appear in the shareholder reports of other funds.
26
GMO U.S. Quality Equity Fund
(A Series of GMO Trust)
Fund Expenses — (Continued)
February 28, 2009 (Unaudited)
Please note that the expenses shown in the table are meant to highlight your ongoing costs only and do not reflect any transactional costs. Therefore, the second line of the table is useful in comparing ongoing costs only, and will not help you determine the relative total costs of owning different funds. In addition, if these transactional costs were included, your costs would have been higher.
| Annualized Net Expense Ratio | Beginning Account Value | Ending Account Value | Net Expense Incurred | ||||||||||||||||
| Class III | |||||||||||||||||||
| 1) Actual | 0.48 | % | $ | 1,000.00 | $ | 709.20 | $ | 2.03 | |||||||||||
| 2) Hypothetical | 0.48 | % | $ | 1,000.00 | $ | 1,022.41 | $ | 2.41 | |||||||||||
| Class IV | |||||||||||||||||||
| 1) Actual | 0.44 | % | $ | 1,000.00 | $ | 709.90 | $ | 1.87 | |||||||||||
| 2) Hypothetical | 0.44 | % | $ | 1,000.00 | $ | 1,022.61 | $ | 2.21 | |||||||||||
| Class V | |||||||||||||||||||
| 1) Actual | 0.42 | % | $ | 1,000.00 | $ | 709.40 | $ | 1.78 | |||||||||||
| 2) Hypothetical | 0.42 | % | $ | 1,000.00 | $ | 1,022.71 | $ | 2.11 | |||||||||||
| Class VI | |||||||||||||||||||
| 1) Actual | 0.39 | % | $ | 1,000.00 | $ | 710.00 | $ | 1.65 | |||||||||||
| 2) Hypothetical | 0.39 | % | $ | 1,000.00 | $ | 1,022.86 | $ | 1.96 | |||||||||||
* Expenses are calculated using each Class's annualized expense ratio for the six months ended February 28, 2009, multiplied by the average account value over the period, multiplied by 181 days in the period, divided by 365 days in the year.
27
GMO U.S. Quality Equity Fund
(A Series of GMO Trust)
Tax Information for the Tax Year Ended February 28, 2009 (Unaudited)
The Fund will notify shareholders of amounts for use in preparing 2009 income tax forms in January 2010.
The Fund's distributions to shareholders include $52,051,934 from long-term capital gains.
For taxable, non-corporate shareholders, 100.00% of the income and short-term capital gains, if any, distributed in the Fund's fiscal year ended February 28, 2009 represents qualified dividend income subject to the 15% rate category.
For corporate shareholders, 100.00% of the income and short-term capital gains, if any, distributed in the Fund's fiscal year ended February 28, 2009 qualified for the dividends-received deduction.
The Fund hereby designates as qualified interest income with respect to its taxable year ended February 28, 2009, $2,900,324 or if determined to be different, the qualified interest income of such year.
28
Trustees and Officers (Unaudited)
The following tables list the Trust's Trustees and Officers as of the date of this report; their address and date of birth ("DOB"); their position with the Trust; the length of time holding that position with the Trust; their principal occupation(s) during the past five years; the number of portfolios in the fund complex they oversee; and other directorships they hold in companies subject to registration or reporting requirements of the Securities Exchange Act of 1934 (generally called "public companies") or in registered investment companies. The Trust's Statement of Additional Information ("SAI") includes additional information about the Trust's trustees, including changes subsequent to the date of the report. The SAI is available, without charge, upon request by writing GMO, c/o GMO Trust, 40 Rowes Wharf, Boston, MA 02110.
Independent Trustees:
| Name, Address, and DOB | Position(s) Held with Trust | Term of Office1 and Length of Time Served | Principal Occupation(s) During Past Five Years | Number of Portfolios in Fund Complex Overseen by Trustee | Other Directorships Held by Trustee | ||||||||||||||||||
| Donald W. Glazer, Esq. c/o GMO Trust 40 Rowes Wharf Boston, MA 02110 DOB: 07/26/1944 | Chairman of the Board of Trustees | Chairman of the Board of Trustees since March 2005; Lead Independent Trustee (September 2004 – March 2005); Trustee since December 2000. | Consultant – Law and Business2; Author of Legal Treatises. | 59 | None. | ||||||||||||||||||
1 Each Trustee is elected to serve during the continued lifetime of the Trust until he/she dies, resigns or is removed, or if sooner, until the next meeting of Shareholders called for the purpose of electing Trustees and until the election and qualification of his/her successor.
2 As part of Mr. Glazer's work as a consultant, he provides part-time consulting services to Goodwin Procter LLP ("Goodwin"). Goodwin has provided legal services to Renewable Resources, LLC, an affiliate of GMO; GMO, in connection with its relationship with Renewable Resources; and funds managed by Renewable Resources. Mr. Glazer has represented that he has no financial interest in, and is not involved in the provision of, such legal services. In the calendar years ended December 31, 2007 and December 31, 2008, these entities paid $789,416 and $183,864 respectively, in legal fees and disbursements to Goodwin. In correspondence with the Staff of the Securities and Exchange Commission beginning in August 2006, the Independent Trustees' legal counsel provided the Staff with information regarding Mr. Glazer's relationship with Goodwin and h is other business activities. On September 11, 2007, based on information that had been given to the Staff as of that date, the Staff provided oral no-action assurance consistent with the opinion of the Independent Trustees' legal counsel that Mr. Glazer is not an "interested person" of the Trust.
29
Independent Trustees — (Continued)
| Name, Address, and DOB | Position(s) Held with Trust | Term of Office1 and Length of Time Served | Principal Occupation(s) During Past Five Years | Number of Portfolios in Fund Complex Overseen by Trustee | Other Directorships Held by Trustee | ||||||||||||||||||
| W. Nicholas Thorndike c/o GMO Trust 40 Rowes Wharf Boston, MA 02110 DOB: 03/28/1933 | Trustee | Since March 2005. | Director or trustee of various corporations and charitable organizations, including Courier Corporation (a book publisher and manufacturer) (July 1989 – present); Putnam Funds (December 1992 – June 2004); and Providence Journal (a newspaper publisher) (December 1986 – December 2003). | 59 | Director of Courier Corporation (a book publisher and manufacturer); Member of the Investment Committee of Partners HealthCare System, Inc.3 | ||||||||||||||||||
| Peter Tufano c/o GMO Trust 40 Rowes Wharf Boston, MA 02110 DOB: 04/22/1957 | Trustee | Since December 2008. | Sylvan C. Coleman Professor of Financial Management, Harvard Business School (since 1989). | 59 | Trustee of State Street Navigator Securities Lending Trust (3 Portfolios). | ||||||||||||||||||
1 Each Trustee is elected to serve during the continued lifetime of the Trust until he/she dies, resigns or is removed, or if sooner, until the next meeting of Shareholders called for the purpose of electing Trustees and until the election and qualification of his/her successor.
3 Partners HealthCare System, Inc. is a client of the Manager.
30
Principal Officers:
| Name, Address, and DOB | Position(s) Held with Trust | Term of Office4 and Length of Time Served | Principal Occupation(s) During Past Five Years5 | ||||||||||||
| J.B. Kittredge DOB: 08/22/1954 | President and Chief Executive Officer | Since March 2009. | General Counsel, Grantham, Mayo, Van Otterloo & Co. LLC (October 2005 – Present); Partner, Ropes & Gray LLP. | ||||||||||||
| Sheppard N. Burnett c/o GMO Trust 40 Rowes Wharf Boston, MA 02110 DOB: 10/24/1968 | Treasurer and Chief Financial Officer | Chief Financial Officer since March 2007; Treasurer since November 2006; Assistant Treasurer, September 2004 – November 2006. | Fund Administration Staff, Grantham, Mayo, Van Otterloo & Co. LLC (June 2004 – present); Vice President, Director of Tax, Columbia Management Group (2002 – 2004). | ||||||||||||
| Brent C. Arvidson c/o GMO Trust 40 Rowes Wharf Boston, MA 02110 DOB: 06/26/1969 | Assistant Treasurer | Since August 1998. | Senior Fund Administrator, Grantham, Mayo, Van Otterloo & Co. LLC. | ||||||||||||
| John L. Nasrah c/o GMO Trust 40 Rowes Wharf Boston, MA 02110 DOB: 05/27/1977 | Assistant Treasurer | Since March 2007. | Fund Administrator, Grantham, Mayo, Van Otterloo & Co. LLC (September 2004 – present); Tax Analyst, Bain & Company, Inc. (June 2003 – September 2004). | ||||||||||||
| Mahmoodur Rahman c/o GMO Trust 40 Rowes Wharf Boston, MA 02110 DOB: 11/30/1967 | Assistant Treasurer | Since September 2007. | Fund Administrator, Grantham, Mayo, Van Otterloo & Co. LLC (April 2007 – present); Vice President and Senior Tax Manager, Massachusetts Financial Services Company (January 2000 – April 2007). | ||||||||||||
| Michael E. Gillespie c/o GMO Trust 40 Rowes Wharf Boston, MA 02110 DOB: 02/18/1958 | Chief Compliance Officer | Since March 2005. | Vice President of Compliance (June 2004 – February 2005) and Director of Domestic Compliance (March 2002 – June 2004), Fidelity Investments. | ||||||||||||
4 Each officer is elected to hold such office until his or her successor is duly elected and qualified to carry out the duties and responsibilities of the office, or until he or she resigns or is removed from office.
5 Each of Messrs. Burnett, Arvidson, Bohan, and Pottle serves as an officer and/or director of certain pooled investment vehicles of which GMO or an affiliate of GMO serves as the investment adviser.
31
Principal Officers — (Continued)
| Name, Address, and DOB | Position(s) Held with Trust | Term of Office4 and Length of Time Served | Principal Occupation(s) During Past Five Years5 | ||||||||||||
| Jason B. Harrison c/o GMO Trust 40 Rowes Wharf Boston, MA 02110 DOB: 01/29/1977 | Vice President and Clerk | Vice President since November 2006; Clerk since March 2006. | Legal Counsel, Grantham, Mayo, Van Otterloo & Co. LLC (since February 2006) and Attorney, Ropes & Gray LLP (September 2002 – February 2006). | ||||||||||||
| David L. Bohan c/o GMO Trust 40 Rowes Wharf Boston, MA 02110 DOB: 06/21/1964 | Vice President and Assistant Clerk | Vice President since March 2005; Assistant Clerk since March 2006. | Legal Counsel, Grantham, Mayo, Van Otterloo & Co. LLC. | ||||||||||||
| Gregory L. Pottle c/o GMO Trust 40 Rowes Wharf Boston, MA 02110 DOB: 07/09/1971 | Vice President and Assistant Clerk | Since November 2006. | Legal Counsel, Grantham, Mayo, Van Otterloo & Co. LLC. | ||||||||||||
| Anne K. Trinque c/o GMO Trust 40 Rowes Wharf Boston, MA 02110 DOB: 04/15/1978 | Vice President and Assistant Clerk | Since September 2007. | Legal Counsel, Grantham, Mayo, Van Otterloo & Co. LLC (January 2007 – present); Attorney, Goodwin Procter LLP (September 2003 – January 2007). | ||||||||||||
| Cheryl Wakeham c/o GMO Trust 40 Rowes Wharf Boston, MA 02110 DOB: 10/29/1958 | Vice President and Anti-Money Laundering Officer | Since December 2004. | Manager, Client Service Administration, Grantham, Mayo, Van Otterloo & Co. LLC. | ||||||||||||
4 Each officer is elected to hold such office until his or her successor is duly elected and qualified to carry out the duties and responsibilities of the office, or until he or she resigns or is removed from office.
5 Each of Messrs. Burnett, Arvidson, Bohan, and Pottle serves as an officer and/or director of certain pooled investment vehicles of which GMO or an affiliate of GMO serves as the investment adviser.
32
GMO Short-Duration Collateral Fund
(A Series of GMO Trust)
Annual Report
February 28, 2009
For a free copy of the Fund's proxy voting guidelines, shareholders may call 1-617-346-7646 (collect) or visit the Securities and Exchange Commission's website at www.sec.gov. Information regarding how the Fund voted proxies relating to portfolio securities during the most recent 12-month period ended June 30 is available on GMO's website at www.gmo.com, or on the Securities and Exchange Commission's website at www.sec.gov.
The Fund files its complete schedule of portfolio holdings with the Securities and Exchange Commission for the first and third quarter of each fiscal year on Form N-Q, which is available on the Commission's website at www.sec.gov. The Fund's Form N-Q may be reviewed and copied at the Commission's Public Reference Room in Washington, D.C. Information on the operation of the Public Reference Room may be obtained by calling 1-800-SEC-0330.
This report is prepared for the general information of shareholders. It is authorized for distribution to prospective investors only when preceded or accompanied by a private placement memorandum, which contains a complete discussion of the risks associated with an investment in this Fund and other important information. The private placement memorandum can be obtained by calling 1-617-346-7646 (collect).
GMO Short-Duration Collateral Fund
(A Series of GMO Trust)
Portfolio Management
Day-to-day management of the Fund's portfolio is the responsibility of the Fixed Income team at Grantham, Mayo, Van Otterloo & Co. LLC.
Management Discussion and Analysis of Fund Performance
Shares of the GMO Short-Duration Collateral Fund returned -16.0% for the fiscal year ended February 28, 2009, compared to +3.5% for the JPMorgan U.S. 3 Month Cash Index.
The Fund underperformed the benchmark during the fiscal year by 19.5%, with negative performance mostly attributable to mark-to-market valuation in subprime and other asset-backed security holdings. The Fund invests primarily in asset-backed securities.
Because the fiscal year was marked by sharply deteriorating liquidity conditions in securitized credit markets, spreads widened to all-time highs. In addition to widening spreads, the Fund suffered credit downgrades during the year: the Fund had 123 downgraded securities, representing 27.4% of its market value from the beginning of the year. At fiscal year-end, 73% of the Fund's portfolio was rated AAA, 8% was rated AA, 2% was rated A, 12% was rated BBB, and 5% was rated below B.
With the extreme price volatility of asset-backed securities during the fiscal year, the Fund underperformed LIBOR by nearly 20%.
The views expressed herein are exclusively those of Grantham, Mayo, Van Otterloo & Co. LLC Management as of the date of this report and are subject to change. GMO disclaims any responsibility to update such views. They are not meant as investment advice.
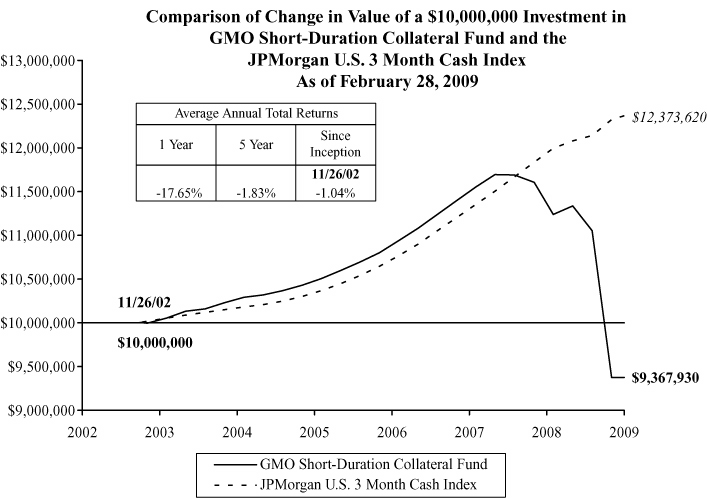
Performance data quoted represents past performance and is not indicative of future results. The investment return and principal value of an investment will fluctuate so that an investor's shares, when redeemed, may be worth more or less than their original cost. Current performance data may be lower or higher than the performance data provided herein. To obtain performance information to the most recent month-end, visit www.gmo.com. Performance shown is net of all fees after reimbursement from the Manager. Each performance figure assumes a redemption at the end of the stated period and reflects a transaction fee of 2.00% on the redemption. Transaction fees are retained by the Fund to cover trading costs. Returns would have been lower had certain expenses not been reimbursed during the periods shown and do not include the effect of taxes on distributions and redem ptions. All information is unaudited.
GMO Short-Duration Collateral Fund
(A Series of GMO Trust)
Investments Concentration Summary
February 28, 2009 (Unaudited)
| Asset Class Summary | % of Total Net Assets | ||||||
| Debt Obligations | 97.8 | % | |||||
| Short-Term Investments | 2.6 | ||||||
| Forward Currency Contracts | 0.1 | ||||||
| Swaps | (0.8 | ) | |||||
| Other | 0.3 | ||||||
| 100.0 | % | ||||||
| Industry Sector Summary | % of Debt Obligations | ||||||
| Credit Cards | 23.2 | % | |||||
| Residential Asset-Backed Securities (United States) | 13.4 | ||||||
| Auto Financing | 12.2 | ||||||
| Residential Mortgage-Backed Securities (European) | 6.8 | ||||||
| Insured Auto Financing | 6.8 | ||||||
| CMBS | 6.6 | ||||||
| Business Loans | 5.9 | ||||||
| Student Loans | 5.1 | ||||||
| Residential Mortgage-Backed Securities (Australian) | 4.0 | ||||||
| Insured Other | 2.0 | ||||||
| Equipment Leases | 1.9 | ||||||
| Investment Grade Corporate Collateralized Debt Obligations | 1.8 | ||||||
| U.S. Government Agency | 1.3 | ||||||
| Rate Reduction Bonds | 1.3 | ||||||
| Bank Loan Collateralized Debt Obligations | 1.2 | ||||||
| CMBS Collateralized Debt Obligations | 1.1 | ||||||
| Insurance Premiums | 0.9 | ||||||
| Insured Credit Cards | 0.8 | ||||||
| Insured High Yield Collateralized Debt Obligations | 0.7 | ||||||
| U.S. Government | 0.6 | ||||||
| Insured Time Share | 0.6 | ||||||
| Insured Residential Mortgage-Backed Securities (United States) | 0.5 | ||||||
| Airlines | 0.4 | ||||||
| Trade Receivables | 0.3 | ||||||
| Insured Residential Asset-Backed Securities (United States) | 0.3 | ||||||
| Time Share | 0.1 | ||||||
| Insured Transportation | 0.1 | ||||||
| Residential Mortgage-Backed Securities (United States) | 0.1 | ||||||
| Collateralized Loan Obligations | 0.0 | ||||||
| Insured Business Loans | 0.0 | ||||||
| ABS Collateralized Debt Obligations | 0.0 | ||||||
| 100.0 | % | ||||||
1
GMO Short-Duration Collateral Fund
(A Series of GMO Trust)
Schedule of Investments
(showing percentage of total net assets)
February 28, 2009
| Par Value ($) | Description | Value ($) | |||||||||||||
| DEBT OBLIGATIONS — 97.8% | |||||||||||||||
| Asset-Backed Securities — 95.9% | |||||||||||||||
| ABS Collateralized Debt Obligations — 0.0% | |||||||||||||||
| 11,200,000 | Paragon CDO Ltd., Series 04-1A, Class A, 144A, 3 mo. LIBOR + .65%, 1.79%, due 10/20/44 | 336,000 | |||||||||||||
| Airlines — 0.3% | |||||||||||||||
| 19,400,000 | Aircraft Finance Trust, Series 99-1A, Class A1, 144A, 1 mo. LIBOR + .48%, 0.94%, due 05/15/24 | 4,850,000 | |||||||||||||
| 8,830,479 | Continental Airlines, Inc., Series 99-1A, 6.55%, due 08/02/20 | 7,770,821 | |||||||||||||
| Total Airlines | 12,620,821 | ||||||||||||||
| Auto Financing — 11.9% | |||||||||||||||
| 39,800,000 | BMW Vehicle Lease Trust, Series 07-1, Class A3B, 1 mo. LIBOR + .24%, 0.70%, due 08/15/13 | 38,336,156 | |||||||||||||
| 11,800,000 | Capital Auto Receivable Asset Trust, Series 07-SN1, Class A4, 1 mo. LIBOR + .10%, 0.56%, due 02/15/11 | 9,117,860 | |||||||||||||
| 26,900,000 | Capital Auto Receivable Asset Trust, Series 07-2, Class A4B, 1 mo. LIBOR + .40%, 0.86%, due 02/18/14 | 22,098,350 | |||||||||||||
| 5,100,000 | Capital Auto Receivable Asset Trust, Series 08-1, Class A4B, 1 mo. LIBOR + 1.35%, 1.81%, due 07/15/14 | 3,907,875 | |||||||||||||
| 24,500,000 | Carmax Auto Owner Trust, Series 08-2, Class A4B, 1 mo. LIBOR + 1.65%, 2.11%, due 08/15/13 | 18,781,445 | |||||||||||||
| 22,600,000 | Daimler Chrysler Auto Trust, Series 08-B, Class A4A, 5.32%, due 11/10/14 | 15,865,200 | |||||||||||||
| 17,400,000 | Daimler Chrysler Auto Trust, Series 08-B, Class A4B, 1 mo. LIBOR + 1.85%, 2.30%, due 11/10/14 | 13,711,200 | |||||||||||||
| 26,400,000 | Daimler Chrysler Master Owner Trust, Series 06-A, Class A, 1 mo. LIBOR + .03%, 0.49%, due 11/15/11 | 17,160,000 | |||||||||||||
| 24,700,000 | Ford Credit Auto Owner Trust, Series 06-C, Class A4B, 1 mo. LIBOR + .04%, 0.50%, due 02/15/12 | 22,266,062 | |||||||||||||
| 13,700,000 | Ford Credit Auto Owner Trust, Series 07-B, Class A4B, 1 mo. LIBOR + .38%, 0.84%, due 07/15/12 | 10,279,110 | |||||||||||||
| 31,800,000 | Ford Credit Auto Owner Trust, Series 08-B, Class A4B, 1 mo. LIBOR + 2.00%, 2.46%, due 03/15/13 | 25,666,734 | |||||||||||||
| 61,400,000 | Ford Credit Floorplan Master Owner Trust, Series 06-4, Class A, 1 mo. LIBOR + .25%, 0.71%, due 06/15/13 | 36,840,000 | |||||||||||||
See accompanying notes to the financial statements.
2
GMO Short-Duration Collateral Fund
(A Series of GMO Trust)
Schedule of Investments — (Continued)
(showing percentage of total net assets)
February 28, 2009
| Par Value ($) | Description | Value ($) | |||||||||||||
| Auto Financing — continued | |||||||||||||||
| 8,500,000 | Franklin Auto Trust, Series 08-A, Class A4B, 1 mo. LIBOR + 1.95%, 2.42%, due 05/20/16 | 6,223,700 | |||||||||||||
| 30,300,000 | Nissan Auto Lease Trust, Series 08-A, Class A3B, 1 mo. LIBOR + 2.20%, 2.66%, due 07/15/11 | 27,885,469 | |||||||||||||
| 31,300,000 | Nissan Auto Receivables Owner Trust, Series 07-A, Class A4, 1 mo. LIBOR, 0.46%, due 06/17/13 | 29,688,676 | |||||||||||||
| 30,500,000 | Nissan Master Owner Trust Receivables, Series 07-A, Class A, 1 mo. LIBOR, 0.46%, due 05/15/12 | 24,705,000 | |||||||||||||
| 33,521,494 | Sovereign Dealer Floor Plan Master Trust, Series 06-1, Class A, 144A, 1 mo. LIBOR + .05%, 0.51%, due 08/15/11 | 30,169,344 | |||||||||||||
| 32,500,000 | Swift Master Auto Receivables Trust, Series 07-1, Class A, 1 mo. LIBOR + .10%, 0.56%, due 06/15/12 | 21,775,000 | |||||||||||||
| 17,100,000 | Swift Master Auto Receivables Trust, Series 07-2, Class A, 1 mo. LIBOR + .65%, 1.11%, due 10/15/12 | 11,200,500 | |||||||||||||
| 33,650,000 | Truck Retail Installment Paper Corp., Series 05-1A, Class A, 144A, 1 mo. LIBOR + .27%, 0.73%, due 12/15/16 | 23,555,000 | |||||||||||||
| 12,000,000 | Wachovia Auto Owner Trust, Series 08-A, Class A4B, 1 mo. LIBOR + 1.15%, 1.62%, due 03/20/14 | 10,866,956 | |||||||||||||
| 19,600,000 | World Omni Auto Receivables Trust, Series 07-A, Class A4, 1 mo. LIBOR, 0.46%, due 11/15/12 | 17,959,676 | |||||||||||||
| Total Auto Financing | 438,059,313 | ||||||||||||||
| Bank Loan Collateralized Debt Obligations — 1.2% | |||||||||||||||
| 19,391,149 | Arran Corp. Loans No. 1 B.V., Series 06-1A, Class A3, 144A, 3 mo. LIBOR + .17%, 1.70%, due 06/20/25 | 18,427,652 | |||||||||||||
| 27,200,000 | Omega Capital Europe Plc, Series GLOB-5A, Class A1, 144A, 3 mo. LIBOR + .25%, 1.68%, due 07/05/11 | 24,100,832 | |||||||||||||
| Total Bank Loan Collateralized Debt Obligations | 42,528,484 | ||||||||||||||
| Business Loans — 5.8% | |||||||||||||||
| 23,310,770 | ACAS Business Loan Trust, Series 07-1A, Class A, 144A, 3 mo. LIBOR + .14%, 1.38%, due 08/16/19 | 18,233,684 | |||||||||||||
| 3,637,011 | Bayview Commercial Asset Trust, Series 04-1, Class A, 144A, 1 mo. LIBOR + .36%, 0.83%, due 04/25/34 | 2,575,731 | |||||||||||||
| 2,639,390 | Bayview Commercial Asset Trust, Series 04-3, Class A1, 144A, 1 mo. LIBOR + .37%, 0.84%, due 01/25/35 | 1,838,599 | |||||||||||||
See accompanying notes to the financial statements.
3
GMO Short-Duration Collateral Fund
(A Series of GMO Trust)
Schedule of Investments — (Continued)
(showing percentage of total net assets)
February 28, 2009
| Par Value ($) | Description | Value ($) | |||||||||||||
| Business Loans — continued | |||||||||||||||
| 11,461,810 | Bayview Commercial Asset Trust, Series 05-4A, Class A2, 144A, 1 mo. LIBOR + .39%, 0.86%, due 01/25/36 | 7,326,389 | |||||||||||||
| 9,875,339 | Bayview Commercial Asset Trust, Series 07-3, Class A1, 144A, 1 mo. LIBOR + .24%, 0.71%, due 07/25/37 | 7,386,445 | |||||||||||||
| 31,700,000 | Bayview Commercial Asset Trust, Series 07-6A, Class A2, 144A, 1 mo. LIBOR + 1.30%, 1.77%, due 12/25/37 | 22,132,940 | |||||||||||||
| 5,227,163 | Capitalsource Commercial Loan Trust, Series 06-1A, Class A1, 144A, 1 mo. LIBOR + .12%, 0.59%, due 08/22/16 | 4,479,678 | |||||||||||||
| 9,244,882 | Capitalsource Commercial Loan Trust, Series 07-1A, Class A, 144A, 1 mo. LIBOR + .13%, 0.60%, due 03/20/17 | 7,397,755 | |||||||||||||
| 15,800,000 | CNH Wholesale Master Note Trust, Series 06-1A, Class A, 144A, 1 mo. LIBOR + .06%, 0.52%, due 07/15/12 | 14,581,055 | |||||||||||||
| 3,684,638 | GE Business Loan Trust, Series 04-1, Class A, 144A, 1 mo. LIBOR + .29%, 0.75%, due 05/15/32 | 2,626,338 | |||||||||||||
| 6,090,123 | GE Business Loan Trust, Series 05-2A, Class A, 144A, 1 mo. LIBOR + .24%, 0.70%, due 11/15/33 | 3,949,154 | |||||||||||||
| 28,700,000 | GE Dealer Floorplan Master Trust, Series 06-4, Class A, 1 mo. LIBOR + .01%, 0.48%, due 10/20/11 | 23,759,295 | |||||||||||||
| 41,500,000 | GE Dealer Floorplan Master Trust, Series 07-2, Class A, 1 mo. LIBOR + .01%, 0.48%, due 07/20/12 | 29,780,216 | |||||||||||||
| 9,071,074 | Lehman Brothers Small Balance Commercial, Series 05-1A, Class A, 144A, 1 mo. LIBOR + .25%, 0.72%, due 02/25/30 | 4,354,116 | |||||||||||||
| 5,885,679 | Lehman Brothers Small Balance Commercial, Series 05-2A, Class 1A, 144A, 1 mo. LIBOR + .25%, 0.72%, due 09/25/30 | 2,825,126 | |||||||||||||
| 6,745,058 | Lehman Brothers Small Balance Commercial, Series 07-3A, Class 1A1, 144A, 1 mo. LIBOR + .65%, 1.12%, due 10/25/37 | 5,261,145 | |||||||||||||
| 27,169,000 | Lehman Brothers Small Balance Commercial, Series 07-3A, Class 1A2, 144A, 1 mo. LIBOR + .85%, 1.32%, due 10/25/37 | 14,127,880 | |||||||||||||
| 27,400,000 | Navistar Financial Dealer Note Master Trust, Series 05-1, Class A, 1 mo. LIBOR + .11%, 0.58%, due 02/25/13 | 23,506,460 | |||||||||||||
| 20,700,000 | Textron Financial Floorplan Master Note, Series 07-AA, Class A, 144A, 1 mo. LIBOR + .06%, 0.51%, due 03/13/12 | 17,005,050 | |||||||||||||
| 677,872 | The Money Store Business Loan Backed Trust, Series 99-1, Class AN, 1 mo. LIBOR + .50%, 1.46%, due 09/15/17 | 583,104 | |||||||||||||
| Total Business Loans | 213,730,160 | ||||||||||||||
See accompanying notes to the financial statements.
4
GMO Short-Duration Collateral Fund
(A Series of GMO Trust)
Schedule of Investments — (Continued)
(showing percentage of total net assets)
February 28, 2009
| Par Value ($) | Description | Value ($) | |||||||||||||
| CMBS — 6.5% | |||||||||||||||
| 11,500,000 | Banc of America Commercial Mortgage, Inc., Series 06-3, Class A2, 5.81%, due 07/10/44 | 8,640,389 | |||||||||||||
| 6,099,483 | Bear Stearns Commercial Mortgage Securities, Inc., Series 05-PW10, Class A1, 5.09%, due 12/11/40 | 5,998,049 | |||||||||||||
| 19,100,000 | Citigroup/Deutsche Bank Commercial Mortgage, Series 05-CD1, Class A2FL, 1 mo. LIBOR + .12%, 0.58%, due 07/15/44 | 13,927,720 | |||||||||||||
| 32,600,000 | Commercial Mortgage Pass-Through Certificates, Series 06-FL12, Class AJ, 144A, 1 mo. LIBOR + .13%, 0.59%, due 12/15/20 | 24,088,140 | |||||||||||||
| 26,000,000 | GE Capital Commercial Mortgage Corp., Series 05-C4, Class A2, 5.31%, due 11/10/45 | 23,855,445 | |||||||||||||
| 16,950,000 | GE Capital Commercial Mortgage Corp., Series 06-C1, Class A2, 5.34%, due 03/10/44 | 14,845,716 | |||||||||||||
| 3,585,364 | Greenwich Capital Commercial Funding Corp., Series 06-FL4A, Class A1, 144A, 1 mo. LIBOR + .09%, 0.54%, due 11/05/21 | 2,973,611 | |||||||||||||
| 27,200,000 | GS Mortgage Securities Corp., Series 06-GG6, Class A2, 5.51%, due 04/10/38 | 23,910,500 | |||||||||||||
| 5,938,604 | GS Mortgage Securities Corp., Series 07-EOP, Class A1, 144A, 1 mo. LIBOR + .09%, 0.54%, due 03/06/20 | 4,693,279 | |||||||||||||
| 6,300,000 | GS Mortgage Securities Corp., Series 07-EOP, Class A2, 144A, 1 mo. LIBOR + .13%, 0.58%, due 03/06/20 | 4,699,170 | |||||||||||||
| 8,176,676 | J.P. Morgan Chase Commercial Mortgage Securities Corp., Series 06-FL1A, Class A1B, 144A, 1 mo. LIBOR + .12%, 0.58%, due 02/15/20 | 6,132,507 | |||||||||||||
| 43,200,000 | J.P. Morgan Chase Commercial Mortgage Securities Corp., Series 06-LDP7, Class A2, 5.86%, due 04/15/45 | 38,026,368 | |||||||||||||
| 3,566,740 | Lehman Brothers Floating Rate Commercial, Series 06-LLFA, Class A1, 144A, 1 mo. LIBOR + .08%, 0.54%, due 09/15/21 | 2,496,718 | |||||||||||||
| 27,200,000 | Merrill Lynch Mortgage Trust, Series 06-C1, Class A2, 5.61%, due 05/12/39 | 23,706,500 | |||||||||||||
| 10,300,000 | Morgan Stanley Capital I, Series 06-IQ11, Class A2, 5.69%, due 10/15/42 | 8,808,148 | |||||||||||||
| 11,000,000 | Morgan Stanley Capital I, Series 06-IQ11, Class A3, 5.74%, due 10/15/42 | 8,093,910 | |||||||||||||
| 4,780,589 | Morgan Stanley Dean Witter Capital I, Series 03-TOP9, Class A1, 3.98%, due 11/13/36 | 4,605,906 | |||||||||||||
| 26,263,095 | Wachovia Bank Commercial Mortgage Trust, Series 06-WL7A, Class A1, 144A, 1 mo. LIBOR + .09%, 0.55%, due 09/15/21 | 18,384,166 | |||||||||||||
| Total CMBS | 237,886,242 | ||||||||||||||
See accompanying notes to the financial statements.
5
GMO Short-Duration Collateral Fund
(A Series of GMO Trust)
Schedule of Investments — (Continued)
(showing percentage of total net assets)
February 28, 2009
| Par Value ($) | Description | Value ($) | |||||||||||||
| CMBS Collateralized Debt Obligations — 1.1% | |||||||||||||||
| 4,900,000 | American Capital Strategies Ltd. Commercial Real Estate CDO Trust, Series 07-1A, Class A, 144A, 3 mo. LIBOR + .80%, 2.05%, due 11/23/52 | 392,000 | |||||||||||||
| 11,493,770 | Crest Exeter Street Solar, Series 04-1A, Class A1, 144A, 3 mo. LIBOR + .35%, 1.82%, due 06/28/19 | 8,275,514 | |||||||||||||
| 14,282,368 | G-Force LLC, Series 05-RR2, Class A2, 144A, 5.16%, due 12/25/39 | 10,953,149 | |||||||||||||
| 24,600,000 | Guggenheim Structured Real Estate Funding, Series 05-2A, Class A, 144A, 1 mo. LIBOR + .32%, 0.79%, due 08/26/30 | 11,070,000 | |||||||||||||
| 27,100,000 | Marathon Real Estate CDO, Series 06-1A, Class A1, 144A, 1 mo. LIBOR + .33%, 0.80%, due 05/25/46 | 10,018,531 | |||||||||||||
| Total CMBS Collateralized Debt Obligations | 40,709,194 | ||||||||||||||
| Collateralized Loan Obligations — 0.0% | |||||||||||||||
| 871,428 | Archimedes Funding IV (Cayman) Ltd., Series 4A, Class A1, 144A, 3 mo. LIBOR + .48%, 1.73%, due 02/25/13 | 793,596 | |||||||||||||
| Credit Cards — 22.7% | |||||||||||||||
| 16,500,000 | Advanta Business Card Master Trust, Series 05-A2, Class A2, 1 mo. LIBOR + .13%, 0.60%, due 05/20/13 | 10,668,281 | |||||||||||||
| 5,900,000 | Advanta Business Card Master Trust, Series 05-A5, Class A5, 1 mo. LIBOR + .06%, 0.53%, due 04/20/12 | 5,655,681 | |||||||||||||
| 23,900,000 | Advanta Business Card Master Trust, Series 07-A4, Class A4, 1 mo. LIBOR + .03%, 0.50%, due 04/22/13 | 18,037,031 | |||||||||||||
| 51,000,000 | American Express Credit Account Master Trust, Series 05-5, Class A, 1 mo. LIBOR + .04%, 0.50%, due 02/15/13 | 48,462,240 | |||||||||||||
| 20,700,000 | American Express Credit Account Master Trust, Series 06-1, Class A, 1 mo. LIBOR + .03%, 0.49%, due 12/15/13 | 18,958,923 | |||||||||||||
| 10,300,000 | American Express Issuance Trust, Series 07-1, Class A, 1 mo. LIBOR + .20%, 0.66%, due 09/15/11 | 9,841,238 | |||||||||||||
| 4,300,000 | Bank of America Credit Card Trust, Series 06-A12, Class A12, 1 mo. LIBOR + .02%, 0.48%, due 03/15/14 | 3,845,920 | |||||||||||||
| 34,000,000 | Cabela's Master Credit Card Trust, Series 08-4A, Class A2, 144A, 1 mo. LIBOR + 3.00%, 3.46%, due 09/15/14 | 27,973,500 | |||||||||||||
| 12,700,000 | Capital One Multi-Asset Execution Trust, Series 04-A2, Class A2, 1 mo. LIBOR + .09%, 0.55%, due 01/17/12 | 12,689,840 | |||||||||||||
| 12,700,000 | Capital One Multi-Asset Execution Trust, Series 04-A3, Class A3, 1 mo. LIBOR + .10%, 0.56%, due 02/15/12 | 12,649,835 | |||||||||||||
See accompanying notes to the financial statements.
6
GMO Short-Duration Collateral Fund
(A Series of GMO Trust)
Schedule of Investments — (Continued)
(showing percentage of total net assets)
February 28, 2009
| Par Value ($) | Description | Value ($) | |||||||||||||
| Credit Cards — continued | |||||||||||||||
| 17,875,000 | Capital One Multi-Asset Execution Trust, Series 04-A7, Class A7, 3 mo. LIBOR + .15%, 1.38%, due 06/16/14 | 16,083,909 | |||||||||||||
| 341,000 | Capital One Multi-Asset Execution Trust, Series 06-A7, Class A7, 1 mo. LIBOR + .03%, 0.49%, due 03/17/14 | 307,190 | |||||||||||||
| 24,800,000 | Capital One Multi-Asset Execution Trust, Series 06-A14, Class A, 1 mo. LIBOR + .01%, 0.47%, due 08/15/13 | 23,051,600 | |||||||||||||
| 7,700,000 | Capital One Multi-Asset Execution Trust, Series 07-A4, Class A4, 1 mo. LIBOR + .03%, 0.49%, due 03/16/15 | 6,573,490 | |||||||||||||
| 16,800,000 | Capital One Multi-Asset Execution Trust, Series 07-A6, Class A6, 1 mo. LIBOR + .07%, 0.53%, due 05/15/13 | 15,909,264 | |||||||||||||
| 17,800,000 | Capital One Multi-Asset Execution Trust, Series 08-A6, Class A6, 1 mo. LIBOR + 1.10%, 1.56%, due 03/17/14 | 16,264,750 | |||||||||||||
| 39,000,000 | Charming Shoppes Master Trust, Series 07-1A, Class A1, 144A, 1 mo. LIBOR + 1.25%, 1.71%, due 09/15/17 | 26,835,510 | |||||||||||||
| 46,600,000 | Chase Issuance Trust, Series 05-A6, Class A6, 1 mo. LIBOR + 0.07%, 0.53%, due 07/15/14 | 41,270,125 | |||||||||||||
| 22,900,000 | Chase Issuance Trust, Series 06-A7, Class A, 1 mo. LIBOR + .01%, 0.47%, due 02/15/13 | 21,799,426 | |||||||||||||
| 4,000,000 | Chase Issuance Trust, Series 07-A1, Class A1, 1 mo. LIBOR + .02%, 0.48%, due 03/15/13 | 3,780,880 | |||||||||||||
| 13,400,000 | Chase Issuance Trust, Series 07-A11, Class A11, 1 mo. LIBOR, 0.46%, due 07/16/12 | 12,991,166 | |||||||||||||
| EUR | 33,200,000 | Citibank Credit Card Issuance Trust, Series 04-A2, Class A, 3 mo. EUR LIBOR + 0.10%, 1.97%, due 05/24/13 | 38,022,214 | ||||||||||||
| 11,500,000 | Citibank Credit Card Issuance Trust, Series 01-A7, Class A7, 3 mo. LIBOR + .14%, 1.37%, due 08/15/13 | 10,603,000 | |||||||||||||
| 8,100,000 | Citibank Credit Card Issuance Trust, Series 05-A3, Class A3, 1 mo. LIBOR + .07%, 0.54%, due 04/24/14 | 7,156,755 | |||||||||||||
| 40,750,000 | Citibank OMNI Master Trust, Series 07-A9A, Class A9, 144A, 1 mo. LIBOR + 1.10%, 1.57%, due 12/23/13 | 36,809,475 | |||||||||||||
| 10,600,000 | Discover Card Master Trust I, Series 96-4, Class A, 1 mo. LIBOR + .38%, 0.83%, due 10/16/13 | 9,508,200 | |||||||||||||
| 11,000,000 | Discover Card Master Trust I, Series 05-4, Class A1, 1 mo. LIBOR + .06%, 0.52%, due 06/18/13 | 9,845,000 | |||||||||||||
| 16,800,000 | Discover Card Master Trust I, Series 05-4, Class A2, 1 mo. LIBOR + .09%, 0.55%, due 06/16/15 | 12,500,250 | |||||||||||||
See accompanying notes to the financial statements.
7
GMO Short-Duration Collateral Fund
(A Series of GMO Trust)
Schedule of Investments — (Continued)
(showing percentage of total net assets)
February 28, 2009
| Par Value ($) | Description | Value ($) | |||||||||||||
| Credit Cards — continued | |||||||||||||||
| 52,700,000 | Discover Card Master Trust I, Series 06-2, Class A2, 1 mo. LIBOR + .03%, 0.49%, due 01/16/14 | 46,277,978 | |||||||||||||
| 4,100,000 | Discover Card Master Trust I, Series 07-1, Class A, 1 mo. LIBOR + .01%, 0.47%, due 08/15/12 | 3,874,500 | |||||||||||||
| 46,900,000 | First National Master Note Trust, Series 07-2, Class A, 1 mo. LIBOR + .75%, 1.21%, due 11/15/12 | 43,748,906 | |||||||||||||
| 20,100,000 | GE Capital Credit Card Master Note Trust, Series 05-1, Class A, 1 mo. LIBOR + .04%, 0.50%, due 03/15/13 | 18,602,148 | |||||||||||||
| 35,800,000 | GE Capital Credit Card Master Note Trust, Series 07-3, Class A1, 1 mo. LIBOR + .01%, 0.47%, due 06/15/13 | 32,667,500 | |||||||||||||
| 39,800,000 | Household Credit Card Master Note Trust I, Series 07-1, Class A, 1 mo. LIBOR + .05%, 0.51%, due 04/15/13 | 34,053,875 | |||||||||||||
| 17,800,000 | Household Credit Card Master Note Trust I, Series 07-2, Class A, 1 mo. LIBOR + .55%, 1.01%, due 07/15/13 | 14,829,625 | |||||||||||||
| 11,500,000 | MBNA Credit Card Master Note Trust, Series 04-A8, Class A8, 1 mo. LIBOR + .15%, 0.61%, due 01/15/14 | 10,525,835 | |||||||||||||
| 40,500,000 | National City Credit Card Master Trust, Series 08-3, Class A, 1 mo. LIBOR + 1.80%, 2.26%, due 05/15/13 | 31,792,500 | |||||||||||||
| 21,100,000 | Pillar Funding Plc, Series 04-2, Class A, 144A, 3 mo. LIBOR + .14%, 2.14%, due 09/15/11 | 20,025,588 | |||||||||||||
| 49,200,000 | Turquoise Card Backed Securities Plc, Series 06-1A, Class A, 144A, 1 mo. LIBOR + .01%, 0.46%, due 05/16/11 | 48,585,000 | |||||||||||||
| 44,600,000 | World Financial Network Credit Card Master Trust, Series 04-A, Class A, 1 mo. LIBOR + .18%, 0.64%, due 03/15/13 | 43,736,544 | |||||||||||||
| 10,900,000 | World Financial Network Credit Card Master Trust, Series 06-A, Class A, 144A, 1 mo. LIBOR + .13%, 0.59%, due 02/15/17 | 7,734,422 | |||||||||||||
| Total Credit Cards | 834,549,114 | ||||||||||||||
| Equipment Leases — 1.8% | |||||||||||||||
| 14,600,000 | CNH Equipment Trust, Series 08-A, Class A4B, 1 mo. LIBOR + 1.95%, 2.41%, due 08/15/14 | 13,067,000 | |||||||||||||
| 20,500,000 | CNH Equipment Trust, Series 07-B, Class A3B, 1 mo. LIBOR + .60%, 1.06%, due 10/17/11 | 19,964,130 | |||||||||||||
| 37,100,000 | GE Equipment Midticket LLC, Series 07-1, Class A3B, 1 mo. LIBOR + .25%, 0.71%, due 06/14/11 | 33,204,500 | |||||||||||||
| Total Equipment Leases | 66,235,630 | ||||||||||||||
See accompanying notes to the financial statements.
8
GMO Short-Duration Collateral Fund
(A Series of GMO Trust)
Schedule of Investments — (Continued)
(showing percentage of total net assets)
February 28, 2009
| Par Value ($) | Description | Value ($) | |||||||||||||
| Insurance Premiums — 0.9% | |||||||||||||||
| 33,000,000 | AICCO Premium Finance Master Trust, Series 07-AA, Class A, 144A, 1 mo. LIBOR + .05%, 0.51%, due 12/15/11 | 31,587,600 | |||||||||||||
| Insured Auto Financing — 6.6% | |||||||||||||||
| 8,500,000 | Aesop Funding II LLC, Series 05-1A, Class A3, 144A, MBIA, 1 mo. LIBOR + .12%, 0.59%, due 04/20/11 | 6,912,880 | |||||||||||||
| 23,300,000 | AmeriCredit Automobile Receivables Trust, Series 07-AX, Class A4, XL, 1 mo. LIBOR + .04%, 0.49%, due 10/06/13 | 15,617,990 | |||||||||||||
| 10,099,106 | AmeriCredit Automobile Receivables Trust, Series 05-BM, Class A4, MBIA, 1 mo. LIBOR + .08%, 0.53%, due 05/06/12 | 9,289,965 | |||||||||||||
| 17,000,000 | AmeriCredit Automobile Receivables Trust, Series 07-BF, Class A4, FSA, 1 mo. LIBOR + .05%, 0.50%, due 12/06/13 | 11,050,000 | |||||||||||||
| 9,790,848 | AmeriCredit Automobile Receivables Trust, Series 07-CM, Class A3B, MBIA, 1 mo. LIBOR + .03%, 0.48%, due 05/07/12 | 9,007,580 | |||||||||||||
| 13,500,000 | AmeriCredit Automobile Receivables Trust, Series 07-DF, Class A4B, FSA, 1 mo. LIBOR + .80%, 1.25%, due 06/06/14 | 7,366,815 | |||||||||||||
| 25,400,000 | AmeriCredit Prime Automobile Receivable Trust, Series 07-2M, Class A4B, MBIA, 1 mo. LIBOR + .50%, 0.95%, due 03/08/16 | 13,421,614 | |||||||||||||
| 12,350,000 | ARG Funding Corp., Series 05-2A, Class A3, 144A, AMBAC, 1 mo. LIBOR + .14%, 0.61%, due 05/20/10 | 11,814,504 | |||||||||||||
| 27,646,995 | Capital One Auto Finance Trust, Series 06-A, Class A4, AMBAC, 1 mo. LIBOR + .01%, 0.47%, due 12/15/12 | 25,056,472 | |||||||||||||
| 23,900,000 | Capital One Auto Finance Trust, Series 06-B, Class A4, MBIA, 1 mo. LIBOR + .02%, 0.47%, due 07/15/13 | 19,060,489 | |||||||||||||
| 6,800,000 | Capital One Auto Finance Trust, Series 07-A, Class A4, AMBAC, 1 mo. LIBOR + .02%, 0.48%, due 11/15/13 | 4,762,244 | |||||||||||||
| 22,301,754 | Capital One Auto Finance Trust, Series 07-C, Class A3B, FGIC, 1 mo. LIBOR + .51%, 0.97%, due 04/16/12 | 20,757,804 | |||||||||||||
| 1,600,000 | Hertz Vehicle Financing LLC, Series 05-2A, Class A3, 144A, AMBAC, 1 mo. LIBOR + .20%, 0.67%, due 02/25/11 | 1,225,760 | |||||||||||||
| 7,900,000 | Hertz Vehicle Financing LLC, Series 05-2A, Class A5, 144A, AMBAC, 1 mo. LIBOR + .25%, 0.72%, due 11/25/11 | 4,682,251 | |||||||||||||
| 40,800,000 | Santander Drive Auto Receivables Trust, Series 07-1, Class A4, FGIC, 1 mo. LIBOR + .05%, 0.51%, due 09/15/14 | 27,773,438 | |||||||||||||
| 23,200,000 | Santander Drive Auto Receivables Trust, Series 07-3, Class A4B, FGIC, 1 mo. LIBOR + .65%, 1.11%, due 10/15/14 | 15,799,896 | |||||||||||||
See accompanying notes to the financial statements.
9
GMO Short-Duration Collateral Fund
(A Series of GMO Trust)
Schedule of Investments — (Continued)
(showing percentage of total net assets)
February 28, 2009
| Par Value ($) | Description | Value ($) | |||||||||||||
| Insured Auto Financing — continued | |||||||||||||||
| 51,300,000 | Triad Auto Receivables Owner Trust, Series 07-B, Class A4B, FSA, 1 mo. LIBOR + 1.20%, 1.65%, due 07/14/14 | 36,212,670 | |||||||||||||
| 5,111,505 | UPFC Auto Receivables Trust, Series 06-B, Class A3, AMBAC, 5.01%, due 08/15/12 | 4,677,027 | |||||||||||||
| Total Insured Auto Financing | 244,489,399 | ||||||||||||||
| Insured Business Loans — 0.0% | |||||||||||||||
| 3,053,250 | CNL Commercial Mortgage Loan Trust, Series 03-2A, Class A1, 144A, AMBAC, 1 mo. LIBOR + .44%, 0.91%, due 10/25/30 | 610,650 | |||||||||||||
| Insured Credit Cards — 0.8% | |||||||||||||||
| 28,400,000 | Cabela's Master Credit Card Trust, Series 04-2A, Class A, 144A, AMBAC, 1 mo. LIBOR + .12%, 0.58%, due 03/15/11 | 28,362,718 | |||||||||||||
| Insured High Yield Collateralized Debt Obligations — 0.7% | |||||||||||||||
| 20,073,077 | Augusta Funding Ltd., Series 10A, Class F-1, 144A, CapMAC, 3mo. LIBOR +.25%, 1.71%, due 06/30/17 | 16,688,756 | |||||||||||||
| 5,143,085 | GSC Partners CDO Fund Ltd., Series 2A, Class A, 144A, FSA, 6 mo. LIBOR + .52%, 3.06%, due 05/22/13 | 3,666,494 | |||||||||||||
| 7,800,000 | GSC Partners CDO Fund Ltd., Series 03-4A, Class A3, 144A, AMBAC, 3 mo. LIBOR + .46%, 1.60%, due 12/16/15 | 6,240,000 | |||||||||||||
| Total Insured High Yield Collateralized Debt Obligations | 26,595,250 | ||||||||||||||
| Insured Other — 2.0% | |||||||||||||||
| 24,700,000 | DB Master Finance LLC, Series 06-1, Class A2, 144A, AMBAC, 5.78%, due 06/20/31 | 17,290,000 | |||||||||||||
| 46,000,000 | Dominos Pizza Master Issuer LLC, Series 07-1, Class A2, 144A, MBIA, 5.26%, due 04/25/37 | 23,000,000 | |||||||||||||
| 13,300,886 | Henderson Receivables LLC, Series 06-3A, Class A1, 144A, MBIA, 1 mo. LIBOR + .20%, 0.66%, due 09/15/41 | 8,361,602 | |||||||||||||
| 12,904,246 | Henderson Receivables LLC, Series 06-4A, Class A1, 144A, MBIA, 1 mo. LIBOR + .20%, 0.66%, due 12/15/41 | 8,220,908 | |||||||||||||
| 19,556,614 | TIB Card Receivables Fund, 144A, FGIC, 3 mo. LIBOR + .25%, 1.68%, due 01/05/14 | 12,398,893 | |||||||||||||
| 2,988,000 | Toll Road Investment Part II, Series B, 144A, MBIA, Zero Coupon, due 02/15/30 | 541,964 | |||||||||||||
See accompanying notes to the financial statements.
10
GMO Short-Duration Collateral Fund
(A Series of GMO Trust)
Schedule of Investments — (Continued)
(showing percentage of total net assets)
February 28, 2009
| Par Value ($) | Description | Value ($) | |||||||||||||
| Insured Other — continued | |||||||||||||||
| 26,300,000 | Toll Road Investment Part II, Series C, 144A, MBIA, Zero Coupon, due 02/15/37 | 2,696,539 | |||||||||||||
| Total Insured Other | 72,509,906 | ||||||||||||||
| Insured Residential Asset-Backed Securities (United States) — 0.3% | |||||||||||||||
| 3,241,384 | Ameriquest Mortgage Securities, Inc., Series 04-R6, Class A1, XL, 1 mo. LIBOR + .21%, 0.68%, due 07/25/34 | 1,847,589 | |||||||||||||
| 3,840,806 | Citigroup Mortgage Loan Trust, Inc., Series 03-HE3, Class A, AMBAC, 1 mo. LIBOR + .38%, 0.85%, due 12/25/33 | 2,189,260 | |||||||||||||
| 993,052 | Quest Trust, Series 04-X1, Class A, 144A, AMBAC, 1 mo. LIBOR + .33%, 0.80%, due 03/25/34 | 631,581 | |||||||||||||
| 29,335,944 | Residential Asset Mortgage Products, Inc., Series 05-RS9, Class AI3, FGIC, 1 mo. LIBOR + .22%, 0.69%, due 11/25/35 | 6,776,603 | |||||||||||||
| Total Insured Residential Asset-Backed Securities (United States) | 11,445,033 | ||||||||||||||
| Insured Residential Mortgage-Backed Securities (United States) — 0.5% | |||||||||||||||
| 630,188 | Chevy Chase Mortgage Funding Corp., Series 03-4A, Class A1, 144A, AMBAC, 1 mo. LIBOR + .34%, 0.81%, due 10/25/34 | 302,490 | |||||||||||||
| 1,198,856 | Chevy Chase Mortgage Funding Corp., Series 04-1A, Class A2, 144A, AMBAC, 1 mo. LIBOR + .33%, 0.80%, due 01/25/35 | 491,531 | |||||||||||||
| 18,685,870 | Countrywide Home Equity Loan Trust, Series 07-E, Class A, MBIA, 1 mo. LIBOR + .15%, 0.61%, due 06/15/37 | 4,671,467 | |||||||||||||
| 8,100,000 | GMAC Mortgage Corp. Loan Trust, Series 04-HE3, Class A3, FSA, 1 mo. LIBOR + .23%, 0.70%, due 10/25/34 | 7,290,000 | |||||||||||||
| 619,001 | GreenPoint Home Equity Loan Trust, Series 04-1, Class A, AMBAC, 1 mo. LIBOR + .23%, 0.93%, due 07/25/29 | 338,559 | |||||||||||||
| 601,336 | GreenPoint Home Equity Loan Trust, Series 04-4, Class A, AMBAC, 1 mo. LIBOR + .28%, 1.02%, due 08/15/30 | 263,778 | |||||||||||||
| 1,462,829 | Lehman ABS Corp., Series 04-2, Class A, AMBAC, 1 mo. LIBOR + .22%, 0.91%, due 06/25/34 | 351,079 | |||||||||||||
| 311,765 | Residential Funding Mortgage Securities II, Series 03-HS1, Class AII, FGIC, 1 mo. LIBOR + .29%, 0.76%, due 12/25/32 | 151,477 | |||||||||||||
| 5,149,544 | SBI Heloc Trust, Series 05-HE1, Class 1A, 144A, FSA, 1 mo. LIBOR + .19%, 0.66%, due 11/25/35 | 2,574,772 | |||||||||||||
| 2,366,819 | Wachovia Asset Securitization, Inc., Series 02-HE1, Class A, AMBAC, 1 mo. LIBOR + .37%, 0.84%, due 09/27/32 | 1,356,558 | |||||||||||||
See accompanying notes to the financial statements.
11
GMO Short-Duration Collateral Fund
(A Series of GMO Trust)
Schedule of Investments — (Continued)
(showing percentage of total net assets)
February 28, 2009
| Par Value ($) | Description | Value ($) | |||||||||||||
| Insured Residential Mortgage-Backed Securities (United States) — continued | |||||||||||||||
| 1,966,222 | Wachovia Asset Securitization, Inc., Series 04-HE1, Class A, MBIA, 1 mo. LIBOR + .22%, 0.69%, due 06/25/34 | 767,868 | |||||||||||||
| Total Insured Residential Mortgage-Backed Securities (United States) | 18,559,579 | ||||||||||||||
| Insured Time Share — 0.5% | |||||||||||||||
| 1,213,775 | Cendant Timeshare Receivables Funding LLC, Series 04-1A, Class A2, 144A, MBIA, 1 mo. LIBOR + .18%, 0.65%, due 05/20/16 | 978,649 | |||||||||||||
| 2,937,072 | Cendant Timeshare Receivables Funding LLC, Series 05-1A, Class A2, 144A, FGIC, 1 mo. LIBOR + .18%, 0.65%, due 05/20/17 | 2,113,774 | |||||||||||||
| 4,681,214 | Sierra Receivables Funding Co., Series 06-1A, Class A2, 144A, MBIA, 1 mo. LIBOR + .15%, 0.62%, due 05/20/18 | 3,546,961 | |||||||||||||
| 4,886,706 | Sierra Receivables Funding Co., Series 07-1A, Class A2, 144A, FGIC, 1 mo. LIBOR + .15%, 0.92%, due 03/20/19 | 3,419,167 | |||||||||||||
| 15,862,214 | Sierra Receivables Funding Co., Series 07-2A, Class A2, 144A, MBIA, 1 mo. LIBOR + 1.00%, 1.47%, due 09/20/19 | 9,727,582 | |||||||||||||
| Total Insured Time Share | 19,786,133 | ||||||||||||||
| Insured Transportation — 0.1% | |||||||||||||||
| 6,665,000 | GE Seaco Finance SRL, Series 04-1A, Class A, 144A, AMBAC, 1 mo. LIBOR + .30%, 0.76%, due 04/17/19 | 3,599,100 | |||||||||||||
| Investment Grade Corporate Collateralized Debt Obligations — 1.8% | |||||||||||||||
| 15,500,000 | Counts Trust, Series 04-2, 144A, 3 mo. LIBOR + .95%, 2.48%, due 09/20/09 | 14,892,710 | |||||||||||||
| 5,000,000 | Morgan Stanley ACES SPC, Series 04-12, Class I, 144A, 3 mo. LIBOR + .80%, 2.03%, due 08/05/09 | 3,142,500 | |||||||||||||
| 6,900,000 | Morgan Stanley ACES SPC, Series 04-12, Class A, 144A, 3 mo. LIBOR + .60%, 1.83%, due 08/05/09 | 5,030,100 | |||||||||||||
| 4,000,000 | Morgan Stanley ACES SPC, Series 04-15, Class I, 144A, 3 mo. LIBOR + .45%, 1.98%, due 12/20/09 | 2,754,000 | |||||||||||||
| 6,000,000 | Morgan Stanley ACES SPC, Series 04-15, Class II, 144A, 3 mo. LIBOR + .65%, 2.18%, due 12/20/09 | 3,321,000 | |||||||||||||
| 2,000,000 | Morgan Stanley ACES SPC, Series 04-15, Class III, 144A, 3 mo. LIBOR + .75%, 2.04%, due 12/20/09 | 920,000 | |||||||||||||
| 10,100,000 | Morgan Stanley ACES SPC, Series 05-2A, Class A, 144A, 3 mo. LIBOR + .45%, 1.98%, due 03/20/10 | 4,923,750 | |||||||||||||
See accompanying notes to the financial statements.
12
GMO Short-Duration Collateral Fund
(A Series of GMO Trust)
Schedule of Investments — (Continued)
(showing percentage of total net assets)
February 28, 2009
| Par Value ($) | Description | Value ($) | |||||||||||||
| Investment Grade Corporate Collateralized Debt Obligations — continued | |||||||||||||||
| 12,000,000 | Morgan Stanley ACES SPC, Series 05-10, Class A1, 144A, 3 mo. LIBOR + .52%, 2.05%, due 03/20/10 | 4,656,000 | |||||||||||||
| 22,300,000 | Morgan Stanley ACES SPC, Series 05-15, Class A, 144A, 3 mo. LIBOR + .40%, 1.93%, due 12/20/10 | 8,998,050 | |||||||||||||
| 34,200,000 | Morgan Stanley ACES SPC, Series 06-13A, Class A, 144A, 3 mo. LIBOR + .29%, 1.82%, due 06/20/13 | 5,762,700 | |||||||||||||
| 9,400,000 | Prism Orso Trust, Series 04-MAPL, Class CERT, 144A, 3 mo. LIBOR + .70%, 2.23%, due 08/01/11 | 5,383,380 | |||||||||||||
| 22,900,000 | Salisbury International Investments Ltd., 3 mo. LIBOR + .42%, 1.95%, due 06/22/10 | 5,560,120 | |||||||||||||
| Total Investment Grade Corporate Collateralized Debt Obligations | 65,344,310 | ||||||||||||||
| Rate Reduction Bonds — 1.3% | |||||||||||||||
| 17,363,975 | Massachusetts RRB Special Purpose Trust, Series 05-1, Class A3, 4.13%, due 09/15/13 | 17,562,793 | |||||||||||||
| 24,900,000 | PG&E Energy Recovery Funding LLC, Series 05-1, Class A4, 4.37%, due 06/25/14 | 24,651,000 | |||||||||||||
| 2,806,086 | PG&E Energy Recovery Funding LLC, Series 05-2, Class A1, 4.85%, due 06/25/11 | 2,811,698 | |||||||||||||
| 1,420,076 | PSE&G Transition Funding LLC, Series 01-1, Class A4, 3 mo. LIBOR + .30%, 2.30%, due 06/15/11 | 1,414,253 | |||||||||||||
| Total Rate Reduction Bonds | 46,439,744 | ||||||||||||||
| Residential Asset-Backed Securities (United States) — 13.1% | |||||||||||||||
| 977,554 | Accredited Mortgage Loan Trust, Series 04-4, Class A1B, 1 mo. LIBOR + .39%, 0.86%, due 01/25/35 | 426,458 | |||||||||||||
| 2,528,620 | Accredited Mortgage Loan Trust, Series 07-1, Class A1, 1 mo. LIBOR + .05%, 0.52%, due 02/25/37 | 2,250,472 | |||||||||||||
| 18,600,000 | ACE Securities Corp., Series 06-CW1, Class A2B, 1 mo. LIBOR + .10%, 0.57%, due 07/25/36 | 7,919,508 | |||||||||||||
| 10,325,062 | ACE Securities Corp., Series 06-HE3, Class A2B, 1 mo. LIBOR + .09%, 0.56%, due 06/25/36 | 6,889,191 | |||||||||||||
| 14,200,183 | ACE Securities Corp., Series 06-ASP4, Class A2B, 1 mo. LIBOR + .10%, 0.57%, due 08/25/36 | 7,100,091 | |||||||||||||
| 6,372,603 | ACE Securities Corp., Series 05-ASP1, Class A2C, 1 mo. LIBOR + .27%, 0.74%, due 09/25/35 | 3,887,288 | |||||||||||||
See accompanying notes to the financial statements.
13
GMO Short-Duration Collateral Fund
(A Series of GMO Trust)
Schedule of Investments — (Continued)
(showing percentage of total net assets)
February 28, 2009
| Par Value ($) | Description | Value ($) | |||||||||||||
| Residential Asset-Backed Securities (United States) — continued | |||||||||||||||
| 4,586,560 | ACE Securities Corp., Series 06-SL1, Class A, 1 mo. LIBOR + .16%, 0.63%, due 09/25/35 | 515,484 | |||||||||||||
| 8,292,262 | ACE Securities Corp., Series 06-ASP1, Class A2B, 1 mo. LIBOR + .15%, 0.62%, due 12/25/35 | 4,998,741 | |||||||||||||
| 11,045,740 | ACE Securities Corp., Series 06-ASP2, Class A2B, 1 mo. LIBOR + .14%, 0.61%, due 03/25/36 | 7,430,800 | |||||||||||||
| 8,500,000 | ACE Securities Corp., Series 06-ASP2, Class A2C, 1 mo. LIBOR + .18%, 0.65%, due 03/25/36 | 3,051,160 | |||||||||||||
| 5,900,000 | ACE Securities Corp., Series 06-HE2, Class A2C, 1 mo. LIBOR + .16%, 0.63%, due 05/25/36 | 2,173,029 | |||||||||||||
| 20,300,000 | ACE Securities Corp., Series 06-ASP5, Class A2C, 1 mo. LIBOR + .18%, 0.65%, due 10/25/36 | 4,872,000 | |||||||||||||
| 9,064,010 | ACE Securities Corp., Series 06-SL3, Class A1, 1 mo. LIBOR + .10%, 0.57%, due 06/25/36 | 634,481 | |||||||||||||
| 11,036,000 | ACE Securities Corp., Series 06-SL3, Class A2, 1 mo. LIBOR + .17%, 0.64%, due 06/25/36 | 416,388 | |||||||||||||
| 7,829,940 | ACE Securities Corp., Series 07-WM1, Class A2A, 1 mo. LIBOR + .07%, 0.54%, due 11/25/36 | 4,093,571 | |||||||||||||
| 3,438,704 | ACE Securities Corp., Series 06-ASL1, Class A, 1 mo. LIBOR + .14%, 0.61%, due 02/25/36 | 549,780 | |||||||||||||
| 11,100,000 | ACE Securities Corp., Series 06-OP1, Class A2C, 1 mo. LIBOR + .15%, 0.62%, due 04/25/36 | 4,088,241 | |||||||||||||
| 14,915,204 | ACE Securities Corp., Series 07-HE1, Class A2A, 1 mo. LIBOR + .09%, 0.56%, due 01/25/37 | 9,010,424 | |||||||||||||
| 12,567,272 | Alliance Bancorp Trust, Series 07-S1, Class A1, 144A, 1 mo. LIBOR + .20%, 0.67%, due 05/25/37 | 1,612,884 | |||||||||||||
| 3,448,275 | Argent Securities, Inc., Series 04-W8, Class A5, 1 mo. LIBOR + .52%, 0.99%, due 05/25/34 | 498,922 | |||||||||||||
| 15,724,082 | Argent Securities, Inc., Series 06-W2, Class A2B, 1 mo. LIBOR + .19%, 0.66%, due 03/25/36 | 7,862,041 | |||||||||||||
| 1,347,003 | Argent Securities, Inc., Series 06-W4, Class A2B, 1 mo. LIBOR + .11%, 0.58%, due 05/25/36 | 1,077,602 | |||||||||||||
| 58,867,000 | Argent Securities, Inc., Series 06-M1, Class A2C, 1 mo. LIBOR + .15%, 0.62%, due 07/25/36 | 14,827,126 | |||||||||||||
| 10,000,000 | Argent Securities, Inc., Series 06-W5, Class A2C, 1 mo. LIBOR + .15%, 0.62%, due 06/25/36 | 6,775,000 | |||||||||||||
See accompanying notes to the financial statements.
14
GMO Short-Duration Collateral Fund
(A Series of GMO Trust)
Schedule of Investments — (Continued)
(showing percentage of total net assets)
February 28, 2009
| Par Value ($) | Description | Value ($) | |||||||||||||
| Residential Asset-Backed Securities (United States) — continued | |||||||||||||||
| 15,000,000 | Argent Securities, Inc., Series 06-M2, Class A2B, 1 mo. LIBOR + .11%, 0.58%, due 09/25/36 | 6,150,000 | |||||||||||||
| 1,546,844 | Asset Backed Funding Certificates, Series 06-OPT3, Class A3A, 1 mo. LIBOR + .06%, 0.53%, due 11/25/36 | 1,430,057 | |||||||||||||
| 14,800,000 | Asset Backed Funding Certificates, Series 06-OPT2, Class A3B, 1 mo. LIBOR + .11%, 0.58%, due 10/25/36 | 12,920,400 | |||||||||||||
| 10,300,000 | Asset Backed Funding Certificates, Series 06-OPT2, Class A3C, 1 mo. LIBOR + .15%, 0.62%, due 10/25/36 | 4,853,360 | |||||||||||||
| 33,848,809 | Asset Backed Funding Certificates, Series 07-NC1, Class A1, 144A, 1 mo. LIBOR + .22%, 0.69%, due 05/25/37 | 22,800,558 | |||||||||||||
| 6,358,250 | Bayview Financial Acquisition Trust, Series 04-B, Class A1, 144A, 1 mo. LIBOR + .50%, 1.50%, due 05/28/39 | 4,240,953 | |||||||||||||
| 6,272,904 | Bayview Financial Acquisition Trust, Series 04-B, Class A2, 144A, 1 mo. LIBOR + .65%, 1.80%, due 05/28/39 | 4,186,536 | |||||||||||||
| 12,800,000 | Bayview Financial Acquisition Trust, Series 05-A, Class A1, 144A, 1 mo. LIBOR + .50%, 1.50%, due 02/28/40 | 7,052,000 | |||||||||||||
| 5,020,208 | Bear Stearns Asset Backed Securities, Inc., Series 07-AQ1, Class A1, 1 mo. LIBOR + .11%, 0.58%, due 11/25/36 | 3,263,135 | |||||||||||||
| 8,500,000 | Bear Stearns Asset Backed Securities, Inc., Series 07-AQ1, Class A2, 1 mo. LIBOR + .20%, 0.67%, due 11/25/36 | 1,700,000 | |||||||||||||
| 8,218,355 | Bear Stearns Mortgage Funding Trust, Series 07-SL2, Class 1A, 1 mo. LIBOR + .16%, 0.63%, due 02/25/37 | 616,377 | |||||||||||||
| 5,195,526 | Carrington Mortgage Loan Trust, Series 07-FRE1, Class A1, 1 mo. LIBOR + .12%, 0.59%, due 02/25/35 | 4,338,264 | |||||||||||||
| 38,600,000 | Carrington Mortgage Loan Trust, Series 07-FRE1, Class A2, 1 mo. LIBOR + .20%, 0.67%, due 02/25/36 | 18,335,000 | |||||||||||||
| 14,216,398 | Carrington Mortgage Loan Trust, Series 06-NC1, Class A2, 1 mo. LIBOR + .16%, 0.63%, due 01/25/36 | 12,709,460 | |||||||||||||
| 12,800,000 | Centex Home Equity, Series 06-A, Class AV3, 1 mo. LIBOR + .16%, 0.63%, due 06/25/36 | 8,706,560 | |||||||||||||
| 322,893 | Chase Funding Mortgage Loan Trust, Series 03-3, Class 2A2, 1 mo. LIBOR + .27%, 1.01%, due 04/25/33 | 232,483 | |||||||||||||
| 178,309 | Citigroup Mortgage Loan Trust, Inc., Series 04-OPT1, Class A1B, 1 mo. LIBOR + .41%, 0.88%, due 10/25/34 | 68,863 | |||||||||||||
| 12,500,000 | Citigroup Mortgage Loan Trust, Inc., Series 06-HE3, Class A2C, 1 mo. LIBOR + .16%, 0.63%, due 12/25/36 | 3,250,000 | |||||||||||||
See accompanying notes to the financial statements.
15
GMO Short-Duration Collateral Fund
(A Series of GMO Trust)
Schedule of Investments — (Continued)
(showing percentage of total net assets)
February 28, 2009
| Par Value ($) | Description | Value ($) | |||||||||||||
| Residential Asset-Backed Securities (United States) — continued | |||||||||||||||
| 36,200,000 | Countrywide Asset-Backed Certificates, Series 06-BC3, Class 2A2, 1 mo. LIBOR + .14%, 0.61%, due 02/25/37 | 22,849,440 | |||||||||||||
| 9,847,464 | Countrywide Asset-Backed Certificates, Series 06-BC5, Class 2A1, 1 mo. LIBOR + .08%, 0.55%, due 03/25/37 | 9,030,124 | |||||||||||||
| 5,788,659 | Credit-Based Asset Servicing & Securitization, Series 06-RP1, Class A1, 144A, 1 mo. LIBOR + .11%, 0.58%, due 04/25/36 | 4,881,467 | |||||||||||||
| 429,511 | Equity One ABS, Inc., Series 04-1, Class AV2, 1 mo. LIBOR + .30%, 0.77%, due 04/25/34 | 76,507 | |||||||||||||
| 14,400,000 | First Franklin Mortgage Loan Asset Backed Certificates, Series 06-FF5, Class 2A3, 1 mo. LIBOR + .16%, 0.63%, due 04/25/36 | 5,706,000 | |||||||||||||
| 4,488,746 | First Franklin Mortgage Loan Asset Backed Certificates, Series 06-FF18, Class A2A, 1 mo. LIBOR + .07%, 0.54%, due 12/25/37 | 4,196,978 | |||||||||||||
| 4,971,476 | Fremont Home Loan Trust, Series 06-B, Class 2A2, 1 mo. LIBOR + .10%, 0.57%, due 08/25/36 | 4,405,970 | |||||||||||||
| 19,925,000 | Fremont Home Loan Trust, Series 06-B, Class 2A3, 1 mo. LIBOR + .16%, 0.63%, due 08/25/36 | 6,376,000 | |||||||||||||
| 5,184,903 | Fremont Home Loan Trust, Series 06-A, Class 1A2, 1 mo. LIBOR + .20%, 0.67%, due 05/25/36 | 3,345,883 | |||||||||||||
| 15,000,000 | GE-WMC Mortgage Securities, Series 06-1, Class A2B, 1 mo. LIBOR + .15%, 0.62%, due 08/25/36 | 1,875,000 | |||||||||||||
| 3,461,573 | GE-WMC Mortgage Securities, Series 05-2, Class A2B, 1 mo. LIBOR + .17%, 0.64%, due 12/25/35 | 2,942,337 | |||||||||||||
| 3,378,162 | Household Home Equity Loan Trust, Series 05-3, Class A2, 1 mo. LIBOR + .29%, 0.76%, due 01/20/35 | 2,099,211 | |||||||||||||
| 12,890,843 | Household Home Equity Loan Trust, Series 06-1, Class A1, 1 mo. LIBOR + .16%, 0.63%, due 01/20/36 | 8,501,914 | |||||||||||||
| 3,876,277 | Household Home Equity Loan Trust, Series 05-2, Class A2, 1 mo. LIBOR + .31%, 0.78%, due 01/20/35 | 2,381,487 | |||||||||||||
| 29,400,000 | J.P. Morgan Mortgage Acquisition Corp., Series 06-WMC4, Class A3, 1 mo. LIBOR + .12%, 0.59%, due 12/25/36 | 9,996,000 | |||||||||||||
| 11,300,000 | Master Asset-Backed Securities Trust, Series 06-HE2, Class A3, 1 mo. LIBOR + .15%, 0.62%, due 06/25/36 | 2,994,500 | |||||||||||||
| 9,097,550 | Master Asset-Backed Securities Trust, Series 06-AM3, Class A2, 1 mo. LIBOR + .13%, 0.60%, due 10/25/36 | 7,914,869 | |||||||||||||
| 23,290,000 | Master Asset-Backed Securities Trust, Series 06-HE3, Class A3, 1 mo. LIBOR + .15%, 0.62%, due 08/25/36 | 5,822,500 | |||||||||||||
See accompanying notes to the financial statements.
16
GMO Short-Duration Collateral Fund
(A Series of GMO Trust)
Schedule of Investments — (Continued)
(showing percentage of total net assets)
February 28, 2009
| Par Value ($) | Description | Value ($) | |||||||||||||
| Residential Asset-Backed Securities (United States) — continued | |||||||||||||||
| 14,400,000 | Master Asset-Backed Securities Trust, Series 06-NC3, Class A4, 1 mo. LIBOR + .16%, 0.63%, due 10/25/36 | 3,816,000 | |||||||||||||
| 20,910,000 | Master Asset-Backed Securities Trust, Series 06-FRE2, Class A4, 1 mo. LIBOR + .15%, 0.62%, due 03/25/36 | 8,364,000 | |||||||||||||
| 5,334,581 | Master Asset-Backed Securities Trust, Series 05-FRE1, Class A4, 1 mo. LIBOR + .25%, 0.72%, due 10/25/35 | 4,134,300 | |||||||||||||
| 11,484,179 | Master Asset-Backed Securities Trust, Series 06-WMC1, Class A2, 1 mo. LIBOR + .11%, 0.58%, due 02/25/36 | 10,680,286 | |||||||||||||
| 6,795,535 | Master Second Lien Trust, Series 06-1, Class A, 1 mo. LIBOR + .16%, 0.63%, due 03/25/36 | 747,509 | |||||||||||||
| 14,339,684 | Merrill Lynch Mortgage Investors, Series 07-HE2, Class A2A, 1 mo. LIBOR + .12%, 0.59%, due 02/25/37 | 11,223,044 | |||||||||||||
| 3,817,579 | Morgan Stanley Capital, Inc., Series 04-SD1, Class A, 1 mo. LIBOR + .40%, 0.87%, due 08/25/34 | 2,557,778 | |||||||||||||
| 32,500,000 | Morgan Stanley Capital, Inc., Series 07-HE4, Class A2C, 1 mo. LIBOR + .23%, 0.70%, due 02/25/37 | 9,100,000 | |||||||||||||
| 23,400,000 | Morgan Stanley Home Equity Loans, Series 06-3, Class A3, 1 mo. LIBOR + .16%, 0.63%, due 04/25/36 | 8,190,000 | |||||||||||||
| 11,207,575 | Morgan Stanley Home Equity Loans, Series 07-2, Class A1, 1 mo. LIBOR + .10%, 0.57%, due 04/25/37 | 8,853,984 | |||||||||||||
| 9,500,000 | Morgan Stanley IXIS Real Estate Capital Trust, Series 06-2, Class A3, 1 mo. LIBOR + .15%, 0.62%, due 11/25/36 | 3,325,000 | |||||||||||||
| 7,212,121 | Nomura Home Equity Loan, Inc., Series 06-FM1, Class 2A2, 1 mo. LIBOR + .16%, 0.63%, due 11/25/35 | 6,563,030 | |||||||||||||
| 9,942,828 | People's Choice Home Loan Securities Trust, Series 05-4, Class 1A2, 1 mo. LIBOR + .26%, 0.73%, due 12/25/35 | 7,457,121 | |||||||||||||
| 13,375,832 | RAAC Series Trust, Series 06-SP1, Class A2, 1 mo. LIBOR + .19%, 0.66%, due 09/25/45 | 10,883,016 | |||||||||||||
| 3,644,950 | Residential Asset Mortgage Products, Inc., Series 06-RZ4, Class A1, 1 mo. LIBOR + .09%, 0.56%, due 10/25/36 | 3,426,253 | |||||||||||||
| 2,514,939 | Residential Asset Mortgage Products, Inc., Series 05-RS4, Class A3, 1 mo. LIBOR + .23%, 0.70%, due 04/25/35 | 2,288,594 | |||||||||||||
| 4,053,243 | Residential Asset Mortgage Products, Inc., Series 05-RS8, Class A2, 1 mo. LIBOR + .29%, 0.76%, due 10/25/33 | 2,837,270 | |||||||||||||
| 9,043,626 | Residential Asset Securities Corp., Series 07-KS3, Class AI1, 1 mo. LIBOR + .11%, 0.58%, due 04/25/37 | 7,867,955 | |||||||||||||
See accompanying notes to the financial statements.
17
GMO Short-Duration Collateral Fund
(A Series of GMO Trust)
Schedule of Investments — (Continued)
(showing percentage of total net assets)
February 28, 2009
| Par Value ($) | Description | Value ($) | |||||||||||||
| Residential Asset-Backed Securities (United States) — continued | |||||||||||||||
| 9,353,909 | Residential Asset Securities Corp., Series 05-KS12, Class A2, 1 mo. LIBOR + .25%, 0.72%, due 01/25/36 | 7,253,956 | |||||||||||||
| 236,691 | Saxon Asset Securities Trust, Series 04-1, Class A, 1 mo. LIBOR + .27%, 1.01%, due 03/25/35 | 61,318 | |||||||||||||
| 6,426,746 | Securitized Asset Backed Receivables LLC, Series 06-NC1, Class A2, 1 mo. LIBOR + .16%, 0.63%, due 03/25/36 | 4,820,059 | |||||||||||||
| 3,891,945 | Security National Mortgage Loan Trust, Series 06-2A, Class A1, 144A, 1 mo. LIBOR + .29%, 0.76%, due 10/25/36 | 3,551,400 | |||||||||||||
| 2,725,384 | SG Mortgage Securities Trust, Series 05-OPT1, Class A2, 1 mo. LIBOR + .26%, 0.73%, due 10/25/35 | 2,248,442 | |||||||||||||
| 3,796,119 | Soundview Home Equity Loan Trust, Series 07-NS1, Class A1, 1 mo. LIBOR + .12%, 0.59%, due 01/25/37 | 3,137,730 | |||||||||||||
| 17,100,000 | Specialty Underwriting & Residential Finance, Series 06-BC3, Class A2C, 1 mo. LIBOR + .15%, 0.62%, due 06/25/37 | 7,796,531 | |||||||||||||
| 11,100,000 | Structured Asset Investment Loan Trust, Series 06-1, Class A3, 1 mo. LIBOR + .20%, 0.67%, due 01/25/36 | 3,885,000 | |||||||||||||
| 7,385,089 | Structured Asset Securities Corp., Series 05-S6, Class A2, 1 mo. LIBOR + .29%, 0.76%, due 11/25/35 | 1,181,614 | |||||||||||||
| 18,999,689 | Yale Mortgage Loan Trust, Series 07-1, Class A, 144A, 1 mo. LIBOR + .40%, 0.87%, due 06/25/37 | 11,114,818 | |||||||||||||
| Total Residential Asset-Backed Securities (United States) | 482,576,883 | ||||||||||||||
| Residential Mortgage-Backed Securities (Australian) — 3.9% | |||||||||||||||
| 5,311,698 | Australian Mortgage Securities II, Series G3, Class A1A, 3 mo. LIBOR + .21%, 1.56%, due 01/10/35 | 4,649,383 | |||||||||||||
| 10,134,283 | Crusade Global Trust, Series 06-1, Class A1, 144A, 3 mo. LIBOR + .06%, 1.20%, due 07/20/38 | 8,667,822 | |||||||||||||
| 16,209,761 | Crusade Global Trust, Series 07-1, Class A1, 3 mo. LIBOR + .06%, 1.20%, due 04/19/38 | 13,143,263 | |||||||||||||
| 5,020,081 | Crusade Global Trust, Series 04-2, Class A1, 3 mo. LIBOR + .13%, 1.38%, due 11/19/37 | 4,060,689 | |||||||||||||
| 3,412,361 | Interstar Millennium Trust, Series 03-3G, Class A2, 3 mo. LIBOR + .25%, 1.72%, due 09/27/35 | 2,725,384 | |||||||||||||
| 30,901,180 | Interstar Millennium Trust, Series 04-2G, Class A, 3 mo. LIBOR + .20%, 2.20%, due 03/14/36 | 25,103,192 | |||||||||||||
| 1,841,749 | Interstar Millennium Trust, Series 05-1G, Class A, 3 mo. LIBOR + .12%, 2.31%, due 12/08/36 | 1,418,165 | |||||||||||||
See accompanying notes to the financial statements.
18
GMO Short-Duration Collateral Fund
(A Series of GMO Trust)
Schedule of Investments — (Continued)
(showing percentage of total net assets)
February 28, 2009
| Par Value ($) | Description | Value ($) | |||||||||||||
| Residential Mortgage-Backed Securities (Australian) — continued | |||||||||||||||
| 2,876,237 | Interstar Millennium Trust, Series 06-2GA, Class A2, 144A, 3 mo. LIBOR + .08%, 1.34%, due 05/27/38 | 2,192,095 | |||||||||||||
| 2,166,972 | Medallion Trust, Series 05-1G, Class A1, 3 mo. LIBOR + .08%, 1.32%, due 05/10/36 | 1,878,074 | |||||||||||||
| 11,045,105 | Medallion Trust, Series 06-1G, Class A1, 3 mo. LIBOR + .05%, 2.05%, due 06/14/37 | 9,023,177 | |||||||||||||
| 7,406,368 | Medallion Trust, Series 07-1G, Class A1, 3 mo. LIBOR + .04%, 1.30%, due 02/27/39 | 6,703,659 | |||||||||||||
| 15,715,639 | National RMBS Trust, Series 06-3, Class A1, 144A, 3 mo. LIBOR + .07%, 1.16%, due 10/20/37 | 13,604,714 | |||||||||||||
| 17,299,736 | Puma Finance Ltd., Series G5, Class A1, 144A, 3 mo. LIBOR + .07%, 1.32%, due 02/21/38 | 14,126,964 | |||||||||||||
| 1,104,157 | Superannuation Members Home Loans Global Fund, Series 6, Class A, 3 mo. LIBOR + .16%, 1.40%, due 11/09/35 | 924,268 | |||||||||||||
| 2,160,535 | Superannuation Members Home Loans Global Fund, Series 7, Class A1, 3 mo. LIBOR + .14%, 2.33%, due 03/09/36 | 1,884,319 | |||||||||||||
| 1,727,059 | Superannuation Members Home Loans Global Fund, Series 4A, Class A, 3 mo. LIBOR + .22%, 1.62%, due 10/09/29 | 1,417,304 | |||||||||||||
| 1,737,452 | Superannuation Members Home Loans Global Fund, Series 8, Class A1, 3 mo. LIBOR + .07%, 1.42%, due 01/12/37 | 1,432,842 | |||||||||||||
| 21,404,982 | Superannuation Members Home Loans Global Fund, Series 07-1, Class A1, 3 mo. LIBOR + .06%, 2.16%, due 06/12/40 | 17,443,883 | |||||||||||||
| 14,605,913 | Westpac Securitization Trust, Series 07-1G, Class A2A, 3 mo. LIBOR + .05%, 1.30%, due 05/21/38 | 12,381,578 | |||||||||||||
| Total Residential Mortgage-Backed Securities (Australian) | 142,780,775 | ||||||||||||||
| Residential Mortgage-Backed Securities (European) — 6.7% | |||||||||||||||
| 15,900,000 | Aire Valley Mortgages, Series 07-1A, Class 1A2, 144A, 3 mo. LIBOR + .09%, 1.62%, due 03/20/30 | 14,246,400 | |||||||||||||
| 13,400,000 | Aire Valley Mortgages, Series 06-1A, Class 1A, 144A, 3 mo. LIBOR + .11%, 1.64%, due 09/20/66 | 12,177,920 | |||||||||||||
| 13,500,000 | Arkle Master Issuer Plc, Series 06-1A, Class 3A, 144A, 3 mo. LIBOR + .05%, 1.29%, due 08/17/11 | 13,197,600 | |||||||||||||
| 12,300,000 | Arkle Master Issuer Plc, Series 06-1A, Class 4A1, 144A, 3 mo. LIBOR + .09%, 1.33%, due 02/17/52 | 10,258,200 | |||||||||||||
| 31,100,000 | Brunel Residential Mortgages, Series 07-1A, Class A4C, 144A, 3 mo. LIBOR + .10%, 1.36%, due 01/13/39 | 25,107,030 | |||||||||||||
See accompanying notes to the financial statements.
19
GMO Short-Duration Collateral Fund
(A Series of GMO Trust)
Schedule of Investments — (Continued)
(showing percentage of total net assets)
February 28, 2009
| Par Value ($) | Description | Value ($) | |||||||||||||
| Residential Mortgage-Backed Securities (European) — continued | |||||||||||||||
| 3,491,826 | Gracechurch Mortgage Funding Plc, Series 1A, Class A2B, 144A, 3 mo. LIBOR + .07%, 1.42%, due 10/11/41 | 3,212,375 | |||||||||||||
| 6,760,721 | Granite Master Issuer Plc, Series 06-2, Class A4, 1 mo. LIBOR + .04%, 0.51%, due 12/20/54 | 4,191,647 | |||||||||||||
| 4,069,799 | Granite Mortgages Plc, Series 04-3, Class 2A1, 3 mo. LIBOR + .14%, 1.67%, due 09/20/44 | 2,767,464 | |||||||||||||
| 38,900,000 | Holmes Financing Plc, Series 10A, Class 4A1, 144A, 3 mo. LIBOR + .08%, 1.17%, due 07/15/40 | 35,932,319 | |||||||||||||
| 10,000,000 | Holmes Master Issuer Plc, Series 07-2A, Class 3A1, 3 mo. LIBOR + .08%, 1.17%, due 07/15/21 | 9,000,000 | |||||||||||||
| 20,632,993 | Kildare Securities Ltd., Series 07-1A, Class A2, 144A, 3 mo. LIBOR + .06%, 2.25%, due 12/10/43 | 15,301,221 | |||||||||||||
| 4,303,145 | Leek Finance Plc, Series 17A, Class A2B, 144A, 3 mo. LIBOR + .14%, 1.67%, due 12/21/37 | 2,879,745 | |||||||||||||
| 987,020 | Leek Finance Plc, Series 14A, Class A2B, 144A, 3 mo. LIBOR + .18%, 1.71%, due 09/21/36 | 931,654 | |||||||||||||
| 3,451,784 | Leek Finance Plc, Series 15A, Class AB, 144A, 3 mo. LIBOR + .14%, 1.67%, due 03/21/37 | 2,968,534 | |||||||||||||
| 11,900,000 | Mound Financing Plc, Series 5A, Class 2A, 144A, 3 mo. LIBOR + .04%, 1.28%, due 05/08/16 | 11,215,750 | |||||||||||||
| 6,591,686 | Paragon Mortgages Plc, Series 7A, Class A1A, 144A, 3 mo. LIBOR + .21%, 1.45%, due 05/15/34 | 6,088,279 | |||||||||||||
| 11,548,800 | Paragon Mortgages Plc, Series 12A, Class A2C, 144A, 3 mo. LIBOR + .11%, 1.35%, due 11/15/38 | 6,800,857 | |||||||||||||
| 7,116,161 | Paragon Mortgages Plc, Series 14A, Class A2C, 144A, 3 mo. LIBOR + .10%, 2.10%, due 09/15/39 | 6,209,420 | |||||||||||||
| 36,200,000 | Pendeford Master Issuer Plc, Series 07-1A, Class 3A, 144A, 3 mo. LIBOR + .10%, 1.32%, due 02/12/16 | 31,638,800 | |||||||||||||
| 3,270,000 | Permanent Financing Plc, Series 4, Class 3A, 3 mo. LIBOR + .14%, 2.33%, due 03/10/24 | 3,264,016 | |||||||||||||
| 26,600,000 | Permanent Master Issuer Plc, Series 06-1, Class 5A, 3 mo. LIBOR + .11%, 1.20%, due 07/15/33 | 21,945,000 | |||||||||||||
| 6,600,000 | Permanent Master Issuer Plc, Series 07-1, Class 4A, 3 mo. LIBOR + .08%, 1.17%, due 10/15/33 | 5,399,790 | |||||||||||||
| 305,268 | RMAC Securities Plc, Series 06-NS4A, Class A1B, 144A, 3 mo. LIBOR + .07%, 2.17%, due 06/12/25 | 304,505 | |||||||||||||
| Total Residential Mortgage-Backed Securities (European) | 245,038,526 | ||||||||||||||
See accompanying notes to the financial statements.
20
GMO Short-Duration Collateral Fund
(A Series of GMO Trust)
Schedule of Investments — (Continued)
(showing percentage of total net assets)
February 28, 2009
| Par Value ($) | Description | Value ($) | |||||||||||||
| Residential Mortgage-Backed Securities (United States) — 0.1% | |||||||||||||||
| 722,302 | Chevy Chase Mortgage Funding Corp., Series 04-3A, Class A2, 144A, 1 mo. LIBOR + .30%, 0.77%, due 08/25/35 | 296,106 | |||||||||||||
| 1,640,705 | GreenPoint Mortgage Funding Trust, Series 05-HE4, Class 2A3C, 1 mo. LIBOR + .25%, 0.72%, due 07/25/30 | 1,065,433 | |||||||||||||
| 3,677,125 | Mellon Residential Funding Corp., Series 04-TBC1, Class A, 144A, 1 mo. LIBOR + .25%, 0.73%, due 02/26/34 | 2,211,446 | |||||||||||||
| Total Residential Mortgage-Backed Securities (United States) | 3,572,985 | ||||||||||||||
| Student Loans — 5.0% | |||||||||||||||
| 5,786,645 | College Loan Corp. Trust, Series 04-1, Class A2, 3 mo. LIBOR + .11%, 1.27%, due 04/25/16 | 5,633,310 | |||||||||||||
| 11,200,000 | College Loan Corp. Trust, Series 06-1, Class A2, 3 mo. LIBOR + .02%, 1.18%, due 04/25/22 | 10,934,560 | |||||||||||||
| 20,300,000 | College Loan Corp. Trust, Series 07-2, Class A1, 3 mo. LIBOR + .25%, 1.41%, due 01/25/24 | 19,285,000 | |||||||||||||
| 5,576,000 | College Loan Corp. Trust, Series 07-1, Class A1, 3 mo. LIBOR + .01%, 1.17%, due 01/25/23 | 5,415,411 | |||||||||||||
| 5,081,092 | Goal Capital Funding Trust, Series 06-1, Class A1, 3 mo. LIBOR, 1.25%, due 08/25/20 | 5,005,892 | |||||||||||||
| 5,164,911 | Goal Capital Funding Trust, Series 07-1, Class A1, 3 mo. LIBOR + .02%, 1.49%, due 06/25/21 | 5,108,614 | |||||||||||||
| 2,873,584 | Keycorp Student Loan Trust, Series 05-A, Class 2A1, 3 mo. LIBOR + .05%, 1.52%, due 09/27/21 | 2,781,572 | |||||||||||||
| 3,632,419 | Montana Higher Education Student Assistance Corp., Series 05-1, Class A, 3 mo. LIBOR + .04%, 1.57%, due 06/20/15 | 3,498,020 | |||||||||||||
| 10,525,936 | National Collegiate Student Loan Trust, Series 06-1, Class A2, 1 mo. LIBOR + .14%, 0.61%, due 08/25/23 | 9,473,342 | |||||||||||||
| 10,485,464 | National Collegiate Student Loan Trust, Series 06-A, Class A1, 144A, 1 mo. LIBOR + .08%, 0.55%, due 08/26/19 | 9,646,627 | |||||||||||||
| 9,600,000 | Nelnet Student Loan Trust, Series 05-2, Class A4, 3 mo. LIBOR + .08%, 1.61%, due 12/23/19 | 8,741,664 | |||||||||||||
| 8,691,939 | SLC Student Loan Trust, Series 06-A, Class A2, 3 mo. LIBOR + .03%, 1.12%, due 10/15/15 | 8,496,710 | |||||||||||||
| 17,047,809 | SLM Student Loan Trust, Series 05-1, Class A2, 3 mo. LIBOR + .08%, 1.24%, due 04/27/20 | 15,589,795 | |||||||||||||
See accompanying notes to the financial statements.
21
GMO Short-Duration Collateral Fund
(A Series of GMO Trust)
Schedule of Investments — (Continued)
(showing percentage of total net assets)
February 28, 2009
| Par Value ($) | Description | Value ($) | |||||||||||||
| Student Loans — continued | |||||||||||||||
| 24,600,000 | SLM Student Loan Trust, Series 05-3, Class A4, 3 mo. LIBOR + .07%, 1.23%, due 04/27/20 | 22,263,000 | |||||||||||||
| 15,717,704 | SLM Student Loan Trust, Series 07-A, Class A1, 3 mo. LIBOR + .03%, 2.03%, due 09/15/22 | 13,202,872 | |||||||||||||
| 25,300,000 | SLM Student Loan Trust, Series 07-2, Class A2, 3 mo. LIBOR, 1.16%, due 07/25/17 | 23,592,250 | |||||||||||||
| 5,700,000 | SLM Student Loan Trust, Series 07-6, Class A2, 3 mo. LIBOR + .25%, 1.41%, due 01/25/19 | 5,090,100 | |||||||||||||
| 11,100,000 | SLM Student Loan Trust, Series 08-6, Class A3, 1 mo. LIBOR + .75%, 1.91%, due 01/25/19 | 9,967,453 | |||||||||||||
| Total Student Loans | 183,726,192 | ||||||||||||||
| Time Share — 0.1% | |||||||||||||||
| 5,413,276 | Sierra Receivables Funding Co., Series 08-1A, Class A2, 144A, 1 mo. LIBOR + 4.00%, 4.47%, due 02/20/20 | 4,596,210 | |||||||||||||
| Trade Receivables — 0.2% | |||||||||||||||
| 9,800,000 | SSCE Funding LLC, Series 04-1A, Class A, 144A, 1 mo. LIBOR + .23%, 0.69%, due 11/15/10 | 9,310,000 | |||||||||||||
| Total Asset-Backed Securities | 3,528,379,547 | ||||||||||||||
| U.S. Government — 0.6% | |||||||||||||||
| 22,005,152 | U.S. Treasury Inflation Indexed Bond, 0.88%, due 04/15/10 (a) (b) | 21,701,432 | |||||||||||||
| U.S. Government Agency — 1.3% | |||||||||||||||
| 10,875,000 | Agency for International Development Floater (Support of India), 3 mo. LIBOR + .10%, 1.27%, due 02/01/27 (c) | 9,636,230 | |||||||||||||
| 13,500,000 | Agency for International Development Floater (Support of Morocco), 6 mo. LIBOR + .15%, 1.90%, due 10/29/26 (c) | 12,634,569 | |||||||||||||
| 16,000,000 | Agency for International Development Floater (Support of Morocco), 6 mo. LIBOR - .02%, 2.81%, due 02/01/25 (c) | 14,857,330 | |||||||||||||
| 783,852 | Agency for International Development Floater (Support of Peru), Series A, 6 mo. U.S. Treasury Bill + .35%, 0.85%, due 05/01/14 (c) | 744,480 | |||||||||||||
| 10,222,500 | Agency for International Development Floater (Support of Tunisia), 6 mo. LIBOR, 1.75%, due 07/01/23 (c) | 9,570,360 | |||||||||||||
| Total U.S. Government Agency | 47,442,969 | ||||||||||||||
| TOTAL DEBT OBLIGATIONS (COST $4,891,212,004) | 3,597,523,948 | ||||||||||||||
See accompanying notes to the financial statements.
22
GMO Short-Duration Collateral Fund
(A Series of GMO Trust)
Schedule of Investments — (Continued)
(showing percentage of total net assets)
February 28, 2009
| Shares | Description | Value ($) | |||||||||||||
| SHORT-TERM INVESTMENTS — 2.6% | |||||||||||||||
| Money Market Funds — 2.6% | |||||||||||||||
| 70,558,573 | State Street Institutional Liquid Reserves Fund-Institutional Class | 70,558,573 | |||||||||||||
| 24,072,590 | State Street Institutional Treasury Plus Money Market Fund-Institutional Class | 24,072,590 | |||||||||||||
| TOTAL SHORT-TERM INVESTMENTS (COST $94,631,163) | 94,631,163 | ||||||||||||||
| TOTAL INVESTMENTS — 100.4% (Cost $4,985,843,167) | 3,692,155,111 | ||||||||||||||
| Other Assets and Liabilities (net) — (0.4%) | (15,407,319 | ) | |||||||||||||
| TOTAL NET ASSETS — 100.0% | $ | 3,676,747,792 | |||||||||||||
See accompanying notes to the financial statements.
23
GMO Short-Duration Collateral Fund
(A Series of GMO Trust)
Schedule of Investments — (Continued)
February 28, 2009
A summary of outstanding financial instruments at February 28, 2009 is as follows:
Forward Currency Contracts
| Settlement Date | Deliver/ Receive | Units of Currency | Value | Net Unrealized Appreciation (Depreciation) | |||||||||||||||
| Sales | |||||||||||||||||||
| 3/10/09 | EUR | 20,000,000 | $ | 25,353,827 | $ | 2,114,173 | |||||||||||||
Swap Agreements
Credit Default Swaps
| Notional Amount | Expiration Date | Counterparty | Receiveu (Pay) | Annual Premium | Implied Credit Spread (1) | Deliverable on Default | Maximum Potential Amount of Future Payments by the Fund Under the Contract (2) | Market Value | |||||||||||||||||||||||||||||||||||
| 60,000,000 | USD | 9/20/2010 | Morgan | Receive | 0.40% | 17.76% | Eagle Creek | 60,000,000 | USD | $ | (14,465,887 | ) | |||||||||||||||||||||||||||||||
| Stanley | CDO | ||||||||||||||||||||||||||||||||||||||||||
| 31,000,000 | USD | 3/20/2013 | Morgan Stanley | Receive | 0.25% | 17.49% | MS Synthetic 2006-1 | 31,000,000 | USD | (15,267,217 | ) | ||||||||||||||||||||||||||||||||
| $ | (29,733,104 | ) | |||||||||||||||||||||||||||||||||||||||||
| Premiums to (Pay) Receive | $ | — | |||||||||||||||||||||||||||||||||||||||||
u Receive - Fund receives premium and sells credit protection.
(Pay) - Fund pays premium and buys credit protection.
(1) Implied credit spreads, represented in absolute terms, utilized in determining the market value of credit default swap agreements on the reference security, as of February 28, 2009, serve as an indicator of the current status of the payment/performance risk and reflect the likelihood or risk of default for the credit derivative. The implied credit spread of a particular referenced entity reflects the cost of buying/selling protection and may include upfront payments required to be made to enter into the agreement. Wider credit spreads represent a deterioration of the referenced entity's credit soundness and a greater likelihood or risk of default or other credit event occurring as defined under the terms of the agreement.
(2) The maximum potential amount the Fund could be required to make as a seller of credit protection if a credit event occurs as defined under the terms of that particular swap agreement.
See accompanying notes to the financial statements.
24
GMO Short-Duration Collateral Fund
(A Series of GMO Trust)
Schedule of Investments — (Continued)
February 28, 2009
As of February 28, 2009, for the swap contracts held, the Fund had sufficient cash and/or securities to cover any commitments or margin requirements of the relevant broker or exchange.
Notes to Schedule of Investments:
144A - Securities exempt from registration under Rule 144A of the Securities Act of 1933. These securities may be resold in transactions exempt from registration, normally to qualified institutional investors.
AMBAC - Insured as to the payment of principal and interest by AMBAC Assurance Corporation.
CapMAC - Insured as to the payment of principal and interest by Capital Markets Assurance Corporation.
CDO - Collateralized Debt Obligation
CMBS - Collateralized Mortgage Backed Security
EUR LIBOR - London Interbank Offered Rate denominated in Euros.
FGIC - Insured as to the payment of principal and interest by Financial Guaranty Insurance Corporation.
FSA - Insured as to the payment of principal and interest by Financial Security Assurance.
LIBOR - London Interbank Offered Rate
MBIA - Insured as to the payment of principal and interest by MBIA Insurance Corp.
RMAC - Residential Mortgage Acceptance Corp.
RMBS - Residential Mortgage Backed Security
XL - Insured as to the payment of principal and interest by XL Capital Assurance.
The rates shown on variable rate notes are the current interest rates at February 28, 2009, which are subject to change based on the terms of the security.
(a) Indexed security in which price and/or coupon is linked to the prices of a specific instrument or financial statistic (Note 2).
(b) All or a portion of this security has been segregated to cover receivable for collateral on swap contracts (Note 2).
(c) Security valued at fair value using methods determined in good faith by or at the direction of the Trustees of GMO Trust (Note 2).
Currency Abbreviations:
EUR - Euro
USD - United States Dollar
See accompanying notes to the financial statements.
25
GMO Short-Duration Collateral Fund
(A Series of GMO Trust)
Statement of Assets and Liabilities — February 28, 2009
| Assets: | |||||||
| Investments, at value (cost $4,985,843,167) (Note 2) | $ | 3,692,155,111 | |||||
| Receivable for investments sold | 1,542,580 | ||||||
| Dividends and interest receivable | 5,970,198 | ||||||
| Unrealized appreciation on open forward currency contracts (Note 2) | 2,114,173 | ||||||
| Receivable for collateral on open swap contracts (Note 2) | 7,530,000 | ||||||
| Receivable for expenses reimbursed by Manager (Note 3) | 119,397 | ||||||
| Total assets | 3,709,431,459 | ||||||
| Liabilities: | |||||||
| Payable to affiliate for (Note 3): | |||||||
| Trustees and Chief Compliance Officer of GMO Trust fees | 11,564 | ||||||
| Payable for open swap contracts (Note 2) | 29,733,104 | ||||||
| Miscellaneous payable | 2,537,983 | ||||||
| Accrued expenses | 401,016 | ||||||
| Total liabilities | 32,683,667 | ||||||
| Net assets | $ | 3,676,747,792 | |||||
| Net assets consist of: | |||||||
| Paid-in capital | $ | 5,108,310,281 | |||||
| Distributions in excess of net investment income | (773,995 | ) | |||||
| Accumulated net realized loss | (109,481,464 | ) | |||||
| Net unrealized depreciation | (1,321,307,030 | ) | |||||
| $ | 3,676,747,792 | ||||||
| Net assets | $ | 3,676,747,792 | |||||
| Shares outstanding: | 215,076,521 | ||||||
| Net asset value per share: | $ | 17.10 | |||||
See accompanying notes to the financial statements.
26
GMO Short-Duration Collateral Fund
(A Series of GMO Trust)
Statement of Operations — Year Ended February 28, 2009
| Investment Income: | |||||||
| Interest | $ | 205,692,317 | |||||
| Dividends | 3,164,329 | ||||||
| Total investment income | 208,856,646 | ||||||
| Expenses: | |||||||
| Custodian, fund accounting agent and transfer agent fees | 657,793 | ||||||
| Audit and tax fees | 93,128 | ||||||
| Legal fees | 449,083 | ||||||
| Trustees fees and related expenses (Note 3) | 113,853 | ||||||
| Miscellaneous | 68,039 | ||||||
| Total expenses | 1,381,896 | ||||||
| Fees and expenses reimbursed by Manager (Note 3) | (1,089,446 | ) | |||||
| Expense reductions (Note 2) | (982 | ) | |||||
| Net expenses | 291,468 | ||||||
| Net investment income (loss) | 208,565,178 | ||||||
| Realized and unrealized gain (loss): | |||||||
| Net realized gain (loss) on: | |||||||
| Investments | (328,230,494 | ) | |||||
| Closed futures contracts | (1,147,405 | ) | |||||
| Closed swap contracts | (10,714,968 | ) | |||||
| Foreign currency, forward contracts and foreign currency related transactions | 8,125,085 | ||||||
| Net realized gain (loss) | (331,967,782 | ) | |||||
| Change in net unrealized appreciation (depreciation) on: | |||||||
| Investments | (815,344,049 | ) | |||||
| Open futures contracts | 892,437 | ||||||
| Open swap contracts | (12,328,122 | ) | |||||
| Foreign currency, forward contracts and foreign currency related transactions | 3,375,172 | ||||||
| Net unrealized gain (loss) | (823,404,562 | ) | |||||
| Net realized and unrealized gain (loss) | (1,155,372,344 | ) | |||||
| Net increase (decrease) in net assets resulting from operations | $ | (946,807,166 | ) | ||||
See accompanying notes to the financial statements.
27
GMO Short-Duration Collateral Fund
(A Series of GMO Trust)
Statement of Changes in Net Assets
| Year Ended February 28, 2009 | Year Ended February 29, 2008 | ||||||||||
| Increase (decrease) in net assets: | |||||||||||
| Operations: | |||||||||||
| Net investment income (loss) | $ | 208,565,178 | $ | 413,372,282 | |||||||
| Net realized gain (loss) | (331,967,782 | ) | (2,015,394 | ) | |||||||
| Change in net unrealized appreciation (depreciation) | (823,404,562 | ) | (512,996,708 | ) | |||||||
| Net increase (decrease) in net assets from operations | (946,807,166 | ) | (101,639,820 | ) | |||||||
| Distributions to shareholders from: | |||||||||||
| Net investment income | (266,488,025 | ) | (418,731,518 | ) | |||||||
| Return of capital | (538,644,733 | ) | — | ||||||||
| (805,132,758 | ) | (418,731,518 | ) | ||||||||
| Net share transactions (Note 7): | (2,247,496,453 | ) | 1,588,185,799 | ||||||||
| Redemption fees (Notes 2 and 7): | 4,769,406 | — | |||||||||
| Total increase (decrease) in net assets resulting from net share transactions and redemption fees | (2,242,727,047 | ) | 1,588,185,799 | ||||||||
| Total increase (decrease) in net assets | (3,994,666,971 | ) | 1,067,814,461 | ||||||||
| Net assets: | |||||||||||
| Beginning of period | 7,671,414,763 | 6,603,600,302 | |||||||||
| End of period (including distributions in excess of net investment income of $773,995 and accumulated undistributed net investment income of $44,272,074, respectively) | $ | 3,676,747,792 | $ | 7,671,414,763 | |||||||
See accompanying notes to the financial statements.
28
GMO Short-Duration Collateral Fund
(A Series of GMO Trust)
Financial Highlights
(For a share outstanding throughout each period)
| Year Ended February 28/29, | |||||||||||||||||||||||
| 2009 | 2008 | 2007 | 2006 | 2005 | |||||||||||||||||||
| Net asset value, beginning of period | $ | 24.03 | $ | 25.66 | $ | 25.60 | $ | 25.33 | $ | 25.18 | |||||||||||||
| Income (loss) from investment operations: | |||||||||||||||||||||||
| Net investment income (loss)† | 0.76 | 1.38 | 1.43 | 1.01 | 0.59 | ||||||||||||||||||
| Net realized and unrealized gain (loss) | (4.41 | ) | (1.64 | ) | 0.00 | (a) | (0.03 | ) | (0.09 | ) | |||||||||||||
| Total from investment operations | (3.65 | ) | (0.26 | ) | 1.43 | 0.98 | 0.50 | ||||||||||||||||
| Less distributions to shareholders: | |||||||||||||||||||||||
| From net investment income | (1.06 | ) | (1.37 | ) | (1.37 | ) | (0.71 | ) | (0.34 | ) | |||||||||||||
| From net realized gains | — | — | — | — | (0.01 | ) | |||||||||||||||||
| From return of capital | (2.22 | ) | — | — | — | — | |||||||||||||||||
| Total distributions | (3.28 | ) | (1.37 | ) | (1.37 | ) | (0.71 | ) | (0.35 | ) | |||||||||||||
| Net asset value, end of period | $ | 17.10 | $ | 24.03 | $ | 25.66 | $ | 25.60 | $ | 25.33 | |||||||||||||
| Total Return(b) | (15.97 | )% | (1.14 | )% | 5.68 | % | 3.89 | % | 2.01 | % | |||||||||||||
| Ratios/Supplemental Data: | |||||||||||||||||||||||
| Net assets, end of period (000's) | $ | 3,676,748 | $ | 7,671,415 | $ | 6,603,600 | $ | 4,480,312 | $ | 3,483,889 | |||||||||||||
| Net operating expenses to average daily net assets(c) | 0.00 | %(d) | 0.00 | %(d) | 0.00 | % | 0.00 | % | 0.00 | % | |||||||||||||
| Interest expense to average daily net assets | — | — | 0.01 | % | 0.02 | % | — | ||||||||||||||||
| Total net expenses to average daily net assets | 0.00 | %(d)(e) | 0.00 | %(d)(e) | 0.01 | % | 0.02 | % | 0.00 | %(e) | |||||||||||||
| Net investment income to average daily net assets | 3.46 | % | 5.41 | % | 5.50 | % | 3.96 | % | 2.31 | % | |||||||||||||
| Portfolio turnover rate | 16 | % | 27 | % | 68 | % | 45 | % | 34 | % | |||||||||||||
| Fees and expenses reimbursed by the Manager to average daily net assets: | 0.02 | % | 0.01 | % | 0.02 | % | 0.02 | % | 0.02 | % | |||||||||||||
| Redemption fees consisted of the following per share amounts:† | $ | 0.02 | — | — | — | — | |||||||||||||||||
(a) Net realized and unrealized gain (loss) was less than $0.01 per share.
(b) The total returns would have been lower had certain expenses not been reimbursed during the periods shown and assumes the effect of reinvested distributions. Calculation excludes redemption fees which are borne by the shareholder.
(c) Net operating expenses were less than 0.01% to average daily net assets.
(d) The net expense ratio does not include the effect of expense reductions.
(e) Total net expenses were less than 0.01% to average daily net assets.
† Calculated using average shares outstanding throughout the period.
See accompanying notes to financial statements.
29
GMO Short-Duration Collateral Fund
(A Series of GMO Trust)
Notes to Financial Statements
February 28, 2009
1. Organization
GMO Short-Duration Collateral Fund (the "Fund") is a series of GMO Trust (the "Trust"). The Fund is registered under the Investment Company Act of 1940, as amended, as an open-end, non-diversified management investment company. The Fund is advised and managed by Grantham, Mayo, Van Otterloo & Co. LLC (the "Manager" or "GMO"). The Trust was established as a Massachusetts business trust under the laws of The Commonwealth of Massachusetts on June 24, 1985. The Declaration of Trust permits the Trustees of the Trust ("Trustees") to create an unlimited number of series of shares ("Funds") and to subdivide Funds into classes.
The Fund seeks total return comparable to that of the JPMorgan U.S. 3 Month Cash Index. The Fund seeks to achieve its investment objective by investing primarily in high quality U.S. and foreign adjustable rate fixed income securities with low volatility (although market changes may indirectly result in volatility). Fixed income securities in which the Fund invests (some of which may have been downgraded), include securities issued by a wide range of private issuers and, to a lesser extent, securities issued by federal, state, local, and foreign governments (including securities neither guaranteed nor insured by the U.S. government). The Fund may invest a substantial portion of its assets in asset-backed securities including, but not limited to, securities backed by pools of residential and commercial mortgages, credit-card receivables, home equity loans, automobile loans, educational loans, corporate and sovereign bonds, and ba nk loans made to corporations. In addition, the Fund may invest in government securities, corporate debt securities, money market instruments, and commercial paper, and enter into credit default swaps, reverse repurchase agreements, and repurchase agreements. The Fund also may use exchange-traded and over-the-counter ("OTC") derivatives, including swap contracts, futures contracts, options on futures, options on swaps (or "swaptions"), and other types of options, and forward currency contracts. The Fund's fixed income securities primarily have adjustable interest rates (or may be hedged using derivatives to convert the fixed rate interest payments into adjustable rate interest payments), but may also include all types of interest rate, payment, and reset terms, including fixed rate, zero coupon, contingent, deferred, payment-in-kind, and auction rate features. The Fund may hold fixed income securities whose ratings after they were acquired were reduced below investment grade.
The Fund directly invests in asset-backed securities with contractual cash flows, such as collateralized mortgage obligations and commercial mortgage-backed securities, including securities backed by sub-prime mortgage loans, credit card receivables and auto loan receivables. The value, liquidity and related income of these securities are sensitive to changes in economic conditions, including real estate values, delinquencies and/or defaults, and may be adversely affected by changes in interest rates and shifts in the market's perception of the securities' market values.
The Fund will, if deemed prudent by the Manager, take temporary defensive measures (until the Manager has determined that normal conditions have returned or that it is otherwise prudent to resume investing in accordance with the Fund's normal investment strategies) and may not achieve its investment objectives
30
GMO Short-Duration Collateral Fund
(A Series of GMO Trust)
Notes to Financial Statements — (Continued)
February 28, 2009
during those periods. Recent changes in the credit markets have reduced the liquidity of all types of fixed income securities, including asset-backed securities.
Shares of the Fund are not publicly offered and are principally available only to other funds of the Trust and certain accredited investors.
2. Significant accounting policies
The following is a summary of significant accounting policies followed by the Fund in the preparation of its financial statements. These policies are in conformity with accounting principles generally accepted in the United States of America ("U.S. GAAP") and have been consistently followed by the Fund in preparing its financial statements. The preparation of financial statements in accordance with U.S. GAAP requires management to make estimates and assumptions that affect the reported amounts and disclosures in the financial statements. Actual results could differ from those estimates. The accounting records of the Fund are maintained in U.S. dollars.
Portfolio valuation
Securities listed on a securities exchange for which market quotations are readily available are valued at the last sale price or official closing price on each business day, or if there is no such reported sale or official closing price, at the most recent quoted bid price. Unlisted securities for which market quotations are readily available are generally valued at the most recent quoted bid price. Debt instruments with a remaining maturity of sixty days or less are generally valued at amortized cost, which approximates fair value. Shares of investment funds are generally valued at their net asset value. Securities for which quotations are not readily available or whose values the Manager has determined to be unreliable are valued at fair value as determined in good faith by the Trustees or persons acting at their direction pursuant to procedures approved by the Trustees. By its nature, a fair value price is a good faith estim ate of the value of a security at a given point in time and may not reflect the value that would be realized if the security were sold. The difference between a fair value price and the value realized upon a sale could be material.
Typically the Fund values debt instruments based on prices supplied by a primary pricing source chosen by the Manager. The Manager evaluates primary pricing sources on an ongoing basis and may change a pricing source should the Manager deem it appropriate. If it deems appropriate, the Manager, at its discretion, may override a price supplied by a primary source by using a price provided by another source. The prices provided by primary pricing sources may differ from the value that would be realized if the securities were sold, and the differences could be material.
Certain securities held by the Fund are valued on the basis of prices provided by a single source. As of February 28, 2009, the total value of these securities represented 38.42% of the net assets. The single source prices provided may differ from the value that would be realized if the securities were sold, and the differences could be material. In addition, although alternative prices are available for other securities held
31
GMO Short-Duration Collateral Fund
(A Series of GMO Trust)
Notes to Financial Statements — (Continued)
February 28, 2009
by the Fund, those alternative sources would not necessarily confirm the security price used by the Fund. Therefore, the existence of those alternative sources does not necessarily provide greater certainty about the prices used by the Fund.
In September 2006, the Financial Accounting Standards Board ("FASB") issued Statement of Financial Accounting Standards No. 157, Fair Value Measurements ("SFAS 157"). SFAS 157 is effective for the Fund's current fiscal year. While the adoption of SFAS 157 does not have an effect on the Fund's net asset value, it does require additional disclosures about fair value measurements. SFAS 157 establishes a three-level hierarchy for disclosure of fair value measurements. The valuation hierarchy is based upon the reliability of inputs to the valuation of the Fund's investments. The three levels are defined as follows:
Level 1 – Valuations based on quoted prices for identical securities in active markets.
Level 2 – Valuations determined using other significant direct or indirect observable inputs.
Level 3 – Valuations based on inputs that are unobservable and significant. The Fund utilized the following fair value techniques on Level 3 investments: The Fund valued debt securities using indicative bids received from primary pricing sources. The Fund also valued certain credit default swaps using industry standard models and inputs from pricing vendors.
The inputs or methodology used for valuing securities are not necessarily an indication of the risk associated with investing in those securities.
The following is a summary of the fair valuations according to inputs used as of February 28, 2009 in valuing the Fund's investments:
| Asset Valuation Inputs | Investments in Securities | Other Financial Instruments* | |||||||||
| Level 1 - Quoted Prices | $ | — | $ | — | |||||||
| Level 2 - Other Significant Observable Inputs | 116,332,595 | 2,114,173 | |||||||||
| Level 3 - Significant Unobservable Inputs | 3,575,822,516 | — | |||||||||
| Total | $ | 3,692,155,111 | $ | 2,114,173 | |||||||
* Other financial instruments include forward currency contracts.
32
GMO Short-Duration Collateral Fund
(A Series of GMO Trust)
Notes to Financial Statements — (Continued)
February 28, 2009
| Liability Valuation Inputs | Investments in Securities | Other Financial Instruments** | |||||||||
| Level 1 - Quoted Prices | $ | — | $ | — | |||||||
| Level 2 - Other Significant Observable Inputs | — | — | |||||||||
| Level 3 - Significant Unobservable Inputs | — | (29,733,104 | ) | ||||||||
| Total | $ | — | $ | (29,733,104 | ) | ||||||
** Other financial instruments include swap agreements.
The following is a reconciliation of investments in which significant unobservable inputs (Level 3) were used in determining value:
| Investments in Securities | Other Financial Instruments*** | ||||||||||
| Balance as of February 29, 2008 | $ | 1,370,228,960 | $ | — | |||||||
| Accrued discounts/premiums | 2,493,885 | — | |||||||||
| Realized gain (loss) | (274,070,194 | ) | — | ||||||||
| Change in unrealized appreciation/depreciation | (835,906,320 | ) | (20,743,168 | ) | |||||||
| Net purchases (sales) | (944,911,179 | ) | — | ||||||||
| Net transfers in and/or out of Level 3 | 4,257,987,364 | (8,989,936 | ) | ||||||||
| Balance as of February 28, 2009 | $ | 3,575,822,516 | $ | (29,733,104 | ) | ||||||
*** Other financial instruments include swap agreements.
Foreign currency translation
The market values of foreign securities, currency holdings and related assets and liabilities are translated to U.S. dollars based on the 4 p.m. New York time exchange rates each business day. Income and expenses denominated in foreign currencies are translated at the 4 p.m. New York time exchange rates on the business day the income and expenses are accrued or incurred. The Fund does not isolate realized and unrealized gains and losses attributable to changes in exchange rates from gains and losses that arise from changes in the market value of investments. Such fluctuations are included with net realized and unrealized gain or loss on investments. Net realized gains and losses on foreign currency transactions represent gains and losses on disposition of currencies and forward currency contracts, currency gains and losses realized between the trade and settlement dates on securities transactions, and the difference between the amount of investment income and foreign withholding taxes recorded on the Fund's accounting records and the U.S. dollar equivalent amounts actually received or paid.
Forward currency contracts
The Fund may enter into forward currency contracts including forward cross currency contracts. A forward currency contract is an agreement between two parties to buy and sell a currency at a set price on
33
GMO Short-Duration Collateral Fund
(A Series of GMO Trust)
Notes to Financial Statements — (Continued)
February 28, 2009
a future date. The market value of a forward currency contract fluctuates with changes in forward currency exchange rates. Forward currency contracts are marked to market daily using rates supplied by a quotation service and changes in value are recorded by the Fund as an unrealized gain or loss. Realized gains or losses equal to the difference between the value of the contract at the time it was opened and the value at the time it was closed are recorded upon delivery or receipt of the currency or, if a forward currency contract is offset by entering into another forward currency contract with the same broker, upon settlement of the net gain or loss. These contracts may involve market risk in excess of the unrealized gain or loss reflected in the Fund's Statement of Assets and Liabilities. They expose the Fund to the risk of unfavorable movements in currency values and the risk that the counterparty will be unable or unwilling to meet the terms of the contracts. Forward currency contracts outstanding at the end of the period are listed in the Fund's Schedule of Investments.
Futures contracts
The Fund may purchase and sell futures contracts. Upon entering into a futures contract, the Fund is required to deposit cash, U.S. government and agency obligations, or other liquid assets with the futures clearing broker in accordance with the initial margin requirements of the broker or exchange. In addition, the Fund maintains cash or securities in an amount that at least equals the net amount payable in the event the Fund must deliver the full amount of the contract. Futures contracts are marked to market daily and an appropriate payable or receivable for the change in value ("variation margin") is recorded by the Fund. The payable or receivable is settled on the following business day. Gains or losses are recognized but not considered realized until the contracts expire or are closed. Futures contracts involve, to varying degrees, risk of loss in excess of the variation margin disclosed in the Statement of Assets and Liabi lities. Under some circumstances, futures exchanges may establish daily limits on the amount that the price of a futures contract can vary from the previous day's settlement price, thereby effectively preventing liquidation of unfavorable positions. Losses may arise from changes in the value of the underlying instrument if the Fund is unable to liquidate a futures position due to an illiquid secondary market for the contract or the imposition of price limits, or if counterparties do not perform under the contract terms. Futures contracts are generally valued at the settlement price established each day by the board of trade or exchange on which they are traded. The Fund had no futures contracts outstanding at the end of the period.
Options
The Fund may write (i.e., sell) call and put options. Writing options alters the Fund's exposure to the underlying instrument by, in the case of a call option, obligating the Fund to sell the underlying instrument at a set price to the option-holder and, in the case of a put option, obligating the Fund to purchase the underlying instrument at a set price from the option-holder. In the case of an index option, settlement will be in cash. When the Fund writes a call or put option, an amount equal to the premium received is recorded as a liability and subsequently marked to market to reflect the current value of the option written. Premiums received from writing options that expire are treated as realized gains. Premiums received from writing options that are exercised or closed are deducted from the amounts paid on the underlying future, security or currency transaction to determine the realized gain or loss. The Fund as a writer of an option
34
GMO Short-Duration Collateral Fund
(A Series of GMO Trust)
Notes to Financial Statements — (Continued)
February 28, 2009
has no control over whether the underlying future, security or currency may be sold (call) or purchased (put) and as a result bears the market risk of an unfavorable change in the price of the future, security or currency underlying the option. In the event that the Fund writes uncovered put or call options (i.e. options for investments that the Fund does not own), it bears the risk of substantial losses if the price of the underlying instrument increases during the term of the option. Options expose the Fund to the risk the Fund may not be able to enter into a closing transaction because of an illiquid market. The Fund had no open written option contracts during the period.
The Fund may also purchase put and call options. Purchasing options alters the Fund's exposure to the underlying instrument by, in the case of a call option, entitling the Fund to purchase the underlying instrument at a set price from the writer of the option and, in the case of a put option, entitling the Fund to sell the underlying instrument at a set price to the writer of the option. The Fund pays a premium for a purchased option. That premium is disclosed in the Schedule of Investments and is subsequently marked to market to reflect the current value of the option. Premiums paid for purchasing options that expire are treated as realized losses. Premiums paid for purchasing options that are exercised or closed are deducted from the proceeds on the closing transaction to determine the realized gain or loss. The risk associated with purchasing put and call options is limited to the premium paid. The Fund had no purchased optio n contracts outstanding at the end of the period.
The Fund values exchange traded options at the last sale price, or if no sale is reported, the last bid price for options it has purchased and the last ask price for options it has written. The Fund values options traded over-the-counter using inputs provided by primary pricing sources and industry standard models.
Indexed securities
The Fund may invest in indexed securities. Indexed securities are securities whose redemption values and/or coupons are linked to the prices of a specific instrument or financial statistic. The Fund uses indexed securities to increase or decrease its exposure to different underlying instruments and to gain exposure to markets in which investing through conventional securities is difficult. Indexed securities held by the Fund at the end of the period are listed in the Fund's Schedule of Investments.
Swap agreements
The Fund may enter into various types of swap agreements, including without limitation, interest rate, total return, credit default and variance swap agreements. A swap agreement is an agreement to exchange the return generated by one instrument for the return generated by another instrument. When entering into a swap agreement, the Fund and/or the swap counterparty may post or receive cash or securities as collateral. The party posting the collateral typically receives the interest associated with or payments related to the collateral and has the risk of loss related to the collateral.
35
GMO Short-Duration Collateral Fund
(A Series of GMO Trust)
Notes to Financial Statements — (Continued)
February 28, 2009
Interest rate swap agreements involve an exchange by the parties of their respective commitments to pay or right to receive interest, e.g., an exchange of floating rate interest payments for fixed rate interest payments with respect to the notional amount of principal.
Total return swap agreements involve a commitment by one party to pay interest to the other party in exchange for a payment to it from the other party based on the return of a reference instrument (e.g., a security or basket of securities), both based on notional amounts. To the extent the return of the reference instrument exceeds or falls short of the interest payments, one party will receive a payment from or make a payment to the other party.
In a credit default swap agreement, one party makes payments to another party in exchange for the right to receive a specified return if a credit event occurs with respect to a referenced entity or entities. Buying credit default protection reduces the buyer's exposure in the event of an issuer's default (e.g., it reduces risk where a party owns a security issued by or otherwise has exposure to the issuer). Selling credit default protection subjects the seller to exposure to an issuer's default. A seller of credit default protection receives payments in return for its obligation to pay the principal amount of a debt security (or other agreed-upon value) to the other party upon the occurrence of a credit event (e.g., issuer default or similar event). If no credit event occurs, the seller has no payment obligations. For credit default swap agreements on asset-backed securities, a credit event may be triggered by such events as the issuer's failure to pay interest or principal, an agreement of the holders of an asset-backed security to a maturity extension, a rating downgrade on the security or a write-down on the collateral underlying the security. For credit default swap agreements on corporate or sovereign issuers, a credit event may be triggered by such events as the issuer's bankruptcy, failure to pay interest or principal, repudiation/moratorium or restructuring.
Variance swap agreements involve an agreement by two parties to exchange cash flows based on the measured variance (or square of volatility) of a specified underlying asset. One party agrees to exchange a "fixed rate" or strike price payment for the "floating rate" or realized price variance on the underlying asset with respect to the notional amount. At inception, the strike price chosen is generally fixed at a level such that the fair value of the swap is zero. At the expiration date, the amount paid by one party to the other is the difference between the realized price variance of the underlying asset and the strike price multiplied by the notional amount. A receiver of the realized price variance would receive a payment when the realized price variance of the underlying asset is greater than the strike price and would make a payment when that variance is less than the strike price. A payer of the realized price variance woul d make a payment when the realized price variance of the underlying asset is greater than the strike price and would receive a payment when that variance is less than the strike price. This type of agreement is essentially a forward contract on the future realized price variance of the underlying asset.
The Fund prices its swap agreements daily using models that may incorporate quotations from market makers and records the change in value, if any, as unrealized gain or loss in the Statement of Operations.
36
GMO Short-Duration Collateral Fund
(A Series of GMO Trust)
Notes to Financial Statements — (Continued)
February 28, 2009
Payments received or made on swap agreements are recorded as realized gain or loss in the Statement of Operations. Gains or losses are realized upon termination of the swap agreements.
Swap agreements often are not actively traded on financial markets. The values assigned to them may differ significantly from the values that would be realized upon termination, and the differences could be material. Entering into swap agreements involves credit, legal, market and documentation risk that is not reflected in the amounts reported in the Statement of Assets and Liabilities. Such risks include the possibility that the party with whom the Fund contracts may default on its obligations to perform or disagree as to the meaning of contractual terms, or that the collateral that party posts may be insufficient or not timely received by the Fund. Credit risk may be particularly acute in an environment where financial services firms are exposed to systemic risks of the type evidenced by the insolvency of Lehman Brothers and subseque nt market disruptions. Swap agreements outstanding at the end of the period are listed in the Fund's Schedule of Investments.
Repurchase agreements
The Fund may enter into repurchase agreements. Under a repurchase agreement the Fund acquires a security for cash and obtains a simultaneous commitment from the seller to repurchase the security at an agreed upon price and date. The Fund, through its custodian, takes possession of securities collateralizing the repurchase agreement. The collateral is marked to market daily to ensure that the market value of the underlying assets is at least equal to the amount owed to the Fund in the event of default by the seller. If the seller of a repurchase agreement defaults or enters into insolvency proceedings and the value of the collateral declines, the Fund's recovery of cash may be delayed or limited. The Fund had no repurchase agreements outstanding at the end of the period.
Reverse repurchase agreements
The Fund may enter into reverse repurchase agreements. Under a reverse repurchase agreement the Fund sells portfolio assets subject to an agreement by the Fund to repurchase the same assets at a later date at a fixed price. In connection with these agreements, the Fund establishes segregated accounts with its custodian in which the Fund maintains cash, U.S. government securities or other assets equal in value to its obligations under the reverse repurchase agreement into which it has entered. Reverse repurchase agreements expose the Fund to the risk that the market value of the securities the Fund has sold under the agreement may decline below the price at which the Fund is obligated to repurchase them under the agreement. If the buyer in a reverse repurchase agreement files for bankruptcy or becomes insolvent, the Fund's use of proceeds from the sale of its securities may be restricted while the other party or its trustee or re ceiver determines whether to honor the Fund's right to repurchase the securities. Furthermore, in that situation the Fund may be unable to recover the securities it sold and as a result would realize a loss equal to the difference between the value of the securities and the payment it received for them. This loss would be greater to the extent the buyer paid less than the value of the securities the Fund sold to it (e.g., a buyer may pay $95 for a bond with a market value of $100). The market value of the securities the Fund has sold
37
GMO Short-Duration Collateral Fund
(A Series of GMO Trust)
Notes to Financial Statements — (Continued)
February 28, 2009
is determined daily and any additional required collateral is allocated to or sent by the Fund on the next business day. The Fund had no reverse repurchase agreements outstanding at the end of the period.
Securities lending
The Fund may lend its securities to qualified brokers. The loans are collateralized with cash or liquid securities with a market value at least equal to the market value of the securities upon entering into the loan. As with other extensions of credit, the Fund may bear the risk of loss with respect to the investment of the collateral, the risk of delay in and/or inability to exercise its rights with respect to the collateral, and the risk of delay in recovery or loss of rights in the loaned securities should the borrower of the securities fail financially. If a loan is collateralized by U.S. government securities, the Fund receives a fee from the borrower. If a loan is collateralized by cash, the Fund typically invests the cash collateral for its own account. For the year from March 1, 2008 through February 28, 2009, the Fund did not participate in securities lending.
Taxes and distributions
The Fund intends to qualify each tax year as a regulated investment company under Subchapter M of the Internal Revenue Code of 1986, as amended (the "Code"). The Fund intends to distribute substantially all of its net investment income and all of its net realized short-term and long-term capital gain, if any, after giving effect to any available capital loss carryforwards for U.S. federal income tax purposes. Therefore, no provision for U.S. federal income or excise tax is necessary.
The Fund's policy is to declare and pay distributions as determined by the Trustees (or their delegates). All distributions are paid in shares of the Fund, at net asset value, unless the shareholder elects to receive cash distributions. Distributions to shareholders are recorded by the Fund on the ex-dividend date.
Income and capital gain distributions are determined in accordance with U.S. federal income tax regulations, which may differ from U.S. GAAP. Certain capital accounts in the financial statements are periodically adjusted for permanent differences in order to reflect their tax character. These adjustments have no impact on net assets or net asset value per share. Temporary differences that arise from recognizing certain items of income, expense, gain or loss in different periods for financial statement and tax purposes will reverse at some time in the future. Distributions in excess of net investment income or net realized gains are temporary over-distributions for financial statement purposes resulting from differences in the recognition or classification of income or distributions for financial statement and tax purposes.
U.S. GAAP and tax accounting differences primarily relate to derivative contract transactions, foreign currency transactions, capital loss carryforwards, post-October capital and currency losses, differing treatment of accretion and amortization, and redemption in-kind transactions.
38
GMO Short-Duration Collateral Fund
(A Series of GMO Trust)
Notes to Financial Statements — (Continued)
February 28, 2009
The following reclassification represents the amount necessary to report the stated components of net assets on a tax basis, excluding certain temporary differences, as of February 28, 2009. The financial highlights exclude these adjustments.
| Distributions in Excess of Net Investment Income | Accumulated Net Realized Loss | Paid-in Capital | |||||||||
| $ | 12,876,778 | $ | 259,672,791 | $ | (272,549,569 | ) | |||||
The tax character of distributions declared to shareholders is as follows:
| 2/28/2009 | 2/29/2008 | ||||||||||
| Ordinary income (including any net short-term capital gain) | $ | 266,488,025 | $ | 418,731,518 | |||||||
| Tax return of capital | 538,644,733 | — | |||||||||
| Total distributions | $ | 805,132,758 | $ | 418,731,518 | |||||||
Distributions in excess of tax basis earnings and profits, if significant, are reported in the financial statements as a return of capital for tax purposes.
As of February 28, 2009, the Fund elected to defer to March 1, 2009 post-October capital and currency losses of $39,640,884 and $28,599, respectively.
As of February 28, 2009, the Fund had capital loss carryforwards available to offset future realized gains if any, to the extent permitted by the Code. Utilization of the capital loss carryforwards could be subject to limitations imposed by the Code related to share ownership activity. Such losses expire as follows:
| 2/28/2011 | $ | (29,576,884 | ) | ||||
| 2/29/2012 | (142,552 | ) | |||||
| 2/28/2014 | (614,650 | ) | |||||
| 2/28/2015 | (5,952,458 | ) | |||||
| 2/29/2016 | (1,158,601 | ) | |||||
| 2/28/2017 | (32,360,541 | ) | |||||
| Total | $ | (69,805,686 | ) | ||||
39
GMO Short-Duration Collateral Fund
(A Series of GMO Trust)
Notes to Financial Statements — (Continued)
February 28, 2009
As of February 28, 2009, the approximate cost for U.S. federal income tax purposes and gross and net unrealized appreciation (depreciation) in value of investments were as follows:
| Aggregate Cost | Gross Unrealized Appreciation | Gross Unrealized (Depreciation) | Net Unrealized Appreciation (Depreciation) | ||||||||||||
| $ | 4,984,449,263 | $ | 213,896 | $ | (1,292,508,048 | ) | $ | (1,292,294,152 | ) | ||||||
For the period ended February 28, 2009, the Fund had net realized losses attributed to redemption in-kind transactions of $274,134,071.
The Fund is subject to the provisions of Financial Accounting Standards Board Interpretation No. 48 ("FIN 48"), Accounting for Uncertainty in Income Taxes — an Interpretation of FASB Statement No. 109. FIN 48 sets forth a minimum threshold for financial statement recognition of a tax position taken or expected to be taken in a tax return that could affect the Fund's financial statements. The Fund did not have any unrecognized tax benefits or liabilities at February 28, 2009, nor did it have any increases or decreases in unrecognized tax benefits or liabilities for the period then ended. The Fund is subject to examination prior to the expiration of the statute of limitations by U.S. federal and state tax authorities for tax returns filed.
Security transactions and related investment income
Security transactions in the financial statements are accounted for on the trade date. Dividend income, net of applicable foreign withholding taxes, if any, is recorded on the ex-dividend date or, if later, when the Fund is informed of the ex-dividend date. Interest income is recorded on the accrual basis and is adjusted for the amortization of premiums and accretion of discounts. Principal on inflation indexed securities is adjusted for inflation and any increase or decrease is recorded as interest income or loss. Income is not recognized on securities for which collection is not expected. Non-cash dividends, if any, are recorded at the fair market value of the asset received. In determining the net gain or loss on securities sold, the Fund uses the identified cost basis for the purposes of determining the cost basis.
Expenses
The majority of the expenses of the Trust are directly identifiable to an individual fund. Expenses that are not readily identifiable to a specific fund are allocated taking into consideration, among other things, the nature and type of expense and the relative size of the funds.
State Street Bank and Trust Company ("State Street") serves as custodian, fund accounting agent and transfer agent of the Fund. State Street's fees may be reduced by an earnings allowance calculated on the average daily cash balances the Fund maintains with State Street. The Fund receives the benefit of the earnings allowance. In addition, Goldman Sachs Agency Lending, the Fund's securities lending agent, has agreed to reimburse the Fund for certain transactional expenses related to securities lending activity.
40
GMO Short-Duration Collateral Fund
(A Series of GMO Trust)
Notes to Financial Statements — (Continued)
February 28, 2009
Credit balances or expense reimbursements used to reduce fees, if any, are reported as a reduction of expenses in the Statement of Operations.
Purchases and redemptions of Fund shares
Effective October 8, 2008, the Fund instituted a fee on cash redemptions of 1.00% of the amount redeemed. Effective October 20, 2008, the fee on cash redemptions was changed to 2.00% of the amount redeemed. The Fund may impose a new purchase premium and/or redemption fee, or modify or eliminate an existing purchase premium and/or redemption fee, at any time. If the Manager determines that any portion of a cash redemption is offset by a corresponding cash purchase on the same day, the Fund will ordinarily waive or reduce the redemption fee with respect to that portion. In addition, the Fund may waive or reduce the redemption fee in extraordinary circumstances if the purchase or redemption will not cause the Fund to incur transaction costs. All redemption fees are paid to the Fund and recorded by the Fund as paid-in-capital. In-kind redemption transactions are generally not subject to redemption fees except when they include a cas h component. However, when a substantial portion of a Fund is being redeemed, the Fund may charge a redemption fee based on estimated or known transaction costs resulting from those redemptions.
Investment risks
To manage the Fund's cash collateral needs in extraordinary market conditions, the Manager reserves the right to reduce or eliminate the Fund's derivative exposures, including those that are intended to cause the Fund to track its benchmark more closely. A reduction in those exposures without replacing them with benchmark securities will tend to cause the performance of the Fund to track its benchmark less closely and make the Fund's performance more dependent on the performance of the asset-backed securities it holds directly or indirectly.
To address in part the cash management issues described above, the Fund expects to honor nearly all redemptions of its shares in-kind for the foreseeable future. If redeeming shareholders from the Fund choose to sell assets received in-kind immediately and current adverse market conditions continue, they may experience difficulty selling the assets at favorable prices. To the extent that the Fund honors redemptions in cash, redeeming shareholders will bear the redemption fees described in the Purchases and Redemptions of Fund Shares note.
Among other trading agreements, the Fund is party to International Swaps and Derivatives Association, Inc. Master Agreements ("ISDA Agreements") with select counterparties that generally govern over-the-counter derivative transactions entered into by the Fund. The ISDA Master Agreements typically include standard representations and warranties as well as contractual terms related to collateral, events of default, termination events, and other standard provisions. Termination events may include the decline in the net assets of the Fund below a certain level over a specified period of time and may entitle a counterparty to elect to terminate early with respect to some or all the transactions under the ISDA Agreement with that counterparty. Such an election by one or more of the counterparties could have a material impact on the
41
GMO Short-Duration Collateral Fund
(A Series of GMO Trust)
Notes to Financial Statements — (Continued)
February 28, 2009
Fund's operations. Due to declines in the net assets of the Fund during the year ended February 28, 2009, one or more counterparties may be entitled to terminate early but none has taken such action.
Recently issued accounting pronouncement
In March 2008, FASB issued Statement of Financial Accounting Standards No. 161, Disclosures about Derivative Instruments and Hedging Activities ("SFAS 161"). SFAS 161 is effective for fiscal years and interim periods beginning after November 15, 2008. SFAS 161 requires enhanced disclosures about the Fund's derivative and hedging activities. The Manager is currently evaluating the impact the adoption of SFAS 161 will have on the Fund's financial statement disclosures.
3. Fees and other transactions with affiliates
GMO does not charge the Fund any management or service fees for its services. In addition, the Manager has contractually agreed to reimburse the Fund for Fund expenses through at least June 30, 2009 (excluding fees and expenses of the independent Trustees of the Trust, fees and expenses for legal services not approved by the Manager for the Trust, compensation and expenses of the Trust's Chief Compliance Officer ("CCO") (excluding any employee benefits), brokerage commissions, securities lending fees and expenses, interest expense, transfer taxes, and other investment-related costs (including expenses associated with investments in any company that is an investment company or would be an investment company under the 1940 Act, but for the exceptions to the definition of investment company provided in Section 3(c)(1) and 3(c)(7) of the 1940 Act), hedging transaction fees, extraordinary, non-recurring and certain other unusual expe nses (including taxes)).
The Fund's portion of the fees paid by the Trust to the Trust's independent Trustees and CCO during the year ended February 28, 2009 was $98,923 and $41,588, respectively. The compensation and expenses of the CCO are included in miscellaneous expenses in the Statement of Operations. The Fund paid no remuneration to any other officer of the Trust.
4. Purchases and sales of securities
For the year ended February 28, 2009, cost of purchases and proceeds from sales of investments, other than short-term obligations, were as follows:
| Purchases | Sales | ||||||||||
| U.S. Government securities | $ | 63,698,142 | $ | 58,009,447 | |||||||
| Investments (non-U.S. Government securities) | 835,992,382 | 3,083,572,090 | |||||||||
42
GMO Short-Duration Collateral Fund
(A Series of GMO Trust)
Notes to Financial Statements — (Continued)
February 28, 2009
5. Guarantees
In the normal course of business the Fund enters into contracts with third-party service providers that contain a variety of representations and warranties and that provide general indemnifications. The Fund's maximum exposure under these arrangements is unknown, as it involves future claims that may be made against the Fund that have not yet occurred. Based on experience, management is of the view that the risk of loss in connection with its indemnification obligations is remote; however, there can be no assurance that such obligations will not result in material liabilities that adversely affect the Fund.
6. Principal shareholders and related parties
As of February 28, 2009, 66.99% of the outstanding shares of the Fund were held by two shareholders, each holding more than 10% of the Fund's outstanding shares. On that date, no other shareholder owned more than 10% of the outstanding shares of the Fund. Each of the shareholders are other funds of the Trust. Redemptions from (or investments into) the Fund by or on behalf of these large shareholders may have a material effect on the Fund.
As of February 28, 2009, no shares of the Fund were held by senior management of the Manager and GMO Trust officers and 99.99% of the Fund's shares were held by accounts for which the Manager had investment discretion.
7. Share transactions
The Declaration of Trust permits the Trust to issue an unlimited number of shares of beneficial interest (without par value). Transactions in Fund shares were as follows:
| Year Ended February 28, 2009 | Year Ended February 29, 2008 | ||||||||||||||||||
| Shares | Amount | Shares | Amount | ||||||||||||||||
| Shares sold | 89,796,548 | $ | 2,127,502,850 | 333,248,563 | $ | 8,426,752,200 | |||||||||||||
| Shares issued to shareholders in reinvestment of distributions | 1,977,373 | 46,978,867 | 16,958,629 | 418,731,518 | |||||||||||||||
| Shares repurchased | (195,999,454 | ) | (4,421,978,170 | ) | (288,235,189 | ) | (7,257,297,919 | ) | |||||||||||
| Redemption fees | — | 4,769,406 | — | — | |||||||||||||||
| Net increase (decrease) | (104,225,533 | ) | $ | (2,242,727,047 | ) | 61,972,003 | $ | 1,588,185,799 | |||||||||||
43
Report of Independent Registered Public Accounting Firm
To the Trustees of GMO Trust and the Shareholders of
GMO Short-Duration Collateral Fund:
In our opinion, the accompanying statement of assets and liabilities, including the schedule of investments, and the related statements of operations and of changes in net assets and the financial highlights present fairly, in all material respects, the financial position of GMO Short-Duration Collateral Fund (the "Fund") at February 28, 2009, the results of its operations for the year then ended, the changes in its net assets for each of the two years in the period then ended and the financial highlights for each of the five years in the period then ended, in conformity with accounting principles generally accepted in the United States of America. These financial statements and financial highlights (hereafter referred to as "financial statements") are the responsibility of the Fund's management. Our responsibility is to express an opinion on these financial statements based on our audits. We conducted our audits of these financ ial statements in accordance with the standards of the Public Company Accounting Oversight Board (United States). Those standards require that we plan and perform the audit to obtain reasonable assurance about whether the financial statements are free of material misstatement. An audit includes examining, on a test basis, evidence supporting the amounts and disclosures in the financial statements, assessing the accounting principles used and significant estimates made by management, and evaluating the overall financial statement presentation. We believe that our audits, which included confirmation of securities at February 28, 2009 by correspondence with the custodian and brokers, provide a reasonable basis for our opinion.
PricewaterhouseCoopers LLP
Boston, Massachusetts
April 29, 2009
44
GMO Short-Duration Collateral Fund
(A Series of GMO Trust)
Fund Expenses
February 28, 2009 (Unaudited)
Expense Examples: The following information is in relation to expenses for the six month period ended February 28, 2009.
As a shareholder of the Fund, you may incur two types of costs: (1) transaction costs, including redemption fees; and (2) ongoing costs. This example is intended to help you understand your ongoing costs (in dollars) of investing in the Fund and to compare these costs with the ongoing costs of investing in other mutual funds.
These examples are based on an investment of $1,000 invested at the beginning of the period and held for the entire period, September 1, 2008 through February 28, 2009.
Actual Expenses
The first line of the table below provides information about actual account values and actual expenses. You may use the information in this line, together with the amount you invested, to estimate the expenses that you paid over the period. Simply divide your account value by $1,000 (for example, a $10,000,000 account value divided by $1,000 = 10,000), then multiply the result by the number in the first line under the heading entitled "Net Expense Incurred" to estimate the expenses you paid on your account during this period.
Hypothetical Example for Comparison Purposes
The second line of the table below provides information about hypothetical account values and hypothetical expenses based on the Fund's actual expense ratio and an assumed rate of return of 5% per year before expenses, which is not the Fund's actual return. The hypothetical account values and expenses may not be used to estimate the actual ending account balance or expenses you paid for the period. You may use this information to compare the ongoing costs of investing in the Fund with other funds. To do so, compare this 5% hypothetical example with the 5% hypothetical examples that appear in the shareholder reports of other funds.
Please note that the expenses shown in the table are meant to highlight your ongoing costs only and do not reflect any transactional costs, such as purchase premiums and redemption fees. Therefore, the second line of the table is useful in comparing ongoing costs only, and will not help you determine the relative total costs of owning different funds. In addition, if these transactional costs were included, your costs would have been higher.
| Annualized Net Expense Ratio | Beginning Account Value | Ending Account Value | Net Expense Incurred * | ||||||||||||||||
| 1) Actual | 0.01 | % | $ | 1,000.00 | $ | 852.80 | $ | 0.05 | |||||||||||
| 2) Hypothetical | 0.01 | % | $ | 1,000.00 | $ | 1,024.74 | $ | 0.05 | |||||||||||
* Expenses are calculated using the annualized expense ratio for the six months ended February 28, 2009, multiplied by the average account value over the period, multiplied by 181 days in the period, divided by 365 days in the year.
45
GMO Short-Duration Collateral Fund
(A Series of GMO Trust)
Tax Information for the Tax Year Ended February 28, 2009 (Unaudited)
The Fund will notify shareholders of amounts for use in preparing 2009 income tax forms in early 2010.
The Fund hereby designates as qualified interest income with respect to its taxable year ended February 28, 2009, $162,831,186 or if determined to be different, the qualified interest income of such year.
46
GMO Short-Duration Collateral Fund
(A Series of GMO Trust)
Note Concerning Distributions (Unaudited)
The Fund previously reported estimated sources of any dividends, short-term capital gains, and long-term capital gains distributions paid on a per share basis. Pursuant to Rule 19a-1(e) of the Investment Company Act, the following serves as a correction of such estimates. 1.38% of distributions to shareholders declared from return of capital during the Fund's fiscal year were reclassified to distributions from net investment income and are reflected as such in the Statement of Changes in Net Assets.
47
Trustees and Officers (Unaudited)
The following tables list the Trust's Trustees and Officers as of the date of this report; their address and date of birth ("DOB"); their position with the Trust; the length of time holding that position with the Trust; their principal occupation(s) during the past five years; the number of portfolios in the fund complex they oversee; and other directorships they hold in companies subject to registration or reporting requirements of the Securities Exchange Act of 1934 (generally called "public companies") or in registered investment companies. The Trust's Statement of Additional Information ("SAI") includes additional information about the Trust's trustees, including changes subsequent to the date of the report. The SAI is available, without charge, upon request by writing GMO, c/o GMO Trust, 40 Rowes Wharf, Boston, MA 02110.
Independent Trustees:
| Name, Address, and DOB | Position(s) Held with Trust | Term of Office1 Length of and Time Served | Principal Occupation(s) During Past Five Years | Number of Portfolios in Fund Complex Overseen by Trustee | Other Directorships Held by Trustee | ||||||||||||||||||
| Donald W. Glazer, Esq. c/o GMO Trust 40 Rowes Wharf Boston, MA 02110 DOB: 07/26/1944 | Chairman of the Board of Trustees | Chairman of the Board of Trustees since March 2005; Lead Independent Trustee (September 2004 – March 2005); Trustee since December 2000. | Consultant – Law and Business2; Author of Legal Treatises. | 59 | None. | ||||||||||||||||||
1 Each Trustee is elected to serve during the continued lifetime of the Trust until he/she dies, resigns or is removed, or if sooner, until the next meeting of Shareholders called for the purpose of electing Trustees and until the election and qualification of his/her successor.
2 As part of Mr. Glazer's work as a consultant, he provides part-time consulting services to Goodwin Procter LLP ("Goodwin"). Goodwin has provided legal services to Renewable Resources, LLC, an affiliate of GMO; GMO, in connection with its relationship with Renewable Resources; and funds managed by Renewable Resources. Mr. Glazer has represented that he has no financial interest in, and is not involved in the provision of, such legal services. In the calendar years ended December 31, 2007 and December 31, 2008, these entities paid $789,416 and $183,864 respectively, in legal fees and disbursements to Goodwin. In correspondence with the Staff of the Securities and Exchange Commission beginning in August 2006, the Independent Trustees' legal counsel provided the Staff with information regarding Mr. Glazer's relationship with Goodwin and h is other business activities. On September 11, 2007, based on information that had been given to the Staff as of that date, the Staff provided oral no-action assurance consistent with the opinion of the Independent Trustees' legal counsel that Mr. Glazer is not an "interested person" of the Trust.
48
Independent Trustees — (Continued)
| Name, Address, and DOB | Position(s) Held with Trust | Term of Office1 Length of and Time Served | Principal Occupation(s) During Past Five Years | Number of Portfolios in Fund Complex Overseen by Trustee | Other Directorships Held by Trustee | ||||||||||||||||||
| W. Nicholas Thorndike c/o GMO Trust 40 Rowes Wharf Boston, MA 02110 DOB: 03/28/1933 | Trustee | Since March 2005. | Director or trustee of various corporations and charitable organizations, including Courier Corporation (a book publisher and manufacturer) (July 1989 – present); Putnam Funds (December 1992 – June 2004); and Providence Journal (a newspaper publisher) (December 1986 – December 2003). | 59 | Director of Courier Corporation (a book publisher and manufacturer); Member of the Investment Committee of Partners HealthCare System, Inc.3 | ||||||||||||||||||
| Peter Tufano c/o GMO Trust 40 Rowes Wharf Boston, MA 02110 DOB: 04/22/1957 | Trustee | Since December 2008. | Sylvan C. Coleman Professor of Financial Management, Harvard Business School (since 1989). | 59 | Trustee of State Street Navigator Securities Lending Trust (3 Portfolios). | ||||||||||||||||||
1 Each Trustee is elected to serve during the continued lifetime of the Trust until he/she dies, resigns or is removed, or if sooner, until the next meeting of Shareholders called for the purpose of electing Trustees and until the election and qualification of his/her successor.
3 Partners HealthCare System, Inc. is a client of the Manager.
49
Principal Officers:
| Name, Address, and DOB | Position(s) Held with Trust | Term of Office4 and Length of Time Served | Principal Occupation(s) During Past Five Years5 | ||||||||||||
| J.B. Kittredge DOB: 08/22/1954 | President and Chief Executive Officer | Since March 2009. | General Counsel, Grantham, Mayo, Van Otterloo & Co. LLC (October 2005 – Present); Partner, Ropes & Gray LLP | ||||||||||||
| Sheppard N. Burnett c/o GMO Trust 40 Rowes Wharf Boston, MA 02110 DOB: 10/24/1968 | Treasurer and Chief Financial Officer | Chief Financial Officer since March 2007; Treasurer since November 2006; Assistant Treasurer, September 2004 – November 2006. | Fund Administration Staff, Grantham, Mayo, Van Otterloo & Co. LLC (June 2004 – present); Vice President, Director of Tax, Columbia Management Group (2002-2004). | ||||||||||||
| Brent C. Arvidson c/o GMO Trust 40 Rowes Wharf Boston, MA 02110 DOB: 06/26/1969 | Assistant Treasurer | Since August 1998. | Senior Fund Administrator, Grantham, Mayo, Van Otterloo & Co. LLC. | ||||||||||||
| John L. Nasrah c/o GMO Trust 40 Rowes Wharf Boston, MA 02110 DOB: 05/27/1977 | Assistant Treasurer | Since March 2007. | Fund Administrator, Grantham, Mayo, Van Otterloo & Co. LLC (September 2004 – present); Tax Analyst, Bain & Company, Inc. (June 2003 – September 2004). | ||||||||||||
| Mahmoodur Rahman c/o GMO Trust 40 Rowes Wharf Boston, MA 02110 DOB: 11/30/1967 | Assistant Treasurer | Since September 2007. | Fund Administrator, Grantham, Mayo, Van Otterloo & Co. LLC (April 2007 – present); Vice President and Senior Tax Manager, Massachusetts Financial Services Company (January 2000 – April 2007). | ||||||||||||
| Michael E. Gillespie c/o GMO Trust 40 Rowes Wharf Boston, MA 02110 DOB: 02/18/1958 | Chief Compliance Officer | Since March 2005. | Vice President of Compliance (June 2004 – February 2005) and Director of Domestic Compliance (March 2002 – June 2004), Fidelity Investments. | ||||||||||||
4 Each officer is elected to hold such office until his or her successor is duly elected and qualified to carry out the duties and responsibilities of the office, or until he or she resigns or is removed from office.
5 Each of Messrs. Burnett, Arvidson, Bohan, and Pottle serves as an officer and/or director of certain pooled investment vehicles of which GMO or an affiliate of GMO serves as the investment adviser
50
Principal Officers — (Continued)
| Name, Address, and DOB | Position(s) Held with Trust | Term of Office4 and Length of Time Served | Principal Occupation(s) During Past Five Years5 | ||||||||||||
| Jason B. Harrison c/o GMO Trust 40 Rowes Wharf Boston, MA 02110 DOB: 01/29/1977 | Vice President and Clerk | Vice President since November 2006; Clerk since March 2006. | Legal Counsel, Grantham, Mayo, Van Otterloo & Co. LLC (since February 2006) and Attorney, Ropes & Gray LLP (September 2002 – February 2006). | ||||||||||||
| David L. Bohan c/o GMO Trust 40 Rowes Wharf Boston, MA 02110 DOB: 06/21/1964 | Vice President and Assistant Clerk | Vice President since March 2005; Assistant Clerk since March 2006. | Legal Counsel, Grantham, Mayo, Van Otterloo & Co. LLC. | ||||||||||||
| Gregory L. Pottle c/o GMO Trust 40 Rowes Wharf Boston, MA 02110 DOB: 07/09/1971 | Vice President and Assistant Clerk | Since November 2006. | Legal Counsel, Grantham, Mayo, Van Otterloo & Co. LLC. | ||||||||||||
| Anne K. Trinque c/o GMO Trust 40 Rowes Wharf Boston, MA 02110 DOB: 04/15/1978 | Vice President and Assistant Clerk | Since September 2007. | Legal Counsel, Grantham, Mayo, Van Otterloo & Co. LLC (January 2007 – present); Attorney, Goodwin Procter LLP (September 2003 – January 2007). | ||||||||||||
| Cheryl Wakeham c/o GMO Trust 40 Rowes Wharf Boston, MA 02110 DOB: 10/29/1958 | Vice President and Anti-Money Laundering Officer | Since December 2004. | Manager, Client Service Administration, Grantham, Mayo, Van Otterloo & Co. LLC. | ||||||||||||
4 Each officer is elected to hold such office until his or her successor is duly elected and qualified to carry out the duties and responsibilities of the office, or until he or she resigns or is removed from office.
5 Each of Messrs. Burnett, Arvidson, Bohan, and Pottle serves as an officer and/or director of certain pooled investment vehicles of which GMO or an affiliate of GMO serves as the investment adviser
51
GMO Short-Duration Collateral Share Fund
(A Series of GMO Trust)
Annual Report
February 28, 2009
For a free copy of the Fund's proxy voting guidelines, shareholders may call 1-617-346-7646 (collect) or visit the Securities and Exchange Commission's website at www.sec.gov. Information regarding how the Fund voted proxies relating to portfolio securities during the most recent 12-month period ended June 30 is available on GMO's website at www.gmo.com, or on the Securities and Exchange Commission's website at www.sec.gov.
The Fund files its complete schedule of portfolio holdings with the Securities and Exchange Commission for the first and third quarter of each fiscal year on Form N-Q, which is available on the Commission's website at www.sec.gov. The Fund's Form N-Q may be reviewed and copied at the Commission's Public Reference Room in Washington, D.C. Information on the operation of the Public Reference Room may be obtained by calling 1-800-SEC-0330. The Fund has a policy with respect to disclosure of portfolio holdings under which it may also make available on GMO's website at www.gmo.com a complete schedule of portfolio holdings.
This report is prepared for the general information of shareholders. It is authorized for distribution to prospective investors only when preceded or accompanied by a prospectus for the GMO Trust, which contains a complete discussion of the risks associated with an investment in this Fund and other important information. The GMO Trust prospectus can be obtained at www.gmo.com.
GMO Short-Duration Collateral Share Fund
(A Series of GMO Trust)
Portfolio Management
Day-to-day management of the Fund's portfolio is the responsibility of the Fixed Income team at Grantham, Mayo, Van Otterloo & Co. LLC.
Management Discussion and Analysis of Fund Performance
The GMO Short-Duration Collateral Share Fund returned -15.9% for the fiscal year ended February 28, 2009, compared to +3.5% for the JPMorgan U.S. 3 Month Cash Index. The Fund underperformed the benchmark during the fiscal year by 19.4%.
The underperformance stemmed from price declines in the collateral pool in which the Fund invests a substantial portion of its total assets, the GMO Short Duration Collateral Fund (SDCF). SDCF invests primarily in U.S. and foreign floating-rate fixed income securities — mainly asset-backed securities.
Because the fiscal year was marked by sharply deteriorating liquidity conditions in securitized credit markets, spreads widened to all-time highs. In addition to widening spreads, SDCF suffered credit downgrades during the year: SDCF had 123 downgraded securities, representing 27.4% of its market value from the beginning of the year. At fiscal year-end, 73% of the SDCF's portfolio was rated AAA, 8% was rated AA, 2% was rated A, 12% was rated BBB, and 5% was rated below B.
With the extreme price volatility of asset-backed securities during the fiscal year, SDCF underperformed LIBOR by nearly 20%, directly contributing to the Fund's underperformance given its 99% exposure to SDCF during the period.
The views expressed herein are exclusively those of Grantham, Mayo, Van Otterloo & Co. LLC Management as of the date of this report and are subject to change. GMO disclaims any responsibility to update such views. They are not meant as investment advice. References to specific securities are not recommendations of such securities and may not be representative of any GMO portfolio's current or future investments.

Performance data quoted represents past performance and is not indicative of future results. The investment return and principal value of an investment will fluctuate so that an investor's shares, when redeemed, may be worth more or less than their original cost. Current performance data may be lower or higher than the performance data provided herein. To obtain performance information to the most recent month-end, visit www.gmo.com. Performance shown is net of all fees after reimbursement from the Manager. Each performance figure assumes a redemption at the end of the stated period and reflects a transaction fee of 2.00% on the redemption. Transaction fees are retained by the Fund to cover trading costs. Returns would have been lower had certain expenses not been reimbursed during the periods shown and do not include the effect of taxes on distributions and redem ptions. All information is unaudited.
* Class III performance information represents Class VI performance from March 1, 2006 to December 28, 2006 and Class III performance thereafter.
GMO Short-Duration Collateral Share Fund
(A Series of GMO Trust)
Investments Concentration Summary
February 28, 2009 (Unaudited)
| Asset Class Summary* | % of Total Net Assets | ||||||
| Debt Obligations | 97.8 | % | |||||
| Short-Term Investments | 2.6 | ||||||
| Forward Currency Contracts | 0.1 | ||||||
| Swaps | (0.8 | ) | |||||
| Other | 0.3 | ||||||
| 100.0 | % | ||||||
* The table above incorporates aggregate indirect asset class exposure associated with investments in GMO Short-Duration Collateral Fund.
| Industry Sector Summary** | % of Debt Obligations | ||||||
| Credit Cards | 23.2 | % | |||||
| Residential Asset-Backed Securities (United States) | 13.6 | ||||||
| Auto Financing | 12.2 | ||||||
| Residential Mortgage-Backed Securities (European) | 6.8 | ||||||
| Insured Auto Financing | 6.8 | ||||||
| CMBS | 6.6 | ||||||
| Business Loans | 5.9 | ||||||
| Student Loans | 5.1 | ||||||
| Residential Mortgage-Backed Securities (Australian) | 4.0 | ||||||
| Insured Other | 2.0 | ||||||
| Equipment Leases | 1.9 | ||||||
| Investment Grade Corporate Collateralized Debt Obligations | 1.8 | ||||||
| U.S. Government Agency | 1.3 | ||||||
| Rate Reduction Bonds | 1.3 | ||||||
| Bank Loan Collateralized Debt Obligations | 1.2 | ||||||
| CMBS Collateralized Debt Obligations | 1.1 | ||||||
| Insurance Premiums | 0.9 | ||||||
| Insured Credit Cards | 0.8 | ||||||
| Insured High Yield Collateralized Debt Obligations | 0.7 | ||||||
| U.S. Government | 0.6 | ||||||
| Insured Time Share | 0.6 | ||||||
| Insured Residential Mortgage-Backed Securities (United States) | 0.5 | ||||||
| Airlines | 0.4 | ||||||
| Trade Receivables | 0.3 | ||||||
| Insured Residential Asset-Backed Securities (United States) | 0.1 | ||||||
| Time Share | 0.1 | ||||||
| Insured Transportation | 0.1 | ||||||
| Residential Mortgage-Backed Securities (United States) | 0.1 | ||||||
| Collateralized Loan Obligations | 0.0 | ||||||
| Insured Business Loans | 0.0 | ||||||
| ABS Collateralized Debt Obligations | 0.0 | ||||||
| 100.0 | % | ||||||
** The table above incorporates aggregate industry sector exposure associated with investments in GMO Short-Duration Collateral Fund.
1
GMO Short-Duration Collateral Share Fund
(A Series of GMO Trust)
Schedule of Investments
(showing percentage of total net assets)
February 28, 2009
| Shares | Description | Value ($) | |||||||||
| MUTUAL FUNDS — 99.6% | |||||||||||
| Affiliated Issuers — 99.6% | |||||||||||
| 1,565,351 | GMO Short-Duration Collateral Fund | 26,767,495 | |||||||||
| TOTAL MUTUAL FUNDS (COST $33,412,424) | 26,767,495 | ||||||||||
| SHORT-TERM INVESTMENTS — 0.6% | |||||||||||
| Money Market Funds — 0.6% | |||||||||||
| 157,534 | State Street Institutional Treasury Plus Money Market Fund-Institutional Class | 157,534 | |||||||||
| TOTAL SHORT-TERM INVESTMENTS (COST $157,534) | 157,534 | ||||||||||
| TOTAL INVESTMENTS — 100.2% (Cost $33,569,958) | 26,925,029 | ||||||||||
| Other Assets and Liabilities (net) — (0.2%) | (47,050 | ) | |||||||||
| TOTAL NET ASSETS — 100.0% | $ | 26,877,979 | |||||||||
See accompanying notes to the financial statements.
2
GMO Short-Duration Collateral Share Fund
(A Series of GMO Trust)
Statement of Assets and Liabilities — February 28, 2009
| Assets: | |||||||
| Investments in unaffiliated issuers, at value (cost $157,534) (Note 2) | $ | 157,534 | |||||
| Investments in affiliated issuers, at value (cost $33,412,424) (Notes 2 and 8) | 26,767,495 | ||||||
| Cash | 1,303 | ||||||
| Dividends receivable | 23 | ||||||
| Receivable for expenses reimbursed by Manager (Note 3) | 5,370 | ||||||
| Total assets | 26,931,725 | ||||||
| Liabilities: | |||||||
| Payable to affiliate for (Note 3): | |||||||
| Management fee | 1,026 | ||||||
| Shareholder service fee | 3,077 | ||||||
| Trustees and Chief Compliance Officer of GMO Trust fees | 89 | ||||||
| Miscellaneous payable | 110 | ||||||
| Accrued expenses | 49,444 | ||||||
| Total liabilities | 53,746 | ||||||
| Net assets | $ | 26,877,979 | |||||
| Net assets consist of: | |||||||
| Paid-in capital | $ | 38,382,878 | |||||
| Accumulated net realized loss | (4,859,970 | ) | |||||
| Net unrealized depreciation | (6,644,929 | ) | |||||
| $ | 26,877,979 | ||||||
| Net assets attributable to: | |||||||
| Class III shares | $ | 26,877,979 | |||||
| Shares outstanding: | |||||||
| Class III | 1,573,246 | ||||||
| Net asset value per share: | |||||||
| Class III | $ | 17.08 | |||||
See accompanying notes to the financial statements.
3
GMO Short-Duration Collateral Share Fund
(A Series of GMO Trust)
Statement of Operations — Year Ended February 28, 2009
| Investment Income: | |||||||
| Dividends from affiliated issuers (Note 8) | $ | 1,513,034 | |||||
| Dividends | 466 | ||||||
| Total investment income | 1,513,500 | ||||||
| Expenses: | |||||||
| Management fee (Note 3) | 13,329 | ||||||
| Shareholder service fee – Class III (Note 3) | 39,987 | ||||||
| Custodian, fund accounting agent and transfer agent fees | 5,888 | ||||||
| Audit and tax fees | 35,403 | ||||||
| Legal fees | 399 | ||||||
| Trustees fees and related expenses (Note 3) | 555 | ||||||
| Registration fees | 1,656 | ||||||
| Miscellaneous | 2,956 | ||||||
| Total expenses | 100,173 | ||||||
| Fees and expenses reimbursed by Manager (Note 3) | (46,121 | ) | |||||
| Net expenses | 54,052 | ||||||
| Net investment income (loss) | 1,459,448 | ||||||
| Realized and unrealized gain (loss): | |||||||
| Net realized gain (loss) on: | |||||||
| Investments in affiliated issuers | (461,840 | ) | |||||
| Net realized gain (loss) | (461,840 | ) | |||||
| Change in net unrealized appreciation (depreciation) on: | |||||||
| Investments in affiliated issuers | (5,988,117 | ) | |||||
| Net realized and unrealized gain (loss) | (6,449,957 | ) | |||||
| Net increase (decrease) in net assets resulting from operations | $ | (4,990,509 | ) | ||||
See accompanying notes to the financial statements.
4
GMO Short-Duration Collateral Share Fund
(A Series of GMO Trust)
Statement of Changes in Net Assets
| Year Ended February 28, 2009 | Year Ended February 29, 2008 | ||||||||||
| Increase (decrease) in net assets: | |||||||||||
| Operations: | |||||||||||
| Net investment income (loss) | $ | 1,459,448 | $ | 1,554,865 | |||||||
| Net realized gain (loss) | (461,840 | ) | (422,578 | ) | |||||||
| Change in net unrealized appreciation (depreciation) | (5,988,117 | ) | (877,706 | ) | |||||||
| Net increase (decrease) in net assets from operations | (4,990,509 | ) | 254,581 | ||||||||
| Distributions to shareholders from: | |||||||||||
| Net investment income | |||||||||||
| Class III | (1,520,770 | ) | (1,493,543 | ) | |||||||
| Return of capital | |||||||||||
| Class III | (2,186,109 | ) | — | ||||||||
| (3,706,879 | ) | (1,493,543 | ) | ||||||||
| Net share transactions (Note 7): | |||||||||||
| Class III | 24,925,353 | (28,686,720 | ) | ||||||||
| Redemption fees (Notes 2 and 7): | |||||||||||
| Class III | 12,814 | — | |||||||||
| Total increase (decrease) in net assets resulting from net share transactions and redemption fees | 24,938,167 | (28,686,720 | ) | ||||||||
| Total increase (decrease) in net assets | 16,240,779 | (29,925,682 | ) | ||||||||
| Net assets: | |||||||||||
| Beginning of period | 10,637,200 | 40,562,882 | |||||||||
| End of period (including accumulated undistributed net investment income of $0 and $61,322, respectively) | $ | 26,877,979 | $ | 10,637,200 | |||||||
See accompanying notes to the financial statements.
5
GMO Short-Duration Collateral Share Fund
(A Series of GMO Trust)
Financial Highlights
(For a Class III share outstanding throughout each period)
| Year Ended February 28/29, | |||||||||||||||
| 2009 | 2008 | 2007(a) | |||||||||||||
| Net asset value, beginning of period | $ | 23.39 | $ | 25.05 | $ | 24.82 | |||||||||
| Income (loss) from investment operations: | |||||||||||||||
| Net investment income (loss)(b)† | 1.17 | 1.07 | (0.01 | ) | |||||||||||
| Net realized and unrealized gain (loss) | (4.92 | ) | (1.38 | ) | 0.24 | ||||||||||
| Total from investment operations | (3.75 | ) | (0.31 | ) | 0.23 | ||||||||||
| Less distributions to shareholders: | |||||||||||||||
| From net investment income | (0.81 | ) | (1.35 | ) | — | ||||||||||
| Return of capital | (1.75 | ) | — | — | |||||||||||
| Total distributions | (2.56 | ) | (1.35 | ) | — | ||||||||||
| Net asset value, end of period | $ | 17.08 | $ | 23.39 | $ | 25.05 | |||||||||
| Total Return(c) | (15.90 | )% | (1.33 | )% | 0.93 | %** | |||||||||
| Ratios/Supplemental Data: | |||||||||||||||
| Net assets, end of period (000's) | $ | 26,878 | $ | 10,637 | $ | 40,563 | |||||||||
| Net expenses to average daily net assets | 0.20 | % | 0.20 | % | 0.21 | %* | |||||||||
| Net investment income to average daily net assets(b) | 5.47 | % | 4.25 | % | (0.21 | )%* | |||||||||
| Portfolio turnover rate | 18 | % | 127 | % | 125 | %**†† | |||||||||
| Fees and expenses reimbursed by the Manager to average daily net assets: | 0.17 | % | 0.15 | % | 0.06 | %* | |||||||||
| Redemption fees consisted of the following per share amounts:† | $ | 0.01 | — | — | |||||||||||
(a) Period from December 28, 2006 (commencement of operations) through February 28, 2007.
(b) Net investment income is affected by the timing of the declaration of dividends by GMO Short-Duration Collateral Fund.
(c) The total returns would have been lower had certain expenses not been reimbursed during the periods shown and assumes the effect of reinvested distributions. Calculation excludes redemption fees which are borne by the shareholder.
† Calculated using average shares outstanding throughout the period.
†† Calculation represents portfolio turnover of the Fund for the period from March 1, 2006 (commencement of operations) through February 28, 2007.
* Annualized.
** Not annualized.
See accompanying notes to the financial statements.
6
GMO Short-Duration Collateral Share Fund
(A Series of GMO Trust)
Notes to Financial Statements
February 28, 2009
1. Organization
GMO Short-Duration Collateral Share Fund (the "Fund") is a series of GMO Trust (the "Trust"). The Fund is registered under the Investment Company Act of 1940, as amended, as an open-end, non-diversified management investment company. The Fund is advised and managed by Grantham, Mayo, Van Otterloo & Co. LLC (the "Manager" or "GMO"). The Trust was established as a Massachusetts business trust under the laws of The Commonwealth of Massachusetts on June 24, 1985. The Declaration of Trust permits the Trustees of the Trust ("Trustees") to create an unlimited number of series of shares ("Funds") and to subdivide Funds into classes.
The Fund seeks total return comparable to that of the JPMorgan U.S. 3 Month Cash Index. The Fund invests substantially all of its assets in GMO Short-Duration Collateral Fund ("SDCF") (an arrangement often referred to as a "master-feeder" structure) and, to a limited extent, in cash and cash equivalents. The Fund's investment objective and principal investment strategies are identical to those of SDCF. SDCF seeks to achieve its investment objective by investing primarily in high quality U.S. and foreign adjustable rate fixed income securities with low volatility. SDCF may invest a substantial portion of its assets in asset-backed securities, some of which have been downgraded.
The financial statements of SDCF should be read in conjunction with the Fund's financial statements. These financial statements are available, without charge, upon request, by calling (617) 346-7646 (collect). Shares of SDCF are not publicly available for direct purchase.
The Fund indirectly (through SDCF) invests in asset-backed securities with contractual cash flows, such as collateralized mortgage obligations and commercial mortgage-backed securities, including securities backed by sub-prime mortgage loans, credit card receivables and auto loan receivables. The value, liquidity and related income of these securities are sensitive to changes in economic conditions, including real estate values, delinquencies and/or defaults, and may be adversely affected by changes in interest rates and shifts in the market's perception of the securities' market values.
The Fund will, if deemed prudent by the Manager, take temporary defensive measures (until the Manager has determined that normal conditions have returned or that it is otherwise prudent to resume investing in accordance with the Fund's normal investment strategies) and may not achieve its investment objectives during those periods. Recent changes in the credit markets have reduced the liquidity of all types of fixed income securities, including asset-backed securities.
2. Significant accounting policies
The following is a summary of significant accounting policies followed by the Fund in the preparation of its financial statements. These policies are in conformity with accounting principles generally accepted in the United States of America ("U.S. GAAP") and have been consistently followed by the Fund in
7
GMO Short-Duration Collateral Share Fund
(A Series of GMO Trust)
Notes to Financial Statements — (Continued)
February 28, 2009
preparing its financial statements. The preparation of financial statements in accordance with U.S. GAAP requires management to make estimates and assumptions that affect the reported amounts and disclosures in the financial statements. Actual results could differ from those estimates. The accounting records of the Fund are maintained in U.S. dollars.
Portfolio valuation
Shares of SDCF are generally valued at their net asset value.
Investments held by SDCF funds are valued as follows. Securities listed on a securities exchange for which market quotations are readily available are valued at the last sale price or official closing price on each business day, or if there is no such reported sale or official closing price, at the most recent quoted bid price. Unlisted securities for which market quotations are readily available are generally valued at the most recent quoted bid price. Debt instruments with a remaining maturity of sixty days or less are generally valued at amortized cost, which approximates fair value. Securities for which quotations are not readily available or whose values the Manager has determined to be unreliable are valued at fair value as determined in good faith by the Trustees or persons acting at their direction pursuant to procedures approved by the Trustees. By its nature, a fair value price is a good faith estimate of the value of a security at a given point in time and may not reflect the value that would be realized if the security were sold. The difference between a fair value price and the value realized upon a sale could be material.
Typically the Fund and the underlying funds value debt instruments based on prices supplied by a primary pricing source chosen by the Manager. The Manager evaluates primary pricing sources on an ongoing basis and may change a pricing source should the Manager deem it appropriate. If it deems it appropriate, the Manager, at its discretion, may override a price supplied by a primary source by using a price provided by another source. The prices provided by primary pricing sources may differ from the value that would be realized if the securities were sold, and the differences could be material.
Certain securities held by the Fund and underlying funds are valued on the basis of prices provided by a single source. As of February 28, 2009, the total value of these securities represented 38.26% of the net assets. The single source prices provided may differ from the value that would be realized if the securities were sold, and the differences could be material. In addition, although alternative prices are available for other securities held by the Fund, those alternative sources would not necessarily confirm the security price used by the Fund. Therefore, the existence of those alternative sources does not necessarily provide greater certainty about the prices used by the Fund.
In September 2006, the Financial Accounting Standards Board ("FASB") issued Statement of Financial Accounting Standards No. 157, Fair Value Measurements ("SFAS 157"). SFAS 157 is effective for the Fund's current fiscal year. While the adoption of SFAS 157 does not have an effect on the Fund's net asset value, it does require additional disclosures about fair value measurements. SFAS 157 establishes a
8
GMO Short-Duration Collateral Share Fund
(A Series of GMO Trust)
Notes to Financial Statements — (Continued)
February 28, 2009
three-level hierarchy for disclosure of fair value measurements. The valuation hierarchy is based upon the reliability of inputs to the valuation of the Fund's investments. The three levels are defined as follows:
Level 1 – Valuations based on quoted prices for identical securities in active markets.
Level 2 – Valuations determined using other significant direct or indirect observable inputs.
Level 3 – Valuations based on inputs that are unobservable and significant.
The inputs or methodology used for valuing securities are not necessarily an indication of the risk associated with investing in those securities.
The following is a summary of the fair valuations according to inputs used as of February 28, 2009 in valuing the Fund's investments:
| Asset Valuation Inputs | Investments in Securities | Other Financial Instruments | |||||||||
| Level 1 - Quoted Prices | $ | — | $ | — | |||||||
| Level 2 - Other Significant Observable Inputs | 26,925,029 | — | |||||||||
| Level 3 - Significant Unobservable Inputs | — | — | |||||||||
| Total | $ | 26,925,029 | $ | — | |||||||
| Liability Valuation Inputs | Investments in Securities | Other Financial Instruments | |||||||||
| Level 1 - Quoted Prices | $ | — | $ | — | |||||||
| Level 2 - Other Significant Observable Inputs | — | — | |||||||||
| Level 3 - Significant Unobservable Inputs | — | — | |||||||||
| Total | $ | — | $ | — | |||||||
For the underlying fund's summary of valuation inputs (which include Level 3 - Significant Unobservable Inputs) please refer to SDCF's portfolio valuation note.
The Fund held no investments or other financial instruments at either February 29, 2008 or February 28, 2009, whose fair value was determined using Level 3 inputs.
Taxes and distributions
The Fund intends to qualify each tax year as a regulated investment company under Subchapter M of the Internal Revenue Code of 1986, as amended (the "Code"). The Fund intends to distribute substantially all of its net investment income and all of its net realized short-term and long-term capital gain, if any, after
9
GMO Short-Duration Collateral Share Fund
(A Series of GMO Trust)
Notes to Financial Statements — (Continued)
February 28, 2009
giving effect to any available capital loss carryforwards for U.S. federal income tax purposes. Therefore, no provision for U.S. federal income or excise tax is necessary.
The Fund's policy is to declare and pay distributions as determined by the Trustees (or their delegates). All distributions are paid in shares of the Fund, at net asset value, unless the shareholder elects to receive cash distributions. Distributions to shareholders are recorded by the Fund on the ex-dividend date.
Income and capital gain distributions are determined in accordance with U.S. federal income tax regulations, which may differ from U.S. GAAP. Certain capital accounts in the financial statements are periodically adjusted for permanent differences in order to reflect their tax character. These adjustments have no impact on net assets or net asset value per share. Temporary differences that arise from recognizing certain items of income, expense, gain or loss in different periods for financial statement and tax purposes will reverse at some time in the future. Distributions in excess of net investment income or net realized gains are temporary over-distributions for financial statement purposes resulting from differences in the recognition or classification of income or distributions for financial statement and tax purposes.
U.S. GAAP and tax accounting differences primarily relate to capital loss carryforwards and losses on wash sale transactions.
The following reclassification represents the amount necessary to report the stated components of net assets on a tax basis, excluding certain temporary differences, as of February 28, 2009. The financial highlights exclude these adjustments.
| Accumulated Undistributed Net Investment Income | Accumulated Net Realized Loss | Paid-in Capital | |||||||||
| $ | — | $ | 17,629 | $ | (17,629 | ) | |||||
The tax character of distributions declared to shareholders is as follows:
| 2/28/2009 | 2/29/2008 | ||||||||||
| Ordinary income (including any net short-term capital gain) | $ | 1,520,770 | $ | 1,493,543 | |||||||
| Tax return of capital | 2,186,109 | — | |||||||||
| Total distributions | $ | 3,706,879 | $ | 1,493,543 | |||||||
Distributions in excess of tax basis earnings and profits, if significant, are reported in the financial statements as a return of capital for tax purposes.
10
GMO Short-Duration Collateral Share Fund
(A Series of GMO Trust)
Notes to Financial Statements — (Continued)
February 28, 2009
As of February 28, 2009, the Fund had capital loss carryforwards available to offset future realized gains if any, to the extent permitted by the Code. Utilization of the capital loss carryforwards could be subject to limitations imposed by the Code related to share ownership activity. Such losses expire as follows:
| 2/29/2016 | $ | (3,400,357 | ) | ||||
| 2/28/2017 | (862,157 | ) | |||||
| Total | $ | (4,262,514 | ) | ||||
As of February 28, 2009, the approximate cost for U.S. federal income tax purposes and gross and net unrealized appreciation (depreciation) in value of investments were as follows:
| Aggregate Cost | Gross Unrealized Appreciation | Gross Unrealized (Depreciation) | Net Unrealized Appreciation (Depreciation) | ||||||||||||
| $ | 34,167,414 | $ | — | $ | (7,242,385 | ) | $ | (7,242,385 | ) | ||||||
The Fund is subject to the provisions of Financial Accounting Standards Board Interpretation No. 48 ("FIN 48"), Accounting for Uncertainty in Income Taxes — an Interpretation of FASB Statement No. 109. FIN 48 sets forth a minimum threshold for financial statement recognition of a tax position taken or expected to be taken in a tax return that could affect the Fund's financial statements. The Fund did not have any unrecognized tax benefits or liabilities at February 28, 2009, nor did it have any increases or decreases in unrecognized tax benefits or liabilities for the period then ended. The Fund is subject to examination prior to the expiration of the statute of limitations by U.S. federal and state tax authorities for tax returns filed.
Security transactions and related investment income
Security transactions in the financial statements are accounted for on the trade date. Income dividends and capital gain distributions from SDCF are recorded on the ex-dividend date. Interest income is recorded on the accrual basis. Non-cash dividends, if any, are recorded at the fair market value of the asset received. In determining the net gain or loss on securities sold, the Fund uses the identified cost basis for the purposes of determining the cost basis.
Expenses
The majority of the expenses of the Trust are directly identifiable to an individual fund. Expenses that are not readily identifiable to a specific fund are allocated taking into consideration, among other things, the nature and type of expense and the relative size of the funds. In addition, the Fund incurs fees and expenses indirectly as a shareholder in SDCF (See Note 3).
11
GMO Short-Duration Collateral Share Fund
(A Series of GMO Trust)
Notes to Financial Statements — (Continued)
February 28, 2009
State Street Bank and Trust Company ("State Street") serves as custodian, fund accounting agent and transfer agent of the Fund. State Street's fees may be reduced by an earnings allowance calculated on the average daily cash balances the Fund maintains with State Street. The Fund receives the benefit of the earnings allowance. Credit balances or expense reimbursements used to reduce fees, if any, are reported as a reduction of expenses in the Statement of Operations.
Purchases and redemptions of Fund shares
Effective October 8, 2008, the Fund instituted a fee on cash redemptions of 1.00% of the amount redeemed. Effective October 21, 2008, the fee on cash redemptions was changed to 2.00% of the amount redeemed. The Fund may impose a new purchase premium and/or redemption fee, or modify or eliminate an existing purchase premium and/or redemption fee, at any time. If the Manager determines that any portion of a cash redemption is offset by a corresponding cash purchase on the same day, the Fund will ordinarily waive or reduce the redemption fee with respect to that portion. In addition, the Fund may waive or reduce the redemption fee in extraordinary circumstances if the purchase or redemption will not cause the Fund to incur transaction costs. All redemption fees are paid to the Fund and recorded by the Fund as paid-in-capital. In-kind redemption transactions are generally not subject to redemption fees except when they include a cas h component. However, when a substantial portion of a Fund is being redeemed, the Fund may charge a redemption fee based on estimated or known transaction costs resulting from those redemptions.
Investment risks
To manage the Fund's cash collateral needs in extraordinary market conditions, the Manager reserves the right to reduce or eliminate the Fund's derivative exposures, including those that are intended to cause the Fund to track its benchmark more closely. A reduction in those exposures without replacing them with benchmark securities will tend to cause the performance of the Fund to track its benchmark less closely and make the Fund's performance more dependent on the performance of the asset-backed securities it holds directly or indirectly.
To address in part the cash management issues described above, the Fund expects to honor nearly all redemptions of its shares in-kind for the foreseeable future. If redeeming shareholders from the Fund choose to sell assets received in-kind immediately and current adverse market conditions continue, they may experience difficulty selling the assets at favorable prices. To the extent that the Fund honors redemptions in cash, redeeming shareholders will bear the redemption fees described in the Purchases and Redemptions of Fund Shares note.
Recently issued accounting pronouncement
In March 2008, FASB issued Statement of Financial Accounting Standards No. 161, Disclosures about Derivative Instruments and Hedging Activities ("SFAS 161"). SFAS 161 is effective for fiscal years and interim periods beginning after November 15, 2008. SFAS 161 requires enhanced disclosures about the Fund's derivative and hedging activities. The Manager is currently evaluating the impact the adoption of SFAS 161 will have on the Fund's financial statement disclosures.
12
GMO Short-Duration Collateral Share Fund
(A Series of GMO Trust)
Notes to Financial Statements — (Continued)
February 28, 2009
3. Fees and other transactions with affiliates
GMO receives a management fee for the services it provides to the Fund. That fee is paid monthly at the annual rate of 0.05% of average daily net assets. The Fund has adopted a Shareholder Service Plan under which the Fund pays GMO a shareholder service fee for client and shareholder service, reporting, and other support. Pursuant to the Shareholder Service Plan, the shareholder service fee is calculated based on average daily net assets at the annual rate of 0.15% for Class III shares.
Through at least June 30, 2009, the Manager has contractually agreed to reimburse the Fund for Fund expenses incurred through that date to the extent the Fund's total annual operating expenses (excluding "Excluded Expenses", as defined below) exceed 0.05% of the Fund's average daily net assets. Excluded Expenses include shareholder service fees, expenses indirectly incurred by investment in SDCF, fees and expenses of the independent Trustees of the Trust, fees and expenses for legal services not approved by the Manager for the Trust, compensation and expenses of the Trust's Chief Compliance Officer ("CCO") (excluding any employee benefits), brokerage commissions, securities lending fees and expenses, interest expense, transfer taxes, and other investment-related costs (including expenses associated with investments in any company that is an investment company or would be an investment company under the 1940 Act, but for the exce ptions to the definition of investment company provided in Section 3(c)(1) and 3(c)(7) of the 1940 Act), hedging transaction fees, extraordinary, non-recurring and certain other unusual expenses (including taxes).
The Fund incurs fees and expenses indirectly as a shareholder in SDCF. For the year ended February 28, 2009, these indirect fees and expenses expressed as an annualized percentage of the Fund's average daily net assets were as follows:
| Indirect Net Expenses (excluding shareholder service fees and interest expense) | Indirect Shareholder Service Fees | Indirect Interest Expense | Total Indirect Expenses | ||||||||||||
| 0.005 | % | 0.000 | % | 0.000 | % | 0.005 | % | ||||||||
The Fund's portion of the fees paid by the Trust to the Trust's independent Trustees and CCO during the year ended February 28, 2009 was $555 and $181, respectively. The compensation and expenses of the CCO are included in miscellaneous expenses in the Statement of Operations. The Fund paid no remuneration to any other officer of the Trust.
13
GMO Short-Duration Collateral Share Fund
(A Series of GMO Trust)
Notes to Financial Statements — (Continued)
February 28, 2009
4. Purchases and sales of securities
Cost of purchases and proceeds from sales of securities, excluding short-term investments, for the year ended February 28, 2009 aggregated $30,353,197 and $4,650,600, respectively.
5. Guarantees
In the normal course of business the Fund enters into contracts with third-party service providers that contain a variety of representations and warranties and that provide general indemnifications. The Fund's maximum exposure under these arrangements is unknown, as it involves future claims that may be made against the Fund that have not yet occurred. Based on experience, management is of the view that the risk of loss in connection with its indemnification obligations is remote; however, there can be no assurance that such obligations will not result in material liabilities that adversely affect the Fund.
6. Principal shareholders and related parties
As of February 28, 2009, 83.88% of the outstanding shares of the Fund were held by three shareholders, each holding more than 10% of the Fund's outstanding shares. On that date, no other shareholder owned more than 10% of the outstanding shares of the Fund. Redemptions from (or investments into) the Fund by or on behalf of these large shareholders may have a material effect on the Fund.
As of February 28, 2009, 86.93% of the Fund's shares were held by senior management of the Manager and GMO Trust officers and none of the Fund's shares were held by accounts for which the Manager had investment discretion.
7. Share transactions
The Declaration of Trust permits the Trust to issue an unlimited number of shares of beneficial interest (without par value). Transactions in Fund shares were as follows:
| Year Ended February 28, 2009 | Year Ended February 29, 2008 | ||||||||||||||||||
| Class III: | Shares | Amount | Shares | Amount | |||||||||||||||
| Shares sold | 1,190,692 | $ | 27,314,596 | 1,953,067 | $ | 49,066,088 | |||||||||||||
| Shares issued to shareholders in reinvestment of distributions | 144,906 | 2,586,630 | 62,533 | 1,492,040 | |||||||||||||||
| Shares repurchased | (217,211 | ) | (4,975,873 | ) | (3,180,036 | ) | (79,244,848 | ) | |||||||||||
| Redemption fees | — | 12,814 | — | — | |||||||||||||||
| Net increase (decrease) | 1,118,387 | $ | 24,938,167 | (1,164,436 | ) | $ | (28,686,720 | ) | |||||||||||
14
GMO Short-Duration Collateral Share Fund
(A Series of GMO Trust)
Notes to Financial Statements — (Continued)
February 28, 2009
8. Investments in affiliated issuers
A summary of the Fund's transactions in the shares of other funds of the Trust during the year ended February 28, 2009 is set forth below:
| Affiliate | Value, beginning of period | Purchases | Sales Proceeds | Dividend Income | Distributions of Realized Gains | Value, end of period | |||||||||||||||||||||
| GMO Short-Duration Collateral Fund | $ | 10,677,894 | $ | 30,353,197 | $ | 4,650,600 | $ | 1,513,034 | u | $ | — | $ | 26,767,495 | ||||||||||||||
| Totals | $ | 10,677,894 | $ | 30,353,197 | $ | 4,650,600 | $ | 1,513,034 | $ | — | $ | 26,767,495 | |||||||||||||||
u The Fund received total distributions in the amount of $4,676,073, of which $3,163,039 was a return of capital.
15
Report of Independent Registered Public Accounting Firm
To the Trustees of GMO Trust and the Shareholders of
GMO Short-Duration Collateral Share Fund:
In our opinion, the accompanying statement of assets and liabilities, including the schedule of investments, and the related statements of operations and of changes in net assets and the financial highlights present fairly, in all material respects, the financial position of GMO Short-Duration Collateral Share Fund (the "Fund") at February 28, 2009, the results of its operations for the year then ended, the changes in its net assets for each of the two years in the period then ended and the financial highlights for each of the periods indicated, in conformity with accounting principles generally accepted in the United States of America. These financial statements and financial highlights (hereafter referred to as "financial statements") are the responsibility of the Fund's management. Our responsibility is to express an opinion on these financial statements based on our audits. We conducted our audits of these financial statemen ts in accordance with the standards of the Public Company Accounting Oversight Board (United States). Those standards require that we plan and perform the audit to obtain reasonable assurance about whether the financial statements are free of material misstatement. An audit includes examining, on a test basis, evidence supporting the amounts and disclosures in the financial statements, assessing the accounting principles used and significant estimates made by management, and evaluating the overall financial statement presentation. We believe that our audits, which included confirmation of securities at February 28, 2009 by correspondence with the custodian, provide a reasonable basis for our opinion.
PricewaterhouseCoopers LLP
Boston, Massachusetts
April 29, 2009
16
GMO Short-Duration Collateral Share Fund
(A Series of GMO Trust)
Fund Expenses
February 28, 2009 (Unaudited)
Expense Examples: The following information is in relation to expenses for the six month period ended February 28, 2009.
As a shareholder of the Fund, you may incur two types of costs: (1) transaction costs, including redemption fees; and (2) ongoing costs, including management fees, shareholder service fees, and other Fund expenses. This example is intended to help you understand your ongoing costs (in dollars) of investing in the Fund and to compare these costs with the ongoing costs of investing in other mutual funds.
These examples are based on an investment of $1,000 invested at the beginning of the period and held for the entire period, September 1, 2008 through February 28, 2009.
Actual Expenses
The first line of the table below provides information about actual account values and actual expenses. You may use the information in this line, together with the amount you invested, to estimate the expenses that you paid over the period. Simply divide your account value by $1,000 (for example, a $10,000,000 account value divided by $1,000 = 10,000), then multiply the result by the number in the first line under the heading entitled "Net Expense Incurred" to estimate the expenses you paid on your account during this period.
Hypothetical Example for Comparison Purposes
The second line of the table below provides information about hypothetical account values and hypothetical expenses based on the Fund's actual expense ratio and an assumed rate of return of 5% per year before expenses, which is not the Fund's actual return. The hypothetical account values and expenses may not be used to estimate the actual ending account balance or expenses you paid for the period. You may use this information to compare the ongoing costs of investing in the Fund with other funds. To do so, compare this 5% hypothetical example with the 5% hypothetical examples that appear in the shareholder reports of other funds.
Please note that the expenses shown in the table are meant to highlight your ongoing costs only and do not reflect any transactional costs. Therefore, the second line of the table is useful in comparing ongoing costs only, and will not help you determine the relative total costs of owning different funds. In addition, if these transactional costs were included, your costs would have been higher.
| Annualized Net Expense Ratio | Beginning Account Value | Ending Account Value | Net Expense Incurred* | ||||||||||||||||
| Class III | |||||||||||||||||||
| 1) Actual | 0.21 | % | $ | 1,000.00 | $ | 854.30 | $ | 0.97 | |||||||||||
| 2) Hypothetical | 0.21 | % | $ | 1,000.00 | $ | 1,023.75 | $ | 1.05 | |||||||||||
* Expenses are calculated using the Class's annualized expense ratio (including indirect expenses incurred) for the six months ended February 28, 2009, multiplied by the average account value over the period, multiplied by 181 days in the period, divided by 365 days in the year.
17
GMO Short-Duration Collateral Share Fund
(A Series of GMO Trust)
Tax Information for the Tax Year Ended February 28, 2009 (Unaudited)
The Fund will notify shareholders of amounts for use in preparing 2009 income tax forms in early 2010.
The Fund hereby designates as qualified interest income with respect to its taxable year ended February 28, 2009, $675,988 or if determined to be different, the qualified interest income of such year.
18
GMO Short Duration Collateral Share Fund
(A Series of GMO Trust)
Note Concerning Distributions (Unaudited)
The Fund previously reported estimated sources of any dividends, short-term capital gains, and long-term capital gains distributions paid on a per share basis. Pursuant to Rule 19a-1(e) of the Investment Company Act, the following serves as a correction of such estimates. 1.38% of distributions to shareholders declared from return of capital during the Fund's fiscal year were reclassified to distributions from net investment income and are reflected as such in the Statement of Changes in Net Assets.
19
Trustees and Officers (Unaudited)
The following tables list the Trust's Trustees and Officers as of the date of this report; their address and date of birth ("DOB"); their position with the Trust; the length of time holding that position with the Trust; their principal occupation(s) during the past five years; the number of portfolios in the fund complex they oversee; and other directorships they hold in companies subject to registration or reporting requirements of the Securities Exchange Act of 1934 (generally called "public companies") or in registered investment companies. The Trust's Statement of Additional Information ("SAI") includes additional information about the Trust's trustees, including changes subsequent to the date of the report. The SAI is available, without charge, upon request by writing GMO, c/o GMO Trust, 40 Rowes Wharf, Boston, MA 02110.
Independent Trustees:
| Name, Address, and DOB | Position(s) Held with Trust | Term of Office1 and Length of Time Served | Principal Occupation(s) During Past Five Years | Number of Portfolios in Fund Complex Overseen by Trustee | Other Directorships Held by Trustee | ||||||||||||||||||
| Donald W. Glazer, Esq. c/o GMO Trust 40 Rowes Wharf Boston, MA 02110 DOB: 07/26/1944 | Chairman of the Board of Trustees | Chairman of the Board of Trustees since March 2005; Lead Independent Trustee (September 2004 – March 2005); Trustee since December 2000. | Consultant – Law and Business2; Author of Legal Treatises. | 59 | None. | ||||||||||||||||||
1 Each Trustee is elected to serve during the continued lifetime of the Trust until he/she dies, resigns or is removed, or if sooner, until the next meeting of Shareholders called for the purpose of electing Trustees and until the election and qualification of his/her successor.
2 As part of Mr. Glazer's work as a consultant, he provides part-time consulting services to Goodwin Procter LLP ("Goodwin"). Goodwin has provided legal services to Renewable Resources, LLC, an affiliate of GMO; GMO, in connection with its relationship with Renewable Resources; and funds managed by Renewable Resources. Mr. Glazer has represented that he has no financial interest in, and is not involved in the provision of, such legal services. In the calendar years ended December 31, 2007 and December 31, 2008, these entities paid $789,416 and $183,864 respectively, in legal fees and disbursements to Goodwin. In correspondence with the Staff of the Securities and Exchange Commission beginning in August 2006, the Independent Trustees' legal counsel provided the Staff with information regarding Mr. Glazer's relationship with Goodwin and h is other business activities. On September 11, 2007, based on information that had been given to the Staff as of that date, the Staff provided oral no-action assurance consistent with the opinion of the Independent Trustees' legal counsel that Mr. Glazer is not an "interested person" of the Trust.
20
Independent Trustees — (Continued)
| Name, Address, and DOB | Position(s) Held with Trust | Term of Office1 and Length of Time Served | Principal Occupation(s) During Past Five Years | Number of Portfolios in Fund Complex Overseen by Trustee | Other Directorships Held by Trustee | ||||||||||||||||||
| W. Nicholas Thorndike c/o GMO Trust 40 Rowes Wharf Boston, MA 02110 DOB: 03/28/1933 | Trustee | Since March 2005. | Director or trustee of various corporations and charitable organizations, including Courier Corporation (a book publisher and manufacturer) (July 1989 – present); Putnam Funds (December 1992 – June 2004); and Providence Journal (a newspaper publisher) (December 1986 – December 2003). | 59 | Director of Courier Corporation (a book publisher and manufacturer); Member of the Investment Committee of Partners HealthCare System, Inc.3 | ||||||||||||||||||
| Peter Tufano c/o GMO Trust 40 Rowes Wharf Boston, MA 02110 DOB: 04/22/1957 | Trustee | Since December 2008. | Sylvan C. Coleman Professor of Financial Management, Harvard Business School (since 1989). | 59 | Trustee of State Street Navigator Securities Lending Trust (3 Portfolios). | ||||||||||||||||||
1 Each Trustee is elected to serve during the continued lifetime of the Trust until he/she dies, resigns or is removed, or if sooner, until the next meeting of Shareholders called for the purpose of electing Trustees and until the election and qualification of his/her successor.
3 Partners HealthCare System, Inc. is a client of the Manager.
21
Principal Officers:
| Name, Address, and DOB | Position(s) Held with Trust | Term of Office4 and Length of Time Served | Principal Occupation(s) During Past Five Years5 | ||||||||||||
| J.B. Kittredge DOB: 08/22/1954 | President and Chief Executive Officer | Since March 2009. | General Counsel, Grantham, Mayo, Van Otterloo & Co. LLC (October 2005 – Present); Partner, Ropes & Gray LLP. | ||||||||||||
| Sheppard N. Burnett c/o GMO Trust 40 Rowes Wharf Boston, MA 02110 DOB: 10/24/1968 | Treasurer and Chief Financial Officer | Chief Financial Officer since March 2007; Treasurer since November 2006; Assistant Treasurer, September 2004 – November 2006. | Fund Administration Staff, Grantham, Mayo, Van Otterloo & Co. LLC (June 2004 – present); Vice President, Director of Tax, Columbia Management Group (2002 – 2004). | ||||||||||||
| Brent C. Arvidson c/o GMO Trust 40 Rowes Wharf Boston, MA 02110 DOB: 06/26/1969 | Assistant Treasurer | Since August 1998. | Senior Fund Administrator, Grantham, Mayo, Van Otterloo & Co. LLC. | ||||||||||||
| John L. Nasrah c/o GMO Trust 40 Rowes Wharf Boston, MA 02110 DOB: 05/27/1977 | Assistant Treasurer | Since March 2007. | Fund Administrator, Grantham, Mayo, Van Otterloo & Co. LLC (September 2004 – present); Tax Analyst, Bain & Company, Inc. (June 2003 – September 2004). | ||||||||||||
| Mahmoodur Rahman c/o GMO Trust 40 Rowes Wharf Boston, MA 02110 DOB: 11/30/1967 | Assistant Treasurer | Since September 2007. | Fund Administrator, Grantham, Mayo, Van Otterloo & Co. LLC (April 2007 – present); Vice President and Senior Tax Manager, Massachusetts Financial Services Company (January 2000 – April 2007). | ||||||||||||
| Michael E. Gillespie c/o GMO Trust 40 Rowes Wharf Boston, MA 02110 DOB: 02/18/1958 | Chief Compliance Officer | Since March 2005. | Vice President of Compliance (June 2004 – February 2005) and Director of Domestic Compliance (March 2002 – June 2004), Fidelity Investments. | ||||||||||||
4 Each officer is elected to hold such office until his or her successor is duly elected and qualified to carry out the duties and responsibilities of the office, or until he or she resigns or is removed from office.
5 Each of Messrs. Burnett, Arvidson, Bohan, and Pottle serves as an officer and/or director of certain pooled investment vehicles of which GMO or an affiliate of GMO serves as the investment adviser.
22
Principal Officers — (Continued)
| Name, Address, and DOB | Position(s) Held with Trust | Term of Office4 and Length of Time Served | Principal Occupation(s) During Past Five Years5 | ||||||||||||
| Jason B. Harrison c/o GMO Trust 40 Rowes Wharf Boston, MA 02110 DOB: 01/29/1977 | Vice President and Clerk | Vice President since November 2006; Clerk since March 2006. | Legal Counsel, Grantham, Mayo, Van Otterloo & Co. LLC (since February 2006) and Attorney, Ropes & Gray LLP (September 2002 – February 2006). | ||||||||||||
| David L. Bohan c/o GMO Trust 40 Rowes Wharf Boston, MA 02110 DOB: 06/21/1964 | Vice President and Assistant Clerk | Vice President since March 2005; Assistant Clerk since March 2006. | Legal Counsel, Grantham, Mayo, Van Otterloo & Co. LLC. | ||||||||||||
| Gregory L. Pottle c/o GMO Trust 40 Rowes Wharf Boston, MA 02110 DOB: 07/09/1971 | Vice President and Assistant Clerk | Since November 2006. | Legal Counsel, Grantham, Mayo, Van Otterloo & Co. LLC. | ||||||||||||
| Anne K. Trinque c/o GMO Trust 40 Rowes Wharf Boston, MA 02110 DOB: 04/15/1978 | Vice President and Assistant Clerk | Since September 2007. | Legal Counsel, Grantham, Mayo, Van Otterloo & Co. LLC (January 2007 – present); Attorney, Goodwin Procter LLP (September 2003 – January 2007). | ||||||||||||
| Cheryl Wakeham c/o GMO Trust 40 Rowes Wharf Boston, MA 02110 DOB: 10/29/1958 | Vice President and Anti-Money Laundering Officer | Since December 2004. | Manager, Client Service Administration, Grantham, Mayo, Van Otterloo & Co. LLC. | ||||||||||||
4 Each officer is elected to hold such office until his or her successor is duly elected and qualified to carry out the duties and responsibilities of the office, or until he or she resigns or is removed from office.
5 Each of Messrs. Burnett, Arvidson, Bohan, and Pottle serves as an officer and/or director of certain pooled investment vehicles of which GMO or an affiliate of GMO serves as the investment adviser.
23
GMO Special Situations Fund
(A Series of GMO Trust)
Annual Report
February 28, 2009
For a free copy of the Fund's proxy voting guidelines, shareholders may call 1-617-346-7646 (collect) or visit the Securities and Exchange Commission's website at www.sec.gov. Information regarding how the Fund voted proxies relating to portfolio securities during the most recent 12-month period ended June 30 is available on GMO's website at www.gmo.com, or on the Securities and Exchange Commission's website at www.sec.gov.
The Fund files its complete schedule of portfolio holdings with the Securities and Exchange Commission for the first and third quarter of each fiscal year on Form N-Q, which is available on the Commission's website at www.sec.gov. The Fund's Form N-Q may be reviewed and copied at the Commission's Public Reference Room in Washington, D.C. Information on the operation of the Public Reference Room may be obtained by calling 1-800-SEC-0330.
This report is prepared for the general information of shareholders. It is authorized for distribution to prospective investors only when preceded or accompanied by a private placement memorandum, which contains a complete discussion of the risks associated with an investment in this Fund and other important information. The private placement memorandum can be obtained by calling 1-617-346-7646 (collect).
GMO Special Situations Fund
(A Series of GMO Trust)
Portfolio Management
Day-to-day management of the Fund's portfolio is the responsibility of the Asset Allocation team at Grantham, Mayo, Van Otterloo & Co. LLC.
Management Discussion and Analysis of Fund Performance
The GMO Special Situations Fund's investment objectives are capital appreciation and capital preservation.
Shares of the Fund are not publicly offered and are principally available only to other GMO Funds and certain other accredited investors.
The Class III shares of the Fund returned +19.5% for the fiscal year ended February 28, 2009, as compared to +1.3% for the Citigroup 3-Month Treasury Bill Index. During the fiscal year the Fund was exposed substantially to currencies through its investment in currency forwards.
Implementation was positive, driven by long positions in Japanese yen and Swiss francs.
The views expressed herein are exclusively those of Grantham, Mayo, Van Otterloo & Co. LLC Management as of the date of this report and are subject to change. GMO disclaims any responsibility to update such views. They are not meant as investment advice.

Performance data quoted represents past performance and is not indicative of future results. The investment return and principal value of an investment will fluctuate so that an investor's shares, when redeemed, may be worth more or less than their original cost. Current performance data may be lower or higher than the performance data provided herein. To obtain performance information to the most recent month-end please call 1-617-346-7646 (collect). Performance shown is net of all fees after reimbursement from the Manager. Returns would have been lower had certain expenses not been reimbursed during the periods shown and do not include the effect of taxes on distributions and redemptions. All information is unaudited. Performance for Class VI shares will vary due to different fees.
* Class III performance information represents Class VI performance from July 31, 2007 to August 13, 2007 and Class III performance thereafter.
GMO Special Situations Fund
(A Series of GMO Trust)
Investments Concentration Summary
February 28, 2009 (Unaudited)
| Asset Class Summary | % of Total Net Assets | ||||||
| Short-Term Investments | 83.4 | % | |||||
| Debt Obligations | 15.7 | ||||||
| Swaps | 0.4 | ||||||
| Written Options | (1.4 | ) | |||||
| Other | 1.9 | ||||||
| 100.0 | % | ||||||
1
GMO Special Situations Fund
(A Series of GMO Trust)
Schedule of Investments
(showing percentage of total net assets)
February 28, 2009
| Par Value ($) / Shares | Description | Value ($) | |||||||||||||
| DEBT OBLIGATIONS — 15.7% | |||||||||||||||
| Foreign Government Obligations — 9.6% | |||||||||||||||
| JPY | 1,536,720,000 | Japanese Government CPI Linked Bond, 1.10%, due 09/10/16 (a) | 13,147,817 | ||||||||||||
| JPY | 789,432,000 | Japanese Government CPI Linked Bond, 1.00%, due 06/10/16 (a) | 6,693,529 | ||||||||||||
| JPY | 792,948,000 | Japanese Government CPI Linked Bond, 0.80%, due 03/10/16 (a) | 6,690,842 | ||||||||||||
| JPY | 785,850,000 | Japanese Government CPI Linked Bond, 0.80%, due 12/10/15 (a) | 6,691,340 | ||||||||||||
| Total Foreign Government Obligations | 33,223,528 | ||||||||||||||
| U.S. Government — 6.1% | |||||||||||||||
| 21,647,340 | U.S. Treasury Inflation Indexed Bond, 0.88%, due 04/15/10 (a) | 21,356,443 | |||||||||||||
| TOTAL DEBT OBLIGATIONS (COST $56,387,602) | 54,579,971 | ||||||||||||||
| SHORT-TERM INVESTMENTS — 83.4% | |||||||||||||||
| Money Market Funds — 5.0% | |||||||||||||||
| 17,245,583 | State Street Institutional Treasury Money Market Fund-Institutional Class | 17,245,583 | |||||||||||||
| Other Short-Term Investments — 78.4% | |||||||||||||||
| 38,278,369 | State Street Eurodollar Time Deposit, 0.01%, due 03/02/09 | 38,278,369 | |||||||||||||
| 234,000,000 | U.S. Treasury Bill, 0.48%, due 09/24/09 (b) | 233,357,202 | |||||||||||||
| Total Other Short-Term Investments | 271,635,571 | ||||||||||||||
| TOTAL SHORT-TERM INVESTMENTS (COST $288,133,027) | 288,881,154 | ||||||||||||||
| TOTAL INVESTMENTS — 99.1% (Cost $344,520,629) | 343,461,125 | ||||||||||||||
| Other Assets and Liabilities (net) — 0.9% | 3,052,852 | ||||||||||||||
| TOTAL NET ASSETS — 100.0% | $ | 346,513,977 | |||||||||||||
See accompanying notes to the financial statements.
2
GMO Special Situations Fund
(A Series of GMO Trust)
Schedule of Investments — (Continued)
February 28, 2009
A summary of outstanding financial instruments at February 28, 2009 is as follows:
Written Options
A summary of open written option contracts for the Fund at February 28, 2009 is as follows:
| Notional Amount | Expiration Date | Description | Premiums | Market Value | |||||||||||||||||||
| Put | $ | 13,000 | 2/25/2011 | USD S&P 500 Index, Strike 625.00 | $ | (1,125,800 | ) | $ | (1,291,691 | ) | |||||||||||||
| Put | 13,000 | 2/24/2012 | USD S&P 500 Index, Strike 625.00 | (1,410,240 | ) | (1,602,552 | ) | ||||||||||||||||
| Put | 13,000 | 2/25/2013 | USD S&P 500 Index, Strike 625.00 | (1,616,420 | ) | (1,822,302 | ) | ||||||||||||||||
| $ | (4,152,460 | ) | $ | (4,716,545 | ) | ||||||||||||||||||
Swap Agreements
Interest Rate Swaps
| Notional Amount | Expiration Date | Counterparty | Receive (Pay)# | Fixed Rate | Variable Rate | Market Value | |||||||||||||||||||||||||
| 100,000,000 | USD | 11/15/2022 | JP Morgan Chase Bank | (Pay) | 0.00 | % | 3 month LIBOR | $ | 1,654,297 | ||||||||||||||||||||||
| 100,000,000 | USD | 11/25/2023 | JP Morgan Chase Bank | (Pay) | 0.00 | % | 3 month LIBOR | 2,386,313 | |||||||||||||||||||||||
| $ | 4,040,610 | ||||||||||||||||||||||||||||||
| Premiums to (Pay) Receive | $ | 103,299 | |||||||||||||||||||||||||||||
# (Pay) - Fund pays fixed rate and receives variable rate.
Receive - Fund receives fixed rate and pays variable rate.
Total Return Swaps
| Notional Amount | Expiration Date | Counterparty | Pay | Receive | Market Value | ||||||||||||||||||||||
| 100,000,000 | USD | 8/12/2009 | JP Morgan | 1.00 | % | Return on Treasury | |||||||||||||||||||||
| Chase Bank | Coupon STRIP | $ | (1,868,383 | ) | |||||||||||||||||||||||
| 100,000,000 | USD | 8/19/2009 | JP Morgan | 1.00 | % | Return on Treasury | |||||||||||||||||||||
| Chase Bank | Principal STRIP | (918,444 | ) | ||||||||||||||||||||||||
| $ | (2,786,827 | ) | |||||||||||||||||||||||||
| Premiums to (Pay) Receive | $ | — | |||||||||||||||||||||||||
As of February 28, 2009, for the swap contracts held, the Fund had sufficient cash and/or securities to cover any commitments or collateral requirements of the relevant broker or exchange.
See accompanying notes to the financial statements.
3
GMO Special Situations Fund
(A Series of GMO Trust)
Schedule of Investments — (Continued)
February 28, 2009
Notes to Schedule of Investments:
CPI - Consumer Price Index
LIBOR - London Interbank Offered Rate
(a) Indexed security in which price and/or coupon is linked to the prices of a specific instrument or financial statistic (Note 2).
(b) Rate shown represents yield-to-maturity.
Currency Abbreviations:
JPY - Japanese Yen
USD - United States Dollar
See accompanying notes to the financial statements.
4
GMO Special Situations Fund
(A Series of GMO Trust)
Statement of Assets and Liabilities — February 28, 2009
| Assets: | |||||||
| Investments, at value (cost $344,520,629) (Note 2) | $ | 343,461,125 | |||||
| Receivable for investments sold | 4,152,460 | ||||||
| Interest receivable | 215,734 | ||||||
| Interest receivable for open swap contracts | 36,698 | ||||||
| Receivable for open swap contracts (Note 2) | 4,040,610 | ||||||
| Receivable for collateral on open swap contracts (Note 2) | 2,320,000 | ||||||
| Receivable for expenses reimbursed by Manager (Note 3) | 5,992 | ||||||
| Total assets | 354,232,619 | ||||||
| Liabilities: | |||||||
| Payable to affiliate for (Note 3): | |||||||
| Management fee | 98,464 | ||||||
| Shareholder service fee | 16,123 | ||||||
| Trustees and Chief Compliance Officer of GMO Trust fees | 1,141 | ||||||
| Payable for open swap contracts (Note 2) | 2,786,827 | ||||||
| Written options outstanding, at value (premiums $4,152,460) (Note 2) | 4,716,545 | ||||||
| Accrued expenses | 99,542 | ||||||
| Total liabilities | 7,718,642 | ||||||
| Net assets | $ | 346,513,977 | |||||
| Net assets attributable to: | |||||||
| Class III shares | $ | 20,366,007 | |||||
| Class VI shares | $ | 326,147,970 | |||||
| Shares outstanding: | |||||||
| Class III | 799,729 | ||||||
| Class VI | 12,785,983 | ||||||
| Net asset value per share: | |||||||
| Class III | $ | 25.47 | |||||
| Class VI | $ | 25.51 | |||||
See accompanying notes to the financial statements.
5
GMO Special Situations Fund
(A Series of GMO Trust)
Statement of Operations — Year Ended February 28, 2009
| Investment Income: | |||||||
| Interest | $ | 8,298,816 | |||||
| Dividends | 117,622 | ||||||
| Total investment income | 8,416,438 | ||||||
| Expenses: | |||||||
| Management fee (Note 3) | 2,099,073 | ||||||
| Shareholder service fee – Class III (Note 3) | 91,746 | ||||||
| Shareholder service fee – Class VI (Note 3) | 278,385 | ||||||
| Custodian, fund accounting agent and transfer agent fees | 78,604 | ||||||
| Audit and tax fees | 44,789 | ||||||
| Legal fees | 45,376 | ||||||
| Trustees fees and related expenses (Note 3) | 13,143 | ||||||
| Miscellaneous | 8,484 | ||||||
| Total expenses | 2,659,600 | ||||||
| Fees and expenses reimbursed by Manager (Note 3) | (163,698 | ) | |||||
| Net expenses | 2,495,902 | ||||||
| Net investment income (loss) | 5,920,536 | ||||||
| Realized and unrealized gain (loss): | |||||||
| Net realized gain (loss) on: | |||||||
| Investments | 1,112,609 | ||||||
| Closed swap contracts | (66,601 | ) | |||||
| Foreign currency, forward contracts and foreign currency related transactions | 93,964,689 | ||||||
| Net realized gain (loss) | 95,010,697 | ||||||
| Change in net unrealized appreciation (depreciation) on: | |||||||
| Investments | (1,131,654 | ) | |||||
| Open swap contracts | 1,357,082 | ||||||
| Written options | (564,085 | ) | |||||
| Foreign currency, forward contracts and foreign currency related transactions | (7,718,831 | ) | |||||
| Net unrealized gain (loss) | (8,057,488 | ) | |||||
| Net realized and unrealized gain (loss) | 86,953,209 | ||||||
| Net increase (decrease) in net assets resulting from operations | $ | 92,873,745 | |||||
See accompanying notes to the financial statements.
6
GMO Special Situations Fund
(A Series of GMO Trust)
Statement of Changes in Net Assets
| Year Ended February 28, 2009 | Period from July 31, 2007 (commencement of operations) through February 29, 2008 | ||||||||||
| Increase (decrease) in net assets: | |||||||||||
| Operations: | |||||||||||
| Net investment income (loss) | $ | 5,920,536 | $ | 8,357,568 | |||||||
| Net realized gain (loss) | 95,010,697 | 28,532,325 | |||||||||
| Change in net unrealized appreciation (depreciation) | (8,057,488 | ) | 7,783,956 | ||||||||
| Net increase (decrease) in net assets from operations | 92,873,745 | 44,673,849 | |||||||||
| Net share transactions (Note 7): | |||||||||||
| Class III | (77,529,015 | ) | 85,973,660 | ||||||||
| Class VI | (350,165,495 | ) | 550,687,233 | ||||||||
| Increase (decrease) in net assets resulting from net share transactions | (427,694,510 | ) | 636,660,893 | ||||||||
| Total increase (decrease) in net assets | (334,820,765 | ) | 681,334,742 | ||||||||
| Net assets: | |||||||||||
| Beginning of period | 681,334,742 | — | |||||||||
| End of period | $ | 346,513,977 | $ | 681,334,742 | |||||||
See accompanying notes to the financial statements.
7
GMO Special Situations Fund
(A Series of GMO Trust)
Financial Highlights
(For a Class III share outstanding throughout each period)
| Year Ended February 28, 2009 | Period from August 13, 2007 (commencement of operations) through February 29, 2008 | ||||||||||
| Net asset value, beginning of period | $ | 21.32 | $ | 20.09 | |||||||
| Income (loss) from investment operations: | |||||||||||
| Net investment income (loss)† | 0.26 | 0.31 | |||||||||
| Net realized and unrealized gain (loss) | 3.89 | 0.92 | |||||||||
| Total from investment operations | 4.15 | 1.23 | |||||||||
| Net asset value, end of period | $ | 25.47 | $ | 21.32 | |||||||
| Total Return(a) | 19.47 | % | 6.12 | %** | |||||||
| Ratios/Supplemental Data: | |||||||||||
| Net assets, end of period (000's) | $ | 20,366 | $ | 88,204 | |||||||
| Net expenses to average daily net assets | 0.52 | % | 0.53 | %* | |||||||
| Net investment income to average daily net assets | 1.20 | % | 2.71 | %* | |||||||
| Portfolio turnover rate | 62 | % | 0 | %††** | |||||||
| Fees and expenses reimbursed by the Manager to average daily net assets: | 0.03 | % | 0.05 | %* | |||||||
(a) The total returns would have been lower had certain expenses not been reimbursed during the periods shown.
† Calculated using average shares outstanding throughout the period.
†† Calculation represents portfolio turnover rate of the Fund for the period from July 31, 2007 (commencement of operations) through February 29, 2008.
* Annualized.
** Not annualized.
See accompanying notes to the financial statements.
8
GMO Special Situations Fund
(A Series of GMO Trust)
Financial Highlights
(For a Class VI share outstanding throughout each period)
| Year Ended February 28, 2009 | Period from July 31, 2007 (commencement of operations) through February 29, 2008 | ||||||||||
| Net asset value, beginning of period | $ | 21.33 | $ | 20.00 | |||||||
| Income (loss) from investment operations: | |||||||||||
| Net investment income (loss)† | 0.23 | 0.34 | |||||||||
| Net realized and unrealized gain (loss) | 3.95 | 0.99 | |||||||||
| Total from investment operations | 4.18 | 1.33 | |||||||||
| Net asset value, end of period | $ | 25.51 | $ | 21.33 | |||||||
| Total Return(a) | 19.60 | % | 6.65 | %** | |||||||
| Ratios/Supplemental Data: | |||||||||||
| Net assets, end of period (000's) | $ | 326,148 | $ | 593,131 | |||||||
| Net expenses to average daily net assets | 0.43 | % | 0.43 | %* | |||||||
| Net investment income to average daily net assets | 1.03 | % | 2.84 | %* | |||||||
| Portfolio turnover rate | 62 | % | 0 | %††** | |||||||
| Fees and expenses reimbursed by the Manager to average daily net assets: | 0.03 | % | 0.05 | %* | |||||||
(a) The total returns would have been lower had certain expenses not been reimbursed during the periods shown.
† Calculated using average shares outstanding throughout the period.
†† Calculation represents portfolio turnover rate of the Fund for the period from July 31, 2007 (commencement of operations) through February 29, 2008.
* Annualized.
** Not annualized.
See accompanying notes to the financial statements.
9
GMO Special Situations Fund
(A Series of GMO Trust)
Notes to Financial Statements
February 28, 2009
1. Organization
GMO Special Situations Fund (the "Fund") is a series of GMO Trust (the "Trust"). The Fund is registered under the Investment Company Act of 1940, as amended, as an open-end, non-diversified management investment company. The Fund is advised and managed by Grantham, Mayo, Van Otterloo & Co. LLC (the "Manager" or "GMO"). The Trust was established as a Massachusetts business trust under the laws of The Commonwealth of Massachusetts on June 24, 1985. The Declaration of Trust permits the Trustees of the Trust ("Trustees") to create an unlimited number of series of shares ("Funds") and to subdivide Funds into classes.
The Fund's investment objectives are capital appreciation and capital preservation. The Fund seeks to achieve its investment objectives by implementing investment strategies that complement long-only investments in global equities and fixed income instruments. The Fund may have long or short exposure to foreign and U.S. equity securities (including both growth and value style equities and equities of any market capitalization), foreign and U.S. fixed income securities (including fixed income securities of any credit quality and having any maturity or duration), currencies, and, from time to time, other alternative asset classes (e.g., instruments that seek exposure to or hedge risks of market volatility). The Fund is not restricted in its exposure to any particular asset class, an d at times may be substantially exposed (long or short) to a single asset class (e.g., equity securities or fixed income securities). In addition, the Fund is not restricted in its exposure (long or short) to any particular market. The Fund may have substantial exposure (long or short) to a particular country or type of country (e.g., emerging countries). The Fund could be subject to material losses from a single investment. The Fund does not seek to control risk relative to a particular securities market index or benchmark. In addition, the Fund does not seek to outperform a particular securities market index or blend of market indices (i.e., the Fund does not seek "relative" return).
As of February 28, 2009, the Fund had two classes of shares outstanding: Class III and Class VI. Each class of shares bears a different level of shareholder service fees.
Shares of the Fund are not publicly offered and are principally available only to other funds of the Trust and certain accredited investors.
The Fund currently limits subscriptions due to capacity considerations.
2. Significant accounting policies
The following is a summary of significant accounting policies followed by the Fund in the preparation of its financial statements. These policies are in conformity with accounting principles generally accepted in the United States of America ("U.S. GAAP") and have been consistently followed by the Fund in preparing its financial statements. The preparation of financial statements in accordance with U.S. GAAP requires management to make estimates and assumptions that affect the reported amounts and disclosures in the financial statements. Actual results could differ from those estimates. The accounting records of the Fund are maintained in U.S. dollars.
10
GMO Special Situations Fund
(A Series of GMO Trust)
Notes to Financial Statements — (Continued)
February 28, 2009
Portfolio valuation
Securities listed on a securities exchange for which market quotations are readily available are valued at the last sale price or official closing price on each business day, or if there is no such reported sale or official closing price, at the most recent quoted bid price. Unlisted securities for which market quotations are readily available are generally valued at the most recent quoted bid price. Debt instruments with a remaining maturity of sixty days or less are generally valued at amortized cost, which approximates fair value. Shares of investment funds are generally valued at their net asset value. Securities for which quotations are not readily available or whose values the Manager has determined to be unreliable are valued at fair value as determined in good faith by the Trustees or persons acting at their direction pursuant to procedures approved by the Trustees. By its nature, a fair value price is a good faith estim ate of the value of a security at a given point in time and may not reflect the value that would be realized if the security were sold. The difference between a fair value price and the value realized upon a sale could be material.
In September 2006, the Financial Accounting Standards Board ("FASB") issued Statement of Financial Accounting Standards No. 157, Fair Value Measurements ("SFAS 157"). SFAS 157 is effective for the Fund's current fiscal year. While the adoption of SFAS 157 does not have an effect on the Fund's net asset value, it does require additional disclosures about fair value measurements. SFAS 157 establishes a three-level hierarchy for disclosure of fair value measurements. The valuation hierarchy is based upon the reliability of inputs to the valuation of the Fund's investments. The three levels are defined as follows:
Level 1 – Valuations based on quoted prices for identical securities in active markets.
Level 2 – Valuations determined using other significant direct or indirect observable inputs.
Level 3 – Valuations based on inputs that are unobservable and significant.
The inputs or methodology used for valuing securities are not necessarily an indication of the risk associated with investing in those securities.
The following is a summary of the fair valuations according to inputs used as of February 28, 2009 in valuing the Fund's investments:
| Asset Valuation Inputs | Investments in Securities | Other Financial Instruments* | |||||||||
| Level 1 - Quoted Prices | $ | 271,635,571 | $ | — | |||||||
| Level 2 - Other Significant Observable Inputs | 71,825,554 | 4,040,610 | |||||||||
| Level 3 - Significant Unobservable Inputs | — | — | |||||||||
| Total | $ | 343,461,125 | $ | 4,040,610 | |||||||
* Other financial instruments include swap agreements.
11
GMO Special Situations Fund
(A Series of GMO Trust)
Notes to Financial Statements — (Continued)
February 28, 2009
| Liability Valuation Inputs | Investments in Securities | Other Financial Instruments** | |||||||||
| Level 1 - Quoted Prices | $ | — | $ | — | |||||||
| Level 2 - Other Significant Observable Inputs | — | (7,503,372 | ) | ||||||||
| Level 3 - Significant Unobservable Inputs | — | — | |||||||||
| Total | $ | — | $ | (7,503,372 | ) | ||||||
** Other financial instruments include swap agreements and written options.
The Fund held no investments or other financial instruments at either February 29, 2008 or February 28, 2009, whose fair value was determined using Level 3 inputs.
Foreign currency translation
The market values of foreign securities, currency holdings and related assets and liabilities are translated to U.S. dollars based on the 4 p.m. New York time exchange rates each business day. Income and expenses denominated in foreign currencies are translated at the 4 p.m. New York time exchange rates on the business day the income and expenses are accrued or incurred. The Fund does not isolate realized and unrealized gains and losses attributable to changes in exchange rates from gains and losses that arise from changes in the market value of investments. Such fluctuations are included with net realized and unrealized gain or loss on investments. Net realized gains and losses on foreign currency transactions represent gains and losses on disposition of currencies and forward currency contracts, currency gains and losses realized between the trade and settlement dates on securities transactions, and the difference between the amount of investment income and foreign withholding taxes recorded on the Fund's accounting records and the U.S. dollar equivalent amounts actually received or paid.
Forward currency contracts
The Fund may enter into forward currency contracts including forward cross currency contracts. A forward currency contract is an agreement between two parties to buy and sell a currency at a set price on a future date. The market value of a forward currency contract fluctuates with changes in forward currency exchange rates. Forward currency contracts are marked to market daily using rates supplied by a quotation service and changes in value are recorded by the Fund as an unrealized gain or loss. Realized gains or losses equal to the difference between the value of the contract at the time it was opened and the value at the time it was closed are recorded upon delivery or receipt of the currency or, if a forward currency contract is offset by entering into another forward currency contract with the same broker, upon settlement of the net gain or loss. These contracts may involve market risk in excess of the unrealized gain or lo ss reflected in the Fund's Statement of Assets and Liabilities. They expose the Fund to risk of unfavorable movements in currency values and the risk that the counterparty will be unable or unwilling to meet the terms of the contracts. The Fund had no forward currency contracts outstanding at the end of the period.
12
GMO Special Situations Fund
(A Series of GMO Trust)
Notes to Financial Statements — (Continued)
February 28, 2009
Futures contracts
The Fund may purchase and sell futures contracts. Upon entering into a futures contract, the Fund is required to deposit cash, U.S. government and agency obligations, or other liquid assets with the futures clearing broker in accordance with the initial margin requirements of the broker or exchange. In addition, the Fund maintains cash or securities in an amount that at least equals the net amount payable in the event the Fund must deliver the full amount of the contract. Futures contracts are marked to market daily and an appropriate payable or receivable for the change in value ("variation margin") is recorded by the Fund. The payable or receivable is settled on the following business day. Gains or losses are recognized but not considered realized until the contracts expire or are closed. Futures contracts involve, to varying degrees, risk of loss in excess of the variation margin disclosed in the Statement of Assets and Liabi lities. Under some circumstances, futures exchanges may establish daily limits on the amount that the price of a futures contract can vary from the previous day's settlement price, thereby effectively preventing liquidation of unfavorable positions. Losses may arise from changes in the value of the underlying instrument if the Fund is unable to liquidate a futures position due to an illiquid secondary market for the contract or the imposition of price limits, or if counterparties do not perform under the contract terms. Futures contracts are generally valued at the settlement price established each day by the board of trade or exchange on which they are traded. The Fund had no futures contracts outstanding at the end of the period.
Options
The Fund may write (i.e., sell) call and put options. Writing options alters the Fund's exposure to the underlying instrument by, in the case of a call option, obligating the Fund to sell the underlying instrument at a set price to the option-holder and, in the case of a put option, obligating the Fund to purchase the underlying instrument at a set price from the option-holder. In the case of an index option, settlement will be in cash. When the Fund writes a call or put option, an amount equal to the premium received is recorded as a liability and subsequently marked to market to reflect the current value of the option written. Premiums received from writing options that expire are treated as realized gains. Premiums received from writing options that are exercised or closed are deducted from the amounts paid on the underlying future, security or currency transaction to determine the realized gain or loss. The Fund as a writer of an option has no control over whether the underlying future, security or currency may be sold (call) or purchased (put) and as a result bears the market risk of an unfavorable change in the price of the future, security or currency underlying the option. In the event that the Fund writes uncovered put or call options (i.e. options for investments that the Fund does not own), it bears the risk of substantial losses if the price of the underlying instrument increases during the term of the option. Options expose the Fund to the risk the Fund may not be able to enter into a closing transaction because of an illiquid market.
13
GMO Special Situations Fund
(A Series of GMO Trust)
Notes to Financial Statements — (Continued)
February 28, 2009
For the year ended February 28, 2009, the Fund's investment activity in options contracts written by the Fund was as follows:
| Puts | Calls | ||||||||||||||||||
| Principal Amount of Contracts | Premiums | Principal Amount of Contracts | Premiums | ||||||||||||||||
| Outstanding, beginning of year | $ | — | $ | — | $ | — | $ | — | |||||||||||
| Options written | (39,000 | ) | (4,152,460 | ) | — | — | |||||||||||||
| Options exercised | — | — | — | — | |||||||||||||||
| Options expired | — | — | — | — | |||||||||||||||
| Options sold | — | — | — | — | |||||||||||||||
| Outstanding, end of year | $ | (39,000 | ) | $ | (4,152,460 | ) | $ | — | $ | — | |||||||||
The Fund may also purchase put and call options. Purchasing options alters the Fund's exposure to the underlying instrument by, in the case of a call option, entitling the Fund to purchase the underlying instrument at a set price from the writer of the option and, in the case of a put option, entitling the Fund to sell the underlying instrument at a set price to the writer of the option. The Fund pays a premium for a purchased option. That premium is disclosed in the Schedule of Investments and is subsequently marked to market to reflect the current value of the option. Premiums paid for purchasing options that expire are treated as realized losses. Premiums paid for purchasing options that are exercised or closed are deducted from the proceeds on the closing transaction to determine the realized gain or loss. The risk associated with purchasing put and call options is limited to the premium paid. The Fund had no purchased optio n contracts outstanding at the end of the period.
The Fund values exchange traded options at the last sale price, or if no sale is reported, the last bid price for options it has purchased and the last ask price for options it has written. The Fund values options traded over-the-counter using inputs provided by primary pricing sources and industry standard models.
Indexed securities
The Fund may invest in indexed securities. Indexed securities are securities whose redemption values and/or coupons are linked to the prices of a specific instrument or financial statistic. The Fund uses indexed securities to increase or decrease its exposure to different underlying instruments and to gain exposure to markets in which investing through conventional securities is difficult. Indexed securities held by the Fund at the end of the period are listed in the Fund's Schedule of Investments.
Swap agreements
The Fund may enter into various types of swap agreements, including without limitation, interest rate, total return, credit default and variance swap agreements. A swap agreement is an agreement to exchange
14
GMO Special Situations Fund
(A Series of GMO Trust)
Notes to Financial Statements — (Continued)
February 28, 2009
the return generated by one instrument for the return generated by another instrument. When entering into a swap agreement, the Fund and/or the swap counterparty may post or receive cash or securities as collateral. The party posting the collateral typically receives the interest associated with or payments related to the collateral and has the risk of loss related to the collateral.
Interest rate swap agreements involve an exchange by the parties of their respective commitments to pay or right to receive interest, e.g., an exchange of floating rate interest payments for fixed rate interest payments with respect to the notional amount of principal.
Total return swap agreements involve a commitment by one party to pay interest to the other party in exchange for a payment to it from the other party based on the return of a reference instrument (e.g., a security or basket of securities), both based on notional amounts. To the extent the return of the reference instrument exceeds or falls short of the interest payments, one party will receive a payment from or make a payment to the other party.
In a credit default swap agreement, one party makes payments to another party in exchange for the right to receive a specified return if a credit event occurs with respect to a referenced entity or entities. Buying credit default protection reduces the buyer's exposure in the event of an issuer's default (e.g., it reduces risk where a party owns a security issued by or otherwise has exposure to the issuer). Selling credit default protection subjects the seller to exposure to an issuer's default. A seller of credit default protection receives payments in return for its obligation to pay the principal amount of a debt security (or other agreed-upon value) to the other party upon the occurrence of a credit event (e.g., issuer default or similar event). If no credit event occurs, the seller has no payment obligations. For credit default swap agreements on asset-backed securities, a credit event may be triggered by such events as the issuer's failure to pay interest or principal, an agreement of the holders of an asset-backed security to a maturity extension, a rating downgrade on the security or a write-down on the collateral underlying the security. For credit default swap agreements on corporate or sovereign issuers, a credit event may be triggered by such events as the issuer's bankruptcy, failure to pay interest or principal, repudiation/moratorium or restructuring.
Variance swap agreements involve an agreement by two parties to exchange cash flows based on the measured variance (or square of volatility) of a specified underlying asset. One party agrees to exchange a "fixed rate" or strike price payment for the "floating rate" or realized price variance on the underlying asset with respect to the notional amount. At inception, the strike price chosen is generally fixed at a level such that the fair value of the swap is zero. At the expiration date, the amount paid by one party to the other is the difference between the realized price variance of the underlying asset and the strike price multiplied by the notional amount. A receiver of the realized price variance would receive a payment when the realized price variance of the underlying asset is greater than the strike price and would make a payment when that variance is less than the strike price. A payer of the realized price variance woul d make a payment when the realized price variance of the underlying asset is greater than the strike price and would receive a payment when that variance is less than the strike price. This type of agreement is essentially a forward contract on the future realized price variance of the underlying asset.
15
GMO Special Situations Fund
(A Series of GMO Trust)
Notes to Financial Statements — (Continued)
February 28, 2009
The Fund prices its swap agreements daily using models that may incorporate quotations from market makers and records the change in value, if any, as unrealized gain or loss in the Statement of Operations. Payments received or made on swap agreements are recorded as realized gain or loss in the Statement of Operations. Gains or losses are realized upon termination of the swap agreements.
Swap agreements often are not actively traded on financial markets. The values assigned to them may differ significantly from the values that would be realized upon termination, and the differences could be material. Entering into swap agreements involves credit, legal, market and documentation risk that is not reflected in the amounts reported in the Statement of Assets and Liabilities. Such risks include the possibility that the party with whom the Fund contracts may default on its obligations to perform or disagree as to the meaning of contractual terms, or that the collateral that party posts may be insufficient or not timely received by the Fund. Credit risk may be particularly acute in an environment where financial services firms are exposed to systemic risks of the type evidenced by the insolvency of Lehman Brothers and subsequent market disruptions. Swap agreements outstanding at the end of the period are listed in the Fund's Schedule of Investments.
Repurchase agreements
The Fund may enter into repurchase agreements. Under a repurchase agreement the Fund acquires a security for cash and obtains a simultaneous commitment from the seller to repurchase the security at an agreed upon price and date. The Fund, through its custodian, takes possession of securities collateralizing the repurchase agreement. The collateral is marked to market daily to ensure that the market value of the underlying assets is at least equal to the amount owed to the Fund in the event of default by the seller. If the seller of a repurchase agreement defaults or enters into insolvency proceedings and the value of the collateral declines, the Fund's recovery of cash may be delayed or limited. The Fund had no repurchase agreements outstanding at the end of the period.
Reverse repurchase agreements
The Fund may enter into reverse repurchase agreements. Under a reverse repurchase agreement the Fund sells portfolio assets subject to an agreement by the Fund to repurchase the same assets at a later date at a fixed price. In connection with these agreements, the Fund establishes segregated accounts with its custodian in which the Fund maintains cash, U.S. government securities or other assets equal in value to its obligations under the reverse repurchase agreement into which it has entered. Reverse repurchase agreements expose the Fund to the risk that the market value of the securities the Fund has sold under the agreement may decline below the price at which the Fund is obligated to repurchase them under the agreement. If the buyer in a reverse repurchase agreement files for bankruptcy or becomes insolvent, the Fund's use of proceeds from the sale of its securities may be restricted while the other party or its trustee or re ceiver determines whether to honor the Fund's right to repurchase the securities. Furthermore, in that situation the Fund may be unable to recover the securities it sold and as a result would realize a loss equal to the difference between the value of the securities and the payment it received for them. This loss would be greater to the extent the buyer paid less than the value of the securities the Fund sold to it (e.g., a buyer
16
GMO Special Situations Fund
(A Series of GMO Trust)
Notes to Financial Statements — (Continued)
February 28, 2009
may pay $95 for a bond with a market value of $100). The market value of the securities the Fund has sold is determined daily and any additional required collateral is allocated to or sent by the Fund on the next business day. The Fund had no reverse repurchase agreements outstanding at the end of the period.
Securities lending
The Fund may lend its securities to qualified brokers. The loans are collateralized with cash or liquid securities with a market value at least equal to the market value of the securities upon entering into the loan. As with other extensions of credit, the Fund may bear the risk of loss with respect to the investment of the collateral, the risk of delay in and/or inability to exercise its rights with respect to the collateral, and the risk of delay in recovery or loss of rights in the loaned securities should the borrower of the securities fail financially. If a loan is collateralized by U.S. government securities, the Fund receives a fee from the borrower. If a loan is collateralized by cash, the Fund typically invests the cash collateral for its own account. For the year from March 1, 2008 through February 28, 2009, the Fund did not participate in securities lending.
Taxes
The Fund has elected to be treated as a partnership for U.S. federal income tax purposes. As a partnership, the Fund is not itself subject to federal income tax. Instead, each shareholder is required to take into account in determining its tax liability its distributive share of items of Fund income, gain, loss, deduction, credit, and tax preference for each taxable year substantially as though such items have been realized directly by the shareholder and without regard to whether any distribution by the Fund has been or will be received. Accordingly, no provision (benefit) for federal and state income taxes is reflected in the accompanying financial statements.
As of February 28, 2009, the approximate cost for U.S. federal income tax purposes and gross and net unrealized appreciation (depreciation) in value of investments were as follows:
| Aggregate Cost | Gross Unrealized Appreciation | Gross Unrealized (Depreciation) | Net Unrealized Appreciation (Depreciation) | ||||||||||||
| $ | 344,520,629 | $ | 1,507,603 | $ | (2,567,107 | ) | $ | (1,059,504 | ) | ||||||
The Fund is subject to the provisions of Financial Accounting Standards Board Interpretation No. 48 ("FIN 48"), Accounting for Uncertainty in Income Taxes — an Interpretation of FASB Statement No. 109. FIN 48 sets forth a minimum threshold for financial statement recognition of a tax position taken or expected to be taken in a tax return that could affect the Fund's financial statements. The Fund did not have any unrecognized tax benefits or liabilities at February 28, 2009, nor did it have any increases or decreases in unrecognized tax benefits or liabilities for the period then ended. The Fund is subject to examination prior to the expiration of the statute of limitations by U.S. federal and state tax authorities for tax returns filed.
17
GMO Special Situations Fund
(A Series of GMO Trust)
Notes to Financial Statements — (Continued)
February 28, 2009
Distributions
Because the Fund has elected to be treated as a partnership for tax purposes, it is not required to make distributions to its shareholders. It is the policy of the Fund to declare and pay distributions as determined by the Trustees (or their delegates).
Security transactions and related investment income
Security transactions in the financial statements are accounted for on the trade date. Dividend income, net of applicable foreign withholding taxes, if any, is recorded on the ex-dividend date or, if later, when the Fund is informed of the ex-dividend date. Interest income is recorded on the accrual basis and is adjusted for the amortization of premiums and accretion of discounts. Principal on inflation indexed securities is adjusted for inflation and any increase or decrease is recorded as interest income or loss. Income is not recognized on securities for which collection is not expected. Non-cash dividends, if any, are recorded at the fair market value of the asset received. In determining the net gain or loss on securities sold, the Fund uses the identified cost basis for the purposes of determining the cost basis.
Expenses
The majority of the expenses of the Trust are directly identifiable to an individual fund. Expenses that are not readily identifiable to a specific fund are allocated taking into consideration, among other things, the nature and type of expense and the relative size of the funds. Investment income, common expenses and realized and unrealized gains and losses are allocated pro rata among the classes of shares of the Fund based on the relative net assets of each class. Shareholder service fees, which are directly attributable to a class of shares, are charged to that class's operations.
State Street Bank and Trust Company ("State Street") serves as custodian, fund accounting agent and transfer agent of the Fund. State Street's fees may be reduced by an earnings allowance calculated on the average daily cash balances the Fund maintains with State Street. The Fund receives the benefit of the earnings allowance. In addition, Goldman Sachs Agency Lending, the Fund's securities lending agent, has agreed to reimburse the Fund for certain transactional expenses related to securities lending activity. Credit balances or expense reimbursements used to reduce fees, if any, are reported as a reduction of expenses in the Statement of Operations.
Investment risks
The Fund is subject to risks involved in investing in foreign securities that are not presented by investments in U.S. securities. These risks may involve adverse political and economic developments, including expropriation and the possible imposition of capital controls or other foreign governmental laws or restrictions. In addition, the securities of some foreign companies and securities markets are less liquid and at times may be more volatile than securities of comparable U.S. companies and U.S. securities markets. The risks described above apply to an even greater extent to investments in emerging markets. The securities markets of emerging countries are generally smaller, less developed, less liquid, and more volatile than the securities markets of the U.S. and developed foreign markets. Additionally, the investment
18
GMO Special Situations Fund
(A Series of GMO Trust)
Notes to Financial Statements — (Continued)
February 28, 2009
risks associated with an investment in the underlying funds may be greater to the extent that the underlying funds engage in derivative transactions.
Recently issued accounting pronouncement
In March 2008, FASB issued Statement of Financial Accounting Standards No. 161, Disclosures about Derivative Instruments and Hedging Activities ("SFAS 161"). SFAS 161 is effective for fiscal years and interim periods beginning after November 15, 2008. SFAS 161 requires enhanced disclosures about the Fund's derivative and hedging activities. The Manager is currently evaluating the impact the adoption of SFAS 161 will have on the Fund's financial statement disclosures.
3. Fees and other transactions with affiliates
GMO receives management fee for the services it provides to the Fund. That fee is paid monthly at the annual rate of 0.37% of average daily net assets. The Fund has adopted a Shareholder Service Plan under which the Fund pays GMO a shareholder service fee for client and shareholder service, reporting, and other support. Pursuant to the Shareholder Service Plan, the shareholder service fee is calculated based on average daily net assets at the annual rate of 0.15% for Class III shares and 0.055% for Class VI shares.
Through at least June 30, 2009, the Manager has contractually agreed to reimburse the Fund for Fund expenses incurred through that date to the extent the Fund's total annual operating expenses (excluding "Excluded Expenses", as defined below) exceed 0.37% of the Fund's average daily net assets. Excluded Expenses include shareholder service fees, expenses indirectly incurred by investment in the underlying funds, fees and expenses of the independent Trustees of the Trust, fees and expenses for legal services not approved by the Manager for the Trust, compensation and expenses of the Trust's Chief Compliance Officer ("CCO") (excluding any employee benefits), brokerage commissions, securities lending fees and expenses, interest expense, transfer taxes, and other investment-related costs (including expenses associated with investments in any company that is an investment company or would be an investment company under the 1940 Act, but for the exceptions to the definition of investment company provided in Section 3(c)(1) and 3(c)(7) of the 1940 Act), hedging transaction fees, extraordinary, non-recurring and certain other unusual expenses (including taxes)).
The Fund's portion of the fees paid by the Trust to the Trust's independent Trustees and CCO during the year ended February 28, 2009 was $11,535 and $3,905, respectively. The compensation and expenses of the CCO are included in miscellaneous expenses in the Statement of Operations. The Fund paid no remuneration to any other officer of the Trust.
19
GMO Special Situations Fund
(A Series of GMO Trust)
Notes to Financial Statements — (Continued)
February 28, 2009
4. Purchases and sales of securities
For the year ended February 28, 2009, cost of purchases and proceeds from sales of investments, other than short-term obligations, were as follows:
| Purchases | Sales | ||||||||||
| U.S. Government securities | $ | 54,320,584 | $ | 33,460,425 | |||||||
| Investments (non-U.S. Government securities) | 35,297,448 | — | |||||||||
5. Guarantees
In the normal course of business the Fund enters into contracts with third-party service providers that contain a variety of representations and warranties and that provide general indemnifications. The Fund's maximum exposure under these arrangements is unknown, as it involves future claims that may be made against the Fund that have not yet occurred. Based on experience, management is of the view that the risk of loss in connection with its indemnification obligations is remote; however, there can be no assurance that such obligations will not result in material liabilities that adversely affect the Fund.
6. Principal shareholders and related parties
As of February 28, 2009, 86.09% of the outstanding shares of the Fund were held by three shareholders, each holding more than 10% of the Fund's outstanding shares. On that date, no other shareholder owned more than 10% of the outstanding shares of the Fund. Two of the shareholders are other funds of the Trust. Redemptions from (or investments into) the Fund by or on behalf of these large shareholders may have a material effect on the Fund.
As of February 28, 2009, no shares of the Fund were held by senior management of the Manager and GMO Trust officers and all of the Fund's shares were held by accounts for which the Manager had investment discretion.
20
GMO Special Situations Fund
(A Series of GMO Trust)
Notes to Financial Statements — (Continued)
February 28, 2009
7. Share transactions
The Declaration of Trust permits the Trust to issue an unlimited number of shares of beneficial interest (without par value). Transactions in Fund shares were as follows:
| Year Ended February 28, 2009 | Period from August 13, 2007, (commencement of operations) through February 29, 2008 | ||||||||||||||||||
| Class III: | Shares | Amount | Shares | Amount | |||||||||||||||
| Shares sold | 112,442 | $ | 2,461,097 | 4,137,904 | $ | 85,973,660 | |||||||||||||
| Shares issued to shareholders in reinvestment of distributions | — | — | — | — | |||||||||||||||
| Shares repurchased | (3,450,617 | ) | (79,990,112 | ) | — | — | |||||||||||||
| Net increase (decrease) | (3,338,175 | ) | $ | (77,529,015 | ) | 4,137,904 | $ | 85,973,660 | |||||||||||
| Year Ended February 28, 2009 | Period from July 31, 2007, (commencement of operations) through February 29, 2008 | ||||||||||||||||||
| Class VI: | Shares | Amount | Shares | Amount | |||||||||||||||
| Shares sold | 283,402 | $ | 6,515,930 | 30,240,773 | $ | 602,709,982 | |||||||||||||
| Shares issued to shareholders in reinvestment of distributions | — | — | — | — | |||||||||||||||
| Shares repurchased | (15,304,605 | ) | (356,681,425 | ) | (2,433,587 | ) | (52,022,749 | ) | |||||||||||
| Net increase (decrease) | (15,021,203 | ) | $ | (350,165,495 | ) | 27,807,186 | $ | 550,687,233 | |||||||||||
21
Report of Independent Registered Public Accounting Firm
To the Trustees of GMO Trust and the Shareholders of
GMO Special Situations Fund:
In our opinion, the accompanying statement of assets and liabilities, including the schedule of investments, and the related statements of operations and of changes in net assets and the financial highlights present fairly, in all material respects, the financial position of GMO Special Situations Fund (the "Fund") at February 28, 2009, the results of its operations for the year then ended and the changes in its net assets and the financial highlights for each of the periods indicated, in conformity with accounting principles generally accepted in the United States of America. These financial statements and financial highlights (hereafter referred to as "financial statements") are the responsibility of the Fund's management. Our responsibility is to express an opinion on these financial statements based on our audits. We conducted our audits of these financial statements in accordance with the standards of the Public Company Acc ounting Oversight Board (United States). Those standards require that we plan and perform the audit to obtain reasonable assurance about whether the financial statements are free of material misstatement. An audit includes examining, on a test basis, evidence supporting the amounts and disclosures in the financial statements, assessing the accounting principles used and significant estimates made by management, and evaluating the overall financial statement presentation. We believe that our audits, which included confirmation of securities at February 28, 2009 by correspondence with the custodian and brokers, provide a reasonable basis for our opinion.
PricewaterhouseCoopers LLP
Boston, Massachusetts
April 29, 2009
22
GMO Special Situations Fund
(A Series of GMO Trust)
Fund Expenses
February 28, 2009 (Unaudited)
Expense Examples: The following information is in relation to expenses for the six month period ended February 28, 2009.
As a shareholder of the Fund, you may incur two types of costs: (1) transaction costs, and (2) ongoing costs, including management fees, shareholder service fees, and other Fund expenses. This example is intended to help you understand your ongoing costs (in dollars) of investing in the Fund and to compare these costs with the ongoing costs of investing in other mutual funds.
These examples are based on an investment of $1,000 invested at the beginning of the period and held for the entire period, September 1, 2008 through February 28, 2009.
Actual Expenses
The first line of the table below for each class provides information about actual account values and actual expenses. You may use the information in this line, together with the amount you invested, to estimate the expenses that you paid over the period. Simply divide your account value by $1,000 (for example, a $10,000,000 account value divided by $1,000 = 10,000), then multiply the result by the number in the first line under the heading entitled "Net Expense Incurred" to estimate the expenses you paid on your account during this period.
Hypothetical Example for Comparison Purposes
The second line of the table below for each class provides information about hypothetical account values and hypothetical expenses based on the Fund's actual expense ratio and an assumed rate of return of 5% per year before expenses, which is not the Fund's actual return. The hypothetical account values and expenses may not be used to estimate the actual ending account balance or expenses you paid for the period. You may use this information to compare the ongoing costs of investing in the Fund with other funds. To do so, compare this 5% hypothetical example with the 5% hypothetical examples that appear in the shareholder reports of the other funds.
Please note that the expenses shown in the table are meant to highlight your ongoing costs only and do not reflect any transactional costs, such as purchase premiums and redemption fees. Therefore, the second line of the table is useful in comparing ongoing costs only, and will not help you determine the relative total costs of owning different funds. In addition, if these transactional costs were included, your costs would have been higher.
| Annualized Expense Ratio | Beginning Account Value | Ending Account Value | Net Expense Incurred* | ||||||||||||||||
| Class III | |||||||||||||||||||
| 1) Actual | 0.52 | % | $ | 1,000.00 | $ | 1,174.30 | $ | 2.80 | |||||||||||
| 2) Hypothetical | 0.52 | % | $ | 1,000.00 | $ | 1,022.22 | $ | 2.61 | |||||||||||
| Class VI | |||||||||||||||||||
| 1) Actual | 0.43 | % | $ | 1,000.00 | $ | 1,174.50 | $ | 2.32 | |||||||||||
| 2) Hypothetical | 0.43 | % | $ | 1,000.00 | $ | 1,022.66 | $ | 2.16 | |||||||||||
* Expenses are calculated using each Class's annualized expense ratio for the six months ended February 28, 2009, multiplied by the average account value over the period, multiplied by 181 days in the period, divided by 365 days in the year.
23
Trustees and Officers (Unaudited)
The following tables list the Trust's Trustees and Officers as of the date of this report; their address and date of birth ("DOB"); their position with the Trust; the length of time holding that position with the Trust; their principal occupation(s) during the past five years; the number of portfolios in the fund complex they oversee; and other directorships they hold in companies subject to registration or reporting requirements of the Securities Exchange Act of 1934 (generally called "public companies") or in registered investment companies. The Trust's Statement of Additional Information ("SAI") includes additional information about the Trust's trustees, including changes subsequent to the date of the report. The SAI is available, without charge, upon request by writing GMO, c/o GMO Trust, 40 Rowes Wharf, Boston, MA 02110.
Independent Trustees:
| Name, Address, and DOB | Position(s) Held with Trust | Term of Office1 and Length of Time Served | Principal Occupation(s) During Past Five Years | Number of Portfolios in Fund Complex Overseen by Trustee | Other Directorships Held by Trustee | ||||||||||||||||||
| Donald W. Glazer, Esq. c/o GMO Trust 40 Rowes Wharf Boston, MA 02110 DOB: 07/26/1944 | Chairman of the Board of Trustees | Chairman of the Board of Trustees since March 2005; Lead Independent Trustee (September 2004 – March 2005); Trustee since December 2000. | Consultant – Law and Business2; Author of Legal Treatises. | 59 | None. | ||||||||||||||||||
1 Each Trustee is elected to serve during the continued lifetime of the Trust until he/she dies, resigns or is removed, or if sooner, until the next meeting of Shareholders called for the purpose of electing Trustees and until the election and qualification of his/her successor.
2 As part of Mr. Glazer's work as a consultant, he provides part-time consulting services to Goodwin Procter LLP ("Goodwin"). Goodwin has provided legal services to Renewable Resources, LLC, an affiliate of GMO; GMO, in connection with its relationship with Renewable Resources; and funds managed by Renewable Resources. Mr. Glazer has represented that he has no financial interest in, and is not involved in the provision of, such legal services. In the calendar years ended December 31, 2007 and December 31, 2008, these entities paid $789,416 and $183,864 respectively, in legal fees and disbursements to Goodwin. In correspondence with the Staff of the Securities and Exchange Commission beginning in August 2006, the Independent Trustees' legal counsel provided the Staff with information regarding Mr. Glazer's relationship with Goodwin and h is other business activities. On September 11, 2007, based on information that had been given to the Staff as of that date, the Staff provided oral no-action assurance consistent with the opinion of the Independent Trustees' legal counsel that Mr. Glazer is not an "interested person" of the Trust.
24
Independent Trustees — (Continued)
| Name, Address, and DOB | Position(s) Held with Trust | Term of Office1 and Length of Time Served | Principal Occupation(s) During Past Five Years | Number of Portfolios in Fund Complex Overseen by Trustee | Other Directorships Held by Trustee | ||||||||||||||||||
| W. Nicholas Thorndike c/o GMO Trust 40 Rowes Wharf Boston, MA 02110 DOB: 03/28/1933 | Trustee | Since March 2005. | Director or trustee of various corporations and charitable organizations, including Courier Corporation (a book publisher and manufacturer) (July 1989 – present); Putnam Funds (December 1992 – June 2004); and Providence Journal (a newspaper publisher) (December 1986 – December 2003). | 59 | Director of Courier Corporation (a book publisher and manufacturer); Member of the Investment Committee of Partners HealthCare System, Inc.3 | ||||||||||||||||||
| Peter Tufano c/o GMO Trust 40 Rowes Wharf Boston, MA 02110 DOB: 04/22/1957 | Trustee | Since December 2008. | Sylvan C. Coleman Professor of Financial Management, Harvard Business School (since 1989). | 59 | Trustee of State Street Navigator Securities Lending Trust (3 Portfolios). | ||||||||||||||||||
1 Each Trustee is elected to serve during the continued lifetime of the Trust until he/she dies, resigns or is removed, or if sooner, until the next meeting of Shareholders called for the purpose of electing Trustees and until the election and qualification of his/her successor.
3 Partners HealthCare System, Inc. is a client of the Manager.
25
Principal Officers:
| Name, Address, and DOB | Position(s) Held with Trust | Term of Office4 and Length of Time Served | Principal Occupation(s) During Past Five Years5 | ||||||||||||
| J.B. Kittredge DOB: 08/22/1954 | President and Chief Executive Officer | Since March 2009. | General Counsel, Grantham, Mayo, Van Otterloo & Co. LLC (October 2005 – Present); Partner, Ropes & Gray LLP. | ||||||||||||
| Sheppard N. Burnett c/o GMO Trust 40 Rowes Wharf Boston, MA 02110 DOB: 10/24/1968 | Treasurer and Chief Financial Officer | Chief Financial Officer since March 2007; Treasurer since November 2006; Assistant Treasurer, September 2004 – November 2006. | Fund Administration Staff, Grantham, Mayo, Van Otterloo & Co. LLC (June 2004 – present); Vice President, Director of Tax, Columbia Management Group (2002 – 2004). | ||||||||||||
| Brent C. Arvidson c/o GMO Trust 40 Rowes Wharf Boston, MA 02110 DOB: 06/26/1969 | Assistant Treasurer | Since August 1998. | Senior Fund Administrator, Grantham, Mayo, Van Otterloo & Co. LLC. | ||||||||||||
| John L. Nasrah c/o GMO Trust 40 Rowes Wharf Boston, MA 02110 DOB: 05/27/1977 | Assistant Treasurer | Since March 2007. | Fund Administrator, Grantham, Mayo, Van Otterloo & Co. LLC (September 2004 – present); Tax Analyst, Bain & Company, Inc. (June 2003 – September 2004). | ||||||||||||
| Mahmoodur Rahman c/o GMO Trust 40 Rowes Wharf Boston, MA 02110 DOB: 11/30/1967 | Assistant Treasurer | Since September 2007. | Fund Administrator, Grantham, Mayo, Van Otterloo & Co. LLC (April 2007 – present); Vice President and Senior Tax Manager, Massachusetts Financial Services Company (January 2000 – April 2007). | ||||||||||||
| Michael E. Gillespie c/o GMO Trust 40 Rowes Wharf Boston, MA 02110 DOB: 02/18/1958 | Chief Compliance Officer | Since March 2005. | Vice President of Compliance (June 2004 – February 2005) and Director of Domestic Compliance (March 2002 – June 2004), Fidelity Investments. | ||||||||||||
4 Each officer is elected to hold such office until his or her successor is duly elected and qualified to carry out the duties and responsibilities of the office, or until he or she resigns or is removed from office.
5 Each of Messrs. Burnett, Arvidson, Bohan, and Pottle serves as an officer and/or director of certain pooled investment vehicles of which GMO or an affiliate of GMO serves as the investment adviser.
26
Principal Officers — (Continued)
| Name, Address, and DOB | Position(s) Held with Trust | Term of Office4 and Length of Time Served | Principal Occupation(s) During Past Five Years5 | ||||||||||||
| Jason B. Harrison c/o GMO Trust 40 Rowes Wharf Boston, MA 02110 DOB: 01/29/1977 | Vice President and Clerk | Vice President since November 2006; Clerk since March 2006. | Legal Counsel, Grantham, Mayo, Van Otterloo & Co. LLC (since February 2006) and Attorney, Ropes & Gray LLP (September 2002 – February 2006). | ||||||||||||
| David L. Bohan c/o GMO Trust 40 Rowes Wharf Boston, MA 02110 DOB: 06/21/1964 | Vice President and Assistant Clerk | Vice President since March 2005; Assistant Clerk since March 2006. | Legal Counsel, Grantham, Mayo, Van Otterloo & Co. LLC. | ||||||||||||
| Gregory L. Pottle c/o GMO Trust 40 Rowes Wharf Boston, MA 02110 DOB: 07/09/1971 | Vice President and Assistant Clerk | Since November 2006. | Legal Counsel, Grantham, Mayo, Van Otterloo & Co. LLC. | ||||||||||||
| Anne K. Trinque c/o GMO Trust 40 Rowes Wharf Boston, MA 02110 DOB: 04/15/1978 | Vice President and Assistant Clerk | Since September 2007. | Legal Counsel, Grantham, Mayo, Van Otterloo & Co. LLC (January 2007 – present); Attorney, Goodwin Procter LLP (September 2003 – January 2007). | ||||||||||||
| Cheryl Wakeham c/o GMO Trust 40 Rowes Wharf Boston, MA 02110 DOB: 10/29/1958 | Vice President and Anti-Money Laundering Officer | Since December 2004. | Manager, Client Service Administration, Grantham, Mayo, Van Otterloo & Co. LLC. | ||||||||||||
4 Each officer is elected to hold such office until his or her successor is duly elected and qualified to carry out the duties and responsibilities of the office, or until he or she resigns or is removed from office.
5 Each of Messrs. Burnett, Arvidson, Bohan, and Pottle serves as an officer and/or director of certain pooled investment vehicles of which GMO or an affiliate of GMO serves as the investment adviser.
27
GMO Tax-Managed International Equities Fund
(A Series of GMO Trust)
Annual Report
February 28, 2009
For a free copy of the Fund's proxy voting guidelines, shareholders may call 1-617-346-7646 (collect) or visit the Securities and Exchange Commission's website at www.sec.gov. Information regarding how the Fund voted proxies relating to portfolio securities during the most recent 12-month period ended June 30 is available on GMO's website at www.gmo.com, or on the Securities and Exchange Commission's website at www.sec.gov.
The Fund files its complete schedule of portfolio holdings with the Securities and Exchange Commission for the first and third quarter of each fiscal year on Form N-Q, which is available on the Commission's website at www.sec.gov. The Fund's Form N-Q may be reviewed and copied at the Commission's Public Reference Room in Washington, D.C. Information on the operation of the Public Reference Room may be obtained by calling 1-800-SEC-0330. The Fund has a policy with respect to disclosure of portfolio holdings under which it may also make available on GMO's website at www.gmo.com a complete schedule of portfolio holdings.
This report is prepared for the general information of shareholders. It is authorized for distribution to prospective investors only when preceded or accompanied by a prospectus for the GMO Trust, which contains a complete discussion of the risks associated with an investment in this Fund and other important information. The GMO Trust prospectus can be obtained at www.gmo.com.
GMO Tax-Managed International Equities Fund
(A Series of GMO Trust)
Portfolio Management
Day-to-day management of the Fund's portfolio is the responsibility of the Quantitative Equity team at Grantham, Mayo, Van Otterloo & Co. LLC.
Management Discussion and Analysis of Fund Performance
The GMO Tax-Managed International Equities Fund declined 46.7% for the fiscal year ended February 28, 2009, as compared to the 50.2% decline for the MSCI EAFE Index. On an after-tax basis, the Fund returned -47.1% compared to the benchmark's -50.3% return for the same period (calculated using the historical highest individual federal marginal income tax rates and not taking into account the impact of state and local taxes). Consistent with the Fund's investment objectives and policies, the Fund was invested primarily in international equity securities throughout the period.
Sector selection contributed positively for the fiscal year. Underweight exposure to Financial Services stocks and overweight exposure to Health Care stocks were the top two sources of positive return. An overweight in Energy stocks also contributed positively, but was offset by overweight exposure to Materials stocks.
Stock selection was a negative factor for the fiscal year period. The portfolio benefited from positive selection within Consumer Staples, Health Care, and Consumer Discretionary stocks. However, poor selection within Financial Services and Industrial stocks outweighed these gains.
Country selection was a moderately positive factor for the year, primarily due to overweight exposure to Japan, which significantly outperformed the market. Last year's key source of contribution, emerging equities, was not a significant factor in performance relative to the benchmark for the period. The portfolio's exposure to emerging markets was reduced during the first half of the period, and the portfolio had no exposure to emerging equities after mid-August.
The views expressed herein are exclusively those of Grantham, Mayo, Van Otterloo & Co. LLC Management as of the date of this report and are subject to change. GMO disclaims any responsibility to update such views. They are not meant as investment advice.

Performance data quoted represents past performance and is not indicative of future results. The investment return and principal value of an investment will fluctuate so that an investor's shares, when redeemed, may be worth more or less than their original cost. Current performance data may be lower or higher than the performance data provided herein. To obtain performance information to the most recent month-end, visit www.gmo.com. Performance shown is net of all fees after reimbursement from the Manager. Returns would have been lower had certain expenses not been reimbursed during the periods shown and do not include the effect of taxes on distributions and redemptions. All information is unaudited.
GMO Tax-Managed International Equities Fund
(A Series of GMO Trust)
Investments Concentration Summary
February 28, 2009 (Unaudited)
| Asset Class Summary | % of Total Net Assets | ||||||
| Common Stocks | 94.9 | % | |||||
| Short-Term Investments | 4.3 | ||||||
| Preferred Stocks | 0.1 | ||||||
| Rights and Warrants | 0.0 | ||||||
| Futures | (0.1 | ) | |||||
| Other | 0.8 | ||||||
| 100.0 | % | ||||||
| Country Summary | % of Equity Investments | ||||||
| Japan | 29.4 | % | |||||
| United Kingdom | 20.9 | ||||||
| France | 11.9 | ||||||
| Switzerland | 11.0 | ||||||
| Germany | 6.1 | ||||||
| Italy | 3.2 | ||||||
| Canada | 2.7 | ||||||
| Hong Kong | 2.6 | ||||||
| Australia | 2.2 | ||||||
| Netherlands | 2.2 | ||||||
| Singapore | 1.4 | ||||||
| Sweden | 1.2 | ||||||
| Belgium | 1.1 | ||||||
| Spain | 1.1 | ||||||
| Finland | 0.9 | ||||||
| Denmark | 0.6 | ||||||
| Greece | 0.6 | ||||||
| Ireland | 0.4 | ||||||
| Norway | 0.3 | ||||||
| Austria | 0.1 | ||||||
| New Zealand | 0.1 | ||||||
| 100.0 | % | ||||||
1
GMO Tax-Managed International Equities Fund
(A Series of GMO Trust)
Investments Concentration Summary — (Continued)
February 28, 2009 (Unaudited)
| Industry Sector Summary | % of Equity Investments | ||||||
| Health Care | 20.3 | % | |||||
| Energy | 13.0 | ||||||
| Consumer Discretionary | 12.5 | ||||||
| Consumer Staples | 11.9 | ||||||
| Financials | 11.3 | ||||||
| Telecommunication Services | 7.3 | ||||||
| Utilities | 6.8 | ||||||
| Materials | 6.7 | ||||||
| Industrials | 5.9 | ||||||
| Information Technology | 4.3 | ||||||
| 100.0 | % | ||||||
2
GMO Tax-Managed International Equities Fund
(A Series of GMO Trust)
Schedule of Investments
(showing percentage of total net assets)
February 28, 2009
| Shares | Description | Value ($) | |||||||||||||
| COMMON STOCKS — 94.9% | |||||||||||||||
| Australia — 2.1% | |||||||||||||||
| 116,687 | Australia and New Zealand Banking Group Ltd | 977,374 | |||||||||||||
| 62,291 | National Australia Bank Ltd | 699,689 | |||||||||||||
| 123,622 | Origin Energy Ltd | 1,067,160 | |||||||||||||
| 36,778 | QBE Insurance Group Ltd | 441,726 | |||||||||||||
| 100,337 | Santos Ltd | 986,448 | |||||||||||||
| 313,061 | Stockland (REIT) | 536,220 | |||||||||||||
| 75,951 | TABCORP Holdings Ltd | 307,768 | |||||||||||||
| 301,138 | Telstra Corp Ltd | 678,668 | |||||||||||||
| 88,814 | Woodside Petroleum Ltd | 2,021,351 | |||||||||||||
| 51,116 | Woolworths Ltd | 849,378 | |||||||||||||
| Total Australia | 8,565,782 | ||||||||||||||
| Austria — 0.1% | |||||||||||||||
| 18,071 | OMV AG | 470,761 | |||||||||||||
| Belgium — 1.0% | |||||||||||||||
| 16,534 | Belgacom SA | 538,167 | |||||||||||||
| 8,420 | Colruyt SA | 1,908,854 | |||||||||||||
| 3,339 | Delhaize Group | 192,785 | |||||||||||||
| 133,416 | Dexia | 277,928 | |||||||||||||
| 230,948 | Fortis | 380,532 | |||||||||||||
| 18,737 | KBC Groep NV | 194,477 | |||||||||||||
| 11,460 | Solvay SA | 648,551 | |||||||||||||
| Total Belgium | 4,141,294 | ||||||||||||||
| Canada — 2.6% | |||||||||||||||
| 82,100 | Bank of Montreal | 1,825,663 | |||||||||||||
| 34,400 | Bank of Nova Scotia | 776,312 | |||||||||||||
| 14,600 | Canadian Imperial Bank of Commerce | 495,197 | |||||||||||||
| 36,500 | Canadian National Railway Co | 1,172,292 | |||||||||||||
| 21,800 | Canadian Pacific Railway Ltd | 616,884 | |||||||||||||
| 22,800 | Magna International Inc Class A | 584,965 | |||||||||||||
See accompanying notes to the financial statements.
3
GMO Tax-Managed International Equities Fund
(A Series of GMO Trust)
Schedule of Investments — (Continued)
(showing percentage of total net assets)
February 28, 2009
| Shares | Description | Value ($) | |||||||||||||
| Canada — continued | |||||||||||||||
| 46,700 | National Bank of Canada | 1,390,502 | |||||||||||||
| 53,600 | Petro-Canada | 1,183,059 | |||||||||||||
| 11,900 | Potash Corp of Saskatchewan Inc | 998,807 | |||||||||||||
| 30,800 | Royal Bank of Canada | 748,574 | |||||||||||||
| 55,700 | Sun Life Financial Inc | 871,708 | |||||||||||||
| Total Canada | 10,663,963 | ||||||||||||||
| Denmark — 0.6% | |||||||||||||||
| 34,522 | Novo-Nordisk A/S Class B | 1,680,995 | |||||||||||||
| 14,105 | Vestas Wind Systems A/S * | 614,186 | |||||||||||||
| Total Denmark | 2,295,181 | ||||||||||||||
| Finland — 0.9% | |||||||||||||||
| 25,430 | Fortum Oyj | 436,753 | |||||||||||||
| 122,939 | Nokia Oyj | 1,151,978 | |||||||||||||
| 19,800 | Rautaruukki Oyj | 328,555 | |||||||||||||
| 83,464 | Sampo Oyj Class A | 1,097,731 | |||||||||||||
| 44,186 | Tietoenator Oyj | 550,987 | |||||||||||||
| Total Finland | 3,566,004 | ||||||||||||||
| France — 11.3% | |||||||||||||||
| 29,738 | Air France | 270,202 | |||||||||||||
| 15,708 | Air Liquide SA | 1,146,251 | |||||||||||||
| 100,535 | ArcelorMittal | 1,926,927 | |||||||||||||
| 76,966 | BNP Paribas | 2,492,558 | |||||||||||||
| 3,285 | Bongrain SA | 165,702 | |||||||||||||
| 23,689 | Cap Gemini SA | 678,894 | |||||||||||||
| 8,940 | Carrefour SA | 298,846 | |||||||||||||
| 17,481 | Casino Guichard-Perrachon SA | 1,079,998 | |||||||||||||
| 18,338 | Cie de Saint-Gobain | 418,329 | |||||||||||||
| 4,715 | Dassault Systemes SA | 163,401 | |||||||||||||
| 35,628 | Essilor International SA | 1,229,597 | |||||||||||||
| 1,804 | Esso SAF | 169,347 | |||||||||||||
| 127,706 | France Telecom SA | 2,853,944 | |||||||||||||
See accompanying notes to the financial statements.
4
GMO Tax-Managed International Equities Fund
(A Series of GMO Trust)
Schedule of Investments — (Continued)
(showing percentage of total net assets)
February 28, 2009
| Shares | Description | Value ($) | |||||||||||||
| France — continued | |||||||||||||||
| 94,851 | GDF Suez | 2,995,374 | |||||||||||||
| 16,002 | GDF Suez VVPR Strip * | 20 | |||||||||||||
| 18,507 | Hermes International | 1,562,797 | |||||||||||||
| 10,797 | L'Oreal SA | 694,542 | |||||||||||||
| 4,045 | NYSE Euronext | 67,040 | |||||||||||||
| 4,196 | Pernod-Ricard SA | 228,476 | |||||||||||||
| 25,445 | Peugeot SA | 432,982 | |||||||||||||
| 33,163 | Renault SA | 476,197 | |||||||||||||
| 238,470 | Sanofi-Aventis | 12,256,671 | |||||||||||||
| 8,092 | SES | 148,214 | |||||||||||||
| 55,121 | Societe Generale | 1,708,620 | |||||||||||||
| 109,319 | STMicroelectronics NV | 480,406 | |||||||||||||
| 4,196 | Suez Environnement SA * | 61,069 | |||||||||||||
| 20 | Suez SA VVPR Strip * | — | |||||||||||||
| 248,035 | Total SA | 11,653,068 | |||||||||||||
| 4,609 | Unibail-Rodamco (REIT) | 578,611 | |||||||||||||
| 9,335 | Vallourec SA | 726,585 | |||||||||||||
| Total France | 46,964,668 | ||||||||||||||
| Germany — 5.7% | |||||||||||||||
| 37,213 | Adidas AG | 1,069,809 | |||||||||||||
| 7,220 | Allianz SE (Registered) | 484,661 | |||||||||||||
| 16,802 | BASF AG | 466,081 | |||||||||||||
| 46,807 | Bayerische Motoren Werke AG | 1,157,798 | |||||||||||||
| 6,648 | Beiersdorf AG | 275,350 | |||||||||||||
| 14,600 | Demag Cranes AG | 284,269 | |||||||||||||
| 84,031 | Deutsche Post AG (Registered) | 803,867 | |||||||||||||
| 251,493 | Deutsche Telekom AG (Registered) | 3,041,258 | |||||||||||||
| 37,427 | E.ON AG | 962,432 | |||||||||||||
| 32,350 | Fresenius Medical Care AG & Co | 1,315,336 | |||||||||||||
| 46,659 | Gildemeister AG | 271,099 | |||||||||||||
| 36,072 | Hannover Rueckversicherungs AG (Registered) | 1,285,981 | |||||||||||||
| 51,526 | Heidelberger Druckmaschinen AG | 212,904 | |||||||||||||
| 30,835 | K&S AG | 1,372,577 | |||||||||||||
See accompanying notes to the financial statements.
5
GMO Tax-Managed International Equities Fund
(A Series of GMO Trust)
Schedule of Investments — (Continued)
(showing percentage of total net assets)
February 28, 2009
| Shares | Description | Value ($) | |||||||||||||
| Germany — continued | |||||||||||||||
| 35,099 | Kloeckner & Co AG | 392,110 | |||||||||||||
| 5,100 | MTU Aero Engines Holding AG | 130,844 | |||||||||||||
| 5,582 | Muenchener Rueckversicherungs-Gesellschaft AG (Registered) | 680,207 | |||||||||||||
| 28,935 | Norddeutsche Affinerie AG | 719,330 | |||||||||||||
| 10,746 | RWE AG | 683,485 | |||||||||||||
| 20,662 | Salzgitter AG | 1,276,129 | |||||||||||||
| 145,541 | SAP AG | 4,675,455 | |||||||||||||
| 37,543 | SGL Carbon SE * | 828,570 | |||||||||||||
| 37,961 | Suedzucker AG | 672,365 | |||||||||||||
| 29,502 | ThyssenKrupp AG | 520,931 | |||||||||||||
| Total Germany | 23,582,848 | ||||||||||||||
| Greece — 0.5% | |||||||||||||||
| 46,621 | National Bank of Greece SA | 569,914 | |||||||||||||
| 63,810 | OPAP SA | 1,640,489 | |||||||||||||
| Total Greece | 2,210,403 | ||||||||||||||
| Hong Kong — 2.4% | |||||||||||||||
| 682,000 | BOC Hong Kong Holdings Ltd | 678,284 | |||||||||||||
| 595,400 | CLP Holdings Ltd | 4,401,519 | |||||||||||||
| 203,100 | Esprit Holdings Ltd | 1,093,779 | |||||||||||||
| 99,500 | Hang Seng Bank Ltd | 1,100,672 | |||||||||||||
| 461,500 | Hong Kong Electric Holdings Ltd | 2,845,385 | |||||||||||||
| Total Hong Kong | 10,119,639 | ||||||||||||||
| Ireland — 0.4% | |||||||||||||||
| 80,660 | CRH Plc | 1,656,538 | |||||||||||||
| Italy — 3.1% | |||||||||||||||
| 142,819 | Enel SPA | 709,841 | |||||||||||||
| 403,302 | ENI SPA | 8,049,740 | |||||||||||||
| 223,415 | Mediaset SPA | 991,462 | |||||||||||||
| 32,935 | Snam Rete Gas SPA | 163,193 | |||||||||||||
| 647,350 | Telecom Italia SPA | 786,866 | |||||||||||||
See accompanying notes to the financial statements.
6
GMO Tax-Managed International Equities Fund
(A Series of GMO Trust)
Schedule of Investments — (Continued)
(showing percentage of total net assets)
February 28, 2009
| Shares | Description | Value ($) | |||||||||||||
| Italy — continued | |||||||||||||||
| 1,117,630 | Telecom Italia SPA-Di RISP | 1,062,940 | |||||||||||||
| 218,791 | Terna SPA | 679,562 | |||||||||||||
| 259,230 | UniCredit SPA | 328,343 | |||||||||||||
| Total Italy | 12,771,947 | ||||||||||||||
| Japan — 27.9% | |||||||||||||||
| 5,000 | ABC-Mart Inc | 109,453 | |||||||||||||
| 7,460 | Acom Co Ltd | 182,506 | |||||||||||||
| 107,400 | Asahi Breweries Ltd | 1,344,802 | |||||||||||||
| 152,000 | Asahi Kasei Corp | 482,954 | |||||||||||||
| 44,500 | Astellas Pharma Inc | 1,476,664 | |||||||||||||
| 41,500 | Bridgestone Corp | 565,220 | |||||||||||||
| 43,400 | Canon Inc | 1,095,289 | |||||||||||||
| 47,500 | Chubu Electric Power Co Inc | 1,171,107 | |||||||||||||
| 223,000 | Cosmo Oil Co Ltd | 618,102 | |||||||||||||
| 15,700 | Culture Convenience Club Co Ltd | 108,328 | |||||||||||||
| 594 | CyberAgent Inc | 270,037 | |||||||||||||
| 83,650 | Daiei Inc * | 260,250 | |||||||||||||
| 15,100 | Daito Trust Construction Co Ltd | 475,519 | |||||||||||||
| 110,000 | Daiwa Securities Group Inc | 377,862 | |||||||||||||
| 65,000 | Daiwabo Co Ltd | 145,605 | |||||||||||||
| 7,100 | Don Quijote Co Ltd | 83,767 | |||||||||||||
| 51,000 | Dowa Holdings Co Ltd | 157,206 | |||||||||||||
| 37,200 | Eisai Co Ltd | 1,139,690 | |||||||||||||
| 22,600 | Electric Power Development Co Ltd | 722,102 | |||||||||||||
| 27,700 | FamilyMart Co Ltd | 934,441 | |||||||||||||
| 39,600 | Fast Retailing Co Ltd | 3,977,822 | |||||||||||||
| 443,000 | Fuji Heavy Industries Ltd | 1,411,553 | |||||||||||||
| 49,000 | Furukawa Electric Co Ltd (The) | 127,038 | |||||||||||||
| 229,000 | GS Yuasa Corp | 940,617 | |||||||||||||
| 138,000 | Hanwa Co Ltd | 371,762 | |||||||||||||
| 439,000 | Hitachi Ltd | 1,093,161 | |||||||||||||
| 294,700 | Honda Motor Co Ltd | 7,047,101 | |||||||||||||
| 48,300 | Hosiden Corp | 506,396 | |||||||||||||
See accompanying notes to the financial statements.
7
GMO Tax-Managed International Equities Fund
(A Series of GMO Trust)
Schedule of Investments — (Continued)
(showing percentage of total net assets)
February 28, 2009
| Shares | Description | Value ($) | |||||||||||||
| Japan — continued | |||||||||||||||
| 146 | INPEX Corp | 987,730 | |||||||||||||
| 76,000 | Iseki & Co Ltd * | 172,626 | |||||||||||||
| 43,000 | Itochu Corp | 192,809 | |||||||||||||
| 59,600 | JFE Holdings Inc | 1,289,620 | |||||||||||||
| 51,000 | JGC Corp | 581,250 | |||||||||||||
| 192,000 | Kajima Corp | 401,355 | |||||||||||||
| 31 | Kakaku.com Inc | 91,430 | |||||||||||||
| 106,000 | Kamigumi Co Ltd | 679,173 | |||||||||||||
| 24,000 | Kansai Electric Power Co Inc | 577,049 | |||||||||||||
| 127,000 | Kao Corp | 2,413,531 | |||||||||||||
| 216,000 | Kawasaki Kisen Kaisha Ltd | 679,054 | |||||||||||||
| 6,200 | Keyence Corp | 1,170,182 | |||||||||||||
| 44,000 | Kirin Holdings Co Ltd | 424,694 | |||||||||||||
| 17,000 | Kyudenko Corp | 117,949 | |||||||||||||
| 34,400 | Kyushu Electric Power Co Inc | 814,686 | |||||||||||||
| 23,500 | Lawson Inc | 1,017,593 | |||||||||||||
| 42,000 | Leopalace21 Corp | 233,319 | |||||||||||||
| 193,000 | Marubeni Corp | 599,174 | |||||||||||||
| 712,000 | Mazda Motor Corp | 899,541 | |||||||||||||
| 47,500 | Mitsubishi Chemical Holdings Corp | 161,340 | |||||||||||||
| 99,000 | Mitsubishi Corp | 1,231,706 | |||||||||||||
| 336,000 | Mitsubishi Heavy Industries Ltd | 940,780 | |||||||||||||
| 237,300 | Mitsubishi UFJ Financial Group Inc | 1,072,032 | |||||||||||||
| 18,380 | Mitsubishi UFJ Lease & Finance Co Ltd | 319,857 | |||||||||||||
| 346,000 | Mitsui Mining & Smelting Co Ltd | 487,452 | |||||||||||||
| 177,000 | Mitsui OSK Lines Ltd | 897,157 | |||||||||||||
| 1,030,300 | Mizuho Financial Group Inc | 1,941,899 | |||||||||||||
| 24,100 | Murata Manufacturing Co Ltd | 915,007 | |||||||||||||
| 33,000 | Nagase & Co | 260,321 | |||||||||||||
| 60 | Net One Systems Co Ltd | 84,288 | |||||||||||||
| 2,700 | Nintendo Co Ltd | 770,849 | |||||||||||||
| 19,000 | Nippon Corp | 152,079 | |||||||||||||
| 73,000 | Nippon Meat Packers Inc | 706,652 | |||||||||||||
| 444,500 | Nippon Mining Holdings Inc | 1,543,811 | |||||||||||||
See accompanying notes to the financial statements.
8
GMO Tax-Managed International Equities Fund
(A Series of GMO Trust)
Schedule of Investments — (Continued)
(showing percentage of total net assets)
February 28, 2009
| Shares | Description | Value ($) | |||||||||||||
| Japan — continued | |||||||||||||||
| 412,000 | Nippon Oil Corp | 1,963,522 | |||||||||||||
| 25,900 | Nippon Paper Group Inc | 574,131 | |||||||||||||
| 117,800 | Nippon Telegraph & Telephone Corp | 5,037,064 | |||||||||||||
| 115,000 | Nippon Yakin Koguo Co Ltd | 221,415 | |||||||||||||
| 360,000 | Nippon Yusen KK | 1,485,058 | |||||||||||||
| 902,200 | Nissan Motor Co | 2,754,186 | |||||||||||||
| 105,000 | Nisshinbo Industries Inc | 749,345 | |||||||||||||
| 3,200 | Nitori Co Ltd | 169,444 | |||||||||||||
| 2,786 | NTT Docomo Inc | 4,340,087 | |||||||||||||
| 137,000 | Obayashi Corp | 576,004 | |||||||||||||
| 145,000 | OJI Paper Co Ltd | 536,303 | |||||||||||||
| 23,300 | Ono Pharmaceutical Co Ltd | 1,078,594 | |||||||||||||
| 2,400 | Oriental Land Co Ltd | 157,462 | |||||||||||||
| 29,960 | ORIX Corp | 608,611 | |||||||||||||
| 557,000 | Osaka Gas Co Ltd | 1,991,554 | |||||||||||||
| 180,000 | Pacific Metals Co Ltd | 689,477 | |||||||||||||
| 58,000 | Panasonic Corp | 671,536 | |||||||||||||
| 8,750 | Point Inc | 357,901 | |||||||||||||
| 1,949 | Rakuten Inc | 1,002,897 | |||||||||||||
| 117,800 | Resona Holdings Inc | 2,019,801 | |||||||||||||
| 117,400 | Ricoh Company Ltd | 1,326,117 | |||||||||||||
| 22,600 | Ryohin Keikaku Co Ltd | 795,225 | |||||||||||||
| 7,600 | Ryosan Co | 166,092 | |||||||||||||
| 45,900 | Sankyo Co Ltd | 2,059,966 | |||||||||||||
| 138,400 | Sega Sammy Holdings Inc | 1,177,787 | |||||||||||||
| 293,700 | Seven & I Holdings Co Ltd | 6,508,932 | |||||||||||||
| 2,200 | Shimamura Co Ltd | 113,550 | |||||||||||||
| 45,600 | Shin-Etsu Chemical Co Ltd | 2,030,186 | |||||||||||||
| 19,000 | Shionogi & Co Ltd | 308,541 | |||||||||||||
| 597,800 | Sojitz Corp | 671,802 | |||||||||||||
| 79,800 | SUMCO Corp | 988,746 | |||||||||||||
| 85,400 | Sumitomo Corp | 713,040 | |||||||||||||
| 109,600 | Sumitomo Electric Industries Ltd | 851,657 | |||||||||||||
| 712,000 | Sumitomo Metal Industries Ltd | 1,333,776 | |||||||||||||
See accompanying notes to the financial statements.
9
GMO Tax-Managed International Equities Fund
(A Series of GMO Trust)
Schedule of Investments — (Continued)
(showing percentage of total net assets)
February 28, 2009
| Shares | Description | Value ($) | |||||||||||||
| Japan — continued | |||||||||||||||
| 86,000 | Sumitomo Metal Mining Co Ltd | 858,438 | |||||||||||||
| 185,000 | Sumitomo Trust & Banking Co Ltd | 611,012 | |||||||||||||
| 270,000 | Taisei Corp | 478,019 | |||||||||||||
| 43,000 | Taisho Pharmaceutical Co Ltd | 771,875 | |||||||||||||
| 55,800 | Takeda Pharmaceutical Co Ltd | 2,253,752 | |||||||||||||
| 16,200 | Terumo Corp | 496,468 | |||||||||||||
| 7,300 | Tohoku Electric Power Co Inc | 170,915 | |||||||||||||
| 23,900 | Tokio Marine Holdings Inc | 542,792 | |||||||||||||
| 113,600 | Tokyo Electric Power Co Inc (The) | 3,206,933 | |||||||||||||
| 345,000 | Tokyo Gas Co Ltd | 1,382,051 | |||||||||||||
| 96,500 | Tokyo Steel Manufacturing Co | 948,739 | |||||||||||||
| 97,000 | TonenGeneral Sekiyu KK | 916,554 | |||||||||||||
| 33,000 | Toyo Suisan Kaisha Ltd | 780,997 | |||||||||||||
| 43,100 | Toyota Motor Corp | 1,380,478 | |||||||||||||
| 9,100 | Unicharm Corp | 594,507 | |||||||||||||
| 129,000 | UNY Co Ltd | 943,458 | |||||||||||||
| 8,290 | USS Co Ltd | 334,431 | |||||||||||||
| 2,768 | Yahoo Japan Corp | 791,791 | |||||||||||||
| 13,900 | Yamaha Motor Co Ltd | 118,422 | |||||||||||||
| Total Japan | 115,635,790 | ||||||||||||||
| Netherlands — 2.1% | |||||||||||||||
| 426,101 | Aegon NV | 1,516,528 | |||||||||||||
| 16,246 | Boskalis Westminster | 309,006 | |||||||||||||
| 11,909 | European Aeronautic Defense and Space Co NV | 172,904 | |||||||||||||
| 58,234 | Heineken NV | 1,554,890 | |||||||||||||
| 411,806 | ING Groep NV | 1,861,482 | |||||||||||||
| 67,353 | Koninklijke Ahold NV | 747,356 | |||||||||||||
| 55,862 | Koninklijke DSM NV | 1,276,641 | |||||||||||||
| 52,954 | Reed Elsevier NV | 588,362 | |||||||||||||
| 42,526 | Unilever NV | 814,853 | |||||||||||||
| Total Netherlands | 8,842,022 | ||||||||||||||
| New Zealand — 0.1% | |||||||||||||||
| 406,172 | Telecom Corp of New Zealand | 492,304 | |||||||||||||
See accompanying notes to the financial statements.
10
GMO Tax-Managed International Equities Fund
(A Series of GMO Trust)
Schedule of Investments — (Continued)
(showing percentage of total net assets)
February 28, 2009
| Shares | Description | Value ($) | |||||||||||||
| Norway — 0.3% | |||||||||||||||
| 15,144 | Frontline Ltd | 313,882 | |||||||||||||
| 56,474 | StatoilHydro ASA | 937,619 | |||||||||||||
| Total Norway | 1,251,501 | ||||||||||||||
| Singapore — 1.4% | |||||||||||||||
| 331,000 | Oversea-Chinese Banking Corp Ltd | 945,641 | |||||||||||||
| 693,000 | SembCorp Marine Ltd | 614,846 | |||||||||||||
| 186,000 | Singapore Exchange Ltd | 536,194 | |||||||||||||
| 89,000 | Singapore Press Holdings Ltd | 155,626 | |||||||||||||
| 1,374,670 | Singapore Telecommunications | 2,163,501 | |||||||||||||
| 193,000 | United Overseas Bank Ltd | 1,229,825 | |||||||||||||
| Total Singapore | 5,645,633 | ||||||||||||||
| Spain — 1.0% | |||||||||||||||
| 47,135 | Banco Popular Espanol SA | 223,055 | |||||||||||||
| 78,740 | Banco Santander SA | 481,015 | |||||||||||||
| 25,020 | Inditex SA | 938,562 | |||||||||||||
| 101,414 | Repsol YPF SA | 1,548,983 | |||||||||||||
| 52,275 | Telefonica SA | 962,072 | |||||||||||||
| Total Spain | 4,153,687 | ||||||||||||||
| Sweden — 1.1% | |||||||||||||||
| 64,400 | Hennes & Mauritz AB Class B | 2,388,865 | |||||||||||||
| 89,103 | Investor AB Class B | 1,005,755 | |||||||||||||
| 60,501 | Nordea Bank AB | 301,651 | |||||||||||||
| 19,698 | SKF AB Class B | 164,199 | |||||||||||||
| 58,100 | Svenska Handelsbanken AB Class A | 695,375 | |||||||||||||
| Total Sweden | 4,555,845 | ||||||||||||||
| Switzerland — 10.5% | |||||||||||||||
| 3,565 | Actelion Ltd (Registered) * | 168,594 | |||||||||||||
| 2,523 | Bobst Group AG (Registered) | 63,532 | |||||||||||||
| 38,103 | Ciba Holding AG * | 1,605,743 | |||||||||||||
| 51,153 | Compagnie Financiere Richemont SA Class A | 675,569 | |||||||||||||
| 344,269 | Nestle SA (Registered) | 11,254,302 | |||||||||||||
See accompanying notes to the financial statements.
11
GMO Tax-Managed International Equities Fund
(A Series of GMO Trust)
Schedule of Investments — (Continued)
(showing percentage of total net assets)
February 28, 2009
| Shares | Description | Value ($) | |||||||||||||
| Switzerland — continued | |||||||||||||||
| 495,364 | Novartis AG (Registered) | 18,072,518 | |||||||||||||
| 40,688 | Roche Holding AG (Non Voting) | 4,618,802 | |||||||||||||
| 6,641 | Swatch Group AG | 738,714 | |||||||||||||
| 597 | Swisscom AG (Registered) | 178,822 | |||||||||||||
| 7,497 | Syngenta AG (Registered) | 1,602,690 | |||||||||||||
| 25,174 | Synthes Inc | 2,921,324 | |||||||||||||
| 163,477 | UBS AG (Registered) * | 1,530,788 | |||||||||||||
| Total Switzerland | 43,431,398 | ||||||||||||||
| United Kingdom — 19.8% | |||||||||||||||
| 165,228 | 3i Group Plc | 470,195 | |||||||||||||
| 325,436 | AstraZeneca Plc | 10,320,162 | |||||||||||||
| 13,069 | Autonomy Corp Plc * | 225,237 | |||||||||||||
| 104,215 | BAE Systems Plc | 550,198 | |||||||||||||
| 843,298 | Barclays Plc | 1,106,338 | |||||||||||||
| 446,084 | BG Group Plc | 6,376,496 | |||||||||||||
| 275,317 | BP Plc | 1,753,979 | |||||||||||||
| 110,157 | British American Tobacco Plc | 2,815,652 | |||||||||||||
| 442,283 | BT Group Plc | 565,043 | |||||||||||||
| 111,818 | Burberry Group Plc | 407,992 | |||||||||||||
| 76,340 | Cable & Wireless Plc | 149,397 | |||||||||||||
| 195,670 | Cadbury Plc | 1,489,740 | |||||||||||||
| 16,250 | Capita Group Plc | 153,341 | |||||||||||||
| 162,463 | Centrica Plc | 624,785 | |||||||||||||
| 49,061 | Cobham Plc | 134,663 | |||||||||||||
| 405,010 | Compass Group Plc | 1,779,386 | |||||||||||||
| 165,679 | Diageo Plc | 1,910,486 | |||||||||||||
| 116,587 | Drax Group Plc | 861,301 | |||||||||||||
| 1,722,106 | DSG International Plc | 495,292 | |||||||||||||
| 1,232,786 | GlaxoSmithKline Plc | 18,697,419 | |||||||||||||
| 386,361 | Home Retail Group Plc | 1,164,638 | |||||||||||||
| 168,472 | HSBC Holdings Plc | 1,171,747 | |||||||||||||
| 23,999 | Imperial Tobacco Group Plc | 574,583 | |||||||||||||
| 1,526,182 | Lloyds Banking Group Plc | 1,252,811 | |||||||||||||
| 71,343 | Next Plc | 1,183,077 | |||||||||||||
See accompanying notes to the financial statements.
12
GMO Tax-Managed International Equities Fund
(A Series of GMO Trust)
Schedule of Investments — (Continued)
(showing percentage of total net assets)
February 28, 2009
| Shares | Description | Value ($) | |||||||||||||
| United Kingdom — continued | |||||||||||||||
| 51,139 | Reckitt Benckiser Group Plc | 1,956,861 | |||||||||||||
| 122,040 | Reed Elsevier Plc | 911,702 | |||||||||||||
| 39,764 | Rio Tinto Plc | 1,015,061 | |||||||||||||
| 2,819,904 | Royal Bank of Scotland Group Plc | 918,412 | |||||||||||||
| 212,792 | Royal Dutch Shell Group Class A (Amsterdam) | 4,651,998 | |||||||||||||
| 5,634 | Royal Dutch Shell Plc A Shares (London) | 123,691 | |||||||||||||
| 118,362 | Royal Dutch Shell Plc B Shares (London) | 2,484,517 | |||||||||||||
| 91,642 | Scottish & Southern Energy Plc | 1,493,350 | |||||||||||||
| 55,486 | Signet Jewelers Ltd | 422,675 | |||||||||||||
| 157,015 | Smith & Nephew Plc | 1,112,674 | |||||||||||||
| 241,841 | Tesco Plc | 1,146,922 | |||||||||||||
| 94,798 | Travis Perkins Plc | 439,262 | |||||||||||||
| 119,452 | Tullow Oil Plc | 1,240,488 | |||||||||||||
| 36,764 | Unilever Plc | 710,197 | |||||||||||||
| 3,279,824 | Vodafone Group Plc | 5,811,492 | |||||||||||||
| 253,927 | William Hill Plc | 853,077 | |||||||||||||
| 251,559 | Wolseley Plc | 635,309 | |||||||||||||
| Total United Kingdom | 82,161,646 | ||||||||||||||
| TOTAL COMMON STOCKS (COST $597,027,262) | 393,178,854 | ||||||||||||||
| PREFERRED STOCKS — 0.1% | |||||||||||||||
| Germany — 0.1% | |||||||||||||||
| 8,506 | Volkswagen AG 5.36% | 381,147 | |||||||||||||
| TOTAL PREFERRED STOCKS (COST $227,450) | 381,147 | ||||||||||||||
| RIGHTS AND WARRANTS — 0.0% | |||||||||||||||
| France — 0.0% | |||||||||||||||
| 22,316 | Cie de Saint-Gobain Warrants, Expires 03/06/09 * | 32,818 | |||||||||||||
| TOTAL RIGHTS AND WARRANTS (COST $67,411) | 32,818 | ||||||||||||||
See accompanying notes to the financial statements.
13
GMO Tax-Managed International Equities Fund
(A Series of GMO Trust)
Schedule of Investments — (Continued)
(showing percentage of total net assets)
February 28, 2009
| Par Value ($) | Description | Value ($) | |||||||||||||
| SHORT-TERM INVESTMENTS — 4.3% | |||||||||||||||
| 2,994,567 | Banco Santander Time Deposit, 0.33%, due 03/02/09 | 2,994,567 | |||||||||||||
| 3,000,000 | Bank of Tokyo-Mitsubishi Time Deposit, 0.08%, due 03/02/09 | 3,000,000 | |||||||||||||
| 2,433,944 | BNP Paribas Time Deposit, 0.08%, due 03/02/09 | 2,433,944 | |||||||||||||
| 209,502 | Brown Brothers Harriman Time Deposit, 0.01% - 9.25%, due 03/02/09 | 209,502 | |||||||||||||
| 2,993,466 | Citibank Time Deposit, 0.05% - 2.29%, due 03/02/09 | 2,993,466 | |||||||||||||
| 63,203 | Hong Kong & Shanghai Banking Corp. Time Deposit, 0.01%, due 03/02/09 | 63,203 | |||||||||||||
| 2,994,814 | JPMorgan Chase Time Deposit, 0.09% - 0.33%, due 03/02/09 | 2,994,814 | |||||||||||||
| 2,994,567 | Societe Generale Time Deposit, 0.33%, due 03/02/09 | 2,994,567 | |||||||||||||
| TOTAL SHORT-TERM INVESTMENTS (COST $17,684,063) | 17,684,063 | ||||||||||||||
| TOTAL INVESTMENTS — 99.3% (Cost $615,006,186) | 411,276,882 | ||||||||||||||
| Other Assets and Liabilities (net) — 0.7% | 2,747,175 | ||||||||||||||
| TOTAL NET ASSETS — 100.0% | $ | 414,024,057 | |||||||||||||
See accompanying notes to the financial statements.
14
GMO Tax-Managed International Equities Fund
(A Series of GMO Trust)
Schedule of Investments — (Continued)
February 28, 2009
A summary of outstanding financial instruments at February 28, 2009 is as follows:
Futures Contracts
| Number of Contracts | Type | Expiration Date | Contract Value | Net Unrealized Appreciation (Depreciation) | |||||||||||||||
| Buys | |||||||||||||||||||
| 142 | E-Mini MSCI EAFE | March 2009 | $ | 6,952,320 | $ | (614,019 | ) | ||||||||||||
As of February 28, 2009, for the futures contracts held, the Fund had sufficient cash and/or securities to cover any commitments or margin requirements of the relevant broker or exchange.
Notes to Schedule of Investments:
REIT - Real Estate Investment Trust
* Non-income producing security.
See accompanying notes to the financial statements.
15
GMO Tax-Managed International Equities Fund
(A Series of GMO Trust)
Statement of Assets and Liabilities — February 28, 2009
| Assets: | |||||||
| Investments, at value (cost $615,006,186) (Note 2) | $ | 411,276,882 | |||||
| Foreign currency, at value (cost $813) (Note 2) | 775 | ||||||
| Receivable for investments sold | 49,039 | ||||||
| Receivable for Fund shares sold | 15,331 | ||||||
| Dividends receivable | 1,398,255 | ||||||
| Foreign taxes receivable | 385,655 | ||||||
| Receivable for collateral on open futures contracts (Note 2) | 1,510,408 | ||||||
| Receivable for expenses reimbursed by Manager (Note 3) | 10,164 | ||||||
| Total assets | 414,646,509 | ||||||
| Liabilities: | |||||||
| Payable for Fund shares repurchased | 42,083 | ||||||
| Payable to affiliate for (Note 3): | |||||||
| Management fee | 172,270 | ||||||
| Shareholder service fee | 51,681 | ||||||
| Trustees and Chief Compliance Officer of GMO Trust fees | 1,677 | ||||||
| Payable for variation margin on open futures contracts (Note 2) | 64,568 | ||||||
| Accrued expenses | 290,173 | ||||||
| Total liabilities | 622,452 | ||||||
| Net assets | $ | 414,024,057 | |||||
| Net assets consist of: | |||||||
| Paid-in capital | $ | 663,491,709 | |||||
| Accumulated undistributed net investment income | 1,553,637 | ||||||
| Distributions in excess of net realized gain | (46,340,420 | ) | |||||
| Net unrealized depreciation | (204,680,869 | ) | |||||
| $ | 414,024,057 | ||||||
| Net assets attributable to: | |||||||
| Class III shares | $ | 414,024,057 | |||||
| Shares outstanding: | |||||||
| Class III | 44,602,971 | ||||||
| Net asset value per share: | |||||||
| Class III | $ | 9.28 | |||||
See accompanying notes to the financial statements.
16
GMO Tax-Managed International Equities Fund
(A Series of GMO Trust)
Statement of Operations — Year Ended February 28, 2009
| Investment Income: | |||||||
| Dividends (net of withholding taxes of $2,913,093) | $ | 28,867,554 | |||||
| Interest | 497,234 | ||||||
| Total investment income | 29,364,788 | ||||||
| Expenses: | |||||||
| Management fee (Note 3) | 4,048,795 | ||||||
| Shareholder service fee – Class III (Note 3) | 1,173,082 | ||||||
| Custodian and fund accounting agent fees | 691,032 | ||||||
| Transfer agent fees | 31,854 | ||||||
| Audit and tax fees | 88,283 | ||||||
| Legal fees | 19,544 | ||||||
| Trustees fees and related expenses (Note 3) | 10,673 | ||||||
| Registration fees | 1,803 | ||||||
| Miscellaneous | 13,335 | ||||||
| Total expenses | 6,078,401 | ||||||
| Fees and expenses reimbursed by Manager (Note 3) | (834,130 | ) | |||||
| Expense reductions (Note 2) | (6,342 | ) | |||||
| Net expenses | 5,237,929 | ||||||
| Net investment income (loss) | 24,126,859 | ||||||
| Realized and unrealized gain (loss): | |||||||
| Net realized gain (loss) on: | |||||||
| Investments | (36,829,827 | ) | |||||
| Closed futures contracts | (3,820,004 | ) | |||||
| Foreign currency, forward contracts and foreign currency related transactions (net of CPMF tax of $150) (Note 2) | (1,215,494 | ) | |||||
| Net realized gain (loss) | (41,865,325 | ) | |||||
| Change in net unrealized appreciation (depreciation) on: | |||||||
| Investments | (399,901,310 | ) | |||||
| Open futures contracts | (614,019 | ) | |||||
| Foreign currency, forward contracts and foreign currency related transactions | (853,074 | ) | |||||
| Net unrealized gain (loss) | (401,368,403 | ) | |||||
| Net realized and unrealized gain (loss) | (443,233,728 | ) | |||||
| Net increase (decrease) in net assets resulting from operations | $ | (419,106,869 | ) | ||||
See accompanying notes to the financial statements.
17
GMO Tax-Managed International Equities Fund
(A Series of GMO Trust)
Statement of Changes in Net Assets
| Year Ended February 28, 2009 | Year Ended February 29, 2008 | ||||||||||
| Increase (decrease) in net assets: | |||||||||||
| Operations: | |||||||||||
| Net investment income (loss) | $ | 24,126,859 | $ | 28,116,487 | |||||||
| Net realized gain (loss) | (41,865,325 | ) | 111,012,148 | ||||||||
| Change in net unrealized appreciation (depreciation) | (401,368,403 | ) | (112,516,265 | ) | |||||||
| Net increase (decrease) in net assets from operations | (419,106,869 | ) | 26,612,370 | ||||||||
| Distributions to shareholders from: | |||||||||||
| Net investment income | |||||||||||
| Class III | (24,318,799 | ) | (31,165,537 | ) | |||||||
| Net realized gains | |||||||||||
| Class III | (25,255,573 | ) | (118,448,701 | ) | |||||||
| (49,574,372 | ) | (149,614,238 | ) | ||||||||
| Net share transactions (Note 7): | |||||||||||
| Class III | (209,640,633 | ) | 110,083,703 | ||||||||
| Total increase (decrease) in net assets | (678,321,874 | ) | (12,918,165 | ) | |||||||
| Net assets: | |||||||||||
| Beginning of period | 1,092,345,931 | 1,105,264,096 | |||||||||
| End of period (including accumulated undistributed net investment income of $1,553,637 and $2,816,425, respectively) | $ | 414,024,057 | $ | 1,092,345,931 | |||||||
See accompanying notes to the financial statements.
18
GMO Tax-Managed International Equities Fund
(A Series of GMO Trust)
Financial Highlights
(For a Class III share outstanding throughout each period)
| Year Ended February 28/29, | |||||||||||||||||||||||
| 2009 | 2008 | 2007 | 2006 | 2005 | |||||||||||||||||||
| Net asset value, beginning of period | $ | 18.73 | $ | 20.76 | $ | 18.31 | $ | 15.78 | $ | 13.19 | |||||||||||||
| Income (loss) from investment operations: | |||||||||||||||||||||||
| Net investment income (loss)† | 0.48 | 0.51 | 0.36 | 0.35 | 0.26 | ||||||||||||||||||
| Net realized and unrealized gain (loss) | (8.92 | ) | 0.20 | (a) | 3.28 | 2.77 | 2.61 | ||||||||||||||||
| Total from investment operations | (8.44 | ) | 0.71 | 3.64 | 3.12 | 2.87 | |||||||||||||||||
| Less distributions to shareholders: | |||||||||||||||||||||||
| From net investment income | (0.49 | ) | (0.57 | ) | (0.40 | ) | (0.31 | ) | (0.28 | ) | |||||||||||||
| From net realized gains | (0.52 | ) | (2.17 | ) | (0.79 | ) | (0.28 | ) | — | ||||||||||||||
| Total distributions | (1.01 | ) | (2.74 | ) | (1.19 | ) | (0.59 | ) | (0.28 | ) | |||||||||||||
| Net asset value, end of period | $ | 9.28 | $ | 18.73 | $ | 20.76 | $ | 18.31 | $ | 15.78 | |||||||||||||
| Total Return(b) | (46.71 | )% | 2.28 | % | 20.33 | % | 20.04 | % | 21.94 | % | |||||||||||||
| Ratios/Supplemental Data: | |||||||||||||||||||||||
| Net assets, end of period (000's) | $ | 414,024 | $ | 1,092,346 | $ | 1,105,264 | $ | 829,583 | $ | 559,912 | |||||||||||||
| Net expenses to average daily net assets | 0.67 | %(c) | 0.69 | %(c) | 0.69 | % | 0.69 | % | 0.69 | % | |||||||||||||
| Net investment income to average daily net assets | 3.09 | % | 2.33 | % | 1.83 | % | 2.10 | % | 1.91 | % | |||||||||||||
| Portfolio turnover rate | 67 | % | 41 | % | 34 | % | 39 | % | 44 | % | |||||||||||||
| Fees and expenses reimbursed by the Manager to average daily net assets: | 0.11 | % | 0.09 | % | 0.08 | % | 0.10 | % | 0.16 | % | |||||||||||||
(a) The amount shown for a share outstanding does not correspond with the aggregate net realized and unrealized gain (loss) on investments due to the timing of purchases and redemptions of Fund shares in relation to fluctuating market values of the investments of the Fund.
(b) The total returns would have been lower had certain expenses not been reimbursed during the periods shown and assumes the effect of reinvested distributions.
(c) The net expense ratio does not include the effect of expense reductions.
† Calculated using average shares outstanding throughout the period.
See accompanying notes to the financial statements.
19
GMO Tax-Managed International Equities Fund
(A Series of GMO Trust)
Notes to Financial Statements
February 28, 2009
1. Organization
GMO Tax-Managed International Equities Fund (the "Fund") is a series of GMO Trust (the "Trust"). The Fund is registered under the Investment Company Act of 1940, as amended, as an open-end, non-diversified management investment company. The Fund is advised and managed by Grantham, Mayo, Van Otterloo & Co. LLC (the "Manager" or "GMO"). The Trust was established as a Massachusetts business trust under the laws of The Commonwealth of Massachusetts on June 24, 1985. The Declaration of Trust permits the Trustees of the Trust ("Trustees") to create an unlimited number of series of shares ("Funds") and to subdivide Funds into classes.
The Fund seeks high after-tax total return. The Fund seeks to achieve its investment objective by outperforming the MSCI EAFE Index (after tax), which is computed by GMO by adjusting the return of the MSCI EAFE Index (Europe, Australasia, and Far East) by its tax cost. The Fund typically makes equity investments in non-U.S. companies that issue stocks included in the MSCI EAFE universe (which is larger than, but generally represented by, the MSCI EAFE Index), plus companies in Canada and emerging countries. GMO uses quantitative models integrated with tax management techniques to provide broad exposure to the international equity markets to investors subject to U.S. federal income tax.
2. Significant accounting policies
The following is a summary of significant accounting policies followed by the Fund in the preparation of its financial statements. These policies are in conformity with accounting principles generally accepted in the United States of America ("U.S. GAAP") and have been consistently followed by the Fund in preparing its financial statements. The preparation of financial statements in accordance with U.S. GAAP requires management to make estimates and assumptions that affect the reported amounts and disclosures in the financial statements. Actual results could differ from those estimates. The accounting records of the Fund are maintained in U.S. dollars.
Portfolio valuation
Securities listed on a securities exchange for which market quotations are readily available are valued at the last sale price or official closing price on each business day, or if there is no such reported sale or official closing price, at the most recent quoted bid price. Unlisted securities for which market quotations are readily available are generally valued at the most recent quoted bid price. Debt instruments with a remaining maturity of sixty days or less are generally valued at amortized cost, which approximates fair value. Shares of investment funds are generally valued at their net asset value. Securities for which quotations are not readily available or whose values the Manager has determined to be unreliable are valued at fair value as determined in good faith by the Trustees or persons acting at their direction pursuant to procedures approved by the Trustees. By its nature, a fair value price is a good faith estim ate of the value of a security at a given point in time and may not reflect the value that would be realized if the security were sold. The difference between a fair value price and the value realized upon a sale could be material. Because many foreign equity securities markets and exchanges close prior to the close of the New York Stock Exchange ("NYSE"), closing prices for foreign securities in those markets or on those
20
GMO Tax-Managed International Equities Fund
(A Series of GMO Trust)
Notes to Financial Statements — (Continued)
February 28, 2009
exchanges do not reflect the events that occur after that close but before the close of the NYSE. As a result, the Fund generally values foreign equity securities using fair value prices, which are based on adjustments to closing prices supplied by a third party vendor based on that vendor's proprietary models. As of February 28, 2009, 87.45% of the net assets of the Fund were valued using fair value prices based on models used by a third party vendor.
In September 2006, the Financial Accounting Standards Board ("FASB") issued Statement of Financial Accounting Standards No. 157, Fair Value Measurements ("SFAS 157"). SFAS 157 is effective for the Fund's current fiscal year. While the adoption of SFAS 157 does not have an effect on the Fund's net asset value, it does require additional disclosures about fair value measurements. SFAS 157 establishes a three-level hierarchy for disclosure of fair value measurements. The valuation hierarchy is based upon the reliability of inputs to the valuation of the Fund's investments. The three levels are defined as follows:
Level 1 – Valuations based on quoted prices for identical securities in active markets.
Level 2 – Valuations determined using other significant direct or indirect observable inputs.
Level 3 – Valuations based on inputs that are unobservable and significant.
The inputs or methodology used for valuing securities are not necessarily an indication of the risk associated with investing in those securities.
The following is a summary of the fair valuations according to inputs used as of February 28, 2009 in valuing the Fund's investments:
| Asset Valuation Inputs | Investments in Securities | Other Financial Instruments | |||||||||
| Level 1 - Quoted Prices | $ | 49,194,159 | $ | — | |||||||
| Level 2 - Other Significant Observable Inputs | 362,082,723 | — | |||||||||
| Level 3 - Significant Unobservable Inputs* | — | — | |||||||||
| Total | $ | 411,276,882 | $ | — | |||||||
* Represents the interest in bankrupt securities that have no value at February 28, 2009.
| Liability Valuation Inputs | Investments in Securities | Other Financial Instruments** | |||||||||
| Level 1 - Quoted Prices | $ | — | $ | (614,019 | ) | ||||||
| Level 2 - Other Significant Observable Inputs | — | — | |||||||||
| Level 3 - Significant Unobservable Inputs | — | — | |||||||||
| Total | $ | — | $ | (614,019 | ) | ||||||
** Other financial instruments include futures contracts.
21
GMO Tax-Managed International Equities Fund
(A Series of GMO Trust)
Notes to Financial Statements — (Continued)
February 28, 2009
The following is a reconciliation of investments in which significant unobservable inputs (Level 3) were used in determining value:
| Investments in Securities | Other Financial Instruments | ||||||||||
| Balance as of February 29, 2008 | $ | 4,468,119 | $ | — | |||||||
| Realized gain (loss) | 224,850 | — | |||||||||
| Change in unrealized appreciation/depreciation | (1,094,014 | ) | — | ||||||||
| Net purchases (sales) | (3,598,955 | ) | — | ||||||||
| Net transfers in and/or out of Level 3 | — | — | |||||||||
| Balance as of February 28, 2009 | $ | — | $ | — | |||||||
Foreign currency translation
The market values of foreign securities, currency holdings and related assets and liabilities are translated to U.S. dollars based on the 4 p.m. New York time exchange rates each business day. Income and expenses denominated in foreign currencies are translated at the 4 p.m. New York time exchange rates on the business day the income and expenses are accrued or incurred. The Fund does not isolate realized and unrealized gains and losses attributable to changes in exchange rates from gains and losses that arise from changes in the market value of investments. Such fluctuations are included with net realized and unrealized gain or loss on investments. Net realized gains and losses on foreign currency transactions represent gains and losses on disposition of currencies and forward currency contracts, currency gains and losses realized between the trade and settlement dates on securities transactions, and the difference between the amount of investment income and foreign withholding taxes recorded on the Fund's accounting records and the U.S. dollar equivalent amounts actually received or paid.
Forward currency contracts
The Fund may enter into forward currency contracts including forward cross currency contracts. A forward currency contract is an agreement between two parties to buy and sell a currency at a set price on a future date. The market value of a forward currency contract fluctuates with changes in forward currency exchange rates. Forward currency contracts are marked to market daily using rates supplied by a quotation service and changes in value are recorded by the Fund as an unrealized gain or loss. Realized gains or losses equal to the difference between the value of the contract at the time it was opened and the value at the time it was closed are recorded upon delivery or receipt of the currency or, if a forward currency contract is offset by entering into another forward currency contract with the same broker, upon settlement of the net gain or loss. These contracts may involve market risk in excess of the unrealized gain or lo ss reflected in the Fund's Statement of Assets and Liabilities. They expose the Fund to the risk of unfavorable movements in currency values and the risk that the counterparty will be unable or unwilling to meet the terms of the contracts. The Fund had no forward currency contracts outstanding at the end of the period.
Futures contracts
The Fund may purchase and sell futures contracts. Upon entering into a futures contract, the Fund is required to deposit cash, U.S. government and agency obligations, or other liquid assets with the futures
22
GMO Tax-Managed International Equities Fund
(A Series of GMO Trust)
Notes to Financial Statements — (Continued)
February 28, 2009
clearing broker in accordance with the initial margin requirements of the broker or exchange. In addition, the Fund maintains cash or securities in an amount that at least equals the net amount payable in the event the Fund must deliver the full amount of the contract. Futures contracts are marked to market daily and an appropriate payable or receivable for the change in value ("variation margin") is recorded by the Fund. The payable or receivable is settled on the following business day. Gains or losses are recognized but not considered realized until the contracts expire or are closed. Futures contracts involve, to varying degrees, risk of loss in excess of the variation margin disclosed in the Statement of Assets and Liabilities. Under some circumstances, futures exchanges may establish daily limits on the amount that the price of a futures contract can vary from the previous day's settlement price, thereby effectively preven ting liquidation of unfavorable positions. Losses may arise from changes in the value of the underlying instrument if the Fund is unable to liquidate a futures position due to an illiquid secondary market for the contract or the imposition of price limits, or if counterparties do not perform under the contract terms. Futures contracts are generally valued at the settlement price established each day by the board of trade or exchange on which they are traded. Because many foreign exchanges close prior to the close of the New York Stock Exchange ("NYSE"), closing prices for foreign futures in those markets or on those exchanges do not reflect the events that occur after that close but before the close of the NYSE. As a result, the Fund generally values foreign futures using fair value prices, which are based on adjustments to closing prices supplied by a third party vendor based on that vendor's proprietary models. Futures contracts outstanding at the end of the period are listed in the Fund's Schedule of Inve stments.
Options
The Fund may write (i.e., sell) call and put options. Writing options alters the Fund's exposure to the underlying instrument by, in the case of a call option, obligating the Fund to sell the underlying instrument at a set price to the option-holder and, in the case of a put option, obligating the Fund to purchase the underlying instrument at a set price from the option-holder. In the case of an index option, settlement will be in cash. When the Fund writes a call or put option, an amount equal to the premium received is recorded as a liability and subsequently marked to market to reflect the current value of the option written. Premiums received from writing options that expire are treated as realized gains. Premiums received from writing options that are exercised or closed are deducted from the amounts paid on the underlying future, security or currency transaction to determine the realized gain or loss. The Fund as a writer of an option has no control over whether the underlying future, security or currency may be sold (call) or purchased (put) and as a result bears the market risk of an unfavorable change in the price of the future, security or currency underlying the option. In the event that the Fund writes uncovered put or call options (i.e. options for investments that the Fund does not own), it bears the risk of substantial losses if the price of the underlying instrument increases during the term of the option. Options expose the Fund to the risk the Fund may not be able to enter into a closing transaction because of an illiquid market. The Fund had no open written option contracts during the period.
The Fund may also purchase put and call options. Purchasing options alters the Fund's exposure to the underlying instrument by, in the case of a call option, entitling the Fund to purchase the underlying instrument at a set price from the writer of the option and, in the case of a put option, entitling the Fund to sell the underlying instrument at a set price to the writer of the option. The Fund pays a premium for a
23
GMO Tax-Managed International Equities Fund
(A Series of GMO Trust)
Notes to Financial Statements — (Continued)
February 28, 2009
purchased option. That premium is disclosed in the Schedule of Investments and is subsequently marked to market to reflect the current value of the option. Premiums paid for purchasing options that expire are treated as realized losses. Premiums paid for purchasing options that are exercised or closed are deducted from the proceeds on the closing transaction to determine the realized gain or loss. The risk associated with purchasing put and call options is limited to the premium paid. The Fund had no purchased option contracts outstanding at the end of the period.
The Fund values exchange traded options at the last sale price, or if no sale is reported, the last bid price for options it has purchased and the last ask price for options it has written. The Fund values options traded over-the-counter using inputs provided by primary pricing sources and industry standard models.
Indexed securities
The Fund may invest in indexed securities. Indexed securities are securities whose redemption values and/or coupons are linked to the prices of a specific instrument or financial statistic. The Fund uses indexed securities to increase or decrease its exposure to different underlying instruments and to gain exposure to markets in which investing through conventional securities is difficult. The Fund had no indexed securities outstanding at the end of the period.
Swap agreements
The Fund may enter into various types of swap agreements, including without limitation, interest rate, total return, credit default and variance swap agreements. A swap agreement is an agreement to exchange the return generated by one instrument for the return generated by another instrument. When entering into a swap agreement, the Fund and/or the swap counterparty may post or receive cash or securities as collateral. The party posting the collateral typically receives the interest associated with or payments related to the collateral and has the risk of loss related to the collateral.
Interest rate swap agreements involve an exchange by the parties of their respective commitments to pay or right to receive interest, e.g., an exchange of floating rate interest payments for fixed rate interest payments with respect to the notional amount of principal.
Total return swap agreements involve a commitment by one party to pay interest to the other party in exchange for a payment to it from the other party based on the return of a reference instrument (e.g., a security or basket of securities), both based on notional amounts. To the extent the return of the reference instrument exceeds or falls short of the interest payments, one party will receive a payment from or make a payment to the other party.
In a credit default swap agreement, one party makes payments to another party in exchange for the right to receive a specified return if a credit event occurs with respect to a referenced entity or entities. Buying credit default protection reduces the buyer's exposure in the event of an issuer's default (e.g., it reduces risk where a party owns a security issued by or otherwise has exposure to the issuer). Selling credit default protection subjects the seller to exposure to an issuer's default. A seller of credit default protection
24
GMO Tax-Managed International Equities Fund
(A Series of GMO Trust)
Notes to Financial Statements — (Continued)
February 28, 2009
receives payments in return for its obligation to pay the principal amount of a debt security (or other agreed-upon value) to the other party upon the occurrence of a credit event (e.g., issuer default or similar event). If no credit event occurs, the seller has no payment obligations. For credit default swap agreements on asset-backed securities, a credit event may be triggered by such events as the issuer's failure to pay interest or principal, an agreement of the holders of an asset-backed security to a maturity extension, a rating downgrade on the security or a write-down on the collateral underlying the security. For credit default swap agreements on corporate or sovereign issuers, a credit event may be triggered by such events as the issuer's bankruptcy, failure to pay interest or principal, repudiation/moratorium or restructuring.
Variance swap agreements involve an agreement by two parties to exchange cash flows based on the measured variance (or square of volatility) of a specified underlying asset. One party agrees to exchange a "fixed rate" or strike price payment for the "floating rate" or realized price variance on the underlying asset with respect to the notional amount. At inception, the strike price chosen is generally fixed at a level such that the fair value of the swap is zero. At the expiration date, the amount paid by one party to the other is the difference between the realized price variance of the underlying asset and the strike price multiplied by the notional amount. A receiver of the realized price variance would receive a payment when the realized price variance of the underlying asset is greater than the strike price and would make a payment when that variance is less than the strike price. A payer of the realized price variance woul d make a payment when the realized price variance of the underlying asset is greater than the strike price and would receive a payment when that variance is less than the strike price. This type of agreement is essentially a forward contract on the future realized price variance of the underlying asset.
The Fund prices its swap agreements daily using models that may incorporate quotations from market makers and records the change in value, if any, as unrealized gain or loss in the Statement of Operations. Payments received or made on swap agreements are recorded as realized gain or loss in the Statement of Operations. Gains or losses are realized upon termination of the swap agreements.
Swap agreements often are not actively traded on financial markets. The values assigned to them may differ significantly from the values that would be realized upon termination, and the differences could be material. Entering into swap agreements involves credit, legal, market and documentation risk that is not reflected in the amounts reported in the Statement of Assets and Liabilities. Such risks include the possibility that the party with whom the Fund contracts may default on its obligations to perform or disagree as to the meaning of contractual terms, or that the collateral that party posts may be insufficient or not timely received by the Fund. Credit risk may be particularly acute in an environment where financial services firms are exposed to systemic risks of the type evidenced by the insolvency of Lehman Brothers and subsequent market disruptions. The Fund had no swap agreements outstanding at the end of the period.
Securities lending
The Fund may lend its securities to qualified brokers. The loans are collateralized with cash or liquid securities with a market value at least equal to the market value of the securities upon entering into the
25
GMO Tax-Managed International Equities Fund
(A Series of GMO Trust)
Notes to Financial Statements — (Continued)
February 28, 2009
loan. As with other extensions of credit, the Fund may bear the risk of loss with respect to the investment of the collateral, the risk of delay in and/or inability to exercise its rights with respect to the collateral, and the risk of delay in recovery or loss of rights in the loaned securities should the borrower of the securities fail financially. If a loan is collateralized by U.S. government securities, the Fund receives a fee from the borrower. If a loan is collateralized by cash, the Fund typically invests the cash collateral for its own account. For the year from March 1, 2008 through February 28, 2009, the Fund did not participate in securities lending.
Taxes and distributions
The Fund intends to qualify each tax year as a regulated investment company under Subchapter M of the Internal Revenue Code of 1986, as amended (the "Code"). The Fund intends to distribute substantially all of its net investment income and all of its net realized short-term and long-term capital gain, if any, after giving effect to any available capital loss carryforwards for U.S. federal income tax purposes. Therefore, no provision for U.S. federal income or excise tax is necessary. Taxes on foreign interest and dividend income are generally withheld in accordance with the applicable country's tax treaty with the United States. The foreign withholding rates applicable to a Fund's investments in certain foreign jurisdictions may be higher if a significant portion of the Fund is held by non-U.S. shareholders.
The Fund's policy is to declare and pay distributions from net investment income, if any, semiannually, and from net realized short-term and long-term capital gain, if any, at least annually. All distributions are paid in shares of the Fund, at net asset value, unless the shareholder elects to receive cash distributions. Distributions to shareholders are recorded by the Fund on the ex-dividend date.
Foreign taxes paid by the Fund may be treated, to the extent permissible under the Code and if the Fund so elects, as if paid by the shareholders of the Fund.
The Fund may be subject to capital gains and repatriation taxes imposed by certain countries in which it invests. The Fund is subject to a Contribuição Provisória sobre Movimentações Financiera ("CPMF") tax which is applied to foreign exchange transactions representing capital inflows or outflows to/from the Brazilian market. For the year ended February 28, 2009, the Fund incurred $150 in CPMF tax, which is included in net realized gain (loss) on foreign currency, forward contracts and foreign currency related transactions in the Statement of Operations.
Income and capital gain distributions are determined in accordance with U.S. federal income tax regulations, which may differ from U.S. GAAP. Certain capital accounts in the financial statements are periodically adjusted for permanent differences in order to reflect their tax character. These adjustments have no impact on net assets or net asset value per share. Temporary differences that arise from recognizing certain items of income, expense, gain or loss in different periods for financial statement and tax purposes will reverse at some time in the future. Distributions in excess of net investment income or net realized gains are temporary over-distributions for financial statement purposes resulting from
26
GMO Tax-Managed International Equities Fund
(A Series of GMO Trust)
Notes to Financial Statements — (Continued)
February 28, 2009
differences in the recognition or classification of income or distributions for financial statement and tax purposes.
U.S. GAAP and tax accounting differences primarily relate to derivative contract transactions, passive foreign investment company transactions, foreign currency transactions, losses on wash sale transactions and post-October capital losses.
The following reclassification represents the amount necessary to report the stated components of net assets on a tax basis, excluding certain temporary differences, as of February 28, 2009. The financial highlights exclude these adjustments.
| Accumulated Undistributed Net Investment Income | Distributions In Excess of Net Realized Gain | Paid-in Capital | |||||||||
| $ | (1,070,848 | ) | $ | 1,070,848 | $ | — | |||||
The tax character of distributions declared to shareholders is as follows:
| 2/28/2009 | 2/29/2008 | ||||||||||
| Ordinary income (including any net short-term capital gain) | $ | 24,411,318 | $ | 42,430,962 | |||||||
| Net long-term capital gain | 25,163,054 | 107,183,276 | |||||||||
| Total distributions | $ | 49,574,372 | $ | 149,614,238 | |||||||
Distributions in excess of tax basis earnings and profits, if significant, are reported in the financial statements as a return of capital for tax purposes.
As of February 28, 2009, the components of distributable earnings on a tax basis consisted of the following:
| Undistributed ordinary income (including any net short-term capital gain) | $ | 1,796,282 | |||||
As of February 28, 2009, the Fund elected to defer to March 1, 2009 post-October capital losses of $46,304,941.
As of February 28, 2009, the approximate cost for U.S. federal income tax purposes and gross and net unrealized appreciation (depreciation) in value of investments were as follows:
| Aggregate Cost | Gross Unrealized Appreciation | Gross Unrealized (Depreciation) | Net Unrealized Appreciation (Depreciation) | ||||||||||||
| $ | 615,708,228 | $ | 12,394,749 | $ | (216,826,095 | ) | $ | (204,431,346 | ) | ||||||
27
GMO Tax-Managed International Equities Fund
(A Series of GMO Trust)
Notes to Financial Statements — (Continued)
February 28, 2009
The Fund is subject to the provisions of Financial Accounting Standards Board Interpretation No. 48 ("FIN 48"), Accounting for Uncertainty in Income Taxes — an Interpretation of FASB Statement No. 109. FIN 48 sets forth a minimum threshold for financial statement recognition of a tax position taken or expected to be taken in a tax return that could affect the Fund's financial statements. The Fund did not have any unrecognized tax benefits or liabilities at February 28, 2009, nor did it have any increases or decreases in unrecognized tax benefits or liabilities for the period then ended. The Fund is subject to examination prior to the expiration of the statute of limitations by U.S. federal and state tax authorities for tax returns filed.
Security transactions and related investment income
Security transactions in the financial statements are accounted for on the trade date. Dividend income, net of applicable foreign withholding taxes, if any, is recorded on the ex-dividend date or, if later, when the Fund is informed of the ex-dividend date. Interest income is recorded on the accrual basis and is adjusted for the amortization of premiums and accretion of discounts. Principal on inflation indexed securities is adjusted for inflation and any increase or decrease is recorded as interest income or loss. Income is not recognized on securities for which collection is not expected. Non-cash dividends, if any, are recorded at the fair market value of the asset received. In determining the net gain or loss on securities sold, the Fund uses the identified cost basis for the purposes of determining the cost basis.
Expenses
The majority of the expenses of the Trust are directly identifiable to an individual fund. Expenses that are not readily identifiable to a specific fund are allocated taking into consideration, among other things, the nature and type of expense and the relative size of the funds.
Brown Brothers Harriman & Co. ("BBH") serves as custodian and fund accounting agent of the Fund. State Street Bank and Trust Company ("State Street") serves as transfer agent of the Fund. BBH and State Street's fees may be reduced by an earnings allowance calculated on the average daily cash balances the Fund maintains with each agent. The Fund receives the benefit of the earnings allowance. In addition, Goldman Sachs Agency Lending, the Fund's securities lending agent, has agreed to reimburse the Fund for certain transactional expenses related to securities lending activity. Credit balances or expense reimbursements used to reduce fees, if any, are reported as a reduction of expenses in the Statement of Operations.
Investment risks
The Fund is subject to risks involved in investing in foreign securities that are not presented by investments in U.S. securities. These risks may involve adverse political and economic developments, including expropriation and the possible imposition of capital controls or other foreign governmental laws or restrictions. In addition, the securities of some foreign companies and securities markets are less liquid and at times may be more volatile than securities of comparable U.S. companies and U.S. securities markets.
28
GMO Tax-Managed International Equities Fund
(A Series of GMO Trust)
Notes to Financial Statements — (Continued)
February 28, 2009
Recently issued accounting pronouncement
In March 2008, FASB issued Statement of Financial Accounting Standards No. 161, Disclosures about Derivative Instruments and Hedging Activities ("SFAS 161"). SFAS 161 is effective for fiscal years and interim periods beginning after November 15, 2008. SFAS 161 requires enhanced disclosures about the Fund's derivative and hedging activities. The Manager is currently evaluating the impact the adoption of SFAS 161 will have on the Fund's financial statement disclosures.
3. Fees and other transactions with affiliates
GMO receives a management fee for the services it provides to the Fund. Effective June 30, 2008, that fee is paid monthly at the annual rate of 0.50% of average daily net assets. For the period from March 1, 2008 through June 29, 2008, the management fee rate was 0.54% of average daily net assets. The Fund has adopted a Shareholder Service Plan under which the Fund pays GMO a shareholder service fee for client and shareholder service, reporting, and other support. Pursuant to the Shareholder Service Plan, the shareholder service fee is calculated based on average daily net assets at the annual rate of 0.15% for Class III shares.
Through at least June 30, 2009, the Manager has contractually agreed to reimburse the Fund for Fund expenses incurred through that date to the extent the Fund's total annual operating expenses (excluding "Excluded Expenses", as defined below) exceed 0.50% of the Fund's average daily net assets. Excluded Expenses include shareholder service fees, fees and expenses of the independent Trustees of the Trust, fees and expenses for legal services not approved by the Manager for the Trust, compensation and expenses of the Trust's Chief Compliance Officer ("CCO") (excluding any employee benefits), brokerage commissions, securities lending fees and expenses, interest expense, transfer taxes, and other investment-related costs (including expenses associated with investments in any company that is an investment company or would be an investment company under the 1940 Act, but for the exceptions to the definition of investment company provided in Section 3(c)(1) and 3(c)(7) of the 1940 Act), hedging transaction fees, extraordinary, non-recurring and certain other unusual expenses (including taxes).
The Fund's portion of the fees paid by the Trust to the Trust's independent Trustees and CCO during the year ended February 28, 2009 was $9,066 and $5,628, respectively. The compensation and expenses of the CCO are included in miscellaneous expenses in the Statement of Operations. The Fund paid no remuneration to any other officer of the Trust.
4. Purchases and sales of securities
Cost of purchases and proceeds from sales of securities, excluding short-term investments, for the year ended February 28, 2009 aggregated $511,957,528 and $746,901,964, respectively.
29
GMO Tax-Managed International Equities Fund
(A Series of GMO Trust)
Notes to Financial Statements — (Continued)
February 28, 2009
5. Guarantees
In the normal course of business the Fund enters into contracts with third-party service providers that contain a variety of representations and warranties and that provide general indemnifications. The Fund's maximum exposure under these arrangements is unknown, as it involves future claims that may be made against the Fund that have not yet occurred. Based on experience, management is of the view that the risk of loss in connection with its indemnification obligations is remote; however, there can be no assurance that such obligations will not result in material liabilities that adversely affect the Fund.
6. Principal shareholders and related parties
As of February 28, 2009, the Fund had no shareholders individually holding more than 10% of the Fund's outstanding shares.
As of February 28, 2009, 0.97% of the Fund's shares were held by senior management of the Manager and GMO Trust officers and 0.16% of the Fund's shares were held by accounts for which the Manager had investment discretion.
7. Share transactions
The Declaration of Trust permits the Trust to issue an unlimited number of shares of beneficial interest (without par value). Transactions in Fund shares were as follows:
| Year Ended February 28, 2009 | Year Ended February 29, 2008 | ||||||||||||||||||
| Class III: | Shares | Amount | Shares | Amount | |||||||||||||||
| Shares sold | 3,751,313 | $ | 51,736,423 | 4,630,804 | $ | 96,384,502 | |||||||||||||
| Shares issued to shareholders in reinvestment of distributions | 2,520,757 | 35,938,181 | 6,034,152 | 126,532,299 | |||||||||||||||
| Shares repurchased | (19,981,045 | ) | (297,315,237 | ) | (5,588,860 | ) | (112,833,098 | ) | |||||||||||
| Net increase (decrease) | (13,708,975 | ) | $ | (209,640,633 | ) | 5,076,096 | $ | 110,083,703 | |||||||||||
30
Report of Independent Registered Public Accounting Firm
To the Trustees of GMO Trust and the Shareholders of
GMO Tax-Managed International Equities Fund:
In our opinion, the accompanying statement of assets and liabilities, including the schedule of investments, and the related statements of operations and of changes in net assets and the financial highlights present fairly, in all material respects, the financial position of GMO Tax-Managed International Equities Fund (the "Fund") at February 28, 2009, the results of its operations for the year then ended, the changes in its net assets for each of the two years in the period then ended and the financial highlights for each of the five years in the period then ended, in conformity with accounting principles generally accepted in the United States of America. These financial statements and financial highlights (hereafter referred to as "financial statements") are the responsibility of the Fund's management. Our responsibility is to express an opinion on these financial statements based on our audits. We conducted our audits of the se financial statements in accordance with the standards of the Public Company Accounting Oversight Board (United States). Those standards require that we plan and perform the audit to obtain reasonable assurance about whether the financial statements are free of material misstatement. An audit includes examining, on a test basis, evidence supporting the amounts and disclosures in the financial statements, assessing the accounting principles used and significant estimates made by management, and evaluating the overall financial statement presentation. We believe that our audits, which included confirmation of securities at February 28, 2009 by correspondence with the custodian and brokers, provide a reasonable basis for our opinion.
PricewaterhouseCoopers LLP
Boston, Massachusetts
April 29, 2009
31
GMO Tax-Managed International Equities Fund
(A Series of GMO Trust)
Fund Expenses
February 28, 2009 (Unaudited)
Expense Examples: The following information is in relation to expenses for the six month period ended February 28, 2009.
As a shareholder of the Fund, you may incur two types of costs: (1) transaction costs, and (2) ongoing costs, including management fees, shareholder service fees and other Fund expenses. This example is intended to help you understand your ongoing costs (in dollars) of investing in the Fund and to compare these costs with the ongoing costs of investing in other mutual funds.
These examples are based on an investment of $1,000 invested at the beginning of the period and held for the entire period, September 1, 2008 through February 28, 2009.
Actual Expenses
The first line of the table below provides information about actual account values and actual expenses. You may use the information in this line, together with the amount you invested, to estimate the expenses that you paid over the period. Simply divide your account value by $1,000 (for example, a $5,000,000 account value divided by $1,000 = 5,000), then multiply the result by the number in the first line under the heading entitled "Net Expense Incurred" to estimate the expenses you paid on your account during this period.
Hypothetical Example for Comparison Purposes
The second line of the table below provides information about hypothetical account values and hypothetical expenses based on the Fund's actual expense ratio and an assumed rate of return of 5% per year before expenses, which is not the Fund's actual return. The hypothetical account values and expenses may not be used to estimate the actual ending account balance or expenses you paid for the period. You may use this information to compare the ongoing costs of investing in the Fund with other funds. To do so, compare this 5% hypothetical example with the 5% hypothetical examples that appear in the shareholder reports of other funds.
Please note that the expenses shown in the table are meant to highlight your ongoing costs only and do not reflect any transactional costs. Therefore, the second line of the table is useful in comparing ongoing costs only, and will not help you determine the relative total costs of owning different funds. In addition, if these transactional costs were included, your costs would have been higher.
| Annualized Net Expense Ratio | Beginning Account Value | Ending Account Value | Net Expense Incurred* | ||||||||||||||||
| Class III | |||||||||||||||||||
| 1) Actual | 0.65 | % | $ | 1,000.00 | $ | 571.20 | $ | 2.53 | |||||||||||
| 2) Hypothetical | 0.65 | % | $ | 1,000.00 | $ | 1,021.57 | $ | 3.26 | |||||||||||
* Expenses are calculated using the Class's annualized net expense ratio for the six months ended February 28, 2009, multiplied by the average account value over the period, multiplied by 181 days in the period, divided by 365 days in the year.
32
GMO Tax-Managed International Equities Fund
(A Series of GMO Trust)
Tax Information for the Tax Year Ended February 28, 2009 (Unaudited)
The Fund will notify shareholders of amounts for use in preparing 2009 income tax forms in January 2010.
The Fund's distributions to shareholders include $25,163,054 from long-term capital gains.
During the year ended February 28, 2009, the Fund paid foreign taxes of $2,906,478 and recognized foreign source income of $31,780,647.
For taxable, non-corporate shareholders, 100.00% of the income and short-term capital gains, if any, distributed in the Fund's fiscal year ended February 28, 2009 represents qualified dividend income subject to the 15% rate category.
The Fund hereby designates as qualified interest income with respect to its taxable year ended February 28, 2009, $278,947 or if determined to be different, the qualified interest income of such year.
33
Trustees and Officers (Unaudited)
The following tables list the Trust's Trustees and Officers as of the date of this report; their address and date of birth ("DOB"); their position with the Trust; the length of time holding that position with the Trust; their principal occupation(s) during the past five years; the number of portfolios in the fund complex they oversee; and other directorships they hold in companies subject to registration or reporting requirements of the Securities Exchange Act of 1934 (generally called "public companies") or in registered investment companies. The Trust's Statement of Additional Information ("SAI") includes additional information about the Trust's trustees, including changes subsequent to the date of the report. The SAI is available, without charge, upon request by writing GMO, c/o GMO Trust, 40 Rowes Wharf, Boston, MA 02110.
Independent Trustees:
| Name, Address, and DOB | Position(s) Held with Trust | Term of Office1 and Length of Time Served | Principal Occupation(s) During Past Five Years | Number of Portfolios in Fund Complex Overseen by Trustee | Other Directorships Held by Trustee | ||||||||||||||||||
| Donald W. Glazer, Esq. c/o GMO Trust 40 Rowes Wharf Boston, MA 02110 DOB: 07/26/1944 | Chairman of the Board of Trustees | Chairman of the Board of Trustees since March 2005; Lead Independent Trustee (September 2004 – March 2005); Trustee since December 2000. | Consultant – Law and Business2; Author of Legal Treatises. | 59 | None. | ||||||||||||||||||
1 Each Trustee is elected to serve during the continued lifetime of the Trust until he/she dies, resigns or is removed, or if sooner, until the next meeting of Shareholders called for the purpose of electing Trustees and until the election and qualification of his/her successor.
2 As part of Mr. Glazer's work as a consultant, he provides part-time consulting services to Goodwin Procter LLP ("Goodwin"). Goodwin has provided legal services to Renewable Resources, LLC, an affiliate of GMO; GMO, in connection with its relationship with Renewable Resources; and funds managed by Renewable Resources. Mr. Glazer has represented that he has no financial interest in, and is not involved in the provision of, such legal services. In the calendar years ended December 31, 2007 and December 31, 2008, these entities paid $789,416 and $183,864 respectively, in legal fees and disbursements to Goodwin. In correspondence with the Staff of the Securities and Exchange Commission beginning in August 2006, the Independent Trustees' legal counsel provided the Staff with information regarding Mr. Glazer's relationship with Goodwin and h is other business activities. On September 11, 2007, based on information that had been given to the Staff as of that date, the Staff provided oral no-action assurance consistent with the opinion of the Independent Trustees' legal counsel that Mr. Glazer is not an "interested person" of the Trust.
34
Independent Trustees — (Continued)
| Name, Address, and DOB | Position(s) Held with Trust | Term of Office1 and Length of Time Served | Principal Occupation(s) During Past Five Years | Number of Portfolios in Fund Complex Overseen by Trustee | Other Directorships Held by Trustee | ||||||||||||||||||
| W. Nicholas Thorndike c/o GMO Trust 40 Rowes Wharf Boston, MA 02110 DOB: 03/28/1933 | Trustee | Since March 2005. | Director or trustee of various corporations and charitable organizations, including Courier Corporation (a book publisher and manufacturer) (July 1989 – present); Putnam Funds (December 1992 – June 2004); and Providence Journal (a newspaper publisher) (December 1986 – December 2003). | 59 | Director of Courier Corporation (a book publisher and manufacturer); Member of the Investment Committee of Partners HealthCare System, Inc.3 | ||||||||||||||||||
| Peter Tufano c/o GMO Trust 40 Rowes Wharf Boston, MA 02110 DOB: 04/22/1957 | Trustee | Since December 2008. | Sylvan C. Coleman Professor of Financial Management, Harvard Business School (since 1989). | 59 | Trustee of State Street Navigator Securities Lending Trust (3 Portfolios). | ||||||||||||||||||
1 Each Trustee is elected to serve during the continued lifetime of the Trust until he/she dies, resigns or is removed, or if sooner, until the next meeting of Shareholders called for the purpose of electing Trustees and until the election and qualification of his/her successor.
3 Partners HealthCare System, Inc. is a client of the Manager.
35
Principal Officers:
| Name, Address, and DOB | Position(s) Held with Trust | Term of Office4 and Length of Time Served | Principal Occupation(s) During Past Five Years5 | ||||||||||||
| J.B. Kittredge DOB: 08/22/1954 | President and Chief Executive Officer | Since March 2009. | General Counsel, Grantham, Mayo, Van Otterloo & Co. LLC (October 2005 – Present); Partner, Ropes & Gray LLP. | ||||||||||||
| Sheppard N. Burnett c/o GMO Trust 40 Rowes Wharf Boston, MA 02110 DOB: 10/24/1968 | Treasurer and Chief Financial Officer | Chief Financial Officer since March 2007; Treasurer since November 2006; Assistant Treasurer, September 2004 – November 2006. | Fund Administration Staff, Grantham, Mayo, Van Otterloo & Co. LLC (June 2004 – present); Vice President, Director of Tax, Columbia Management Group (2002 – 2004). | ||||||||||||
| Brent C. Arvidson c/o GMO Trust 40 Rowes Wharf Boston, MA 02110 DOB: 06/26/1969 | Assistant Treasurer | Since August 1998. | Senior Fund Administrator, Grantham, Mayo, Van Otterloo & Co. LLC. | ||||||||||||
| John L. Nasrah c/o GMO Trust 40 Rowes Wharf Boston, MA 02110 DOB: 05/27/1977 | Assistant Treasurer | Since March 2007. | Fund Administrator, Grantham, Mayo, Van Otterloo & Co. LLC (September 2004 – present); Tax Analyst, Bain & Company, Inc. (June 2003 – September 2004). | ||||||||||||
| Mahmoodur Rahman c/o GMO Trust 40 Rowes Wharf Boston, MA 02110 DOB: 11/30/1967 | Assistant Treasurer | Since September 2007. | Fund Administrator, Grantham, Mayo, Van Otterloo & Co. LLC (April 2007 – present); Vice President and Senior Tax Manager, Massachusetts Financial Services Company (January 2000 – April 2007). | ||||||||||||
| Michael E. Gillespie c/o GMO Trust 40 Rowes Wharf Boston, MA 02110 DOB: 02/18/1958 | Chief Compliance Officer | Since March 2005. | Vice President of Compliance (June 2004 – February 2005) and Director of Domestic Compliance (March 2002 – June 2004), Fidelity Investments. | ||||||||||||
4 Each officer is elected to hold such office until his or her successor is duly elected and qualified to carry out the duties and responsibilities of the office, or until he or she resigns or is removed from office.
5 Each of Messrs. Burnett, Arvidson, Bohan, and Pottle serves as an officer and/or director of certain pooled investment vehicles of which GMO or an affiliate of GMO serves as the investment adviser.
36
Principal Officers — (Continued)
| Name, Address, and DOB | Position(s) Held with Trust | Term of Office4 and Length of Time Served | Principal Occupation(s) During Past Five Years5 | ||||||||||||
| Jason B. Harrison c/o GMO Trust 40 Rowes Wharf Boston, MA 02110 DOB: 01/29/1977 | Vice President and Clerk | Vice President since November 2006; Clerk since March 2006. | Legal Counsel, Grantham, Mayo, Van Otterloo & Co. LLC (since February 2006) and Attorney, Ropes & Gray LLP (September 2002 – February 2006). | ||||||||||||
| David L. Bohan c/o GMO Trust 40 Rowes Wharf Boston, MA 02110 DOB: 06/21/1964 | Vice President and Assistant Clerk | Vice President since March 2005; Assistant Clerk since March 2006. | Legal Counsel, Grantham, Mayo, Van Otterloo & Co. LLC. | ||||||||||||
| Gregory L. Pottle c/o GMO Trust 40 Rowes Wharf Boston, MA 02110 DOB: 07/09/1971 | Vice President and Assistant Clerk | Since November 2006. | Legal Counsel, Grantham, Mayo, Van Otterloo & Co. LLC. | ||||||||||||
| Anne K. Trinque c/o GMO Trust 40 Rowes Wharf Boston, MA 02110 DOB: 04/15/1978 | Vice President and Assistant Clerk | Since September 2007. | Legal Counsel, Grantham, Mayo, Van Otterloo & Co. LLC (January 2007 – present); Attorney, Goodwin Procter LLP (September 2003 – January 2007). | ||||||||||||
| Cheryl Wakeham c/o GMO Trust 40 Rowes Wharf Boston, MA 02110 DOB: 10/29/1958 | Vice President and Anti-Money Laundering Officer | Since December 2004. | Manager, Client Service Administration, Grantham, Mayo, Van Otterloo & Co. LLC. | ||||||||||||
4 Each officer is elected to hold such office until his or her successor is duly elected and qualified to carry out the duties and responsibilities of the office, or until he or she resigns or is removed from office.
5 Each of Messrs. Burnett, Arvidson, Bohan, and Pottle serves as an officer and/or director of certain pooled investment vehicles of which GMO or an affiliate of GMO serves as the investment adviser.
37
GMO Domestic Bond Fund
(A Series of GMO Trust)
Annual Report
February 28, 2009
For a free copy of the Fund's proxy voting guidelines, shareholders may call 1-617-346-7646 (collect) or visit the Securities and Exchange Commission's website at www.sec.gov. Information regarding how the Fund voted proxies relating to portfolio securities during the most recent 12-month period ended June 30 is available on GMO's website at www.gmo.com, or on the Securities and Exchange Commission's website at www.sec.gov.
The Fund files its complete schedule of portfolio holdings with the Securities and Exchange Commission for the first and third quarter of each fiscal year on Form N-Q, which is available on the Commission's website at www.sec.gov. The Fund's Form N-Q may be reviewed and copied at the Commission's Public Reference Room in Washington, D.C. Information on the operation of the Public Reference Room may be obtained by calling 1-800-SEC-0330. The Fund has a policy with respect to disclosure of portfolio holdings under which it may also make available on GMO's website at www.gmo.com a complete schedule of portfolio holdings.
This report is prepared for the general information of shareholders. It is authorized for distribution to prospective investors only when preceded or accompanied by a prospectus for the GMO Trust, which contains a complete discussion of the risks associated with an investment in this Fund and other important information. The GMO Trust prospectus can be obtained at www.gmo.com.
GMO Domestic Bond Fund
(A Series of GMO Trust)
Portfolio Management
Day-to-day management of the Fund's portfolio is the responsibility of the Fixed Income team at Grantham, Mayo, Van Otterloo & Co. LLC.
Management Discussion and Analysis of Fund Performance
The Class III shares of the GMO Domestic Bond Fund returned -10.4% for the fiscal year ended February 28, 2009, as compared to the +5.7% return of the Barclays Capital U.S. Government Index (formerly Lehman Brothers U.S. Government Bond Index), the Fund's benchmark. The Fund underperformed the benchmark during the fiscal year by 16.1%.
The fiscal year's underperformance stemmed from price declines in the fund in which the Fund invests a substantial portion of its total assets, the GMO Short Duration Collateral Fund (SDCF). SDCF invests primarily in asset-backed securities. The position in SDCF collateralizes derivatives positions that seek to deliver the return of the Fund's benchmark, which has an approximate 5-year duration.
With the extreme price volatility of asset-backed securities during the fiscal year, SDCF underperformed LIBOR by nearly 20%, directly contributing to the Fund's underperformance given its 94% exposure to SDCF during the period.
The views expressed herein are exclusively those of Grantham, Mayo, Van Otterloo & Co. LLC Management as of the date of this report and are subject to change. GMO disclaims any responsibility to update such views. They are not meant as investment advice. References to specific securities are not recommendations of such securities and may not be representative of any GMO portfolio's current or future investments.

Performance data quoted represents past performance and is not indicative of future results. The investment return and principal value of an investment will fluctuate so that an investor's shares, when redeemed, may be worth more or less than their original cost. Current performance data may be lower or higher than the performance data provided herein. To obtain performance information to the most recent month-end, visit www.gmo.com. Performance shown is net of all fees after reimbursement from the Manager. Each performance figure assumes a redemption at the end of the stated period and reflects a transaction fee of 2.00% on the redemption. Transaction fees are retained by the Fund to cover trading costs. Returns would have been lower had certain expenses not been reimbursed during the periods shown and do not include the effect of taxes on distributions and redem ptions. All information is unaudited. Performance for Class VI shares will vary due to different fees.
GMO Domestic Bond Fund
(A Series of GMO Trust)
Investments Concentration Summary
February 28, 2009 (Unaudited)
| Asset Class Summary* | % of Total Net Assets | ||||||
| Debt Obligations | 94.3 | % | |||||
| Short-Term Investments | 5.5 | ||||||
| Preferred Stocks | 0.1 | ||||||
| Forward Currency Contracts | 0.0 | ||||||
| Futures | (0.1 | ) | |||||
| Swaps | (0.3 | ) | |||||
| Other | 0.5 | ||||||
| 100.0 | % | ||||||
* The table above incorporates aggregate indirect asset class exposure associated with investments in other funds of GMO Trust ("underlying funds").
1
GMO Domestic Bond Fund
(A Series of GMO Trust)
Schedule of Investments
(showing percentage of total net assets)
February 28, 2009
| Par Value ($) / Shares | Description | Value ($) | |||||||||||||
| DEBT OBLIGATIONS — 19.7% | |||||||||||||||
| Corporate Debt — 0.8% | |||||||||||||||
| 9,312,000 | Health Care Property Investors, Inc., Series G, MTN, 5.63%, due 02/28/13 | 8,409,388 | |||||||||||||
| U.S. Government — 17.5% | |||||||||||||||
| 11,000,000 | U.S. Treasury Bond, 3.50%, due 02/15/39 | 10,561,760 | |||||||||||||
| 33,581,130 | U.S. Treasury Inflation Indexed Bond, 0.88%, due 04/15/10 (a) (b) | 33,129,867 | |||||||||||||
| 225,000,000 | U.S. Treasury Principal Strip Bond, due 11/15/21 | 132,966,675 | |||||||||||||
| 15,000,000 | U.S. Treasury Strip Coupon Bond, due 11/15/23 | 8,022,450 | |||||||||||||
| Total U.S. Government | 184,680,752 | ||||||||||||||
| U.S. Government Agency — 1.4% | |||||||||||||||
| 8,705,000 | Agency for International Development Floater (Support of India), 3 mo. LIBOR + .10%, 1.27%, due 02/01/27 (c) | 7,713,415 | |||||||||||||
| 3,000,000 | Agency for International Development Floater (Support of Jamaica), 6 mo. LIBOR + 0.30%, 3.43%, due 12/01/14 (c) | 2,937,424 | |||||||||||||
| 660,310 | Agency for International Development Floater (Support of Jamaica), 6 mo. U.S. Treasury Bill + 0.75%, 1.25%, due 03/30/19 (c) | 613,586 | |||||||||||||
| 2,432,500 | Agency for International Development Floater (Support of Sri Lanka), 6 mo. LIBOR + .20%, 4.22%, due 06/15/12 (c) | 2,400,170 | |||||||||||||
| 1,400,002 | Agency for International Development Floater (Support of Zimbabwe), 3 mo. U.S. Treasury Bill x 115%, 1.89%, due 01/01/12 (c) | 1,343,847 | |||||||||||||
| Total U.S. Government Agency | 15,008,442 | ||||||||||||||
| TOTAL DEBT OBLIGATIONS (COST $222,374,193) | 208,098,582 | ||||||||||||||
| PREFERRED STOCKS — 0.1% | |||||||||||||||
| Banking — 0.1% | |||||||||||||||
| 8,000 | Home Ownership Funding 2 Preferred 144A, 1.00% (c) | 720,000 | |||||||||||||
| TOTAL PREFERRED STOCKS (COST $2,060,974) | 720,000 | ||||||||||||||
See accompanying notes to the financial statements.
2
GMO Domestic Bond Fund
(A Series of GMO Trust)
Schedule of Investments — (Continued)
(showing percentage of total net assets)
February 28, 2009
| Shares | Description | Value ($) | |||||||||||||
| MUTUAL FUNDS — 76.3% | |||||||||||||||
| Affiliated Issuers — 76.3% | |||||||||||||||
| 47,223,590 | GMO Short-Duration Collateral Fund | 807,523,384 | |||||||||||||
| 1,483 | GMO Special Purpose Holding Fund (c) (d) | 1,082 | |||||||||||||
| TOTAL MUTUAL FUNDS (COST $1,024,695,583) | 807,524,466 | ||||||||||||||
| SHORT-TERM INVESTMENTS — 3.5% | |||||||||||||||
| Money Market Funds — 3.5% | |||||||||||||||
| 37,415,411 | State Street Institutional Treasury Plus Money Market Fund-Institutional Class | 37,415,411 | |||||||||||||
| TOTAL SHORT-TERM INVESTMENTS (COST $37,415,411) | 37,415,411 | ||||||||||||||
| TOTAL INVESTMENTS — 99.6% (Cost $1,286,546,161) | 1,053,758,459 | ||||||||||||||
| Other Assets and Liabilities (net) — 0.4% | 4,496,442 | ||||||||||||||
| TOTAL NET ASSETS — 100.0% | $ | 1,058,254,901 | |||||||||||||
See accompanying notes to the financial statements.
3
GMO Domestic Bond Fund
(A Series of GMO Trust)
Schedule of Investments — (Continued)
February 28, 2009
A summary of outstanding financial instruments at February 28, 2009 is as follows:
Futures Contracts
| Number of Contracts | Type | Expiration Date | Contract Value | Net Unrealized Appreciation (Depreciation) | |||||||||||||||
| Buys | |||||||||||||||||||
| 96 | U.S. Long Bond (CBT) | March 2009 | $ | 11,962,500 | $ | 12,462 | |||||||||||||
| 1,145 | U.S. Treasury Note 2 Yr. (CBT) | June 2009 | 248,017,736 | (146,558 | ) | ||||||||||||||
| 1,171 | U.S. Treasury Note 5 Yr. (CBT) | June 2009 | 136,522,133 | (342,005 | ) | ||||||||||||||
| 1,052 | U.S. Treasury Note 10 Yr. (CBT) | June 2009 | 126,272,875 | (1,071,593 | ) | ||||||||||||||
| $ | 522,775,244 | $ | (1,547,694 | ) | |||||||||||||||
Swap Agreements
Credit Default Swaps
| Notional Amount | Expiration Date | Counterparty | Receive (Pay)u | Annual Premium | Implied Credit Spread (1) | Deliverable on Default | Maximum Potential Amount of Future Payments by the Fund Under the Contract (2) | Market Value | |||||||||||||||||||||||||||||||||||
| 75,000,000 | USD | 12/20/2012 | JP Morgan | (Pay) | 0.89 | % | 1.18 | % | Reference | N/A | $ | 660,374 | |||||||||||||||||||||||||||||||
| Chase Bank | security | ||||||||||||||||||||||||||||||||||||||||||
| within | |||||||||||||||||||||||||||||||||||||||||||
| CDX index | |||||||||||||||||||||||||||||||||||||||||||
| 194,456,914 | USD | 12/20/2012 | JP Morgan Chase Bank | Receive | 0.73 | % | 0.58 | % | Reference security within CDX index | 194,456,914 | USD | 1,328,008 | |||||||||||||||||||||||||||||||
| 291,685,371 | USD | 12/20/2012 | JP Morgan Chase Bank | Receive | 0.47 | % | 0.58 | % | Reference security within CDX index | 291,685,371 | USD | (887,783 | ) | ||||||||||||||||||||||||||||||
| 11,500,000 | USD | 3/20/2013 | Barclays Bank PLC | (Pay) | 0.61 | % | 7.84 | % | Health Care Properties | N/A | 2,521,299 | ||||||||||||||||||||||||||||||||
| $ | 3,621,898 | ||||||||||||||||||||||||||||||||||||||||||
| Premiums to (Pay) Receive | $ | — | |||||||||||||||||||||||||||||||||||||||||
See accompanying notes to the financial statements.
4
GMO Domestic Bond Fund
(A Series of GMO Trust)
Schedule of Investments — (Continued)
February 28, 2009
u Receive - Fund receives premium and sells credit protection.
(Pay) - Fund pays premium and buys credit protection.
(1) Implied credit spreads, represented in absolute terms, utilized in determining the market value of credit default swap agreements on the reference security, as of February 28, 2009, serve as an indicator of the current status of the payment/performance risk and reflect the likelihood or risk of default for the credit derivative. The implied credit spread of a particular referenced entity reflects the cost of buying/selling protection and may include upfront payments required to be made to enter into the agreement. Wider credit spreads represent a deterioration of the referenced entity's credit soundness and a greater likelihood or risk of default or other credit event occurring as defined under the terms of the agreement.
(2) The maximum potential amount the Fund could be required to make as a seller of credit protection if a credit event occurs as defined under the terms of that particular swap agreement.
Interest Rate Swaps
| Notional Amount | Expiration Date | Counterparty | Receive (Pay)# | Fixed Rate | Variable Rate | Market Value | |||||||||||||||||||||||||
| 134,000,000 | USD | 4/30/2011 | JP Morgan Chase Bank | (Pay) | 1.60 | % | 3 month LIBOR | $ | 497,418 | ||||||||||||||||||||||
| 151,500,000 | USD | 2/11/2012 | Deutsche Bank | (Pay) | 2.03 | % | 3 month LIBOR | 20,838 | |||||||||||||||||||||||
| 102,000,000 | USD | 2/11/2014 | JP Morgan Chase Bank | Receive | 2.60 | % | 3 month LIBOR | (357,519 | ) | ||||||||||||||||||||||
| 165,000,000 | USD | 4/30/2014 | JP Morgan Chase Bank | Receive | 2.35 | % | 3 month LIBOR | (3,272,592 | ) | ||||||||||||||||||||||
| 51,200,000 | USD | 2/11/2019 | Deutsche Bank | Receive | 3.25 | % | 3 month LIBOR | (418,377 | ) | ||||||||||||||||||||||
| 63,000,000 | USD | 4/30/2019 | JP Morgan Chase Bank | (Pay) | 2.83 | % | 3 month LIBOR | 3,029,696 | |||||||||||||||||||||||
| 26,000,000 | USD | 2/11/2039 | JP Morgan Chase Bank | (Pay) | 3.42 | % | 3 month LIBOR | 216,329 | |||||||||||||||||||||||
| $ | (284,207 | ) | |||||||||||||||||||||||||||||
| Premiums to (Pay) Receive | $ | — | |||||||||||||||||||||||||||||
# (Pay) - Fund pays fixed rate and receives variable rate.
Receive - Fund receives fixed rate and pays variable rate.
Total Return Swaps
| Notional Amount | Expiration Date | Counterparty | Pay | Receive | Market Value | ||||||||||||||||||||||
| 300,000,000 | USD | 5/29/2009 | JP Morgan | 1 Month | Return on JP Morgan | $ | — | ||||||||||||||||||||
| Chase Bank | LIBOR - 0.12% | Treasury Index | |||||||||||||||||||||||||
| $ | — | ||||||||||||||||||||||||||
| Premiums to (Pay) Receive | $ | — | |||||||||||||||||||||||||
As of February 28, 2009, for the futures and/or swap contracts held, the Fund had sufficient cash and/or securities to cover any commitments or margin requirements of the relevant broker or exchange.
See accompanying notes to the financial statements.
5
GMO Domestic Bond Fund
(A Series of GMO Trust)
Schedule of Investments — (Continued)
February 28, 2009
Notes to Schedule of Investments:
144A - Securities exempt from registration under Rule 144A of the Securities Act of 1933. These securities may be resold in transactions exempt from registration, normally to qualified institutional investors.
LIBOR - London Interbank Offered Rate
MTN - Medium Term Note
The rates shown on variable rate notes are the current interest rates at February 28, 2009, which are subject to change based on the terms of the security.
(a) All or a portion of this security has been segregated to cover margin requirements on open financial futures contracts (Note 2).
(b) Indexed security in which price and/or coupon is linked to the prices of a specific instrument or financial statistic (Note 2).
(c) Security valued at fair value using methods determined in good faith by or at the direction of the Trustees of GMO Trust (Note 2).
(d) Underlying investment represents interests in defaulted securities.
Currency Abbreviations:
USD - United States Dollar
See accompanying notes to the financial statements.
6
GMO Domestic Bond Fund
(A Series of GMO Trust)
Statement of Assets and Liabilities — February 28, 2009
| Assets: | |||||||
| Investments in unaffiliated issuers, at value (cost $261,850,578) (Note 2) | $ | 246,233,993 | |||||
| Investments in affiliated issuers, at value (cost $1,024,695,583) (Notes 2 and 8) | 807,524,466 | ||||||
| Receivable for investments sold | 233,334 | ||||||
| Interest receivable | 442,338 | ||||||
| Receivable for variation margin on open futures contracts (Note 2) | 718,338 | ||||||
| Interest receivable for open swap contracts | 32,170 | ||||||
| Receivable for open swap contracts (Note 2) | 8,273,962 | ||||||
| Receivable for expenses reimbursed by Manager (Note 3) | 29,204 | ||||||
| Total assets | 1,063,487,805 | ||||||
| Liabilities: | |||||||
| Payable for Fund shares repurchased | 15,306 | ||||||
| Payable to affiliate for (Note 3): | |||||||
| Management fee | 81,650 | ||||||
| Shareholder service fee | 55,020 | ||||||
| Trustees and Chief Compliance Officer of GMO Trust fees | 3,463 | ||||||
| Payable for open swap contracts (Note 2) | 4,936,271 | ||||||
| Accrued expenses | 141,194 | ||||||
| Total liabilities | 5,232,904 | ||||||
| Net assets | $ | 1,058,254,901 | |||||
| Net assets consist of: | |||||||
| Paid-in capital | $ | 1,239,292,333 | |||||
| Accumulated undistributed net investment income | 4,003,688 | ||||||
| Accumulated net realized gain | 45,956,585 | ||||||
| Net unrealized depreciation | (230,997,705 | ) | |||||
| $ | 1,058,254,901 | ||||||
| Net assets attributable to: | |||||||
| Class III shares | $ | 337,523,544 | |||||
| Class VI shares | $ | 720,731,357 | |||||
| Shares outstanding: | |||||||
| Class III | 42,252,014 | ||||||
| Class VI | 90,176,286 | ||||||
| Net asset value per share: | |||||||
| Class III | $ | 7.99 | |||||
| Class VI | $ | 7.99 | |||||
See accompanying notes to the financial statements.
7
GMO Domestic Bond Fund
(A Series of GMO Trust)
Statement of Operations — Year Ended February 28, 2009
| Investment Income: | |||||||
| Dividends from affiliated issuers (Note 8) | $ | 58,497,360 | |||||
| Interest | 2,070,726 | ||||||
| Dividends | 305,319 | ||||||
| Total investment income | 60,873,405 | ||||||
| Expenses: | |||||||
| Management fee (Note 3) | 1,187,642 | ||||||
| Shareholder service fee – Class III (Note 3) | 210,569 | ||||||
| Shareholder service fee – Class VI (Note 3) | 575,995 | ||||||
| Custodian, fund accounting agent and transfer agent fees | 153,000 | ||||||
| Audit and tax fees | 64,790 | ||||||
| Legal fees | 51,731 | ||||||
| Trustees fees and related expenses (Note 3) | 41,711 | ||||||
| Registration fees | 14,947 | ||||||
| Miscellaneous | 14,421 | ||||||
| Total expenses | 2,314,806 | ||||||
| Fees and expenses reimbursed by Manager (Note 3) | (269,141 | ) | |||||
| Expense reductions (Note 2) | (424 | ) | |||||
| Net expenses | 2,045,241 | ||||||
| Net investment income (loss) | 58,828,164 | ||||||
| Realized and unrealized gain (loss): | |||||||
| Net realized gain (loss) on: | |||||||
| Investments in unaffiliated issuers | (37,590 | ) | |||||
| Investments in affiliated issuers | (83,546,066 | ) | |||||
| Realized gains distributions from affiliated issuers (Note 8) | 3,358 | ||||||
| Closed futures contracts | 112,873,936 | ||||||
| Closed swap contracts | (21,272,198 | ) | |||||
| Net realized gain (loss) | 8,021,440 | ||||||
| Change in net unrealized appreciation (depreciation) on: | |||||||
| Investments in unaffiliated issuers | (13,623,455 | ) | |||||
| Investments in affiliated issuers | (178,747,988 | ) | |||||
| Open futures contracts | (5,920,166 | ) | |||||
| Open swap contracts | (688,647 | ) | |||||
| Net unrealized gain (loss) | (198,980,256 | ) | |||||
| Net realized and unrealized gain (loss) | (190,958,816 | ) | |||||
| Net increase (decrease) in net assets resulting from operations | $ | (132,130,652 | ) | ||||
See accompanying notes to the financial statements.
8
GMO Domestic Bond Fund
(A Series of GMO Trust)
Statement of Changes in Net Assets
| Year Ended February 28, 2009 | Year Ended February 29, 2008 | ||||||||||
| Increase (decrease) in net assets: | |||||||||||
| Operations: | |||||||||||
| Net investment income (loss) | $ | 58,828,164 | $ | 33,094,287 | |||||||
| Net realized gain (loss) | 8,021,440 | 32,296,684 | |||||||||
| Change in net unrealized appreciation (depreciation) | (198,980,256 | ) | (37,260,108 | ) | |||||||
| Net increase (decrease) in net assets from operations | (132,130,652 | ) | 28,130,863 | ||||||||
| Distributions to shareholders from: | |||||||||||
| Net investment income | |||||||||||
| Class III | (6,956,865 | ) | (11,697,331 | ) | |||||||
| Class VI | (53,135,218 | ) | (41,858,762 | ) | |||||||
| Total distributions from net investment income | (60,092,083 | ) | (53,556,093 | ) | |||||||
| Net realized gains | |||||||||||
| Class III | (313,474 | ) | — | ||||||||
| Class VI | (2,316,108 | ) | — | ||||||||
| Total distributions from net realized gains | (2,629,582 | ) | �� | — | |||||||
| (62,721,665 | ) | (53,556,093 | ) | ||||||||
| Net share transactions (Note 7): | |||||||||||
| Class III | 215,412,245 | 55,468,188 | |||||||||
| Class VI | 311,273,145 | 273,813,697 | |||||||||
| Increase (decrease) in net assets resulting from net share transactions | 526,685,390 | 329,281,885 | |||||||||
| Redemption fees (Notes 2 and 7): | |||||||||||
| Class III | 65,120 | — | |||||||||
| Class VI | 544,931 | — | |||||||||
| Increase in net assets resulting from redemption fees | 610,051 | — | |||||||||
| Total increase (decrease) in net assets resulting from net share transactions and redemption fees | 527,295,441 | 329,281,885 | |||||||||
| Total increase (decrease) in net assets | 332,443,124 | 303,856,655 | |||||||||
| Net assets: | |||||||||||
| Beginning of period | 725,811,777 | 421,955,122 | |||||||||
| End of period (including accumulated undistributed net investment income of $4,003,688 and $8,256,225, respectively) | $ | 1,058,254,901 | $ | 725,811,777 | |||||||
See accompanying notes to the financial statements.
9
GMO Domestic Bond Fund
(A Series of GMO Trust)
Financial Highlights
(For a Class III share outstanding throughout each period)
| Year Ended February 28/29, | |||||||||||||||||||||||
| 2009 | 2008 | 2007 | 2006 | 2005 | |||||||||||||||||||
| Net asset value, beginning of period | $ | 9.47 | $ | 9.81 | $ | 9.81 | $ | 9.84 | $ | 10.07 | |||||||||||||
| Income (loss) from investment operations: | |||||||||||||||||||||||
| Net investment income (loss)(a)† | 0.39 | 0.42 | 0.43 | 0.13 | 0.16 | ||||||||||||||||||
| Net realized and unrealized gain (loss) | (1.36 | ) | (0.01 | ) | 0.06 | 0.16 | 0.04 | ||||||||||||||||
| Total from investment operations | (0.97 | ) | 0.41 | 0.49 | 0.29 | 0.20 | |||||||||||||||||
| Less distributions to shareholders: | |||||||||||||||||||||||
| From net investment income | (0.50 | ) | (0.75 | ) | (0.49 | ) | (0.16 | ) | (0.16 | ) | |||||||||||||
| From net realized gains | (0.01 | ) | — | — | (0.16 | ) | (0.27 | ) | |||||||||||||||
| Return of capital | — | — | — | — | (0.00 | )(b) | |||||||||||||||||
| Total distributions | (0.51 | ) | (0.75 | ) | (0.49 | ) | (0.32 | ) | (0.43 | ) | |||||||||||||
| Net asset value, end of period | $ | 7.99 | $ | 9.47 | $ | 9.81 | $ | 9.81 | $ | 9.84 | |||||||||||||
| Total Return(c) | (10.39 | )% | 4.35 | % | 5.09 | % | 3.02 | % | 2.02 | % | |||||||||||||
| Ratios/Supplemental Data: | |||||||||||||||||||||||
| Net assets, end of period (000's) | $ | 337,524 | $ | 144,286 | $ | 94,159 | $ | 125,188 | $ | 736,300 | |||||||||||||
| Net expenses to average daily net assets(d) | 0.26 | %(e) | 0.25 | %(e) | 0.25 | % | 0.25 | % | 0.25 | % | |||||||||||||
| Net investment income to average daily net assets(a) | 4.43 | % | 4.28 | % | 4.42 | % | 1.30 | % | 1.57 | % | |||||||||||||
| Portfolio turnover rate | 68 | % | 22 | % | 17 | % | 24 | % | 11 | % | |||||||||||||
| Fees and expenses reimbursed by the Manager to average daily net assets: | 0.02 | % | 0.03 | % | 0.03 | % | 0.02 | % | 0.03 | % | |||||||||||||
| Redemption fees consisted of the following per share amounts:† | $ | 0.00 | (f) | — | — | — | — | ||||||||||||||||
(a) Net investment income is affected by the timing of the declaration of dividends by the underlying funds in which the Fund invests.
(b) Return of capital is less than $0.01.
(c) The total returns would have been lower had certain expenses not been reimbursed during the periods shown and assumes the effect of reinvested distributions. Calculation excludes redemption fees which are borne by the shareholder.
(d) Net expenses exclude expenses incurred indirectly through investment in the underlying funds (See Note 3).
(e) The net expense ratio does not include the effect of expense reductions.
(f) Redemption fees were less than $0.01 per share.
† Calculated using average shares outstanding throughout the period.
See accompanying notes to the financial statements.
10
GMO Domestic Bond Fund
(A Series of GMO Trust)
Financial Highlights
(For a Class VI share outstanding throughout each period)
| Year Ended February 28/29, | |||||||||||||||||||
| 2009 | 2008 | 2007 | 2006(a) | ||||||||||||||||
| Net asset value, beginning of period | $ | 9.48 | $ | 9.82 | $ | 9.82 | $ | 9.93 | |||||||||||
| Income (loss) from investment operations: | |||||||||||||||||||
| Net investment income (loss)(b)† | 0.44 | 0.57 | 0.48 | 0.24 | |||||||||||||||
| Net realized and unrealized gain (loss) | (1.41 | ) | (0.15 | ) | 0.02 | (0.14 | )(c) | ||||||||||||
| Total from investment operations | (0.97 | ) | 0.42 | 0.50 | 0.10 | ||||||||||||||
| Less distributions to shareholders: | |||||||||||||||||||
| From net investment income | (0.51 | ) | (0.76 | ) | (0.50 | ) | (0.21 | ) | |||||||||||
| From net realized gains | (0.01 | ) | — | — | — | ||||||||||||||
| Total distributions | (0.52 | ) | (0.76 | ) | (0.50 | ) | (0.21 | ) | |||||||||||
| Net asset value, end of period | $ | 7.99 | $ | 9.48 | $ | 9.82 | $ | 9.82 | |||||||||||
| Total Return(d) | (10.40 | )% | 4.42 | % | 5.19 | % | 0.97 | %** | |||||||||||
| Ratios/Supplemental Data: | |||||||||||||||||||
| Net assets, end of period (000's) | $ | 720,731 | $ | 581,526 | $ | 327,796 | $ | 359,958 | |||||||||||
| Net expenses to average daily net assets(e) | 0.16 | %(f) | 0.16 | %(f) | 0.16 | % | 0.16 | %* | |||||||||||
| Net investment income to average daily net assets(b) | 5.02 | % | 5.87 | % | 4.85 | % | 2.38 | %(g) | |||||||||||
| Portfolio turnover rate | 68 | % | 22 | % | 17 | % | 24 | %†† | |||||||||||
| Fees and expenses reimbursed by the Manager to average daily net assets: | 0.02 | % | 0.03 | % | 0.03 | % | 0.02 | %* | |||||||||||
| Redemption fees consisted of the following per share amounts:† | $ | 0.00 | (h) | — | — | — | |||||||||||||
(a) Period from July 26, 2005 (commencement of operations) through February 28, 2006.
(b) Net investment income is affected by the timing of the declaration of dividends by the underlying funds in which the Fund invests.
(c) The amount shown for a share outstanding does not correspond with the aggregate net realized and unrealized gain (loss) on investments due to the timing of purchases and redemptions of Fund shares in relation to fluctuating market values of the investments of the Fund.
(d) The total returns would have been lower had certain expenses not been reimbursed during the periods shown and assumes the effect of reinvested distributions. Calculation excludes redemption fees which are borne by the shareholder.
(e) Net expenses exclude expenses incurred indirectly through investment in the underlying funds (See Note 3).
(f) The net expense ratio does not include the effect of expense reductions.
(g) The ratio for the period ended February 28, 2006 has not been annualized since the Fund believes it would not be appropriate because the Fund's net income is not earned ratably throughout the fiscal year.
(h) Redemption fees were less than $0.01 per share.
† Calculated using average shares outstanding throughout the period.
†† Calculation represents portfolio turnover of the Fund for the year ended February 28, 2006.
* Annualized.
** Not annualized.
See accompanying notes to the financial statements.
11
GMO Domestic Bond Fund
(A Series of GMO Trust)
Notes to Financial Statements
February 28, 2009
1. Organization
GMO Domestic Bond Fund (the "Fund") is a series of GMO Trust (the "Trust"). The Fund is registered under the Investment Company Act of 1940, as amended, as an open-end, non-diversified management investment company. The Fund is advised and managed by Grantham, Mayo, Van Otterloo & Co. LLC (the "Manager" or "GMO"). The Trust was established as a Massachusetts business trust under the laws of The Commonwealth of Massachusetts on June 24, 1985. The Declaration of Trust permits the Trustees of the Trust ("Trustees") to create an unlimited number of series of shares ("Funds") and to subdivide Funds into classes.
The Fund seeks total return in excess of that of the Barclays Capital U.S. Government Index (formerly Lehman Brothers U.S. Government Index). The Fund invests a substantial portion of its total assets in shares of GMO Short-Duration Collateral Fund; in U.S. investment-grade bonds, including asset-backed securities and U.S. government securities (including securities neither guaranteed nor insured by the U.S. government); and derivatives (including synthetic debt instruments) whose value is related to U.S. investment-grade bonds. The Fund also may invest a portion of its assets in foreign bonds and lower-rated securities.
As of February 28, 2009, the Fund had two classes of shares outstanding: Class III and Class VI. Each class of shares bears a different level of shareholder servicing fees.
The financial statements of the series of the Trust in which the Fund invests ("underlying funds") should be read in conjunction with the Fund's financial statements. These financial statements are available, without charge, upon request, by calling (617) 346-7646 (collect). Shares of the GMO Short-Duration Collateral Fund and the GMO Special Purpose Holding Fund are not publicly available for direct purchase.
The Fund directly and indirectly (through underlying funds) invests in securities with contractual cash flows, such as collateralized mortgage obligations and commercial mortgage-backed securities, including securities backed by sub-prime mortgage loans, credit card receivables and auto loan receivables. The value, liquidity and related income of these securities are sensitive to changes in economic conditions, including real estate values, delinquencies and/or defaults, and may be adversely affected by changes in interest rates and shifts in the market's perception of the securities' market values.
The Fund will, if deemed prudent by the Manager, take temporary defensive measures (until the Manager has determined that normal conditions have returned or that it is otherwise prudent to resume investing in accordance with the Fund's normal investment strategies) and may not achieve its investment objectives during those periods. Recent changes in the credit markets have reduced the liquidity of all types of fixed income securities, including asset-backed securities.
12
GMO Domestic Bond Fund
(A Series of GMO Trust)
Notes to Financial Statements — (Continued)
February 28, 2009
2. Significant accounting policies
The following is a summary of significant accounting policies followed by the Fund in the preparation of its financial statements. These policies are in conformity with accounting principles generally accepted in the United States of America ("U.S. GAAP") and have been consistently followed by the Fund in preparing its financial statements. The preparation of financial statements in accordance with U.S. GAAP requires management to make estimates and assumptions that affect the reported amounts and disclosures in the financial statements. Actual results could differ from those estimates. The accounting records of the Fund are maintained in U.S. dollars.
Portfolio valuation
Securities listed on a securities exchange for which market quotations are readily available are valued at the last sale price or official closing price on each business day, or if there is no such reported sale or official closing price, at the most recent quoted bid price. Unlisted securities for which market quotations are readily available are generally valued at the most recent quoted bid price. Debt instruments with a remaining maturity of sixty days or less are generally valued at amortized cost, which approximates fair value. Shares of investment funds are generally valued at their net asset value. Securities for which quotations are not readily available or whose values the Manager has determined to be unreliable are valued at fair value as determined in good faith by the Trustees or persons acting at their direction pursuant to procedures approved by the Trustees. By its nature, a fair value price is a good faith estim ate of the value of a security at a given point in time and may not reflect the value that would be realized if the security were sold. The difference between a fair value price and the value realized upon a sale could be material.
Typically the Fund and the underlying funds value debt instruments based on prices supplied by a primary pricing source chosen by the Manager. The Manager evaluates primary pricing sources on an ongoing basis and may change a pricing source should the Manager deem it appropriate. If it deems appropriate, the Manager, at its discretion, may override a price supplied by a primary source by using a price provided by another source. The prices provided by primary pricing sources may differ from the value that would be realized if the securities were sold, and the differences could be material.
Certain securities held by the Fund and underlying funds are valued on the basis of prices provided by a single source. As of February 28, 2009, the total value of these securities represented 29.31% of the net assets. The single source prices provided may differ from the value that would be realized if the securities were sold, and the differences could be material. In addition, although alternative prices are available for other securities held by the Fund, those alternative sources would not necessarily confirm the security price used by the Fund. Therefore, the existence of those alternative sources does not necessarily provide greater certainty about the prices used by the Fund.
GMO Special Purpose Holding Fund ("SPHF"), an investment of the Fund, has litigation pending against various entities related to the default of certain asset-backed securities previously held by SPHF. The outcome of the lawsuits against the remaining defendants is not known and any potential recoveries are
13
GMO Domestic Bond Fund
(A Series of GMO Trust)
Notes to Financial Statements — (Continued)
February 28, 2009
not reflected in the net asset value of SPHF. For the year ended February 28, 2009, the Fund received $3,358 through SPHF in connection with settlement agreements related to that litigation.
In September 2006, the Financial Accounting Standards Board ("FASB") issued Statement of Financial Accounting Standards No. 157, Fair Value Measurements ("SFAS 157"). SFAS 157 is effective for the Fund's current fiscal year. While the adoption of SFAS 157 does not have an effect on the Fund's net asset value, it does require additional disclosures about fair value measurements. SFAS 157 establishes a three-level hierarchy for disclosure of fair value measurements. The valuation hierarchy is based upon the reliability of inputs to the valuation of the Fund's investments. The three levels are defined as follows:
Level 1 – Valuations based on quoted prices for identical securities in active markets.
Level 2 – Valuations determined using other significant direct or indirect observable inputs.
Level 3 – Valuations based on inputs that are unobservable and significant. The Fund utilized the following fair value techniques on Level 3 investments: The Fund valued certain debt securities and preferred stocks using a specified spread above the LIBOR rate. The Fund also considered certain bankrupt securities to be worthless.
The inputs or methodology used for valuing securities are not necessarily an indication of the risk associated with investing in those securities.
The following is a summary of the fair valuations according to inputs used as of February 28, 2009 in valuing the Fund's investments:
| Asset Valuation Inputs | Investments in Securities | Other Financial Instruments* | |||||||||
| Level 1 - Quoted Prices | $ | 10,561,760 | $ | 12,462 | |||||||
| Level 2 - Other Significant Observable Inputs | 1,027,467,175 | 3,764,281 | |||||||||
| Level 3 - Significant Unobservable Inputs | 15,729,524 | 4,509,681 | |||||||||
| Total | $ | 1,053,758,459 | $ | 8,286,424 | |||||||
* Other financial instruments include futures contracts and swap agreements.
| Liability Valuation Inputs | Investments in Securities | Other Financial Instruments** | |||||||||
| Level 1 - Quoted Prices | $ | — | $ | (1,560,156 | ) | ||||||
| Level 2 - Other Significant Observable Inputs | — | (4,048,488 | ) | ||||||||
| Level 3 - Significant Unobservable Inputs | — | (887,783 | ) | ||||||||
| Total | $ | — | $ | (6,496,427 | ) | ||||||
** Other financial instruments include futures contracts and swap agreements.
14
GMO Domestic Bond Fund
(A Series of GMO Trust)
Notes to Financial Statements — (Continued)
February 28, 2009
For the underlying fund's summary of valuation inputs please refer to the respective fund's portfolio valuation note.
The following is a reconciliation of investments in which significant unobservable inputs (Level 3) were used in determining value:
| Investments in Securities | Other Financial Instruments*** | ||||||||||
| Balance as of February 29, 2008 | $ | 1,868 | $ | — | |||||||
| Accrued discounts/premiums | (1,229 | ) | — | ||||||||
| Realized gain (loss) | (419,114 | ) | — | ||||||||
| Realized gain distributions received | 2,565 | — | |||||||||
| Realized gain distributions paid | (3,358 | ) | — | ||||||||
| Change in unrealized appreciation/depreciation | (1,419,955 | ) | 1,951,301 | ||||||||
| Net purchases (sales) | (6,582,912 | ) | — | ||||||||
| Net transfers in and/or out of Level 3 | 24,151,659 | 1,670,597 | |||||||||
| Balance as of February 28, 2009 | $ | 15,729,524 | $ | 3,621,898 | |||||||
*** Other financial instruments include swap agreements.
Futures contracts
The Fund may purchase and sell futures contracts. Upon entering into a futures contract, the Fund is required to deposit cash, U.S. government and agency obligations, or other liquid assets with the futures clearing broker in accordance with the initial margin requirements of the broker or exchange. In addition, the Fund maintains cash or securities in an amount that at least equals the net amount payable in the event the Fund must deliver the full amount of the contract. Futures contracts are marked to market daily and an appropriate payable or receivable for the change in value ("variation margin") is recorded by the Fund. The payable or receivable is settled on the following business day. Gains or losses are recognized but not considered realized until the contracts expire or are closed. Futures contracts involve, to varying degrees, risk of loss in excess of the variation margin disclosed in the Statement of Assets and Liabi lities. Under some circumstances, futures exchanges may establish daily limits on the amount that the price of a futures contract can vary from the previous day's settlement price, thereby effectively preventing liquidation of unfavorable positions. Losses may arise from changes in the value of the underlying instrument if the Fund is unable to liquidate a futures position due to an illiquid secondary market for the contract or the imposition of price limits, or if counterparties do not perform under the contract terms. Futures contracts are generally valued at the settlement price established each day by the board of trade or exchange on which they are traded. Futures contracts outstanding at the end of the period are listed in the Fund's Schedule of Investments.
15
GMO Domestic Bond Fund
(A Series of GMO Trust)
Notes to Financial Statements — (Continued)
February 28, 2009
Options
The Fund may write (i.e., sell) call and put options. Writing options alters the Fund's exposure to the underlying instrument by, in the case of a call option, obligating the Fund to sell the underlying instrument at a set price to the option-holder and, in the case of a put option, obligating the Fund to purchase the underlying instrument at a set price from the option-holder. In the case of an index option, settlement will be in cash. When the Fund writes a call or put option, an amount equal to the premium received is recorded as a liability and subsequently marked to market to reflect the current value of the option written. Premiums received from writing options that expire are treated as realized gains. Premiums received from writing options that are exercised or closed are deducted from the amounts paid on the underlying future, security or currency transaction to determine the realized gain or loss. The Fund as a writer of an option has no control over whether the underlying future, security or currency may be sold (call) or purchased (put) and as a result bears the market risk of an unfavorable change in the price of the future, security or currency underlying the option. In the event that the Fund writes uncovered put or call options (i.e. options for investments that the Fund does not own), it bears the risk of substantial losses if the price of the underlying instrument increases during the term of the option. Options expose the Fund to the risk the Fund may not be able to enter into a closing transaction because of an illiquid market. The Fund had no open written option contracts during the period.
The Fund may also purchase put and call options. Purchasing options alters the Fund's exposure to the underlying instrument by, in the case of a call option, entitling the Fund to purchase the underlying instrument at a set price from the writer of the option and, in the case of a put option, entitling the Fund to sell the underlying instrument at a set price to the writer of the option. The Fund pays a premium for a purchased option. That premium is disclosed in the Schedule of Investments and is subsequently marked to market to reflect the current value of the option. Premiums paid for purchasing options that expire are treated as realized losses. Premiums paid for purchasing options that are exercised or closed are deducted from the proceeds on the closing transaction to determine the realized gain or loss. The risk associated with purchasing put and call options is limited to the premium paid. The Fund had no purchased optio n contracts outstanding at the end of the period.
The Fund values exchange traded options at the last sale price, or if no sale is reported, the last bid price for options it has purchased and the last ask price for options it has written. The Fund values options traded over-the-counter using inputs provided by primary pricing sources and industry standard models.
Indexed securities
The Fund may invest in indexed securities. Indexed securities are securities whose redemption values and/or coupons are linked to the prices of a specific instrument or financial statistic. The Fund uses indexed securities to increase or decrease its exposure to different underlying instruments and to gain exposure to markets in which investing through conventional securities is difficult. Indexed securities held by the Fund at the end of the period are listed in the Fund's Schedule of Investments.
16
GMO Domestic Bond Fund
(A Series of GMO Trust)
Notes to Financial Statements — (Continued)
February 28, 2009
Swap agreements
The Fund may enter into various types of swap agreements, including without limitation, interest rate, total return, credit default and variance swap agreements. A swap agreement is an agreement to exchange the return generated by one instrument for the return generated by another instrument. When entering into a swap agreement, the Fund and/or the swap counterparty may post or receive cash or securities as collateral. The party posting the collateral typically receives the interest associated with or payments related to the collateral and has the risk of loss related to the collateral.
Interest rate swap agreements involve an exchange by the parties of their respective commitments to pay or right to receive interest, e.g., an exchange of floating rate interest payments for fixed rate interest payments with respect to the notional amount of principal.
Total return swap agreements involve a commitment by one party to pay interest to the other party in exchange for a payment to it from the other party based on the return of a reference instrument (e.g., a security or basket of securities), both based on notional amounts. To the extent the return of the reference instrument exceeds or falls short of the interest payments, one party will receive a payment from or make a payment to the other party.
In a credit default swap agreement, one party makes payments to another party in exchange for the right to receive a specified return if a credit event occurs with respect to a referenced entity or entities. Buying credit default protection reduces the buyer's exposure in the event of an issuer's default (e.g., it reduces risk where a party owns a security issued by or otherwise has exposure to the issuer). Selling credit default protection subjects the seller to exposure to an issuer's default. A seller of credit default protection receives payments in return for its obligation to pay the principal amount of a debt security (or other agreed-upon value) to the other party upon the occurrence of a credit event (e.g., issuer default or similar event). If no credit event occurs, the seller has no payment obligations. For credit default swap agreements on asset-backed securities, a credit event may be triggered by such events as the issuer's failure to pay interest or principal, an agreement of the holders of an asset-backed security to a maturity extension, a rating downgrade on the security or a write-down on the collateral underlying the security. For credit default swap agreements on corporate or sovereign issuers, a credit event may be triggered by such events as the issuer's bankruptcy, failure to pay interest or principal, repudiation/moratorium or restructuring.
Variance swap agreements involve an agreement by two parties to exchange cash flows based on the measured variance (or square of volatility) of a specified underlying asset. One party agrees to exchange a "fixed rate" or strike price payment for the "floating rate" or realized price variance on the underlying asset with respect to the notional amount. At inception, the strike price chosen is generally fixed at a level such that the fair value of the swap is zero. At the expiration date, the amount paid by one party to the other is the difference between the realized price variance of the underlying asset and the strike price multiplied by the notional amount. A receiver of the realized price variance would receive a payment when the realized price variance of the underlying asset is greater than the strike price and would make a
17
GMO Domestic Bond Fund
(A Series of GMO Trust)
Notes to Financial Statements — (Continued)
February 28, 2009
payment when that variance is less than the strike price. A payer of the realized price variance would make a payment when the realized price variance of the underlying asset is greater than the strike price and would receive a payment when that variance is less than the strike price. This type of agreement is essentially a forward contract on the future realized price variance of the underlying asset.
The Fund prices its swap agreements daily using models that may incorporate quotations from market makers and records the change in value, if any, as unrealized gain or loss in the Statement of Operations. Payments received or made on swap agreements are recorded as realized gain or loss in the Statement of Operations. Gains or losses are realized upon termination of the swap agreements.
Swap agreements often are not actively traded on financial markets. The values assigned to them may differ significantly from the values that would be realized upon termination, and the differences could be material. Entering into swap agreements involves credit, legal, market and documentation risk that is not reflected in the amounts reported in the Statement of Assets and Liabilities. Such risks include the possibility that the party with whom the Fund contracts may default on its obligations to perform or disagree as to the meaning of contractual terms, or that the collateral that party posts may be insufficient or not timely received by the Fund. Credit risk may be particularly acute in an environment where financial services firms are exposed to systemic risks of the type evidenced by the insolvency of Lehman Brothers and subsequent market disruptions. Swap agreements outstanding at the end of the period are listed in the Fund's Schedule of Investments.
Repurchase agreements
The Fund may enter into repurchase agreements. Under a repurchase agreement the Fund acquires a security for cash and obtains a simultaneous commitment from the seller to repurchase the security at an agreed upon price and date. The Fund, through its custodian, takes possession of securities collateralizing the repurchase agreement. The collateral is marked to market daily to ensure that the market value of the underlying assets is at least equal to the amount owed to the Fund in the event of default by the seller. If the seller of a repurchase agreement defaults or enters into insolvency proceedings and the value of the collateral declines, the Fund's recovery of cash may be delayed or limited. The Fund had no repurchase agreements outstanding at the end of the period.
Reverse repurchase agreements
The Fund may enter into reverse repurchase agreements. Under a reverse repurchase agreement the Fund sells portfolio assets subject to an agreement by the Fund to repurchase the same assets at a later date at a fixed price. In connection with these agreements, the Fund establishes segregated accounts with its custodian in which the Fund maintains cash, U.S. government securities or other assets equal in value to its obligations under the reverse repurchase agreement into which it has entered. Reverse repurchase agreements expose the Fund to the risk that the market value of the securities the Fund has sold under the agreement may decline below the price at which the Fund is obligated to repurchase them under the agreement. If the buyer in a reverse repurchase agreement files for bankruptcy or becomes insolvent, the
18
GMO Domestic Bond Fund
(A Series of GMO Trust)
Notes to Financial Statements — (Continued)
February 28, 2009
Fund's use of proceeds from the sale of its securities may be restricted while the other party or its trustee or receiver determines whether to honor the Fund's right to repurchase the securities. Furthermore, in that situation the Fund may be unable to recover the securities it sold and as a result would realize a loss equal to the difference between the value of the securities and the payment it received for them. This loss would be greater to the extent the buyer paid less than the value of the securities the Fund sold to it (e.g., a buyer may pay $95 for a bond with a market value of $100). The market value of the securities the Fund has sold is determined daily and any additional required collateral is allocated to or sent by the Fund on the next business day. The Fund had no reverse repurchase agreements outstanding at the end of the period.
Securities lending
The Fund may lend its securities to qualified brokers. The loans are collateralized with cash or liquid securities with a market value at least equal to the market value of the securities upon entering into the loan. As with other extensions of credit, the Fund may bear the risk of loss with respect to the investment of the collateral, the risk of delay in and/or inability to exercise its rights with respect to the collateral, and the risk of delay in recovery or loss of rights in the loaned securities should the borrower of the securities fail financially. If a loan is collateralized by U.S. government securities, the Fund receives a fee from the borrower. If a loan is collateralized by cash, the Fund typically invests the cash collateral for its own account. For the year from March 1, 2008 through February 28, 2009, the Fund did not participate in securities lending.
Taxes and distributions
The Fund intends to qualify each tax year as a regulated investment company under Subchapter M of the Internal Revenue Code of 1986, as amended (the "Code"). The Fund intends to distribute substantially all of its net investment income and all of its net realized short-term and long-term capital gain, if any, after giving effect to any available capital loss carryforwards for U.S. federal income tax purposes. Therefore, no provision for U.S. federal income or excise tax is necessary.
The Fund's policy is to declare and pay distributions from net investment income, if any, quarterly, and from net realized short-term and long-term capital gain, if any, at least annually. All distributions are paid in shares of the Fund, at net asset value, unless the shareholder elects to receive cash distributions. Distributions to shareholders are recorded by the Fund on the ex-dividend date.
Income and capital gain distributions are determined in accordance with U.S. federal income tax regulations, which may differ from U.S. GAAP. Certain capital accounts in the financial statements are periodically adjusted for permanent differences in order to reflect their tax character. These adjustments have no impact on net assets or net asset value per share. Temporary differences that arise from recognizing certain items of income, expense, gain or loss in different periods for financial statement and tax purposes will reverse at some time in the future. Distributions in excess of net investment income or net realized gains are temporary over-distributions for financial statement purposes resulting from differences in the recognition or classification of income or distributions for financial statement and tax purposes.
19
GMO Domestic Bond Fund
(A Series of GMO Trust)
Notes to Financial Statements — (Continued)
February 28, 2009
U.S. GAAP and tax accounting differences primarily relate to losses on wash sale transactions, derivative contract transactions and redemption in-kind transactions.
The following reclassification represents the amount necessary to report the stated components of net assets on a tax basis, excluding certain temporary differences, as of February 28, 2009. The financial highlights exclude these adjustments.
| Accumulated Undistributed Net Investment Income | Accumulated Net Realized Gain | Paid-in Capital | |||||||||
| $ | (2,988,618 | ) | $ | 44,573,670 | $ | (41,585,052 | ) | ||||
The tax character of distributions declared to shareholders is as follows:
| 2/28/2009 | 2/29/2008 | ||||||||||
| Ordinary income (including any net short-term capital gain) | $ | 60,092,083 | $ | 53,556,093 | |||||||
| Net long-term capital gain | 2,629,582 | — | |||||||||
| Total distributions | $ | 62,721,665 | $ | 53,556,093 | |||||||
Distributions in excess of tax basis earnings and profits, if significant, are reported in the financial statements as a return of capital for tax purposes.
As of February 28, 2009, the components of distributable earnings on a tax basis consisted of the following:
| Undistributed ordinary income (including any net short-term capital gain) | $ | 25,315,519 | |||||
| Undistributed net long-term capital gain | $ | 40,052,087 | |||||
As of February 28, 2009, the approximate cost for U.S. federal income tax purposes and gross and net unrealized appreciation (depreciation) in value of investments were as follows:
| Aggregate Cost | Gross Unrealized Appreciation | Gross Unrealized (Depreciation) | Net Unrealized Appreciation (Depreciation) | ||||||||||||
| $ | 1,303,114,454 | $ | 1,082 | $ | (249,357,077 | ) | $ | (249,355,995 | ) | ||||||
For the period ended February 28, 2009, the Fund had net realized losses attributed to redemption in-kind transactions of $36,154,621.
20
GMO Domestic Bond Fund
(A Series of GMO Trust)
Notes to Financial Statements — (Continued)
February 28, 2009
The Fund is subject to the provisions of Financial Accounting Standards Board Interpretation No. 48 ("FIN 48"), Accounting for Uncertainty in Income Taxes — an Interpretation of FASB Statement No. 109. FIN 48 sets forth a minimum threshold for financial statement recognition of a tax position taken or expected to be taken in a tax return that could affect the Fund's financial statements. The Fund did not have any unrecognized tax benefits or liabilities at February 28, 2009, nor did it have any increases or decreases in unrecognized tax benefits or liabilities for the period then ended. The Fund is subject to examination prior to the expiration of the statute of limitations by U.S. federal and state tax authorities for tax returns filed.
Security transactions and related investment income
Security transactions in the financial statements are accounted for on the trade date. Dividend income, net of applicable foreign withholding taxes, if any, is recorded on the ex-dividend date or, if later, when the Fund is informed of the ex-dividend date. Interest income is recorded on the accrual basis and is adjusted for the amortization of premiums and accretion of discounts. Principal on inflation indexed securities is adjusted for inflation and any increase or decrease is recorded as interest income or loss. Income is not recognized on securities for which collection is not expected. Non-cash dividends, if any, are recorded at the fair market value of the asset received. In determining the net gain or loss on securities sold, the Fund uses the identified cost basis for the purposes of determining the cost basis.
Expenses
The majority of the expenses of the Trust are directly identifiable to an individual fund. Expenses that are not readily identifiable to a specific fund are allocated taking into consideration, among other things, the nature and type of expense and the relative size of the funds. Investment income, common expenses and realized and unrealized gains and losses are allocated pro rata among the classes of shares of the Fund based on the relative net assets of each class. Shareholder service fees, which are directly attributable to a class of shares, are charged to that class's operations. In addition, the Fund incurs fees and expenses indirectly as a shareholder in the underlying funds. Because the underlying funds have different expense and fee levels and the Fund may own different proportions of the underlying funds at different times, the amount of fees and expenses indirectly incurred by the Fund will vary (See Note 3).
State Street Bank and Trust Company ("State Street") serves as custodian, fund accounting agent and transfer agent of the Fund. State Street's fees may be reduced by an earnings allowance calculated on the average daily cash balances the Fund maintains with State Street. The Fund receives the benefit of the earnings allowance. In addition, Goldman Sachs Agency Lending, the Fund's securities lending agent, has agreed to reimburse the Fund for certain transactional expenses related to securities lending activity. Credit balances or expense reimbursements used to reduce fees, if any, are reported as a reduction of expenses in the Statement of Operations.
21
GMO Domestic Bond Fund
(A Series of GMO Trust)
Notes to Financial Statements — (Continued)
February 28, 2009
Purchases and redemptions of Fund shares
Effective October 8, 2008, the Fund instituted a fee on cash redemptions of 0.96% of the amount redeemed. Effective October 21, 2008, the fee on cash redemptions was changed to 2.00% of the amount redeemed. The Fund may impose a new purchase premium and/or redemption fee, or modify or eliminate an existing purchase premium and/or redemption fee, at any time. If the Manager determines that any portion of a cash redemption is offset by a corresponding cash purchase on the same day, the Fund will ordinarily waive or reduce the redemption fee with respect to that portion. In addition, the Fund may waive or reduce the redemption fee in extraordinary circumstances if the purchase or redemption will not cause the Fund to incur transaction costs. All redemption fees are paid to the Fund and recorded by the Fund as paid-in-capital. These fees are allocated relative to each class's net assets on the share transaction date. In-kind redempt ion transactions are generally not subject to redemption fees except when they include a cash component. However, when a substantial portion of a Fund is being redeemed, the Fund may charge a redemption fee based on estimated or known transaction costs resulting from those redemptions.
Investment risks
To manage the Fund's cash collateral needs in extraordinary market conditions, the Manager reserves the right to reduce or eliminate the Fund's derivative exposures, including those that are intended to cause the Fund to track its benchmark more closely. A reduction in those exposures will tend to cause the performance of the Fund to track its benchmark less closely and make the Fund's performance more dependent on the performance of the asset-backed securities it holds directly or indirectly.
To address in part the cash management issues described above, the Fund expects to honor nearly all redemptions of its shares in-kind for the foreseeable future. If redeeming shareholders from the Fund choose to sell assets received in-kind immediately and current adverse market conditions continue, they may experience difficulty selling the assets at favorable prices. To the extent that the Fund honors redemptions in cash, redeeming shareholders will bear the redemption fees described in the Purchases and Redemptions of Fund Shares note.
Recently issued accounting pronouncement
In March 2008, FASB issued Statement of Financial Accounting Standards No. 161, Disclosures about Derivative Instruments and Hedging Activities ("SFAS 161"). SFAS 161 is effective for fiscal years and interim periods beginning after November 15, 2008. SFAS 161 requires enhanced disclosures about the Fund's derivative and hedging activities. The Manager is currently evaluating the impact the adoption of SFAS 161 will have on the Fund's financial statement disclosures.
3. Fees and other transactions with affiliates
GMO receives a management fee for the services it provides to the Fund. That fee is paid monthly at the annual rate of 0.10% of average daily net assets. The Fund has adopted a Shareholder Service Plan under which the Fund pays GMO a shareholder service fee for client and shareholder service, reporting, and
22
GMO Domestic Bond Fund
(A Series of GMO Trust)
Notes to Financial Statements — (Continued)
February 28, 2009
other support. Pursuant to the Shareholder Service Plan, the shareholder service fee is calculated based on average daily net assets at the annual rate of 0.15% for Class III shares and 0.055% for Class VI shares.
Through at least June 30, 2009, the Manager has contractually agreed to reimburse the Fund for Fund expenses incurred through that date to the extent the Fund's total annual operating expenses (excluding "Excluded Expenses", as defined below) exceed 0.10% of the Fund's average daily net assets. Excluded Expenses include shareholder service fees, expenses indirectly incurred by investment in the underlying funds, fees and expenses of the independent Trustees of the Trust, fees and expenses for legal services not approved by the Manager for the Trust, compensation and expenses of the Trust's Chief Compliance Officer ("CCO") (excluding any employee benefits), brokerage commissions, securities lending fees and expenses, interest expense, transfer taxes, and other investment-related costs (including expenses associated with investments in any company that is an investment company or would be an investment company under the 1940 Act, but for the exceptions to the definition of investment company provided in Section 3(c)(1) and 3(c)(7) of the 1940 Act), hedging transaction fees, extraordinary, non-recurring and certain other unusual expenses (including taxes).
The Fund incurs fees and expenses indirectly as a shareholder of the underlying funds. For the year ended February 28, 2009, these indirect fees and expenses expressed as an annualized percentage of the Fund's average daily net assets were as follows:
| Indirect Net Expenses (excluding shareholder service fees and interest expense) | Indirect Shareholder Service Fees | Indirect Interest Expense | Total Indirect Expenses | ||||||||||||
| 0.004 | % | 0.000 | % | 0.000 | % | 0.004 | % | ||||||||
The Fund's portion of the fees paid by the Trust to the Trust's independent Trustees and CCO during the year ended February 28, 2009 was $37,598 and $7,456, respectively. The compensation and expenses of the CCO are included in miscellaneous expenses in the Statement of Operations. The Fund paid no remuneration to any other officer of the Trust.
4. Purchases and sales of securities
For the year ended February 28, 2009, cost of purchases and proceeds from sales of investments, other than short-term obligations, were as follows:
| Purchases | Sales | ||||||||||
| U.S. Government securities | $ | 51,810,294 | $ | 6,311,303 | |||||||
| Investments (non-U.S. Government securities) | 1,428,357,615 | 778,114,634 | |||||||||
23
GMO Domestic Bond Fund
(A Series of GMO Trust)
Notes to Financial Statements — (Continued)
February 28, 2009
5. Guarantees
In the normal course of business the Fund enters into contracts with third-party service providers that contain a variety of representations and warranties and that provide general indemnifications. The Fund's maximum exposure under these arrangements is unknown, as it involves future claims that may be made against the Fund that have not yet occurred. Based on experience, management is of the view that the risk of loss in connection with its indemnification obligations is remote; however, there can be no assurance that such obligations will not result in material liabilities that adversely affect the Fund.
6. Principal shareholders and related parties
As of February 28, 2009, 75.00% of the shares outstanding of the Fund were held by three shareholders, each holding more than 10% of the Fund's outstanding shares. On that date, no other shareholder owned more than 10% of the outstanding shares of the Fund. One of the shareholders is another fund of the Trust. Redemptions from (or investments into) the Fund by or on behalf of these large shareholders may have a material effect on the Fund.
As of February 28, 2009, 0.01% of the Fund's shares were held by senior management of the Manager and GMO Trust officers and 93.76% of the Fund's shares were held by accounts for which the Manager had investment discretion.
7. Share transactions
The Declaration of Trust permits the Trust to issue an unlimited number of shares of beneficial interest (without par value). Transactions in Fund shares were as follows:
| Year Ended February 28, 2009 | Year Ended February 29, 2008 | ||||||||||||||||||
| Class III: | Shares | Amount | Shares | Amount | |||||||||||||||
| Shares sold | 38,472,777 | $ | 321,100,621 | 30,453,972 | $ | 298,824,097 | |||||||||||||
| Shares issued to shareholders in reinvestment of distributions | 765,227 | 6,493,461 | 765,476 | 7,192,263 | |||||||||||||||
| Shares repurchased | (12,226,577 | ) | (112,181,837 | ) | (25,576,899 | ) | (250,548,172 | ) | |||||||||||
| Redemption fees | — | 65,120 | — | — | |||||||||||||||
| Net increase (decrease) | 27,011,427 | $ | 215,477,365 | 5,642,549 | $ | 55,468,188 | |||||||||||||
24
GMO Domestic Bond Fund
(A Series of GMO Trust)
Notes to Financial Statements — (Continued)
February 28, 2009
| Year Ended February 28, 2009 | Year Ended February 29, 2008 | ||||||||||||||||||
| Class VI: | Shares | Amount | Shares | Amount | |||||||||||||||
| Shares sold | 106,478,381 | $ | 970,656,989 | 26,087,987 | $ | 256,617,471 | |||||||||||||
| Shares issued to shareholders in reinvestment of distributions | 3,251,921 | 28,578,791 | 4,455,602 | 41,858,762 | |||||||||||||||
| Shares repurchased | (80,899,819 | ) | (687,962,635 | ) | (2,571,173 | ) | (24,662,536 | ) | |||||||||||
| Redemption fees | — | 544,931 | — | — | |||||||||||||||
| Net increase (decrease) | 28,830,483 | $ | 311,818,076 | 27,972,416 | $ | 273,813,697 | |||||||||||||
8. Investments in affiliated issuers
A summary of the Fund's transactions in the shares of other funds of the Trust during the year ended February 28, 2009 is set forth below:
| Affiliate | Value, beginning of period | Purchases | Sales Proceeds | Dividend Income | Distributions of Realized Gains | Value, end of period | |||||||||||||||||||||
| GMO Short-Duration Collateral Fund | $ | 678,684,117 | $ | 1,228,030,102 | $ | 719,477,333 | $ | 58,497,360 | u | $ | — | $ | 807,523,384 | ||||||||||||||
| GMO Special Purpose Holding Fund | 1,868 | — | — | — | 3,358 | 1,082 | |||||||||||||||||||||
| Totals | $ | 678,685,985 | $ | 1,228,030,102 | $ | 719,477,333 | $ | 58,497,360 | $ | 3,358 | $ | 807,524,466 | |||||||||||||||
u The Fund received total distributions in the amount of $175,917,592, of which $117,420,232 was a return of capital.
9. Subsequent event
On March 19, 2009, the Trustees approved GMO's plan to maximize the amount of cash distributed to shareholders that represents receipts on its portfolio holdings (including shares of the underlying funds) and from dispositions of those holdings. The plan was adopted in light of the requirements of Section 562 (b) of the Code and calls for the Fund to cease operations within 2 years. For purposes of meeting that timetable, the Fund may distribute securities (including shares of the underlying funds) in-kind.
25
Report of Independent Registered Public Accounting Firm
To the Trustees of GMO Trust and the Shareholders of
GMO Domestic Bond Fund:
In our opinion, the accompanying statement of assets and liabilities, including the schedule of investments, and the related statements of operations and of changes in net assets and the financial highlights present fairly, in all material respects, the financial position of GMO Domestic Bond Fund (the "Fund") at February 28, 2009, the results of its operations for the year then ended, the changes in its net assets for each of the two years in the period then ended and the financial highlights for each of the five years in the period then ended, in conformity with accounting principles generally accepted in the United States of America. These financial statements and financial highlights (hereafter referred to as "financial statements") are the responsibility of the Fund's management. Our responsibility is to express an opinion on these financial statements based on our audits. We conducted our audits of these financial statemen ts in accordance with the standards of the Public Company Accounting Oversight Board (United States). Those standards require that we plan and perform the audit to obtain reasonable assurance about whether the financial statements are free of material misstatement. An audit includes examining, on a test basis, evidence supporting the amounts and disclosures in the financial statements, assessing the accounting principles used and significant estimates made by management, and evaluating the overall financial statement presentation. We believe that our audits, which included confirmation of securities at February 28, 2009 by correspondence with the custodian and brokers, provide a reasonable basis for our opinion.
The Trustees of the Trust approved a plan to cease operations of the Fund within 2 years (see Note 9).
PricewaterhouseCoopers LLP
Boston, Massachusetts
April 29, 2009
26
GMO Domestic Bond Fund
(A Series of GMO Trust)
Fund Expenses
February 28, 2009 (Unaudited)
Expense Examples: The following information is in relation to expenses for the six month period ended February 28, 2009.
As a shareholder of the Fund, you may incur two types of costs: (1) transaction costs, including redemption fees; and (2) ongoing costs, including management fees, shareholder service fees, and other Fund expenses. This example is intended to help you understand your ongoing costs (in dollars) of investing in the Fund and to compare these costs with the ongoing costs of investing in other mutual funds.
These examples are based on an investment of $1,000 invested at the beginning of the period and held for the entire period, September 1, 2008 through February 28, 2009.
Actual Expenses
The first line of the table for each class below provides information about actual account values and actual expenses. You may use the information in this line, together with the amount you invested, to estimate the expenses that you paid over the period. Simply divide your account value by $1,000 (for example, a $10,000,000 account value divided by $1,000 = 10,000), then multiply the result by the number in the first line under the heading entitled "Net Expense Incurred" to estimate the expenses you paid on your account during this period.
Hypothetical Example for Comparison Purposes
The second line of the table for each class below provides information about hypothetical account values and hypothetical expenses based on the Fund's actual expense ratio and an assumed rate of return of 5% per year before expenses, which is not the Fund's actual return. The hypothetical account values and expenses may not be used to estimate the actual ending account balance or expenses you paid for the period. You may use this information to compare the ongoing costs of investing in the Fund with other funds. To do so, compare this 5% hypothetical example with the 5% hypothetical examples that appear in the shareholder reports of other funds.
Please note that the expenses shown in the table are meant to highlight your ongoing costs only and do not reflect any transactional costs, such as purchase premiums and redemption fees. Therefore, the second line of the table is useful in comparing ongoing costs only, and will not help you determine the relative total costs of owning different funds. In addition, if these transactional costs were included, your costs would have been higher.
| Annualized Net Expense Ratio | Beginning Account Value | Ending Account Value | Net Expense Incurred* | ||||||||||||||||
| Class III | |||||||||||||||||||
| 1) Actual | 0.27 | % | $ | 1,000.00 | $ | 907.60 | $ | 1.28 | |||||||||||
| 2) Hypothetical | 0.27 | % | $ | 1,000.00 | $ | 1,023.46 | $ | 1.35 | |||||||||||
| Class VI | |||||||||||||||||||
| 1) Actual | 0.17 | % | $ | 1,000.00 | $ | 907.10 | $ | 0.80 | |||||||||||
| 2) Hypothetical | 0.17 | % | $ | 1,000.00 | $ | 1,023.95 | $ | 0.85 | |||||||||||
* Expenses are calculated using each Class's annualized net expense ratio (including indirect expenses incurred) for the six months ended February 28, 2009, multiplied by the average account value over the period, multiplied by 181 days in the period, divided by 365 days in the year.
27
GMO Domestic Bond Fund
(A Series of GMO Trust)
Tax Information for the Tax Year Ended February 28, 2009 (Unaudited)
The Fund will notify shareholders of amounts for use in preparing 2009 income tax forms in January 2010.
The Fund's distributions to shareholders include $2,629,582 from long-term capital gains.
The Fund hereby designates as qualified interest income with respect to its taxable year ended February 28, 2009, $29,475,811 or if determined to be different, the qualified interest income of such year.
28
Trustees and Officers (Unaudited)
The following tables list the Trust's Trustees and Officers as of the date of this report; their address and date of birth ("DOB"); their position with the Trust; the length of time holding that position with the Trust; their principal occupation(s) during the past five years; the number of portfolios in the fund complex they oversee; and other directorships they hold in companies subject to registration or reporting requirements of the Securities Exchange Act of 1934 (generally called "public companies") or in registered investment companies. The Trust's Statement of Additional Information ("SAI") includes additional information about the Trust's trustees, including changes subsequent to the date of the report. The SAI is available, without charge, upon request by writing GMO, c/o GMO Trust, 40 Rowes Wharf, Boston, MA 02110.
Independent Trustees:
| Name, Address, and DOB | Position(s) Held with Trust | Term of Office1 and Length of Time Served | Principal Occupation(s) During Past Five Years | Number of Portfolios in Fund Complex Overseen by Trustee | Other Directorships Held by Trustee | ||||||||||||||||||
| Donald W. Glazer, Esq. c/o GMO Trust 40 Rowes Wharf Boston, MA 02110 DOB: 07/26/1944 | Chairman of the Board of Trustees | Chairman of the Board of Trustees since March 2005; Lead Independent Trustee (September 2004 – March 2005); Trustee since December 2000. | Consultant – Law and Business2; Author of Legal Treatises. | 59 | None. | ||||||||||||||||||
1 Each Trustee is elected to serve during the continued lifetime of the Trust until he/she dies, resigns or is removed, or if sooner, until the next meeting of Shareholders called for the purpose of electing Trustees and until the election and qualification of his/her successor.
2 As part of Mr. Glazer's work as a consultant, he provides part-time consulting services to Goodwin Procter LLP ("Goodwin"). Goodwin has provided legal services to Renewable Resources, LLC, an affiliate of GMO; GMO, in connection with its relationship with Renewable Resources; and funds managed by Renewable Resources. Mr. Glazer has represented that he has no financial interest in, and is not involved in the provision of, such legal services. In the calendar years ended December 31, 2007 and December 31, 2008, these entities paid $789,416 and $183,864 respectively, in legal fees and disbursements to Goodwin. In correspondence with the Staff of the Securities and Exchange Commission beginning in August 2006, the Independent Trustees' legal counsel provided the Staff with information regarding Mr. Glazer's relationship with Goodwin and h is other business activities. On September 11, 2007, based on information that had been given to the Staff as of that date, the Staff provided oral no-action assurance consistent with the opinion of the Independent Trustees' legal counsel that Mr. Glazer is not an "interested person" of the Trust.
29
Independent Trustees — (Continued)
| Name, Address, and DOB | Position(s) Held with Trust | Term of Office1 and Length of Time Served | Principal Occupation(s) During Past Five Years | Number of Portfolios in Fund Complex Overseen by Trustee | Other Directorships Held by Trustee | ||||||||||||||||||
| W. Nicholas Thorndike c/o GMO Trust 40 Rowes Wharf Boston, MA 02110 DOB: 03/28/1933 | Trustee | Since March 2005. | Director or trustee of various corporations and charitable organizations, including Courier Corporation (a book publisher and manufacturer) (July 1989 – present); Putnam Funds (December 1992 – June 2004); and Providence Journal (a newspaper publisher) (December 1986 – December 2003). | 59 | Director of Courier Corporation (a book publisher and manufacturer); Member of the Investment Committee of Partners HealthCare System, Inc.3 | ||||||||||||||||||
| Peter Tufano c/o GMO Trust 40 Rowes Wharf Boston, MA 02110 DOB: 04/22/1957 | Trustee | Since December 2008. | Sylvan C. Coleman Professor of Financial Management, Harvard Business School (since 1989). | 59 | Trustee of State Street Navigator Securities Lending Trust (3 Portfolios). | ||||||||||||||||||
1 Each Trustee is elected to serve during the continued lifetime of the Trust until he/she dies, resigns or is removed, or if sooner, until the next meeting of Shareholders called for the purpose of electing Trustees and until the election and qualification of his/her successor.
3 Partners HealthCare System, Inc. is a client of the Manager.
30
Principal Officers:
| Name, Address, and DOB | Position(s) Held with Trust | Term of Office4 and Length of Time Served | Principal Occupation(s) During Past Five Years5 | ||||||||||||
| J.B. Kittredge DOB: 08/22/1954 | President and Chief Executive Officer | Since March 2009. | General Counsel, Grantham, Mayo, Van Otterloo & Co. LLC (October 2005 – Present); Partner, Ropes & Gray LLP. | ||||||||||||
| Sheppard N. Burnett c/o GMO Trust 40 Rowes Wharf Boston, MA 02110 DOB: 10/24/1968 | Treasurer and Chief Financial Officer | Chief Financial Officer since March 2007; Treasurer since November 2006; Assistant Treasurer, September 2004 – November 2006. | Fund Administration Staff, Grantham, Mayo, Van Otterloo & Co. LLC (June 2004 – present); Vice President, Director of Tax, Columbia Management Group (2002 – 2004). | ||||||||||||
| Brent C. Arvidson c/o GMO Trust 40 Rowes Wharf Boston, MA 02110 DOB: 06/26/1969 | Assistant Treasurer | Since August 1998. | Senior Fund Administrator, Grantham, Mayo, Van Otterloo & Co. LLC. | ||||||||||||
| John L. Nasrah c/o GMO Trust 40 Rowes Wharf Boston, MA 02110 DOB: 05/27/1977 | Assistant Treasurer | Since March 2007. | Fund Administrator, Grantham, Mayo, Van Otterloo & Co. LLC (September 2004 – present); Tax Analyst, Bain & Company, Inc. (June 2003 – September 2004). | ||||||||||||
| Mahmoodur Rahman c/o GMO Trust 40 Rowes Wharf Boston, MA 02110 DOB: 11/30/1967 | Assistant Treasurer | Since September 2007. | Fund Administrator, Grantham, Mayo, Van Otterloo & Co. LLC (April 2007 – present); Vice President and Senior Tax Manager, Massachusetts Financial Services Company (January 2000 – April 2007). | ||||||||||||
| Michael E. Gillespie c/o GMO Trust 40 Rowes Wharf Boston, MA 02110 DOB: 02/18/1958 | Chief Compliance Officer | Since March 2005. | Vice President of Compliance (June 2004 – February 2005) and Director of Domestic Compliance (March 2002 – June 2004), Fidelity Investments. | ||||||||||||
4 Each officer is elected to hold such office until his or her successor is duly elected and qualified to carry out the duties and responsibilities of the office, or until he or she resigns or is removed from office.
5 Each of Messrs. Burnett, Arvidson, Bohan, and Pottle serves as an officer and/or director of certain pooled investment vehicles of which GMO or an affiliate of GMO serves as the investment adviser.
31
Principal Officers — (Continued)
| Name, Address, and DOB | Position(s) Held with Trust | Term of Office4 and Length of Time Served | Principal Occupation(s) During Past Five Years5 | ||||||||||||
| Jason B. Harrison c/o GMO Trust 40 Rowes Wharf Boston, MA 02110 DOB: 01/29/1977 | Vice President and Clerk | Vice President since November 2006; Clerk since March 2006. | Legal Counsel, Grantham, Mayo, Van Otterloo & Co. LLC (since February 2006) and Attorney, Ropes & Gray LLP (September 2002 – February 2006). | ||||||||||||
| David L. Bohan c/o GMO Trust 40 Rowes Wharf Boston, MA 02110 DOB: 06/21/1964 | Vice President and Assistant Clerk | Vice President since March 2005; Assistant Clerk since March 2006. | Legal Counsel, Grantham, Mayo, Van Otterloo & Co. LLC. | ||||||||||||
| Gregory L. Pottle c/o GMO Trust 40 Rowes Wharf Boston, MA 02110 DOB: 07/09/1971 | Vice President and Assistant Clerk | Since November 2006. | Legal Counsel, Grantham, Mayo, Van Otterloo & Co. LLC. | ||||||||||||
| Anne K. Trinque c/o GMO Trust 40 Rowes Wharf Boston, MA 02110 DOB: 04/15/1978 | Vice President and Assistant Clerk | Since September 2007. | Legal Counsel, Grantham, Mayo, Van Otterloo & Co. LLC (January 2007 – present); Attorney, Goodwin Procter LLP (September 2003 – January 2007). | ||||||||||||
| Cheryl Wakeham c/o GMO Trust 40 Rowes Wharf Boston, MA 02110 DOB: 10/29/1958 | Vice President and Anti-Money Laundering Officer | Since December 2004. | Manager, Client Service Administration, Grantham, Mayo, Van Otterloo & Co. LLC. | ||||||||||||
4 Each officer is elected to hold such office until his or her successor is duly elected and qualified to carry out the duties and responsibilities of the office, or until he or she resigns or is removed from office.
5 Each of Messrs. Burnett, Arvidson, Bohan, and Pottle serves as an officer and/or director of certain pooled investment vehicles of which GMO or an affiliate of GMO serves as the investment adviser.
32
GMO World Opportunity Overlay Fund
(A Series of GMO Trust)
Annual Report
February 28, 2009
For a free copy of the Fund's proxy voting guidelines, shareholders may call 1-617-346-7646 (collect) or visit the Securities and Exchange Commission's website at www.sec.gov. Information regarding how the Fund voted proxies relating to portfolio securities during the most recent 12-month period ended June 30 is available on GMO's website at www.gmo.com, or on the Securities and Exchange Commission's website at www.sec.gov.
The Fund files its complete schedule of portfolio holdings with the Securities and Exchange Commission for the first and third quarter of each fiscal year on Form N-Q, which is available on the Commission's website at www.sec.gov. The Fund's Form N-Q may be reviewed and copied at the Commission's Public Reference Room in Washington, D.C. Information on the operation of the Public Reference Room may be obtained by calling 1-800-SEC-0330.
This report is prepared for the general information of shareholders. It is authorized for distribution to prospective investors only when preceded or accompanied by a private placement memorandum, which contains a complete discussion of the risks associated with an investment in this Fund and other important information. The private placement memorandum can be obtained by calling 1-617-346-7646 (collect).
GMO World Opportunity Overlay Fund
(A Series of GMO Trust)
Portfolio Management
Day-to-day management of the Fund's portfolio is the responsibility of the Fixed Income team at Grantham, Mayo, Van Otterloo & Co. LLC.
Management Discussion and Analysis of Fund Performance
The GMO World Opportunity Overlay Fund returned -28.5% for the fiscal year ended February 28, 2009, as compared to +3.5% for the JPMorgan U.S. 3 Month Cash Index.
The Fund underperformed the benchmark during the fiscal year by -32%. During this time, the overlay detracted about 12%, while collateral management detracted more than 19%. The Fund is comprised of overlay strategies involving investments in derivative transactions (largely interest-rate swaps and exchange-traded futures). These derivative transactions are backed by a collateral pool consisting of U.S. and foreign floating-rate fixed income securities — mainly asset-backed securities.
With the extreme price volatility of asset-backed securities during the fiscal year, the collateral assets underperformed LIBOR by nearly 20%, directly contributing to the Fund's underperformance.
While many model-based positions outperformed, underperformance of U.S. Treasury principal strips versus LIBOR and other opportunistic trades drove overlay losses. The slope and volatility strategies added value during this time.
Based on GMO models, the duration of the Fund's investments at fiscal year-end was 0.2 years.
The views expressed herein are exclusively those of Grantham, Mayo, Van Otterloo & Co. LLC Management as of the date of this report and are subject to change. GMO disclaims any responsibility to update such views. They are not meant as investment advice.
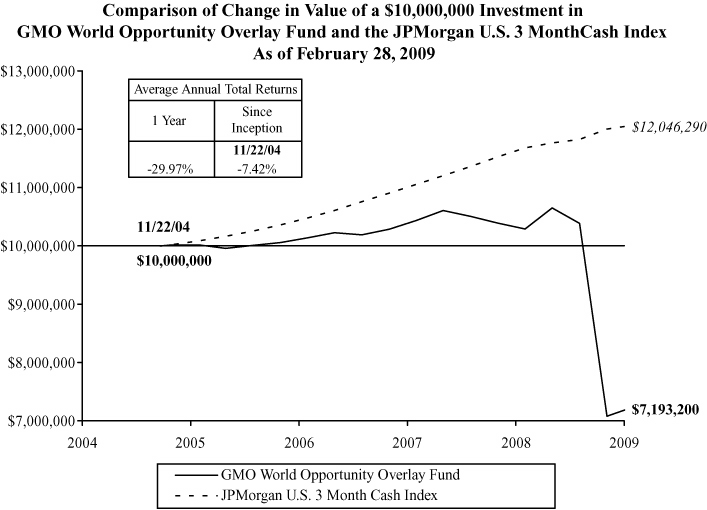
Performance data quoted represents past performance and is not indicative of future results. The investment return and principal value of an investment will fluctuate so that an investor's shares, when redeemed, may be worth more or less than their original cost. Current performance data may be lower or higher than the performance data provided herein. To obtain performance information to the most recent month-end, visit www.gmo.com. Performance shown is net of all fees after reimbursement from the Manager. Each performance figure assumes a redemption at the end of the stated period and reflects a transaction fee of 2.00% on the redemption. Transaction fees are retained by the Fund to cover trading costs. Returns would have been lower had certain expenses not been reimbursed during the periods shown and do not include the effect of taxes on distributions and redem ptions. All information is unaudited.
GMO World Opportunity Overlay Fund
(A Series of GMO Trust)
Investments Concentration Summary
February 28, 2009 (Unaudited)
| Asset Class Summary | % of Total Net Assets | ||||||
| Debt Obligations | 84.7 | % | |||||
| Options Purchased | 9.9 | ||||||
| Short-Term Investments | 8.0 | ||||||
| Swaps | (2.0 | ) | |||||
| Written Options | (3.7 | ) | |||||
| Other | 3.1 | ||||||
| 100.0 | % | ||||||
| Industry Sector Summary | % of Debt Obligations | ||||||
| Credit Cards | 18.2 | % | |||||
| Residential Asset-Backed Securities (United States) | 14.7 | ||||||
| Auto Financing | 14.0 | ||||||
| U.S. Government | 9.3 | ||||||
| Insured Auto Financing | 8.8 | ||||||
| Residential Mortgage-Backed Securities (European) | 6.0 | ||||||
| CMBS | 5.8 | ||||||
| Business Loans | 4.2 | ||||||
| Student Loans | 3.4 | ||||||
| Investment Grade Corporate Collateralized Debt Obligations | 2.9 | ||||||
| Residential Mortgage-Backed Securities (Australian) | 2.8 | ||||||
| Equipment Leases | 1.7 | ||||||
| Insured Other | 1.7 | ||||||
| Bank Loan Collateralized Debt Obligations | 1.4 | ||||||
| Insurance Premiums | 1.1 | ||||||
| Insured Residential Asset-Backed Securities (United States) | 0.9 | ||||||
| CMBS Collateralized Debt Obligations | 0.9 | ||||||
| Insured Credit Cards | 0.9 | ||||||
| Insured Time Share | 0.7 | ||||||
| Insured Transportation | 0.4 | ||||||
| U.S. Government & Agencies | 0.1 | ||||||
| Insured Residential Mortgage-Backed Securities (United States) | 0.1 | ||||||
| Residential Mortgage-Backed Securities (United States) | 0.0 | ||||||
| 100.0 | % | ||||||
1
GMO World Opportunity Overlay Fund
(A Series of GMO Trust)
Schedule of Investments
(showing percentage of total net assets)
February 28, 2009
| Par Value ($) | Description | Value ($) | |||||||||||||
| DEBT OBLIGATIONS — 84.7% | |||||||||||||||
| Asset-Backed Securities — 76.7% | |||||||||||||||
| Auto Financing — 11.8% | |||||||||||||||
| 8,300,000 | BMW Vehicle Lease Trust, Series 07-1, Class A3B, 1 mo. LIBOR + .24%, 0.70%, due 08/15/13 | 7,994,726 | |||||||||||||
| 6,300,000 | Capital Auto Receivable Asset Trust, Series 07-2, Class A4B, 1 mo. LIBOR + .40%, 0.86%, due 02/18/14 | 5,175,450 | |||||||||||||
| 9,200,000 | Carmax Auto Owner Trust, Series 08-2, Class A4B, 1 mo. LIBOR + 1.65%, 2.11%, due 08/15/13 | 7,052,624 | |||||||||||||
| 4,685,000 | Daimler Chrysler Auto Trust, Series 08-B, Class A4A, 5.32%, due 11/10/14 | 3,288,870 | |||||||||||||
| 6,100,000 | Daimler Chrysler Master Owner Trust, Series 06-A, Class A, 1 mo. LIBOR + .03%, 0.49%, due 11/15/11 | 3,965,000 | |||||||||||||
| 6,800,000 | Ford Credit Auto Owner Trust, Series 06-C, Class A4B, 1 mo. LIBOR + .04%, 0.50%, due 02/15/12 | 6,129,928 | |||||||||||||
| 1,800,000 | Ford Credit Auto Owner Trust, Series 07-B, Class A4B, 1 mo. LIBOR + .38%, 0.84%, due 07/15/12 | 1,350,540 | |||||||||||||
| 11,890,000 | Ford Credit Floorplan Master Owner Trust, Series 06-4, Class A, 1 mo. LIBOR + .25%, 0.71%, due 06/15/13 | 7,134,000 | |||||||||||||
| 3,900,000 | Merrill Auto Trust Securitization, Series 07-1, Class A4, 1 mo. LIBOR + .06%, 0.52%, due 12/15/13 | 3,233,953 | |||||||||||||
| 9,000,000 | Merrill Auto Trust Securitization, Series 08-1, Class A4B, 1 mo. LIBOR + 2.20%, 2.66%, due 04/15/15 | 7,183,125 | |||||||||||||
| 11,800,000 | Nissan Auto Receivables Owner Trust, Series 07-A, Class A4, 1 mo. LIBOR, 0.46%, due 06/17/13 | 11,192,536 | |||||||||||||
| 7,010,886 | Sovereign Dealer Floor Plan Master Trust, Series 06-1, Class A, 144A, 1 mo. LIBOR + .05%, 0.51%, due 08/15/11 | 6,309,798 | |||||||||||||
| 9,000,000 | Superior Wholesale Inventory Financing Trust, Series 04-A10, Class A, 1 mo. LIBOR + .10%, 0.56%, due 09/15/11 | 6,300,000 | |||||||||||||
| 2,000,000 | Swift Master Auto Receivables Trust, Series 07-1, Class A, 1 mo. LIBOR + .10%, 0.56%, due 06/15/12 | 1,340,000 | |||||||||||||
| 7,200,000 | Truck Retail Installment Paper Corp., Series 05-1A, Class A, 144A, 1 mo. LIBOR + .27%, 0.73%, due 12/15/16 | 5,040,000 | |||||||||||||
| 11,800,000 | World Omni Auto Receivables Trust, Series 07-A, Class A4, 1 mo. LIBOR, 0.46%, due 11/15/12 | 10,812,458 | |||||||||||||
| Total Auto Financing | 93,503,008 | ||||||||||||||
See accompanying notes to the financial statements.
2
GMO World Opportunity Overlay Fund
(A Series of GMO Trust)
Schedule of Investments — (Continued)
(showing percentage of total net assets)
February 28, 2009
| Par Value ($) | Description | Value ($) | |||||||||||||
| Bank Loan Collateralized Debt Obligations — 1.2% | |||||||||||||||
| 4,746,086 | Arran Corp. Loans No. 1 B.V., Series 06-1A, Class A3, 144A, 3 mo. LIBOR + .17%, 1.70%, due 06/20/25 | 4,510,264 | |||||||||||||
| 5,360,000 | Omega Capital Europe Plc, Series GLOB-5A, Class A1, 144A, 3 mo. LIBOR + .25%, 1.68%, due 07/05/11 | 4,749,282 | |||||||||||||
| Total Bank Loan Collateralized Debt Obligations | 9,259,546 | ||||||||||||||
| �� | Business Loans — 3.6% | ||||||||||||||
| 1,649,619 | Bayview Commercial Asset Trust, Series 04-3, Class A1, 144A, 1 mo. LIBOR + .37%, 0.84%, due 01/25/35 | 1,149,124 | |||||||||||||
| 2,553,990 | Bayview Commercial Asset Trust, Series 05-4A, Class A2, 144A, 1 mo. LIBOR + .39%, 0.86%, due 01/25/36 | 1,632,511 | |||||||||||||
| 9,000,000 | Bayview Commercial Asset Trust, Series 07-6A, Class A2, 144A, 1 mo. LIBOR + 1.30%, 1.77%, due 12/25/37 | 6,283,800 | |||||||||||||
| 952,026 | Capitalsource Commercial Loan Trust, Series 06-1A, Class A1, 144A, 1 mo. LIBOR + .12%, 0.59%, due 08/22/16 | 815,886 | |||||||||||||
| 1,687,625 | GE Business Loan Trust, Series 05-2A, Class A, 144A, 1 mo. LIBOR + .24%, 0.70%, due 11/15/33 | 1,094,344 | |||||||||||||
| 11,000,000 | GE Dealer Floorplan Master Trust, Series 07-2, Class A, 1 mo. LIBOR + .01%, 0.48%, due 07/20/12 | 7,893,551 | |||||||||||||
| 2,216,462 | Lehman Brothers Small Balance Commercial, Series 05-1A, Class A, 144A, 1 mo. LIBOR + .25%, 0.72%, due 02/25/30 | 1,063,902 | |||||||||||||
| 1,609,758 | Lehman Brothers Small Balance Commercial, Series 05-2A, Class 1A, 144A, 1 mo. LIBOR + .25%, 0.72%, due 09/25/30 | 772,684 | |||||||||||||
| 3,393,942 | Lehman Brothers Small Balance Commercial, Series 07-2A, Class 1A1, 144A, 1 mo. LIBOR + .12%, 0.59%, due 06/25/37 | 1,764,850 | |||||||||||||
| 749,206 | Lehman Brothers Small Balance Commercial, Series 07-3A, Class 1A1, 144A, 1 mo. LIBOR + .65%, 1.12%, due 10/25/37 | 584,381 | |||||||||||||
| 2,700,000 | Lehman Brothers Small Balance Commercial, Series 07-3A, Class 1A2, 144A, 1 mo. LIBOR + .85%, 1.32%, due 10/25/37 | 1,404,000 | |||||||||||||
| 4,500,000 | Navistar Financial Dealer Note Master Trust, Series 05-1, Class A, 1 mo. LIBOR + .11%, 0.58%, due 02/25/13 | 3,860,550 | |||||||||||||
| Total Business Loans | 28,319,583 | ||||||||||||||
| CMBS — 4.9% | |||||||||||||||
| 5,200,000 | Citigroup/Deutsche Bank Commercial Mortgage, Series 05-CD1, Class A2FL, 1 mo. LIBOR + .12%, 0.58%, due 07/15/44 | 3,791,840 | |||||||||||||
See accompanying notes to the financial statements.
3
GMO World Opportunity Overlay Fund
(A Series of GMO Trust)
Schedule of Investments — (Continued)
(showing percentage of total net assets)
February 28, 2009
| Par Value ($) | Description | Value ($) | |||||||||||||
| CMBS — continued | |||||||||||||||
| 11,700,000 | Commercial Mortgage Pass-Through Certificates, Series 06-FL12, Class AJ, 144A, 1 mo. LIBOR + .13%, 0.59%, due 12/15/20 | 8,645,130 | |||||||||||||
| 5,200,000 | GE Capital Commercial Mortgage Corp., Series 05-C4, Class A2, 5.31%, due 11/10/45 | 4,771,089 | |||||||||||||
| 3,600,000 | GE Capital Commercial Mortgage Corp., Series 06-C1, Class A2, 5.33%, due 03/10/44 | 3,153,072 | |||||||||||||
| 963,232 | Greenwich Capital Commercial Funding Corp., Series 06-FL4A, Class A1, 144A, 1 mo. LIBOR + .09%, 0.54%, due 11/05/21 | 798,881 | |||||||||||||
| 6,300,000 | GS Mortgage Securities Corp., Series 06-GG6, Class A2, 5.51%, due 04/10/38 | 5,538,094 | |||||||||||||
| 561,431 | Lehman Brothers Floating Rate Commercial, Series 06-LLFA, Class A1, 144A, 1 mo. LIBOR + .08%, 0.54%, due 09/15/21 | 393,002 | |||||||||||||
| 5,400,000 | Merrill Lynch Mortgage Trust, Series 06-C1, Class A2, 5.61%, due 05/12/39 | 4,706,437 | |||||||||||||
| 2,700,000 | Morgan Stanley Capital I, Series 06-IQ11, Class A3, 5.74%, due 10/15/42 | 1,986,687 | |||||||||||||
| 6,914,840 | Wachovia Bank Commercial Mortgage Trust, Series 06-WL7A, Class A1, 144A, 1 mo. LIBOR + .09%, 0.55%, due 09/15/21 | 4,840,388 | |||||||||||||
| Total CMBS | 38,624,620 | ||||||||||||||
| CMBS Collateralized Debt Obligations — 0.7% | |||||||||||||||
| 6,780,000 | American Capital Strategies Ltd. Commercial Real Estate CDO Trust, Series 07-1A, Class A, 144A, 3 mo. LIBOR + .80%, 2.05%, due 11/23/52 | 542,400 | |||||||||||||
| 6,300,000 | Guggenheim Structured Real Estate Funding, Series 05-2A, Class A, 144A, 1 mo. LIBOR + .32%, 0.79%, due 08/26/30 | 2,835,000 | |||||||||||||
| 6,700,000 | Marathon Real Estate CDO, Series 06-1A, Class A1, 144A, 1 mo. LIBOR + .33%, 0.80%, due 05/25/46 | 2,476,906 | |||||||||||||
| Total CMBS Collateralized Debt Obligations | 5,854,306 | ||||||||||||||
| Credit Cards — 15.4% | |||||||||||||||
| 4,500,000 | American Express Credit Account Master Trust, Series 04-4, Class A, 1 mo. LIBOR + .09%, 0.55%, due 03/15/12 | 4,430,003 | |||||||||||||
| 8,100,000 | American Express Credit Account Master Trust, Series 05-5, Class A, 1 mo. LIBOR + .04%, 0.50%, due 02/15/13 | 7,696,944 | |||||||||||||
| 4,100,000 | American Express Credit Account Master Trust, Series 06-1, Class A, 1 mo. LIBOR + .03%, 0.49%, due 12/15/13 | 3,755,149 | |||||||||||||
| 7,200,000 | Cabela's Master Credit Card Trust, Series 08-4A, Class A2, 144A, 1 mo. LIBOR + 3.00%, 3.46%, due 09/15/14 | 5,923,800 | |||||||||||||
See accompanying notes to the financial statements.
4
GMO World Opportunity Overlay Fund
(A Series of GMO Trust)
Schedule of Investments — (Continued)
(showing percentage of total net assets)
February 28, 2009
| Par Value ($) | Description | Value ($) | |||||||||||||
| Credit Cards — continued | |||||||||||||||
| 4,500,000 | Capital One Multi-Asset Execution Trust, Series 04-A7, Class A7, 3 mo. LIBOR + .15%, 1.38%, due 06/16/14 | 4,049,096 | |||||||||||||
| 8,900,000 | Capital One Multi-Asset Execution Trust, Series 06-A14, Class A, 1 mo. LIBOR + .01%, 0.47%, due 08/15/13 | 8,272,550 | |||||||||||||
| 8,100,000 | Capital One Multi-Asset Execution Trust, Series 08-A6, Class A6, 1 mo. LIBOR + 1.10%, 1.56%, due 03/17/14 | 7,401,375 | |||||||||||||
| 7,700,000 | Charming Shoppes Master Trust, Series 07-1A, Class A1, 144A, 1 mo. LIBOR + 1.25%, 1.71%, due 09/15/17 | 5,298,293 | |||||||||||||
| 9,200,000 | Citibank OMNI Master Trust, Series 07-A9A, Class A9, 144A, 1 mo. LIBOR + 1.10%, 1.57%, due 12/23/13 | 8,310,360 | |||||||||||||
| 4,100,000 | Discover Card Master Trust I, Series 05-4, Class A1, 1 mo. LIBOR + .06%, 0.52%, due 06/18/13 | 3,669,500 | |||||||||||||
| 4,000,000 | Discover Card Master Trust I, Series 05-4, Class A2, 1 mo. LIBOR + .09%, 0.55%, due 06/16/15 | 2,976,250 | |||||||||||||
| 2,700,000 | Discover Card Master Trust I, Series 06-2, Class A2, 1 mo. LIBOR + .03%, 0.49%, due 01/16/14 | 2,370,978 | |||||||||||||
| 4,000,000 | Discover Card Master Trust I, Series 96-4, Class A, 1 mo. LIBOR + .38%, 0.83%, due 10/16/13 | 3,588,000 | |||||||||||||
| 5,700,000 | GE Capital Credit Card Master Note Trust, Series 05-1, Class A, 1 mo. LIBOR + .04%, 0.50%, due 03/15/13 | 5,275,236 | |||||||||||||
| 4,500,000 | GE Capital Credit Card Master Note Trust, Series 07-3, Class A1, 1 mo. LIBOR + .01%, 0.47%, due 06/15/13 | 4,106,250 | |||||||||||||
| 10,800,000 | Household Credit Card Master Note Trust I, Series 07-1, Class A, 1 mo. LIBOR + .05%, 0.51%, due 04/15/13 | 9,240,750 | |||||||||||||
| 4,600,000 | Household Credit Card Master Note Trust I, Series 07-2, Class A, 1 mo. LIBOR + .55%, 1.01%, due 07/15/13 | 3,832,375 | |||||||||||||
| 14,500,000 | HSBC Private Label Credit Card Master Note, Series 07-1, Class A, 1 mo. LIBOR + .02%, 0.48%, due 12/16/13 | 13,688,906 | |||||||||||||
| 4,300,000 | National City Credit Card Master Trust, Series 08-3, Class A, 1 mo. LIBOR + 1.80%, 2.26%, due 05/15/13 | 3,375,500 | |||||||||||||
| 13,900,000 | World Financial Network Credit Card Master Trust, Series 04-A, Class A, 1 mo. LIBOR + .18%, 0.64%, due 03/15/13 | 13,630,896 | |||||||||||||
| 900,000 | World Financial Network Credit Card Master Trust, Series 06-A, Class A, 144A, 1 mo. LIBOR + .13%, 0.59%, due 02/15/17 | 638,622 | |||||||||||||
| Total Credit Cards | 121,530,833 | ||||||||||||||
See accompanying notes to the financial statements.
5
GMO World Opportunity Overlay Fund
(A Series of GMO Trust)
Schedule of Investments — (Continued)
(showing percentage of total net assets)
February 28, 2009
| Par Value ($) | Description | Value ($) | |||||||||||||
| Equipment Leases — 1.4% | |||||||||||||||
| 4,100,000 | CNH Equipment Trust, Series 07-B, Class A3B, 1 mo. LIBOR + .60%, 1.06%, due 10/17/11 | 3,992,826 | |||||||||||||
| 8,100,000 | GE Equipment Midticket LLC, Series 07-1, Class A3B, 1 mo. LIBOR + .25%, 0.71%, due 06/14/11 | 7,249,500 | |||||||||||||
| Total Equipment Leases | 11,242,326 | ||||||||||||||
| Insurance Premiums — 1.0% | |||||||||||||||
| 8,000,000 | AICCO Premium Finance Master Trust, Series 07-AA, Class A, 144A, 1 mo. LIBOR + .05%, 0.51%, due 12/15/11 | 7,657,600 | |||||||||||||
| Insured Auto Financing — 7.5% | |||||||||||||||
| 4,700,000 | Aesop Funding II LLC, Series 05-1A, Class A3, 144A, MBIA, 1 mo. LIBOR + .12%, 0.59%, due 04/20/11 | 3,822,416 | |||||||||||||
| 6,000,000 | Aesop Funding II LLC, Series 06-1A, Class A, 144A, MBIA, 1 mo. LIBOR + .22%, 0.69%, due 03/20/12 | 3,988,320 | |||||||||||||
| 3,529,785 | AmeriCredit Automobile Receivables Trust, Series 05-BM, Class A4, MBIA, 1 mo. LIBOR + .08%, 0.53%, due 05/06/12 | 3,246,978 | |||||||||||||
| 3,000,000 | AmeriCredit Automobile Receivables Trust, Series 07-AX, Class A4, XL, 1 mo. LIBOR + .04%, 0.49%, due 10/06/13 | 2,010,900 | |||||||||||||
| 6,911,187 | AmeriCredit Automobile Receivables Trust, Series 07-CM, Class A3B, MBIA, 1 mo. LIBOR + .03%, 0.48%, due 05/07/12 | 6,358,292 | |||||||||||||
| 2,700,000 | AmeriCredit Automobile Receivables Trust, Series 07-DF, Class A4B, FSA, 1 mo. LIBOR + .80%, 1.25%, due 06/06/14 | 1,473,363 | |||||||||||||
| 6,000,000 | AmeriCredit Prime Automobile Receivable Trust, Series 07-2M, Class A4B, MBIA, 1 mo. LIBOR + .50%, 0.95%, due 03/08/16 | 3,170,460 | |||||||||||||
| 3,150,000 | ARG Funding Corp., Series 05-2A, Class A3, 144A, AMBAC, 1 mo. LIBOR + .14%, 0.61%, due 05/20/10 | 3,013,416 | |||||||||||||
| 5,700,000 | Capital One Auto Finance Trust, Series 06-B, Class A4, MBIA, 1 mo. LIBOR + .02%, 0.47%, due 07/15/13 | 4,545,807 | |||||||||||||
| 9,900,000 | Capital One Auto Finance Trust, Series 07-A, Class A4, AMBAC, 1 mo. LIBOR + .02%, 0.48%, due 11/15/13 | 6,933,267 | |||||||||||||
| 1,715,520 | Capital One Auto Finance Trust, Series 07-C, Class A3B, FGIC, 1 mo. LIBOR + .51%, 0.97%, due 04/16/12 | 1,596,754 | |||||||||||||
| 1,800,000 | Hertz Vehicle Financing LLC, Series 05-2A, Class A5, 144A, AMBAC, 1 mo. LIBOR + .25%, 0.72%, due 11/25/11 | 1,066,842 | |||||||||||||
| 11,100,000 | Santander Drive Auto Receivables Trust, Series 07-3, Class A4B, FGIC, 1 mo. LIBOR + .65%, 1.11%, due 10/15/14 | 7,559,433 | |||||||||||||
See accompanying notes to the financial statements.
6
GMO World Opportunity Overlay Fund
(A Series of GMO Trust)
Schedule of Investments — (Continued)
(showing percentage of total net assets)
February 28, 2009
| Par Value ($) | Description | Value ($) | |||||||||||||
| Insured Auto Financing — continued | |||||||||||||||
| 11,000,000 | Triad Auto Receivables Owner Trust, Series 07-B, Class A4B, FSA, 1 mo. LIBOR + 1.20%, 1.65%, due 07/14/14 | 7,764,900 | |||||||||||||
| 2,915,049 | UPFC Auto Receivables Trust, Series 06-B, Class A3, AMBAC, 5.01%, due 08/15/12 | 2,667,270 | |||||||||||||
| Total Insured Auto Financing | 59,218,418 | ||||||||||||||
| Insured Credit Cards — 0.7% | |||||||||||||||
| 5,800,000 | Cabela's Master Credit Card Trust, Series 04-2A, Class A, 144A, AMBAC, 1 mo. LIBOR + .12%, 0.58%, due 03/15/11 | 5,792,386 | |||||||||||||
| Insured Other — 1.4% | |||||||||||||||
| 5,000,000 | DB Master Finance LLC, Series 06-1, Class A2, 144A, AMBAC, 5.78%, due 06/20/31 | 3,500,000 | |||||||||||||
| 3,796,397 | Henderson Receivables LLC, Series 06-3A, Class A1, 144A, MBIA, 1 mo. LIBOR + .20%, 0.66%, due 09/15/41 | 2,386,605 | |||||||||||||
| 3,010,991 | Henderson Receivables LLC, Series 06-4A, Class A1, 144A, MBIA, 1 mo. LIBOR + .20%, 0.66%, due 12/15/41 | 1,918,212 | |||||||||||||
| 3,879,652 | TIB Card Receivables Fund, 144A, FGIC, 3 mo. LIBOR + .25%, 1.68%, due 01/05/14 | 2,459,699 | |||||||||||||
| 9,200,000 | Toll Road Investment Part II, Series C, 144A, MBIA, Zero Coupon, due 02/15/37 | 943,276 | |||||||||||||
| Total Insured Other | 11,207,792 | ||||||||||||||
| Insured Residential Asset-Backed Securities (United States) — 0.8% | |||||||||||||||
| 10,840,629 | Ameriquest Mortgage Securities, Inc., Series 04-R6, Class A1, XL, 1 mo. LIBOR + .21%, 0.68%, due 07/25/34 | 6,179,158 | |||||||||||||
| Insured Residential Mortgage-Backed Securities (United States) — 0.1% | |||||||||||||||
| 1,287,386 | SBI Heloc Trust, Series 05-HE1, Class 1A, 144A, FSA, 1 mo. LIBOR + .19%, 0.66%, due 11/25/35 | 643,693 | |||||||||||||
| Insured Time Share — 0.6% | |||||||||||||||
| 1,156,472 | Cendant Timeshare Receivables Funding LLC, Series 05-1A, Class A2, 144A, FGIC, 1 mo. LIBOR + .18%, 0.65%, due 05/20/17 | 832,299 | |||||||||||||
| 784,712 | Sierra Receivables Funding Co., Series 06-1A, Class A2, 144A, MBIA, 1 mo. LIBOR + .15%, 0.62%, due 05/20/18 | 594,577 | |||||||||||||
See accompanying notes to the financial statements.
7
GMO World Opportunity Overlay Fund
(A Series of GMO Trust)
Schedule of Investments — (Continued)
(showing percentage of total net assets)
February 28, 2009
| Par Value ($) | Description | Value ($) | |||||||||||||
| Insured Time Share — continued | |||||||||||||||
| 4,892,085 | Sierra Receivables Funding Co., Series 07-2A, Class A2, 144A, MBIA, 1 mo. LIBOR + 1.00%, 1.47%, due 09/20/19 | 3,000,095 | |||||||||||||
| Total Insured Time Share | 4,426,971 | ||||||||||||||
| Insured Transportation — 0.3% | |||||||||||||||
| 5,649,786 | CLI Funding LLC, Series 06-1A, Class A, 144A, AMBAC, 1 mo. LIBOR + .18%, 0.64%, due 08/18/21 | 2,627,150 | |||||||||||||
| Investment Grade Corporate Collateralized Debt Obligations — 2.4% | |||||||||||||||
| 2,000,000 | Morgan Stanley ACES SPC, Series 04-12, Class A, 144A, 3 mo. LIBOR + .60%, 1.83%, due 08/05/09 | 1,458,000 | |||||||||||||
| 4,000,000 | Morgan Stanley ACES SPC, Series 04-15, Class II, 144A, 3 mo. LIBOR + .65%, 2.18%, due 12/20/09 | 2,214,000 | |||||||||||||
| 2,000,000 | Morgan Stanley ACES SPC, Series 04-15, Class III, 144A, 3 mo. LIBOR + .75%, 2.28%, due 12/20/09 | 920,000 | |||||||||||||
| 5,000,000 | Morgan Stanley ACES SPC, Series 04-16, Class I, 144A, 3 mo. LIBOR + .40%, 1.63%, due 08/05/09 | 4,232,500 | |||||||||||||
| 2,000,000 | Morgan Stanley ACES SPC, Series 05-10, Class A1, 144A, 3 mo. LIBOR + .52%, 2.05%, due 03/20/10 | 776,000 | |||||||||||||
| 4,000,000 | Morgan Stanley ACES SPC, Series 05-15, Class A, 144A, 3 mo. LIBOR + .40%, 1.93%, due 12/20/10 | 1,614,000 | |||||||||||||
| 2,000,000 | Morgan Stanley ACES SPC, Series 05-2A, Class A, 144A, 3 mo. LIBOR + .45%, 1.98%, due 03/20/10 | 975,000 | |||||||||||||
| 5,300,000 | Morgan Stanley ACES SPC, Series 06-13A, Class A, 144A, 3 mo. LIBOR + .29%, 1.82%, due 06/20/13 | 893,050 | |||||||||||||
| 9,000,000 | Prism Orso Trust, Series 04-MAPL, Class CERT, 144A, 3 mo. LIBOR + .70%, 2.23%, due 08/01/11 | 5,154,300 | |||||||||||||
| 4,500,000 | Salisbury International Investments Ltd., 3 mo. LIBOR + .42%, 1.95%, due 06/22/10 | 1,092,600 | |||||||||||||
| Total Investment Grade Corporate Collateralized Debt Obligations | 19,329,450 | ||||||||||||||
| Residential Asset-Backed Securities (United States) — 12.5% | |||||||||||||||
| 3,012,033 | Accredited Mortgage Loan Trust, Series 07-1, Class A1, 1 mo. LIBOR + .05%, 0.52%, due 02/25/37 | 2,680,709 | |||||||||||||
| 1,288,038 | ACE Securities Corp., Series 05-ASP1, Class A2C, 1 mo. LIBOR + .27%, 0.74%, due 09/25/35 | 785,703 | |||||||||||||
See accompanying notes to the financial statements.
8
GMO World Opportunity Overlay Fund
(A Series of GMO Trust)
Schedule of Investments — (Continued)
(showing percentage of total net assets)
February 28, 2009
| Par Value ($) | Description | Value ($) | |||||||||||||
| Residential Asset-Backed Securities (United States) — continued | |||||||||||||||
| 370,901 | ACE Securities Corp., Series 05-SDI, Class A1, 1 mo. LIBOR + .40%, 0.87%, due 11/25/50 | 275,950 | |||||||||||||
| 9,500,000 | ACE Securities Corp., Series 06-ASP5, Class A2C, 1 mo. LIBOR + .18%, 0.65%, due 10/25/36 | 2,280,000 | |||||||||||||
| 4,500,000 | ACE Securities Corp., Series 06-CW1, Class A2B, 1 mo. LIBOR + .10%, 0.57%, due 07/25/36 | 1,916,010 | |||||||||||||
| 12,100,000 | ACE Securities Corp., Series 06-HE2, Class A2C, 1 mo. LIBOR + .16%, 0.63%, due 05/25/36 | 4,456,551 | |||||||||||||
| 2,232,446 | ACE Securities Corp., Series 06-HE3, Class A2B, 1 mo. LIBOR + .09%, 0.56%, due 06/25/36 | 1,489,555 | |||||||||||||
| 1,079,191 | ACE Securities Corp., Series 06-SL1, Class A, 1 mo. LIBOR + .16%, 0.63%, due 09/25/35 | 121,290 | |||||||||||||
| 2,207,399 | ACE Securities Corp., Series 06-SL3, Class A1, 1 mo. LIBOR + .10%, 0.57%, due 06/25/36 | 154,518 | |||||||||||||
| 2,700,000 | ACE Securities Corp., Series 06-SL3, Class A2, 1 mo. LIBOR + .17%, 0.64%, due 06/25/36 | 101,871 | |||||||||||||
| 1,383,159 | ACE Securities Corp., Series 06-SL4, Class A1, 1 mo. LIBOR + .12%, 0.59%, due 09/25/36 | 138,233 | |||||||||||||
| 4,803,864 | ACE Securities Corp., Series 07-ASL1, Class A2, 1 mo. LIBOR + .17%, 0.64%, due 12/25/36 | 361,491 | |||||||||||||
| 2,963,095 | ACE Securities Corp., Series 07-WM1, Class A2A, 1 mo. LIBOR + .07%, 0.54%, due 11/25/36 | 1,549,136 | |||||||||||||
| 11,400,000 | Argent Securities, Inc., Series 06-M1, Class A2C, 1 mo. LIBOR + .15%, 0.62%, due 07/25/36 | 2,871,375 | |||||||||||||
| 10,800,000 | Argent Securities, Inc., Series 06-M2, Class A2B, 1 mo. LIBOR + .11%, 0.58%, due 09/25/36 | 4,428,000 | |||||||||||||
| 2,879,869 | Argent Securities, Inc., Series 06-W2, Class A2B, 1 mo. LIBOR + .19%, 0.66%, due 03/25/36 | 1,439,934 | |||||||||||||
| 2,300,000 | Argent Securities, Inc., Series 06-W5, Class A2C, 1 mo. LIBOR + .15%, 0.62%, due 06/25/36 | 1,558,250 | |||||||||||||
| 2,700,000 | Asset Backed Funding Certificates, Series 06-OPT2, Class A3B, 1 mo. LIBOR + .11%, 0.58%, due 10/25/36 | 2,357,100 | |||||||||||||
| 2,700,000 | Asset Backed Funding Certificates, Series 06-OPT2, Class A3C, 1 mo. LIBOR + .15%, 0.62%, due 10/25/36 | 1,272,240 | |||||||||||||
| 244,239 | Asset Backed Funding Certificates, Series 06-OPT3, Class A3A, 1 mo. LIBOR + .06%, 0.53%, due 11/25/36 | 225,799 | |||||||||||||
See accompanying notes to the financial statements.
9
GMO World Opportunity Overlay Fund
(A Series of GMO Trust)
Schedule of Investments — (Continued)
(showing percentage of total net assets)
February 28, 2009
| Par Value ($) | Description | Value ($) | |||||||||||||
| Residential Asset-Backed Securities (United States) — continued | |||||||||||||||
| 8,395,571 | Asset Backed Funding Certificates, Series 07-NC1, Class A1, 144A, 1 mo. LIBOR + .22%, 0.69%, due 05/25/37 | 5,655,256 | |||||||||||||
| 5,000,000 | Bayview Financial Acquisition Trust, Series 05-A, Class A1, 144A, 1 mo. LIBOR + .50%, 1.50%, due 02/28/40 | 2,754,688 | |||||||||||||
| 3,484,615 | Bear Stearns Asset Backed Securities, Inc., Series 07-AQ1, Class A1, 1 mo. LIBOR + .11%, 0.58%, due 11/25/36 | 2,265,000 | |||||||||||||
| 5,400,000 | Bear Stearns Asset Backed Securities, Inc., Series 07-AQ1, Class A2, 1 mo. LIBOR + .20%, 0.67%, due 11/25/36 | 1,080,000 | |||||||||||||
| 2,889,265 | Bear Stearns Mortgage Funding Trust, Series 07-SL2, Class 1A, 1 mo. LIBOR + .16%, 0.63%, due 02/25/37 | 216,695 | |||||||||||||
| 2,700,000 | Centex Home Equity, Series 06-A, Class AV3, 1 mo. LIBOR + .16%, 0.63%, due 06/25/36 | 1,836,540 | |||||||||||||
| 2,600,000 | Citigroup Mortgage Loan Trust, Inc., Series 06-HE3, Class A2C, 1 mo. LIBOR + .16%, 0.63%, due 12/25/36 | 676,000 | |||||||||||||
| 6,600,000 | Citigroup Mortgage Loan Trust, Inc., Series 06-WFH4, Class A3, 1 mo. LIBOR + .15%, 0.62%, due 11/25/36 | 3,880,800 | |||||||||||||
| 8,212,000 | Countrywide Asset-Backed Certificates, Series 06-BC3, Class 2A2, 1 mo. LIBOR + .14%, 0.61%, due 02/25/37 | 5,183,414 | |||||||||||||
| 2,642,681 | Countrywide Asset-Backed Certificates, Series 06-BC5, Class 2A1, 1 mo. LIBOR + .08%, 0.55%, due 03/25/37 | 2,423,338 | |||||||||||||
| 1,168,038 | Credit-Based Asset Servicing & Securitization, Series 06-RP1, Class A1, 144A, 1 mo. LIBOR + .11%, 0.58%, due 04/25/36 | 984,985 | |||||||||||||
| 4,400,000 | Fremont Home Loan Trust, Series 06-B, Class 2A3, 1 mo. LIBOR + .16%, 0.63%, due 08/25/36 | 1,408,000 | |||||||||||||
| 1,373,484 | Household Home Equity Loan Trust, Series 05-2, Class A2, 1 mo. LIBOR + .31%, 0.78%, due 01/20/35 | 843,834 | |||||||||||||
| 568,954 | Household Home Equity Loan Trust, Series 05-3, Class A2, 1 mo. LIBOR + .29%, 0.76%, due 01/20/35 | 353,551 | |||||||||||||
| 6,800,000 | J.P. Morgan Mortgage Acquisition Corp., Series 06-WMC4, Class A3, 1 mo. LIBOR + .12%, 0.59%, due 12/25/36 | 2,312,000 | |||||||||||||
| 690,358 | Master Asset-Backed Securities Trust, Series 05-FRE1, Class A4, 1 mo. LIBOR + .25%, 0.72%, due 10/25/35 | 535,027 | |||||||||||||
| 4,500,000 | Master Asset-Backed Securities Trust, Series 06-FRE2, Class A4, 1 mo. LIBOR + .15%, 0.62%, due 03/25/36 | 1,800,000 | |||||||||||||
| 2,700,000 | Master Asset-Backed Securities Trust, Series 06-HE2, Class A3, 1 mo. LIBOR + .15%, 0.62%, due 06/25/36 | 715,500 | |||||||||||||
See accompanying notes to the financial statements.
10
GMO World Opportunity Overlay Fund
(A Series of GMO Trust)
Schedule of Investments — (Continued)
(showing percentage of total net assets)
February 28, 2009
| Par Value ($) | Description | Value ($) | |||||||||||||
| Residential Asset-Backed Securities (United States) — continued | |||||||||||||||
| 6,160,000 | Master Asset-Backed Securities Trust, Series 06-HE3, Class A3, 1 mo. LIBOR + .15%, 0.62%, due 08/25/36 | 1,540,000 | |||||||||||||
| 3,100,000 | Master Asset-Backed Securities Trust, Series 06-NC3, Class A4, 1 mo. LIBOR + .16%, 0.63%, due 10/25/36 | 821,500 | |||||||||||||
| 1,421,296 | Master Second Lien Trust, Series 06-1, Class A, 1 mo. LIBOR + .16%, 0.63%, due 03/25/36 | 156,343 | |||||||||||||
| 3,272,122 | Merrill Lynch Mortgage Trust, Series 06-SD1, Class A, 1 mo. LIBOR + .28%, 0.75%, due 01/25/47 | 2,360,145 | |||||||||||||
| 2,400,000 | Morgan Stanley IXIS Real Estate Capital Trust, Series 06-2, Class A3, 1 mo. LIBOR + .15%, 0.62%, due 11/25/36 | 840,000 | |||||||||||||
| 9,000,000 | Nationstar Home Equity Loan Trust, Series 06-B, Class AV3, 1 mo. LIBOR + .17%, 0.64%, due 09/25/36 | 3,993,750 | |||||||||||||
| 9,100,000 | Nomura Home Equity Loan, Inc., Series 06-HE3, Class 2A3, 1 mo. LIBOR + .15%, 0.62%, due 07/25/36 | 3,392,594 | |||||||||||||
| 2,609,992 | People's Choice Home Loan Securities Trust, Series 05-4, Class 1A2, 1 mo. LIBOR + .26%, 0.73%, due 12/25/35 | 1,957,494 | |||||||||||||
| 406,828 | Residential Asset Mortgage Products, Inc., Series 05-RS4, Class A3, 1 mo. LIBOR + .23%, 0.70%, due 04/25/35 | 370,214 | |||||||||||||
| 6,600,000 | Saxon Asset Securities Trust, Series 06-3, Class A2, 1 mo. LIBOR + .11%, 0.58%, due 10/25/46 | 4,884,000 | |||||||||||||
| 9,200,000 | Securitized Asset-Backed Receivables LLC Trust, Series 06-HE1, Class A2C, 1 mo. LIBOR + .16%, 0.63%, due 07/25/36 | 2,760,000 | |||||||||||||
| 2,758,071 | Security National Mortgage Loan Trust, Series 06-2A, Class A1, 144A, 1 mo. LIBOR + .29%, 0.76%, due 10/25/36 | 2,516,740 | |||||||||||||
| 711,647 | SG Mortgage Securities Trust, Series 05-OPT1, Class A2, 1 mo. LIBOR + .26%, 0.73%, due 10/25/35 | 587,108 | |||||||||||||
| 5,012,958 | Soundview Home Equity Loan Trust, Series 07-NS1, Class A1, 1 mo. LIBOR + .12%, 0.59%, due 01/25/37 | 4,143,523 | |||||||||||||
| 3,700,000 | Specialty Underwriting & Residential Finance, Series 06-BC3, Class A2C, 1 mo. LIBOR + .15%, 0.62%, due 06/25/37 | 1,686,969 | |||||||||||||
| 2,700,000 | Structured Asset Investment Loan Trust, Series 06-1, Class A3, 1 mo. LIBOR + .20%, 0.67%, due 01/25/36 | 945,000 | |||||||||||||
| 1,191,979 | Structured Asset Securities Corp., Series 05-S6, Class A2, 1 mo. LIBOR + .29%, 0.76%, due 11/25/35 | 190,717 | |||||||||||||
| Total Residential Asset-Backed Securities (United States) | 98,534,440 | ||||||||||||||
See accompanying notes to the financial statements.
11
GMO World Opportunity Overlay Fund
(A Series of GMO Trust)
Schedule of Investments — (Continued)
(showing percentage of total net assets)
February 28, 2009
| Par Value ($) | Description | Value ($) | |||||||||||||
| Residential Mortgage-Backed Securities (Australian) — 2.4% | |||||||||||||||
| 1,138,221 | Australian Mortgage Securities II, Series G3, Class A1A, 3 mo. LIBOR + .21%, 1.56%, due 01/10/35 | 996,296 | |||||||||||||
| 3,011,603 | Crusade Global Trust, Series 06-1, Class A1, 144A, 3 mo. LIBOR + .06%, 1.20%, due 07/20/38 | 2,575,815 | |||||||||||||
| 8,812,506 | Interstar Millennium Trust, Series 04-2G, Class A, 3 mo. LIBOR + .20%, 2.20%, due 03/14/36 | 7,159,015 | |||||||||||||
| 3,403,231 | Interstar Millennium Trust, Series 05-1G, Class A, 3 mo. LIBOR + .12%, 2.31%, due 12/08/36 | 2,620,522 | |||||||||||||
| 1,896,101 | Medallion Trust, Series 05-1G, Class A1, 3 mo. LIBOR + .08%, 1.32%, due 05/10/36 | 1,643,314 | |||||||||||||
| 4,927,140 | Puma Finance Ltd., Series G5, Class A1, 144A, 3 mo. LIBOR + .07%, 1.32%, due 02/21/38 | 4,023,503 | |||||||||||||
| Total Residential Mortgage-Backed Securities (Australian) | 19,018,465 | ||||||||||||||
| Residential Mortgage-Backed Securities (European) — 5.1% | |||||||||||||||
| 9,400,000 | Aire Valley Mortgages, Series 06-1A, Class 1A, 144A, 3 mo. LIBOR + .11%, 1.64%, due 09/20/66 | 8,542,720 | |||||||||||||
| 5,800,000 | Brunel Residential Mortgages, Series 07-1A, Class A4C, 144A, 3 mo. LIBOR + .10%, 1.36%, due 01/13/39 | 4,682,340 | |||||||||||||
| 872,957 | Gracechurch Mortgage Funding Plc, Series 1A, Class A2B, 144A, 3 mo. LIBOR + .07%, 1.42%, due 10/11/41 | 803,095 | |||||||||||||
| 4,799,302 | Granite Master Issuer Plc, Series 06-3, Class A3, 1 mo. LIBOR + .04%, 0.51%, due 12/20/54 | 3,109,947 | |||||||||||||
| 9,349,325 | Kildare Securities Ltd., Series 07-1A, Class A2, 144A, 3 mo. LIBOR + .06%, 2.25%, due 12/10/43 | 6,933,366 | |||||||||||||
| 1,025,766 | Leek Finance Plc, Series 15A, Class AB, 144A, 3 mo. LIBOR + .14%, 1.67%, due 03/21/37 | 882,159 | |||||||||||||
| 3,386,250 | Leek Finance Plc, Series 16A, Class A2B, 144A, 3 mo. LIBOR + .16%, 1.69%, due 09/21/37 | 2,865,478 | |||||||||||||
| 2,400,000 | Mound Financing Plc, Series 5A, Class 2A, 144A, 3 mo. LIBOR + .04%, 1.28%, due 05/08/16 | 2,262,000 | |||||||||||||
| 3,039,157 | Paragon Mortgages Plc, Series 12A, Class A2C, 144A, 3 mo. LIBOR + .11%, 1.35%, due 11/15/38 | 1,789,699 | |||||||||||||
| 2,944,619 | Paragon Mortgages Plc, Series 14A, Class A2C, 144A, 3 mo. LIBOR + .10%, 2.10%, due 09/15/39 | 2,569,415 | |||||||||||||
| 2,700,000 | Permanent Master Issuer Plc, Series 06-1, Class 5A, 3 mo. LIBOR + .11%, 1.20%, due 07/15/33 | 2,227,500 | |||||||||||||
See accompanying notes to the financial statements.
12
GMO World Opportunity Overlay Fund
(A Series of GMO Trust)
Schedule of Investments — (Continued)
(showing percentage of total net assets)
February 28, 2009
| Par Value ($) | Description | Value ($) | |||||||||||||
| Residential Mortgage-Backed Securities (European) — continued | |||||||||||||||
| 4,500,000 | Permanent Master Issuer Plc, Series 07-1, Class 4A, 3 mo. LIBOR + .08%, 1.17%, due 10/15/33 | 3,681,675 | |||||||||||||
| 79,314 | RMAC Securities Plc, Series 06-NS4A, Class A1B, 144A, 3 mo. LIBOR + .07%, 2.17%, due 06/12/25 | 79,116 | |||||||||||||
| Total Residential Mortgage-Backed Securities (European) | 40,428,510 | ||||||||||||||
| Residential Mortgage-Backed Securities (United States) — 0.0% | |||||||||||||||
| 494,464 | GreenPoint Mortgage Funding Trust, Series 05-HE4, Class 2A3C, 1 mo. LIBOR + .25%, 0.72%, due 07/25/30 | 321,093 | |||||||||||||
| Student Loans — 2.9% | |||||||||||||||
| 1,392,508 | College Loan Corp. Trust, Series 04-1, Class A2, 3 mo. LIBOR + .11%, 1.27%, due 04/25/16 | 1,355,610 | |||||||||||||
| 5,904,000 | College Loan Corp. Trust, Series 07-1, Class A1, 3 mo. LIBOR + .01%, 1.17%, due 01/25/23 | 5,733,965 | |||||||||||||
| 3,100,000 | College Loan Corp. Trust, Series 07-2, Class A1, 3 mo. LIBOR + .25%, 1.41%, due 01/25/24 | 2,945,000 | |||||||||||||
| 933,262 | Goal Capital Funding Trust, Series 06-1, Class A1, 3 mo. LIBOR, 1.25%, due 08/25/20 | 919,450 | |||||||||||||
| 705,491 | Keycorp Student Loan Trust, Series 05-A, Class 2A1, 3 mo. LIBOR + .05%, 1.52%, due 09/27/21 | 682,901 | |||||||||||||
| 1,287,858 | Montana Higher Education Student Assistance Corp., Series 05-1, Class A, 3 mo. LIBOR + .04%, 1.57%, due 06/20/15 | 1,240,207 | |||||||||||||
| 6,013,597 | National Collegiate Student Loan Trust, Series 05-2, Class A2, 1 mo. LIBOR + .15%, 0.62%, due 02/25/26 | 5,238,023 | |||||||||||||
| 677,107 | National Collegiate Student Loan Trust, Series 06-1, Class A2, 1 mo. LIBOR + .14%, 0.61%, due 08/25/23 | 609,396 | |||||||||||||
| 2,257,966 | National Collegiate Student Loan Trust, Series 06-A, Class A1, 144A, 1 mo. LIBOR + .08%, 0.55%, due 08/26/19 | 2,077,328 | |||||||||||||
| 2,194,359 | SLC Student Loan Trust, Series 06-A, Class A2, 3 mo. LIBOR + .03%, 1.12%, due 10/15/15 | 2,145,071 | |||||||||||||
| Total Student Loans | 22,946,951 | ||||||||||||||
| Total Asset-Backed Securities | 606,666,299 | ||||||||||||||
See accompanying notes to the financial statements.
13
GMO World Opportunity Overlay Fund
(A Series of GMO Trust)
Schedule of Investments — (Continued)
(showing percentage of total net assets)
February 28, 2009
| Principal Amount | Description | Value ($) | |||||||||||||
| U.S. Government — 7.9% | |||||||||||||||
| 62,999,310 | U.S. Treasury Inflation Indexed Bond, 0.88%, due 04/15/10 (a) (b) | 62,152,725 | |||||||||||||
| U.S. Government Agency — 0.1% | |||||||||||||||
| 800,000 | U.S. Department of Transportation, 144A, 6.00%, due 12/07/21 | 785,416 | |||||||||||||
| TOTAL DEBT OBLIGATIONS (COST $941,918,906) | 669,604,440 | ||||||||||||||
| OPTIONS PURCHASED — 9.9% | |||||||||||||||
| Currency Options — 3.8% | |||||||||||||||
| USD | 700,000,000 | USD Call/JPY Put, Expires 09/05/13, Strike 119.00 | 6,637,400 | ||||||||||||
| USD | 700,000,000 | USD Call/JPY Put, Expires 09/05/13, Strike 119.00 | 6,637,400 | ||||||||||||
| USD | 700,000,000 | USD Call/JPY Put, Expires 09/10/13, Strike 119.00 | 6,647,900 | ||||||||||||
| USD | 700,000,000 | USD Call/JPY Put, Expires 09/12/13, Strike 119.00 | 6,639,500 | ||||||||||||
| USD | 350,000,000 | USD Call/JPY Put, Expires 09/24/13, Strike 119.00 | 3,326,750 | ||||||||||||
| Total Currency Options | 29,888,950 | ||||||||||||||
| Options on Interest Rate Swaps — 4.2% | |||||||||||||||
| EUR | 600,000,000 | EUR Swaption Put, Expires 03/12/09, Strike 1.71% | 428,246 | ||||||||||||
| EUR | 150,000,000 | EUR Swaption Call, Expires 02/22/10, Strike 3.95% | 2,800,713 | ||||||||||||
| EUR | 500,000,000 | EUR Swaption Call, Expires 02/23/10, Strike 1.00% | 29,158 | ||||||||||||
| EUR | 600,000,000 | EUR Swaption Put, Expires 02/03/11, Strike 3.39% | 7,391,236 | ||||||||||||
| GBP | 75,000,000 | GBP Swaption Call, Expires 05/06/09, Strike 3.79% | 1,472,043 | ||||||||||||
| GBP | 75,000,000 | GBP Swaption Call, Expires 05/06/09, Strike 3.39% | 254,682 | ||||||||||||
| GBP | 14,000,000 | GBP Swaption Call, Expires 02/28/11, Strike 5.17% | 1,474,820 | ||||||||||||
| GBP | 14,000,000 | GBP Swaption Put, Expires 02/28/11, Strike 5.17% | 368,620 | ||||||||||||
| GBP | 14,000,000 | GBP Swaption Put, Expires 03/03/11, Strike 5.03% | 426,482 | ||||||||||||
| GBP | 14,000,000 | GBP Swaption Call, Expires 03/03/11, Strike 5.03% | 1,314,842 | ||||||||||||
| GBP | 28,000,000 | GBP Swaption Put, Expires 03/14/11, Strike 4.96% | 925,759 | ||||||||||||
| GBP | 28,000,000 | GBP Swaption Call, Expires 03/14/11, Strike 4.96% | 2,464,775 | ||||||||||||
| GBP | 35,000,000 | GBP Swaption Call, Expires 03/21/11, Strike 4.92% | 2,952,046 | ||||||||||||
| GBP | 35,000,000 | GBP Swaption Put, Expires 03/21/11, Strike 4.92% | 1,219,029 | ||||||||||||
| USD | 64,000,000 | USD Swaption Straddle, Expires 04/10/18, Strike TBD | 3,171,776 | ||||||||||||
| USD | 64,000,000 | USD Swaption Straddle, Expires 04/23/18, Strike TBD | 3,166,720 | ||||||||||||
See accompanying notes to the financial statements.
14
GMO World Opportunity Overlay Fund
(A Series of GMO Trust)
Schedule of Investments — (Continued)
(showing percentage of total net assets)
February 28, 2009
| Shares /Principal Amount | Description | Value ($) | |||||||||||||
| Options on Interest Rate Swaps — continued | |||||||||||||||
| USD | 64,000,000 | USD Swaption Straddle, Expires 05/01/18, Strike TBD | 3,161,408 | ||||||||||||
| Total Options on Interest Rate Swaps | 33,022,355 | ||||||||||||||
| Options on Interest Rates — 1.9% | |||||||||||||||
| GBP | 150,000,000 | Floor on 3 Month GBP LIBOR Call, Expires 09/13/09, Strike 6.40% | 6,645,131 | ||||||||||||
| GBP | 150,000,000 | Floor on 3 Month GBP LIBOR Call, Expires 09/13/09, Strike 5.40% | 5,053,048 | ||||||||||||
| USD | 300,000,000 | USD 3 Month LIBOR Cap Call, Expires 04/15/10, Strike 2.64% | 90,900 | ||||||||||||
| USD | 300,000,000 | USD 3 Month LIBOR Floor Call, Expires 04/15/10, Strike 2.64% | 3,777,600 | ||||||||||||
| Total Options on Interest Rates | 15,566,679 | ||||||||||||||
| TOTAL OPTIONS PURCHASED (COST $51,279,221) | 78,477,984 | ||||||||||||||
| SHORT-TERM INVESTMENTS — 8.0% | |||||||||||||||
| Money Market Funds — 8.0% | |||||||||||||||
| 38,819,421 | State Street Institutional Liquid Reserves Fund-Institutional Class | 38,819,421 | |||||||||||||
| 24,072,590 | State Street Institutional Treasury Plus Money Market Fund-Institutional Class | 24,072,590 | |||||||||||||
| TOTAL SHORT-TERM INVESTMENTS (COST $62,892,011) | 62,892,011 | ||||||||||||||
| TOTAL INVESTMENTS — 102.6% (Cost $1,056,090,138) | 810,974,435 | ||||||||||||||
| Other Assets and Liabilities (net) — (2.6%) | (20,494,750 | ) | |||||||||||||
| TOTAL NET ASSETS — 100.0% | $ | 790,479,685 | |||||||||||||
See accompanying notes to the financial statements.
15
GMO World Opportunity Overlay Fund
(A Series of GMO Trust)
Schedule of Investments — (Continued)
February 28, 2009
A summary of outstanding financial instruments at February 28, 2009 is as follows:
Written Options
A summary of open written option contracts for the Fund at February 28, 2009 is as follows:
| Notional Amount | Expiration Date | Description | Premiums | Market Value | |||||||||||||||||||||||
| Call | 600,000,000 | 2/3/2011 | EUR | Interest Rate Swaption, | |||||||||||||||||||||||
| Strike 2.39% | $ | (1,787,928 | ) | $ | (1,862,071 | ) | |||||||||||||||||||||
| Call | 150,000,000 | 5/6/2009 | GBP | Interest Rate Swaption, Strike 3.54% | (3,330,000 | ) | (1,372,833 | ) | |||||||||||||||||||
| Call | 30,000,000 | 5/18/2009 | GBP | Interest Rate Swaption, Strike 3.55% | (682,704 | ) | (315,410 | ) | |||||||||||||||||||
| Call | 300,000,000 | 9/13/2009 | GBP Floor on 3 Month GBP LIBOR, | Strike 5.90% | (1,167,900 | ) | (11,698,179 | ) | |||||||||||||||||||
| Put | 300,000,000 | 4/14/2009 | USD | Interest Rate Swaption, Strike 2.69% | (1,395,000 | ) | (2,700 | ) | |||||||||||||||||||
| Call | 300,000,000 | 4/14/2009 | USD | Interest Rate Swaption, Strike 2.69% | (1,395,000 | ) | (3,710,700 | ) | |||||||||||||||||||
| Call | 55,000,000 | 10/3/2011 | USD | Interest Rate Swaption, Strike 4.88% | (3,025,000 | ) | (5,946,985 | ) | |||||||||||||||||||
| Put | 120,000,000 | 10/3/2011 | USD | Interest Rate Swaption, Strike 4.88% | (6,600,000 | ) | (4,599,000 | ) | |||||||||||||||||||
| $ | (19,383,532 | ) | $ | (29,507,878 | ) | ||||||||||||||||||||||
See accompanying notes to the financial statements.
16
GMO World Opportunity Overlay Fund
(A Series of GMO Trust)
Schedule of Investments — (Continued)
February 28, 2009
Swap Agreements
Credit Default Swaps
| Notional Amount | Expiration Date | Counterparty | Receiveu (Pay) | Annual Premium | Implied Credit Spread (1) | Deliverable on Default | Maximum Potential Amount of Future Payments by the Fund Under the Contract (2) | Market Value | |||||||||||||||||||||||||||||||||||
| 13,000,000 | USD | 9/20/2010 | Morgan Stanley | Receive | 0.40 | % | 17.76 | % | Eagle | 13,000,000 | USD | $ | (3,134,275 | ) | |||||||||||||||||||||||||||||
| Creek | |||||||||||||||||||||||||||||||||||||||||||
| CDO | |||||||||||||||||||||||||||||||||||||||||||
| 50,000,000 | USD | 12/20/2012 | Morgan Stanley | (Pay) | 1.93 | % | 6.22 | % | Reference security within CDX index | N/A | 6,354,725 | ||||||||||||||||||||||||||||||||
| 97,228,457 | USD | 12/20/2012 | Morgan Stanley | Receive | 0.71 | % | 0.58 | % | Reference security within CDX index | 97,228,457 | USD | 589,446 | |||||||||||||||||||||||||||||||
| 252,793,989 | USD | 12/20/2012 | Morgan Stanley | Receive | 0.71 | % | 0.58 | % | Reference security within CDX Index | 252,793,989 | USD | 1,532,560 | |||||||||||||||||||||||||||||||
| 100,000,000 | USD | 12/20/2012 | Morgan Stanley | (Pay) | 1.20 | % | 1.19 | % | Referenc security within CDX Index | N/A | (276,095 | ) | |||||||||||||||||||||||||||||||
| 7,000,000 | USD | 3/20/2013 | Morgan Stanley | Receive | 0.25 | % | 17.49 | % | MS Synthetic 2006-1 | 7,000,000 | USD | (3,447,436 | ) | ||||||||||||||||||||||||||||||
| $ | 1,618,925 | ||||||||||||||||||||||||||||||||||||||||||
| Premiums to (Pay) Receive | $ | — | |||||||||||||||||||||||||||||||||||||||||
u Receive - Fund receives premium and sells credit protection.
(Pay) - Fund pays premium and buys credit protection.
See accompanying notes to the financial statements.
17
GMO World Opportunity Overlay Fund
(A Series of GMO Trust)
Schedule of Investments — (Continued)
February 28, 2009
(1) Implied credit spreads, represented in absolute terms, utilized in determining the market value of credit default swap agreements on the reference security, as of February 28, 2009, serve as an indicator of the current status of the payment/performance risk and reflect the likelihood or risk of default for the credit derivative. The implied credit spread of a particular referenced entity reflects the cost of buying/selling protection and may include upfront payments required to be made to enter into the agreement. Wider credit spreads represent a deterioration of the referenced entity's credit soundness and a greater likelihood or risk of default or other credit event occurring as defined under the terms of the agreement.
(2) The maximum potential amount the Fund could be required to make as a seller of credit protection if a credit event occurs as defined under the terms of that particular swap agreement.
Interest Rate Swaps
| Notional Amount | Expiration Date | Counterparty | Receive (Pay)# | Fixed Rate | Variable Rate | Market Value | |||||||||||||||||||||||||
| 55,000,000 | USD11/15/2021 | JP Morgan Chase Bank | (Pay) | 0.00 | % | 3 month LIBOR | $ | (8,769,217 | ) | ||||||||||||||||||||||
| 65,000,000 | USD5/15/2022 | JP Morgan Chase Bank | (Pay) | 0.00 | % | 3 month LIBOR | (5,174,335 | ) | |||||||||||||||||||||||
| 105,000,000 | USD8/15/2022 | JP Morgan Chase Bank | (Pay) | 0.00 | % | 3 month LIBOR | (8,365,991 | ) | |||||||||||||||||||||||
| 153,000,000 | AUD4/16/2023 | Deutsche Bank AG | Receive | 6.36 | % | 6 month AUD BBSW | 2,969,251 | ||||||||||||||||||||||||
| 82,200,000 | AUD4/17/2038 | Deutsche Bank AG | (Pay) | 4.34 | % | 6 month AUD BBSW | (2,787,465 | ) | |||||||||||||||||||||||
| 25,000,000 | GBP12/7/2046 | Merrill Lynch | (Pay) | 4.36 | % | 6 month GBP LIBOR | (3,264,671 | ) | |||||||||||||||||||||||
| $ | (25,392,428 | ) | |||||||||||||||||||||||||||||
| Premiums to (Pay) Receive | $ | 2,001,485 | |||||||||||||||||||||||||||||
# (Pay) - Fund pays fixed rate and receives variable rate.
Receive - Fund receives fixed rate and pays variable rate.
Total Return Swaps
| Notional Amount | Expiration Date | Counterparty | Pay | Receive | Market Value | ||||||||||||||||||||||
| 65,000,000 | USD | 3/11/2009 | JP Morgan | 2.65 | % | Return on Treasury | |||||||||||||||||||||
| Chase Bank | Coupon STRIP | $ | 1,683,409 | ||||||||||||||||||||||||
| 105,000,000 | USD | 3/11/2009 | JP Morgan Chase Bank | 2.65 | % | Return on Treasury Coupon STRIP | 2,455,833 | ||||||||||||||||||||
| 55,000,000 | USD | 4/20/2009 | JP Morgan Chase Bank | 2.35 | % | Return on Treasury Principal STRIP | 3,689,076 | ||||||||||||||||||||
| 25,000,000 | GBP | 5/8/2009 | Barclays Bank PLC | 1.72 | % | Return on United Kingdom Treasury 2046 Bonds | (134,369 | ) | |||||||||||||||||||
| $ | 7,693,949 | ||||||||||||||||||||||||||
| Premiums to (Pay) Receive | $ | — | |||||||||||||||||||||||||
See accompanying notes to the financial statements.
18
GMO World Opportunity Overlay Fund
(A Series of GMO Trust)
Schedule of Investments — (Continued)
February 28, 2009
As of February 28, 2009, for the swap contracts held, the Fund had sufficient cash and/or securities to cover any commitments or margin requirements of the relevant broker or exchange.
Notes to Schedule of Investments:
144A - Securities exempt from registration under Rule 144A of the Securities Act of 1933. These securities may be resold in transactions exempt from registration, normally to qualified institutional investors.
AMBAC - Insured as to the payment of principal and interest by AMBAC Assurance Corporation.
BBSW - Bank Bill Swap Reference Rate
CDO - Collateralized Debt Obligation
CMBS - Collateralized Mortgage Backed Security
FGIC - Insured as to the payment of principal and interest by Financial Guaranty Insurance Corporation.
FSA - Insured as to the payment of principal and interest by Financial Security Assurance.
GBP LIBOR - London Interbank Offered Rate denominated in British Pounds.
LIBOR - London Interbank Offered Rate
MBIA - Insured as to the payment of principal and interest by MBIA Insurance Corp.
RMAC - Residential Mortgage Acceptance Corp.
The rates shown on variable rate notes are the current interest rates at February 28, 2009, which are subject to change based on the terms of the security.
XL - Insured as to the payment of principal and interest by XL Capital Assurance.
(a) Indexed security in which price and/or coupon is linked to the prices of a specific instrument or financial statistic (Note 2).
(b) All or a portion of this security has been segregated to cover collateral requirements on open swap contracts (Note 2).
Currency Abbreviations:
AUD - Australian Dollar
EUR - Euro
GBP - British Pound
JPY - Japanese Yen
USD - United States Dollar
See accompanying notes to the financial statements.
19
GMO World Opportunity Overlay Fund
(A Series of GMO Trust)
Statement of Assets and Liabilities — February 28, 2009
| Assets: | |||||||
| Investments, at value (cost $1,056,090,138) (Note 2) | $ | 810,974,435 | |||||
| Cash | 29,321,429 | ||||||
| Dividends and interest receivable | 942,280 | ||||||
| Interest receivable for open swap contracts | 4,225,867 | ||||||
| Receivable for open swap contracts (Note 2) | 19,274,300 | ||||||
| Receivable for expenses reimbursed by Manager (Note 3) | 110,015 | ||||||
| Total assets | 864,848,326 | ||||||
| Liabilities: | |||||||
| Payable for investments purchased | 9,187,200 | ||||||
| Payable to affiliate for (Note 3): | |||||||
| Trustees and Chief Compliance Officer of GMO Trust fees | 2,342 | ||||||
| Payable for open swap contracts (Note 2) | 35,353,854 | ||||||
| Written options outstanding, at value (premiums $19,383,532) (Note 2) | 29,507,878 | ||||||
| Miscellaneous payable | 146,504 | ||||||
| Accrued expenses | 170,863 | ||||||
| Total liabilities | 74,368,641 | ||||||
| Net assets | $ | 790,479,685 | |||||
| Shares outstanding: | 43,086,310 | ||||||
| Net asset value per share: | $ | 18.35 | |||||
See accompanying notes to the financial statements.
20
GMO World Opportunity Overlay Fund
(A Series of GMO Trust)
Statement of Operations — Year Ended February 28, 2009
| Investment Income: | |||||||
| Interest | $ | 37,460,971 | |||||
| Dividends | 877,947 | ||||||
| Total investment income | 38,338,918 | ||||||
| Expenses: | |||||||
| Custodian, fund accounting agent and transfer agent fees | 164,218 | ||||||
| Audit and tax fees | 111,345 | ||||||
| Legal fees | 239,364 | ||||||
| Trustees fees and related expenses (Note 3) | 22,090 | ||||||
| Miscellaneous | 14,303 | ||||||
| Total expenses | 551,320 | ||||||
| Fees and expenses reimbursed by Manager (Note 3) | (492,100 | ) | |||||
| Net expenses | 59,220 | ||||||
| Net investment income (loss) | 38,279,698 | ||||||
| Realized and unrealized gain (loss): | |||||||
| Net realized gain (loss) on: | |||||||
| Investments | (67,148,445 | ) | |||||
| Closed futures contracts | 8,349,319 | ||||||
| Closed swap contracts | (100,245,488 | ) | |||||
| Written options | (65,671,464 | ) | |||||
| Foreign currency, forward contracts and foreign currency related transactions | 94,713 | ||||||
| Net realized gain (loss) | (224,621,365 | ) | |||||
| Change in net unrealized appreciation (depreciation) on: | |||||||
| Investments | (142,109,350 | ) | |||||
| Open futures contracts | 436,136 | ||||||
| Open swap contracts | (9,609,116 | ) | |||||
| Written options | (9,731,267 | ) | |||||
| Foreign currency, forward contracts and foreign currency related transactions | 178,438 | ||||||
| Net unrealized gain (loss) | (160,835,159 | ) | |||||
| Net realized and unrealized gain (loss) | (385,456,524 | ) | |||||
| Net increase (decrease) in net assets resulting from operations | $ | (347,176,826 | ) | ||||
See accompanying notes to the financial statements.
21
GMO World Opportunity Overlay Fund
(A Series of GMO Trust)
Statement of Changes in Net Assets
| Year Ended February 28, 2009 | Year Ended February 29, 2008 | ||||||||||
| Increase (decrease) in net assets: | |||||||||||
| Operations: | |||||||||||
| Net investment income (loss) | $ | 38,279,698 | $ | 84,404,733 | |||||||
| Net realized gain (loss) | (224,621,365 | ) | 398,466 | ||||||||
| Change in net unrealized appreciation (depreciation) | (160,835,159 | ) | (110,689,866 | ) | |||||||
| Net increase (decrease) in net assets from operations | (347,176,826 | ) | (25,886,667 | ) | |||||||
| Net share transactions (Note 7): | (340,951,905 | ) | (246,005,000 | ) | |||||||
| Redemption fees (Notes 2 and 7): | 432,682 | — | |||||||||
| Total increase (decrease) in net assets resulting from net share transactions and redemption fees | (340,519,223 | ) | (246,005,000 | ) | |||||||
| Total increase (decrease) in net assets | (687,696,049 | ) | (271,891,667 | ) | |||||||
| Net assets: | |||||||||||
| Beginning of period | 1,478,175,734 | 1,750,067,401 | |||||||||
| End of period | $ | 790,479,685 | $ | 1,478,175,734 | |||||||
See accompanying notes to the financial statements.
22
GMO World Opportunity Overlay Fund
(A Series of GMO Trust)
Financial Highlights
(For a share outstanding throughout each period)
| Year Ended February 28/29, | |||||||||||||||||||||||
| 2009 | 2008 | 2007 | 2006 | 2005(a) | |||||||||||||||||||
| Net asset value, beginning of period | $ | 25.68 | $ | 25.99 | $ | 25.23 | $ | 25.17 | $ | 25.00 | |||||||||||||
| Income (loss) from investment operations: | |||||||||||||||||||||||
| Net investment income (loss)† | 0.76 | 1.41 | 1.36 | 0.96 | 0.15 | ||||||||||||||||||
| Net realized and unrealized gain (loss) | (8.09 | ) | (1.72 | ) | (0.60 | ) | (0.90 | ) | 0.02 | ||||||||||||||
| Total from investment operations | (7.33 | ) | (0.31 | ) | 0.76 | 0.06 | 0.17 | ||||||||||||||||
| Net asset value, end of period | $ | 18.35 | $ | 25.68 | $ | 25.99 | $ | 25.23 | $ | 25.17 | |||||||||||||
| Total Return(b) | (28.54 | )% | (1.19 | )% | 3.01 | % | 0.24 | % | 0.68 | %** | |||||||||||||
| Ratios/Supplemental Data: | |||||||||||||||||||||||
| Net assets, end of period (000's) | $ | 790,480 | $ | 1,478,176 | $ | 1,750,067 | $ | 1,012,277 | $ | 582,279 | |||||||||||||
| Net operating expenses to average daily net assets | 0.00 | %(c) | 0.00 | %(c) | 0.00 | %(c) | 0.00 | %(c) | 0.01 | %* | |||||||||||||
| Interest expense to average daily net assets | — | 0.07 | % | 0.00 | %(c) | — | — | ||||||||||||||||
| Total net expenses to average daily net assets | 0.00 | %(c) | 0.07 | % | 0.00 | %(c) | 0.00 | %(c) | 0.01 | %* | |||||||||||||
| Net investment income to average daily net assets | 3.19 | % | 5.38 | % | 5.36 | % | 3.84 | % | 2.21 | %* | |||||||||||||
| Portfolio turnover rate | 59 | % | 41 | % | 93 | % | 31 | % | 8 | %** | |||||||||||||
| Fees and expenses reimbursed by the Manager to average daily net assets: | 0.04 | % | 0.02 | % | 0.03 | % | 0.03 | % | 0.06 | %* | |||||||||||||
| Redemption fees consisted of the following per share amounts:† | $ | 0.01 | — | — | — | — | |||||||||||||||||
(a) Period from November 22, 2004 (commencement of operations) through February 28, 2005.
(b) The total returns would have been lower had certain expenses not been reimbursed during the periods shown. Calculation excludes redemption fees which are borne by the shareholder.
(c) Ratio is less than 0.01%.
† Calculated using average shares outstanding throughout the period.
* Annualized.
** Not annualized.
See accompanying notes to financial statements.
23
GMO World Opportunity Overlay Fund
(A Series of GMO Trust)
Notes to Financial Statements
February 28, 2009
1. Organization
GMO World Opportunity Overlay Fund (the "Fund") is a series of GMO Trust (the "Trust"). The Fund is registered under the Investment Company Act of 1940, as amended, as an open-end, non-diversified management investment company. The Fund is advised and managed by Grantham, Mayo, Van Otterloo & Co. LLC (the "Manager" or "GMO"). The Trust was established as a Massachusetts business trust under the laws of The Commonwealth of Massachusetts on June 24, 1985. The Declaration of Trust permits the Trustees of the Trust ("Trustees") to create an unlimited number of series of shares ("Funds") and to subdivide Funds into classes.
The Fund seeks total return greater than that of the JPMorgan U.S. 3 Month Cash Index. The Fund's investment program has two principal components. One component of the Fund's investment program involves the use of derivatives, primarily interest rate swap contracts and/or futures contracts, to seek to exploit misvaluations in world interest rates and to add value relative to the JPMorgan U.S. 3 Month Cash Index. The other component of the Fund's investment program involves making direct investments primarily in high quality U.S. and foreign adjustable rate fixed income securities with low volatility (although market changes may indirectly result in volatility), some of which have been downgraded. The Fund may also, from time to time, make tactical allocations to seek to add value to the Fund.
The Fund directly invests in asset-backed securities with contractual cash flows, such as collateralized mortgage obligations and commercial mortgage-backed securities, including securities backed by sub-prime mortgage loans, credit card receivables and auto loan receivables. The value, liquidity and related income of these securities are sensitive to changes in economic conditions, including real estate values, delinquencies and/or defaults, and may be adversely affected by changes in interest rates and shifts in the market's perception of the securities' market values.
The Fund will, if deemed prudent by the Manager, take temporary defensive measures (until the Manager has determined that normal conditions have returned or that it is otherwise prudent to resume investing in accordance with the Fund's normal investment strategies) and may not achieve its investment objectives during those periods. Recent changes in the credit markets have reduced the liquidity of all types of fixed income securities, including asset-backed securities. The Fund took temporary defensive measures during the last fiscal year.
Shares of the Fund are not publicly offered and are principally available only to other funds of the Trust and certain accredited investors.
2. Significant accounting policies
The following is a summary of significant accounting policies followed by the Fund in the preparation of its financial statements. These policies are in conformity with accounting principles generally accepted in the United States of America ("U.S. GAAP") and have been consistently followed by the Fund in
24
GMO World Opportunity Overlay Fund
(A Series of GMO Trust)
Notes to Financial Statements — (Continued)
February 28, 2009
preparing its financial statements. The preparation of financial statements in accordance with U.S. GAAP requires management to make estimates and assumptions that affect the reported amounts and disclosures in the financial statements. Actual results could differ from those estimates. The accounting records of the Fund are maintained in U.S. dollars.
Portfolio valuation
Securities listed on a securities exchange for which market quotations are readily available are valued at the last sale price or official closing price on each business day, or if there is no such reported sale or official closing price, at the most recent quoted bid price. Unlisted securities for which market quotations are readily available are generally valued at the most recent quoted bid price. Debt instruments with a remaining maturity of sixty days or less are generally valued at amortized cost, which approximates fair value. Shares of investment funds are generally valued at their net asset value. Securities for which quotations are not readily available or whose values the Manager has determined to be unreliable are valued at fair value as determined in good faith by the Trustees or persons acting at their direction pursuant to procedures approved by the Trustees. By its nature, a fair value price is a good faith estim ate of the value of a security at a given point in time and may not reflect the value that would be realized if the security were sold. The difference between a fair value price and the value realized upon a sale could be material.
Typically the Fund values debt instruments based on prices supplied by a primary pricing source chosen by the Manager. The Manager evaluates primary pricing sources on an ongoing basis and may change a pricing source should the Manager deem it appropriate. If it deems appropriate, the Manager, at its discretion, may override a price supplied by a primary source by using a price provided by another source. The prices provided by primary pricing sources may differ from the value that would be realized if the securities were sold, and the differences could be material.
Certain securities held by the Fund are valued on the basis of prices provided by a single source. As of February 28, 2009, the total value of these securities represented 33.17% of the net assets. The single source prices provided may differ from the value that would be realized if the securities were sold, and the differences could be material. In addition, although alternative prices are available for other securities held by the Fund, those alternative sources would not necessarily confirm the security price used by the Fund. Therefore, the existence of those alternative sources does not necessarily provide greater certainty about the prices used by the Fund.
In September 2006, the Financial Accounting Standards Board ("FASB") issued Statement of Financial Accounting Standards No. 157, Fair Value Measurements ("SFAS 157"). SFAS 157 is effective for the Fund's current fiscal year. While the adoption of SFAS 157 does not have an effect on the Fund's net asset value, it does require additional disclosures about fair value measurements. SFAS 157 establishes a three-level hierarchy for disclosure of fair value measurements. The valuation hierarchy is based upon the reliability of inputs to the valuation of the Fund's investments. The three levels are defined as follows:
Level 1 — Valuations based on quoted prices for identical securities in active markets.
25
GMO World Opportunity Overlay Fund
(A Series of GMO Trust)
Notes to Financial Statements — (Continued)
February 28, 2009
Level 2 — Valuations determined using other significant direct or indirect observable inputs.
Level 3 — Valuations based on inputs that are unobservable and significant. The Fund utilized the following fair value techniques on Level 3 investments: The Fund valued certain debt securities using indicative bids received from primary pricing sources. The Fund also valued certain credit default swaps using industry standard models and inputs from pricing vendors.
The inputs or methodology used for valuing securities are not necessarily an indication of the risk associated with investing in those securities.
The following is a summary of the fair valuations according to inputs used as of February 28, 2009 in valuing the Fund's investments:
| Asset Valuation Inputs | Investments in Securities | Other Financial Instruments* | |||||||||
| Level 1 - Quoted Prices | $ | — | $ | — | |||||||
| Level 2 - Other Significant Observable Inputs | 204,308,136 | 10,797,569 | |||||||||
| Level 3 - Significant Unobservable Inputs | 606,666,299 | 8,476,731 | |||||||||
| Total | $ | 810,974,435 | $ | 19,274,300 | |||||||
* Other financial instruments include swap agreements.
| Liability Valuation Inputs | Investments in Securities | Other Financial Instruments** | |||||||||
| Level 1 - Quoted Prices | $ | — | $ | — | |||||||
| Level 2 - Other Significant Observable Inputs | — | (58,003,926 | ) | ||||||||
| Level 3 - Significant Unobservable Inputs | — | (6,857,806 | ) | ||||||||
| Total | $ | — | $ | (64,861,732 | ) | ||||||
** Other financial instruments include swap agreements and written options.
26
GMO World Opportunity Overlay Fund
(A Series of GMO Trust)
Notes to Financial Statements — (Continued)
February 28, 2009
The following is a reconciliation of investments in which significant unobservable inputs (Level 3) were used in determining value:
| Investments in Securities | Other Financial Instruments*** | ||||||||||
| Balance as of February 29, 2008 | $ | 299,356,447 | $ | — | |||||||
| Accrued discounts/premiums | 637,276 | — | |||||||||
| Realized gain (loss) | (65,129,665 | ) | — | ||||||||
| Change in unrealized appreciation/depreciation | (169,771,875 | ) | 3,901,401 | ||||||||
| Net purchases (sales) | (241,424,258 | ) | — | ||||||||
| Net transfers in and/or out of Level 3 | 782,998,374 | (2,282,476 | ) | ||||||||
| Balance as of February 28, 2009 | $ | 606,666,299 | $ | 1,618,925 | |||||||
*** Other financial instruments include swap agreements.
Foreign currency translation
The market values of foreign securities, currency holdings and related assets and liabilities are translated to U.S. dollars based on the 4 p.m. New York time exchange rates each business day. Income and expenses denominated in foreign currencies are translated at the 4 p.m. New York time exchange rates on the business day the income and expenses are accrued or incurred. The Fund does not isolate realized and unrealized gains and losses attributable to changes in exchange rates from gains and losses that arise from changes in the market value of investments. Such fluctuations are included with net realized and unrealized gain or loss on investments. Net realized gains and losses on foreign currency transactions represent gains and losses on disposition of currencies and forward currency contracts, currency gains and losses realized between the trade and settlement dates on securities transactions, and the difference between the amount of investment income and foreign withholding taxes recorded on the Fund's accounting records and the U.S. dollar equivalent amounts actually received or paid.
Forward currency contracts
The Fund may enter into forward currency contracts including forward cross currency contracts. A forward currency contract is an agreement between two parties to buy and sell a currency at a set price on a future date. The market value of a forward currency contract fluctuates with changes in forward currency exchange rates. Forward currency contracts are marked to market daily using rates supplied by a quotation service and changes in value are recorded by the Fund as an unrealized gain or loss. Realized gains or losses equal to the difference between the value of the contract at the time it was opened and the value at the time it was closed are recorded upon delivery or receipt of the currency or, if a forward currency contract is offset by entering into another forward currency contract with the same broker, upon settlement of the net gain or loss. These contracts may involve market risk in excess of the unrealized gain or lo ss reflected in the Fund's Statement of Assets and Liabilities. They expose the Fund to the risk of unfavorable
27
GMO World Opportunity Overlay Fund
(A Series of GMO Trust)
Notes to Financial Statements — (Continued)
February 28, 2009
movements in currency values and the risk that the counterparty will be unable or unwilling to meet the terms of the contracts. The Fund had no forward currency contracts outstanding at the end of the period.
Futures contracts
The Fund may purchase and sell futures contracts. Upon entering into a futures contract, the Fund is required to deposit cash, U.S. government and agency obligations, or other liquid assets with the futures clearing broker in accordance with the initial margin requirements of the broker or exchange. In addition, the Fund maintains cash or securities in an amount that at least equals the net amount payable in the event the Fund must deliver the full amount of the contract. Futures contracts are marked to market daily and an appropriate payable or receivable for the change in value ("variation margin") is recorded by the Fund. The payable or receivable is settled on the following business day. Gains or losses are recognized but not considered realized until the contracts expire or are closed. Futures contracts involve, to varying degrees, risk of loss in excess of the variation margin disclosed in the Statement of Assets and Liabi lities. Under some circumstances, futures exchanges may establish daily limits on the amount that the price of a futures contract can vary from the previous day's settlement price, thereby effectively preventing liquidation of unfavorable positions. Losses may arise from changes in the value of the underlying instrument if the Fund is unable to liquidate a futures position due to an illiquid secondary market for the contract or the imposition of price limits, or if counterparties do not perform under the contract terms. Futures contracts are generally valued at the settlement price established each day by the board of trade or exchange on which they are traded. The Fund had no futures contracts outstanding at the end of the period.
Options
The Fund may write (i.e., sell) call and put options. Writing options alters the Fund's exposure to the underlying instrument by, in the case of a call option, obligating the Fund to sell the underlying instrument at a set price to the option-holder and, in the case of a put option, obligating the Fund to purchase the underlying instrument at a set price from the option-holder. In the case of an index option, settlement will be in cash. When the Fund writes a call or put option, an amount equal to the premium received is recorded as a liability and subsequently marked to market to reflect the current value of the option written. Premiums received from writing options that expire are treated as realized gains. Premiums received from writing options that are exercised or closed are deducted from the amounts paid on the underlying future, security or currency transaction to determine the realized gain or loss. The Fund as a writer of an option has no control over whether the underlying future, security or currency may be sold (call) or purchased (put) and as a result bears the market risk of an unfavorable change in the price of the future, security or currency underlying the option. In the event that the Fund writes uncovered put or call options (i.e. options for investments that the Fund does not own), it bears the risk of substantial losses if the price of the underlying instrument increases during the term of the option. Options expose the Fund to the risk the Fund may not be able to enter into a closing transaction because of an illiquid market. Written options outstanding at the end of the period are listed in the Fund's Schedule of Investments.
28
GMO World Opportunity Overlay Fund
(A Series of GMO Trust)
Notes to Financial Statements — (Continued)
February 28, 2009
For the year ended February 28, 2009, the Fund's investment activity in written options contracts was as follows:
| Puts | Calls | ||||||||||||||||||
| Principal Amount of Contracts | Premiums | Principal Amount of Contracts | Premiums | ||||||||||||||||
| Outstanding, beginning of year | $ | (120,000,000 | ) | $ | (525,305 | ) | $ | (540,000,000 | ) | $ | (2,385,597 | ) | |||||||
| Options written | (19,013,000,000 | ) | (43,177,695 | ) | (6,372,000,000 | ) | (47,294,297 | ) | |||||||||||
| Options exercised | 16,832,000,000 | 26,759,335 | 1,908,000,000 | 17,479,820 | |||||||||||||||
| Options bought back | 805,997,600 | 589,805 | 2,052,000,000 | 15,374,110 | |||||||||||||||
| Options expired | 1,075,002,400 | 8,358,860 | 1,517,000,000 | 5,437,432 | |||||||||||||||
| Outstanding, end of year | $ | (420,000,000 | ) | $ | (7,995,000 | ) | $ | (1,435,000,000 | ) | $ | (11,388,532 | ) | |||||||
The Fund may also purchase put and call options. Purchasing options alters the Fund's exposure to the underlying instrument by, in the case of a call option, entitling the Fund to purchase the underlying instrument at a set price from the writer of the option and, in the case of a put option, entitling the Fund to sell the underlying instrument at a set price to the writer of the option. The Fund pays a premium for a purchased option. That premium is disclosed in the Schedule of Investments and is subsequently marked to market to reflect the current value of the option. Premiums paid for purchasing options that expire are treated as realized losses. Premiums paid for purchasing options that are exercised or closed are deducted from the proceeds on the closing transaction to determine the realized gain or loss. The risk associated with purchasing put and call options is limited to the premium paid. Options contracts purchased by the Fund and outstanding at the end of the period are listed in the Fund's Schedule of Investments.
The Fund values exchange traded options at the last sale price, or if no sale is reported, the last bid price for options it has purchased and the last ask price for options it has written. The Fund values options traded over-the-counter using inputs provided by primary pricing sources and industry standard models.
Indexed securities
The Fund may invest in indexed securities. Indexed securities are securities whose redemption values and/or coupons are linked to the prices of a specific instrument or financial statistic. The Fund uses indexed securities to increase or decrease its exposure to different underlying instruments and to gain exposure to markets in which investing through conventional securities is difficult. Indexed securities held by the Fund at the end of the period are listed in the Fund's Schedule of Investments.
Swap agreements
The Fund may enter into various types of swap agreements, including without limitation, interest rate, total return, credit default and variance swap agreements. A swap agreement is an agreement to exchange
29
GMO World Opportunity Overlay Fund
(A Series of GMO Trust)
Notes to Financial Statements — (Continued)
February 28, 2009
the return generated by one instrument for the return generated by another instrument. When entering into a swap agreement, the Fund and/or the swap counterparty may post or receive cash or securities as collateral. The party posting the collateral typically receives the interest associated with or payments related to the collateral and has the risk of loss related to the collateral.
Interest rate swap agreements involve an exchange by the parties of their respective commitments to pay or right to receive interest, e.g., an exchange of floating rate interest payments for fixed rate interest payments with respect to the notional amount of principal.
Total return swap agreements involve a commitment by one party to pay interest to the other party in exchange for a payment to it from the other party based on the return of a reference instrument (e.g., a security or basket of securities), both based on notional amounts. To the extent the return of the reference instrument exceeds or falls short of the interest payments, one party will receive a payment from or make a payment to the other party.
In a credit default swap agreement, one party makes payments to another party in exchange for the right to receive a specified return if a credit event occurs with respect to a referenced entity or entities. Buying credit default protection reduces the buyer's exposure in the event of an issuer's default (e.g., it reduces risk where a party owns a security issued by or otherwise has exposure to the issuer). Selling credit default protection subjects the seller to exposure to an issuer's default. A seller of credit default protection receives payments in return for its obligation to pay the principal amount of a debt security (or other agreed-upon value) to the other party upon the occurrence of a credit event (e.g., issuer default or similar event). If no credit event occurs, the seller has no payment obligations. For credit default swap agreements on asset-backed securities, a credit event may be triggered by such events as the issuer's failure to pay interest or principal, an agreement of the holders of an asset-backed security to a maturity extension, a rating downgrade on the security or a write-down on the collateral underlying the security. For credit default swap agreements on corporate or sovereign issuers, a credit event may be triggered by such events as the issuer's bankruptcy, failure to pay interest or principal, repudiation/moratorium or restructuring.
Variance swap agreements involve an agreement by two parties to exchange cash flows based on the measured variance (or square of volatility) of a specified underlying asset. One party agrees to exchange a "fixed rate" or strike price payment for the "floating rate" or realized price variance on the underlying asset with respect to the notional amount. At inception, the strike price chosen is generally fixed at a level such that the fair value of the swap is zero. At the expiration date, the amount paid by one party to the other is the difference between the realized price variance of the underlying asset and the strike price multiplied by the notional amount. A receiver of the realized price variance would receive a payment when the realized price variance of the underlying asset is greater than the strike price and would make a payment when that variance is less than the strike price. A payer of the realized price variance woul d make a payment when the realized price variance of the underlying asset is greater than the strike price and
30
GMO World Opportunity Overlay Fund
(A Series of GMO Trust)
Notes to Financial Statements — (Continued)
February 28, 2009
would receive a payment when that variance is less than the strike price. This type of agreement is essentially a forward contract on the future realized price variance of the underlying asset.
The Fund prices its swap agreements daily using models that may incorporate quotations from market makers and records the change in value, if any, as unrealized gain or loss in the Statement of Operations. Payments received or made on swap agreements are recorded as realized gain or loss in the Statement of Operations. Gains or losses are realized upon termination of the swap agreements.
Swap agreements often are not actively traded on financial markets. The values assigned to them may differ significantly from the values that would be realized upon termination, and the differences could be material. Entering into swap agreements involves credit, legal, market and documentation risk that is not reflected in the amounts reported in the Statement of Assets and Liabilities. Such risks include the possibility that the party with whom the Fund contracts may default on its obligations to perform or disagree as to the meaning of contractual terms, or that the collateral that party posts may be insufficient or not timely received by the Fund. Credit risk may be particularly acute in an environment where financial services firms are exposed to systemic risks of the type evidenced by the insolvency of Lehman Brothers and subsequent market disruptions. Swap agreements outstanding at the end of the period are listed in the Fund's Schedule of Investments.
Repurchase agreements
The Fund may enter into repurchase agreements. Under a repurchase agreement the Fund acquires a security for cash and obtains a simultaneous commitment from the seller to repurchase the security at an agreed upon price and date. The Fund, through its custodian, takes possession of securities collateralizing the repurchase agreement. The collateral is marked to market daily to ensure that the market value of the underlying assets is at least equal to the amount owed to the Fund in the event of default by the seller. If the seller of a repurchase agreement defaults or enters into insolvency proceedings and the value of the collateral declines, the Fund's recovery of cash may be delayed or limited. The Fund had no repurchase agreements outstanding at the end of the period.
Reverse repurchase agreements
The Fund may enter into reverse repurchase agreements. Under a reverse repurchase agreement the Fund sells portfolio assets subject to an agreement by the Fund to repurchase the same assets at a later date at a fixed price. In connection with these agreements, the Fund establishes segregated accounts with its custodian in which the Fund maintains cash, U.S. government securities or other assets equal in value to its obligations under the reverse repurchase agreement into which it has entered. Reverse repurchase agreements expose the Fund to the risk that the market value of the securities the Fund has sold under the agreement may decline below the price at which the Fund is obligated to repurchase them under the agreement. If the buyer in a reverse repurchase agreement files for bankruptcy or becomes insolvent, the Fund's use of proceeds from the sale of its securities may be restricted while the other party or its trustee or re ceiver determines whether to honor the Fund's right to repurchase the securities. Furthermore, in that
31
GMO World Opportunity Overlay Fund
(A Series of GMO Trust)
Notes to Financial Statements — (Continued)
February 28, 2009
situation the Fund may be unable to recover the securities it sold and as a result would realize a loss equal to the difference between the value of the securities and the payment it received for them. This loss would be greater to the extent the buyer paid less than the value of the securities the Fund sold to it (e.g., a buyer may pay $95 for a bond with a market value of $100). The market value of the securities the Fund has sold is determined daily and any additional required collateral is allocated to or sent by the Fund on the next business day. The Fund had no reverse repurchase agreements outstanding at the end of the period.
Securities lending
The Fund may lend its securities to qualified brokers. The loans are collateralized with cash or liquid securities with a market value at least equal to the market value of the securities upon entering into the loan. As with other extensions of credit, the Fund may bear the risk of loss with respect to the investment of the collateral, the risk of delay in and/or inability to exercise its rights with respect to the collateral, and the risk of delay in recovery or loss of rights in the loaned securities should the borrower of the securities fail financially. If a loan is collateralized by U.S. government securities, the Fund receives a fee from the borrower. If a loan is collateralized by cash, the Fund typically invests the cash collateral for its own account. For the year from March 1, 2008 through February 28, 2009, the Fund did not participate in securities lending.
Taxes
The Fund has elected to be treated as a partnership for U.S. federal income tax purposes. As a partnership, the Fund is not itself subject to federal income tax. Instead, each shareholder is required to take into account in determining its tax liability its distributive share of items of Fund income, gain, loss, deduction, credit, and tax preference for each taxable year substantially as though such items have been realized directly by the shareholder and without regard to whether any distribution by the Fund has been or will be received. Accordingly, no provision (benefit) for federal and state income taxes is reflected in the accompanying financial statements.
As of February 28, 2009, the approximate cost for U.S. federal income tax purposes and gross and net unrealized appreciation (depreciation) in value of investments were as follows:
| Aggregate Cost | Gross Unrealized Appreciation | Gross Unrealized (Depreciation) | Net Unrealized Appreciation (Depreciation) | ||||||||||||
| $ | 1,056,090,138 | $ | 34,377,259 | $ | (279,492,962 | ) | $ | (245,115,703 | ) | ||||||
For the year ended February 28, 2009, the Fund had net realized losses attributed to redemption in-kind transactions of $43,434,360.
The Fund is subject to the provisions of Financial Accounting Standards Board Interpretation No. 48 ("FIN 48"), Accounting for Uncertainty in Income Taxes — an Interpretation of FASB Statement No. 109.
32
GMO World Opportunity Overlay Fund
(A Series of GMO Trust)
Notes to Financial Statements — (Continued)
February 28, 2009
FIN 48 sets forth a minimum threshold for financial statement recognition of a tax position taken or expected to be taken in a tax return that could affect the Fund's financial statements. The Fund did not have any unrecognized tax benefits or liabilities at February 28, 2009, nor did it have any increases or decreases in unrecognized tax benefits or liabilities for the period then ended. The Fund is subject to examination prior to the expiration of the statute of limitations by U.S. federal and state tax authorities for tax returns filed.
Distributions
Because the Fund has elected to be treated as a partnership for tax purposes, it is not required to make distributions to its shareholders. It is the policy of the Fund to declare and pay distributions as determined by the Trustees (or their delegates).
Security transactions and related investment income
Security transactions in the financial statements are accounted for on the trade date. Dividend income, net of applicable foreign withholding taxes, if any, is recorded on the ex-dividend date or, if later, when the Fund is informed of the ex-dividend date. Interest income is recorded on the accrual basis and is adjusted for the amortization of premiums and accretion of discounts. Principal on inflation indexed securities, is adjusted for inflation and any increase or decrease is recorded as interest income or loss. Income is not recognized on securities for which collection is not expected. Non-cash dividends, if any, are recorded at the fair market value of the asset received. In determining the net gain or loss on securities sold, the Fund uses the identified cost basis for the purposes of determining the cost basis.
Expenses
The majority of the expenses of the Trust are directly identifiable to an individual fund. Expenses that are not readily identifiable to a specific fund are allocated taking into consideration, among other things, the nature and type of expense and the relative size of the funds.
State Street Bank and Trust Company ("State Street") serves as custodian, fund accounting agent and transfer agent of the Fund. State Street's fees may be reduced by an earnings allowance calculated on the average daily cash balances the Fund maintains with State Street. The Fund receives the benefit of the earnings allowance. In addition, Goldman Sachs Agency Lending, the Fund's securities lending agent, has agreed to reimburse the Fund for certain transactional expenses related to securities lending activity. Credit balances or expense reimbursements used to reduce fees, if any, are reported as a reduction of expenses in the Statement of Operations.
Investment risks
To manage the Fund's cash collateral needs in extraordinary market conditions, the Manager reserves the right to reduce or eliminate the Fund's derivative exposures, including those that are intended to cause the Fund to track its benchmark more closely. A reduction in those exposures will tend to cause the
33
GMO World Opportunity Overlay Fund
(A Series of GMO Trust)
Notes to Financial Statements — (Continued)
February 28, 2009
performance of the Fund to track its benchmark less closely and make the Fund's performance more dependent on the performance of the asset-backed securities it holds directly or indirectly.
To address in part the cash management issues described above, the Fund expects to honor nearly all redemptions of its shares in-kind for the foreseeable future. If redeeming shareholders from the Fund choose to sell assets received in-kind immediately and current adverse market conditions continue, they may experience difficulty selling the assets at favorable prices. To the extent that the Fund honors redemptions in cash, redeeming shareholders will bear the redemption fees described in the Purchases and Redemptions of Fund Shares note.
Purchases and redemptions of Fund shares
Effective October 8, 2008, the Fund instituted a fee on cash redemptions of 1.00% of the amount redeemed. Effective October 20, 2008, the fee on cash redemptions was changed to 2.00% of the amount redeemed. The Fund may impose a new purchase premium and/or redemption fee, or modify or eliminate an existing purchase premium and/or redemption fee, at any time. If the Manager determines that any portion of a cash redemption is offset by a corresponding cash purchase on the same day, the Fund will ordinarily waive or reduce the redemption fee with respect to that portion. In addition, the Fund may waive or reduce the redemption fee in extraordinary circumstances if the purchase or redemption will not cause the Fund to incur transaction costs. All redemption fees are paid to the Fund and recorded by the Fund as paid-in-capital. In-kind redemption transactions are generally not subject to redemption fees except when they include a cas h component. However, when a substantial portion of a Fund is being redeemed, the Fund may charge a redemption fee based on estimated or known transaction costs resulting from those redemptions.
Recently issued accounting pronouncement
In March 2008, FASB issued Statement of Financial Accounting Standards No. 161, Disclosures about Derivative Instruments and Hedging Activities ("SFAS 161"). SFAS 161 is effective for fiscal years and interim periods beginning after November 15, 2008. SFAS 161 requires enhanced disclosures about the Fund's derivative and hedging activities. The Manager is currently evaluating the impact the adoption of SFAS 161 will have on the Fund's financial statement disclosures.
3. Fees and other transactions with affiliates
GMO does not charge the Fund any management or service fees for its services. In addition, through June 30, 2009, the Manager has contractually agreed to reimburse the Fund for Fund expenses incurred through that date (excluding "Excluded Expenses", as defined below). Excluded Expenses include fees and expenses of the independent Trustees of the Trust, fees and expenses for legal services not approved by the Manager for the Trust, compensation and expenses of the Trust's Chief Compliance Officer ("CCO") (excluding any employee benefits), brokerage commissions, securities lending fees and expenses, interest expense, transfer taxes, and other investment-related costs (including expenses
34
GMO World Opportunity Overlay Fund
(A Series of GMO Trust)
Notes to Financial Statements — (Continued)
February 28, 2009
associated with investments in any company that is an investment company or would be an investment company under the 1940 Act, but for the exceptions to the definition of investment company provided in Section 3(c)(1) and 3(c)(7) of the 1940 Act), hedging transaction fees, extraordinary, non-recurring and certain other unusual expenses (including taxes).
The Fund's portion of the fees paid by the Trust to the Trust's independent Trustees and CCO during the year ended February 28, 2009 was $19,543 and $8,246, respectively. The compensation and expenses of the CCO are included in miscellaneous expenses in the Statement of Operations. The Fund paid no remuneration to any other officer of the Trust.
4. Purchases and sales of securities
For the year ended February 28, 2009, cost of purchases and proceeds from sales of investments, other than short-term obligations, were as follows:
| Purchases | Sales | ||||||||||
| U.S. Government securities | $ | 63,500,657 | $ | — | |||||||
| Investments (non-U.S. Government securities) | 611,716,892 | 1,065,684,662 | |||||||||
5. Guarantees
In the normal course of business the Fund enters into contracts with third-party service providers that contain a variety of representations and warranties and that provide general indemnifications. The Fund's maximum exposure under these arrangements is unknown, as it involves future claims that may be made against the Fund that have not yet occurred. Based on experience, management is of the view that the risk of loss in connection with its indemnification obligations is remote; however, there can be no assurance that such obligations will not result in material liabilities that adversely affect the Fund.
6. Principal shareholders and related parties
As of February 28, 2009, 55.18% of the outstanding shares of the Fund were held by one shareholder. On that date, no other shareholder owned more than 10% of the outstanding shares of the Fund. The shareholder is another fund of the Trust. Redemptions from (or investments into) the Fund by or on behalf of this large shareholder may have a material effect on the Fund.
As of February 28, 2009, no shares of the Fund were held by senior management of the Manager and GMO Trust officers and 99.99% of the Fund's shares were held by accounts for which the Manager had investment discretion.
35
GMO World Opportunity Overlay Fund
(A Series of GMO Trust)
Notes to Financial Statements — (Continued)
February 28, 2009
7. Share transactions
The Declaration of Trust permits the Trust to issue an unlimited number of shares of beneficial interest (without par value). Transactions in Fund shares were as follows:
| Year Ended February 28, 2009 | Year Ended February 29, 2008 | ||||||||||||||||||
| Shares | Amount | Shares | Amount | ||||||||||||||||
| Shares sold | 6,499,921 | $ | 163,700,000 | 53,723,671 | $ | 1,403,880,000 | |||||||||||||
| Shares repurchased | (20,970,764 | ) | (504,651,905 | ) | (63,507,548 | ) | (1,649,885,000 | ) | |||||||||||
| Redemption fees | — | 432,682 | — | — | |||||||||||||||
| Net increase (decrease) | (14,470,843 | ) | $ | (340,519,223 | ) | (9,783,877 | ) | $ | (246,005,000 | ) | |||||||||
36
Report of Independent Registered Public Accounting Firm
To the Trustees of GMO Trust and the Shareholders of
GMO World Opportunity Overlay Fund:
In our opinion, the accompanying statement of assets and liabilities, including the schedule of investments, and the related statements of operations and of changes in net assets and the financial highlights present fairly, in all material respects, the financial position of GMO World Opportunity Overlay Fund (the "Fund") at February 28, 2009, the results of its operations for the year then ended, the changes in its net assets for each of the two years in the period then ended and the financial highlights for each of the periods indicated, in conformity with accounting principles generally accepted in the United States of America. These financial statements and financial highlights (hereafter referred to as "financial statements") are the responsibility of the Fund's management. Our responsibility is to express an opinion on these financial statements based on our audits. We conducted our audits of these financial statements in accordance with the standards of the Public Company Accounting Oversight Board (United States). Those standards require that we plan and perform the audit to obtain reasonable assurance about whether the financial statements are free of material misstatement. An audit includes examining, on a test basis, evidence supporting the amounts and disclosures in the financial statements, assessing the accounting principles used and significant estimates made by management, and evaluating the overall financial statement presentation. We believe that our audits, which included confirmation of securities at February 28, 2009 by correspondence with the custodian and brokers, provide a reasonable basis for our opinion.
PricewaterhouseCoopers LLP
Boston, Massachusetts
April 29, 2009
37
GMO World Opportunity Overlay Fund
(A Series of GMO Trust)
Fund Expenses
February 28, 2009 (Unaudited)
Expense Examples: The following information is in relation to expenses for the six month period ended February 28, 2009.
As a shareholder of the Fund, you may incur two types of costs: (1) transaction costs, including redemption fees; and (2) ongoing costs. This example is intended to help you understand your ongoing costs (in dollars) of investing in the Fund and to compare these costs with the ongoing costs of investing in other mutual funds.
These examples are based on an investment of $1,000 invested at the beginning of the period and held for the entire period, September 1, 2008 through February 28, 2009.
Actual Expenses
The first line of the table below provides information about actual account values and actual expenses. You may use the information in this line, together with the amount you invested, to estimate the expenses that you paid over the period. Simply divide your account value by $1,000 (for example, a $10,000,000 account value divided by $1,000 = 10,000), then multiply the result by the number in the first line under the heading entitled "Net Expense Incurred" to estimate the expenses you paid on your account during this period.
Hypothetical Example for Comparison Purposes
The second line of the table below provides information about hypothetical account values and hypothetical expenses based on the Fund's actual expense ratio and an assumed rate of return of 5% per year before expenses, which is not the Fund's actual return. The hypothetical account values and expenses may not be used to estimate the actual ending account balance or expenses you paid for the period. You may use this information to compare the ongoing costs of investing in the Fund with other funds. To do so, compare this 5% hypothetical example with the 5% hypothetical examples that appear in the shareholder reports of the other funds.
Please note that the expenses shown in the table are meant to highlight your ongoing costs only and do not reflect any transactional costs. Therefore, the second line of the table is useful in comparing ongoing costs only, and will not help you determine the relative total costs of owning different funds. In addition, if these transactional costs were included, your costs would have been higher.
| Annualized Net Expense Ratio | Beginning Account Value | Ending Account Value | Net Expense Incurred* | ||||||||||||||||
| 1) Actual | 0.01 | % | $ | 1,000.00 | $ | 694.00 | $ | 0.04 | |||||||||||
| 2) Hypothetical | 0.01 | % | $ | 1,000.00 | $ | 1,024.74 | $ | 0.05 | |||||||||||
* Expenses are calculated using the annualized expense ratio for the six months ended February 28, 2009, multiplied by the average account value over the period, multiplied by 181 days in the period, divided by 365 days in the year.
38
Trustees and Officers (Unaudited)
The following tables list the Trust's Trustees and Officers as of the date of this report; their address and date of birth ("DOB"); their position with the Trust; the length of time holding that position with the Trust; their principal occupation(s) during the past five years; the number of portfolios in the fund complex they oversee; and other directorships they hold in companies subject to registration or reporting requirements of the Securities Exchange Act of 1934 (generally called "public companies") or in registered investment companies. The Trust's Statement of Additional Information ("SAI") includes additional information about the Trust's trustees, including changes subsequent to the date of the report. The SAI is available, without charge, upon request by writing GMO, c/o GMO Trust, 40 Rowes Wharf, Boston, MA 02110.
Independent Trustees:
| Name, Address, and DOB | Position(s) Held with Trust | Term of Office1 and Length of Time Served | Principal Occupation(s) During Past Five Years | Number of Portfolios in Fund Complex Overseen by Trustee | Other Directorships Held by Trustee | ||||||||||||||||||
| Donald W. Glazer, Esq. c/o GMO Trust 40 Rowes Wharf Boston, MA 02110 DOB: 07/26/1944 | Chairman of the Board of Trustees | Chairman of the Board of Trustees since March 2005; Lead Independent Trustee (September 2004 – March 2005); Trustee since December 2000. | Consultant – Law and Business2; Author of Legal Treatises. | 59 | None. | ||||||||||||||||||
1 Each Trustee is elected to serve during the continued lifetime of the Trust until he/she dies, resigns or is removed, or if sooner, until the next meeting of Shareholders called for the purpose of electing Trustees and until the election and qualification of his/her successor.
2 As part of Mr. Glazer's work as a consultant, he provides part-time consulting services to Goodwin Procter LLP ("Goodwin"). Goodwin has provided legal services to Renewable Resources, LLC, an affiliate of GMO; GMO, in connection with its relationship with Renewable Resources; and funds managed by Renewable Resources. Mr. Glazer has represented that he has no financial interest in, and is not involved in the provision of, such legal services. In the calendar years ended December 31, 2007 and December 31, 2008, these entities paid $789,416 and $183,864 respectively, in legal fees and disbursements to Goodwin. In correspondence with the Staff of the Securities and Exchange Commission beginning in August 2006, the Independent Trustees' legal counsel provided the Staff with information regarding Mr. Glazer's relationship with Goodwin and h is other business activities. On September 11, 2007, based on information that had been given to the Staff as of that date, the Staff provided oral no-action assurance consistent with the opinion of the Independent Trustees' legal counsel that Mr. Glazer is not an "interested person" of the Trust.
39
Independent Trustees — (Continued)
| Name, Address, and DOB | Position(s) Held with Trust | Term of Office1 and Length of Time Served | Principal Occupation(s) During Past Five Years | Number of Portfolios in Fund Complex Overseen by Trustee | Other Directorships Held by Trustee | ||||||||||||||||||
| W. Nicholas Thorndike c/o GMO Trust 40 Rowes Wharf Boston, MA 02110 DOB: 03/28/1933 | Trustee | Since March 2005. | Director or trustee of various corporations and charitable organizations, including Courier Corporation (a book publisher and manufacturer) (July 1989 – present); Putnam Funds (December 1992 – June 2004); and Providence Journal (a newspaper publisher) (December 1986 – December 2003). | 59 | Director of Courier Corporation (a book publisher and manufacturer); Member of the Investment Committee of Partners HealthCare System, Inc.3 | ||||||||||||||||||
| Peter Tufano c/o GMO Trust 40 Rowes Wharf Boston, MA 02110 DOB: 04/22/1957 | Trustee | Since December 2008. | Sylvan C. Coleman Professor of Financial Management, Harvard Business School (since 1989). | 59 | Trustee of State Street Navigator Securities Lending Trust (3 Portfolios). | ||||||||||||||||||
1 Each Trustee is elected to serve during the continued lifetime of the Trust until he/she dies, resigns or is removed, or if sooner, until the next meeting of Shareholders called for the purpose of electing Trustees and until the election and qualification of his/her successor.
3 Partners HealthCare System, Inc. is a client of the Manager.
40
Principal Officers:
| Name, Address, and DOB | Position(s) Held with Trust | Term of Office4 and Length of Time Served | Principal Occupation(s) During Past Five Years5 | ||||||||||||
| J.B. Kittredge DOB: 08/22/1954 | President and Chief Executive Officer | Since March 2009. | General Counsel, Grantham, Mayo, Van Otterloo & Co. LLC (October 2005 – Present); Partner, Ropes & Gray LLP. | ||||||||||||
| Sheppard N. Burnett c/o GMO Trust 40 Rowes Wharf Boston, MA 02110 DOB: 10/24/1968 | Treasurer and Chief Financial Officer | Chief Financial Officer since March 2007; Treasurer since November 2006; Assistant Treasurer, September 2004 – November 2006. | Fund Administration Staff, Grantham, Mayo, Van Otterloo & Co. LLC (June 2004 – present); Vice President, Director of Tax, Columbia Management Group (2002 – 2004). | ||||||||||||
| Brent C. Arvidson c/o GMO Trust 40 Rowes Wharf Boston, MA 02110 DOB: 06/26/1969 | Assistant Treasurer | Since August 1998. | Senior Fund Administrator, Grantham, Mayo, Van Otterloo & Co. LLC. | ||||||||||||
| John L. Nasrah c/o GMO Trust 40 Rowes Wharf Boston, MA 02110 DOB: 05/27/1977 | Assistant Treasurer | Since March 2007. | Fund Administrator, Grantham, Mayo, Van Otterloo & Co. LLC (September 2004 – present); Tax Analyst, Bain & Company, Inc. (June 2003 – September 2004). | ||||||||||||
| Mahmoodur Rahman c/o GMO Trust 40 Rowes Wharf Boston, MA 02110 DOB: 11/30/1967 | Assistant Treasurer | Since September 2007. | Fund Administrator, Grantham, Mayo, Van Otterloo & Co. LLC (April 2007 – present); Vice President and Senior Tax Manager, Massachusetts Financial Services Company (January 2000 – April 2007). | ||||||||||||
| Michael E. Gillespie c/o GMO Trust 40 Rowes Wharf Boston, MA 02110 DOB: 02/18/1958 | Chief Compliance Officer | Since March 2005. | Vice President of Compliance (June 2004 – February 2005) and Director of Domestic Compliance (March 2002 – June 2004), Fidelity Investments. | ||||||||||||
4 Each officer is elected to hold such office until his or her successor is duly elected and qualified to carry out the duties and responsibilities of the office, or until he or she resigns or is removed from office.
5 Each of Messrs. Burnett, Arvidson, Bohan, and Pottle serves as an officer and/or director of certain pooled investment vehicles of which GMO or an affiliate of GMO serves as the investment adviser.
41
Principal Officers — (Continued)
| Name, Address, and DOB | Position(s) Held with Trust | Term of Office4 and Length of Time Served | Principal Occupation(s) During Past Five Years5 | ||||||||||||
| Jason B. Harrison c/o GMO Trust 40 Rowes Wharf Boston, MA 02110 DOB: 01/29/1977 | Vice President and Clerk | Vice President since November 2006; Clerk since March 2006. | Legal Counsel, Grantham, Mayo, Van Otterloo & Co. LLC (since February 2006) and Attorney, Ropes & Gray LLP (September 2002 – February 2006). | ||||||||||||
| David L. Bohan c/o GMO Trust 40 Rowes Wharf Boston, MA 02110 DOB: 06/21/1964 | Vice President and Assistant Clerk | Vice President since March 2005; Assistant Clerk since March 2006. | Legal Counsel, Grantham, Mayo, Van Otterloo & Co. LLC. | ||||||||||||
| Gregory L. Pottle c/o GMO Trust 40 Rowes Wharf Boston, MA 02110 DOB: 07/09/1971 | Vice President and Assistant Clerk | Since November 2006. | Legal Counsel, Grantham, Mayo, Van Otterloo & Co. LLC. | ||||||||||||
| Anne K. Trinque c/o GMO Trust 40 Rowes Wharf Boston, MA 02110 DOB: 04/15/1978 | Vice President and Assistant Clerk | Since September 2007. | Legal Counsel, Grantham, Mayo, Van Otterloo & Co. LLC (January 2007 – present); Attorney, Goodwin Procter LLP (September 2003 – January 2007). | ||||||||||||
| Cheryl Wakeham c/o GMO Trust 40 Rowes Wharf Boston, MA 02110 DOB: 10/29/1958 | Vice President and Anti-Money Laundering Officer | Since December 2004. | Manager, Client Service Administration, Grantham, Mayo, Van Otterloo & Co. LLC. | ||||||||||||
4 Each officer is elected to hold such office until his or her successor is duly elected and qualified to carry out the duties and responsibilities of the office, or until he or she resigns or is removed from office.
5 Each of Messrs. Burnett, Arvidson, Bohan, and Pottle serves as an officer and/or director of certain pooled investment vehicles of which GMO or an affiliate of GMO serves as the investment adviser.
42
GMO Tax-Managed U.S. Equities Fund
(A Series of GMO Trust)
Annual Report
February 28, 2009
For a free copy of the Fund's proxy voting guidelines, shareholders may call 1-617-346-7646 (collect) or visit the Securities and Exchange Commission's website at www.sec.gov. Information regarding how the Fund voted proxies relating to portfolio securities during the most recent 12-month period ended June 30 is available on GMO's website at www.gmo.com, or on the Securities and Exchange Commission's website at www.sec.gov.
The Fund files its complete schedule of portfolio holdings with the Securities and Exchange Commission for the first and third quarter of each fiscal year on Form N-Q, which is available on the Commission's website at www.sec.gov. The Fund's Form N-Q may be reviewed and copied at the Commission's Public Reference Room in Washington, D.C. Information on the operation of the Public Reference Room may be obtained by calling 1-800-SEC-0330. The Fund has a policy with respect to disclosure of portfolio holdings under which it may also make available on GMO's website at www.gmo.com a complete schedule of portfolio holdings.
This report is prepared for the general information of shareholders. It is authorized for distribution to prospective investors only when preceded or accompanied by a prospectus for the GMO Trust, which contains a complete discussion of the risks associated with an investment in this Fund and other important information. The GMO Trust prospectus can be obtained at www.gmo.com.
GMO Tax-Managed U.S. Equities Fund
(A Series of GMO Trust)
Portfolio Management
Day-to-day management of the Fund's portfolio is the responsibility of the Quantitative Equity team at Grantham, Mayo, Van Otterloo & Co. LLC.
Management Discussion and Analysis of Fund Performance
The GMO Tax-Managed U.S. Equities Fund declined 35.4% for the fiscal year ended February 28, 2009, as compared to the 43.5% decline for the Russell 3000 Index. On an after-tax basis (calculated using the historical highest individual federal marginal income tax rates and not taking into account the impact of state and local taxes), the Fund returned -35.6% compared to the benchmark's -43.7% return for the same period. Consistent with the Fund's investment objectives and policies, the Fund was invested primarily in U.S. equity securities throughout the period.
The portfolio's outperformance for the fiscal year is attributed primarily to sector selection. The portfolio benefited from being underweight Financial Services stocks, the weakest sector for the period. Overweight exposure to Health Care and Consumer Staples stocks, which posted the strongest, albeit still negative, returns also benefited the portfolio.
Stock selection was also positive for the latest fiscal year. Strength was broad based, with selections within Energy, Consumer Discretionary, and Consumer Staples stocks all contributing positively. Overweight exposures to Wal-Mart, Johnson & Johnson, and Exxon Mobil were three of the portfolio's strongest contributors. Selection within Health Care, including overweight exposure to UnitedHealth Group and Zimmer Holdings, detracted from relative performance.
For the fiscal year, the performance of high quality stocks was the key factor in the portfolio's relative returns. These stocks significantly outperformed the market during the latter half of the period. Momentum also contributed positive returns for the year, as the strategy also picked up exposure to high quality stocks. Our intrinsic value strategy struggled in the sharply descending markets.
The views expressed herein are exclusively those of Grantham, Mayo, Van Otterloo & Co. LLC Management as of the date of this report and are subject to change. GMO disclaims any responsibility to update such views. They are not meant as investment advice. References to specific securities are not recommendations of such securities and may not be representative of any GMO portfolio's current or future investments.

Performance data quoted represents past performance and is not indicative of future results. The investment return and principal value of an investment will fluctuate so that an investor's shares, when redeemed, may be worth more or less than their original cost. Current performance data may be lower or higher than the performance data provided herein. To obtain performance information to the most recent month-end, visit www.gmo.com. Performance shown is net of all fees after reimbursement from the Manager. Returns would have been lower had certain expenses not been reimbursed during the periods shown and do not include the effect of taxes on distributions and redemptions. All information is unaudited.
* Russell 3000 + Index represents the S&P 500 Index prior to 10/15/2007 and the Russell 3000 Index thereafter.
GMO Tax-Managed U.S. Equities Fund
(A Series of GMO Trust)
Investments Concentration Summary
February 28, 2009 (Unaudited)
| Asset Class Summary | % of Total Net Assets | ||||||
| Common Stocks | 98.2 | % | |||||
| Short-Term Investments | 1.9 | ||||||
| Other | (0.1 | ) | |||||
| 100.0 | % | ||||||
| Industry Sector Summary | % of Equity Investments | ||||||
| Health Care | 28.5 | % | |||||
| Consumer Staples | 25.4 | ||||||
| Information Technology | 19.0 | ||||||
| Energy | 13.4 | ||||||
| Consumer Discretionary | 4.8 | ||||||
| Industrials | 3.8 | ||||||
| Financials | 2.4 | ||||||
| Telecommunication Services | 1.8 | ||||||
| Materials | 0.5 | ||||||
| Utilities | 0.4 | ||||||
| 100.0 | % | ||||||
1
GMO Tax-Managed U.S. Equities Fund
(A Series of GMO Trust)
Schedule of Investments
(showing percentage of total net assets)
February 28, 2009
| Shares | Description | Value ($) | |||||||||||||
| COMMON STOCKS — 98.2% | |||||||||||||||
| Consumer Discretionary — 4.7% | |||||||||||||||
| 200 | Advance Auto Parts, Inc. | 7,650 | |||||||||||||
| 300 | Apollo Group, Inc.-Class A * | 21,750 | |||||||||||||
| 100 | AutoZone, Inc. * | 14,223 | |||||||||||||
| 600 | Bed Bath & Beyond, Inc. * | 12,780 | |||||||||||||
| 200 | Best Buy Co., Inc. | 5,764 | |||||||||||||
| 2,100 | Coach, Inc. * | 29,358 | |||||||||||||
| 2,400 | Comcast Corp.-Class A | 31,344 | |||||||||||||
| 300 | DirecTV Group (The), Inc. * | 5,982 | |||||||||||||
| 200 | Dollar Tree, Inc. * | 7,764 | |||||||||||||
| 500 | Gap (The), Inc. | 5,395 | |||||||||||||
| 300 | H&R Block, Inc. | 5,730 | |||||||||||||
| 200 | Hasbro, Inc. | 4,578 | |||||||||||||
| 5,200 | Home Depot, Inc. | 108,628 | |||||||||||||
| 200 | ITT Educational Services, Inc. * | 22,700 | |||||||||||||
| 300 | Johnson Controls, Inc. | 3,414 | |||||||||||||
| 200 | Kohl's Corp. * | 7,028 | |||||||||||||
| 400 | Leggett & Platt, Inc. | 4,572 | |||||||||||||
| 2,800 | Lowe's Cos., Inc. | 44,352 | |||||||||||||
| 700 | McDonald's Corp. | 36,575 | |||||||||||||
| 100 | Nike, Inc.-Class B | 4,153 | |||||||||||||
| 100 | Polo Ralph Lauren Corp. | 3,447 | |||||||||||||
| 300 | Ross Stores, Inc. | 8,856 | |||||||||||||
| 100 | Sherwin-Williams Co. (The) | 4,595 | |||||||||||||
| 1,500 | Staples, Inc. | 23,925 | |||||||||||||
| 800 | Target Corp. | 22,648 | |||||||||||||
| 300 | Time Warner Cable, Inc.-Class A * | 5,469 | |||||||||||||
| 600 | Time Warner, Inc. | 4,578 | |||||||||||||
| 500 | TJX Cos. (The), Inc. | 11,135 | |||||||||||||
| 500 | Urban Outfitters, Inc. * | 8,320 | |||||||||||||
| 200 | Yum! Brands, Inc. | 5,256 | |||||||||||||
| Total Consumer Discretionary | 481,969 | ||||||||||||||
See accompanying notes to the financial statements.
2
GMO Tax-Managed U.S. Equities Fund
(A Series of GMO Trust)
Schedule of Investments — (Continued)
(showing percentage of total net assets)
February 28, 2009
| Shares | Description | Value ($) | |||||||||||||
| Consumer Staples — 24.9% | |||||||||||||||
| 8,600 | Altria Group, Inc. | 132,784 | |||||||||||||
| 400 | Archer-Daniels-Midland Co. | 10,664 | |||||||||||||
| 400 | Avon Products, Inc. | 7,036 | |||||||||||||
| 600 | Campbell Soup Co. | 16,062 | |||||||||||||
| 200 | Clorox Co. | 9,720 | |||||||||||||
| 8,300 | Coca-Cola Co. (The) | 339,055 | |||||||||||||
| 1,500 | Colgate-Palmolive Co. | 90,270 | |||||||||||||
| 300 | Costco Wholesale Corp. | 12,702 | |||||||||||||
| 100 | Energizer Holdings, Inc. * | 4,219 | |||||||||||||
| 800 | Estee Lauder Cos. (The), Inc.-Class A | 18,120 | |||||||||||||
| 1,200 | General Mills, Inc. | 62,976 | |||||||||||||
| 500 | Hershey Co. (The) | 16,845 | |||||||||||||
| 600 | HJ Heinz Co. | 19,602 | |||||||||||||
| 100 | JM Smucker Co. (The) | 3,712 | |||||||||||||
| 800 | Kellogg Co. | 31,136 | |||||||||||||
| 1,200 | Kimberly-Clark Corp. | 56,532 | |||||||||||||
| 1,500 | Kraft Foods, Inc.-Class A | 34,170 | |||||||||||||
| 400 | Kroger Co. (The) | 8,268 | |||||||||||||
| 6,200 | PepsiCo, Inc. | 298,468 | |||||||||||||
| 6,500 | Philip Morris International, Inc. | 217,555 | |||||||||||||
| 6,100 | Procter & Gamble Co. (The) | 293,837 | |||||||||||||
| 300 | Supervalu, Inc. | 4,683 | |||||||||||||
| 500 | Sysco Corp. | 10,750 | |||||||||||||
| 14,100 | Wal-Mart Stores, Inc. | 694,284 | |||||||||||||
| 6,200 | Walgreen Co. | 147,932 | |||||||||||||
| Total Consumer Staples | 2,541,382 | ||||||||||||||
| Energy — 13.2% | |||||||||||||||
| 200 | Anadarko Petroleum Corp. | 6,990 | |||||||||||||
| 400 | Apache Corp. | 23,636 | |||||||||||||
| 500 | BJ Services Co. | 4,835 | |||||||||||||
| 200 | Cabot Oil & Gas Corp. | 4,074 | |||||||||||||
| 700 | Chesapeake Energy Corp. | 10,948 | |||||||||||||
| 6,800 | Chevron Corp. | 412,828 | |||||||||||||
| 200 | Cimarex Energy Co. | 3,930 | |||||||||||||
See accompanying notes to the financial statements.
3
GMO Tax-Managed U.S. Equities Fund
(A Series of GMO Trust)
Schedule of Investments — (Continued)
(showing percentage of total net assets)
February 28, 2009
| Shares | Description | Value ($) | |||||||||||||
| Energy — continued | |||||||||||||||
| 2,274 | ConocoPhillips | 84,934 | |||||||||||||
| 300 | Devon Energy Corp. | 13,101 | |||||||||||||
| 300 | EOG Resources, Inc. | 15,012 | |||||||||||||
| 8,900 | Exxon Mobil Corp. | 604,310 | |||||||||||||
| 500 | Halliburton Co. | 8,155 | |||||||||||||
| 200 | Helmerich & Payne, Inc. | 4,732 | |||||||||||||
| 300 | Hess Corp. | 16,407 | |||||||||||||
| 200 | Murphy Oil Corp. | 8,362 | |||||||||||||
| 500 | Nabors Industries Ltd. * | 4,855 | |||||||||||||
| 300 | Newfield Exploration Co. * | 5,799 | |||||||||||||
| 200 | Noble Corp. | 4,918 | |||||||||||||
| 200 | Noble Energy, Inc. | 9,108 | |||||||||||||
| 700 | Occidental Petroleum Corp. | 36,309 | |||||||||||||
| 300 | Pioneer Natural Resources Co. | 4,377 | |||||||||||||
| 300 | Plains Exploration & Production Co. * | 5,742 | |||||||||||||
| 400 | Southwestern Energy Co. * | 11,508 | |||||||||||||
| 400 | Spectra Energy Corp. | 5,200 | |||||||||||||
| 100 | Sunoco, Inc. | 3,345 | |||||||||||||
| 189 | Transocean Ltd. * | 11,296 | |||||||||||||
| 600 | Valero Energy Corp. | 11,628 | |||||||||||||
| 300 | XTO Energy, Inc. | 9,498 | |||||||||||||
| Total Energy | 1,345,837 | ||||||||||||||
| Financials — 2.3% | |||||||||||||||
| 400 | Aflac, Inc. | 6,704 | |||||||||||||
| 1,100 | Allstate Corp. (The) | 18,513 | |||||||||||||
| 3,508 | Bank of America Corp. | 13,857 | |||||||||||||
| 600 | BB&T Corp. | 9,678 | |||||||||||||
| 100 | BlackRock, Inc. | 9,681 | |||||||||||||
| 1,100 | Chubb Corp. | 42,944 | |||||||||||||
| 2,500 | Citigroup, Inc. | 3,750 | |||||||||||||
| 200 | First American Corp. | 4,634 | |||||||||||||
| 100 | Goldman Sachs Group (The), Inc. | 9,108 | |||||||||||||
| 600 | Hudson City Bancorp, Inc. | 6,222 | |||||||||||||
| 300 | JPMorgan Chase & Co. | 6,855 | |||||||||||||
See accompanying notes to the financial statements.
4
GMO Tax-Managed U.S. Equities Fund
(A Series of GMO Trust)
Schedule of Investments — (Continued)
(showing percentage of total net assets)
February 28, 2009
| Shares | Description | Value ($) | |||||||||||||
| Financials — continued | |||||||||||||||
| 800 | Marsh & McLennan Cos., Inc. | 14,344 | |||||||||||||
| 300 | MetLife, Inc. | 5,538 | |||||||||||||
| 300 | Moody's Corp. | 5,385 | |||||||||||||
| 100 | PNC Financial Services Group, Inc. | 2,734 | |||||||||||||
| 600 | Progressive Corp. (The) * | 6,942 | |||||||||||||
| 200 | Torchmark Corp. | 4,120 | |||||||||||||
| 1,100 | Travelers Cos. (The), Inc. | 39,765 | |||||||||||||
| 300 | Unum Group | 3,054 | |||||||||||||
| 800 | US Bancorp | 11,448 | |||||||||||||
| 1,000 | Wells Fargo & Co. | 12,100 | |||||||||||||
| Total Financials | 237,376 | ||||||||||||||
| Health Care — 28.0% | |||||||||||||||
| 3,600 | Abbott Laboratories | 170,424 | |||||||||||||
| 500 | AmerisourceBergen Corp. | 15,880 | |||||||||||||
| 5,900 | Amgen, Inc. * | 288,687 | |||||||||||||
| 200 | Baxter International, Inc. | 10,182 | |||||||||||||
| 100 | Becton, Dickinson & Co. | 6,189 | |||||||||||||
| 300 | Biogen Idec, Inc. * | 13,812 | |||||||||||||
| 1,800 | Bristol-Myers Squibb Co. | 33,138 | |||||||||||||
| 400 | Cardinal Health, Inc. | 12,980 | |||||||||||||
| 200 | Celgene Corp. * | 8,946 | |||||||||||||
| 100 | Cephalon, Inc. * | 6,559 | |||||||||||||
| 2,400 | Coventry Health Care, Inc. * | 27,648 | |||||||||||||
| 200 | Covidien Ltd. | 6,334 | |||||||||||||
| 4,600 | Eli Lilly & Co. | 135,148 | |||||||||||||
| 400 | Express Scripts, Inc. * | 20,120 | |||||||||||||
| 2,100 | Forest Laboratories, Inc. * | 45,024 | |||||||||||||
| 100 | Genentech, Inc. * | 8,555 | |||||||||||||
| 100 | Genzyme Corp. * | 6,093 | |||||||||||||
| 1,700 | Gilead Sciences, Inc. * | 76,160 | |||||||||||||
| 10,700 | Johnson & Johnson | 535,000 | |||||||||||||
| 900 | McKesson Corp. | 36,918 | |||||||||||||
| 3,400 | Medtronic, Inc. | 100,606 | |||||||||||||
See accompanying notes to the financial statements.
5
GMO Tax-Managed U.S. Equities Fund
(A Series of GMO Trust)
Schedule of Investments — (Continued)
(showing percentage of total net assets)
February 28, 2009
| Shares | Description | Value ($) | |||||||||||||
| Health Care — continued | |||||||||||||||
| 3,800 | Merck & Co., Inc. | 91,960 | |||||||||||||
| 42,030 | Pfizer, Inc. | 517,389 | |||||||||||||
| 100 | Quest Diagnostics, Inc. | 4,583 | |||||||||||||
| 600 | Schering-Plough Corp. | 10,434 | |||||||||||||
| 300 | Stryker Corp. | 10,101 | |||||||||||||
| 12,021 | UnitedHealth Group, Inc. | 236,213 | |||||||||||||
| 200 | Varian Medical Systems, Inc. * | 6,102 | |||||||||||||
| 200 | Vertex Pharmaceuticals, Inc. * | 6,046 | |||||||||||||
| 1,900 | WellPoint, Inc. * | 64,448 | |||||||||||||
| 6,100 | Wyeth | 249,002 | |||||||||||||
| 2,600 | Zimmer Holdings, Inc. * | 91,052 | |||||||||||||
| Total Health Care | 2,851,733 | ||||||||||||||
| Industrials — 3.7% | |||||||||||||||
| 1,400 | 3M Co. | 63,644 | |||||||||||||
| 500 | Burlington Northern Santa Fe Corp. | 29,385 | |||||||||||||
| 600 | CH Robinson Worldwide, Inc. | 24,828 | |||||||||||||
| 800 | CSX Corp. | 19,744 | |||||||||||||
| 200 | Danaher Corp. | 10,152 | |||||||||||||
| 300 | Emerson Electric Co. | 8,025 | |||||||||||||
| 800 | Fastenal Co. | 24,096 | |||||||||||||
| 100 | FedEx Corp. | 4,321 | |||||||||||||
| 1,000 | General Dynamics Corp. | 43,820 | |||||||||||||
| 500 | General Electric Co. | 4,255 | |||||||||||||
| 200 | Joy Global, Inc. | 3,492 | |||||||||||||
| 100 | L-3 Communications Holdings, Inc. | 6,765 | |||||||||||||
| 100 | Lockheed Martin Corp. | 6,311 | |||||||||||||
| 600 | Norfolk Southern Corp. | 19,032 | |||||||||||||
| 200 | Paccar, Inc. | 5,014 | |||||||||||||
| 200 | Parker-Hannifin Corp. | 6,674 | |||||||||||||
| 200 | Ryder System, Inc. | 4,572 | |||||||||||||
| 400 | Tyco International Ltd. | 8,020 | |||||||||||||
| 600 | Union Pacific Corp. | 22,512 | |||||||||||||
| 700 | United Parcel Service, Inc.-Class B | 28,826 | |||||||||||||
See accompanying notes to the financial statements.
6
GMO Tax-Managed U.S. Equities Fund
(A Series of GMO Trust)
Schedule of Investments — (Continued)
(showing percentage of total net assets)
February 28, 2009
| Shares | Description | Value ($) | |||||||||||||
| Industrials — continued | |||||||||||||||
| 800 | United Technologies Corp. | 32,664 | |||||||||||||
| 200 | Waste Management, Inc. | 5,400 | |||||||||||||
| Total Industrials | 381,552 | ||||||||||||||
| Information Technology — 18.7% | |||||||||||||||
| 400 | Altera Corp. | 6,132 | |||||||||||||
| 200 | Automatic Data Processing, Inc. | 6,830 | |||||||||||||
| 18,700 | Cisco Systems, Inc. * | 272,459 | |||||||||||||
| 300 | Citrix Systems, Inc. * | 6,174 | |||||||||||||
| 3,000 | Dell, Inc. * | 25,590 | |||||||||||||
| 4,761 | eBay, Inc. * | 51,752 | |||||||||||||
| 200 | Fiserv, Inc. * | 6,524 | |||||||||||||
| 210 | Google, Inc.-Class A * | 70,978 | |||||||||||||
| 200 | Hewlett-Packard Co. | 5,806 | |||||||||||||
| 1,700 | International Business Machines Corp. | 156,451 | |||||||||||||
| 200 | Intuit, Inc. * | 4,558 | |||||||||||||
| 100 | MasterCard, Inc.-Class A | 15,803 | |||||||||||||
| 30,900 | Microsoft Corp. | 499,035 | |||||||||||||
| 400 | NetApp, Inc. * | 5,376 | |||||||||||||
| 23,900 | Oracle Corp. * | 371,406 | |||||||||||||
| 11,300 | Qualcomm, Inc. | 377,759 | |||||||||||||
| 600 | Symantec Corp. * | 8,298 | |||||||||||||
| 100 | Visa, Inc.-Class A | 5,671 | |||||||||||||
| 800 | Western Union Co. | 8,928 | |||||||||||||
| Total Information Technology | 1,905,530 | ||||||||||||||
| Materials — 0.5% | |||||||||||||||
| 100 | Air Products & Chemicals, Inc. | 4,625 | |||||||||||||
| 200 | Monsanto Co. | 15,254 | |||||||||||||
| 400 | Nucor Corp. | 13,460 | |||||||||||||
| 200 | Owens-Illinois, Inc. * | 3,084 | |||||||||||||
| 100 | Praxair, Inc. | 5,675 | |||||||||||||
| 200 | Sigma-Aldrich Corp. | 7,140 | |||||||||||||
| 100 | Vulcan Materials Co. | 4,141 | |||||||||||||
| Total Materials | 53,379 | ||||||||||||||
See accompanying notes to the financial statements.
7
GMO Tax-Managed U.S. Equities Fund
(A Series of GMO Trust)
Schedule of Investments — (Continued)
(showing percentage of total net assets)
February 28, 2009
| Shares | Description | Value ($) | |||||||||||||
| Telecommunication Services — 1.8% | |||||||||||||||
| 3,863 | AT&T, Inc. | 91,824 | |||||||||||||
| 3,242 | Verizon Communications, Inc. | 92,494 | |||||||||||||
| Total Telecommunication Services | 184,318 | ||||||||||||||
| Utilities — 0.4% | |||||||||||||||
| 200 | Dominion Resources, Inc./Virginia | 6,036 | |||||||||||||
| 100 | Exelon Corp. | 4,722 | |||||||||||||
| 200 | FirstEnergy Corp. | 8,512 | |||||||||||||
| 100 | PG&E Corp. | 3,822 | |||||||||||||
| 400 | Southern Co. | 12,124 | |||||||||||||
| Total Utilities | 35,216 | ||||||||||||||
| TOTAL COMMON STOCKS (COST $12,435,103) | 10,018,292 | ||||||||||||||
| SHORT-TERM INVESTMENTS — 1.9% | |||||||||||||||
| Money Market Funds — 1.9% | |||||||||||||||
| 195,160 | State Street Institutional Treasury Money Market Fund-Institutional Class | 195,160 | |||||||||||||
| TOTAL SHORT-TERM INVESTMENTS (COST $195,160) | 195,160 | ||||||||||||||
| TOTAL INVESTMENTS — 100.1% (Cost $12,630,263) | 10,213,452 | ||||||||||||||
| Other Assets and Liabilities (net) — (0.1%) | (14,726 | ) | |||||||||||||
| TOTAL NET ASSETS — 100.0% | $ | 10,198,726 | |||||||||||||
Notes to Schedule of Investments:
* Non-income producing security.
See accompanying notes to the financial statements.
8
GMO Tax-Managed U.S. Equities Fund
(A Series of GMO Trust)
Statement of Assets and Liabilities — February 28, 2009
| Assets: | |||||||
| Investments, at value (cost $12,630,263) (Note 2) | $ | 10,213,452 | |||||
| Dividends receivable | 43,200 | ||||||
| Receivable for expenses reimbursed by Manager (Note 3) | 7,987 | ||||||
| Total assets | 10,264,639 | ||||||
| Liabilities: | |||||||
| Payable to affiliate for (Note 3): | |||||||
| Management fee | 2,844 | ||||||
| Shareholder service fee | 1,293 | ||||||
| Trustees and Chief Compliance Officer of GMO Trust fees | 84 | ||||||
| Accrued expenses | 61,692 | ||||||
| Total liabilities | 65,913 | ||||||
| Net assets | $ | 10,198,726 | |||||
| Net assets consist of: | |||||||
| Paid-in capital | $ | 31,673,509 | |||||
| Accumulated undistributed net investment income | 39,439 | ||||||
| Accumulated net realized loss | (19,097,411 | ) | |||||
| Net unrealized depreciation | (2,416,811 | ) | |||||
| $ | 10,198,726 | ||||||
| Net assets attributable to: | |||||||
| Class III shares | $ | 10,198,726 | |||||
| Shares outstanding: | |||||||
| Class III | 1,317,950 | ||||||
| Net asset value per share: | |||||||
| Class III | $ | 7.74 | |||||
See accompanying notes to the financial statements.
9
GMO Tax-Managed U.S. Equities Fund
(A Series of GMO Trust)
Statement of Operations — Year Ended February 28, 2009
| Investment Income: | |||||||
| Dividends (net of withholding taxes of $63) | $ | 1,221,264 | |||||
| Interest | 1,927 | ||||||
| Total investment income | 1,223,191 | ||||||
| Expenses: | |||||||
| Management fee (Note 3) | 198,196 | ||||||
| Shareholder service fee – Class III (Note 3) | 90,089 | ||||||
| Custodian, fund accounting agent and transfer agent fees | 38,362 | ||||||
| Audit and tax fees | 56,945 | ||||||
| Legal fees | 1,605 | ||||||
| Trustees fees and related expenses (Note 3) | 720 | ||||||
| Registration fees | 1,730 | ||||||
| Miscellaneous | 3,240 | ||||||
| Total expenses | 390,887 | ||||||
| Fees and expenses reimbursed by Manager (Note 3) | (101,441 | ) | |||||
| Expense reductions (Note 2) | (31 | ) | |||||
| Net expenses | 289,415 | ||||||
| Net investment income (loss) | 933,776 | ||||||
| Realized and unrealized gain (loss): | |||||||
| Net realized gain (loss) on: | |||||||
| Investments | (20,369,888 | ) | |||||
| Closed futures contracts | (429,455 | ) | |||||
| Net realized gain (loss) | (20,799,343 | ) | |||||
| Change in net unrealized appreciation (depreciation) on investments | (2,169,581 | ) | |||||
| Net realized and unrealized gain (loss) | (22,968,924 | ) | |||||
| Net increase (decrease) in net assets resulting from operations | $ | (22,035,148 | ) | ||||
See accompanying notes to the financial statements.
10
GMO Tax-Managed U.S. Equities Fund
(A Series of GMO Trust)
Statement of Changes in Net Assets
| Year Ended February 28, 2009 | Year Ended February 29, 2008 | ||||||||||
| Increase (decrease) in net assets: | |||||||||||
| Operations: | |||||||||||
| Net investment income (loss) | $ | 933,776 | $ | 1,718,647 | |||||||
| Net realized gain (loss) | (20,799,343 | ) | 6,085,509 | ||||||||
| Change in net unrealized appreciation (depreciation) | (2,169,581 | ) | (13,115,568 | ) | |||||||
| Net increase (decrease) in net assets from operations | (22,035,148 | ) | (5,311,412 | ) | |||||||
| Distributions to shareholders from: | |||||||||||
| Net investment income | |||||||||||
| Class III | (1,107,627 | ) | (1,800,557 | ) | |||||||
| Net realized gains | |||||||||||
| Class III | — | (1,256,863 | ) | ||||||||
| (1,107,627 | ) | (3,057,420 | ) | ||||||||
| Net share transactions (Note 7): | |||||||||||
| Class III | (55,344,097 | ) | (19,670,155 | ) | |||||||
| Total increase (decrease) in net assets | (78,486,872 | ) | (28,038,987 | ) | |||||||
| Net assets: | |||||||||||
| Beginning of period | 88,685,598 | 116,724,585 | |||||||||
| End of period (including accumulated undistributed net investment income of $39,439 and $213,290, respectively) | $ | 10,198,726 | $ | 88,685,598 | |||||||
See accompanying notes to the financial statements.
11
GMO Tax-Managed U.S. Equities Fund
(A Series of GMO Trust)
Financial Highlights
(For a Class III share outstanding throughout each period)
| Year Ended February 28/29, | |||||||||||||||||||||||
| 2009 | 2008 | 2007 | 2006 | 2005 | |||||||||||||||||||
| Net asset value, beginning of period | $ | 12.21 | $ | 13.48 | $ | 12.83 | $ | 12.14 | $ | 11.58 | |||||||||||||
| Income (loss) from investment operations: | |||||||||||||||||||||||
| Net investment income (loss)† | 0.18 | 0.21 | 0.19 | 0.20 | 0.16 | ||||||||||||||||||
| Net realized and unrealized gain (loss) | (4.45 | ) | (1.08 | ) | 0.64 | 0.69 | 0.54 | ||||||||||||||||
| Total from investment operations | (4.27 | ) | (0.87 | ) | 0.83 | 0.89 | 0.70 | ||||||||||||||||
| Less distributions to shareholders: | |||||||||||||||||||||||
| From net investment income | (0.20 | ) | (0.22 | ) | (0.18 | ) | (0.20 | ) | (0.14 | ) | |||||||||||||
| From net realized gains | — | (0.18 | ) | — | — | — | |||||||||||||||||
| Total distributions | (0.20 | ) | (0.40 | ) | (0.18 | ) | (0.20 | ) | (0.14 | ) | |||||||||||||
| Net asset value, end of period | $ | 7.74 | $ | 12.21 | $ | 13.48 | $ | 12.83 | $ | 12.14 | |||||||||||||
| Total Return(a) | (35.43 | )% | (6.78 | )% | 6.53 | % | 7.46 | % | 6.12 | %(b) | |||||||||||||
| Ratios/Supplemental Data: | |||||||||||||||||||||||
| Net assets, end of period (000's) | $ | 10,199 | $ | 88,686 | $ | 116,725 | $ | 121,339 | $ | 81,374 | |||||||||||||
| Net expenses to average daily net assets | 0.48 | %(c) | 0.48 | %(c) | 0.48 | % | 0.48 | % | 0.48 | % | |||||||||||||
| Net investment income to average daily net assets | 1.55 | % | 1.55 | % | 1.46 | % | 1.65 | % | 1.39 | % | |||||||||||||
| Portfolio turnover rate | 66 | % | 62 | % | 67 | % | 62 | % | 87 | % | |||||||||||||
| Fees and expenses reimbursed by the Manager to average daily net assets: | 0.17 | % | 0.12 | % | 0.11 | % | 0.08 | % | 0.08 | % | |||||||||||||
(a) The total returns would have been lower had certain expenses not been reimbursed during the periods shown and assumes the effect of reinvested distributions.
(b) The effect of losses in the amount of $15,989, resulting from compliance violations and the Manager's reimbursement of such losses, had no effect on the total return.
(c) The net expense ratio does not include the effect of expense reductions.
† Calculated using average shares outstanding throughout the period.
See accompanying notes to the financial statements.
12
GMO Tax-Managed U.S. Equities Fund
(A Series of GMO Trust)
Notes to Financial Statements
February 28, 2009
1. Organization
GMO Tax-Managed U.S. Equities Fund (the "Fund") is a series of GMO Trust (the "Trust"). The Fund is registered under the Investment Company Act of 1940, as amended, as an open-end, non-diversified management investment company. The Fund is advised and managed by Grantham, Mayo, Van Otterloo & Co. LLC (the "Manager" or "GMO"). The Trust was established as a Massachusetts business trust under the laws of The Commonwealth of Massachusetts on June 24, 1985. The Declaration of Trust permits the Trustees of the Trust ("Trustees") to create an unlimited number of series of shares ("Funds") and to subdivide Funds into classes.
The Fund seeks high after-tax total return. The Fund seeks to achieve its objective by outperforming the Russell 3000 Index. The Fund typically makes equity investments in companies that issue stocks included in the Russell 3000 Index, and in companies with similar market capitalizations, and uses quantitative models integrated with tax management techniques to provide broad exposure to the U.S. equity market to investors subject to U.S. federal income tax.
2. Significant accounting policies
The following is a summary of significant accounting policies followed by the Fund in the preparation of its financial statements. These policies are in conformity with accounting principles generally accepted in the United States of America ("U.S. GAAP") and have been consistently followed by the Fund in preparing its financial statements. The preparation of financial statements in accordance with U.S. GAAP requires management to make estimates and assumptions that affect the reported amounts and disclosures in the financial statements. Actual results could differ from those estimates. The accounting records of the Fund are maintained in U.S. dollars.
Portfolio valuation
Securities listed on a securities exchange for which market quotations are readily available are valued at the last sale price or official closing price on each business day, or if there is no such reported sale or official closing price, at the most recent quoted bid price. Unlisted securities for which market quotations are readily available are generally valued at the most recent quoted bid price. Debt instruments with a remaining maturity of sixty days or less are generally valued at amortized cost, which approximates fair value. Shares of investment funds are generally valued at their net asset value. Securities for which quotations are not readily available or whose values the Manager has determined to be unreliable are valued at fair value as determined in good faith by the Trustees or persons acting at their direction pursuant to procedures approved by the Trustees. By its nature, a fair value price is a good faith estim ate of the value of a security at a given point in time and may not reflect the value that would be realized if the security were sold. The difference between a fair value price and the value realized upon a sale could be material.
13
GMO Tax-Managed U.S. Equities Fund
(A Series of GMO Trust)
Notes to Financial Statements — (Continued)
February 28, 2009
In September 2006, the Financial Accounting Standards Board ("FASB") issued Statement of Financial Accounting Standards No. 157, Fair Value Measurements ("SFAS 157"). SFAS 157 is effective for the Fund's current fiscal year. While the adoption of SFAS 157 does not have an effect on the Fund's net asset value, it does require additional disclosures about fair value measurements. SFAS 157 establishes a three-level hierarchy for disclosure of fair value measurements. The valuation hierarchy is based upon the reliability of inputs to the valuation of the Fund's investments. The three levels are defined as follows:
Level 1 – Valuations based on quoted prices for identical securities in active markets.
Level 2 – Valuations determined using other significant direct or indirect observable inputs.
Level 3 – Valuations based on inputs that are unobservable and significant.
The inputs or methodology used for valuing securities are not necessarily an indication of the risk associated with investing in those securities.
The following is a summary of the fair valuations according to inputs used as of February 28, 2009 in valuing the Fund's investments:
| Asset Valuation Inputs | Investments in Securities | Other Financial Instruments | |||||||||
| Level 1 - Quoted Prices | $ | 10,018,292 | $ | — | |||||||
| Level 2 - Other Significant Observable Inputs | 195,160 | — | |||||||||
| Level 3 - Significant Unobservable Inputs | — | — | |||||||||
| Total | $ | 10,213,452 | $ | — | |||||||
| Liability Valuation Inputs | Investments in Securities | Other Financial Instruments | |||||||||
| Level 1 - Quoted Prices | $ | — | $ | — | |||||||
| Level 2 - Other Significant Observable Inputs | — | — | |||||||||
| Level 3 - Significant Unobservable Inputs | — | — | |||||||||
| Total | $ | — | $ | — | |||||||
The Fund held no investments or other financial instruments at either February 29, 2008 or February 28, 2009, whose fair value was determined using Level 3 inputs.
14
GMO Tax-Managed U.S. Equities Fund
(A Series of GMO Trust)
Notes to Financial Statements — (Continued)
February 28, 2009
Futures contracts
The Fund may purchase and sell futures contracts. Upon entering into a futures contract, the Fund is required to deposit cash, U.S. government and agency obligations, or other liquid assets with the futures clearing broker in accordance with the initial margin requirements of the broker or exchange. In addition, the Fund maintains cash or securities in an amount that at least equals the net amount payable in the event the Fund must deliver the full amount of the contract. Futures contracts are marked to market daily and an appropriate payable or receivable for the change in value ("variation margin") is recorded by the Fund. The payable or receivable is settled on the following business day. Gains or losses are recognized but not considered realized until the contracts expire or are closed. Futures contracts involve, to varying degrees, risk of loss in excess of the variation margin disclosed in the Statement of Assets and Liabi lities. Under some circumstances, futures exchanges may establish daily limits on the amount that the price of a futures contract can vary from the previous day's settlement price, thereby effectively preventing liquidation of unfavorable positions. Losses may arise from changes in the value of the underlying instrument if the Fund is unable to liquidate a futures position due to an illiquid secondary market for the contract or the imposition of price limits, or if counterparties do not perform under the contract terms. Futures contracts are generally valued at the settlement price established each day by the board of trade or exchange on which they are traded. The Fund had no futures contracts outstanding at the end of the period.
Swap agreements
The Fund may enter into various types of swap agreements, including without limitation, interest rate, total return, credit default and variance swap agreements. A swap agreement is an agreement to exchange the return generated by one instrument for the return generated by another instrument. When entering into a swap agreement, the Fund and/or the swap counterparty may post or receive cash or securities as collateral. The party posting the collateral typically receives the interest associated with or payments related to the collateral and has the risk of loss related to the collateral.
Interest rate swap agreements involve an exchange by the parties of their respective commitments to pay or right to receive interest, e.g., an exchange of floating rate interest payments for fixed rate interest payments with respect to the notional amount of principal.
Total return swap agreements involve a commitment by one party to pay interest to the other party in exchange for a payment to it from the other party based on the return of a reference instrument (e.g., a security or basket of securities), both based on notional amounts. To the extent the return of the reference instrument exceeds or falls short of the interest payments, one party will receive a payment from or make a payment to the other party.
In a credit default swap agreement, one party makes payments to another party in exchange for the right to receive a specified return if a credit event occurs with respect to a referenced entity or entities. Buying credit default protection reduces the buyer's exposure in the event of an issuer's default (e.g., it reduces risk where a party owns a security issued by or otherwise has exposure to the issuer). Selling credit default
15
GMO Tax-Managed U.S. Equities Fund
(A Series of GMO Trust)
Notes to Financial Statements — (Continued)
February 28, 2009
protection subjects the seller to exposure to an issuer's default. A seller of credit default protection receives payments in return for its obligation to pay the principal amount of a debt security (or other agreed-upon value) to the other party upon the occurrence of a credit event (e.g., issuer default or similar event). If no credit event occurs, the seller has no payment obligations. For credit default swap agreements on asset-backed securities, a credit event may be triggered by such events as the issuer's failure to pay interest or principal, an agreement of the holders of an asset-backed security to a maturity extension, a rating downgrade on the security or a write-down on the collateral underlying the security. For credit default swap agreements on corporate or sovereign issuers, a credit event may be triggered by such events as the issuer's bankruptcy, failure to pay interest or principal, repudiation/moratorium or re structuring.
Variance swap agreements involve an agreement by two parties to exchange cash flows based on the measured variance (or square of volatility) of a specified underlying asset. One party agrees to exchange a "fixed rate" or strike price payment for the "floating rate" or realized price variance on the underlying asset with respect to the notional amount. At inception, the strike price chosen is generally fixed at a level such that the fair value of the swap is zero. At the expiration date, the amount paid by one party to the other is the difference between the realized price variance of the underlying asset and the strike price multiplied by the notional amount. A receiver of the realized price variance would receive a payment when the realized price variance of the underlying asset is greater than the strike price and would make a payment when that variance is less than the strike price. A payer of the realized price variance woul d make a payment when the realized price variance of the underlying asset is greater than the strike price and would receive a payment when that variance is less than the strike price. This type of agreement is essentially a forward contract on the future realized price variance of the underlying asset.
The Fund prices its swap agreements daily using models that may incorporate quotations from market makers and records the change in value, if any, as unrealized gain or loss in the Statement of Operations. Payments received or made on swap agreements are recorded as realized gain or loss in the Statement of Operations. Gains or losses are realized upon termination of the swap agreements.
Swap agreements often are not actively traded on financial markets. The values assigned to them may differ significantly from the values that would be realized upon termination, and the differences could be material. Entering into swap agreements involves credit, legal, market and documentation risk that is not reflected in the amounts reported in the Statement of Assets and Liabilities. Such risks include the possibility that the party with whom the Fund contracts may default on its obligations to perform or disagree as to the meaning of contractual terms, or that the collateral that party posts may be insufficient or not timely received by the Fund. Credit risk may be particularly acute in an environment where financial services firms are exposed to systemic risks of the type evidenced by the insolvency of Lehman Brothers and subsequent market disruptions. The Fund had no swap agreements outstanding at the end of the period.
16
GMO Tax-Managed U.S. Equities Fund
(A Series of GMO Trust)
Notes to Financial Statements — (Continued)
February 28, 2009
Repurchase agreements
The Fund may enter into repurchase agreements. Under a repurchase agreement the Fund acquires a security for cash and obtains a simultaneous commitment from the seller to repurchase the security at an agreed upon price and date. The Fund, through its custodian, takes possession of securities collateralizing the repurchase agreement. The collateral is marked to market daily to ensure that the market value of the underlying assets is at least equal to the amount owed to the Fund in the event of default by the seller. If the seller of a repurchase agreement defaults or enters into insolvency proceedings and the value of the collateral declines, the Fund's recovery of cash may be delayed or limited. The Fund had no repurchase agreements outstanding at the end of the period.
Securities lending
The Fund may lend its securities to qualified brokers. The loans are collateralized with cash or liquid securities with a market value at least equal to the market value of the securities upon entering into the loan. As with other extensions of credit, the Fund may bear the risk of loss with respect to the investment of the collateral, the risk of delay in and/or inability to exercise its rights with respect to the collateral, and the risk of delay in recovery or loss of rights in the loaned securities should the borrower of the securities fail financially. If a loan is collateralized by U.S. government securities, the Fund receives a fee from the borrower. If a loan is collateralized by cash, the Fund typically invests the cash collateral for its own account. For the year from March 1, 2008 through February 28, 2009, the Fund did not participate in securities lending.
Taxes and distributions
The Fund intends to qualify each tax year as a regulated investment company under Subchapter M of the Internal Revenue Code of 1986, as amended (the "Code"). The Fund intends to distribute substantially all of its net investment income and all of its net realized short-term and long-term capital gain, if any, after giving effect to any available capital loss carryforwards for U.S. federal income tax purposes. Therefore, no provision for U.S. federal income or excise tax is necessary.
The Fund's policy is to declare and pay distributions from net investment income, if any, quarterly, and from net realized short-term and long-term capital gain, if any, at least annually. All distributions are paid in shares of the Fund, at net asset value, unless the shareholder elects to receive cash distributions. Distributions to shareholders are recorded by the Fund on the ex-dividend date.
Income and capital gain distributions are determined in accordance with U.S. federal income tax regulations, which may differ from U.S. GAAP. Certain capital accounts in the financial statements are periodically adjusted for permanent differences in order to reflect their tax character. These adjustments have no impact on net assets or net asset value per share. Temporary differences that arise from recognizing certain items of income, expense, gain or loss in different periods for financial statement and tax purposes will reverse at some time in the future. Distributions in excess of net investment income or net realized gains are temporary over-distributions for financial statement purposes resulting from differences in the recognition or classification of income or distributions for financial statement and tax purposes.
17
GMO Tax-Managed U.S. Equities Fund
(A Series of GMO Trust)
Notes to Financial Statements — (Continued)
February 28, 2009
U.S. GAAP and tax accounting differences primarily relate to capital loss carryforwards, losses on wash sale transactions and post-October capital losses.
The following reclassification represents the amount necessary to report the stated components of net assets on a tax basis, excluding certain temporary differences, as of February 28, 2009. The financial highlights exclude these adjustments.
| Accumulated Undistributed Net Investment Income | Accumulated Net Realized Loss | Paid-in Capital | |||||||||
| $ | — | $ | 1,910,887 | $ | (1,910,887 | ) | |||||
The tax character of distributions declared to shareholders is as follows:
| 2/28/2009 | 2/29/2008 | ||||||||||
| Ordinary income (including any net short-term capital gain) | $ | 1,107,627 | $ | 1,811,810 | |||||||
| Net long-term capital gain | — | 1,245,610 | |||||||||
| Total distributions | $ | 1,107,627 | $ | 3,057,420 | |||||||
Distributions in excess of tax basis earnings and profits, if significant, are reported in the financial statements as a return of capital for tax purposes.
As of February 28, 2009, the components of distributable earnings on a tax basis consisted of the following:
| Undistributed ordinary income (including any net short-term capital gain) | $ | 39,439 | |||||
As of February 28, 2009, the Fund elected to defer to March 1, 2009 post-October capital losses of $10,340,010.
As of February 28, 2009, the Fund had capital loss carryforwards available to offset future realized gains if any, to the extent permitted by the Code. Utilization of the capital loss carryforwards could be subject to limitations imposed by the Code related to share ownership activity. Such losses expire as follows:
| 2/28/2017 | $ | (8,413,466 | ) | ||||
| Total | $ | (8,413,466 | ) | ||||
18
GMO Tax-Managed U.S. Equities Fund
(A Series of GMO Trust)
Notes to Financial Statements — (Continued)
February 28, 2009
As of February 28, 2009, the approximate cost for U.S. federal income tax purposes and gross and net unrealized appreciation (depreciation) in value of investments were as follows:
| Aggregate Cost | Gross Unrealized Appreciation | Gross Unrealized (Depreciation) | Net Unrealized Appreciation (Depreciation) | ||||||||||||
| $ | 12,974,198 | $ | 273,027 | $ | (3,033,773 | ) | $ | (2,760,746 | ) | ||||||
The Fund is subject to the provisions of Financial Accounting Standards Board Interpretation No. 48 ("FIN 48"), Accounting for Uncertainty in Income Taxes — an Interpretation of FASB Statement No. 109. FIN 48 sets forth a minimum threshold for financial statement recognition of a tax position taken or expected to be taken in a tax return that could affect the Fund's financial statements. The Fund did not have any unrecognized tax benefits or liabilities at February 28, 2009, nor did it have any increases or decreases in unrecognized tax benefits or liabilities for the period then ended. The Fund is subject to examination prior to the expiration of the statute of limitations by U.S. federal and state tax authorities for tax returns filed.
Security transactions and related investment income
Security transactions in the financial statements are accounted for on the trade date. Dividend income, net of applicable foreign withholding taxes, if any, is recorded on the ex-dividend date or, if later, when the Fund is informed of the ex-dividend date. Interest income is recorded on the accrual basis and is adjusted for the amortization of premiums and accretion of discounts. Principal on inflation indexed securities, is adjusted for inflation and any increase or decrease is recorded as interest income or loss. Income is not recognized on securities for which collection is not expected. Non-cash dividends, if any, are recorded at the fair market value of the asset received. In determining the net gain or loss on securities sold, the Fund uses the identified cost basis for the purposes of determining the cost basis.
Expenses
The majority of the expenses of the Trust are directly identifiable to an individual fund. Expenses that are not readily identifiable to a specific fund are allocated taking into consideration, among other things, the nature and type of expense and the relative size of the funds.
State Street Bank and Trust Company ("State Street") serves as custodian, fund accounting agent and transfer agent of the Fund. State Street's fees may be reduced by an earnings allowance calculated on the average daily cash balances the Fund maintains with State Street. The Fund receives the benefit of the earnings allowance. In addition, Goldman Sachs Agency Lending, the Fund's securities lending agent, has agreed to reimburse the Fund for certain transactional expenses related to securities lending activity. Credit balances or expense reimbursements used to reduce fees, if any, are reported as a reduction of expenses in the Statement of Operations.
19
GMO Tax-Managed U.S. Equities Fund
(A Series of GMO Trust)
Notes to Financial Statements — (Continued)
February 28, 2009
Recently issued accounting pronouncement
In March 2008, FASB issued Statement of Financial Accounting Standards No. 161, Disclosures about Derivative Instruments and Hedging Activities ("SFAS 161"). SFAS 161 is effective for fiscal years and interim periods beginning after November 15, 2008. SFAS 161 requires enhanced disclosures about the Fund's derivative and hedging activities. The Manager is currently evaluating the impact the adoption of SFAS 161 will have on the Fund's financial statement disclosures.
3. Fees and other transactions with affiliates
GMO receives a management fee for the services it provides to the Fund. That fee is paid monthly at the annual rate of 0.33% of average daily net assets. The Fund has adopted a Shareholder Service Plan under which the Fund pays GMO a shareholder service fee for client and shareholder service, reporting, and other support. Pursuant to the Shareholder Service Plan, the shareholder service fee is calculated based on average daily net assets at the annual rate of 0.15% for Class III shares.
Through at least June 30, 2009, the Manager has contractually agreed to reimburse the Fund for Fund expenses incurred through that date to the extent the Fund's total annual operating expenses (excluding "Excluded Expenses", as defined below) exceed 0.33% of the Fund's average daily net assets. Excluded Expenses include shareholder service fees, fees and expenses of the independent Trustees of the Trust, fees and expenses for legal services not approved by the Manager for the Trust, compensation and expenses of the Trust's Chief Compliance Officer ("CCO") (excluding any employee benefits), brokerage commissions, securities lending fees and expenses, interest expense, transfer taxes, and other investment-related costs (including expenses associated with investments in any company that is an investment company or would be an investment company under the 1940 Act, but for the exceptions to the definition of investment company provi ded in Section 3(c)(1) and 3(c)(7) of the 1940 Act), hedging transaction fees, extraordinary, non-recurring and certain other unusual expenses (including taxes).
The Fund's portion of the fees paid by the Trust to the Trust's independent Trustees and CCO during the year ended February 28, 2009 was $720 and $303, respectively. The compensation and expenses of the CCO are included in miscellaneous expenses in the Statement of Operations. The Fund paid no remuneration to any other officer of the Trust.
4. Purchases and sales of securities
Cost of purchases and proceeds from sales of securities, excluding short-term investments, for the year ended February 28, 2009 aggregated $38,922,539 and $92,908,690, respectively.
20
GMO Tax-Managed U.S. Equities Fund
(A Series of GMO Trust)
Notes to Financial Statements — (Continued)
February 28, 2009
5. Guarantees
In the normal course of business the Fund enters into contracts with third-party service providers that contain a variety of representations and warranties and that provide general indemnifications. The Fund's maximum exposure under these arrangements is unknown, as it involves future claims that may be made against the Fund that have not yet occurred. Based on experience, management is of the view that the risk of loss in connection with its indemnification obligations is remote; however, there can be no assurance that such obligations will not result in material liabilities that adversely affect the Fund.
6. Principal shareholders and related parties
As of February 28, 2009, 92.65% of the outstanding shares of the Fund were held by five shareholders, each holding more than 10% of the Fund's outstanding shares. On that date, no other shareholder owned more than 10% of the outstanding shares of the Fund. Redemptions from (or investments into) the Fund by or on behalf of these large shareholders may have a material effect on the Fund.
As of February 28, 2009, 0.28% of the Fund's shares were held by senior management of the Manager and GMO Trust officers and 17.26% of the Fund's shares were held by accounts for which the Manager had investment discretion.
7. Share transactions
The Declaration of Trust permits the Trust to issue an unlimited number of shares of beneficial interest (without par value). Transactions in Fund shares were as follows:
| Year Ended February 28, 2009 | Year Ended February 29, 2008 | ||||||||||||||||||
| Class III: | Shares | Amount | Shares | Amount | |||||||||||||||
| Shares sold | 147,299 | $ | 1,297,188 | 76,039 | $ | 1,022,306 | |||||||||||||
| Shares issued to shareholders in reinvestment of distributions | 85,574 | 960,217 | 196,167 | 2,702,024 | |||||||||||||||
| Shares repurchased | (6,181,090 | ) | (57,601,502 | ) | (1,667,621 | ) | (23,394,485 | ) | |||||||||||
| Net increase (decrease) | (5,948,217 | ) | $ | (55,344,097 | ) | (1,395,415 | ) | $ | (19,670,155 | ) | |||||||||
21
Report of Independent Registered Public Accounting Firm
To the Trustees of GMO Trust and the Shareholders of
GMO Tax-Managed U.S. Equities Fund:
In our opinion, the accompanying statement of assets and liabilities, including the schedule of investments, and the related statements of operations and of changes in net assets and the financial highlights present fairly, in all material respects, the financial position of GMO Tax-Managed U.S. Equities Fund (the "Fund") at February 28, 2009, the results of its operations for the year then ended, the changes in its net assets for each of the two years in the period then ended and the financial highlights for each of the five years in the period then ended, in conformity with accounting principles generally accepted in the United States of America. These financial statements and financial highlights (hereafter referred to as "financial statements") are the responsibility of the Fund's management. Our responsibility is to express an opinion on these financial statements based on our audits. We conducted our audits of these financ ial statements in accordance with the standards of the Public Company Accounting Oversight Board (United States). Those standards require that we plan and perform the audit to obtain reasonable assurance about whether the financial statements are free of material misstatement. An audit includes examining, on a test basis, evidence supporting the amounts and disclosures in the financial statements, assessing the accounting principles used and significant estimates made by management, and evaluating the overall financial statement presentation. We believe that our audits, which included confirmation of securities at February 28, 2009 by correspondence with the custodian and brokers, provide a reasonable basis for our opinion.
PricewaterhouseCoopers LLP
Boston, Massachusetts
April 29, 2009
22
GMO Tax-Managed U.S. Equities Fund
(A Series of GMO Trust)
Fund Expenses
February 28, 2009 (Unaudited)
Expense Examples: The following information is in relation to expenses for the six month period ended February 28, 2009.
As a shareholder of the Fund, you may incur two types of costs: (1) transaction costs, and (2) ongoing costs, including management fees, shareholder service fees, and other Fund expenses. This example is intended to help you understand your ongoing costs (in dollars) of investing in the Fund and to compare these costs with the ongoing costs of investing in other mutual funds.
These examples are based on an investment of $1,000 invested at the beginning of the period and held for the entire period, September 1, 2008 through February 28, 2009.
Actual Expenses
The first line of the table below provides information about actual account values and actual expenses. You may use the information in this line, together with the amount you invested, to estimate the expenses that you paid over the period. Simply divide your account value by $1,000 (for example, a $10,000,000 account value divided by $1,000 = 10,000), then multiply the result by the number in the first line under the heading entitled "Net Expense Incurred" to estimate the expenses you paid on your account during this period.
Hypothetical Example for Comparison Purposes
The second line of the table below provides information about hypothetical account values and hypothetical expenses based on the Fund's actual expense ratio and an assumed rate of return of 5% per year before expenses, which is not the Fund's actual return. The hypothetical account values and expenses may not be used to estimate the actual ending account balance or expenses you paid for the period. You may use this information to compare the ongoing costs of investing in the Fund with other funds. To do so, compare this 5% hypothetical example with the 5% hypothetical examples that appear in the shareholder reports of other funds.
Please note that the expenses shown in the table are meant to highlight your ongoing costs only and do not reflect any transactional costs, such as purchase premiums and redemption fees. Therefore, the second line of the table is useful in comparing ongoing costs only, and will not help you determine the relative total costs of owning different funds. In addition, if these transactional costs were included, your costs would have been higher.
| Annualized Net Expense Ratio | Beginning Account Value | Ending Account Value | Net Expense Incurred* | ||||||||||||||||
| Class III | |||||||||||||||||||
| 1) Actual | 0.48 | % | $ | 1,000.00 | $ | 654.70 | $ | 1.97 | |||||||||||
| 2) Hypothetical | 0.48 | % | $ | 1,000.00 | $ | 1,022.41 | $ | 2.41 | |||||||||||
* Expenses are calculated using the Class's annualized expense ratio (including indirect expenses incurred) for the six months ended February 28, 2009, multiplied by the average account value over the period, multiplied by 181 days in the period, divided by 365 days in the year.
23
GMO Tax-Managed U.S. Equities Fund
(A Series of GMO Trust)
Tax Information for the Tax Year Ended February 28, 2009 (Unaudited)
The Fund will notify shareholders of amounts for use in preparing 2009 income tax forms in January 2010.
For taxable, non-corporate shareholders, 100.00% of the income and short-term capital gains, if any, distributed in the Fund's fiscal year ended February 28, 2009 represents qualified dividend income subject to the 15% rate category.
For corporate shareholders, 100.00% of the income and short-term capital gains, if any, distributed in the Fund's fiscal year ended February 28, 2009 qualified for the dividends-received deduction.
The Fund hereby designates as qualified interest income with respect to its taxable year ended February 28, 2009, $22,416 or if determined to be different, the qualified interest income of such year.
24
Trustees and Officers (Unaudited)
The following tables list the Trust's Trustees and Officers as of the date of this report; their address and date of birth ("DOB"); their position with the Trust; the length of time holding that position with the Trust; their principal occupation(s) during the past five years; the number of portfolios in the fund complex they oversee; and other directorships they hold in companies subject to registration or reporting requirements of the Securities Exchange Act of 1934 (generally called "public companies") or in registered investment companies. The Trust's Statement of Additional Information ("SAI") includes additional information about the Trust's trustees, including changes subsequent to the date of the report. The SAI is available, without charge, upon request by writing GMO, c/o GMO Trust, 40 Rowes Wharf, Boston, MA 02110.
Independent Trustees:
| Name, Address, and DOB | Position(s) Held with Trust | Term of Office1 and Length of Time Served | Principal Occupation(s) During Past Five Years | Number of Portfolios in Fund Complex Overseen by Trustee | Other Directorships Held by Trustee | ||||||||||||||||||
| Donald W. Glazer, Esq. c/o GMO Trust 40 Rowes Wharf Boston, MA 02110 DOB: 07/26/1944 | Chairman of the Board of Trustees | Chairman of the Board of Trustees since March 2005; Lead Independent Trustee (September 2004 – March 2005); Trustee since December 2000. | Consultant – Law and Business2; Author of Legal Treatises. | 59 | None. | ||||||||||||||||||
1 Each Trustee is elected to serve during the continued lifetime of the Trust until he/she dies, resigns or is removed, or if sooner, until the next meeting of Shareholders called for the purpose of electing Trustees and until the election and qualification of his/her successor.
2 As part of Mr. Glazer's work as a consultant, he provides part-time consulting services to Goodwin Procter LLP ("Goodwin"). Goodwin has provided legal services to Renewable Resources, LLC, an affiliate of GMO; GMO, in connection with its relationship with Renewable Resources; and funds managed by Renewable Resources. Mr. Glazer has represented that he has no financial interest in, and is not involved in the provision of, such legal services. In the calendar years ended December 31, 2007 and December 31, 2008, these entities paid $789,416 and $183,864 respectively, in legal fees and disbursements to Goodwin. In correspondence with the Staff of the Securities and Exchange Commission beginning in August 2006, the Independent Trustees' legal counsel provided the Staff with information regarding Mr. Glazer's relationship with Goodwin and h is other business activities. On September 11, 2007, based on information that had been given to the Staff as of that date, the Staff provided oral no-action assurance consistent with the opinion of the Independent Trustees' legal counsel that Mr. Glazer is not an "interested person" of the Trust.
25
Independent Trustees — (Continued)
| Name, Address, and DOB | Position(s) Held with Trust | Term of Office1 and Length of Time Served | Principal Occupation(s) During Past Five Years | Number of Portfolios in Fund Complex Overseen by Trustee | Other Directorships Held by Trustee | ||||||||||||||||||
| W. Nicholas Thorndike c/o GMO Trust 40 Rowes Wharf Boston, MA 02110 DOB: 03/28/1933 | Trustee | Since March 2005. | Director or trustee of various corporations and charitable organizations, including Courier Corporation (a book publisher and manufacturer) (July 1989 – present); Putnam Funds (December 1992 – June 2004); and Providence Journal (a newspaper publisher) (December 1986 – December 2003). | 59 | Director of Courier Corporation (a book publisher and manufacturer); Member of the Investment Committee of Partners HealthCare System, Inc.3 | ||||||||||||||||||
| Peter Tufano c/o GMO Trust 40 Rowes Wharf Boston, MA 02110 DOB: 04/22/1957 | Trustee | Since December 2008. | Sylvan C. Coleman Professor of Financial Management, Harvard Business School (since 1989). | 59 | Trustee of State Street Navigator Securities Lending Trust (3 Portfolios). | ||||||||||||||||||
1 Each Trustee is elected to serve during the continued lifetime of the Trust until he/she dies, resigns or is removed, or if sooner, until the next meeting of Shareholders called for the purpose of electing Trustees and until the election and qualification of his/her successor.
3 Partners HealthCare System, Inc. is a client of the Manager.
26
Principal Officers:
| Name, Address, and DOB | Position(s) Held with Trust | Term of Office4 and Length of Time Served | Principal Occupation(s) During Past Five Years5 | ||||||||||||
| J.B. Kittredge DOB: 08/22/1954 | President and Chief Executive Officer | Since March 2009. | General Counsel, Grantham, Mayo, Van Otterloo & Co. LLC (October 2005 – Present); Partner, Ropes & Gray LLP. | ||||||||||||
| Sheppard N. Burnett c/o GMO Trust 40 Rowes Wharf Boston, MA 02110 DOB: 10/24/1968 | Treasurer and Chief Financial Officer | Chief Financial Officer since March 2007; Treasurer since November 2006; Assistant Treasurer, September 2004 – November 2006. | Fund Administration Staff, Grantham, Mayo, Van Otterloo & Co. LLC (June 2004 – present); Vice President, Director of Tax, Columbia Management Group (2002 – 2004). | ||||||||||||
| Brent C. Arvidson c/o GMO Trust 40 Rowes Wharf Boston, MA 02110 DOB: 06/26/1969 | Assistant Treasurer | Since August 1998. | Senior Fund Administrator, Grantham, Mayo, Van Otterloo & Co. LLC. | ||||||||||||
| John L. Nasrah c/o GMO Trust 40 Rowes Wharf Boston, MA 02110 DOB: 05/27/1977 | Assistant Treasurer | Since March 2007. | Fund Administrator, Grantham, Mayo, Van Otterloo & Co. LLC (September 2004 – present); Tax Analyst, Bain & Company, Inc. (June 2003 – September 2004). | ||||||||||||
| Mahmoodur Rahman c/o GMO Trust 40 Rowes Wharf Boston, MA 02110 DOB: 11/30/1967 | Assistant Treasurer | Since September 2007. | Fund Administrator, Grantham, Mayo, Van Otterloo & Co. LLC (April 2007 – present); Vice President and Senior Tax Manager, Massachusetts Financial Services Company (January 2000 – April 2007). | ||||||||||||
| Michael E. Gillespie c/o GMO Trust 40 Rowes Wharf Boston, MA 02110 DOB: 02/18/1958 | Chief Compliance Officer | Since March 2005. | Vice President of Compliance (June 2004 – February 2005) and Director of Domestic Compliance (March 2002 – June 2004), Fidelity Investments. | ||||||||||||
4 Each officer is elected to hold such office until his or her successor is duly elected and qualified to carry out the duties and responsibilities of the office, or until he or she resigns or is removed from office.
5 Each of Messrs. Burnett, Arvidson, Bohan, and Pottle serves as an officer and/or director of certain pooled investment vehicles of which GMO or an affiliate of GMO serves as the investment adviser.
27
Principal Officers — (Continued)
| Name, Address, and DOB | Position(s) Held with Trust | Term of Office4 and Length of Time Served | Principal Occupation(s) During Past Five Years5 | ||||||||||||
| Jason B. Harrison c/o GMO Trust 40 Rowes Wharf Boston, MA 02110 DOB: 01/29/1977 | Vice President and Clerk | Vice President since November 2006; Clerk since March 2006. | Legal Counsel, Grantham, Mayo, Van Otterloo & Co. LLC (since February 2006) and Attorney, Ropes & Gray LLP (September 2002 – February 2006). | ||||||||||||
| David L. Bohan c/o GMO Trust 40 Rowes Wharf Boston, MA 02110 DOB: 06/21/1964 | Vice President and Assistant Clerk | Vice President since March 2005; Assistant Clerk since March 2006. | Legal Counsel, Grantham, Mayo, Van Otterloo & Co. LLC. | ||||||||||||
| Gregory L. Pottle c/o GMO Trust 40 Rowes Wharf Boston, MA 02110 DOB: 07/09/1971 | Vice President and Assistant Clerk | Since November 2006. | Legal Counsel, Grantham, Mayo, Van Otterloo & Co. LLC. | ||||||||||||
| Anne K. Trinque c/o GMO Trust 40 Rowes Wharf Boston, MA 02110 DOB: 04/15/1978 | Vice President and Assistant Clerk | Since September 2007. | Legal Counsel, Grantham, Mayo, Van Otterloo & Co. LLC (January 2007 – present); Attorney, Goodwin Procter LLP (September 2003 – January 2007). | ||||||||||||
| Cheryl Wakeham c/o GMO Trust 40 Rowes Wharf Boston, MA 02110 DOB: 10/29/1958 | Vice President and Anti-Money Laundering Officer | Since December 2004. | Manager, Client Service Administration, Grantham, Mayo, Van Otterloo & Co. LLC. | ||||||||||||
4 Each officer is elected to hold such office until his or her successor is duly elected and qualified to carry out the duties and responsibilities of the office, or until he or she resigns or is removed from office.
5 Each of Messrs. Burnett, Arvidson, Bohan, and Pottle serves as an officer and/or director of certain pooled investment vehicles of which GMO or an affiliate of GMO serves as the investment adviser.
28
GMO Foreign Small Companies Fund
(A Series of GMO Trust)
Annual Report
February 28, 2009
For a free copy of the Fund's proxy voting guidelines, shareholders may call 1-617-346-7646 (collect) or visit the Securities and Exchange Commission's website at www.sec.gov. Information regarding how the Fund voted proxies relating to portfolio securities during the most recent 12-month period ended June 30 is available on GMO's website at www.gmo.com, or on the Securities and Exchange Commission's website at www.sec.gov.
The Fund files its complete schedule of portfolio holdings with the Securities and Exchange Commission for the first and third quarter of each fiscal year on Form N-Q, which is available on the Commission's website at www.sec.gov. The Fund's Form N-Q may be reviewed and copied at the Commission's Public Reference Room in Washington, D.C. Information on the operation of the Public Reference Room may be obtained by calling 1-800-SEC-0330. The Fund has a policy with respect to disclosure of portfolio holdings under which it may also make available on GMO's website at www.gmo.com a complete schedule of portfolio holdings.
This report is prepared for the general information of shareholders. It is authorized for distribution to prospective investors only when preceded or accompanied by a prospectus for the GMO Trust, which contains a complete discussion of the risks associated with an investment in this Fund and other important information. The GMO Trust prospectus can be obtained at www.gmo.com.
GMO Foreign Small Companies Fund
(A Series of GMO Trust)
Portfolio Management
Day-to-day management of the Fund's portfolio is the responsibility of the International Active team at Grantham, Mayo, Van Otterloo & Co. LLC.
Management Discussion and Analysis of Fund Performance
The Class III shares of the GMO Foreign Small Companies Fund returned -51.3% for the fiscal year ended February 28, 2009, as compared to -53.2% for the S&P Developed ex-U.S. Small Cap Index (formerly S&P/Citigroup EMI World ex-U.S. Index). Consistent with the Fund's investment objectives and policies, the Fund was invested substantially in equity securities of small companies in countries outside of the U.S. throughout the period.
Stock selection subtracted 1.8% from returns for the fiscal year. Stock selection underperformed in Japan, Germany, and the emerging markets. Stock selection outperformed in the United Kingdom and Australia.
Country selection added 3.7% to performance for the fiscal year. The largest positive impact from country selection came from an underweight position in Australia, which added 0.8% to returns.
The views expressed herein are exclusively those of Grantham, Mayo, Van Otterloo & Co. LLC Management as of the date of this report and are subject to change. GMO disclaims any responsibility to update such views. They are not meant as investment advice.

Performance data quoted represents past performance and is not indicative of future results. The investment return and principal value of an investment will fluctuate so that an investor's shares, when redeemed, may be worth more or less than their original cost. Current performance data may be lower or higher than the performance data provided herein. To obtain performance information to the most recent month-end, visit www.gmo.com. Performance shown is net of all fees after reimbursement from the Manager. Each performance figure assumes a purchase at the beginning and redemption at the end of the stated period and reflects a transaction fee of .50% on the purchase and .50% on the redemption. Transaction fees are retained by the Fund to cover trading costs. Returns would have been lower had certain expenses not been reimbursed during the periods shown and do not include the effect of taxes on distributions and redemptions. The Fund commenced operations on June 30, 2000 subsequent to a transaction involving, in essence, the reorganization of the GMO Small Cap Active Pool of the Common Fund for Non-Profit Organizations (the "GMO Pool") as the GMO Foreign Small Companies Fund. All information relating to the time periods prior to June 30, 2000 relates to the GMO Pool. All information is unaudited. Performance for Class IV shares will vary due to different fees.
GMO Foreign Small Companies Fund
(A Series of GMO Trust)
Investments Concentration Summary
February 28, 2009 (Unaudited)
| Asset Class Summary | % of Total Net Assets | ||||||
| Common Stocks | 92.5 | % | |||||
| Short-Term Investments | 5.2 | ||||||
| Preferred Stocks | 0.3 | ||||||
| Rights and Warrants | 0.0 | ||||||
| Other | 2.0 | ||||||
| 100.0 | % | ||||||
| Country Summary | % of Equity Investments | ||||||
| Japan | 28.1 | % | |||||
| United Kingdom | 23.8 | ||||||
| France | 7.1 | ||||||
| Switzerland | 5.3 | ||||||
| Germany | 4.8 | ||||||
| Italy | 4.6 | ||||||
| Canada | 3.3 | ||||||
| Finland | 2.9 | ||||||
| South Korea | 2.6 | ||||||
| Hong Kong | 2.1 | ||||||
| Netherlands | 2.1 | ||||||
| Sweden | 2.0 | ||||||
| Norway | 1.9 | ||||||
| Australia | 1.8 | ||||||
| Spain | 1.6 | ||||||
| Singapore | 1.0 | ||||||
| Taiwan | 1.0 | ||||||
| China | 0.6 | ||||||
| Belgium | 0.5 | ||||||
| Philippines | 0.5 | ||||||
| Brazil | 0.4 | ||||||
| Greece | 0.4 | ||||||
| Mexico | 0.4 | ||||||
| Thailand | 0.3 | ||||||
| Austria | 0.2 | ||||||
| Indonesia | 0.2 | ||||||
| Ireland | 0.2 | ||||||
| Malaysia | 0.2 | ||||||
| New Zealand | 0.1 | ||||||
| India | 0.0 | ||||||
| 100.0 | % | ||||||
1
GMO Foreign Small Companies Fund
(A Series of GMO Trust)
Investments Concentration Summary — (Continued)
February 28, 2009 (Unaudited)
| Industry Sector Summary | % of Equity Investments | ||||||
| Industrials | 21.1 | % | |||||
| Consumer Discretionary | 15.0 | ||||||
| Financials | 14.7 | ||||||
| Information Technology | 11.3 | ||||||
| Consumer Staples | 10.9 | ||||||
| Health Care | 9.4 | ||||||
| Energy | 6.7 | ||||||
| Materials | 6.3 | ||||||
| Utilities | 3.2 | ||||||
| Telecommunication Services | 1.4 | ||||||
| 100.0 | % | ||||||
2
GMO Foreign Small Companies Fund
(A Series of GMO Trust)
Schedule of Investments
(showing percentage of total net assets)
February 28, 2009
| Shares | Description | Value ($) | |||||||||||||
| COMMON STOCKS — 92.5% | |||||||||||||||
| Australia — 1.7% | |||||||||||||||
| 140,000 | Aristocrat Leisure Ltd | 327,108 | |||||||||||||
| 235,814 | Australian Vintage Ltd * | 24,021 | |||||||||||||
| 359,197 | Consolidated Rutile Ltd | 65,967 | |||||||||||||
| 344,215 | Fairfax Media Ltd (a) | 165,081 | |||||||||||||
| 232,073 | Goodman Group | 37,322 | |||||||||||||
| 397,700 | Insurance Australia Group Ltd | 862,108 | |||||||||||||
| 82,500 | Insurance Australia Group Ltd (Placement Shares) | 178,311 | |||||||||||||
| 425,860 | Iress Market Technology Ltd | 1,418,795 | |||||||||||||
| 322,000 | Metcash Ltd | 855,382 | |||||||||||||
| 666,100 | Tatts Group Ltd | 1,206,298 | |||||||||||||
| 133,600 | West Australian Newspapers Holdings Ltd | 383,566 | |||||||||||||
| Total Australia | 5,523,959 | ||||||||||||||
| Austria — 0.2% | |||||||||||||||
| 17,607 | Flughafen Wien AG | 477,812 | |||||||||||||
| 29,800 | Wienerberger AG | 239,983 | |||||||||||||
| Total Austria | 717,795 | ||||||||||||||
| Belgium — 0.5% | |||||||||||||||
| 86,840 | AGFA-Gevaert NV * | 195,555 | |||||||||||||
| 14,000 | Bekaert NV | 679,766 | |||||||||||||
| 22,954 | Omega Pharma SA | 609,682 | |||||||||||||
| Total Belgium | 1,485,003 | ||||||||||||||
| Brazil — 0.4% | |||||||||||||||
| 450,000 | Cia Hering * | 1,223,133 | |||||||||||||
| Canada — 3.0% | |||||||||||||||
| 199,800 | Flint Energy Services Ltd * | 783,683 | |||||||||||||
| 350,800 | Gammon Gold Inc * | 2,757,428 | |||||||||||||
| 93,900 | ING Canada Inc | 2,412,821 | |||||||||||||
| 90,600 | KAP Resources Ltd (a) (b) * | 712 | |||||||||||||
| 291,800 | Kingsway Financial Services Inc | 516,075 | |||||||||||||
See accompanying notes to the financial statements.
3
GMO Foreign Small Companies Fund
(A Series of GMO Trust)
Schedule of Investments — (Continued)
(showing percentage of total net assets)
February 28, 2009
| Shares | Description | Value ($) | |||||||||||||
| Canada — continued | |||||||||||||||
| 246,000 | Linamar Corp | 645,842 | |||||||||||||
| 96,000 | Penn West Energy Trust | 845,905 | |||||||||||||
| 300,000 | Precision Drilling Trust | 870,146 | |||||||||||||
| 45,000 | TransCanada Corp | 1,092,989 | |||||||||||||
| Total Canada | 9,925,601 | ||||||||||||||
| China — 0.5% | |||||||||||||||
| 5,874,000 | Uni-President China Holding Ltd * | 1,787,214 | |||||||||||||
| Finland — 2.7% | |||||||||||||||
| 45,121 | Atria Group Plc | 457,137 | |||||||||||||
| 143,072 | Hk-Ruokatalo Oyj Class A | 765,857 | |||||||||||||
| 170,086 | KCI Konecranes Oyj | 2,754,586 | |||||||||||||
| 68,383 | Marimekko Oyj | 699,063 | |||||||||||||
| 139,129 | Nokian Renkaat Oyj | 1,638,807 | |||||||||||||
| 100,000 | Oriola-KD Oyj Class B | 237,563 | |||||||||||||
| 26,600 | Outokumpu Oyj | 269,096 | |||||||||||||
| 65,000 | Tietoenator Oyj | 810,531 | |||||||||||||
| 47,700 | Uponor Oyj | 480,889 | |||||||||||||
| 144,205 | YIT Oyj | 864,463 | |||||||||||||
| Total Finland | 8,977,992 | ||||||||||||||
| France — 6.6% | |||||||||||||||
| 116,288 | Boursorama * | 685,109 | |||||||||||||
| 65,100 | Cap Gemini SA | 1,865,677 | |||||||||||||
| 3,200 | Casino Guichard-Perrachon SA | 197,700 | |||||||||||||
| 17,000 | CNP Assurances | 1,093,450 | |||||||||||||
| 6,450 | Damartex SA | 87,016 | |||||||||||||
| 73,000 | Essilor International SA | 2,519,382 | |||||||||||||
| 45,267 | Eurazeo | 1,054,835 | |||||||||||||
| 5,400 | Gaumont SA | 283,337 | |||||||||||||
| 48,156 | JC Decaux SA | 613,019 | |||||||||||||
| 46,712 | Klepierre | 944,889 | |||||||||||||
| 3,075 | Lisi | 102,177 | |||||||||||||
See accompanying notes to the financial statements.
4
GMO Foreign Small Companies Fund
(A Series of GMO Trust)
Schedule of Investments — (Continued)
(showing percentage of total net assets)
February 28, 2009
| Shares | Description | Value ($) | |||||||||||||
| France — continued | |||||||||||||||
| 34,866 | Neopost SA | 2,530,122 | |||||||||||||
| 11,272 | Societe BIC SA | 549,379 | |||||||||||||
| 44,600 | Sodexo | 2,040,809 | |||||||||||||
| 171,872 | TF1 SA | 1,383,301 | |||||||||||||
| 21,000 | Thales SA | 842,916 | |||||||||||||
| 38,672 | Virbac SA | 2,757,761 | |||||||||||||
| 71,141 | Zodiac SA | 2,143,874 | |||||||||||||
| Total France | 21,694,753 | ||||||||||||||
| Germany — 4.1% | |||||||||||||||
| 13,164 | Adidas AG | 378,442 | |||||||||||||
| 7,827 | Axel Springer AG | 529,704 | |||||||||||||
| 119,755 | Cat Oil AG * | 309,529 | |||||||||||||
| 24,800 | Celesio AG | 518,015 | |||||||||||||
| 41,200 | Commerzbank AG | 142,059 | |||||||||||||
| 170,300 | Francotyp-Postalia Holdings AG | 119,327 | |||||||||||||
| 35,900 | Fraport AG | 1,086,982 | |||||||||||||
| 18,900 | Fresenius Medical Care AG & Co | 768,465 | |||||||||||||
| 108,500 | Gagfah SA | 328,939 | |||||||||||||
| 83,100 | Gerresheimer AG | 1,761,421 | |||||||||||||
| 21,515 | Grenkeleasing AG | 577,611 | |||||||||||||
| 65,220 | Heidelberger Druckmaschinen AG | 269,488 | |||||||||||||
| 523,600 | Infineon Technologies AG * | 317,625 | |||||||||||||
| 10,900 | MAN AG | 438,745 | |||||||||||||
| 55,446 | Nemetschek AG | 493,883 | |||||||||||||
| 508,500 | Patrizia Immobilien AG * | 959,692 | |||||||||||||
| 4,788 | Puma AG Rudolf Dassler Sport | 715,652 | |||||||||||||
| 42,600 | Rheinmetall AG | 1,391,420 | |||||||||||||
| 264,300 | Symrise AG | 2,424,674 | |||||||||||||
| Total Germany | 13,531,673 | ||||||||||||||
| Greece — 0.3% | |||||||||||||||
| 57,645 | Bank of Cyprus Public Co Ltd | 118,644 | |||||||||||||
| 75,000 | Metka SA | 538,531 | |||||||||||||
See accompanying notes to the financial statements.
5
GMO Foreign Small Companies Fund
(A Series of GMO Trust)
Schedule of Investments — (Continued)
(showing percentage of total net assets)
February 28, 2009
| Shares | Description | Value ($) | |||||||||||||
| Greece — continued | |||||||||||||||
| 64,600 | Mytilineos Holdings SA | 270,373 | |||||||||||||
| 43,100 | Piraeus Bank SA | 208,982 | |||||||||||||
| Total Greece | 1,136,530 | ||||||||||||||
| Hong Kong — 1.9% | |||||||||||||||
| 3,498,686 | Hong Kong & Shanghai Hotels | 2,093,866 | |||||||||||||
| 1,801,307 | Industrial & Commercial Bank of China | 1,668,344 | |||||||||||||
| 6,800,000 | Ming An Holdings Co Ltd (The) | 631,665 | |||||||||||||
| 7,472,000 | TPV Technology Ltd | 1,927,338 | |||||||||||||
| Total Hong Kong | 6,321,213 | ||||||||||||||
| India — 0.0% | |||||||||||||||
| 100,000 | Welspun Gujarat Stahl Ltd | �� | 119,041 | ||||||||||||
| Indonesia — 0.2% | |||||||||||||||
| 1,600,000 | United Tractors Tbk PT | 703,625 | |||||||||||||
| Ireland — 0.2% | |||||||||||||||
| 40,500 | DCC Plc | 550,201 | |||||||||||||
| Italy — 4.3% | |||||||||||||||
| 255,300 | Arnoldo Mondadori Editore SPA | 766,322 | |||||||||||||
| 77,000 | Banco Popolare Scarl | 293,621 | |||||||||||||
| 112,900 | Brembo SPA | 422,001 | |||||||||||||
| 128,900 | Buzzi Unicem SPA | 1,199,860 | |||||||||||||
| 351,300 | Campari | 1,901,734 | |||||||||||||
| 182,000 | Credito Emiliano SPA | 565,105 | |||||||||||||
| 112,616 | Finmeccanica SPA | 1,435,113 | |||||||||||||
| 212,016 | Grouppo Editoriale L'Espresso | 200,996 | |||||||||||||
| 883,700 | IFIL SPA | 1,668,479 | |||||||||||||
| 255,700 | Indesit Company SPA | 734,134 | |||||||||||||
| 71,900 | Italcementi SPA | 640,775 | |||||||||||||
| 192,742 | Mediaset SPA | 855,343 | |||||||||||||
| 50,000 | Saipem SPA | 772,484 | |||||||||||||
See accompanying notes to the financial statements.
6
GMO Foreign Small Companies Fund
(A Series of GMO Trust)
Schedule of Investments — (Continued)
(showing percentage of total net assets)
February 28, 2009
| Shares | Description | Value ($) | |||||||||||||
| Italy — continued | |||||||||||||||
| 1,408,664 | Telecom Italia SPA-Di RISP | 1,339,733 | |||||||||||||
| 137,600 | Unione di Banche Italiane ScpA | 1,301,148 | |||||||||||||
| Total Italy | 14,096,848 | ||||||||||||||
| Japan — 26.1% | |||||||||||||||
| 500,000 | Capcom | 9,491,787 | |||||||||||||
| 1,400,000 | Daicel Chemical Industries Ltd | 4,866,615 | |||||||||||||
| 400 | EPS Co Ltd | 1,626,241 | |||||||||||||
| 247 | Global One REIT Co Ltd | 1,532,207 | |||||||||||||
| 180,000 | Hisamitsu Pharmaceutical Co Inc | 5,436,079 | |||||||||||||
| 275,000 | Hitachi Chemical Co Ltd | 2,747,455 | |||||||||||||
| 250,000 | Hitachi Transport System Ltd | 2,279,183 | |||||||||||||
| 430,000 | Izumi Co Ltd | 4,481,664 | |||||||||||||
| 600,000 | J-Oil Mills Inc | 1,604,981 | |||||||||||||
| 250 | Japan Retail Fund Investment Corp REIT | 809,228 | |||||||||||||
| 175,000 | K's Holdings Corp | 2,091,463 | |||||||||||||
| 540,000 | Keiyo Bank Ltd (The) | 2,479,744 | |||||||||||||
| 225,000 | KOSE Corp | 4,662,649 | |||||||||||||
| 117,000 | Kyorin Co Ltd | 1,448,318 | |||||||||||||
| 375,000 | Kyowa Exeo Corp | 3,066,201 | |||||||||||||
| 89,900 | Mitsubishi UFJ Lease & Finance Co Ltd | 1,564,480 | |||||||||||||
| 380,000 | Nabtesco Corp | 2,319,729 | |||||||||||||
| 535,000 | NHK Spring Co Ltd | 1,809,065 | |||||||||||||
| 23,500 | Obic Co Ltd | 3,100,048 | |||||||||||||
| 525,000 | Rohto Pharmaceutical Co Ltd | 5,564,261 | |||||||||||||
| 550 | Seven Bank Ltd | 1,509,168 | |||||||||||||
| 250,000 | Shimachu Co Ltd | 3,851,306 | |||||||||||||
| 350,000 | Shimadzu Corp | 2,186,620 | |||||||||||||
| 1,400,000 | Snow Brand Milk Products Co Ltd | 3,766,087 | |||||||||||||
| 180,000 | Sumitomo Rubber Industries | 1,136,526 | |||||||||||||
| 440,000 | Toyo Suisan Kaisha Ltd | 10,413,299 | |||||||||||||
| Total Japan | 85,844,404 | ||||||||||||||
| Malaysia — 0.2% | |||||||||||||||
| 600,000 | IJM Corp Berhad | 593,527 | |||||||||||||
See accompanying notes to the financial statements.
7
GMO Foreign Small Companies Fund
(A Series of GMO Trust)
Schedule of Investments — (Continued)
(showing percentage of total net assets)
February 28, 2009
| Shares | Description | Value ($) | |||||||||||||
| Mexico — 0.4% | |||||||||||||||
| 2,405,600 | Genomma Lab Internacional SA Class B * | 1,262,032 | |||||||||||||
| Netherlands — 1.9% | |||||||||||||||
| 61,600 | Imtech NV | 781,356 | |||||||||||||
| 55,600 | Koninklijke DSM NV | 1,270,653 | |||||||||||||
| 77,756 | Koninklijke Ten Cate NV | 1,175,686 | |||||||||||||
| 34,621 | Randstad Holdings NV | 502,308 | |||||||||||||
| 126,600 | SBM Offshore NV | 1,656,250 | |||||||||||||
| 236,300 | SNS Reaal NV | 877,529 | |||||||||||||
| Total Netherlands | 6,263,782 | ||||||||||||||
| New Zealand — 0.1% | |||||||||||||||
| 413,300 | Air New Zealand | 168,934 | |||||||||||||
| Norway — 1.8% | |||||||||||||||
| 1,228,334 | Ability Drilling ASA * | 451,979 | |||||||||||||
| 405,000 | DNO International ASA * | 246,802 | |||||||||||||
| 3,283,000 | Dockwise Ltd * | 2,421,961 | |||||||||||||
| 1,669,085 | Prosafe Production Public Ltd * | 2,708,861 | |||||||||||||
| Total Norway | 5,829,603 | ||||||||||||||
| Philippines — 0.5% | |||||||||||||||
| 12,800,000 | Aboitiz Power Corp | 1,088,512 | |||||||||||||
| 5,100,000 | Alliance Global Group Inc * | 154,380 | |||||||||||||
| 23,400,000 | Pepsi-Cola Products Philippines Inc | 409,008 | |||||||||||||
| Total Philippines | 1,651,900 | ||||||||||||||
| Singapore — 1.0% | |||||||||||||||
| 1,472,500 | Anwell Technologies Ltd * | 218,056 | |||||||||||||
| 490,000 | Banyan Tree Holdings Inc | 122,836 | |||||||||||||
| 3,039,000 | Chemoil Energy Ltd | 678,305 | |||||||||||||
| 2,815,000 | Financial One Corp | 279,363 | |||||||||||||
| 2,950,000 | First Ship Lease Trust | 652,231 | |||||||||||||
| 2,522,000 | LMA International NV * | 199,446 | |||||||||||||
| 934,000 | People's Food Holdings Ltd | 382,833 | |||||||||||||
See accompanying notes to the financial statements.
8
GMO Foreign Small Companies Fund
(A Series of GMO Trust)
Schedule of Investments — (Continued)
(showing percentage of total net assets)
February 28, 2009
| Shares | Description | Value ($) | |||||||||||||
| Singapore — continued | |||||||||||||||
| 1,703,000 | Petra Foods Ltd | 351,108 | |||||||||||||
| 298,000 | SembCorp Marine Ltd | 264,393 | |||||||||||||
| Total Singapore | 3,148,571 | ||||||||||||||
| South Korea — 2.4% | |||||||||||||||
| 92,823 | Busan Bank | 307,664 | |||||||||||||
| 15,000 | Cheil Industries Inc | 355,879 | |||||||||||||
| 227,549 | Handsome Corp | 1,148,042 | |||||||||||||
| 2,978 | Hite Brewery Co Ltd | 262,118 | |||||||||||||
| 49,900 | Korea Electric Terminal Co | 481,926 | |||||||||||||
| 220,963 | Kortek Corp | 789,870 | |||||||||||||
| 15,100 | Nong Shim Co Ltd | 2,229,376 | |||||||||||||
| 13,580 | Pulmuone Holdings Co Ltd | 673,852 | |||||||||||||
| 52,200 | Samsung Card Co Ltd | 896,694 | |||||||||||||
| 12,307 | Samsung Digital Imaging Co Ltd (a) * | 125,060 | |||||||||||||
| 27,393 | Samsung Techwin Co Ltd | 535,010 | |||||||||||||
| Total South Korea | 7,805,491 | ||||||||||||||
| Spain — 1.5% | |||||||||||||||
| 50,000 | Grifols SA | 783,875 | |||||||||||||
| 159,000 | Mapfre SA | 323,241 | |||||||||||||
| 26,000 | Red Electrica de Espana | 1,042,750 | |||||||||||||
| 22,000 | Tecnicas Reunidas SA | 611,036 | |||||||||||||
| 96,592 | Union Fenosa SA | 2,176,911 | |||||||||||||
| Total Spain | 4,937,813 | ||||||||||||||
| Sweden — 1.8% | |||||||||||||||
| 170,268 | B&B Tools AB | 1,044,641 | |||||||||||||
| 145,555 | Getinge AB Class B | 1,679,395 | |||||||||||||
| 301,100 | SAAB AB Class B | 2,072,916 | |||||||||||||
| 2,322,000 | Trigon Agri A/S * | 1,282,577 | |||||||||||||
| Total Sweden | 6,079,529 | ||||||||||||||
See accompanying notes to the financial statements.
9
GMO Foreign Small Companies Fund
(A Series of GMO Trust)
Schedule of Investments — (Continued)
(showing percentage of total net assets)
February 28, 2009
| Shares | Description | Value ($) | |||||||||||||
| Switzerland — 4.9% | |||||||||||||||
| 165,080 | Bank Sarasin & Cie AG Class B (Registered) | 3,483,240 | |||||||||||||
| 7,500 | Banque Cantonale Vaudoise | 1,988,796 | |||||||||||||
| 12,970 | Geberit AG (Registered) | 1,161,774 | |||||||||||||
| 14,910 | Helvetia Patria Holding (Registered) | 2,283,181 | |||||||||||||
| 2,083 | Jelmoli Holding AG (Registered) | 801,507 | |||||||||||||
| 170,539 | Kardex AG * | 3,858,262 | |||||||||||||
| 6,470 | Swisscom AG (Registered) | 1,937,983 | |||||||||||||
| 4,394 | Valora Holding AG | 581,021 | |||||||||||||
| Total Switzerland | 16,095,764 | ||||||||||||||
| Taiwan — 0.9% | |||||||||||||||
| 42,000 | 104 Corp | 76,222 | |||||||||||||
| 1,434,840 | Advanced Semiconductor Engineering Inc | 497,058 | |||||||||||||
| 230,290 | Catcher Technology Co Ltd | 384,432 | |||||||||||||
| 3,769,280 | Gold Circuit Electronics Ltd | 776,365 | |||||||||||||
| 2,243,322 | Tsann Kuen Enterprises Co Ltd | 735,872 | |||||||||||||
| 1,339,019 | Yulon Motor Co Ltd | 548,614 | |||||||||||||
| Total Taiwan | 3,018,563 | ||||||||||||||
| Thailand — 0.3% | |||||||||||||||
| 9,520,000 | Home Product Center Pcl (Foreign Registered) (a) | 962,474 | |||||||||||||
| United Kingdom — 22.1% | |||||||||||||||
| 145,000 | AMEC Plc | 1,120,050 | |||||||||||||
| 150,000 | Amlin Plc | 731,297 | |||||||||||||
| 150,000 | Aquarius Platinum Ltd | 362,030 | |||||||||||||
| 488,989 | Balfour Beatty Plc | 2,201,615 | |||||||||||||
| 100,000 | Berkeley Group Holdings Plc (Unit Shares) * | 1,236,401 | |||||||||||||
| 179,199 | Bodycote Plc | 300,640 | |||||||||||||
| 142,613 | Bovis Homes Group Plc | 785,320 | |||||||||||||
| 583,333 | Brit Insurance Holdings Plc | 1,573,745 | |||||||||||||
| 438,800 | British Airways Plc | 851,758 | |||||||||||||
| 200,000 | Carillion Plc | 625,523 | |||||||||||||
| 250,400 | Catlin Group Ltd | 1,478,843 | |||||||||||||
| 123,888 | Chemring Group | 3,853,122 | |||||||||||||
| 468,000 | Cobham Plc | 1,284,570 | |||||||||||||
See accompanying notes to the financial statements.
10
GMO Foreign Small Companies Fund
(A Series of GMO Trust)
Schedule of Investments — (Continued)
(showing percentage of total net assets)
February 28, 2009
| Shares | Description | Value ($) | |||||||||||||
| United Kingdom — continued | |||||||||||||||
| 242,000 | Compass Group Plc | 1,063,212 | |||||||||||||
| 50,000 | Connaught Plc | 240,996 | |||||||||||||
| 134 | Consort Medical Plc | 800 | |||||||||||||
| 200,000 | Davis Service Group (Ordinary) | 653,468 | |||||||||||||
| 84,828 | De La Rue Plc | 1,246,567 | |||||||||||||
| 3,300,000 | Dimension Data Holdings Plc | 1,671,923 | |||||||||||||
| 31,660 | DS Smith Plc | 31,215 | |||||||||||||
| 11,400 | Experian Plc | 67,375 | |||||||||||||
| 95,200 | Filtrona Plc | 155,873 | |||||||||||||
| 1,253,000 | Galliford Try Plc | 706,396 | |||||||||||||
| 135,027 | Go-Ahead Group Plc | 1,760,116 | |||||||||||||
| 621,109 | Group 4 Securicor Plc | 1,641,870 | |||||||||||||
| 1,128,160 | Hays Plc | 1,223,580 | |||||||||||||
| 77,100 | Hikma Pharmaceuticals Plc | 412,664 | |||||||||||||
| 86,000 | Homeserve Plc | 1,221,142 | |||||||||||||
| 311,049 | ICAP Plc | 1,035,495 | |||||||||||||
| 143,466 | Inmarsat Plc | 879,360 | |||||||||||||
| 116,050 | International Personal Finance Plc | 186,256 | |||||||||||||
| 725,000 | John Wood Group Plc | 1,994,240 | |||||||||||||
| 115,000 | Johnson Matthey Plc | 1,596,917 | |||||||||||||
| 104,929 | Kazakhmys Plc | 387,829 | |||||||||||||
| 137,649 | Kier Group Plc | 1,763,751 | |||||||||||||
| 97,000 | Lamprell Plc | 114,744 | |||||||||||||
| 15,000 | Lonmin Plc | 214,931 | |||||||||||||
| 544,498 | Mitie Group Plc | 1,369,977 | |||||||||||||
| 207,142 | N Brown Group | 589,204 | |||||||||||||
| 101,000 | Next Plc | 1,674,877 | |||||||||||||
| 275,000 | Northumbrian Water Group Plc | 866,157 | |||||||||||||
| 497,357 | Pennon Group Plc | 3,067,793 | |||||||||||||
| 196,076 | Petrofac Ltd | 1,309,645 | |||||||||||||
| 305,555 | Playtech Ltd | 1,574,145 | |||||||||||||
| 57,500 | Provident Financial Plc | 669,295 | |||||||||||||
| 472,187 | PZ Cussons Plc | 1,121,388 | |||||||||||||
| 600,000 | Qinetiq Group Plc | 1,182,960 | |||||||||||||
| 750,000 | RM Plc | 1,819,385 | |||||||||||||
See accompanying notes to the financial statements.
11
GMO Foreign Small Companies Fund
(A Series of GMO Trust)
Schedule of Investments — (Continued)
(showing percentage of total net assets)
February 28, 2009
| Shares | Description | Value ($) | |||||||||||||
| United Kingdom — continued | |||||||||||||||
| 1,091,496 | RSA Insurance Group Plc | 2,134,023 | |||||||||||||
| 1,000,000 | Sage Group Plc | 2,422,983 | |||||||||||||
| 275,000 | Savills Plc | 1,137,725 | |||||||||||||
| 22,000 | Schroders Plc | 228,362 | |||||||||||||
| 195,858 | Segro Plc | 298,504 | |||||||||||||
| 419,930 | Serco Group Plc | 2,311,085 | |||||||||||||
| 90,000 | Severn Trent (Ordinary Shares) | 1,395,084 | |||||||||||||
| 69,000 | Shire Plc | 818,040 | |||||||||||||
| 110,288 | Smith News Plc | 91,307 | |||||||||||||
| 23,796 | Soco International Plc * | 401,370 | |||||||||||||
| 719,500 | Spice Plc | 400,581 | |||||||||||||
| 250,000 | Stagecoach Group Plc | 411,191 | |||||||||||||
| 307,600 | Total Produce Plc | 81,467 | |||||||||||||
| 110,181 | Travis Perkins Plc | 510,541 | |||||||||||||
| 601,129 | TT Group Plc | 186,315 | |||||||||||||
| 151,104 | Tullow Oil Plc | 1,569,189 | |||||||||||||
| 130,700 | Ultra Electronics Holdings | 2,051,419 | |||||||||||||
| 221,206 | United Business Media Ltd | 1,304,367 | |||||||||||||
| 59,135 | Venture Production (Ordinary Shares) | 429,189 | |||||||||||||
| 235,661 | VT Group Plc | 1,648,131 | |||||||||||||
| 177,097 | WH Smith Plc | 849,054 | |||||||||||||
| 33,800 | Wolseley Plc | 85,361 | |||||||||||||
| Total United Kingdom | 72,685,748 | ||||||||||||||
| TOTAL COMMON STOCKS (COST $481,186,820) | 304,142,716 | ||||||||||||||
| PREFERRED STOCKS — 0.3% | |||||||||||||||
| Germany — 0.3% | |||||||||||||||
| 554,574 | ProSiebenSat.1 Media AG 91.24% | 964,248 | |||||||||||||
| Italy — 0.0% | |||||||||||||||
| 8,500 | Exor SPA * | 36,304 | |||||||||||||
| TOTAL PREFERRED STOCKS (COST $4,656,258) | 1,000,552 | ||||||||||||||
See accompanying notes to the financial statements.
12
GMO Foreign Small Companies Fund
(A Series of GMO Trust)
Schedule of Investments — (Continued)
(showing percentage of total net assets)
February 28, 2009
| Shares / Par Value ($) | Description | Value ($) | |||||||||||||
| RIGHTS AND WARRANTS — 0.0% | |||||||||||||||
| Malaysia — 0.0% | |||||||||||||||
| 70,000 | IJM Land Berhad Warrants, Expires 09/11/13 * | 3,399 | |||||||||||||
| TOTAL RIGHTS AND WARRANTS (COST $1,435) | 3,399 | ||||||||||||||
| SHORT-TERM INVESTMENTS — 5.2% | |||||||||||||||
| 1,996,378 | Banco Santander Time Deposit, 0.53%, due 03/02/09 | 1,996,378 | |||||||||||||
| 67,434 | Bank of Tokyo-Mitsubishi Time Deposit, 0.08%, due 03/02/09 | 67,434 | |||||||||||||
| 2,000,000 | BNP Paribas Time Deposit, 0.23%, due 03/02/09 | 2,000,000 | |||||||||||||
| 2,000,000 | Branch Banking & Trust Time Deposit, 0.13%, due 03/02/09 | 2,000,000 | |||||||||||||
| 1,996,378 | Citibank Time Deposit, 0.53%, due 03/02/09 | 1,996,378 | |||||||||||||
| 2,000,000 | HSBC Bank (USA) Time Deposit, 0.19%, due 03/02/09 | 2,000,000 | |||||||||||||
| 1,140,783 | JPMorgan Chase Time Deposit, 0.09%-0.53%, due 03/02/09 | 1,140,783 | |||||||||||||
| 2,100,000 | Royal Bank of Canada Time Deposit, 0.20%, due 03/02/09 | 2,100,000 | |||||||||||||
| 3,996,378 | Societe Generale Time Deposit, 0.25%-0.53%, due 03/02/09 | 3,996,378 | |||||||||||||
| TOTAL SHORT-TERM INVESTMENTS (COST $17,297,351) | 17,297,351 | �� | |||||||||||||
| TOTAL INVESTMENTS — 98.0% (Cost $503,141,864) | 322,444,018 | ||||||||||||||
| Other Assets and Liabilities (net) — 2.0% | 6,418,173 | ||||||||||||||
| TOTAL NET ASSETS — 100.0% | $ | 328,862,191 | |||||||||||||
Notes to Schedule of Investments:
* Non-income producing security.
(a) Security valued at fair value using methods determined in good faith by or at the direction of the Trustees of GMO Trust (Note 2).
(b) Bankrupt issuer.
See accompanying notes to the financial statements.
13
GMO Foreign Small Companies Fund
(A Series of GMO Trust)
Statement of Assets and Liabilities — February 28, 2009
| Assets: | |||||||
| Investments, at value (cost $503,141,864) (Note 2) | $ | 322,444,018 | |||||
| Cash | 4,922,383 | ||||||
| Foreign currency, at value (cost $697,105) (Note 2) | 662,576 | ||||||
| Receivable for investments sold | 1,156,614 | ||||||
| Dividends and interest receivable | 737,078 | ||||||
| Foreign taxes receivable | 192,999 | ||||||
| Receivable for expenses reimbursed by Manager (Note 3) | 22,376 | ||||||
| Miscellaneous receivable | 1,024,735 | ||||||
| Total assets | 331,162,779 | ||||||
| Liabilities: | |||||||
| Payable for investments purchased | 948,509 | ||||||
| Payable to affiliate for (Note 3): | |||||||
| Management fee | 189,593 | ||||||
| Shareholder service fee | 33,043 | ||||||
| Trustees and Chief Compliance Officer of GMO Trust fees | 1,286 | ||||||
| Miscellaneous payable | 835,717 | ||||||
| Accrued expenses | 292,440 | ||||||
| Total liabilities | 2,300,588 | ||||||
| Net assets | $ | 328,862,191 | |||||
| Net assets consist of: | |||||||
| Paid-in capital | $ | 596,428,078 | |||||
| Distributions in excess of net investment income | (2,263,216 | ) | |||||
| Distributions in excess of net realized gain | (84,418,562 | ) | |||||
| Net unrealized depreciation | (180,884,109 | ) | |||||
| $ | 328,862,191 | ||||||
| Net assets attributable to: | |||||||
| Class III shares | $ | 185,297,727 | |||||
| Class IV shares | $ | 143,564,464 | |||||
| Shares outstanding: | |||||||
| Class III | 28,901,376 | ||||||
| Class IV | 22,361,691 | ||||||
| Net asset value per share: | |||||||
| Class III | $ | 6.41 | |||||
| Class IV | $ | 6.42 | |||||
See accompanying notes to the financial statements.
14
GMO Foreign Small Companies Fund
(A Series of GMO Trust)
Statement of Operations — Year Ended February 28, 2009
| Investment Income: | |||||||
| Dividends (net of withholding taxes of $2,329,701) | $ | 22,940,073 | |||||
| Securities lending income | 1,272,055 | ||||||
| Interest | 985,697 | ||||||
| Total investment income | 25,197,825 | ||||||
| Expenses: | |||||||
| Management fee (Note 3) | 5,028,384 | ||||||
| Shareholder service fee – Class III (Note 3) | 373,554 | ||||||
| Shareholder service fee – Class IV (Note 3) | 469,305 | ||||||
| Custodian and fund accounting agent fees | 670,764 | ||||||
| Transfer agent fees | 41,646 | ||||||
| Audit and tax fees | 86,000 | ||||||
| Legal fees | 17,968 | ||||||
| Trustees fees and related expenses (Note 3) | 9,256 | ||||||
| Registration fees | 460 | ||||||
| Miscellaneous | 14,049 | ||||||
| Total expenses | 6,711,386 | ||||||
| Fees and expenses reimbursed by Manager (Note 3) | (798,420 | ) | |||||
| Expense reductions (Note 2) | (25,053 | ) | |||||
| Net expenses | 5,887,913 | ||||||
| Net investment income (loss) | 19,309,912 | ||||||
| Realized and unrealized gain (loss): | |||||||
| Net realized gain (loss) on: | |||||||
| Investments | (81,616,379 | ) | |||||
| Foreign currency, forward contracts and foreign currency related transactions (net of CPMF tax of $139) (Note 2) | (2,867,183 | ) | |||||
| Net realized gain (loss) | (84,483,562 | ) | |||||
| Change in net unrealized appreciation (depreciation) on: | |||||||
| Investments | (363,978,849 | ) | |||||
| Foreign currency, forward contracts and foreign currency related transactions | (1,249,911 | ) | |||||
| Net unrealized gain (loss) | (365,228,760 | ) | |||||
| Net realized and unrealized gain (loss) | (449,712,322 | ) | |||||
| Net increase (decrease) in net assets resulting from operations | $ | (430,402,410 | ) | ||||
See accompanying notes to the financial statements.
15
GMO Foreign Small Companies Fund
(A Series of GMO Trust)
Statement of Changes in Net Assets
| Year Ended February 28, 2009 | Year Ended February 29, 2008 | ||||||||||
| Increase (decrease) in net assets: | |||||||||||
| Operations: | |||||||||||
| Net investment income (loss) | $ | 19,309,912 | $ | 19,366,409 | |||||||
| Net realized gain (loss) | (84,483,562 | ) | 177,097,003 | ||||||||
| Change in net unrealized appreciation (depreciation) | (365,228,760 | ) | (210,550,516 | ) | |||||||
| Net increase (decrease) in net assets from operations | (430,402,410 | ) | (14,087,104 | ) | |||||||
| Distributions to shareholders from: | |||||||||||
| Net investment income | |||||||||||
| Class III | (5,535,606 | ) | (8,928,275 | ) | |||||||
| Class IV | (7,364,331 | ) | (16,347,910 | ) | |||||||
| Total distributions from net investment income | (12,899,937 | ) | (25,276,185 | ) | |||||||
| Net realized gains | |||||||||||
| Class III | (17,878,843 | ) | (71,469,472 | ) | |||||||
| Class IV | (33,553,914 | ) | (126,085,967 | ) | |||||||
| Total distributions from net realized gains | (51,432,757 | ) | (197,555,439 | ) | |||||||
| Return of capital | |||||||||||
| Class III | (183,326 | ) | — | ||||||||
| Class IV | (243,890 | ) | — | ||||||||
| Total distributions from return of capital | (427,216 | ) | — | ||||||||
| (64,759,910 | ) | (222,831,624 | ) | ||||||||
| Net share transactions (Note 7): | |||||||||||
| Class III | 18,176,575 | 46,586,423 | |||||||||
| Class IV | (199,947,721 | ) | 79,691,450 | ||||||||
| Increase (decrease) in net assets resulting from net share transactions | (181,771,146 | ) | 126,277,873 | ||||||||
| Purchase premiums and redemption fees (Notes 2 and 7): | |||||||||||
| Class III | 14 | — | |||||||||
| Class IV | 27 | — | |||||||||
| Increase in net assets resulting from purchase premiums and redemption fees | 41 | — | |||||||||
| Total increase (decrease) in net assets resulting from net share transactions, purchase premiums and redemption fees | (181,771,105 | ) | 126,277,873 | ||||||||
| Total increase (decrease) in net assets | (676,933,425 | ) | (110,640,855 | ) | |||||||
| Net assets: | |||||||||||
| Beginning of period | 1,005,795,616 | 1,116,436,471 | |||||||||
| End of period (including distributions in excess of net investment income of $2,263,216 and $7,212,762, respectively) | $ | 328,862,191 | $ | 1,005,795,616 | |||||||
See accompanying notes to the financial statements.
16
GMO Foreign Small Companies Fund
(A Series of GMO Trust)
Financial Highlights
(For a Class III share outstanding throughout each period)
| Year Ended February 28/29, | |||||||||||||||||||||||
| 2009 | 2008 | 2007 | 2006 | 2005 | |||||||||||||||||||
| Net asset value, beginning of period | $ | 14.63 | $ | 18.38 | $ | 17.98 | $ | 17.19 | $ | 14.79 | |||||||||||||
| Income (loss) from investment operations: | |||||||||||||||||||||||
| Net investment income (loss)† | 0.30 | 0.31 | 0.28 | 0.26 | 0.26 | ||||||||||||||||||
| Net realized and unrealized gain (loss) | (7.43 | ) | (0.36 | ) | 4.51 | 3.19 | 3.76 | ||||||||||||||||
| Total from investment operations | (7.13 | ) | (0.05 | ) | 4.79 | 3.45 | 4.02 | ||||||||||||||||
| Less distributions to shareholders: | |||||||||||||||||||||||
| From net investment income | (0.27 | ) | (0.41 | ) | (0.44 | ) | (0.32 | ) | (0.38 | ) | |||||||||||||
| From net realized gains | (0.81 | ) | (3.29 | ) | (3.95 | ) | (2.34 | ) | (1.24 | ) | |||||||||||||
| Return of capital | (0.01 | ) | — | — | — | — | |||||||||||||||||
| Total distributions | (1.09 | ) | (3.70 | ) | (4.39 | ) | (2.66 | ) | (1.62 | ) | |||||||||||||
| Net asset value, end of period | $ | 6.41 | $ | 14.63 | $ | 18.38 | $ | 17.98 | $ | 17.19 | |||||||||||||
| Total Return(a) | (51.33 | )% | (1.96 | )% | 29.94 | % | 22.32 | % | 28.40 | % | |||||||||||||
| Ratios/Supplemental Data: | |||||||||||||||||||||||
| Net assets, end of period (000's) | $ | 185,298 | $ | 338,804 | $ | 375,565 | $ | 364,551 | $ | 426,758 | |||||||||||||
| Net expenses to average daily net assets | 0.85 | %(b) | 0.86 | %(b) | 0.86 | % | 0.85 | % | 0.85 | % | |||||||||||||
| Net investment income to average daily net assets | 2.59 | % | 1.69 | % | 1.53 | % | 1.52 | % | 1.71 | % | |||||||||||||
| Portfolio turnover rate | 42 | % | 42 | % | 37 | % | 40 | % | 25 | % | |||||||||||||
| Fees and expenses reimbursed by the Manager to average daily net assets: | 0.11 | % | 0.09 | % | 0.09 | % | 0.09 | % | 0.09 | % | |||||||||||||
| Purchase premiums and redemption fees consisted of the following per share amounts:† | $ | 0.00 | (c) | — | — | — | — | ||||||||||||||||
(a) The total returns would have been lower had certain expenses not been reimbursed during the periods shown and assumes the effect of reinvested distributions. Calculation excludes purchase premiums and redemption fees which are borne by the shareholder.
(b) The net expense ratio does not include the effect of expense reductions, except for reimbursements related to securities lending transactions (Note 2).
(c) Purchase premiums and redemption fees were less than $0.01 per share.
† Calculated using average shares outstanding throughout the period.
See accompanying notes to the financial statements.
17
GMO Foreign Small Companies Fund
(A Series of GMO Trust)
Financial Highlights
(For a Class IV share outstanding throughout each period)
| Year Ended February 28/29, | |||||||||||||||||||||||
| 2009 | 2008 | 2007 | 2006 | 2005 | |||||||||||||||||||
| Net asset value, beginning of period | $ | 14.64 | $ | 18.39 | $ | 17.99 | $ | 17.20 | $ | 14.80 | |||||||||||||
| Income (loss) from investment operations: | |||||||||||||||||||||||
| Net investment income (loss)† | 0.33 | 0.31 | 0.28 | 0.26 | 0.26 | ||||||||||||||||||
| Net realized and unrealized gain (loss) | (7.46 | ) | (0.35 | ) | 4.52 | 3.20 | 3.76 | ||||||||||||||||
| Total from investment operations | (7.13 | ) | (0.04 | ) | 4.80 | 3.46 | 4.02 | ||||||||||||||||
| Less distributions to shareholders: | |||||||||||||||||||||||
| From net investment income | (0.27 | ) | (0.42 | ) | (0.45 | ) | (0.33 | ) | (0.38 | ) | |||||||||||||
| From net realized gains | (0.81 | ) | (3.29 | ) | (3.95 | ) | (2.34 | ) | (1.24 | ) | |||||||||||||
| Return of capital | (0.01 | ) | — | — | — | — | |||||||||||||||||
| Total distributions | (1.09 | ) | (3.71 | ) | (4.40 | ) | (2.67 | ) | (1.62 | ) | |||||||||||||
| Net asset value, end of period | $ | 6.42 | $ | 14.64 | $ | 18.39 | $ | 17.99 | $ | 17.20 | |||||||||||||
| Total Return(a) | (51.29 | )% | (1.91 | )% | 30.00 | % | 22.37 | % | 28.44 | % | |||||||||||||
| Ratios/Supplemental Data: | |||||||||||||||||||||||
| Net assets, end of period (000's) | $ | 143,564 | $ | 666,991 | $ | 740,872 | $ | 638,634 | $ | 567,048 | |||||||||||||
| Net expenses to average daily net assets | 0.80 | %(b) | 0.81 | %(b) | 0.81 | % | 0.80 | % | 0.81 | % | |||||||||||||
| Net investment income to average daily net assets | 2.74 | % | 1.70 | % | 1.54 | % | 1.55 | % | 1.69 | % | |||||||||||||
| Portfolio turnover rate | 42 | % | 42 | % | 37 | % | 40 | % | 25 | % | |||||||||||||
| Fees and expenses reimbursed by the Manager to average daily net assets: | 0.11 | % | 0.09 | % | 0.09 | % | 0.09 | % | 0.09 | % | |||||||||||||
| Purchase premiums and redemption fees consisted of the following per share amounts:† | $ | 0.00 | (c) | — | — | — | — | ||||||||||||||||
(a) The total returns would have been lower had certain expenses not been reimbursed during the periods shown and assumes the effect of reinvested distributions. Calculation excludes purchase premiums and redemption fees which are borne by the shareholder.
(b) The net expense ratio does not include the effect of expense reductions, except for reimbursements related to securities lending transactions (Note 2).
(c) Purchase premiums and redemption fees were less than $0.01 per share.
† Calculated using average shares outstanding throughout the period.
See accompanying notes to the financial statements.
18
GMO Foreign Small Companies Fund
(A Series of GMO Trust)
Notes to Financial Statements
February 28, 2009
1. Organization
GMO Foreign Small Companies Fund (the "Fund") is a series of GMO Trust (the "Trust"). The Fund is registered under the Investment Company Act of 1940, as amended, as an open-end, diversified management investment company. The Fund is advised and managed by Grantham, Mayo, Van Otterloo & Co. LLC (the "Manager" or "GMO"). The Trust was established as a Massachusetts business trust under the laws of The Commonwealth of Massachusetts on June 24, 1985. The Declaration of Trust permits the Trustees of the Trust ("Trustees") to create an unlimited number of series of shares ("Funds") and to subdivide Funds into classes.
The Fund seeks total return in excess of that of its benchmark, the S&P Developed ex-U.S. Small Cap Index (formerly S&P/Citigroup EMI World ex-U.S. Index). The Fund typically makes equity investments in companies located or doing business outside of the U.S. that are in the smallest 25% of companies in a particular country as measured by total float-adjusted market capitalization. The Fund generally seeks to be fully invested and normally does not take temporary defensive positions, but may hold up to 10% of its total assets in cash and cash equivalents in order to manage cash inflows and outflows as a result of shareholder purchases and redemptions. The Fund may make investments in emerging countries, but these investments (excluding investments in companies from emerging countries included in the Fund's benchmark) generally will represent 10% or less of the Fund's total assets.
As of February 28, 2009, the Fund had two classes of shares outstanding: Class III and Class IV. Each class of shares bears a different level of shareholder servicing fees.
The Fund currently limits subscriptions due to capacity considerations.
2. Significant accounting policies
The following is a summary of significant accounting policies followed by the Fund in the preparation of its financial statements. These policies are in conformity with accounting principles generally accepted in the United States of America ("U.S. GAAP") and have been consistently followed by the Fund in preparing its financial statements. The preparation of financial statements in accordance with U.S. GAAP requires management to make estimates and assumptions that affect the reported amounts and disclosures in the financial statements. Actual results could differ from those estimates. The accounting records of the Fund are maintained in U.S. dollars.
Portfolio valuation
Securities listed on a securities exchange for which market quotations are readily available are valued at the last sale price or official closing price on each business day, or if there is no such reported sale or official closing price, at the most recent quoted bid price. Unlisted securities for which market quotations are readily available are generally valued at the most recent quoted bid price. Debt instruments with a remaining maturity of sixty days or less are generally valued at amortized cost, which approximates fair value. Shares of investment funds are generally valued at their net asset value. Securities for which
19
GMO Foreign Small Companies Fund
(A Series of GMO Trust)
Notes to Financial Statements — (Continued)
February 28, 2009
quotations are not readily available or whose values the Manager has determined to be unreliable are valued at fair value as determined in good faith by the Trustees or persons acting at their direction pursuant to procedures approved by the Trustees. By its nature, a fair value price is a good faith estimate of the value of a security at a given point in time and may not reflect the value that would be realized if the security were sold. The difference between a fair value price and the value realized upon a sale could be material. Because many foreign equity securities markets and exchanges close prior to the close of the New York Stock Exchange ("NYSE"), closing prices for foreign securities in those markets or on those exchanges do not reflect the events that occur after that close but before the close of the NYSE. As a result, the Fund generally values foreign equity securities using fair value prices, which are based on ad justments to closing prices supplied by a third party vendor based on that vendor's proprietary models. As of February 28, 2009, 88.58% of the net assets of the Fund were valued using fair value prices based on models used by a third party vendor.
In September 2006, the Financial Accounting Standards Board ("FASB") issued Statement of Financial Accounting Standards No. 157, Fair Value Measurements ("SFAS 157"). SFAS 157 is effective for the Fund's current fiscal year. While the adoption of SFAS 157 does not have an effect on the Fund's net asset value, it does require additional disclosures about fair value measurements. SFAS 157 establishes a three-level hierarchy for disclosure of fair value measurements. The valuation hierarchy is based upon the reliability of inputs to the valuation of the Fund's investments. The three levels are defined as follows:
Level 1 – Valuations based on quoted prices for identical securities in active markets.
Level 2 – Valuations determined using other significant direct or indirect observable inputs.
Level 3 – Valuations based on inputs that are unobservable and significant. The Fund utilized the following fair value techniques on Level 3 investments: The Fund's securities in Thailand were subject to a fair value premium adjustment upon exceeding foreign ownership limitations. The Fund also considered certain bankrupt securities to be worthless. The Fund valued Fairfax Media Ltd at the subscription price of an entitlement offer. The Fund valued Samsung Digital Imaging Co Ltd at the exchange value of a corporate action adjusted by the movement in a representative index until the security began trading.
The inputs or methodology used for valuing securities are not necessarily an indication of the risk associated with investing in those securities.
20
GMO Foreign Small Companies Fund
(A Series of GMO Trust)
Notes to Financial Statements — (Continued)
February 28, 2009
The following is a summary of the fair valuations according to inputs used as of February 28, 2009 in valuing the Fund's investments:
| Asset Valuation Inputs | Investments in Securities | Other Financial Instruments | |||||||||
| Level 1 - Quoted Prices | $ | 29,885,714 | $ | — | |||||||
| Level 2 - Other Significant Observable Inputs | 291,304,977 | — | |||||||||
| Level 3 - Significant Unobservable Inputs | 1,253,327 | — | |||||||||
| Total | $ | 322,444,018 | $ | — | |||||||
| Liability Valuation Inputs | Investments in Securities | Other Financial Instruments | |||||||||
| Level 1 - Quoted Prices | $ | — | $ | — | |||||||
| Level 2 - Other Significant Observable Inputs | — | — | |||||||||
| Level 3 - Significant Unobservable Inputs | — | — | |||||||||
| Total | $ | — | $ | — | |||||||
The following is a reconciliation of investments in which significant unobservable inputs (Level 3) were used in determining value:
| Investments in Securities | Other Financial Instruments | ||||||||||
| Balance as of February 29, 2008 | $ | 2,052,106 | $ | — | |||||||
| Realized gain (loss) | 169,674 | — | |||||||||
| Change in unrealized appreciation/depreciation | (1,270,503 | ) | — | ||||||||
| Net purchases (sales) | 302,050 | — | |||||||||
| Net transfers in and/or out of Level 3 | — | — | |||||||||
| Balance as of February 28, 2009 | $ | 1,253,327 | $ | — | |||||||
Foreign currency translation
The market values of foreign securities, currency holdings and related assets and liabilities are translated to U.S. dollars based on the 4 p.m. New York time exchange rates each business day. Income and expenses denominated in foreign currencies are translated at the 4 p.m. New York time exchange rates on the business day the income and expenses are accrued or incurred. The Fund does not isolate realized and unrealized gains and losses attributable to changes in exchange rates from gains and losses that arise from changes in the market value of investments. Such fluctuations are included with net realized and unrealized gain or loss on investments. Net realized gains and losses on foreign currency transactions represent gains and losses on disposition of currencies and forward currency contracts, currency gains and
21
GMO Foreign Small Companies Fund
(A Series of GMO Trust)
Notes to Financial Statements — (Continued)
February 28, 2009
losses realized between the trade and settlement dates on securities transactions, and the difference between the amount of investment income and foreign withholding taxes recorded on the Fund's accounting records and the U.S. dollar equivalent amounts actually received or paid.
Forward currency contracts
The Fund may enter into forward currency contracts including forward cross currency contracts. A forward currency contract is an agreement between two parties to buy and sell a currency at a set price on a future date. The market value of a forward currency contract fluctuates with changes in forward currency exchange rates. Forward currency contracts are marked to market daily using rates supplied by a quotation service and changes in value are recorded by the Fund as an unrealized gain or loss. Realized gains or losses equal to the difference between the value of the contract at the time it was opened and the value at the time it was closed are recorded upon delivery or receipt of the currency or, if a forward currency contract is offset by entering into another forward currency contract with the same broker, upon settlement of the net gain or loss. These contracts may involve market risk in excess of the unrealized gain or lo ss reflected in the Fund's Statement of Assets and Liabilities. They expose the Fund to the risk of unfavorable movements in currency values and the risk that the counterparty will be unable or unwilling to meet the terms of the contracts. The Fund had no forward currency contracts outstanding at the end of the period.
Futures contracts
The Fund may purchase and sell futures contracts. Upon entering into a futures contract, the Fund is required to deposit cash, U.S. government and agency obligations, or other liquid assets with the futures clearing broker in accordance with the initial margin requirements of the broker or exchange. In addition, the Fund maintains cash or securities in an amount that at least equals the net amount payable in the event the Fund must deliver the full amount of the contract. Futures contracts are marked to market daily and an appropriate payable or receivable for the change in value ("variation margin") is recorded by the Fund. The payable or receivable is settled on the following business day. Gains or losses are recognized but not considered realized until the contracts expire or are closed. Futures contracts involve, to varying degrees, risk of loss in excess of the variation margin disclosed in the Statement of Assets and Liabi lities. Under some circumstances, futures exchanges may establish daily limits on the amount that the price of a futures contract can vary from the previous day's settlement price, thereby effectively preventing liquidation of unfavorable positions. Losses may arise from changes in the value of the underlying instrument if the Fund is unable to liquidate a futures position due to an illiquid secondary market for the contract or the imposition of price limits, or if counterparties do not perform under the contract terms. Futures contracts are generally valued at the settlement price established each day by the board of trade or exchange on which they are traded. Because many foreign exchanges close prior to the close of the New York stock Exchange ("NYSE"), closing prices for foreign futures in those markets or on those exchanges do not reflect the events that occur after that close but before the close of the NYSE. As a result, the Fund generally values foreign futures using fair value prices, which are base d on adjustments to closing prices supplied by a third party vendor based on that vendor's proprietary models. The Fund had no futures contracts outstanding at the end of the period.
22
GMO Foreign Small Companies Fund
(A Series of GMO Trust)
Notes to Financial Statements — (Continued)
February 28, 2009
Options
The Fund may write (i.e., sell) call and put options. Writing options alters the Fund's exposure to the underlying instrument by, in the case of a call option, obligating the Fund to sell the underlying instrument at a set price to the option-holder and, in the case of a put option, obligating the Fund to purchase the underlying instrument at a set price from the option-holder. In the case of an index option, settlement will be in cash. When the Fund writes a call or put option, an amount equal to the premium received is recorded as a liability and subsequently marked to market to reflect the current value of the option written. Premiums received from writing options that expire are treated as realized gains. Premiums received from writing options that are exercised or closed are deducted from the amounts paid on the underlying future, security or currency transaction to determine the realized gain or loss. The Fund as a writer of an option has no control over whether the underlying future, security or currency may be sold (call) or purchased (put) and as a result bears the market risk of an unfavorable change in the price of the future, security or currency underlying the option. In the event that the Fund writes uncovered put or call options (i.e. options for investments that the Fund does not own), it bears the risk of substantial losses if the price of the underlying instrument increases during the term of the option. Options expose the Fund to the risk the Fund may not be able to enter into a closing transaction because of an illiquid market. The Fund had no open written option contracts during the period.
The Fund may also purchase put and call options. Purchasing options alters the Fund's exposure to the underlying instrument by, in the case of a call option, entitling the Fund to purchase the underlying instrument at a set price from the writer of the option and, in the case of a put option, entitling the Fund to sell the underlying instrument at a set price to the writer of the option. The Fund pays a premium for a purchased option. That premium is disclosed in the Schedule of Investments and is subsequently marked to market to reflect the current value of the option. Premiums paid for purchasing options that expire are treated as realized losses. Premiums paid for purchasing options that are exercised or closed are deducted from the proceeds on the closing transaction to determine the realized gain or loss. The risk associated with purchasing put and call options is limited to the premium paid. The Fund had no purchased optio n contracts outstanding at the end of the period.
The Fund values exchange traded options at the last sale price, or if no sale is reported, the last bid price for options it has purchased and the last ask price for options it has written. The Fund values options traded over-the-counter using inputs provided by primary pricing sources and industry standard models.
Securities lending
The Fund may lend its securities to qualified brokers. The loans are collateralized with cash or liquid securities with a market value at least equal to the market value of the securities upon entering into the loan. As with other extensions of credit, the Fund may bear the risk of loss with respect to the investment of the collateral, the risk of delay in and/or inability to exercise its rights with respect to the collateral, and the risk of delay in recovery or loss of rights in the loaned securities should the borrower of the securities fail financially. If a loan is collateralized by U.S. government securities, the Fund receives a fee from the
23
GMO Foreign Small Companies Fund
(A Series of GMO Trust)
Notes to Financial Statements — (Continued)
February 28, 2009
borrower. If a loan is collateralized by cash, the Fund typically invests the cash collateral for its own account. The Fund had no securities on loan at February 28, 2009.
Taxes and distributions
The Fund intends to qualify each tax year as a regulated investment company under Subchapter M of the Internal Revenue Code of 1986, as amended (the "Code"). The Fund intends to distribute substantially all of its net investment income and all of its net realized short-term and long-term capital gain, if any, after giving effect to any available capital loss carryforwards for U.S. federal income tax purposes. Therefore, no provision for U.S. federal income or excise tax is necessary. Taxes on foreign interest and dividend income are generally withheld in accordance with the applicable country's tax treaty with the United States. The foreign withholding rates applicable to a Fund's investments in certain foreign jurisdictions may be higher if a significant portion of the Fund is held by non-U.S. shareholders.
The Fund's policy is to declare and pay distributions from net investment income, if any, semiannually, and from net realized short-term and long-term capital gain, if any, at least annually. All distributions are paid in shares of the Fund, at net asset value, unless the shareholder elects to receive cash distributions. Distributions to shareholders are recorded by the Fund on the ex-dividend date.
Foreign taxes paid by the Fund may be treated, to the extent permissible under the Code and if the Fund so elects, as if paid by the shareholders of the Fund.
The Fund may be subject to capital gains and repatriation taxes imposed by certain countries in which it invests.
The Fund is subject to a Contribuição Provisória sobre Movimentações Financiera ("CPMF") tax which is applied to foreign exchange transactions representing capital inflows or outflows to/from the Brazilian market. For the year ended February 28, 2009, the Fund incurred $139 in CPMF tax, which is included in net realized gain (loss) on foreign currency, forward contracts and foreign currency related transactions in the Statement of Operations.
Income and capital gain distributions are determined in accordance with U.S. federal income tax regulations, which may differ from U.S. GAAP. Certain capital accounts in the financial statements are periodically adjusted for permanent differences in order to reflect their tax character. These adjustments have no impact on net assets or net asset value per share. Temporary differences that arise from recognizing certain items of income, expense, gain or loss in different periods for financial statement and tax purposes will reverse at some time in the future. Distributions in excess of net investment income or net realized gains are temporary over-distributions for financial statement purposes resulting from differences in the recognition or classification of income or distributions for financial statement and tax purposes.
24
GMO Foreign Small Companies Fund
(A Series of GMO Trust)
Notes to Financial Statements — (Continued)
February 28, 2009
U.S. GAAP and tax accounting differences primarily relate to passive foreign investment company transactions, losses on wash sale transactions, adjustments related to securities on loan, post-October capital and currency losses, foreign currency transactions and redemption-in-kind transactions.
The following reclassification represents the amount necessary to report the stated components of net assets on a tax basis, excluding certain temporary differences, as of February 28, 2009. The financial highlights exclude these adjustments.
| Distributions In Excess of Net Investment Income | Distributions In Excess of Net Realized Gain | Paid-in Capital | |||||||||
| $ | (1,460,429 | ) | $ | 7,879,159 | $ | (6,418,730 | ) | ||||
The tax character of distributions declared to shareholders is as follows:
| 2/28/2009 | 2/29/2008 | ||||||||||
| Ordinary income (including any net short-term capital gain) | $ | 12,899,937 | $ | 68,579,611 | |||||||
| Net long-term capital gain | 51,432,757 | 154,252,013 | |||||||||
| 64,332,694 | 222,831,624 | ||||||||||
| Tax return-of-capital | 427,216 | — | |||||||||
| Total distribution | $ | 64,759,910 | $ | 222,831,624 | |||||||
Distributions in excess of tax basis earnings and profits, if significant, are reported in the financial statements as a return of capital for tax purposes.
As of February 28, 2009, the Fund elected to defer to March 1, 2009 post-October capital and currency losses of $81,517,073 and $1,563,263, respectively.
As of February 28, 2009, the approximate cost for U.S. federal income tax purposes and gross and net unrealized appreciation (depreciation) in value of investments were as follows:
| Aggregate Cost | Gross Unrealized Appreciation | Gross Unrealized (Depreciation) | Net Unrealized Appreciation (Depreciation) | ||||||||||||
| $ | 505,680,465 | $ | 28,586,152 | $ | (211,822,599 | ) | $ | (183,236,447 | ) | ||||||
For the period ended February 28, 2009, the Fund had net realized losses attributed to redemption in-kind transactions of $5,674,239.
25
GMO Foreign Small Companies Fund
(A Series of GMO Trust)
Notes to Financial Statements — (Continued)
February 28, 2009
The Fund is subject to the provisions of Financial Accounting Standards Board Interpretation No. 48 ("FIN 48"), Accounting for Uncertainty in Income Taxes — an Interpretation of FASB Statement No. 109. FIN 48 sets forth a minimum threshold for financial statement recognition of a tax position taken or expected to be taken in a tax return that could affect the Fund's financial statements. The Fund did not have any unrecognized tax benefits or liabilities at February 28, 2009, nor did it have any increases or decreases in unrecognized tax benefits or liabilities for the period then ended. The Fund is subject to examination prior to the expiration of the statute of limitations by U.S. federal and state tax authorities for tax returns filed.
Security transactions and related investment income
Security transactions in the financial statements are accounted for on the trade date. Dividend income, net of applicable foreign withholding taxes, if any, is recorded on the ex-dividend date or, if later, when the Fund is informed of the ex-dividend date. Interest income is recorded on the accrual basis and is adjusted for the amortization of premiums and accretion of discounts. Principal on inflation indexed securities is adjusted for inflation and any increase or decrease is recorded as interest income or loss. Income is not recognized on securities for which collection is not expected. Non-cash dividends, if any, are recorded at the fair market value of the asset received. In determining the net gain or loss on securities sold, the Fund uses the identified cost basis for the purposes of determining the cost basis.
Expenses
The majority of the expenses of the Trust are directly identifiable to an individual fund. Expenses that are not readily identifiable to a specific fund are allocated taking into consideration, among other things, the nature and type of expense and the relative size of the funds. Investment income, common expenses and realized and unrealized gains and losses are allocated pro rata among the classes of shares of the Fund based on the relative net assets of each class. Shareholder service fees, which are directly attributable to a class of shares, are charged to that class's operations.
Brown Brothers Harriman & Co. ("BBH") serves as custodian and fund accounting agent of the Fund. State Street Bank and Trust Company ("State Street") serves as transfer agent of the Fund. BBH and State Street's fees may be reduced by an earnings allowance calculated on the average daily cash balances the Fund maintains with each agent. The Fund receives the benefit of the earnings allowance. In addition, Goldman Sachs Agency Lending, the Fund's securities lending agent, has agreed to reimburse the Fund for certain transactional expenses related to securities lending activity. Credit balances or expense reimbursements used to reduce fees, if any, are reported as a reduction of expenses in the Statement of Operations.
Purchases and redemptions of Fund shares
Effective January 15, 2009, the Fund instituted a premium on cash purchases and fee on cash redemptions of 0.50% of the amount invested or redeemed. As of February 28, 2009, the premium on cash purchases and fee on cash redemptions were each 0.50% of the amount invested or redeemed. The Fund may impose a new purchase premium and/or redemption fee, or modify or eliminate an existing purchase premium and/or redemption fee, at any time. If the Manager determines that any portion of a cash purchase or
26
GMO Foreign Small Companies Fund
(A Series of GMO Trust)
Notes to Financial Statements — (Continued)
February 28, 2009
redemption is offset by a corresponding cash redemption or purchase on the same day, the Fund will ordinarily waive or reduce the purchase premium or redemption fee with respect to that portion. In addition, the Fund may waive or reduce the purchase premium or redemption fee in extraordinary circumstances if the purchase or redemption will not cause the Fund to incur transaction costs. All purchase premiums and redemption fees are paid to the Fund and recorded by the Fund as paid-in-capital. These fees are allocated relative to each class's net assets on the share transaction date. The Fund will waive or reduce the purchase premium relating to the in-kind portion of a purchase transaction except for estimated or known transaction costs (e.g. stamp duties and transfer taxes) incurred by the Fund as a result of the transfer of the purchasing shareholder's securities to the Fund. In-kind redemption transactions are generally not su bject to redemption fees except when they include a cash component. However, when a substantial portion of a Fund is being redeemed, the Fund may charge a redemption fee based on estimated or known transaction costs resulting from those redemptions. The Fund charges no premium for reinvested distributions.
Investment risks
The Fund is subject to risks involved in investing in foreign securities that are not presented by investments in U.S. securities. These risks may involve adverse political and economic developments, including expropriation and the possible imposition of capital controls or other foreign governmental laws or restrictions. In addition, the securities of some foreign companies and securities markets are less liquid and at times may be more volatile than securities of comparable U.S. companies and U.S. securities markets.
Recently issued accounting pronouncement
In March 2008, FASB issued Statement of Financial Accounting Standards No. 161, Disclosures about Derivative Instruments and Hedging Activities ("SFAS 161"). SFAS 161 is effective for fiscal years and interim periods beginning after November 15, 2008. SFAS 161 requires enhanced disclosures about the Fund's derivative and hedging activities. The Manager is currently evaluating the impact the adoption of SFAS 161 will have on the Fund's financial statement disclosures.
3. Fees and other transactions with affiliates
GMO receives a management fee for the services it provides to the Fund. That fee is paid monthly at the annual rate of 0.70% of average daily net assets. The Fund has adopted a Shareholder Service Plan under which the Fund pays GMO a shareholder service fee for client and shareholder service, reporting, and other support. Pursuant to the Shareholder Service Plan, the shareholder service fee is calculated based on average daily net assets of each class at the annual rate of 0.15% for Class III shares and 0.10% for Class IV shares.
Through at least June 30, 2009, the Manager has contractually agreed to reimburse the Fund for Fund expenses incurred through that date to the extent the Fund's total annual operating expenses (excluding "Excluded Expenses", as defined below) exceed 0.70% of the Fund's average daily net assets. Excluded Expenses include shareholder service fees, fees and expenses of the independent Trustees of the Trust,
27
GMO Foreign Small Companies Fund
(A Series of GMO Trust)
Notes to Financial Statements — (Continued)
February 28, 2009
fees and expenses for legal services not approved by the Manager for the Trust, compensation and expenses of the Trust's Chief Compliance Officer ("CCO") (excluding any employee benefits), brokerage commissions, securities lending fees and expenses, interest expense, transfer taxes, and other investment-related costs (including expenses associated with investments in any company that is an investment company or would be an investment company under the 1940 Act, but for the exceptions to the definition of investment company provided in Section 3(c)(1) and 3(c)(7) of the 1940 Act), hedging transaction fees, extraordinary, non-recurring and certain other unusual expenses (including taxes).
The Fund's portion of the fees paid by the Trust to the Trust's independent Trustees and CCO during the year ended February 28, 2009 was $8,129 and $5,090, respectively. The compensation and expenses of the CCO are included in miscellaneous expenses in the Statement of Operations. The Fund paid no remuneration to any other officer of the Trust.
4. Purchases and sales of securities
Cost of purchases and proceeds from sales of securities, excluding short-term investments, for the year ended February 28, 2009 aggregated $285,617,243 and $479,598,300, respectively.
5. Guarantees
In the normal course of business the Fund enters into contracts with third-party service providers that contain a variety of representations and warranties and that provide general indemnifications. The Fund's maximum exposure under these arrangements is unknown, as it involves future claims that may be made against the Fund that have not yet occurred. Based on experience, management is of the view that the risk of loss in connection with its indemnification obligations is remote; however, there can be no assurance that such obligations will not result in material liabilities that adversely affect the Fund.
6. Principal shareholders and related parties
As of February 28, 2009, 67.53% of the outstanding shares of the Fund were held by three shareholders, each holding more than 10% of the Fund's outstanding shares. On that date, no other shareholder owned more than 10% of the outstanding shares of the Fund. Redemptions from (or investments into) the Fund by or on behalf of these large shareholders may have a material effect on the Fund.
As of February 28, 2009, 0.01% of the Fund's shares were held by senior management of the Manager and GMO Trust officers, and none of the Fund's shares were held by accounts for which the Manager had investment discretion.
28
GMO Foreign Small Companies Fund
(A Series of GMO Trust)
Notes to Financial Statements — (Continued)
February 28, 2009
7. Share transactions
The Declaration of Trust permits the Trust to issue an unlimited number of shares of beneficial interest (without par value). Transactions in Fund shares were as follows:
| Year Ended February 28, 2009 | Year Ended February 29, 2008 | ||||||||||||||||||
| Class III: | Shares | Amount | Shares | Amount | |||||||||||||||
| Shares sold | 8,133,081 | $ | 54,843,370 | 8,563,923 | $ | 166,900,000 | |||||||||||||
| Shares issued to shareholders in reinvestment of distributions | 2,299,029 | 23,448,063 | 4,631,692 | 78,154,241 | |||||||||||||||
| Shares repurchased | (4,688,611 | ) | (60,114,858 | ) | (10,469,794 | ) | (198,467,818 | ) | |||||||||||
| Purchase Premiums | — | — | — | — | |||||||||||||||
| Redemption fees | — | 14 | — | — | |||||||||||||||
| Net increase (decrease) | 5,743,499 | $ | 18,176,589 | 2,725,821 | $ | 46,586,423 | |||||||||||||
| Year Ended February 28, 2009 | Year Ended February 29, 2008 | ||||||||||||||||||
| Class IV: | Shares | Amount | Shares | Amount | |||||||||||||||
| Shares sold | — | $ | — | 6,619,129 | $ | 126,292,990 | |||||||||||||
| Shares issued to shareholders in reinvestment of distributions | 3,578,937 | 39,283,862 | 8,449,525 | 140,398,460 | |||||||||||||||
| Shares repurchased | (26,775,273 | ) | (239,231,583 | ) | (9,792,130 | ) | (187,000,000 | ) | |||||||||||
| Purchase Premiums | — | — | — | — | |||||||||||||||
| Redemption fees | — | 27 | — | — | |||||||||||||||
| Net increase (decrease) | (23,196,336 | ) | $ | (199,947,694 | ) | 5,276,524 | $ | 79,691,450 | |||||||||||
8. Subsequent Event
Subsequent to February 28, 2009, the Fund received redemption requests in the amount of $144,588,492.
29
Report of Independent Registered Public Accounting Firm
To the Trustees of GMO Trust and the Shareholders of
GMO Foreign Small Companies Fund:
In our opinion, the accompanying statement of assets and liabilities, including the schedule of investments, and the related statements of operations and of changes in net assets and the financial highlights present fairly, in all material respects, the financial position of GMO Foreign Small Companies Fund (the "Fund") at February 28, 2009, the results of its operations for the year then ended, the changes in its net assets for each of the two years in the period then ended and the financial highlights for each of the five years in the period then ended, in conformity with accounting principles generally accepted in the United States of America. These financial statements and financial highlights (hereafter referred to as "financial statements") are the responsibility of the Fund's management. Our responsibility is to express an opinion on these financial statements based on our audits. We conducted our audits of these financia l statements in accordance with the standards of the Public Company Accounting Oversight Board (United States). Those standards require that we plan and perform the audit to obtain reasonable assurance about whether the financial statements are free of material misstatement. An audit includes examining, on a test basis, evidence supporting the amounts and disclosures in the financial statements, assessing the accounting principles used and significant estimates made by management, and evaluating the overall financial statement presentation. We believe that our audits, which included confirmation of securities at February 28, 2009 by correspondence with the custodian and brokers, provide a reasonable basis for our opinion.
PricewaterhouseCoopers LLP
Boston, Massachusetts
April 29, 2009
30
GMO Foreign Small Companies Fund
(A Series of GMO Trust)
Fund Expenses
February 28, 2009 (Unaudited)
Expense Examples: The following information is in relation to expenses for the six month period ended February 28, 2009.
As a shareholder of the Fund, you may incur two types of costs: (1) transaction costs, including purchase premiums and redemption fees; and (2) ongoing costs, including management fees, shareholder service fees and other Fund expenses. This example is intended to help you understand your ongoing costs (in dollars) of investing in the Fund and to compare these costs with the ongoing costs of investing in other mutual funds.
These examples are based on an investment of $1,000 invested at the beginning of the period and held for the entire period, September 1, 2008 through February 28, 2009.
Actual Expenses
The first line of the table for each class below provides information about actual account values and actual expenses. You may use the information in this line, together with the amount you invested, to estimate the expenses that you paid over the period. Simply divide your account value by $1,000 (for example, a $10,000,000 account value divided by $1,000 = 10,000), then multiply the result by the number in the first line under the heading entitled "Net Expense Incurred" to estimate the expenses you paid on your account during this period.
Hypothetical Example for Comparison Purposes
The second line of the table for each class below provides information about hypothetical account values and hypothetical expenses based on the Fund's actual expense ratio and an assumed rate of return of 5% per year before expenses, which is not the Fund's actual return. The hypothetical account values and expenses may not be used to estimate the actual ending account balance or expenses you paid for the period. You may use this information to compare the ongoing costs of investing in the Fund with other funds. To do so, compare this 5% hypothetical example with the 5% hypothetical examples that appear in the shareholder reports of other funds.
Please note that the expenses shown in the table are meant to highlight your ongoing costs only and do not reflect any transactional costs. Therefore, the second line of the table is useful in comparing ongoing costs only, and will not help you determine the relative total costs of owning different funds. In addition, if these transactional costs were included, your costs would have been higher.
| Annualized Net Expense Ratio | Beginning Account Value | Ending Account Value | Net Expense Incurred* | ||||||||||||||||
| Class III | |||||||||||||||||||
| 1) Actual | 0.86 | % | $ | 1,000.00 | $ | 542.70 | $ | 3.29 | |||||||||||
| 2) Hypothetical | 0.86 | % | $ | 1,000.00 | $ | 1,020.53 | $ | 4.31 | |||||||||||
| Class IV | |||||||||||||||||||
| 1) Actual | 0.80 | % | $ | 1,000.00 | $ | 543.10 | $ | 3.06 | |||||||||||
| 2) Hypothetical | 0.80 | % | $ | 1,000.00 | $ | 1,020.83 | $ | 4.01 | |||||||||||
* Expenses are calculated using each Class's annualized net expense ratio for the six months ended February 28, 2009, multiplied by the average account value over the period, multiplied by 181 days in the period, divided by 365 days in the year.
31
GMO Foreign Small Companies Fund
(A Series of GMO Trust)
Tax Information for the Tax Year Ended February 28, 2009 (Unaudited)
The Fund will notify shareholders of amounts for use in preparing 2009 income tax forms in January 2010.
The Fund's distributions to shareholders include $51,432,757 from long-term capital gains.
During the year ended February 28, 2009, the Fund paid foreign taxes of $2,329,701 and recognized foreign source income of $25,269,774.
For taxable, non-corporate shareholders, 99.42% of the income and short-term capital gains, if any, distributed in the Fund's fiscal year ended February 28, 2009 represents qualified dividend income subject to the 15% rate category.
The Fund hereby designates as qualified interest income with respect to its taxable year ended February 28, 2009, $1,076,771 or if determined to be different, the qualified interest income of such year.
32
GMO Foreign Small Companies Fund
(A Series of GMO Trust)
Note Concerning Distributions (Unaudited)
The Fund previously reported estimated sources of any dividends, short-term capital gains, and long-term capital gains distributions paid on a per share basis. Pursuant to Rule 19a-1(e) of the Investment Company Act, the following serves as a correction of such estimates. 0.53% of the distributions to shareholders declared from net investment income and 3.14% of the distributions to shareholders declared from net realized gains during the Fund's fiscal year were reclassified to distributions from return of capital and are reflected as such in the Statement of Changes in Net Assets.
33
Trustees and Officers (Unaudited)
The following tables list the Trust's Trustees and Officers as of the date of this report; their address and date of birth ("DOB"); their position with the Trust; the length of time holding that position with the Trust; their principal occupation(s) during the past five years; the number of portfolios in the fund complex they oversee; and other directorships they hold in companies subject to registration or reporting requirements of the Securities Exchange Act of 1934 (generally called "public companies") or in registered investment companies. The Trust's Statement of Additional Information ("SAI") includes additional information about the Trust's trustees, including changes subsequent to the date of the report. The SAI is available, without charge, upon request by writing GMO, c/o GMO Trust, 40 Rowes Wharf, Boston, MA 02110.
Independent Trustees:
| Name, Address, and DOB | Position(s) Held with Trust | Term of Office1 and Length of Time Served | Principal Occupation(s) During Past Five Years | Number of Portfolios in Fund Complex Overseen by Trustee | Other Directorships Held by Trustee | ||||||||||||||||||
| Donald W. Glazer, Esq. c/o GMO Trust 40 Rowes Wharf Boston, MA 02110 DOB: 07/26/1944 | Chairman of the Board of Trustees | Chairman of the Board of Trustees since March 2005; Lead Independent Trustee (September 2004 – March 2005); Trustee since December 2000. | Consultant – Law and Business2; Author of Legal Treatises. | 59 | None. | ||||||||||||||||||
1 Each Trustee is elected to serve during the continued lifetime of the Trust until he/she dies, resigns or is removed, or if sooner, until the next meeting of Shareholders called for the purpose of electing Trustees and until the election and qualification of his/her successor.
2 As part of Mr. Glazer's work as a consultant, he provides part-time consulting services to Goodwin Procter LLP ("Goodwin"). Goodwin has provided legal services to Renewable Resources, LLC, an affiliate of GMO; GMO, in connection with its relationship with Renewable Resources; and funds managed by Renewable Resources. Mr. Glazer has represented that he has no financial interest in, and is not involved in the provision of, such legal services. In the calendar years ended December 31, 2007 and December 31, 2008, these entities paid $789,416 and $183,864 respectively, in legal fees and disbursements to Goodwin. In correspondence with the Staff of the Securities and Exchange Commission beginning in August 2006, the Independent Trustees' legal counsel provided the Staff with information regarding Mr. Glazer's relationship with Goodwin and h is other business activities. On September 11, 2007, based on information that had been given to the Staff as of that date, the Staff provided oral no-action assurance consistent with the opinion of the Independent Trustees' legal counsel that Mr. Glazer is not an "interested person" of the Trust.
34
Independent Trustees — (Continued)
| Name, Address, and DOB | Position(s) Held with Trust | Term of Office1 and Length of Time Served | Principal Occupation(s) During Past Five Years | Number of Portfolios in Fund Complex Overseen by Trustee | Other Directorships Held by Trustee | ||||||||||||||||||
| W. Nicholas Thorndike c/o GMO Trust 40 Rowes Wharf Boston, MA 02110 DOB: 03/28/1933 | Trustee | Since March 2005. | Director or trustee of various corporations and charitable organizations, including Courier Corporation (a book publisher and manufacturer) (July 1989 – present); Putnam Funds (December 1992 – June 2004); and Providence Journal (a newspaper publisher) (December 1986 – December 2003). | 59 | Director of Courier Corporation (a book publisher and manufacturer); Member of the Investment Committee of Partners HealthCare System, Inc.3 | ||||||||||||||||||
| Peter Tufano c/o GMO Trust 40 Rowes Wharf Boston, MA 02110 DOB: 04/22/1957 | Trustee | Since December 2008. | Sylvan C. Coleman Professor of Financial Management, Harvard Business School (since 1989). | 59 | Trustee of State Street Navigator Securities Lending Trust (3 Portfolios). | ||||||||||||||||||
1 Each Trustee is elected to serve during the continued lifetime of the Trust until he/she dies, resigns or is removed, or if sooner, until the next meeting of Shareholders called for the purpose of electing Trustees and until the election and qualification of his/her successor.
3 Partners HealthCare System, Inc. is a client of the Manager.
35
Principal Officers:
| Name, Address, and DOB | Position(s) Held with Trust | Term of Office4 and Length of Time Served | Principal Occupation(s) During Past Five Years5 | ||||||||||||
| J.B. Kittredge DOB: 08/22/1954 | President and Chief Executive Officer | Since March 2009. | General Counsel, Grantham, Mayo, Van Otterloo & Co. LLC (October 2005 – Present); Partner, Ropes & Gray LLP. | ||||||||||||
| Sheppard N. Burnett c/o GMO Trust 40 Rowes Wharf Boston, MA 02110 DOB: 10/24/1968 | Treasurer and Chief Financial Officer | Chief Financial Officer since March 2007; Treasurer since November 2006; Assistant Treasurer, September 2004 – November 2006. | Fund Administration Staff, Grantham, Mayo, Van Otterloo & Co. LLC (June 2004 – present); Vice President, Director of Tax, Columbia Management Group (2002 – 2004). | ||||||||||||
| Brent C. Arvidson c/o GMO Trust 40 Rowes Wharf Boston, MA 02110 DOB: 06/26/1969 | Assistant Treasurer | Since August 1998. | Senior Fund Administrator, Grantham, Mayo, Van Otterloo & Co. LLC. | ||||||||||||
| John L. Nasrah c/o GMO Trust 40 Rowes Wharf Boston, MA 02110 DOB: 05/27/1977 | Assistant Treasurer | Since March 2007. | Fund Administrator, Grantham, Mayo, Van Otterloo & Co. LLC (September 2004 – present); Tax Analyst, Bain & Company, Inc. (June 2003 – September 2004). | ||||||||||||
| Mahmoodur Rahman c/o GMO Trust 40 Rowes Wharf Boston, MA 02110 DOB: 11/30/1967 | Assistant Treasurer | Since September 2007. | Fund Administrator, Grantham, Mayo, Van Otterloo & Co. LLC (April 2007 – present); Vice President and Senior Tax Manager, Massachusetts Financial Services Company (January 2000 – April 2007). | ||||||||||||
| Michael E. Gillespie c/o GMO Trust 40 Rowes Wharf Boston, MA 02110 DOB: 02/18/1958 | Chief Compliance Officer | Since March 2005. | Vice President of Compliance (June 2004 – February 2005) and Director of Domestic Compliance (March 2002 – June 2004), Fidelity Investments. | ||||||||||||
4 Each officer is elected to hold such office until his or her successor is duly elected and qualified to carry out the duties and responsibilities of the office, or until he or she resigns or is removed from office.
5 Each of Messrs. Burnett, Arvidson, Bohan, and Pottle serves as an officer and/or director of certain pooled investment vehicles of which GMO or an affiliate of GMO serves as the investment adviser.
36
Principal Officers — (Continued)
| Name, Address, and DOB | Position(s) Held with Trust | Term of Office4 and Length of Time Served | Principal Occupation(s) During Past Five Years5 | ||||||||||||
| Jason B. Harrison c/o GMO Trust 40 Rowes Wharf Boston, MA 02110 DOB: 01/29/1977 | Vice President and Clerk | Vice President since November 2006; Clerk since March 2006. | Legal Counsel, Grantham, Mayo, Van Otterloo & Co. LLC (since February 2006) and Attorney, Ropes & Gray LLP (September 2002 – February 2006). | ||||||||||||
| David L. Bohan c/o GMO Trust 40 Rowes Wharf Boston, MA 02110 DOB: 06/21/1964 | Vice President and Assistant Clerk | Vice President since March 2005; Assistant Clerk since March 2006. | Legal Counsel, Grantham, Mayo, Van Otterloo & Co. LLC. | ||||||||||||
| Gregory L. Pottle c/o GMO Trust 40 Rowes Wharf Boston, MA 02110 DOB: 07/09/1971 | Vice President and Assistant Clerk | Since November 2006. | Legal Counsel, Grantham, Mayo, Van Otterloo & Co. LLC. | ||||||||||||
| Anne K. Trinque c/o GMO Trust 40 Rowes Wharf Boston, MA 02110 DOB: 04/15/1978 | Vice President and Assistant Clerk | Since September 2007. | Legal Counsel, Grantham, Mayo, Van Otterloo & Co. LLC (January 2007 – present); Attorney, Goodwin Procter LLP (September 2003 – January 2007). | ||||||||||||
| Cheryl Wakeham c/o GMO Trust 40 Rowes Wharf Boston, MA 02110 DOB: 10/29/1958 | Vice President and Anti-Money Laundering Officer | Since December 2004. | Manager, Client Service Administration, Grantham, Mayo, Van Otterloo & Co. LLC. | ||||||||||||
4 Each officer is elected to hold such office until his or her successor is duly elected and qualified to carry out the duties and responsibilities of the office, or until he or she resigns or is removed from office.
5 Each of Messrs. Burnett, Arvidson, Bohan, and Pottle serves as an officer and/or director of certain pooled investment vehicles of which GMO or an affiliate of GMO serves as the investment adviser.
37
GMO International Intrinsic Value Fund
(A Series of GMO Trust)
Annual Report
February 28, 2009
For a free copy of the Fund's proxy voting guidelines, shareholders may call 1-617-346-7646 (collect) or visit the Securities and Exchange Commission's website at www.sec.gov. Information regarding how the Fund voted proxies relating to portfolio securities during the most recent 12-month period ended June 30 is available on GMO's website at www.gmo.com, or on the Securities and Exchange Commission's website at www.sec.gov.
The Fund files its complete schedule of portfolio holdings with the Securities and Exchange Commission for the first and third quarter of each fiscal year on Form N-Q, which is available on the Commission's website at www.sec.gov. The Fund's Form N-Q may be reviewed and copied at the Commission's Public Reference Room in Washington, D.C. Information on the operation of the Public Reference Room may be obtained by calling 1-800-SEC-0330. The Fund has a policy with respect to disclosure of portfolio holdings under which it may also make available on GMO's website at www.gmo.com a complete schedule of portfolio holdings.
This report is prepared for the general information of shareholders. It is authorized for distribution to prospective investors only when preceded or accompanied by a prospectus for the GMO Trust, which contains a complete discussion of the risks associated with an investment in this Fund and other important information. The GMO Trust prospectus can be obtained at www.gmo.com.
GMO International Intrinsic Value Fund
(A Series of GMO Trust)
Portfolio Management
Day-to-day management of the Fund's portfolio is the responsibility of the Quantitative Equity team at Grantham, Mayo, Van Otterloo & Co. LLC.
Management Discussion and Analysis of Fund Performance
The Class III shares of the GMO International Intrinsic Value Fund returned -48.0% for the fiscal year ended February 28, 2009, as compared to -50.2% for the MSCI EAFE Index and -51.4% for the MSCI EAFE Value Index. Consistent with the Fund's investment objectives and policies, the Fund was invested primarily in international equity securities throughout the period.
Relative to the EAFE Value Index, country allocation had a slight negative impact. This was the result of positions in several countries. The Fund's underweight in Spain combined with holding small cash balances in falling markets added value, but these gains were offset by the Fund's overweight in Switzerland and underweight in the United Kingdom.
Sector weightings had a strong positive impact on performance relative to the index. During the period, the Fund's underweight to Financials and overweight to Health Care contributed significantly.
Currency allocation also had a strong positive impact on relative performance as the Fund's underweights in the British pound and Australian dollar and overweights in the Japanese yen and Swiss franc added value. The U.S. dollar strengthened relative to most foreign currencies, which detracted from returns for U.S. investors. The MSCI EAFE Index returned almost 9% more in local currency terms than in U.S. dollars.
Stock selection had mixed results, with the Fund's financial holdings especially weak. Holdings in Australian mining company Rio Tinto, Finnish cell phone maker Nokia, and British financial Royal Bank of Scotland were among the most significant detractors. On the positive side were holdings in British pharmaceutical GlaxoSmithKline, Swiss pharmaceutical Novartis, and Swiss food processor Nestlé, all of which outperformed strongly.
Among GMO's international quantitative stock selection disciplines, stocks ranked highly by intrinsic value (with its boost of high quality) outperformed strongly. Those selected by quality-adjusted value outperformed slightly, while those with strong momentum underperformed somewhat.
The views expressed herein are exclusively those of Grantham, Mayo, Van Otterloo & Co. LLC Management as of the date of this report and are subject to change. GMO disclaims any responsibility to update such views. They are not meant as investment advice. References to specific securities are not recommendations of such securities and may not be representative of any GMO portfolio's current or future investments.
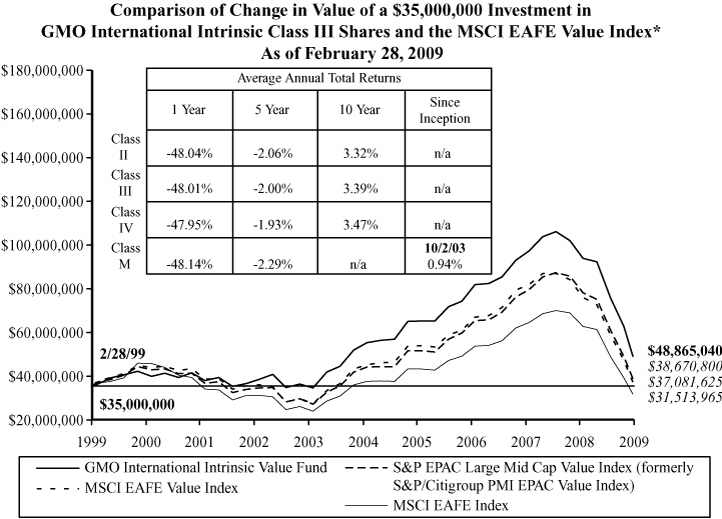
Performance data quoted represents past performance and is not indicative of future results. The investment return and principal value of an investment will fluctuate so that an investor's shares, when redeemed, may be worth more or less than their original cost. Current performance data may be lower or higher than the performance data provided herein. To obtain performance information to the most recent month-end, visit www.gmo.com. Performance shown is net of all fees after reimbursement from the Manager. Returns would have been lower had certain expenses not been reimbursed during the periods shown and do not include the effect of taxes on distributions and redemptions. All information is unaudited. Performance for Classes II, IV and M will vary due to different fees.
* Effective January 1, 2009, the benchmark for the International Intrinsic Value Fund was changed from the S&P EPAC Large Mid Cap Value Index to the MSCI EAFE Value Index. This change was applicable retroactively as well as going forward.
GMO International Intrinsic Value Fund
(A Series of GMO Trust)
Investments Concentration Summary
February 28, 2009 (Unaudited)
| Asset Class Summary | % of Total Net Assets | ||||||
| Common Stocks | 95.0 | % | |||||
| Short-Term Investments | 2.5 | ||||||
| Preferred Stocks | 0.0 | ||||||
| Rights and Warrants | 0.0 | ||||||
| Forward Currency Contracts | (0.3 | ) | |||||
| Futures | (1.1 | ) | |||||
| Other | 3.9 | ||||||
| 100.0 | % | ||||||
| Country Summary | % of Equity Investments | ||||||
| Japan | 30.9 | % | |||||
| United Kingdom | 20.0 | ||||||
| France | 12.1 | ||||||
| Switzerland | 8.9 | ||||||
| Germany | 4.9 | ||||||
| Italy | 4.3 | ||||||
| Canada | 3.3 | ||||||
| Hong Kong | 2.9 | ||||||
| Australia | 2.2 | ||||||
| Netherlands | 1.9 | ||||||
| Singapore | 1.8 | ||||||
| Spain | 1.6 | ||||||
| Sweden | 1.3 | ||||||
| Finland | 1.1 | ||||||
| Belgium | 1.0 | ||||||
| Greece | 0.5 | ||||||
| Ireland | 0.4 | ||||||
| Denmark | 0.3 | ||||||
| Norway | 0.3 | ||||||
| New Zealand | 0.2 | ||||||
| Austria | 0.1 | ||||||
| 100.0 | % | ||||||
1
GMO International Intrinsic Value Fund
(A Series of GMO Trust)
Investments Concentration Summary — (Continued)
February 28, 2009 (Unaudited)
| Industry Sector Summary | % of Equity Investments | ||||||
| Health Care | 17.2 | % | |||||
| Financials | 13.5 | ||||||
| Energy | 13.3 | ||||||
| Consumer Discretionary | 13.1 | ||||||
| Consumer Staples | 10.2 | ||||||
| Utilities | 8.0 | ||||||
| Telecommunication Services | 7.8 | ||||||
| Industrials | 6.5 | ||||||
| Materials | 6.2 | ||||||
| Information Technology | 4.2 | ||||||
| 100.0 | % | ||||||
2
GMO International Intrinsic Value Fund
(A Series of GMO Trust)
Schedule of Investments
(showing percentage of total net assets)
February 28, 2009
| Shares | Description | Value ($) | |||||||||||||
| COMMON STOCKS — 95.0% | |||||||||||||||
| Australia — 2.1% | |||||||||||||||
| 160,334 | AGL Energy Ltd | 1,345,781 | |||||||||||||
| 1,195,413 | Australia and New Zealand Banking Group Ltd | 10,012,812 | |||||||||||||
| 308,374 | BHP Billiton Ltd | 5,552,765 | |||||||||||||
| 1,690,912 | BlueScope Steel Ltd | 2,369,243 | |||||||||||||
| 966,580 | Foster's Group Ltd | 3,383,986 | |||||||||||||
| 4,615,170 | Macquarie Infrastructure Group | 2,983,338 | |||||||||||||
| 4,232,474 | Mirvac Group Ltd | 2,245,276 | |||||||||||||
| 541,819 | National Australia Bank Ltd | 6,086,025 | |||||||||||||
| 437,053 | QBE Insurance Group Ltd | 5,249,268 | |||||||||||||
| 536,830 | Santos Ltd | 5,277,765 | |||||||||||||
| 5,002,914 | Stockland | 8,569,145 | |||||||||||||
| 1,105,753 | TABCORP Holdings Ltd | 4,480,726 | |||||||||||||
| 2,888,525 | Telstra Corp Ltd | 6,509,804 | |||||||||||||
| 508,934 | Woodside Petroleum Ltd | 11,583,016 | |||||||||||||
| 267,976 | Woolworths Ltd | 4,452,872 | |||||||||||||
| Total Australia | 80,101,822 | ||||||||||||||
| Austria — 0.1% | |||||||||||||||
| 117,360 | OMV AG | 3,057,300 | |||||||||||||
| Belgium — 0.9% | |||||||||||||||
| 22,776 | Bekaert NV | 1,105,882 | |||||||||||||
| 231,143 | Belgacom SA | 7,523,497 | |||||||||||||
| 41,628 | Colruyt SA | 9,437,266 | |||||||||||||
| 53,442 | Delhaize Group | 3,085,602 | |||||||||||||
| 1,709,510 | Dexia | 3,561,194 | |||||||||||||
| 2,132,999 | Fortis | 3,514,531 | |||||||||||||
| 61,297 | Mobistar SA | 3,773,795 | |||||||||||||
| 63,094 | Solvay SA | 3,570,654 | |||||||||||||
| Total Belgium | 35,572,421 | ||||||||||||||
See accompanying notes to the financial statements.
3
GMO International Intrinsic Value Fund
(A Series of GMO Trust)
Schedule of Investments — (Continued)
(showing percentage of total net assets)
February 28, 2009
| Shares | Description | Value ($) | |||||||||||||
| Canada — 3.1% | |||||||||||||||
| 861,800 | Bank of Montreal | 19,163,907 | |||||||||||||
| 298,000 | Bank of Nova Scotia | 6,725,028 | |||||||||||||
| 153,211 | BCE Inc | 2,990,276 | |||||||||||||
| 173,700 | Canadian Imperial Bank of Commerce | 5,891,491 | |||||||||||||
| 335,300 | Canadian National Railway Co | 10,769,029 | |||||||||||||
| 158,500 | Canadian Natural Resources | 5,095,622 | |||||||||||||
| 258,300 | Canadian Pacific Railway Ltd | 7,309,228 | |||||||||||||
| 31,200 | EnCana Corp | 1,231,127 | |||||||||||||
| 491,100 | Hudbay Minerals Inc * | 2,161,736 | |||||||||||||
| 175,300 | IGM Financial Inc | 3,852,687 | |||||||||||||
| 210,200 | Magna International Inc Class A | 5,392,963 | |||||||||||||
| 591,800 | National Bank of Canada | 17,620,959 | |||||||||||||
| 303,400 | Penn West Energy Trust | 2,673,411 | |||||||||||||
| 516,300 | Petro-Canada | 11,395,774 | |||||||||||||
| 239,100 | Royal Bank of Canada | 5,811,171 | |||||||||||||
| 180,700 | Shaw Communications Inc Class B | 2,670,303 | |||||||||||||
| 527,000 | Sun Life Financial Inc | 8,247,579 | |||||||||||||
| Total Canada | 119,002,291 | ||||||||||||||
| Denmark — 0.3% | |||||||||||||||
| 332,800 | Danske Bank A/S | 2,089,752 | |||||||||||||
| 1,406 | NeuroSearch A/S * | 19,156 | |||||||||||||
| 159,129 | Novo-Nordisk A/S Class B | 7,748,537 | |||||||||||||
| Total Denmark | 9,857,445 | ||||||||||||||
| Finland — 1.0% | |||||||||||||||
| 329,570 | Neste Oil Oyj | 4,105,299 | |||||||||||||
| 1,133,693 | Nokia Oyj | 10,623,067 | |||||||||||||
| 199,709 | Nokian Renkaat Oyj | 2,352,382 | |||||||||||||
| 232,597 | Outokumpu Oyj | 2,353,042 | |||||||||||||
| 162,387 | Rautaruukki Oyj | 2,694,602 | |||||||||||||
| 1,006,161 | Sampo Oyj Class A | 13,233,176 | |||||||||||||
| 38,955 | Stockmann Oyj AB Class A | 588,449 | |||||||||||||
| 208,277 | Tietoenator Oyj | 2,597,155 | |||||||||||||
| Total Finland | 38,547,172 | ||||||||||||||
See accompanying notes to the financial statements.
4
GMO International Intrinsic Value Fund
(A Series of GMO Trust)
Schedule of Investments — (Continued)
(showing percentage of total net assets)
February 28, 2009
| Shares | Description | Value ($) | |||||||||||||
| France — 11.5% | |||||||||||||||
| 119,327 | Air Liquide SA | 8,707,584 | |||||||||||||
| 728,147 | ArcelorMittal | 13,956,198 | |||||||||||||
| 940,486 | BNP Paribas | 30,457,809 | |||||||||||||
| 15,189 | Bongrain SA | 766,166 | |||||||||||||
| 94,860 | Cap Gemini SA | 2,718,558 | |||||||||||||
| 118,326 | Casino Guichard-Perrachon SA | 7,310,330 | |||||||||||||
| 215,486 | Cie de Saint-Gobain | 4,915,698 | |||||||||||||
| 18,011 | CNP Assurances | 1,158,478 | |||||||||||||
| 147,667 | Dassault Systemes SA | 5,117,488 | |||||||||||||
| 165,104 | Essilor International SA | 5,698,083 | |||||||||||||
| 1,132,481 | France Telecom SA | 25,308,425 | |||||||||||||
| 3,655 | Fromageries Bel | 425,428 | |||||||||||||
| 669,048 | GDF Suez | 21,128,388 | |||||||||||||
| 118,539 | Hermes International | 10,009,855 | |||||||||||||
| 117,040 | L'Oreal SA | 7,528,865 | |||||||||||||
| 334,203 | Peugeot SA | 5,686,923 | |||||||||||||
| 423,668 | Renault SA | 6,083,575 | |||||||||||||
| 2,262,820 | Sanofi-Aventis | 116,302,432 | |||||||||||||
| 159,951 | SES | 2,929,674 | |||||||||||||
| 663,541 | Societe Generale | 20,568,198 | |||||||||||||
| 70,321 | Sodexo | 3,217,751 | |||||||||||||
| 339,107 | STMicroelectronics NV | 1,490,215 | |||||||||||||
| 2,684,418 | Total SA | 126,118,111 | |||||||||||||
| 35,589 | Unibail-Rodamco | 4,467,819 | |||||||||||||
| 43,616 | Vallourec SA | 3,394,831 | |||||||||||||
| Total France | 435,466,882 | ||||||||||||||
| Germany — 4.7% | |||||||||||||||
| 271,462 | Adidas AG | 7,804,060 | |||||||||||||
| 68,437 | Allianz SE (Registered) | 4,594,004 | |||||||||||||
| 231,841 | BASF AG | 6,431,185 | |||||||||||||
| 561,563 | Bayerische Motoren Werke AG | 13,890,585 | |||||||||||||
| 134,445 | Demag Cranes AG | 2,617,709 | |||||||||||||
| 544,958 | Deutsche Post AG (Registered) | 5,213,240 | |||||||||||||
See accompanying notes to the financial statements.
5
GMO International Intrinsic Value Fund
(A Series of GMO Trust)
Schedule of Investments — (Continued)
(showing percentage of total net assets)
February 28, 2009
| Shares | Description | Value ($) | |||||||||||||
| Germany — continued | |||||||||||||||
| 1,961,271 | Deutsche Telekom AG (Registered) | 23,717,285 | |||||||||||||
| 522,666 | E.ON AG | 13,440,311 | |||||||||||||
| 124,746 | Fresenius Medical Care AG & Co | 5,072,114 | |||||||||||||
| 207,595 | Gildemeister AG | 1,206,174 | |||||||||||||
| 271,763 | Hannover Rueckversicherungs AG (Registered) | 9,688,459 | |||||||||||||
| 571,290 | Heidelberger Druckmaschinen AG | 2,360,557 | |||||||||||||
| 184,379 | Kloeckner & Co AG | 2,059,797 | |||||||||||||
| 48,745 | MTU Aero Engines Holding AG | 1,250,588 | |||||||||||||
| 63,919 | Muenchener Rueckversicherungs-Gesellschaft AG (Registered) | 7,788,995 | |||||||||||||
| 276,868 | Norddeutsche Affinerie AG | 6,882,993 | |||||||||||||
| 24,434 | Puma AG Rudolf Dassler Sport | 3,652,098 | |||||||||||||
| 137,829 | RWE AG | 8,766,428 | |||||||||||||
| 171,703 | Salzgitter AG | 10,604,741 | |||||||||||||
| 885,810 | SAP AG | 28,456,344 | |||||||||||||
| 83,874 | SGL Carbon SE * | 1,851,089 | |||||||||||||
| 332,977 | ThyssenKrupp AG | 5,879,533 | |||||||||||||
| 37,297 | Vossloh AG | 3,467,580 | |||||||||||||
| Total Germany | 176,695,869 | ||||||||||||||
| Greece — 0.5% | |||||||||||||||
| 284,470 | Alpha Bank A.E. | 1,500,069 | |||||||||||||
| 396,315 | National Bank of Greece SA | 4,844,715 | |||||||||||||
| 487,456 | OPAP SA | 12,531,985 | |||||||||||||
| Total Greece | 18,876,769 | ||||||||||||||
| Hong Kong — 2.8% | |||||||||||||||
| 3,030,500 | BOC Hong Kong Holdings Ltd | 3,013,990 | |||||||||||||
| 5,548,598 | CLP Holdings Ltd | 41,018,236 | |||||||||||||
| 1,072,400 | Esprit Holdings Ltd | 5,775,327 | |||||||||||||
| 171,000 | Guoco Group | 986,264 | |||||||||||||
| 469,800 | Hang Seng Bank Ltd | 5,196,941 | |||||||||||||
| 5,632,300 | Hong Kong & China Gas | 8,493,787 | |||||||||||||
| 186,700 | Hong Kong Aircraft Engineering Co Ltd | 1,668,464 | |||||||||||||
| 4,434,469 | Hong Kong Electric Holdings Ltd | 27,340,779 | |||||||||||||
See accompanying notes to the financial statements.
6
GMO International Intrinsic Value Fund
(A Series of GMO Trust)
Schedule of Investments — (Continued)
(showing percentage of total net assets)
February 28, 2009
| Shares | Description | Value ($) | |||||||||||||
| Hong Kong — continued | |||||||||||||||
| 564,700 | Hong Kong Ferry Co Ltd | 303,443 | |||||||||||||
| 506,000 | Hutchison Whampoa Ltd | 2,640,393 | |||||||||||||
| 879,000 | MTR Corp Ltd | 1,950,762 | |||||||||||||
| 322,000 | Sun Hung Kai Properties Ltd | 2,497,493 | |||||||||||||
| 2,664,400 | Yue Yuen Industrial Holdings | 4,942,157 | |||||||||||||
| Total Hong Kong | 105,828,036 | ||||||||||||||
| Ireland — 0.4% | |||||||||||||||
| 786,796 | CRH Plc | 16,158,663 | |||||||||||||
| Italy — 4.0% | |||||||||||||||
| 1,152,750 | A2A SPA | 1,656,496 | |||||||||||||
| 412,084 | Banco Popolare Scarl | 1,571,386 | |||||||||||||
| 2,017,949 | Enel SPA | 10,029,638 | |||||||||||||
| 4,635,220 | ENI SPA | 92,517,057 | |||||||||||||
| 136,019 | Fondiaria - Sai SPA-Di RISP | 1,017,005 | |||||||||||||
| 1,146,249 | Intesa San Paolo | 2,789,916 | |||||||||||||
| 220,092 | Italcementi SPA-Di RISP | 1,152,220 | |||||||||||||
| 197,819 | Luxottica Group SPA | 2,575,663 | |||||||||||||
| 1,335,964 | Mediaset SPA | 5,928,686 | |||||||||||||
| 97,300 | Natuzzi SPA ADR * | 144,004 | |||||||||||||
| 1,539,591 | Snam Rete Gas SPA | 7,628,675 | |||||||||||||
| 7,057,377 | Telecom Italia SPA | 8,578,374 | |||||||||||||
| 9,035,087 | Telecom Italia SPA-Di RISP | 8,592,964 | |||||||||||||
| 1,588,316 | Terna SPA | 4,933,290 | |||||||||||||
| 3,124,667 | UniCredit SPA | 3,957,731 | |||||||||||||
| Total Italy | 153,073,105 | ||||||||||||||
| Japan — 29.3% | |||||||||||||||
| 47,380 | Acom Co Ltd | 1,159,136 | |||||||||||||
| 1,083,450 | Aiful Corp | 1,118,339 | |||||||||||||
| 169,000 | Air Water Inc | 1,429,495 | |||||||||||||
| 156,900 | Aisin Seiki Co Ltd | 2,433,648 | |||||||||||||
| 1,174,600 | Alps Electric Co Ltd | 3,246,420 | |||||||||||||
See accompanying notes to the financial statements.
7
GMO International Intrinsic Value Fund
(A Series of GMO Trust)
Schedule of Investments — (Continued)
(showing percentage of total net assets)
February 28, 2009
| Shares | Description | Value ($) | |||||||||||||
| Japan — continued | |||||||||||||||
| 778,600 | Asahi Breweries Ltd | 9,749,192 | |||||||||||||
| 1,957,000 | Asahi Kasei Corp | 6,218,028 | |||||||||||||
| 96,100 | Astellas Pharma Inc | 3,188,931 | |||||||||||||
| 787,000 | Bank of Yokohama Ltd (The) | 3,333,019 | |||||||||||||
| 104,300 | Benesse Corp | 4,150,919 | |||||||||||||
| 299,200 | Bridgestone Corp | 4,075,030 | |||||||||||||
| 552,700 | Canon Inc | 13,948,530 | |||||||||||||
| 161,400 | Capcom | 3,063,949 | |||||||||||||
| 341,200 | Chubu Electric Power Co Inc | 8,412,250 | |||||||||||||
| 123,100 | Chugoku Electric Power Co Inc | 2,949,254 | |||||||||||||
| 112,200 | Circle K Sunkus Co Ltd | 1,724,513 | |||||||||||||
| 290,000 | COMSYS Holdings Corp | 2,076,195 | |||||||||||||
| 2,015,000 | Cosmo Oil Co Ltd | 5,585,088 | |||||||||||||
| 517,200 | Culture Convenience Club Co Ltd | 3,568,614 | |||||||||||||
| 475,000 | Dai Nippon Printing Co Ltd | 4,014,030 | |||||||||||||
| 797,650 | Daiei Inc * | 2,481,634 | |||||||||||||
| 458,000 | Daihatsu Motor Co Ltd | 3,472,463 | |||||||||||||
| 124,600 | Daito Trust Construction Co Ltd | 3,923,822 | |||||||||||||
| 779,000 | Daiwa Securities Group Inc | 2,675,949 | |||||||||||||
| 332,000 | Daiwabo Co Ltd | 743,705 | |||||||||||||
| 320,500 | Denso Corp | 6,085,149 | |||||||||||||
| 185,600 | Don Quijote Co Ltd | 2,189,748 | |||||||||||||
| 490,000 | Dowa Holdings Co Ltd | 1,510,412 | |||||||||||||
| 181,300 | Electric Power Development Co Ltd | 5,792,789 | |||||||||||||
| 200,700 | FamilyMart Co Ltd | 6,770,481 | |||||||||||||
| 248,700 | Fast Retailing Co Ltd | 24,981,925 | |||||||||||||
| 3,223,000 | Fuji Heavy Industries Ltd | 10,269,605 | |||||||||||||
| 180,000 | Fuji Oil Co Ltd | 2,262,862 | |||||||||||||
| 1,715,000 | Fujikura Ltd | 3,723,071 | |||||||||||||
| 1,115,000 | Furukawa Electric Co Ltd (The) | 2,890,755 | |||||||||||||
| 1,089,000 | GS Yuasa Corp | 4,473,065 | |||||||||||||
| 229,000 | Hankyu Hanshin Holdings Inc | 1,054,905 | |||||||||||||
| 1,609,000 | Hanwa Co Ltd | 4,334,530 | |||||||||||||
| 10,403,000 | Haseko Corp | 3,552,391 | |||||||||||||
See accompanying notes to the financial statements.
8
GMO International Intrinsic Value Fund
(A Series of GMO Trust)
Schedule of Investments — (Continued)
(showing percentage of total net assets)
February 28, 2009
| Shares | Description | Value ($) | |||||||||||||
| Japan — continued | |||||||||||||||
| 136,800 | Hikari Tsushin Inc | 2,204,241 | |||||||||||||
| 75,500 | Hirose Electric Co Ltd | 6,482,570 | |||||||||||||
| 1,629,000 | Hitachi Ltd | 4,056,398 | |||||||||||||
| 405,300 | Hokkaido Electric Power Co Inc | 8,583,880 | |||||||||||||
| 108,400 | Hokuriku Electric Power Co | 2,874,581 | |||||||||||||
| 3,172,300 | Honda Motor Co Ltd | 75,858,562 | |||||||||||||
| 249,400 | Hosiden Corp | 2,614,806 | |||||||||||||
| 66,800 | Hoya Corp | 1,210,581 | |||||||||||||
| 775 | INPEX Corp | 5,243,086 | |||||||||||||
| 592,000 | Iseki & Co Ltd * | 1,344,663 | |||||||||||||
| 960,000 | Itochu Corp | 4,304,567 | |||||||||||||
| 630,800 | JFE Holdings Inc | 13,649,195 | |||||||||||||
| 340,000 | JGC Corp | 3,875,001 | |||||||||||||
| 1,489,000 | Kajima Corp | 3,112,594 | |||||||||||||
| 269,100 | Kansai Electric Power Co Inc | 6,470,157 | |||||||||||||
| 1,415,000 | Kao Corp | 26,890,917 | |||||||||||||
| 2,853,000 | Kawasaki Kisen Kaisha Ltd | 8,969,169 | |||||||||||||
| 6,670 | Kenedix Inc * | 461,116 | |||||||||||||
| 47,500 | Keyence Corp | 8,965,104 | |||||||||||||
| 67,000 | Kirin Holdings Co Ltd | 646,693 | |||||||||||||
| 9,264 | KK daVinci Holdings * | 232,228 | |||||||||||||
| 280,000 | Konami Corp | 3,952,367 | |||||||||||||
| 231,000 | Kyowa Exeo Corp | 1,888,780 | |||||||||||||
| 460,600 | Kyushu Electric Power Co Inc | 10,908,274 | |||||||||||||
| 178,200 | Lawson Inc | 7,716,384 | |||||||||||||
| 596,600 | Leopalace21 Corp | 3,314,244 | |||||||||||||
| 1,359,000 | Marubeni Corp | 4,219,058 | |||||||||||||
| 725,800 | Matsui Securities Co Ltd | 4,149,311 | |||||||||||||
| 4,820,000 | Mazda Motor Corp | 6,089,587 | |||||||||||||
| 1,538,500 | Mitsubishi Chemical Holdings Corp | 5,225,721 | |||||||||||||
| 532,300 | Mitsubishi Corp | 6,622,600 | |||||||||||||
| 389,000 | Mitsubishi Gas Chemical Co Inc | 1,522,905 | |||||||||||||
| 1,647,000 | Mitsubishi Heavy Industries Ltd | 4,611,502 | |||||||||||||
| 721,000 | Mitsubishi Rayon Co Ltd | 1,307,731 | |||||||||||||
See accompanying notes to the financial statements.
9
GMO International Intrinsic Value Fund
(A Series of GMO Trust)
Schedule of Investments — (Continued)
(showing percentage of total net assets)
February 28, 2009
| Shares | Description | Value ($) | |||||||||||||
| Japan — continued | |||||||||||||||
| 2,417,800 | Mitsubishi UFJ Financial Group Inc | 10,922,711 | |||||||||||||
| 173,910 | Mitsubishi UFJ Lease & Finance Co Ltd | 3,026,460 | |||||||||||||
| 3,296,000 | Mitsui Mining & Smelting Co Ltd | 4,643,475 | |||||||||||||
| 1,574,000 | Mitsui OSK Lines Ltd | 7,978,108 | |||||||||||||
| 9,782,900 | Mizuho Financial Group Inc | 18,438,714 | |||||||||||||
| 208,000 | Murata Manufacturing Co Ltd | 7,897,158 | |||||||||||||
| 707,000 | NEC Corp | 1,650,724 | |||||||||||||
| 1,447 | Net One Systems Co Ltd | 2,032,739 | |||||||||||||
| 871,000 | Nichirei Corp | 2,875,864 | |||||||||||||
| 18,000 | Nintendo Co Ltd | 5,138,991 | |||||||||||||
| 389,000 | Nippon Carbon Co Ltd | 650,505 | |||||||||||||
| 362,000 | Nippon Denko Co Ltd | 991,968 | |||||||||||||
| 357,000 | Nippon Meat Packers Inc | 3,455,820 | |||||||||||||
| 3,526,500 | Nippon Mining Holdings Inc | 12,248,032 | |||||||||||||
| 5,246,000 | Nippon Oil Corp | 25,001,540 | |||||||||||||
| 135,900 | Nippon Paper Group Inc | 3,012,527 | |||||||||||||
| 1,095,400 | Nippon Telegraph & Telephone Corp | 46,838,711 | |||||||||||||
| 1,325,000 | Nippon Yakin Koguo Co Ltd | 2,551,091 | |||||||||||||
| 2,923,000 | Nippon Yusen KK | 12,057,846 | |||||||||||||
| 8,897,700 | Nissan Motor Co | 27,162,405 | |||||||||||||
| 114,300 | Nissha Printing Co Ltd | 2,836,100 | |||||||||||||
| 314,500 | Nisshin Seifun Group Inc | 3,174,738 | |||||||||||||
| 905,000 | Nisshinbo Industries Inc | 6,458,641 | |||||||||||||
| 141,300 | Nitto Denko Corp | 2,546,976 | |||||||||||||
| 243,300 | Nomura Research Institute | 3,831,506 | |||||||||||||
| 26,865 | NTT Docomo Inc | 41,850,842 | |||||||||||||
| 1,091,000 | Obayashi Corp | 4,587,007 | |||||||||||||
| 416,000 | Odakyu Electric Railway Co Ltd | 3,072,603 | |||||||||||||
| 948,000 | OJI Paper Co Ltd | 3,506,311 | |||||||||||||
| 74,100 | Ono Pharmaceutical Co Ltd | 3,430,206 | |||||||||||||
| 52,100 | Oriental Land Co Ltd | 3,418,245 | |||||||||||||
| 276,600 | ORIX Corp | 5,618,882 | |||||||||||||
| 6,961,000 | Osaka Gas Co Ltd | 24,889,061 | |||||||||||||
| 1,359,000 | Pacific Metals Co Ltd | 5,205,553 | |||||||||||||
See accompanying notes to the financial statements.
10
GMO International Intrinsic Value Fund
(A Series of GMO Trust)
Schedule of Investments — (Continued)
(showing percentage of total net assets)
February 28, 2009
| Shares | Description | Value ($) | |||||||||||||
| Japan — continued | |||||||||||||||
| 131,600 | Panasonic Corp | 1,523,693 | |||||||||||||
| 101,270 | Point Inc | 4,142,247 | |||||||||||||
| 253,750 | Promise Co Ltd | 3,389,303 | |||||||||||||
| 740,000 | Rengo Co Ltd | 4,046,474 | |||||||||||||
| 723,900 | Resona Holdings Inc | 12,412,002 | |||||||||||||
| 901,000 | Ricoh Company Ltd | 10,177,438 | |||||||||||||
| 69,200 | Rohm Co Ltd | 3,305,168 | |||||||||||||
| 173,000 | Ryohin Keikaku Co Ltd | 6,087,345 | |||||||||||||
| 132,000 | Saizeriya Co Ltd | 1,300,182 | |||||||||||||
| 323,700 | Sankyo Co Ltd | 14,527,470 | |||||||||||||
| 2,099,000 | Sanyo Electric Co Ltd * | 2,946,295 | |||||||||||||
| 25,019 | SBI Holdings Inc | 1,992,549 | |||||||||||||
| 1,289,800 | Sega Sammy Holdings Inc | 10,976,228 | |||||||||||||
| 168,600 | Seiko Epson Corp | 1,928,874 | |||||||||||||
| 2,637,300 | Seven & I Holdings Co Ltd | 58,447,413 | |||||||||||||
| 86,300 | Shimamura Co Ltd | 4,454,246 | |||||||||||||
| 155,100 | Shimano Inc | 5,051,433 | |||||||||||||
| 388,600 | Shin-Etsu Chemical Co Ltd | 17,301,100 | |||||||||||||
| 1,419,000 | Shinsei Bank Ltd | 1,249,701 | |||||||||||||
| 1,054,000 | Showa Shell Sekiyu KK | 8,757,560 | |||||||||||||
| 5,790,200 | Sojitz Corp | 6,506,970 | |||||||||||||
| 457,100 | SUMCO Corp | 5,663,606 | |||||||||||||
| 940,700 | Sumitomo Corp | 7,854,299 | |||||||||||||
| 1,169,800 | Sumitomo Electric Industries Ltd | 9,090,043 | |||||||||||||
| 4,244,000 | Sumitomo Metal Industries Ltd | 7,950,202 | |||||||||||||
| 785,000 | Sumitomo Metal Mining Co Ltd | 7,835,740 | |||||||||||||
| 1,476,000 | Sumitomo Trust & Banking Co Ltd | 4,874,888 | |||||||||||||
| 61,200 | T&D Holdings Inc | 1,369,719 | |||||||||||||
| 2,192,000 | Taisei Corp | 3,880,809 | |||||||||||||
| 452,900 | Takeda Pharmaceutical Co Ltd | 18,292,552 | |||||||||||||
| 913,510 | Takefuji Corp | 3,015,995 | |||||||||||||
| 114,500 | Terumo Corp | 3,508,984 | |||||||||||||
| 182,600 | Tohoku Electric Power Co Inc | 4,275,219 | |||||||||||||
| 904,500 | Tokyo Electric Power Co Inc (The) | 25,534,073 | |||||||||||||
See accompanying notes to the financial statements.
11
GMO International Intrinsic Value Fund
(A Series of GMO Trust)
Schedule of Investments — (Continued)
(showing percentage of total net assets)
February 28, 2009
| Shares | Description | Value ($) | |||||||||||||
| Japan — continued | |||||||||||||||
| 2,682,000 | Tokyo Gas Co Ltd | 10,743,944 | |||||||||||||
| 919,800 | Tokyo Steel Manufacturing Co | 9,043,006 | |||||||||||||
| 540,000 | Tokyo Tatemono Co Ltd | 1,193,596 | |||||||||||||
| 790,000 | TonenGeneral Sekiyu KK | 7,464,715 | |||||||||||||
| 638,000 | Toppan Printing Co Ltd | 3,800,135 | |||||||||||||
| 2,730,000 | Tosoh Corp | 4,131,837 | |||||||||||||
| 867,000 | Toyo Engineering Corp | 2,348,746 | |||||||||||||
| 178,000 | Toyo Suisan Kaisha Ltd | 4,212,653 | |||||||||||||
| 122,900 | Toyota Boshoku Corp | 1,176,373 | |||||||||||||
| 200 | Toyota Industries Corp | 4,262 | |||||||||||||
| 394,600 | Toyota Motor Corp | 12,638,898 | |||||||||||||
| 388,600 | Toyota Tsusho Kaisha | 3,138,426 | |||||||||||||
| 1,263,000 | Ube Industries Ltd | 1,994,123 | |||||||||||||
| 62,500 | Unicharm Corp | 4,083,150 | |||||||||||||
| 1,141,000 | UNY Co Ltd | 8,344,847 | |||||||||||||
| 76,120 | USS Co Ltd | 3,070,799 | |||||||||||||
| 21,030 | Yahoo Japan Corp | 6,015,667 | |||||||||||||
| 89,000 | Yamato Kogyo Co | 1,805,505 | |||||||||||||
| 223,000 | Yamazaki Baking Co Ltd | 2,809,689 | |||||||||||||
| Total Japan | 1,112,904,665 | ||||||||||||||
| Netherlands — 1.8% | |||||||||||||||
| 3,785,031 | Aegon NV | 13,471,233 | |||||||||||||
| 112,184 | European Aeronautic Defense and Space Co NV | 1,628,775 | |||||||||||||
| 11,644 | Gamma Holdings NV | 50,587 | |||||||||||||
| 442,871 | Heineken NV | 11,824,973 | |||||||||||||
| 3,826,638 | ING Groep NV | 17,297,511 | |||||||||||||
| 582,644 | Koninklijke Ahold NV | 6,465,081 | |||||||||||||
| 256,990 | Koninklijke DSM NV | 5,873,115 | |||||||||||||
| 314,313 | Reed Elsevier NV | 3,492,273 | |||||||||||||
| 339,421 | Unilever NV | 6,503,741 | |||||||||||||
| Total Netherlands | 66,607,289 | ||||||||||||||
See accompanying notes to the financial statements.
12
GMO International Intrinsic Value Fund
(A Series of GMO Trust)
Schedule of Investments — (Continued)
(showing percentage of total net assets)
February 28, 2009
| Shares | Description | Value ($) | |||||||||||||
| New Zealand — 0.1% | |||||||||||||||
| 4,824,192 | Telecom Corp of New Zealand | 5,847,196 | |||||||||||||
| Norway — 0.3% | |||||||||||||||
| 756,300 | DnB NOR ASA | 2,720,558 | |||||||||||||
| 429,050 | StatoilHydro ASA | 7,123,376 | |||||||||||||
| Total Norway | 9,843,934 | ||||||||||||||
| Singapore — 1.7% | |||||||||||||||
| 2,384,000 | Neptune Orient Lines Ltd | 1,827,412 | |||||||||||||
| 2,627,200 | Noble Group Ltd | 1,794,525 | |||||||||||||
| 2,870,000 | Oversea-Chinese Banking Corp Ltd | 8,199,364 | |||||||||||||
| 3,258,100 | Sembcorp Industries Ltd | 4,370,096 | |||||||||||||
| 4,795,000 | SembCorp Marine Ltd | 4,254,236 | |||||||||||||
| 1,251,000 | Singapore Exchange Ltd | 3,606,339 | |||||||||||||
| 1,578,000 | Singapore Petroleum Co | 2,703,322 | |||||||||||||
| 5,458,000 | Singapore Press Holdings Ltd | 9,543,874 | |||||||||||||
| 2,399,000 | Singapore Technologies Engineering Ltd | 3,543,747 | |||||||||||||
| 11,974,000 | Singapore Telecommunications | 18,845,076 | |||||||||||||
| 1,133,000 | United Overseas Bank Ltd | 7,219,650 | |||||||||||||
| Total Singapore | 65,907,641 | ||||||||||||||
| Spain — 1.6% | |||||||||||||||
| 470,250 | Banco Bilbao Vizcaya Argentaria SA * | 3,397,095 | |||||||||||||
| 634,251 | Banco Popular Espanol SA * | 3,001,439 | |||||||||||||
| 988,220 | Banco Santander SA | 6,036,944 | |||||||||||||
| 118,893 | Gas Natural SDG SA | 2,131,334 | |||||||||||||
| 599,186 | Iberdrola SA | 3,896,537 | |||||||||||||
| 204,544 | Inditex SA | 7,672,951 | |||||||||||||
| 1,243,711 | Repsol YPF SA | 18,996,258 | |||||||||||||
| 627,162 | Telefonica SA | 11,542,323 | |||||||||||||
| 104,458 | Union Fenosa SA | 2,354,188 | |||||||||||||
| Total Spain | 59,029,069 | ||||||||||||||
See accompanying notes to the financial statements.
13
GMO International Intrinsic Value Fund
(A Series of GMO Trust)
Schedule of Investments — (Continued)
(showing percentage of total net assets)
February 28, 2009
| Shares | Description | Value ($) | |||||||||||||
| Sweden — 1.3% | |||||||||||||||
| 517,366 | Hennes & Mauritz AB Class B | 19,191,269 | |||||||||||||
| 913,607 | Investor AB Class B | 10,312,392 | |||||||||||||
| 1,162,532 | Nordea Bank AB | 5,796,242 | |||||||||||||
| 418,200 | SKF AB Class B | 3,486,049 | |||||||||||||
| 655,877 | Svenska Handelsbanken AB Class A | 7,849,916 | |||||||||||||
| 670,100 | Swedbank AB | 1,732,809 | |||||||||||||
| Total Sweden | 48,368,677 | ||||||||||||||
| Switzerland — 8.5% | |||||||||||||||
| 286,555 | Ciba Holding AG * | 12,076,045 | |||||||||||||
| 286,383 | Clariant AG (Registered) * | 1,067,636 | |||||||||||||
| 255,426 | Compagnie Financiere Richemont SA Class A | 3,373,366 | |||||||||||||
| 2,847,350 | Nestle SA (Registered) | 93,081,097 | |||||||||||||
| 3,943,783 | Novartis AG (Registered) | 143,882,257 | |||||||||||||
| 253,409 | Roche Holding AG (Non Voting) | 28,766,367 | |||||||||||||
| 38,127 | Swatch Group AG | 4,241,071 | |||||||||||||
| 22,893 | Syngenta AG (Registered) | 4,894,010 | |||||||||||||
| 148,631 | Synthes Inc | 17,247,930 | |||||||||||||
| 1,339,874 | UBS AG (Registered) * | 12,546,494 | |||||||||||||
| Total Switzerland | 321,176,273 | ||||||||||||||
| United Kingdom — 19.0% | |||||||||||||||
| 1,932,712 | 3i Group Plc | 5,499,985 | |||||||||||||
| 2,588,275 | AstraZeneca Plc | 82,078,862 | |||||||||||||
| 718,499 | BAE Systems Plc | 3,793,283 | |||||||||||||
| 8,372,626 | Barclays Plc | 10,984,201 | |||||||||||||
| 1,095,110 | Barratt Developments Plc | 1,325,541 | |||||||||||||
| 1,998,694 | BG Group Plc | 28,570,097 | |||||||||||||
| 3,001,764 | BP Plc | 19,123,527 | |||||||||||||
| 862,287 | British American Tobacco Plc | 22,040,365 | |||||||||||||
| 4,602,910 | BT Group Plc | 5,880,493 | |||||||||||||
| 1,246,405 | Burberry Group Plc | 4,547,781 | |||||||||||||
| 1,378,307 | Cable & Wireless Plc | 2,697,343 | |||||||||||||
| 876,734 | Cadbury Plc | 6,675,045 | |||||||||||||
See accompanying notes to the financial statements.
14
GMO International Intrinsic Value Fund
(A Series of GMO Trust)
Schedule of Investments — (Continued)
(showing percentage of total net assets)
February 28, 2009
| Shares | Description | Value ($) | |||||||||||||
| United Kingdom — continued | |||||||||||||||
| 682,752 | Capita Group Plc | 6,442,715 | |||||||||||||
| 1,132,089 | Centrica Plc | 4,353,683 | |||||||||||||
| 2,527,322 | Cobham Plc | 6,937,010 | |||||||||||||
| 1,694,513 | Compass Group Plc | 7,444,736 | |||||||||||||
| 1,318,395 | Diageo Plc | 15,202,745 | |||||||||||||
| 1,008,106 | Drax Group Plc | 7,447,513 | |||||||||||||
| 16,531,489 | DSG International Plc | 4,754,596 | |||||||||||||
| 401,044 | FirstGroup Plc | 1,531,848 | |||||||||||||
| 1,457,164 | Game Group Plc | 3,029,400 | |||||||||||||
| 11,791,007 | GlaxoSmithKline Plc | 178,831,844 | |||||||||||||
| 3,502,880 | Home Retail Group Plc | 10,559,001 | |||||||||||||
| 2,205,355 | HSBC Holdings Plc | 15,338,558 | |||||||||||||
| 186,890 | Imperial Tobacco Group Plc | 4,474,508 | |||||||||||||
| 285,771 | Jardine Lloyd Thompson Group Plc | 1,854,699 | |||||||||||||
| 1,916,757 | Kesa Electricals Plc | 2,883,152 | |||||||||||||
| 3,358,416 | Kingfisher Plc | 6,018,540 | |||||||||||||
| 299,160 | Lancashire Holdings Ltd * | 2,048,494 | |||||||||||||
| 16,124,188 | Lloyds Banking Group Plc | 13,236,014 | |||||||||||||
| 321,740 | London Stock Exchange | 1,974,927 | |||||||||||||
| 504,514 | Next Plc | 8,366,325 | |||||||||||||
| 4,302,051 | Old Mutual Plc | 2,528,194 | |||||||||||||
| 248,399 | Reckitt Benckiser Group Plc | 9,505,118 | |||||||||||||
| 798,727 | Reed Elsevier Plc | 5,966,905 | |||||||||||||
| 164,991 | Rio Tinto Plc | 4,211,749 | |||||||||||||
| 27,582,510 | Royal Bank of Scotland Group Plc | 8,983,320 | |||||||||||||
| 2,351,023 | Royal Dutch Shell Plc A Shares (London) | 51,615,068 | |||||||||||||
| 1,179,016 | Royal Dutch Shell Plc B Shares (London) | 24,748,530 | |||||||||||||
| 2,013,967 | RSA Insurance Group Plc | 3,937,580 | |||||||||||||
| 1,438,161 | Sage Group Plc | 3,484,640 | |||||||||||||
| 505,735 | Scottish & Southern Energy Plc | 8,241,191 | |||||||||||||
| 444,774 | Signet Jewelers Ltd | 3,388,149 | |||||||||||||
| 932,781 | Smith & Nephew Plc | 6,610,078 | |||||||||||||
| 2,881,273 | Taylor Woodrow Plc | 756,081 | |||||||||||||
| 1,418,284 | Tesco Plc | 6,726,157 | |||||||||||||
See accompanying notes to the financial statements.
15
GMO International Intrinsic Value Fund
(A Series of GMO Trust)
Schedule of Investments — (Continued)
(showing percentage of total net assets)
February 28, 2009
| Shares | Description | Value ($) | |||||||||||||
| United Kingdom — continued | |||||||||||||||
| 576,738 | Travis Perkins Plc | 2,672,408 | |||||||||||||
| 229,376 | Unilever Plc | 4,431,022 | |||||||||||||
| 590,487 | United Utilities Group Plc | 4,266,437 | |||||||||||||
| 34,405,461 | Vodafone Group Plc | 60,962,738 | |||||||||||||
| 1,956,735 | William Hill Plc | 6,573,721 | |||||||||||||
| 1,668,222 | Wolseley Plc | 4,213,071 | |||||||||||||
| Total United Kingdom | 719,768,988 | ||||||||||||||
| TOTAL COMMON STOCKS (COST $6,487,775,057) | 3,601,691,507 | ||||||||||||||
| PREFERRED STOCKS — 0.0% | |||||||||||||||
| Germany — 0.0% | |||||||||||||||
| 9,049 | Villeroy & Boch AG (Non Voting) 12.57% | 41,785 | |||||||||||||
| TOTAL PREFERRED STOCKS (COST $95,178) | 41,785 | ||||||||||||||
| RIGHTS AND WARRANTS — 0.0% | |||||||||||||||
| France — 0.0% | |||||||||||||||
| 262,246 | Cie de Saint-Gobain Warrants, Expires 03/06/09 * | 385,656 | |||||||||||||
| TOTAL RIGHTS AND WARRANTS (COST $1,083,603) | 385,656 | ||||||||||||||
See accompanying notes to the financial statements.
16
GMO International Intrinsic Value Fund
(A Series of GMO Trust)
Schedule of Investments — (Continued)
(showing percentage of total net assets)
February 28, 2009
| Par Value ($) | Description | Value ($) | |||||||||||||
| SHORT-TERM INVESTMENTS — 2.5% | |||||||||||||||
| 25,000,000 | BNP Paribas Time Deposit, 0.23%, due 03/02/09 | 25,000,000 | |||||||||||||
| 46,775 | Brown Brothers Harriman Time Deposit, 0.02% - 2.45%, due 03/02/09 | 46,775 | |||||||||||||
| 6,107,066 | Citibank Time Deposit, 0.05% - 2.29%, due 03/02/09 | 6,107,066 | |||||||||||||
| 356,473 | HSBC Bank (Hong Kong) Time Deposit, 0.01%, due 03/02/09 | 356,473 | |||||||||||||
| 25,000,000 | HSBC Bank (USA) Time Deposit, 0.19%, due 03/02/09 | 25,000,000 | |||||||||||||
| 38,014 | JPMorgan Chase Time Deposit, 0.01%, due 03/02/09 | 38,014 | |||||||||||||
| 25,000,000 | Royal Bank of Canada Time Deposit, 0.20%, due 03/02/09 | 25,000,000 | |||||||||||||
| 11,328,600 | Societe Generale Time Deposit, 0.25% - 0.33%, due 03/02/09 | 11,328,600 | |||||||||||||
| TOTAL SHORT-TERM INVESTMENTS (COST $92,876,928) | 92,876,928 | ||||||||||||||
| TOTAL INVESTMENTS — 97.5% (Cost $6,581,830,766) | 3,694,995,876 | ||||||||||||||
| Other Assets and Liabilities (net) — 2.5% | 96,019,503 | ||||||||||||||
| TOTAL NET ASSETS — 100.0% | $ | 3,791,015,379 | |||||||||||||
See accompanying notes to the financial statements.
17
GMO International Intrinsic Value Fund
(A Series of GMO Trust)
Schedule of Investments — (Continued)
February 28, 2009
A summary of outstanding financial instruments at February 28, 2009 is as follows:
Forward Currency Contracts
| Settlement Date | Deliver/Receive | Units of Currency | Value | Net Unrealized Appreciation (Depreciation) | |||||||||||||||
| Buys | |||||||||||||||||||
| 4/24/09 | AUD | 13,186,000 | $ | 8,400,809 | $ | (119,325 | ) | ||||||||||||
| 4/24/09 | CAD | 8,102,000 | 6,368,934 | (136,554 | ) | ||||||||||||||
| 4/24/09 | CAD | 12,368,000 | 9,722,411 | (129,978 | ) | ||||||||||||||
| 4/24/09 | CHF | 32,284,954 | 27,628,580 | 78,518 | |||||||||||||||
| 4/24/09 | CHF | 32,284,954 | 27,628,580 | 74,897 | |||||||||||||||
| 4/24/09 | CHF | 32,284,954 | 27,628,580 | 111,509 | |||||||||||||||
| 4/24/09 | CHF | 32,284,954 | 27,628,580 | 46,036 | |||||||||||||||
| 4/24/09 | CHF | 32,284,954 | 27,628,580 | 42,148 | |||||||||||||||
| 4/24/09 | EUR | 61,451,067 | 77,884,475 | 690,874 | |||||||||||||||
| 4/24/09 | EUR | 61,451,067 | 77,884,475 | 481,940 | |||||||||||||||
| 4/24/09 | EUR | 122,902,135 | 155,768,952 | 965,110 | |||||||||||||||
| 4/24/09 | GBP | 34,204,729 | 48,962,428 | (594,239 | ) | ||||||||||||||
| 4/24/09 | JPY | 4,233,677,586 | 43,427,646 | (3,848,018 | ) | ||||||||||||||
| 4/24/09 | JPY | 3,311,304,013 | 33,966,247 | (2,060,060 | ) | ||||||||||||||
| 4/24/09 | JPY | 3,311,304,013 | 33,966,247 | (2,088,892 | ) | ||||||||||||||
| 4/24/09 | SEK | 251,526,296 | 27,924,468 | (2,476,970 | ) | ||||||||||||||
| 4/24/09 | SEK | 195,511,737 | 21,705,728 | (451,339 | ) | ||||||||||||||
| 4/24/09 | SEK | 195,511,737 | 21,705,728 | (721,001 | ) | ||||||||||||||
| 4/24/09 | SEK | 195,511,737 | 21,705,728 | (695,049 | ) | ||||||||||||||
| 4/24/09 | SEK | 195,511,737 | 21,705,728 | (722,674 | ) | ||||||||||||||
| 4/24/09 | SEK | 195,511,737 | 21,705,728 | (631,706 | ) | ||||||||||||||
| 4/24/09 | SEK | 195,511,737 | 21,705,728 | (675,765 | ) | ||||||||||||||
| 4/24/09 | SEK | 195,511,737 | 21,705,728 | (665,641 | ) | ||||||||||||||
| $ | 814,360,088 | $ | (13,526,179 | ) | |||||||||||||||
| Sales | |||||||||||||||||||
| 4/24/09 | AUD | 45,779,936 | $ | 29,166,428 | $ | (121,073 | ) | ||||||||||||
| 4/24/09 | AUD | 44,433,467 | 28,308,591 | (84,453 | ) | ||||||||||||||
| 4/24/09 | AUD | 44,433,467 | 28,308,591 | (87,119 | ) | ||||||||||||||
| 4/24/09 | CAD | 38,766,287 | 30,473,946 | 190,370 | |||||||||||||||
| 4/24/09 | CAD | 38,766,287 | 30,473,946 | 170,008 | |||||||||||||||
| 4/24/09 | CAD | 38,766,287 | 30,473,946 | 175,702 | |||||||||||||||
See accompanying notes to the financial statements.
18
GMO International Intrinsic Value Fund
(A Series of GMO Trust)
Schedule of Investments — (Continued)
February 28, 2009
Forward Currency Contracts — continued
| Settlement Date | Deliver/Receive | Units of Currency | Value | Net Unrealized Appreciation (Depreciation) | |||||||||||||||
| 4/24/09 | CAD | 38,766,287 | $ | 30,473,946 | $ | 243,703 | |||||||||||||
| 4/24/09 | EUR | 9,015,000 | 11,425,815 | 141,421 | |||||||||||||||
| 4/24/09 | EUR | 112,594,537 | 142,704,868 | 1,730,278 | |||||||||||||||
| 4/24/09 | GBP | 31,467,765 | 45,044,595 | (178,580 | ) | ||||||||||||||
| 4/24/09 | GBP | 31,467,765 | 45,044,595 | (315,685 | ) | ||||||||||||||
| 4/24/09 | GBP | 31,467,765 | 45,044,595 | (172,978 | ) | ||||||||||||||
| 4/24/09 | GBP | 31,467,765 | 45,044,595 | (289,252 | ) | ||||||||||||||
| 4/24/09 | GBP | 31,467,765 | 45,044,595 | (166,055 | ) | ||||||||||||||
| 4/24/09 | GBP | 31,467,765 | 45,044,595 | (293,657 | ) | ||||||||||||||
| 4/24/09 | GBP | 31,467,765 | 45,044,595 | (182,387 | ) | ||||||||||||||
| $ | 677,122,242 | $ | 760,243 | ||||||||||||||||
Futures Contracts
| Number of Contracts | Type | Expiration Date | Contract Value | Net Unrealized Appreciation (Depreciation) | |||||||||||||||
| Buys | |||||||||||||||||||
| 704 | DAX | March 2009 | $ | 84,829,046 | $ | (18,375,462 | ) | ||||||||||||
| 1,414 | CAC 40 | March 2009 | 47,772,924 | (3,711,028 | ) | ||||||||||||||
| 933 | S&P/MIB | March 2009 | 89,465,628 | (29,147,676 | ) | ||||||||||||||
| 729 | TOPIX Index | March 2009 | 55,946,092 | (4,954,266 | ) | ||||||||||||||
| $ | 278,013,690 | $ | (56,188,432 | ) | |||||||||||||||
| Sales | |||||||||||||||||||
| 785 | FTSE 100 | March 2009 | $ | 42,384,408 | $ | 4,302,687 | |||||||||||||
| 78 | Hang Seng | March 2009 | 6,303,387 | 89,762 | |||||||||||||||
| 695 | SPI 200 | March 2009 | 36,305,145 | 3,245,021 | |||||||||||||||
| 823 | S&P Toronto 60 | March 2009 | 63,242,006 | 4,370,186 | |||||||||||||||
| 521 | IBEX 35 | March 2009 | 49,641,680 | 2,049,162 | |||||||||||||||
| $ | 197,876,626 | $ | 14,056,818 | ||||||||||||||||
As of February 28, 2009, for the futures contracts held, the Fund had sufficient cash and/or securities to cover any commitments or margin requirements of the relevant broker or exchange.
See accompanying notes to the financial statements.
19
GMO International Intrinsic Value Fund
(A Series of GMO Trust)
Schedule of Investments — (Continued)
February 28, 2009
Notes to Schedule of Investments:
ADR - American Depositary Receipt
* Non-income producing security.
Currency Abbreviations:
AUD - Australian Dollar
CAD - Canadian Dollar
CHF - Swiss Franc
EUR - Euro
GBP - British Pound
JPY - Japanese Yen
SEK - Swedish Krona
See accompanying notes to the financial statements.
20
GMO International Intrinsic Value Fund
(A Series of GMO Trust)
Statement of Assets and Liabilities — February 28, 2009
| Assets: | |||||||
| Investments, at value (cost $6,581,830,766) (Note 2) | $ | 3,694,995,876 | |||||
| Foreign currency, at value (cost $1,482) (Note 2) | 1,478 | ||||||
| Receivable for investments sold | 1,738,432 | ||||||
| Receivable for Fund shares sold | 30,607,569 | ||||||
| Dividends and interest receivable | 12,672,967 | ||||||
| Foreign taxes receivable | 1,736,278 | ||||||
| Unrealized appreciation on open forward currency contracts (Note 2) | 5,142,514 | ||||||
| Receivable for collateral on open futures contracts (Note 2) | 70,689,727 | ||||||
| Receivable for expenses reimbursed by Manager (Note 3) | 19,712 | ||||||
| Total assets | 3,817,604,553 | ||||||
| Liabilities: | |||||||
| Payable for investments purchased | 1,156,260 | ||||||
| Payable for Fund shares repurchased | 1,114,509 | ||||||
| Payable to affiliate for (Note 3): | |||||||
| Management fee | 1,577,344 | ||||||
| Shareholder service fee | 382,174 | ||||||
| Administration fee – Class M | 1,501 | ||||||
| Trustees and Chief Compliance Officer of GMO Trust fees | 15,306 | ||||||
| Payable for 12b-1 fee – Class M | 4,174 | ||||||
| Payable for variation margin on open futures contracts (Note 2) | 3,199,913 | ||||||
| Unrealized depreciation on open forward currency contracts (Note 2) | 17,908,450 | ||||||
| Miscellaneous payable | 320,432 | ||||||
| Accrued expenses | 909,111 | ||||||
| Total liabilities | 26,589,174 | ||||||
| Net assets | $ | 3,791,015,379 | |||||
See accompanying notes to the financial statements.
21
GMO International Intrinsic Value Fund
(A Series of GMO Trust)
Statement of Assets and Liabilities — February 28, 2009 — (Continued)
| Net assets consist of: | |||||||
| Paid-in capital | $ | 7,135,029,435 | |||||
| Accumulated undistributed net investment income | 75,187,376 | ||||||
| Accumulated net realized loss | (477,227,959 | ) | |||||
| Net unrealized depreciation | (2,941,973,473 | ) | |||||
| $ | 3,791,015,379 | ||||||
| Net assets attributable to: | |||||||
| Class II shares | $ | 394,069,819 | |||||
| Class III shares | $ | 1,487,839,389 | |||||
| Class IV shares | $ | 1,900,168,374 | |||||
| Class M shares | $ | 8,937,797 | |||||
| Shares outstanding: | |||||||
| Class II | 28,437,198 | ||||||
| Class III | 106,242,973 | ||||||
| Class IV | 135,767,547 | ||||||
| Class M | 646,388 | ||||||
| Net asset value per share: | |||||||
| Class II | $ | 13.86 | |||||
| Class III | $ | 14.00 | |||||
| Class IV | $ | 14.00 | |||||
| Class M | $ | 13.83 | |||||
See accompanying notes to the financial statements.
22
GMO International Intrinsic Value Fund
(A Series of GMO Trust)
Statement of Operations — Year Ended February 28, 2009
| Investment Income: | |||||||
| Dividends (net of withholding taxes of $23,658,193) | $ | 237,798,464 | |||||
| Securities lending income | 6,303,767 | ||||||
| Interest | 3,543,007 | ||||||
| Total investment income | 247,645,238 | ||||||
| Expenses: | |||||||
| Management fee (Note 3) | 31,414,815 | ||||||
| Shareholder service fee – Class II (Note 3) | 904,824 | ||||||
| Shareholder service fee – Class III (Note 3) | 3,270,352 | ||||||
| Shareholder service fee – Class IV (Note 3) | 3,130,154 | ||||||
| 12b-1 fee – Class M (Note 3) | 37,266 | ||||||
| Administration fee – Class M (Note 3) | 29,813 | ||||||
| Custodian and fund accounting agent fees | 2,554,946 | ||||||
| Transfer agent fees | 71,362 | ||||||
| Audit and tax fees | 109,379 | ||||||
| Legal fees | 153,653 | ||||||
| Trustees fees and related expenses (Note 3) | 85,180 | ||||||
| Registration fees | 29,823 | ||||||
| Miscellaneous | 106,958 | ||||||
| Total expenses | 41,898,525 | ||||||
| Fees and expenses reimbursed by Manager (Note 3) | (2,981,508 | ) | |||||
| Expense reductions (Note 2) | (17,900 | ) | |||||
| Net expenses | 38,899,117 | ||||||
| Net investment income (loss) | 208,746,121 | ||||||
| Realized and unrealized gain (loss): | |||||||
| Net realized gain (loss) on: | |||||||
| Investments | (345,352,225 | ) | |||||
| Closed futures contracts | (143,483,872 | ) | |||||
| Foreign currency, forward contracts and foreign currency related transactions | 53,004,523 | ||||||
| Net realized gain (loss) | (435,831,574 | ) | |||||
| Change in net unrealized appreciation (depreciation) on: | |||||||
| Investments | (3,314,080,721 | ) | |||||
| Open futures contracts | 13,053,553 | ||||||
| Foreign currency, forward contracts and foreign currency related transactions | (37,384,477 | ) | |||||
| Net unrealized gain (loss) | (3,338,411,645 | ) | |||||
| Net realized and unrealized gain (loss) | (3,774,243,219 | ) | |||||
| Net increase (decrease) in net assets resulting from operations | $ | (3,565,497,098 | ) | ||||
See accompanying notes to the financial statements.
23
GMO International Intrinsic Value Fund
(A Series of GMO Trust)
Statement of Changes in Net Assets
| Year Ended February 28, 2009 | Year Ended February 29, 2008 | ||||||||||
| Increase (decrease) in net assets: | |||||||||||
| Operations: | |||||||||||
| Net investment income (loss) | $ | 208,746,121 | $ | 218,038,494 | |||||||
| Net realized gain (loss) | (435,831,574 | ) | 1,274,521,119 | ||||||||
| Change in net unrealized appreciation (depreciation) | (3,338,411,645 | ) | (1,522,423,988 | ) | |||||||
| Net increase (decrease) in net assets from operations | (3,565,497,098 | ) | (29,864,375 | ) | |||||||
| Distributions to shareholders from: | |||||||||||
| Net investment income | |||||||||||
| Class II | (16,802,472 | ) | (12,407,304 | ) | |||||||
| Class III | (92,401,886 | ) | (65,215,261 | ) | |||||||
| Class IV | (145,544,379 | ) | (109,936,051 | ) | |||||||
| Class M | (578,220 | ) | (443,458 | ) | |||||||
| Total distributions from net investment income | (255,326,957 | ) | (188,002,074 | ) | |||||||
| Net realized gains | |||||||||||
| Class II | (26,461,564 | ) | (69,248,911 | ) | |||||||
| Class III | (143,314,754 | ) | (349,607,893 | ) | |||||||
| Class IV | (230,830,432 | ) | (574,842,698 | ) | |||||||
| Class M | (1,002,702 | ) | (2,604,560 | ) | |||||||
| Total distributions from net realized gains | (401,609,452 | ) | (996,304,062 | ) | |||||||
| (656,936,409 | ) | (1,184,306,136 | ) | ||||||||
| Net share transactions (Note 7): | |||||||||||
| Class II | 166,533,198 | 29,246,584 | |||||||||
| Class III | 398,098,987 | 350,165,933 | |||||||||
| Class IV | 172,499,767 | 254,901,122 | |||||||||
| Class M | 353,743 | 4,852,998 | |||||||||
| Increase (decrease) in net assets resulting from net share transactions | 737,485,695 | 639,166,637 | |||||||||
| Total increase (decrease) in net assets | (3,484,947,812 | ) | (575,003,874 | ) | |||||||
| Net assets: | |||||||||||
| Beginning of period | 7,275,963,191 | 7,850,967,065 | |||||||||
| End of period (including accumulated undistributed net investment income of $75,187,376 and $84,019,314, respectively) | $ | 3,791,015,379 | $ | 7,275,963,191 | |||||||
See accompanying notes to the financial statements.
24
GMO International Intrinsic Value Fund
(A Series of GMO Trust)
Financial Highlights
(For a Class II share outstanding throughout each period)
| Year Ended February 28/29, | |||||||||||||||||||||||
| 2009 | 2008 | 2007 | 2006 | 2005 | |||||||||||||||||||
| Net asset value, beginning of period | $ | 29.69 | $ | 34.99 | $ | 32.35 | $ | 29.04 | $ | 24.18 | |||||||||||||
| Income (loss) from investment operations: | |||||||||||||||||||||||
| Net investment income (loss)† | 0.79 | 0.93 | 0.79 | 0.65 | 0.49 | ||||||||||||||||||
| Net realized and unrealized gain (loss) | (14.01 | ) | (0.86 | ) | 5.60 | 4.45 | 5.07 | ||||||||||||||||
| Total from investment operations | (13.22 | ) | 0.07 | 6.39 | 5.10 | 5.56 | |||||||||||||||||
| Less distributions to shareholders: | |||||||||||||||||||||||
| From net investment income | (0.99 | ) | (0.83 | ) | (0.54 | ) | (0.36 | ) | (0.66 | ) | |||||||||||||
| From net realized gains | (1.62 | ) | (4.54 | ) | (3.21 | ) | (1.43 | ) | (0.04 | ) | |||||||||||||
| Total distributions | (2.61 | ) | (5.37 | ) | (3.75 | ) | (1.79 | ) | (0.70 | ) | |||||||||||||
| Net asset value, end of period | $ | 13.86 | $ | 29.69 | $ | 34.99 | $ | 32.35 | $ | 29.04 | |||||||||||||
| Total Return(a) | (48.04 | )% | (1.11 | )% | 20.46 | % | 18.16 | % | 23.17 | % | |||||||||||||
| Ratios/Supplemental Data: | |||||||||||||||||||||||
| Net assets, end of period (000's) | $ | 394,070 | $ | 510,006 | $ | 564,440 | $ | 567,313 | $ | 231,695 | |||||||||||||
| Net expenses to average daily net assets | 0.74 | %(b) | 0.76 | %(b) | 0.76 | % | 0.76 | % | 0.76 | % | |||||||||||||
| Net investment income to average daily net assets | 3.41 | % | 2.59 | % | 2.32 | % | 2.16 | % | 1.88 | % | |||||||||||||
| Portfolio turnover rate | 53 | % | 47 | % | 36 | % | 38 | % | 46 | % | |||||||||||||
| Fees and expenses reimbursed by the Manager to average daily net assets: | 0.05 | % | 0.05 | % | 0.04 | % | 0.06 | % | 0.07 | % | |||||||||||||
(a) The total returns would have been lower had certain expenses not been reimbursed during the periods shown and assumes the effect of reinvested distributions.
(b) The net expense ratio does not include the effect of expense reductions, except for reimbursements related to securities lending transactions (Note 2).
† Calculated using average shares outstanding throughout the period.
See accompanying notes to the financial statements.
25
GMO International Intrinsic Value Fund
(A Series of GMO Trust)
Financial Highlights
(For a Class III share outstanding throughout each period)
| Year Ended February 28/29, | |||||||||||||||||||||||
| 2009 | 2008 | 2007 | 2006 | 2005 | |||||||||||||||||||
| Net asset value, beginning of period | $ | 29.97 | $ | 35.28 | $ | 32.59 | $ | 29.23 | $ | 24.32 | |||||||||||||
| Income (loss) from investment operations: | |||||||||||||||||||||||
| Net investment income (loss)† | 0.79 | 0.94 | 0.81 | 0.72 | 0.59 | ||||||||||||||||||
| Net realized and unrealized gain (loss) | (14.13 | ) | (0.86 | ) | 5.66 | 4.44 | 5.02 | ||||||||||||||||
| Total from investment operations | (13.34 | ) | 0.08 | 6.47 | 5.16 | 5.61 | |||||||||||||||||
| Less distributions to shareholders: | |||||||||||||||||||||||
| From net investment income | (1.01 | ) | (0.85 | ) | (0.57 | ) | (0.37 | ) | (0.66 | ) | |||||||||||||
| From net realized gains | (1.62 | ) | (4.54 | ) | (3.21 | ) | (1.43 | ) | (0.04 | ) | |||||||||||||
| Total distributions | (2.63 | ) | (5.39 | ) | (3.78 | ) | (1.80 | ) | (0.70 | ) | |||||||||||||
| Net asset value, end of period | $ | 14.00 | $ | 29.97 | $ | 35.28 | $ | 32.59 | $ | 29.23 | |||||||||||||
| Total Return(a) | (48.01 | )% | (1.06 | )% | 20.54 | % | 18.26 | % | 23.28 | % | |||||||||||||
| Ratios/Supplemental Data: | |||||||||||||||||||||||
| Net assets, end of period (000's) | $ | 1,487,839 | $ | 2,615,878 | $ | 2,703,050 | $ | 2,795,610 | $ | 1,804,485 | |||||||||||||
| Net expenses to average daily net assets | 0.67 | %(b) | 0.69 | %(b) | 0.69 | % | 0.69 | % | 0.69 | % | |||||||||||||
| Net investment income to average daily net assets | 3.38 | % | 2.61 | % | 2.36 | % | 2.39 | % | 2.30 | % | |||||||||||||
| Portfolio turnover rate | 53 | % | 47 | % | 36 | % | 38 | % | 46 | % | |||||||||||||
| Fees and expenses reimbursed by the Manager to average daily net assets: | 0.05 | % | 0.05 | % | 0.04 | % | 0.06 | % | 0.07 | % | |||||||||||||
(a) The total returns would have been lower had certain expenses not been reimbursed during the periods shown and assumes the effect of reinvested distributions.
(b) The net expense ratio does not include the effect of expense reductions, except for reimbursements related to securities lending transactions (Note 2).
† Calculated using average shares outstanding throughout the period.
See accompanying notes to the financial statements.
26
GMO International Intrinsic Value Fund
(A Series of GMO Trust)
Financial Highlights
(For a Class IV share outstanding throughout each period)
| Year Ended February 28/29, | |||||||||||||||||||||||
| 2009 | 2008 | 2007 | 2006 | 2005 | |||||||||||||||||||
| Net asset value, beginning of period | $ | 29.96 | $ | 35.26 | $ | 32.58 | $ | 29.22 | $ | 24.31 | |||||||||||||
| Income (loss) from investment operations: | |||||||||||||||||||||||
| Net investment income (loss)† | 0.82 | 0.96 | 0.80 | 0.74 | 0.54 | ||||||||||||||||||
| Net realized and unrealized gain (loss) | (14.14 | ) | (0.85 | ) | 5.68 | 4.43 | 5.09 | ||||||||||||||||
| Total from investment operations | (13.32 | ) | 0.11 | 6.48 | 5.17 | 5.63 | |||||||||||||||||
| Less distributions to shareholders: | |||||||||||||||||||||||
| From net investment income | (1.02 | ) | (0.87 | ) | (0.59 | ) | (0.38 | ) | (0.68 | ) | |||||||||||||
| From net realized gains | (1.62 | ) | (4.54 | ) | (3.21 | ) | (1.43 | ) | (0.04 | ) | |||||||||||||
| Total distributions | (2.64 | ) | (5.41 | ) | (3.80 | ) | (1.81 | ) | (0.72 | ) | |||||||||||||
| Net asset value, end of period | $ | 14.00 | $ | 29.96 | $ | 35.26 | $ | 32.58 | $ | 29.22 | |||||||||||||
| Total Return(a) | (47.95 | )% | (0.98 | )% | 20.61 | % | 18.32 | % | 23.37 | % | |||||||||||||
| Ratios/Supplemental Data: | |||||||||||||||||||||||
| Net assets, end of period (000's) | $ | 1,900,168 | $ | 4,131,392 | $ | 4,566,106 | $ | 3,150,741 | $ | 2,193,988 | |||||||||||||
| Net expenses to average daily net assets | 0.61 | %(b) | 0.63 | %(b) | 0.63 | % | 0.63 | % | 0.63 | % | |||||||||||||
| Net investment income to average daily net assets | 3.47 | % | 2.67 | % | 2.32 | % | 2.45 | % | 2.06 | % | |||||||||||||
| Portfolio turnover rate | 53 | % | 47 | % | 36 | % | 38 | % | 46 | % | |||||||||||||
| Fees and expenses reimbursed by the Manager to average daily net assets: | 0.05 | % | 0.05 | % | 0.04 | % | 0.06 | % | 0.07 | % | |||||||||||||
(a) The total returns would have been lower had certain expenses not been reimbursed during the periods shown and assumes the effect of reinvested distributions.
(b) The net expense ratio does not include the effect of expense reductions, except for reimbursements related to securities lending transactions (Note 2).
† Calculated using average shares outstanding throughout the period.
See accompanying notes to the financial statements.
27
GMO International Intrinsic Value Fund
(A Series of GMO Trust)
Financial Highlights
(For a Class M share outstanding throughout each period)
| Year Ended February 28/29, | |||||||||||||||||||||||
| 2009 | 2008 | 2007 | 2006 | 2005 | |||||||||||||||||||
| Net asset value, beginning of period | $ | 29.60 | $ | 34.93 | $ | 32.28 | $ | 28.98 | $ | 24.15 | |||||||||||||
| Income (loss) from investment operations: | |||||||||||||||||||||||
| Net investment income (loss)† | 0.73 | 0.79 | 0.68 | 0.61 | 0.44 | ||||||||||||||||||
| Net realized and unrealized gain (loss) | (13.95 | ) | (0.81 | ) | 5.62 | 4.41 | 5.04 | ||||||||||||||||
| Total from investment operations | (13.22 | ) | (0.02 | ) | 6.30 | 5.02 | 5.48 | ||||||||||||||||
| Less distributions to shareholders: | |||||||||||||||||||||||
| From net investment income | (0.93 | ) | (0.77 | ) | (0.44 | ) | (0.29 | ) | (0.61 | ) | |||||||||||||
| From net realized gains | (1.62 | ) | (4.54 | ) | (3.21 | ) | (1.43 | ) | (0.04 | ) | |||||||||||||
| Total distributions | (2.55 | ) | (5.31 | ) | (3.65 | ) | (1.72 | ) | (0.65 | ) | |||||||||||||
| Net asset value, end of period | $ | 13.83 | $ | 29.60 | $ | 34.93 | $ | 32.28 | $ | 28.98 | |||||||||||||
| Total Return(a) | (48.14 | )% | (1.36 | )% | 20.18 | % | 17.92 | % | 22.88 | % | |||||||||||||
| Ratios/Supplemental Data: | |||||||||||||||||||||||
| Net assets, end of period (000's) | $ | 8,938 | $ | 18,687 | $ | 17,371 | $ | 29,984 | $ | 18,347 | |||||||||||||
| Net expenses to average daily net assets | 0.97 | %(b) | 0.99 | %(b) | 0.99 | % | 0.99 | % | 0.99 | % | |||||||||||||
| Net investment income to average daily net assets | 3.13 | % | 2.22 | % | 2.00 | % | 2.07 | % | 1.72 | % | |||||||||||||
| Portfolio turnover rate | 53 | % | 47 | % | 36 | % | 38 | % | 46 | % | |||||||||||||
| Fees and expenses reimbursed by the Manager to average daily net assets: | 0.05 | % | 0.05 | % | 0.04 | % | 0.06 | % | 0.07 | % | |||||||||||||
(a) The total returns would have been lower had certain expenses not been reimbursed during the periods shown and assumes the effect of reinvested distributions.
(b) The net expense ratio does not include the effect of expense reductions, except for reimbursements related to securities lending transactions (Note 2).
† Calculated using average shares outstanding throughout the period.
See accompanying notes to the financial statements.
28
GMO International Intrinsic Value Fund
(A Series of GMO Trust)
Notes to Financial Statements
February 28, 2009
1. Organization
GMO International Intrinsic Value Fund (the "Fund") is a series of GMO Trust (the "Trust"). The Fund is registered under the Investment Company Act of 1940, as amended, as an open-end, non-diversified management investment company. The Fund is advised and managed by Grantham, Mayo, Van Otterloo & Co. LLC (the "Manager" or "GMO"). The Trust was established as a Massachusetts business trust under the laws of The Commonwealth of Massachusetts on June 24, 1985. The Declaration of Trust permits the Trustees of the Trust ("Trustees") to create an unlimited number of series of shares ("Funds") and to subdivide Funds into classes.
The Fund seeks high total return. The Fund seeks to achieve its objective by outperforming the MSCI EAFE Value Index. The Fund typically makes equity investments in companies from developed countries, other than the U.S. Effective January 1, 2009 the Fund changed its benchmark from the S&P EPAC Large Mid Cap Value Index (formerly S&P/Citigroup PMI EPAC Value Index) to the MSCI EAFE Value Index to better reflect a more appropriate, comparative, broad-based market Index for the Fund.
Throughout the year ended February 28, 2009, the Fund had four classes of shares outstanding: Class II, Class III, Class IV and Class M. Class M shares bear an administration fee and a 12b-1 fee while classes II, III, and IV bear a shareholder service fee (See Note 3). The principal economic difference among the classes of shares is the type and level of fees borne by the classes.
2. Significant accounting policies
The following is a summary of significant accounting policies followed by the Fund in the preparation of its financial statements. These policies are in conformity with accounting principles generally accepted in the United States of America ("U.S. GAAP") and have been consistently followed by the Fund in preparing its financial statements. The preparation of financial statements in accordance with U.S. GAAP requires management to make estimates and assumptions that affect the reported amounts and disclosures in the financial statements. Actual results could differ from those estimates. The accounting records of the Fund are maintained in U.S. dollars.
Portfolio valuation
Securities listed on a securities exchange for which market quotations are readily available are valued at the last sale price or official closing price on each business day, or if there is no such reported sale or official closing price, at the most recent quoted bid price. Unlisted securities for which market quotations are readily available are generally valued at the most recent quoted bid price. Debt instruments with a remaining maturity of sixty days or less are generally valued at amortized cost, which approximates fair value. Shares of investment funds are generally valued at their net asset value. Securities for which quotations are not readily available or whose values the Manager has determined to be unreliable are valued at fair value as determined in good faith by the Trustees or persons acting at their direction
29
GMO International Intrinsic Value Fund
(A Series of GMO Trust)
Notes to Financial Statements — (Continued)
February 28, 2009
pursuant to procedures approved by the Trustees. By its nature, a fair value price is a good faith estimate of the value of a security at a given point in time and may not reflect the value that would be realized if the security were sold. The difference between a fair value price and the value realized upon a sale could be material. Because many foreign equity securities markets and exchanges close prior to the close of the New York Stock Exchange ("NYSE"), closing prices for foreign securities in those markets or on those exchanges do not reflect the events that occur after that close but before the close of the NYSE. As a result, the Fund generally values foreign equity securities using fair value prices, which are based on adjustments to closing prices supplied by a third party vendor based on that vendor's proprietary models. As of February 28, 2009, 87.66% of the net assets of the Fund were valued using fair value prices b ased on models used by a third party vendor.
In September 2006, the Financial Accounting Standards Board ("FASB") issued Statement of Financial Accounting Standards No. 157, Fair Value Measurements ("SFAS 157"). SFAS 157 is effective for the Fund's current fiscal year. While the adoption of SFAS 157 does not have an effect on the Fund's net asset value, it does require additional disclosures about fair value measurements. SFAS 157 establishes a three-level hierarchy for disclosure of fair value measurements. The valuation hierarchy is based upon the reliability of inputs to the valuation of the Fund's investments. The three levels are defined as follows:
Level 1 – Valuations based on quoted prices for identical securities in active markets.
Level 2 – Valuations determined using other significant direct or indirect observable inputs.
Level 3 – Valuations based on inputs that are unobservable and significant.
The inputs or methodology used for valuing securities are not necessarily an indication of the risk associated with investing in those securities.
The following is a summary of the fair valuations according to inputs used as of February 28, 2009 in valuing the Fund's investments:
| Asset Valuation Inputs | Investments in Securities | Other Financial Instruments* | |||||||||
| Level 1 - Quoted Prices | $ | 371,354,891 | $ | 4,370,186 | |||||||
| Level 2 - Other Significant Observable Inputs | 3,323,640,985 | 14,829,146 | |||||||||
| Level 3 - Significant Unobservable Inputs | — | — | |||||||||
| Total | $ | 3,694,995,876 | $ | 19,199,332 | |||||||
* Other financial instruments include forward currency contracts and futures contracts.
30
GMO International Intrinsic Value Fund
(A Series of GMO Trust)
Notes to Financial Statements — (Continued)
February 28, 2009
| Liability Valuation Inputs | Investments in Securities | Other Financial Instruments** | |||||||||
| Level 1 - Quoted Prices | $ | — | $ | — | |||||||
| Level 2 - Other Significant Observable Inputs | — | (74,096,882 | ) | ||||||||
| Level 3 - Significant Unobservable Inputs | — | — | |||||||||
| Total | $ | — | $ | (74,096,882 | ) | ||||||
** Other financial instruments include forward currency contracts and futures contracts.
The Fund held no investments or other financial instruments at either February 29, 2008 or February 28, 2009, whose fair value was determined using Level 3 inputs.
Foreign currency translation
The market values of foreign securities, currency holdings and related assets and liabilities are translated to U.S. dollars based on the 4 p.m. New York time exchange rates each business day. Income and expenses denominated in foreign currencies are translated at the 4 p.m. New York time exchange rates on the business day the income and expenses are accrued or incurred. The Fund does not isolate realized and unrealized gains and losses attributable to changes in exchange rates from gains and losses that arise from changes in the market value of investments. Such fluctuations are included with net realized and unrealized gain or loss on investments. Net realized gains and losses on foreign currency transactions represent gains and losses on disposition of currencies and forward currency contracts, currency gains and losses realized between the trade and settlement dates on securities transactions, and the difference between the amount of investment income and foreign withholding taxes recorded on the Fund's accounting records and the U.S. dollar equivalent amounts actually received or paid.
Forward currency contracts
The Fund may enter into forward currency contracts including forward cross currency contracts. A forward currency contract is an agreement between two parties to buy and sell a currency at a set price on a future date. The market value of a forward currency contract fluctuates with changes in forward currency exchange rates. Forward currency contracts are marked to market daily using rates supplied by a quotation service and changes in value are recorded by the Fund as an unrealized gain or loss. Realized gains or losses equal to the difference between the value of the contract at the time it was opened and the value at the time it was closed are recorded upon delivery or receipt of the currency or, if a forward currency contract is offset by entering into another forward currency contract with the same broker, upon settlement of the net gain or loss. These contracts may involve market risk in excess of the unrealized gain or lo ss reflected in the Fund's Statement of Assets and Liabilities. They expose the Fund to the risk of unfavorable movements in currency values and the risk that the counterparty will be unable or unwilling to meet the terms of the contracts. Forward currency contracts outstanding at the end of the period are listed in the Fund's Schedule of Investments.
31
GMO International Intrinsic Value Fund
(A Series of GMO Trust)
Notes to Financial Statements — (Continued)
February 28, 2009
Futures contracts
The Fund may purchase and sell futures contracts. Upon entering into a futures contract, the Fund is required to deposit cash, U.S. government and agency obligations, or other liquid assets with the futures clearing broker in accordance with the initial margin requirements of the broker or exchange. In addition, the Fund maintains cash or securities in an amount that at least equals the net amount payable in the event the Fund must deliver the full amount of the contract. Futures contracts are marked to market daily and an appropriate payable or receivable for the change in value ("variation margin") is recorded by the Fund. The payable or receivable is settled on the following business day. Gains or losses are recognized but not considered realized until the contracts expire or are closed. Futures contracts involve, to varying degrees, risk of loss in excess of the variation margin disclosed in the Statement of Assets and Liabi lities. Under some circumstances, futures exchanges may establish daily limits on the amount that the price of a futures contract can vary from the previous day's settlement price, thereby effectively preventing liquidation of unfavorable positions. Losses may arise from changes in the value of the underlying instrument if the Fund is unable to liquidate a futures position due to an illiquid secondary market for the contract or the imposition of price limits, or if counterparties do not perform under the contract terms. Futures contracts are generally valued at the settlement price established each day by the board of trade or exchange on which they are traded. Because many foreign exchanges close prior to the close of the New York Stock Exchange ("NYSE"), closing prices for foreign futures in those markets or on those markets or on those exchanges do not reflect the events that occur after that close but before the close of the NYSE. As a result, the Fund generally values foreign futures using fair value pr ices, which are based on adjustments to closing prices supplied by a third party vendor based on that vendor's proprietary models. Futures contracts outstanding at the end of the period are listed in the Fund's Schedule of Investments.
Options
The Fund may write (i.e., sell) call and put options. Writing options alters the Fund's exposure to the underlying instrument by, in the case of a call option, obligating the Fund to sell the underlying instrument at a set price to the option-holder and, in the case of a put option, obligating the Fund to purchase the underlying instrument at a set price from the option-holder. In the case of an index option, settlement will be in cash. When the Fund writes a call or put option, an amount equal to the premium received is recorded as a liability and subsequently marked to market to reflect the current value of the option written. Premiums received from writing options that expire are treated as realized gains. Premiums received from writing options that are exercised or closed are deducted from the amounts paid on the underlying future, security or currency transaction to determine the realized gain or loss. The Fund as a writer of an option has no control over whether the underlying future, security or currency may be sold (call) or purchased (put) and as a result bears the market risk of an unfavorable change in the price of the future, security or currency underlying the option. In the event that the Fund writes uncovered put or call options (i.e. options for investments that the Fund does not own), it bears the risk of substantial losses if the price of the underlying instrument increases during the term of the option. Options expose the Fund to the risk the Fund may not be able to enter into a closing transaction because of an illiquid market. The Fund had no open written option contracts during the period.
32
GMO International Intrinsic Value Fund
(A Series of GMO Trust)
Notes to Financial Statements — (Continued)
February 28, 2009
The Fund may also purchase put and call options. Purchasing options alters the Fund's exposure to the underlying instrument by, in the case of a call option, entitling the Fund to purchase the underlying instrument at a set price from the writer of the option and, in the case of a put option, entitling the Fund to sell the underlying instrument at a set price to the writer of the option. The Fund pays a premium for a purchased option. That premium is disclosed in the Schedule of Investments and is subsequently marked to market to reflect the current value of the option. Premiums paid for purchasing options that expire are treated as realized losses. Premiums paid for purchasing options that are exercised or closed are deducted from the proceeds on the closing transaction to determine the realized gain or loss. The risk associated with purchasing put and call options is limited to the premium paid. The Fund had no purchased optio n contracts outstanding at the end of the period.
The Fund values exchange traded options at the last sale price, or if no sale is reported, the last bid price for options it has purchased and the last ask price for options it has written. The Fund values options traded over-the-counter using inputs provided by primary pricing sources and industry standard models.
Swap agreements
The Fund may enter into various types of swap agreements, including without limitation, interest rate, total return, credit default and variance swap agreements. A swap agreement is an agreement to exchange the return generated by one instrument for the return generated by another instrument. When entering into a swap agreement, the Fund and/or the swap counterparty may post or receive cash or securities as collateral. The party posting the collateral typically receives the interest associated with or payments related to the collateral and has the risk of loss related to the collateral.
Interest rate swap agreements involve an exchange by the parties of their respective commitments to pay or right to receive interest, e.g., an exchange of floating rate interest payments for fixed rate interest payments with respect to the notional amount of principal.
Total return swap agreements involve a commitment by one party to pay interest to the other party in exchange for a payment to it from the other party based on the return of a reference instrument (e.g., a security or basket of securities), both based on notional amounts. To the extent the return of the reference instrument exceeds or falls short of the interest payments, one party will receive a payment from or make a payment to the other party.
In a credit default swap agreement, one party makes payments to another party in exchange for the right to receive a specified return if a credit event occurs with respect to a referenced entity or entities. Buying credit default protection reduces the buyer's exposure in the event of an issuer's default (e.g., it reduces risk where a party owns a security issued by or otherwise has exposure to the issuer). Selling credit default protection subjects the seller to exposure to an issuer's default. A seller of credit default protection receives payments in return for its obligation to pay the principal amount of a debt security (or other agreed-upon value) to the other party upon the occurrence of a credit event (e.g., issuer default or similar
33
GMO International Intrinsic Value Fund
(A Series of GMO Trust)
Notes to Financial Statements — (Continued)
February 28, 2009
event). If no credit event occurs, the seller has no payment obligations. For credit default swap agreements on asset-backed securities, a credit event may be triggered by such events as the issuer's failure to pay interest or principal, an agreement of the holders of an asset-backed security to a maturity extension, a rating downgrade on the security or a write-down on the collateral underlying the security. For credit default swap agreements on corporate or sovereign issuers, a credit event may be triggered by such events as the issuer's bankruptcy, failure to pay interest or principal, repudiation/moratorium or restructuring.
Variance swap agreements involve an agreement by two parties to exchange cash flows based on the measured variance (or square of volatility) of a specified underlying asset. One party agrees to exchange a "fixed rate" or strike price payment for the "floating rate" or realized price variance on the underlying asset with respect to the notional amount. At inception, the strike price chosen is generally fixed at a level such that the fair value of the swap is zero. At the expiration date, the amount paid by one party to the other is the difference between the realized price variance of the underlying asset and the strike price multiplied by the notional amount. A receiver of the realized price variance would receive a payment when the realized price variance of the underlying asset is greater than the strike price and would make a payment when that variance is less than the strike price. A payer of the realized price variance woul d make a payment when the realized price variance of the underlying asset is greater than the strike price and would receive a payment when that variance is less than the strike price. This type of agreement is essentially a forward contract on the future realized price variance of the underlying asset.
The Fund prices its swap agreements daily using models that may incorporate quotations from market makers and records the change in value, if any, as unrealized gain or loss in the Statement of Operations. Payments received or made on swap agreements are recorded as realized gain or loss in the Statement of Operations. Gains or losses are realized upon termination of the swap agreements.
Swap agreements often are not actively traded on financial markets. The values assigned to them may differ significantly from the values that would be realized upon termination, and the differences could be material. Entering into swap agreements involves credit, legal, market and documentation risk that is not reflected in the amounts reported in the Statement of Assets and Liabilities. Such risks include the possibility that the party with whom the Fund contracts may default on its obligations to perform or disagree as to the meaning of contractual terms, or that the collateral that party posts may be insufficient or not timely received by the Fund. Credit risk may be particularly acute in an environment where financial services firms are exposed to systemic risks of the type evidenced by the insolvency of Lehman Brothers and subsequent market disruptions. The Fund had no swap agreements outstanding at the end of the period.
Securities lending
The Fund may lend its securities to qualified brokers. The loans are collateralized with cash or liquid securities with a market value at least equal to the market value of the securities upon entering into the loan. As with other extensions of credit, the Fund may bear the risk of loss with respect to the investment of the collateral, the risk of delay in and/or inability to exercise its rights with respect to the collateral, and the risk of delay in recovery or loss of rights in the loaned securities should the borrower of the securities
34
GMO International Intrinsic Value Fund
(A Series of GMO Trust)
Notes to Financial Statements — (Continued)
February 28, 2009
fail financially. If a loan is collateralized by U.S. government securities, the Fund receives a fee from the borrower. If a loan is collateralized by cash, the Fund typically invests the cash collateral for its own account. As of February 28, 2009 the Fund had no securities on loan.
Taxes and distributions
The Fund intends to qualify each tax year as a regulated investment company under Subchapter M of the Internal Revenue Code of 1986, as amended (the "Code"). The Fund intends to distribute substantially all of its net investment income and all of its net realized short-term and long-term capital gain, if any, after giving effect to any available capital loss carryforwards for U.S. federal income tax purposes. Therefore, no provision for U.S. federal income or excise tax is necessary. Taxes on foreign interest and dividend income are generally withheld in accordance with the applicable country's tax treaty with the United States. The foreign withholding rates applicable to a Fund's investments in certain foreign jurisdictions may be higher if a significant portion of the Fund is held by non-U.S. shareholders.
The Fund's policy is to declare and pay distributions from net investment income, if any, semiannually, and from net realized short-term and long-term capital gain, if any, at least annually. All distributions are paid in shares of the Fund, at net asset value, unless the shareholder elects to receive cash distributions. Distributions to shareholders are recorded by the Fund on the ex-dividend date.
Foreign taxes paid by the Fund may be treated, to the extent permissible under the Code and if the Fund so elects, as if paid by the shareholders of the Fund.
The Fund may be subject to capital gains and repatriation taxes imposed by certain countries in which it invests.
Income and capital gain distributions are determined in accordance with U.S. federal income tax regulations, which may differ from U.S. GAAP. Certain capital accounts in the financial statements are periodically adjusted for permanent differences in order to reflect their tax character. These adjustments have no impact on net assets or net asset value per share. Temporary differences that arise from recognizing certain items of income, expense, gain or loss in different periods for financial statement and tax purposes will reverse at some time in the future. Distributions in excess of net investment income or net realized gains are temporary over-distributions for financial statement purposes resulting from differences in the recognition or classification of income or distributions for financial statement and tax purposes.
U.S. GAAP and tax accounting differences primarily relate to capital loss carryforwards, derivative contract transactions, foreign currency transactions, losses on wash sale transactions, passive foreign investment company transactions and post-October capital losses.
The following reclassification represents the amount necessary to report the stated components of net assets on a tax basis, excluding certain temporary differences, as of February 28, 2009. The financial highlights exclude these adjustments.
35
GMO International Intrinsic Value Fund
(A Series of GMO Trust)
Notes to Financial Statements — (Continued)
February 28, 2009
| Accumulated Undistributed Net Investment Income | Accumulated Net Realized Loss | Paid-in Capital | |||||||||
| $ | 37,748,898 | $ | (37,748,898 | ) | $ | — | |||||
The tax character of distributions declared to shareholders is as follows:
| 2/28/2009 | 2/29/2008 | ||||||||||
| Ordinary income (including any net short-term capital gain) | $ | 255,354,938 | $ | 329,444,076 | |||||||
| Net long-term capital gain | 401,581,471 | 854,862,060 | |||||||||
| Total distributions | $ | 656,936,409 | $ | 1,184,306,136 | |||||||
Distributions in excess of tax basis earnings and profits, if significant, are reported in the financial statements as a return of capital for tax purposes.
As of February 28, 2009, the components of distributable earnings on a tax basis consisted of the following:
| Undistributed ordinary income (including any net short-term capital gain) | $ | 63,634,786 | |||||
As of February 28, 2009, the Fund elected to defer to March 1, 2009 post-October capital losses of $285,032,634.
As of February 28, 2009, the Fund had capital loss carryforwards available to offset future realized gains if any, to the extent permitted by the Code. Utilization of the capital loss carryforwards could be subject to limitations imposed by the Code related to share ownership activity. Such losses expire as follows:
| 2/28/2017 | $ | (154,259,096 | ) | ||||
| Total | $ | (154,259,096 | ) | ||||
As of February 28, 2009, the approximate cost for U.S. federal income tax purposes and gross and net unrealized appreciation (depreciation) in value of investments were as follows:
| Aggregate Cost | Gross Unrealized Appreciation | Gross Unrealized (Depreciation) | Net Unrealized Appreciation (Depreciation) | ||||||||||||
| $ | 6,619,446,565 | $ | 22,161,094 | $ | (2,946,611,783 | ) | $ | (2,924,450,689 | ) | ||||||
36
GMO International Intrinsic Value Fund
(A Series of GMO Trust)
Notes to Financial Statements — (Continued)
February 28, 2009
The Fund is subject to the provisions of Financial Accounting Standards Board Interpretation No. 48 ("FIN 48"), Accounting for Uncertainty in Income Taxes — an Interpretation of FASB Statement No. 109. FIN 48 sets forth a minimum threshold for financial statement recognition of a tax position taken or expected to be taken in a tax return that could affect the Fund's financial statements. The Fund did not have any unrecognized tax benefits or liabilities at February 28, 2009, nor did it have any increases or decreases in unrecognized tax benefits or liabilities for the period then ended. The Fund is subject to examination prior to the expiration of the statute of limitations by U.S. federal and state tax authorities for tax returns filed.
Security transactions and related investment income
Security transactions in the financial statements are accounted for on the trade date. Dividend income, net of applicable foreign withholding taxes, if any, is recorded on the ex-dividend date or, if later, when the Fund is informed of the ex-dividend date. Interest income is recorded on the accrual basis and is adjusted for the amortization of premiums and accretion of discounts. Principal on inflation indexed securities is adjusted for inflation and any increase or decrease is recorded as interest income or loss. Income is not recognized on securities for which collection is not expected. Non-cash dividends, if any, are recorded at the fair market value of the asset received. In determining the net gain or loss on securities sold, the Fund uses the identified cost basis for the purposes of determining the cost basis.
Expenses
The majority of the expenses of the Trust are directly identifiable to an individual fund. Expenses that are not readily identifiable to a specific fund are allocated taking into consideration, among other things, the nature and type of expense and the relative size of the funds. Investment income, common expenses and realized and unrealized gains and losses are allocated pro rata among the classes of shares of the Fund based on the relative net assets of each class. Shareholder service fees, 12b-1, and administration fees, which are directly attributable to a class of shares, are charged to that class's operations.
Brown Brothers Harriman & Co. ("BBH") serves as custodian and fund accounting agent of the Fund. State Street Bank and Trust Company ("State Street") serves as transfer agent of the Fund. BBH and State Street's fees may be reduced by an earnings allowance calculated on the average daily cash balances the Fund maintains with each agent. The Fund receives the benefit of the earnings allowance. In addition, Goldman Sachs Agency Lending, the Fund's securities lending agent, has agreed to reimburse the Fund for certain transactional expenses related to securities lending activity. Credit balances or expense reimbursements used to reduce fees, if any, are reported as a reduction of expenses in the Statement of Operations.
Investment risks
The Fund is subject to risks involved in investing in foreign securities that are not presented by investments in U.S. securities. These risks may involve adverse political and economic developments, including expropriation and the possible imposition of capital controls or other foreign governmental laws or restrictions. In addition, the securities of some foreign companies and securities markets are less liquid and at times may be more volatile than securities of comparable U.S. companies and U.S. securities markets.
37
GMO International Intrinsic Value Fund
(A Series of GMO Trust)
Notes to Financial Statements — (Continued)
February 28, 2009
Recently issued accounting pronouncement
In March 2008, FASB issued Statement of Financial Accounting Standards No. 161, Disclosures about Derivative Instruments and Hedging Activities ("SFAS 161"). SFAS 161 is effective for fiscal years and interim periods beginning after November 15, 2008. SFAS 161 requires enhanced disclosures about the Fund's derivative and hedging activities. The Manager is currently evaluating the impact the adoption of SFAS 161 will have on the Fund's financial statement disclosures.
3. Fees and other transactions with affiliates
Effective June 30, 2008, GMO receives a management fee for investment management services provided to the Fund that is paid monthly at the annual rate of 0.50% of average daily net assets. For the period from March 1, 2008 through June 29, 2008, the management fee rate was 0.54% of average daily net assets. The Fund has adopted a Shareholder Service Plan under which the Fund pays GMO a shareholder service fee for client and shareholder service, reporting, and other support. Pursuant to the Shareholder Service Plan, the shareholder service fee is calculated based on average daily net assets of each class at the annual rate of 0.22% for Class II shares, 0.15% for Class III shares, and 0.09% for Class IV shares.
Holders of Class M shares of the Fund pay GMO an administration fee for support services provided to Class M shareholders. That fee is paid monthly at the annual rate of 0.20% of average daily net assets of Class M shares. Pursuant to a Rule 12b-1 distribution plan adopted by the Fund, holders of Class M shares of the Fund may pay a fee, at the annual rate of up to 1.00% of average daily net assets of Class M shares for any activities or expenses primarily intended to result in the sale of Class M shares of the Fund and/or for the provision of services to Class M shareholders. The Trustees currently limit payments on Class M shares to 0.25% of the Fund's average daily net assets of Class M shares.
Through at least June 30, 2009, the Manager has contractually agreed to reimburse the Fund for Fund expenses incurred through that date to the extent the Fund's total annual operating expenses (excluding "Excluded Expenses", as defined below) exceed 0.50% of the Fund's average daily net assets. Excluded Expenses include shareholder service fees, administration and distribution (12b-1) fees, fees and expenses of the independent Trustees of the Trust, fees and expenses for legal services not approved by the Manager for the Trust, compensation and expenses of the Trust's Chief Compliance Officer ("CCO") (excluding any employee benefits), brokerage commissions, securities lending fees and expenses, interest expense, transfer taxes, and other investment-related costs (including expenses associated with investments in any company that is an investment company or would be an investment company under the 1940 Act, but for the exceptions to the definition of investment company provided in Section 3(c)(1) and 3(c)(7) of the 1940 Act), hedging transaction fees, extraordinary, non-recurring and certain other unusual expenses (including taxes).
The Fund's portion of the fees paid by the Trust to the Trust's independent Trustees and CCO during the year ended February 28, 2009 was $70,979 and $44,001, respectively. The compensation and expenses of the CCO are included in miscellaneous expenses in the Statement of Operations. The Fund paid no remuneration to any other officer of the Trust.
38
GMO International Intrinsic Value Fund
(A Series of GMO Trust)
Notes to Financial Statements — (Continued)
February 28, 2009
4. Purchases and sales of securities
Cost of purchases and proceeds from sales of securities, excluding short-term investments, for the year ended February 28, 2009 aggregated $3,433,072,305 and $3,087,544,799, respectively.
5. Guarantees
In the normal course of business the Fund enters into contracts with third-party service providers that contain a variety of representations and warranties and that provide general indemnifications. The Fund's maximum exposure under these arrangements is unknown, as it involves future claims that may be made against the Fund that have not yet occurred. Based on experience, management is of the view that the risk of loss in connection with its indemnification obligations is remote; however, there can be no assurance that such obligations will not result in material liabilities that adversely affect the Fund.
6. Principal shareholders and related parties
As of February 28, 2009, the Fund had no shareholders who individually held more than 10% of the Fund's outstanding shares.
As of February 28, 2009, 0.43% shares of the Fund were held by senior management of the Manager and GMO Trust officers, and 57.00% of the Fund's shares were held by accounts for which the Manager had investment discretion.
7. Share transactions
The Declaration of Trust permits the Trust to issue an unlimited number of shares of beneficial interest (without par value). Transactions in Fund shares were as follows:
| Year Ended February 28, 2009 | Year Ended February 29, 2008 | ||||||||||||||||||
| Class II: | Shares | Amount | Shares | Amount | |||||||||||||||
| Shares sold | 12,342,982 | $ | 192,225,431 | 2,870,488 | $ | 104,261,777 | |||||||||||||
| Shares issued to shareholders in reinvestment of distributions | 1,660,673 | 38,959,612 | 2,225,434 | 73,788,974 | |||||||||||||||
| Shares repurchased | (2,745,119 | ) | (64,651,845 | ) | (4,046,894 | ) | (148,804,167 | ) | |||||||||||
| Net increase (decrease) | 11,258,536 | $ | 166,533,198 | 1,049,028 | $ | 29,246,584 | |||||||||||||
39
GMO International Intrinsic Value Fund
(A Series of GMO Trust)
Notes to Financial Statements — (Continued)
February 28, 2009
| Year Ended February 28, 2009 | Year Ended February 29, 2008 | ||||||||||||||||||
| Class III: | Shares | Amount | Shares | Amount | |||||||||||||||
| Shares sold | 34,874,353 | $ | 648,206,780 | 11,261,644 | $ | 401,290,984 | |||||||||||||
| Shares issued to shareholders in reinvestment of distributions | 9,415,098 | 223,954,309 | 12,081,961 | 403,817,120 | |||||||||||||||
| Shares repurchased | (25,321,014 | ) | (474,062,102 | ) | (12,684,964 | ) | (454,942,171 | ) | |||||||||||
| Net increase (decrease) | 18,968,437 | $ | 398,098,987 | 10,658,641 | $ | 350,165,933 | |||||||||||||
| Year Ended February 28, 2009 | Year Ended February 29, 2008 | ||||||||||||||||||
| Class IV: | Shares | Amount | Shares | Amount | |||||||||||||||
| Shares sold | 50,166,036 | $ | 1,080,197,863 | 25,699,917 | $ | 891,693,160 | |||||||||||||
| Shares issued to shareholders in reinvestment of distributions | 14,525,469 | 347,382,151 | 19,888,170 | 664,131,421 | |||||||||||||||
| Shares repurchased | (66,824,488 | ) | (1,255,080,247 | ) | (37,173,406 | ) | (1,300,923,459 | ) | |||||||||||
| Net increase (decrease) | (2,132,983 | ) | $ | 172,499,767 | 8,414,681 | $ | 254,901,122 | ||||||||||||
| Year Ended February 28, 2009 | Year Ended February 29, 2008 | ||||||||||||||||||
| Class M: | Shares | Amount | Shares | Amount | |||||||||||||||
| Shares sold | 124,606 | $ | 2,785,247 | 245,514 | $ | 9,021,667 | |||||||||||||
| Shares issued to shareholders in reinvestment of distributions | 67,005 | 1,580,922 | 92,415 | 3,048,018 | |||||||||||||||
| Shares repurchased | (176,478 | ) | (4,012,426 | ) | (204,043 | ) | (7,216,687 | ) | |||||||||||
| Net increase (decrease) | 15,133 | $ | 353,743 | 133,886 | $ | 4,852,998 | |||||||||||||
40
Report of Independent Registered Public Accounting Firm
To the Trustees of GMO Trust and the Shareholders of
GMO International Intrinsic Value Fund:
In our opinion, the accompanying statement of assets and liabilities, including the schedule of investments, and the related statements of operations and of changes in net assets and the financial highlights present fairly, in all material respects, the financial position of GMO International Intrinsic Value Fund (the "Fund") at February 28, 2009, the results of its operations for the year then ended, the changes in its net assets for each of the two years in the period then ended and the financial highlights for each of the five years in the period then ended, in conformity with accounting principles generally accepted in the United States of America. These financial statements and financial highlights (hereafter referred to as "financial statements") are the responsibility of the Fund's management. Our responsibility is to express an opinion on these financial statements based on our audits. We conducted our audits of these fi nancial statements in accordance with the standards of the Public Company Accounting Oversight Board (United States). Those standards require that we plan and perform the audit to obtain reasonable assurance about whether the financial statements are free of material misstatement. An audit includes examining, on a test basis, evidence supporting the amounts and disclosures in the financial statements, assessing the accounting principles used and significant estimates made by management, and evaluating the overall financial statement presentation. We believe that our audits, which included confirmation of securities at February 28, 2009 by correspondence with the custodian and brokers, provide a reasonable basis for our opinion.
PricewaterhouseCoopers LLP
Boston, Massachusetts
April 29, 2009
41
GMO International Intrinsic Value Fund
(A Series of GMO Trust)
Fund Expenses
February 28, 2009 (Unaudited)
Expense Examples: The following information is in relation to expenses for the six month period ended February 28, 2009.
As a shareholder of the Fund, you may incur two types of costs: (1) transaction costs; and (2) ongoing costs, including management fees, shareholder service fees, distribution (12b-1) and/or administration fees, and other Fund expenses. This example is intended to help you understand your ongoing costs (in dollars) of investing in the Fund and to compare these costs with the ongoing costs of investing in other mutual funds.
These examples are based on an investment of $1,000 invested at the beginning of the period and held for the entire period, September 1, 2008 through February 28, 2009.
Actual Expenses
The first line of the table for each class below provides information about actual account values and actual expenses. You may use the information in this line, together with the amount you invested, to estimate the expenses that you paid over the period. Simply divide your account value by $1,000 (for example, a $35,000,000 account value divided by $1,000 = 35,000), then multiply the result by the number in the first line under the heading entitled "Net Expense Incurred" to estimate the expenses you paid on your account during this period.
Hypothetical Example for Comparison Purposes
The second line of the table for each class below provides information about hypothetical account values and hypothetical expenses based on the Fund's actual expense ratio and an assumed rate of return of 5% per year before expenses, which is not the Fund's actual return. The hypothetical account values and expenses may not be used to estimate the actual ending account balance or expenses you paid for the period. You may use this information to compare the ongoing costs of investing in the Fund with other funds. To do so, compare this 5% hypothetical example with the 5% hypothetical examples that appear in the shareholder reports of other funds.
42
GMO International Intrinsic Value Fund
(A Series of GMO Trust)
Fund Expenses — (Continued)
February 28, 2009 (Unaudited)
Please note that the expenses shown in the table are meant to highlight your ongoing costs only and do not reflect any transactional costs, such as purchase premiums and redemption fees. Therefore, the second line of the table is useful in comparing ongoing costs only, and will not help you determine the relative total costs of owning different funds. In addition, if these transactional costs were included, your costs would have been higher.
| Annualized Net Expense Ratio | Beginning Account Value | Ending Account Value | Net Expense Incurred* | ||||||||||||||||
| Class II | |||||||||||||||||||
| 1) Actual | 0.72 | % | $ | 1,000.00 | $ | 565.70 | $ | 2.80 | |||||||||||
| 2) Hypothetical | 0.72 | % | $ | 1,000.00 | $ | 1,021.22 | $ | 3.61 | |||||||||||
| Class III | |||||||||||||||||||
| 1) Actual | 0.65 | % | $ | 1,000.00 | $ | 565.60 | $ | 2.52 | |||||||||||
| 2) Hypothetical | 0.65 | % | $ | 1,000.00 | $ | 1,021.57 | $ | 3.26 | |||||||||||
| Class IV | |||||||||||||||||||
| 1) Actual | 0.59 | % | $ | 1,000.00 | $ | 566.00 | $ | 2.29 | |||||||||||
| 2) Hypothetical | 0.59 | % | $ | 1,000.00 | $ | 1,021.87 | $ | 2.96 | |||||||||||
| Class M | |||||||||||||||||||
| 1) Actual | 0.95 | % | $ | 1,000.00 | $ | 564.90 | $ | 3.69 | |||||||||||
| 2) Hypothetical | 0.95 | % | $ | 1,000.00 | $ | 1,020.08 | $ | 4.76 | |||||||||||
* Expenses are calculated using each Class's annualized net expense ratio for the six months ended February 28, 2009, multiplied by the average account value over the period, multiplied by 181 days in the period, divided by 365 days in the year.
43
GMO International Intrinsic Value Fund
(A Series of GMO Trust)
Tax Information for the Tax Year Ended February 28, 2009 (Unaudited)
The Fund will notify shareholders of amounts for use in preparing 2009 income tax forms in January 2010.
The Fund's distributions to shareholders include $401,581,471 from long-term capital gains.
During the year ended February 28, 2009, the Fund paid foreign taxes of $23,626,965 and recognized foreign source income of $261,456,657.
For taxable, non-corporate shareholders, 72.87% of the income and short-term capital gains, if any, distributed in the Fund's fiscal year ended February 28, 2009 represents qualified dividend income subject to the 15% rate category.
44
Trustees and Officers (Unaudited)
The following tables list the Trust's Trustees and Officers as of the date of this report; their address and date of birth ("DOB"); their position with the Trust; the length of time holding that position with the Trust; their principal occupation(s) during the past five years; the number of portfolios in the fund complex they oversee; and other directorships they hold in companies subject to registration or reporting requirements of the Securities Exchange Act of 1934 (generally called "public companies") or in registered investment companies. The Trust's Statement of Additional Information ("SAI") includes additional information about the Trust's trustees, including changes subsequent to the date of the report. The SAI is available, without charge, upon request by writing GMO, c/o GMO Trust, 40 Rowes Wharf, Boston, MA 02110.
Independent Trustees:
| Name, Address, and DOB | Position(s) Held with Trust | Term of Office1 and Length of Time Served | Principal Occupation(s) During Past Five Years | Number of Portfolios in Fund Complex Overseen by Trustee | Other Directorships Held by Trustee | ||||||||||||||||||
| Donald W. Glazer, Esq. c/o GMO Trust 40 Rowes Wharf Boston, MA 02110 DOB: 07/26/1944 | Chairman of the Board of Trustees | Chairman of the Board of Trustees since March 2005; Lead Independent Trustee (September 2004 – March 2005); Trustee since December 2000. | Consultant – Law and Business2; Author of Legal Treatises. | 59 | None. | ||||||||||||||||||
1 Each Trustee is elected to serve during the continued lifetime of the Trust until he/she dies, resigns or is removed, or if sooner, until the next meeting of Shareholders called for the purpose of electing Trustees and until the election and qualification of his/her successor.
2 As part of Mr. Glazer's work as a consultant, he provides part-time consulting services to Goodwin Procter LLP ("Goodwin"). Goodwin has provided legal services to Renewable Resources, LLC, an affiliate of GMO; GMO, in connection with its relationship with Renewable Resources; and funds managed by Renewable Resources. Mr. Glazer has represented that he has no financial interest in, and is not involved in the provision of, such legal services. In the calendar years ended December 31, 2007 and December 31, 2008, these entities paid $789,416 and $183,864 respectively, in legal fees and disbursements to Goodwin. In correspondence with the Staff of the Securities and Exchange Commission beginning in August 2006, the Independent Trustees' legal counsel provided the Staff with information regarding Mr. Glazer's relationship with Goodwin and h is other business activities. On September 11, 2007, based on information that had been given to the Staff as of that date, the Staff provided oral no-action assurance consistent with the opinion of the Independent Trustees' legal counsel that Mr. Glazer is not an "interested person" of the Trust.
45
Independent Trustees — (Continued)
| Name, Address, and DOB | Position(s) Held with Trust | Term of Office1 and Length of Time Served | Principal Occupation(s) During Past Five Years | Number of Portfolios in Fund Complex Overseen by Trustee | Other Directorships Held by Trustee | ||||||||||||||||||
| W. Nicholas Thorndike c/o GMO Trust 40 Rowes Wharf Boston, MA 02110 DOB: 03/28/1933 | Trustee | Since March 2005. | Director or trustee of various corporations and charitable organizations, including Courier Corporation (a book publisher and manufacturer) (July 1989 – present); Putnam Funds (December 1992 – June 2004); and Providence Journal (a newspaper publisher) (December 1986 – December 2003). | 59 | Director of Courier Corporation (a book publisher and manufacturer); Member of the Investment Committee of Partners HealthCare System, Inc.3 | ||||||||||||||||||
| Peter Tufano c/o GMO Trust 40 Rowes Wharf Boston, MA 02110 DOB: 04/22/1957 | Trustee | Since December 2008. | Sylvan C. Coleman Professor of Financial Management, Harvard Business School (since 1989). | 59 | Trustee of State Street Navigator Securities Lending Trust (3 Portfolios). | ||||||||||||||||||
1 Each Trustee is elected to serve during the continued lifetime of the Trust until he/she dies, resigns or is removed, or if sooner, until the next meeting of Shareholders called for the purpose of electing Trustees and until the election and qualification of his/her successor.
3 Partners HealthCare System, Inc. is a client of the Manager.
46
Principal Officers:
| Name, Address, and DOB | Position(s) Held with Trust | Term of Office4 and Length of Time Served | Principal Occupation(s) During Past Five Years5 | ||||||||||||
| J.B. Kittredge DOB: 08/22/1954 | President and Chief Executive Officer | Since March 2009. | General Counsel, Grantham, Mayo, Van Otterloo & Co. LLC (October 2005 – Present); Partner, Ropes & Gray LLP. | ||||||||||||
| Sheppard N. Burnett c/o GMO Trust 40 Rowes Wharf Boston, MA 02110 DOB: 10/24/1968 | Treasurer and Chief Financial Officer | Chief Financial Officer since March 2007; Treasurer since November 2006; Assistant Treasurer, September 2004 – November 2006. | Fund Administration Staff, Grantham, Mayo, Van Otterloo & Co. LLC (June 2004 – present); Vice President, Director of Tax, Columbia Management Group (2002 – 2004). | ||||||||||||
| Brent C. Arvidson c/o GMO Trust 40 Rowes Wharf Boston, MA 02110 DOB: 06/26/1969 | Assistant Treasurer | Since August 1998. | Senior Fund Administrator, Grantham, Mayo, Van Otterloo & Co. LLC. | ||||||||||||
| John L. Nasrah c/o GMO Trust 40 Rowes Wharf Boston, MA 02110 DOB: 05/27/1977 | Assistant Treasurer | Since March 2007. | Fund Administrator, Grantham, Mayo, Van Otterloo & Co. LLC (September 2004 – present); Tax Analyst, Bain & Company, Inc. (June 2003 – September 2004). | ||||||||||||
| Mahmoodur Rahman c/o GMO Trust 40 Rowes Wharf Boston, MA 02110 DOB: 11/30/1967 | Assistant Treasurer | Since September 2007. | Fund Administrator, Grantham, Mayo, Van Otterloo & Co. LLC (April 2007 – present); Vice President and Senior Tax Manager, Massachusetts Financial Services Company (January 2000 – April 2007). | ||||||||||||
| Michael E. Gillespie c/o GMO Trust 40 Rowes Wharf Boston, MA 02110 DOB: 02/18/1958 | Chief Compliance Officer | Since March 2005. | Vice President of Compliance (June 2004 – February 2005) and Director of Domestic Compliance (March 2002 – June 2004), Fidelity Investments. | ||||||||||||
4 Each officer is elected to hold such office until his or her successor is duly elected and qualified to carry out the duties and responsibilities of the office, or until he or she resigns or is removed from office.
5 Each of Messrs. Burnett, Arvidson, Bohan, and Pottle serves as an officer and/or director of certain pooled investment vehicles of which GMO or an affiliate of GMO serves as the investment adviser.
47
Principal Officers — (Continued)
| Name, Address, and DOB | Position(s) Held with Trust | Term of Office4 and Length of Time Served | Principal Occupation(s) During Past Five Years5 | ||||||||||||
| Jason B. Harrison c/o GMO Trust 40 Rowes Wharf Boston, MA 02110 DOB: 01/29/1977 | Vice President and Clerk | Vice President since November 2006; Clerk since March 2006. | Legal Counsel, Grantham, Mayo, Van Otterloo & Co. LLC (since February 2006) and Attorney, Ropes & Gray LLP (September 2002 – February 2006). | ||||||||||||
| David L. Bohan c/o GMO Trust 40 Rowes Wharf Boston, MA 02110 DOB: 06/21/1964 | Vice President and Assistant Clerk | Vice President since March 2005; Assistant Clerk since March 2006. | Legal Counsel, Grantham, Mayo, Van Otterloo & Co. LLC. | ||||||||||||
| Gregory L. Pottle c/o GMO Trust 40 Rowes Wharf Boston, MA 02110 DOB: 07/09/1971 | Vice President and Assistant Clerk | Since November 2006. | Legal Counsel, Grantham, Mayo, Van Otterloo & Co. LLC. | ||||||||||||
| Anne K. Trinque c/o GMO Trust 40 Rowes Wharf Boston, MA 02110 DOB: 04/15/1978 | Vice President and Assistant Clerk | Since September 2007. | Legal Counsel, Grantham, Mayo, Van Otterloo & Co. LLC (January 2007 – present); Attorney, Goodwin Procter LLP (September 2003 – January 2007). | ||||||||||||
| Cheryl Wakeham c/o GMO Trust 40 Rowes Wharf Boston, MA 02110 DOB: 10/29/1958 | Vice President and Anti-Money Laundering Officer | Since December 2004. | Manager, Client Service Administration, Grantham, Mayo, Van Otterloo & Co. LLC. | ||||||||||||
4 Each officer is elected to hold such office until his or her successor is duly elected and qualified to carry out the duties and responsibilities of the office, or until he or she resigns or is removed from office.
5 Each of Messrs. Burnett, Arvidson, Bohan, and Pottle serves as an officer and/or director of certain pooled investment vehicles of which GMO or an affiliate of GMO serves as the investment adviser.
48
GMO Core Plus Bond Fund
(A Series of GMO Trust)
Annual Report
February 28, 2009
For a free copy of the Fund's proxy voting guidelines, shareholders may call 1-617-346-7646 (collect) or visit the Securities and Exchange Commission's website at www.sec.gov. Information regarding how the Fund voted proxies relating to portfolio securities during the most recent 12-month period ended June 30 is available on GMO's website at www.gmo.com, or on the Securities and Exchange Commission's website at www.sec.gov.
The Fund files its complete schedule of portfolio holdings with the Securities and Exchange Commission for the first and third quarter of each fiscal year on Form N-Q, which is available on the Commission's website at www.sec.gov. The Fund's Form N-Q may be reviewed and copied at the Commission's Public Reference Room in Washington, D.C. Information on the operation of the Public Reference Room may be obtained by calling 1-800-SEC-0330. The Fund has a policy with respect to disclosure of portfolio holdings under which it may also make available on GMO's website at www.gmo.com a complete schedule of portfolio holdings.
This report is prepared for the general information of shareholders. It is authorized for distribution to prospective investors only when preceded or accompanied by a prospectus for the GMO Trust, which contains a complete discussion of the risks associated with an investment in this Fund and other important information. The GMO Trust prospectus can be obtained at www.gmo.com.
GMO Core Plus Bond Fund
(A Series of GMO Trust)
Portfolio Management
Day-to-day management of the Fund's portfolio is the responsibility of the Fixed Income team at Grantham, Mayo, Van Otterloo & Co. LLC.
Management Discussion and Analysis of Fund Performance
The Class III shares of the GMO Core Plus Bond Fund returned -20.1% for the fiscal year ended February 28, 2009, as compared to the +2.1% return for the Barclays Capital U.S. Aggregate Index (formerly Lehman Brothers U.S. Aggregate Index). The Fund's exposure to various investments is achieved directly, and indirectly, through its investment in certain underlying GMO mutual funds, including the GMO Emerging Country Debt Fund (ECDF), the GMO World Opportunity Overlay Fund (WOOF), and the GMO Short-Duration Collateral Fund (SDCF).
The Fund underperformed the benchmark during the fiscal year by 22.2%. Exposures to SDCF and WOOF were by far the largest negative contributors during the fiscal year, followed by negative contributions from developed interest-rate strategies, currency selection, and exposure to emerging country debt via ECDF.
About 76% of the fiscal year's underperformance was due to price declines in the two funds in which the Fund invests a substantial portion of its total assets: SDCF and WOOF. These funds primarily invest in asset-backed securities. The positions in SDCF and WOOF collateralize the Fund's derivatives positions that seek to deliver the return of the benchmark as well as create active exposures in global interest-rate and currency markets.
As the fiscal year was marked by sharply deteriorating liquidity conditions in securitized credit markets, spreads widened to all-time highs in the asset-backed securities held in the GMO Core Plus Bond Fund, mostly indirectly via holdings of SDCF and WOOF. Such ABS exposure contributed -15.33% to the Fund's performance. To increase flexibility, the Fund began holding more U.S. Government Securities and Money Market Funds directly. In addition to widening spreads, both SDCF and WOOF's portfolios suffered credit downgrades during the year. SDCF had 123 downgraded securities, and WOOF had 82, representing 27.4% and 25.5% of their respective market values from the beginning of the year. At fiscal year end, 73% of SDCF's portfolio was rated AAA, 8% was rated AA, 2% was rated A, 12% was rated BBB and 5% was rated below BBB. At fiscal year end, 74% of WOOF's portfolio was rated AAA, 6% was rated AA, 2% was rated A, 12% was rated BBB a nd 6% was rated below BBB.
Further underperformance was attributable to interest-rate and currency strategies. Given the unhealthy market conditions for interest-rates and currencies, characterized by poor liquidity and choppy, gapping prices, the Fund temporarily suspended model-based positions in interest rates and currencies starting in October.
In interest-rate strategies, underperformance of U.S. Treasury principal strips versus LIBOR and other opportunistic trades contributed to developed interest-rate strategy losses. Before model-based interest-rate positions were suspended, Euro-area, U.S., Swedish, and Swiss market positions had contributed positively. Further, the slope and volatility strategies also added value during this time.
GMO Core Plus Bond Fund
(A Series of GMO Trust)
Management Discussion and Analysis of Fund Performance — (Continued)
Currency contribution was concentrated before positions were suspended in October. Negative relative currency performance during this time came mainly from the Fund's Swedish krona, Norwegian krone, yen, and New Zealand dollar positions.
A small exposure to emerging country debt also detracted value as spread widening on that asset class contributed negatively, as did negative contributions from both security and country selection.
The views expressed herein are exclusively those of Grantham, Mayo, Van Otterloo & Co. LLC Management as of the date of this report and are subject to change. GMO disclaims any responsibility to update such views. They are not meant as investment advice. References to specific securities are not recommendations of such securities and may not be representative of any GMO portfolio's current or future investments.
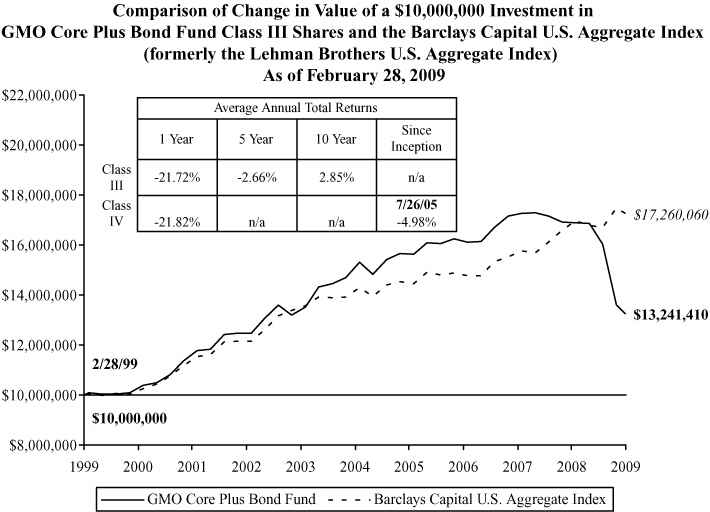
Performance data quoted represents past performance and is not indicative of future results. The investment return and principal value of an investment will fluctuate so that an investor's shares, when redeemed, may be worth more or less than their original cost. Current performance data may be lower or higher than the performance data provided herein. To obtain performance information to the most recent month-end, visit www.gmo.com. Performance shown is net of all fees after reimbursement from the Manager. Each performance figure assumes a redemption at the end of the stated period and reflects a transaction fee of 2.00% on the redemption. Transaction fees are retained by the Fund to cover trading costs. Returns would have been lower had certain expenses not been reimbursed during the periods shown and do not include the effect of taxes on distributions and redem ptions. All information is unaudited. Performance for Class IV will vary due to different fees.
This page has been left blank intentionally.
GMO Core Plus Bond Fund
(A Series of GMO Trust)
Investments Concentration Summary
February 28, 2009 (Unaudited)
| Asset Class Summary* | % of Total Net Assets | ||||||
| Debt Obligations | 86.4 | % | |||||
| Short-Term Investments | 15.7 | ||||||
| Options Purchased | 1.7 | ||||||
| Preferred Stocks | 0.3 | ||||||
| Loan Participations | 0.2 | ||||||
| Forward Currency Contracts | 0.1 | ||||||
| Loan Assignments | 0.1 | ||||||
| Rights and Warrants | 0.0 | ||||||
| Promissory Notes | 0.0 | ||||||
| Reverse Repurchase Agreements | (0.0 | ) | |||||
| Futures | (0.1 | ) | |||||
| Written Options | (0.6 | ) | |||||
| Swaps | (6.1 | ) | |||||
| Other | 2.3 | ||||||
| 100.0 | % | ||||||
| Country / Region Summary** | % of Investments | ||||||
| United States | 95.9 | % | |||||
| Emerging*** | 3.4 | ||||||
| United Kingdom | 1.8 | ||||||
| Australia | (0.4 | ) | |||||
| Euro Region**** | (0.7 | ) | |||||
| 100.0 | % | ||||||
* The table above incorporates aggregate indirect asset class exposure associated with investments in other funds of GMO Trust ("underlying funds").
** The table above incorporates aggregate indirect country exposure associated with investments in the underlying funds. The table excludes short-term investments. The table includes exposure through the use of derivative contracts. The table is based on duration-adjusted exposures, taking into account the market value of securities and the notional amounts of swaps and other derivative contracts. Duration is based on the Manager's models. The greater the duration of a bond, the greater its contribution to the concentration percentage. Credit default swap exposures (both positive and negative) are factored into the duration-adjusted exposure using the reference security and applying the same methodology to that security.
*** The "Emerging" exposure is associated with investments in the GMO Emerging Country Debt Fund, which is exposed to emerging countries primarily comprised of Philippines, Russia, Venezuela, Brazil, Argentina, Colombia, Uruguay, Mexico, Ivory Coast, and Vietnam. Additional information about the Fund's emerging country exposure is available in the financial statements of the GMO Emerging Country Debt Fund.
**** The "Euro Region" is comprised of Austria, Belgium, Finland, France, Germany, Greece, Ireland, Italy, Netherlands, Portugal and Spain.
1
GMO Core Plus Bond Fund
(A Series of GMO Trust)
Schedule of Investments
(showing percentage of total net assets)
February 28, 2009
| Par Value | Description | Value ($) | |||||||||
| DEBT OBLIGATIONS — 25.7% | |||||||||||
| Albania — 2.3% | |||||||||||
| Foreign Government Obligations | |||||||||||
| USD | 15,681,227 | Republic of Albania Par Bond, Zero Coupon, due 08/31/25 (a) (b) | 7,114,707 | ||||||||
| Australia — 0.2% | |||||||||||
| Asset-Backed Securities | |||||||||||
| USD | 326,810 | Crusade Global Trust, Series 07-1, Class A1, 3 mo. LIBOR + .06%, 1.20%, due 04/19/38 | 264,985 | ||||||||
| USD | 481,549 | Medallion Trust, Series 05-1G, Class A1, 3 mo. LIBOR + .08%, 1.32%, due 05/10/36 | 417,350 | ||||||||
| Total Australia | 682,335 | ||||||||||
| United Kingdom — 0.5% | |||||||||||
| Asset-Backed Securities | |||||||||||
| USD | 300,000 | Aire Valley Mortgages, Series 07-1A, Class 1A2, 144A, 3 mo. LIBOR + .09%, 1.62%, due 03/20/30 | 268,800 | ||||||||
| USD | 700,000 | Brunel Residential Mortgages, Series 07-1A, Class A4C, 144A, 3 mo. LIBOR + .10%, 1.36%, due 01/13/39 | 565,110 | ||||||||
| USD | 111,747 | Granite Master Issuer Plc, Series 06-2, Class A4, 1 mo. LIBOR + .04%, 0.51%, due 12/20/54 | 69,283 | ||||||||
| USD | 500,000 | Pendeford Master Issuer Plc, Series 07-1A, Class 3A, 144A, 3 mo. LIBOR + .10%, 1.32%, due 02/12/16 | 437,000 | ||||||||
| USD | 300,000 | Permanent Master Issuer Plc, Series 07-1, Class 4A, 3 mo. LIBOR + .08%, 1.17%, due 10/15/33 | 245,445 | ||||||||
| Total United Kingdom | 1,585,638 | ||||||||||
| United States — 22.7% | |||||||||||
| Asset-Backed Securities — 5.1% | |||||||||||
| USD | 309,806 | Alliance Bancorp Trust, Series 07-S1, Class A1, 144A, 1 mo. LIBOR + .20%, 0.67%, due 05/25/37 | 39,760 | ||||||||
| USD | 400,000 | AmeriCredit Automobile Receivables Trust, Series 07-AX, Class A4, XL, 1 mo. LIBOR + .04%, 0.49%, due 10/06/13 | 268,120 | ||||||||
| USD | 50,000 | ARG Funding Corp., Series 05-2A, Class A3, 144A, AMBAC, 1 mo. LIBOR + .14%, 0.61%, due 05/20/10 | 47,832 | ||||||||
See accompanying notes to the financial statements.
2
GMO Core Plus Bond Fund
(A Series of GMO Trust)
Schedule of Investments — (Continued)
(showing percentage of total net assets)
February 28, 2009
| Par Value | Description | Value ($) | |||||||||
| Asset-Backed Securities — continued | |||||||||||
| USD | 200,000 | Argent Securities, Inc., Series 06-M2, Class A2B, 1 mo. LIBOR + .11%, 0.58%, due 09/25/36 | 82,000 | ||||||||
| USD | 1,000,000 | Argent Securities, Inc., Series 06-W5, Class A2C, 1 mo. LIBOR + .15%, 0.62%, due 06/25/36 | 677,500 | ||||||||
| USD | 1,200,000 | Argent Securities, Inc., Series 06-M1, Class A2C, 1 mo. LIBOR + .15%, 0.62%, due 07/25/36 | 302,250 | ||||||||
| USD | 186,877 | Bayview Commercial Asset Trust, Series 05-4A, Class A2, 144A, 1 mo. LIBOR + .39%, 0.86%, due 01/25/36 | 119,452 | ||||||||
| USD | 200,000 | BMW Vehicle Lease Trust, Series 07-1, Class A3B, 1 mo. LIBOR + .24%, 0.70%, due 08/15/13 | 192,644 | ||||||||
| USD | 300,000 | Capital Auto Receivable Asset Trust, Series 07-2, Class A4B, 1 mo. LIBOR + .40%, 0.86%, due 02/18/14 | 246,450 | ||||||||
| USD | 500,000 | Charming Shoppes Master Trust, Series 07-1A, Class A1, 144A, 1 mo. LIBOR + 1.25%, 1.71%, due 09/15/17 | 344,045 | ||||||||
| USD | 250,000 | Citibank OMNI Master Trust, Series 07-A9A, Class A9, 144A, 1 mo. LIBOR + 1.10%, 1.57%, due 12/23/13 | 225,825 | ||||||||
| USD | 300,000 | College Loan Corp. Trust, Series 07-2, Class A1, 3 mo. LIBOR + .25%, 1.41%, due 01/25/24 | 285,000 | ||||||||
| USD | 903,082 | Crest Exeter Street Solar, Series 04-1A, Class A1, 144A, 3 mo. LIBOR + .35%, 1.82%, due 06/28/19 | 650,219 | ||||||||
| USD | 300,000 | Daimler Chrysler Auto Trust, Series 08-B, Class A4B, 1 mo. LIBOR + 1.85%, 2.30%, due 11/10/14 | 236,400 | ||||||||
| USD | 100,000 | Daimler Chrysler Master Owner Trust, Series 06-A, Class A, 1 mo. LIBOR + .03%, 0.49%, due 11/15/11 | 65,000 | ||||||||
| USD | 800,000 | First Franklin Mortgage Loan Asset Backed Certificates, Series 06-FF5, Class 2A3, 1 mo. LIBOR + .16%, 0.63%, due 04/25/36 | 317,000 | ||||||||
| USD | 600,000 | Ford Credit Auto Owner Trust, Series 06-C, Class A4B, 1 mo. LIBOR + .04%, 0.50%, due 02/15/12 | 540,876 | ||||||||
| USD | 500,000 | Ford Credit Floorplan Master Owner Trust, Series 06-4, Class A, 1 mo. LIBOR + .25%, 0.71%, due 06/15/13 | 300,000 | ||||||||
| USD | 533,304 | Fremont Home Loan Trust, Series 06-A, Class 1A2, 1 mo. LIBOR + .20%, 0.67%, due 05/25/36 | 344,148 | ||||||||
| USD | 100,000 | Fremont Home Loan Trust, Series 06-B, Class 2A3, 1 mo. LIBOR + .16%, 0.63%, due 08/25/36 | 32,000 | ||||||||
| USD | 953,875 | GE Business Loan Trust, Series 05-2A, Class A, 144A, 1 mo. LIBOR + .24%, 0.70%, due 11/15/33 | 618,542 | ||||||||
See accompanying notes to the financial statements.
3
GMO Core Plus Bond Fund
(A Series of GMO Trust)
Schedule of Investments — (Continued)
(showing percentage of total net assets)
February 28, 2009
| Par Value | Description | Value ($) | |||||||||
| Asset-Backed Securities — continued | |||||||||||
| USD | 500,000 | GE Capital Credit Card Master Note Trust, Series 07-3, Class A1, 1 mo. LIBOR + .01%, 0.47%, due 06/15/13 | 456,250 | ||||||||
| USD | 600,000 | GE Dealer Floorplan Master Trust, Series 06-4, Class A, 1 mo. LIBOR + .01%, 0.48%, due 10/20/11 | 496,710 | ||||||||
| USD | 18,313 | GreenPoint Mortgage Funding Trust, Series 05-HE4, Class 2A3C, 1 mo. LIBOR + .25%, 0.72%, due 07/25/30 | 11,892 | ||||||||
| USD | 800,000 | GS Mortgage Securities Corp., Series 07-EOP, Class A2, 144A, 1 mo. LIBOR + .13%, 0.58%, due 03/06/20 | 596,720 | ||||||||
| USD | 600,000 | Household Credit Card Master Note Trust I, Series 07-2, Class A, 1 mo. LIBOR + .55%, 1.01%, due 07/15/13 | 499,875 | ||||||||
| USD | 440,338 | Lehman Brothers Floating Rate Commercial, Series 06-LLFA, Class A1, 144A, 1 mo. LIBOR + .08%, 0.54%, due 09/15/21 | 308,237 | ||||||||
| USD | 528,851 | Lehman Brothers Small Balance Commercial, Series 07-3A, Class 1A1, 144A, 1 mo. LIBOR + .65%, 1.12%, due 10/25/37 | 412,504 | ||||||||
| USD | 200,000 | Master Asset-Backed Securities Trust, Series 06-FRE2, Class A4, 1 mo. LIBOR + .15%, 0.62%, due 03/25/36 | 80,000 | ||||||||
| USD | 900,000 | Master Asset-Backed Securities Trust, Series 06-HE2, Class A3, 1 mo. LIBOR + .15%, 0.62%, due 06/25/36 | 238,500 | ||||||||
| USD | 1,000,000 | Morgan Stanley ACES SPC, Series 05-2A, Class A, 144A, 3 mo. LIBOR + .45%, 1.98%, due 03/20/10 | 487,500 | ||||||||
| USD | 1,000,000 | Morgan Stanley ACES SPC, Series 04-12, Class A, 144A, 3 mo. LIBOR + .60%, 1.83%, due 08/05/09 | 729,000 | ||||||||
| USD | 700,000 | Morgan Stanley Capital, Inc., Series 07-HE4, Class A2C, 1 mo. LIBOR + .23%, 0.70%, due 02/25/37 | 196,000 | ||||||||
| USD | 300,000 | National City Credit Card Master Trust, Series 08-3, Class A, 1 mo. LIBOR + 1.80%, 2.26%, due 05/15/13 | 235,500 | ||||||||
| USD | 430,886 | National Collegiate Student Loan Trust, Series 06-1, Class A2, 1 mo. LIBOR + .14%, 0.61%, due 08/25/23 | 387,798 | ||||||||
| USD | 300,000 | Nissan Auto Lease Trust, Series 08-A, Class A3B, 1 mo. LIBOR + 2.20%, 2.66%, due 07/15/11 | 276,094 | ||||||||
| USD | 200,000 | Nissan Master Owner Trust Receivables, Series 07-A, Class A, 1 mo. LIBOR, 0.46%, due 05/15/12 | 162,000 | ||||||||
| USD | 445,499 | Residential Asset Securities Corp., Series 07-KS3, Class AI1, 1 mo. LIBOR + .11%, 0.58%, due 04/25/37 | 387,584 | ||||||||
| USD | 142,070 | Residential Funding Mortgage Securities II, Series 03-HS1, Class AII, FGIC, 1 mo. LIBOR + .29%, 0.76%, due 12/25/32 | 69,028 | ||||||||
See accompanying notes to the financial statements.
4
GMO Core Plus Bond Fund
(A Series of GMO Trust)
Schedule of Investments — (Continued)
(showing percentage of total net assets)
February 28, 2009
| Par Value | Description | Value ($) | |||||||||
| Asset-Backed Securities — continued | |||||||||||
| USD | 500,000 | Santander Drive Auto Receivables Trust, Series 07-1, Class A4, FGIC, 1 mo. LIBOR + .05%, 0.51%, due 09/15/14 | 340,361 | ||||||||
| USD | 156,047 | SBI Heloc Trust, Series 05-HE1, Class 1A, 144A, FSA, 1 mo. LIBOR + .19%, 0.66%, due 11/25/35 | 78,023 | ||||||||
| USD | 784,712 | Sierra Receivables Funding Co., Series 06-1A, Class A2, 144A, MBIA, 1 mo. LIBOR + .15%, 0.62%, due 05/20/18 | 594,577 | ||||||||
| USD | 666,812 | SLM Student Loan Trust, Series 07-A, Class A1, 3 mo. LIBOR + .03%, 2.03%, due 09/15/22 | 560,122 | ||||||||
| USD | 166,926 | Sovereign Dealer Floor Plan Master Trust, Series 06-1, Class A, 144A, 1 mo. LIBOR + .05%, 0.51%, due 08/15/11 | 150,233 | ||||||||
| USD | 129,563 | Structured Asset Securities Corp., Series 05-S6, Class A2, 1 mo. LIBOR + .29%, 0.76%, due 11/25/35 | 20,730 | ||||||||
| USD | 400,000 | Swift Master Auto Receivables Trust, Series 07-1, Class A, 1 mo. LIBOR + .10%, 0.56%, due 06/15/12 | 268,000 | ||||||||
| USD | 400,000 | Triad Auto Receivables Owner Trust, Series 07-B, Class A4B, FSA, 1 mo. LIBOR + 1.20%, 1.65%, due 07/14/14 | 282,360 | ||||||||
| USD | 500,000 | Truck Retail Installment Paper Corp., Series 05-1A, Class A, 144A, 1 mo. LIBOR + .27%, 0.73%, due 12/15/16 | 350,000 | ||||||||
| USD | 900,000 | Wachovia Auto Owner Trust, Series 08-A, Class A4B, 1 mo. LIBOR + 1.15%, 1.62%, due 03/20/14 | 815,022 | ||||||||
| USD | 500,000 | World Financial Network Credit Card Master Trust, Series 06-A, Class A, 144A, 1 mo. LIBOR + .13%, 0.59%, due 02/15/17 | 354,790 | ||||||||
| 15,780,473 | |||||||||||
| U.S. Government — 17.5% | |||||||||||
| USD | 25,532,760 | U.S. Treasury Inflation Indexed Bond, 0.88%, due 04/15/10 (c) (d) | 25,189,650 | ||||||||
| USD | 10,100,000 | U.S. Treasury Receipts, 0.00%, due 08/15/12 (b) | 9,183,868 | ||||||||
| USD | 10,100,000 | U.S. Treasury Receipts, 0.00%, due 02/15/10 (b) | 9,950,445 | ||||||||
| USD | 10,100,000 | U.S. Treasury Receipts, 0.00%, due 02/15/12 (b) | 9,392,360 | ||||||||
| 53,716,323 | |||||||||||
| U.S. Government Agency — 0.1% | |||||||||||
| USD | 201,584 | Agency for International Development Floater (Support of Honduras), 3 mo. U.S. Treasury Bill x 117%, 0.07%, due 10/01/11 (b) | 194,851 | ||||||||
| Total United States | 69,691,647 | ||||||||||
| TOTAL DEBT OBLIGATIONS (COST $78,313,163) | 79,074,327 | ||||||||||
See accompanying notes to the financial statements.
5
GMO Core Plus Bond Fund
(A Series of GMO Trust)
Schedule of Investments — (Continued)
(showing percentage of total net assets)
February 28, 2009
| Shares | Description | Value ($) | |||||||||||||
| MUTUAL FUNDS — 64.7% | |||||||||||||||
| United States — 64.7% | |||||||||||||||
| Affiliated Issuers | |||||||||||||||
| 1,644,373 | GMO Emerging Country Debt Fund, Class III | 9,619,580 | |||||||||||||
| 7,980,394 | GMO Short-Duration Collateral Fund | 136,464,740 | |||||||||||||
| 93,858 | GMO Special Purpose Holding Fund (b) (e) | 68,517 | |||||||||||||
| 2,873,549 | GMO World Opportunity Overlay Fund | 52,729,622 | |||||||||||||
| Total United States | 198,882,459 | ||||||||||||||
| TOTAL MUTUAL FUNDS (COST $267,458,801) | 198,882,459 | ||||||||||||||
| PREFERRED STOCKS — 0.3% | |||||||||||||||
| United States — 0.3% | |||||||||||||||
| 10,000 | Home Ownership Funding 2 Preferred 144A, 1.00% (b) | 900,000 | |||||||||||||
| TOTAL PREFERRED STOCKS (COST $2,138,851) | 900,000 | ||||||||||||||
| SHORT-TERM INVESTMENTS — 13.1% | |||||||||||||||
| Money Market Funds — 13.1% | |||||||||||||||
| 10,361,181 | State Street Institutional Liquid Reserves Fund-Institutional Class | 10,361,181 | |||||||||||||
| 30,028,954 | State Street Institutional Treasury Plus Money Market Fund-Institutional Class | 30,028,954 | |||||||||||||
| TOTAL SHORT-TERM INVESTMENTS (COST $40,390,135) | 40,390,135 | ||||||||||||||
| TOTAL INVESTMENTS — 103.8% (Cost $388,300,950) | 319,246,921 | ||||||||||||||
| Other Assets and Liabilities (net) — (3.8%) | (11,668,533 | ) | |||||||||||||
| TOTAL NET ASSETS — 100.0% | $ | 307,578,388 | |||||||||||||
See accompanying notes to the financial statements.
6
GMO Core Plus Bond Fund
(A Series of GMO Trust)
Schedule of Investments — (Continued)
February 28, 2009
A summary of outstanding financial instruments at February 28, 2009 is as follows:
Futures Contracts
| Number of Contracts | Type | Expiration Date | Contract Value | Net Unrealized Appreciation (Depreciation) | |||||||||||||||
| Buys | |||||||||||||||||||
| 27 | U.S. Long Bond (CBT) | March 2009 | $ | 3,364,453 | $ | (266,815 | ) | ||||||||||||
| 238 | U.S. Treasury Note 2 Yr. (CBT) | June 2009 | 51,553,031 | (30,464 | ) | ||||||||||||||
| 99 | U.S. Treasury Note 5 Yr. (CBT) | June 2009 | 11,542,008 | (28,914 | ) | ||||||||||||||
| $ | 66,459,492 | $ | (326,193 | ) | |||||||||||||||
| Sales | |||||||||||||||||||
| 34 | U.S. Treasury Note 10 Yr. (CBT) | June 2009 | $ | 4,081,062 | $ | 34,695 | |||||||||||||
Swap Agreements
Credit Default Swaps
| Notional Amount | Expiration Date | Counterparty | Receiveu (Pay) | Annual Premium | Implied Credit Spread (1) | Deliverable on Default | Maximum Potential Amount of Future Payments by the Fund Under the Contract (2) | Market Value | |||||||||||||||||||||||||||||||||||
| 5,000,000 | USD | 12/20/2010 | Deutsche | Receive | 0.75 | % | 3.36 | % | Enterprise | 5,000,000 | USD | $ | (217,745 | ) | |||||||||||||||||||||||||||||
| Bank AG | Products | ||||||||||||||||||||||||||||||||||||||||||
| Partners | |||||||||||||||||||||||||||||||||||||||||||
| LP | |||||||||||||||||||||||||||||||||||||||||||
| 2,000,000 | USD | 6/20/2011 | Barclays Bank PLC | Receive | 0.30 | % | 21.97 | % | Prologis | 2,000,000 | USD | (657,142 | ) | ||||||||||||||||||||||||||||||
| 2,000,000 | USD | 6/20/2011 | UBS AG | Receive | 0.26 | % | 3.90 | % | ERP Operating LP | 2,000,000 | USD | (154,143 | ) | ||||||||||||||||||||||||||||||
| 2,000,000 | USD | 12/20/2013 | UBS AG | Receive | 0.34 | % | 10.61 | % | CIT | 2,000,000 | USD | (616,543 | ) | ||||||||||||||||||||||||||||||
| 2,000,000 | USD | 12/20/2013 | Barclays Bank PLC | Receive | 0.25 | % | 9.59 | % | SLM Corp. | 2,000,000 | USD | (580,171 | ) | ||||||||||||||||||||||||||||||
| $ | (2,225,744 | ) | |||||||||||||||||||||||||||||||||||||||||
| Premiums to (Pay) Receive | $ | — | |||||||||||||||||||||||||||||||||||||||||
u Receive - Fund receives premium and sells credit protection.
(Pay) - Fund pays premium and buys credit protection.
See accompanying notes to the financial statements.
7
GMO Core Plus Bond Fund
(A Series of GMO Trust)
Schedule of Investments — (Continued)
February 28, 2009
(1) Implied credit spreads, represented in absolute terms, utilized in determining the market value of credit default swap agreements on the reference security, as of February 28, 2009, serve as an indicator of the current status of the payment/performance risk and reflect the likelihood or risk of default for the credit derivative. The implied credit spread of a particular referenced entity reflects the cost of buying/selling protection and may include upfront payments required to be made to enter into the agreement. Wider credit spreads represent a deterioration of the referenced entity's credit soundness and a greater likelihood or risk of default or other credit event occurring as defined under the terms of the agreement.
(2) The maximum potential amount the Fund could be required to make as a seller of credit protection if a credit event occurs as defined under the terms of that particular swap agreement.
Interest Rate Swaps
| Notional Amount | Expiration Date | Counterparty | Receive (Pay)# | Fixed Rate | Variable Rate | Market Value | |||||||||||||||||||||||||
| 10,100,000 | USD | 2/15/2010 | JP Morgan Chase Bank | (Pay) | 0.00 | % | 3 month LIBOR | $ | (2,596,991 | ) | |||||||||||||||||||||
| 10,100,000 | USD | 2/15/2012 | JP Morgan Chase Bank | (Pay) | 0.00 | % | 3 month LIBOR | (2,877,719 | ) | ||||||||||||||||||||||
| 10,100,000 | USD | 8/15/2012 | JP Morgan Chase Bank | (Pay) | 0.00 | % | 3 month LIBOR | (2,907,984 | ) | ||||||||||||||||||||||
| 15,680,000 | USD | 8/31/2025 | JP Morgan Chase Bank | (Pay) | 0.00 | % | 3 month LIBOR | (4,105,907 | ) | ||||||||||||||||||||||
| $ | (12,488,601 | ) | |||||||||||||||||||||||||||||
| Premiums to (Pay) Receive (f) | $ | 8,730,953 | |||||||||||||||||||||||||||||
# (Pay) - Fund pays fixed rate and receives variable rate.
Receive - Fund receives fixed rate and pays variable rate.
Total Return Swaps
| Notional Amount | Expiration Date | Counterparty | Pay | Receive | Market Value | ||||||||||||||||||||||
| 250,000,000 | USD | 8/19/2011 | Morgan Stanley | 3 month | Lehman Aggregate | ||||||||||||||||||||||
| LIBOR - 0.01% | Total Return Index | $ | (1,357,987 | ) | |||||||||||||||||||||||
| $ | (1,357,987 | ) | |||||||||||||||||||||||||
| Premiums to (Pay) Receive | $ | — | |||||||||||||||||||||||||
As of February 28, 2009, for the futures and/or swap contracts held, the Fund had sufficient cash and/or securities to cover any commitments or margin requirements of the relevant broker or exchange.
See accompanying notes to the financial statements.
8
GMO Core Plus Bond Fund
(A Series of GMO Trust)
Schedule of Investments — (Continued)
February 28, 2009
Notes to Schedule of Investments:
144A - Securities exempt from registration under Rule 144A of the Securities Act of 1933. These securities may be resold in transactions exempt from registration, normally to qualified institutional investors.
AMBAC - Insured as to the payment of principal and interest by AMBAC Assurance Corporation.
FGIC - Insured as to the payment of principal and interest by Financial Guaranty Insurance Corporation.
FSA - Insured as to the payment of principal and interest by Financial Security Assurance.
LIBOR - London Interbank Offered Rate
MBIA - Insured as to the payment of principal and interest by MBIA Insurance Corp.
XL - Insured as to the payment of principal and interest by XL Capital Assurance.
The rates shown on variable rate notes are the current interest rates at February 28, 2009, which are subject to change based on the terms of the security.
(a) Security is backed by the U.S. Government.
(b) Security valued at fair value using methods determined in good faith by or at the direction of the Trustees of GMO Trust (Note 2).
(c) All or a portion of this security has been segregated to cover margin requirements on open financial futures contracts (Note 2).
(d) Indexed security in which price and/or coupon is linked to the prices of a specific instrument or financial statistic (Note 2).
(e) Underlying investment represents interests in defaulted securities.
(f) Includes accretion since inception for zero coupon interest rate swaps.
Currency Abbreviations:
USD - United States Dollar
See accompanying notes to the financial statements.
9
GMO Core Plus Bond Fund
(A Series of GMO Trust)
Statement of Assets and Liabilities — February 28, 2009
| Assets: | |||||||
| Investments in unaffiliated issuers, at value (cost $120,842,149) (Note 2) | $ | 120,364,462 | |||||
| Investments in affiliated issuers, at value (cost $267,458,801) (Notes 2 and 8) | 198,882,459 | ||||||
| Interest receivable | 105,544 | ||||||
| Receivable for variation margin on open futures contracts (Note 2) | 68,255 | ||||||
| Interest receivable for open swap contracts | 5,395,814 | ||||||
| Receivable for expenses reimbursed by Manager (Note 3) | 10,372 | ||||||
| Total assets | 324,826,906 | ||||||
| Liabilities: | |||||||
| Payable to affiliate for (Note 3): | |||||||
| Management fee | 59,425 | ||||||
| Shareholder service fee | 26,620 | ||||||
| Trustees and Chief Compliance Officer of GMO Trust fees | 1,067 | ||||||
| Payable to broker for closed futures contracts | 49 | ||||||
| Payable for open swap contracts (Note 2) | 16,072,332 | ||||||
| Miscellaneous payable | 854,313 | ||||||
| Accrued expenses | 234,712 | ||||||
| Total liabilities | 17,248,518 | ||||||
| Net assets | $ | 307,578,388 | |||||
| Net assets consist of: | |||||||
| Paid-in capital | $ | 540,949,827 | |||||
| Accumulated undistributed net investment income | 639,071 | ||||||
| Accumulated net realized loss | (157,323,604 | ) | |||||
| Net unrealized depreciation | (76,686,906 | ) | |||||
| $ | 307,578,388 | ||||||
| Net assets attributable to: | |||||||
| Class III shares | $ | 73,730,254 | |||||
| Class IV shares | $ | 233,848,134 | |||||
| Shares outstanding: | |||||||
| Class III | 12,124,156 | ||||||
| Class IV | 38,379,005 | ||||||
| Net asset value per share: | |||||||
| Class III | $ | 6.08 | |||||
| Class IV | $ | 6.09 | |||||
See accompanying notes to the financial statements.
10
GMO Core Plus Bond Fund
(A Series of GMO Trust)
Statement of Operations — Year Ended February 28, 2009
| Investment Income: | |||||||
| Dividends from affiliated issuers (Note 8) | $ | 12,880,241 | |||||
| Interest | 4,197,059 | ||||||
| Dividends | 107,702 | ||||||
| Total investment income | 17,185,002 | ||||||
| Expenses: | |||||||
| Management fee (Note 3) | 1,769,661 | ||||||
| Shareholder service fee – Class III (Note 3) | 153,490 | ||||||
| Shareholder service fee – Class IV (Note 3) | 605,538 | ||||||
| Custodian, fund accounting agent and transfer agent fees | 331,240 | ||||||
| Audit and tax fees | 81,605 | ||||||
| Legal fees | 35,063 | ||||||
| Trustees fees and related expenses (Note 3) | 15,797 | ||||||
| Registration fees | 1,380 | ||||||
| Miscellaneous | 9,751 | ||||||
| Total expenses | 3,003,525 | ||||||
| Fees and expenses reimbursed by Manager (Note 3) | (436,056 | ) | |||||
| Expense reductions (Note 2) | (165 | ) | |||||
| Indirectly incurred fees waived or borne by Manager (Note 3) | (94,529 | ) | |||||
| Shareholder service fee waived (Note 3) | (22,305 | ) | |||||
| Net expenses | 2,450,470 | ||||||
| Net investment income (loss) | 14,734,532 | ||||||
| Realized and unrealized gain (loss): | |||||||
| Net realized gain (loss) on: | |||||||
| Investments in unaffiliated issuers | 1,078,227 | ||||||
| Investments in affiliated issuers | (80,421,086 | ) | |||||
| Realized gains distributions from affiliated issuers (Note 8) | 753,610 | ||||||
| Closed futures contracts | (2,302,070 | ) | |||||
| Closed swap contracts | (17,888,081 | ) | |||||
| Written options | (2,242,470 | ) | |||||
| Foreign currency, forward contracts and foreign currency related transactions | (8,254,415 | ) | |||||
| Net realized gain (loss) | (109,276,285 | ) | |||||
| Change in net unrealized appreciation (depreciation) on: | |||||||
| Investments in unaffiliated issuers | (6,218,091 | ) | |||||
| Investments in affiliated issuers | (9,108,148 | ) | |||||
| Open futures contracts | (526,001 | ) | |||||
| Open swap contracts | (2,731,519 | ) | |||||
| Foreign currency, forward contracts and foreign currency related transactions | (3,685,506 | ) | |||||
| Net unrealized gain (loss) | (22,269,265 | ) | |||||
| Net realized and unrealized gain (loss) | (131,545,550 | ) | |||||
| Net increase (decrease) in net assets resulting from operations | $ | (116,811,018 | ) | ||||
See accompanying notes to the financial statements.
11
GMO Core Plus Bond Fund
(A Series of GMO Trust)
Statement of Changes in Net Assets
| Year Ended February 28, 2009 | Year Ended February 29, 2008 | ||||||||||
| Increase (decrease) in net assets: | |||||||||||
| Operations: | |||||||||||
| Net investment income (loss) | $ | 14,734,532 | $ | 50,658,808 | |||||||
| Net realized gain (loss) | (109,276,285 | ) | (7,666,110 | ) | |||||||
| Change in net unrealized appreciation (depreciation) | (22,269,265 | ) | (78,741,185 | ) | |||||||
| Net increase (decrease) in net assets from operations | (116,811,018 | ) | (35,748,487 | ) | |||||||
| Distributions to shareholders from: | |||||||||||
| Net investment income | |||||||||||
| Class III | (16,448,556 | ) | (12,275,863 | ) | |||||||
| Class IV | (65,811,675 | ) | (99,097,283 | ) | |||||||
| Total distributions from net investment income | (82,260,231 | ) | (111,373,146 | ) | |||||||
| Net share transactions (Note 7): | |||||||||||
| Class III | (14,545,995 | ) | (45,249,825 | ) | |||||||
| Class IV | (622,725,935 | ) | (1,033,993,070 | ) | |||||||
| Increase (decrease) in net assets resulting from net share transactions | (637,271,930 | ) | (1,079,242,895 | ) | |||||||
| Redemption fees (Notes 2 and 7): | |||||||||||
| Class III | 109,302 | — | |||||||||
| Class IV | 514,084 | — | |||||||||
| Increase in net assets resulting from redemption fees | 623,386 | — | |||||||||
| Total increase (decrease) in net assets resulting from net share transactions and redemption fees | (636,648,544 | ) | (1,079,242,895 | ) | |||||||
| Total increase (decrease) in net assets | (835,719,793 | ) | (1,226,364,528 | ) | |||||||
| Net assets: | |||||||||||
| Beginning of period | 1,143,298,181 | 2,369,662,709 | |||||||||
| End of period (including accumulated undistributed net investment income of $639,071 and $42,886,045, respectively) | $ | 307,578,388 | $ | 1,143,298,181 | |||||||
See accompanying notes to the financial statements.
12
GMO Core Plus Bond Fund
(A Series of GMO Trust)
Financial Highlights
(For a Class III share outstanding throughout each period)
| Year Ended February 28/29, | |||||||||||||||||||||||
| 2009 | 2008 | 2007 | 2006 | 2005 | |||||||||||||||||||
| Net asset value, beginning of period | $ | 9.42 | $ | 10.49 | $ | 10.32 | $ | 10.35 | $ | 10.40 | |||||||||||||
| Income (loss) from investment operations: | |||||||||||||||||||||||
| Net investment income (loss)(a)† | 0.27 | 0.37 | 0.43 | 0.15 | 0.18 | ||||||||||||||||||
| Net realized and unrealized gain (loss) | (2.08 | ) | (0.63 | ) | 0.27 | 0.17 | 0.24 | ||||||||||||||||
| Total from investment operations | (1.81 | ) | (0.26 | ) | 0.70 | 0.32 | 0.42 | ||||||||||||||||
| Less distributions to shareholders: | |||||||||||||||||||||||
| From net investment income | (1.53 | ) | (0.81 | ) | (0.53 | ) | (0.35 | ) | (0.25 | ) | |||||||||||||
| From net realized gains | — | — | — | — | (0.22 | ) | |||||||||||||||||
| Total distributions | (1.53 | ) | (0.81 | ) | (0.53 | ) | (0.35 | ) | (0.47 | ) | |||||||||||||
| Net asset value, end of period | $ | 6.08 | $ | 9.42 | $ | 10.49 | $ | 10.32 | $ | 10.35 | |||||||||||||
| Total Return(b) | (20.12 | )% | (2.56 | )% | 6.85 | % | 3.10 | % | 4.01 | % | |||||||||||||
| Ratios/Supplemental Data: | |||||||||||||||||||||||
| Net assets, end of period (000's) | $ | 73,730 | $ | 125,506 | $ | 187,045 | $ | 148,476 | $ | 1,216,251 | |||||||||||||
| Net expenses to average daily net assets(c) | 0.39 | %(d) | 0.39 | %(d) | 0.39 | % | 0.39 | % | 0.39 | % | |||||||||||||
| Net investment income to average daily net assets(a) | 3.20 | % | 3.70 | % | 4.11 | % | 1.40 | % | 1.77 | % | |||||||||||||
| Portfolio turnover rate | 22 | % | 44 | % | 72 | % | 62 | % | 108 | % | |||||||||||||
| Fees and expenses reimbursed and/or waived by the Manager to average daily net assets: | 0.08 | % | 0.06 | % | 0.06 | % | 0.06 | % | 0.07 | % | |||||||||||||
| Redemption fees consisted of the following per share amounts:† | $ | 0.01 | — | — | — | — | |||||||||||||||||
(a) Net investment income is affected by the timing of the declaration of dividends by the underlying funds in which the Fund invests.
(b) The total returns would have been lower had certain expenses not been reimbursed and/or waived during the periods shown and assumes the effect of reinvested distributions. Calculation excludes redemption fees which are borne by the shareholder.
(c) Net expenses exclude expenses incurred indirectly through investment in the underlying funds (See Note 3).
(d) The net expense ratio does not include the effect of expense reductions.
† Calculated using average shares outstanding throughout the period.
See accompanying notes to the financial statements.
13
GMO Core Plus Bond Fund
(A Series of GMO Trust)
Financial Highlights
(For a Class IV share outstanding throughout each period)
| Year Ended February 28/29, | |||||||||||||||||||
| 2009 | 2008 | 2007 | 2006(a) | ||||||||||||||||
| Net asset value, beginning of period | $ | 9.44 | $ | 10.50 | $ | 10.33 | $ | 10.46 | |||||||||||
| Income (loss) from investment operations: | |||||||||||||||||||
| Net investment income (loss)(b)† | 0.17 | 0.36 | 0.45 | 0.23 | |||||||||||||||
| Net realized and unrealized gain (loss) | (1.99 | ) | (0.61 | ) | 0.26 | (0.01 | )(c) | ||||||||||||
| Total from investment operations | (1.82 | ) | (0.25 | ) | 0.71 | 0.22 | |||||||||||||
| Less distributions to shareholders: | |||||||||||||||||||
| From net investment income | (1.53 | ) | (0.81 | ) | (0.54 | ) | (0.35 | ) | |||||||||||
| Total distributions | (1.53 | ) | (0.81 | ) | (0.54 | ) | (0.35 | ) | |||||||||||
| Net asset value, end of period | $ | 6.09 | $ | 9.44 | $ | 10.50 | $ | 10.33 | |||||||||||
| Total Return(d) | (20.23 | )% | (2.42 | )% | 6.90 | % | 2.06 | %** | |||||||||||
| Ratios/Supplemental Data: | |||||||||||||||||||
| Net assets, end of period (000's) | $ | 233,848 | $ | 1,017,792 | $ | 2,182,618 | $ | 2,618,011 | |||||||||||
| Net expenses to average daily net assets(e) | 0.34 | %(f) | 0.34 | %(f) | 0.34 | % | 0.34 | %* | |||||||||||
| Net investment income to average daily net assets(b) | 1.89 | % | 3.60 | % | 4.33 | % | 2.16 | %(g) | |||||||||||
| Portfolio turnover rate | 22 | % | 44 | % | 72 | % | 62 | %†† | |||||||||||
| Fees and expenses reimbursed and/or waived by the Manager to average daily net assets: | 0.08 | % | 0.06 | % | 0.06 | % | 0.07 | %* | |||||||||||
| Redemption fees consisted of the following per share amounts:† | $ | 0.01 | — | — | — | ||||||||||||||
(a) Period from July 26, 2005 (commencement of operations) through February 28, 2006.
(b) Net investment income is affected by the timing of the declaration of dividends by the underlying funds in which the Fund invests.
(c) The per share amount is not in accord with the net realized and unrealized gain (loss) on investments for the period because of the timing of sales of Fund shares and the amount of the per share realized and unrealized gains and losses at such time.
(d) The total returns would have been lower had certain expenses not been reimbursed and/or waived during the periods shown and assumes the effect of reinvested distributions. Calculation excludes redemption fees which are borne by the shareholder.
(e) Net expenses exclude expenses incurred indirectly through investment in the underlying funds (See Note 3).
(f) The net expense ratio does not include the effect of expense reductions.
(g) The ratio for the period ended February 28, 2006 has not been annualized since the Fund believes it would not be appropriate because the Fund's net income is not earned ratably throughout the fiscal year.
† Calculated using average shares outstanding throughout the period.
†† Calculation represents portfolio turnover of the Fund for the year ended February 28, 2006.
* Annualized.
** Not annualized.
See accompanying notes to the financial statements.
14
GMO Core Plus Bond Fund
(A Series of GMO Trust)
Notes to Financial Statements
February 28, 2009
1. Organization
GMO Core Plus Bond Fund (the "Fund") is a series of GMO Trust (the "Trust"). The Fund is registered under the Investment Company Act of 1940, as amended, as an open-end, non-diversified management investment company. The Fund is advised and managed by Grantham, Mayo, Van Otterloo & Co. LLC (the "Manager" or "GMO"). The Trust was established as a Massachusetts business trust under the laws of The Commonwealth of Massachusetts on June 24, 1985. The Declaration of Trust permits the Trustees of the Trust ("Trustees") to create an unlimited number of series of shares ("Funds") and to subdivide Funds into classes.
The Fund seeks total return in excess of that of the Barclays Capital U.S. Aggregate Index (formerly Lehman Brothers U.S. Aggregate Index). The Fund typically invests in bonds included in the Barclays Capital U.S. Aggregate Index and in securities and instruments with similar characteristics. The Fund seeks additional returns by seeking to exploit differences in global interest rates and currency and emerging country debt markets. The Fund may invest a substantial portion of its total assets in shares of GMO Short-Duration Collateral Fund; in futures contracts, currency options, currency forwards, swap contracts, and other types of derivatives; in U.S. and foreign investment-grade bonds, including U.S. and foreign government securities and asset-backed securities issued by U.S. government agencies (including securities neither guaranteed nor insured by the U.S. government) and foreign governments, corporate bonds, and mortgage-b acked and other asset-backed securities issued by private issuers; to a significant extent in credit default swaps; in shares of GMO World Opportunity Overlay Fund; and up to 5% of the Fund's total assets in sovereign debt of emerging countries (including below investment grade securities (also known as "junk bonds")), primarily through investment in shares of GMO Emerging Country Debt Fund ("ECDF").
Throughout the year ended February 28, 2009, the Fund had two classes of shares outstanding: Class III and Class IV. Each class of shares bears a different level of shareholder service fees.
The financial statements of the series of the Trust in which the Fund invests ("underlying funds") should be read in conjunction with the Fund's financial statements. These financial statements are available, without charge, upon request by calling (617) 346-7646 (collect). Shares of GMO Short-Duration Collateral Fund, GMO World Opportunity Overlay Fund and GMO Special Purpose Holding Fund are not publicly available for direct purchase.
The Fund directly and indirectly (through underlying funds) invests in securities with contractual cash flows, such as collateralized mortgage obligations and commercial mortgage-backed securities, including securities backed by sub-prime mortgage loans, credit card receivables and auto loan receivables. The value, liquidity and related income of these securities are sensitive to changes in economic conditions, including real estate values, delinquencies and/or defaults, and may be adversely affected by changes in interest rates and shifts in the market's perception of the securities' market values.
15
GMO Core Plus Bond Fund
(A Series of GMO Trust)
Notes to Financial Statements — (Continued)
February 28, 2009
The Fund will, if deemed prudent by the Manager, take temporary defensive measures (until the Manager has determined that normal conditions have returned or that it is otherwise prudent to resume investing in accordance with the Fund's normal investment strategies) and may not achieve its investment objectives during those periods. Recent changes in the credit markets have reduced the liquidity of all types of fixed income securities, including asset-backed securities.
2. Significant accounting policies
The following is a summary of significant accounting policies followed by the Fund in the preparation of its financial statements. These policies are in conformity with accounting principles generally accepted in the United States of America ("U.S. GAAP") and have been consistently followed by the Fund in preparing its financial statements. The preparation of financial statements in accordance with U.S. GAAP requires management to make estimates and assumptions that affect the reported amounts and disclosures in the financial statements. Actual results could differ from those estimates. The accounting records of the Fund are maintained in U.S. dollars.
Portfolio valuation
Securities listed on a securities exchange for which market quotations are readily available are valued at the last sale price or official closing price on each business day, or if there is no such reported sale or official closing price, at the most recent quoted bid price. Unlisted securities for which market quotations are readily available are generally valued at the most recent quoted bid price. Debt instruments with a remaining maturity of sixty days or less are generally valued at amortized cost, which approximates fair value. Shares of investment funds are generally valued at their net asset value. Securities for which quotations are not readily available or whose values the Manager has determined to be unreliable are valued at fair value as determined in good faith by the Trustees or persons acting at their direction pursuant to procedures approved by the Trustees. By its nature, a fair value price is a good faith estim ate of the value of a security at a given point in time and may not reflect the value that would be realized if the security were sold. The difference between a fair value price and the value realized upon a sale could be material.
Typically the Fund and the underlying funds value debt instruments based on prices supplied by a primary pricing source chosen by the Manager. The Manager evaluates primary pricing sources on an ongoing basis and may change a pricing source should the Manager deem it appropriate. If it deems appropriate, the Manager, at its discretion, may override a price supplied by a primary source by using a price provided by another source. The prices provided by primary pricing sources may differ from the value that would be realized if the securities were sold, and the differences could be material.
Certain securities held by the Fund are valued on the basis of prices provided by a single source. As of February 28, 2009, the total value of these securities represented 26.41% of the net assets. The single source prices provided may differ from the value that would be realized if the securities were sold, and the differences could be material. In addition, although alternative prices are available for other securities held by the Fund, those alternative sources would not necessarily confirm the security price used by the Fund.
16
GMO Core Plus Bond Fund
(A Series of GMO Trust)
Notes to Financial Statements — (Continued)
February 28, 2009
Therefore, the existence of those alternative sources does not necessarily provide greater certainty about the prices used by the Fund.
GMO Special Purpose Holding Fund ("SPHF"), an investment of the Fund, has litigation pending against various entities related to the default of certain asset-backed securities previously held by SPHF. The outcome of the lawsuits against the remaining defendants is not known and any potential recoveries are not reflected in the net asset value of SPHF. For the year ended February 28, 2009, the Fund received $212,552 through SPHF in connection with settlement agreements related to that litigation.
In September 2006, the Financial Accounting Standards Board ("FASB") issued Statement of Financial Accounting Standards No. 157, Fair Value Measurements ("SFAS 157"). SFAS 157 is effective for the Fund's current fiscal year. While the adoption of SFAS 157 does not have an effect on the Fund's net asset value, it does require additional disclosures about fair value measurements. SFAS 157 establishes a three-level hierarchy for disclosure of fair value measurements. The valuation hierarchy is based upon the reliability of inputs to the valuation of the Fund's investments. The three levels are defined as follows:
Level 1 – Valuations based on quoted prices for identical securities in active markets.
Level 2 – Valuations determined using other significant direct or indirect observable inputs.
Level 3 – Valuations based on inputs that are unobservable and significant. The Fund utilized the following fair value techniques on Level 3 investments: The Fund valued certain debt securities using indicative bids received from primary pricing sources. In addition, the Fund valued certain debt securities and preferred stocks using a specified spread above the LIBOR rate or U.S. Treasury yield. The Fund also valued certain credit default swaps using industry standard models and inputs from pricing vendors. The Fund considered certain bankrupt securities to be worthless.
The inputs or methodology used for valuing securities are not necessarily an indication of the risk associated with investing in those securities.
The following is a summary of the fair valuations according to inputs used as of February 28, 2009 in valuing the Fund's investments:
| Asset Valuation Inputs | Investments in Securities | Other Financial Instruments* | |||||||||
| Level 1 - Quoted Prices | $ | 9,619,580 | $ | 34,695 | |||||||
| Level 2 - Other Significant Observable Inputs | 254,774,147 | — | |||||||||
| Level 3 - Significant Unobservable Inputs | 54,853,194 | — | |||||||||
| Total | $ | 319,246,921 | $ | 34,695 | |||||||
* Other financial instruments include futures contracts.
17
GMO Core Plus Bond Fund
(A Series of GMO Trust)
Notes to Financial Statements — (Continued)
February 28, 2009
| Liability Valuation Inputs | Investments in Securities | Other Financial Instruments** | |||||||||
| Level 1 - Quoted Prices | $ | — | $ | (326,193 | ) | ||||||
| Level 2 - Other Significant Observable Inputs | — | (13,846,588 | ) | ||||||||
| Level 3 - Significant Unobservable Inputs | — | (2,225,744 | ) | ||||||||
| Total | $ | — | $ | (16,398,525 | ) | ||||||
** Other financial instruments include futures contracts and swap agreements.
For the underlying fund's summary of valuation inputs please refer to the respective fund's portfolio valuation note.
The following is a reconciliation of investments in which significant unobservable inputs (Level 3) were used in determining value:
| Investments in Securities | Other Financial Instruments*** | ||||||||||
| Balance as of February 29, 2008 | $ | 33,957,631 | $ | — | |||||||
| Accrued discounts/premiums | 2,355,287 | — | |||||||||
| Realized gain (loss) | 100,157 | — | |||||||||
| Realized gain distributions received | 162,394 | — | |||||||||
| Realized gain distributions paid | (212,552 | ) | — | ||||||||
| Change in unrealized appreciation/depreciation | (3,857,035 | ) | (1,119,082 | ) | |||||||
| Net purchases (sales) | 20,802,815 | — | |||||||||
| Net transfers in and/or out of Level 3 | 1,544,497 | (1,106,662 | ) | ||||||||
| Balance as of February 28, 2009 | $ | 54,853,194 | $ | (2,225,744 | ) | ||||||
*** Other financial instruments include swap agreements.
Foreign currency translation
The market values of foreign securities, currency holdings and related assets and liabilities are translated to U.S. dollars based on the 4 p.m. New York time exchange rates each business day. Income and expenses denominated in foreign currencies are translated at the 4 p.m. New York time exchange rates on the business day the income and expenses are accrued or incurred. The Fund does not isolate realized and unrealized gains and losses attributable to changes in exchange rates from gains and losses that arise from changes in the market value of investments. Such fluctuations are included with net realized and unrealized gain or loss on investments. Net realized gains and losses on foreign currency transactions represent gains and losses on disposition of currencies and forward currency contracts, currency gains and losses realized between the trade and settlement dates on securities transactions, and the difference between the amount of investment income and foreign withholding taxes recorded on the Fund's accounting records and the U.S. dollar equivalent amounts actually received or paid.
18
GMO Core Plus Bond Fund
(A Series of GMO Trust)
Notes to Financial Statements — (Continued)
February 28, 2009
Forward currency contracts
The Fund may enter into forward currency contracts including forward cross currency contracts. A forward currency contract is an agreement between two parties to buy and sell a currency at a set price on a future date. The market value of a forward currency contract fluctuates with changes in forward currency exchange rates. Forward currency contracts are marked to market daily using rates supplied by a quotation service and changes in value are recorded by the Fund as an unrealized gain or loss. Realized gains or losses equal to the difference between the value of the contract at the time it was opened and the value at the time it was closed are recorded upon delivery or receipt of the currency or, if a forward currency contract is offset by entering into another forward currency contract with the same broker, upon settlement of the net gain or loss. These contracts may involve market risk in excess of the unrealized gain or lo ss reflected in the Fund's Statement of Assets and Liabilities. They expose the Fund to the risk of unfavorable movements in currency values and the risk that the counterparty will be unable or unwilling to meet the terms of the contracts. The Fund had no forward currency contracts outstanding at the end of the period.
Futures contracts
The Fund may purchase and sell futures contracts. Upon entering into a futures contract, the Fund is required to deposit cash, U.S. government and agency obligations, or other liquid assets with the futures clearing broker in accordance with the initial margin requirements of the broker or exchange. In addition, the Fund maintains cash or securities in an amount that at least equals the net amount payable in the event the Fund must deliver the full amount of the contract. Futures contracts are marked to market daily and an appropriate payable or receivable for the change in value ("variation margin") is recorded by the Fund. The payable or receivable is settled on the following business day. Gains or losses are recognized but not considered realized until the contracts expire or are closed. Futures contracts involve, to varying degrees, risk of loss in excess of the variation margin disclosed in the Statement of Assets and Liabi lities. Under some circumstances, futures exchanges may establish daily limits on the amount that the price of a futures contract can vary from the previous day's settlement price, thereby effectively preventing liquidation of unfavorable positions. Losses may arise from changes in the value of the underlying instrument if the Fund is unable to liquidate a futures position due to an illiquid secondary market for the contract or the imposition of price limits, or if counterparties do not perform under the contract terms. Futures contracts are generally valued at the settlement price established each day by the board of trade or exchange on which they are traded. Futures contracts outstanding at the end of the period are listed in the Fund's Schedule of Investments.
Options
The Fund may write (i.e., sell) call and put options. Writing options alters the Fund's exposure to the underlying instrument by, in the case of a call option, obligating the Fund to sell the underlying instrument at a set price to the option-holder and, in the case of a put option, obligating the Fund to purchase the underlying instrument at a set price from the option-holder. In the case of an index option, settlement will be in cash. When the Fund writes a call or put option, an amount equal to the premium received is recorded as a liability and subsequently marked to market to reflect the current value of the option written.
19
GMO Core Plus Bond Fund
(A Series of GMO Trust)
Notes to Financial Statements — (Continued)
February 28, 2009
Premiums received from writing options that expire are treated as realized gains. Premiums received from writing options that are exercised or closed are deducted from the amounts paid on the underlying future, security or currency transaction to determine the realized gain or loss. The Fund as a writer of an option has no control over whether the underlying future, security or currency may be sold (call) or purchased (put) and as a result bears the market risk of an unfavorable change in the price of the future, security or currency underlying the option. In the event that the Fund writes uncovered put or call options (i.e. options for investments that the Fund does not own), it bears the risk of substantial losses if the price of the underlying instrument increases during the term of the option. Options expose the Fund to the risk the Fund may not be able to enter into a closing transaction because of an illiquid market. The F und had no written option contracts outstanding at the end of the period.
For the year ended February 28, 2009, the Fund's investment activity in written options contracts was as follows:
| Puts | Calls | ||||||||||||||||||
| Principal Amount of Contracts | Premiums | Principal Amount of Contracts | Premiums | ||||||||||||||||
| Outstanding, beginning of year | $ | — | $ | — | — | $ | — | ||||||||||||
| Options written | — | — | JPY | (9,302,000,000 | ) | (870,449 | ) | ||||||||||||
| Options exercised | — | — | JPY | 9,302,000,000 | 870,449 | ||||||||||||||
| Options expired | — | — | — | — | |||||||||||||||
| Options sold | — | — | — | — | |||||||||||||||
| Outstanding, end of year | $ | — | $ | — | — | $ | — | ||||||||||||
The Fund may also purchase put and call options. Purchasing options alters the Fund's exposure to the underlying instrument by, in the case of a call option, entitling the Fund to purchase the underlying instrument at a set price from the writer of the option and, in the case of a put option, entitling the Fund to sell the underlying instrument at a set price to the writer of the option. The Fund pays a premium for a purchased option. That premium is disclosed in the Schedule of Investments and is subsequently marked to market to reflect the current value of the option. Premiums paid for purchasing options that expire are treated as realized losses. Premiums paid for purchasing options that are exercised or closed are deducted from the proceeds on the closing transaction to determine the realized gain or loss. The risk associated with purchasing put and call options is limited to the premium paid. The Fund had no purchased optio n contracts outstanding at the end of the period.
The Fund values exchange traded options at the last sale price, or if no sale is reported, the last bid price for options it has purchased and the last ask price for options it has written. The Fund values options traded over-the-counter using inputs provided by primary pricing sources and industry standard models.
20
GMO Core Plus Bond Fund
(A Series of GMO Trust)
Notes to Financial Statements — (Continued)
February 28, 2009
Indexed securities
The Fund may invest in indexed securities. Indexed securities are securities whose redemption values and/or coupons are linked to the prices of a specific instrument or financial statistic. The Fund uses indexed securities to increase or decrease its exposure to different underlying instruments and to gain exposure to markets in which investing through conventional securities is difficult. Indexed securities held by the Fund at the end of the period are listed in the Fund's Schedule of Investments.
Swap agreements
The Fund may enter into various types of swap agreements, including without limitation, interest rate, total return, credit default and variance swap agreements. A swap agreement is an agreement to exchange the return generated by one instrument for the return generated by another instrument. When entering into a swap agreement, the Fund and/or the swap counterparty may post or receive cash or securities as collateral. The party posting the collateral typically receives the interest associated with or payments related to the collateral and has the risk of loss related to the collateral.
Interest rate swap agreements involve an exchange by the parties of their respective commitments to pay or right to receive interest, e.g., an exchange of floating rate interest payments for fixed rate interest payments with respect to the notional amount of principal.
Total return swap agreements involve a commitment by one party to pay interest to the other party in exchange for a payment to it from the other party based on the return of a reference instrument (e.g., a security or basket of securities), both based on notional amounts. To the extent the return of the reference instrument exceeds or falls short of the interest payments, one party will receive a payment from or make a payment to the other party.
In a credit default swap agreement, one party makes payments to another party in exchange for the right to receive a specified return if a credit event occurs with respect to a referenced entity or entities. Buying credit default protection reduces the buyer's exposure in the event of an issuer's default (e.g., it reduces risk where a party owns a security issued by or otherwise has exposure to the issuer). Selling credit default protection subjects the seller to exposure to an issuer's default. A seller of credit default protection receives payments in return for its obligation to pay the principal amount of a debt security (or other agreed-upon value) to the other party upon the occurrence of a credit event (e.g., issuer default or similar event). If no credit event occurs, the seller has no payment obligations. For credit default swap agreements on asset-backed securities, a credit event may be triggered by such events as the issuer's failure to pay interest or principal, an agreement of the holders of an asset-backed security to a maturity extension, a rating downgrade on the security or a write-down on the collateral underlying the security. For credit default swap agreements on corporate or sovereign issuers, a credit event may be triggered by such events as the issuer's bankruptcy, failure to pay interest or principal, repudiation/moratorium or restructuring.
21
GMO Core Plus Bond Fund
(A Series of GMO Trust)
Notes to Financial Statements — (Continued)
February 28, 2009
Variance swap agreements involve an agreement by two parties to exchange cash flows based on the measured variance (or square of volatility) of a specified underlying asset. One party agrees to exchange a "fixed rate" or strike price payment for the "floating rate" or realized price variance on the underlying asset with respect to the notional amount. At inception, the strike price chosen is generally fixed at a level such that the fair value of the swap is zero. At the expiration date, the amount paid by one party to the other is the difference between the realized price variance of the underlying asset and the strike price multiplied by the notional amount. A receiver of the realized price variance would receive a payment when the realized price variance of the underlying asset is greater than the strike price and would make a payment when that variance is less than the strike price. A payer of the realized price variance woul d make a payment when the realized price variance of the underlying asset is greater than the strike price and would receive a payment when that variance is less than the strike price. This type of agreement is essentially a forward contract on the future realized price variance of the underlying asset.
The Fund prices its swap agreements daily using models that may incorporate quotations from market makers and records the change in value, if any, as unrealized gain or loss in the Statement of Operations. Payments received or made on swap agreements are recorded as realized gain or loss in the Statement of Operations. Gains or losses are realized upon termination of the swap agreements.
Swap agreements often are not actively traded on financial markets. The values assigned to them may differ significantly from the values that would be realized upon termination, and the differences could be material. Entering into swap agreements involves credit, legal, market and documentation risk that is not reflected in the amounts reported in the Statement of Assets and Liabilities. Such risks include the possibility that the party with whom the Fund contracts may default on its obligations to perform or disagree as to the meaning of contractual terms, or that the collateral that party posts may be insufficient or not timely received by the Fund. Credit risk may be particularly acute in an environment where financial services firms are exposed to systemic risks of the type evidenced by the insolvency of Lehman Brothers and subsequent market disruptions. Swap agreements outstanding at the end of the period are listed in the Fund's Schedule of Investments.
Repurchase agreements
The Fund may enter into repurchase agreements. Under a repurchase agreement the Fund acquires a security for cash and obtains a simultaneous commitment from the seller to repurchase the security at an agreed upon price and date. The Fund, through its custodian, takes possession of securities collateralizing the repurchase agreement. The collateral is marked to market daily to ensure that the market value of the underlying assets is at least equal to the amount owed to the Fund in the event of default by the seller. If the seller of a repurchase agreement defaults or enters into insolvency proceedings and the value of the collateral declines, the Fund's recovery of cash may be delayed or limited. The Fund had no repurchase agreements outstanding at the end of the period.
22
GMO Core Plus Bond Fund
(A Series of GMO Trust)
Notes to Financial Statements — (Continued)
February 28, 2009
Reverse repurchase agreements
The Fund may enter into reverse repurchase agreements. Under a reverse repurchase agreement the Fund sells portfolio assets subject to an agreement by the Fund to repurchase the same assets at a later date at a fixed price. In connection with these agreements, the Fund establishes segregated accounts with its custodian in which the Fund maintains cash, U.S. government securities or other assets equal in value to its obligations under the reverse repurchase agreement into which it has entered. Reverse repurchase agreements expose the Fund to the risk that the market value of the securities the Fund has sold under the agreement may decline below the price at which the Fund is obligated to repurchase them under the agreement. If the buyer in a reverse repurchase agreement files for bankruptcy or becomes insolvent, the Fund's use of proceeds from the sale of its securities may be restricted while the other party or its trustee or re ceiver determines whether to honor the Fund's right to repurchase the securities. Furthermore, in that situation the Fund may be unable to recover the securities it sold and as a result would realize a loss equal to the difference between the value of the securities and the payment it received for them. This loss would be greater to the extent the buyer paid less than the value of the securities the Fund sold to it (e.g., a buyer may pay $95 for a bond with a market value of $100). The market value of the securities the Fund has sold is determined daily and any additional required collateral is allocated to or sent by the Fund on the next business day. The Fund had no reverse repurchase agreements outstanding at the end of the period.
Securities lending
The Fund may lend its securities to qualified brokers. The loans are collateralized with cash or liquid securities with a market value at least equal to the market value of the securities upon entering into the loan. As with other extensions of credit, the Fund may bear the risk of loss with respect to the investment of the collateral, the risk of delay in and/or inability to exercise its rights with respect to the collateral, and the risk of delay in recovery or loss of rights in the loaned securities should the borrower of the securities fail financially. If a loan is collateralized by U.S. government securities, the Fund receives a fee from the borrower. If a loan is collateralized by cash, the Fund typically invests the cash collateral for its own account. For the year from March 1, 2008 through February 28, 2009, the Fund did not participate in securities lending.
Taxes and distributions
The Fund intends to qualify each tax year as a regulated investment company under Subchapter M of the Internal Revenue Code of 1986, as amended (the "Code"). The Fund intends to distribute substantially all of its net investment income and all of its net realized short-term and long-term capital gain, if any, after giving effect to any available capital loss carryforwards for U.S. federal income tax purposes. Therefore, no provision for U.S. federal income or excise tax is necessary.
The Fund's policy is to declare and pay distributions from net investment income, if any, semiannually, and from net realized short-term and long-term capital gain, if any, at least annually. All distributions are paid in shares of the Fund, at net asset value, unless the shareholder elects to receive cash distributions. Distributions to shareholders are recorded by the Fund on the ex-dividend date.
23
GMO Core Plus Bond Fund
(A Series of GMO Trust)
Notes to Financial Statements — (Continued)
February 28, 2009
Income and capital gain distributions are determined in accordance with U.S. federal income tax regulations, which may differ from U.S. GAAP. Certain capital accounts in the financial statements are periodically adjusted for permanent differences in order to reflect their tax character. These adjustments have no impact on net assets or net asset value per share. Temporary differences that arise from recognizing certain items of income, expense, gain or loss in different periods for financial statement and tax purposes will reverse at some time in the future. Distributions in excess of net investment income or net realized gains are temporary over-distributions for financial statement purposes resulting from differences in the recognition or classification of income or distributions for financial statement and tax purposes.
U.S. GAAP and tax accounting differences primarily relate to capital loss carryforwards, losses on wash sale transactions, foreign currency transactions, derivative contract transactions, partnership interest tax allocations, post-October capital losses and differing treatment for security transactions.
The following reclassification represents the amount necessary to report the stated components of net assets on a tax basis, excluding certain temporary differences, as of February 28, 2009. The financial highlights exclude these adjustments.
| Accumulated Undistributed Net Investment Income | Accumulated Net Realized Loss | Paid-in Capital | |||||||||
| $ | 111,050,815 | $ | 3,961,632 | $ | (115,012,447 | ) | |||||
The tax character of distributions declared to shareholders is as follows:
| 2/28/2009 | 2/29/2008 | ||||||||||
| Ordinary income (including any net short-term capital gain) | $ | 82,260,231 | $ | 111,373,146 | |||||||
| Total distributions | $ | 82,260,231 | $ | 111,373,146 | |||||||
Distributions in excess of tax basis earnings and profits, if significant, are reported in the financial statements as a return of capital for tax purposes.
As of February 28, 2009, the components of distributable earnings on a tax basis consisted of the following:
| Undistributed ordinary income (including any net short-term capital gain) | $ | 6,483,643 | |||||
As of February 28, 2009, the Fund elected to defer to March 1, 2009 post-October capital losses of $16,579,574.
24
GMO Core Plus Bond Fund
(A Series of GMO Trust)
Notes to Financial Statements — (Continued)
February 28, 2009
As of February 28, 2009, the Fund had capital loss carryforwards available to offset future realized gains if any, to the extent permitted by the Code. Such losses expire as follows:
| 2/28/2014 | $ | (34,693,380 | ) | ||||
| 2/28/2015 | (2,795,728 | ) | |||||
| 2/29/2016 | (33,008,915 | ) | |||||
| 2/28/2017 | (59,218,431 | ) | |||||
| Total | $ | (129,716,454 | ) | ||||
As of February 28, 2009, the approximate cost for U.S. federal income tax purposes and gross and net unrealized appreciation (depreciation) in value of investments were as follows:
Aggregate Cost | Gross Unrealized Appreciation | Gross Unrealized (Depreciation) | Net Unrealized Appreciation (Depreciation) | ||||||||||||
| $ | 405,611,711 | $ | 3,420,726 | $ | (89,785,516 | ) | $ | (86,364,790 | ) | ||||||
Utilization of the capital loss carryforwards, post-October capital losses and future losses, if any, realized subsequent to February 28, 2009 could be subject to limitations imposed by the Code related to share ownership activity.
The Fund is subject to the provisions of Financial Accounting Standards Board Interpretation No. 48 ("FIN 48"), Accounting for Uncertainty in Income Taxes — an Interpretation of FASB Statement No. 109. FIN 48 sets forth a minimum threshold for financial statement recognition of a tax position taken or expected to be taken in a tax return that could affect the Fund's financial statements. The Fund did not have any unrecognized tax benefits or liabilities at February 28, 2009, nor did it have any increases or decreases in unrecognized tax benefits or liabilities for the period then ended. The Fund is subject to examination prior to the expiration of the statute of limitations by U.S. federal and state tax authorities for tax returns filed.
Security transactions and related investment income
Security transactions in the financial statements are accounted for on the trade date. Dividend income, net of applicable foreign withholding taxes, if any, is recorded on the ex-dividend date or, if later, when the Fund is informed of the ex-dividend date. Interest income is recorded on the accrual basis and is adjusted for the amortization of premiums and accretion of discounts. Principal on inflation indexed securities, is adjusted for inflation and any increase or decrease is recorded as interest income or loss. Income is not recognized on securities for which collection is not expected. Non-cash dividends, if any, are recorded at the fair market value of the asset received. In determining the net gain or loss on securities sold, the Fund uses the identified cost basis for the purposes of determining the cost basis.
25
GMO Core Plus Bond Fund
(A Series of GMO Trust)
Notes to Financial Statements — (Continued)
February 28, 2009
Expenses
The majority of the expenses of the Trust are directly identifiable to an individual fund. Expenses that are not readily identifiable to a specific fund are allocated taking into consideration, among other things, the nature and type of expense and the relative size of the funds. Investment income, common expenses and realized and unrealized gains and losses are allocated pro rata among the classes of shares of the Fund based on the relative net assets of each class. Shareholder service fees, which are directly attributable to a class of shares, are charged to that class's operations. In addition, the Fund incurs fees and expenses indirectly as a shareholder in the underlying funds. Because the underlying funds have different expense and fee levels and the Fund may own different proportions of the underlying funds at different times, the amount of fees and expenses indirectly incurred by the Fund will vary (See Note 3).
State Street Bank and Trust Company ("State Street") serves as custodian, fund accounting agent and transfer agent of the Fund. State Street's fees may be reduced by an earnings allowance calculated on the average daily cash balances the Fund maintains with State Street. The Fund receives the benefit of the earnings allowance. In addition, Goldman Sachs Agency Lending, the Fund's securities lending agent, has agreed to reimburse the Fund for certain transactional expenses related to securities lending activity. Credit balances or expense reimbursements used to reduce fees, if any, are reported as a reduction of expenses in the Statement of Operations.
Purchases and redemptions of Fund shares
Effective October 8, 2008, the Fund instituted a fee on cash redemptions of 0.89% of the amount redeemed. Effective October 21, 2008, the fee on cash redemptions was changed to 2.00% of the amount redeemed. As of February 28, 2009, the fee on cash redemptions was 2.00% of the amount redeemed. The Fund may impose a new purchase premium and/or redemption fee, or modify or eliminate an existing purchase premium and/or redemption fee, at any time. If the Manager determines that any portion of a cash redemption is offset by a corresponding cash purchase on the same day, the Fund will ordinarily waive or reduce the redemption fee with respect to that portion. In addition, the Fund may waive or reduce the redemption fee in extraordinary circumstances if the purchase or redemption will not cause the Fund to incur transaction costs. All redemption fees are paid to the Fund and recorded by the Fund as paid-in-capital. These fees are alloc ated relative to each class's net assets on the share transaction date. In-kind redemption transactions are generally not subject to redemption fees except when they include a cash component. However, when a substantial portion of a Fund is being redeemed, the Fund may charge a redemption fee based on estimated or known transaction costs resulting from those redemptions.
Investment risks
The Fund is subject to risks involved in investing in foreign securities that are not presented by investments in U.S. securities. These risks may involve adverse political and economic developments, including expropriation and the possible imposition of capital controls or other foreign governmental laws or restrictions. In addition, the securities of some foreign companies and securities markets are less liquid and at times may be more volatile than securities of comparable U.S. companies and U.S. securities
26
GMO Core Plus Bond Fund
(A Series of GMO Trust)
Notes to Financial Statements — (Continued)
February 28, 2009
markets. The risks described above apply to an even greater extent to investments in emerging markets. The securities markets of emerging countries are generally smaller, less developed, less liquid, and more volatile than the securities markets of the U.S. and developed foreign markets. Additionally, the investment risks associated with an investment in the underlying funds may be greater to the extent that the underlying funds engage in derivative transactions.
To manage the Fund's cash collateral needs in extraordinary market conditions, the Manager reserves the right to reduce or eliminate the Fund's derivative exposures, including those that are intended to cause the Fund to track its benchmark more closely. A reduction in those exposures without replacing them with benchmark securities will tend to cause the performance of the Fund to track its benchmark less closely and make the Fund's performance more dependent on the performance of the asset-backed securities it holds directly or indirectly.
To address in part the cash management issues described above, the Fund expects to honor nearly all redemptions of its shares in-kind for the foreseeable future. If redeeming shareholders from the Fund choose to sell assets received in-kind immediately and current adverse market conditions continue, they may experience difficulty selling the assets at favorable prices. To the extent that the Fund honors redemptions in cash, redeeming shareholders will bear the redemption fees described in the Purchases and Redemptions of Fund Shares note.
Among other trading agreements, the Fund is party to International Swaps and Derivatives Association, Inc. Master Agreements ("ISDA Agreements") with select counterparties that generally govern over-the-counter derivative transactions entered into by the Fund. The ISDA Master Agreements typically include standard representations and warranties as well as contractual terms related to collateral, events of default, termination events, and other standard provisions. Termination events may include the decline in the net assets of the Fund below a certain level over a specified period of time and may entitle a counterparty to elect to terminate early with respect to some or all the transactions under the ISDA Agreement with that counterparty. Such an election by one or more of the counterparties could have a material impact on the Fund's operations. Due to declines in the net assets of the Fund during the year ended February 28, 2009 , one or more counterparties may be entitled to terminate early but none has taken such action.
Recently issued accounting pronouncement
In March 2008, FASB issued Statement of Financial Accounting Standards No. 161, Disclosures about Derivative Instruments and Hedging Activities ("SFAS 161"). SFAS 161 is effective for fiscal years and interim periods beginning after November 15, 2008. SFAS 161 requires enhanced disclosures about the Fund's derivative and hedging activities. The Manager is currently evaluating the impact the adoption of SFAS 161 will have on the Fund's financial statement disclosures.
27
GMO Core Plus Bond Fund
(A Series of GMO Trust)
Notes to Financial Statements — (Continued)
February 28, 2009
3. Fees and other transactions with affiliates
GMO receives a management fee for the services it provides to the Fund. That fee is paid monthly at the annual rate of 0.25% of average daily net assets. The Fund has adopted a Shareholder Service Plan under which the Fund pays GMO a shareholder service fee for client and shareholder service, reporting, and other support. Pursuant to the Shareholder Service Plan, the shareholder service fee is calculated based on average daily net assets of each class at the annual rate of 0.15% for Class III shares and 0.10% for Class IV shares. The Manager will waive the Fund's shareholder service fee to the extent that the aggregate of any direct and indirect shareholder service fees borne by a class of shares of the Fund exceeds 0.15% for Class III shares and 0.10% for Class IV shares; provided, however, that the amount of this waiver will not exceed the respective Class's shareholder service fee.
Through at least June 30, 2009, the Manager has contractually agreed to reimburse the Fund for Fund expenses incurred through that date to the extent the Fund's total annual operating expenses (excluding "Excluded Expenses", as defined below) exceed 0.25% of the Fund's average daily net assets. Excluded Expenses include shareholder service fees, expenses indirectly incurred by investment in the underlying funds, fees and expenses of the independent Trustees of the Trust, fees and expenses for legal services not approved by the Manager for the Trust, compensation and expenses of the Trust's Chief Compliance Officer ("CCO") (excluding any employee benefits), brokerage commissions, securities lending fees and expenses, interest expense, transfer taxes, and other investment-related costs (including expenses associated with investments in any company that is an investment company or would be an investment company under the 1940 Act, but for the exceptions to the definition of investment company provided in Section 3(c)(1) and 3(c)(7) of the 1940 Act), hedging transaction fees, extraordinary, non-recurring and certain other unusual expenses (including taxes). In addition, the Manager has contractually agreed to reimburse the Fund through at least June 30, 2009 to the extent that the sum of (a) the Fund's total annual operating expenses (excluding Excluded Fund Fees and Expenses) and (b) the amount of fees and expenses incurred indirectly by the Fund through its investment in ECDF (excluding ECDF's fees and expenses of the independent trustees of the Trust, fees for legal services not procured or provided by the Manager for the Trust, compensation and expenses of the Trust's CCO (excluding any employee benefits), and investment-related expenses such as brokerage commissions, hedging transaction fees, securities lending fees and expenses, interest expense and transfer taxes), exceeds 0.25% of the Fund's average daily net assets, subject to a maximum total reimbursement to the Fund equal to 0.25% of the Fund's average daily net assets.
28
GMO Core Plus Bond Fund
(A Series of GMO Trust)
Notes to Financial Statements — (Continued)
February 28, 2009
The Fund incurs fees and expenses indirectly as a shareholder in the underlying funds. For the year ended February 28, 2009, these indirect fees and expenses expressed as an annualized percentage of the Fund's average daily net assets were as follows:
| Indirect Net Expenses (excluding shareholder service fees and interest expense) | Indirect Shareholder Service Fees | Indirect Interest Expense | Total Indirect Expenses | ||||||||||||
| 0.018 | % | 0.003 | % | 0.007 | % | 0.028 | % | ||||||||
The Fund's portion of the fees paid by the Trust to the Trust's independent Trustees and CCO during the year ended February 28, 2009 was $15,337 and $5,067, respectively. The compensation and expenses of the CCO are included in miscellaneous expenses in the Statement of Operations. The Fund paid no remuneration to any other officer of the Trust.
4. Purchases and sales of securities
For the year ended February 28, 2009, cost of purchases and proceeds from sales of investments, other than short-term obligations, were as follows:
| Purchases | Sales | ||||||||||
| U.S. Government securities | $ | 49,231,572 | $ | 45,252,051 | |||||||
| Investments (non-U.S. Government securities) | 104,049,747 | 877,279,607 | |||||||||
5. Guarantees
In the normal course of business the Fund enters into contracts with third-party service providers that contain a variety of representations and warranties and that provide general indemnifications. The Fund's maximum exposure under these arrangements is unknown, as it involves future claims that may be made against the Fund that have not yet occurred. Based on experience, management is of the view that the risk of loss in connection with its indemnification obligations is remote; however, there can be no assurance that such obligations will not result in material liabilities that adversely affect the Fund.
6. Principal shareholders and related parties
As of February 28, 2009, 72.68% of the outstanding shares of the Fund were held by four shareholders, each holding more than 10% of the Fund's outstanding shares. On that date, no other shareholder owned
29
GMO Core Plus Bond Fund
(A Series of GMO Trust)
Notes to Financial Statements — (Continued)
February 28, 2009
more than 10% of the outstanding shares of the Fund. Redemptions from (or investments into) the Fund by or on behalf of these large shareholders may have a material effect on the Fund.
As of February 28, 2009, 0.02% of the Fund's shares were held by senior management of the Manager and GMO Trust officers and 40.80% of the Fund's shares were held by accounts for which the Manager had investment discretion.
7. Share transactions
The Declaration of Trust permits the Trust to issue an unlimited number of shares of beneficial interest (without par value). Transactions in Fund shares were as follows:
| Year Ended February 28, 2009 | Year Ended February 29, 2008 | ||||||||||||||||||
| Class III: | Shares | Amount | Shares | Amount | |||||||||||||||
| Shares sold | 4,083 | $ | 29,086 | 7,093,489 | $ | 73,135,418 | |||||||||||||
| Shares issued to shareholders in reinvestment of distributions | 2,426,853 | 16,389,522 | 1,115,417 | 10,882,545 | |||||||||||||||
| Shares repurchased | (3,624,307 | ) | (30,964,603 | ) | (12,715,568 | ) | (129,267,788 | ) | |||||||||||
| Redemption fees | — | 109,302 | — | — | |||||||||||||||
| Net increase (decrease) | (1,193,371 | ) | $ | (14,436,693 | ) | (4,506,662 | ) | $ | (45,249,825 | ) | |||||||||
| Year Ended February 28, 2009 | Year Ended February 29, 2008 | ||||||||||||||||||
| Class IV: | Shares | Amount | Shares | Amount | |||||||||||||||
| Shares sold | 564,334 | $ | 5,000,000 | 12,016,620 | $ | 125,053,877 | |||||||||||||
| Shares issued to shareholders in reinvestment of distributions | 9,197,631 | 65,811,675 | 10,145,742 | 99,097,283 | |||||||||||||||
| Shares repurchased | (79,246,156 | ) | (693,537,610 | ) | (122,110,610 | ) | (1,258,144,230 | ) | |||||||||||
| Redemption fees | — | 514,084 | — | — | |||||||||||||||
| Net increase (decrease) | (69,484,191 | ) | $ | (622,211,851 | ) | (99,948,248 | ) | $ | (1,033,993,070 | ) | |||||||||
30
GMO Core Plus Bond Fund
(A Series of GMO Trust)
Notes to Financial Statements — (Continued)
February 28, 2009
8. Investments in affiliated issuers
A summary of the Fund's transactions in the shares of other funds of the Trust during the year ended February 28, 2009 is set forth below:
| Affiliate | Value, beginning of period | Purchases | Sales Proceeds | Dividend Income | Distributions of Realized Gains | Value, end of period | |||||||||||||||||||||
| GMO Emerging Country Debt Fund, Class III | $ | — | $ | 9,636,024 | $ | — | $ | — | $ | — | $ | 9,619,580 | |||||||||||||||
| GMO Emerging Country Debt Fund, Class IV | 37,549,507 | 1,731,782 | 30,736,024 | 1,190,723 | 541,058 | ||||||||||||||||||||||
| GMO Short- Duration Collateral Fund | 780,181,577 | 77,330,341 | 643,132,208 | 11,689,518 | u | — | 136,464,740 | ||||||||||||||||||||
| GMO Special Purpose Holding Fund | 118,261 | — | — | — | 212,552 | 68,517 | |||||||||||||||||||||
| GMO World Opportunity Overlay Fund | 232,656,595 | 5,800,000 | 163,200,000 | — | — | 52,729,622 | |||||||||||||||||||||
| Totals | $ | 1,050,505,940 | $ | 94,498,147 | $ | 837,068,232 | $ | 12,880,241 | $ | 753,610 | $ | 198,882,459 | |||||||||||||||
u The Fund received total distributions in the amount of $31,213,684, of which $19,524,166 was a return of capital.
31
Report of Independent Registered Public Accounting Firm
To the Trustees of GMO Trust and the Shareholders of
GMO Core Plus Bond Fund:
In our opinion, the accompanying statement of assets and liabilities, including the schedule of investments, and the related statements of operations and of changes in net assets and the financial highlights present fairly, in all material respects, the financial position of GMO Core Plus Bond Fund (the "Fund") at February 28, 2009, the results of its operations for the year then ended, the changes in its net assets for each of the two years in the period then ended and the financial highlights for the periods indicated, in conformity with accounting principles generally accepted in the United States of America. These financial statements and financial highlights (hereafter referred to as "financial statements") are the responsibility of the Fund's management. Our responsibility is to express an opinion on these financial statements based on our audits. We conducted our audits of these financial statements in accordance with the standards of the Public Company Accounting Oversight Board (United States). Those standards require that we plan and perform the audit to obtain reasonable assurance about whether the financial statements are free of material misstatement. An audit includes examining, on a test basis, evidence supporting the amounts and disclosures in the financial statements, assessing the accounting principles used and significant estimates made by management, and evaluating the overall financial statement presentation. We believe that our audits, which included confirmation of securities at February 28, 2009 by correspondence with the custodian and brokers, provide a reasonable basis for our opinion.
PricewaterhouseCoopers LLP
Boston, Massachusetts
April 29, 2009
32
GMO Core Plus Bond Fund
(A Series of GMO Trust)
Fund Expenses
February 28, 2009 (Unaudited)
Expense Examples: The following information is in relation to expenses for the six month period ended February 28, 2009.
As a shareholder of the Fund, you may incur two types of costs: (1) transaction costs, including redemption fees; and (2) ongoing costs, including management fees, shareholder service fees, and other Fund expenses. This example is intended to help you understand your ongoing costs (in dollars) of investing in the Fund and to compare these costs with the ongoing costs of investing in other mutual funds.
These examples are based on an investment of $1,000 invested at the beginning of the period and held for the entire period, September 1, 2008 through February 28, 2009.
Actual Expenses
The first line of the table below provides information about actual account values and actual expenses. You may use the information in this line, together with the amount you invested, to estimate the expenses that you paid over the period. Simply divide your account value by $1,000 (for example, a $10,000,000 account value divided by $1,000 = 10,000), then multiply the result by the number in the first line under the heading entitled "Net Expense Incurred" to estimate the expenses you paid on your account during this period.
Hypothetical Example for Comparison Purposes
The second line of the table below provides information about hypothetical account values and hypothetical expenses based on the Fund's actual expense ratio and an assumed rate of return of 5% per year before expenses, which is not the Fund's actual return. The hypothetical account values and expenses may not be used to estimate the actual ending account balance or expenses you paid for the period. You may use this information to compare the ongoing costs of investing in the Fund with other funds. To do so, compare this 5% hypothetical example with the 5% hypothetical examples that appear in the shareholder reports of other funds.
Please note that the expenses shown in the table are meant to highlight your ongoing costs only and do not reflect any transactional costs, such as purchase premiums and redemption fees. Therefore, the second line of the table is useful in comparing ongoing costs only, and will not help you determine the relative total costs of owning different funds. In addition, if these transactional costs were included, your costs would have been higher.
| Annualized Expense Ratio | Beginning Account Value | Ending Account Value | Net Expense Incurred* | ||||||||||||||||
| Class III | |||||||||||||||||||
| 1) Actual | 0.43 | % | $ | 1,000.00 | $ | 811.70 | $ | 1.93 | |||||||||||
| 2) Hypothetical | 0.43 | % | $ | 1,000.00 | $ | 1,022.66 | $ | 2.16 | |||||||||||
| Class IV | |||||||||||||||||||
| 1) Actual | 0.37 | % | $ | 1,000.00 | $ | 811.50 | $ | 1.66 | |||||||||||
| 2) Hypothetical | 0.37 | % | $ | 1,000.00 | $ | 1,022.96 | $ | 1.86 | |||||||||||
* Expenses are calculated using each Class's annualized expense ratio (including indirect expenses incurred) for the six months ended February 28, 2009, multiplied by the average account value over the period, multiplied by 181 days in the period, divided by 365 days in the year.
33
GMO Core Plus Bond Fund
(A Series of GMO Trust)
Tax Information for the Tax Year Ended February 28, 2009 (Unaudited)
The Fund will notify shareholders of amounts for use in preparing 2009 income tax forms in early 2010.
The Fund hereby designates as qualified interest income with respect to its taxable year ended February 28, 2009, $13,628,614 or if determined to be different, the qualified interest income of such year.
34
Trustees and Officers (Unaudited)
The following tables list the Trust's Trustees and Officers as of the date of this report; their address and date of birth ("DOB"); their position with the Trust; the length of time holding that position with the Trust; their principal occupation(s) during the past five years; the number of portfolios in the fund complex they oversee; and other directorships they hold in companies subject to registration or reporting requirements of the Securities Exchange Act of 1934 (generally called "public companies") or in registered investment companies. The Trust's Statement of Additional Information ("SAI") includes additional information about the Trust's trustees, including changes subsequent to the date of the report. The SAI is available, without charge, upon request by writing GMO, c/o GMO Trust, 40 Rowes Wharf, Boston, MA 02110.
Independent Trustees:
| Name, Address, and DOB | Position(s) Held with Trust | Term of Office1 and Length of Time Served | Principal Occupation(s) During Past Five Years | Number of Portfolios in Fund Complex Overseen by Trustee | Other Directorships Held by Trustee | ||||||||||||||||||
| Donald W. Glazer, Esq. c/o GMO Trust 40 Rowes Wharf Boston, MA 02110 DOB: 07/26/1944 | Chairman of the Board of Trustees | Chairman of the Board of Trustees since March 2005; Lead Independent Trustee (September 2004 – March 2005); Trustee since December 2000. | Consultant – Law and Business2; Author of Legal Treatises. | 59 | None. | ||||||||||||||||||
1 Each Trustee is elected to serve during the continued lifetime of the Trust until he/she dies, resigns or is removed, or if sooner, until the next meeting of Shareholders called for the purpose of electing Trustees and until the election and qualification of his/her successor.
2 As part of Mr. Glazer's work as a consultant, he provides part-time consulting services to Goodwin Procter LLP ("Goodwin"). Goodwin has provided legal services to Renewable Resources, LLC, an affiliate of GMO; GMO, in connection with its relationship with Renewable Resources; and funds managed by Renewable Resources. Mr. Glazer has represented that he has no financial interest in, and is not involved in the provision of, such legal services. In the calendar years ended December 31, 2007 and December 31, 2008, these entities paid $789,416 and $183,864 respectively, in legal fees and disbursements to Goodwin. In correspondence with the Staff of the Securities and Exchange Commission beginning in August 2006, the Independent Trustees' legal counsel provided the Staff with information regarding Mr. Glazer's relationship with Goodwin and h is other business activities. On September 11, 2007, based on information that had been given to the Staff as of that date, the Staff provided oral no-action assurance consistent with the opinion of the Independent Trustees' legal counsel that Mr. Glazer is not an "interested person" of the Trust.
35
Independent Trustees — (Continued)
| Name, Address, and DOB | Position(s) Held with Trust | Term of Office1 and Length of Time Served | Principal Occupation(s) During Past Five Years | Number of Portfolios in Fund Complex Overseen by Trustee | Other Directorships Held by Trustee | ||||||||||||||||||
| W. Nicholas Thorndike c/o GMO Trust 40 Rowes Wharf Boston, MA 02110 DOB: 03/28/1933 | Trustee | Since March 2005. | Director or trustee of various corporations and charitable organizations, including Courier Corporation (a book publisher and manufacturer) (July 1989 – present); Putnam Funds (December 1992 – June 2004); and Providence Journal (a newspaper publisher) (December 1986 – December 2003). | 59 | Director of Courier Corporation (a book publisher and manufacturer); Member of the Investment Committee of Partners HealthCare System, Inc.3 | ||||||||||||||||||
| Peter Tufano c/o GMO Trust 40 Rowes Wharf Boston, MA 02110 DOB: 04/22/1957 | Trustee | Since December 2008. | Sylvan C. Coleman Professor of Financial Management, Harvard Business School (since 1989). | 59 | Trustee of State Street Navigator Securities Lending Trust (3 Portfolios). | ||||||||||||||||||
1 Each Trustee is elected to serve during the continued lifetime of the Trust until he/she dies, resigns or is removed, or if sooner, until the next meeting of Shareholders called for the purpose of electing Trustees and until the election and qualification of his/her successor.
3 Partners HealthCare System, Inc. is a client of the Manager.
36
Principal Officers:
| Name, Address, and DOB | Position(s) Held with Trust | Term of Office4 and Length of Time Served | Principal Occupation(s) During Past Five Years5 | ||||||||||||
| J.B. Kittredge DOB: 08/22/1954 | President and Chief Executive Officer | Since March 2009. | General Counsel, Grantham, Mayo, Van Otterloo & Co. LLC (October 2005 – Present); Partner, Ropes & Gray LLP. | ||||||||||||
| Sheppard N. Burnett c/o GMO Trust 40 Rowes Wharf Boston, MA 02110 DOB: 10/24/1968 | Treasurer and Chief Financial Officer | Chief Financial Officer since March 2007; Treasurer since November 2006; Assistant Treasurer, September 2004 – November 2006. | Fund Administration Staff, Grantham, Mayo, Van Otterloo & Co. LLC (June 2004 – present); Vice President, Director of Tax, Columbia Management Group (2002 – 2004). | ||||||||||||
| Brent C. Arvidson c/o GMO Trust 40 Rowes Wharf Boston, MA 02110 DOB: 06/26/1969 | Assistant Treasurer | Since August 1998. | Senior Fund Administrator, Grantham, Mayo, Van Otterloo & Co. LLC. | ||||||||||||
| John L. Nasrah c/o GMO Trust 40 Rowes Wharf Boston, MA 02110 DOB: 05/27/1977 | Assistant Treasurer | Since March 2007. | Fund Administrator, Grantham, Mayo, Van Otterloo & Co. LLC (September 2004 – present); Tax Analyst, Bain & Company, Inc. (June 2003 – September 2004). | ||||||||||||
| Mahmoodur Rahman c/o GMO Trust 40 Rowes Wharf Boston, MA 02110 DOB: 11/30/1967 | Assistant Treasurer | Since September 2007. | Fund Administrator, Grantham, Mayo, Van Otterloo & Co. LLC (April 2007 – present); Vice President and Senior Tax Manager, Massachusetts Financial Services Company (January 2000 – April 2007). | ||||||||||||
| Michael E. Gillespie c/o GMO Trust 40 Rowes Wharf Boston, MA 02110 DOB: 02/18/1958 | Chief Compliance Officer | Since March 2005. | Vice President of Compliance (June 2004 – February 2005) and Director of Domestic Compliance (March 2002 – June 2004), Fidelity Investments. | ||||||||||||
4 Each officer is elected to hold such office until his or her successor is duly elected and qualified to carry out the duties and responsibilities of the office, or until he or she resigns or is removed from office.
5 Each of Messrs. Burnett, Arvidson, Bohan, and Pottle serves as an officer and/or director of certain pooled investment vehicles of which GMO or an affiliate of GMO serves as the investment adviser.
37
Principal Officers — (Continued)
| Name, Address, and DOB | Position(s) Held with Trust | Term of Office4 and Length of Time Served | Principal Occupation(s) During Past Five Years5 | ||||||||||||
| Jason B. Harrison c/o GMO Trust 40 Rowes Wharf Boston, MA 02110 DOB: 01/29/1977 | Vice President and Clerk | Vice President since November 2006; Clerk since March 2006. | Legal Counsel, Grantham, Mayo, Van Otterloo & Co. LLC (since February 2006) and Attorney, Ropes & Gray LLP (September 2002 – February 2006). | ||||||||||||
| David L. Bohan c/o GMO Trust 40 Rowes Wharf Boston, MA 02110 DOB: 06/21/1964 | Vice President and Assistant Clerk | Vice President since March 2005; Assistant Clerk since March 2006. | Legal Counsel, Grantham, Mayo, Van Otterloo & Co. LLC. | ||||||||||||
| Gregory L. Pottle c/o GMO Trust 40 Rowes Wharf Boston, MA 02110 DOB: 07/09/1971 | Vice President and Assistant Clerk | Since November 2006. | Legal Counsel, Grantham, Mayo, Van Otterloo & Co. LLC. | ||||||||||||
| Anne K. Trinque c/o GMO Trust 40 Rowes Wharf Boston, MA 02110 DOB: 04/15/1978 | Vice President and Assistant Clerk | Since September 2007. | Legal Counsel, Grantham, Mayo, Van Otterloo & Co. LLC (January 2007 – present); Attorney, Goodwin Procter LLP (September 2003 – January 2007). | ||||||||||||
| Cheryl Wakeham c/o GMO Trust 40 Rowes Wharf Boston, MA 02110 DOB: 10/29/1958 | Vice President and Anti-Money Laundering Officer | Since December 2004. | Manager, Client Service Administration, Grantham, Mayo, Van Otterloo & Co. LLC. | ||||||||||||
4 Each officer is elected to hold such office until his or her successor is duly elected and qualified to carry out the duties and responsibilities of the office, or until he or she resigns or is removed from office.
5 Each of Messrs. Burnett, Arvidson, Bohan, and Pottle serves as an officer and/or director of certain pooled investment vehicles of which GMO or an affiliate of GMO serves as the investment adviser.
38
GMO Global Bond Fund
(A Series of GMO Trust)
Annual Report
February 28, 2009
For a free copy of the Fund's proxy voting guidelines, shareholders may call 1-617-346-7646 (collect) or visit the Securities and Exchange Commission's website at www.sec.gov. Information regarding how the Fund voted proxies relating to portfolio securities during the most recent 12-month period ended June 30 is available on GMO's website at www.gmo.com, or on the Securities and Exchange Commission's website at www.sec.gov.
The Fund files its complete schedule of portfolio holdings with the Securities and Exchange Commission for the first and third quarter of each fiscal year on Form N-Q, which is available on the Commission's website at www.sec.gov. The Fund's Form N-Q may be reviewed and copied at the Commission's Public Reference Room in Washington, D.C. Information on the operation of the Public Reference Room may be obtained by calling 1-800-SEC-0330. The Fund has a policy with respect to disclosure of portfolio holdings under which it may also make available on GMO's website at www.gmo.com a complete schedule of portfolio holdings.
This report is prepared for the general information of shareholders. It is authorized for distribution to prospective investors only when preceded or accompanied by a prospectus for the GMO Trust, which contains a complete discussion of the risks associated with an investment in this Fund and other important information. The GMO Trust prospectus can be obtained at www.gmo.com.
GMO Global Bond Fund
(A Series of GMO Trust)
Portfolio Management
Day-to-day management of the Fund's portfolio is the responsibility of the Fixed Income team at Grantham, Mayo, Van Otterloo & Co. LLC.
Management Discussion and Analysis of Fund Performance
The GMO Global Bond Fund returned -22.8% for the fiscal year ended February 28, 2009, as compared to the -1.9% return for the JPMorgan Global Government Bond Index. The Fund's exposure to various issues is achieved directly and indirectly through its investment in certain underlying GMO mutual funds, primarily in the GMO Emerging Country Debt Fund (ECDF), the GMO World Opportunity Overlay Fund (WOOF), and the GMO Short-Duration Collateral Fund (SDCF).
The Fund underperformed the benchmark during the fiscal year by 20.9%. Exposures to SDCF and WOOF were by far the largest negative contributors during the fiscal year, followed by negative contributions from developed interest-rate strategies, exposure to emerging country debt via ECDF, and currency selection.
Nearly 80% of the fiscal year's underperformance was due to price declines in the two funds in which the Fund invests a substantial portion of its total assets: SDCF and WOOF. These funds primarily invest in asset-backed securities. The positions in SDCF and WOOF collateralize derivatives positions that seek to deliver the return of the benchmark as well as create active exposures in global interest-rate and currency markets.
As the fiscal year was marked by sharply deteriorating liquidity conditions in securitized credit markets, spreads widened to all-time highs in the asset-backed securities held indirectly in the Global Bond Fund via holdings of SDCF and WOOF. Such ABS exposure contributed (17.65%) to the Fund's performance. To increase flexibility, the Fund began holding more cash assets directly. In addition to widening spreads, both SDCF and WOOF's portfolios suffered credit downgrades during the year. SDCF had 123 downgraded securities, and WOOF had 82, representing 27.4% and 25.5% of their respective market values from the beginning of the year. At fiscal year end, 73% of SDCF's portfolio was rated AAA, 8% was rated AA, 2% was rated A, 12% was rated BBB and 5% was rated below BBB. At fiscal year end, 74% of WOOF's portfolio was rated AAA, 6% was rated AA, 2% was rated A, 12% was rated BBB and 6% was rated below BBB.
Further underperformance was attributable to interest-rate and currency strategies. Given the unhealthy market conditions for interest-rates and currencies, characterized by poor liquidity and choppy, gapping prices, the Fund temporarily suspended model-based positions in interest rates and currencies starting in October.
In interest-rate strategies, underperformance of U.S. Treasury principal strips versus LIBOR and other opportunistic trades contributed to developed interest-rate strategy losses. Before model-based interest-rate positions were suspended, Euro-area, U.S., Swedish, and Swiss market positions had contributed positively. Further, the slope and volatility strategies also added value during this time.
GMO Global Bond Fund
(A Series of GMO Trust)
Management Discussion and Analysis of Fund Performance — (Continued)
Currency contribution was concentrated before positions were suspended in October. Negative relative currency performance during this time came mainly from the Fund's Swedish krona, Norwegian krone, New Zealand dollar, and yen positions.
A small exposure to emerging country debt also detracted value as spread widening on the asset class contributed negatively, as did negative contributions from both security and country selection.
The views expressed herein are exclusively those of Grantham, Mayo, Van Otterloo & Co. LLC Management as of the date of this report and are subject to change. GMO disclaims any responsibility to update such views. They are not meant as investment advice. References to specific securities are not recommendations of such securities and may not be representative of any GMO portfolio's current or future investments.

Performance data quoted represents past performance and is not indicative of future results. The investment return and principal value of an investment will fluctuate so that an investor's shares, when redeemed, may be worth more or less than their original cost. Current performance data may be lower or higher than the performance data provided herein. To obtain performance information to the most recent month-end, visit www.gmo.com. Performance shown is net of all fees after reimbursement from the Manager. Each performance figure assumes a redemption at the end of the stated period and reflects a transaction fee of 2.00% on the redemption. Transaction fees are retained by the Fund to cover trading costs. Returns would have been lower had certain expenses not been reimbursed during the periods shown and do not include the effect of taxes on distributions and redem ptions. All information is unaudited.
This page has been left blank intentionally.
GMO Global Bond Fund
(A Series of GMO Trust)
Investments Concentration Summary
February 28, 2009 (Unaudited)
| Asset Class Summary* | % of Total Net Assets | ||||||
| Debt Obligations | 94.0 | % | |||||
| Short-Term Investments | 6.1 | ||||||
| Options Purchased | 1.8 | ||||||
| Loan Participations | 0.2 | ||||||
| Loan Assignments | 0.1 | ||||||
| Rights and Warrants | 0.0 | ||||||
| Promissory Notes | 0.0 | ||||||
| Reverse Repurchase Agreements | (0.0 | ) | |||||
| Futures | (0.0 | ) | |||||
| Written Options | (0.7 | ) | |||||
| Swaps | (1.0 | ) | |||||
| Forward Currency Contracts | (3.4 | ) | |||||
| Other | 2.9 | ||||||
| 100.0 | % | ||||||
| Country / Region Summary** | % of Investments | ||||||
| Japan | 34.7 | % | |||||
| Euro Region*** | 32.7 | ||||||
| United States | 20.5 | ||||||
| United Kingdom | 7.3 | ||||||
| Emerging**** | 3.3 | ||||||
| Canada | 1.7 | ||||||
| Australia | (0.2 | ) | |||||
| 100.0 | % | ||||||
* The table above incorporates aggregate indirect asset class exposure associated with investments in other funds of GMO Trust ("underlying funds").
** The table above incorporates aggregate indirect country exposure associated with investments in the underlying funds. The table excludes short-term investments. The table includes exposure through the use of derivative contracts.
*** The "Euro Region" is comprised of Austria, Belgium, Finland, France, Germany, Greece, Ireland, Italy, Netherlands, Portugal and Spain.
**** The "Emerging" exposure is associated with investments in the GMO Emerging Country Debt Fund, which is exposed to emerging countries primarily comprised of Philippines, Russia, Venezuela, Brazil, Argentina, Colombia, Uruguay, Mexico, Ivory Coast, and Vietnam. Additional information about the fund's emerging country exposure is available in the financial statements of the GMO Emerging Country Debt Fund.
1
GMO Global Bond Fund
(A Series of GMO Trust)
Schedule of Investments
(showing percentage of total net assets)
February 28, 2009
| Par Value | Description | Value ($) | |||||||||
| DEBT OBLIGATIONS — 16.8% | |||||||||||
| Canada — 0.7% | |||||||||||
| Foreign Government Obligations | |||||||||||
| CAD | 1,500,000 | Government of Canada, 8.00%, due 06/01/23 | 1,752,861 | ||||||||
| France — 2.3% | |||||||||||
| Foreign Government Obligations | |||||||||||
| EUR | 5,000,000 | Government of France, 4.00%, due 10/25/38 | 6,187,318 | ||||||||
| Germany — 2.7% | |||||||||||
| Foreign Government Obligations | |||||||||||
| EUR | 5,000,000 | Republic of Deutschland, 4.75%, due 07/04/34 | 7,056,297 | ||||||||
| Japan — 2.9% | |||||||||||
| Foreign Government Obligations | |||||||||||
| JPY | 700,000,000 | Japan Government Twenty Year Bond, 2.20%, due 06/20/26 | 7,540,950 | ||||||||
| United Kingdom — 2.1% | |||||||||||
| Foreign Government Obligations | |||||||||||
| GBP | 4,000,000 | U.K. Treasury Gilt, 4.25%, due 12/07/27 | 5,568,925 | ||||||||
| United States — 6.1% | |||||||||||
| U.S. Government | |||||||||||
| USD | 7,104,768 | U.S. Treasury Inflation Indexed Bond, 0.88%, due 04/15/10 (a) (b) | 7,009,294 | ||||||||
| USD | 15,000,000 | U.S. Treasury Principal Strip Bond, due 11/15/21 | 8,864,445 | ||||||||
| Total United States | 15,873,739 | ||||||||||
| TOTAL DEBT OBLIGATIONS (COST $47,830,810) | 43,980,090 | ||||||||||
See accompanying notes to the financial statements.
2
GMO Global Bond Fund
(A Series of GMO Trust)
Schedule of Investments — (Continued)
(showing percentage of total net assets)
February 28, 2009
| Shares | Description | Value ($) | |||||||||||||
| MUTUAL FUNDS — 81.6% | |||||||||||||||
| United States — 81.6% | |||||||||||||||
| Affiliated Issuers | |||||||||||||||
| 1,322,529 | GMO Emerging Country Debt Fund, Class III | 7,736,793 | |||||||||||||
| 9,323,457 | GMO Short-Duration Collateral Fund | 159,431,112 | |||||||||||||
| 45,838 | GMO Special Purpose Holding Fund (c) (d) | 33,462 | |||||||||||||
| 2,522,448 | GMO World Opportunity Overlay Fund | 46,286,913 | |||||||||||||
| Total United States | 213,488,280 | ||||||||||||||
| TOTAL MUTUAL FUNDS (COST $290,221,048) | 213,488,280 | ||||||||||||||
| SHORT-TERM INVESTMENTS — 3.0% | |||||||||||||||
| Money Market Funds — 3.0% | |||||||||||||||
| 7,889,087 | State Street Institutional Treasury Plus Money Market Fund-Institutional Class | 7,889,087 | |||||||||||||
| TOTAL SHORT-TERM INVESTMENTS (COST $7,889,087) | 7,889,087 | ||||||||||||||
| TOTAL INVESTMENTS — 101.4% (Cost $345,940,945) | 265,357,457 | ||||||||||||||
| Other Assets and Liabilities (net) — (1.4%) | (3,651,195 | ) | |||||||||||||
| TOTAL NET ASSETS — 100.0% | $ | 261,706,262 | |||||||||||||
See accompanying notes to the financial statements.
3
GMO Global Bond Fund
(A Series of GMO Trust)
Schedule of Investments — (Continued)
February 28, 2009
A summary of outstanding financial instruments at February 28, 2009 is as follows:
Forward Currency Contracts
| Settlement Date | Deliver/Receive | Units of Currency | Value | Net Unrealized Appreciation (Depreciation) | |||||||||||||||
| Buys | |||||||||||||||||||
| 3/31/09 | AUD | 800,000 | $ | 510,519 | $ | (8,681 | ) | ||||||||||||
| 4/07/09 | CAD | 5,000,000 | 3,930,059 | (184,152 | ) | ||||||||||||||
| 3/10/09 | EUR | 60,000,000 | 76,061,482 | (6,342,518 | ) | ||||||||||||||
| 4/14/09 | GBP | 4,500,000 | 6,441,483 | (155,517 | ) | ||||||||||||||
| 3/17/09 | JPY | 5,433,700,000 | 55,689,692 | (3,904,728 | ) | ||||||||||||||
| $ | 142,633,235 | $ | (10,595,596 | ) | |||||||||||||||
| Sales | |||||||||||||||||||
| 4/07/09 | CAD | 2,300,000 | $ | 1,807,827 | $ | 49,528 | |||||||||||||
| 3/10/09 | EUR | 10,900,000 | 13,817,836 | 1,427,424 | |||||||||||||||
| $ | 15,625,663 | $ | 1,476,952 | ||||||||||||||||
Forward Cross Currency Contracts
| Settlement Date | Deliver/Units of Currency | Receive/In Exchange For | Net Unrealized Appreciation (Depreciation) | ||||||||||||
| 4/21/09 | EUR | 1,200,000 | SEK | 12,960,000 | $ | (82,149 | ) | ||||||||
Futures Contracts
| Number of Contracts | Type | Expiration Date | Contract Value | Net Unrealized Appreciation (Depreciation) | |||||||||||||||
| Buys | |||||||||||||||||||
| 4 | Australian Government Bond 10 Yr. | March 2009 | $ | 289,155 | $ | (2,263 | ) | ||||||||||||
| 7 | Australian Government Bond 3 Yr. | March 2009 | 482,730 | 1,369 | |||||||||||||||
| 20 | Canadian Government Bond 10 Yr. | June 2009 | 1,947,178 | (16,767 | ) | ||||||||||||||
| 172 | Euro BOBL | March 2009 | 25,466,412 | 219,233 | |||||||||||||||
| 181 | Euro Bund | March 2009 | 28,614,007 | 71,081 | |||||||||||||||
| 300 | Federal Funds 30 day | March 2009 | 124,716,226 | (1,512 | ) | ||||||||||||||
See accompanying notes to the financial statements.
4
GMO Global Bond Fund
(A Series of GMO Trust)
Schedule of Investments — (Continued)
February 28, 2009
Futures Contracts — continued
| Number of Contracts | Type | Expiration Date | Contract Value | Net Unrealized Appreciation (Depreciation) | |||||||||||||||
| 51 | Japanese Government Bond 10 Yr. (TSE) | March 2009 | $ | 72,898,203 | $ | 47,840 | |||||||||||||
| 35 | U.S. Long Bond (CBT) | March 2009 | 4,361,328 | (168,808 | ) | ||||||||||||||
| 44 | U.S. Treasury Note 10 Yr. (CBT) | June 2009 | 5,281,375 | (44,820 | ) | ||||||||||||||
| 135 | U.S. Treasury Note 5 Yr. (CBT) | June 2009 | 15,739,102 | (39,428 | ) | ||||||||||||||
| 79 | U.S. Treasury Note 2 Yr. (CBT) | June 2009 | 17,112,141 | (10,112 | ) | ||||||||||||||
| 37 | UK Gilt Long Bond | June 2009 | 6,314,460 | (86,864 | ) | ||||||||||||||
| $ | 303,222,317 | $ | (31,051 | ) | |||||||||||||||
Swap Agreements
Credit Default Swaps
| Notional Amount | Expiration Date | Counterparty | Receiveu (Pay) | Annual Premium | Implied Credit Spread (1) | Deliverable on Default | Maximum Potential Amount of Future Payments by the Fund Under the Contract (2) | Market Value | |||||||||||||||||||||||||||||||||||
| 21,000,000 | USD | 3/20/2014 | Deutsche Bank | (Pay) | 1.70 | % | 1.86 | % | Republic | N/A | $ | 123,788 | |||||||||||||||||||||||||||||||
| of Italy | |||||||||||||||||||||||||||||||||||||||||||
| 15,000,000 | USD | 3/20/2019 | Deutsche Bank | Receive | 1.66 | % | 1.81 | % | Republic of Italy | 15,000,000 | USD | (154,293 | ) | ||||||||||||||||||||||||||||||
| $ | (30,505 | ) | |||||||||||||||||||||||||||||||||||||||||
| Premiums to (Pay) Receive | $ | — | |||||||||||||||||||||||||||||||||||||||||
u Receive - Fund receives premium and sells credit protection.
(Pay) - Fund pays premium and buys credit protection.
(1) Implied credit spreads, represented in absolute terms, utilized in determining the market value of credit default swap agreements on the reference security, as of February 28, 2009, serve as an indicator of the current status of the payment/performance risk and reflect the likelihood or risk of default for the credit derivative. The implied credit spread of a particular referenced entity reflects the cost of buying/selling protection and may include upfront payments required to be made to enter into the agreement. Wider credit spreads represent a deterioration of the referenced entity's credit soundness and a greater likelihood or risk of default or other credit event occurring as defined under the terms of the agreement.
(2) The maximum potential amount the Fund could be required to make as a seller of credit protection if a credit event occurs as defined under the terms of that particular swap agreement.
See accompanying notes to the financial statements.
5
GMO Global Bond Fund
(A Series of GMO Trust)
Schedule of Investments — (Continued)
February 28, 2009
As of February 28, 2009, for the futures and/or swap contracts held, the Fund had sufficient cash and/or securities to cover any commitments or margin requirements of the relevant broker or exchange.
Notes to Schedule of Investments:
(a) Indexed security in which price and/or coupon is linked to the prices of a specific instrument or financial statistic (Note 2).
(b) All or a portion of this security has been segregated to cover margin requirements on open financial futures contracts and/or collateral on open swap contracts (Note 2).
(c) Underlying investment represents interests in defaulted securities.
(d) Security valued at fair value using methods determined in good faith by or at the direction of the Trustees of GMO Trust (Note 2).
Currency Abbreviations:
AUD - Australian Dollar
CAD - Canadian Dollar
EUR - Euro
GBP - British Pound
JPY - Japanese Yen
SEK - Swedish Krona
USD - United States Dollar
See accompanying notes to the financial statements.
6
GMO Global Bond Fund
(A Series of GMO Trust)
Statement of Assets and Liabilities — February 28, 2009
| Assets: | |||||||
| Investments in unaffiliated issuers, at value (cost $55,719,897) (Note 2) | $ | 51,869,177 | |||||
| Investments in affiliated issuers, at value (cost $290,221,048) (Notes 2 and 8) | 213,488,280 | ||||||
| Cash | 5,294,000 | ||||||
| Dividends and interest receivable | 420,024 | ||||||
| Unrealized appreciation on open forward currency contracts (Note 2) | 1,476,952 | ||||||
| Receivable for variation margin on open futures contracts (Note 2) | 35,123 | ||||||
| Receivable for open swap contracts (Note 2) | 123,788 | ||||||
| Receivable for expenses reimbursed by Manager (Note 3) | 8,985 | ||||||
| Total assets | 272,716,329 | ||||||
| Liabilities: | |||||||
| Payable to affiliate for (Note 3): | |||||||
| Management fee | 38,846 | ||||||
| Shareholder service fee | 30,668 | ||||||
| Trustees and Chief Compliance Officer of GMO Trust fees | 869 | ||||||
| Unrealized depreciation on open forward currency contracts (Note 2) | 10,677,745 | ||||||
| Payable for open swap contracts (Note 2) | 154,293 | ||||||
| Accrued expenses | 107,646 | ||||||
| Total liabilities | 11,010,067 | ||||||
| Net assets | $ | 261,706,262 | |||||
| Net assets consist of: | |||||||
| Paid-in capital | $ | 370,428,961 | |||||
| Accumulated undistributed net investment income | (406,766 | ) | |||||
| Accumulated net realized loss | (18,436,172 | ) | |||||
| Net unrealized depreciation | (89,879,761 | ) | |||||
| $ | 261,706,262 | ||||||
| Net assets attributable to: | |||||||
| Class III shares | $ | 261,706,262 | |||||
| Shares outstanding: | |||||||
| Class III | 41,336,295 | ||||||
| Net asset value per share: | |||||||
| Class III | $ | 6.33 | |||||
See accompanying notes to the financial statements.
7
GMO Global Bond Fund
(A Series of GMO Trust)
Statement of Operations — Year Ended February 28, 2009
| Investment Income: | |||||||
| Dividends from affiliated issuers (Note 8) | $ | 10,962,957 | |||||
| Dividends | 85,521 | ||||||
| Interest | 235,986 | ||||||
| Total investment income | 11,284,464 | ||||||
| Expenses: | |||||||
| Management fee (Note 3) | 591,744 | ||||||
| Shareholder service fee – Class III (Note 3) | 467,166 | ||||||
| Custodian, fund accounting agent and transfer agent fees | 138,133 | ||||||
| Audit and tax fees | 67,162 | ||||||
| Legal fees | 10,408 | ||||||
| Trustees fees and related expenses (Note 3) | 8,586 | ||||||
| Registration fees | 6,208 | ||||||
| Miscellaneous | 4,350 | ||||||
| Total expenses | 1,293,757 | ||||||
| Fees and expenses reimbursed by Manager (Note 3) | (34,530 | ) | |||||
| Expense reductions (Note 2) | (1,953 | ) | |||||
| Indirectly incurred fees waived or borne by Manager (Note 3) | (37,784 | ) | |||||
| Shareholder service fee waived (Note 3) | (13,391 | ) | |||||
| Net expenses | 1,206,099 | ||||||
| Net investment income (loss) | 10,078,365 | ||||||
| Realized and unrealized gain (loss): | |||||||
| Net realized gain (loss) on: | |||||||
| Investments in unaffiliated issuers | 948,086 | ||||||
| Investments in affiliated issuers | (8,404,504 | ) | |||||
| Realized gains distributions from affiliated issuers (Note 8) | 312,612 | ||||||
| Closed futures contracts | 11,405,798 | ||||||
| Closed swap contracts | 3,287,785 | ||||||
| Written options | (920,150 | ) | |||||
| Foreign currency, forward contracts and foreign currency related transactions | (3,294,403 | ) | |||||
| Net realized gain (loss) | 3,335,224 | ||||||
| Change in net unrealized appreciation (depreciation) on: | |||||||
| Investments in unaffiliated issuers | (3,862,279 | ) | |||||
| Investments in affiliated issuers | (60,236,285 | ) | |||||
| Open futures contracts | (3,574,999 | ) | |||||
| Open swap contracts | (2,574,033 | ) | |||||
| Foreign currency, forward contracts and foreign currency related transactions | (20,601,342 | ) | |||||
| Net unrealized gain (loss) | (90,848,938 | ) | |||||
| Net realized and unrealized gain (loss) | (87,513,714 | ) | |||||
| Net increase (decrease) in net assets resulting from operations | $ | (77,435,349 | ) | ||||
See accompanying notes to the financial statements.
8
GMO Global Bond Fund
(A Series of GMO Trust)
Statement of Changes in Net Assets
| Year Ended February 28, 2009 | Year Ended February 29, 2008 | ||||||||||
| Increase (decrease) in net assets: | |||||||||||
| Operations: | |||||||||||
| Net investment income (loss) | $ | 10,078,365 | $ | 12,741,125 | |||||||
| Net realized gain (loss) | 3,335,224 | 10,424,511 | |||||||||
| Change in net unrealized appreciation (depreciation) | (90,848,938 | ) | (3,353,820 | ) | |||||||
| Net increase (decrease) in net assets from operations | (77,435,349 | ) | 19,811,816 | ||||||||
| Distributions to shareholders from: | |||||||||||
| Net investment income | |||||||||||
| Class III | (19,772,881 | ) | (23,714,054 | ) | |||||||
| Net share transactions (Note 7): | |||||||||||
| Class III | 20,286,078 | 157,195,473 | |||||||||
| Redemption fees (Notes 2 and 7): | |||||||||||
| Class III | 13,923 | — | |||||||||
| Total increase (decrease) in net assets resulting from net share transactions and redemption fees | 20,300,001 | 157,195,473 | |||||||||
| Total increase (decrease) in net assets | (76,908,229 | ) | 153,293,235 | ||||||||
| Net assets: | |||||||||||
| Beginning of period | 338,614,491 | 185,321,256 | |||||||||
| End of period (including accumulated undistributed net investment income of $406,767 and $403,110, respectively) | $ | 261,706,262 | $ | 338,614,491 | |||||||
See accompanying notes to the financial statements.
9
GMO Global Bond Fund
(A Series of GMO Trust)
Financial Highlights
(For a Class III share outstanding throughout each period)
| Year Ended February 28/29, | |||||||||||||||||||||||
| 2009 | 2008 | 2007 | 2006 | 2005 | |||||||||||||||||||
| Net asset value, beginning of period | $ | 8.70 | $ | 8.92 | $ | 8.53 | $ | 9.11 | $ | 8.73 | |||||||||||||
| Income (loss) from investment operations: | |||||||||||||||||||||||
| Net investment income (loss)(a)† | 0.25 | 0.42 | 0.38 | 0.18 | 0.21 | ||||||||||||||||||
| Net realized and unrealized gain (loss) | (2.11 | ) | 0.11 | 0.38 | (0.57 | ) | 0.63 | ||||||||||||||||
| Total from investment operations | (1.86 | ) | 0.53 | 0.76 | (0.39 | ) | 0.84 | ||||||||||||||||
| Less distributions to shareholders: | |||||||||||||||||||||||
| From net investment income | (0.51 | ) | (0.75 | ) | (0.37 | ) | (0.19 | ) | (0.46 | ) | |||||||||||||
| Total distributions | (0.51 | ) | (0.75 | ) | (0.37 | ) | (0.19 | ) | (0.46 | ) | |||||||||||||
| Net asset value, end of period | $ | 6.33 | $ | 8.70 | $ | 8.92 | $ | 8.53 | $ | 9.11 | |||||||||||||
| Total Return(b) | (22.77 | )% | 6.50 | % | 8.99 | % | (4.33 | )% | 9.52 | % | |||||||||||||
| Ratios/Supplemental Data: | |||||||||||||||||||||||
| Net assets, end of period (000's) | $ | 261,706 | $ | 338,614 | $ | 185,321 | $ | 168,324 | $ | 170,750 | |||||||||||||
| Net expenses to average daily net assets(c) | 0.39 | %(d) | 0.38 | %(d) | 0.39 | % | 0.37 | % | 0.33 | % | |||||||||||||
| Net investment income to average daily net assets(a) | 3.24 | % | 4.86 | % | 4.33 | % | 2.12 | % | 2.40 | % | |||||||||||||
| Portfolio turnover rate | 35 | % | 20 | % | 22 | % | 20 | % | 38 | % | |||||||||||||
| Fees and expenses reimbursed and/or waived by the Manager to average daily net assets: | 0.03 | % | 0.03 | % | 0.06 | % | 0.07 | % | 0.12 | % | |||||||||||||
| Redemption fees consisted of the following per share amounts:† | $ | 0.00 | (e) | — | — | — | — | ||||||||||||||||
(a) Net investment income is affected by the timing of the declaration of dividends by the underlying funds in which the Fund invests.
(b) The total returns would have been lower had certain expenses not been reimbursed during the periods shown and assumes the effect of reinvested distributions. Calculation excludes redemption fees which are borne by the shareholder.
(c) Net expenses exclude expenses incurred indirectly through investment in the underlying funds (See Note 3).
(d) The net expense ratio does not include the effect of expense reductions.
(e) Redemption fees were less than $0.01 per share.
† Calculated using average shares outstanding throughout the period.
See accompanying notes to the financial statements.
10
GMO Global Bond Fund
(A Series of GMO Trust)
Notes to Financial Statements
February 28, 2009
1. Organization
GMO Global Bond Fund (the "Fund") is a series of GMO Trust (the "Trust"). The Fund is registered under the Investment Company Act of 1940, as amended, as an open-end, non-diversified management investment company. The Fund is advised and managed by Grantham, Mayo, Van Otterloo & Co. LLC (the "Manager" or "GMO"). The Trust was established as a Massachusetts business trust under the laws of The Commonwealth of Massachusetts on June 24, 1985. The Declaration of Trust permits the Trustees of the Trust ("Trustees") to create an unlimited number of series of shares ("Funds") and to subdivide Funds into classes.
The Fund seeks total return in excess of that of the JPMorgan Global Government Bond Index. The Fund typically invests in bonds included in the JPMorgan Global Government Bond Index and in securities and instruments with similar characteristics. The Fund seeks additional returns by seeking to exploit differences in global interest rates and currency and emerging country debt markets. The Fund may invest a substantial portion of its assets in shares of Short-Duration Collateral Fund; in futures contracts, currency options, currency forwards, swap contracts, and other types of derivatives; in investment-grade bonds denominated in various currencies, including foreign and U.S. government securities and asset-backed securities issued by foreign governments and U.S. government agencies (including securities neither guaranteed nor insured by the U.S. government), corporate bonds, and mortgage-backed and other asset-backed securities i ssued by private issuers; in shares of GMO World Opportunity Overlay Fund; and up to 5% of the Fund's total assets in sovereign debt of emerging countries (including below investment grade securities (also known as "junk bonds")), primarily through investment in shares of GMO Emerging Country Debt Fund ("ECDF").
The Fund directly and indirectly (through underlying funds) invests in securities with contractual cash flows, such as collateralized mortgage obligations and commercial mortgage-backed securities, including securities backed by sub-prime mortgage loans, credit card receivables and auto loan receivables. The value, liquidity and related income of these securities are sensitive to changes in economic conditions, including real estate values, delinquencies and/or defaults, and may be adversely affected by changes in interest rates and shifts in the market's perception of the securities' market values.
The Fund will, if deemed prudent by the Manager, take temporary defensive measures (until the Manager has determined that normal conditions have returned or that it is otherwise prudent to resume investing in accordance with the Fund's normal investment strategies) and may not achieve its investment objectives during those periods. Recent changes in the credit markets have reduced the liquidity of all types of fixed income securities, including asset-backed securities. The Fund took temporary defensive measures during the last fiscal year.
11
GMO Global Bond Fund
(A Series of GMO Trust)
Notes to Financial Statements — (Continued)
February 28, 2009
2. Significant accounting policies
The following is a summary of significant accounting policies followed by the Fund in the preparation of its financial statements. These policies are in conformity with accounting principles generally accepted in the United States of America ("U.S. GAAP") and have been consistently followed by the Fund in preparing its financial statements. The preparation of financial statements in accordance with U.S. GAAP requires management to make estimates and assumptions that affect the reported amounts and disclosures in the financial statements. Actual results could differ from those estimates. The accounting records of the Fund are maintained in U.S. dollars.
Portfolio valuation
Securities listed on a securities exchange for which market quotations are readily available are valued at the last sale price or official closing price on each business day, or if there is no such reported sale or official closing price, at the most recent quoted bid price. Unlisted securities for which market quotations are readily available are generally valued at the most recent quoted bid price. Debt instruments with a remaining maturity of sixty days or less are generally valued at amortized cost, which approximates fair value. Shares of investment funds are generally valued at their net asset value. Securities for which quotations are not readily available or whose values the Manager has determined to be unreliable are valued at fair value as determined in good faith by the Trustees or persons acting at their direction pursuant to procedures approved by the Trustees. By its nature, a fair value price is a good faith estim ate of the value of a security at a given point in time and may not reflect the value that would be realized if the security were sold. The difference between a fair value price and the value realized upon a sale could be material.
Typically the Fund and the underlying funds value debt instruments based on prices supplied by a primary pricing source chosen by the Manager. The Manager evaluates primary pricing sources on an ongoing basis and may change a pricing source should the Manager deem it appropriate. If it deems appropriate, the Manager, at its discretion, may override a price supplied by a primary source by using a price provided by another source. The prices provided by primary pricing sources may differ from the value that would be realized if the securities were sold, and the differences could be material.
Certain securities held by the Fund and underlying funds are valued on the basis of prices provided by a single source. As of February 28, 2009, the total value of these securities represented 40.29% of the net assets. The single source prices provided may differ from the value that would be realized if the securities were sold, and the differences could be material. In addition, although alternative prices are available for other securities held by the Fund, those alternative sources would not necessarily confirm the security price used by the Fund. Therefore, the existence of those alternative sources does not necessarily provide greater certainty about the prices used by the Fund.
GMO Special Purpose Holding Fund ("SPHF"), an investment of the Fund, has litigation pending against various entities related to the default of certain asset-backed securities previously held by SPHF. The outcome of the lawsuits against the remaining defendants is not known and any potential recoveries are
12
GMO Global Bond Fund
(A Series of GMO Trust)
Notes to Financial Statements — (Continued)
February 28, 2009
not reflected in the net asset value of SPHF. For the year ended February 28, 2009, the Fund received $103,806 through SPHF in connection with settlement agreements related to that litigation.
In September 2006, the Financial Accounting Standards Board ("FASB") issued Statement of Financial Accounting Standards No. 157, Fair Value Measurements ("SFAS 157"). SFAS 157 is effective for the Fund's current fiscal year. While the adoption of SFAS 157 does not have an effect on the Fund's net asset value, it does require additional disclosures about fair value measurements. SFAS 157 establishes a three-level hierarchy for disclosure of fair value measurements. The valuation hierarchy is based upon the reliability of inputs to the valuation of the Fund's investments. The three levels are defined as follows:
Level 1 – Valuations based on quoted prices for identical securities in active markets.
Level 2 – Valuations determined using other significant direct or indirect observable inputs.
Level 3 – Valuations based on inputs that are unobservable and significant. The Fund utilized the following fair value techniques on Level 3 investments: The Fund considered certain bankrupt securities to be worthless.
The inputs or methodology used for valuing securities are not necessarily an indication of the risk associated with investing in those securities.
The following is a summary of the fair valuations according to inputs used as of February 28, 2009 in valuing the Fund's investments:
| Asset Valuation Inputs | Investments in Securities | Other Financial Instruments* | |||||||||
| Level 1 - Quoted Prices | $ | 7,736,793 | $ | 339,523 | |||||||
| Level 2 - Other Significant Observable Inputs | 257,587,202 | 1,476,952 | |||||||||
| Level 3 - Significant Unobservable Inputs | 33,462 | 123,788 | |||||||||
| Total | $ | 265,357,457 | $ | 1,940,263 | |||||||
* Other financial instruments include forward currency contracts, futures contracts and swap agreements.
| Liability Valuation Inputs | Investments in Securities | Other Financial Instruments** | |||||||||
| Level 1 - Quoted Prices | $ | — | $ | (370,574 | ) | ||||||
| Level 2 - Other Significant Observable Inputs | — | (10,677,745 | ) | ||||||||
| Level 3 - Significant Unobservable Inputs | — | (154,293 | ) | ||||||||
| Total | $ | — | $ | (11,202,612 | ) | ||||||
** Other financial instruments include forward currency contracts, futures contracts and swap agreements.
13
GMO Global Bond Fund
(A Series of GMO Trust)
Notes to Financial Statements — (Continued)
February 28, 2009
For the underlying fund's summary of valuation inputs please refer to the respective fund's portfolio valuation note.
The following is a reconciliation of investments in which significant unobservable inputs (Level 3) were used in determining value:
| Investments in Securities | Other Financial Instruments | ||||||||||
| Balance as of February 29, 2008 | $ | 57,756 | $ | — | |||||||
| Accrued discounts/premiums | — | — | |||||||||
| Realized gain (loss) | — | — | |||||||||
| Realized gain distributions received | 79,287 | — | |||||||||
| Realized gain distributions paid | (103,806 | ) | — | ||||||||
| Change in unrealized appreciation/depreciation | 225 | (30,505 | ) | ||||||||
| Net purchases (sales) | — | — | |||||||||
| Net transfers in and/or out of Level 3 | — | — | |||||||||
| Balance as of February 28, 2009 | $ | 33,462 | $ | (30,505 | ) | ||||||
Foreign currency translation
The market values of foreign securities, currency holdings and related assets and liabilities are translated to U.S. dollars based on the 4 p.m. New York time exchange rates each business day. Income and expenses denominated in foreign currencies are translated at the 4 p.m. New York time exchange rates on the business day the income and expenses are accrued or incurred. The Fund does not isolate realized and unrealized gains and losses attributable to changes in exchange rates from gains and losses that arise from changes in the market value of investments. Such fluctuations are included with net realized and unrealized gain or loss on investments. Net realized gains and losses on foreign currency transactions represent gains and losses on disposition of currencies and forward currency contracts, currency gains and losses realized between the trade and settlement dates on securities transactions, and the difference between the amount of investment income and foreign withholding taxes recorded on the Fund's accounting records and the U.S. dollar equivalent amounts actually received or paid.
Forward currency contracts
The Fund may enter into forward currency contracts including forward cross currency contracts. A forward currency contract is an agreement between two parties to buy and sell a currency at a set price on a future date. The market value of a forward currency contract fluctuates with changes in forward currency exchange rates. Forward currency contracts are marked to market daily using rates supplied by a quotation service and changes in value are recorded by the Fund as an unrealized gain or loss. Realized gains or losses equal to the difference between the value of the contract at the time it was opened and the value at the time it was closed are recorded upon delivery or receipt of the currency or, if a forward currency
14
GMO Global Bond Fund
(A Series of GMO Trust)
Notes to Financial Statements — (Continued)
February 28, 2009
contract is offset by entering into another forward currency contract with the same broker, upon settlement of the net gain or loss. These contracts may involve market risk in excess of the unrealized gain or loss reflected in the Fund's Statement of Assets and Liabilities. They expose the Fund to the risk of unfavorable movements in currency values and the risk that the counterparty will be unable or unwilling to meet the terms of the contracts. Forward currency contracts outstanding at the end of the period are listed in the Fund's Schedule of Investments.
Futures contracts
The Fund may purchase and sell futures contracts. Upon entering into a futures contract, the Fund is required to deposit cash, U.S. government and agency obligations, or other liquid assets with the futures clearing broker in accordance with the initial margin requirements of the broker or exchange. In addition, the Fund maintains cash or securities in an amount that at least equals the net amount payable in the event the Fund must deliver the full amount of the contract. Futures contracts are marked to market daily and an appropriate payable or receivable for the change in value ("variation margin") is recorded by the Fund. The payable or receivable is settled on the following business day. Gains or losses are recognized but not considered realized until the contracts expire or are closed. Futures contracts involve, to varying degrees, risk of loss in excess of the variation margin disclosed in the Statement of Assets and Liabi lities. Under some circumstances, futures exchanges may establish daily limits on the amount that the price of a futures contract can vary from the previous day's settlement price, thereby effectively preventing liquidation of unfavorable positions. Losses may arise from changes in the value of the underlying instrument if the Fund is unable to liquidate a futures position due to an illiquid secondary market for the contract or the imposition of price limits, or if counterparties do not perform under the contract terms. Futures contracts are generally valued at the settlement price established each day by the board of trade or exchange on which they are traded. Futures contracts outstanding at the end of the period are listed in the Fund's Schedule of Investments.
Options
The Fund may write (i.e., sell) call and put options. Writing options alters the Fund's exposure to the underlying instrument by, in the case of a call option, obligating the Fund to sell the underlying instrument at a set price to the option-holder and, in the case of a put option, obligating the Fund to purchase the underlying instrument at a set price from the option-holder. In the case of an index option, settlement will be in cash. When the Fund writes a call or put option, an amount equal to the premium received is recorded as a liability and subsequently marked to market to reflect the current value of the option written. Premiums received from writing options that expire are treated as realized gains. Premiums received from writing options that are exercised or closed are deducted from the amounts paid on the underlying future, security or currency transaction to determine the realized gain or loss. The Fund as a writer of an option has no control over whether the underlying future, security or currency may be sold (call) or purchased (put) and as a result bears the market risk of an unfavorable change in the price of the future, security or currency underlying the option. In the event that the Fund writes uncovered put or call options (i.e. options for investments that the Fund does not own), it bears the risk of substantial losses if the price of the
15
GMO Global Bond Fund
(A Series of GMO Trust)
Notes to Financial Statements — (Continued)
February 28, 2009
underlying instrument increases during the term of the option. Options expose the Fund to the risk the Fund may not be able to enter into a closing transaction because of an illiquid market.
For the year ended February 28, 2009, the Fund's investment activity in options contracts written by the Fund was as follows:
| Puts | Calls | ||||||||||||||||||
| Principal Amount of Contracts | Premiums | Principal Amount of Contracts | Premiums | ||||||||||||||||
| Outstanding, beginning of year | $ | — | $ | — | $ | — | $ | — | |||||||||||
| Options written | — | — | JPY | (3,817,000,000 | ) | (357,184 | ) | ||||||||||||
| Options exercised | — | — | JPY | 3,817,000,000 | 357,184 | ||||||||||||||
| Options expired | — | — | — | — | |||||||||||||||
| Options sold | — | — | — | — | |||||||||||||||
| Outstanding, end of year | $ | — | $ | — | $ | — | $ | — | |||||||||||
The Fund may also purchase put and call options. Purchasing options alters the Fund's exposure to the underlying instrument by, in the case of a call option, entitling the Fund to purchase the underlying instrument at a set price from the writer of the option and, in the case of a put option, entitling the Fund to sell the underlying instrument at a set price to the writer of the option. The Fund pays a premium for a purchased option. That premium is disclosed in the Schedule of Investments and is subsequently marked to market to reflect the current value of the option. Premiums paid for purchasing options that expire are treated as realized losses. Premiums paid for purchasing options that are exercised or closed are deducted from the proceeds on the closing transaction to determine the realized gain or loss. The risk associated with purchasing put and call options is limited to the premium paid. The Fund had no purchased optio n contracts outstanding at the end of the period.
The Fund values exchange traded options at the last sale price, or if no sale is reported, the last bid price for options it has purchased and the last ask price for options it has written. The Fund values options traded over-the-counter using inputs provided by primary pricing sources and industry standard models.
Indexed securities
The Fund may invest in indexed securities. Indexed securities are securities whose redemption values and/or coupons are linked to the prices of a specific instrument or financial statistic. The Fund uses indexed securities to increase or decrease its exposure to different underlying instruments and to gain exposure to markets in which investing through conventional securities is difficult. Indexed securities held by the Fund at the end of the period are listed in the Fund's Schedule of Investments.
16
GMO Global Bond Fund
(A Series of GMO Trust)
Notes to Financial Statements — (Continued)
February 28, 2009
Swap agreements
The Fund may enter into various types of swap agreements, including without limitation, interest rate, total return, credit default and variance swap agreements. A swap agreement is an agreement to exchange the return generated by one instrument for the return generated by another instrument. When entering into a swap agreement, the Fund and/or the swap counterparty may post or receive cash or securities as collateral. The party posting the collateral typically receives the interest associated with or payments related to the collateral and has the risk of loss related to the collateral.
Interest rate swap agreements involve an exchange by the parties of their respective commitments to pay or right to receive interest, e.g., an exchange of floating rate interest payments for fixed rate interest payments with respect to the notional amount of principal.
Total return swap agreements involve a commitment by one party to pay interest to the other party in exchange for a payment to it from the other party based on the return of a reference instrument (e.g., a security or basket of securities), both based on notional amounts. To the extent the return of the reference instrument exceeds or falls short of the interest payments, one party will receive a payment from or make a payment to the other party.
In a credit default swap agreement, one party makes payments to another party in exchange for the right to receive a specified return if a credit event occurs with respect to a referenced entity or entities. Buying credit default protection reduces the buyer's exposure in the event of an issuer's default (e.g., it reduces risk where a party owns a security issued by or otherwise has exposure to the issuer). Selling credit default protection subjects the seller to exposure to an issuer's default. A seller of credit default protection receives payments in return for its obligation to pay the principal amount of a debt security (or other agreed-upon value) to the other party upon the occurrence of a credit event (e.g., issuer default or similar event). If no credit event occurs, the seller has no payment obligations. For credit default swap agreements on asset-backed securities, a credit event may be triggered by such events as the issuer's failure to pay interest or principal, an agreement of the holders of an asset-backed security to a maturity extension, a rating downgrade on the security or a write-down on the collateral underlying the security. For credit default swap agreements on corporate or sovereign issuers, a credit event may be triggered by such events as the issuer's bankruptcy, failure to pay interest or principal, repudiation/moratorium or restructuring.
Variance swap agreements involve an agreement by two parties to exchange cash flows based on the measured variance (or square of volatility) of a specified underlying asset. One party agrees to exchange a "fixed rate" or strike price payment for the "floating rate" or realized price variance on the underlying asset with respect to the notional amount. At inception, the strike price chosen is generally fixed at a level such that the fair value of the swap is zero. At the expiration date, the amount paid by one party to the other is the difference between the realized price variance of the underlying asset and the strike price multiplied by the notional amount. A receiver of the realized price variance would receive a payment when the realized price variance of the underlying asset is greater than the strike price and would make a payment when that variance is less than the strike price. A payer of the realized price variance woul d
17
GMO Global Bond Fund
(A Series of GMO Trust)
Notes to Financial Statements — (Continued)
February 28, 2009
make a payment when the realized price variance of the underlying asset is greater than the strike price and would receive a payment when that variance is less than the strike price. This type of agreement is essentially a forward contract on the future realized price variance of the underlying asset.
The Fund prices its swap agreements daily using models that may incorporate quotations from market makers and records the change in value, if any, as unrealized gain or loss in the Statement of Operations. Payments received or made on swap agreements are recorded as realized gain or loss in the Statement of Operations. Gains or losses are realized upon termination of the swap agreements.
Swap agreements often are not actively traded on financial markets. The values assigned to them may differ significantly from the values that would be realized upon termination, and the differences could be material. Entering into swap agreements involves credit, legal, market and documentation risk that is not reflected in the amounts reported in the Statement of Assets and Liabilities. Such risks include the possibility that the party with whom the Fund contracts may default on its obligations to perform or disagree as to the meaning of contractual terms, or that the collateral that party posts may be insufficient or not timely received by the Fund. Credit risk may be particularly acute in an environment where financial services firms are exposed to systemic risks of the type evidenced by the insolvency of Lehman Brothers and subsequent market disruptions. Swap agreements outstanding at the end of the period are listed in the Fund's Schedule of Investments.
Repurchase agreements
The Fund may enter into repurchase agreements. Under a repurchase agreement the Fund acquires a security for cash and obtains a simultaneous commitment from the seller to repurchase the security at an agreed upon price and date. The Fund, through its custodian, takes possession of securities collateralizing the repurchase agreement. The collateral is marked to market daily to ensure that the market value of the underlying assets is at least equal to the amount owed to the Fund in the event of default by the seller. If the seller of a repurchase agreement defaults or enters into insolvency proceedings and the value of the collateral declines, the Fund's recovery of cash may be delayed or limited. The Fund had no repurchase agreements outstanding at the end of the period.
Reverse repurchase agreements
The Fund may enter into reverse repurchase agreements. Under a reverse repurchase agreement the Fund sells portfolio assets subject to an agreement by the Fund to repurchase the same assets at a later date at a fixed price. In connection with these agreements, the Fund establishes segregated accounts with its custodian in which the Fund maintains cash, U.S. government securities or other assets equal in value to its obligations under the reverse repurchase agreement into which it has entered. Reverse repurchase agreements expose the Fund to the risk that the market value of the securities the Fund has sold under the agreement may decline below the price at which the Fund is obligated to repurchase them under the agreement. If the buyer in a reverse repurchase agreement files for bankruptcy or becomes insolvent, the Fund's use of proceeds from the sale of its securities may be restricted while the other party or its trustee
18
GMO Global Bond Fund
(A Series of GMO Trust)
Notes to Financial Statements — (Continued)
February 28, 2009
or receiver determines whether to honor the Fund's right to repurchase the securities. Furthermore, in that situation the Fund may be unable to recover the securities it sold and as a result would realize a loss equal to the difference between the value of the securities and the payment it received for them. This loss would be greater to the extent the buyer paid less than the value of the securities the Fund sold to it (e.g., a buyer may pay $95 for a bond with a market value of $100). The market value of the securities the Fund has sold is determined daily and any additional required collateral is allocated to or sent by the Fund on the next business day. The Fund had no repurchase agreements outstanding at the end of the period.
Securities lending
The Fund may lend its securities to qualified brokers. The loans are collateralized with cash or liquid securities with a market value at least equal to the market value of the securities upon entering into the loan. As with other extensions of credit, the Fund may bear the risk of loss with respect to the investment of the collateral, the risk of delay in and/or inability to exercise its rights with respect to the collateral, and the risk of delay in recovery or loss of rights in the loaned securities should the borrower of the securities fail financially. If a loan is collateralized by U.S. government securities, the Fund receives a fee from the borrower. If a loan is collateralized by cash, the Fund typically invests the cash collateral for its own account. For the year from March 1, 2008 through February 28, 2009, the Fund did not participate in securities lending.
Taxes and distributions
The Fund intends to qualify each tax year as a regulated investment company under Subchapter M of the Internal Revenue Code of 1986, as amended (the "Code"). The Fund intends to distribute substantially all of its net investment income and all of its net realized short-term and long-term capital gain, if any, after giving effect to any available capital loss carryforwards for U.S. federal income tax purposes. Therefore, no provision for U.S. federal income or excise tax is necessary.
The Fund's policy is to declare and pay distributions from net investment income, if any, semiannually, and from net realized short-term and long-term capital gain, if any, at least annually. All distributions are paid in shares of the Fund, at net asset value, unless the shareholder elects to receive cash distributions. Distributions to shareholders are recorded by the Fund on the ex-dividend date.
Income and capital gain distributions are determined in accordance with U.S. federal income tax regulations, which may differ from U.S. GAAP. Certain capital accounts in the financial statements are periodically adjusted for permanent differences in order to reflect their tax character. These adjustments have no impact on net assets or net asset value per share. Temporary differences that arise from recognizing certain items of income, expense, gain or loss in different periods for financial statement and tax purposes will reverse at some time in the future. Distributions in excess of net investment income or net realized gains are temporary over - -distributions for financial statement purposes resulting from differences in the recognition or classification of income or distributions for financial statement and tax purposes.
19
GMO Global Bond Fund
(A Series of GMO Trust)
Notes to Financial Statements — (Continued)
February 28, 2009
U.S. GAAP and tax accounting differences primarily relate to capital loss carryforwards, derivative contract transactions, foreign currency transactions, partnership interest tax allocations, net operating losses, losses on wash sale transactions and post-October capital losses.
The following reclassification represents the amount necessary to report the stated components of net assets on a tax basis, excluding certain temporary differences, as of February 28, 2009. The financial highlights exclude these adjustments.
| Accumulated Undistributed Net Investment Income | Accumulated Net Realized Loss | Paid-in Capital | |||||||||
| $ | 8,884,640 | $ | (7,770,825 | ) | $ | (1,113,815 | ) | ||||
The tax character of distributions declared to shareholders is as follows:
| 2/28/2009 | 2/29/2008 | ||||||||||
| Ordinary income (including any net short-term capital gain) | $ | 19,772,881 | $ | 23,714,054 | |||||||
| Total distributions | �� | $ | 19,772,881 | $ | 23,714,054 | ||||||
Distributions in excess of tax basis earnings and profits, if significant, are reported in the financial statements as a return of capital for tax purposes.
As of February 28, 2009, the Fund elected to defer to March 1, 2009 post-October capital losses of $7,106,783.
As of February 28, 2009, the Fund had capital loss carryforwards available to offset future realized gains if any, to the extent permitted by the Code. Utilization of the capital loss carryforwards could be subject to limitations imposed by the Code related to share ownership activity. Such losses expire as follows:
| 2/29/2012 | $ | (7,601,799 | ) | ||||
| 2/28/2014 | (7,575,780 | ) | |||||
| 2/28/2015 | (269,796 | ) | |||||
| 2/28/2017 | (4,412,277 | ) | |||||
| Total | $ | (19,859,652 | ) | ||||
20
GMO Global Bond Fund
(A Series of GMO Trust)
Notes to Financial Statements — (Continued)
February 28, 2009
As of February 28, 2009, the approximate cost for U.S. federal income tax purposes and gross and net unrealized appreciation (depreciation) in value of investments were as follows:
| Aggregate Cost | Gross Unrealized Appreciation | Gross Unrealized (Depreciation) | Net Unrealized Appreciation (Depreciation) | ||||||||||||
| $ | 347,291,501 | $ | 33,462 | $ | (81,967,506 | ) | $ | (81,934,044 | ) | ||||||
The Fund is subject to the provisions of Financial Accounting Standards Board Interpretation No. 48 ("FIN 48"), Accounting for Uncertainty in Income Taxes — an Interpretation of FASB Statement No. 109. FIN 48 sets forth a minimum threshold for financial statement recognition of a tax position taken or expected to be taken in a tax return that could affect the Fund's financial statements. The Fund did not have any unrecognized tax benefits or liabilities at February 28, 2009, nor did it have any increases or decreases in unrecognized tax benefits or liabilities for the period then ended. The Fund is subject to examination prior to the expiration of the statute of limitations by U.S. federal and state tax authorities for tax returns filed.
Security transactions and related investment income
Security transactions in the financial statements are accounted for on the trade date. Dividend income, net of applicable foreign withholding taxes, if any, is recorded on the ex-dividend date or, if later, when the Fund is informed of the ex-dividend date. Interest income is recorded on the accrual basis and is adjusted for the amortization of premiums and accretion of discounts. Principal on inflation indexed securities is adjusted for inflation and any increase or decrease is recorded as interest income or loss. Income is not recognized on securities for which collection is not expected. Non-cash dividends, if any, are recorded at the fair market value of the asset received. In determining the net gain or loss on securities sold, the Fund uses the identified cost basis for the purposes of determining the cost basis.
Expenses
The majority of the expenses of the Trust are directly identifiable to an individual fund. Expenses that are not readily identifiable to a specific fund are allocated taking into consideration, among other things, the nature and type of expense and the relative size of the funds. In addition, the Fund incurs fees and expenses indirectly as a shareholder in the underlying funds. Because the underlying funds have different expense and fee levels and the Fund may own different proportions of the underlying funds at different times, the amount of fees and expenses indirectly incurred by the Fund will vary (See Note 3).
State Street Bank and Trust Company ("State Street") serves as custodian, fund accounting agent and transfer agent of the Fund. State Street's fees may be reduced by an earnings allowance calculated on the average daily cash balances the Fund maintains with State Street. The Fund receives the benefit of the earnings allowance. In addition, Goldman Sachs Agency Lending, the Fund's securities lending agent, has agreed to reimburse the Fund for certain transactional expenses related to securities lending activity.
21
GMO Global Bond Fund
(A Series of GMO Trust)
Notes to Financial Statements — (Continued)
February 28, 2009
Credit balances or expense reimbursements used to reduce fees, if any, are reported as a reduction of expenses in the Statement of Operations.
Purchases and redemptions of Fund shares
Effective October 8, 2008, the Fund instituted a fee on cash redemptions of 0.97% of the amount redeemed. Effective October 21, 2008, the fee on cash redemptions was changed to 2.00% of the amount redeemed. As of February 28, 2009, the fee on cash redemptions was 2.00% of the amount redeemed. The Fund may impose a new purchase premium and/or redemption fee, or modify or eliminate an existing purchase premium and/or redemption fee, at any time. If the Manager determines that any portion of a cash redemption is offset by a corresponding cash purchase on the same day, the Fund will ordinarily waive or reduce the redemption fee with respect to that portion. In addition, the Fund may waive or reduce the redemption fee in extraordinary circumstances if the purchase or redemption will not cause the Fund to incur transaction costs. All redemption fees are paid to the Fund and recorded by the Fund as paid-in-capital. In-kind redemption transactions are generally not subject to redemption fees except when they include a cash component. However, when a substantial portion of a Fund is being redeemed, the Fund may charge a redemption fee based on estimated or known transaction costs resulting from those redemptions.
Investment risks
The Fund is subject to risks involved in investing in foreign securities that are not presented by investments in U.S. securities. These risks may involve adverse political and economic developments, including expropriation and the possible imposition of capital controls or other foreign governmental laws or restrictions. In addition, the securities of some foreign companies and securities markets are less liquid and at times may be more volatile than securities of comparable U.S. companies and U.S. securities markets. The risks described above apply to an even greater extent to investments in emerging markets. The securities markets of emerging countries are generally smaller, less developed, less liquid, and more volatile than the securities markets of the U.S. and developed foreign markets. Additionally, the investment risks associated with an investment in the underlying funds may be greater to the extent that the underlying funds engage in derivative transactions.
To manage the Fund's cash collateral needs in extraordinary market conditions, the Manager reserves the right to reduce or eliminate the Fund's derivative exposures, including those that are intended to cause the Fund to track its benchmark more closely. A reduction in those exposures without replacing them with benchmark securities will tend to cause the performance of the Fund to track its benchmark less closely and make the Fund's performance more dependent on the performance of the asset-backed securities it holds directly or indirectly.
To address in part the cash management issues described above, the Fund expects to honor nearly all redemptions of its shares in-kind for the foreseeable future. If redeeming shareholders from the Fund choose to sell assets received in-kind immediately and current adverse market conditions continue, they may experience difficulty selling the assets at favorable prices. To the extent that the Fund honors
22
GMO Global Bond Fund
(A Series of GMO Trust)
Notes to Financial Statements — (Continued)
February 28, 2009
redemptions in cash, redeeming shareholders will bear the redemption fees described in the Purchases and Redemptions of Fund Shares note.
Recently issued accounting pronouncement
In March 2008, FASB issued Statement of Financial Accounting Standards No. 161, Disclosures about Derivative Instruments and Hedging Activities ("SFAS 161"). SFAS 161 is effective for fiscal years and interim periods beginning after November 15, 2008. SFAS 161 requires enhanced disclosures about the Fund's derivative and hedging activities. The Manager is currently evaluating the impact the adoption of SFAS 161 will have on the Fund's financial statement disclosures.
3. Fees and other transactions with affiliates
GMO receives a management fee for the services it provides to the Fund. That fee is paid monthly at the annual rate of 0.19% of average daily net assets. The Fund has adopted a Shareholder Service Plan under which the Fund pays GMO a shareholder service fee for client and shareholder service, reporting, and other support. Pursuant to the Shareholder Service Plan, the shareholder service fee is calculated based on average daily net assets at the annual rate of 0.15% for Class III shares. The Manager will waive the Fund's shareholder service fee to the extent that the aggregate of any direct and indirect shareholder service fees borne by the Fund exceeds 0.15%; provided, however, that the amount of this waiver will not exceed 0.15%.
Through at least June 30, 2009, the Manager has contractually agreed to reimburse the Fund for Fund expenses incurred through that date to the extent the Fund's total annual operating expenses (excluding "Excluded Expenses", as defined below) exceed 0.25% of the Fund's average daily net assets. Excluded Expenses include shareholder service fees, expenses indirectly incurred by investment in the underlying funds, fees and expenses of the independent Trustees of the Trust, fees and expenses for legal services not approved by the Manager for the Trust, compensation and expenses of the Trust's Chief Compliance Officer ("CCO") (excluding any employee benefits), brokerage commissions, securities lending fees and expenses, interest expense, transfer taxes, and other investment-related costs (including expenses associated with investments in any company that is an investment company or would be an investment company under the 1940 Act, but for the exceptions to the definition of investment company provided in Section 3(c)(1) and 3(c)(7) of the 1940 Act), hedging transaction fees, extraordinary, non-recurring and certain other unusual expenses (including taxes). In addition, the Manager has contractually agreed to reimburse the Fund through at least June 30, 2009 to the extent that the sum of (a) the Fund's total annual operating expenses (excluding Excluded Expenses) and (b) the amount of fees and expenses incurred indirectly by the Fund through its investment in ECDF (excluding ECDF's fees and expenses of the independent trustees of the Trust, fees for legal services not procured or provided by the Manager for the Trust, compensation and expenses of the Trust's CCO (excluding any employee benefits), and investment-related expenses such as brokerage commissions, hedging transaction fees, securities lending fees and expenses, interest expense and transfer taxes), exceeds 0.25% of the Fund's average daily net assets, subject to a maximum tot al reimbursement to the Fund equal to 0.25% of the Fund's average daily net assets.
23
GMO Global Bond Fund
(A Series of GMO Trust)
Notes to Financial Statements — (Continued)
February 28, 2009
The Fund incurs fees and expenses indirectly as a shareholder in the underlying funds. For the year ended February 28, 2009, these indirect fees and expenses expressed as an annualized percentage of the Fund's average daily net assets were as follows:
| Indirect Net Expenses (excluding shareholder service fees and interest expense) | Indirect Shareholder Service Fees | Indirect Interest Expense | Total Indirect Expenses | ||||||||||||
| 0.017 | % | 0.004 | % | 0.007 | % | 0.028 | % | ||||||||
The Fund's portion of the fees paid by the Trust to the Trust's independent Trustees and CCO during the year ended February 28, 2009 was $7,524 and $2,173, respectively. The compensation and expenses of the CCO are included in miscellaneous expenses in the Statement of Operations. The Fund paid no remuneration to any other officer of the Trust.
4. Purchases and sales of securities
For the year ended February 28, 2009, cost of purchases and proceeds from sales of investments, other than short-term obligations, were as follows:
| Purchases | Sales | ||||||||||
| U.S. Government securities | $ | 11,563,370 | $ | 3,000,000 | |||||||
| Investments (non-U.S. Government securities) | 118,766,166 | 99,877,534 | |||||||||
5. Guarantees
In the normal course of business the Fund enters into contracts with third-party service providers that contain a variety of representations and warranties and that provide general indemnifications. The Fund's maximum exposure under these arrangements is unknown, as it involves future claims that may be made against the Fund that have not yet occurred. Based on experience, management is of the view that the risk of loss in connection with its indemnification obligations is remote; however, there can be no assurance that such obligations will not result in material liabilities that adversely affect the Fund.
6. Principal shareholders and related parties
As of February 28, 2009, 64.29% of the outstanding shares of the Fund were held by three shareholders, each holding more than 10% of the Fund's outstanding shares. On that date, no other shareholder owned more than 10% of the outstanding shares of the Fund. Redemptions from (or investments into) the Fund by or on behalf of these large shareholders may have a material effect on the Fund.
24
GMO Global Bond Fund
(A Series of GMO Trust)
Notes to Financial Statements — (Continued)
February 28, 2009
As of February 28, 2009, 0.01% of the Fund's shares were held by senior management of the Manager and GMO Trust officers and 31.30% of the Fund's shares were held by accounts for which the Manager had investment discretion.
7. Share transactions
The Declaration of Trust permits the Trust to issue an unlimited number of shares of beneficial interest (without par value). Transactions in Fund shares were as follows:
| Year Ended February 28, 2009 | Year Ended February 29, 2008 | ||||||||||||||||||
| Class III: | Shares | Amount | Shares | Amount | |||||||||||||||
| Shares sold | 1,411,603 | $ | 12,089,225 | 15,937,195 | $ | 139,052,495 | |||||||||||||
| Shares issued to shareholders in reinvestment of distributions | 2,363,492 | 19,546,079 | 2,820,633 | 23,399,087 | |||||||||||||||
| Shares repurchased | (1,373,474 | ) | (11,349,226 | ) | (606,251 | ) | (5,256,109 | ) | |||||||||||
| Redemption fees | — | 13,923 | — | — | |||||||||||||||
| Net increase (decrease) | 2,401,621 | $ | 20,300,001 | 18,151,577 | $ | 157,195,473 | |||||||||||||
8. Investments in affiliated issuers
A summary of the Fund's transactions in the shares of other funds of the Trust during the year ended February 28, 2009 is set forth below:
| Affiliate | Value, beginning of period | Purchases | Sales Proceeds | Dividend Income | Distributions of Realized Gains | Value, end of period | |||||||||||||||||||||
| GMO Emerging Country Debt Fund, Class III | $ | 9,885,128 | $ | 2,400,195 | $ | — | $ | 891,388 | $ | 208,806 | $ | 7,736,793 | |||||||||||||||
| GMO Short-Duration Collateral Fund | 241,749,211 | 69,343,808 | 85,200,000 | 10,071,569 | u | — | 159,431,112 | ||||||||||||||||||||
| GMO Special Purpose Holding Fund | 57,756 | — | — | — | 103,806 | 33,462 | |||||||||||||||||||||
| GMO World Opportunity Overlay Fund | 66,066,597 | 9,600,000 | 11,100,000 | — | — | 46,286,913 | |||||||||||||||||||||
| Totals | $ | 317,758,692 | $ | 81,344,003 | $ | 96,300,000 | $ | 10,962,957 | $ | 312,612 | $ | 213,488,280 | |||||||||||||||
u The Fund received total distributions in the amount of $30,745,194, of which $20,673,625 was a return of capital.
25
Report of Independent Registered Public Accounting Firm
To the Trustees of GMO Trust and the Shareholders of
GMO Global Bond Fund:
In our opinion, the accompanying statement of assets and liabilities, including the schedule of investments, and the related statements of operations and of changes in net assets and the financial highlights present fairly, in all material respects, the financial position of GMO Global Bond Fund (the "Fund") at February 28, 2009, the results of its operations for the year then ended, the changes in its net assets for each of the two years in the period then ended and the financial highlights for each of the five years in the period then ended, in conformity with accounting principles generally accepted in the United States of America. These financial statements and financial highlights (hereafter referred to as "financial statements") are the responsibility of the Fund's management. Our responsibility is to express an opinion on these financial statements based on our audits. We conducted our audits of these financial statements in accordance with the standards of the Public Company Accounting Oversight Board (United States). Those standards require that we plan and perform the audit to obtain reasonable assurance about whether the financial statements are free of material misstatement. An audit includes examining, on a test basis, evidence supporting the amounts and disclosures in the financial statements, assessing the accounting principles used and significant estimates made by management, and evaluating the overall financial statement presentation. We believe that our audits, which included confirmation of securities at February 28, 2009 by correspondence with the custodian and brokers, provide a reasonable basis for our opinion.
PricewaterhouseCoopers LLP
Boston, Massachusetts
April 29, 2009
26
GMO Global Bond Fund
(A Series of GMO Trust)
Fund Expenses
February 28, 2009 (Unaudited)
Expense Examples: The following information is in relation to expenses for the six month period ended February 28, 2009.
As a shareholder of the Fund, you may incur two types of costs: (1) transaction costs including redemption fees and (2) ongoing costs, including management fees, shareholder service fees, and other Fund expenses. This example is intended to help you understand your ongoing costs (in dollars) of investing in the Fund and to compare these costs with the ongoing costs of investing in other mutual funds.
These examples are based on an investment of $1,000 invested at the beginning of the period and held for the entire period, September 1, 2008 through February 28, 2009.
Actual Expenses
The first line of the table below provides information about actual account values and actual expenses. You may use the information in this line, together with the amount you invested, to estimate the expenses that you paid over the period. Simply divide your account value by $1,000 (for example, a $10,000,000 account value divided by $1,000 = 10,000), then multiply the result by the number in the first line under the heading entitled "Net Expense Incurred" to estimate the expenses you paid on your account during this period.
Hypothetical Example for Comparison Purposes
The second line of the table below provides information about hypothetical account values and hypothetical expenses based on the Fund's actual expense ratio and an assumed rate of return of 5% per year before expenses, which is not the Fund's actual return. The hypothetical account values and expenses may not be used to estimate the actual ending account balance or expenses you paid for the period. You may use this information to compare the ongoing costs of investing in the Fund with other funds. To do so, compare this 5% hypothetical example with the 5% hypothetical examples that appear in the shareholder reports of other funds.
Please note that the expenses shown in the table are meant to highlight your ongoing costs only and do not reflect any transactional costs, such as purchase premiums and redemption fees. Therefore, the second line of the table is useful in comparing ongoing costs only, and will not help you determine the relative total costs of owning different funds. In addition, if these transactional costs were included, your costs would have been higher.
| Annualized Net Expense Ratio | Beginning Account Value | Ending Account Value | Net Expense Incurred* | ||||||||||||||||
| Class III | |||||||||||||||||||
| 1) Actual | 0.42 | % | $ | 1,000.00 | $ | 810.50 | $ | 1.89 | |||||||||||
| 2) Hypothetical | 0.42 | % | $ | 1,000.00 | $ | 1,022.71 | $ | 2.11 | |||||||||||
* Expenses are calculated using the Class's annualized expense ratio (including indirect expenses incurred) for the six months ended February 28, 2009, multiplied by the average account value over the period, multiplied by 181 days in the period, divided by 365 days in the year.
27
GMO Global Bond Fund
(A Series of GMO Trust)
Tax Information for the Tax Year Ended February 28, 2009 (Unaudited)
The Fund will notify shareholders of amounts for use in preparing 2009 income tax forms in early 2010.
28
Trustees and Officers (Unaudited)
The following tables list the Trust's Trustees and Officers as of the date of this report; their address and date of birth ("DOB"); their position with the Trust; the length of time holding that position with the Trust; their principal occupation(s) during the past five years; the number of portfolios in the fund complex they oversee; and other directorships they hold in companies subject to registration or reporting requirements of the Securities Exchange Act of 1934 (generally called "public companies") or in registered investment companies. The Trust's Statement of Additional Information ("SAI") includes additional information about the Trust's trustees, including changes subsequent to the date of the report. The SAI is available, without charge, upon request by writing GMO, c/o GMO Trust, 40 Rowes Wharf, Boston, MA 02110.
Independent Trustees:
| Name, Address, and DOB | Position(s) Held with Trust | Term of Office1 and Length of Time Served | Principal Occupation(s) During Past Five Years | Number of Portfolios in Fund Complex Overseen by Trustee | Other Directorships Held by Trustee | ||||||||||||||||||
| Donald W. Glazer, Esq. c/o GMO Trust 40 Rowes Wharf Boston, MA 02110 DOB: 07/26/1944 | Chairman of the Board of Trustees | Chairman of the Board of Trustees since March 2005; Lead Independent Trustee (September 2004 – March 2005); Trustee since December 2000. | Consultant – Law and Business2; Author of Legal Treatises. | 59 | None. | ||||||||||||||||||
1 Each Trustee is elected to serve during the continued lifetime of the Trust until he/she dies, resigns or is removed, or if sooner, until the next meeting of Shareholders called for the purpose of electing Trustees and until the election and qualification of his/her successor.
2 As part of Mr. Glazer's work as a consultant, he provides part-time consulting services to Goodwin Procter LLP ("Goodwin"). Goodwin has provided legal services to Renewable Resources, LLC, an affiliate of GMO; GMO, in connection with its relationship with Renewable Resources; and funds managed by Renewable Resources. Mr. Glazer has represented that he has no financial interest in, and is not involved in the provision of, such legal services. In the calendar years ended December 31, 2007 and December 31, 2008, these entities paid $789,416 and $183,864 respectively, in legal fees and disbursements to Goodwin. In correspondence with the Staff of the Securities and Exchange Commission beginning in August 2006, the Independent Trustees' legal counsel provided the Staff with information regarding Mr. Glazer's relationship with Goodwin and h is other business activities. On September 11, 2007, based on information that had been given to the Staff as of that date, the Staff provided oral no-action assurance consistent with the opinion of the Independent Trustees' legal counsel that Mr. Glazer is not an "interested person" of the Trust.
29
Independent Trustees — (Continued)
| Name, Address, and DOB | Position(s) Held with Trust | Term of Office1 and Length of Time Served | Principal Occupation(s) During Past Five Years | Number of Portfolios in Fund Complex Overseen by Trustee | Other Directorships Held by Trustee | ||||||||||||||||||
| W. Nicholas Thorndike c/o GMO Trust 40 Rowes Wharf Boston, MA 02110 DOB: 03/28/1933 | Trustee | Since March 2005. | Director or trustee of various corporations and charitable organizations, including Courier Corporation (a book publisher and manufacturer) (July 1989 – present); Putnam Funds (December 1992 – June 2004); and Providence Journal (a newspaper publisher) (December 1986 – December 2003). | 59 | Director of Courier Corporation (a book publisher and manufacturer); Member of the Investment Committee of Partners HealthCare System, Inc.3 | ||||||||||||||||||
| Peter Tufano c/o GMO Trust 40 Rowes Wharf Boston, MA 02110 DOB: 04/22/1957 | Trustee | Since December 2008. | Sylvan C. Coleman Professor of Financial Management, Harvard Business School (since 1989). | 59 | Trustee of State Street Navigator Securities Lending Trust (3 Portfolios). | ||||||||||||||||||
1 Each Trustee is elected to serve during the continued lifetime of the Trust until he/she dies, resigns or is removed, or if sooner, until the next meeting of Shareholders called for the purpose of electing Trustees and until the election and qualification of his/her successor.
3 Partners HealthCare System, Inc. is a client of the Manager.
30
Principal Officers:
| Name, Address, and DOB | Position(s) Held with Trust | Term of Office4 and Length of Time Served | Principal Occupation(s) During Past Five Years5 | ||||||||||||
| J.B. Kittredge DOB: 08/22/1954 | President and Chief Executive Officer | Since March 2009. | General Counsel, Grantham, Mayo, Van Otterloo & Co. LLC (October 2005 – Present); Partner, Ropes & Gray LLP. | ||||||||||||
| Sheppard N. Burnett c/o GMO Trust 40 Rowes Wharf Boston, MA 02110 DOB: 10/24/1968 | Treasurer and Chief Financial Officer | Chief Financial Officer since March 2007; Treasurer since November 2006; Assistant Treasurer, September 2004 – November 2006. | Fund Administration Staff, Grantham, Mayo, Van Otterloo & Co. LLC (June 2004 – present); Vice President, Director of Tax, Columbia Management Group (2002 – 2004). | ||||||||||||
| Brent C. Arvidson c/o GMO Trust 40 Rowes Wharf Boston, MA 02110 DOB: 06/26/1969 | Assistant Treasurer | Since August 1998. | Senior Fund Administrator, Grantham, Mayo, Van Otterloo & Co. LLC. | ||||||||||||
| John L. Nasrah c/o GMO Trust 40 Rowes Wharf Boston, MA 02110 DOB: 05/27/1977 | Assistant Treasurer | Since March 2007. | Fund Administrator, Grantham, Mayo, Van Otterloo & Co. LLC (September 2004 – present); Tax Analyst, Bain & Company, Inc. (June 2003 – September 2004). | ||||||||||||
| Mahmoodur Rahman c/o GMO Trust 40 Rowes Wharf Boston, MA 02110 DOB: 11/30/1967 | Assistant Treasurer | Since September 2007. | Fund Administrator, Grantham, Mayo, Van Otterloo & Co. LLC (April 2007 – present); Vice President and Senior Tax Manager, Massachusetts Financial Services Company (January 2000 – April 2007). | ||||||||||||
| Michael E. Gillespie c/o GMO Trust 40 Rowes Wharf Boston, MA 02110 DOB: 02/18/1958 | Chief Compliance Officer | Since March 2005. | Vice President of Compliance (June 2004 – February 2005) and Director of Domestic Compliance (March 2002 – June 2004), Fidelity Investments. | ||||||||||||
4 Each officer is elected to hold such office until his or her successor is duly elected and qualified to carry out the duties and responsibilities of the office, or until he or she resigns or is removed from office.
5 Each of Messrs. Burnett, Arvidson, Bohan, and Pottle serves as an officer and/or director of certain pooled investment vehicles of which GMO or an affiliate of GMO serves as the investment adviser.
31
Principal Officers — (Continued)
| Name, Address, and DOB | Position(s) Held with Trust | Term of Office4 and Length of Time Served | Principal Occupation(s) During Past Five Years5 | ||||||||||||
| Jason B. Harrison c/o GMO Trust 40 Rowes Wharf Boston, MA 02110 DOB: 01/29/1977 | Vice President and Clerk | Vice President since November 2006; Clerk since March 2006. | Legal Counsel, Grantham, Mayo, Van Otterloo & Co. LLC (since February 2006) and Attorney, Ropes & Gray LLP (September 2002 – February 2006). | ||||||||||||
| David L. Bohan c/o GMO Trust 40 Rowes Wharf Boston, MA 02110 DOB: 06/21/1964 | Vice President and Assistant Clerk | Vice President since March 2005; Assistant Clerk since March 2006. | Legal Counsel, Grantham, Mayo, Van Otterloo & Co. LLC. | ||||||||||||
| Gregory L. Pottle c/o GMO Trust 40 Rowes Wharf Boston, MA 02110 DOB: 07/09/1971 | Vice President and Assistant Clerk | Since November 2006. | Legal Counsel, Grantham, Mayo, Van Otterloo & Co. LLC. | ||||||||||||
| Anne K. Trinque c/o GMO Trust 40 Rowes Wharf Boston, MA 02110 DOB: 04/15/1978 | Vice President and Assistant Clerk | Since September 2007. | Legal Counsel, Grantham, Mayo, Van Otterloo & Co. LLC (January 2007 – present); Attorney, Goodwin Procter LLP (September 2003 – January 2007). | ||||||||||||
| Cheryl Wakeham c/o GMO Trust 40 Rowes Wharf Boston, MA 02110 DOB: 10/29/1958 | Vice President and Anti-Money Laundering Officer | Since December 2004. | Manager, Client Service Administration, Grantham, Mayo, Van Otterloo & Co. LLC. | ||||||||||||
4 Each officer is elected to hold such office until his or her successor is duly elected and qualified to carry out the duties and responsibilities of the office, or until he or she resigns or is removed from office.
5 Each of Messrs. Burnett, Arvidson, Bohan, and Pottle serves as an officer and/or director of certain pooled investment vehicles of which GMO or an affiliate of GMO serves as the investment adviser.
32
GMO Alternative Asset Opportunity Fund
(A Series of GMO Trust)
Consolidated Annual Report
February 28, 2009
For a free copy of the Fund's proxy voting guidelines, shareholders may call 1-617-346-7646 (collect) or visit the Securities and Exchange Commission's website at www.sec.gov. Information regarding how the Fund voted proxies relating to portfolio securities during the most recent 12-month period ended June 30 is available on GMO's website at www.gmo.com, or on the Securities and Exchange Commission's website at www.sec.gov.
The Fund files its complete schedule of portfolio holdings with the Securities and Exchange Commission for the first and third quarter of each fiscal year on Form N-Q, which is available on the Commission's website at www.sec.gov. The Fund's Form N-Q may be reviewed and copied at the Commission's Public Reference Room in Washington, D.C. Information on the operation of the Public Reference Room may be obtained by calling 1-800-SEC-0330.
This report is prepared for the general information of shareholders. It is authorized for distribution to prospective investors only when preceded or accompanied by a private placement memorandum, which contains a complete discussion of the risks associated with an investment in this Fund and other important information. The private placement memorandum can be obtained by calling 1-617-346-7646 (collect).
GMO Alternative Asset Opportunity Fund
(A Series of GMO Trust)
Portfolio Management
Day-to-day management of the Fund's portfolio is the responsibility of the Fixed Income team at Grantham, Mayo, Van Otterloo & Co. LLC.
Management Discussion and Analysis of Fund Performance
The Alternative Asset Opportunity Fund returned -33.7% for the fiscal year ended February 28, 2009, as compared to -27.1% for the Alternative Asset Opportunity (50% Dow Jones-AIG Commodity Index / 50% JPMorgan U.S. 3 Month Cash Index) Index.
The Fund underperformed its benchmark, the Alternative Asset Opportunity Index (50% Dow Jones-AIG Commodity Index / 50% JPMorgan U.S. 3 Month Cash Index), by 6.6% during the fiscal year.
Commodity prices fell broadly during the fiscal year: energy commodity prices fell the most, by 54% to 64%, followed by grain commodity prices, which fell by 27% to 58%. Metal, soft, and meat commodity prices also fell, by 6% to 60%, 2% to 57%, and 16% to 25%, respectively.
Losses from the Fund's exposure to the GMO Short Duration Collateral Fund (SDCF), which invests primarily in asset-backed securities, more than offset gains from commodity performance, as negative momentum in the asset-backed market accelerated during the fiscal year. The SDCF investment collateralizes the commodities positions, which are achieved in the futures markets.
Overall commodity performance was positive during the fiscal year as the Fund correctly positioned for falling prices in cotton, live cattle, lean hog, and soy oil contracts.
Sugar, soy meal, crude oil, and cocoa contracts were the largest negative commodity contributors for the fiscal year, as negative performance came from incorrectly positioning the prices of these contracts.
The views expressed herein are exclusively those of Grantham, Mayo, Van Otterloo & Co. LLC Management as of the date of this report and are subject to change. GMO disclaims any responsibility to update such views. They are not meant as investment advice. References to specific securities are not recommendations of such securities and may not be representative of any GMO portfolio's current or future investments.
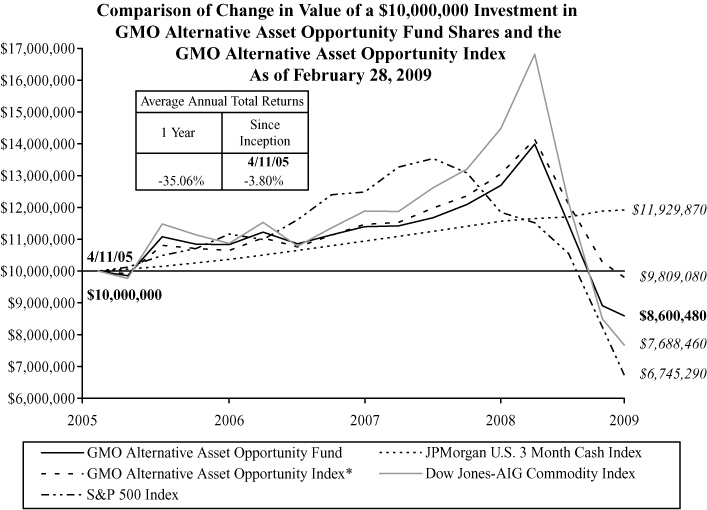
Performance data quoted represents past performance and is not indicative of future results. The investment return and principal value of an investment will fluctuate so that an investor's shares, when redeemed, may be worth more or less than their original cost. Current performance data may be lower or higher than the performance data provided herein. To obtain performance information to the most recent month-end, visit www.gmo.com. Performance shown is net of all fees after reimbursement from the Manager. Each performance figure assumes a redemption at the end of the stated period and reflects a transaction fee of 2.00% on the redemption. Transaction fees are retained by the Fund to cover trading costs. Returns would have been lower had certain expenses not been reimbursed during the periods shown and do not include the effect of taxes on distributions and redem ptions. All information is unaudited.
* The GMO Alternative Asset Opportunity Index is a composite benchmark computed by GMO and comprised of 50% Dow Jones-AIG Commodity Index and 50% JPMorgan U.S. 3 Month Cash Index.
GMO Alternative Asset Opportunity Fund
(A Series of GMO Trust)
Consolidated Investments Concentration Summary (a)
February 28, 2009 (Unaudited)
| Asset Class Summary* | % of Total Net Assets | ||||||
| Debt Obligations | 96.6 | % | |||||
| Short-Term Investments | 3.4 | ||||||
| Swaps | 0.3 | ||||||
| Futures | 0.3 | ||||||
| Forward Currency Contracts | 0.0 | ||||||
| Other | (0.6 | ) | |||||
| 100.0 | % | ||||||
(a) GMO Alternative Asset SPC Ltd. is a 100% owned subsidiary of GMO Alternative Asset Opportunity Fund.
* The table above incorporates aggregate indirect asset class exposure associated with investments in other funds of GMO Trust ("underlying funds").
1
GMO Alternative Asset Opportunity Fund
(A Series of GMO Trust)
Consolidated Schedule of Investments
(showing percentage of total net assets)
February 28, 2009
| Par Value ($) / Shares | Description | Value ($) | |||||||||
| DEBT OBLIGATIONS — 26.7% | |||||||||||
| U.S. Government — 26.7% | |||||||||||
| 6,050,154 | U.S. Treasury Inflation Indexed Bond, 0.88%, due 04/15/10 (a) (b) (c) | 5,968,852 | |||||||||
| TOTAL DEBT OBLIGATIONS (COST $5,982,086) | 5,968,852 | ||||||||||
| MUTUAL FUNDS — 71.5% | |||||||||||
| Affiliated Issuers — 71.5% | |||||||||||
| 936,264 | GMO Short-Duration Collateral Fund | 16,010,119 | |||||||||
| TOTAL MUTUAL FUNDS (COST $21,311,450) | 16,010,119 | ||||||||||
| SHORT-TERM INVESTMENTS— 1.6% | |||||||||||
| Money Market Funds — 1.6% | |||||||||||
| 135,371 | SSgA USD Liquidity Fund-Class I Stable NAV Shares (c) (d) | 135,371 | |||||||||
| 216,563 | State Street Institutional Treasury Plus Money Market Fund-Institutional Class | 216,563 | |||||||||
| TOTAL MONEY MARKET FUNDS (COST $351,934) | 351,934 | ||||||||||
| TOTAL SHORT-TERM INVESTMENTS (COST $351,934) | 351,934 | ||||||||||
| TOTAL INVESTMENTS — 99.8% (Cost $27,645,470) | 22,330,905 | ||||||||||
| Other Assets and Liabilities (net) — 0.2% | 57,962 | ||||||||||
| TOTAL NET ASSETS — 100.0% | $ | 22,388,867 | |||||||||
See accompanying notes to the financial statements.
2
GMO Alternative Asset Opportunity Fund
(A Series of GMO Trust)
Consolidated Schedule of Investments — (Continued)
February 28, 2009
A summary of outstanding financial instruments at February 28, 2009 is as follows:
Futures Contracts (c)
| Number of Contracts | Type | Expiration Date | Contract Value | Net Unrealized Appreciation (Depreciation) | |||||||||||||||
| Buys | |||||||||||||||||||
| 11 | Cocoa | May 2009 | $ | 265,430 | $ | (38,550 | ) | ||||||||||||
| 4 | Copper | May 2009 | 153,850 | 3,596 | |||||||||||||||
| 4 | Crude Oil | April 2009 | 179,040 | 9,884 | |||||||||||||||
| 4 | Gold 100 OZ | April 2009 | 377,000 | (4,747 | ) | ||||||||||||||
| 4 | Heating Oil | April 2009 | 212,940 | 16,364 | |||||||||||||||
| 1 | Natural Gas | April 2009 | 41,980 | 26 | |||||||||||||||
| $ | 1,230,240 | $ | (13,427 | ) | |||||||||||||||
| Sales | |||||||||||||||||||
| 15 | Corn | May 2009 | $ | 269,250 | $ | (1,189 | ) | ||||||||||||
| 10 | Coffee "C" | May 2009 | 419,625 | 18,027 | |||||||||||||||
| 17 | Cotton No. 2 | May 2009 | 367,710 | 31,481 | |||||||||||||||
| 28 | Lean Hogs | April 2009 | 682,080 | 21,128 | |||||||||||||||
| 23 | Live Cattle | April 2009 | 790,510 | (914 | ) | ||||||||||||||
| 3 | Silver | May 2009 | 196,650 | 15,250 | |||||||||||||||
| 8 | Soybean | May 2009 | 348,800 | 6,366 | |||||||||||||||
| 5 | Soybean Meal | May 2009 | 134,900 | 2,465 | |||||||||||||||
| 3 | Soybean Oil | May 2009 | 55,998 | (697 | ) | ||||||||||||||
| 27 | Sugar (World) | May 2009 | 415,195 | (8,597 | ) | ||||||||||||||
| 11 | Wheat | May 2009 | 286,825 | 503 | |||||||||||||||
| $ | 3,967,543 | $ | 83,823 | ||||||||||||||||
See accompanying notes to the financial statements.
3
GMO Alternative Asset Opportunity Fund
(A Series of GMO Trust)
Consolidated Schedule of Investments — (Continued)
February 28, 2009
Swap Agreements (c)
Total Return Swaps
| Notional Amount | Expiration Date | Counterparty | Pay | Receive | Market Value | ||||||||||||||||||||||
| 8,435,866 | USD | 4/14/2009 | Barclays Capital | 1 month | Return on DJ-AIG | ||||||||||||||||||||||
| T-Bill + 0.19% | Commodity | ||||||||||||||||||||||||||
| Total Return Index (b) | $ | 200,753 | |||||||||||||||||||||||||
| $ | 200,753 | ||||||||||||||||||||||||||
| Premiums to (Pay) Receive | $ | — | |||||||||||||||||||||||||
As of February 28, 2009, for the futures and/or swap contracts held, the Fund had sufficient cash and/or securities to cover any commitments or margin requirements of the relevant broker or exchange.
Notes to Consolidated Schedule of Investments:
(a) All or a portion of this security has been segregated to cover margin requirements on open financial futures contracts and/or open swap contracts (Note 2).
(b) Indexed security in which price and/or coupon is linked to the price of a specific instrument or financial statistic (Note 2).
(c) All or a portion of this security is owned by GMO Alternative Asset SPC Ltd., which is a 100% owned subsidiary of GMO Alternative Asset Opportunity Fund.
(d) Fund is domiciled in Ireland.
Currency Abbreviations:
USD - United States Dollar
See accompanying notes to the financial statements.
4
GMO Alternative Asset Opportunity Fund
(A Series of GMO Trust)
Consolidating Statement of Assets and Liabilities — February 28, 2009
| GMO Alternative Asset Opportunity Fund | GMO Alternative Asset SPC Ltd. | Eliminations | Consolidated Totals | ||||||||||||||||
| Assets: | |||||||||||||||||||
| Investments in unaffiliated issuers, at value (consolidated cost $6,334,020) (Note 2) | $ | 216,563 | $ | 6,104,223 | $ | — | $ | 6,320,786 | |||||||||||
| Investments in affiliated issuers, at value (consolidated cost $21,311,450) (Note 2) | 22,264,445 | — | (6,254,326 | ) | 16,010,119 | ||||||||||||||
| Dividends and interest receivable | 8 | 18,346 | — | 18,354 | |||||||||||||||
| Receivable for open swap contracts (Note 2) | — | 200,753 | 200,753 | ||||||||||||||||
| Receivable for expenses reimbursed by Manager (Note 3) | 9,046 | 7,504 | — | 16,550 | |||||||||||||||
| Total assets | 22,490,062 | 6,330,826 | (6,254,326 | ) | 22,566,562 | ||||||||||||||
| Liabilities: | |||||||||||||||||||
| Payable for variation margin on open futures contracts (Note 2) | — | 7,203 | 7,203 | ||||||||||||||||
| Payable to affiliate for (Note 3): | |||||||||||||||||||
| Management fee | 7,752 | — | — | 7,752 | |||||||||||||||
| Shareholder service fee | 2,584 | — | — | 2,584 | |||||||||||||||
| Trustees and Chief Compliance Officer of GMO Trust fees | 67 | — | — | 67 | |||||||||||||||
| Accrued expenses | 90,792 | 69,297 | — | 160,089 | |||||||||||||||
| Total liabilities | 101,195 | 76,500 | — | 177,695 | |||||||||||||||
| Net assets | $ | 22,388,867 | $ | 6,254,326 | $ | (6,254,326 | ) | $ | 22,388,867 | ||||||||||
| Shareholders' capital | $ | 22,388,867 | $ | 22,388,867 | |||||||||||||||
| Shares outstanding | 1,020,688 | 1,020,688 | |||||||||||||||||
| Net asset value per share | $ | 21.94 | $ | 21.94 | |||||||||||||||
See accompanying notes to the financial statements.
5
GMO Alternative Asset Opportunity Fund
(A Series of GMO Trust)
Consolidating Statement of Operations — For the Year Ended February 28, 2009
| GMO Alternative Asset Opportunity Fund | GMO Alternative Asset SPC Ltd. | Eliminations | Consolidated Totals | ||||||||||||||||
| Investment Income: | |||||||||||||||||||
| Dividends from affiliated issuers (Note 8) | $ | 1,004,960 | $ | — | $ | — | $ | 1,004,960 | |||||||||||
| Dividends | 38 | 19,228 | — | 19,266 | |||||||||||||||
| Interest | 551 | 106,595 | — | 107,146 | |||||||||||||||
| Total income (loss) | 1,005,549 | 125,823 | — | 1,131,372 | |||||||||||||||
| Expenses: | |||||||||||||||||||
| Management fee (Note 3) | 132,631 | — | — | 132,631 | |||||||||||||||
| Shareholder service fee (Note 3) | 44,210 | — | — | 44,210 | |||||||||||||||
| Custodian and transfer agent fees | 2,703 | 83,720 | — | 86,423 | |||||||||||||||
| Audit and tax fees | 92,798 | 18,473 | — | 111,271 | |||||||||||||||
| Legal fees | 5,863 | 2,200 | — | 8,063 | |||||||||||||||
| Trustees fees and related expenses (Note 3) | 527 | — | — | 527 | |||||||||||||||
| Miscellaneous | 1,928 | 6,770 | — | 8,698 | |||||||||||||||
| Total expenses | 280,660 | 111,163 | — | 391,823 | |||||||||||||||
| Fees and expenses reimbursed by Manager (Note 3) | (103,291 | ) | (111,163 | ) | — | (214,454 | ) | ||||||||||||
| Expense Reduction | (279 | ) | (279 | ) | |||||||||||||||
| Net expenses | 177,090 | — | — | 177,090 | |||||||||||||||
| Net investment income (loss) | 828,459 | 125,823 | — | 954,282 | |||||||||||||||
| Realized and unrealized gain (loss): | |||||||||||||||||||
| Net realized gain (loss) on: | |||||||||||||||||||
| Investments in unaffiliated issuers | — | (198,109 | ) | — | (198,109 | ) | |||||||||||||
| Investments in affiliated issuers | (168,878 | ) | — | — | (168,878 | ) | |||||||||||||
| Closed futures contracts | — | 1,324,997 | — | 1,324,997 | |||||||||||||||
| Closed swap contracts | — | (7,490,504 | ) | — | (7,490,504 | ) | |||||||||||||
| Net realized gain (loss) | (168,878 | ) | (6,363,616 | ) | — | (6,532,494 | ) | ||||||||||||
| Change in net unrealized appreciation (depreciation) on: | |||||||||||||||||||
| Investments in unaffiliated issuers | — | (22,071 | ) | — | (22,071 | ) | |||||||||||||
| Investments in affiliated issuers | (12,114,464 | ) | — | 7,818,266 | (4,296,198 | ) | |||||||||||||
| Open futures contracts | — | (76,829 | ) | — | (76,829 | ) | |||||||||||||
| Open swap contracts | — | (1,481,573 | ) | — | (1,481,573 | ) | |||||||||||||
| Net unrealized gain (loss) | (12,114,464 | ) | (1,580,473 | ) | 7,818,266 | (5,876,671 | ) | ||||||||||||
| Net realized and unrealized gain (loss) | (12,283,342 | ) | (7,944,089 | ) | 7,818,266 | (12,409,165 | ) | ||||||||||||
| Net increase (decrease) in net assets resulting from operations | $ | (11,454,883 | ) | $ | (7,818,266 | ) | $ | 7,818,266 | $ | (11,454,883 | ) | ||||||||
See accompanying notes to the financial statements.
6
GMO Alternative Asset Opportunity Fund
(A Series of GMO Trust)
Consolidated Statement of Changes in Net Assets
| Year Ended February 28, 2009 | Year Ended February 29, 2008 | ||||||||||
| Increase (decrease) in net assets: | |||||||||||
| Operations: | |||||||||||
| Net investment income (loss) | $ | 954,282 | $ | 2,400,062 | |||||||
| Net realized gain (loss) | (6,532,494 | ) | 2,207,780 | ||||||||
| Change in net unrealized appreciation (depreciation) | (5,876,671 | ) | (3,054,525 | ) | |||||||
| Net increase (decrease) in net assets from operations | (11,454,883 | ) | 1,553,317 | ||||||||
| Fund share transactions: (Note 7) | |||||||||||
| Proceeds from sale of shares | 388 | 3,431,990 | |||||||||
| Cost of shares repurchased | (131,245 | ) | (145,526,957 | ) | |||||||
| Redemption fees | 2,617 | — | |||||||||
| Net increase (decrease) in Fund share transactions | (128,240 | ) | (142,094,967 | ) | |||||||
| Total increase (decrease) in net assets | (11,583,123 | ) | (140,541,650 | ) | |||||||
| Net assets: | |||||||||||
| Beginning of period | 33,971,990 | 174,513,640 | |||||||||
| End of period | $ | 22,388,867 | $ | 33,971,990 | |||||||
See accompanying notes to the financial statements.
7
GMO Alternative Asset Opportunity Fund
(A Series of GMO Trust)
Consolidated Financial Highlights
(For a share outstanding throughout each period)
| Year Ended February 28/29, | |||||||||||||||||||
| 2009 | 2008 | 2007 | 2006(a) | ||||||||||||||||
| Net asset value, beginning of period | $ | 33.11 | $ | 28.54 | $ | 26.63 | $ | 25.00 | |||||||||||
| Income (loss) from investment operations: | |||||||||||||||||||
| Net investment income (loss)(b)† | 0.93 | 0.69 | 1.28 | 0.73 | |||||||||||||||
| Net realized and unrealized gain (loss) | (12.10 | ) | 3.88 | (c) | 0.63 | 0.90 | |||||||||||||
| Total from investment operations | (11.17 | ) | 4.57 | 1.91 | 1.63 | ||||||||||||||
| Net asset value, end of period | $ | 21.94 | $ | 33.11 | $ | 28.54 | $ | 26.63 | |||||||||||
| Total Return(d) | (33.74 | )% | 16.01 | % | 7.17 | % | 6.52 | %** | |||||||||||
| Ratios/Supplemental Data: | |||||||||||||||||||
| Net assets, end of period (000's) | $ | 22,389 | $ | 33,972 | $ | 174,514 | $ | 181,947 | |||||||||||
| Net expenses to average daily net assets(e) | 0.60 | %(f) | 0.60 | % | 0.60 | % | 0.61 | %* | |||||||||||
| Net investment income to average daily net assets(b) | 3.24 | % | 2.41 | % | 4.60 | % | 3.12 | %* | |||||||||||
| Portfolio turnover rate | 89 | % | 24 | % | 12 | % | 13 | %** | |||||||||||
| Fees and expenses reimbursed by the Manager to average daily net assets: | 0.73 | % | 0.21 | % | 0.12 | % | 0.15 | %* | |||||||||||
| Redemption fees consisted of the following per share amounts:† | $ | 0.00 | (g) | — | — | — | |||||||||||||
(a) Period from April 11, 2005 (commencement of operations) to February 28, 2006.
(b) Net investment income is affected by the timing of the declaration of dividends by the underlying funds in which the Fund invests.
(c) The amount shown for a share outstanding does not correspond with the aggregate net realized and unrealized gain (loss) on investments due to the timing of purchases and redemptions of Fund shares in relation to fluctuating market values of the investments of the Fund.
(d) Total returns would have been lower had certain expenses not been reimbursed during the periods shown and assumes the effect of reinvested distributions. Calculation excludes redemption fees which are borne by the shareholder.
(e) Net expenses exclude expenses incurred indirectly through investment in the underlying funds (See Note 3).
(f) The net expense ratio does not include the effect of expense reductions.
(g) Redemption fees were less than $0.01 per share.
† Calculated using average shares outstanding throughout the period.
* Annualized.
** Not annualized.
See accompanying notes to the financial statements.
8
GMO Alternative Asset Opportunity Fund
(A Series of GMO Trust)
Notes to Consolidated Financial Statements
February 28, 2009
1. Organization
GMO Alternative Asset Opportunity Fund (the "Fund") is a series of GMO Trust (the "Trust"). The Fund is registered under the Investment Company Act of 1940, as amended, as an open-end, non-diversified management investment company. The Fund is advised and managed by Grantham, Mayo, Van Otterloo & Co. LLC (the "Manager" or "GMO"). The Trust was established as a Massachusetts business trust under the laws of The Commonwealth of Massachusetts on June 24, 1985. The Declaration of Trust permits the Trustees of the Trust ("Trustees") to create an unlimited number of series of shares ("Funds") and to subdivide Funds into classes.
The Fund seeks total return greater than that of its benchmark. The Fund's benchmark is a composite of the Dow Jones-AIG Commodity Index (50%) and the JPMorgan U.S. 3 Month Cash Index (50%). The Fund seeks indirect exposure to investment returns of commodities and, from time to time, other alternative asset classes (e.g., currencies). The Fund's investment program has two primary components. One component is intended to gain indirect exposure to the commodity markets through the Fund's investments in a wholly-owned subsidiary company, which, in turn, invests in various commodity-related derivatives. The second component of the Fund's investment program consists of direct and indirect investments in high quality U.S. and foreign fixed income securities. Normally, the Fund gains exposure to fixed income securities indirectly by investing in GMO Short-Duration Collateral Fund.
The Fund directly and indirectly (through underlying funds) invests in asset-backed securities with contractual cash flows, such as collateralized mortgage obligations and commercial mortgage-backed securities, including securities backed by sub-prime mortgage loans, credit card receivables and auto loan receivables. The value, liquidity and related income of these securities are sensitive to changes in economic conditions, including real estate values, delinquencies and/or defaults, and may be adversely affected by changes in interest rates and shifts in the market's perception of the securities' market values.
The Fund will, if deemed prudent by the Manager, take temporary defensive measures (until the Manager has determined that normal conditions have returned or that it is otherwise prudent to resume investing in accordance with the Fund's normal investment strategies) and may not achieve its investment objectives during those periods. Recent changes in the credit markets have reduced the liquidity of all types of fixed income securities, including asset-backed securities.
Shares of the Fund are not publicly offered and are principally available only to other funds of the Trust and certain accredited investors.
The Fund currently limits subscriptions due to capacity considerations.
9
GMO Alternative Asset Opportunity Fund
(A Series of GMO Trust)
Notes to Consolidated Financial Statements — (Continued)
February 28, 2009
2. Significant accounting policies
The following is a summary of significant accounting policies followed by the Fund in the preparation of its financial statements. These policies are in conformity with accounting principles generally accepted in the United States of America ("U.S. GAAP") and have been consistently followed by the Fund in preparing its financial statements. The preparation of financial statements in accordance with U.S. GAAP requires management to make estimates and assumptions that affect the reported amounts and disclosures in the financial statements. Actual results could differ from those estimates. The accounting records of the Fund are maintained in U.S. dollars.
Basis of presentation and principles of consolidation
The accompanying consolidated financial statements include the accounts (and the related notes when appropriate) of the GMO Alternative Asset Opportunity Fund and its wholly owned investment in GMO Alternative Asset SPC Ltd. The consolidated financial statements include 100% of the assets and liabilities of GMO Alternative Asset SPC Ltd. All significant interfund accounts and transactions have been eliminated in consolidation.
Portfolio valuation
Securities listed on a securities exchange for which market quotations are readily available are valued at the last sale price or official closing price on each business day, or if there is no such reported sale or official closing price, at the most recent quoted bid price. Unlisted securities for which market quotations are readily available are generally valued at the most recent quoted bid price. Debt instruments with a remaining maturity of sixty days or less are generally valued at amortized cost, which approximates fair value. Shares of investment funds are generally valued at their net asset value. Securities for which quotations are not readily available or whose values the Manager has determined to be unreliable are valued at fair value as determined in good faith by the Trustees or persons acting at their direction pursuant to procedures approved by the Trustees. By its nature, a fair value price is a good faith estim ate of the value of a security at a given point in time and may not reflect the value that would be realized if the security were sold. The difference between a fair value price and the value realized upon a sale could be material.
Typically the Fund and the underlying funds value debt instruments based on prices supplied by a primary pricing source chosen by the Manager. The Manager evaluates primary pricing sources on an ongoing basis and may change a pricing source should the Manager deem it appropriate. If it deems it appropriate, the Manager, at its discretion, may override a price supplied by a primary source by using a price provided by another source. The prices provided by primary pricing sources may differ from the value that would be realized if the securities were sold, and the differences could be material.
Certain securities held by the Fund and underlying funds are valued on the basis of prices provided by a single source. As of February 28, 2009, the total value of these securities represented 27.47% of the net assets. The single source prices provided may differ from the value that would be realized if the securities were sold, and the differences could be material. In addition, although alternative prices are available for other securities held by the Fund, those alternative sources would not necessarily confirm the security
10
GMO Alternative Asset Opportunity Fund
(A Series of GMO Trust)
Notes to Consolidated Financial Statements — (Continued)
February 28, 2009
price used by the Fund. Therefore, the existence of those alternative sources does not necessarily provide greater certainty about the prices used by the Fund.
In September 2006, the Financial Accounting Standards Board issued Statement of Financial Accounting Standards ("FASB") No. 157, Fair Value Measurements ("SFAS 157"). SFAS 157 is effective for the Fund's current fiscal year. While the adoption of SFAS 157 does not have an effect on the Fund's net asset value, it does require additional disclosures about fair value measurements. SFAS 157 establishes a three-level hierarchy for disclosure of fair value measurements. The valuation hierarchy is based upon the reliability of inputs to the valuation of the Fund's investments. The three levels are defined as follows:
Level 1 – Valuations based on quoted prices for identical securities in active markets.
Level 2 – Valuations determined using other significant direct or indirect observable inputs.
Level 3 – Valuations based on inputs that are unobservable and significant.
The inputs or methodology used for valuing securities are not necessarily an indication of the risk associated with investing in those securities.
The following is a summary of the fair valuations according to inputs used as of February 28, 2009 in valuing the Fund's investments:
| Asset Valuation Inputs | Investments in Securities | Other Financial Instruments* | |||||||||
| Level 1 - Quoted Prices | $ | — | $ | 125,090 | |||||||
| Level 2 - Other Significant Observable Inputs | 22,330,905 | 200,753 | |||||||||
| Level 3 - Significant Unobservable Inputs | — | — | |||||||||
| Total | $ | 22,330,905 | $ | 325,843 | |||||||
* Other financial instruments include futures contracts and swap agreements.
| Liability Valuation Inputs | Investments in Securities | Other Financial Instruments** | |||||||||
| Level 1 - Quoted Prices | $ | — | $ | (54,694 | ) | ||||||
| Level 2 - Other Significant Observable Inputs | — | — | |||||||||
| Level 3 - Significant Unobservable Inputs | — | — | |||||||||
| Total | $ | — | $ | (54,694 | ) | ||||||
** Other financial instruments include futures contracts.
For the underlying fund's summary of valuation inputs please refer to the respective fund's portfolio valuation note.
11
GMO Alternative Asset Opportunity Fund
(A Series of GMO Trust)
Notes to Consolidated Financial Statements — (Continued)
February 28, 2009
The Fund held no investments or other financial instruments at either February 29, 2008 or February 28, 2009, whose fair value was determined using Level 3 inputs.
Futures contracts
The Fund may purchase and sell futures contracts. Upon entering into a futures contract, the Fund is required to deposit cash, U.S. government and agency obligations, or other liquid assets with the futures clearing broker in accordance with the initial margin requirements of the broker or exchange. In addition, the Fund maintains cash or securities in an amount that at least equals the net amount payable in the event the Fund must deliver the full amount of the contract. Futures contracts are marked to market daily and an appropriate payable or receivable for the change in value ("variation margin") is recorded by the Fund. The payable or receivable is settled on the following business day. Gains or losses are recognized but not considered realized until the contracts expire or are closed. Futures contracts involve, to varying degrees, risk of loss in excess of the variation margin disclosed in the Statement of Assets and Liabi lities. Under certain circumstances, futures exchanges may establish daily limits on the amount that the price of a futures contract can vary from the previous day's settlement price, thereby effectively preventing liquidation of unfavorable positions. Losses may arise from changes in the value of the underlying instrument if the Fund is unable to liquidate a futures position due to an illiquid secondary market for the contract or the imposition of price limits, or if counterparties do not perform under the contract terms. Futures contracts are generally valued at the settlement price established each day by the board of trade or exchange on which they are traded. Futures contracts outstanding at the end of the period are listed in the Fund's Schedule of Investments.
Indexed securities
The Fund may invest in indexed securities. Indexed securities are securities whose redemption values and/or coupons are linked to the prices of a specific instrument or financial statistic. The Fund uses indexed securities to increase or decrease its exposure to different underlying instruments and to gain exposure to markets in which investing through conventional securities is difficult. Indexed securities held by the Fund at the end of the period are listed in the Fund's Schedule of Investments.
Swap agreements
The Fund may enter into various types of swap agreements, including without limitation, interest rate, total return, credit default and variance swap agreements. A swap agreement is an agreement to exchange the return generated by one instrument for the return generated by another instrument. When entering into a swap agreement, the Fund and/or the swap counterparty may post or receive cash or securities as collateral. The party posting the collateral typically receives the interest associated with or payments related to the collateral and has the risk of loss related to the collateral.
Interest rate swap agreements involve an exchange by the parties of their respective commitments to pay or right to receive interest, e.g., an exchange of floating rate interest payments for fixed rate interest payments with respect to the notional amount of principal.
12
GMO Alternative Asset Opportunity Fund
(A Series of GMO Trust)
Notes to Consolidated Financial Statements — (Continued)
February 28, 2009
Total return swap agreements involve a commitment by one party to pay interest to the other party in exchange for a payment to it from the other party based on the return of a reference instrument (e.g., a security or basket of securities), both based on notional amounts. To the extent the return of the reference instrument exceeds or falls short of the interest payments, one party will receive a payment from or make a payment to the other party.
In a credit default swap agreement, one party makes payments to another party in exchange for the right to receive a specified return if a credit event occurs with respect to a referenced entity or entities. Buying credit default protection reduces the buyer's exposure in the event of an issuer's default (i.e., it reduces risk where a party owns a security issued by or otherwise has exposure to the issuer). Selling credit default protection subjects the seller to exposure to an issuer's default. A seller of credit default protection receives payments in return for its obligation to pay the principal amount of a debt security (or other agreed-upon value) to the other party upon the occurrence of a credit event (e.g., issuer default or similar event). If no credit event occurs, the seller has no payment obligations. For credit default swap agreements on asset-backed securities, a credit event may be triggered by such events as the issuer's failure to pay interest or principal, an agreement of the holders of an asset-backed security to a maturity extension, a rating downgrade on the security or a write-down on the collateral underlying the security. For credit default swap agreements on corporate or sovereign issuers, a credit event may be triggered by such events as the issuer's bankruptcy, failure to pay interest or principal, repudiation/moratorium or restructuring.
Variance swap agreements involve an agreement by two parties to exchange cash flows based on the measured variance (or square of volatility) of a specified underlying asset. One party agrees to exchange a "fixed rate" or strike price payment for the "floating rate" or realized price variance on the underlying asset with respect to the notional amount. At inception, the strike price chosen is generally fixed at a level such that the fair value of the swap is zero. At the expiration date, the amount paid by one party to the other is the difference between the realized price variance of the underlying asset and the strike price multiplied by the notional amount. A receiver of the realized price variance would receive a payment when the realized price variance of the underlying asset is greater than the strike price and would make a payment when that variance is less than the strike price. A payer of the realized price variance woul d make a payment when the realized price variance of the underlying asset is greater than the strike price and would receive a payment when that variance is less than the strike price. This type of agreement is essentially a forward contract on the future realized price variance of the underlying asset.
The Fund prices its swap agreements daily using models that may incorporate quotations from market makers and records the change in value, if any, as unrealized gain or loss in the Statement of Operations. Payments received or made on swap agreements are recorded as realized gain or loss in the Statement of Operations. Gains or losses are realized upon termination of the swap agreements.
Swap agreements often are not actively traded on financial markets. The values assigned to them may differ significantly from the values that would be realized upon termination, and the differences could be
13
GMO Alternative Asset Opportunity Fund
(A Series of GMO Trust)
Notes to Consolidated Financial Statements — (Continued)
February 28, 2009
material. Entering into swap agreements involves credit, legal, market and documentation risk that is not reflected in the amounts reported in the Statement of Assets and Liabilities. Such risks include the possibility that the party with whom the Fund contracts may default on its obligations to perform or disagree as to the meaning of contractual terms, or that the collateral that party posts may be insufficient or not timely received by the Fund. Credit risk may be particularly acute in an environment where financial services firms are exposed to systemic risks of the type evidenced by the insolvency of Lehman Brothers and subsequent market disruptions. Swap agreements outstanding at the end of the period are listed in the Fund's Schedule of Investments.
Repurchase agreements
The Fund may enter into repurchase agreements. Under a repurchase agreement the Fund acquires a security for cash and obtains a simultaneous commitment from the seller to repurchase the security at an agreed upon price and date. The Fund, through its custodian, takes possession of securities collateralizing the repurchase agreement. The collateral is marked to market daily to ensure that the market value of the underlying assets is at least equal to the amount owed to the Fund in the event of default by the seller. If the seller of a repurchase agreement defaults or enters into insolvency proceedings and the value of the collateral declines, the Fund's recovery of cash may be delayed or limited. The Fund had no repurchase agreements outstanding at the end of the period.
Taxes
The Fund has elected to be treated as a partnership for U.S. federal income tax purposes. As a partnership, the Fund is not itself subject to federal income tax. Instead, each shareholder is required to take into account in determining its tax liability its distributive share of items of Fund income, gain, loss, deduction, credit, and tax preference for each taxable year substantially as though such items have been realized directly by the shareholder and without regard to whether any distribution by the Fund has been or will be received. Accordingly, no provision (benefit) for federal and state income taxes is reflected in the accompanying financial statements.
As of February 28, 2009, the approximate cost for U.S. federal income tax purposes and gross and net unrealized appreciation and (depreciation) in value of investments were as follows:
Aggregate Cost | Gross Unrealized Appreciation | Gross Unrealized (Depreciation) | Net Unrealized Appreciation (Depreciation) | ||||||||||||
| $ | 34,963,184 | $ | 33,253 | $ | (12,665,532 | ) | $ | (12,632,279 | ) | ||||||
The Fund is subject to the provisions of Financial Accounting Standards Board Interpretation No. 48 ("FIN 48"), Accounting for Uncertainty in Income Taxes — an Interpretation of FASB Statement No. 109. FIN 48 sets forth a minimum threshold for financial statement recognition of a tax position taken or expected to be taken in a tax return that could affect the Fund's financial statements. The Fund did not have any unrecognized tax benefits or liabilities at February 28, 2009, nor did it have any increases or decreases in
14
GMO Alternative Asset Opportunity Fund
(A Series of GMO Trust)
Notes to Consolidated Financial Statements — (Continued)
February 28, 2009
unrecognized tax benefits or liabilities for the period then ended. The Fund is subject to examination prior to the expiration of the statute of limitations by U.S. federal and state tax authorities for tax returns filed.
Distributions
The Fund does not intend to make any distributions to its shareholders but may do so in the sole discretion of the Trustees.
Security transactions and related investment income
Security transactions in the financial statements are accounted for on the trade date. Dividend income, net of applicable foreign withholding taxes, if any, is recorded on the ex-dividend date or, if later, when the Fund is informed of the ex-dividend date. Interest income is recorded on the accrual basis and is adjusted for the amortization of premiums and accretion of discounts. Principal on inflation indexed securities is adjusted for inflation and any increase or decrease is recorded as interest income or loss. Income is not recognized on securities for which collection is not expected. Non-cash dividends, if any, are recorded at the fair market value of the asset received. In determining the net gain or loss on securities sold, the Fund uses the identified cost basis for the purposes of determining the cost basis.
Expenses
The majority of the expenses of the Trust are directly identifiable to an individual fund. Expenses that are not readily identifiable to a specific fund are allocated taking into consideration, among other things, the nature and type of expense and the relative size of the funds. In addition, the Fund incurs fees and expenses indirectly as a shareholder in the underlying funds. Because the underlying funds have different expense and fee levels and the Fund may own different proportions of the underlying funds at different times, the amount of fees and expenses indirectly incurred by the Fund will vary (See Note 3).
State Street Bank and Trust Company ("State Street") serves as custodian, fund accounting agent and transfer agent of the Fund. State Street's fees may be reduced by an earnings allowance calculated on the average daily cash balances the Fund maintains with State Street. The Fund receives the benefit of the earnings allowance. In addition, Goldman Sachs Agency Lending, the Fund's securities lending agent, has agreed to reimburse the Fund for certain transactional expenses related to securities lending activity. Credit balances or expense reimbursements used to reduce fees, if any, are reported as a reduction of expenses in the Statement of Operations.
Purchases and redemptions of Fund shares
Effective October 8, 2008, the Fund instituted a fee on cash redemptions of 0.76% of the amount redeemed. Effective October 21, 2008, the fee on cash redemptions was changed to 2.00% of the amount redeemed. As of February 28, 2009, the fee for cash redemptions is currently 2.00% of the amount redeemed. The Fund may impose a new purchase premium and/or redemption fee, or modify or eliminate an existing purchase premium and/or redemption fee, at any time. If the Manager determines that any portion of a cash redemption is offset by a corresponding cash purchase on the same day, the Fund will ordinarily waive or reduce the redemption fee with respect to that portion. In addition, the Fund may waive or reduce the
15
GMO Alternative Asset Opportunity Fund
(A Series of GMO Trust)
Notes to Consolidated Financial Statements — (Continued)
February 28, 2009
redemption fee in extraordinary circumstances if the purchase or redemption will not cause the Fund to incur transaction costs. All redemption fees are paid to the Fund and recorded by the Fund as paid-in-capital. In-kind redemption transactions are generally not subject to redemption fees except when they include a cash component. However, when a substantial portion of a Fund is being redeemed, the Fund may charge a redemption fee based on estimated or known transaction costs resulting from those redemptions.
Investment risks
Because of the Fund's indirect exposure to the global commodity markets, the value of its shares is affected by factors particular to the commodity markets and may fluctuate more than the value of shares of a fund with a broader range of investments. Commodity prices can be extremely volatile and are affected by a wide range of factors, including changes in overall market movements, real or perceived inflationary trends, commodity index volatility, changes in interest rates or currency exchange rates, population growth and changing demographics, international economic, political, and regulatory developments, and developments affecting a particular industry or commodity, such as drought, floods, or other weather conditions, livestock disease, trade embargoes, competition from substitute products, transportation bottlenecks or shortages, fluctuations in supply and demand, and tariffs. The value of the Fund's investments in commodi ty-related derivatives may fluctuate more than the relevant underlying commodity or commodity index.
To manage the Fund's cash collateral needs in current extraordinary market conditions, the Manager reserves the right to reduce or eliminate the Fund's derivative exposures, including those that are intended to cause the Fund to track its benchmark more closely. A reduction in those exposures without replacing them with benchmark securities will tend to cause the performance of the Fund to track its benchmark less closely and make the Fund's performance more dependent on the performance of the asset-backed securities it holds directly or indirectly.
To address in part the cash management issues described above, the Fund expects to honor nearly all redemptions of its shares in-kind for the foreseeable future. If redeeming shareholders from the Fund choose to sell assets received in-kind immediately and current adverse market conditions continue, they may experience difficulty selling the assets at favorable prices. To the extent that the Fund honors redemptions in cash, redeeming shareholders will bear the redemption fees described under Purchases and Redemptions of Fund Shares above.
There are certain additional risks involved in investing in foreign securities that are not inherent in investments in U.S. securities. These risks may involve adverse political and economic developments, including expropriation and the possible imposition of capital controls or other foreign governmental laws or restrictions. In addition, the securities of some foreign companies and securities markets are less liquid and at times more volatile than securities of comparable U.S. companies and U.S. securities markets. The securities markets of emerging countries are generally smaller, less developed, less liquid, and more volatile than the securities markets of the U.S. and developed foreign markets. Because of the Fund's
16
GMO Alternative Asset Opportunity Fund
(A Series of GMO Trust)
Notes to Consolidated Financial Statements — (Continued)
February 28, 2009
exposure to the global commodity markets, the value of its shares is affected by factors particular to the commodity markets and may fluctuate more than the value of shares of a fund with broader range of investments.
Recently issued accounting pronouncement
In March 2008, FASB issued Statement of Financial Accounting Standards No. 161, Disclosures about Derivative Instruments and Hedging Activities ("SFAS 161"). SFAS 161 is effective for fiscal years and interim periods beginning after November 15, 2008. SFAS 161 requires enhanced disclosures about Funds' derivative and hedging activities. The Manager is currently evaluating the impact the adoption of SFAS 161 will have on the Fund's financial statement disclosures.
In December, 2007, FASB issued SFAS No. 160, an amendment of Accounting Research Bulletin No. 51, Noncontrolling Interests in Consolidated Financial Statements. SFAS 160 is effective for fiscal years and interim periods beginning on or after December 15, 2008. SFAS 160 requires enhanced disclosures in consolidated financial statements that identifies and distinguishes between the interests of the parent's owners and the interests of the noncontrolling owners of a subsidiary. The Manager is currently evaluating the impact the adoption of SFAS 160 will have on the Fund's financial statements.
3. Fees and other transactions with affiliates
GMO receives a management fee for the services it provides to the Fund. That fee is paid monthly at the annual rate of 0.45% of average daily net assets. The Fund has adopted a Shareholder Service Plan under which the Fund pays GMO a shareholder service fee for client and shareholder service, reporting, and other support. Pursuant to the Shareholder Service Plan, the shareholder service fee is calculated based on average daily net assets at the annual rate of 0.15%.
Through at least June 30, 2009, the Manager has contractually agreed to reimburse the Fund for Fund expenses incurred through that date to the extent the Fund's total annual operating expenses (excluding "Excluded Expenses", as defined below) exceed 0.45% of the Fund's average daily net assets. Excluded Expenses include shareholder service fees, fees and expenses of the independent Trustees of the Trust, fees and expenses for legal services not approved by the Manager for the Trust, compensation and expenses of the Trust's Chief Compliance Officer ("CCO") (excluding any employee benefits), brokerage commissions, securities lending fees and expenses, interest expense, transfer taxes, and other investment-related costs (including expenses associated with investments in any company that is an investment company or would be an investment company under the 1940 Act, but for the exceptions to the definition of investment company provi ded in Section 3(c)(1) and 3(c)(7) of the 1940 Act), hedging transaction fees, extraordinary, non-recurring and certain other unusual expenses (including taxes).
17
GMO Alternative Asset Opportunity Fund
(A Series of GMO Trust)
Notes to Consolidated Financial Statements — (Continued)
February 28, 2009
The Fund incurs fees and expenses indirectly as a shareholder in the GMO Short-Duration Collateral Fund. For the year ended February 28, 2009, these indirect fees and expenses expressed as an annualized percentage of the Fund's average daily net assets were as follows:
| Indirect Net Expenses (excluding shareholder service fees and interest expense) | Indirect Shareholder Service Fees | Indirect Interest Expense | Total Indirect Expenses | ||||||||||||
| 0.003 | % | 0.000 | % | 0.000 | % | 0.003 | % | ||||||||
The Fund's portion of the fees paid by the Trust to the Trust's independent Trustees and CCO during the year ended February 28, 2009 was $345 and $182, respectively. The compensation and expenses of the CCO are included in miscellaneous expenses in the Statement of Operations. The Fund paid no remuneration to any other officer of the Trust.
The Fund's investments in commodity-related derivatives are generally made through GMO Alternative Asset Opportunity SPC Ltd., a wholly owned subsidiary organized as a Bermuda limited liability company, which GMO serves as investment manager but does not receive any additional management or other fees for such services.
4. Purchases and sales of securities
For the year ended February 28, 2009, cost of purchases and proceeds from sales of investments, other than short-term obligations, were as follows:
| Purchases | Sales | ||||||||||
| U.S. Government securities | $ | 22,812,878 | $ | 21,594,001 | |||||||
| Investments (non-U.S. Government securities) | 158,934 | 1,294,100 | |||||||||
5. Guarantees
In the normal course of business the Fund enters into contracts with third-party service providers that contain a variety of representations and warranties and that provide general indemnifications. The Fund's maximum exposure under these arrangements is unknown, as it involves future claims that may be made against the Fund that have not yet occurred. Based on experience, management is of the view that the risk of loss in connection with its indemnification obligations is remote; however, there can be no assurance that such obligations will not result in material liabilities that adversely affect the Fund.
18
GMO Alternative Asset Opportunity Fund
(A Series of GMO Trust)
Notes to Consolidated Financial Statements — (Continued)
February 28, 2009
6. Principal shareholders and related parties
As of February 28, 2009, 83.35% of the outstanding shares of the Fund were held by two shareholders. On that date, no other shareholder owned more than 10% of the outstanding shares of the Fund. One of the shareholders is another fund of the Trust. Redemptions from (or investments into) the Fund by or on behalf of these large shareholders may have a material effect on the Fund.
As of February 28, 2009, no shares of the Fund were held by senior management of the Manager and GMO Trust officers and all of the Fund's shares were held by accounts for which the Manager had investment discretion.
7. Share transactions
The Declaration of Trust permits the Trust to issue an unlimited number of shares of beneficial interest (without par value). Transactions in Fund shares were as follows:
| Year Ended February 28, 2009 | Year Ended February 29, 2008 | ||||||||||||||||||
| Shares | Amount | Shares | Amount | ||||||||||||||||
| Shares sold | 15 | $ | 388 | 117,663 | $ | 3,431,990 | |||||||||||||
| Shares repurchased | (5,333 | ) | (131,245 | ) | (5,206,092 | ) | (145,526,957 | ) | |||||||||||
| Redemption fees | — | 2,617 | — | — | |||||||||||||||
| Net increase (decrease) | (5,318 | ) | $ | (128,240 | ) | (5,088,429 | ) | $ | (142,094,967 | ) | |||||||||
8. Investments in affiliated issuers
A summary of the Fund's transactions in the shares of other funds of the Trust during the year ended February 28, 2009 is set forth below:
| Affiliate | Value, beginning of period | Purchases | Sales Proceeds | Dividend Income | Distributions of Realized Gains | Value, end of period | |||||||||||||||||||||
| GMO Short-Duration Collateral Fund | $ | 23,686,705 | $ | 158,934 | $ | 1,294,100 | $ | 1,004,960 | u | $ | — | $ | 16,010,119 | ||||||||||||||
| Totals | $ | 23,686,705 | $ | 158,934 | $ | 1,294,100 | $ | 1,004,960 | $ | — | $ | 16,010,119 | |||||||||||||||
u The Fund received total distributions in the amount of $3,081,304, of which $2,076,344 was a return of capital.
19
Report of Independent Registered Public Accounting Firm
To the Trustees of GMO Trust and the Shareholders of
GMO Alternative Asset Opportunity Fund:
In our opinion, the accompanying consolidated statement of assets and liabilities, including the consolidated schedule of investments, and the related consolidated statements of operations and of changes in net assets and the financial highlights present fairly, in all material respects, the financial position of GMO Alternative Asset Opportunity Fund (the "Fund") and subsidiary at February 28, 2009, the results of their operations for the year then ended, the changes in their net assets for each of the two years in the period then ended and the financial highlights for the periods indicated, in conformity with accounting principles generally accepted in the United States of America. These financial statements and financial highlights (hereafter referred to as "financial statements") are the responsibility of the Fund's management. Our responsibility is to express an opinion on these financial statements based on our audits. We conducted our audits of these financial statements in accordance with the standards of the Public Company Accounting Oversight Board (United States). Those standards require that we plan and perform the audit to obtain reasonable assurance about whether the financial statements are free of material misstatement. An audit includes examining, on a test basis, evidence supporting the amounts and disclosures in the financial statements, assessing the accounting principles used and significant estimates made by management, and evaluating the overall financial statement presentation. We believe that our audits, which included confirmation of securities at February 28, 2009 by correspondence with the custodian and brokers, provide a reasonable basis for our opinion.
PricewaterhouseCoopers LLP
Boston, Massachusetts
April 29, 2009
20
GMO Alternative Asset Opportunity Fund
(A Series of GMO Trust)
Fund Expenses
February 28, 2009 (Unaudited)
Expense Examples: The following information is in relation to expenses for the six month period ended February 28, 2009.
As a shareholder of the Fund, you may incur two types of costs: (1) transaction costs, including redemption fees; and (2) ongoing costs, including management fees, shareholder service fees, and other Fund expenses. This example is intended to help you understand your ongoing costs (in dollars) of investing in the Fund and to compare these costs with the ongoing costs of investing in other mutual funds.
These examples are based on an investment of $1,000 invested at the beginning of the period and held for the entire period, September 1, 2008 through February 28, 2009.
Actual Expenses
The first line of the table below for each class provides information about actual account values and actual expenses. You may use the information in this line, together with the amount you invested, to estimate the expenses that you paid over the period. Simply divide your account value by $1,000 (for example, a $10,000,000 account value divided by $1,000 = 10,000), then multiply the result by the number in the first line under the heading entitled "Net Expense Incurred" to estimate the expenses you paid on your account during this period.
Hypothetical Example for Comparison Purposes
The second line of the table below for each class provides information about hypothetical account values and hypothetical expenses based on the Fund's actual expense ratio and an assumed rate of return of 5% per year before expenses, which is not the Fund's actual return. The hypothetical account values and expenses may not be used to estimate the actual ending account balance or expenses you paid for the period. You may use this information to compare the ongoing costs of investing in the Fund with other funds. To do so, compare this 5% hypothetical example with the 5% hypothetical examples that appear in the shareholder reports of the other funds.
Please note that the expenses shown in the table are meant to highlight your ongoing costs only and do not reflect any transactional costs, such as purchase premiums and redemption fees. Therefore, the second line of the table is useful in comparing ongoing costs only, and will not help you determine the relative total costs of owning different funds. In addition, if these transactional costs were included, your costs would have been higher.
| Annualized Expense Ratio | Beginning Account Value | Ending Account Value | Net Expense Incurred* | ||||||||||||||||
| 1) Actual | 0.61 | % | $ | 1,000.00 | $ | 717.50 | $ | 2.60 | |||||||||||
| 2) Hypothetical | 0.61 | % | $ | 1,000.00 | $ | 1,021.77 | $ | 3.06 | |||||||||||
* Expenses are calculated using the Fund's annualized net expense ratio (including indirect expenses incurred) for the six months ended February 28, 2009, multiplied by the average account value over the period, multiplied by 181 days in the period, divided by 365 days in the year.
21
Trustees and Officers (Unaudited)
The following tables list the Trust's Trustees and Officers as of the date of this report; their address and date of birth ("DOB"); their position with the Trust; the length of time holding that position with the Trust; their principal occupation(s) during the past five years; the number of portfolios in the fund complex they oversee; and other directorships they hold in companies subject to registration or reporting requirements of the Securities Exchange Act of 1934 (generally called "public companies") or in registered investment companies. The Trust's Statement of Additional Information ("SAI") includes additional information about the Trust's trustees, including changes subsequent to the date of the report. The SAI is available, without charge, upon request by writing GMO, c/o GMO Trust, 40 Rowes Wharf, Boston, MA 02110.
Independent Trustees:
| Name, Address, and DOB | Position(s) Held with Trust | Term of Office1 and Length of Time Served | Principal Occupation(s) During Past Five Years | Number of Portfolios in Fund Complex Overseen by Trustee | Other Directorships Held by Trustee | ||||||||||||||||||
| Donald W. Glazer, Esq. c/o GMO Trust 40 Rowes Wharf Boston, MA 02110 DOB: 07/26/1944 | Chairman of the Board of Trustees | Chairman of the Board of Trustees since March 2005; Lead Independent Trustee (September 2004 – March 2005); Trustee since December 2000. | Consultant – Law and Business2; Author of Legal Treatises. | 59 | None. | ||||||||||||||||||
1 Each Trustee is elected to serve during the continued lifetime of the Trust until he/she dies, resigns or is removed, or if sooner, until the next meeting of Shareholders called for the purpose of electing Trustees and until the election and qualification of his/her successor.
2 As part of Mr. Glazer's work as a consultant, he provides part-time consulting services to Goodwin Procter LLP ("Goodwin"). Goodwin has provided legal services to Renewable Resources, LLC, an affiliate of GMO; GMO, in connection with its relationship with Renewable Resources; and funds managed by Renewable Resources. Mr. Glazer has represented that he has no financial interest in, and is not involved in the provision of, such legal services. In the calendar years ended December 31, 2007 and December 31, 2008, these entities paid $789,416 and $183,864 respectively, in legal fees and disbursements to Goodwin. In correspondence with the Staff of the Securities and Exchange Commission beginning in August 2006, the Independent Trustees' legal counsel provided the Staff with information regarding Mr. Glazer's relationship with Goodwin and h is other business activities. On September 11, 2007, based on information that had been given to the Staff as of that date, the Staff provided oral no-action assurance consistent with the opinion of the Independent Trustees' legal counsel that Mr. Glazer is not an "interested person" of the Trust.
22
Independent Trustees — (Continued)
| Name, Address, and DOB | Position(s) Held with Trust | Term of Office1 and Length of Time Served | Principal Occupation(s) During Past Five Years | Number of Portfolios in Fund Complex Overseen by Trustee | Other Directorships Held by Trustee | ||||||||||||||||||
| W. Nicholas Thorndike c/o GMO Trust 40 Rowes Wharf Boston, MA 02110 DOB: 03/28/1933 | Trustee | Since March 2005. | Director or trustee of various corporations and charitable organizations, including Courier Corporation (a book publisher and manufacturer) (July 1989 – present); Putnam Funds (December 1992 – June 2004); and Providence Journal (a newspaper publisher) (December 1986 – December 2003). | 59 | Director of Courier Corporation (a book publisher and manufacturer); Member of the Investment Committee of Partners HealthCare System, Inc.3 | ||||||||||||||||||
| Peter Tufano c/o GMO Trust 40 Rowes Wharf Boston, MA 02110 DOB: 04/22/1957 | Trustee | Since December 2008. | Sylvan C. Coleman Professor of Financial Management, Harvard Business School (since 1989). | 59 | Trustee of State Street Navigator Securities Lending Trust (3 Portfolios). | ||||||||||||||||||
1 Each Trustee is elected to serve during the continued lifetime of the Trust until he/she dies, resigns or is removed, or if sooner, until the next meeting of Shareholders called for the purpose of electing Trustees and until the election and qualification of his/her successor.
3 Partners HealthCare System, Inc. is a client of the Manager.
23
Principal Officers:
| Name, Address, and DOB | Position(s) Held with Trust | Term of Office4 and Length of Time Served | Principal Occupation(s) During Past Five Years | ||||||||||||
| J.B. Kittredge DOB: 08/22/1954 | President and Chief Executive Officer | Since March 2009. | General Counsel, Grantham, Mayo, Van Otterloo & Co. LLC (October 2005 – Present); Partner, Ropes & Gray LLP. | ||||||||||||
| Sheppard N. Burnett c/o GMO Trust 40 Rowes Wharf Boston, MA 02110 DOB: 10/24/1968 | Treasurer and Chief Financial Officer | Chief Financial Officer since March 2007; Treasurer since November 2006; Assistant Treasurer, September 2004 – November 2006. | Fund Administration Staff, Grantham, Mayo, Van Otterloo & Co. LLC (June 2004 – present); Vice President, Director of Tax, Columbia Management Group (2002 – 2004). | ||||||||||||
| Brent C. Arvidson c/o GMO Trust 40 Rowes Wharf Boston, MA 02110 DOB: 06/26/1969 | Assistant Treasurer | Since August 1998. | Senior Fund Administrator, Grantham, Mayo, Van Otterloo & Co. LLC. | ||||||||||||
| John L. Nasrah c/o GMO Trust 40 Rowes Wharf Boston, MA 02110 DOB: 05/27/1977 | Assistant Treasurer | Since March 2007. | Fund Administrator, Grantham, Mayo, Van Otterloo & Co. LLC (September 2004 – present); Tax Analyst, Bain & Company, Inc. (June 2003 – September 2004). | ||||||||||||
| Mahmoodur Rahman c/o GMO Trust 40 Rowes Wharf Boston, MA 02110 DOB: 11/30/1967 | Assistant Treasurer | Since September 2007. | Fund Administrator, Grantham, Mayo, Van Otterloo & Co. (April 2007 – present); Vice President and Senior Tax Manager, Massachusetts Financial Services Company (January 2000 – April 2007). | ||||||||||||
| Michael E. Gillespie c/o GMO Trust 40 Rowes Wharf Boston, MA 02110 DOB: 02/18/1958 | Chief Compliance Officer | Since March 2005. | Vice President of Compliance (June 2004 – February 2005) and Director of Domestic Compliance (March 2002 – June 2004), Fidelity Investments. | ||||||||||||
4 Each officer is elected to hold such office until his or her successor is duly elected and qualified to carry out the duties and responsibilities of their office, or until he or she resigns or is removed from office.
24
Principal Officers — (Continued)
| Name, Address, and DOB | Position(s) Held with Trust | Term of Office4 and Length of Time Served | Principal Occupation(s) During Past Five Years | ||||||||||||
| Jason B. Harrison c/o GMO Trust 40 Rowes Wharf Boston, MA 02110 DOB: 01/29/1977 | Vice President and Clerk | Vice President since November 2006; Clerk since March 2006. | Legal Counsel, Grantham, Mayo, Van Otterloo & Co. LLC (since February 2006) and Attorney, Ropes & Gray LLP (September 2002 – February 2006). | ||||||||||||
| David L. Bohan c/o GMO Trust 40 Rowes Wharf Boston, MA 02110 DOB: 06/21/1964 | Vice President and Assistant Clerk | Vice President since March 2005; Assistant Clerk since March 2006. | Legal Counsel, Grantham, Mayo, Van Otterloo & Co. LLC. | ||||||||||||
| Gregory L. Pottle c/o GMO Trust 40 Rowes Wharf Boston, MA 02110 DOB: 07/09/1971 | Vice President and Assistant Clerk | Since November 2006. | Legal Counsel, Grantham, Mayo, Van Otterloo & Co. LLC. | ||||||||||||
| Anne K. Trinque c/o GMO Trust 40 Rowes Wharf Boston, MA 02110 DOB: 04/15/1978 | Vice President and Assistant Clerk | Since September 2007. | Legal Counsel, Grantham, Mayo, Van Otterloo & Co. LLC (January 2007 – present); Attorney, Goodwin Procter LLP (September 2003 – January 2007). | ||||||||||||
| Cheryl Wakeham c/o GMO Trust 40 Rowes Wharf Boston, MA 02110 DOB: 10/29/1958 | Vice President and Anti-Money Laundering Officer | Since December 2004. | Manager, Client Service Administration, Grantham, Mayo, Van Otterloo & Co. LLC. | ||||||||||||
4 Each officer is elected to hold such office until his or her successor is duly elected and qualified to carry out the duties and responsibilities of their office, or until he or she resigns or is removed from office.
5 Each of Messrs. Burnett, Arvidson, Bohan, and Pottle serves as an officer and/or director of certain pooled investment vehicles of which GMO or an affiliate of GMO serves as the investment adviser.
25
GMO Strategic Fixed Income Fund
(A Series of GMO Trust)
Annual Report
February 28, 2009
For a free copy of the Fund's proxy voting guidelines, shareholders may call 1-617-346-7646 (collect) or visit the Securities and Exchange Commission's website at www.sec.gov. Information regarding how the Fund voted proxies relating to portfolio securities during the most recent 12-month period ended June 30 is available on GMO's website at www.gmo.com, or on the Securities and Exchange Commission's website at www.sec.gov.
The Fund files its complete schedule of portfolio holdings with the Securities and Exchange Commission for the first and third quarter of each fiscal year on Form N-Q, which is available on the Commission's website at www.sec.gov. The Fund's Form N-Q may be reviewed and copied at the Commission's Public Reference Room in Washington, D.C. Information on the operation of the Public Reference Room may be obtained by calling 1-800-SEC-0330. The Fund has a policy with respect to disclosure of portfolio holdings under which it may also make available on GMO's website at www.gmo.com a complete schedule of portfolio holdings.
This report is prepared for the general information of shareholders. It is authorized for distribution to prospective investors only when preceded or accompanied by a prospectus for the GMO Trust, which contains a complete discussion of the risks associated with an investment in this Fund and other important information. The GMO Trust prospectus can be obtained at www.gmo.com.
GMO Strategic Fixed Income Fund
(A Series of GMO Trust)
Portfolio Management
Day-to-day management of the Fund's portfolio is the responsibility of the Fixed Income team at Grantham, Mayo, Van Otterloo & Co. LLC.
Management Discussion and Analysis of Fund Performance
The Class III shares of the GMO Strategic Fixed Income Fund returned -21.2% for the fiscal year ending on February 28, 2009, as compared to the +3.5% return for the JPMorgan U.S. 3 Month Cash Index. The Fund's exposure to various issues is achieved directly and indirectly through its investment in certain underlying GMO mutual funds, including the GMO Emerging Country Debt Fund (ECDF), the GMO World Opportunity Overlay Fund (WOOF), and the GMO Short-Duration Collateral Fund (SDCF).
The Fund underperformed the benchmark during the fiscal year by 24.7%. Exposures to SDCF and WOOF were by far the largest negative contributors during the fiscal year, followed by negative contributions from developed interest-rate strategies and exposure to emerging country debt via ECDF.
More than 80% of the fiscal year's underperformance was due to price declines in the two funds in which the Fund invests a substantial portion of its total assets: SDCF and WOOF. These funds primarily invest in asset-backed securities. The positions in SDCF and WOOF collateralize derivatives positions that seek to deliver the return of the benchmark as well as create active exposures in global interest-rate markets.
As the fiscal year was marked by sharply deteriorating liquidity conditions in securitized credit markets, spreads widened to all-time highs in the asset-backed securities held indirectly in the Strategic Fixed Income Fund via holdings of SDCF and WOOF. Such ABS exposure contributed -18.80% to the Fund's performance. To increase flexibility, the Fund began holding more cash assets directly. In addition to widening spreads, both SDCF and WOOF's portfolios suffered credit downgrades during the year. SDCF had 123 downgraded securities, and WOOF had 82, representing 27.4% and 25.5% of their respective market values from the beginning of the year. At fiscal year end, 73% of SDCF's portfolio was rated AAA, 8% was rated AA, 2% was rated A, 12% was rated BBB and 5% was rated below BBB. At fiscal year end, 74% of WOOF's portfolio was rated AAA, 6% was rated AA, 2% was rated A, 12% was rated BBB and 6% was rated below BBB.
Further underperformance was attributable to interest-rate strategies. Given the unhealthy market conditions for interest-rates, characterized by poor liquidity and choppy, gapping prices, the Fund temporarily suspended model-based positions starting in October.
The underperformance of U.S. Treasury principal strips versus LIBOR and other opportunistic trades contributed to developed interest-rate strategy losses. Before model-based interest-rate positions were suspended, Euro-area, U.S., Swedish, and Swiss market positions had contributed positively. Further, the slope and volatility strategies also added value during this time.
GMO Strategic Fixed Income Fund
(A Series of GMO Trust)
Management Discussion and Analysis of Fund Performance — (Continued)
A small exposure to emerging country debt also detracted value as spread widening on the asset class contributed negatively, as did negative contributions from both security and country selection.
The views expressed herein are exclusively those of Grantham, Mayo, Van Otterloo & Co. LLC Management as of the date of this report and are subject to change. GMO disclaims any responsibility to update such views. They are not meant as investment advice. References to specific securities are not recommendations of such securities and may not be representative of any GMO portfolio's current or future investments.

Performance data quoted represents past performance and is not indicative of future results. The investment return and principal value of an investment will fluctuate so that an investor's shares, when redeemed, may be worth more or less than their original cost. Current performance data may be lower or higher than the performance data provided herein. To obtain performance information to the most recent month-end, visit www.gmo.com. Performance shown is net of all fees after reimbursement from the Manager. Each performance figure assumes a redemption at the end of the stated period and reflects a transaction fee of 2.00% on the redemption. Transaction fees are retained by the Fund to cover trading costs. Returns would have been lower had certain expenses not been reimbursed during the periods shown and do not include the effect of taxes on distributions and redem ptions. All information is unaudited. Performance for Class VI will vary due to different fees.
* Class III performance information represents Class VI performance from May 31, 2006 to July 13, 2006 and Class III performance thereafter.
** JPMorgan U.S. 3 Month Cash Index + represents the Barclays Capital U.S. Treasury 1-3 Year Index prior to 9/29/06 and the JPMorgan U.S. 3 Month Cash Index thereafter.
This page has been left blank intentionally.
GMO Strategic Fixed Income Fund
(A Series of GMO Trust)
Investments Concentration Summary
February 28, 2009 (Unaudited)
| Asset Class Summary* | % of Total Net Assets | ||||||
| Debt Obligations | 87.2 | % | |||||
| Short-Term Investments | 16.5 | ||||||
| Options Purchased | 1.8 | ||||||
| Loan Participations | 0.1 | ||||||
| Forward Currency Contracts | 0.1 | ||||||
| Loan Assignments | 0.0 | ||||||
| Futures | 0.0 | ||||||
| Rights and Warrants | 0.0 | ||||||
| Promissory Notes | 0.0 | ||||||
| Reverse Repurchase Agreements | (0.0 | ) | |||||
| Written Options | (0.7 | ) | |||||
| Swaps | (5.8 | ) | |||||
| Other | 0.8 | ||||||
| 100.0 | % | ||||||
* The table above incorporates aggregate indirect asset class exposure associated with investments in other funds of GMO Trust ("underlying funds").
1
GMO Strategic Fixed Income Fund
(A Series of GMO Trust)
Schedule of Investments
(showing percentage of total net assets)
February 28, 2009
| Par Value ($) / Shares / Principal Amount | Description | Value ($) | |||||||||||||
| DEBT OBLIGATIONS — 5.2% | |||||||||||||||
| United States — 5.2% | |||||||||||||||
| U.S. Government | |||||||||||||||
| 79,096,050 | U.S. Treasury Inflation Indexed Bond, 0.88% , due 04/15/10 (a) (b) | 78,033,157 | |||||||||||||
| 50,000,000 | U.S. Treasury Note, 1.13% , due 01/15/12 (a) | 49,675,800 | |||||||||||||
| Total United States | 127,708,957 | ||||||||||||||
| TOTAL DEBT OBLIGATIONS (COST $131,342,098) | 127,708,957 | ||||||||||||||
| MUTUAL FUNDS — 86.3% | |||||||||||||||
| United States — 86.3% | |||||||||||||||
| Affiliated Issuers | |||||||||||||||
| 7,397,456 | GMO Emerging Country Debt Fund, Class IV | 43,275,117 | |||||||||||||
| 96,859,391 | GMO Short-Duration Collateral Fund | 1,656,295,579 | |||||||||||||
| 23,773,633 | GMO World Opportunity Overlay Fund | 436,246,172 | |||||||||||||
| Total United States | 2,135,816,868 | ||||||||||||||
| TOTAL MUTUAL FUNDS (COST $2,826,995,466) | 2,135,816,868 | ||||||||||||||
| OPTIONS PURCHASED — 0.1% | |||||||||||||||
| Options on Futures — 0.1% | |||||||||||||||
| USD | 1,500,000 | U.S. Treasury Bonds Futures 30 Yr. Call, Expires 03/27/09, Strike 129.00 | 1,476,563 | ||||||||||||
| USD | 1,500,000 | U.S. Treasury Bonds Futures 30 Yr. Call, Expires 03/27/09, Strike 135.00 | 281,250 | ||||||||||||
| 1,757,813 | |||||||||||||||
| TOTAL OPTIONS PURCHASED (COST $4,060,687) | 1,757,813 | ||||||||||||||
See accompanying notes to the financial statements.
2
GMO Strategic Fixed Income Fund
(A Series of GMO Trust)
Schedule of Investments — (Continued)
(showing percentage of total net assets)
February 28, 2009
| Shares | Description | Value ($) | |||||||||||||
| SHORT-TERM INVESTMENTS — 13.3% | |||||||||||||||
| Money Market Funds — 13.3% | |||||||||||||||
| 87,590,909 | State Street Institutional Liquid Reserves Fund-Institutional Class | 87,590,909 | |||||||||||||
| 242,250,003 | State Street Institutional Treasury Plus Money Market Fund-Institutional Class | 242,250,003 | |||||||||||||
| TOTAL SHORT-TERM INVESTMENTS (COST $329,840,912) | 329,840,912 | ||||||||||||||
| TOTAL INVESTMENTS — 104.9% (Cost $3,292,239,163) | 2,595,124,550 | ||||||||||||||
| Other Assets and Liabilities (net) — (4.9%) | (121,475,086 | ) | |||||||||||||
| TOTAL NET ASSETS — 100.0% | $ | 2,473,649,464 | |||||||||||||
See accompanying notes to the financial statements.
3
GMO Strategic Fixed Income Fund
(A Series of GMO Trust)
Schedule of Investments — (Continued)
February 28, 2009
A summary of outstanding financial instruments at February 28, 2009 is as follows:
Futures Contracts
| Number of Contracts | Type | Expiration Date | Contract Value | Net Unrealized Appreciation (Depreciation) | |||||||||||||||
| Sales | |||||||||||||||||||
| 248 | U.S. Treasury Note 10 Yr. (CBT) | June 2009 | $ | 29,767,750 | $ | 253,069 | |||||||||||||
| 63 | U.S. Treasury Note 2 Yr. (CBT) | June 2009 | 13,646,391 | 8,670 | |||||||||||||||
| 66 | U.S. Treasury Note 5 Yr. (CBT) | June 2009 | 7,694,672 | 18,880 | |||||||||||||||
| $ | 51,108,813 | $ | 280,619 | ||||||||||||||||
Written Options
A summary of open written option contracts for the Fund at February 28, 2009 is as follows:
| Notional Amount | Expiration Date | Description | Premiums | Market Value | |||||||||||||||||||
| Call | $3,000,000 | 3/27/2009 | USD U.S. Treasury Bonds Futures (30YR), Strike 132.00 | $ | (3,462,750 | ) | $ | (1,406,250 | ) | ||||||||||||||
Swap Agreements
Interest Rate Swaps
| Notional Amount | Expiration Date | Counterparty | Receive (Pay) # | Fixed Rate | Variable Rate | Market Value | |||||||||||||||||||||||||
| 668,000,000 | USD | 2/16/2020 | Merrill Lynch | Receive | 4.54 | % | 3 month LIBOR | $ | 50,465,727 | ||||||||||||||||||||||
| 660,000,000 | USD | 3/5/2020 | Citigroup | Receive | 4.46 | % | 3 month LIBOR | 45,000,945 | |||||||||||||||||||||||
| 333,000,000 | USD | 3/4/2020 | Morgan Stanley | Receive | 4.53 | % | 3 month LIBOR | 24,598,750 | |||||||||||||||||||||||
| 192,000,000 | USD | 3/20/2020 | Deutsche Bank AG | Receive | 4.31 | % | 3 month LIBOR | 10,456,636 | |||||||||||||||||||||||
| 800,000,000 | USD | 3/20/2012 | Deutsche Bank AG | (Pay) | 3.62 | % | 3 month LIBOR | (18,024,508 | ) | ||||||||||||||||||||||
| 1,398,000,000 | USD | 3/4/2012 | Morgan Stanley | (Pay) | 3.92 | % | 3 month LIBOR | (40,561,709 | ) | ||||||||||||||||||||||
| 588,000,000 | USD | 3/20/2012 | Deutsche Bank AG | (Pay) | 2.23 | % | 3 month LIBOR | 2,451,487 | |||||||||||||||||||||||
| 151,000,000 | USD | 3/20/2020 | Deutsche Bank AG | Receive | 2.71 | % | 3 month LIBOR | (11,843,681 | ) | ||||||||||||||||||||||
| 2,766,000,000 | USD | 2/16/2012 | Merrill Lynch | (Pay) | 3.79 | % | 3 month LIBOR | (75,327,354 | ) | ||||||||||||||||||||||
| 333,000,000 | USD | 3/20/2020 | Deutsche Bank AG | (Pay) | 4.72 | % | 3 month LIBOR | (29,475,961 | ) | ||||||||||||||||||||||
| 660,000,000 | USD | 3/5/2020 | Citigroup | (Pay) | 4.94 | % | 3 month LIBOR | (71,217,248 | ) | ||||||||||||||||||||||
See accompanying notes to the financial statements.
4
GMO Strategic Fixed Income Fund
(A Series of GMO Trust)
Schedule of Investments — (Continued)
February 28, 2009
Interest Rate Swaps — continued
| Notional Amount | Expiration Date | Counterparty | Receive (Pay) # | Fixed Rate | Variable Rate | Market Value | |||||||||||||||||||||||||
| 333,000,000 | USD | 3/4/2020 | Morgan Stanley | (Pay) | 5.00 | % | 3 month LIBOR | $ | (37,619,628 | ) | |||||||||||||||||||||
| 668,000,000 | USD | 2/18/2020 | Merrill Lynch | (Pay) | 5.10 | % | 3 month LIBOR | (81,948,516 | ) | ||||||||||||||||||||||
| 1,388,000,000 | USD | 3/20/2012 | Deutsche Bank AG | Receive | 3.54 | % | 3 month LIBOR | 29,143,437 | |||||||||||||||||||||||
| 1,398,000,000 | USD | 3/4/2012 | Morgan Stanley | Receive | 3.80 | % | 3 month LIBOR | 37,341,399 | |||||||||||||||||||||||
| 2,766,000,000 | USD | 2/16/2012 | Merrill Lynch | Receive | 3.90 | % | 3 month LIBOR | 81,307,988 | |||||||||||||||||||||||
| $ | (85,252,236 | ) | |||||||||||||||||||||||||||||
| Premiums to (Pay) Receive | $ | 2,250,000 | |||||||||||||||||||||||||||||
# (Pay) - Fund pays fixed rate and receives variable rate.
Receive - Fund receives fixed rate and pays variable rate.
Total Return Swaps
| Notional Amount | Expiration Date | Counterparty | Pay | Receive | Market Value | ||||||||||||||||||||||
| 268,692,139 | USD | 04/15/2009 | Barclays | 1.03 | % | Barclays U.S. Government | |||||||||||||||||||||
| Bank PLC | Inflation Linked 10 Yr | ||||||||||||||||||||||||||
| Total Return Index | $ | (15,270,516 | ) | ||||||||||||||||||||||||
| 272,627,193 | USD | 04/14/2009 | Barclays Bank PLC | 1.03 | % | Barclays U.S. Government Inflation Linked 10 Yr Total Return Index | (19,114,960 | ) | |||||||||||||||||||
| $ | (34,385,476 | ) | |||||||||||||||||||||||||
| Premiums to (Pay) Receive | $ | — | |||||||||||||||||||||||||
As of February 28, 2009, for the futures and/or swap contracts held, the Fund had sufficient cash and/or securities to cover any commitments or margin requirements of the relevant broker or exchange.
Notes to Schedule of Investments:
LIBOR - London Interbank Offered Rate
(a) All or a portion of this security has been segregated to cover margin requirements on open financial futures contracts and/or collateral on open swap contracts.
(b) Indexed security in which price and/or coupon is linked to the prices of a specific instrument or financial statistic (Note 2).
Currency Abbreviations:
USD - United States Dollar
See accompanying notes to the financial statements.
5
GMO Strategic Fixed Income Fund
(A Series of GMO Trust)
Statement of Assets and Liabilities — February 28, 2009
| Assets: | |||||||
| Investments in unaffiliated issuers, at value (cost $465,243,697) (Note 2) | $ | 459,307,682 | |||||
| Investments in affiliated issuers, at value (cost $2,826,995,466) (Notes 2 and 8) | 2,135,816,868 | ||||||
| Dividends and interest receivable | 393,604 | ||||||
| Receivable for open swap contracts (Note 2) | 280,766,369 | ||||||
| Receivable for expenses reimbursed by Manager (Note 3) | 74,499 | ||||||
| Total assets | 2,876,359,022 | ||||||
| Liabilities: | |||||||
| Payable to affiliate for (Note 3): | |||||||
| Management fee | 477,587 | ||||||
| Shareholder service fee | 115,183 | ||||||
| Trustees and Chief Compliance Officer of GMO Trust fees | 8,041 | ||||||
| Payable for variation margin on open futures contracts (Note 2) | 21,443 | ||||||
| Payable for open swap contracts (Note 2) | 400,404,081 | ||||||
| Written options outstanding, at value (premiums $3,462,750) (Note 2) | 1,406,250 | ||||||
| Accrued expenses | 276,973 | ||||||
| Total liabilities | 402,709,558 | ||||||
| Net assets | $ | 2,473,649,464 | |||||
| Net assets consist of: | |||||||
| Paid-in capital | $ | 3,485,675,835 | |||||
| Distributions in excess of net investment income | (68,468,070 | ) | |||||
| Accumulated net realized loss | (131,393,095 | ) | |||||
| Net unrealized depreciation | (812,165,206 | ) | |||||
| $ | 2,473,649,464 | ||||||
| Net assets attributable to: | |||||||
| Class III shares | $ | 227,452,665 | |||||
| Class VI shares | $ | 2,246,196,799 | |||||
| Shares outstanding: | |||||||
| Class III | 13,094,367 | ||||||
| Class VI | 129,474,124 | ||||||
| Net asset value per share: | |||||||
| Class III | $ | 17.37 | |||||
| Class VI | $ | 17.35 | |||||
See accompanying notes to the financial statements.
6
GMO Strategic Fixed Income Fund
(A Series of GMO Trust)
Statement of Operations — Year Ended February 28, 2009
| Investment Income: | |||||||
| Dividends from affiliated issuers (Note 8) | $ | 125,592,034 | |||||
| Interest | 11,124,464 | ||||||
| Dividends | 557,958 | ||||||
| Total investment income | 137,274,456 | ||||||
| Expenses: | |||||||
| Management fee (Note 3) | 9,947,921 | ||||||
| Shareholder service fee – Class III (Note 3) | 267,205 | ||||||
| Shareholder service fee – Class VI (Note 3) | 2,090,567 | ||||||
| Custodian, fund accounting agent and transfer agent fees | 489,274 | ||||||
| Audit and tax fees | 83,736 | ||||||
| Legal fees | 182,191 | ||||||
| Trustees fees and related expenses (Note 3) | 109,411 | ||||||
| Registration fees | 4,168 | ||||||
| Miscellaneous | 48,858 | ||||||
| Total expenses | 13,223,331 | ||||||
| Fees and expenses reimbursed by Manager (Note 3) | (707,578 | ) | |||||
| Expense reductions (Note 2) | (34 | ) | |||||
| Indirectly incurred fees waived or borne by Manager (Note 3) | (282,548 | ) | |||||
| Shareholder service fee waived (Note 3) | (93,733 | ) | |||||
| Net expenses | 12,139,438 | ||||||
| Net investment income (loss) | 125,135,018 | ||||||
| Realized and unrealized gain (loss): | |||||||
| Net realized gain (loss) on: | |||||||
| Investments in unaffiliated issuers | (32,170,490 | ) | |||||
| Investments in affiliated issuers | (257,532,415 | ) | |||||
| Realized gains distributions from affiliated issuers (Note 8) | 1,710,186 | ||||||
| Closed futures contracts | (16,185,665 | ) | |||||
| Closed swap contracts | 15,090,043 | ||||||
| Written options | (8,905,265 | ) | |||||
| Foreign currency, forward contracts and foreign currency related transactions | 5,211 | ||||||
| Net realized gain (loss) | (297,988,395 | ) | |||||
| Change in net unrealized appreciation (depreciation) on: | |||||||
| Investments in unaffiliated issuers | (5,477,014 | ) | |||||
| Investments in affiliated issuers | (524,404,155 | ) | |||||
| Open futures contracts | 3,460,295 | ||||||
| Open swap contracts | (158,821,421 | ) | |||||
| Written options | 2,056,500 | ||||||
| Foreign currency, forward contracts and foreign currency related transactions | (3,400 | ) | |||||
| Net unrealized gain (loss) | (683,189,195 | ) | |||||
| Net realized and unrealized gain (loss) | (981,177,590 | ) | |||||
| Net increase (decrease) in net assets resulting from operations | $ | (856,042,572 | ) | ||||
See accompanying notes to the financial statements.
7
GMO Strategic Fixed Income Fund
(A Series of GMO Trust)
Statement of Changes in Net Assets
| Year Ended February 28, 2009 | Year Ended February 29, 2008 | ||||||||||
| Increase (decrease) in net assets: | |||||||||||
| Operations: | |||||||||||
| Net investment income (loss) | $ | 125,135,018 | $ | 119,328,375 | |||||||
| Net realized gain (loss) | (297,988,395 | ) | (36,796,389 | ) | |||||||
| Change in net unrealized appreciation (depreciation) | (683,189,195 | ) | (126,139,356 | ) | |||||||
| Net increase (decrease) in net assets from operations | (856,042,572 | ) | (43,607,370 | ) | |||||||
| Distributions to shareholders from: | |||||||||||
| Net investment income | |||||||||||
| Class III | (8,839,751 | ) | (5,772,752 | ) | |||||||
| Class VI | (159,237,634 | ) | (97,139,821 | ) | |||||||
| Total distributions from net investment income | (168,077,385 | ) | (102,912,573 | ) | |||||||
| Net realized gains | |||||||||||
| Class III | — | (344,272 | ) | ||||||||
| Class VI | — | (5,909,472 | ) | ||||||||
| Total distributions from net realized gains | — | (6,253,744 | ) | ||||||||
| Net share transactions (Note 7): | |||||||||||
| Class III | (688,142 | ) | 59,121,073 | ||||||||
| Class VI | (1,905,410,410 | ) | 3,042,002,441 | ||||||||
| Increase (decrease) in net assets resulting from net share transactions | (1,906,098,552 | ) | 3,101,123,514 | ||||||||
| Redemption fees (Notes 2 and 7): | |||||||||||
| Class III | 190,982 | — | |||||||||
| Class VI | 4,100,512 | — | |||||||||
| Increase in net assets resulting from redemption fees | 4,291,494 | — | |||||||||
| Total increase (decrease) in net assets resulting from net share transactions and redemption fees | (1,901,807,058 | ) | 3,101,123,514 | ||||||||
| Total increase (decrease) in net assets | (2,925,927,015 | ) | 2,948,349,827 | ||||||||
| Net assets: | |||||||||||
| Beginning of period | 5,399,576,479 | 2,451,226,652 | |||||||||
| End of period (including distributions in excess of net investment income of $68,468,070 and $28,882,220, respectively) | $ | 2,473,649,464 | $ | 5,399,576,479 | |||||||
See accompanying notes to the financial statements.
8
GMO Strategic Fixed Income Fund
(A Series of GMO Trust)
Financial Highlights
(For a Class III share outstanding throughout each period)
| Year Ended February 28/29, | |||||||||||||||
| 2009 | 2008 | 2007(a) | |||||||||||||
| Net asset value, beginning of period | $ | 23.60 | $ | 25.22 | $ | 25.06 | |||||||||
| Income (loss) from investment operations: | |||||||||||||||
| Net investment income (loss)(b)† | 0.71 | 0.78 | 0.96 | ||||||||||||
| Net realized and unrealized gain (loss) | (5.70 | ) | (1.37 | ) | 0.34 | ||||||||||
| Total from investment operations | (4.99 | ) | (0.59 | ) | 1.30 | ||||||||||
| Less distributions to shareholders: | |||||||||||||||
| From net investment income | (1.24 | ) | (0.97 | ) | (1.14 | ) | |||||||||
| From net realized gains | — | (0.06 | ) | — | |||||||||||
| Total distributions | (1.24 | ) | (1.03 | ) | (1.14 | ) | |||||||||
| Net asset value, end of period | $ | 17.37 | $ | 23.60 | $ | 25.22 | |||||||||
| Total Return(c) | (21.20 | )% | (2.39 | )% | 5.23 | %** | |||||||||
| Ratios/Supplemental Data: | |||||||||||||||
| Net assets, end of period (000's) | $ | 227,453 | $ | 277,879 | $ | 226,917 | |||||||||
| Net expenses to average daily net assets(d) | 0.40 | %(e) | 0.38 | %(e) | 0.39 | %* | |||||||||
| Net investment income to average daily net assets(b) | 3.32 | % | 3.12 | % | 5.96 | %* | |||||||||
| Portfolio turnover rate | 70 | % | 67 | % | 7 | %**†† | |||||||||
| Fees and expenses reimbursed and/or waived by the Manager to average daily net assets: | 0.03 | % | 0.04 | % | 0.06 | %* | |||||||||
| Redemption fees consisted of the following per share amounts:† | $ | 0.02 | — | — | |||||||||||
(a) Period from July 13, 2006 (commencement of operations) through February 28, 2007.
(b) Net investment income is affected by the timing of the declaration of dividends by the underlying funds in which the Fund invests.
(c) The total returns would have been lower had certain expenses not been reimbursed and/or waived during the periods shown and assumes the effect of reinvested distributions. Calculation excludes redemption fees which are borne by the shareholder.
(d) Net expenses exclude expenses incurred indirectly through investment in the underlying funds (See Note 3).
(e) The net expense ratio does not include the effect of expense reductions.
† Calculated using average shares outstanding throughout the period.
* Annualized.
** Not annualized.
†† Calculation represents portfolio turnover of the Fund for the period from May 31, 2006 through February 28, 2007.
See accompanying notes to the financial statements.
9
GMO Strategic Fixed Income Fund
(A Series of GMO Trust)
Financial Highlights
(For a Class VI share outstanding throughout each period)
| Year Ended February 28/29, | |||||||||||||||
| 2009 | 2008 | 2007(a) | |||||||||||||
| Net asset value, beginning of period | $ | 23.57 | $ | 25.22 | $ | 25.00 | |||||||||
| Income (loss) from investment operations: | |||||||||||||||
| Net investment income (loss)(b)† | 0.68 | 0.97 | 0.76 | ||||||||||||
| Net realized and unrealized gain (loss) | (5.64 | ) | (1.55 | ) | 0.61 | ||||||||||
| Total from investment operations | (4.96 | ) | (0.58 | ) | 1.37 | ||||||||||
| Less distributions to shareholders: | |||||||||||||||
| From net investment income | (1.26 | ) | (1.01 | ) | (1.15 | ) | |||||||||
| From net realized gains | — | (0.06 | ) | — | |||||||||||
| Total distributions | (1.26 | ) | (1.07 | ) | (1.15 | ) | |||||||||
| Net asset value, end of period | $ | 17.35 | $ | 23.57 | $ | 25.22 | |||||||||
| Total Return(c) | (21.09 | )% | (2.35 | )% | 5.52 | %** | |||||||||
| Ratios/Supplemental Data: | |||||||||||||||
| Net assets, end of period (000's) | $ | 2,246,197 | $ | 5,121,698 | $ | 2,224,310 | |||||||||
| Net expenses to average daily net assets(d) | 0.30 | %(e) | 0.29 | %(e) | 0.29 | %* | |||||||||
| Net investment income to average daily net assets(b) | 3.14 | % | 3.87 | % | 4.01 | %* | |||||||||
| Portfolio turnover rate | 70 | % | 67 | % | 7 | %** | |||||||||
| Fees and expenses reimbursed and/or waived by the Manager to average daily net assets: | 0.03 | % | 0.04 | % | 0.06 | %* | |||||||||
| Redemption fees consisted of the following per share amounts:† | $ | 0.02 | — | — | |||||||||||
(a) Period from May 31, 2006 (commencement of operations) through February 28, 2007.
(b) Net investment income is affected by the timing of the declaration of dividends by the underlying funds in which the Fund invests.
(c) The total returns would have been lower had certain expenses not been reimbursed and/or waived during the periods shown and assumes the effect of reinvested distributions. Calculation excludes redemption fees which are borne by the shareholder.
(d) Net expenses exclude expenses incurred indirectly through investment in the underlying funds (See Note 3).
(e) The net expense ratio does not include the effect of expense reductions.
† Calculated using average shares outstanding throughout the period.
* Annualized.
** Not annualized.
See accompanying notes to the financial statements.
10
GMO Strategic Fixed Income Fund
(A Series of GMO Trust)
Notes to Financial Statements
February 28, 2009
1. Organization
GMO Strategic Fixed Income Fund (the "Fund") is a series of GMO Trust (the "Trust"). The Fund is registered under the Investment Company Act of 1940, as amended, as an open-end, non-diversified management investment company. The Fund is advised and managed by Grantham, Mayo, Van Otterloo & Co. LLC (the "Manager" or "GMO"). The Trust was established as a Massachusetts business trust under the laws of The Commonwealth of Massachusetts on June 24, 1985. The Declaration of Trust permits the Trustees of the Trust ("Trustees") to create an unlimited number of series of shares ("Funds") and to subdivide Funds into classes.
The Fund seeks total return in excess of that of the JPMorgan U.S. 3 Month Cash Index. The Manager may, in the future, depending on the Manager's assessment of interest rate conditions, change the Fund's benchmark to another nationally recognized debt index with a duration between 90 days and 15 years. The Fund typically invests in fixed income securities included in the Fund's benchmark and in securities and instruments with similar characteristics. The Fund may seek additional returns by seeking to exploit differences in global interest rates and currency and emerging country debt markets. The Fund may invest a substantial portion of its total assets in shares of GMO Short-Duration Collateral Fund; in futures contracts, currency options, currency forwards, swap contracts, interest rate options, swaps on interest rates, and other types of derivatives; in U.S. and foreign investment-grade bonds, including U.S. and foreign govern ment securities and asset-backed securities issued by U.S. government agencies (including securities neither guaranteed nor insured by the U.S. government), and foreign governments, corporate bonds, and mortgage-backed and other asset-backed securities issued by private issuers; in shares of GMO World Opportunity Overlay Fund, and up to 5% of the Fund's total assets in sovereign debt of emerging countries (including below investment grade securities (also known as "junk bonds")), primarily through investment in shares of GMO Emerging Country Debt Fund ("ECDF").
Throughout the year ended February 28, 2009, the Fund had two classes of shares outstanding: Class III and Class VI. Each class of shares bears a different level of shareholder service fees.
The financial statements of the series of the Trust in which the Fund invests ("underlying funds") should be read in conjunction with the Fund's financial statements. These financial statements are available, without charge, upon request by calling (617) 346-7646 (collect). Shares of GMO Short-Duration Collateral Fund and GMO World Opportunity Overlay Fund are not publicly available for direct purchase.
The Fund directly and indirectly (through underlying funds) invests in securities with contractual cash flows, such as collateralized mortgage obligations and commercial mortgage-backed securities, including securities backed by sub-prime mortgage loans, credit card receivables and auto loan receivables. The value, liquidity and related income of these securities are sensitive to changes in economic conditions, including real estate values, delinquencies and/or defaults, and may be adversely affected by changes in interest rates and shifts in the market's perception of the securities' market values.
11
GMO Strategic Fixed Income Fund
(A Series of GMO Trust)
Notes to Financial Statements — (Continued)
February 28, 2009
The Fund will, if deemed prudent by the Manager, take temporary defensive measures (until the Manager has determined that normal conditions have returned or that it is otherwise prudent to resume investing in accordance with the Fund's normal investment strategies) and may not achieve its investment objectives during those periods. Recent changes in the credit markets have reduced the liquidity of all types of fixed income securities, including asset-backed securities. The Fund took temporary defensive measures during the last fiscal year.
The Fund is not accepting subscriptions.
2. Significant accounting policies
The following is a summary of significant accounting policies followed by the Fund in the preparation of its financial statements. These policies are in conformity with accounting principles generally accepted in the United States of America ("U.S. GAAP") and have been consistently followed by the Fund in preparing its financial statements. The preparation of financial statements in accordance with U.S. GAAP requires management to make estimates and assumptions that affect the reported amounts and disclosures in the financial statements. Actual results could differ from those estimates. The accounting records of the Fund are maintained in U.S. dollars.
Portfolio valuation
Securities listed on a securities exchange for which market quotations are readily available are valued at the last sale price or official closing price on each business day, or if there is no such reported sale or official closing price, at the most recent quoted bid price. Unlisted securities for which market quotations are readily available are generally valued at the most recent quoted bid price. Debt instruments with a remaining maturity of sixty days or less are generally valued at amortized cost, which approximates fair value. Shares of investment funds are generally valued at their net asset value. Securities for which quotations are not readily available or whose values the Manager has determined to be unreliable are valued at fair value as determined in good faith by the Trustees or persons acting at their direction pursuant to procedures approved by the Trustees. By its nature, a fair value price is a good faith estim ate of the value of a security at a given point in time and may not reflect the value that would be realized if the security were sold. The difference between a fair value price and the value realized upon a sale could be material.
Typically the Fund and the underlying funds value debt instruments based on prices supplied by a primary pricing source chosen by the Manager. The Manager evaluates primary pricing sources on an ongoing basis and may change a pricing source should the Manager deem it appropriate. If it deems appropriate, the Manager, at its discretion, may override a price supplied by a primary source by using a price provided by another source. The prices provided by primary pricing sources may differ from the value that would be realized if the securities were sold, and the differences could be material.
Certain securities held by the Fund and underlying funds are valued on the basis of prices provided by a single source. The prices provided may differ from the value that would be realized if the securities were
12
GMO Strategic Fixed Income Fund
(A Series of GMO Trust)
Notes to Financial Statements — (Continued)
February 28, 2009
sold, and the differences could be material. As of February 28, 2009, the total value of these securities represented 32.10% of net assets.
In September 2006, the Financial Accounting Standards Board ("FASB") issued Statement of Financial Accounting Standards No. 157, Fair Value Measurements ("SFAS 157"). SFAS 157 is effective for the Fund's current fiscal year. While the adoption of SFAS 157 does not have an effect on the Fund's net asset value, it does require additional disclosures about fair value measurements. SFAS 157 establishes a three-level hierarchy for disclosure of fair value measurements. The valuation hierarchy is based upon the reliability of inputs to the valuation of the Fund's investments. The three levels are defined as follows:
Level 1 – Valuations based on quoted prices for identical securities in active markets.
Level 2 – Valuations determined using other significant direct or indirect observable inputs.
Level 3 – Valuations based on inputs that are unobservable and significant.
The inputs or methodology used for valuing securities are not necessarily an indication of the risk associated with investing in those securities.
The following is a summary of the fair valuations according to inputs used as of February 28, 2009 in valuing the Fund's investments:
| Asset Valuation Inputs | Investments in Securities | Other Financial Instruments* | |||||||||
| Level 1 - Quoted Prices | $ | 92,950,917 | $ | 280,619 | |||||||
| Level 2 - Other Significant Observable Inputs | 2,502,173,633 | 280,766,369 | |||||||||
| Level 3 - Significant Unobservable Inputs | — | — | |||||||||
| Total | $ | 2,595,124,550 | $ | 281,046,988 | |||||||
* Other financial instruments include futures contracts and swap agreements.
| Liability Valuation Inputs | Investments in Securities | Other Financial Instruments** | |||||||||
| Level 1 - Quoted Prices | $ | — | $ | — | |||||||
| Level 2 - Other Significant Observable Inputs | — | (401,810,331 | ) | ||||||||
| Level 3 - Significant Unobservable Inputs | — | — | |||||||||
| Total | $ | — | $ | (401,810,331 | ) | ||||||
** Other financial instruments include swap agreements and written options.
For the underlying fund's summary of valuation inputs please refer to the respective fund's portfolio valuation note.
13
GMO Strategic Fixed Income Fund
(A Series of GMO Trust)
Notes to Financial Statements — (Continued)
February 28, 2009
The Fund held no investments or other financial instruments at either February 29, 2008 or February 28, 2009, whose fair value was determined using Level 3 inputs.
Foreign currency translation
The market values of foreign securities, currency holdings and related assets and liabilities are translated to U.S. dollars based on the 4 p.m. New York time exchange rates each business day. Income and expenses denominated in foreign currencies are translated at the 4 p.m. New York time exchange rates on the business day the income and expenses are accrued or incurred. The Fund does not isolate realized and unrealized gains and losses attributable to changes in exchange rates from gains and losses that arise from changes in the market value of investments. Such fluctuations are included with net realized and unrealized gain or loss on investments. Net realized gains and losses on foreign currency transactions represent gains and losses on disposition of currencies and forward currency contracts, currency gains and losses realized between the trade and settlement dates on securities transactions, and the difference between the amount of investment income and foreign withholding taxes recorded on the Fund's accounting records and the U.S. dollar equivalent amounts actually received or paid.
Forward currency contracts
The Fund may enter into forward currency contracts including forward cross currency contracts. A forward currency contract is an agreement between two parties to buy and sell a currency at a set price on a future date. The market value of a forward currency contract fluctuates with changes in forward currency exchange rates. Forward currency contracts are marked to market daily using rates supplied by a quotation service and changes in value are recorded by the Fund as an unrealized gain or loss. Realized gains or losses equal to the difference between the value of the contract at the time it was opened and the value at the time it was closed are recorded upon delivery or receipt of the currency or, if a forward currency contract is offset by entering into another forward currency contract with the same broker, upon settlement of the net gain or loss. These contracts may involve market risk in excess of the unrealized gain or lo ss reflected in the Fund's Statement of Assets and Liabilities. They expose the Fund to the risk of unfavorable movements in currency values and the risk that the counterparty will be unable or unwilling to meet the terms of the contracts. The Fund had no forward currency contracts outstanding at the end of the period.
Futures contracts
The Fund may purchase and sell futures contracts. Upon entering into a futures contract, the Fund is required to deposit cash, U.S. government and agency obligations, or other liquid assets with the futures clearing broker in accordance with the initial margin requirements of the broker or exchange. In addition, the Fund maintains cash or securities in an amount that at least equals the net amount payable in the event the Fund must deliver the full amount of the contract. Futures contracts are marked to market daily and an appropriate payable or receivable for the change in value ("variation margin") is recorded by the Fund. The payable or receivable is settled on the following business day. Gains or losses are recognized but not considered realized until the contracts expire or are closed. Futures contracts involve, to varying degrees, risk of loss in excess of the variation margin disclosed in the Statement of Assets and Liabi lities. Under
14
GMO Strategic Fixed Income Fund
(A Series of GMO Trust)
Notes to Financial Statements — (Continued)
February 28, 2009
some circumstances, futures exchanges may establish daily limits on the amount that the price of a futures contract can vary from the previous day's settlement price, thereby effectively preventing liquidation of unfavorable positions. Losses may arise from changes in the value of the underlying instrument if the Fund is unable to liquidate a futures position due to an illiquid secondary market for the contract or the imposition of price limits, or if counterparties do not perform under the contract terms. Futures contracts are generally valued at the settlement price established each day by the board of trade or exchange on which they are traded. Futures contracts outstanding at the end of the period are listed in the Fund's Schedule of Investments.
Options
The Fund may write (i.e., sell) call and put options. Writing options alters the Fund's exposure to the underlying instrument by, in the case of a call option, obligating the Fund to sell the underlying instrument at a set price to the option-holder and, in the case of a put option, obligating the Fund to purchase the underlying instrument at a set price from the option-holder. In the case of an index option, settlement will be in cash. When the Fund writes a call or put option, an amount equal to the premium received is recorded as a liability and subsequently marked to market to reflect the current value of the option written. Premiums received from writing options that expire are treated as realized gains. Premiums received from writing options that are exercised or closed are deducted from the amounts paid on the underlying future, security or currency transaction to determine the realized gain or loss. The Fund as a writer of an option has no control over whether the underlying future, security or currency may be sold (call) or purchased (put) and as a result bears the market risk of an unfavorable change in the price of the future, security or currency underlying the option. In the event that the Fund writes uncovered put or call options (i.e. options for investments that the Fund does not own), it bears the risk of substantial losses if the price of the underlying instrument increases during the term of the option. Options expose the Fund to the risk the Fund may not be able to enter into a closing transaction because of an illiquid market. Written options outstanding at the end of the period are listed in the Fund's Schedule of Investments.
For the year ended February 28, 2009, the Fund's investment activity in written options contracts was as follows:
| Puts | Calls | ||||||||||||||||||
| Principal Amount of Contracts | Premiums | Principal Amount of Contracts | Premiums | ||||||||||||||||
| Outstanding, beginning of year | $ | — | $ | — | $ | — | $ | — | |||||||||||
| Options written | — | — | (2,329,460,000 | ) | (20,270,085 | ) | |||||||||||||
| Options exercised | — | — | 2,306,600,000 | 5,905,300 | |||||||||||||||
| Options expired | — | — | 14,360,000 | 8,053,660 | |||||||||||||||
| Options sold | — | — | 5,500,000 | 2,848,375 | |||||||||||||||
| Outstanding, end of year | $ | — | $ | — | $ | (3,000,000 | ) | $ | (3,462,750 | ) | |||||||||
15
GMO Strategic Fixed Income Fund
(A Series of GMO Trust)
Notes to Financial Statements — (Continued)
February 28, 2009
The Fund may also purchase put and call options. Purchasing options alters the Fund's exposure to the underlying instrument by, in the case of a call option, entitling the Fund to purchase the underlying instrument at a set price from the writer of the option and, in the case of a put option, entitling the Fund to sell the underlying instrument at a set price to the writer of the option. The Fund pays a premium for a purchased option. That premium is disclosed in the Schedule of Investments and is subsequently marked to market to reflect the current value of the option. Premiums paid for purchasing options that expire are treated as realized losses. Premiums paid for purchasing options that are exercised or closed are deducted from the proceeds on the closing transaction to determine the realized gain or loss. The risk associated with purchasing put and call options is limited to the premium paid. Options contracts purchased by the Fund and outstanding at the end of the period are listed in the Fund's Schedule of Investments.
The Fund values exchange traded options at the last sale price, or if no sale is reported, the last bid price for options it has purchased and the last ask price for options it has written. The Fund values options traded over-the-counter using inputs provided by primary pricing sources and industry standard models.
Loan agreements
The Fund may invest in loans to corporate, governmental, or other borrowers. The Fund's investments in loans may be in the form of participations in loans or assignments of all or a portion of loans from third parties. A loan is often administered by a bank or other financial institution (the "lender") that acts as agent for all holders. The agent administers the terms of the loan, as specified in the loan agreement. When investing in a loan participation, (i) the Fund has the right to receive payments of principal, interest and any fees to which it is entitled only from the lender selling the participation in the loan agreement and only upon receipt by the lender of payments from the borrower and (ii) the Fund generally has no right to enforce compliance by the borrower with the terms of the loan agreement. As a result, the Fund may be subject to the credit risk of both the borrower and the lender has sold the participation in the loan agreement. When the Fund purchases assignments from lenders, it acquires direct rights against the borrower on the loan. The Fund had no loan agreements outstanding at the end of the period.
Indexed securities
The Fund may invest in indexed securities. Indexed securities are securities whose redemption values and/or coupons are linked to the prices of a specific instrument or financial statistic. The Fund uses indexed securities to increase or decrease its exposure to different underlying instruments and to gain exposure to markets in which investing through conventional securities is difficult. Indexed securities held by the Fund at the end of the period are listed in the Fund's Schedule of Investments.
Swap agreements
The Fund may enter into various types of swap agreements, including without limitation, interest rate, total return, credit default and variance swap agreements. A swap agreement is an agreement to exchange the return generated by one instrument for the return generated by another instrument. When entering into a swap agreement, the Fund and/or the swap counterparty may post or receive cash or securities as
16
GMO Strategic Fixed Income Fund
(A Series of GMO Trust)
Notes to Financial Statements — (Continued)
February 28, 2009
collateral. The party posting the collateral typically receives the interest associated with or payments related to the collateral and has the risk of loss related to the collateral.
Interest rate swap agreements involve an exchange by the parties of their respective commitments to pay or right to receive interest, e.g., an exchange of floating rate interest payments for fixed rate interest payments with respect to the notional amount of principal.
Total return swap agreements involve a commitment by one party to pay interest to the other party in exchange for a payment to it from the other party based on the return of a reference instrument (e.g., a security or basket of securities), both based on notional amounts. To the extent the return of the reference instrument exceeds or falls short of the interest payments, one party will receive a payment from or make a payment to the other party.
In a credit default swap agreement, one party makes payments to another party in exchange for the right to receive a specified return if a credit event occurs with respect to a referenced entity or entities. Buying credit default protection reduces the buyer's exposure in the event of an issuer's default (e.g., it reduces risk where a party owns a security issued by or otherwise has exposure to the issuer). Selling credit default protection subjects the seller to exposure to an issuer's default. A seller of credit default protection receives payments in return for its obligation to pay the principal amount of a debt security (or other agreed-upon value) to the other party upon the occurrence of a credit event (e.g., issuer default or similar event). If no credit event occurs, the seller has no payment obligations. For credit default swap agreements on asset-backed securities, a credit event may be triggered by such events as the issuer's failure to pay interest or principal, an agreement of the holders of an asset-backed security to a maturity extension, a rating downgrade on the security or a write-down on the collateral underlying the security. For credit default swap agreements on corporate or sovereign issuers, a credit event may be triggered by such events as the issuer's bankruptcy, failure to pay interest or principal, repudiation/moratorium or restructuring.
Variance swap agreements involve an agreement by two parties to exchange cash flows based on the measured variance (or square of volatility) of a specified underlying asset. One party agrees to exchange a "fixed rate" or strike price payment for the "floating rate" or realized price variance on the underlying asset with respect to the notional amount. At inception, the strike price chosen is generally fixed at a level such that the fair value of the swap is zero. At the expiration date, the amount paid by one party to the other is the difference between the realized price variance of the underlying asset and the strike price multiplied by the notional amount. A receiver of the realized price variance would receive a payment when the realized price variance of the underlying asset is greater than the strike price and would make a payment when that variance is less than the strike price. A payer of the realized price variance woul d make a payment when the realized price variance of the underlying asset is greater than the strike price and would receive a payment when that variance is less than the strike price. This type of agreement is essentially a forward contract on the future realized price variance of the underlying asset.
17
GMO Strategic Fixed Income Fund
(A Series of GMO Trust)
Notes to Financial Statements — (Continued)
February 28, 2009
The Fund prices its swap agreements daily using models that may incorporate quotations from market makers and records the change in value, if any, as unrealized gain or loss in the Statement of Operations. Payments received or made on swap agreements are recorded as realized gain or loss in the Statement of Operations. Gains or losses are realized upon termination of the swap agreements.
Swap agreements often are not actively traded on financial markets. The values assigned to them may differ significantly from the values that would be realized upon termination, and the differences could be material. Entering into swap agreements involves credit, legal, market and documentation risk that is not reflected in the amounts reported in the Statement of Assets and Liabilities. Such risks include the possibility that the party with whom the Fund contracts may default on its obligations to perform or disagree as to the meaning of contractual terms, or that the collateral that party posts may be insufficient or not timely received by the Fund. Credit risk may be particularly acute in an environment where financial services firms are exposed to systemic risks of the type evidenced by the insolvency of Lehman Brothers and subsequent market disruptions. Swap agreements outstanding at the end of the period are listed in the Fund's Schedule of Investments.
Repurchase agreements
The Fund may enter into repurchase agreements. Under a repurchase agreement the Fund acquires a security for cash and obtains a simultaneous commitment from the seller to repurchase the security at an agreed upon price and date. The Fund, through its custodian, takes possession of securities collateralizing the repurchase agreement. The collateral is marked to market daily to ensure that the market value of the underlying assets is at least equal to the amount owed to the Fund in the event of default by the seller. If the seller of a repurchase agreement defaults or enters into insolvency proceedings and the value of the collateral declines, the Fund's recovery of cash may be delayed or limited. The Fund had no repurchase agreements outstanding at the end of the period.
Reverse repurchase agreements
The Fund may enter into reverse repurchase agreements. Under a reverse repurchase agreement the Fund sells portfolio assets subject to an agreement by the Fund to repurchase the same assets at a later date at a fixed price. In connection with these agreements, the Fund establishes segregated accounts with its custodian in which the Fund maintains cash, U.S. government securities or other assets equal in value to its obligations under the reverse repurchase agreement into which it has entered. Reverse repurchase agreements expose the Fund to the risk that the market value of the securities the Fund has sold under the agreement may decline below the price at which the Fund is obligated to repurchase them under the agreement. If the buyer in a reverse repurchase agreement files for bankruptcy or becomes insolvent, the Fund's use of proceeds from the sale of its securities may be restricted while the other party or its trustee or re ceiver determines whether to honor the Fund's right to repurchase the securities. Furthermore, in that situation the Fund may be unable to recover the securities it sold and as a result would realize a loss equal to the difference between the value of the securities and the payment it received for them. This loss would be greater to the extent the buyer paid less than the value of the securities the Fund sold to it (e.g., a buyer
18
GMO Strategic Fixed Income Fund
(A Series of GMO Trust)
Notes to Financial Statements — (Continued)
February 28, 2009
may pay $95 for a bond with a market value of $100). The market value of the securities the Fund has sold is determined daily and any additional required collateral is allocated to or sent by the Fund on the next business day. The Fund had no reverse repurchase agreements outstanding at the end of the period.
Securities lending
The Fund may lend its securities to qualified brokers. The loans are collateralized with cash or liquid securities with a market value at least equal to the market value of the securities upon entering into the loan. As with other extensions of credit, the Fund may bear the risk of loss with respect to the investment of the collateral, the risk of delay in and/or inability to exercise its rights with respect to the collateral, and the risk of delay in recovery or loss of rights in the loaned securities should the borrower of the securities fail financially. If a loan is collateralized by U.S. government securities, the Fund receives a fee from the borrower. If a loan is collateralized by cash, the Fund typically invests the cash collateral for its own account. For the year from March 1, 2008 through February 28, 2009, the Fund did not participate in securities lending.
Taxes and distributions
The Fund intends to qualify each tax year as a regulated investment company under Subchapter M of the Internal Revenue Code of 1986, as amended (the "Code"). The Fund intends to distribute substantially all of its net investment income and all of its net realized short-term and long-term capital gain, if any, after giving effect to any available capital loss carryforwards for U.S. federal income tax purposes. Therefore, no provision for U.S. federal income or excise tax is necessary.
The Fund's policy is to declare and pay distributions from net investment income, if any, semiannually, and from net realized short-term and long-term capital gain, if any, at least annually. All distributions are paid in shares of the Fund, at net asset value, unless the shareholder elects to receive cash distributions. Distributions to shareholders are recorded by the Fund on the ex-dividend date.
Income and capital gain distributions are determined in accordance with U.S. federal income tax regulations, which may differ from U.S. GAAP. Certain capital accounts in the financial statements are periodically adjusted for permanent differences in order to reflect their tax character. These adjustments have no impact on net assets or net asset value per share. Temporary differences that arise from recognizing certain items of income, expense, gain or loss in different periods for financial statement and tax purposes will reverse at some time in the future. Distributions in excess of net investment income or net realized gains are temporary over-distributions for financial statement purposes resulting from differences in the recognition or classification of income or distributions for financial statement and tax purposes.
U.S. GAAP and tax accounting differences primarily relate to capital loss carryforwards, derivative contract transactions, partnership interest tax allocations, losses on wash sale transactions, post-October capital and currency losses, redemption in-kind transactions, and amortization and accretion of debt securities.
19
GMO Strategic Fixed Income Fund
(A Series of GMO Trust)
Notes to Financial Statements — (Continued)
February 28, 2009
The following reclassification represents the amount necessary to report the stated components of net assets on a tax basis, excluding certain temporary differences, as of February 28, 2009. The financial highlights exclude these adjustments.
| Distributions In Excess of Net Investment Income | Accumulated Net Realized Loss | Paid-in Capital | |||||||||
| $ | 3,356,517 | $ | 159,813,728 | $ | (163,170,245 | ) | |||||
The tax character of distributions declared to shareholders is as follows:
| 2/28/2009 | 2/29/2008 | ||||||||||
| Ordinary income (including any net short-term capital gain) | $ | 168,077,385 | $ | 105,777,934 | |||||||
| Net long-term capital gain | — | 3,388,383 | |||||||||
| Total distributions | $ | 168,077,385 | $ | 109,166,317 | |||||||
Distributions in excess of tax basis earnings and profits, if significant, are reported in the financial statements as a return of capital for tax purposes.
As of February 28, 2009, the Fund elected to defer to March 1, 2009 post-October capital losses of $92,972,393 and post-October currency losses of $6,458,589.
As of February 28, 2009, the Fund had capital loss carryforwards available to offset future realized gains if any, to the extent permitted by the Code. Utilization of the capital loss carryforwards could be subject to limitations imposed by the Code related to share ownership activity. Such losses expire as follows:
| 2/28/2017 | $ | (137,475,668 | ) | ||||
| Total | $ | (137,475,668 | ) | ||||
As of February 28, 2009, the approximate cost for U.S. federal income tax purposes and gross and net unrealized appreciation (depreciation) in value of investments were as follows:
| Aggregate Cost | Gross Unrealized Appreciation | Gross Unrealized (Depreciation) | Net Unrealized Appreciation (Depreciation) | ||||||||||||
| $ | 3,255,159,433 | $ | 2,056,500 | $ | (662,091,383 | ) | $ | (660,034,883 | ) | ||||||
For the period ended February 28, 2009, the Fund had net realized losses attributed to redemption in-kind transactions of $193,969,130.
20
GMO Strategic Fixed Income Fund
(A Series of GMO Trust)
Notes to Financial Statements — (Continued)
February 28, 2009
The Fund is subject to the provisions of Financial Accounting Standards Board Interpretation No. 48 ("FIN 48"), Accounting for Uncertainty in Income Taxes — an Interpretation of FASB Statement No. 109. FIN 48 sets forth a minimum threshold for financial statement recognition of a tax position taken or expected to be taken in a tax return that could affect the Fund's financial statements. The Fund did not have any unrecognized tax benefits or liabilities at February 28, 2009, nor did it have any increases or decreases in unrecognized tax benefits or liabilities for the period then ended. The Fund is subject to examination prior to the expiration of the statute of limitations by U.S. federal and state tax authorities for tax returns filed.
Security transactions and related investment income
Security transactions in the financial statements are accounted for on the trade date. Dividend income, net of applicable foreign withholding taxes, if any, is recorded on the ex-dividend date or, if later, when the Fund is informed of the ex-dividend date. Interest income is recorded on the accrual basis and is adjusted for the amortization of premiums and accretion of discounts. Principal on inflation indexed securities, is adjusted for inflation and any increase or decrease is recorded as interest income or loss. Income is not recognized on securities for which collection is not expected. Non-cash dividends, if any, are recorded at the fair market value of the asset received. In determining the net gain or loss on securities sold, the Fund uses the identified cost basis for the purposes of determining the cost basis.
Expenses
The majority of the expenses of the Trust are directly identifiable to an individual fund. Expenses that are not readily identifiable to a specific fund are allocated taking into consideration, among other things, the nature and type of expense and the relative size of the funds. In addition, the Fund incurs fees and expenses indirectly as a shareholder in the underlying funds. Because the underlying funds have different expense and fee levels and the Fund may own different proportions of the underlying funds at different times, the amount of fees and expenses indirectly incurred by the Fund will vary (See Note 3).
State Street Bank and Trust Company ("State Street") serves as custodian, fund accounting agent and transfer agent of the Fund. State Street's fees may be reduced by an earnings allowance calculated on the average daily cash balances the Fund maintains with State Street. The Fund receives the benefit of the earnings allowance. In addition, Goldman Sachs Agency Lending, the Fund's securities lending agent, has agreed to reimburse the Fund for certain transactional expenses related to securities lending activity. Credit balances or expense reimbursements used to reduce fees, if any, are reported as a reduction of expenses in the Statement of Operations.
Purchases and redemptions of Fund shares
Effective October 8, 2008, the Fund instituted a fee on cash redemptions of 0.85% of the amount redeemed. Effective October 21, 2008, the fee on cash redemptions was changed to 2.00% of the amount redeemed. As of February 28, 2009, the fee on cash redemptions was 2.00% of the amount redeemed. The Fund may impose a new purchase premium and/or redemption fee, or modify or eliminate an existing purchase premium and/or redemption fee, at any time. If the Manager determines that any portion of a cash redemption is offset by a corresponding cash purchase on the same day, the Fund will ordinarily
21
GMO Strategic Fixed Income Fund
(A Series of GMO Trust)
Notes to Financial Statements — (Continued)
February 28, 2009
waive or reduce the redemption fee with respect to that portion. In addition, the Fund may waive or reduce the redemption fee in extraordinary circumstances if the purchase or redemption will not cause the Fund to incur transaction costs. All redemption fees are paid to the Fund and recorded by the Fund as paid-in-capital. In-kind redemption transactions are generally not subject to redemption fees except when they include a cash component. However, when a substantial portion of a Fund is being redeemed, the Fund may charge a redemption fee based on estimated or known transaction costs resulting from those redemptions.
Investment risks
The Fund is subject to risks involved in investing in foreign securities that are not presented by investments in U.S. securities. These risks may involve adverse political and economic developments, including expropriation and the possible imposition of capital controls or other foreign governmental laws or restrictions. In addition, the securities of some foreign companies and securities markets are less liquid and at times may be more volatile than securities of comparable U.S. companies and U.S. securities markets. The risks described above apply to an even greater extent to investments in emerging markets. The securities markets of emerging countries are generally smaller, less developed, less liquid, and more volatile than the securities markets of the U.S. and developed foreign markets.
To manage the Fund's cash collateral needs in extraordinary market conditions, the Manager reserves the right to reduce or eliminate the Fund's derivative exposures, including those that are intended to cause the Fund to track its benchmark more closely. A reduction in those exposures without replacing them with benchmark securities will tend to cause the performance of the Fund to track its benchmark less closely and make the Fund's performance more dependent on the performance of the asset-backed securities it holds directly or indirectly.
To address in part the cash management issues described above, the Fund expects to honor nearly all redemptions of its shares in-kind for the foreseeable future. If redeeming shareholders from the Fund choose to sell assets received in-kind immediately and current adverse market conditions continue, they may experience difficulty selling the assets at favorable prices. To the extent that the Fund honors redemptions in cash, redeeming shareholders will bear the redemption fees described in the Purchases and Redemptions of Fund Shares note.
Among other trading agreements, the Fund is party to International Swaps and Derivatives Association, Inc. Master Agreements ("ISDA Agreements") with select counterparties that generally govern over-the-counter derivative transactions entered into by the Fund. The ISDA Master Agreements typically include standard representations and warranties as well as contractual terms related to collateral, events of default, termination events, and other standard provisions. Termination events may include the decline in the net assets of the Fund below a certain level over a specified period of time and may entitle a counterparty to elect to terminate early with respect to some or all the transactions under the ISDA Agreement with that counterparty. Such an election by one or more of the counterparties could have a material impact on the
22
GMO Strategic Fixed Income Fund
(A Series of GMO Trust)
Notes to Financial Statements — (Continued)
February 28, 2009
Fund's operations. Due to declines in the net assets of the Fund during the year ended February 28, 2009, one or more counterparties may be entitled to terminate early but none has taken such action.
Recently issued accounting pronouncement
In March 2008, FASB issued Statement of Financial Accounting Standards No. 161, Disclosures about Derivative Instruments and Hedging Activities ("SFAS 161"). SFAS 161 is effective for fiscal years and interim periods beginning after November 15, 2008. SFAS 161 requires enhanced disclosures about the Fund's derivative and hedging activities. The Manager is currently evaluating the impact the adoption of SFAS 161 will have on the Fund's financial statement disclosures.
3. Fees and other transactions with affiliates
GMO receives a management fee for the services it provides to the Fund. That fee is paid monthly at the annual rate of 0.25% of average daily net assets. The Fund has adopted a Shareholder Service Plan under which the Fund pays GMO a shareholder service fee for client and shareholder service, reporting, and other support. Pursuant to the Shareholder Service Plan, the shareholder service fee is calculated based on average daily net assets at the annual rate of 0.15% for Class III shares and 0.055% for Class VI shares. The Manager will waive the Fund's shareholder service fee to the extent that the aggregate of any direct and indirect shareholder service fees borne by a class of shares of the Fund exceeds 0.15% for Class III shares and 0.055% for Class VI shares; provided, however, that the amount of this waiver will not exceed the respective Class's shareholder service fee.
Through at least June 30, 2009, the Manager has contractually agreed to reimburse the Fund for Fund expenses incurred through that date to the extent the Fund's total annual operating expenses (excluding "Excluded Expenses", as defined below) exceed 0.25% of the Fund's average daily net assets. Excluded Expenses include shareholder service fees, expenses indirectly incurred by investment in the underlying funds, fees and expenses of the independent Trustees of the Trust, fees and expenses for legal services not approved by the Manager for the Trust, compensation and expenses of the Trust's Chief Compliance Officer ("CCO") (excluding any employee benefits), brokerage commissions, securities lending fees and expenses, interest expense, transfer taxes, and other investment-related costs (including expenses associated with investments in any company that is an investment company or would be an investment company under the 1940 Act, but for the exceptions to the definition of investment company provided in Section 3(c)(1) and 3(c)(7) of the 1940 Act), hedging transaction fees, extraordinary, non-recurring and certain other unusual expenses (including taxes). In addition, the Manager has contractually agreed to reimburse the Fund through at least June 30, 2009 to the extent that the sum of (a) the Fund's total annual operating expenses (excluding Excluded Expenses) and (b) the amount of fees and expenses incurred indirectly by the Fund through its investment in ECDF (excluding ECDF's Excluded Expenses), exceeds 0.25% of the Fund's average daily net assets, subject to a maximum total reimbursement to the Fund equal to 0.25% of the Fund's average daily net assets.
23
GMO Strategic Fixed Income Fund
(A Series of GMO Trust)
Notes to Financial Statements — (Continued)
February 28, 2009
The Fund incurs fees and expenses indirectly as a shareholder in the underlying funds. For the year ended February 28, 2009, these indirect fees and expenses expressed as an annualized percentage of the Fund's average daily net assets were as follows:
| Indirect Net Expenses (excluding shareholder service fees and interest expense) | Indirect Shareholder Service Fees | Indirect Interest Expense | Total Indirect Expenses | ||||||||||||
| 0.012 | % | 0.002 | % | 0.004 | % | 0.018 | % | ||||||||
The Fund's portion of the fees paid by the Trust to the Trust's independent Trustees and CCO during the year ended February 28, 2009 was $95,940 and $27,921, respectively. The compensation and expenses of the CCO are included in miscellaneous expenses in the Statement of Operations. The Fund paid no remuneration to any other officer of the Trust.
4. Purchases and sales of securities
For the year ended February 28, 2009, cost of purchases and proceeds from sales of investments, other than short-term obligations, were as follows:
| Purchases | Sales | ||||||||||
| U.S. Government securities | $ | 2,268,481,020 | $ | 2,127,715,739 | |||||||
| Investments (non-U.S. Government securities) | 167,002,483 | 1,691,459,512 | |||||||||
5. Guarantees
In the normal course of business the Fund enters into contracts with third-party service providers that contain a variety of representations and warranties and that provide general indemnifications. The Fund's maximum exposure under these arrangements is unknown, as it involves future claims that may be made against the Fund that have not yet occurred. Based on experience, management is of the view that the risk of loss in connection with its indemnification obligations is remote; however, there can be no assurance that such obligations will not result in material liabilities that adversely affect the Fund.
6. Principal shareholders and related parties
As of February 28, 2009, 73.00% of the outstanding shares of the Fund were held by three shareholders, each holding more than 10% of the Fund's outstanding shares. On that date, no other shareholder owned more than 10% of the outstanding shares of the Fund. Two of the shareholders are other funds of the Trust.
24
GMO Strategic Fixed Income Fund
(A Series of GMO Trust)
Notes to Financial Statements — (Continued)
February 28, 2009
Redemptions from (or investments into) the Fund by or on behalf of these large shareholders may have a material effect on the Fund.
As of February 28, 2009, no shares of the Fund were held by senior management of the Manager and GMO Trust officers and 99.8% of the Fund's shares were held by accounts for which the Manager had investment discretion.
7. Share transactions
The Declaration of Trust permits the Trust to issue an unlimited number of shares of beneficial interest (without par value). Transactions in Fund shares were as follows:
| Year Ended February 28, 2009 | Year Ended February 29, 2008 | ||||||||||||||||||
| Class III: | Shares | Amount | Shares | Amount | |||||||||||||||
| Shares sold | 6,706,775 | $ | 123,683,482 | 14,637,641 | $ | 354,355,271 | |||||||||||||
| Shares issued to shareholders in reinvestment of distributions | 400,493 | 7,025,456 | 210,515 | 5,059,119 | |||||||||||||||
| Shares repurchased | (5,789,615 | ) | (131,397,080 | ) | (12,069,867 | ) | (300,293,317 | ) | |||||||||||
| Redemption fees | — | 190,982 | — | — | |||||||||||||||
| Net increase (decrease) | 1,317,653 | $ | (497,160 | ) | 2,778,289 | $ | 59,121,073 | ||||||||||||
| Year Ended February 28, 2009 | Year Ended February 29, 2008 | ||||||||||||||||||
| Class VI: | Shares | Amount | Shares | Amount | |||||||||||||||
| Shares sold | 3,935,250 | $ | 89,019,736 | 188,277,166 | $ | 4,555,951,605 | |||||||||||||
| Shares issued to shareholders in reinvestment of distributions | 9,080,584 | 159,234,461 | 4,301,787 | 103,049,293 | |||||||||||||||
| Shares repurchased | (100,806,037 | ) | (2,153,664,607 | ) | (63,520,875 | ) | (1,616,998,457 | ) | |||||||||||
| Redemption fees | — | 4,100,512 | — | — | |||||||||||||||
| Net increase (decrease) | (87,790,203 | ) | $ | (1,901,309,898 | ) | 129,058,078 | $ | 3,042,002,441 | |||||||||||
25
GMO Strategic Fixed Income Fund
(A Series of GMO Trust)
Notes to Financial Statements — (Continued)
February 28, 2009
8. Investments in affiliated issuers
A summary of the Fund's transactions in the shares of other funds of the Trust during the year ended February 28, 2009 is set forth below:
| Affiliate | Value, beginning of period | Purchases | Sales Proceeds | Dividend Income | Distributions of Realized Gains | Value, end of period | |||||||||||||||||||||
| GMO Emerging Country Debt Fund, Class III | $ | 80,962,232 | $ | 2,145,580 | $ | 54,104,368 | $ | 435,393 | $ | 1,710,186 | $ | — | |||||||||||||||
| GMO Emerging Country Debt Fund, Class IV | — | 58,863,729 | 10,897,241 | 4,722,079 | — | 43,275,117 | |||||||||||||||||||||
| GMO Short-Duration Collateral Fund | 4,314,050,306 | 20,239,290 | 1,887,271,509 | 120,434,562 | — | 1,656,295,579 | u | ||||||||||||||||||||
| GMO World Opportunity Overlay Fund | 821,340,094 | 25,000,000 | 206,791,804 | — | — | 436,246,172 | |||||||||||||||||||||
| Totals | $ | 5,216,352,632 | $ | 106,248,599 | $ | 2,159,064,922 | $ | 125,592,034 | $ | 1,710,186 | $ | 2,135,816,868 | |||||||||||||||
u After the effect of return of capital distributions of $245,782,874 for the year ended February 28, 2009.
9. Subsequent event
On March 19, 2009, the Trustees approved GMO's plan to maximize the amount of cash distributed to shareholders that represents receipts on its portfolio holdings (including shares of the underlying funds) and from dispositions of those holdings. The plan was adopted in light of the requirements of Section 562 (b) of the Code and calls for the Fund to cease operations within 2 years. For purposes of meeting that timetable, the Fund may distribute securities (including shares of the underlying funds) in-kind.
26
Report of Independent Registered Public Accounting Firm
To the Trustees of GMO Trust and the Shareholders of
GMO Strategic Fixed Income Fund:
In our opinion, the accompanying statement of assets and liabilities, including the schedule of investments, and the related statements of operations and of changes in net assets and the financial highlights present fairly, in all material respects, the financial position of GMO Strategic Fixed Income Fund (the "Fund") at February 28, 2009, the results of its operations for the year then ended, the changes in its net assets for each of the two years in the period then ended and the financial highlights for the periods indicated, in conformity with accounting principles generally accepted in the United States of America. These financial statements and financial highlights (hereafter referred to as "financial statements") are the responsibility of the Fund's management. Our responsibility is to express an opinion on these financial statements based on our audits. We conducted our audits of these financial statements in accordance with the standards of the Public Company Accounting Oversight Board (United States). Those standards require that we plan and perform the audit to obtain reasonable assurance about whether the financial statements are free of material misstatement. An audit includes examining, on a test basis, evidence supporting the amounts and disclosures in the financial statements, assessing the accounting principles used and significant estimates made by management, and evaluating the overall financial statement presentation. We believe that our audits, which included confirmation of securities at February 28, 2009 by correspondence with the custodian and brokers, provide a reasonable basis for our opinion.
The Trustees of the Trust approved a plan to cease operations of the Fund within 2 years (see Note 9).
PricewaterhouseCoopers LLP
Boston, Massachusetts
April 29, 2009
27
GMO Strategic Fixed Income Fund
(A Series of GMO Trust)
Fund Expenses
February 28, 2009 (Unaudited)
Expense Examples: The following information is in relation to expenses for the six month period ended February 28, 2009.
As a shareholder of the Fund, you may incur two types of costs: (1) transaction costs, including redemption fees; and (2) ongoing costs, including management fees, shareholder service fees, and other Fund expenses. This example is intended to help you understand your ongoing costs (in dollars) of investing in the Fund and to compare these costs with the ongoing costs of investing in other mutual funds.
These examples are based on an investment of $1,000 invested at the beginning of the period and held for the entire period, September 1, 2008 through February 28, 2009.
Actual Expenses
The first line of the table for each class below provides information about actual account values and actual expenses. You may use the information in this line, together with the amount you invested, to estimate the expenses that you paid over the period. Simply divide your account value by $1,000 (for example, a $10,000,000 account value divided by $1,000 = 10,000), then multiply the result by the number in the first line under the heading entitled "Net Expense Incurred" to estimate the expenses you paid on your account during this period.
Hypothetical Example for Comparison Purposes
The second line of the table for each class below provides information about hypothetical account values and hypothetical expenses based on the Fund's actual expense ratio and an assumed rate of return of 5% per year before expenses, which is not the Fund's actual return. The hypothetical account values and expenses may not be used to estimate the actual ending account balance or expenses you paid for the period. You may use this information to compare the ongoing costs of investing in the Fund with other funds. To do so, compare this 5% hypothetical example with the 5% hypothetical examples that appear in the shareholder reports of other funds.
Please note that the expenses shown in the table are meant to highlight your ongoing costs only and do not reflect any transactional costs, such as purchase premiums and redemption fees. Therefore, the second line of the table is useful in comparing ongoing costs only, and will not help you determine the relative total costs of owning different funds. In addition, if these transactional costs were included, your costs would have been higher.
| Annualized Net Expense Ratio | Beginning Account Value | Ending Account Value | Net Expense Incurred* | ||||||||||||||||
| Class III | |||||||||||||||||||
| 1) Actual | 0.42 | % | $ | 1,000.00 | $ | 818.10 | $ | 1.89 | |||||||||||
| 2) Hypothetical | 0.42 | % | $ | 1,000.00 | $ | 1,022.71 | $ | 2.11 | |||||||||||
| Class VI | |||||||||||||||||||
| 1) Actual | 0.33 | % | $ | 1,000.00 | $ | 818.40 | $ | 1.49 | |||||||||||
| 2) Hypothetical | 0.33 | % | $ | 1,000.00 | $ | 1,023.16 | $ | 1.66 | |||||||||||
* Expenses are calculated using each Class's annualized net expense ratio (including indirect expenses incurred) for the six months ended February 28, 2009, multiplied by the average account value over the period, multiplied by 181 days in the period, divided by 365 days in the year.
28
GMO Strategic Fixed Income Fund
(A Series of GMO Trust)
Tax Information for the Tax Year Ended February 28, 2009 (Unaudited)
The Fund will notify shareholders of amounts for use in preparing 2009 income tax forms in early 2010.
The Fund hereby designates as qualified interest income with respect to its taxable year ended February 28, 2009, $60,798,278 or if determined to be different, the qualified interest income of such year.
29
Trustees and Officers (Unaudited)
The following tables list the Trust's Trustees and Officers as of the date of this report; their address and date of birth ("DOB"); their position with the Trust; the length of time holding that position with the Trust; their principal occupation(s) during the past five years; the number of portfolios in the fund complex they oversee; and other directorships they hold in companies subject to registration or reporting requirements of the Securities Exchange Act of 1934 (generally called "public companies") or in registered investment companies. The Trust's Statement of Additional Information ("SAI") includes additional information about the Trust's trustees, including changes subsequent to the date of the report. The SAI is available, without charge, upon request by writing GMO, c/o GMO Trust, 40 Rowes Wharf, Boston, MA 02110.
Independent Trustees:
| Name, Address, and DOB | Position(s) Held with Trust | Term of Office1 and Length of Time Served | Principal Occupation(s) During Past Five Years | Number of Portfolios in Fund Complex Overseen by Trustee | Other Directorships Held by Trustee | ||||||||||||||||||
| Donald W. Glazer, Esq. c/o GMO Trust 40 Rowes Wharf Boston, MA 02110 DOB: 07/26/1944 | Chairman of the Board of Trustees | Chairman of the Board of Trustees since March 2005; Lead Independent Trustee (September 2004 – March 2005); Trustee since December 2000. | Consultant – Law and Business2; Author of Legal Treatises. | 59 | None. | ||||||||||||||||||
1 Each Trustee is elected to serve during the continued lifetime of the Trust until he/she dies, resigns or is removed, or if sooner, until the next meeting of Shareholders called for the purpose of electing Trustees and until the election and qualification of his/her successor.
2 As part of Mr. Glazer's work as a consultant, he provides part-time consulting services to Goodwin Procter LLP ("Goodwin"). Goodwin has provided legal services to Renewable Resources, LLC, an affiliate of GMO; GMO, in connection with its relationship with Renewable Resources; and funds managed by Renewable Resources. Mr. Glazer has represented that he has no financial interest in, and is not involved in the provision of, such legal services. In the calendar years ended December 31, 2007 and December 31, 2008, these entities paid $789,416 and $183,864 respectively, in legal fees and disbursements to Goodwin. In correspondence with the Staff of the Securities and Exchange Commission beginning in August 2006, the Independent Trustees' legal counsel provided the Staff with information regarding Mr. Glazer's relationship with Goodwin and h is other business activities. On September 11, 2007, based on information that had been given to the Staff as of that date, the Staff provided oral no-action assurance consistent with the opinion of the Independent Trustees' legal counsel that Mr. Glazer is not an "interested person" of the Trust.
30
Independent Trustees — (Continued)
| Name, Address, and DOB | Position(s) Held with Trust | Term of Office1 and Length of Time Served | Principal Occupation(s) During Past Five Years | Number of Portfolios in Fund Complex Overseen by Trustee | Other Directorships Held by Trustee | ||||||||||||||||||
| W. Nicholas Thorndike c/o GMO Trust 40 Rowes Wharf Boston, MA 02110 DOB: 03/28/1933 | Trustee | Since March 2005. | Director or trustee of various corporations and charitable organizations, including Courier Corporation (a book publisher and manufacturer) (July 1989 – present); Putnam Funds (December 1992 – June 2004); and Providence Journal (a newspaper publisher) (December 1986 – December 2003). | 59 | Director of Courier Corporation (a book publisher and manufacturer); Member of the Investment Committee of Partners HealthCare System, Inc.3 | ||||||||||||||||||
| Peter Tufano c/o GMO Trust 40 Rowes Wharf Boston, MA 02110 DOB: 04/22/1957 | Trustee | Since December 2008. | Sylvan C. Coleman Professor of Financial Management, Harvard Business School (since 1989). | 59 | Trustee of State Street Navigator Securities Lending Trust (3 Portfolios). | ||||||||||||||||||
1 Each Trustee is elected to serve during the continued lifetime of the Trust until he/she dies, resigns or is removed, or if sooner, until the next meeting of Shareholders called for the purpose of electing Trustees and until the election and qualification of his/her successor.
3 Partners HealthCare System, Inc. is a client of the Manager.
31
Principal Officers:
| Name, Address, and DOB | Position(s) Held with Trust | Term of Office4 and Length of Time Served | Principal Occupation(s) During Past Five Years5 | ||||||||||||
| J.B. Kittredge DOB: 08/22/1954 | President and Chief Executive Officer | Since March 2009. | General Counsel, Grantham, Mayo, Van Otterloo & Co. LLC (October 2005 – Present); Partner, Ropes & Gray LLP. | ||||||||||||
| Sheppard N. Burnett c/o GMO Trust 40 Rowes Wharf Boston, MA 02110 DOB: 10/24/1968 | Treasurer and Chief Financial Officer | Chief Financial Officer since March 2007; Treasurer since November 2006; Assistant Treasurer, September 2004 – November 2006. | Fund Administration Staff, Grantham, Mayo, Van Otterloo & Co. LLC (June 2004 – present); Vice President, Director of Tax, Columbia Management Group (2002 – 2004). | ||||||||||||
| Brent C. Arvidson c/o GMO Trust 40 Rowes Wharf Boston, MA 02110 DOB: 06/26/1969 | Assistant Treasurer | Since August 1998. | Senior Fund Administrator, Grantham, Mayo, Van Otterloo & Co. LLC. | ||||||||||||
| John L. Nasrah c/o GMO Trust 40 Rowes Wharf Boston, MA 02110 DOB: 05/27/1977 | Assistant Treasurer | Since March 2007. | Fund Administrator, Grantham, Mayo, Van Otterloo & Co. LLC (September 2004 – present); Tax Analyst, Bain & Company, Inc. (June 2003 – September 2004). | ||||||||||||
| Mahmoodur Rahman c/o GMO Trust 40 Rowes Wharf Boston, MA 02110 DOB: 11/30/1967 | Assistant Treasurer | Since September 2007. | Fund Administrator, Grantham, Mayo, Van Otterloo & Co. LLC (April 2007 – present); Vice President and Senior Tax Manager, Massachusetts Financial Services Company (January 2000 – April 2007). | ||||||||||||
| Michael E. Gillespie c/o GMO Trust 40 Rowes Wharf Boston, MA 02110 DOB: 02/18/1958 | Chief Compliance Officer | Since March 2005. | Vice President of Compliance (June 2004 – February 2005) and Director of Domestic Compliance (March 2002 – June 2004), Fidelity Investments. | ||||||||||||
4 Each officer is elected to hold such office until his or her successor is duly elected and qualified to carry out the duties and responsibilities of the office, or until he or she resigns or is removed from office.
5 Each of Messrs. Burnett, Arvidson, Bohan, and Pottle serves as an officer and/or director of certain pooled investment vehicles of which GMO or an affiliate of GMO serves as the investment adviser.
32
Principal Officers — (Continued)
| Name, Address, and DOB | Position(s) Held with Trust | Term of Office4 and Length of Time Served | Principal Occupation(s) During Past Five Years5 | ||||||||||||
| Jason B. Harrison c/o GMO Trust 40 Rowes Wharf Boston, MA 02110 DOB: 01/29/1977 | Vice President and Clerk | Vice President since November 2006; Clerk since March 2006. | Legal Counsel, Grantham, Mayo, Van Otterloo & Co. LLC (since February 2006) and Attorney, Ropes & Gray LLP (September 2002 – February 2006). | ||||||||||||
| David L. Bohan c/o GMO Trust 40 Rowes Wharf Boston, MA 02110 DOB: 06/21/1964 | Vice President and Assistant Clerk | Vice President since March 2005; Assistant Clerk since March 2006. | Legal Counsel, Grantham, Mayo, Van Otterloo & Co. LLC. | ||||||||||||
| Gregory L. Pottle c/o GMO Trust 40 Rowes Wharf Boston, MA 02110 DOB: 07/09/1971 | Vice President and Assistant Clerk | Since November 2006. | Legal Counsel, Grantham, Mayo, Van Otterloo & Co. LLC. | ||||||||||||
| Anne K. Trinque c/o GMO Trust 40 Rowes Wharf Boston, MA 02110 DOB: 04/15/1978 | Vice President and Assistant Clerk | Since September 2007. | Legal Counsel, Grantham, Mayo, Van Otterloo & Co. LLC (January 2007 – present); Attorney, Goodwin Procter LLP (September 2003 – January 2007). | ||||||||||||
| Cheryl Wakeham c/o GMO Trust 40 Rowes Wharf Boston, MA 02110 DOB: 10/29/1958 | Vice President and Anti-Money Laundering Officer | Since December 2004. | Manager, Client Service Administration, Grantham, Mayo, Van Otterloo & Co. LLC. | ||||||||||||
4 Each officer is elected to hold such office until his or her successor is duly elected and qualified to carry out the duties and responsibilities of the office, or until he or she resigns or is removed from office.
5 Each of Messrs. Burnett, Arvidson, Bohan, and Pottle serves as an officer and/or director of certain pooled investment vehicles of which GMO or an affiliate of GMO serves as the investment adviser.
33
GMO Short-Duration Investment Fund
(A Series of GMO Trust)
Annual Report
February 28, 2009
For a free copy of the Fund's proxy voting guidelines, shareholders may call 1-617-346-7646 (collect) or visit the Securities and Exchange Commission's website at www.sec.gov. Information regarding how the Fund voted proxies relating to portfolio securities during the most recent 12-month period ended June 30 is available on GMO's website at www.gmo.com, or on the Securities and Exchange Commission's website at www.sec.gov.
The Fund files its complete schedule of portfolio holdings with the Securities and Exchange Commission for the first and third quarter of each fiscal year on Form N-Q, which is available on the Commission's website at www.sec.gov. The Fund's Form N-Q may be reviewed and copied at the Commission's Public Reference Room in Washington, D.C. Information on the operation of the Public Reference Room may be obtained by calling 1-800-SEC-0330. The Fund has a policy with respect to disclosure of portfolio holdings under which it may also make available on GMO's website at www.gmo.com a complete schedule of portfolio holdings.
This report is prepared for the general information of shareholders. It is authorized for distribution to prospective investors only when preceded or accompanied by a prospectus for the GMO Trust, which contains a complete discussion of the risks associated with an investment in this Fund and other important information. The GMO Trust prospectus can be obtained at www.gmo.com.
GMO Short-Duration Investment Fund
(A Series of GMO Trust)
Portfolio Management
Day-to-day management of the Fund's portfolio is the responsibility of the Fixed Income team at Grantham, Mayo, Van Otterloo & Co. LLC.
Management Discussion and Analysis of Fund Performance
The GMO Short-Duration Investment Fund returned -11.8% for the fiscal year ended February 28, 2009, as compared to +3.5% for the JPMorgan U.S. 3 Month Cash Index. The Fund underperformed the benchmark during the fiscal year by 15.3%.
The fiscal year's underperformance stemmed from price declines in the GMO Short Duration Collateral Fund (SDCF) in which the Fund invests a substantial portion of its total assets. SDCF invests primarily in asset-backed securities.
As the fiscal year was marked by sharply deteriorating liquidity conditions in securitized credit markets, spreads widened to all-time highs. In addition to widening spreads, SDCF's portfolio suffered credit downgrades during the year: SDCF had 123 downgraded securities, representing 27.4% of its market value from the beginning of the year. At fiscal year end, 73% of SDCF's portfolio was rated AAA, 8% was rated AA, 2% was rated A, 12% was rated BBB and 5% was rated below BBB.
With the extreme price volatility of asset-backed securities during the fiscal year, SDCF underperformed LIBOR by nearly 20%, directly contributing to the Fund's underperformance given its 64% exposure to SDCF during the period.
The views expressed herein are exclusively those of Grantham, Mayo, Van Otterloo & Co. LLC Management as of the date of this report and are subject to change. GMO disclaims any responsibility to update such views. They are not meant as investment advice. References to specific securities are not recommendations of such securities and may not be representative of any GMO portfolio's current or future investments.
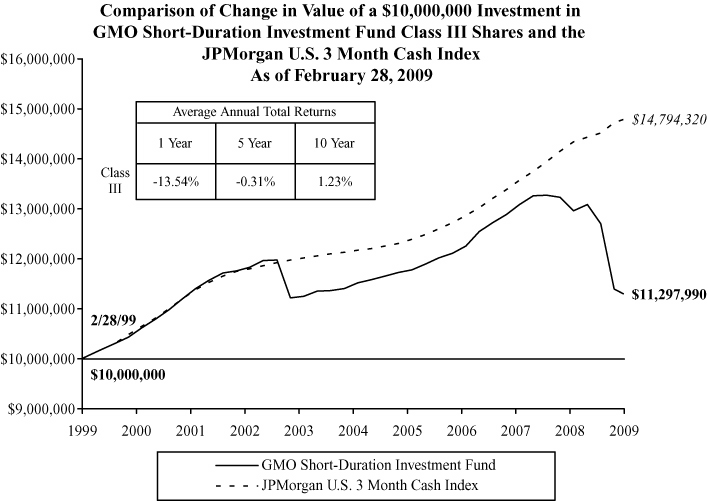
Performance data quoted represents past performance and is not indicative of future results. The investment return and principal value of an investment will fluctuate so that an investor's shares, when redeemed, may be worth more or less than their original cost. Current performance data may be lower or higher than the performance data provided herein. To obtain performance information to the most recent month-end, visit www.gmo.com. Performance shown is net of all fees after reimbursement from the Manager. Each performance figure assumes a redemption at the end of the stated period and reflects a transaction fee of 2.00% on the redemption. Transaction fees are retained by the Fund to cover trading costs. Returns would have been lower had certain expenses not been reimbursed during the periods shown and do not include the effect of taxes on distributions and redem ptions. All information is unaudited.
GMO Short-Duration Investment Fund
(A Series of GMO Trust)
Investments Concentration Summary
February 28, 2009 (Unaudited)
| Asset Class Summary* | % of Total Net Assets | ||||||
| Debt Obligations | 85.2 | % | |||||
| Short-Term Investments | 15.1 | ||||||
| Forward Currency Contracts | 0.0 | ||||||
| Swaps | (0.5 | ) | |||||
| Other | 0.2 | ||||||
| 100.0 | % | ||||||
* The table above incorporates aggregate indirect asset class exposure associated with investments in other funds of GMO Trust ("underlying funds").
1
GMO Short-Duration Investment Fund
(A Series of GMO Trust)
Schedule of Investments
(showing percentage of total net assets)
February 28, 2009
| Par Value ($) / Shares | Description | Value ($) | |||||||||
| DEBT OBLIGATIONS — 23.0% | |||||||||||
| U.S. Government Agency — 23.0% | |||||||||||
| 93,333 | Agency for International Development Floater (Support of Botswana), 6 mo. U.S. Treasury Bill + .40%, 0.87%, due 10/01/12 (a) | 90,082 | |||||||||
| 601,650 | Agency for International Development Floater (Support of C.A.B.E.I), 6 mo. U.S. Treasury Bill + .40%, 0.87%, due 10/01/12 (a) | 580,634 | |||||||||
| 503,960 | Agency for International Development Floater (Support of Honduras), 3 mo. U.S. Treasury Bill x 117%, 0.07%, due 10/01/11 (a) | 487,128 | |||||||||
| 32,947 | Agency for International Development Floater (Support of Peru), Series B, 6 mo. U.S. Treasury Bill +.35%, 0.82%, due 05/01/14 (a) | 31,292 | |||||||||
| 243,929 | Small Business Administration Pool #502320, Prime - 2.19%, 1.06%, due 08/25/18 | 241,098 | |||||||||
| Total U.S. Government Agency | 1,430,234 | ||||||||||
| TOTAL DEBT OBLIGATIONS (COST $1,475,483) | 1,430,234 | ||||||||||
| MUTUAL FUNDS — 63.7% | |||||||||||
| Affiliated Issuers — 63.7% | |||||||||||
| 231,576 | GMO Short-Duration Collateral Fund | 3,959,951 | |||||||||
| 9,192 | GMO Special Purpose Holding Fund (a) (b) | 6,710 | |||||||||
| TOTAL MUTUAL FUNDS (COST $5,430,976) | 3,966,661 | ||||||||||
| SHORT-TERM INVESTMENTS — 13.4% | |||||||||||
| Money Market Funds — 13.4% | |||||||||||
| 228,467 | State Street Institutional Liquid Reserves Fund-Institutional Class | 228,467 | |||||||||
| 607,473 | State Street Institutional Treasury Plus Money Market Fund-Institutional Class | 607,473 | |||||||||
| TOTAL SHORT-TERM INVESTMENTS (COST $835,940) | 835,940 | ||||||||||
| TOTAL INVESTMENTS — 100.1% (Cost $7,742,399) | 6,232,835 | ||||||||||
| Other Assets and Liabilities (net) — (0.1%) | (4,734 | ) | |||||||||
| TOTAL NET ASSETS — 100.0% | $ | 6,228,101 | |||||||||
See accompanying notes to the financial statements.
2
GMO Short-Duration Investment Fund
(A Series of GMO Trust)
Schedule of Investments — (Continued)
February 28, 2009
Notes to Schedule of Investments:
C.A.B.E.I. - Central American Bank of Economic Integration
The rates shown on variable rate notes are the current interest rates at February 28, 2009, which are subject to change based on the terms of the security.
(a) Security valued at fair value using methods determined in good faith by or at the direction of the Trustees of GMO Trust (Note 2).
(b) Underlying investment represents interests in defaulted securities.
See accompanying notes to the financial statements.
3
GMO Short-Duration Investment Fund
(A Series of GMO Trust)
Statement of Assets and Liabilities — February 28, 2009
| Assets: | |||||||
| Investments in unaffiliated issuers, at value (cost $2,311,423) (Note 2) | $ | 2,266,174 | |||||
| Investments in affiliated issuers, at value (cost $5,430,976) (Notes 2 and 8) | 3,966,661 | ||||||
| Receivable for investments sold | 5,808 | ||||||
| Dividends and interest receivable | 8,185 | ||||||
| Receivable for expenses reimbursed by Manager (Note 3) | 8,110 | ||||||
| Total assets | 6,254,938 | ||||||
| Liabilities: | |||||||
| Payable to affiliate for (Note 3): | |||||||
| Management fee | 238 | ||||||
| Shareholder service fee | 716 | ||||||
| Trustees and Chief Compliance Officer of GMO Trust fees | 6 | ||||||
| Accrued expenses | 25,877 | ||||||
| Total liabilities | 26,837 | ||||||
| Net assets | $ | 6,228,101 | |||||
| Net assets consist of: | |||||||
| Paid-in capital | $ | 10,424,371 | |||||
| Accumulated undistributed net investment income | 749 | ||||||
| Accumulated net realized loss | (2,687,455 | ) | |||||
| Net unrealized depreciation | (1,509,564 | ) | |||||
| $ | 6,228,101 | ||||||
| Net assets attributable to: | |||||||
| Class III shares | $ | 6,228,101 | |||||
| Shares outstanding: | |||||||
| Class III | 870,808 | ||||||
| Net asset value per share: | |||||||
| Class III | $ | 7.15 | |||||
See accompanying notes to the financial statements.
4
GMO Short-Duration Investment Fund
(A Series of GMO Trust)
Statement of Operations — Year Ended February 28, 2009
| Investment Income: | |||||||
| Dividends from affiliated issuers (Note 8) | $ | 246,431 | |||||
| Interest | 31,414 | ||||||
| Dividends | 1,164 | ||||||
| Total investment income | 279,009 | ||||||
| Expenses: | |||||||
| Management fee (Note 3) | 3,479 | ||||||
| Shareholder service fee – Class III (Note 3) | 10,438 | ||||||
| Custodian, fund accounting agent and transfer agent fees | 2,191 | ||||||
| Audit and tax fees | 44,618 | ||||||
| Legal fees | 185 | ||||||
| Trustees fees and related expenses (Note 3) | 195 | ||||||
| Registration fees | 5,501 | ||||||
| Miscellaneous | 2,483 | ||||||
| Total expenses | 69,090 | ||||||
| Fees and expenses reimbursed by Manager (Note 3) | (54,979 | ) | |||||
| Net expenses | 14,111 | ||||||
| Net investment income (loss) | 264,898 | ||||||
| Realized and unrealized gain (loss): | |||||||
| Net realized gain (loss) on: | |||||||
| Investments | (30 | ) | |||||
| Realized gains distributions from affiliated issuers (Note 8) | 20,816 | ||||||
| Net realized gain (loss) | 20,786 | ||||||
| Change in net unrealized appreciation (depreciation) on: | |||||||
| Investments in unaffiliated issuers | (41,666 | ) | |||||
| Investments in affiliated issuers | (1,092,568 | ) | |||||
| Net unrealized gain (loss) | (1,134,234 | ) | |||||
| Net realized and unrealized gain (loss) | (1,113,448 | ) | |||||
| Net increase (decrease) in net assets resulting from operations | $ | (848,550 | ) | ||||
See accompanying notes to the financial statements.
5
GMO Short-Duration Investment Fund
(A Series of GMO Trust)
Statement of Changes in Net Assets
| Year Ended February 28, 2009 | Year Ended February 29, 2008 | ||||||||||
| Increase (decrease) in net assets: | |||||||||||
| Operations: | |||||||||||
| Net investment income (loss) | $ | 264,898 | $ | 531,638 | |||||||
| Net realized gain (loss) | 20,786 | 234,625 | |||||||||
| Change in net unrealized appreciation (depreciation) | (1,134,234 | ) | (393,401 | ) | |||||||
| Net increase (decrease) in net assets from operations | (848,550 | ) | 372,862 | ||||||||
| Distributions to shareholders from: | |||||||||||
| Net investment income | |||||||||||
| Class III | (264,963 | ) | (529,051 | ) | |||||||
| Net share transactions (Note 7): | |||||||||||
| Class III | (34,132 | ) | (23,783,143 | ) | |||||||
| Redemption fees (Notes 2 and 7): | |||||||||||
| Class III | 352 | — | |||||||||
| Total increase (decrease) in net assets resulting from net share transactions and redemption fees | (33,780 | ) | (23,783,143 | ) | |||||||
| Total increase (decrease) in net assets | (1,147,293 | ) | (23,939,332 | ) | |||||||
| Net assets: | |||||||||||
| Beginning of period | 7,375,394 | 31,314,726 | |||||||||
| End of period (including accumulated undistributed net investment income of $749 and $1,079, respectively) | $ | 6,228,101 | $ | 7,375,394 | |||||||
See accompanying notes to the financial statements.
6
GMO Short-Duration Investment Fund
(A Series of GMO Trust)
Financial Highlights
(For a Class III share outstanding throughout each period)
| Year Ended February 28/29, | |||||||||||||||||||||||
| 2009 | 2008 | 2007 | 2006 | 2005 | |||||||||||||||||||
| Net asset value, beginning of period | $ | 8.45 | $ | 8.93 | $ | 8.82 | $ | 8.77 | $ | 8.75 | |||||||||||||
| Income (loss) from investment operations: | |||||||||||||||||||||||
| Net investment income (loss)(a)† | 0.30 | 0.32 | 0.47 | 0.27 | 0.23 | ||||||||||||||||||
| Net realized and unrealized gain (loss) | (1.29 | ) | (0.28 | ) | 0.11 | 0.07 | (0.01 | ) | |||||||||||||||
| Total from investment operations | (0.99 | ) | 0.04 | 0.58 | 0.34 | 0.22 | |||||||||||||||||
| Less distributions to shareholders: | |||||||||||||||||||||||
| From net investment income | (0.31 | ) | (0.52 | ) | (0.47 | ) | (0.29 | ) | (0.20 | ) | |||||||||||||
| Total distributions | (0.31 | ) | (0.52 | ) | (0.47 | ) | (0.29 | ) | (0.20 | ) | |||||||||||||
| Net asset value, end of period | $ | 7.15 | $ | 8.45 | $ | 8.93 | $ | 8.82 | $ | 8.77 | |||||||||||||
| Total Return(b) | (11.78 | )% | 0.40 | % | 6.62 | % | 3.83 | % | 2.49 | % | |||||||||||||
| Ratios/Supplemental Data: | |||||||||||||||||||||||
| Net assets, end of period (000's) | $ | 6,228 | $ | 7,375 | $ | 31,315 | $ | 29,454 | $ | 29,607 | |||||||||||||
| Net expenses to average daily net assets(c) | 0.20 | % | 0.20 | % | 0.20 | % | 0.20 | % | 0.20 | % | |||||||||||||
| Net investment income to average daily net assets(a) | 3.81 | % | 3.59 | % | 5.21 | % | 3.01 | % | 2.57 | % | |||||||||||||
| Portfolio turnover rate | 4 | % | 5 | % | 12 | % | 17 | % | 101 | % | |||||||||||||
| Fees and expenses reimbursed by the Manager to average daily net assets: | 0.79 | % | 0.60 | % | 0.14 | % | 0.13 | % | 0.10 | % | |||||||||||||
| Redemption fees consisted of the following per share amounts: | $ | 0.00 | (d) | — | — | — | — | ||||||||||||||||
(a) Net investment income is affected by the timing of the declaration of dividends by the underlying funds in which the Fund invests.
(b) The total returns would have been lower had certain expenses not been reimbursed during the periods shown and assumes the effect of reinvested distributions. Calculation excludes redemption fees which are borne by the shareholder.
(c) Net expenses exclude expenses incurred indirectly through investment in the underlying funds (See Note 3).
(d) Redemption fees were less than $0.01 per share.
† Calculated using average shares outstanding throughout the period.
See accompanying notes to the financial statements.
7
GMO Short-Duration Investment Fund
(A Series of GMO Trust)
Notes to Financial Statements
February 28, 2009
1. Organization
GMO Short-Duration Investment Fund (the "Fund") is a series of GMO Trust (the "Trust"). The Fund is registered under the Investment Company Act of 1940, as amended, as an open-end, non-diversified management investment company. The Fund is advised and managed by Grantham, Mayo, Van Otterloo & Co. LLC (the "Manager" or "GMO"). The Trust was established as a Massachusetts business trust under the laws of The Commonwealth of Massachusetts on June 24, 1985. The Declaration of Trust permits the Trustees of the Trust ("Trustees") to create an unlimited number of series of shares ("Funds") and to subdivide Funds into classes.
The Fund seeks to provide current income to the extent consistent with the preservation of capital and liquidity. The Fund seeks to achieve this objective by investing a substantial portion of its assets in GMO Short-Duration Collateral Fund, which primarily invests in high quality U.S. and foreign adjustable rate fixed income securities, in particular asset-backed securities, issued by a wide range of private and government issuers. In addition, the Fund invests in high quality fixed income securities. The Fund's benchmark is the JPMorgan U.S. 3 Month Cash Index.
The financial statements of the series of the Trust in which the Fund invests ("underlying funds") should be read in conjunction with the Fund's financial statements. These financial statements are available, without charge, upon request, by calling (617) 346-7646 (collect). Shares of the GMO Special Purpose Holding Fund and the GMO Short-Duration Collateral Fund are not publicly available for direct purchase.
The Fund directly and indirectly (through underlying funds) invests in securities with contractual cash flows, such as collateralized mortgage obligations and commercial mortgage-backed securities, including securities backed by sub-prime mortgage loans, credit card receivables and auto loan receivables. The value, liquidity and related income of these securities are sensitive to changes in economic conditions, including real estate values, delinquencies and/or defaults, and may be adversely affected by changes in interest rates and shifts in the market's perception of the securities' market values.
The Fund will, if deemed prudent by the Manager, take temporary defensive measures (until the Manager has determined that normal conditions have returned or that it is otherwise prudent to resume investing in accordance with the Fund's normal investment strategies) and may not achieve its investment objectives during those periods. Recent changes in the credit markets have reduced the liquidity of all types of fixed income securities, including asset-backed securities.
2. Significant accounting policies
The following is a summary of significant accounting policies followed by the Fund in the preparation of its financial statements. These policies are in conformity with accounting principles generally accepted in the United States of America ("U.S. GAAP") and have been consistently followed by the Fund in preparing its
8
GMO Short-Duration Investment Fund
(A Series of GMO Trust)
Notes to Financial Statements — (Continued)
February 28, 2009
financial statements. The preparation of financial statements in accordance with U.S. GAAP requires management to make estimates and assumptions that affect the reported amounts and disclosures in the financial statements. Actual results could differ from those estimates. The accounting records of the Fund are maintained in U.S. dollars.
Portfolio valuation
Securities listed on a securities exchange for which market quotations are readily available are valued at the last sale price or official closing price on each business day, or if there is no such reported sale or official closing price, at the most recent quoted bid price. Unlisted securities for which market quotations are readily available are generally valued at the most recent quoted bid price. Debt instruments with a remaining maturity of sixty days or less are generally valued at amortized cost, which approximates fair value. Shares of investment funds are generally valued at their net asset value. Securities for which quotations are not readily available or whose values the Manager has determined to be unreliable are valued at fair value as determined in good faith by the Trustees or persons acting at their direction pursuant to procedures approved by the Trustees. By its nature, a fair value price is a good faith estim ate of the value of a security at a given point in time and may not reflect the value that would be realized if the security were sold. The difference between a fair value price and the value realized upon a sale could be material.
Typically the Fund and the underlying funds value debt instruments based on prices supplied by a primary pricing source chosen by the Manager. The Manager evaluates primary pricing sources on an ongoing basis and may change a pricing source should the Manager deem it appropriate. If it deems appropriate, the Manager, at its discretion, may override a price supplied by a primary source by using a price provided by another source. The prices provided by primary pricing sources may differ from the value that would be realized if the securities were sold, and the differences could be material.
Certain securities held by the Fund and underlying funds are valued on the basis of prices provided by a single source. As of February 28, 2009, the total value of these securities represented 28.30% of the net assets. The single source prices provided may differ from the value that would be realized if the securities were sold, and the differences could be material. In addition, although alternative prices are available for other securities held by the Fund, those alternative sources would not necessarily confirm the security price used by the Fund. Therefore, the existence of those alternative sources does not necessarily provide greater certainty about the prices used by the Fund.
GMO Special Purpose Holding Fund ("SPHF"), an investment of the Fund, has litigation pending against various entities related to the default of certain asset-backed securities previously held by SPHF. The outcome of the lawsuits against the remaining defendants is not known and any potential recoveries are not reflected in the net asset value of SPHF. For the year ended February 28, 2009, the Fund received $20,816 through SPHF in connection with settlement agreements related to that litigation.
9
GMO Short-Duration Investment Fund
(A Series of GMO Trust)
Notes to Financial Statements — (Continued)
February 28, 2009
In September 2006, the Financial Accounting Standards Board ("FASB") issued Statement of Financial Accounting Standards No. 157, Fair Value Measurements ("SFAS 157"). SFAS 157 is effective for the Fund's current fiscal year. While the adoption of SFAS 157 does not have an effect on the Fund's net asset value, it does require additional disclosures about fair value measurements. SFAS 157 establishes a three-level hierarchy for disclosure of fair value measurements. The valuation hierarchy is based upon the reliability of inputs to the valuation of the Fund's investments. The three levels are defined as follows:
Level 1 – Valuations based on quoted prices for identical securities in active markets.
Level 2 – Valuations determined using other significant direct or indirect observable inputs.
Level 3 – Valuations based on inputs that are unobservable and significant. The Fund utilized the following fair value techniques on Level 3 investments: The Fund valued debt securities using a specified spread above the LIBOR rate. The Fund also considered certain bankrupt securities to be worthless.
The inputs or methodology used for valuing securities are not necessarily an indication of the risk associated with investing in those securities.
The following is a summary of the fair valuations according to inputs used as of February 28, 2009 in valuing the Fund's investments:
| Asset Valuation Inputs | Investments in Securities | Other Financial Instruments | |||||||||
| Level 1 - Quoted Prices | $ | — | $ | — | |||||||
| Level 2 - Other Significant Observable Inputs | 5,036,989 | — | |||||||||
| Level 3 - Significant Unobservable Inputs | 1,195,846 | — | |||||||||
| Total | $ | 6,232,835 | $ | — | |||||||
| Liability Valuation Inputs | Investments in Securities | Other Financial Instruments | |||||||||
| Level 1 - Quoted Prices | $ | — | $ | — | |||||||
| Level 2 - Other Significant Observable Inputs | — | — | |||||||||
| Level 3 - Significant Unobservable Inputs | — | — | |||||||||
| Total | $ | — | $ | — | |||||||
For the underlying funds' summary of valuation inputs, please refer to the respective fund's portfolio valuation note.
10
GMO Short-Duration Investment Fund
(A Series of GMO Trust)
Notes to Financial Statements — (Continued)
February 28, 2009
The following is a reconciliation of investments in which significant unobservable inputs (Level 3) were used in determining value:
| Investments in Securities | Other Financial Instruments | ||||||||||
| Balance as of February 29, 2008 | $ | 11,582 | $ | — | |||||||
| Accrued discounts/premiums | (39 | ) | — | ||||||||
| Realized gain (loss) | 242 | — | |||||||||
| Realized gain distributions received | 15,965 | — | |||||||||
| Realized gain distributions paid | (20,816 | ) | — | ||||||||
| Change in unrealized appreciation/depreciation | (36,868 | ) | — | ||||||||
| Net purchases (sales) | (306,741 | ) | — | ||||||||
| Net transfers in and/or out of Level 3 | 1,532,521 | — | |||||||||
| Balance as of February 28, 2009 | $ | 1,195,846 | $ | — | |||||||
Indexed securities
The Fund may invest in indexed securities. Indexed securities are securities whose redemption values and/or coupons are linked to the prices of a specific instrument or financial statistic. The Fund uses indexed securities to increase or decrease its exposure to different underlying instruments and to gain exposure to markets in which investing through conventional securities is difficult. The Fund had no indexed securities outstanding at the end of the period.
Repurchase agreements
The Fund may enter into repurchase agreements. Under a repurchase agreement the Fund acquires a security for cash and obtains a simultaneous commitment from the seller to repurchase the security at an agreed upon price and date. The Fund, through its custodian, takes possession of securities collateralizing the repurchase agreement. The collateral is marked to market daily to ensure that the market value of the underlying assets is at least equal to the amount owed to the Fund in the event of default by the seller. If the seller of a repurchase agreement defaults or enters into insolvency proceedings and the value of the collateral declines, the Fund's recovery of cash may be delayed or limited. The Fund had no repurchase agreements outstanding at the end of the period.
Securities lending
The Fund may lend its securities to qualified brokers. The loans are collateralized with cash or liquid securities with a market value at least equal to the market value of the securities upon entering into the loan. As with other extensions of credit, the Fund may bear the risk of loss with respect to the investment of the collateral, the risk of delay in and/or inability to exercise its rights with respect to the collateral, and the risk of delay in recovery or loss of rights in the loaned securities should the borrower of the securities fail financially. If a loan is collateralized by U.S. government securities, the Fund receives a fee from the
11
GMO Short-Duration Investment Fund
(A Series of GMO Trust)
Notes to Financial Statements — (Continued)
February 28, 2009
borrower. If a loan is collateralized by cash, the Fund typically invests the cash collateral for its own account. For the year from March 1, 2008 through February 28, 2009, the Fund did not participate in securities lending.
Taxes and distributions
The Fund intends to qualify each tax year as a regulated investment company under Subchapter M of the Internal Revenue Code of 1986, as amended (the "Code"). The Fund intends to distribute substantially all of its net investment income and all of its net realized short-term and long-term capital gain, if any, after giving effect to any available capital loss carryforwards for U.S. federal income tax purposes. Therefore, no provision for U.S. federal income or excise tax is necessary.
The Fund's policy is to declare and pay distributions from net investment income, if any, quarterly, and from net realized short-term and long-term capital gain, if any, at least annually. All distributions are paid in shares of the Fund, at net asset value, unless the shareholder elects to receive cash distributions. Distributions to shareholders are recorded by the Fund on the ex-dividend date.
Income and capital gain distributions are determined in accordance with U.S. federal income tax regulations, which may differ from U.S. GAAP. Certain capital accounts in the financial statements are periodically adjusted for permanent differences in order to reflect their tax character. These adjustments have no impact on net assets or net asset value per share. Temporary differences that arise from recognizing certain items of income, expense, gain or loss in different periods for financial statement and tax purposes will reverse at some time in the future. Distributions in excess of net investment income or net realized gains are temporary over-distributions for financial statement purposes resulting from differences in the recognition or classification of income or distributions for financial statement and tax purposes.
U.S. GAAP and tax accounting differences primarily relate to capital loss carryforwards, partnership interest tax allocations and losses on wash sale transactions.
The following reclassification represents the amount necessary to report the stated components of net assets on a tax basis, excluding certain temporary differences, as of February 28, 2009. The financial highlights exclude these adjustments.
| Accumulated Undistributed Net Investment Income | Accumulated Net Realized Loss | Paid-in Capital | |||||||||
| $ | (265 | ) | $ | 1,647,187 | $ | (1,646,922 | ) | ||||
12
GMO Short-Duration Investment Fund
(A Series of GMO Trust)
Notes to Financial Statements — (Continued)
February 28, 2009
The tax character of distributions declared to shareholders is as follows:
| 2/28/2009 | 2/29/2008 | ||||||||||
| Ordinary income (including any net short-term capital gain) | $ | 264,963 | $ | 529,051 | |||||||
| Total distributions | $ | 264,963 | $ | 529,051 | |||||||
Distributions in excess of tax basis earnings and profits, if significant, are reported in the financial statements as a return of capital for tax purposes.
As of February 28, 2009, the components of distributable earnings on a tax basis consisted of the following:
| Undistributed ordinary income (including any net short-term capital gain) | $ | 4,142 | |||||
As of February 28, 2009, the Fund had capital loss carryforwards available to offset future realized gains if any, to the extent permitted by the Code. Utilization of the capital loss carryforwards could be subject to limitations imposed by the Code related to share ownership activity. Such losses expire as follows:
| 2/29/2012 | $ | (470,429 | ) | ||||
| 2/28/2013 | (708 | ) | |||||
| 2/28/2014 | (1,377,141 | ) | |||||
| 2/29/2016 | (226,383 | ) | |||||
| Total | $ | (2,074,661 | ) | ||||
As of February 28, 2009, the approximate cost for U.S. federal income tax purposes and gross and net unrealized appreciation (depreciation) in value of investments were as follows:
Aggregate Cost | Gross Unrealized Appreciation | Gross Unrealized (Depreciation) | Net Unrealized Appreciation (Depreciation) | ||||||||||||
| $ | 8,358,586 | $ | 6,710 | $ | (2,132,461 | ) | $ | (2,125,751 | ) | ||||||
The Fund is subject to the provisions of Financial Accounting Standards Board Interpretation No. 48 ("FIN 48"), Accounting for Uncertainty in Income Taxes — an Interpretation of FASB Statement No. 109. FIN 48 sets forth a minimum threshold for financial statement recognition of a tax position taken or expected to be taken in a tax return that could affect the Fund's financial statements. The Fund did not have any unrecognized tax benefits or liabilities at February 28, 2009, nor did it have any increases or
13
GMO Short-Duration Investment Fund
(A Series of GMO Trust)
Notes to Financial Statements — (Continued)
February 28, 2009
decreases in unrecognized tax benefits or liabilities for the period then ended. The Fund is subject to examination prior to the expiration of the statute of limitations by U.S. federal and state tax authorities for tax returns filed.
Security transactions and related investment income
Security transactions in the financial statements are accounted for on the trade date. Dividend income, net of applicable foreign withholding taxes, if any, is recorded on the ex-dividend date or, if later, when the Fund is informed of the ex-dividend date. Interest income is recorded on the accrual basis and is adjusted for the amortization of premiums and accretion of discounts. Principal on inflation indexed securities is adjusted for inflation and any increase or decrease is recorded as interest income or loss. Income is not recognized on securities for which collection is not expected. Non-cash dividends, if any, are recorded at the fair market value of the asset received. In determining the net gain or loss on securities sold, the Fund uses the identified cost basis for the purposes of determining the cost basis.
Expenses
The majority of the expenses of the Trust are directly identifiable to an individual fund. Expenses that are not readily identifiable to a specific fund are allocated taking into consideration, among other things, the nature and type of expense and the relative size of the funds. In addition, the Fund incurs fees and expenses indirectly as a shareholder in the underlying funds. Because the underlying funds have different expense and fee levels and the Fund may own different proportions of the underlying funds at different times, the amount of fees and expenses indirectly incurred by the Fund will vary (See Note 3).
State Street Bank and Trust Company ("State Street") serves as custodian, fund accounting agent and transfer agent of the Fund. State Street's fees may be reduced by an earnings allowance calculated on the average daily cash balances the Fund maintains with State Street. The Fund receives the benefit of the earnings allowance. In addition, Goldman Sachs Agency Lending, the Fund's securities lending agent, has agreed to reimburse the Fund for certain transactional expenses related to securities lending activity. Credit balances or expense reimbursements used to reduce fees, if any, are reported as a reduction of expenses in the Statement of Operations.
Purchases and redemptions of Fund shares
Effective October 8, 2008, the Fund instituted a fee on cash redemptions of 0.77% of the amount redeemed. Effective October 21, 2008, the fee on cash redemptions was changed to 2.00% of the amount redeemed. As of February 28, 2009, the fee on cash redemptions was 2.00% of the amount redeemed. The Fund may impose a new purchase premium and/or redemption fee, or modify or eliminate an existing purchase premium and/or redemption fee, at any time. If the Manager determines that any portion of a cash redemption is offset by a corresponding cash purchase on the same day, the Fund will ordinarily waive or reduce the redemption fee with respect to that portion. In addition, the Fund may waive or reduce the redemption fee in extraordinary circumstances if the purchase or redemption will not cause
14
GMO Short-Duration Investment Fund
(A Series of GMO Trust)
Notes to Financial Statements — (Continued)
February 28, 2009
the Fund to incur transaction costs. All redemption fees are paid to the Fund and recorded by the Fund as paid-in-capital. In-kind redemption transactions are generally not subject to redemption fees except when they include a cash component. However, when a substantial portion of a Fund is being redeemed, the Fund may charge a redemption fee based on estimated or known transaction costs resulting from those redemptions.
Recently issued accounting pronouncement
In March 2008, FASB issued Statement of Financial Accounting Standards No. 161, Disclosures about Derivative Instruments and Hedging Activities ("SFAS 161"). SFAS 161 is effective for fiscal years and interim periods beginning after November 15, 2008. SFAS 161 requires enhanced disclosures about the Fund's derivative and hedging activities. The Manager is currently evaluating the impact the adoption of SFAS 161 will have on the Fund's financial statement disclosures.
3. Fees and other transactions with affiliates
GMO receives a management fee for the services it provides to the Fund. That fee is paid monthly at the annual rate of 0.05% of average daily net assets. The Fund has adopted a Shareholder Service Plan under which the Fund pays GMO a shareholder service fee for client and shareholder service, reporting, and other support. Pursuant to the Shareholder Service Plan, the shareholder service fee is calculated based on average daily net assets at the annual rate of 0.15% for Class III shares.
Through at least June 30, 2009, the Manager has contractually agreed to reimburse the Fund for Fund expenses incurred through that date to the extent the Fund's total annual operating expenses (excluding "Excluded Expenses", as defined below) exceed 0.05% of the Fund's average daily net assets. Excluded Expenses include shareholder service fees, expenses indirectly incurred by investment in the underlying funds, fees and expenses of the independent Trustees of the Trust, fees and expenses for legal services not approved by the Manager for the Trust, compensation and expenses of the Trust's Chief Compliance Officer ("CCO") (excluding any employee benefits), brokerage commissions, securities lending fees and expenses, interest expense, transfer taxes, and other investment-related costs (including expenses associated with investments in any company that is an investment company or would be an investment company under the 1940 Act, but for the exceptions to the definition of investment company provided in Section 3(c)(1) and 3(c)(7) of the 1940 Act), hedging transaction fees, extraordinary, non-recurring and certain other unusual expenses (including taxes).
15
GMO Short-Duration Investment Fund
(A Series of GMO Trust)
Notes to Financial Statements — (Continued)
February 28, 2009
The Fund incurs fees and expenses indirectly as a shareholder in the underlying funds. For the year ended February 28, 2009, these indirect fees and expenses expressed as an annualized percentage of the Fund's average daily net assets were as follows:
| Indirect Net Expenses (excluding shareholder service fees and interest expense) | Indirect Shareholder Service Fees | Indirect Interest Expense | Total Indirect Expenses | ||||||||||||
| 0.004 | % | 0.000 | % | 0.000 | % | 0.004 | % | ||||||||
The Fund's portion of the fees paid by the Trust to the Trust's independent Trustees and CCO during the year ended February 28, 2009 was $164 and $0, respectively. The compensation and expenses of the CCO are included in miscellaneous expenses in the Statement of Operations. The Fund paid no remuneration to any other officer of the Trust.
4. Purchases and sales of securities
Cost of purchases and proceeds from sales of securities, excluding short-term investments, for the year ended February 28, 2009 aggregated $237,101 and $367,547, respectively.
5. Guarantees
In the normal course of business the Fund enters into contracts with third-party service providers that contain a variety of representations and warranties and that provide general indemnifications. The Fund's maximum exposure under these arrangements is unknown, as it involves future claims that may be made against the Fund that have not yet occurred. Based on experience, management is of the view that the risk of loss in connection with its indemnification obligations is remote; however, there can be no assurance that such obligations will not result in material liabilities that adversely affect the Fund.
6. Principal shareholders and related parties
As of February 28, 2009, 55.22% of the outstanding shares of the Fund were held by two shareholders, each holding more than 10% of the Fund's outstanding shares. On that date, no other shareholder owned more than 10% of the outstanding shares of the Fund. One of the shareholders is another fund of the Trust. Redemptions from (or investments into) the Fund by or on behalf of these large shareholders may have a material effect on the Fund.
16
GMO Short-Duration Investment Fund
(A Series of GMO Trust)
Notes to Financial Statements — (Continued)
February 28, 2009
As of February 28, 2009, 13.64% of the Fund's shares were held by senior management of the Manager and GMO Trust officers and 82.51% of the Fund's shares were held by accounts for which the Manager had investment discretion.
7. Share transactions
The Declaration of Trust permits the Trust to issue an unlimited number of shares of beneficial interest (without par value). Transactions in Fund shares were as follows:
| Year Ended February 28, 2009 | Year Ended February 29, 2008 | ||||||||||||||||||
| Class III: | Shares | Amount | Shares | Amount | |||||||||||||||
| Shares sold | 4 | $ | 32 | 55,544 | $ | 469,351 | |||||||||||||
| Shares issued to shareholders in reinvestment of distributions | 23,717 | 175,909 | 60,822 | 528,993 | |||||||||||||||
| Shares repurchased | (25,867 | ) | (210,073 | ) | (2,751,782 | ) | (24,781,487 | ) | |||||||||||
| Redemption fees | — | 352 | — | — | |||||||||||||||
| Net increase (decrease) | (2,146 | ) | $ | (33,780 | ) | (2,635,416 | ) | $ | (23,783,143 | ) | |||||||||
8. Investments in affiliated issuers
A summary of the Fund's transactions in the shares of other funds of the Trust during the year ended February 28, 2009 is set forth below:
| Affiliate | Value, beginning of period | Purchases | Sales Proceeds | Dividend Income | Distributions of Realized Gains | Value, end of period | |||||||||||||||||||||
| GMO Short-Duration Collateral Fund | $ | 5,324,037 | $ | 237,101 | $ | — | $ | 246,431 | $ | — | $ | 3,959,951 | u | ||||||||||||||
| GMO Special Purpose Holding Fund | 11,582 | — | — | — | 20,816 | 6,710 | |||||||||||||||||||||
| Totals | $ | 5,335,619 | $ | 237,101 | $ | — | $ | 246,431 | $ | 20,816 | $ | 3,966,661 | |||||||||||||||
u After the effect of return of capital distributions of $513,491.
17
Report of Independent Registered Public Accounting Firm
To the Trustees of GMO Trust and the Shareholders of
GMO Short-Duration Investment Fund:
In our opinion, the accompanying statement of assets and liabilities, including the schedule of investments, and the related statements of operations and of changes in net assets and the financial highlights present fairly, in all material respects, the financial position of GMO Short-Duration Investment Fund (the "Fund") at February 28, 2009, the results of its operations for the year then ended, the changes in its net assets for each of the two years in the period then ended and the financial highlights for each of the five years in the period then ended, in conformity with accounting principles generally accepted in the United States of America. These financial statements and financial highlights (hereafter referred to as "financial statements") are the responsibility of the Fund's management. Our responsibility is to express an opinion on these financial statements based on our audits. We conducted our audits of these financ ial statements in accordance with the standards of the Public Company Accounting Oversight Board (United States). Those standards require that we plan and perform the audit to obtain reasonable assurance about whether the financial statements are free of material misstatement. An audit includes examining, on a test basis, evidence supporting the amounts and disclosures in the financial statements, assessing the accounting principles used and significant estimates made by management, and evaluating the overall financial statement presentation. We believe that our audits, which included confirmation of securities at February 28, 2009 by correspondence with the custodian and brokers, provide a reasonable basis for our opinion.
PricewaterhouseCoopers LLP
Boston, Massachusetts
April 29, 2009
18
GMO Short-Duration Investment Fund
(A Series of GMO Trust)
Fund Expenses
February 28, 2009 (Unaudited)
Expense Examples: The following information is in relation to expenses for the six month period ended February 28, 2009.
As a shareholder of the Fund, you may incur two types of costs: (1) transaction costs including redemption fees, and (2) ongoing costs, including management fees, shareholder service fees, and other Fund expenses. This example is intended to help you understand your ongoing costs (in dollars) of investing in the Fund and to compare these costs with the ongoing costs of investing in other mutual funds.
These examples are based on an investment of $1,000 invested at the beginning of the period and held for the entire period, September 1, 2008 through February 28, 2009.
Actual Expenses
The first line of the table below provides information about actual account values and actual expenses. You may use the information in this line, together with the amount you invested, to estimate the expenses that you paid over the period. Simply divide your account value by $1,000 (for example, a $10,000,000 account value divided by $1,000 = 10,000), then multiply the result by the number in the first line under the heading entitled "Net Expense Incurred" to estimate the expenses you paid on your account during this period.
Hypothetical Example for Comparison Purposes
The second line of the table below provides information about hypothetical account values and hypothetical expenses based on the Fund's actual expense ratio and an assumed rate of return of 5% per year before expenses, which is not the Fund's actual return. The hypothetical account values and expenses may not be used to estimate the actual ending account balance or expenses you paid for the period. You may use this information to compare the ongoing costs of investing in the Fund with other funds. To do so, compare this 5% hypothetical example with the 5% hypothetical examples that appear in the shareholder reports of other funds.
Please note that the expenses shown in the table are meant to highlight your ongoing costs only and do not reflect any transactional costs, such as purchase premiums and redemption fees. Therefore, the second line of the table is useful in comparing ongoing costs only, and will not help you determine the relative total costs of owning different funds. In addition, if these transactional costs were included, your costs would have been higher.
| Annualized Net Expense Ratio | Beginning Account Value | Ending Account Value | Net Expense Incurred* | ||||||||||||||||
| Class III | |||||||||||||||||||
| 1) Actual | 0.21 | % | $ | 1,000.00 | $ | 888.30 | $ | 0.98 | |||||||||||
| 2) Hypothetical | 0.21 | % | $ | 1,000.00 | $ | 1,023.75 | $ | 1.05 | |||||||||||
* Expenses are calculated using the Class's annualized expense ratio (including indirect expenses incurred) for the six months ended February 28, 2009, multiplied by the average account value over the period, multiplied by 181 days in the period, divided by 365 days in the year.
19
GMO Short-Duration Investment Fund
(A Series of GMO Trust)
Tax Information for the Tax Year Ended February 28, 2009 (Unaudited)
The Fund will notify shareholders of amounts for use in preparing 2009 income tax forms in early 2010.
The Fund hereby designates as qualified interest income with respect to its taxable year ended February 28, 2009, $105,108 or if determined to be different, the qualified interest income of such year.
20
Trustees and Officers (Unaudited)
The following tables list the Trust's Trustees and Officers as of the date of this report; their address and date of birth ("DOB"); their position with the Trust; the length of time holding that position with the Trust; their principal occupation(s) during the past five years; the number of portfolios in the fund complex they oversee; and other directorships they hold in companies subject to registration or reporting requirements of the Securities Exchange Act of 1934 (generally called "public companies") or in registered investment companies. The Trust's Statement of Additional Information ("SAI") includes additional information about the Trust's trustees, including changes subsequent to the date of the report. The SAI is available, without charge, upon request by writing GMO, c/o GMO Trust, 40 Rowes Wharf, Boston, MA 02110.
Independent Trustees:
| Name, Address, and DOB | Position(s) Held with Trust | Term of Office1 and Length of Time Served | Principal Occupation(s) During Past Five Years | Number of Portfolios in Fund Complex Overseen by Trustee | Other Directorships Held by Trustee | ||||||||||||||||||
| Donald W. Glazer, Esq. c/o GMO Trust 40 Rowes Wharf Boston, MA 02110 DOB: 07/26/1944 | Chairman of the Board of Trustees | Chairman of the Board of Trustees since March 2005; Lead Independent Trustee (September 2004 – March 2005); Trustee since December 2000. | Consultant – Law and Business2; Author of Legal Treatises. | 59 | None. | ||||||||||||||||||
1 Each Trustee is elected to serve during the continued lifetime of the Trust until he/she dies, resigns or is removed, or if sooner, until the next meeting of Shareholders called for the purpose of electing Trustees and until the election and qualification of his/her successor.
2 As part of Mr. Glazer's work as a consultant, he provides part-time consulting services to Goodwin Procter LLP ("Goodwin"). Goodwin has provided legal services to Renewable Resources, LLC, an affiliate of GMO; GMO, in connection with its relationship with Renewable Resources; and funds managed by Renewable Resources. Mr. Glazer has represented that he has no financial interest in, and is not involved in the provision of, such legal services. In the calendar years ended December 31, 2007 and December 31, 2008, these entities paid $789,416 and $183,864 respectively, in legal fees and disbursements to Goodwin. In correspondence with the Staff of the Securities and Exchange Commission beginning in August 2006, the Independent Trustees' legal counsel provided the Staff with information regarding Mr. Glazer's relationship with Goodwin and h is other business activities. On September 11, 2007, based on information that had been given to the Staff as of that date, the Staff provided oral no-action assurance consistent with the opinion of the Independent Trustees' legal counsel that Mr. Glazer is not an "interested person" of the Trust.
21
Independent Trustees — (Continued)
| Name, Address, and DOB | Position(s) Held with Trust | Term of Office1 and Length of Time Served | Principal Occupation(s) During Past Five Years | Number of Portfolios in Fund Complex Overseen by Trustee | Other Directorships Held by Trustee | ||||||||||||||||||
| W. Nicholas Thorndike c/o GMO Trust 40 Rowes Wharf Boston, MA 02110 DOB: 03/28/1933 | Trustee | Since March 2005. | Director or trustee of various corporations and charitable organizations, including Courier Corporation (a book publisher and manufacturer) (July 1989 – present); Putnam Funds (December 1992 – June 2004); and Providence Journal (a newspaper publisher) (December 1986 – December 2003). | 59 | Director of Courier Corporation (a book publisher and manufacturer); Member of the Investment Committee of Partners HealthCare System, Inc.3 | ||||||||||||||||||
| Peter Tufano c/o GMO Trust 40 Rowes Wharf Boston, MA 02110 DOB: 04/22/1957 | Trustee | Since December 2008. | Sylvan C. Coleman Professor of Financial Management, Harvard Business School (since 1989). | 59 | Trustee of State Street Navigator Securities Lending Trust (3 Portfolios). | ||||||||||||||||||
1 Each Trustee is elected to serve during the continued lifetime of the Trust until he/she dies, resigns or is removed, or if sooner, until the next meeting of Shareholders called for the purpose of electing Trustees and until the election and qualification of his/her successor.
3 Partners HealthCare System, Inc. is a client of the Manager.
22
Principal Officers:
| Name, Address, and DOB | Position(s) Held with Trust | Term of Office4 and Length of Time Served | Principal Occupation(s) During Past Five Years5 | ||||||||||||
| J.B. Kittredge DOB: 08/22/1954 | President and Chief Executive Officer | Since March 2009. | General Counsel, Grantham, Mayo, Van Otterloo & Co. LLC (October 2005 – Present); Partner, Ropes & Gray LLP. | ||||||||||||
| Sheppard N. Burnett c/o GMO Trust 40 Rowes Wharf Boston, MA 02110 DOB: 10/24/1968 | Treasurer and Chief Financial Officer | Chief Financial Officer since March 2007; Treasurer since November 2006; Assistant Treasurer, September 2004 – November 2006. | Fund Administration Staff, Grantham, Mayo, Van Otterloo & Co. LLC (June 2004 – present); Vice President, Director of Tax, Columbia Management Group (2002 – 2004). | ||||||||||||
| Brent C. Arvidson c/o GMO Trust 40 Rowes Wharf Boston, MA 02110 DOB: 06/26/1969 | Assistant Treasurer | Since August 1998. | Senior Fund Administrator, Grantham, Mayo, Van Otterloo & Co. LLC. | ||||||||||||
| John L. Nasrah c/o GMO Trust 40 Rowes Wharf Boston, MA 02110 DOB: 05/27/1977 | Assistant Treasurer | Since March 2007. | Fund Administrator, Grantham, Mayo, Van Otterloo & Co. LLC (September 2004 – present); Tax Analyst, Bain & Company, Inc. (June 2003 – September 2004). | ||||||||||||
| Mahmoodur Rahman c/o GMO Trust 40 Rowes Wharf Boston, MA 02110 DOB: 11/30/1967 | Assistant Treasurer | Since September 2007. | Fund Administrator, Grantham, Mayo, Van Otterloo & Co. LLC (April 2007 – present); Vice President and Senior Tax Manager, Massachusetts Financial Services Company (January 2000 – April 2007). | ||||||||||||
| Michael E. Gillespie c/o GMO Trust 40 Rowes Wharf Boston, MA 02110 DOB: 02/18/1958 | Chief Compliance Officer | Since March 2005. | Vice President of Compliance (June 2004 – February 2005) and Director of Domestic Compliance (March 2002 – June 2004), Fidelity Investments. | ||||||||||||
4 Each officer is elected to hold such office until his or her successor is duly elected and qualified to carry out the duties and responsibilities of the office, or until he or she resigns or is removed from office.
5 Each of Messrs. Burnett, Arvidson, Bohan, and Pottle serves as an officer and/or director of certain pooled investment vehicles of which GMO or an affiliate of GMO serves as the investment adviser.
23
Principal Officers — (Continued)
| Name, Address, and DOB | Position(s) Held with Trust | Term of Office4 and Length of Time Served | Principal Occupation(s) During Past Five Years5 | ||||||||||||
| Jason B. Harrison c/o GMO Trust 40 Rowes Wharf Boston, MA 02110 DOB: 01/29/1977 | Vice President and Clerk | Vice President since November 2006; Clerk since March 2006. | Legal Counsel, Grantham, Mayo, Van Otterloo & Co. LLC (since February 2006) and Attorney, Ropes & Gray LLP (September 2002 – February 2006). | ||||||||||||
| David L. Bohan c/o GMO Trust 40 Rowes Wharf Boston, MA 02110 DOB: 06/21/1964 | Vice President and Assistant Clerk | Vice President since March 2005; Assistant Clerk since March 2006. | Legal Counsel, Grantham, Mayo, Van Otterloo & Co. LLC. | ||||||||||||
| Gregory L. Pottle c/o GMO Trust 40 Rowes Wharf Boston, MA 02110 DOB: 07/09/1971 | Vice President and Assistant Clerk | Since November 2006. | Legal Counsel, Grantham, Mayo, Van Otterloo & Co. LLC. | ||||||||||||
| Anne K. Trinque c/o GMO Trust 40 Rowes Wharf Boston, MA 02110 DOB: 04/15/1978 | Vice President and Assistant Clerk | Since September 2007. | Legal Counsel, Grantham, Mayo, Van Otterloo & Co. LLC (January 2007 – present); Attorney, Goodwin Procter LLP (September 2003 – January 2007). | ||||||||||||
| Cheryl Wakeham c/o GMO Trust 40 Rowes Wharf Boston, MA 02110 DOB: 10/29/1958 | Vice President and Anti-Money Laundering Officer | Since December 2004. | Manager, Client Service Administration, Grantham, Mayo, Van Otterloo & Co. LLC. | ||||||||||||
4 Each officer is elected to hold such office until his or her successor is duly elected and qualified to carry out the duties and responsibilities of the office, or until he or she resigns or is removed from office.
5 Each of Messrs. Burnett, Arvidson, Bohan, and Pottle serves as an officer and/or director of certain pooled investment vehicles of which GMO or an affiliate of GMO serves as the investment adviser.
24
GMO U.S. Small/Mid Cap Growth Fund
(A Series of GMO Trust)
Annual Report
February 28, 2009
For a free copy of the Fund's proxy voting guidelines, shareholders may call 1-617-346-7646 (collect) or visit the Securities and Exchange Commission's website at www.sec.gov. Information regarding how the Fund voted proxies relating to portfolio securities during the most recent 12-month period ended June 30 is available on GMO's website at www.gmo.com, or on the Securities and Exchange Commission's website at www.sec.gov.
The Fund files its complete schedule of portfolio holdings with the Securities and Exchange Commission for the first and third quarter of each fiscal year on Form N-Q, which is available on the Commission's website at www.sec.gov. The Fund's Form N-Q may be reviewed and copied at the Commission's Public Reference Room in Washington, D.C. Information on the operation of the Public Reference Room may be obtained by calling 1-800-SEC-0330. The Fund has a policy with respect to disclosure of portfolio holdings under which it may also make available on GMO's website at www.gmo.com a complete schedule of portfolio holdings.
This report is prepared for the general information of shareholders. It is authorized for distribution to prospective investors only when preceded or accompanied by a prospectus for the GMO Trust, which contains a complete discussion of the risks associated with an investment in this Fund and other important information. The GMO Trust prospectus can be obtained at www.gmo.com.
GMO U.S. Small/Mid Cap Growth Fund
(A Series of GMO Trust)
Portfolio Management
Day-to-day management of the Fund's portfolio is the responsibility of the Quantitative Equity team at Grantham, Mayo, Van Otterloo & Co. LLC.
Management Discussion and Analysis of Fund Performance
The GMO U.S. Small/Mid Cap Growth Fund returned -44.3% for the fiscal year ended February 28, 2009, as compared to -44.2% for the Russell 2500 Growth Index. Consistent with the Fund's investment objectives and policies, the Fund was invested primarily in U.S. equity securities throughout the period.
Stock selection added to returns relative to the Russell 2500 Growth Index. Stock selections within Consumer Discretionary, Financials, and Information Technology added to relative returns while stock selections within Health Care, Energy, and Consumer Staples detracted. Individual names adding to relative returns included overweight positions in Ross Stores, Edwards Lifesciences, and Strayer Education. Individual names detracting from relative returns included overweight positions in Walter Industries, Massey Energy, and Energy Conversion Devices.
Sector selection detracted from returns relative to the Russell 2500 Growth Index. Sector weightings positively impacting relative performance included overweight positions in Consumer Discretionary and Industrials and an underweight in Financials. Sector weightings negatively impacting relative performance included an overweight in Energy and underweight positions in Health Care and Telecommunication Services.
The views expressed herein are exclusively those of Grantham, Mayo, Van Otterloo & Co. LLC Management as of the date of this report and are subject to change. GMO disclaims any responsibility to update such views. They are not meant as investment advice. References to specific securities are not recommendations of such securities and may not be representative of any GMO portfolio's current or future investments.
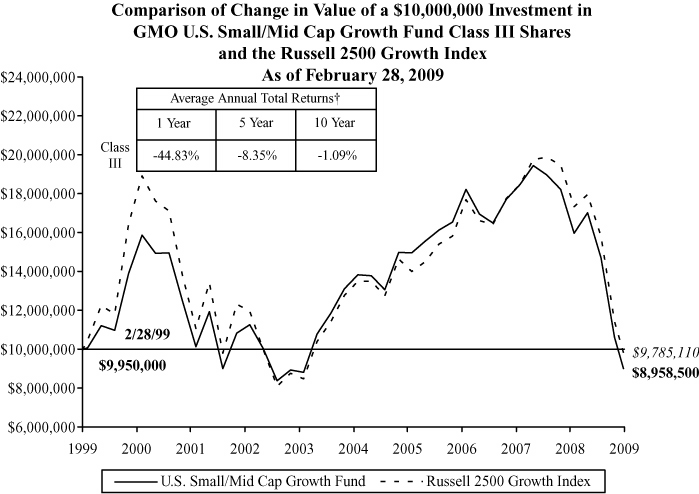
Performance data quoted represents past performance and is not indicative of future results. The investment return and principal value of an investment will fluctuate so that an investor's shares, when redeemed, may be worth more or less than their original cost. Current performance data may be lower or higher than the performance data provided herein. To obtain performance information to the most recent month-end, visit www.gmo.com. Performance shown is net of all fees after reimbursement from the Manager. Each performance figure assumes a purchase at the beginning and redemption at the end of the stated period and reflects a transaction fee of .50% on the purchase and .50% on the redemption. Transaction fees are retained by the Fund to cover trading costs. Returns would have been lower had certain expenses not been reimbursed during the periods shown and do not include the effect of taxes on distributions and redemptions. All information is unaudited.
† The Fund is the successor to the GMO Small/Mid Cap Growth Fund, therefore, performance for the periods prior to September 16, 2005 is that of GMO Small/Mid Cap Growth Fund.
GMO U.S. Small/Mid Cap Growth Fund
(A Series of GMO Trust)
Investments Concentration Summary
February 28, 2009 (Unaudited)
| Asset Class Summary | % of Total Net Assets | ||||||
| Common Stocks | 99.0 | % | |||||
| Short-Term Investments | 2.6 | ||||||
| Futures | (0.3 | ) | |||||
| Other | (1.3 | ) | |||||
| 100.0 | % | ||||||
| Industry Sector Summary | % of Equity Investments | ||||||
| Consumer Discretionary | 22.6 | % | |||||
| Health Care | 20.3 | ||||||
| Information Technology | 18.0 | ||||||
| Industrials | 16.8 | ||||||
| Energy | 8.1 | ||||||
| Financials | 5.1 | ||||||
| Consumer Staples | 4.6 | ||||||
| Materials | 4.0 | ||||||
| Telecommunication Services | 0.3 | ||||||
| Utilities | 0.2 | ||||||
| 100.0 | % | ||||||
1
GMO U.S. Small/Mid Cap Growth Fund
(A Series of GMO Trust)
Schedule of Investments
(showing percentage of total net assets)
February 28, 2009
| Shares | Description | Value ($) | |||||||||||||
| COMMON STOCKS — 99.0% | |||||||||||||||
| Consumer Discretionary — 22.4% | |||||||||||||||
| 500 | 1-800-FLOWERS.COM, Inc. * | 665 | |||||||||||||
| 1,600 | Advance Auto Parts, Inc. | 61,200 | |||||||||||||
| 1,500 | Aeropostale, Inc. * | 34,785 | |||||||||||||
| 200 | Arbitron, Inc. | 2,588 | |||||||||||||
| 2,300 | Big Lots, Inc. * | 35,673 | |||||||||||||
| 100 | Brink's Home Security Holdings, Inc. * | 2,097 | |||||||||||||
| 900 | Buckle, Inc. | 21,357 | |||||||||||||
| 200 | Buffalo Wild Wings, Inc. * | 6,174 | |||||||||||||
| 400 | CEC Entertainment, Inc. * | 9,340 | |||||||||||||
| 2,200 | Corinthian Colleges, Inc. * | 43,340 | |||||||||||||
| 2,500 | Dollar Tree, Inc. * | 97,050 | |||||||||||||
| 1,200 | DreamWorks Animation SKG, Inc.-Class A * | 23,148 | |||||||||||||
| 800 | Exide Technologies * | 2,608 | |||||||||||||
| 400 | Family Dollar Stores, Inc. | 10,976 | |||||||||||||
| 1,200 | Finish Line (The), Inc.-Class A | 4,980 | |||||||||||||
| 100 | Fuel Systems Solutions, Inc. * | 1,981 | |||||||||||||
| 100 | Gymboree Corp. (The) * | 2,572 | |||||||||||||
| 1,100 | Hasbro, Inc. | 25,179 | |||||||||||||
| 200 | Hibbett Sports, Inc. * | 2,804 | |||||||||||||
| 500 | Hillenbrand, Inc. | 8,385 | |||||||||||||
| 600 | ITT Educational Services, Inc. * | 68,100 | |||||||||||||
| 100 | Jack in the Box, Inc. * | 1,944 | |||||||||||||
| 200 | John Wiley and Sons, Inc.-Class A | 6,278 | |||||||||||||
| 100 | Jos. A. Bank Clothiers, Inc. * | 2,260 | |||||||||||||
| 1,300 | Marvel Entertainment, Inc. * | 33,618 | |||||||||||||
| 200 | Matthews International Corp.-Class A | 6,948 | |||||||||||||
| 400 | New York & Co., Inc. * | 872 | |||||||||||||
| 400 | NutriSystem, Inc. | 5,160 | |||||||||||||
| 700 | Panera Bread Co.-Class A * | 30,828 | |||||||||||||
| 200 | Papa John's International, Inc. * | 4,430 | |||||||||||||
| 600 | PetSmart, Inc. | 12,024 | |||||||||||||
| 200 | PF Chang's China Bistro, Inc. * | 3,940 | |||||||||||||
See accompanying notes to the financial statements.
2
GMO U.S. Small/Mid Cap Growth Fund
(A Series of GMO Trust)
Schedule of Investments — (Continued)
(showing percentage of total net assets)
February 28, 2009
| Shares | Description | Value ($) | |||||||||||||
| Consumer Discretionary — continued | |||||||||||||||
| 100 | Polaris Industries, Inc. | 1,841 | |||||||||||||
| 200 | Pre-Paid Legal Services, Inc. * | 6,382 | |||||||||||||
| 400 | Pulte Homes, Inc. | 3,672 | |||||||||||||
| 4,600 | Ross Stores, Inc. | 135,792 | |||||||||||||
| 400 | Strayer Education, Inc. | 67,900 | |||||||||||||
| 700 | True Religion Apparel, Inc. * | 7,154 | |||||||||||||
| 300 | Universal Electronics, Inc. * | 4,671 | |||||||||||||
| 2,700 | Urban Outfitters, Inc. * | 44,928 | |||||||||||||
| 700 | Warnaco Group (The), Inc. * | 15,155 | |||||||||||||
| 500 | Wolverine World Wide, Inc. | 7,580 | |||||||||||||
| Total Consumer Discretionary | 868,379 | ||||||||||||||
| Consumer Staples — 4.5% | |||||||||||||||
| 400 | Boston Beer Co., Inc.-Class A * | 9,588 | |||||||||||||
| 900 | Cal-Maine Foods, Inc. | 20,052 | |||||||||||||
| 900 | Central European Distribution Corp. * | 6,003 | |||||||||||||
| 800 | Church & Dwight Co., Inc. | 39,136 | |||||||||||||
| 1,900 | Darling International, Inc. * | 8,227 | |||||||||||||
| 600 | Dean Foods Co. * | 12,270 | |||||||||||||
| 1,300 | Flowers Foods, Inc. | 29,003 | |||||||||||||
| 150 | Inter Parfums, Inc. | 819 | |||||||||||||
| 100 | JM Smucker Co. (The) | 3,712 | |||||||||||||
| 200 | Lancaster Colony Corp. | 7,776 | |||||||||||||
| 400 | McCormick & Co., Inc. (Non Voting) | 12,540 | |||||||||||||
| 400 | National Beverage Corp. * | 3,272 | |||||||||||||
| 400 | NBTY, Inc. * | 5,948 | |||||||||||||
| 400 | Nu Skin Enterprises, Inc.-Class A | 3,760 | |||||||||||||
| 200 | Pantry, Inc. * | 3,092 | |||||||||||||
| 100 | Sanderson Farms, Inc. | 3,453 | |||||||||||||
| 100 | USANA Health Sciences, Inc. * | 2,003 | |||||||||||||
| 200 | WD-40 Co. | 4,922 | |||||||||||||
| Total Consumer Staples | 175,576 | ||||||||||||||
See accompanying notes to the financial statements.
3
GMO U.S. Small/Mid Cap Growth Fund
(A Series of GMO Trust)
Schedule of Investments — (Continued)
(showing percentage of total net assets)
February 28, 2009
| Shares | Description | Value ($) | |||||||||||||
| Energy — 8.0% | |||||||||||||||
| 500 | Alpha Natural Resources, Inc. * | 9,200 | |||||||||||||
| 800 | Arena Resources, Inc. * | 17,136 | |||||||||||||
| 200 | Berry Petroleum Co. | 1,330 | |||||||||||||
| 600 | BPZ Resources, Inc. * | 2,064 | |||||||||||||
| 300 | CARBO Ceramics, Inc. | 10,428 | |||||||||||||
| 1,700 | Comstock Resources, Inc. * | 51,731 | |||||||||||||
| 400 | Concho Resources Inc. * | 7,980 | |||||||||||||
| 200 | Contango Oil & Gas Co. * | 7,284 | |||||||||||||
| 100 | Dawson Geophysical Co. * | 1,221 | |||||||||||||
| 400 | Encore Acquisition Co. * | 8,032 | |||||||||||||
| 200 | Foundation Coal Holdings, Inc. | 3,216 | |||||||||||||
| 1,000 | Frontline Ltd. | 20,290 | |||||||||||||
| 200 | Golar LNG Ltd. | 874 | |||||||||||||
| 1,100 | International Coal Group, Inc. * | 1,793 | |||||||||||||
| 900 | James River Coal Co. * | 9,891 | |||||||||||||
| 200 | Knightsbridge Tankers Ltd. | 2,634 | |||||||||||||
| 100 | Lufkin Industries, Inc. | 3,285 | |||||||||||||
| 400 | Mariner Energy, Inc. * | 3,700 | |||||||||||||
| 1,000 | McMoRan Exploration Co. * | 4,590 | |||||||||||||
| 400 | Oil States International, Inc. * | 5,328 | |||||||||||||
| 600 | Patriot Coal Corp. * | 2,190 | |||||||||||||
| 2,000 | Patterson-UTI Energy, Inc. | 17,180 | |||||||||||||
| 1,900 | Petrohawk Energy Corp. * | 32,338 | |||||||||||||
| 100 | Petroleum Development Corp. * | 1,210 | |||||||||||||
| 500 | Petroquest Energy, Inc. * | 1,620 | |||||||||||||
| 100 | PHI, Inc. * | 872 | |||||||||||||
| 600 | RPC, Inc. | 3,498 | |||||||||||||
| 200 | St. Mary Land & Exploration Co. | 2,716 | |||||||||||||
| 300 | Superior Energy Services, Inc. * | 3,957 | |||||||||||||
| 100 | T-3 Energy Services, Inc. * | 1,101 | |||||||||||||
| 100 | Tidewater, Inc. | 3,532 | |||||||||||||
| 1,000 | Unit Corp. * | 21,370 | |||||||||||||
| 200 | USEC, Inc. * | 1,006 | |||||||||||||
| 1,600 | W&T Offshore, Inc. | 12,880 | |||||||||||||
See accompanying notes to the financial statements.
4
GMO U.S. Small/Mid Cap Growth Fund
(A Series of GMO Trust)
Schedule of Investments — (Continued)
(showing percentage of total net assets)
February 28, 2009
| Shares | Description | Value ($) | |||||||||||||
| Energy — continued | |||||||||||||||
| 1,200 | Walter Industries, Inc. | 21,804 | |||||||||||||
| 500 | Whiting Petroleum Corp. * | 11,650 | |||||||||||||
| Total Energy | 310,931 | ||||||||||||||
| Financials — 5.1% | |||||||||||||||
| 700 | Brown & Brown, Inc. | 11,809 | |||||||||||||
| 600 | Capitol Federal Financial | 22,218 | |||||||||||||
| 400 | Cash America International, Inc. | 5,760 | |||||||||||||
| 200 | Cohen & Steers, Inc. | 1,798 | |||||||||||||
| 100 | Digital Realty Trust, Inc. REIT | 2,989 | |||||||||||||
| 1,500 | Eaton Vance Corp. | 25,950 | |||||||||||||
| 1,200 | EZCORP, Inc.-Class A * | 12,336 | |||||||||||||
| 1,200 | Federated Investors Inc.-Class B | 22,632 | |||||||||||||
| 300 | First Cash Financial Services, Inc. * | 4,098 | |||||||||||||
| 100 | First Financial Bankshares, Inc. | 4,302 | |||||||||||||
| 100 | GAMCO Investors, Inc.-Class A | 2,900 | |||||||||||||
| 100 | Greenhill & Co., Inc. | 6,460 | |||||||||||||
| 200 | Health Care REIT, Inc. | 6,154 | |||||||||||||
| 100 | Home Properties, Inc. REIT | 2,654 | |||||||||||||
| 200 | Inland Real Estate Corp. REIT | 1,560 | |||||||||||||
| 200 | Interactive Brokers Group, Inc.-Class A * | 2,810 | |||||||||||||
| 500 | Knight Capital Group, Inc.-Class A * | 8,795 | |||||||||||||
| 200 | Nationwide Health Properties, Inc. REIT | 4,052 | |||||||||||||
| 200 | Omega Healthcare Investors, Inc. REIT | 2,626 | |||||||||||||
| 400 | optionsXpress Holdings, Inc. | 3,948 | |||||||||||||
| 600 | Oritani Financial Corp. * | 6,486 | |||||||||||||
| 1,000 | SEI Investments Co. | 11,840 | |||||||||||||
| 200 | SVB Financial Group * | 3,270 | |||||||||||||
| 400 | Waddell and Reed Financial, Inc. | 5,648 | |||||||||||||
| 200 | Westamerica Bancorporation | 7,974 | |||||||||||||
| 400 | World Acceptance Corp. * | 5,864 | |||||||||||||
| Total Financials | 196,933 | ||||||||||||||
See accompanying notes to the financial statements.
5
GMO U.S. Small/Mid Cap Growth Fund
(A Series of GMO Trust)
Schedule of Investments — (Continued)
(showing percentage of total net assets)
February 28, 2009
| Shares | Description | Value ($) | |||||||||||||
| Health Care — 20.1% | |||||||||||||||
| 200 | Abaxis, Inc. * | 3,128 | |||||||||||||
| 500 | Abiomed, Inc. * | 3,405 | |||||||||||||
| 100 | Abraxis Bioscience, Inc. * | 5,854 | |||||||||||||
| 300 | Acorda Therapeutics, Inc. * | 6,600 | |||||||||||||
| 200 | Albany Molecular Research, Inc. * | 1,734 | |||||||||||||
| 700 | Allos Therapeutics * | 3,948 | |||||||||||||
| 500 | Almost Family, Inc. * | 10,145 | |||||||||||||
| 100 | Amedisys, Inc. * | 3,271 | |||||||||||||
| 500 | American Medical Systems Holdings, Inc. * | 5,175 | |||||||||||||
| 100 | AMN Healthcare Services, Inc. * | 651 | |||||||||||||
| 400 | Auxilium Pharmaceuticals, Inc. * | 10,988 | |||||||||||||
| 100 | Beckman Coulter, Inc. | 4,484 | |||||||||||||
| 100 | Bio-Rad Laboratories, Inc. * | 5,570 | |||||||||||||
| 400 | Bruker Corp. * | 1,684 | |||||||||||||
| 200 | CardioNet, Inc. * | 5,000 | |||||||||||||
| 300 | Catalyst Health Solutions, Inc. * | 6,324 | |||||||||||||
| 200 | Centene Corp. * | 3,396 | |||||||||||||
| 600 | Cephalon, Inc. * | 39,354 | |||||||||||||
| 100 | Chemed Corp. | 3,981 | |||||||||||||
| 400 | CorVel Corp. * | 7,544 | |||||||||||||
| 300 | Cougar Biotechnology, Inc. * | 7,509 | |||||||||||||
| 700 | CryoLife, Inc. * | 3,535 | |||||||||||||
| 100 | Cubist Pharmaceuticals, Inc. * | 1,421 | |||||||||||||
| 700 | Cyberonics, Inc. * | 9,415 | |||||||||||||
| 100 | Dionex Corp. * | 4,679 | |||||||||||||
| 1,400 | Edwards Lifesciences Corp. * | 77,854 | |||||||||||||
| 200 | Emergency Medical Services, LP * | 6,124 | |||||||||||||
| 1,800 | Emergent Biosolutions, Inc. * | 34,758 | |||||||||||||
| 100 | Ensign Group, Inc. (The) | 1,323 | |||||||||||||
| 900 | eResearchTechnology, Inc. * | 4,365 | |||||||||||||
| 200 | Exactech, Inc. * | 2,756 | |||||||||||||
| 400 | Gentiva Health Services, Inc. * | 6,932 | |||||||||||||
| 300 | Haemonetics Corp. * | 16,014 | |||||||||||||
| 300 | Healthways, Inc. * | 2,733 | |||||||||||||
See accompanying notes to the financial statements.
6
GMO U.S. Small/Mid Cap Growth Fund
(A Series of GMO Trust)
Schedule of Investments — (Continued)
(showing percentage of total net assets)
February 28, 2009
| Shares | Description | Value ($) | |||||||||||||
| Health Care — continued | |||||||||||||||
| 100 | Hill-Rom Holdings, Inc. | 982 | |||||||||||||
| 100 | Immucor, Inc. * | 2,244 | |||||||||||||
| 200 | ISIS Pharmaceuticals, Inc. * | 2,572 | |||||||||||||
| 100 | Kendle International, Inc. * | 1,870 | |||||||||||||
| 200 | Kensey Nash Corp. * | 3,812 | |||||||||||||
| 100 | Landauer, Inc. | 5,001 | |||||||||||||
| 700 | LHC Group, Inc. * | 13,951 | |||||||||||||
| 700 | Lincare Holdings, Inc. * | 14,749 | |||||||||||||
| 1,200 | Luminex Corp. * | 19,920 | |||||||||||||
| 200 | Martek Biosciences Corp. | 3,746 | |||||||||||||
| 800 | Medicines Co. * | 9,816 | |||||||||||||
| 100 | Medivation, Inc. * | 1,667 | |||||||||||||
| 1,200 | Merit Medical Systems, Inc. * | 13,368 | |||||||||||||
| 800 | Momenta Pharmaceuticals, Inc. * | 7,680 | |||||||||||||
| 700 | Myriad Genetics, Inc. * | 55,195 | |||||||||||||
| 400 | Natus Medical, Inc. * | 3,132 | |||||||||||||
| 300 | Noven Pharmaceuticals, Inc. * | 2,439 | |||||||||||||
| 700 | NPS Pharmaceuticals, Inc. * | 3,185 | |||||||||||||
| 600 | Omnicare, Inc. | 15,558 | |||||||||||||
| 700 | Owens & Minor, Inc. | 23,597 | |||||||||||||
| 600 | PAREXEL International Corp. * | 5,502 | |||||||||||||
| 100 | PDL BioPharma, Inc. | 587 | |||||||||||||
| 700 | PerkinElmer, Inc. | 9,016 | |||||||||||||
| 1,200 | Perrigo Co. | 24,108 | |||||||||||||
| 200 | Pharmaceutical Product Development, Inc. | 4,798 | |||||||||||||
| 400 | Rigel Pharmaceuticals, Inc. * | 2,096 | |||||||||||||
| 1,000 | Savient Pharmaceuticals, Inc. * | 4,320 | |||||||||||||
| 1,000 | Sequenom, Inc. * | 14,630 | |||||||||||||
| 1,800 | Steris Corp. | 41,508 | |||||||||||||
| 800 | Techne Corp. | 39,080 | |||||||||||||
| 6,000 | Tenet Healthcare Corp. * | 6,660 | |||||||||||||
| 1,800 | Thoratec Corp. * | 41,112 | |||||||||||||
| 2,300 | Valeant Pharmaceuticals International * | 40,020 | |||||||||||||
| 200 | Varian, Inc. * | 4,526 | |||||||||||||
See accompanying notes to the financial statements.
7
GMO U.S. Small/Mid Cap Growth Fund
(A Series of GMO Trust)
Schedule of Investments — (Continued)
(showing percentage of total net assets)
February 28, 2009
| Shares | Description | Value ($) | |||||||||||||
| Health Care — continued | |||||||||||||||
| 100 | Vertex Pharmaceuticals, Inc. * | 3,023 | |||||||||||||
| 500 | Volcano Corp. * | 7,480 | |||||||||||||
| 200 | Watson Pharmaceuticals, Inc. * | 5,654 | |||||||||||||
| 200 | WellCare Health Plans, Inc. * | 1,806 | |||||||||||||
| 100 | Young Innovations, Inc. | 1,600 | |||||||||||||
| 400 | Zoll Medical Corp. * | 5,500 | |||||||||||||
| Total Health Care | 779,164 | ||||||||||||||
| Industrials — 16.6% | |||||||||||||||
| 100 | Acuity Brands, Inc. | 2,292 | |||||||||||||
| 100 | Aerovironment, Inc. * | 3,122 | |||||||||||||
| 600 | American Ecology Corp. | 9,420 | |||||||||||||
| 200 | Applied Industrial Technologies, Inc. | 3,224 | |||||||||||||
| 100 | Applied Signal Technology, Inc. | 1,912 | |||||||||||||
| 200 | Argon ST, Inc. * | 3,402 | |||||||||||||
| 100 | Axsys Technologies, Inc. * | 3,321 | |||||||||||||
| 100 | AZZ, Inc. * | 2,024 | |||||||||||||
| 100 | Badger Meter, Inc. | 2,510 | |||||||||||||
| 1,100 | Beacon Roofing Supply, Inc. * | 12,067 | |||||||||||||
| 700 | Brink's Co. (The) | 16,709 | |||||||||||||
| 300 | CBIZ, Inc. * | 2,058 | |||||||||||||
| 100 | Chart Industries, Inc. * | 642 | |||||||||||||
| 100 | CIRCOR International, Inc. | 2,223 | |||||||||||||
| 700 | Clarcor, Inc. | 18,452 | |||||||||||||
| 400 | Clean Harbors, Inc. * | 19,432 | |||||||||||||
| 200 | Colfax Corp. * | 1,454 | |||||||||||||
| 200 | Copart, Inc. * | 5,404 | |||||||||||||
| 300 | Delta Air Lines, Inc. * | 1,509 | |||||||||||||
| 700 | Donaldson Co., Inc. | 17,087 | |||||||||||||
| 200 | Dun & Bradstreet Corp. | 14,794 | |||||||||||||
| 200 | Dynamic Materials Corp. | 1,864 | |||||||||||||
| 400 | EMCOR Group, Inc. * | 6,164 | |||||||||||||
| 600 | Energy Conversion Devices, Inc. * | 13,158 | |||||||||||||
| 200 | ESCO Technologies, Inc. * | 6,502 | |||||||||||||
See accompanying notes to the financial statements.
8
GMO U.S. Small/Mid Cap Growth Fund
(A Series of GMO Trust)
Schedule of Investments — (Continued)
(showing percentage of total net assets)
February 28, 2009
| Shares | Description | Value ($) | |||||||||||||
| Industrials — continued | |||||||||||||||
| 200 | Exponent, Inc. * | 4,494 | |||||||||||||
| 200 | Forward Air Corp. | 3,328 | |||||||||||||
| 100 | GATX Corp. | 1,827 | |||||||||||||
| 600 | Genesee & Wyoming, Inc.-Class A * | 12,534 | |||||||||||||
| 600 | Gorman-Rupp Co. | 10,614 | |||||||||||||
| 600 | Graco, Inc. | 10,188 | |||||||||||||
| 200 | GrafTech International Ltd. * | 1,130 | |||||||||||||
| 100 | Hawaiian Holdings, Inc. * | 317 | |||||||||||||
| 600 | Healthcare Services Group, Inc. | 9,222 | |||||||||||||
| 400 | Heartland Express, Inc. | 4,948 | |||||||||||||
| 200 | Herman Miller, Inc. | 2,016 | |||||||||||||
| 400 | HUB Group Inc.-Class A * | 7,184 | |||||||||||||
| 100 | Idex Corp. | 1,932 | |||||||||||||
| 700 | II-VI, Inc. * | 12,572 | |||||||||||||
| 2,900 | JB Hunt Transport Services, Inc. | 59,102 | |||||||||||||
| 800 | Kansas City Southern * | 14,152 | |||||||||||||
| 600 | Knight Transportation, Inc. | 7,776 | |||||||||||||
| 600 | Knoll, Inc. | 3,960 | |||||||||||||
| 800 | Landstar System, Inc. | 25,320 | |||||||||||||
| 200 | Lincoln Electric Holdings, Inc. | 6,146 | |||||||||||||
| 300 | Lindsay Corp. | 7,275 | |||||||||||||
| 700 | MasTec, Inc. * | 6,622 | |||||||||||||
| 700 | MSC Industrial Direct Co., Inc.-Class A | 21,413 | |||||||||||||
| 500 | Navigant Consulting, Inc. * | 6,485 | |||||||||||||
| 500 | Nordson Corp. | 12,450 | |||||||||||||
| 700 | Old Dominion Freight Line, Inc. * | 15,253 | |||||||||||||
| 600 | Pacer International, Inc. | 1,758 | |||||||||||||
| 300 | Pall Corp. | 7,131 | |||||||||||||
| 1,100 | Polypore International, Inc. * | 5,335 | |||||||||||||
| 300 | Quanex Building Products Corp. | 2,103 | |||||||||||||
| 600 | Raven Industries, Inc. | 10,908 | |||||||||||||
| 700 | Resources Connection, Inc. * | 9,625 | |||||||||||||
| 200 | Robbins & Myers, Inc. | 3,226 | |||||||||||||
| 500 | Robert Half International, Inc. | 7,685 | |||||||||||||
See accompanying notes to the financial statements.
9
GMO U.S. Small/Mid Cap Growth Fund
(A Series of GMO Trust)
Schedule of Investments — (Continued)
(showing percentage of total net assets)
February 28, 2009
| Shares | Description | Value ($) | |||||||||||||
| Industrials — continued | |||||||||||||||
| 500 | Ryder System, Inc. | 11,430 | |||||||||||||
| 200 | Sauer-Danfoss, Inc. | 1,170 | |||||||||||||
| 300 | Stanley, Inc. * | 9,303 | |||||||||||||
| 200 | Sun Hydraulics Corp. | 2,652 | |||||||||||||
| 200 | Team, Inc. * | 2,624 | |||||||||||||
| 500 | Teledyne Technologies, Inc. * | 11,455 | |||||||||||||
| 500 | Tetra Tech, Inc. * | 11,200 | |||||||||||||
| 200 | Textainer Group Holdings Ltd. | 1,182 | |||||||||||||
| 300 | Titan Machinery, Inc. * | 2,769 | |||||||||||||
| 300 | Valmont Industries, Inc. | 13,068 | |||||||||||||
| 1,300 | Wabtec Corp. | 34,788 | |||||||||||||
| 300 | Waste Connections, Inc. * | 7,152 | |||||||||||||
| 200 | Watsco, Inc. | 6,866 | |||||||||||||
| 500 | Watson Wyatt Worldwide, Inc. | 24,555 | |||||||||||||
| 1,000 | Woodward Governor Co. | 17,220 | |||||||||||||
| Total Industrials | 644,211 | ||||||||||||||
| Information Technology — 17.8% | |||||||||||||||
| 300 | ACI Worldwide, Inc. * | 5,358 | |||||||||||||
| 300 | ADTRAN, Inc. | 4,332 | |||||||||||||
| 400 | Alliance Data Systems Corp. * | 11,840 | |||||||||||||
| 1,472 | Ansys, Inc. * | 29,690 | |||||||||||||
| 300 | Blackbaud, Inc. | 3,072 | |||||||||||||
| 100 | CACI International, Inc.-Class A * | 4,277 | |||||||||||||
| 200 | Cass Information Systems, Inc. | 5,162 | |||||||||||||
| 200 | Cogent, Inc. * | 2,080 | |||||||||||||
| 3,800 | Compuware Corp. * | 22,458 | |||||||||||||
| 800 | CSG Systems International, Inc. * | 10,816 | |||||||||||||
| 500 | Digital River, Inc. * | 11,960 | |||||||||||||
| 1,300 | Earthlink, Inc. * | 8,190 | |||||||||||||
| 1,700 | F5 Networks, Inc. * | 34,000 | |||||||||||||
| 300 | Faro Technologies, Inc. * | 3,567 | |||||||||||||
| 3,800 | FLIR Systems, Inc. * | 77,558 | |||||||||||||
| 400 | Forrester Research, Inc. * | 7,336 | |||||||||||||
See accompanying notes to the financial statements.
10
GMO U.S. Small/Mid Cap Growth Fund
(A Series of GMO Trust)
Schedule of Investments — (Continued)
(showing percentage of total net assets)
February 28, 2009
| Shares | Description | Value ($) | |||||||||||||
| Information Technology — continued | |||||||||||||||
| 100 | Gartner, Inc. * | 1,011 | |||||||||||||
| 1,400 | Global Payments, Inc. | 42,952 | |||||||||||||
| 900 | Hewitt Associates Inc.-Class A * | 26,550 | |||||||||||||
| 200 | Hittite Microwave Corp. * | 5,516 | |||||||||||||
| 1,200 | Integral Systems, Inc. * | 10,956 | |||||||||||||
| 800 | InterDigital, Inc. * | 23,504 | |||||||||||||
| 500 | IXYS Corp. | 4,215 | |||||||||||||
| 200 | j2 Global Communications, Inc. * | 3,746 | |||||||||||||
| 900 | Jabil Circuit, Inc. | 3,726 | |||||||||||||
| 800 | Mantech International Corp.-Class A * | 41,736 | |||||||||||||
| 1,400 | Micrel, Inc. | 9,310 | |||||||||||||
| 600 | Microsemi Corp. * | 6,066 | |||||||||||||
| 200 | Multi-Fineline Electronix, Inc. * | 2,854 | |||||||||||||
| 200 | National Instruments Corp. | 3,446 | |||||||||||||
| 100 | NCI, Inc. * | 2,720 | |||||||||||||
| 300 | Net 1 UEPS Technologies, Inc. * | 4,341 | |||||||||||||
| 100 | Netlogic Microsystems, Inc. * | 2,371 | |||||||||||||
| 100 | Opnet Technologies, Inc. * | 916 | |||||||||||||
| 1,700 | Parametric Technology Corp. * | 13,838 | |||||||||||||
| 600 | Pegasystems, Inc. | 8,598 | |||||||||||||
| 200 | Pericom Semiconductor Corp. * | 1,074 | |||||||||||||
| 200 | Plexus Corp. * | 2,570 | |||||||||||||
| 1,700 | PMC-Sierra, Inc. * | 8,687 | |||||||||||||
| 300 | Polycom, Inc. * | 3,990 | |||||||||||||
| 200 | Power Integrations, Inc. | 3,670 | |||||||||||||
| 300 | Progress Software Corp. * | 4,782 | |||||||||||||
| 300 | Quality Systems, Inc. | 11,613 | |||||||||||||
| 400 | Radiant Systems, Inc. * | 1,124 | |||||||||||||
| 500 | Renaissance Learning, Inc. | 3,555 | |||||||||||||
| 500 | Rofin-Sinar Technologies, Inc. * | 7,325 | |||||||||||||
| 300 | SAIC, Inc. * | 5,673 | |||||||||||||
| 200 | Scansource, Inc. * | 3,174 | |||||||||||||
| 700 | Semtech Corp. * | 8,225 | |||||||||||||
| 2,600 | Silicon Image, Inc. * | 6,032 | |||||||||||||
See accompanying notes to the financial statements.
11
GMO U.S. Small/Mid Cap Growth Fund
(A Series of GMO Trust)
Schedule of Investments — (Continued)
(showing percentage of total net assets)
February 28, 2009
| Shares | Description | Value ($) | |||||||||||||
| Information Technology — continued | |||||||||||||||
| 300 | Silicon Laboratories, Inc. * | 6,570 | |||||||||||||
| 1,900 | Skyworks Solutions, Inc. * | 12,350 | |||||||||||||
| 300 | Sohu.com, Inc. * | 14,820 | |||||||||||||
| 800 | Solera Holdings, Inc. * | 16,632 | |||||||||||||
| 400 | STEC, Inc. * | 2,256 | |||||||||||||
| 600 | Stratasys, Inc. * | 5,460 | |||||||||||||
| 1,700 | Sybase, Inc. * | 46,206 | |||||||||||||
| 200 | Synaptics, Inc. * | 4,150 | |||||||||||||
| 800 | Syntel, Inc. | 16,272 | |||||||||||||
| 1,400 | TeleCommunication Systems, Inc. * | 11,550 | |||||||||||||
| 200 | TNS, Inc. * | 1,338 | |||||||||||||
| 600 | Tyler Technologies, Inc. * | 8,166 | |||||||||||||
| 800 | Volterra Semiconductor Corp. * | 6,480 | |||||||||||||
| 700 | Websense, Inc. * | 7,812 | |||||||||||||
| Total Information Technology | 691,624 | ||||||||||||||
| Materials — 4.0% | |||||||||||||||
| 300 | Airgas, Inc. | 9,237 | |||||||||||||
| 100 | AptarGroup, Inc. | 2,806 | |||||||||||||
| 300 | Balchem Corp.-Class B | 6,225 | |||||||||||||
| 100 | Ball Corp. | 4,029 | |||||||||||||
| 400 | Calgon Carbon Corp. * | 5,860 | |||||||||||||
| 1,000 | Crown Holdings, Inc. * | 21,080 | |||||||||||||
| 600 | FMC Corp. | 24,258 | |||||||||||||
| 300 | Greif, Inc.-Class A | 9,225 | |||||||||||||
| 200 | Headwaters, Inc. * | 396 | |||||||||||||
| 300 | Innophos Holdings, Inc. | 3,186 | |||||||||||||
| 100 | Koppers Holdings, Inc. | 1,336 | |||||||||||||
| 800 | NewMarket Corp. | 27,656 | |||||||||||||
| 100 | Quaker Chemical Corp. | 563 | |||||||||||||
| 200 | Rock-Tenn Co.-Class A | 5,522 | |||||||||||||
| 100 | Schnitzer Steel Industries, Inc.-Class A | 2,864 | |||||||||||||
| 300 | ShengdaTech, Inc. * | 1,038 | |||||||||||||
| 100 | Silgan Holdings, Inc. | 4,906 | |||||||||||||
See accompanying notes to the financial statements.
12
GMO U.S. Small/Mid Cap Growth Fund
(A Series of GMO Trust)
Schedule of Investments — (Continued)
(showing percentage of total net assets)
February 28, 2009
| Shares | Description | Value ($) | |||||||||||||
| Materials — continued | |||||||||||||||
| 800 | Terra Industries, Inc. | 20,632 | |||||||||||||
| 200 | Valhi, Inc. | 2,498 | |||||||||||||
| Total Materials | 153,317 | ||||||||||||||
| Telecommunication Services — 0.3% | |||||||||||||||
| 700 | Frontier Communications Corp. | 5,040 | |||||||||||||
| 300 | Premiere Global Services, Inc. * | 2,508 | |||||||||||||
| 300 | Syniverse Holdings, Inc. * | 4,539 | |||||||||||||
| Total Telecommunication Services | 12,087 | ||||||||||||||
| Utilities — 0.2% | |||||||||||||||
| 600 | CenterPoint Energy, Inc. | 6,192 | |||||||||||||
| 100 | Energen Corp. | 2,680 | |||||||||||||
| Total Utilities | 8,872 | ||||||||||||||
| TOTAL COMMON STOCKS (COST $6,045,104) | 3,841,094 | ||||||||||||||
| SHORT-TERM INVESTMENTS — 2.6% | |||||||||||||||
| Money Market Funds — 2.6% | |||||||||||||||
| 101,885 | State Street Institutional Treasury Money Market Fund-Institutional Class | 101,885 | |||||||||||||
| TOTAL SHORT-TERM INVESTMENTS (COST $101,885) | 101,885 | ||||||||||||||
| TOTAL INVESTMENTS — 101.6% (Cost $6,146,989) | 3,942,979 | ||||||||||||||
| Other Assets and Liabilities (net) — (1.6%) | (60,614 | ) | |||||||||||||
| TOTAL NET ASSETS — 100.0% | $ | 3,882,365 | |||||||||||||
See accompanying notes to the financial statements.
13
GMO U.S. Small/Mid Cap Growth Fund
(A Series of GMO Trust)
Schedule of Investments — (Continued)
February 28, 2009
A summary of outstanding financial instruments at February 28, 2009 is as follows:
Futures Contracts
| Number of Contracts | Type | Expiration Date | Contract Value | Net Unrealized Appreciation (Depreciation) | |||||||||||||||
| Buys | |||||||||||||||||||
| 2 | Russell 2000 Mini | March 2009 | $ | 77,700 | $ | (11,554 | ) | ||||||||||||
As of February 28, 2009, for the futures contracts held, the Fund had sufficient cash and/or securities to cover any commitments or margin requirements of the relevant broker or exchange.
Notes to Schedule of Investments:
REIT - Real Estate Investment Trust
* Non-income producing security.
See accompanying notes to the financial statements.
14
GMO U.S. Small/Mid Cap Growth Fund
(A Series of GMO Trust)
Statement of Assets and Liabilities — February 28, 2009
| Assets: | |||||||
| Investments, at value (cost $6,146,989) (Note 2) | $ | 3,942,979 | |||||
| Receivable for investments sold | 57,245 | ||||||
| Dividends and interest receivable | 2,600 | ||||||
| Receivable for collateral on open futures contracts (Note 2) | 11,000 | ||||||
| Receivable for expenses reimbursed by Manager (Note 3) | 16,558 | ||||||
| Total assets | 4,030,382 | ||||||
| Liabilities: | |||||||
| Payable for investments purchased | 72,096 | ||||||
| Payable to affiliate for (Note 3): | |||||||
| Management fee | 1,012 | ||||||
| Shareholder service fee | 489 | ||||||
| Trustees and Chief Compliance Officer of GMO Trust fees | 15 | ||||||
| Payable for variation margin on open futures contracts (Note 2) | 1,079 | ||||||
| Accrued expenses | 73,326 | ||||||
| Total liabilities | 148,017 | ||||||
| Net assets | $ | 3,882,365 | |||||
| Net assets consist of: | |||||||
| Paid-in capital | $ | 8,842,451 | |||||
| Accumulated undistributed net investment income | 126 | ||||||
| Accumulated net realized loss | (2,744,648 | ) | |||||
| Net unrealized depreciation | (2,215,564 | ) | |||||
| $ | 3,882,365 | ||||||
| Net assets attributable to: | |||||||
| Class III shares | $ | 3,882,365 | |||||
| Shares outstanding: | |||||||
| Class III | 515,176 | ||||||
| Net asset value per share: | |||||||
| Class III | $ | 7.54 | |||||
See accompanying notes to the financial statements.
15
GMO U.S. Small/Mid Cap Growth Fund
(A Series of GMO Trust)
Statement of Operations — Year Ended February 28, 2009
| Investment Income: | |||||||
| Dividends | $ | 53,514 | |||||
| Interest | 101 | ||||||
| Total investment income | 53,615 | ||||||
| Expenses: | |||||||
| Management fee (Note 3) | 20,454 | ||||||
| Shareholder service fee – Class III (Note 3) | 9,897 | ||||||
| Custodian, fund accounting agent and transfer agent fees | 52,413 | ||||||
| Audit and tax fees | 59,001 | ||||||
| Legal fees | 106 | ||||||
| Trustees fees and related expenses (Note 3) | 93 | ||||||
| Registration fees | 276 | ||||||
| Miscellaneous | 2,984 | ||||||
| Total expenses | 145,224 | ||||||
| Fees and expenses reimbursed by Manager (Note 3) | (114,766 | ) | |||||
| Net expenses | 30,458 | ||||||
| Net investment income (loss) | 23,157 | ||||||
| Realized and unrealized gain (loss): | |||||||
| Net realized gain (loss) on: | |||||||
| Investments | (1,394,724 | ) | |||||
| Closed futures contracts | 19,951 | ||||||
| Net realized gain (loss) | (1,374,773 | ) | |||||
| Change in net unrealized appreciation (depreciation) on: | |||||||
| Investments | (1,700,305 | ) | |||||
| Open futures contracts | (11,554 | ) | |||||
| Net unrealized gain (loss) | (1,711,859 | ) | |||||
| Net realized and unrealized gain (loss) | (3,086,632 | ) | |||||
| Net increase (decrease) in net assets resulting from operations | $ | (3,063,475 | ) | ||||
See accompanying notes to the financial statements.
16
GMO U.S. Small/Mid Cap Growth Fund
(A Series of GMO Trust)
Statement of Changes in Net Assets
| Year Ended February 28, 2009 | Year Ended February 29, 2008 | ||||||||||
| Increase (decrease) in net assets: | |||||||||||
| Operations: | |||||||||||
| Net investment income (loss) | $ | 23,157 | $ | 59,683 | |||||||
| Net realized gain (loss) | (1,374,773 | ) | 1,071,606 | ||||||||
| Change in net unrealized appreciation (depreciation) | (1,711,859 | ) | (2,475,643 | ) | |||||||
| Net increase (decrease) in net assets from operations | (3,063,475 | ) | (1,344,354 | ) | |||||||
| Distributions to shareholders from: | |||||||||||
| Net investment income | |||||||||||
| Class III | (22,611 | ) | (57,832 | ) | |||||||
| Net realized gains | |||||||||||
| Class III | — | (3,159,111 | ) | ||||||||
| Return of capital | |||||||||||
| Class III | — | (44,360 | ) | ||||||||
| (22,611 | ) | (3,261,303 | ) | ||||||||
| Net share transactions (Note 7): | |||||||||||
| Class III | (1,236,081 | ) | (12,589,446 | ) | |||||||
| Purchase premiums and redemption fees (Notes 2 and 7): | |||||||||||
| Class III | 6,384 | 79,121 | |||||||||
| Total increase (decrease) in net assets resulting from net share transactions, purchase premiums and redemption fees | (1,229,697 | ) | (12,510,325 | ) | |||||||
| Total increase (decrease) in net assets | (4,315,783 | ) | (17,115,982 | ) | |||||||
| Net assets: | |||||||||||
| Beginning of period | 8,198,148 | 25,314,130 | |||||||||
| End of period (including accumulated undistributed net investment income of $126 and $0, respectively) | $ | 3,882,365 | $ | 8,198,148 | |||||||
See accompanying notes to the financial statements.
17
GMO U.S. Small/Mid Cap Growth Fund
(A Series of GMO Trust)
Financial Highlights
(For a Class III share outstanding throughout each period)
| Year Ended February 28/29, | |||||||||||||||||||||||
| 2009 | 2008 | 2007 | 2006 | 2005 | |||||||||||||||||||
| Net asset value, beginning of period | $ | 13.59 | $ | 18.93 | $ | 19.67 | $ | 21.96 | $ | 21.78 | |||||||||||||
| Income (loss) from investment operations: | |||||||||||||||||||||||
| Net investment income (loss)† | 0.04 | 0.06 | 0.07 | 0.06 | 0.03 | ||||||||||||||||||
| Net realized and unrealized gain (loss) | (6.05 | ) | (1.79 | ) | 0.79 | 2.93 | 1.96 | ||||||||||||||||
| Total from investment operations | (6.01 | ) | (1.73 | ) | 0.86 | 2.99 | 1.99 | ||||||||||||||||
| Less distributions to shareholders: | |||||||||||||||||||||||
| From net investment income | (0.04 | ) | (0.06 | ) | (0.09 | ) | (0.07 | ) | (0.01 | ) | |||||||||||||
| From net realized gains | — | (3.49 | ) | (1.51 | ) | (5.21 | ) | (1.80 | ) | ||||||||||||||
| Return of capital | — | (0.06 | ) | — | — | — | |||||||||||||||||
| Total distributions | (0.04 | ) | (3.61 | ) | (1.60 | ) | (5.28 | ) | (1.81 | ) | |||||||||||||
| Net asset value, end of period | $ | 7.54 | $ | 13.59 | $ | 18.93 | $ | 19.67 | $ | 21.96 | |||||||||||||
| Total Return(a) | (44.27 | )% | (11.74 | )% | 4.86 | % | 14.63 | % | 10.50 | % | |||||||||||||
| Ratios/Supplemental Data: | |||||||||||||||||||||||
| Net assets, end of period (000's) | $ | 3,882 | $ | 8,198 | $ | 25,314 | $ | 29,804 | $ | 38,801 | |||||||||||||
| Net expenses to average daily net assets | 0.46 | % | 0.46 | % | 0.46 | % | 0.48 | % | 0.48 | % | |||||||||||||
| Net investment income to average daily net assets | 0.35 | % | 0.30 | % | 0.38 | % | 0.30 | % | 0.16 | % | |||||||||||||
| Portfolio turnover rate | 127 | % | 118 | % | 109 | % | 87 | % | 110 | % | |||||||||||||
| Fees and expenses reimbursed by the Manager to average daily net assets: | 1.74 | % | 0.48 | % | 0.60 | % | 0.35 | % | 0.26 | % | |||||||||||||
| Purchase premiums and redemption fees consisted of the following per share amounts:† | $ | 0.01 | $ | 0.07 | $ | 0.03 | $ | 0.08 | $ | 0.04 | |||||||||||||
(a) The total returns would have been lower had certain expenses not been reimbursed during the periods shown and assumes the effect of reinvested distributions. Calculation excludes purchase premiums and redemption fees which are borne by the shareholder.
† Calculated using average shares outstanding throughout the period.
See accompanying notes to the financial statements.
18
GMO U.S. Small/Mid Cap Growth Fund
(A Series of GMO Trust)
Notes to Financial Statements
February 28, 2009
1. Organization
GMO U.S. Small/Mid Cap Growth Fund (the "Fund") is a series of GMO Trust (the "Trust"). The Fund is registered under the Investment Company Act of 1940, as amended, as an open-end, non-diversified management investment company. The Fund is advised and managed by Grantham, Mayo, Van Otterloo & Co. LLC (the "Manager" or "GMO"). The Trust was established as a Massachusetts business trust under the laws of The Commonwealth of Massachusetts on June 24, 1985. The Declaration of Trust permits the Trustees of the Trust ("Trustees") to create an unlimited number of series of shares ("Funds") and to subdivide Funds into classes.
The Fund seeks long-term capital growth. The Fund seeks to achieve its objective by outperforming the Russell 2500 Growth Index. The Fund typically makes equity investments in U.S. companies that issue stocks included in the Russell 2500 Index, and in companies with similar market capitalizations.
2. Significant accounting policies
The following is a summary of significant accounting policies followed by the Fund in the preparation of its financial statements. These policies are in conformity with accounting principles generally accepted in the United States of America ("U.S. GAAP") and have been consistently followed by the Fund in preparing its financial statements. The preparation of financial statements in accordance with U.S. GAAP requires management to make estimates and assumptions that affect the reported amounts and disclosures in the financial statements. Actual results could differ from those estimates. The accounting records of the Fund are maintained in U.S. dollars.
Portfolio valuation
Securities listed on a securities exchange for which market quotations are readily available are valued at the last sale price or official closing price on each business day, or if there is no such reported sale or official closing price, at the most recent quoted bid price. Unlisted securities for which market quotations are readily available are generally valued at the most recent quoted bid price. Debt instruments with a remaining maturity of sixty days or less are generally valued at amortized cost, which approximates fair value. Shares of investment funds are generally valued at their net asset value. Securities for which quotations are not readily available or whose values the Manager has determined to be unreliable are valued at fair value as determined in good faith by the Trustees or persons acting at their direction pursuant to procedures approved by the Trustees. By its nature, a fair value price is a good faith estim ate of the value of a security at a given point in time and may not reflect the value that would be realized if the security were sold. The difference between a fair value price and the value realized upon a sale could be material.
In September 2006, the Financial Accounting Standards Board ("FASB") issued Statement of Financial Accounting Standards No. 157, Fair Value Measurements ("SFAS 157"). SFAS 157 is effective for the Fund's current fiscal year. While the adoption of SFAS 157 does not have an effect on
19
GMO U.S. Small/Mid Cap Growth Fund
(A Series of GMO Trust)
Notes to Financial Statements — (Continued)
February 28, 2009
the Fund's net asset value, it does require additional disclosures about fair value measurements. SFAS 157 establishes a three-level hierarchy for disclosure of fair value measurements. The valuation hierarchy is based upon the reliability of inputs to the valuation of the Fund's investments. The three levels are defined as follows:
Level 1 – Valuations based on quoted prices for identical securities in active markets.
Level 2 – Valuations determined using other significant direct or indirect observable inputs.
Level 3 – Valuations based on inputs that are unobservable and significant.
The inputs or methodology used for valuing securities are not necessarily an indication of the risk associated with investing in those securities.
The following is a summary of the fair valuations according to inputs used as of February 28, 2009 in valuing the Fund's investments:
| Asset Valuation Inputs | Investments in Securities | Other Financial Instruments | |||||||||
| Level 1 - Quoted Prices | $ | 3,841,094 | $ | — | |||||||
| Level 2 - Other Significant Observable Inputs | 101,885 | — | |||||||||
| Level 3 - Significant Unobservable Inputs | — | — | |||||||||
| Total | $ | 3,942,979 | $ | — | |||||||
| Liability Valuation Inputs | Investments in Securities | Other Financial Instruments* | |||||||||
| Level 1 - Quoted Prices | $ | — | $ | (11,554 | ) | ||||||
| Level 2 - Other Significant Observable Inputs | — | — | |||||||||
| Level 3 - Significant Unobservable Inputs | — | — | |||||||||
| Total | $ | — | $ | (11,554 | ) | ||||||
* Other financial instruments include futures contracts.
The Fund held no investments or other financial instruments at either February 29, 2008 or February 28, 2009, whose fair value was determined using Level 3 inputs.
Futures contracts
The Fund may purchase and sell futures contracts. Upon entering into a futures contract, the Fund is required to deposit cash, U.S. government and agency obligations, or other liquid assets with the futures
20
GMO U.S. Small/Mid Cap Growth Fund
(A Series of GMO Trust)
Notes to Financial Statements — (Continued)
February 28, 2009
clearing broker in accordance with the initial margin requirements of the broker or exchange. In addition, the Fund maintains cash or securities in an amount that at least equals the net amount payable in the event the Fund must deliver the full amount of the contract. Futures contracts are marked to market daily and an appropriate payable or receivable for the change in value ("variation margin") is recorded by the Fund. The payable or receivable is settled on the following business day. Gains or losses are recognized but not considered realized until the contracts expire or are closed. Futures contracts involve, to varying degrees, risk of loss in excess of the variation margin disclosed in the Statement of Assets and Liabilities. Under some circumstances, futures exchanges may establish daily limits on the amount that the price of a futures contract can vary from the previous day's settlement price, thereby effectively preven ting liquidation of unfavorable positions. Losses may arise from changes in the value of the underlying instrument if the Fund is unable to liquidate a futures position due to an illiquid secondary market for the contract or the imposition of price limits, or if counterparties do not perform under the contract terms. Futures contracts are generally valued at the settlement price established each day by the board of trade or exchange on which they are traded. Futures contracts outstanding at the end of the period are listed in the Fund's Schedule of Investments.
Swap agreements
The Fund may enter into various types of swap agreements, including without limitation, interest rate, total return, credit default and variance swap agreements. A swap agreement is an agreement to exchange the return generated by one instrument for the return generated by another instrument. When entering into a swap agreement, the Fund and/or the swap counterparty may post or receive cash or securities as collateral. The party posting the collateral typically receives the interest associated with or payments related to the collateral and has the risk of loss related to the collateral.
Interest rate swap agreements involve an exchange by the parties of their respective commitments to pay or right to receive interest, e.g., an exchange of floating rate interest payments for fixed rate interest payments with respect to the notional amount of principal.
Total return swap agreements involve a commitment by one party to pay interest to the other party in exchange for a payment to it from the other party based on the return of a reference instrument (e.g., a security or basket of securities), both based on notional amounts. To the extent the return of the reference instrument exceeds or falls short of the interest payments, one party will receive a payment from or make a payment to the other party.
In a credit default swap agreement, one party makes payments to another party in exchange for the right to receive a specified return if a credit event occurs with respect to a referenced entity or entities. Buying credit default protection reduces the buyer's exposure in the event of an issuer's default (e.g., it reduces risk where a party owns a security issued by or otherwise has exposure to the issuer). Selling credit default protection subjects the seller to exposure to an issuer's default. A seller of credit default protection receives payments in return for its obligation to pay the principal amount of a debt security (or other
21
GMO U.S. Small/Mid Cap Growth Fund
(A Series of GMO Trust)
Notes to Financial Statements — (Continued)
February 28, 2009
agreed-upon value) to the other party upon the occurrence of a credit event (e.g., issuer default or similar event). If no credit event occurs, the seller has no payment obligations. For credit default swap agreements on asset-backed securities, a credit event may be triggered by such events as the issuer's failure to pay interest or principal, an agreement of the holders of an asset-backed security to a maturity extension, a rating downgrade on the security or a write-down on the collateral underlying the security. For credit default swap agreements on corporate or sovereign issuers, a credit event may be triggered by such events as the issuer's bankruptcy, failure to pay interest or principal, repudiation/moratorium or restructuring.
Variance swap agreements involve an agreement by two parties to exchange cash flows based on the measured variance (or square of volatility) of a specified underlying asset. One party agrees to exchange a "fixed rate" or strike price payment for the "floating rate" or realized price variance on the underlying asset with respect to the notional amount. At inception, the strike price chosen is generally fixed at a level such that the fair value of the swap is zero. At the expiration date, the amount paid by one party to the other is the difference between the realized price variance of the underlying asset and the strike price multiplied by the notional amount. A receiver of the realized price variance would receive a payment when the realized price variance of the underlying asset is greater than the strike price and would make a payment when that variance is less than the strike price. A payer of the realized price variance woul d make a payment when the realized price variance of the underlying asset is greater than the strike price and would receive a payment when that variance is less than the strike price. This type of agreement is essentially a forward contract on the future realized price variance of the underlying asset.
The Fund prices its swap agreements daily using models that may incorporate quotations from market makers and records the change in value, if any, as unrealized gain or loss in the Statement of Operations. Payments received or made on swap agreements are recorded as realized gain or loss in the Statement of Operations. Gains or losses are realized upon termination of the swap agreements.
Swap agreements often are not actively traded on financial markets. The values assigned to them may differ significantly from the values that would be realized upon termination, and the differences could be material. Entering into swap agreements involves credit, legal, market and documentation risk that is not reflected in the amounts reported in the Statement of Assets and Liabilities. Such risks include the possibility that the party with whom the Fund contracts may default on its obligations to perform or disagree as to the meaning of contractual terms, or that the collateral that party posts may be insufficient or not timely received by the Fund. Credit risk may be particularly acute in an environment where financial services firms are exposed to systemic risks of the type evidenced by the insolvency of Lehman Brothers and subsequent market disruptions. The Fund had no swap agreements outstanding at the end of the period.
Repurchase agreements
The Fund may enter into repurchase agreements. Under a repurchase agreement the Fund acquires a security for cash and obtains a simultaneous commitment from the seller to repurchase the security at an agreed upon price and date. The Fund, through its custodian, takes possession of securities collateralizing
22
GMO U.S. Small/Mid Cap Growth Fund
(A Series of GMO Trust)
Notes to Financial Statements — (Continued)
February 28, 2009
the repurchase agreement. The collateral is marked to market daily to ensure that the market value of the underlying assets is at least equal to the amount owed to the Fund in the event of default by the seller. If the seller of a repurchase agreement defaults or enters into insolvency proceedings and the value of the collateral declines, the Fund's recovery of cash may be delayed or limited. The Fund had no repurchase agreements outstanding at the end of the period.
Securities lending
The Fund may lend its securities to qualified brokers. The loans are collateralized with cash or liquid securities with a market value at least equal to the market value of the securities upon entering into the loan. As with other extensions of credit, the Fund may bear the risk of loss with respect to the investment of the collateral, the risk of delay in and/or inability to exercise its rights with respect to the collateral, and the risk of delay in recovery or loss of rights in the loaned securities should the borrower of the securities fail financially. If a loan is collateralized by U.S. government securities, the Fund receives a fee from the borrower. If a loan is collateralized by cash, the Fund typically invests the cash collateral for its own account. For the year from March 1, 2008 through February 28, 2009, the Fund did not participate in securities lending.
Taxes and distributions
The Fund intends to qualify each tax year as a regulated investment company under Subchapter M of the Internal Revenue Code of 1986, as amended (the "Code"). The Fund intends to distribute substantially all of its net investment income and all of its net realized short-term and long-term capital gain, if any, after giving effect to any available capital loss carryforwards for U.S. federal income tax purposes. Therefore, no provision for U.S. federal income or excise tax is necessary.
The Fund's policy is to declare and pay distributions from net investment income, if any, quarterly, and from net realized short-term and long-term capital gain, if any, at least annually. All distributions are paid in shares of the Fund, at net asset value, unless the shareholder elects to receive cash distributions. Distributions to shareholders are recorded by the Fund on the ex-dividend date.
Income and capital gain distributions are determined in accordance with U.S. federal income tax regulations, which may differ from U.S. GAAP. Certain capital accounts in the financial statements are periodically adjusted for permanent differences in order to reflect their tax character. These adjustments have no impact on net assets or net asset value per share. Temporary differences that arise from recognizing certain items of income, expense, gain or loss in different periods for financial statement and tax purposes will reverse at some time in the future. Distributions in excess of net investment income or net realized gains are temporary over-distributions for financial statement purposes resulting from differences in the recognition or classification of income or distributions for financial statement and tax purposes.
23
GMO U.S. Small/Mid Cap Growth Fund
(A Series of GMO Trust)
Notes to Financial Statements — (Continued)
February 28, 2009
U.S. GAAP and tax accounting differences primarily relate to capital loss carryforwards, losses on wash sale transactions, derivative contract transactions and post-October capital losses.
The following reclassification represents the amount necessary to report the stated components of net assets on a tax basis, excluding certain temporary differences, as of February 28, 2009. The financial highlights exclude these adjustments.
| Accumulated Undistributed Net Investment Income | Accumulated Net Realized Loss | Paid-in Capital | |||||||||
| $ | (420 | ) | $ | (26 | ) | $ | 446 | ||||
The tax character of distributions declared to shareholders is as follows:
| 2/28/2009 | 2/29/2008 | ||||||||||
| Ordinary income (including any net short-term capital gain) | $ | 22,611 | $ | 1,413,260 | |||||||
| Net long-term capital gain | — | 1,803,683 | |||||||||
| Total distributions | $ | 22,611 | $ | 3,216,943 | |||||||
| Tax return of capital | — | 44,360 | |||||||||
| Total distributions | $ | 22,611 | $ | 3,261,303 | |||||||
Distributions in excess of tax basis earnings and profits, if significant, are reported in the financial statements as a return of capital for tax purposes.
As of February 28, 2009, the components of distributable earnings on a tax basis consisted of the following:
| Undistributed ordinary income (including any net short-term capital gain) | $ | 126 | |||||
As of February 28, 2009, the Fund elected to defer to March 1, 2009 post-October capital losses of $830,507.
As of February 28, 2009, the Fund had capital loss carryforwards available to offset future realized gains if any, to the extent permitted by the Code. Utilization of the capital loss carryforwards could be subject to limitations imposed by the Code related to share ownership activity. Such losses expire as follows:
| 2/28/2017 | $ | (1,886,733 | ) | ||||
| Total | $ | (1,886,733 | ) | ||||
24
GMO U.S. Small/Mid Cap Growth Fund
(A Series of GMO Trust)
Notes to Financial Statements — (Continued)
February 28, 2009
As of February 28, 2009, the approximate cost for U.S. federal income tax purposes and gross and net unrealized appreciation (depreciation) in value of investments were as follows:
| Aggregate Cost | Gross Unrealized Appreciation | Gross Unrealized (Depreciation) | Net Unrealized Appreciation (Depreciation) | ||||||||||||
| $ | 6,185,951 | $ | 30,818 | $ | (2,273,790 | ) | $ | (2,242,972 | ) | ||||||
The Fund is subject to the provisions of Financial Accounting Standards Board Interpretation No. 48 ("FIN 48"), Accounting for Uncertainty in Income Taxes — an Interpretation of FASB Statement No. 109. FIN 48 sets forth a minimum threshold for financial statement recognition of a tax position taken or expected to be taken in a tax return that could affect the Fund's financial statements. The Fund did not have any unrecognized tax benefits or liabilities at February 28, 2009, nor did it have any increases or decreases in unrecognized tax benefits or liabilities for the period then ended. The Fund is subject to examination prior to the expiration of the statute of limitations by U.S. federal and state tax authorities for tax returns filed.
Security transactions and related investment income
Security transactions in the financial statements are accounted for on the trade date. Dividend income, net of applicable foreign withholding taxes, if any, is recorded on the ex-dividend date or, if later, when the Fund is informed of the ex-dividend date. Interest income is recorded on the accrual basis and is adjusted for the amortization of premiums and accretion of discounts. Principal on inflation indexed securities is adjusted for inflation and any increase or decrease is recorded as interest income or loss. Income is not recognized on securities for which collection is not expected. Non-cash dividends, if any, are recorded at the fair market value of the asset received. In determining the net gain or loss on securities sold, the Fund uses the identified cost basis for the purposes of determining the cost basis.
Expenses
The majority of the expenses of the Trust are directly identifiable to an individual fund. Expenses that are not readily identifiable to a specific fund are allocated taking into consideration, among other things, the nature and type of expense and the relative size of the funds.
State Street Bank and Trust Company ("State Street") serves as custodian, fund accounting agent and transfer agent of the Fund. State Street's fees may be reduced by an earnings allowance calculated on the average daily cash balances the Fund maintains with State Street. The Fund receives the benefit of the earnings allowance. In addition, Goldman Sachs Agency Lending, the Fund's securities lending agent, has agreed to reimburse the Fund for certain transactional expenses related to securities lending activity. Credit balances or expense reimbursements used to reduce fees, if any, are reported as a reduction of expenses in the Statement of Operations.
25
GMO U.S. Small/Mid Cap Growth Fund
(A Series of GMO Trust)
Notes to Financial Statements — (Continued)
February 28, 2009
Purchases and redemptions of Fund shares
As of February 28, 2009, the premium on cash purchases and fee on cash redemptions of Fund shares were each 0.50% of the amount invested or redeemed. The Fund may impose a new purchase premium and/or redemption fee, or modify or eliminate an existing purchase premium and/or redemption fee, at any time. If the Manager determines that any portion of a cash purchase or redemption is offset by a corresponding cash redemption or purchase on the same day, the Fund will ordinarily waive or reduce the purchase premium or redemption fee with respect to that portion. In addition, the Fund may waive or reduce the purchase premium or redemption fee in extraordinary circumstances if the purchase or redemption will not cause the Fund to incur transaction costs. All purchase premiums and redemption fees are paid to the Fund and recorded by the Fund as paid-in-capital. The Fund will waive or reduce the purchase premium relating to the in-kind p ortion of a purchase transaction except for estimated or known transaction costs (e.g. stamp duties and transfer taxes) incurred by the Fund as a result of the transfer of the purchasing shareholder's securities to the Fund. In-kind redemption transactions are generally not subject to redemption fees except when they include a cash component. However, when a substantial portion of a Fund is being redeemed, the Fund may charge a redemption fee based on estimated or known transaction costs resulting from those redemptions. The Fund charges no premium for reinvested distributions.
Recently issued accounting pronouncement
In March 2008, FASB issued Statement of Financial Accounting Standards No. 161, Disclosures about Derivative Instruments and Hedging Activities ("SFAS 161"). SFAS 161 is effective for fiscal years and interim periods beginning after November 15, 2008. SFAS 161 requires enhanced disclosures about the Fund's derivative and hedging activities. The Manager is currently evaluating the impact the adoption of SFAS 161 will have on the Fund's financial statement disclosures.
3. Fees and other transactions with affiliates
GMO receives a management fee for the services it provides to the Fund. That fee is paid monthly at the annual rate of 0.31% of average daily net assets. The Fund has adopted a Shareholder Service Plan under which the Fund pays GMO a shareholder service fee for client and shareholder service, reporting, and other support. Pursuant to the Shareholder Service Plan, the shareholder service fee is calculated based on average daily net assets at the annual rate of 0.15% for Class III shares.
Through at least June 30, 2009, the Manager has contractually agreed to reimburse the Fund for Fund expenses incurred through that date to the extent the Fund's total annual operating expenses (excluding "Excluded Expenses", as defined below) exceed 0.31% of the Fund's average daily net assets. Excluded Expenses include shareholder service fees, fees and expenses of the independent Trustees of the Trust, fees and expenses for legal services not approved by the Manager for the Trust, compensation and expenses of the Trust's Chief Compliance Officer ("CCO") (excluding any employee benefits), brokerage commissions, securities lending fees and expenses, interest expense, transfer taxes, and other investment-related costs (including expenses associated with investments in
26
GMO U.S. Small/Mid Cap Growth Fund
(A Series of GMO Trust)
Notes to Financial Statements — (Continued)
February 28, 2009
any company that is an investment company or would be an investment company under the 1940 Act, but for the exceptions to the definition of investment company provided in Section 3(c)(1) and 3(c)(7) of the 1940 Act), hedging transaction fees, extraordinary, non-recurring and certain other unusual expenses (including taxes).
The Fund's portion of the fees paid by the Trust to the Trust's independent Trustees and CCO during the year ended February 28, 2009 was $93 and $1, respectively. The compensation and expenses of the CCO are included in miscellaneous expenses in the Statement of Operations. The Fund paid no remuneration to any other officer of the Trust.
4. Purchases and sales of securities
Cost of purchases and proceeds from sales of securities, excluding short-term investments, for the year ended February 28, 2009 aggregated $8,282,074 and $9,258,901, respectively.
5. Guarantees
In the normal course of business the Fund enters into contracts with third-party service providers that contain a variety of representations and warranties and that provide general indemnifications. The Fund's maximum exposure under these arrangements is unknown, as it involves future claims that may be made against the Fund that have not yet occurred. Based on experience, management is of the view that the risk of loss in connection with its indemnification obligations is remote; however, there can be no assurance that such obligations will not result in material liabilities that adversely affect the Fund.
6. Principal shareholders and related parties
As of February 28, 2009, 73.57% of the outstanding shares of the Fund were held by five shareholders, each holding more than 10% of the Fund's outstanding shares. On that date, no other shareholder owned more than 10% of the outstanding shares of the Fund. One of the shareholders is another fund of the Trust. Redemptions from (or investments into) the Fund or on behalf of these large shareholders may have a material effect on the Fund.
As of February 28, 2009, no shares of the Fund were held by senior management of the Manager and GMO Trust officers and 97.01% of the Fund's shares were held by accounts for which the Manager had investment discretion.
27
GMO U.S. Small/Mid Cap Growth Fund
(A Series of GMO Trust)
Notes to Financial Statements — (Continued)
February 28, 2009
7. Share transactions
The Declaration of Trust permits the Trust to issue an unlimited number of shares of beneficial interest (without par value). Transactions in Fund shares were as follows:
| Year Ended February 28, 2009 | Year Ended February 29, 2008 | ||||||||||||||||||
| Class III: | Shares | Amount | Shares | Amount | |||||||||||||||
| Shares sold | 1,626 | $ | 15,144 | 626 | $ | 10,677 | |||||||||||||
| Shares issued to shareholders in reinvestment of distributions | 1,557 | 15,161 | 191,266 | 3,213,436 | |||||||||||||||
| Shares repurchased | (91,318 | ) | (1,266,386 | ) | (925,656 | ) | (15,813,559 | ) | |||||||||||
| Purchase premiums | — | 64 | — | 53 | |||||||||||||||
| Redemption fees | — | 6,320 | — | 79,068 | |||||||||||||||
| Net increase (decrease) | (88,135 | ) | $ | (1,229,697 | ) | (733,764 | ) | $ | (12,510,325 | ) | |||||||||
28
Report of Independent Registered Public Accounting Firm
To the Trustees of GMO Trust and the Shareholders of
GMO U.S. Small/Mid Cap Growth Fund:
In our opinion, the accompanying statement of assets and liabilities, including the schedule of investments, and the related statements of operations and of changes in net assets and the financial highlights present fairly, in all material respects, the financial position of GMO U.S. Small/Mid Cap Growth Fund (the "Fund") at February 28, 2009, the results of its operations for the year then ended, the changes in its net assets for each of the two years in the period then ended and the financial highlights for each of the five years in the period then ended, in conformity with accounting principles generally accepted in the United States of America. These financial statements and financial highlights (hereafter referred to as "financial statements") are the responsibility of the Fund's management. Our responsibility is to express an opinion on these financial statements based on our audits. We conducted our audits of these financ ial statements in accordance with the standards of the Public Company Accounting Oversight Board (United States). Those standards require that we plan and perform the audit to obtain reasonable assurance about whether the financial statements are free of material misstatement. An audit includes examining, on a test basis, evidence supporting the amounts and disclosures in the financial statements, assessing the accounting principles used and significant estimates made by management, and evaluating the overall financial statement presentation. We believe that our audits, which included confirmation of securities at February 28, 2009 by correspondence with the custodian, provide a reasonable basis for our opinion.
PricewaterhouseCoopers LLP
Boston, Massachusetts
April 29, 2009
29
GMO U.S. Small/Mid Cap Growth Fund
(A Series of GMO Trust)
Fund Expenses
February 28, 2009 (Unaudited)
Expense Examples: The following information is in relation to expenses for the six month period ended February 28, 2009.
As a shareholder of the Fund, you may incur two types of costs: (1) transaction costs, and (2) ongoing costs, including management fees, shareholder service fees and other Fund expenses. This example is intended to help you understand your ongoing costs (in dollars) of investing in the Fund and to compare these costs with the ongoing costs of investing in other mutual funds.
These examples are based on an investment of $1,000 invested at the beginning of the period and held for the entire period, September 1, 2008 through February 28, 2009.
Actual Expenses
The first line of the table for each class below provides information about actual account values and actual expenses. You may use the information in this line, together with the amount you invested, to estimate the expenses that you paid over the period. Simply divide your account value by $1,000 (for example, a $10,000,000 account value divided by $1,000 = 10,000), then multiply the result by the number in the first line under the heading entitled "Net Expense Incurred" to estimate the expenses you paid on your account during this period.
Hypothetical Example for Comparison Purposes
The second line of the table for each class below provides information about hypothetical account values and hypothetical expenses based on the Fund's actual expense ratio and an assumed rate of return of 5% per year before expenses, which is not the Fund's actual return. The hypothetical account values and expenses may not be used to estimate the actual ending account balance or expenses you paid for the period. You may use this information to compare the ongoing costs of investing in the Fund with other funds. To do so, compare this 5% hypothetical example with the 5% hypothetical examples that appear in the shareholder reports of other funds.
Please note that the expenses shown in the table are meant to highlight your ongoing costs only and do not reflect any transactional costs. Therefore, the second line of the table is useful in comparing ongoing costs only, and will not help you determine the relative total costs of owning different funds. In addition, if these transactional costs were included, your costs would have been higher.
| Annualized Net Expense Ratio | Beginning Account Value | Ending Account Value | Net Expense Incurred* | ||||||||||||||||
| Class III | |||||||||||||||||||
| 1) Actual | 0.46 | % | $ | 1,000.00 | $ | 530.80 | $ | 1.75 | |||||||||||
| 2) Hypothetical | 0.46 | % | $ | 1,000.00 | $ | 1,022.51 | $ | 2.31 | |||||||||||
* Expenses are calculated using the Class's annualized expense ratio for the six months ended February 28, 2009, multiplied by the average account value over the period, multiplied by 181 days in the period, divided by 365 days in the year.
30
GMO U.S. Small/Mid Cap Growth Fund
(A Series of GMO Trust)
Tax Information for the Tax Year Ended February 28, 2009 (Unaudited)
The Fund will notify shareholders of amounts for use in preparing 2009 income tax forms in January 2010.
For taxable, non-corporate shareholders, 100.00% of the income and short-term capital gains, if any, distributed in the Fund's fiscal year ended February 28, 2009 represents qualified dividend income subject to the 15% rate category.
For corporate shareholders, 100.00% of the income and short-term capital gains, if any, distributed in the Fund's fiscal year ended February 28, 2009 qualified for the dividends-received deduction.
31
Trustees and Officers (Unaudited)
The following tables list the Trust's Trustees and Officers as of the date of this report; their address and date of birth ("DOB"); their position with the Trust; the length of time holding that position with the Trust; their principal occupation(s) during the past five years; the number of portfolios in the fund complex they oversee; and other directorships they hold in companies subject to registration or reporting requirements of the Securities Exchange Act of 1934 (generally called "public companies") or in registered investment companies. The Trust's Statement of Additional Information ("SAI") includes additional information about the Trust's trustees, including changes subsequent to the date of the report. The SAI is available, without charge, upon request by writing GMO, c/o GMO Trust, 40 Rowes Wharf, Boston, MA 02110.
Independent Trustees:
| Name, Address, and DOB | Position(s) Held with Trust | Term of Office1 and Length of Time Served | Principal Occupation(s) During Past Five Years | Number of Portfolios in Fund Complex Overseen by Trustee | Other Directorships Held by Trustee | ||||||||||||||||||
| Donald W. Glazer, Esq. c/o GMO Trust 40 Rowes Wharf Boston, MA 02110 DOB: 07/26/1944 | Chairman of the Board of Trustees | Chairman of the Board of Trustees since March 2005; Lead Independent Trustee (September 2004 – March 2005); Trustee since December 2000. | Consultant – Law and Business2; Author of Legal Treatises. | 59 | None. | ||||||||||||||||||
1 Each Trustee is elected to serve during the continued lifetime of the Trust until he/she dies, resigns or is removed, or if sooner, until the next meeting of Shareholders called for the purpose of electing Trustees and until the election and qualification of his/her successor.
2 As part of Mr. Glazer's work as a consultant, he provides part-time consulting services to Goodwin Procter LLP ("Goodwin"). Goodwin has provided legal services to Renewable Resources, LLC, an affiliate of GMO; GMO, in connection with its relationship with Renewable Resources; and funds managed by Renewable Resources. Mr. Glazer has represented that he has no financial interest in, and is not involved in the provision of, such legal services. In the calendar years ended December 31, 2007 and December 31, 2008, these entities paid $789,416 and $183,864 respectively, in legal fees and disbursements to Goodwin. In correspondence with the Staff of the Securities and Exchange Commission beginning in August 2006, the Independent Trustees' legal counsel provided the Staff with information regarding Mr. Glazer's relationship with Goodwin and h is other business activities. On September 11, 2007, based on information that had been given to the Staff as of that date, the Staff provided oral no-action assurance consistent with the opinion of the Independent Trustees' legal counsel that Mr. Glazer is not an "interested person" of the Trust.
32
Independent Trustees — (Continued)
| Name, Address, and DOB | Position(s) Held with Trust | Term of Office1 and Length of Time Served | Principal Occupation(s) During Past Five Years | Number of Portfolios in Fund Complex Overseen by Trustee | Other Directorships Held by Trustee | ||||||||||||||||||
| W. Nicholas Thorndike c/o GMO Trust 40 Rowes Wharf Boston, MA 02110 DOB: 03/28/1933 | Trustee | Since March 2005. | Director or trustee of various corporations and charitable organizations, including Courier Corporation (a book publisher and manufacturer) (July 1989 – present); Putnam Funds (December 1992 – June 2004); and Providence Journal (a newspaper publisher) (December 1986 – December 2003). | 59 | Director of Courier Corporation (a book publisher and manufacturer); Member of the Investment Committee of Partners HealthCare System, Inc.3 | ||||||||||||||||||
| Peter Tufano c/o GMO Trust 40 Rowes Wharf Boston, MA 02110 DOB: 04/22/1957 | Trustee | Since December 2008. | Sylvan C. Coleman Professor of Financial Management, Harvard Business School (since 1989). | 59 | Trustee of State Street Navigator Securities Lending Trust (3 Portfolios). | ||||||||||||||||||
1 Each Trustee is elected to serve during the continued lifetime of the Trust until he/she dies, resigns or is removed, or if sooner, until the next meeting of Shareholders called for the purpose of electing Trustees and until the election and qualification of his/her successor.
3 Partners HealthCare System, Inc. is a client of the Manager.
33
Principal Officers:
| Name, Address, and DOB | Position(s) Held with Trust | Term of Office4 and Length of Time Served | Principal Occupation(s) During Past Five Years5 | ||||||||||||
| J.B. Kittredge DOB: 08/22/1954 | President and Chief Executive Officer | Since March 2009. | General Counsel, Grantham, Mayo, Van Otterloo & Co. LLC (October 2005 – Present); Partner, Ropes & Gray LLP. | ||||||||||||
| Sheppard N. Burnett c/o GMO Trust 40 Rowes Wharf Boston, MA 02110 DOB: 10/24/1968 | Treasurer and Chief Financial Officer | Chief Financial Officer since March 2007; Treasurer since November 2006; Assistant Treasurer, September 2004 – November 2006. | Fund Administration Staff, Grantham, Mayo, Van Otterloo & Co. LLC (June 2004 – present); Vice President, Director of Tax, Columbia Management Group (2002 – 2004). | ||||||||||||
| Brent C. Arvidson c/o GMO Trust 40 Rowes Wharf Boston, MA 02110 DOB: 06/26/1969 | Assistant Treasurer | Since August 1998. | Senior Fund Administrator, Grantham, Mayo, Van Otterloo & Co. LLC. | ||||||||||||
| John L. Nasrah c/o GMO Trust 40 Rowes Wharf Boston, MA 02110 DOB: 05/27/1977 | Assistant Treasurer | Since March 2007. | Fund Administrator, Grantham, Mayo, Van Otterloo & Co. LLC (September 2004 – present); Tax Analyst, Bain & Company, Inc. (June 2003 – September 2004). | ||||||||||||
| Mahmoodur Rahman c/o GMO Trust 40 Rowes Wharf Boston, MA 02110 DOB: 11/30/1967 | Assistant Treasurer | Since September 2007. | Fund Administrator, Grantham, Mayo, Van Otterloo & Co. LLC (April 2007 – present); Vice President and Senior Tax Manager, Massachusetts Financial Services Company (January 2000 – April 2007). | ||||||||||||
| Michael E. Gillespie c/o GMO Trust 40 Rowes Wharf Boston, MA 02110 DOB: 02/18/1958 | Chief Compliance Officer | Since March 2005. | Vice President of Compliance (June 2004 – February 2005) and Director of Domestic Compliance (March 2002 – June 2004), Fidelity Investments. | ||||||||||||
4 Each officer is elected to hold such office until his or her successor is duly elected and qualified to carry out the duties and responsibilities of the office, or until he or she resigns or is removed from office.
5 Each of Messrs. Burnett, Arvidson, Bohan, and Pottle serves as an officer and/or director of certain pooled investment vehicles of which GMO or an affiliate of GMO serves as the investment adviser.
34
Principal Officers — (Continued)
| Name, Address, and DOB | Position(s) Held with Trust | Term of Office4 and Length of Time Served | Principal Occupation(s) During Past Five Years5 | ||||||||||||
| Jason B. Harrison c/o GMO Trust 40 Rowes Wharf Boston, MA 02110 DOB: 01/29/1977 | Vice President and Clerk | Vice President since November 2006; Clerk since March 2006. | Legal Counsel, Grantham, Mayo, Van Otterloo & Co. LLC (since February 2006) and Attorney, Ropes & Gray LLP (September 2002 – February 2006). | ||||||||||||
| David L. Bohan c/o GMO Trust 40 Rowes Wharf Boston, MA 02110 DOB: 06/21/1964 | Vice President and Assistant Clerk | Vice President since March 2005; Assistant Clerk since March 2006. | Legal Counsel, Grantham, Mayo, Van Otterloo & Co. LLC. | ||||||||||||
| Gregory L. Pottle c/o GMO Trust 40 Rowes Wharf Boston, MA 02110 DOB: 07/09/1971 | Vice President and Assistant Clerk | Since November 2006. | Legal Counsel, Grantham, Mayo, Van Otterloo & Co. LLC. | ||||||||||||
| Anne K. Trinque c/o GMO Trust 40 Rowes Wharf Boston, MA 02110 DOB: 04/15/1978 | Vice President and Assistant Clerk | Since September 2007. | Legal Counsel, Grantham, Mayo, Van Otterloo & Co. LLC (January 2007 – present); Attorney, Goodwin Procter LLP (September 2003 – January 2007). | ||||||||||||
| Cheryl Wakeham c/o GMO Trust 40 Rowes Wharf Boston, MA 02110 DOB: 10/29/1958 | Vice President and Anti-Money Laundering Officer | Since December 2004. | Manager, Client Service Administration, Grantham, Mayo, Van Otterloo & Co. LLC. | ||||||||||||
4 Each officer is elected to hold such office until his or her successor is duly elected and qualified to carry out the duties and responsibilities of the office, or until he or she resigns or is removed from office.
5 Each of Messrs. Burnett, Arvidson, Bohan, and Pottle serves as an officer and/or director of certain pooled investment vehicles of which GMO or an affiliate of GMO serves as the investment adviser.
35
GMO International Core Equity Fund
(A Series of GMO Trust)
Annual Report
February 28, 2009
For a free copy of the Fund's proxy voting guidelines, shareholders may call 1-617-346-7646 (collect) or visit the Securities and Exchange Commission's website at www.sec.gov. Information regarding how the Fund voted proxies relating to portfolio securities during the most recent 12-month period ended June 30 is available on GMO's website at www.gmo.com, or on the Securities and Exchange Commission's website at www.sec.gov.
The Fund files its complete schedule of portfolio holdings with the Securities and Exchange Commission for the first and third quarter of each fiscal year on Form N-Q, which is available on the Commission's website at www.sec.gov. The Fund's Form N-Q may be reviewed and copied at the Commission's Public Reference Room in Washington, D.C. Information on the operation of the Public Reference Room may be obtained by calling 1-800-SEC-0330. The Fund has a policy with respect to disclosure of portfolio holdings under which it may also make available on GMO's website at www.gmo.com a complete schedule of portfolio holdings.
This report is prepared for the general information of shareholders. It is authorized for distribution to prospective investors only when preceded or accompanied by a prospectus for the GMO Trust, which contains a complete discussion of the risks associated with an investment in this Fund and other important information. The GMO Trust prospectus can be obtained at www.gmo.com.
GMO International Core Equity Fund
(A Series of GMO Trust)
Portfolio Management
Day-to-day management of the Fund's portfolio is the responsibility of the Quantitative Equity team at Grantham, Mayo, Van Otterloo & Co. LLC.
Management Discussion and Analysis of Fund Performance
The Class III shares of the GMO International Core Equity Fund returned -48.6% for the fiscal year ended February 28, 2009, as compared to -50.2% for the MSCI EAFE Index. Consistent with the Fund's investment objectives and policies, the Fund was invested substantially in international equity securities throughout the period.
Country allocation had a slight positive impact on relative performance. This was the result of the overweight in Germany and holding small cash balances in a falling market.
Sector weightings had a strong positive impact on performance relative to the index. During the period, the Fund's underweight to Financials and overweight to Health Care contributed significantly.
Currency allocation also had a strong positive impact on relative performance as the Fund's underweights in the British pound and Australian dollar and overweights in the Japanese yen and Swiss franc added value. The U.S. dollar strengthened relative to most foreign currencies, which detracted from returns for U.S. investors. The MSCI EAFE Index returned almost 9% more in local currency terms than in U.S. dollars.
Stock selection had mixed results with the Fund's Financials and Industrials particularly weak. Holdings in British financials Royal Bank of Scotland and HBOS and Dutch financial ING Groep were among the most significant detractors. On the positive side were holdings in European pharmaceuticals GlaxoSmithKline, Sanofi-Aventis, and Novartis, all of which outperformed strongly.
Among GMO's international quantitative stock selection disciplines, stocks ranked highly by intrinsic value (with its boost of high quality) outperformed strongly. Those selected by quality-adjusted value outperformed slightly, while those with strong momentum underperformed somewhat.
The views expressed herein are exclusively those of Grantham, Mayo, Van Otterloo & Co. LLC Management as of the date of this report and are subject to change. GMO disclaims any responsibility to update such views. They are not meant as investment advice. References to specific securities are not recommendations of such securities and may not be representative of any GMO portfolio's current or future investments.
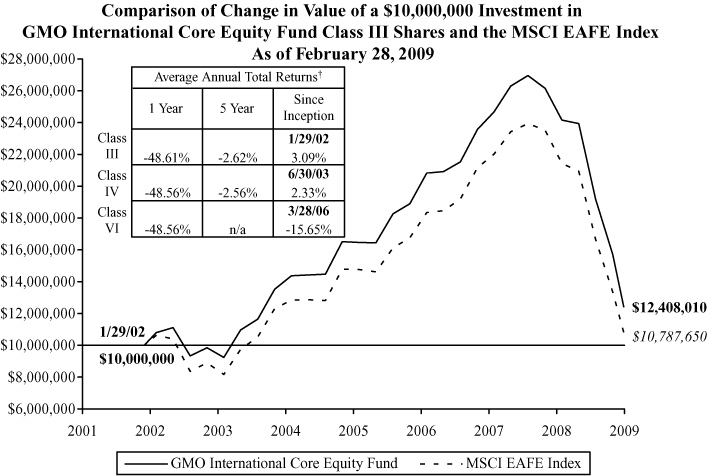
Performance data quoted represents past performance and is not indicative of future results. The investment return and principal value of an investment will fluctuate so that an investor's shares, when redeemed, may be worth more or less than their original cost. Current performance data may be lower or higher than the performance data provided herein. To obtain performance information to the most recent month-end, visit www.gmo.com. Performance shown is net of all fees after reimbursement from the Manager. Returns would have been lower had certain expenses not been reimbursed during the periods shown and do not include the effect of taxes on distributions and redemptions. All information is unaudited. Performance for Classes IV and VI will vary due to different fees.
† The Fund is the successor to the GMO International Disciplined Equity Fund, therefore, performance for the periods prior to September 16, 2005 is that of GMO International Disciplined Equity Fund.
GMO International Core Equity Fund
(A Series of GMO Trust)
Investments Concentration Summary
February 28, 2009 (Unaudited)
| Asset Class Summary | % of Total Net Assets | ||||||
| Common Stocks | 94.7 | % | |||||
| Short-Term Investments | 3.2 | ||||||
| Preferred Stocks | 0.2 | ||||||
| Rights and Warrants | 0.0 | ||||||
| Forward Currency Contracts | (0.2 | ) | |||||
| Futures | (0.6 | ) | |||||
| Other | 2.7 | ||||||
| 100.0 | % | ||||||
| Country Summary | % of Equity Investments | ||||||
| Japan | 28.4 | % | |||||
| United Kingdom | 21.9 | ||||||
| France | 12.3 | ||||||
| Switzerland | 10.2 | ||||||
| Germany | 6.3 | ||||||
| Australia | 2.8 | ||||||
| Italy | 2.5 | ||||||
| Hong Kong | 2.4 | ||||||
| Canada | 2.3 | ||||||
| Netherlands | 2.3 | ||||||
| Finland | 1.7 | ||||||
| Sweden | 1.6 | ||||||
| Singapore | 1.4 | ||||||
| Spain | 1.2 | ||||||
| Denmark | 0.7 | ||||||
| Belgium | 0.6 | ||||||
| Norway | 0.6 | ||||||
| Ireland | 0.5 | ||||||
| Greece | 0.2 | ||||||
| Austria | 0.1 | ||||||
| 100.0 | % | ||||||
1
GMO International Core Equity Fund
(A Series of GMO Trust)
Investments Concentration Summary — (Continued)
February 28, 2009 (Unaudited)
| Industry Sector Summary | % of Equity Investments | ||||||
| Health Care | 17.1 | % | |||||
| Financials | 13.2 | ||||||
| Energy | 12.8 | ||||||
| Consumer Discretionary | 11.6 | ||||||
| Consumer Staples | 11.4 | ||||||
| Materials | 8.0 | ||||||
| Industrials | 7.4 | ||||||
| Telecommunication Services | 7.1 | ||||||
| Utilities | 6.3 | ||||||
| Information Technology | 5.1 | ||||||
| 100.0 | % | ||||||
2
GMO International Core Equity Fund
(A Series of GMO Trust)
Schedule of Investments
(showing percentage of total net assets)
February 28, 2009
| Shares | Description | Value ($) | |||||||||
| COMMON STOCKS — 94.7% | |||||||||||
| Australia — 2.7% | |||||||||||
| 1,089,814 | Australia and New Zealand Banking Group Ltd | 9,128,312 | |||||||||
| 225,992 | BHP Billiton Ltd | 4,069,346 | |||||||||
| 1,328,717 | BlueScope Steel Ltd | 1,861,749 | |||||||||
| 224,165 | CSL Ltd | 5,184,132 | |||||||||
| 1,530,765 | Foster's Group Ltd | 5,359,191 | |||||||||
| 2,434,000 | Incitec Pivot Ltd | 3,315,800 | |||||||||
| 1,918,780 | Mirvac Group Ltd | 1,017,889 | |||||||||
| 583,865 | Origin Energy Ltd | 5,040,184 | |||||||||
| 1,037,449 | Santos Ltd | 10,199,526 | |||||||||
| 2,771,258 | Stockland (REIT) | 4,746,696 | |||||||||
| 714,351 | TABCORP Holdings Ltd | 2,894,689 | |||||||||
| 3,367,924 | Telstra Corp Ltd | 7,590,215 | |||||||||
| 650,743 | Woodside Petroleum Ltd | 14,810,500 | |||||||||
| 495,796 | Woolworths Ltd | 8,238,485 | |||||||||
| Total Australia | 83,456,714 | ||||||||||
| Austria — 0.1% | |||||||||||
| 71,879 | OMV AG | 1,872,492 | |||||||||
| Belgium — 0.6% | |||||||||||
| 102,100 | Belgacom SA | 3,323,263 | |||||||||
| 44,625 | Colruyt SA | 10,116,700 | |||||||||
| 892,761 | Dexia | 1,859,770 | |||||||||
| 1,316,586 | Fortis | 2,169,332 | |||||||||
| Total Belgium | 17,469,065 | ||||||||||
| Canada — 2.2% | |||||||||||
| 164,200 | Agrium Inc | 5,700,923 | |||||||||
| 424,300 | Bank of Montreal | 9,435,189 | |||||||||
| 146,800 | Canadian Natural Resources | 4,719,478 | |||||||||
| 141,900 | Magna International Inc Class A | 3,640,635 | |||||||||
| 464,400 | National Bank of Canada | 13,827,599 | |||||||||
See accompanying notes to the financial statements.
3
GMO International Core Equity Fund
(A Series of GMO Trust)
Schedule of Investments — (Continued)
(showing percentage of total net assets)
February 28, 2009
| Shares | Description | Value ($) | |||||||||
| Canada — continued | |||||||||||
| 100,900 | Petro-Canada | 2,227,065 | |||||||||
| 179,000 | Potash Corp of Saskatchewan Inc | 15,024,068 | |||||||||
| 340,700 | Royal Bank of Canada | 8,280,494 | |||||||||
| 275,300 | Sun Life Financial Inc | 4,308,460 | |||||||||
| Total Canada | 67,163,911 | ||||||||||
| Denmark — 0.7% | |||||||||||
| 205,248 | Novo-Nordisk A/S Class B | 9,994,229 | |||||||||
| 247,288 | Vestas Wind Systems A/S * | 10,767,875 | |||||||||
| Total Denmark | 20,762,104 | ||||||||||
| Finland — 1.6% | |||||||||||
| 270,714 | Fortum Oyj | 4,649,436 | |||||||||
| 230,357 | KCI Konecranes Oyj | 3,730,690 | |||||||||
| 347,981 | Neste Oil Oyj | 4,334,636 | |||||||||
| 1,675,632 | Nokia Oyj | 15,701,209 | |||||||||
| 453,372 | Outokumpu Oyj | 4,586,489 | |||||||||
| 213,591 | Rautaruukki Oyj | 3,544,266 | |||||||||
| 683,523 | Sampo Oyj Class A | 8,989,794 | |||||||||
| 415,098 | Tietoenator Oyj | 5,176,154 | |||||||||
| Total Finland | 50,712,674 | ||||||||||
| France — 11.7% | |||||||||||
| 133,484 | Air Liquide SA | 9,740,655 | |||||||||
| 195,826 | Alstom | 9,188,888 | |||||||||
| 1,012,948 | ArcelorMittal | 19,414,903 | |||||||||
| 694,247 | BNP Paribas | 22,483,315 | |||||||||
| 208,822 | Cap Gemini SA | 5,984,552 | |||||||||
| 110,509 | Casino Guichard-Perrachon SA | 6,827,385 | |||||||||
| 84,390 | Cie de Saint-Gobain | 1,925,117 | |||||||||
| 177,294 | Essilor International SA | 6,118,786 | |||||||||
| 1,249,621 | France Telecom SA | 27,926,243 | |||||||||
| 778,752 | GDF Suez | 24,592,816 | |||||||||
See accompanying notes to the financial statements.
4
GMO International Core Equity Fund
(A Series of GMO Trust)
Schedule of Investments — (Continued)
(showing percentage of total net assets)
February 28, 2009
| Shares | Description | Value ($) | |||||||||
| France — continued | |||||||||||
| 237,562 | �� | Gemalto NV * | 5,978,510 | ||||||||
| 134,758 | Hermes International | 11,379,445 | |||||||||
| 105,742 | L'Oreal SA | 6,802,096 | |||||||||
| 104,796 | Nexans SA | 4,021,352 | |||||||||
| 260,769 | Peugeot SA | 4,437,343 | |||||||||
| 191,589 | Renault SA | 2,751,083 | |||||||||
| 1,462,899 | Sanofi-Aventis | 75,188,796 | |||||||||
| 381,995 | Societe Generale | 11,840,939 | |||||||||
| 878,696 | STMicroelectronics NV | 3,861,455 | |||||||||
| 88,898 | Technip SA | 2,877,344 | |||||||||
| 1,641,392 | Total SA | 77,115,136 | |||||||||
| 319,981 | UbiSoft Entertainment SA * | 4,762,887 | |||||||||
| 91,287 | Unibail-Rodamco (REIT) | 11,460,108 | |||||||||
| 108,072 | Vallourec SA | 8,411,733 | |||||||||
| Total France | 365,090,887 | ||||||||||
| Germany — 5.8% | |||||||||||
| 95,423 | Adidas AG | 2,743,245 | |||||||||
| 40,376 | Allianz SE (Registered) | 2,710,340 | |||||||||
| 172,335 | BASF AG | 4,780,511 | |||||||||
| 237,224 | Bayerische Motoren Werke AG | 5,867,873 | |||||||||
| 187,476 | Bilfinger & Berger AG | 6,427,074 | |||||||||
| 118,732 | Demag Cranes AG | 2,311,770 | |||||||||
| 2,606,581 | Deutsche Telekom AG (Registered) | 31,520,898 | |||||||||
| 313,639 | E.ON AG | 8,065,200 | |||||||||
| 233,694 | GEA Group AG | 2,548,832 | |||||||||
| 385,105 | Hannover Rueckversicherungs AG (Registered) | 13,729,146 | |||||||||
| 434,374 | K&S AG | 19,335,558 | |||||||||
| 267,499 | Kloeckner & Co AG | 2,988,376 | |||||||||
| 20,847 | Linde AG | 1,339,675 | |||||||||
| 33,953 | Muenchener Rueckversicherungs-Gesellschaft AG (Registered) | 4,137,420 | |||||||||
| 226,283 | Norddeutsche Affinerie AG | 5,625,440 | |||||||||
| 54,968 | Q-Cells AG * | 898,123 | |||||||||
See accompanying notes to the financial statements.
5
GMO International Core Equity Fund
(A Series of GMO Trust)
Schedule of Investments — (Continued)
(showing percentage of total net assets)
February 28, 2009
| Shares | Description | Value ($) | |||||||||
| Germany — continued | |||||||||||
| 84,624 | RWE AG | 5,382,395 | |||||||||
| 110,721 | Salzgitter AG | 6,838,363 | |||||||||
| 1,123,350 | SAP AG | 36,087,235 | |||||||||
| 425,891 | SGL Carbon SE * | 9,399,363 | |||||||||
| 352,263 | Suedzucker AG | 6,239,278 | |||||||||
| 128,391 | ThyssenKrupp AG | 2,267,061 | |||||||||
| Total Germany | 181,243,176 | ||||||||||
| Greece — 0.2% | |||||||||||
| 417,152 | National Bank of Greece SA | 5,099,435 | |||||||||
| Hong Kong — 2.3% | |||||||||||
| 3,887,221 | CLP Holdings Ltd | 28,736,439 | |||||||||
| 1,045,300 | Hang Seng Bank Ltd | 11,563,139 | |||||||||
| 3,336,000 | Hong Kong Electric Holdings Ltd | 20,568,153 | |||||||||
| 952,000 | Sun Hung Kai Properties Ltd | 7,383,894 | |||||||||
| 2,113,000 | Yue Yuen Industrial Holdings | 3,919,373 | |||||||||
| Total Hong Kong | 72,170,998 | ||||||||||
| Ireland — 0.4% | |||||||||||
| 437,030 | CRH Plc | 8,975,415 | |||||||||
| 324,709 | DCC Plc | 4,411,239 | |||||||||
| Total Ireland | 13,386,654 | ||||||||||
| Italy — 2.3% | |||||||||||
| 1,243,442 | Bulgari SPA | 5,028,159 | |||||||||
| 722,440 | Enel SPA | 3,590,681 | |||||||||
| 2,694,539 | ENI SPA | 53,781,874 | |||||||||
| 349,132 | Prysmian SPA | 2,867,197 | |||||||||
| 2,739,416 | Telecom Italia SPA | 3,329,812 | |||||||||
| 3,164,161 | UniCredit SPA | 4,007,755 | |||||||||
| Total Italy | 72,605,478 | ||||||||||
See accompanying notes to the financial statements.
6
GMO International Core Equity Fund
(A Series of GMO Trust)
Schedule of Investments — (Continued)
(showing percentage of total net assets)
February 28, 2009
| Shares | Description | Value ($) | |||||||||
| Japan — 26.9% | |||||||||||
| 933,500 | Aiful Corp | 963,560 | |||||||||
| 1,066,300 | Alps Electric Co Ltd | 2,947,095 | |||||||||
| 484,200 | Asahi Breweries Ltd | 6,062,881 | |||||||||
| 447,400 | Astellas Pharma Inc | 14,846,280 | |||||||||
| 304,700 | Bridgestone Corp | 4,149,939 | |||||||||
| 287,700 | Canon Inc | 7,260,706 | |||||||||
| 166,700 | Chubu Electric Power Co Inc | 4,109,971 | |||||||||
| 1,680,600 | Chuo Mitsui Trust Holdings Inc | 5,094,423 | |||||||||
| 5,319 | CyberAgent Inc | 2,418,057 | |||||||||
| 682,550 | Daiei Inc * | 2,123,537 | |||||||||
| 741,000 | Daiichi Chuo Kisen Kaisha | 1,506,999 | |||||||||
| 469,648 | Daiichi Sankyo Co Ltd | 7,545,338 | |||||||||
| 2,860,000 | Daikyo Inc | 1,262,640 | |||||||||
| 402,000 | Daiwabo Co Ltd | 900,510 | |||||||||
| 1,481 | DeNa Co Ltd | 4,355,171 | |||||||||
| 151,800 | Don Quijote Co Ltd | 1,790,968 | |||||||||
| 242,100 | Eisai Co Ltd | 7,417,176 | |||||||||
| 368,800 | FamilyMart Co Ltd | 12,441,223 | |||||||||
| 351,000 | Fast Retailing Co Ltd | 35,257,964 | |||||||||
| 3,317,000 | Fuji Heavy Industries Ltd | 10,569,122 | |||||||||
| 1,964,000 | GS Yuasa Corp | 8,067,125 | |||||||||
| 112,400 | Hikari Tsushin Inc | 1,811,087 | |||||||||
| 3,908,000 | Hitachi Ltd | 9,731,370 | |||||||||
| 2,159,100 | Honda Motor Co Ltd | 51,630,117 | |||||||||
| 1,942 | INPEX Corp | 13,138,160 | |||||||||
| 758,000 | Iseki & Co Ltd * | 1,721,714 | |||||||||
| 733 | Japan Real Estate Investment Corp | 5,456,923 | |||||||||
| 962,000 | Japan Steel Works Ltd (The) | 8,641,686 | |||||||||
| 219,300 | JFE Holdings Inc | 4,745,194 | |||||||||
| 538,000 | JGC Corp | 6,131,618 | |||||||||
| 1,572,000 | Kajima Corp | 3,286,096 | |||||||||
| 1,058 | Kakaku.com Inc | 3,120,408 | |||||||||
| 862,000 | Kao Corp | 16,381,604 | |||||||||
| 2,344,000 | Kawasaki Kisen Kaisha Ltd | 7,368,991 | |||||||||
See accompanying notes to the financial statements.
7
GMO International Core Equity Fund
(A Series of GMO Trust)
Schedule of Investments — (Continued)
(showing percentage of total net assets)
February 28, 2009
| Shares | Description | Value ($) | |||||||||
| Japan — continued | |||||||||||
| 5,671 | Kenedix Inc * | 392,053 | |||||||||
| 13,946 | KK daVinci Holdings * | 349,595 | |||||||||
| 484,600 | Konami Corp | 6,840,419 | |||||||||
| 204,900 | Kyushu Electric Power Co Inc | 4,852,595 | |||||||||
| 241,300 | Lawson Inc | 10,448,729 | |||||||||
| 2,240,000 | Marubeni Corp | 6,954,149 | |||||||||
| 830,000 | Matsui Securities Co Ltd | 4,745,010 | |||||||||
| 4,810,000 | Mazda Motor Corp | 6,076,953 | |||||||||
| 942,000 | Meiji Dairies Corp | 3,560,532 | |||||||||
| 1,314,300 | Mitsubishi Corp | 16,351,837 | |||||||||
| 4,474,000 | Mitsubishi Heavy Industries Ltd | 12,526,934 | |||||||||
| 2,035,000 | Mitsubishi UFJ Financial Group Inc | 9,193,365 | |||||||||
| 150,120 | Mitsubishi UFJ Lease & Finance Co Ltd | 2,612,456 | |||||||||
| 899,000 | Mitsui OSK Lines Ltd | 4,556,747 | |||||||||
| 9,794,500 | Mizuho Financial Group Inc | 18,460,578 | |||||||||
| 419,000 | Nikon Corp | 3,928,031 | |||||||||
| 33,000 | Nintendo Co Ltd | 9,421,484 | |||||||||
| 802 | Nippon Building Fund Inc | 6,486,415 | |||||||||
| 955,000 | Nippon Denko Co Ltd | 2,616,932 | |||||||||
| 2,668,000 | Nippon Light Metal | 1,831,296 | |||||||||
| 781,000 | Nippon Meat Packers Inc | 7,560,211 | |||||||||
| 3,332,000 | Nippon Mining Holdings Inc | 11,572,506 | |||||||||
| 2,965,000 | Nippon Oil Corp | 14,130,684 | |||||||||
| 170,700 | Nippon Paper Group Inc | 3,783,947 | |||||||||
| 1,559,000 | Nippon Sheet Glass | 3,082,138 | |||||||||
| 745,800 | Nippon Telegraph & Telephone Corp | 31,890,004 | |||||||||
| 1,040,500 | Nippon Yakin Koguo Co Ltd | 2,003,328 | |||||||||
| 1,830,000 | Nippon Yusen KK | 7,549,045 | |||||||||
| 6,328,900 | Nissan Motor Co | 19,320,515 | |||||||||
| 18,209 | NTT Docomo Inc | 28,366,350 | |||||||||
| 1,195,000 | Obayashi Corp | 5,024,265 | |||||||||
| 1,933,000 | OJI Paper Co Ltd | 7,149,472 | |||||||||
| 179,000 | Ono Pharmaceutical Co Ltd | 8,286,193 | |||||||||
| 263,040 | ORIX Corp | 5,343,422 | |||||||||
See accompanying notes to the financial statements.
8
GMO International Core Equity Fund
(A Series of GMO Trust)
Schedule of Investments — (Continued)
(showing percentage of total net assets)
February 28, 2009
| Shares | Description | Value ($) | |||||||||
| Japan — continued | |||||||||||
| 5,698,000 | Osaka Gas Co Ltd | 20,373,204 | |||||||||
| 1,207,000 | Pacific Metals Co Ltd | 4,623,328 | |||||||||
| 946,500 | Panasonic Corp | 10,958,777 | |||||||||
| 76,730 | Point Inc | 3,138,487 | |||||||||
| 907,800 | Resona Holdings Inc | 15,565,155 | |||||||||
| 516,000 | Ricoh Company Ltd | 5,828,588 | |||||||||
| 70,300 | Rohm Co Ltd | 3,357,707 | |||||||||
| 107,400 | Ryohin Keikaku Co Ltd | 3,779,080 | |||||||||
| 219,400 | Sankyo Co Ltd | 9,846,546 | |||||||||
| 6,414,000 | Sanyo Electric Co Ltd * | 9,003,115 | |||||||||
| 418,000 | Seiko Epson Corp | 4,782,142 | |||||||||
| 1,712,700 | Seven & I Holdings Co Ltd | 37,956,579 | |||||||||
| 602,000 | Shin-Etsu Chemical Co Ltd | 26,802,012 | |||||||||
| 7,348,300 | Sojitz Corp | 8,257,947 | |||||||||
| 763,600 | SUMCO Corp | 9,461,232 | |||||||||
| 2,330,000 | Taisei Corp | 4,125,130 | |||||||||
| 312,000 | Taisho Pharmaceutical Co Ltd | 5,600,582 | |||||||||
| 422,400 | Takeda Pharmaceutical Co Ltd | 17,060,663 | |||||||||
| 802,130 | Takefuji Corp | 2,648,268 | |||||||||
| 955,000 | Tokai Carbon Co Ltd | 2,995,100 | |||||||||
| 320,800 | Tokio Marine Holdings Inc | 7,285,673 | |||||||||
| 839,600 | Tokyo Electric Power Co Inc (The) | 23,701,944 | |||||||||
| 3,217,000 | Tokyo Gas Co Ltd | 12,887,125 | |||||||||
| 764,700 | Tokyo Steel Manufacturing Co | 7,518,141 | |||||||||
| 358,000 | TonenGeneral Sekiyu KK | 3,382,744 | |||||||||
| 85,000 | Toyo Suisan Kaisha Ltd | 2,011,660 | |||||||||
| 247,600 | Toyota Motor Corp | 7,930,540 | |||||||||
| 1,004,000 | UNY Co Ltd | 7,342,880 | |||||||||
| 19,030 | USS Co Ltd | 767,700 | |||||||||
| Total Japan | 840,515,892 | ||||||||||
| Netherlands — 2.2% | |||||||||||
| 2,910,504 | Aegon NV | 10,358,720 | |||||||||
| 456,639 | Heineken NV | 12,192,589 | |||||||||
See accompanying notes to the financial statements.
9
GMO International Core Equity Fund
(A Series of GMO Trust)
Schedule of Investments — (Continued)
(showing percentage of total net assets)
February 28, 2009
| Shares | Description | Value ($) | |||||||||
| Netherlands — continued | |||||||||||
| 2,561,556 | ING Groep NV | 11,578,974 | |||||||||
| 248,831 | Koninklijke Ahold NV | 2,761,056 | |||||||||
| 463,184 | Koninklijke DSM NV | 10,585,364 | |||||||||
| 206,531 | OCE NV | 522,403 | |||||||||
| 385,969 | Reed Elsevier NV | 4,288,430 | |||||||||
| 448,420 | TomTom NV * | 1,587,038 | |||||||||
| 449,420 | Unilever NV | 8,611,463 | |||||||||
| 96,005 | Wereldhave NV | 6,449,212 | |||||||||
| Total Netherlands | 68,935,249 | ||||||||||
| Norway — 0.6% | |||||||||||
| 349,800 | DnB NOR ASA | 1,258,299 | |||||||||
| 640,700 | StatoilHydro ASA | 10,637,332 | |||||||||
| 568,500 | Tandberg ASA | 7,261,127 | |||||||||
| Total Norway | 19,156,758 | ||||||||||
| Singapore — 1.3% | |||||||||||
| 418,200 | MobileOne Ltd | 419,808 | |||||||||
| 2,968,000 | Oversea-Chinese Banking Corp Ltd | 8,479,342 | |||||||||
| 2,770,000 | Singapore Exchange Ltd | 7,985,260 | |||||||||
| 9,990,000 | Singapore Telecommunications | 15,722,591 | |||||||||
| 1,259,000 | United Overseas Bank Ltd | 8,022,541 | |||||||||
| Total Singapore | 40,629,542 | ||||||||||
| Spain — 1.1% | |||||||||||
| 473,490 | Banco Santander SA | 2,892,506 | |||||||||
| 988,129 | Iberdrola SA | 6,425,853 | |||||||||
| 167,473 | Inditex SA | 6,282,326 | |||||||||
| 1,308,309 | Mapfre SA | 2,659,745 | |||||||||
| 628,639 | Repsol YPF SA | 9,601,739 | |||||||||
| 369,162 | Telefonica SA | 6,794,077 | |||||||||
| Total Spain | 34,656,246 | ||||||||||
See accompanying notes to the financial statements.
10
GMO International Core Equity Fund
(A Series of GMO Trust)
Schedule of Investments — (Continued)
(showing percentage of total net assets)
February 28, 2009
| Shares | Description | Value ($) | |||||||||
| Sweden — 1.5% | |||||||||||
| 882,150 | Boliden AB | 2,427,188 | |||||||||
| 614,620 | Electrolux AB Series B | 4,181,687 | |||||||||
| 509,628 | Hennes & Mauritz AB Class B | 18,904,235 | |||||||||
| 868,906 | Investor AB Class B | 9,807,826 | |||||||||
| 439,871 | Nordea Bank AB | 2,193,143 | |||||||||
| 287,881 | SKF AB Class B | 2,399,731 | |||||||||
| 531,566 | Svenska Handelsbanken AB Class A | 6,362,090 | |||||||||
| 817,433 | Swedbank AB | 2,113,796 | |||||||||
| Total Sweden | 48,389,696 | ||||||||||
| Switzerland — 9.7% | |||||||||||
| 435,425 | ABB Ltd * | 5,256,142 | |||||||||
| 133,618 | Actelion Ltd (Registered) * | 6,319,000 | |||||||||
| 158,692 | Baloise Holding Ltd | 8,986,415 | |||||||||
| 274,232 | Compagnie Financiere Richemont SA Class A | 3,621,733 | |||||||||
| 2,485,765 | Nestle SA (Registered) | 81,260,728 | |||||||||
| 3,324,358 | Novartis AG (Registered) | 121,283,583 | |||||||||
| 212,425 | Roche Holding AG (Non Voting) | 24,113,965 | |||||||||
| 49,565 | Swatch Group AG | 5,513,381 | |||||||||
| 114,373 | Syngenta AG (Registered) | 24,450,383 | |||||||||
| 91,269 | Synthes Inc | 10,591,339 | |||||||||
| 1,195,995 | UBS AG (Registered) * | 11,199,220 | |||||||||
| Total Switzerland | 302,595,889 | ||||||||||
| United Kingdom — 20.8% | |||||||||||
| 2,061,415 | 3i Group Plc | 5,866,240 | |||||||||
| 1,316,987 | AMEC Plc | 10,173,045 | |||||||||
| 2,062,869 | AstraZeneca Plc | 65,417,291 | |||||||||
| 605,978 | BAE Systems Plc | 3,199,233 | |||||||||
| 5,624,333 | Barclays Plc | 7,378,665 | |||||||||
| 773,962 | BBA Aviation Plc | 769,066 | |||||||||
| 121,383 | Berkeley Group Holdings Plc (Unit Shares) * | 1,500,781 | |||||||||
| 4,290,547 | BG Group Plc | 61,330,721 | |||||||||
| 467,257 | BHP Billiton Plc | 7,282,120 | |||||||||
See accompanying notes to the financial statements.
11
GMO International Core Equity Fund
(A Series of GMO Trust)
Schedule of Investments — (Continued)
(showing percentage of total net assets)
February 28, 2009
| Shares | Description | Value ($) | |||||||||
| United Kingdom — continued | |||||||||||
| 1,508,410 | BP Plc | 9,609,723 | |||||||||
| 1,032,375 | British American Tobacco Plc | 26,387,876 | |||||||||
| 799,016 | Burberry Group Plc | 2,915,385 | |||||||||
| 1,012,231 | Cadbury Plc | 7,706,656 | |||||||||
| 922,925 | Capita Group Plc | 8,709,082 | |||||||||
| 1,015,724 | Centrica Plc | 3,906,177 | |||||||||
| 3,328,028 | Compass Group Plc | 14,621,482 | |||||||||
| 1,187,588 | Diageo Plc | 13,694,376 | |||||||||
| 1,242,683 | Drax Group Plc | 9,180,480 | |||||||||
| 13,524,251 | DSG International Plc | 3,889,689 | |||||||||
| 904,518 | FirstGroup Plc | 3,454,944 | |||||||||
| 1,287,164 | Game Group Plc | 2,675,975 | |||||||||
| 7,824,033 | GlaxoSmithKline Plc | 118,665,543 | |||||||||
| 1,966,803 | Home Retail Group Plc | 5,928,686 | |||||||||
| 1,563,809 | HSBC Holdings Plc | 10,876,514 | |||||||||
| 272,340 | Imperial Tobacco Group Plc | 6,520,347 | |||||||||
| 1,813,596 | Kesa Electricals Plc | 2,727,979 | |||||||||
| 1,635,207 | Kingfisher Plc | 2,930,417 | |||||||||
| 1,721,764 | Ladbrokes Plc | 4,251,174 | |||||||||
| 13,667,932 | Lloyds Banking Group Plc | 11,219,724 | |||||||||
| 570,490 | London Stock Exchange | 3,501,822 | |||||||||
| 783,454 | Michael Page International Plc | 2,401,106 | |||||||||
| 589,229 | Next Plc | 9,771,148 | |||||||||
| 2,479,706 | Northern Foods Plc | 1,648,950 | |||||||||
| 2,879,960 | Old Mutual Plc | 1,692,471 | |||||||||
| 238,180 | Provident Financial Plc | 2,772,394 | |||||||||
| 347,624 | Reckitt Benckiser Group Plc | 13,302,014 | |||||||||
| 445,935 | Rio Tinto Plc | 11,383,448 | |||||||||
| 14,797,653 | Royal Bank of Scotland Group Plc | 4,819,433 | |||||||||
| 567,226 | Royal Dutch Shell Group Class A (Amsterdam) | 12,400,533 | |||||||||
| 1,399,139 | Royal Dutch Shell Plc A Shares (London) | 30,717,120 | |||||||||
| 714,403 | Royal Dutch Shell Plc B Shares (London) | 14,995,915 | |||||||||
| 290,705 | Scottish & Southern Energy Plc | 4,737,176 | |||||||||
| 498,897 | Signet Jewelers Ltd | 3,800,441 | |||||||||
See accompanying notes to the financial statements.
12
GMO International Core Equity Fund
(A Series of GMO Trust)
Schedule of Investments — (Continued)
(showing percentage of total net assets)
February 28, 2009
| Shares | Description | Value ($) | |||||||||
| United Kingdom — continued | |||||||||||
| 636,019 | Smith & Nephew Plc | 4,507,098 | |||||||||
| 258,995 | Spectris Plc | 1,585,851 | |||||||||
| 2,795,756 | Stagecoach Group Plc | 4,598,362 | |||||||||
| 1,943,781 | Tesco Plc | 9,218,306 | |||||||||
| 1,802,618 | Tomkins Plc | 2,895,981 | |||||||||
| 753,808 | Travis Perkins Plc | 3,492,890 | |||||||||
| 1,999,628 | Trinity Mirror Plc | 878,839 | |||||||||
| 403,096 | Unilever Plc | 7,786,897 | |||||||||
| 30,886,294 | Vodafone Group Plc | 54,727,156 | |||||||||
| 585,628 | WH Smith Plc | 2,807,668 | |||||||||
| 2,673,076 | Wolseley Plc | 6,750,815 | |||||||||
| Total United Kingdom | 649,983,225 | ||||||||||
| TOTAL COMMON STOCKS (COST $5,385,837,101) | 2,955,896,085 | ||||||||||
| PREFERRED STOCKS — 0.2% | |||||||||||
| Germany — 0.2% | |||||||||||
| 151,008 | Volkswagen AG 5.36% | 6,766,556 | |||||||||
| TOTAL PREFERRED STOCKS (COST $13,630,996) | 6,766,556 | ||||||||||
| RIGHTS AND WARRANTS — 0.0% | |||||||||||
| France — 0.0% | |||||||||||
| 102,702 | Cie de Saint-Gobain Warrants, Expires 03/06/09 * | 151,033 | |||||||||
| TOTAL RIGHTS AND WARRANTS (COST $590,732) | 151,033 | ||||||||||
See accompanying notes to the financial statements.
13
GMO International Core Equity Fund
(A Series of GMO Trust)
Schedule of Investments — (Continued)
(showing percentage of total net assets)
February 28, 2009
| Par Value ($) | Description | Value ($) | |||||||||
| SHORT-TERM INVESTMENTS — 3.2% | |||||||||||
| 25,428 | Bank of Tokyo-Mitsubishi Time Deposit, 0.08%, due 03/02/09 | 25,428 | |||||||||
| 25,000,000 | BNP Paribas Time Deposit, 0.23%, due 03/02/09 | 25,000,000 | |||||||||
| 46,723 | Brown Brothers Harriman Time Deposit, 0.02%-2.45%, due 03/02/09 | 46,723 | |||||||||
| 4,470,041 | Citibank Time Deposit, 0.05%-2.29%, due 03/02/09 | 4,470,041 | |||||||||
| 235,272 | HSBC Bank (Hong Kong) Time Deposit, 0.01%, due 03/02/09 | 235,272 | |||||||||
| 25,000,000 | HSBC Bank (USA) Time Deposit, 0.19%, due 03/02/09 | 25,000,000 | |||||||||
| 72,376 | JPMorgan Chase Time Deposit, 0.01%, due 03/02/09 | 72,376 | |||||||||
| 17,400,000 | Royal Bank of Canada Time Deposit, 0.20%, due 03/02/09 | 17,400,000 | |||||||||
| 25,637,197 | Societe Generale Time Deposit, 0.25%-0.33%, due 03/02/09 | 25,637,197 | |||||||||
| TOTAL SHORT-TERM INVESTMENTS (COST $97,887,037) | 97,887,037 | ||||||||||
| TOTAL INVESTMENTS — 98.1% (Cost $5,497,945,866) | 3,060,700,711 | ||||||||||
| Other Assets and Liabilities (net) — 1.9% | 59,991,422 | ||||||||||
| TOTAL NET ASSETS — 100.0% | $ | 3,120,692,133 | |||||||||
See accompanying notes to the financial statements.
14
GMO International Core Equity Fund
(A Series of GMO Trust)
Schedule of Investments — (Continued)
February 28, 2009
A summary of outstanding financial instruments at February 28, 2009 is as follows:
Forward Currency Contracts
| Settlement Date | Deliver/Receive | Units of Currency | Value | Net Unrealized Appreciation (Depreciation) | |||||||||||||||
| Buys | |||||||||||||||||||
| 4/24/09 | CAD | 5,859,000 | $ | 4,605,725 | $ | (98,750 | ) | ||||||||||||
| 4/24/09 | CAD | 6,247,000 | 4,910,729 | (65,652 | ) | ||||||||||||||
| 4/24/09 | CHF | 31,165,656 | 26,670,716 | 151,944 | |||||||||||||||
| 4/24/09 | CHF | 31,165,656 | 26,670,716 | 107,644 | |||||||||||||||
| 4/24/09 | CHF | 32,110,070 | 27,478,919 | 78,092 | |||||||||||||||
| 4/24/09 | EUR | 22,557,782 | 28,590,244 | 107,593 | |||||||||||||||
| 4/24/09 | EUR | 22,557,782 | 28,590,244 | 253,609 | |||||||||||||||
| 4/24/09 | GBP | 12,799,462 | 18,321,816 | (222,365 | ) | ||||||||||||||
| 4/24/09 | HKD | 92,032,935 | 11,872,470 | (1,215 | ) | ||||||||||||||
| 4/24/09 | JPY | 2,291,142,592 | 23,501,773 | (1,433,635 | ) | ||||||||||||||
| 4/24/09 | JPY | 2,291,142,592 | 23,501,773 | (1,422,269 | ) | ||||||||||||||
| 4/24/09 | NZD | 38,355,000 | 19,141,280 | (297,072 | ) | ||||||||||||||
| 4/24/09 | SEK | 187,712,160 | 20,839,818 | (693,844 | ) | ||||||||||||||
| 4/24/09 | SEK | 187,712,160 | 20,839,818 | (692,238 | ) | ||||||||||||||
| 4/24/09 | SEK | 187,712,160 | 20,839,818 | (667,321 | ) | ||||||||||||||
| 4/24/09 | SEK | 187,712,160 | 20,839,818 | (639,087 | ) | ||||||||||||||
| 4/24/09 | SEK | 187,712,160 | 20,839,818 | (648,806 | ) | ||||||||||||||
| 4/24/09 | SEK | 187,712,160 | 20,839,818 | (606,505 | ) | ||||||||||||||
| 4/24/09 | SEK | 187,712,160 | 20,839,818 | (433,333 | ) | ||||||||||||||
| $ | 389,735,131 | $ | (7,223,210 | ) | |||||||||||||||
| Sales | |||||||||||||||||||
| 4/24/09 | AUD | 25,115,797 | $ | 16,001,291 | $ | (27,845 | ) | ||||||||||||
| 4/24/09 | AUD | 25,115,797 | 16,001,291 | (47,737 | ) | ||||||||||||||
| 4/24/09 | CAD | 21,452,390 | 16,863,595 | 105,346 | |||||||||||||||
| 4/24/09 | CAD | 21,452,390 | 16,863,595 | 97,229 | |||||||||||||||
| 4/24/09 | CAD | 21,452,390 | 16,863,595 | 79,065 | |||||||||||||||
| 4/24/09 | CAD | 21,452,390 | 16,863,595 | 94,079 | |||||||||||||||
| 4/24/09 | DKK | 55,964,277 | 9,505,860 | (87,911 | ) | ||||||||||||||
| 4/24/09 | DKK | 55,964,277 | 9,505,860 | (90,288 | ) | ||||||||||||||
| 4/24/09 | GBP | 40,149,287 | 57,471,777 | (211,868 | ) | ||||||||||||||
See accompanying notes to the financial statements.
15
GMO International Core Equity Fund
(A Series of GMO Trust)
Schedule of Investments — (Continued)
February 28, 2009
Forward Currency Contracts — continued
| Settlement Date | Deliver/Receive | Units of Currency | Value | Net Unrealized Appreciation (Depreciation) | |||||||||||||||
| 4/24/09 | GBP | 20,074,644 | $ | 28,735,889 | $ | (113,923 | ) | ||||||||||||
| 4/24/09 | GBP | 20,074,644 | 28,735,889 | (110,350 | ) | ||||||||||||||
| 4/24/09 | GBP | 20,074,644 | 28,735,889 | (116,352 | ) | ||||||||||||||
| 4/24/09 | NOK | 58,746,992 | 8,341,939 | 24,164 | |||||||||||||||
| 4/24/09 | NOK | 58,746,992 | 8,341,939 | (22,014 | ) | ||||||||||||||
| 4/24/09 | SGD | 16,173,191 | 10,445,864 | 148,524 | |||||||||||||||
| $ | 289,277,868 | $ | (279,881 | ) | |||||||||||||||
Futures Contracts
| Number of Contracts | Type | Expiration Date | Contract Value | Net Unrealized Appreciation (Depreciation) | |||||||||||||||
| Buys | |||||||||||||||||||
| 264 | DAX | March 2009 | $ | 31,810,892 | $ | (6,408,230 | ) | ||||||||||||
| 61 | MSCI Singapore | March 2009 | 1,494,157 | (22,780 | ) | ||||||||||||||
| 451 | S&P/MIB | March 2009 | 43,246,515 | (13,928,146 | ) | ||||||||||||||
| 455 | TOPIX | March 2009 | 34,918,343 | (3,451,804 | ) | ||||||||||||||
| $ | 111,469,907 | $ | (23,810,960 | ) | |||||||||||||||
| Sales | |||||||||||||||||||
| 103 | FTSE 100 | March 2009 | $ | 5,561,266 | $ | 741,018 | |||||||||||||
| 462 | S&P Toronto 60 | March 2009 | 35,501,588 | 3,173,533 | |||||||||||||||
| $ | 41,062,854 | $ | 3,914,551 | ||||||||||||||||
As of February 28, 2009, for the futures contracts held, the Fund had sufficient cash and/or securities to cover any commitments or margin requirements of the relevant broker or exchange.
See accompanying notes to the financial statements.
16
GMO International Core Equity Fund
(A Series of GMO Trust)
Schedule of Investments — (Continued)
February 28, 2009
Notes to Schedule of Investments:
REIT - Real Estate Investment Trust
* Non-income producing security.
Currency Abbreviations:
AUD - Australian Dollar
CAD - Canadian Dollar
CHF - Swiss Franc
DKK - Danish Krone
EUR - Euro
GBP - British Pound
HKD - Hong Kong Dollar
JPY - Japanese Yen
NOK - Norwegian Krone
NZD - New Zealand Dollar
SEK - Swedish Krona
SGD - Singapore Dollar
See accompanying notes to the financial statements.
17
GMO International Core Equity Fund
(A Series of GMO Trust)
Statement of Assets and Liabilities — February 28, 2009
| Assets: | |||||||
| Investments, at value (cost $5,497,945,866) (Note 2) | $ | 3,060,700,711 | |||||
| Receivable for investments sold | 677,338 | ||||||
| Receivable for Fund shares sold | 37,936,037 | ||||||
| Dividends and interest receivable | 10,662,694 | ||||||
| Foreign taxes receivable | 1,412,245 | ||||||
| Unrealized appreciation on open forward currency contracts (Note 2) | 1,247,289 | ||||||
| Receivable for collateral on open futures contracts (Note 2) | 22,654,710 | ||||||
| Receivable for expenses reimbursed by Manager (Note 3) | 75,964 | ||||||
| Total assets | 3,135,366,988 | ||||||
| Liabilities: | |||||||
| Due to custodian | 6,062 | ||||||
| Payable for investments purchased | 449,367 | ||||||
| Payable for Fund shares repurchased | 1,036,593 | ||||||
| Payable to affiliate for (Note 3): | |||||||
| Management fee | 980,914 | ||||||
| Shareholder service fee | 204,779 | ||||||
| Trustees and Chief Compliance Officer of GMO Trust fees | 12,276 | ||||||
| Payable for variation margin on open futures contracts (Note 2) | 2,089,202 | ||||||
| Unrealized depreciation on open forward currency contracts (Note 2) | 8,750,380 | ||||||
| Miscellaneous payable | 417,299 | ||||||
| Accrued expenses | 727,983 | ||||||
| Total liabilities | 14,674,855 | ||||||
| Net assets | $ | 3,120,692,133 | |||||
See accompanying notes to the financial statements.
18
GMO International Core Equity Fund
(A Series of GMO Trust)
Statement of Assets and Liabilities — February 28, 2009 — (Continued)
| Net assets consist of: | |||||||
| Paid-in capital | $ | 6,071,011,459 | |||||
| Accumulated undistributed net investment income | 39,924,821 | ||||||
| Accumulated net realized loss | (525,638,127 | ) | |||||
| Net unrealized depreciation | (2,464,606,020 | ) | |||||
| $ | 3,120,692,133 | ||||||
| Net assets attributable to: | |||||||
| Class III shares | $ | 855,689,646 | |||||
| Class IV shares | $ | 1,166,164,690 | |||||
| Class VI shares | $ | 1,098,837,797 | |||||
| Shares outstanding: | |||||||
| Class III | 47,144,700 | ||||||
| Class IV | 64,296,997 | ||||||
| Class VI | 60,616,111 | ||||||
| Net asset value per share: | |||||||
| Class III | $ | 18.15 | |||||
| Class IV | $ | 18.14 | |||||
| Class VI | $ | 18.13 | |||||
See accompanying notes to the financial statements.
19
GMO International Core Equity Fund
(A Series of GMO Trust)
Statement of Operations — Year Ended February 28, 2009
| Investment Income: | |||||||
| Dividends (net of withholding taxes of $15,680,741) | $ | 159,953,249 | |||||
| Securities lending income | 3,190,580 | ||||||
| Interest | 2,583,156 | ||||||
| Total investment income | 165,726,985 | ||||||
| Expenses: | |||||||
| Management fee (Note 3) | 17,737,003 | ||||||
| Shareholder service fee – Class III (Note 3) | 1,261,152 | ||||||
| Shareholder service fee – Class IV (Note 3) | 727,244 | ||||||
| Shareholder service fee – Class VI (Note 3) | 1,660,348 | ||||||
| Custodian and fund accounting agent fees | 1,948,916 | ||||||
| Transfer agent fees | 49,945 | ||||||
| Audit and tax fees | 102,533 | ||||||
| Legal fees | 111,095 | ||||||
| Trustees fees and related expenses (Note 3) | 69,308 | ||||||
| Registration fees | 22,060 | ||||||
| Miscellaneous | 76,230 | ||||||
| Total expenses | 23,765,834 | ||||||
| Fees and expenses reimbursed by Manager (Note 3) | (2,276,350 | ) | |||||
| Expense reductions (Note 2) | (26,942 | ) | |||||
| Net expenses | 21,462,542 | ||||||
| Net investment income (loss) | 144,264,443 | ||||||
| Realized and unrealized gain (loss): | |||||||
| Net realized gain (loss) on: | |||||||
| Investments | (433,292,357 | ) | |||||
| Closed futures contracts | (99,183,590 | ) | |||||
| Foreign currency, forward contracts and foreign currency related transactions | 36,480,784 | ||||||
| Net realized gain (loss) | (495,995,163 | ) | |||||
| Change in net unrealized appreciation (depreciation) on: | |||||||
| Investments | (2,397,648,991 | ) | |||||
| Open futures contracts | 3,521,749 | ||||||
| Foreign currency, forward contracts and foreign currency related transactions | (19,687,169 | ) | |||||
| Net unrealized gain (loss) | (2,413,814,411 | ) | |||||
| Net realized and unrealized gain (loss) | (2,909,809,574 | ) | |||||
| Net increase (decrease) in net assets resulting from operations | $ | (2,765,545,131 | ) | ||||
See accompanying notes to the financial statements.
20
GMO International Core Equity Fund
(A Series of GMO Trust)
Statement of Changes in Net Assets
| Year Ended February 28, 2009 | Year Ended February 29, 2008 | ||||||||||
| Increase (decrease) in net assets: | |||||||||||
| Operations: | |||||||||||
| Net investment income (loss) | $ | 144,264,443 | $ | 130,597,450 | |||||||
| Net realized gain (loss) | (495,995,163 | ) | 262,829,020 | ||||||||
| Change in net unrealized appreciation (depreciation) | (2,413,814,411 | ) | (538,336,524 | ) | |||||||
| Net increase (decrease) in net assets from operations | (2,765,545,131 | ) | (144,910,054 | ) | |||||||
| Distributions to shareholders from: | |||||||||||
| Net investment income | |||||||||||
| Class III | (33,600,867 | ) | (15,752,992 | ) | |||||||
| Class IV | (33,761,743 | ) | (13,850,618 | ) | |||||||
| Class VI | (125,844,027 | ) | (70,382,406 | ) | |||||||
| Total distributions from net investment income | (193,206,637 | ) | (99,986,016 | ) | |||||||
| Net realized gains | |||||||||||
| Class III | (7,902,343 | ) | (44,597,287 | ) | |||||||
| Class IV | (7,358,071 | ) | (40,295,188 | ) | |||||||
| Class VI | (28,358,623 | ) | (183,168,178 | ) | |||||||
| Total distributions from net realized gains | (43,619,037 | ) | (268,060,653 | ) | |||||||
| (236,825,674 | ) | (368,046,669 | ) | ||||||||
| Net share transactions (Note 7): | |||||||||||
| Class III | 495,120,468 | 81,033,866 | |||||||||
| Class IV | 741,372,190 | 308,789,561 | |||||||||
| Class VI | (545,537,754 | ) | 2,587,884,351 | ||||||||
| Increase (decrease) in net assets resulting from net share transactions | 690,954,904 | 2,977,707,778 | |||||||||
| Total increase (decrease) in net assets | (2,311,415,901 | ) | 2,464,751,055 | ||||||||
| Net assets: | |||||||||||
| Beginning of period | 5,432,108,034 | 2,967,356,979 | |||||||||
| End of period (including accumulated undistributed net investment income of $39,924,821 and $60,260,648, respectively) | $ | 3,120,692,133 | $ | 5,432,108,034 | |||||||
See accompanying notes to the financial statements.
21
GMO International Core Equity Fund
(A Series of GMO Trust)
Financial Highlights
(For a Class III share outstanding throughout each period)
| Year Ended February 28/29, | |||||||||||||||||||||||
| 2009 | 2008 | 2007 | 2006 | 2005 | |||||||||||||||||||
| Net asset value, beginning of period | $ | 37.25 | $ | 39.38 | $ | 35.23 | $ | 30.81 | $ | 26.75 | |||||||||||||
| Income (loss) from investment operations: | |||||||||||||||||||||||
| Net investment income (loss)† | 0.92 | 1.01 | 0.86 | 0.72 | 0.55 | ||||||||||||||||||
| Net realized and unrealized gain (loss) | (18.54 | ) | (0.51 | ) | 6.06 | 4.79 | 4.54 | ||||||||||||||||
| Total from investment operations | (17.62 | ) | 0.50 | 6.92 | 5.51 | 5.09 | |||||||||||||||||
| Less distributions to shareholders: | |||||||||||||||||||||||
| From net investment income | (1.19 | ) | (0.68 | ) | (0.77 | ) | (0.16 | ) | (0.54 | ) | |||||||||||||
| From net realized gains | (0.29 | ) | (1.95 | ) | (2.00 | ) | (0.93 | ) | (0.49 | ) | |||||||||||||
| Total distributions | (1.48 | ) | (2.63 | ) | (2.77 | ) | (1.09 | ) | (1.03 | ) | |||||||||||||
| Net asset value, end of period | $ | 18.15 | $ | 37.25 | $ | 39.38 | $ | 35.23 | $ | 30.81 | |||||||||||||
| Total Return(a) | (48.61 | )% | 0.69 | % | 20.04 | % | 18.26 | % | 19.20 | % | |||||||||||||
| Ratios/Supplemental Data: | |||||||||||||||||||||||
| Net assets, end of period (000's) | $ | 855,690 | $ | 917,685 | $ | 877,816 | $ | 820,336 | $ | 321,463 | |||||||||||||
| Net expenses to average daily net assets | 0.53 | %(b) | 0.53 | %(b) | 0.53 | % | 0.54 | % | 0.55 | % | |||||||||||||
| Net investment income to average daily net assets | 3.08 | % | 2.44 | % | 2.29 | % | 2.26 | % | 1.98 | % | |||||||||||||
| Portfolio turnover rate | 41 | % | 43 | % | 47 | % | 43 | % | 45 | % | |||||||||||||
| Fees and expenses reimbursed by the Manager to average daily net assets: | 0.05 | % | 0.05 | % | 0.05 | % | 0.10 | % | 0.14 | % | |||||||||||||
(a) The total returns would have been lower had certain expenses not been reimbursed during the periods shown and assumes the effect of reinvested distributions.
(b) The net expense ratio does not include the effect of expense reductions, except for reimbursements related to securities lending transactions (Note 2).
† Calculated using average shares outstanding throughout the period.
See accompanying notes to the financial statements.
22
GMO International Core Equity Fund
(A Series of GMO Trust)
Financial Highlights
(For a Class IV share outstanding throughout each period)
| Year Ended February 28/29, | |||||||||||||||||||||||
| 2009 | 2008 | 2007 | 2006 | 2005 | |||||||||||||||||||
| Net asset value, beginning of period | $ | 37.23 | $ | 39.36 | $ | 35.21 | $ | 30.80 | $ | 26.75 | |||||||||||||
| Income (loss) from investment operations: | |||||||||||||||||||||||
| Net investment income (loss)† | 0.94 | 1.04 | 0.85 | 0.65 | 0.56 | ||||||||||||||||||
| Net realized and unrealized gain (loss) | (18.53 | ) | (0.52 | ) | 6.09 | 4.87 | 4.54 | ||||||||||||||||
| Total from investment operations | (17.59 | ) | 0.52 | 6.94 | 5.52 | 5.10 | |||||||||||||||||
| Less distributions to shareholders: | |||||||||||||||||||||||
| From net investment income | (1.21 | ) | (0.70 | ) | (0.79 | ) | (0.18 | ) | (0.56 | ) | |||||||||||||
| From net realized gains | (0.29 | ) | (1.95 | ) | (2.00 | ) | (0.93 | ) | (0.49 | ) | |||||||||||||
| Total distributions | (1.50 | ) | (2.65 | ) | (2.79 | ) | (1.11 | ) | (1.05 | ) | |||||||||||||
| Net asset value, end of period | $ | 18.14 | $ | 37.23 | $ | 39.36 | $ | 35.21 | $ | 30.80 | |||||||||||||
| Total Return(a) | (48.56 | )% | 0.75 | % | 20.14 | % | 18.31 | % | 19.24 | % | |||||||||||||
| Ratios/Supplemental Data: | |||||||||||||||||||||||
| Net assets, end of period (000's) | $ | 1,166,165 | $ | 947,063 | $ | 711,712 | $ | 1,183,535 | $ | 255,580 | |||||||||||||
| Net expenses to average daily net assets | 0.47 | %(b) | 0.47 | %(b) | 0.47 | % | 0.48 | % | 0.49 | % | |||||||||||||
| Net investment income to average daily net assets | 3.18 | % | 2.51 | % | 2.27 | % | 1.98 | % | 2.01 | % | |||||||||||||
| Portfolio turnover rate | 41 | % | 43 | % | 47 | % | 43 | % | 45 | % | |||||||||||||
| Fees and expenses reimbursed by the Manager to average daily net assets: | 0.05 | % | 0.05 | % | 0.05 | % | 0.11 | % | 0.14 | % | |||||||||||||
(a) The total returns would have been lower had certain expenses not been reimbursed during the periods shown and assumes the effect of reinvested distributions.
(b) The net expense ratio does not include the effect of expense reductions, except for reimbursements related to securities lending transactions (Note 2).
† Calculated using average shares outstanding throughout the period.
See accompanying notes to the financial statements.
23
GMO International Core Equity Fund
(A Series of GMO Trust)
Financial Highlights
(For a Class VI share outstanding throughout each period)
| Year Ended February 28/29, | |||||||||||||||
| 2009 | 2008 | 2007(a) | |||||||||||||
| Net asset value, beginning of period | $ | 37.22 | $ | 39.35 | $ | 36.09 | |||||||||
| Income (loss) from investment operations: | |||||||||||||||
| Net investment income (loss)† | 0.92 | 0.98 | 0.74 | ||||||||||||
| Net realized and unrealized gain (loss) | (18.50 | ) | (0.45 | ) | 5.33 | ||||||||||
| Total from investment operations | (17.58 | ) | 0.53 | 6.07 | |||||||||||
| Less distributions to shareholders: | |||||||||||||||
| From net investment income | (1.22 | ) | (0.71 | ) | (0.81 | ) | |||||||||
| From net realized gains | (0.29 | ) | (1.95 | ) | (2.00 | ) | |||||||||
| Total distributions | (1.51 | ) | (2.66 | ) | (2.81 | ) | |||||||||
| Net asset value, end of period | $ | 18.13 | $ | 37.22 | $ | 39.35 | |||||||||
| Total Return(b) | (48.56 | )% | 0.78 | % | 17.24 | %** | |||||||||
| Ratios/Supplemental Data: | |||||||||||||||
| Net assets, end of period (000's) | $ | 1,098,838 | $ | 3,567,360 | $ | 1,377,829 | |||||||||
| Net expenses to average daily net assets | 0.44 | %(c) | 0.44 | %(c) | 0.44 | %* | |||||||||
| Net investment income to average daily net assets | 3.07 | % | 2.36 | % | 2.11 | %* | |||||||||
| Portfolio turnover rate | 41 | % | 43 | % | 47 | %†† | |||||||||
| Fees and expenses reimbursed by the Manager to average daily net assets: | 0.05 | % | 0.05 | % | 0.05 | %* | |||||||||
(a) Period from March 28, 2006 (commencement of operations) through February 28, 2007.
(b) The total returns would have been lower had certain expenses not been reimbursed during the periods shown and assumes the effect of reinvested distributions.
(c) The net expense ratio does not include the effect of expense reductions, except for reimbursements related to securities lending transactions (Note 2).
† Calculated using average shares outstanding throughout the period.
†† Calculation represents portfolio turnover of the Fund for the year ended February 28, 2007.
* Annualized.
** Not annualized.
See accompanying notes to the financial statements.
24
GMO International Core Equity Fund
(A Series of GMO Trust)
Notes to Financial Statements
February 28, 2009
1. Organization
GMO International Core Equity Fund (the "Fund") is a series of GMO Trust (the "Trust"). The Fund is registered under the Investment Company Act of 1940, as amended, as an open-end, diversified management investment company. The Fund is advised and managed by Grantham, Mayo, Van Otterloo & Co. LLC (the "Manager" or "GMO"). The Trust was established as a Massachusetts business trust under the laws of The Commonwealth of Massachusetts on June 24, 1985. The Declaration of Trust permits the Trustees of the Trust ("Trustees") to create an unlimited number of series of shares ("Funds") and to subdivide Funds into classes.
The Fund seeks high total return. The Fund seeks to achieve its objective by outperforming the MSCI EAFE Index (Europe, Australasia, and Far East). The Fund typically makes equity investments in companies from developed countries, other than the U.S.
Throughout the year ended February 28, 2009, the Fund had three classes of shares outstanding: Class III, Class IV and Class VI. Each class of shares bears a different level of shareholder service fees.
2. Significant accounting policies
The following is a summary of significant accounting policies followed by the Fund in the preparation of its financial statements. These policies are in conformity with accounting principles generally accepted in the United States of America ("U.S. GAAP") and have been consistently followed by the Fund in preparing its financial statements. The preparation of financial statements in accordance with U.S. GAAP requires management to make estimates and assumptions that affect the reported amounts and disclosures in the financial statements. Actual results could differ from those estimates. The accounting records of the Fund are maintained in U.S. dollars.
Portfolio valuation
Securities listed on a securities exchange for which market quotations are readily available are valued at the last sale price or official closing price on each business day, or if there is no such reported sale or official closing price, at the most recent quoted bid price. Unlisted securities for which market quotations are readily available are generally valued at the most recent quoted bid price. Debt instruments with a remaining maturity of sixty days or less are generally valued at amortized cost, which approximates fair value. Shares of investment funds are generally valued at their net asset value. Securities for which quotations are not readily available or whose values the Manager has determined to be unreliable are valued at fair value as determined in good faith by the Trustees or persons acting at their direction pursuant to procedures approved by the Trustees. By its nature, a fair value price is a good faith estim ate of the value of a security at a given point in time and may not reflect the value that would be realized if the security were sold. The difference between a fair value price and the value realized upon a sale could be material. Because many foreign equity securities markets and exchanges close prior to the close of the New York Stock Exchange ("NYSE"), closing prices for foreign securities in those markets or on those exchanges do not reflect the events that
25
GMO International Core Equity Fund
(A Series of GMO Trust)
Notes to Financial Statements — (Continued)
February 28, 2009
occur after that close but before the close of the NYSE. As a result, the Fund generally values foreign equity securities using fair value prices, which are based on adjustments to closing prices supplied by a third party vendor based on that vendor's proprietary models. As of February 28, 2009, 88.78% of the net assets of the Fund were valued using fair value prices based on models used by a third party vendor.
In September 2006, the Financial Accounting Standards Board ("FASB") issued Statement of Financial Accounting Standards No. 157, Fair Value Measurements ("SFAS 157"). SFAS 157 is effective for the Fund's current fiscal year. While the adoption of SFAS 157 does not have an effect on the Fund's net asset value, it does require additional disclosures about fair value measurements. SFAS 157 establishes a three-level hierarchy for disclosure of fair value measurements. The valuation hierarchy is based upon the reliability of inputs to the valuation of the Fund's investments. The three levels are defined as follows:
Level 1 – Valuations based on quoted prices for identical securities in active markets.
Level 2 – Valuations determined using other significant direct or indirect observable inputs.
Level 3 – Valuations based on inputs that are unobservable and significant.
The inputs or methodology used for valuing securities are not necessarily an indication of the risk associated with investing in those securities.
The following is a summary of the fair valuations according to inputs used as of February 28, 2009 in valuing the Fund's investments:
| Asset Valuation Inputs | Investments in Securities | Other Financial Instruments* | |||||||||
| Level 1 - Quoted Prices | $ | 289,956,265 | $ | 3,173,533 | |||||||
| Level 2 - Other Significant Observable Inputs | 2,770,744,446 | 1,988,307 | |||||||||
| Level 3 - Significant Unobservable Inputs | — | — | |||||||||
| Total | $ | 3,060,700,711 | $ | 5,161,840 | |||||||
* Other financial instruments include forward currency contracts and futures contracts.
| Liability Valuation Inputs | Investments in Securities | Other Financial Instruments** | |||||||||
| Level 1 - Quoted Prices | $ | — | $ | — | |||||||
| Level 2 - Other Significant Observable Inputs | — | (32,561,340 | ) | ||||||||
| Level 3 - Significant Unobservable Inputs | — | — | |||||||||
| Total | $ | — | $ | (32,561,340 | ) | ||||||
** Other financial instruments include forward currency contracts and futures contracts.
26
GMO International Core Equity Fund
(A Series of GMO Trust)
Notes to Financial Statements — (Continued)
February 28, 2009
The Fund held no investments or other financial instruments at either February 29, 2008 or February 28, 2009, whose fair value was determined using Level 3 inputs.
Foreign currency translation
The market values of foreign securities, currency holdings and related assets and liabilities are translated to U.S. dollars based on the 4 p.m. New York time exchange rates each business day. Income and expenses denominated in foreign currencies are translated at the 4 p.m. New York time exchange rates on the business day the income and expenses are accrued or incurred. The Fund does not isolate realized and unrealized gains and losses attributable to changes in exchange rates from gains and losses that arise from changes in the market value of investments. Such fluctuations are included with net realized and unrealized gain or loss on investments. Net realized gains and losses on foreign currency transactions represent gains and losses on disposition of currencies and forward currency contracts, currency gains and losses realized between the trade and settlement dates on securities transactions, and the difference between the amount of investment income and foreign withholding taxes recorded on the Fund's accounting records and the U.S. dollar equivalent amounts actually received or paid.
Forward currency contracts
The Fund may enter into forward currency contracts including forward cross currency contracts. A forward currency contract is an agreement between two parties to buy and sell a currency at a set price on a future date. The market value of a forward currency contract fluctuates with changes in forward currency exchange rates. Forward currency contracts are marked to market daily using rates supplied by a quotation service and changes in value are recorded by the Fund as an unrealized gain or loss. Realized gains or losses equal to the difference between the value of the contract at the time it was opened and the value at the time it was closed are recorded upon delivery or receipt of the currency or, if a forward currency contract is offset by entering into another forward currency contract with the same broker, upon settlement of the net gain or loss. These contracts may involve market risk in excess of the unrealized gain or lo ss reflected in the Fund's Statement of Assets and Liabilities. They expose the Fund to the risk of unfavorable movements in currency values and the risk that the counterparty will be unable or unwilling to meet the terms of the contracts. Forward currency contracts outstanding at the end of the period are listed in the Fund's Schedule of Investments.
Futures contracts
The Fund may purchase and sell futures contracts. Upon entering into a futures contract, the Fund is required to deposit cash, U.S. government and agency obligations, or other liquid assets with the futures clearing broker in accordance with the initial margin requirements of the broker or exchange. In addition, the Fund maintains cash or securities in an amount that at least equals the net amount payable in the event the Fund must deliver the full amount of the contract. Futures contracts are marked to market daily and an appropriate payable or receivable for the change in value ("variation margin") is recorded by the Fund. The payable or receivable is settled on the following business day. Gains or losses are recognized but not considered realized until the contracts expire or are closed. Futures contracts involve, to varying degrees,
27
GMO International Core Equity Fund
(A Series of GMO Trust)
Notes to Financial Statements — (Continued)
February 28, 2009
risk of loss in excess of the variation margin disclosed in the Statement of Assets and Liabilities. Under some circumstances, futures exchanges may establish daily limits on the amount that the price of a futures contract can vary from the previous day's settlement price, thereby effectively preventing liquidation of unfavorable positions. Losses may arise from changes in the value of the underlying instrument if the Fund is unable to liquidate a futures position due to an illiquid secondary market for the contract or the imposition of price limits, or if counterparties do not perform under the contract terms. Futures contracts are generally valued at the settlement price established each day by the board of trade or exchange on which they are traded. Because many foreign exchanges close prior to the close of the New York Stock Exchange ("NYSE"), closing prices for foreign futures in those markets or on those markets or on thos e exchanges do not reflect the events that occur after that close but before the close of the NYSE. As a result, the Fund generally values foreign futures using fair value prices, which are based on adjustments to closing prices supplied by a third party vendor based on that vendor's proprietary models. Futures contracts outstanding at the end of the period are listed in the Fund's Schedule of Investments.
Options
The Fund may write (i.e., sell) call and put options. Writing options alters the Fund's exposure to the underlying instrument by, in the case of a call option, obligating the Fund to sell the underlying instrument at a set price to the option-holder and, in the case of a put option, obligating the Fund to purchase the underlying instrument at a set price from the option-holder. In the case of an index option, settlement will be in cash. When the Fund writes a call or put option, an amount equal to the premium received is recorded as a liability and subsequently marked to market to reflect the current value of the option written. Premiums received from writing options that expire are treated as realized gains. Premiums received from writing options that are exercised or closed are deducted from the amounts paid on the underlying future, security or currency transaction to determine the realized gain or loss. The Fund as a writer of an option has no control over whether the underlying future, security or currency may be sold (call) or purchased (put) and as a result bears the market risk of an unfavorable change in the price of the future, security or currency underlying the option. In the event that the Fund writes uncovered put or call options (i.e. options for investments that the Fund does not own), it bears the risk of substantial losses if the price of the underlying instrument increases during the term of the option. Options expose the Fund to the risk the Fund may not be able to enter into a closing transaction because of an illiquid market. The Fund had no open written option contracts during the period.
The Fund may also purchase put and call options. Purchasing options alters the Fund's exposure to the underlying instrument by, in the case of a call option, entitling the Fund to purchase the underlying instrument at a set price from the writer of the option and, in the case of a put option, entitling the Fund to sell the underlying instrument at a set price to the writer of the option. The Fund pays a premium for a purchased option. That premium is disclosed in the Schedule of Investments and is subsequently marked to market to reflect the current value of the option. Premiums paid for purchasing options that expire are treated as realized losses. Premiums paid for purchasing options that are exercised or closed are deducted from the proceeds on the closing transaction to determine the realized gain or loss. The risk associated
28
GMO International Core Equity Fund
(A Series of GMO Trust)
Notes to Financial Statements — (Continued)
February 28, 2009
with purchasing put and call options is limited to the premium paid. The Fund had no purchased option contracts outstanding at the end of the period.
The Fund values exchange traded options at the last sale price, or if no sale is reported, the last bid price for options it has purchased and the last ask price for options it has written. The Fund values options traded over-the-counter using inputs provided by primary pricing sources and industry standard models.
Swap agreements
The Fund may enter into various types of swap agreements, including without limitation, interest rate, total return, credit default and variance swap agreements. A swap agreement is an agreement to exchange the return generated by one instrument for the return generated by another instrument. When entering into a swap agreement, the Fund and/or the swap counterparty may post or receive cash or securities as collateral. The party posting the collateral typically receives the interest associated with or payments related to the collateral and has the risk of loss related to the collateral.
Interest rate swap agreements involve an exchange by the parties of their respective commitments to pay or right to receive interest, e.g., an exchange of floating rate interest payments for fixed rate interest payments with respect to the notional amount of principal.
Total return swap agreements involve a commitment by one party to pay interest to the other party in exchange for a payment to it from the other party based on the return of a reference instrument (e.g., a security or basket of securities), both based on notional amounts. To the extent the return of the reference instrument exceeds or falls short of the interest payments, one party will receive a payment from or make a payment to the other party.
In a credit default swap agreement, one party makes payments to another party in exchange for the right to receive a specified return if a credit event occurs with respect to a referenced entity or entities. Buying credit default protection reduces the buyer's exposure in the event of an issuer's default (e.g., it reduces risk where a party owns a security issued by or otherwise has exposure to the issuer). Selling credit default protection subjects the seller to exposure to an issuer's default. A seller of credit default protection receives payments in return for its obligation to pay the principal amount of a debt security (or other agreed-upon value) to the other party upon the occurrence of a credit event (e.g., issuer default or similar event). If no credit event occurs, the seller has no payment obligations. For credit default swap agreements on asset-backed securities, a credit event may be triggered by such events as the issuer's failure to pay interest or principal, an agreement of the holders of an asset-backed security to a maturity extension, a rating downgrade on the security or a write-down on the collateral underlying the security. For credit default swap agreements on corporate or sovereign issuers, a credit event may be triggered by such events as the issuer's bankruptcy, failure to pay interest or principal, repudiation/moratorium or restructuring.
29
GMO International Core Equity Fund
(A Series of GMO Trust)
Notes to Financial Statements — (Continued)
February 28, 2009
Variance swap agreements involve an agreement by two parties to exchange cash flows based on the measured variance (or square of volatility) of a specified underlying asset. One party agrees to exchange a "fixed rate" or strike price payment for the "floating rate" or realized price variance on the underlying asset with respect to the notional amount. At inception, the strike price chosen is generally fixed at a level such that the fair value of the swap is zero. At the expiration date, the amount paid by one party to the other is the difference between the realized price variance of the underlying asset and the strike price multiplied by the notional amount. A receiver of the realized price variance would receive a payment when the realized price variance of the underlying asset is greater than the strike price and would make a payment when that variance is less than the strike price. A payer of the realized price variance woul d make a payment when the realized price variance of the underlying asset is greater than the strike price and would receive a payment when that variance is less than the strike price. This type of agreement is essentially a forward contract on the future realized price variance of the underlying asset.
The Fund prices its swap agreements daily using models that may incorporate quotations from market makers and records the change in value, if any, as unrealized gain or loss in the Statement of Operations. Payments received or made on swap agreements are recorded as realized gain or loss in the Statement of Operations. Gains or losses are realized upon termination of the swap agreements.
Swap agreements often are not actively traded on financial markets. The values assigned to them may differ significantly from the values that would be realized upon termination, and the differences could be material. Entering into swap agreements involves credit, legal, market and documentation risk that is not reflected in the amounts reported in the Statement of Assets and Liabilities. Such risks include the possibility that the party with whom the Fund contracts may default on its obligations to perform or disagree as to the meaning of contractual terms, or that the collateral that party posts may be insufficient or not timely received by the Fund. Credit risk may be particularly acute in an environment where financial services firms are exposed to systemic risks of the type evidenced by the insolvency of Lehman Brothers and subsequent market disruptions. The Fund had no swap agreements outstanding at the end of the period.
Securities lending
The Fund may lend its securities to qualified brokers. The loans are collateralized with cash or liquid securities with a market value at least equal to the market value of the securities upon entering into the loan. As with other extensions of credit, the Fund may bear the risk of loss with respect to the investment of the collateral, the risk of delay in and/or inability to exercise its rights with respect to the collateral, and the risk of delay in recovery or loss of rights in the loaned securities should the borrower of the securities fail financially. If a loan is collateralized by U.S. government securities, the Fund receives a fee from the borrower. If a loan is collateralized by cash, the Fund typically invests the cash collateral for its own account. As of February 28, 2009 the Fund had no securities on loan.
Taxes and distributions
The Fund intends to qualify each tax year as a regulated investment company under Subchapter M of the Internal Revenue Code of 1986, as amended (the "Code"). The Fund intends to distribute substantially all
30
GMO International Core Equity Fund
(A Series of GMO Trust)
Notes to Financial Statements — (Continued)
February 28, 2009
of its net investment income and all of its net realized short-term and long-term capital gain, if any, after giving effect to any available capital loss carryforwards for U.S. federal income tax purposes. Therefore, no provision for U.S. federal income or excise tax is necessary. Taxes on foreign interest and dividend income are generally withheld in accordance with the applicable country's tax treaty with the United States. The foreign withholding rates applicable to a Fund's investments in certain foreign jurisdictions may be higher if a significant portion of the Fund is held by non-U.S. shareholders.
The Fund's policy is to declare and pay distributions from net investment income, if any, semiannually, and from net realized short-term and long-term capital gain, if any, at least annually. All distributions are paid in shares of the Fund, at net asset value, unless the shareholder elects to receive cash distributions. Distributions to shareholders are recorded by the Fund on the ex-dividend date.
Foreign taxes paid by the Fund may be treated, to the extent permissible under the Code and if the Fund so elects, as if paid by the shareholders of the Fund.
The Fund may be subject to capital gains and repatriation taxes imposed by certain countries in which it invests.
Income and capital gain distributions are determined in accordance with U.S. federal income tax regulations, which may differ from U.S. GAAP. Certain capital accounts in the financial statements are periodically adjusted for permanent differences in order to reflect their tax character. These adjustments have no impact on net assets or net asset value per share. Temporary differences that arise from recognizing certain items of income, expense, gain or loss in different periods for financial statement and tax purposes will reverse at some time in the future. Distributions in excess of net investment income or net realized gains are temporary over-distributions for financial statement purposes resulting from differences in the recognition or classification of income or distributions for financial statement and tax purposes.
U.S. GAAP and tax accounting differences primarily relate to capital loss carryforwards, derivative contract transactions, foreign currency transactions, losses on wash sale transactions, passive foreign investment company transactions and post-October capital losses.
The following reclassification represents the amount necessary to report the stated components of net assets on a tax basis, excluding certain temporary differences, as of February 28, 2009. The financial highlights exclude these adjustments.
| Accumulated Undistributed Net Investment Income | Accumulated Net Realized Loss | Paid-in Capital | |||||||||
| $ | 28,606,367 | $ | (28,606,367 | ) | $ | — | |||||
31
GMO International Core Equity Fund
(A Series of GMO Trust)
Notes to Financial Statements — (Continued)
February 28, 2009
The tax character of distributions declared to shareholders is as follows:
| 2/28/2009 | 2/29/2008 | ||||||||||
| Ordinary income (including any net short-term capital gain) | $ | 193,221,407 | $ | 172,283,394 | |||||||
| Net long-term capital gain | 43,604,267 | 195,763,275 | |||||||||
| Total distributions | $ | 236,825,674 | $ | 368,046,669 | |||||||
Distributions in excess of tax basis earnings and profits, if significant, are reported in the financial statements as a return of capital for tax purposes.
As of February 28, 2009, the components of distributable earnings on a tax basis consisted of the following:
| Undistributed ordinary income (including any net short-term capital gain) | $ | 33,081,380 | |||||
As of February 28, 2009, the Fund elected to defer to March 1, 2009 post-October capital losses of $283,595,779.
As of February 28, 2009, the Fund had capital loss carryforwards available to offset future realized gains if any, to the extent permitted by the Code. Utilization of the capital loss carryforwards could be subject to limitations imposed by the Code related to share ownership activity. Such losses expire as follows:
| 2/28/2017 | $ | (215,235,940 | ) | ||||
| Total | $ | (215,235,940 | ) | ||||
As of February 28, 2009, the approximate cost for U.S. federal income tax purposes and gross and net unrealized appreciation (depreciation) in value of investments were as follows:
| Aggregate Cost | Gross Unrealized Appreciation | Gross Unrealized (Depreciation) | Net Unrealized Appreciation (Depreciation) | ||||||||||||
| $ | 5,524,475,074 | $ | 9,084,889 | $ | (2,472,859,252 | ) | $ | (2,463,774,363 | ) | ||||||
The Fund is subject to the provisions of Financial Accounting Standards Board Interpretation No. 48 ("FIN 48"), Accounting for Uncertainty in Income Taxes — an Interpretation of FASB Statement No. 109. FIN 48 sets forth a minimum threshold for financial statement recognition of a tax position taken or expected to be taken in a tax return that could affect the Fund's financial statements. The Fund did not have any unrecognized tax benefits or liabilities at February 28, 2009, nor did it have any increases or
32
GMO International Core Equity Fund
(A Series of GMO Trust)
Notes to Financial Statements — (Continued)
February 28, 2009
decreases in unrecognized tax benefits or liabilities for the period then ended. The Fund is subject to examination prior to the expiration of the statute of limitations by U.S. federal and state tax authorities for tax returns filed.
Security transactions and related investment income
Security transactions in the financial statements are accounted for on the trade date. Dividend income, net of applicable foreign withholding taxes, if any, is recorded on the ex-dividend date or, if later, when the Fund is informed of the ex-dividend date. Interest income is recorded on the accrual basis and is adjusted for the amortization of premiums and accretion of discounts. Principal on inflation indexed securities is adjusted for inflation and any increase or decrease is recorded as interest income or loss. Income is not recognized on securities for which collection is not expected. Non-cash dividends, if any, are recorded at the fair market value of the asset received. In determining the net gain or loss on securities sold, the Fund uses the identified cost basis for the purposes of determining the cost basis.
Expenses
The majority of the expenses of the Trust are directly identifiable to an individual fund. Expenses that are not readily identifiable to a specific fund are allocated taking into consideration, among other things, the nature and type of expense and the relative size of the funds. Investment income, common expenses and realized and unrealized gains and losses are allocated pro rata among the classes of shares of the Fund based on the relative net assets of each class. Shareholder service fees, which are directly attributable to a class of shares, are charged to that class's operations.
Brown Brothers Harriman & Co. ("BBH") serves as custodian and fund accounting agent of the Fund. State Street Bank and Trust Company ("State Street") serves as transfer agent of the Fund. BBH and State Street's fees may be reduced by an earnings allowance calculated on the average daily cash balances the Fund maintains with each agent. The Fund receives the benefit of the earnings allowance. In addition, Goldman Sachs Agency Lending, the Fund's securities lending agent, has agreed to reimburse the Fund for certain transactional expenses related to securities lending activity. Credit balances or expense reimbursements used to reduce fees, if any, are reported as a reduction of expenses in the Statement of Operations.
Investment risks
The Fund is subject to risks involved in investing in foreign securities that are not presented by investments in U.S. securities. These risks may involve adverse political and economic developments, including expropriation and the possible imposition of capital controls or other foreign governmental laws or restrictions. In addition, the securities of some foreign companies and securities markets are less liquid and at times may be more volatile than securities of comparable U.S. companies and U.S. securities markets.
Recently issued accounting pronouncement
In March 2008, FASB issued Statement of Financial Accounting Standards No. 161, Disclosures about Derivative Instruments and Hedging Activities ("SFAS 161"). SFAS 161 is effective for fiscal years and
33
GMO International Core Equity Fund
(A Series of GMO Trust)
Notes to Financial Statements — (Continued)
February 28, 2009
interim periods beginning after November 15, 2008. SFAS 161 requires enhanced disclosures about the Fund's derivative and hedging activities. The Manager is currently evaluating the impact the adoption of SFAS 161 will have on the Fund's financial statement disclosures.
3. Fees and other transactions with affiliates
GMO receives a management fee for the services it provides to the Fund. That fee is paid monthly at the annual rate of 0.38% of average daily net assets. The Fund has adopted a Shareholder Service Plan under which the Fund pays GMO a shareholder service fee for client and shareholder service, reporting, and other support. Pursuant to the Shareholder Service Plan, the shareholder service fee is calculated based on average daily net assets of each class at the annual rate of 0.15% for Class III shares, 0.09% for Class IV shares and 0.055% for Class VI shares.
Through at least June 30, 2009, the Manager has contractually agreed to reimburse the Fund for Fund expenses incurred through that date to the extent the Fund's total annual operating expenses (excluding "Excluded Expenses", as defined below) exceed 0.38% of the Fund's average daily net assets. Excluded Expenses include shareholder service fees, fees and expenses of the independent Trustees of the Trust, fees and expenses for legal services not approved by the Manager for the Trust, compensation and expenses of the Trust's Chief Compliance Officer ("CCO") (excluding any employee benefits), brokerage commissions, securities lending fees and expenses, interest expense, transfer taxes, and other investment-related costs (including expenses associated with investments in any company that is an investment company or would be an investment company under the 1940 Act, but for the exceptions to the definition of investment company provi ded in Section 3(c)(1) and 3(c)(7) of the 1940 Act), hedging transaction fees, extraordinary, non-recurring and certain other unusual expenses (including taxes).
The Fund's portion of the fee paid by the Trust to the independent Trustees and CCO during the year ended February 28, 2009 was $54,686 and $33,947, respectively. The compensation and expenses of the CCO are included in miscellaneous expenses in the Statement of Operations. The Fund paid no remuneration to any other officer of the Trust.
4. Purchases and sales of securities
Cost of purchases and proceeds from sales of securities, excluding short-term investments, for the year ended February 28, 2009 aggregated $2,357,605,587 and $1,848,090,031, respectively.
5. Guarantees
In the normal course of business the Fund enters into contracts with third-party service providers that contain a variety of representations and warranties and that provide general indemnifications. The Fund's maximum exposure under these arrangements is unknown, as it involves future claims that may be made
34
GMO International Core Equity Fund
(A Series of GMO Trust)
Notes to Financial Statements — (Continued)
February 28, 2009
against the Fund that have not yet occurred. Based on experience, management is of the view that the risk of loss in connection with its indemnification obligations is remote; however, there can be no assurance that such obligations will not result in material liabilities that adversely affect the Fund.
6. Principal shareholders and related parties
As of February 28, 2009, 22.63% of the outstanding shares of the Fund were held by one shareholder. On that date, no other shareholder owned more than 10% of the outstanding shares of the Fund. Redemptions from (or investments into) the Fund by or on behalf of this large shareholder may have a material effect on the Fund.
As of February 28, 2009, less than 0.01% of the Fund's shares were held by senior management of the Manager and GMO Trust officers and 40.78% of the Fund's shares were held by accounts for which the Manager had investment discretion.
7. Share transactions
The Declaration of Trust permits the Trust to issue an unlimited number of shares of beneficial interest (without par value). Transactions in Fund shares were as follows:
| Year Ended February 28, 2009 | Year Ended February 29, 2008 | ||||||||||||||||||
| Class III: | Shares | Amount | Shares | Amount | |||||||||||||||
| Shares sold | 24,667,921 | $ | 554,316,558 | 11,949,449 | $ | 492,041,742 | |||||||||||||
| Shares issued to shareholders in reinvestment of distributions | 1,343,947 | 36,964,534 | 1,414,279 | 58,116,527 | |||||||||||||||
| Shares repurchased | (3,502,126 | ) | (96,160,624 | ) | (11,019,208 | ) | (469,124,403 | ) | |||||||||||
| Net increase (decrease) | 22,509,742 | $ | 495,120,468 | 2,344,520 | $ | 81,033,866 | |||||||||||||
| Year Ended February 28, 2009 | Year Ended February 29, 2008 | ||||||||||||||||||
| Class IV: | Shares | Amount | Shares | Amount | |||||||||||||||
| Shares sold | 56,498,768 | $ | 1,087,585,834 | 15,988,725 | $ | 658,843,076 | |||||||||||||
| Shares issued to shareholders in reinvestment of distributions | 1,320,611 | 35,699,368 | 1,206,587 | 49,719,301 | |||||||||||||||
| Shares repurchased | (18,958,207 | ) | (381,913,012 | ) | (9,841,902 | ) | (399,772,816 | ) | |||||||||||
| Net increase (decrease) | 38,861,172 | $ | 741,372,190 | 7,353,410 | $ | 308,789,561 | |||||||||||||
35
GMO International Core Equity Fund
(A Series of GMO Trust)
Notes to Financial Statements — (Continued)
February 28, 2009
| Year Ended February 28, 2009 | Year Ended February 29, 2008 | ||||||||||||||||||
| Class VI: | Shares | Amount | Shares | Amount | |||||||||||||||
| Shares sold | 22,188,760 | $ | 566,965,336 | 74,361,787 | $ | 3,110,181,310 | |||||||||||||
| Shares issued to shareholders in reinvestment of distributions | 5,699,175 | 154,153,325 | 6,180,798 | 253,296,700 | |||||||||||||||
| Shares repurchased | (63,112,155 | ) | (1,266,656,415 | ) | (19,719,605 | ) | (775,593,659 | ) | |||||||||||
| Net increase (decrease) | (35,224,220 | ) | $ | (545,537,754 | ) | 60,822,980 | $ | 2,587,884,351 | |||||||||||
36
Report of Independent Registered Public Accounting Firm
To the Trustees of GMO Trust and the Shareholders of
GMO International Core Equity Fund:
In our opinion, the accompanying statement of assets and liabilities, including the schedule of investments, and the related statements of operations and of changes in net assets and the financial highlights present fairly, in all material respects, the financial position of GMO International Core Equity Fund (the "Fund") at February 28, 2009, the results of its operations for the year then ended, the changes in its net assets for each of the two years in the period then ended and the financial highlights for the periods indicated, in conformity with accounting principles generally accepted in the United States of America. These financial statements and financial highlights (hereafter referred to as "financial statements") are the responsibility of the Fund's management. Our responsibility is to express an opinion on these financial statements based on our audits. We conducted our audits of these financial statements in accordan ce with the standards of the Public Company Accounting Oversight Board (United States). Those standards require that we plan and perform the audit to obtain reasonable assurance about whether the financial statements are free of material misstatement. An audit includes examining, on a test basis, evidence supporting the amounts and disclosures in the financial statements, assessing the accounting principles used and significant estimates made by management, and evaluating the overall financial statement presentation. We believe that our audits, which included confirmation of securities at February 28, 2009 by correspondence with the custodian and brokers, provide a reasonable basis for our opinion.
PricewaterhouseCoopers LLP
Boston, Massachusetts
April 29, 2009
37
GMO International Core Equity Fund
(A Series of GMO Trust)
Fund Expenses
February 28, 2009 (Unaudited)
Expense Examples: The following information is in relation to expenses for the six month period ended February 28, 2009.
As a shareholder of the Fund, you may incur two types of costs: (1) transaction costs, and (2) ongoing costs, including management fees, shareholder service fees and other Fund expenses. This example is intended to help you understand your ongoing costs (in dollars) of investing in the Fund and to compare these costs with the ongoing costs of investing in other mutual funds.
These examples are based on an investment of $1,000 invested at the beginning of the period and held for the entire period, September 1, 2008 through February 28, 2009.
Actual Expenses
The first line of the table for each class below provides information about actual account values and actual expenses. You may use the information in this line, together with the amount you invested, to estimate the expenses that you paid over the period. Simply divide your account value by $1,000 (for example, a $10,000,000 account value divided by $1,000 = 10,000), then multiply the result by the number in the first line under the heading entitled "Net Expense Incurred" to estimate the expenses you paid on your account during this period.
Hypothetical Example for Comparison Purposes
The second line of the table for each class below provides information about hypothetical account values and hypothetical expenses based on the Fund's actual expense ratio and an assumed rate of return of 5% per year before expenses, which is not the Fund's actual return. The hypothetical account values and expenses may not be used to estimate the actual ending account balance or expenses you paid for the period. You may use this information to compare the ongoing costs of investing in the Fund with other funds. To do so, compare this 5% hypothetical example with the 5% hypothetical examples that appear in the shareholder reports of other funds.
38
GMO International Core Equity Fund
(A Series of GMO Trust)
Fund Expenses — (Continued)
February 28, 2009 (Unaudited)
Please note that the expenses shown in the table are meant to highlight your ongoing costs only and do not reflect any transactional costs. Therefore, the second line of the table is useful in comparing ongoing costs only, and will not help you determine the relative total costs of owning different funds. In addition, if these transactional costs were included, your costs would have been higher.
| Annualized Net Expense Ratio | Beginning Account Value | Ending Account Value | Net Expense Incurred* | ||||||||||||||||
| Class III | |||||||||||||||||||
| 1) Actual | 0.53 | % | $ | 1,000.00 | $ | 557.00 | $ | 2.05 | |||||||||||
| 2) Hypothetical | 0.53 | % | $ | 1,000.00 | $ | 1,022.17 | $ | 2.66 | |||||||||||
| Class IV | |||||||||||||||||||
| 1) Actual | 0.48 | % | $ | 1,000.00 | $ | 557.30 | $ | 1.85 | |||||||||||
| 2) Hypothetical | 0.48 | % | $ | 1,000.00 | $ | 1,022.41 | $ | 2.41 | |||||||||||
| Class VI | |||||||||||||||||||
| 1) Actual | 0.44 | % | $ | 1,000.00 | $ | 557.40 | $ | 1.70 | |||||||||||
| 2) Hypothetical | 0.44 | % | $ | 1,000.00 | $ | 1,022.61 | $ | 2.21 | |||||||||||
* Expenses are calculated using each Class's annualized net expense ratio for the six months ended February 28, 2009, multiplied by the average account value over the period, multiplied by 181 days in the period, divided by 365 days in the year.
39
GMO International Core Equity Fund
(A Series of GMO Trust)
Tax Information for the Tax Year Ended February 28, 2009 (Unaudited)
The Fund will notify shareholders of amounts for use in preparing 2009 income tax forms in January 2010.
The Fund's distributions to shareholders include $43,604,267 from long-term capital gains.
During the year ended February 28, 2009, the Fund paid foreign taxes of $15,659,311 and recognized foreign source income of $175,612,560.
For taxable, non-corporate shareholders, 70.65% of the income and short-term capital gains, if any, distributed in the Fund's fiscal year ended February 28, 2009 represents qualified dividend income subject to the 15% rate category.
40
Trustees and Officers (Unaudited)
The following tables list the Trust's Trustees and Officers as of the date of this report; their address and date of birth ("DOB"); their position with the Trust; the length of time holding that position with the Trust; their principal occupation(s) during the past five years; the number of portfolios in the fund complex they oversee; and other directorships they hold in companies subject to registration or reporting requirements of the Securities Exchange Act of 1934 (generally called "public companies") or in registered investment companies. The Trust's Statement of Additional Information ("SAI") includes additional information about the Trust's trustees, including changes subsequent to the date of the report. The SAI is available, without charge, upon request by writing GMO, c/o GMO Trust, 40 Rowes Wharf, Boston, MA 02110.
Independent Trustees:
| Name, Address, and DOB | Position(s) Held with Trust | Term of Office1 and Length of Time Served | Principal Occupation(s) During Past Five Years | Number of Portfolios in Fund Complex Overseen by Trustee | Other Directorships Held by Trustee | ||||||||||||||||||
| Donald W. Glazer, Esq. c/o GMO Trust 40 Rowes Wharf Boston, MA 02110 DOB: 07/26/1944 | Chairman of the Board of Trustees | Chairman of the Board of Trustees since March 2005; Lead Independent Trustee (September 2004 – March 2005); Trustee since December 2000. | Consultant – Law and Business2; Author of Legal Treatises. | 59 | None. | ||||||||||||||||||
1 Each Trustee is elected to serve during the continued lifetime of the Trust until he/she dies, resigns or is removed, or if sooner, until the next meeting of Shareholders called for the purpose of electing Trustees and until the election and qualification of his/her successor.
2 As part of Mr. Glazer's work as a consultant, he provides part-time consulting services to Goodwin Procter LLP ("Goodwin"). Goodwin has provided legal services to Renewable Resources, LLC, an affiliate of GMO; GMO, in connection with its relationship with Renewable Resources; and funds managed by Renewable Resources. Mr. Glazer has represented that he has no financial interest in, and is not involved in the provision of, such legal services. In the calendar years ended December 31, 2007 and December 31, 2008, these entities paid $789,416 and $183,864 respectively, in legal fees and disbursements to Goodwin. In correspondence with the Staff of the Securities and Exchange Commission beginning in August 2006, the Independent Trustees' legal counsel provided the Staff with information regarding Mr. Glazer's relationship with Goodwin and h is other business activities. On September 11, 2007, based on information that had been given to the Staff as of that date, the Staff provided oral no-action assurance consistent with the opinion of the Independent Trustees' legal counsel that Mr. Glazer is not an "interested person" of the Trust.
41
Independent Trustees — (Continued)
| Name, Address, and DOB | Position(s) Held with Trust | Term of Office1 and Length of Time Served | Principal Occupation(s) During Past Five Years | Number of Portfolios in Fund Complex Overseen by Trustee | Other Directorships Held by Trustee | ||||||||||||||||||
| W. Nicholas Thorndike c/o GMO Trust 40 Rowes Wharf Boston, MA 02110 DOB: 03/28/1933 | Trustee | Since March 2005. | Director or trustee of various corporations and charitable organizations, including Courier Corporation (a book publisher and manufacturer) (July 1989 – present); Putnam Funds (December 1992 – June 2004); and Providence Journal (a newspaper publisher) (December 1986 – December 2003). | 59 | Director of Courier Corporation (a book publisher and manufacturer); Member of the Investment Committee of Partners HealthCare System, Inc.3 | ||||||||||||||||||
| Peter Tufano c/o GMO Trust 40 Rowes Wharf Boston, MA 02110 DOB: 04/22/1957 | Trustee | Since December 2008. | Sylvan C. Coleman Professor of Financial Management, Harvard Business School (since 1989). | 59 | Trustee of State Street Navigator Securities Lending Trust (3 Portfolios). | ||||||||||||||||||
1 Each Trustee is elected to serve during the continued lifetime of the Trust until he/she dies, resigns or is removed, or if sooner, until the next meeting of Shareholders called for the purpose of electing Trustees and until the election and qualification of his/her successor.
3 Partners HealthCare System, Inc. is a client of the Manager.
42
Principal Officers:
| Name, Address, and DOB | Position(s) Held with Trust | Term of Office4 and Length of Time Served | Principal Occupation(s) During Past Five Years5 | ||||||||||||
| J.B. Kittredge DOB: 08/22/1954 | President and Chief Executive Officer | Since March 2009. | General Counsel, Grantham, Mayo, Van Otterloo & Co. LLC (October 2005 – Present); Partner, Ropes & Gray LLP. | ||||||||||||
| Sheppard N. Burnett c/o GMO Trust 40 Rowes Wharf Boston, MA 02110 DOB: 10/24/1968 | Treasurer and Chief Financial Officer | Chief Financial Officer since March 2007; Treasurer since November 2006; Assistant Treasurer, September 2004 – November 2006. | Fund Administration Staff, Grantham, Mayo, Van Otterloo & Co. LLC (June 2004 – present); Vice President, Director of Tax, Columbia Management Group (2002 – 2004). | ||||||||||||
| Brent C. Arvidson c/o GMO Trust 40 Rowes Wharf Boston, MA 02110 DOB: 06/26/1969 | Assistant Treasurer | Since August 1998. | Senior Fund Administrator, Grantham, Mayo, Van Otterloo & Co. LLC. | ||||||||||||
| John L. Nasrah c/o GMO Trust 40 Rowes Wharf Boston, MA 02110 DOB: 05/27/1977 | Assistant Treasurer | Since March 2007. | Fund Administrator, Grantham, Mayo, Van Otterloo & Co. LLC (September 2004 – present); Tax Analyst, Bain & Company, Inc. (June 2003 – September 2004). | ||||||||||||
| Mahmoodur Rahman c/o GMO Trust 40 Rowes Wharf Boston, MA 02110 DOB: 11/30/1967 | Assistant Treasurer | Since September 2007. | Fund Administrator, Grantham, Mayo, Van Otterloo & Co. LLC (April 2007 – present); Vice President and Senior Tax Manager, Massachusetts Financial Services Company (January 2000 – April 2007). | ||||||||||||
| Michael E. Gillespie c/o GMO Trust 40 Rowes Wharf Boston, MA 02110 DOB: 02/18/1958 | Chief Compliance Officer | Since March 2005. | Vice President of Compliance (June 2004 – February 2005) and Director of Domestic Compliance (March 2002 – June 2004), Fidelity Investments. | ||||||||||||
4 Each officer is elected to hold such office until his or her successor is duly elected and qualified to carry out the duties and responsibilities of the office, or until he or she resigns or is removed from office.
5 Each of Messrs. Burnett, Arvidson, Bohan, and Pottle serves as an officer and/or director of certain pooled investment vehicles of which GMO or an affiliate of GMO serves as the investment adviser.
43
Principal Officers — (Continued)
| Name, Address, and DOB | Position(s) Held with Trust | Term of Office4 and Length of Time Served | Principal Occupation(s) During Past Five Years5 | ||||||||||||
| Jason B. Harrison c/o GMO Trust 40 Rowes Wharf Boston, MA 02110 DOB: 01/29/1977 | Vice President and Clerk | Vice President since November 2006; Clerk since March 2006. | Legal Counsel, Grantham, Mayo, Van Otterloo & Co. LLC (since February 2006) and Attorney, Ropes & Gray LLP (September 2002 – February 2006). | ||||||||||||
| David L. Bohan c/o GMO Trust 40 Rowes Wharf Boston, MA 02110 DOB: 06/21/1964 | Vice President and Assistant Clerk | Vice President since March 2005; Assistant Clerk since March 2006. | Legal Counsel, Grantham, Mayo, Van Otterloo & Co. LLC. | ||||||||||||
| Gregory L. Pottle c/o GMO Trust 40 Rowes Wharf Boston, MA 02110 DOB: 07/09/1971 | Vice President and Assistant Clerk | Since November 2006. | Legal Counsel, Grantham, Mayo, Van Otterloo & Co. LLC. | ||||||||||||
| Anne K. Trinque c/o GMO Trust 40 Rowes Wharf Boston, MA 02110 DOB: 04/15/1978 | Vice President and Assistant Clerk | Since September 2007. | Legal Counsel, Grantham, Mayo, Van Otterloo & Co. LLC (January 2007 – present); Attorney, Goodwin Procter LLP (September 2003 – January 2007). | ||||||||||||
| Cheryl Wakeham c/o GMO Trust 40 Rowes Wharf Boston, MA 02110 DOB: 10/29/1958 | Vice President and Anti-Money Laundering Officer | Since December 2004. | Manager, Client Service Administration, Grantham, Mayo, Van Otterloo & Co. LLC. | ||||||||||||
4 Each officer is elected to hold such office until his or her successor is duly elected and qualified to carry out the duties and responsibilities of the office, or until he or she resigns or is removed from office.
5 Each of Messrs. Burnett, Arvidson, Bohan, and Pottle serves as an officer and/or director of certain pooled investment vehicles of which GMO or an affiliate of GMO serves as the investment adviser.
44
GMO International Growth Equity Fund
(A Series of GMO Trust)
Annual Report
February 28, 2009
For a free copy of the Fund's proxy voting guidelines, shareholders may call 1-617-346-7646 (collect) or visit the Securities and Exchange Commission's website at www.sec.gov. Information regarding how the Fund voted proxies relating to portfolio securities during the most recent 12-month period ended June 30 is available on GMO's website at www.gmo.com, or on the Securities and Exchange Commission's website at www.sec.gov.
The Fund files its complete schedule of portfolio holdings with the Securities and Exchange Commission for the first and third quarter of each fiscal year on Form N-Q, which is available on the Commission's website at www.sec.gov. The Fund's Form N-Q may be reviewed and copied at the Commission's Public Reference Room in Washington, D.C. Information on the operation of the Public Reference Room may be obtained by calling 1-800-SEC-0330. The Fund has a policy with respect to disclosure of portfolio holdings under which it may also make available on GMO's website at www.gmo.com a complete schedule of portfolio holdings.
This report is prepared for the general information of shareholders. It is authorized for distribution to prospective investors only when preceded or accompanied by a prospectus for the GMO Trust, which contains a complete discussion of the risks associated with an investment in this Fund and other important information. The GMO Trust prospectus can be obtained at www.gmo.com.
GMO International Growth Equity Fund
(A Series of GMO Trust)
Portfolio Management
Day-to-day management of the Fund's portfolio is the responsibility of the Quantitative Equity team at Grantham, Mayo, Van Otterloo & Co. LLC.
Management Discussion and Analysis of Fund Performance
The Class III shares of the GMO International Growth Equity Fund returned -43.5% for the fiscal year ended February 28, 2009, as compared to -50.2% for the MSCI EAFE Index and -49.1% for the MSCI EAFE Growth Index. Consistent with the Fund's investment objectives and policies, the Fund was invested primarily in international equity securities throughout the period.
Relative to the EAFE Growth Index, stock selection made a strong positive contribution, particularly within Health Care and Energy. Among the most significant contributors were holdings in French oil company Total, British pharmaceutical GlaxoSmithKline, and British energy company BG Group, all of which outperformed. Overweight positions in French steel maker ArcelorMittal, Swedish energy company Vostok Gas SDR, and Finnish cell phone maker Nokia detracted from returns.
Among GMO's international quantitative stock selection disciplines, stocks selected for their high quality characteristics outperformed very strongly. Those stocks ranked highly by intrinsic value (with its boost of high quality) outperformed significantly, while those with strong momentum underperformed.
Country allocation had a positive impact on relative performance. This was mainly from underweights in Italy and Japan and holding small cash balances in a falling market.
Currency allocation also had a strong positive impact on relative performance as the Fund's underweights in the British pound and Australian dollar and overweight in the Japanese yen added value. The U.S. dollar strengthened relative to most foreign currencies, which detracted from returns for U.S. investors. The MSCI EAFE Index returned almost 9% more in local currency terms than in U.S. dollars.
Sector weightings had a strong positive impact on performance relative to the index. During the period, the Fund's underweight to Financials and overweight to Health Care contributed significantly.
The views expressed herein are exclusively those of Grantham, Mayo, Van Otterloo & Co. LLC Management as of the date of this report and are subject to change. GMO disclaims any responsibility to update such views. They are not meant as investment advice. References to specific securities are not recommendations of such securities and may not be representative of any GMO portfolio's current or future investments.

Performance data quoted represents past performance and is not indicative of future results. The investment return and principal value of an investment will fluctuate so that an investor's shares, when redeemed, may be worth more or less than their original cost. Current performance data may be lower or higher than the performance data provided herein. To obtain performance information to the most recent month-end, visit www.gmo.com. Performance shown is net of all fees after reimbursement from the Manager. Returns would have been lower had certain expenses not been reimbursed during the periods shown and do not include the effect of taxes on distributions and redemptions. All information is unaudited. Performance for Classes IV will vary due to different fees.
* Effective January 1, 2009, the benchmark for the International Growth Equity Fund was changed from the S&P EPAC Large Mid Cap Growth Index to the MSCI EAFE Growth Index. This change was applicable retroactively as well as going forward.
† The Fund is the successor to the GMO International Growth Fund, therefore, performance for the periods prior to September 16, 2005 is that of GMO International Growth Fund.
GMO International Growth Equity Fund
(A Series of GMO Trust)
Investments Concentration Summary
February 28, 2009 (Unaudited)
| Asset Class Summary | % of Total Net Assets | ||||||
| Common Stocks | 94.3 | % | |||||
| Short-Term Investments | 4.5 | ||||||
| Futures | (0.3 | ) | |||||
| Forward Currency Contracts | (0.7 | ) | |||||
| Other | 2.2 | ||||||
| 100.0 | % | ||||||
| Country Summary | % of Equity Investments | ||||||
| United Kingdom | 24.5 | % | |||||
| Japan | 21.7 | ||||||
| Switzerland | 16.2 | ||||||
| France | 8.3 | ||||||
| Germany | 5.3 | ||||||
| Australia | 4.7 | ||||||
| Canada | 4.5 | ||||||
| Spain | 3.4 | ||||||
| Denmark | 2.6 | ||||||
| Hong Kong | 2.4 | ||||||
| Netherlands | 1.9 | ||||||
| Finland | 1.1 | ||||||
| Singapore | 1.0 | ||||||
| Sweden | 0.9 | ||||||
| Norway | 0.6 | ||||||
| Greece | 0.5 | ||||||
| Belgium | 0.2 | ||||||
| Austria | 0.1 | ||||||
| Ireland | 0.1 | ||||||
| 100.0 | % | ||||||
| Industry Sector Summary | % of Equity Investments | ||||||
| Health Care | 25.0 | % | |||||
| Consumer Staples | 18.0 | ||||||
| Energy | 10.4 | ||||||
| Materials | 10.4 | ||||||
| Consumer Discretionary | 8.4 | ||||||
| Industrials | 7.6 | ||||||
| Information Technology | 7.1 | ||||||
| Telecommunication Services | 5.8 | ||||||
| Utilities | 5.2 | ||||||
| Financials | 2.1 | ||||||
| 100.0 | % | ||||||
1
GMO International Growth Equity Fund
(A Series of GMO Trust)
Schedule of Investments
(showing percentage of total net assets)
February 28, 2009
| Shares | Description | Value ($) | |||||||||||||
| COMMON STOCKS — 94.3% | |||||||||||||||
| Australia — 4.4% | |||||||||||||||
| 187,432 | Australian Stock Exchange Ltd | 3,123,583 | |||||||||||||
| 424,392 | BHP Billiton Ltd | 7,641,854 | |||||||||||||
| 772,562 | Brambles Ltd | 2,257,351 | |||||||||||||
| 289,777 | CSL Ltd | 6,701,502 | |||||||||||||
| 1,011,812 | Foster's Group Ltd | 3,542,342 | |||||||||||||
| 1,100,514 | Harvey Norman Holdings Ltd | 1,327,927 | |||||||||||||
| 2,201,219 | Incitec Pivot Ltd | 2,998,686 | |||||||||||||
| 1,369,807 | Origin Energy Ltd | 11,824,787 | |||||||||||||
| 398,318 | QBE Insurance Group Ltd | 4,784,037 | |||||||||||||
| 172,798 | Rio Tinto Ltd | 5,084,282 | |||||||||||||
| 1,403,836 | Telstra Corp Ltd | 3,163,794 | |||||||||||||
| 717,755 | Woodside Petroleum Ltd | 16,335,650 | |||||||||||||
| 1,137,492 | Woolworths Ltd | 18,901,345 | |||||||||||||
| Total Australia | 87,687,140 | ||||||||||||||
| Austria — 0.1% | |||||||||||||||
| 82,392 | Oesterreichische Elektrizitaetswirtschafts AG Class A | 2,534,247 | |||||||||||||
| Belgium — 0.2% | |||||||||||||||
| 18,049 | Colruyt SA | 4,091,794 | |||||||||||||
| Canada — 4.2% | |||||||||||||||
| 180,300 | Agrium Inc | 6,259,905 | |||||||||||||
| 461,300 | Canadian National Railway Co | 14,815,845 | |||||||||||||
| 163,700 | Canadian Natural Resources | 5,262,797 | |||||||||||||
| 85,800 | Canadian Pacific Railway Ltd | 2,427,920 | |||||||||||||
| 175,300 | Enbridge Inc | 5,249,906 | |||||||||||||
| 106,300 | EnCana Corp | 4,194,513 | |||||||||||||
| 98,500 | Husky Energy Inc | 2,105,958 | |||||||||||||
| 76,100 | IGM Financial Inc | 1,672,501 | |||||||||||||
| 332,400 | Potash Corp of Saskatchewan Inc | 27,899,443 | |||||||||||||
See accompanying notes to the financial statements.
2
GMO International Growth Equity Fund
(A Series of GMO Trust)
Schedule of Investments — (Continued)
(showing percentage of total net assets)
February 28, 2009
| Shares | Description | Value ($) | |||||||||||||
| Canada — continued | |||||||||||||||
| 150,700 | Research In Motion Ltd * | 6,022,314 | |||||||||||||
| 228,200 | Shoppers Drug Mart Corp | 7,761,527 | |||||||||||||
| Total Canada | 83,672,629 | ||||||||||||||
| Denmark — 2.5% | |||||||||||||||
| 291 | AP Moller-Maersk A/S Class A | 1,369,278 | |||||||||||||
| 222,900 | H Lundbeck A/S | 4,733,020 | |||||||||||||
| 605,002 | Novo-Nordisk A/S Class B | 29,459,621 | |||||||||||||
| 314,075 | Vestas Wind Systems A/S * | 13,676,039 | |||||||||||||
| Total Denmark | 49,237,958 | ||||||||||||||
| Finland — 1.0% | |||||||||||||||
| 164,805 | Alma Media Corp | 1,124,741 | |||||||||||||
| 96,409 | Amer Sports Oyj Class A | 672,908 | |||||||||||||
| 233,762 | Fortum Oyj | 4,014,796 | |||||||||||||
| 162,031 | Kone Oyj Class B | 3,339,552 | |||||||||||||
| 692,373 | Nokia Oyj | 6,487,757 | |||||||||||||
| 335,092 | Nokian Renkaat Oyj | 3,947,064 | |||||||||||||
| Total Finland | 19,586,818 | ||||||||||||||
| France — 7.8% | |||||||||||||||
| 113,649 | Air Liquide SA | 8,293,246 | |||||||||||||
| 1,111,424 | ArcelorMittal | 21,302,366 | |||||||||||||
| 54,092 | Dassault Systemes SA | 1,874,591 | |||||||||||||
| 68,842 | Electricite de France | 2,667,901 | |||||||||||||
| 197,657 | Essilor International SA | 6,821,555 | |||||||||||||
| 181,508 | Groupe Danone | 8,613,702 | |||||||||||||
| 63,085 | Hermes International | 5,327,122 | |||||||||||||
| 148,636 | L'Oreal SA | 9,561,350 | |||||||||||||
| 28,972 | Neopost SA | 2,102,412 | |||||||||||||
| 681,207 | Sanofi-Aventis | 35,012,078 | |||||||||||||
| 967,145 | Total SA | 45,437,969 | |||||||||||||
| 63,664 | Vallourec SA | 4,955,257 | |||||||||||||
| 129,236 | Veolia Environnement | 2,775,579 | |||||||||||||
| Total France | 154,745,128 | ||||||||||||||
See accompanying notes to the financial statements.
3
GMO International Growth Equity Fund
(A Series of GMO Trust)
Schedule of Investments — (Continued)
(showing percentage of total net assets)
February 28, 2009
| Shares | Description | Value ($) | |||||||||||||
| Germany — 5.0% | |||||||||||||||
| 154,460 | Adidas AG | 4,440,456 | |||||||||||||
| 311,062 | Aixtron AG | 1,240,740 | |||||||||||||
| 106,132 | Beiersdorf AG | 4,395,832 | |||||||||||||
| 1,345,154 | Deutsche Telekom AG (Registered) | 16,266,697 | |||||||||||||
| 165,589 | Fresenius Medical Care AG & Co | 6,732,771 | |||||||||||||
| 338,788 | K&S AG | 15,080,680 | |||||||||||||
| 79,836 | Norddeutsche Affinerie AG | 1,984,739 | |||||||||||||
| 10,739 | Puma AG Rudolf Dassler Sport | 1,605,135 | |||||||||||||
| 1,343,048 | SAP AG | 43,144,958 | |||||||||||||
| 211,127 | SGL Carbon SE * | 4,659,547 | |||||||||||||
| Total Germany | 99,551,555 | ||||||||||||||
| Greece — 0.4% | |||||||||||||||
| 105,198 | Coca Cola Hellenic Bottling Co SA | 1,273,820 | |||||||||||||
| 168,560 | National Bank of Greece SA | 2,060,546 | |||||||||||||
| 208,439 | OPAP SA | 5,358,749 | |||||||||||||
| Total Greece | 8,693,115 | ||||||||||||||
| Hong Kong — 2.3% | |||||||||||||||
| 1,721,500 | CLP Holdings Ltd | 12,726,258 | |||||||||||||
| 1,009,200 | Esprit Holdings Ltd | 5,434,969 | |||||||||||||
| 472,400 | Hang Seng Bank Ltd | 5,225,702 | |||||||||||||
| 3,579,400 | Hong Kong & China Gas | 5,397,912 | |||||||||||||
| 92,800 | Hong Kong Aircraft Engineering Co Ltd | 829,317 | |||||||||||||
| 1,618,000 | Hong Kong Electric Holdings Ltd | 9,975,801 | |||||||||||||
| 1,480,000 | Li & Fung Ltd | 3,207,136 | |||||||||||||
| 4,242,000 | PCCW Ltd | 1,964,713 | |||||||||||||
| Total Hong Kong | 44,761,808 | ||||||||||||||
| Ireland — 0.1% | |||||||||||||||
| 124,498 | CRH Plc | 2,556,852 | |||||||||||||
See accompanying notes to the financial statements.
4
GMO International Growth Equity Fund
(A Series of GMO Trust)
Schedule of Investments — (Continued)
(showing percentage of total net assets)
February 28, 2009
| Shares | Description | Value ($) | |||||||||||||
| Japan — 20.5% | |||||||||||||||
| 316,400 | Astellas Pharma Inc | 10,499,247 | |||||||||||||
| 681,650 | Canon Inc | 17,202,850 | |||||||||||||
| 1,028 | Central Japan Railway Co | 6,245,236 | |||||||||||||
| 351,600 | Daiichi Sankyo Co Ltd | 5,648,786 | |||||||||||||
| 291,800 | Daikin Industries Ltd | 6,352,422 | |||||||||||||
| 77,300 | East Japan Railway Co | 4,629,318 | |||||||||||||
| 236,700 | Eisai Co Ltd | 7,251,738 | |||||||||||||
| 126,900 | Fanuc Ltd | 8,264,475 | |||||||||||||
| 183,000 | Fast Retailing Co Ltd | 18,382,357 | |||||||||||||
| 44,300 | Hirose Electric Co Ltd | 3,803,680 | |||||||||||||
| 117,200 | Hisamitsu Pharmaceutical Co Inc | 3,539,492 | |||||||||||||
| 621,000 | Honda Motor Co Ltd | 14,849,846 | |||||||||||||
| 455,400 | Hoya Corp | 8,252,973 | |||||||||||||
| 1,163 | INPEX Corp | 7,868,012 | |||||||||||||
| 85,300 | Ito En Ltd | 1,087,677 | |||||||||||||
| 411,000 | Japan Steel Works Ltd (The) | 3,692,030 | |||||||||||||
| 1,730 | Japan Tobacco Inc | 4,126,483 | |||||||||||||
| 403,000 | JGC Corp | 4,593,015 | |||||||||||||
| 689,000 | Kao Corp | 13,093,881 | |||||||||||||
| 52,300 | Keyence Corp | 9,871,051 | |||||||||||||
| 138,500 | Lawson Inc | 5,997,302 | |||||||||||||
| 1,153,000 | Marubeni Corp | 3,579,524 | |||||||||||||
| 1,297,500 | Mitsubishi Corp | 16,142,820 | |||||||||||||
| 2,333,000 | Mitsubishi Heavy Industries Ltd | 6,532,261 | |||||||||||||
| 1,298,900 | Mizuho Financial Group Inc | 2,448,154 | |||||||||||||
| 71,300 | Murata Manufacturing Co Ltd | 2,707,055 | |||||||||||||
| 398,000 | Nikon Corp | 3,731,161 | |||||||||||||
| 40,200 | Nintendo Co Ltd | 11,477,081 | |||||||||||||
| 401,000 | Nippon Denko Co Ltd | 1,098,837 | |||||||||||||
| 921,000 | Nippon Yusen KK | 3,799,273 | |||||||||||||
| 93,900 | Nissha Printing Co Ltd | 2,329,920 | |||||||||||||
| 144,000 | Nomura Research Institute | 2,267,722 | |||||||||||||
| 7,233 | NTT Docomo Inc | 11,267,714 | |||||||||||||
See accompanying notes to the financial statements.
5
GMO International Growth Equity Fund
(A Series of GMO Trust)
Schedule of Investments — (Continued)
(showing percentage of total net assets)
February 28, 2009
| Shares | Description | Value ($) | |||||||||||||
| Japan — continued | |||||||||||||||
| 1,361,000 | OJI Paper Co Ltd | 5,033,849 | |||||||||||||
| 178,000 | Olympus Corp | 2,348,179 | |||||||||||||
| 36,100 | Ono Pharmaceutical Co Ltd | 1,671,126 | |||||||||||||
| 1,472,000 | Panasonic Corp | 17,043,126 | |||||||||||||
| 10,994 | Rakuten Inc | 5,657,186 | |||||||||||||
| 38,000 | Rohm Co Ltd | 1,814,977 | |||||||||||||
| 104,300 | Sankyo Co Ltd | 4,680,924 | |||||||||||||
| 64,100 | Secom Co | 2,199,833 | |||||||||||||
| 876,600 | Seven & I Holdings Co Ltd | 19,427,066 | |||||||||||||
| 27,200 | Shimamura Co Ltd | 1,403,888 | |||||||||||||
| 387,700 | Shin-Etsu Chemical Co Ltd | 17,261,030 | |||||||||||||
| 434,000 | Shionogi & Co Ltd | 7,047,728 | |||||||||||||
| 225,000 | Shiseido Co Ltd | 3,313,510 | |||||||||||||
| 2,717,000 | Sumitomo Metal Industries Ltd | 5,089,703 | |||||||||||||
| 668,700 | Takeda Pharmaceutical Co Ltd | 27,008,677 | |||||||||||||
| 270,400 | Terumo Corp | 8,286,719 | |||||||||||||
| 141,900 | Tokio Marine Holdings Inc | 3,222,684 | |||||||||||||
| 748,100 | Tokyo Electric Power Co Inc (The) | 21,118,895 | |||||||||||||
| 110,900 | Toyoda Gosei Co Ltd | 1,499,634 | |||||||||||||
| 90,800 | Toyota Motor Corp | 2,908,292 | |||||||||||||
| 77,900 | Unicharm Corp | 5,089,238 | |||||||||||||
| 24,923 | Yahoo Japan Corp | 7,129,267 | |||||||||||||
| 84,900 | Yamada Denki Co Ltd | 3,080,147 | |||||||||||||
| Total Japan | 405,969,071 | ||||||||||||||
| Netherlands — 1.8% | |||||||||||||||
| 235,511 | Heineken NV | 6,288,312 | |||||||||||||
| 185,009 | Koninklijke DSM NV | 4,228,099 | |||||||||||||
| 678,086 | Koninklijke KPN NV | 8,675,350 | |||||||||||||
| 220,429 | Reed Elsevier NV | 2,449,146 | |||||||||||||
| 706,501 | Unilever NV | 13,537,464 | |||||||||||||
| Total Netherlands | 35,178,371 | ||||||||||||||
See accompanying notes to the financial statements.
6
GMO International Growth Equity Fund
(A Series of GMO Trust)
Schedule of Investments — (Continued)
(showing percentage of total net assets)
February 28, 2009
| Shares | Description | Value ($) | |||||||||||||
| Norway — 0.6% | |||||||||||||||
| 529,650 | StatoilHydro ASA | 8,793,605 | |||||||||||||
| 146,980 | Yara International ASA | 3,110,396 | |||||||||||||
| Total Norway | 11,904,001 | ||||||||||||||
| Singapore — 0.9% | |||||||||||||||
| 1,471,000 | Keppel Land Ltd | 1,216,337 | |||||||||||||
| 1,606,000 | Singapore Press Holdings Ltd | 2,808,256 | |||||||||||||
| 2,318,000 | Singapore Technologies Engineering Ltd | 3,424,096 | |||||||||||||
| 6,682,500 | Singapore Telecommunications | 10,517,139 | |||||||||||||
| Total Singapore | 17,965,828 | ||||||||||||||
| Spain — 3.3% | |||||||||||||||
| 327,418 | Iberdrola SA | 2,129,216 | |||||||||||||
| 203,199 | Inditex SA | 7,622,496 | |||||||||||||
| 1,053,264 | Mapfre SA | 2,141,248 | |||||||||||||
| 104,344 | Red Electrica de Espana | 4,184,797 | |||||||||||||
| 2,204,850 | Telefonica SA | 40,578,177 | |||||||||||||
| 344,018 | Union Fenosa SA | 7,753,193 | |||||||||||||
| Total Spain | 64,409,127 | ||||||||||||||
| Sweden — 0.9% | |||||||||||||||
| 468,703 | Hennes & Mauritz AB Class B | 17,386,155 | |||||||||||||
| Switzerland — 15.2% | |||||||||||||||
| 245,367 | Compagnie Financiere Richemont SA Class A | 3,240,518 | |||||||||||||
| 26,545 | Geberit AG (Registered) | 2,377,741 | |||||||||||||
| 54,298 | Lonza Group AG (Registered) | 5,209,062 | |||||||||||||
| 2,619,618 | Nestle SA (Registered) | 85,636,440 | |||||||||||||
| 2,621,683 | Novartis AG (Registered) | 95,647,673 | |||||||||||||
| 513,370 | Roche Holding AG (Non Voting) | 58,276,502 | |||||||||||||
| 5,392 | SGS SA (Registered) | 4,865,177 | |||||||||||||
| 19,477 | Swatch Group AG | 2,166,531 | |||||||||||||
| 11,174 | Swisscom AG (Registered) | 3,346,989 | |||||||||||||
See accompanying notes to the financial statements.
7
GMO International Growth Equity Fund
(A Series of GMO Trust)
Schedule of Investments — (Continued)
(showing percentage of total net assets)
February 28, 2009
| Shares | Description | Value ($) | |||||||||||||
| Switzerland — continued | |||||||||||||||
| 111,686 | Syngenta AG (Registered) | 23,875,963 | |||||||||||||
| 152,849 | Synthes Inc | 17,737,409 | |||||||||||||
| Total Switzerland | 302,380,005 | ||||||||||||||
| United Kingdom — 23.1% | |||||||||||||||
| 137,201 | Anglo American Plc | 1,935,316 | |||||||||||||
| 1,039,359 | AstraZeneca Plc | 32,959,946 | |||||||||||||
| 474,980 | Autonomy Corp Plc * | 8,186,024 | |||||||||||||
| 4,831,996 | BG Group Plc | 69,070,401 | |||||||||||||
| 366,707 | BHP Billiton Plc | 5,715,065 | |||||||||||||
| 1,043,329 | British American Tobacco Plc | 26,667,864 | |||||||||||||
| 578,429 | Burberry Group Plc | 2,110,525 | |||||||||||||
| 455,439 | Cadbury Plc | 3,467,501 | |||||||||||||
| 1,064,945 | Capita Group Plc | 10,049,238 | |||||||||||||
| 2,570,529 | Centrica Plc | 9,885,502 | |||||||||||||
| 1,436,721 | Cobham Plc | 3,943,521 | |||||||||||||
| 2,520,964 | Diageo Plc | 29,069,870 | |||||||||||||
| 629,647 | Drax Group Plc | 4,651,598 | |||||||||||||
| 6,416,651 | GlaxoSmithKline Plc | 97,320,062 | |||||||||||||
| 1,008,988 | HSBC Holdings Plc | 7,017,655 | |||||||||||||
| 424,438 | Imperial Tobacco Group Plc | 10,161,867 | |||||||||||||
| 1,353,738 | Man Group Plc | 3,292,681 | |||||||||||||
| 255,079 | Next Plc | 4,229,959 | |||||||||||||
| 565,177 | Petrofac Ltd | 3,774,971 | |||||||||||||
| 1,105,550 | Reckitt Benckiser Group Plc | 42,304,449 | |||||||||||||
| 1,159,107 | Reed Elsevier Plc | 8,659,130 | |||||||||||||
| 693,365 | Rio Tinto Plc | 17,699,630 | |||||||||||||
| 326,187 | Royal Dutch Shell Plc A Shares (London) | 7,161,208 | |||||||||||||
| 409,857 | Scottish & Southern Energy Plc | 6,678,814 | |||||||||||||
| 492,089 | Smith & Nephew Plc | 3,487,149 | |||||||||||||
| 311,560 | Standard Chartered Plc | 2,936,211 | |||||||||||||
| 1,040,647 | Tesco Plc | 4,935,228 | |||||||||||||
| 783,416 | Tullow Oil Plc | 8,135,639 | |||||||||||||
| 261,232 | Unilever Plc | 5,046,408 | |||||||||||||
See accompanying notes to the financial statements.
8
GMO International Growth Equity Fund
(A Series of GMO Trust)
Schedule of Investments — (Continued)
(showing percentage of total net assets)
February 28, 2009
| Shares / Par Value ($) | Description | Value ($) | |||||||||||||
| United Kingdom — continued | |||||||||||||||
| 7,238,224 | Vodafone Group Plc | 12,825,346 | |||||||||||||
| 471,008 | Xstrata Plc | 4,640,229 | |||||||||||||
| Total United Kingdom | 458,019,007 | ||||||||||||||
| TOTAL COMMON STOCKS (COST $2,929,986,355) | 1,870,330,609 | ||||||||||||||
| SHORT-TERM INVESTMENTS — 4.5% | |||||||||||||||
| 10,800,000 | BNP Paribas Time Deposit, 0.23%, due 03/02/09 | 10,800,000 | |||||||||||||
| 58,337 | Brown Brothers Harriman Time Deposit, 0.01% - 2.45%, due 03/02/09 | 58,337 | |||||||||||||
| 3,348,095 | Citibank Time Deposit, 0.05% - 0.08%, due 03/02/09 | 3,348,095 | |||||||||||||
| 74,146 | HSBC Bank (Hong Kong) Time Deposit, 0.01%, due 03/02/09 | 74,146 | |||||||||||||
| 25,000,000 | HSBC Bank (USA) Time Deposit, 0.19%, due 03/02/09 | 25,000,000 | |||||||||||||
| 25,000,000 | Royal Bank of Canada Time Deposit, 0.20%, due 03/02/09 | 25,000,000 | |||||||||||||
| 25,130,625 | Societe Generale Time Deposit, 0.25% - 0.33%, due 03/02/09 | 25,130,625 | |||||||||||||
| TOTAL SHORT-TERM INVESTMENTS (COST $89,411,203) | 89,411,203 | ||||||||||||||
| TOTAL INVESTMENTS — 98.8% (Cost $3,019,397,558) | 1,959,741,812 | ||||||||||||||
| Other Assets and Liabilities (net) — 1.2% | 24,732,583 | ||||||||||||||
| TOTAL NET ASSETS — 100.0% | $ | 1,984,474,395 | |||||||||||||
See accompanying notes to the financial statements.
9
GMO International Growth Equity Fund
(A Series of GMO Trust)
Schedule of Investments — (Continued)
February 28, 2009
A summary of outstanding financial instruments at February 28, 2009 is as follows:
Forward Currency Contracts
| Settlement Date | Deliver/Receive | Units of Currency | Value | Net Unrealized Appreciation (Depreciation) | |||||||||||||||
| Buys | |||||||||||||||||||
| 4/24/09 | CHF | 53,863,444 | $ | 46,094,862 | $ | (422,552 | ) | ||||||||||||
| 4/24/09 | CHF | 4,874,940 | 4,171,840 | (9,069 | ) | ||||||||||||||
| 4/24/09 | EUR | 13,060,238 | 16,552,842 | 102,558 | |||||||||||||||
| 4/24/09 | GBP | 17,217,159 | 24,645,537 | (299,114 | ) | ||||||||||||||
| 4/24/09 | JPY | 5,209,544,269 | 53,437,760 | (3,046,510 | ) | ||||||||||||||
| 4/24/09 | JPY | 3,348,992,744 | 34,352,846 | (2,083,507 | ) | ||||||||||||||
| 4/24/09 | JPY | 3,348,992,744 | 34,352,846 | (2,078,949 | ) | ||||||||||||||
| 4/24/09 | JPY | 3,348,992,744 | 34,352,846 | (2,067,816 | ) | ||||||||||||||
| 4/24/09 | JPY | 3,348,992,744 | 34,352,846 | (2,095,562 | ) | ||||||||||||||
| 4/24/09 | NZD | 16,225,269 | 8,097,312 | (97,665 | ) | ||||||||||||||
| 4/24/09 | SEK | 140,075,846 | 15,551,231 | (476,904 | ) | ||||||||||||||
| 4/24/09 | SEK | 140,075,846 | 15,551,231 | (484,157 | ) | ||||||||||||||
| 4/24/09 | SEK | 140,075,846 | 15,551,231 | (452,590 | ) | ||||||||||||||
| 4/24/09 | SEK | 140,075,846 | 15,551,231 | (517,765 | ) | ||||||||||||||
| 4/24/09 | SEK | 140,075,846 | 15,551,231 | (516,567 | ) | ||||||||||||||
| 4/24/09 | SEK | 140,075,846 | 15,551,231 | (497,973 | ) | ||||||||||||||
| 4/24/09 | SEK | 140,075,846 | 15,551,231 | (323,365 | ) | ||||||||||||||
| 4/24/09 | SGD | 93,026,088 | 60,083,246 | (854,293 | ) | ||||||||||||||
| $ | 459,353,400 | $ | (16,221,800 | ) | |||||||||||||||
| Sales | |||||||||||||||||||
| 4/24/09 | AUD | 36,890,883 | $ | 23,503,206 | $ | (106,639 | ) | ||||||||||||
| 4/24/09 | AUD | 35,805,857 | 22,811,935 | (49,078 | ) | ||||||||||||||
| 4/24/09 | AUD | 35,805,857 | 22,811,935 | (94,695 | ) | ||||||||||||||
| 4/24/09 | CAD | 22,194,247 | 17,446,764 | 124,487 | |||||||||||||||
| 4/24/09 | CAD | 22,194,247 | 17,446,764 | 116,422 | |||||||||||||||
| 4/24/09 | CAD | 22,194,247 | 17,446,764 | 100,592 | |||||||||||||||
| 4/24/09 | CAD | 22,194,247 | 17,446,764 | 81,800 | |||||||||||||||
| 4/24/09 | CHF | 24,088,310 | 20,614,117 | (83,199 | ) | ||||||||||||||
| 4/24/09 | EUR | 14,149,814 | 17,933,795 | 217,445 | |||||||||||||||
| 4/24/09 | GBP | 18,135,087 | 25,959,507 | (181,931 | ) | ||||||||||||||
See accompanying notes to the financial statements.
10
GMO International Growth Equity Fund
(A Series of GMO Trust)
Schedule of Investments — (Continued)
February 28, 2009
Forward Currency Contracts — continued
| Settlement Date | Deliver/Receive | Units of Currency | Value | Net Unrealized Appreciation (Depreciation) | |||||||||||||||
| 4/24/09 | GBP | 18,135,087 | $ | 25,959,507 | $ | (166,698 | ) | ||||||||||||
| 4/24/09 | GBP | 18,135,087 | 25,959,507 | (99,689 | ) | ||||||||||||||
| 4/24/09 | GBP | 36,270,173 | 51,919,012 | (191,398 | ) | ||||||||||||||
| 4/24/09 | HKD | 125,056,500 | 16,132,590 | 3,108 | |||||||||||||||
| 4/24/09 | HKD | 125,056,500 | 16,132,590 | 1,651 | |||||||||||||||
| 4/24/09 | JPY | 1,691,692,857 | 17,352,819 | 1,537,591 | |||||||||||||||
| 4/24/09 | NOK | 54,700,258 | 7,767,312 | 22,500 | |||||||||||||||
| 4/24/09 | SGD | 71,963,888 | 46,479,692 | 1,319,376 | |||||||||||||||
| $ | 411,124,580 | $ | 2,551,645 | ||||||||||||||||
Futures Contracts
| Number of Contracts | Type | Expiration Date | Contract Value | Net Unrealized Appreciation (Depreciation) | |||||||||||||||
| Buys | |||||||||||||||||||
| 139 | CAC 40 | March 2009 | $ | 4,696,207 | $ | (364,804 | ) | ||||||||||||
| 849 | FTSE 100 | March 2009 | 45,839,953 | (6,337,480 | ) | ||||||||||||||
| $ | 50,536,160 | $ | (6,702,284 | ) | |||||||||||||||
| Sales | |||||||||||||||||||
| 31 | Hang Seng | March 2009 | $ | 2,505,192 | $ | 35,674 | |||||||||||||
As of February 28, 2009, for the futures contracts held, the Fund had sufficient cash and/or securities to cover any commitments or margin requirements of the relevant broker or exchange.
See accompanying notes to the financial statements.
11
GMO International Growth Equity Fund
(A Series of GMO Trust)
Schedule of Investments — (Continued)
February 28, 2009
Notes to Schedule of Investments:
* Non-income producing security.
Currency Abbreviations:
AUD - Australian Dollar
CAD - Canadian Dollar
CHF - Swiss Franc
EUR - Euro
GBP - British Pound
HKD - Hong Kong Dollar
JPY - Japanese Yen
NOK - Norwegian Krone
NZD - New Zealand Dollar
SEK - Swedish Krona
SGD - Singapore Dollar
See accompanying notes to the financial statements.
12
GMO International Growth Equity Fund
(A Series of GMO Trust)
Statement of Assets and Liabilities — February 28, 2009
| Assets: | |||||||
| Investments, at value (cost $3,019,397,558) (Note 2) | $ | 1,959,741,812 | |||||
| Foreign currency, at value (cost $8,591) (Note 2) | 8,548 | ||||||
| Receivable for Fund shares sold | 24,556,799 | ||||||
| Dividends and interest receivable | 6,735,598 | ||||||
| Foreign taxes receivable | 1,064,852 | ||||||
| Unrealized appreciation on open forward currency contracts (Note 2) | 3,627,530 | ||||||
| Receivable for collateral on open futures contracts (Note 2) | 8,977,155 | ||||||
| Receivable for expenses reimbursed by Manager (Note 3) | 11,592 | ||||||
| Total assets | 2,004,723,886 | ||||||
| Liabilities: | |||||||
| Payable for Fund shares repurchased | 7,820 | ||||||
| Payable to affiliate for (Note 3): | |||||||
| Management fee | 804,586 | ||||||
| Shareholder service fee | 169,563 | ||||||
| Trustees and Chief Compliance Officer of GMO Trust fees | 7,625 | ||||||
| Payable for variation margin on open futures contracts (Note 2) | 1,419,262 | ||||||
| Unrealized depreciation on open forward currency contracts (Note 2) | 17,297,685 | ||||||
| Miscellaneous payable | 27,242 | ||||||
| Accrued expenses | 515,708 | ||||||
| Total liabilities | 20,249,491 | ||||||
| Net assets | $ | 1,984,474,395 | |||||
| Net assets consist of: | |||||||
| Paid-in capital | $ | 3,487,831,610 | |||||
| Accumulated undistributed net investment income | 75,464,465 | ||||||
| Accumulated net realized loss | (498,753,989 | ) | |||||
| Net unrealized depreciation | (1,080,067,691 | ) | |||||
| $ | 1,984,474,395 | ||||||
| Net assets attributable to: | |||||||
| Class III shares | $ | 564,066,993 | |||||
| Class IV shares | $ | 1,420,407,402 | |||||
| Shares outstanding: | |||||||
| Class III | 39,015,984 | ||||||
| Class IV | 98,212,905 | ||||||
| Net asset value per share: | |||||||
| Class III | $ | 14.46 | |||||
| Class IV | $ | 14.46 | |||||
See accompanying notes to the financial statements.
13
GMO International Growth Equity Fund
(A Series of GMO Trust)
Statement of Operations — Year Ended February 28, 2009
| Investment Income: | |||||||
| Dividends (net of withholding taxes of $7,842,572) | $ | 87,637,220 | |||||
| Securities lending income | 1,966,624 | ||||||
| Interest | 1,625,008 | ||||||
| Total investment income | 91,228,852 | ||||||
| Expenses: | |||||||
| Management fee (Note 3) | 15,090,970 | ||||||
| Shareholder service fee – Class III (Note 3) | 1,205,037 | ||||||
| Shareholder service fee – Class IV (Note 3) | 1,950,314 | ||||||
| Custodian and fund accounting agent fees | 1,433,154 | ||||||
| Transfer agent fees | 44,359 | ||||||
| Audit and tax fees | 87,184 | ||||||
| Legal fees | 74,954 | ||||||
| Trustees fees and related expenses (Note 3) | 38,424 | ||||||
| Registration fees | 5,385 | ||||||
| Miscellaneous | 48,734 | ||||||
| Total expenses | 19,978,515 | ||||||
| Fees and expenses reimbursed by Manager (Note 3) | (1,671,830 | ) | |||||
| Expense reductions (Note 2) | (11,901 | ) | |||||
| Net expenses | 18,294,784 | ||||||
| Net investment income (loss) | 72,934,068 | ||||||
| Realized and unrealized gain (loss): | |||||||
| Net realized gain (loss) on: | |||||||
| Investments | (448,028,290 | ) | |||||
| Closed futures contracts | (48,869,386 | ) | |||||
| Foreign currency, forward contracts and foreign currency related transactions | 64,658,857 | ||||||
| Net realized gain (loss) | (432,238,819 | ) | |||||
| Change in net unrealized appreciation (depreciation) on: | |||||||
| Investments | (1,202,509,614 | ) | |||||
| Open futures contracts | 11,872,928 | ||||||
| Foreign currency, forward contracts and foreign currency related transactions | (26,375,332 | ) | |||||
| Net unrealized gain (loss) | (1,217,012,018 | ) | |||||
| Net realized and unrealized gain (loss) | (1,649,250,837 | ) | |||||
| Net increase (decrease) in net assets resulting from operations | $ | (1,576,316,769 | ) | ||||
See accompanying notes to the financial statements.
14
GMO International Growth Equity Fund
(A Series of GMO Trust)
Statement of Changes in Net Assets
| Year Ended February 28, 2009 | Year Ended February 29, 2008 | ||||||||||
| Increase (decrease) in net assets: | |||||||||||
| Operations: | |||||||||||
| Net investment income (loss) | $ | 72,934,068 | $ | 88,762,173 | |||||||
| Net realized gain (loss) | (432,238,819 | ) | 588,918,771 | ||||||||
| Change in net unrealized appreciation (depreciation) | (1,217,012,018 | ) | (429,914,938 | ) | |||||||
| Net increase (decrease) in net assets from operations | (1,576,316,769 | ) | 247,766,006 | ||||||||
| Distributions to shareholders from: | |||||||||||
| Net investment income | |||||||||||
| Class III | (30,802,113 | ) | (12,574,532 | ) | |||||||
| Class IV | (84,945,522 | ) | (33,113,153 | ) | |||||||
| Total distributions from net investment income | (115,747,635 | ) | (45,687,685 | ) | |||||||
| Net realized gains | |||||||||||
| Class III | (33,779,254 | ) | (165,474,422 | ) | |||||||
| Class IV | (88,650,878 | ) | (436,843,880 | ) | |||||||
| Total distributions from net realized gains | (122,430,132 | ) | (602,318,302 | ) | |||||||
| (238,177,767 | ) | (648,005,987 | ) | ||||||||
| Net share transactions (Note 7): | |||||||||||
| Class III | 40,576,827 | 195,928,030 | |||||||||
| Class IV | 223,699,073 | (76,118,558 | ) | ||||||||
| Increase (decrease) in net assets resulting from net share transactions | 264,275,900 | 119,809,472 | |||||||||
| Total increase (decrease) in net assets | (1,550,218,636 | ) | (280,430,509 | ) | |||||||
| Net assets: | |||||||||||
| Beginning of period | 3,534,693,031 | 3,815,123,540 | |||||||||
| End of period (including accumulated undistributed net investment income of $75,464,465 and $55,413,766, respectively) | $ | 1,984,474,395 | $ | 3,534,693,031 | |||||||
See accompanying notes to the financial statements.
15
GMO International Growth Equity Fund
(A Series of GMO Trust)
Financial Highlights
(For a Class III share outstanding throughout each period)
| Year Ended February 28/29, | |||||||||||||||||||||||
| 2009 | 2008 | 2007 | 2006 | 2005 | |||||||||||||||||||
| Net asset value, beginning of period | $ | 27.68 | $ | 31.37 | $ | 29.90 | $ | 27.22 | $ | 23.67 | |||||||||||||
| Income (loss) from investment operations: | |||||||||||||||||||||||
| Net investment income (loss)† | 0.54 | 0.69 | 0.77 | 0.53 | 0.40 | ||||||||||||||||||
| Net realized and unrealized gain (loss) | (11.93 | ) | 1.28 | 4.80 | 3.57 | 3.94 | |||||||||||||||||
| Total from investment operations | (11.39 | ) | 1.97 | 5.57 | 4.10 | 4.34 | |||||||||||||||||
| Less distributions to shareholders: | |||||||||||||||||||||||
| From net investment income | (0.88 | ) | (0.40 | ) | (0.49 | ) | (0.10 | ) | (0.33 | ) | |||||||||||||
| From net realized gains | (0.95 | ) | (5.26 | ) | (3.61 | ) | (1.32 | ) | (0.46 | ) | |||||||||||||
| Total distributions | (1.83 | ) | (5.66 | ) | (4.10 | ) | (1.42 | ) | (0.79 | ) | |||||||||||||
| Net asset value, end of period | $ | 14.46 | $ | 27.68 | $ | 31.37 | $ | 29.90 | $ | 27.22 | |||||||||||||
| Total Return(a) | (43.54 | )% | 5.04 | % | 19.21 | % | 15.54 | % | 18.66 | % | |||||||||||||
| Ratios/Supplemental Data: | |||||||||||||||||||||||
| Net assets, end of period (000's) | $ | 564,067 | $ | 1,018,040 | $ | 950,332 | $ | 3,119,919 | $ | 1,653,053 | |||||||||||||
| Net expenses to average daily net assets | 0.66 | %(b) | 0.67 | %(b) | 0.67 | % | 0.68 | % | 0.69 | % | |||||||||||||
| Net investment income to average daily net assets | 2.43 | % | 2.13 | % | 2.46 | % | 1.89 | % | 1.64 | % | |||||||||||||
| Portfolio turnover rate | 63 | % | 92 | % | 74 | % | 57 | % | 52 | % | |||||||||||||
| Fees and expenses reimbursed by the Manager to average daily net assets: | 0.06 | % | 0.05 | % | 0.05 | % | 0.08 | % | 0.09 | % | |||||||||||||
(a) The total returns would have been lower had certain expenses not been reimbursed during the periods shown and assumes the effect of reinvested distributions.
(b) The net expense ratio does not include the effect of expense reductions, except for reimbursements related to securities lending transactions (Note 2).
† Calculated using average shares outstanding throughout the period.
See accompanying notes to the financial statements.
16
GMO International Growth Equity Fund
(A Series of GMO Trust)
Financial Highlights
(For a Class IV share outstanding throughout each period)
| Year Ended February 28/29, | |||||||||||||||
| 2009 | 2008 | 2007(a) | |||||||||||||
| Net asset value, beginning of period | $ | 27.70 | $ | 31.38 | $ | 29.92 | |||||||||
| Income (loss) from investment operations: | |||||||||||||||
| Net investment income (loss)† | 0.55 | 0.73 | 0.20 | ||||||||||||
| Net realized and unrealized gain (loss) | (11.95 | ) | 1.26 | 4.48 | |||||||||||
| Total from investment operations | (11.40 | ) | 1.99 | 4.68 | |||||||||||
| Less distributions to shareholders: | |||||||||||||||
| From net investment income | (0.89 | ) | (0.41 | ) | (0.50 | ) | |||||||||
| From net realized gains | (0.95 | ) | (5.26 | ) | (2.72 | ) | |||||||||
| Total distributions | (1.84 | ) | (5.67 | ) | (3.22 | ) | |||||||||
| Net asset value, end of period | $ | 14.46 | $ | 27.70 | $ | 31.38 | |||||||||
| Total Return(b) | (43.53 | )% | 5.11 | % | 15.79 | %** | |||||||||
| Ratios/Supplemental Data: | |||||||||||||||
| Net assets, end of period (000's) | $ | 1,420,407 | $ | 2,516,653 | $ | 2,864,791 | |||||||||
| Net expenses to average daily net assets | 0.60 | %(c) | 0.61 | %(c) | 0.61 | %* | |||||||||
| Net investment income to average daily net assets | 2.47 | % | 2.24 | % | 1.01 | %* | |||||||||
| Portfolio turnover rate | 63 | % | 92 | % | 74 | %†† | |||||||||
| Fees and expenses reimbursed by the Manager to average daily net assets: | 0.06 | % | 0.05 | % | 0.05 | %* | |||||||||
(a) Period from July 12, 2006 (commencement of operations) through February 28, 2007.
(b) The total returns would have been lower had certain expenses not been reimbursed during the periods shown and assumes the effect of reinvested distributions.
(c) The net expense ratio does not include the effect of expense reductions, except for reimbursements related to securities lending transactions (Note 2).
† Calculated using average shares outstanding throughout the period.
†† Calculation represents portfolio turnover of the Fund for the year ended February 28, 2007.
* Annualized.
** Not annualized.
See accompanying notes to the financial statements.
17
GMO International Growth Equity Fund
(A Series of GMO Trust)
Notes to Financial Statements
February 28, 2009
1. Organization
GMO International Growth Equity Fund (the "Fund") is a series of GMO Trust (the "Trust"). The Fund is registered under the Investment Company Act of 1940, as amended, as an open-end, non-diversified management investment company. The Fund is advised and managed by Grantham, Mayo, Van Otterloo & Co. LLC (the "Manager" or "GMO"). The Trust was established as a Massachusetts business trust under the laws of The Commonwealth of Massachusetts on June 24, 1985. The Declaration of Trust permits the Trustees of the Trust ("Trustees") to create an unlimited number of series of shares ("Funds") and to subdivide Funds into classes.
The Fund seeks high total return. The Fund seeks to achieve its objective by outperforming the MSCI EAFE Growth Index. The Fund typically makes equity investments in companies from developed countries, other than the U.S. Effective January 1, 2009, the Fund changed its benchmark from the S&P EPAC Large Mid Cap Growth Index (formerly S&P/Citigroup Primary Market Index ("PMI") Europe, Pacific Asia Composite ("EPAC") Growth Index) to the MSCI EAFE Growth Index to better reflect a more appropriate, comparative, broad-based market index for the Fund.
Throughout the year ended February 28, 2009, the Fund had two classes of shares outstanding: Class III and Class IV. Each class of shares bears a different level of shareholder service fees.
2. Significant accounting policies
The following is a summary of significant accounting policies followed by the Fund in the preparation of its financial statements. These policies are in conformity with accounting principles generally accepted in the United States of America ("U.S. GAAP") and have been consistently followed by the Fund in preparing its financial statements. The preparation of financial statements in accordance with U.S. GAAP requires management to make estimates and assumptions that affect the reported amounts and disclosures in the financial statements. Actual results could differ from those estimates. The accounting records of the Fund are maintained in U.S. dollars.
Portfolio valuation
Securities listed on a securities exchange for which market quotations are readily available are valued at the last sale price or official closing price on each business day, or if there is no such reported sale or official closing price, at the most recent quoted bid price. Unlisted securities for which market quotations are readily available are generally valued at the most recent quoted bid price. Debt instruments with a remaining maturity of sixty days or less are generally valued at amortized cost, which approximates fair value. Shares of investment funds are generally valued at their net asset value. Securities for which quotations are not readily available or whose values the Manager has determined to be unreliable are valued at fair value as determined in good faith by the Trustees or persons acting at their direction pursuant to procedures approved by the Trustees. By its nature, a fair value price is a good faith estim ate
18
GMO International Growth Equity Fund
(A Series of GMO Trust)
Notes to Financial Statements — (Continued)
February 28, 2009
of the value of a security at a given point in time and may not reflect the value that would be realized if the security were sold. The difference between a fair value price and the value realized upon a sale could be material. Because many foreign equity securities markets and exchanges close prior to the close of the New York Stock Exchange ("NYSE"), closing prices for foreign securities in those markets or on those exchanges do not reflect the events that occur after that close but before the close of the NYSE. As a result, the Fund generally values foreign equity securities using fair value prices, which are based on adjustments to closing prices supplied by a third party vendor based on that vendor's proprietary models. As of February 28, 2009, 85.05% of the net assets of the Fund were valued using fair value prices based on models used by a third party vendor.
In September 2006, the Financial Accounting Standards Board ("FASB") issued Statement of Financial Accounting Standards No. 157, Fair Value Measurements ("SFAS 157"). SFAS 157 is effective for the Fund's current fiscal year. While the adoption of SFAS 157 does not have an effect on the Fund's net asset value, it does require additional disclosures about fair value measurements. SFAS 157 establishes a three-level hierarchy for disclosure of fair value measurements. The valuation hierarchy is based upon the reliability of inputs to the valuation of the Fund's investments. The three levels are defined as follows:
Level 1 – Valuations based on quoted prices for identical securities in active markets.
Level 2 – Valuations determined using other significant direct or indirect observable inputs.
Level 3 – Valuations based on inputs that are unobservable and significant.
The inputs or methodology used for valuing securities are not necessarily an indication of the risk associated with investing in those securities.
The following is a summary of the fair valuations according to inputs used as of February 28, 2009 in valuing the Fund's investments:
| Asset Valuation Inputs | Investments in Securities | Other Financial Instruments* | |||||||||
| Level 1 - Quoted Prices | $ | 271,972,023 | $ | — | |||||||
| Level 2 - Other Significant Observable Inputs | 1,687,769,789 | 3,663,204 | |||||||||
| Level 3 - Significant Unobservable Inputs | — | — | |||||||||
| Total | $ | 1,959,741,812 | $ | 3,663,204 | |||||||
* Other financial instruments include forward currency contracts and futures contracts.
19
GMO International Growth Equity Fund
(A Series of GMO Trust)
Notes to Financial Statements — (Continued)
February 28, 2009
| Liability Valuation Inputs | Investments in Securities | Other Financial Instruments** | |||||||||
| Level 1 - Quoted Prices | $ | — | $ | — | |||||||
| Level 2 - Other Significant Observable Inputs | — | (23,999,969 | ) | ||||||||
| Level 3 - Significant Unobservable Inputs | — | — | |||||||||
| Total | $ | — | $ | (23,999,969 | ) | ||||||
** Other financial instruments include forward currency contracts and futures contracts.
The Fund held no investments or other financial instruments at either February 29, 2008 or February 28, 2009, whose fair value was determined using Level 3 inputs.
Foreign currency translation
The market values of foreign securities, currency holdings and related assets and liabilities are translated to U.S. dollars based on the 4 p.m. New York time exchange rates each business day. Income and expenses denominated in foreign currencies are translated at the 4 p.m. New York time exchange rates on the business day the income and expenses are accrued or incurred. The Fund does not isolate realized and unrealized gains and losses attributable to changes in exchange rates from gains and losses that arise from changes in the market value of investments. Such fluctuations are included with net realized and unrealized gain or loss on investments. Net realized gains and losses on foreign currency transactions represent gains and losses on disposition of currencies and forward currency contracts, currency gains and losses realized between the trade and settlement dates on securities transactions, and the difference between the amount of investment income and foreign withholding taxes recorded on the Fund's accounting records and the U.S. dollar equivalent amounts actually received or paid.
Forward currency contracts
The Fund may enter into forward currency contracts including forward cross currency contracts. A forward currency contract is an agreement between two parties to buy and sell a currency at a set price on a future date. The market value of a forward currency contract fluctuates with changes in forward currency exchange rates. Forward currency contracts are marked to market daily using rates supplied by a quotation service and changes in value are recorded by the Fund as an unrealized gain or loss. Realized gains or losses equal to the difference between the value of the contract at the time it was opened and the value at the time it was closed are recorded upon delivery or receipt of the currency or, if a forward currency contract is offset by entering into another forward currency contract with the same broker, upon settlement of the net gain or loss. These contracts may involve market risk in excess of the unrealized gain or lo ss reflected in the Fund's Statement of Assets and Liabilities. They expose the Fund to the risk of unfavorable movements in currency values and the risk that the counterparty will be unable or unwilling to meet the terms of the contracts. Forward currency contracts outstanding at the end of the period are listed in the Fund's Schedule of Investments.
20
GMO International Growth Equity Fund
(A Series of GMO Trust)
Notes to Financial Statements — (Continued)
February 28, 2009
Futures contracts
The Fund may purchase and sell futures contracts. Upon entering into a futures contract, the Fund is required to deposit cash, U.S. government and agency obligations, or other liquid assets with the futures clearing broker in accordance with the initial margin requirements of the broker or exchange. In addition, the Fund maintains cash or securities in an amount that at least equals the net amount payable in the event the Fund must deliver the full amount of the contract. Futures contracts are marked to market daily and an appropriate payable or receivable for the change in value ("variation margin") is recorded by the Fund. The payable or receivable is settled on the following business day. Gains or losses are recognized but not considered realized until the contracts expire or are closed. Futures contracts involve, to varying degrees, risk of loss in excess of the variation margin disclosed in the Statement of Assets and Liabi lities. Under some circumstances, futures exchanges may establish daily limits on the amount that the price of a futures contract can vary from the previous day's settlement price, thereby effectively preventing liquidation of unfavorable positions. Losses may arise from changes in the value of the underlying instrument if the Fund is unable to liquidate a futures position due to an illiquid secondary market for the contract or the imposition of price limits, or if counterparties do not perform under the contract terms. Futures contracts are generally valued at the settlement price established each day by the board of trade or exchange on which they are traded. Because many foreign exchanges close prior to the close of the New York Stock Exchange ("NYSE"), closing prices for foreign futures in those markets or on those markets or on those exchanges do not reflect the events that occur after that close but before the close of the NYSE. As a result, the Fund generally values foreign futures using fair value pr ices, which are based on adjustments to closing prices supplied by a third party vendor based on that vendor's proprietary models. Futures contracts outstanding at the end of the period are listed in the Fund's Schedule of Investments.
Options
The Fund may write (i.e., sell) call and put options. Writing options alters the Fund's exposure to the underlying instrument by, in the case of a call option, obligating the Fund to sell the underlying instrument at a set price to the option-holder and, in the case of a put option, obligating the Fund to purchase the underlying instrument at a set price from the option-holder. In the case of an index option, settlement will be in cash. When the Fund writes a call or put option, an amount equal to the premium received is recorded as a liability and subsequently marked to market to reflect the current value of the option written. Premiums received from writing options that expire are treated as realized gains. Premiums received from writing options that are exercised or closed are deducted from the amounts paid on the underlying future, security or currency transaction to determine the realized gain or loss. The Fund as a writer of an option has no control over whether the underlying future, security or currency may be sold (call) or purchased (put) and as a result bears the market risk of an unfavorable change in the price of the future, security or currency underlying the option. In the event that the Fund writes uncovered put or call options (i.e. options for investments that the Fund does not own), it bears the risk of substantial losses if the price of the underlying instrument increases during the term of the option. Options expose the Fund to the risk the Fund may not be able to enter into a closing transaction because of an illiquid market. The Fund had no open written option contracts during the period.
21
GMO International Growth Equity Fund
(A Series of GMO Trust)
Notes to Financial Statements — (Continued)
February 28, 2009
The Fund may also purchase put and call options. Purchasing options alters the Fund's exposure to the underlying instrument by, in the case of a call option, entitling the Fund to purchase the underlying instrument at a set price from the writer of the option and, in the case of a put option, entitling the Fund to sell the underlying instrument at a set price to the writer of the option. The Fund pays a premium for a purchased option. That premium is disclosed in the Schedule of Investments and is subsequently marked to market to reflect the current value of the option. Premiums paid for purchasing options that expire are treated as realized losses. Premiums paid for purchasing options that are exercised or closed are deducted from the proceeds on the closing transaction to determine the realized gain or loss. The risk associated with purchasing put and call options is limited to the premium paid. The Fund had no purchased optio n contracts outstanding at the end of the period.
The Fund values exchange traded options at the last sale price, or if no sale is reported, the last bid price for options it has purchased and the last ask price for options it has written. The Fund values options traded over-the-counter using inputs provided by primary pricing sources and industry standard models.
Swap agreements
The Fund may enter into various types of swap agreements, including without limitation, interest rate, total return, credit default and variance swap agreements. A swap agreement is an agreement to exchange the return generated by one instrument for the return generated by another instrument. When entering into a swap agreement, the Fund and/or the swap counterparty may post or receive cash or securities as collateral. The party posting the collateral typically receives the interest associated with or payments related to the collateral and has the risk of loss related to the collateral.
Interest rate swap agreements involve an exchange by the parties of their respective commitments to pay or right to receive interest, e.g., an exchange of floating rate interest payments for fixed rate interest payments with respect to the notional amount of principal.
Total return swap agreements involve a commitment by one party to pay interest to the other party in exchange for a payment to it from the other party based on the return of a reference instrument (e.g., a security or basket of securities), both based on notional amounts. To the extent the return of the reference instrument exceeds or falls short of the interest payments, one party will receive a payment from or make a payment to the other party.
In a credit default swap agreement, one party makes payments to another party in exchange for the right to receive a specified return if a credit event occurs with respect to a referenced entity or entities. Buying credit default protection reduces the buyer's exposure in the event of an issuer's default (e.g., it reduces risk where a party owns a security issued by or otherwise has exposure to the issuer). Selling credit default protection subjects the seller to exposure to an issuer's default. A seller of credit default protection receives payments in return for its obligation to pay the principal amount of a debt security (or other agreed-upon value) to the other party upon the occurrence of a credit event (e.g., issuer default or similar
22
GMO International Growth Equity Fund
(A Series of GMO Trust)
Notes to Financial Statements — (Continued)
February 28, 2009
event). If no credit event occurs, the seller has no payment obligations. For credit default swap agreements on asset-backed securities, a credit event may be triggered by such events as the issuer's failure to pay interest or principal, an agreement of the holders of an asset-backed security to a maturity extension, a rating downgrade on the security or a write-down on the collateral underlying the security. For credit default swap agreements on corporate or sovereign issuers, a credit event may be triggered by such events as the issuer's bankruptcy, failure to pay interest or principal, repudiation/moratorium or restructuring.
Variance swap agreements involve an agreement by two parties to exchange cash flows based on the measured variance (or square of volatility) of a specified underlying asset. One party agrees to exchange a "fixed rate" or strike price payment for the "floating rate" or realized price variance on the underlying asset with respect to the notional amount. At inception, the strike price chosen is generally fixed at a level such that the fair value of the swap is zero. At the expiration date, the amount paid by one party to the other is the difference between the realized price variance of the underlying asset and the strike price multiplied by the notional amount. A receiver of the realized price variance would receive a payment when the realized price variance of the underlying asset is greater than the strike price and would make a payment when that variance is less than the strike price. A payer of the realized price variance woul d make a payment when the realized price variance of the underlying asset is greater than the strike price and would receive a payment when that variance is less than the strike price. This type of agreement is essentially a forward contract on the future realized price variance of the underlying asset.
The Fund prices its swap agreements daily using models that may incorporate quotations from market makers and records the change in value, if any, as unrealized gain or loss in the Statement of Operations. Payments received or made on swap agreements are recorded as realized gain or loss in the Statement of Operations. Gains or losses are realized upon termination of the swap agreements.
Swap agreements often are not actively traded on financial markets. The values assigned to them may differ significantly from the values that would be realized upon termination, and the differences could be material. Entering into swap agreements involves credit, legal, market and documentation risk that is not reflected in the amounts reported in the Statement of Assets and Liabilities. Such risks include the possibility that the party with whom the Fund contracts may default on its obligations to perform or disagree as to the meaning of contractual terms, or that the collateral that party posts may be insufficient or not timely received by the Fund. Credit risk may be particularly acute in an environment where financial services firms are exposed to systemic risks of the type evidenced by the insolvency of Lehman Brothers and subsequent market disruptions. The Fund had no swap agreements outstanding at the end of the period.
Securities lending
The Fund may lend its securities to qualified brokers. The loans are collateralized with cash or liquid securities with a market value at least equal to the market value of the securities upon entering into the loan. As with other extensions of credit, the Fund may bear the risk of loss with respect to the investment
23
GMO International Growth Equity Fund
(A Series of GMO Trust)
Notes to Financial Statements — (Continued)
February 28, 2009
of the collateral, the risk of delay in and/or inability to exercise its rights with respect to the collateral, and the risk of delay in recovery or loss of rights in the loaned securities should the borrower of the securities fail financially. If a loan is collateralized by U.S. government securities, the Fund receives a fee from the borrower. If a loan is collateralized by cash, the Fund typically invests the cash collateral for its own account. As of February 28, 2009 the Fund had no securities on loan.
Taxes and distributions
The Fund intends to qualify each tax year as a regulated investment company under Subchapter M of the Internal Revenue Code of 1986, as amended (the "Code"). The Fund intends to distribute substantially all of its net investment income and all of its net realized short-term and long-term capital gain, if any, after giving effect to any available capital loss carryforwards for U.S. federal income tax purposes. Therefore, no provision for U.S. federal income or excise tax is necessary. Taxes on foreign interest and dividend income are generally withheld in accordance with the applicable country's tax treaty with the United States. The foreign withholding rates applicable to a Fund's investments in certain foreign jurisdictions may be higher if a significant portion of the Fund is held by non-U.S. shareholders.
The Fund's policy is to declare and pay distributions from net investment income, if any, semiannually, and from net realized short-term and long-term capital gain, if any, at least annually. All distributions are paid in shares of the Fund, at net asset value, unless the shareholder elects to receive cash distributions. Distributions to shareholders are recorded by the Fund on the ex-dividend date.
Foreign taxes paid by the Fund may be treated, to the extent permissible under the Code and if the Fund so elects, as if paid by the shareholders of the Fund.
The Fund may be subject to capital gains and repatriation taxes imposed by certain countries in which it invests.
Income and capital gain distributions are determined in accordance with U.S. federal income tax regulations, which may differ from U.S. GAAP. Certain capital accounts in the financial statements are periodically adjusted for permanent differences in order to reflect their tax character. These adjustments have no impact on net assets or net asset value per share. Temporary differences that arise from recognizing certain items of income, expense, gain or loss in different periods for financial statement and tax purposes will reverse at some time in the future. Distributions in excess of net investment income or net realized gains are temporary over-distributions for financial statement purposes resulting from differences in the recognition or classification of income or distributions for financial statement and tax purposes.
U.S. GAAP and tax accounting differences primarily relate to capital loss carryforwards, losses on wash sale transactions, foreign currency transactions and post-October capital losses.
24
GMO International Growth Equity Fund
(A Series of GMO Trust)
Notes to Financial Statements — (Continued)
February 28, 2009
The following reclassification represents the amount necessary to report the stated components of net assets on a tax basis, excluding certain temporary differences, as of February 28, 2009. The financial highlights exclude these adjustments.
| Accumulated Undistirbuted Net Investment Income | Accumulated Net Realized Loss | Paid-in Capital | |||||||||
| $ | 62,864,266 | $ | (62,864,266 | ) | $ | — | |||||
The tax character of distributions declared to shareholders is as follows:
| 2/28/2009 | 2/29/2008 | ||||||||||
| Ordinary income (including any net short-term capital gain) | $ | 115,766,584 | $ | 263,403,378 | |||||||
| Net long-term capital gain | 122,411,183 | 384,602,609 | |||||||||
| Total distributions | $ | 238,177,767 | $ | 648,005,987 | |||||||
Distributions in excess of tax basis earnings and profits, if significant, are reported in the financial statements as a return of capital for tax purposes.
As of February 28, 2009, the components of distributable earnings on a tax basis consisted of the following:
| Undistributed ordinary income (including any net short-term capital gain) | $ | 62,379,214 | |||||
As of February 28, 2009, the Fund had capital loss carryforwards available to offset future realized gains if any, to the extent permitted by the Code. Utilization of the capital loss carryforwards could be subject to limitations imposed by the Code related to share ownership activity. Such losses expire as follows:
| 2/28/2017 | $ | (208,609,786 | ) | ||||
| Total | $ | (208,609,786 | ) | ||||
As of February 28, 2009, the Fund elected to defer to March 1, 2009 post-October capital losses of $268,162,473.
25
GMO International Growth Equity Fund
(A Series of GMO Trust)
Notes to Financial Statements — (Continued)
February 28, 2009
As of February 28, 2009, the approximate cost for U.S. federal income tax purposes and gross and net unrealized appreciation (depreciation) in value of investments were as follows:
| Aggregate Cost | Gross Unrealized Appreciation | Gross Unrealized (Depreciation) | Net Unrealized Appreciation (Depreciation) | ||||||||||||
| $ | 3,041,352,048 | $ | 12,052,432 | $ | (1,093,662,668 | ) | $ | (1,081,610,236 | ) | ||||||
The Fund is subject to the provisions of Financial Accounting Standards Board Interpretation No. 48 ("FIN 48"), Accounting for Uncertainty in Income Taxes — an Interpretation of FASB Statement No. 109. FIN 48 sets forth a minimum threshold for financial statement recognition of a tax position taken or expected to be taken in a tax return that could affect the Fund's financial statements. The Fund did not have any unrecognized tax benefits or liabilities at February 28, 2009, nor did it have any increases or decreases in unrecognized tax benefits or liabilities for the period then ended. The Fund is subject to examination prior to the expiration of the statute of limitations by U.S. federal and state tax authorities for tax returns filed.
Security transactions and related investment income
Security transactions in the financial statements are accounted for on the trade date. Dividend income, net of applicable foreign withholding taxes, if any, is recorded on the ex-dividend date or, if later, when the Fund is informed of the ex-dividend date. Interest income is recorded on the accrual basis and is adjusted for the amortization of premiums and accretion of discounts. Principal on inflation indexed securities is adjusted for inflation and any increase or decrease is recorded as interest income or loss. Income is not recognized on securities for which collection is not expected. Non-cash dividends, if any, are recorded at the fair market value of the asset received. In determining the net gain or loss on securities sold, the Fund uses the identified cost basis for the purposes of determining the cost basis.
Expenses
The majority of the expenses of the Trust are directly identifiable to an individual fund. Expenses that are not readily identifiable to a specific fund are allocated taking into consideration, among other things, the nature and type of expense and the relative size of the funds. Investment income, common expenses and realized and unrealized gains and losses are allocated pro rata among the classes of shares of the Fund based on the relative net assets of each class. Shareholder service fees, which are directly attributable to a class of shares, are charged to that class's operations.
Brown Brothers Harriman & Co. ("BBH") serves as custodian and fund accounting agent of the Fund. State Street Bank and Trust Company ("State Street") serves as transfer agent of the Fund. BBH and State Street's fees may be reduced by an earnings allowance calculated on the average daily cash balances the Fund maintains with each agent. The Fund receives the benefit of the earnings allowance. In addition, Goldman Sachs Agency Lending, the Fund's securities lending agent, has agreed to reimburse the Fund
26
GMO International Growth Equity Fund
(A Series of GMO Trust)
Notes to Financial Statements — (Continued)
February 28, 2009
for certain transactional expenses related to securities lending activity. Credit balances or expense reimbursements used to reduce fees, if any, are reported as a reduction of expenses in the Statement of Operations.
Investment risks
The Fund is subject to risks involved in investing in foreign securities that are not presented by investments in U.S. securities. These risks may involve adverse political and economic developments, including expropriation and the possible imposition of capital controls or other foreign governmental laws or restrictions. In addition, the securities of some foreign companies and securities markets are less liquid and at times may be more volatile than securities of comparable U.S. companies and U.S. securities markets.
Recently issued accounting pronouncement
In March 2008, FASB issued Statement of Financial Accounting Standards No. 161, Disclosures about Derivative Instruments and Hedging Activities ("SFAS 161"). SFAS 161 is effective for fiscal years and interim periods beginning after November 15, 2008. SFAS 161 requires enhanced disclosures about the Fund's derivative and hedging activities. The Manager is currently evaluating the impact the adoption of SFAS 161 will have on the Fund's financial statement disclosures.
3. Fees and other transactions with affiliates
Effective June 30, 2008, GMO receives a management fee for investment management services provided to the Fund that is paid monthly at the annual rate of 0.50% of average daily net assets. For the period from March 1, 2008 through June 29, 2008, the management fee rate was 0.52% of average daily net assets. The Fund has adopted a Shareholder Service Plan under which the Fund pays GMO a shareholder service fee for client and shareholder service, reporting, and other support. Pursuant to the Shareholder Service Plan, the shareholder service fee is calculated based on average daily net assets at the annual rate of 0.15% for Class III shares and 0.09% for Class IV shares.
Through at least June 30, 2009, the Manager has contractually agreed to reimburse the Fund for Fund expenses incurred through that date to the extent the Fund's total annual operating expenses (excluding "Excluded Expenses", as defined below) exceed 0.50% of the Fund's average daily net assets. Excluded Expenses include shareholder service fees, fees and expenses of the independent Trustees of the Trust, fees and expenses for legal services not approved by the Manager for the Trust, compensation and expenses of the Trust's Chief Compliance Officer ("CCO") (excluding any employee benefits), brokerage commissions, securities lending fees and expenses, interest expense, transfer taxes, and other investment-related costs (including expenses associated with investments in any company that is an investment company or would be an investment company under the 1940 Act, but for the exceptions to the definition of investment company provi ded in Section 3(c)(1) and 3(c)(7) of the 1940 Act), hedging transaction fees, extraordinary, non-recurring and certain other unusual expenses (including taxes).
27
GMO International Growth Equity Fund
(A Series of GMO Trust)
Notes to Financial Statements — (Continued)
February 28, 2009
The Fund's portion of the fee paid by the Trust to the Trust's independent Trustees and CCO during the year ended February 28, 2009 was $34,728 and $21,403, respectively. The compensation and expenses of the CCO are included in miscellaneous expenses in the Statement of Operations. The Fund paid no remuneration to any other officer of the Trust.
4. Purchases and sales of securities
Cost of purchases and proceeds from sales of securities, excluding short-term investments, for the year ended February 28, 2009 aggregated $1,967,093,529 and $1,790,847,389, respectively.
5. Guarantees
In the normal course of business the Fund enters into contracts with third-party service providers that contain a variety of representations and warranties and that provide general indemnifications. The Fund's maximum exposure under these arrangements is unknown, as it involves future claims that may be made against the Fund that have not yet occurred. Based on experience, management is of the view that the risk of loss in connection with its indemnification obligations is remote; however, there can be no assurance that such obligations will not result in material liabilities that adversely affect the Fund.
6. Principal shareholders and related parties
As of February 28, 2009, 39.66% of the outstanding shares of the Fund were held by three shareholders, each holding more than 10% of the Fund's outstanding shares. On that date, no other shareholder owned more than 10% of the outstanding shares of the Fund. Two of the shareholders are other funds of the Trust. Redemptions from (or investments into) the Fund by or on behalf of these large shareholders may have a material effect on the Fund.
As of February 28, 2009, less than 0.01% of the Fund's shares were held by senior management of the Manager and GMO Trust officers and 95.99% of the Fund's shares were held by accounts for which the Manager had investment discretion.
28
GMO International Growth Equity Fund
(A Series of GMO Trust)
Notes to Financial Statements — (Continued)
February 28, 2009
7. Share transactions
The Declaration of Trust permits the Trust to issue an unlimited number of shares of beneficial interest (without par value). Transactions in Fund shares were as follows:
| Year Ended February 28, 2009 | Year Ended February 29, 2008 | ||||||||||||||||||
| Class III: | Shares | Amount | Shares | Amount | |||||||||||||||
| Shares sold | 11,893,535 | $ | 239,774,534 | 6,367,909 | $ | 201,027,055 | |||||||||||||
| Shares issued to shareholders in reinvestment of distributions | 2,513,470 | 58,342,144 | 5,685,508 | 173,931,678 | |||||||||||||||
| Shares repurchased | (12,169,228 | ) | (257,539,851 | ) | (5,568,633 | ) | (179,030,703 | ) | |||||||||||
| Net increase (decrease) | 2,237,777 | $ | 40,576,827 | 6,484,784 | $ | 195,928,030 | |||||||||||||
| Year Ended February 28, 2009 | Year Ended February 29, 2008 | ||||||||||||||||||
| Class IV: | Shares | Amount | Shares | Amount | |||||||||||||||
| Shares sold | 46,074,272 | $ | 942,225,145 | 20,701,601 | $ | 636,413,259 | |||||||||||||
| Shares issued to shareholders in reinvestment of distributions | 7,579,903 | 172,936,531 | 15,300,242 | 469,510,148 | |||||||||||||||
| Shares repurchased | (46,297,143 | ) | (891,462,603 | ) | (36,433,738 | ) | (1,182,041,965 | ) | |||||||||||
| Net increase (decrease) | 7,357,032 | $ | 223,699,073 | (431,895 | ) | $ | (76,118,558 | ) | |||||||||||
29
Report of Independent Registered Public Accounting Firm
To the Trustees of GMO Trust and the Shareholders of
GMO International Growth Equity Fund:
In our opinion, the accompanying statement of assets and liabilities, including the schedule of investments, and the related statements of operations and of changes in net assets and the financial highlights present fairly, in all material respects, the financial position of GMO International Growth Equity Fund (the "Fund") at February 28, 2009, the results of its operations for the year then ended, the changes in its net assets for each of the two years in the period then ended and the financial highlights for the periods indicated, in conformity with accounting principles generally accepted in the United States of America. These financial statements and financial highlights (hereafter referred to as "financial statements") are the responsibility of the Fund's management. Our responsibility is to express an opinion on these financial statements based on our audits. We conducted our audits of these financial statements in accord ance with the standards of the Public Company Accounting Oversight Board (United States). Those standards require that we plan and perform the audit to obtain reasonable assurance about whether the financial statements are free of material misstatement. An audit includes examining, on a test basis, evidence supporting the amounts and disclosures in the financial statements, assessing the accounting principles used and significant estimates made by management, and evaluating the overall financial statement presentation. We believe that our audits, which included confirmation of securities at February 28, 2009 by correspondence with the custodian and brokers, provide a reasonable basis for our opinion.
PricewaterhouseCoopers LLP
Boston, Massachusetts
April 29, 2009
30
GMO International Growth Equity Fund
(A Series of GMO Trust)
Fund Expenses
February 28, 2009 (Unaudited)
Expense Examples: The following information is in relation to expenses for the six month period ended February 28, 2009.
As a shareholder of the Fund, you may incur two types of costs: (1) transaction costs, and (2) ongoing costs, including management fees, shareholder service fees and other Fund expenses. This example is intended to help you understand your ongoing costs (in dollars) of investing in the Fund and to compare these costs with the ongoing costs of investing in other mutual funds.
These examples are based on an investment of $1,000 invested at the beginning of the period and held for the entire period, September 1, 2008 through February 28, 2009.
Actual Expenses
The first line of the table for each class below provides information about actual account values and actual expenses. You may use the information in this line, together with the amount you invested, to estimate the expenses that you paid over the period. Simply divide your account value by $1,000 (for example, a $10,000,000 account value divided by $1,000 = 10,000), then multiply the result by the number in the first line under the heading entitled "Net Expense Incurred" to estimate the expenses you paid on your account during this period.
Hypothetical Example for Comparison Purposes
The second line of the table for each class below provides information about hypothetical account values and hypothetical expenses based on the Fund's actual expense ratio and an assumed rate of return of 5% per year before expenses, which is not the Fund's actual return. The hypothetical account values and expenses may not be used to estimate the actual ending account balance or expenses you paid for the period. You may use this information to compare the ongoing costs of investing in the Fund with other funds. To do so, compare this 5% hypothetical example with the 5% hypothetical examples that appear in the shareholder reports of other funds.
Please note that the expenses shown in the table are meant to highlight your ongoing costs only and do not reflect any transactional costs. Therefore, the second line of the table is useful in comparing ongoing costs only, and will not help you determine the relative total costs of owning different funds. In addition, if these transactional costs were included, your costs would have been higher.
| Annualized Net Expense Ratio | Beginning Account Value | Ending Account Value | Net Expense Incurred* | ||||||||||||||||
| Class III | |||||||||||||||||||
| 1) Actual | 0.65 | % | $ | 1,000.00 | $ | 613.00 | $ | 2.60 | |||||||||||
| 2) Hypothetical | 0.65 | % | $ | 1,000.00 | $ | 1,021.57 | $ | 3.26 | |||||||||||
| Class IV | |||||||||||||||||||
| 1) Actual | 0.59 | % | $ | 1,000.00 | $ | 613.00 | $ | 2.36 | |||||||||||
| 2) Hypothetical | 0.59 | % | $ | 1,000.00 | $ | 1,021.87 | $ | 2.96 | |||||||||||
* Expenses are calculated using each Class's annualized net expense ratio for the six months ended February 28, 2009, multiplied by the average account value over the period, multiplied by 181 days in the period, divided by 365 days in the year.
31
GMO International Growth Equity Fund
(A Series of GMO Trust)
Tax Information for the Tax Year Ended February 28, 2009 (Unaudited)
The Fund will notify shareholders of amounts for use in preparing 2009 income tax forms in January 2010.
The Fund's distributions to shareholders include $122,411,183 from long-term capital gains.
During the year ended February 28, 2009, the Fund paid foreign taxes of $7,811,420 and recognized foreign source income of $95,448,640.
For taxable, non-corporate shareholders, 57.92% of the income and short-term capital gains, if any, distributed in the Fund's fiscal year ended February 28, 2009 represents qualified dividend income subject to the 15% rate category.
32
Trustees and Officers (Unaudited)
The following tables list the Trust's Trustees and Officers as of the date of this report; their address and date of birth ("DOB"); their position with the Trust; the length of time holding that position with the Trust; their principal occupation(s) during the past five years; the number of portfolios in the fund complex they oversee; and other directorships they hold in companies subject to registration or reporting requirements of the Securities Exchange Act of 1934 (generally called "public companies") or in registered investment companies. The Trust's Statement of Additional Information ("SAI") includes additional information about the Trust's trustees, including changes subsequent to the date of the report. The SAI is available, without charge, upon request by writing GMO, c/o GMO Trust, 40 Rowes Wharf, Boston, MA 02110.
Independent Trustees:
| Name, Address, and DOB | Position(s) Held with Trust | Term of Office1 and Length of Time Served | Principal Occupation(s) During Past Five Years | Number of Portfolios in Fund Complex Overseen by Trustee | Other Directorships Held by Trustee | ||||||||||||||||||
| Donald W. Glazer, Esq. c/o GMO Trust 40 Rowes Wharf Boston, MA 02110 DOB: 07/26/1944 | Chairman of the Board of Trustees | Chairman of the Board of Trustees since March 2005; Lead Independent Trustee (September 2004 – March 2005); Trustee since December 2000. | Consultant – Law and Business2; Author of Legal Treatises. | 59 | None. | ||||||||||||||||||
1 Each Trustee is elected to serve during the continued lifetime of the Trust until he/she dies, resigns or is removed, or if sooner, until the next meeting of Shareholders called for the purpose of electing Trustees and until the election and qualification of his/her successor.
2 As part of Mr. Glazer's work as a consultant, he provides part-time consulting services to Goodwin Procter LLP ("Goodwin"). Goodwin has provided legal services to Renewable Resources, LLC, an affiliate of GMO; GMO, in connection with its relationship with Renewable Resources; and funds managed by Renewable Resources. Mr. Glazer has represented that he has no financial interest in, and is not involved in the provision of, such legal services. In the calendar years ended December 31, 2007 and December 31, 2008, these entities paid $789,416 and $183,864 respectively, in legal fees and disbursements to Goodwin. In correspondence with the Staff of the Securities and Exchange Commission beginning in August 2006, the Independent Trustees' legal counsel provided the Staff with information regarding Mr. Glazer's relationship with Goodwin and h is other business activities. On September 11, 2007, based on information that had been given to the Staff as of that date, the Staff provided oral no-action assurance consistent with the opinion of the Independent Trustees' legal counsel that Mr. Glazer is not an "interested person" of the Trust.
33
Independent Trustees — (Continued)
| Name, Address, and DOB | Position(s) Held with Trust | Term of Office1 and Length of Time Served | Principal Occupation(s) During Past Five Years | Number of Portfolios in Fund Complex Overseen by Trustee | Other Directorships Held by Trustee | ||||||||||||||||||
| W. Nicholas Thorndike c/o GMO Trust 40 Rowes Wharf Boston, MA 02110 DOB: 03/28/1933 | Trustee | Since March 2005. | Director or trustee of various corporations and charitable organizations, including Courier Corporation (a book publisher and manufacturer) (July 1989 – present); Putnam Funds (December 1992 – June 2004); and Providence Journal (a newspaper publisher) (December 1986 – December 2003). | 59 | Director of Courier Corporation (a book publisher and manufacturer); Member of the Investment Committee of Partners HealthCare System, Inc.3 | ||||||||||||||||||
| Peter Tufano c/o GMO Trust 40 Rowes Wharf Boston, MA 02110 DOB: 04/22/1957 | Trustee | Since December 2008. | Sylvan C. Coleman Professor of Financial Management, Harvard Business School (since 1989). | 59 | Trustee of State Street Navigator Securities Lending Trust (3 Portfolios). | ||||||||||||||||||
1 Each Trustee is elected to serve during the continued lifetime of the Trust until he/she dies, resigns or is removed, or if sooner, until the next meeting of Shareholders called for the purpose of electing Trustees and until the election and qualification of his/her successor.
3 Partners HealthCare System, Inc. is a client of the Manager.
34
Principal Officers:
| Name, Address, and DOB | Position(s) Held with Trust | Term of Office4 and Length of Time Served | Principal Occupation(s) During Past Five Years5 | ||||||||||||
| J.B. Kittredge DOB: 08/22/1954 | President and Chief Executive Officer | Since March 2009. | General Counsel, Grantham, Mayo, Van Otterloo & Co. LLC (October 2005 – Present); Partner, Ropes & Gray LLP. | ||||||||||||
| Sheppard N. Burnett c/o GMO Trust 40 Rowes Wharf Boston, MA 02110 DOB: 10/24/1968 | Treasurer and Chief Financial Officer | Chief Financial Officer since March 2007; Treasurer since November 2006; Assistant Treasurer, September 2004 – November 2006. | Fund Administration Staff, Grantham, Mayo, Van Otterloo & Co. LLC (June 2004 – present); Vice President, Director of Tax, Columbia Management Group (2002 – 2004). | ||||||||||||
| Brent C. Arvidson c/o GMO Trust 40 Rowes Wharf Boston, MA 02110 DOB: 06/26/1969 | Assistant Treasurer | Since August 1998. | Senior Fund Administrator, Grantham, Mayo, Van Otterloo & Co. LLC. | ||||||||||||
| John L. Nasrah c/o GMO Trust 40 Rowes Wharf Boston, MA 02110 DOB: 05/27/1977 | Assistant Treasurer | Since March 2007. | Fund Administrator, Grantham, Mayo, Van Otterloo & Co. LLC (September 2004 – present); Tax Analyst, Bain & Company, Inc. (June 2003 – September 2004). | ||||||||||||
| Mahmoodur Rahman c/o GMO Trust 40 Rowes Wharf Boston, MA 02110 DOB: 11/30/1967 | Assistant Treasurer | Since September 2007. | Fund Administrator, Grantham, Mayo, Van Otterloo & Co. LLC (April 2007 – present); Vice President and Senior Tax Manager, Massachusetts Financial Services Company (January 2000 – April 2007). | ||||||||||||
| Michael E. Gillespie c/o GMO Trust 40 Rowes Wharf Boston, MA 02110 DOB: 02/18/1958 | Chief Compliance Officer | Since March 2005. | Vice President of Compliance (June 2004 – February 2005) and Director of Domestic Compliance (March 2002 – June 2004), Fidelity Investments. | ||||||||||||
4 Each officer is elected to hold such office until his or her successor is duly elected and qualified to carry out the duties and responsibilities of the office, or until he or she resigns or is removed from office.
5 Each of Messrs. Burnett, Arvidson, Bohan, and Pottle serves as an officer and/or director of certain pooled investment vehicles of which GMO or an affiliate of GMO serves as the investment adviser.
35
Principal Officers — (Continued)
| Name, Address, and DOB | Position(s) Held with Trust | Term of Office4 and Length of Time Served | Principal Occupation(s) During Past Five Years5 | ||||||||||||
| Jason B. Harrison c/o GMO Trust 40 Rowes Wharf Boston, MA 02110 DOB: 01/29/1977 | Vice President and Clerk | Vice President since November 2006; Clerk since March 2006. | Legal Counsel, Grantham, Mayo, Van Otterloo & Co. LLC (since February 2006) and Attorney, Ropes & Gray LLP (September 2002 – February 2006). | ||||||||||||
| David L. Bohan c/o GMO Trust 40 Rowes Wharf Boston, MA 02110 DOB: 06/21/1964 | Vice President and Assistant Clerk | Vice President since March 2005; Assistant Clerk since March 2006. | Legal Counsel, Grantham, Mayo, Van Otterloo & Co. LLC. | ||||||||||||
| Gregory L. Pottle c/o GMO Trust 40 Rowes Wharf Boston, MA 02110 DOB: 07/09/1971 | Vice President and Assistant Clerk | Since November 2006. | Legal Counsel, Grantham, Mayo, Van Otterloo & Co. LLC. | ||||||||||||
| Anne K. Trinque c/o GMO Trust 40 Rowes Wharf Boston, MA 02110 DOB: 04/15/1978 | Vice President and Assistant Clerk | Since September 2007. | Legal Counsel, Grantham, Mayo, Van Otterloo & Co. LLC (January 2007 – present); Attorney, Goodwin Procter LLP (September 2003 – January 2007). | ||||||||||||
| Cheryl Wakeham c/o GMO Trust 40 Rowes Wharf Boston, MA 02110 DOB: 10/29/1958 | Vice President and Anti-Money Laundering Officer | Since December 2004. | Manager, Client Service Administration, Grantham, Mayo, Van Otterloo & Co. LLC. | ||||||||||||
4 Each officer is elected to hold such office until his or her successor is duly elected and qualified to carry out the duties and responsibilities of the office, or until he or she resigns or is removed from office.
5 Each of Messrs. Burnett, Arvidson, Bohan, and Pottle serves as an officer and/or director of certain pooled investment vehicles of which GMO or an affiliate of GMO serves as the investment adviser.
36
GMO International Small Companies Fund
(A Series of GMO Trust)
Annual Report
February 28, 2009
For a free copy of the Fund's proxy voting guidelines, shareholders may call 1-617-346-7646 (collect) or visit the Securities and Exchange Commission's website at www.sec.gov. Information regarding how the Fund voted proxies relating to portfolio securities during the most recent 12-month period ended June 30 is available on GMO's website at www.gmo.com, or on the Securities and Exchange Commission's website at www.sec.gov.
The Fund files its complete schedule of portfolio holdings with the Securities and Exchange Commission for the first and third quarter of each fiscal year on Form N-Q, which is available on the Commission's website at www.sec.gov. The Fund's Form N-Q may be reviewed and copied at the Commission's Public Reference Room in Washington, D.C. Information on the operation of the Public Reference Room may be obtained by calling 1-800-SEC-0330. The Fund has a policy with respect to disclosure of portfolio holdings under which it may also make available on GMO's website at www.gmo.com a complete schedule of portfolio holdings.
This report is prepared for the general information of shareholders. It is authorized for distribution to prospective investors only when preceded or accompanied by a prospectus for the GMO Trust, which contains a complete discussion of the risks associated with an investment in this Fund and other important information. The GMO Trust prospectus can be obtained at www.gmo.com.
GMO International Small Companies Fund
(A Series of GMO Trust)
Portfolio Management
Day-to-day management of the Fund's portfolio is the responsibility of the Quantitative Equity team at Grantham, Mayo, Van Otterloo & Co. LLC.
Management Discussion and Analysis of Fund Performance
The GMO International Small Companies Fund returned -51.5% for the fiscal year ended February 28, 2009, as compared to -52.0% for the MSCI EAFE Small Cap Index. Consistent with the Fund's investment objectives and policies, the Fund was invested primarily in international equity securities throughout the period.
Stock selection was weak overall, especially within Financials. Swiss chemical company Ciba Holding, Japanese consumer staples company Fuji Oil, and Japanese industrial GS Yuasa were among the most significant contributors to relative performance. Japanese real estate developer KK daVinci Holdings and British media companies Trinity Mirror and Yell Group were among the greatest detractors.
Among GMO's international quantitative stock selection disciplines, stocks ranked highly by intrinsic value (with its boost of high quality) outperformed. Those selected by quality-adjusted value underperformed, while those with strong momentum were essentially in line with the market.
Country allocation had a strong positive impact. This was mainly from the Fund's underweight in Australia, overweight in Japan, and holding small cash balances in a falling market.
Currency allocation also had a positive impact on relative performance as the Fund's underweights in the British pound and Australian dollar and overweights in the Japanese yen and Swiss franc added value. The U.S. dollar strengthened relative to most foreign currencies, which detracted from returns for U.S. investors. The MSCI EAFE Index returned almost 9% more in local currency terms than in U.S. dollars.
Sector weightings had a small negative impact on performance relative to the index. During the period, the Fund's overweights to Materials and Energy detracted.
The views expressed herein are exclusively those of Grantham, Mayo, Van Otterloo & Co. LLC Management as of the date of this report and are subject to change. GMO disclaims any responsibility to update such views. They are not meant as investment advice. References to specific securities are not recommendations of such securities and may not be representative of any GMO portfolio's current or future investments.

Performance data quoted represents past performance and is not indicative of future results. The investment return and principal value of an investment will fluctuate so that an investor's shares, when redeemed, may be worth more or less than their original cost. Current performance data may be lower or higher than the performance data provided herein. To obtain performance information to the most recent month-end, visit www.gmo.com. Performance shown is net of all fees after reimbursement from the Manager. Each performance figure assumes a purchase at the beginning and redemption at the end of the stated period and reflects a transaction fee of .50% on the purchase and .50% on the redemption. Transaction fees are retained by the Fund to cover trading costs. Returns would have been lower had certain expenses not been reimbursed during the periods shown and do not include the effect of taxes on distributions and redemptions. All information is unaudited.
* Effective June 1, 2008, the benchmark for the International Small Companies Fund was changed from the S&P Developed ex-U.S. Small Cap Index to the MSCI EAFE Small Cap Index (MSCI Standard Index Series, net of withholding tax).
** The MSCI EAFE Small Cap + Index represents the S&P Developed ex-U.S. Small Cap Index prior to 5/30/2008 and the MSCI EAFE Small Cap Index (MSCI Standard Index Series, net of withholding tax) thereafter.
GMO International Small Companies Fund
(A Series of GMO Trust)
Investments Concentration Summary
February 28, 2009 (Unaudited)
| Asset Class Summary | % of Total Net Assets | ||||||
| Common Stocks | 94.9 | % | |||||
| Short-Term Investments | 2.2 | ||||||
| Preferred Stocks | 0.3 | ||||||
| Rights and Warrants | 0.0 | ||||||
| Forward Currency Contracts | (0.3 | ) | |||||
| Futures | (0.5 | ) | |||||
| Other | 3.4 | ||||||
| 100.0 | % | ||||||
| Country Summary | % of Equity Investments | ||||||
| Japan | 40.4 | % | |||||
| United Kingdom | 19.5 | ||||||
| Germany | 6.4 | ||||||
| Canada | 4.9 | ||||||
| Sweden | 3.8 | ||||||
| France | 3.6 | ||||||
| Netherlands | 3.5 | ||||||
| Switzerland | 3.2 | ||||||
| Singapore | 2.5 | ||||||
| Belgium | 2.1 | ||||||
| Australia | 1.9 | ||||||
| Italy | 1.7 | ||||||
| Ireland | 1.3 | ||||||
| Finland | 1.2 | ||||||
| Hong Kong | 1.0 | ||||||
| Norway | 0.8 | ||||||
| Greece | 0.7 | ||||||
| Austria | 0.6 | ||||||
| New Zealand | 0.4 | ||||||
| Denmark | 0.3 | ||||||
| Portugal | 0.2 | ||||||
| 100.0 | % | ||||||
1
GMO International Small Companies Fund
(A Series of GMO Trust)
Investments Concentration Summary — (Continued)
February 28, 2009 (Unaudited)
| Industry Sector Summary | % of Equity Investments | ||||||
| Industrials | 21.1 | % | |||||
| Consumer Discretionary | 19.8 | ||||||
| Financials | 12.1 | ||||||
| Information Technology | 11.1 | ||||||
| Materials | 10.6 | ||||||
| Consumer Staples | 9.9 | ||||||
| Health Care | 8.9 | ||||||
| Energy | 4.2 | ||||||
| Utilities | 2.0 | ||||||
| Telecommunication Services | 0.3 | ||||||
| 100.0 | % | ||||||
2
GMO International Small Companies Fund
(A Series of GMO Trust)
Schedule of Investments
(showing percentage of total net assets)
February 28, 2009
| Shares | Description | Value ($) | |||||||||||||
| COMMON STOCKS — 94.9% | |||||||||||||||
| Australia — 1.8% | |||||||||||||||
| 116,358 | Ansell Ltd | 609,438 | |||||||||||||
| 481,125 | Centennial Coal Co Ltd | 526,706 | |||||||||||||
| 31,614 | Cochlear Ltd | 1,069,654 | |||||||||||||
| 1,388,756 | Commonwealth Property Office Fund | 842,128 | |||||||||||||
| 939,440 | CSR Ltd | 591,474 | |||||||||||||
| 464,953 | Downer Edi Ltd | 1,084,989 | |||||||||||||
| 302,067 | Iluka Resources Ltd * | 818,637 | |||||||||||||
| 2,079,135 | Macquarie DDR Trust | 48,128 | |||||||||||||
| 333,680 | Octaviar Ltd * | 211,238 | |||||||||||||
| 1,555,183 | PaperlinX Ltd | 676,532 | |||||||||||||
| 1,073,824 | Tishman Speyer Office Fund | 50,401 | |||||||||||||
| 164,194 | West Australian Newspapers Holdings Ltd | 471,401 | |||||||||||||
| Total Australia | 7,000,726 | ||||||||||||||
| Austria — 0.5% | |||||||||||||||
| 20,001 | Flughafen Wien AG | 542,779 | |||||||||||||
| 14,796 | Mayr-Melnhof Karton AG (Bearer) | 954,514 | |||||||||||||
| 43,411 | Meinl Airports International AG * | 258,837 | |||||||||||||
| 29,308 | RHI AG * | 360,309 | |||||||||||||
| Total Austria | 2,116,439 | ||||||||||||||
| Belgium — 2.0% | |||||||||||||||
| 30,618 | Bekaert NV | 1,486,648 | |||||||||||||
| 9,192 | Cofinimmo SA | 990,563 | |||||||||||||
| 93,429 | Euronav SA | 1,169,569 | |||||||||||||
| 14,703 | EVS Broadcast Equipment SA | 456,092 | |||||||||||||
| 29,258 | GIMV NV | 1,158,037 | |||||||||||||
| 32,592 | Omega Pharma SA | 865,676 | |||||||||||||
| 49,621 | Tessenderlo Chemie | 1,455,310 | |||||||||||||
| Total Belgium | 7,581,895 | ||||||||||||||
See accompanying notes to the financial statements.
3
GMO International Small Companies Fund
(A Series of GMO Trust)
Schedule of Investments — (Continued)
(showing percentage of total net assets)
February 28, 2009
| Shares | Description | Value ($) | |||||||||||||
| Canada — 4.7% | |||||||||||||||
| 117,775 | Ace Aviation Holdings Inc Class A * | 592,485 | |||||||||||||
| 133,000 | Advantage Energy Income Fund | 305,266 | |||||||||||||
| 87,475 | Baytex Trust | 803,791 | |||||||||||||
| 105,300 | Biovail Corp | 1,119,050 | |||||||||||||
| 165,600 | CGI Group Inc * | 1,210,564 | |||||||||||||
| 154,375 | Daylight Resources Trust | 789,955 | |||||||||||||
| 53,300 | Dorel Industries Inc Class B | 828,701 | |||||||||||||
| 198,000 | Fairborne Energy Ltd * | 437,337 | |||||||||||||
| 87,600 | Gerdau Ameristeel Corp | 354,614 | |||||||||||||
| 390,200 | Hudbay Minerals Inc * | 1,717,592 | |||||||||||||
| 92,100 | Kingsway Financial Services Inc | 162,887 | |||||||||||||
| 50,200 | Laurentian Bank of Canada | 1,258,354 | |||||||||||||
| 55,000 | Linamar Corp | 144,396 | |||||||||||||
| 103,400 | Methanex Corp | 759,936 | |||||||||||||
| 51,775 | Open Text Corp * | 1,646,609 | |||||||||||||
| 30,671 | Quebecor Inc Class B | 454,930 | |||||||||||||
| 255,300 | RONA Inc * | 2,363,963 | |||||||||||||
| 77,700 | Russel Metals Inc | 701,145 | |||||||||||||
| 76,550 | Torstar Corp Class B | 307,476 | |||||||||||||
| 123,625 | Transcontinental Inc | 723,948 | |||||||||||||
| 187,500 | Trinidad Drilling Ltd | 380,247 | |||||||||||||
| 147,800 | TriStar Oil & Gas Ltd * | 1,126,914 | |||||||||||||
| Total Canada | 18,190,160 | ||||||||||||||
| Denmark — 0.3% | |||||||||||||||
| 28,088 | Genmab A/S * | 1,073,280 | |||||||||||||
| Finland — 1.1% | |||||||||||||||
| 111,675 | Amer Sports Oyj Class A | 779,461 | |||||||||||||
| 45,400 | Orion Oyj | 703,574 | |||||||||||||
| 128,771 | Pohjola Bank Plc | 910,605 | |||||||||||||
| 93,233 | Tietoenator Oyj | 1,162,589 | |||||||||||||
| 147,506 | YIT Oyj | 884,252 | |||||||||||||
| Total Finland | 4,440,481 | ||||||||||||||
See accompanying notes to the financial statements.
4
GMO International Small Companies Fund
(A Series of GMO Trust)
Schedule of Investments — (Continued)
(showing percentage of total net assets)
February 28, 2009
| Shares | Description | Value ($) | |||||||||||||
| France — 3.5% | |||||||||||||||
| 29,901 | Alten * | 405,362 | |||||||||||||
| 8,407 | bioMerieux | 635,255 | |||||||||||||
| 5,255 | Bollore | 504,768 | |||||||||||||
| 13,663 | Ciments Francais | 941,291 | |||||||||||||
| 12,221 | Fonciere des Regions | 612,958 | |||||||||||||
| 107,711 | Gemalto NV * | 2,710,666 | |||||||||||||
| 59,040 | Groupe Steria SCA | 655,900 | |||||||||||||
| 45,772 | IMS International Metal Service | 529,437 | |||||||||||||
| 185,539 | Maurel et Prom | 1,893,568 | |||||||||||||
| 20,538 | Nexans SA | 788,108 | |||||||||||||
| 78,259 | Rallye SA | 1,152,923 | |||||||||||||
| 7,903 | Societe BIC SA | 385,180 | |||||||||||||
| 441,818 | Thomson * | 373,204 | |||||||||||||
| 8,233 | Vilmorin & Cie | 794,114 | |||||||||||||
| 9,490 | Wendel Investissement | 236,380 | |||||||||||||
| 24,706 | Zodiac SA | 744,529 | |||||||||||||
| Total France | 13,363,643 | ||||||||||||||
| Germany — 5.9% | |||||||||||||||
| 58,263 | Aixtron AG | 232,395 | |||||||||||||
| 182,761 | Arques Industries AG * | 251,644 | |||||||||||||
| 18,981 | Bechtle AG | 292,808 | |||||||||||||
| 15,035 | Biotest AG | 645,701 | |||||||||||||
| 65,664 | Demag Cranes AG | 1,278,510 | |||||||||||||
| 27,695 | Fielmann AG | 1,618,327 | |||||||||||||
| 69,377 | Gildemeister AG | 403,096 | |||||||||||||
| 64,706 | Hannover Rueckversicherungs AG (Registered) | 2,306,795 | |||||||||||||
| 186,254 | Heidelberger Druckmaschinen AG | 769,597 | |||||||||||||
| 48,543 | IKB Deutsche Industriebank AG * | 48,365 | |||||||||||||
| 113,205 | Kloeckner & Co AG | 1,264,674 | |||||||||||||
| 18,481 | MTU Aero Engines Holding AG | 474,143 | |||||||||||||
| 164,605 | Norddeutsche Affinerie AG | 4,092,113 | |||||||||||||
| 3,017 | Puma AG Rudolf Dassler Sport | 450,944 | |||||||||||||
| 95,478 | Qiagen NV * | 1,540,517 | |||||||||||||
See accompanying notes to the financial statements.
5
GMO International Small Companies Fund
(A Series of GMO Trust)
Schedule of Investments — (Continued)
(showing percentage of total net assets)
February 28, 2009
| Shares | Description | Value ($) | |||||||||||||
| Germany — continued | |||||||||||||||
| 71,053 | Rhoen-Klinikum AG | 1,331,696 | |||||||||||||
| 72,159 | SGL Carbon SE * | 1,592,540 | |||||||||||||
| 44,560 | Stada Arzneimittel AG | 752,572 | |||||||||||||
| 174,636 | Suedzucker AG | 3,093,151 | |||||||||||||
| 3,966 | Vossloh AG | 368,727 | |||||||||||||
| Total Germany | 22,808,315 | ||||||||||||||
| Greece — 0.7% | |||||||||||||||
| 184,559 | Ellaktor SA | 896,053 | |||||||||||||
| 125,925 | Hellenic Exchanges SA | 637,129 | |||||||||||||
| 232,337 | Intralot SA | 1,016,063 | |||||||||||||
| 190,551 | Technical Olympic SA * | 43,145 | |||||||||||||
| Total Greece | 2,592,390 | ||||||||||||||
| Hong Kong — 0.9% | |||||||||||||||
| 77,000 | Asia Satellite Telecommunications Holdings Ltd | 80,505 | |||||||||||||
| 268,800 | Dah Sing Financial Services | 682,557 | |||||||||||||
| 1,640,800 | HKR International Ltd | 324,066 | |||||||||||||
| 1,225,000 | Pacific Basin Shipping Ltd | 558,317 | |||||||||||||
| 745,000 | Sun Hung Kai & Co Ltd | 450,425 | |||||||||||||
| 392,000 | VTech Holdings Ltd | 1,521,664 | |||||||||||||
| Total Hong Kong | 3,617,534 | ||||||||||||||
| Ireland — 1.2% | |||||||||||||||
| 222,309 | DCC Plc | 3,020,114 | |||||||||||||
| 962,077 | Fyffes Plc | 212,955 | |||||||||||||
| 757,766 | Grafton Group Plc * | 1,279,404 | |||||||||||||
| 766,672 | Total Produce Ltd | 180,685 | |||||||||||||
| Total Ireland | 4,693,158 | ||||||||||||||
| Italy — 1.7% | |||||||||||||||
| 160,536 | Benetton Group SPA | 1,001,764 | |||||||||||||
| 1,400,808 | Beni Stabili SPA | 1,058,243 | |||||||||||||
| 177,554 | Bulgari SPA | 717,983 | |||||||||||||
See accompanying notes to the financial statements.
6
GMO International Small Companies Fund
(A Series of GMO Trust)
Schedule of Investments — (Continued)
(showing percentage of total net assets)
February 28, 2009
| Shares | Description | Value ($) | |||||||||||||
| Italy — continued | |||||||||||||||
| 196,338 | Cementir SPA | 449,402 | |||||||||||||
| 57,177 | ERG SPA | 680,297 | |||||||||||||
| 12,957 | Italmobiliare SPA | 329,228 | |||||||||||||
| 20,642 | Italmobiliare SPA-RNC | 376,950 | |||||||||||||
| 475,635 | Milano Assicurazioni SPA | 985,521 | |||||||||||||
| 142,781 | Pirelli & Co Real Estate SPA | 411,238 | |||||||||||||
| 63,066 | Trevi Finanziaria SPA | 365,756 | |||||||||||||
| Total Italy | 6,376,382 | ||||||||||||||
| Japan — 38.4% | |||||||||||||||
| 20,100 | ABC-Mart Inc | 440,001 | |||||||||||||
| 77,900 | Aderans Co Ltd | 534,449 | |||||||||||||
| 700,250 | Aiful Corp | 722,799 | |||||||||||||
| 144,000 | Air Water Inc | 1,218,031 | |||||||||||||
| 212,100 | Alps Electric Co Ltd | 586,213 | |||||||||||||
| 295,800 | AOC Holdings Inc | 1,597,091 | |||||||||||||
| 5,447 | Asset Managers Holdings Co Ltd * | 324,404 | |||||||||||||
| 72,300 | Autobacs Seven Co Ltd | 1,843,180 | |||||||||||||
| 101,500 | Avex Group Holding Inc | 911,749 | |||||||||||||
| 620,000 | Central Glass Co Ltd | 1,609,738 | |||||||||||||
| 52,900 | Chiba Kogyo Bank Ltd * | 522,806 | |||||||||||||
| 104,900 | Circle K Sunkus Co Ltd | 1,612,312 | |||||||||||||
| 216,000 | COMSYS Holdings Corp | 1,546,407 | |||||||||||||
| 196,400 | Culture Convenience Club Co Ltd | 1,355,135 | |||||||||||||
| 2,151 | CyberAgent Inc | 977,860 | |||||||||||||
| 520,600 | Daiei Inc * | 1,619,681 | |||||||||||||
| 41,200 | Daiichikosho Co Ltd | 385,671 | |||||||||||||
| 2,216,000 | Daikyo Inc | 978,326 | |||||||||||||
| 189,000 | Daio Paper Corp | 1,466,293 | |||||||||||||
| 478,000 | Daiwabo Co Ltd | 1,070,756 | |||||||||||||
| 122,900 | DCM Japan Holdings Co Ltd | 559,003 | |||||||||||||
| 376 | DeNa Co Ltd | 1,105,702 | |||||||||||||
| 140,800 | Don Quijote Co Ltd | 1,661,188 | |||||||||||||
| 325,300 | Edion Corp | 808,497 | |||||||||||||
See accompanying notes to the financial statements.
7
GMO International Small Companies Fund
(A Series of GMO Trust)
Schedule of Investments — (Continued)
(showing percentage of total net assets)
February 28, 2009
| Shares | Description | Value ($) | |||||||||||||
| Japan — continued | |||||||||||||||
| 82,600 | Foster Electric Co Ltd | 443,722 | |||||||||||||
| 289,500 | Fuji Oil Co Ltd | 3,639,437 | |||||||||||||
| 45,900 | Fuji Soft Inc | 673,021 | |||||||||||||
| 277,000 | Fujikura Ltd | 601,336 | |||||||||||||
| 413,100 | Futaba Industrial Co Ltd | 1,174,437 | |||||||||||||
| 278,100 | GMO internet Inc | 1,061,869 | |||||||||||||
| 781,000 | Godo Steel | 1,828,340 | |||||||||||||
| 107,090 | Goldcrest Co Ltd | 1,903,075 | |||||||||||||
| 357 | Gourmet Navigator Inc | 714,280 | |||||||||||||
| 362,000 | GS Yuasa Corp | 1,486,914 | |||||||||||||
| 52,080 | Gulliver International Co Ltd | 674,322 | |||||||||||||
| 74,200 | H.I.S. Co Ltd | 1,060,225 | |||||||||||||
| 955,000 | Hanwa Co Ltd | 2,572,701 | |||||||||||||
| 51,300 | Hisamitsu Pharmaceutical Co Inc | 1,549,283 | |||||||||||||
| 171,800 | Hitachi Capital Corp | 1,475,435 | |||||||||||||
| 17,900 | Hogy Medical Co Ltd | 992,861 | |||||||||||||
| 188,000 | Hokuetsu Paper Mills Ltd | 685,359 | |||||||||||||
| 79,200 | Hokuto Corp | 1,545,948 | |||||||||||||
| 135,400 | Hosiden Corp | 1,419,586 | |||||||||||||
| 135,000 | Hyakujushi Bank Ltd (The) | 635,221 | |||||||||||||
| 307,000 | Iseki & Co Ltd * | 697,317 | |||||||||||||
| 570,000 | Iwatani International Corp | 1,196,307 | |||||||||||||
| 283,000 | J-Oil Mills Inc | 757,016 | |||||||||||||
| 257,000 | JACCS Co Ltd * | 434,457 | |||||||||||||
| 255,000 | JFE Shoji Holdings Inc | 661,401 | |||||||||||||
| 495,800 | Joint Corp | 386,327 | |||||||||||||
| 68,700 | K's Holdings Corp | 821,049 | |||||||||||||
| 75,500 | Kaga Electronics Co Ltd | 702,415 | |||||||||||||
| 784 | Kakaku.com Inc | 2,312,287 | |||||||||||||
| 125,000 | Kaken Pharmaceutical Co Ltd | 1,183,707 | |||||||||||||
| 150,000 | Kamigumi Co Ltd | 961,094 | |||||||||||||
| 355,000 | Kayaba Industry Co | 468,217 | |||||||||||||
| 4,234 | Kenedix Inc * | 292,709 | |||||||||||||
| 10,438 | KK daVinci Holdings * | 261,658 | |||||||||||||
See accompanying notes to the financial statements.
8
GMO International Small Companies Fund
(A Series of GMO Trust)
Schedule of Investments — (Continued)
(showing percentage of total net assets)
February 28, 2009
| Shares | Description | Value ($) | |||||||||||||
| Japan — continued | |||||||||||||||
| 30,200 | Kobayashi Pharmaceutical Co Ltd | 996,084 | |||||||||||||
| 135,400 | Kohnan Shoji Co Ltd | 1,256,674 | |||||||||||||
| 97,200 | Kojima Co Ltd | 202,025 | |||||||||||||
| 47,500 | KOSE Corp | 984,337 | |||||||||||||
| 347,000 | Kurabo Industries Ltd | 467,430 | |||||||||||||
| 245,000 | Kyokuyo Co Ltd | 444,566 | |||||||||||||
| 213,000 | Kyowa Exeo Corp | 1,741,602 | |||||||||||||
| 122,000 | Kyudenko Corp | 846,458 | |||||||||||||
| 13,300 | Mars Engineering Corp | 418,704 | |||||||||||||
| 1,735,525 | Maruha Group Inc | 2,055,995 | |||||||||||||
| 156,000 | Meiji Dairies Corp | 589,642 | |||||||||||||
| 135,100 | Miraca Holdings Inc | 2,806,761 | |||||||||||||
| 110,900 | MISUMI Group Inc | 1,239,774 | |||||||||||||
| 305,000 | Mitsubishi Steel Manufacturing Co Ltd | 557,073 | |||||||||||||
| 776,000 | Mizuho Investors Securities | 593,719 | |||||||||||||
| 185,000 | Nagase & Co | 1,459,378 | |||||||||||||
| 415,000 | Nakayama Steel Works Ltd | 779,419 | |||||||||||||
| 883 | Net One Systems Co Ltd | 1,240,435 | |||||||||||||
| 425,000 | Nichias Corp | 867,371 | |||||||||||||
| 345,000 | Nichirei Corp | 1,139,119 | |||||||||||||
| 75,400 | Nihon Kohden Corp | 950,787 | |||||||||||||
| 47,000 | Nihon Nohyaku Co Ltd | 320,997 | |||||||||||||
| 137,600 | Nihon Unisys Ltd | 967,020 | |||||||||||||
| 203,000 | Nippon Corp | 1,624,842 | |||||||||||||
| 222,000 | Nippon Denko Co Ltd | 608,334 | |||||||||||||
| 32,000 | Nippon Densetsu Kogyo Co Ltd | 309,484 | |||||||||||||
| 323,000 | Nippon Flour Mills Co Ltd | 1,453,427 | |||||||||||||
| 1,027,000 | Nippon Light Metal | 704,925 | |||||||||||||
| 126,000 | Nippon Shokubai Co Ltd | 776,944 | |||||||||||||
| 285,000 | Nippon Soda Co Ltd | 810,190 | |||||||||||||
| 158,000 | Nippon Synthetic Chemical Industry Co Ltd | 336,504 | |||||||||||||
| 205,600 | Nippon System Development Co Ltd | 1,231,626 | |||||||||||||
| 752,500 | Nippon Yakin Koguo Co Ltd | 1,448,827 | |||||||||||||
| 106,000 | Nipro Corp | 1,619,879 | |||||||||||||
See accompanying notes to the financial statements.
9
GMO International Small Companies Fund
(A Series of GMO Trust)
Schedule of Investments — (Continued)
(showing percentage of total net assets)
February 28, 2009
| Shares | Description | Value ($) | |||||||||||||
| Japan — continued | |||||||||||||||
| 130,100 | Nishimatsuya Chain Co Ltd | 957,567 | |||||||||||||
| 367,000 | Nissan Shatai Co Ltd | 2,100,052 | |||||||||||||
| 49,800 | Nissha Printing Co Ltd | 1,235,676 | |||||||||||||
| 331,000 | Nisshin Oillio Group Ltd (The) | 1,596,990 | |||||||||||||
| 196,400 | Nissin Kogyo Co Ltd | 1,796,145 | |||||||||||||
| 40,900 | Okinawa Electric Power Co | 2,497,639 | |||||||||||||
| 568,000 | Pacific Metals Co Ltd | 2,175,684 | |||||||||||||
| 156,200 | Park24 Co Ltd | 1,061,887 | |||||||||||||
| 46,000 | Pigeon Corp | 888,810 | |||||||||||||
| 46,000 | PLENUS Co Ltd | 643,424 | |||||||||||||
| 76,820 | Point Inc | 3,142,168 | |||||||||||||
| 127,400 | Q.P. Corp | 1,411,953 | |||||||||||||
| 205,000 | Rengo Co Ltd | 1,120,983 | |||||||||||||
| 42,800 | Rinnai Corp | 1,477,742 | |||||||||||||
| 303,400 | Round One Corp | 1,760,207 | |||||||||||||
| 372,000 | Ryobi Ltd | 560,993 | |||||||||||||
| 53,700 | Ryohin Keikaku Co Ltd | 1,889,540 | |||||||||||||
| 53,600 | Ryosan Co | 1,171,383 | |||||||||||||
| 129,500 | Saizeriya Co Ltd | 1,275,557 | |||||||||||||
| 554,000 | Sanken Electric Co Ltd | 1,352,009 | |||||||||||||
| 158,000 | Sanki Engineering | 797,472 | |||||||||||||
| 441,000 | Sankyo-Tateyama Holdings Inc | 272,967 | |||||||||||||
| 15,000 | Sawai Pharmaceuticals Co Ltd | 732,323 | |||||||||||||
| 185,000 | Seino Holdings Co Ltd | 863,485 | |||||||||||||
| 38,100 | Shima Seiki Manufacturing Ltd | 687,688 | |||||||||||||
| 76,500 | Shimachu Co Ltd | 1,178,500 | |||||||||||||
| 293,700 | Showa Corp | 858,988 | |||||||||||||
| 48,400 | Sugi Pharmacy Co Ltd | 1,017,767 | |||||||||||||
| 798,000 | Sumitomo Light Metal Industry | 646,610 | |||||||||||||
| 45,900 | Sundrug Co Ltd | 763,033 | |||||||||||||
| 211,000 | Taihei Kogyo Co Ltd | 471,795 | |||||||||||||
| 180,000 | Takara Holdings Inc | 729,769 | |||||||||||||
| 402,000 | TOA Corp * | 491,688 | |||||||||||||
| 117,800 | Tokyo Steel Manufacturing Co | 1,158,150 | |||||||||||||
See accompanying notes to the financial statements.
10
GMO International Small Companies Fund
(A Series of GMO Trust)
Schedule of Investments — (Continued)
(showing percentage of total net assets)
February 28, 2009
| Shares | Description | Value ($) | |||||||||||||
| Japan — continued | |||||||||||||||
| 513,000 | Topy Industries Ltd | 752,755 | |||||||||||||
| 132,000 | Toshiba Plant Systems & Services Corp | 1,248,413 | |||||||||||||
| 427,000 | Toyo Engineering Corp | 1,156,764 | |||||||||||||
| 51,000 | Toyo Suisan Kaisha Ltd | 1,206,996 | |||||||||||||
| 577,000 | Toyo Tire & Rubber Co Ltd | 664,659 | |||||||||||||
| 65,800 | Tsumura & Co | 1,824,992 | |||||||||||||
| 52,000 | Uchida Yoko Co Ltd | 148,148 | |||||||||||||
| 31,700 | Unicharm Petcare Corp | 974,056 | |||||||||||||
| 389,000 | Uniden Corp | 565,356 | |||||||||||||
| 53,700 | Union Tool Co | 1,001,904 | |||||||||||||
| 1,249 | Works Applications Co Ltd | 502,953 | |||||||||||||
| 79,700 | Xebio Co Ltd | 1,197,556 | |||||||||||||
| Total Japan | 148,612,173 | ||||||||||||||
| Netherlands — 3.4% | |||||||||||||||
| 256,175 | Aalberts Industries NV | 1,282,403 | |||||||||||||
| 72,175 | ASM International NV * | 467,271 | |||||||||||||
| 40,191 | Boskalis Westminster | 764,450 | |||||||||||||
| 106,867 | CSM | 1,157,100 | |||||||||||||
| 192,607 | Koninklijke BAM Groep NV | 1,405,999 | |||||||||||||
| 32,540 | Koninklijke Vopak NV | 1,075,913 | |||||||||||||
| 245,613 | OCE NV | 621,257 | |||||||||||||
| 102,721 | OPG Groep NV | 861,253 | |||||||||||||
| 32,032 | Smit International NV | 1,368,578 | |||||||||||||
| 102,599 | USG People NV | 844,075 | |||||||||||||
| 38,272 | Vastned NV | 1,686,090 | |||||||||||||
| 22,048 | Wereldhave NV | 1,481,092 | |||||||||||||
| Total Netherlands | 13,015,481 | ||||||||||||||
| New Zealand — 0.4% | |||||||||||||||
| 980,016 | Fisher & Paykel Healthcare Corp Ltd | 1,631,408 | |||||||||||||
See accompanying notes to the financial statements.
11
GMO International Small Companies Fund
(A Series of GMO Trust)
Schedule of Investments — (Continued)
(showing percentage of total net assets)
February 28, 2009
| Shares | Description | Value ($) | |||||||||||||
| Norway — 0.8% | |||||||||||||||
| 42,960 | Frontline Ltd | 890,409 | |||||||||||||
| 157,276 | Tandberg ASA | 2,008,797 | |||||||||||||
| Total Norway | 2,899,206 | ||||||||||||||
| Portugal — 0.1% | |||||||||||||||
| 140,175 | Redes Energeticas Nacionais SA | 556,613 | |||||||||||||
| Singapore — 2.4% | |||||||||||||||
| 454,000 | Kim Eng Holdings Ltd | 340,496 | |||||||||||||
| 623,000 | KS Energy Services Ltd | 285,910 | |||||||||||||
| 956,000 | MobileOne Ltd | 959,675 | |||||||||||||
| 746,100 | Pacific Century Region Developments Ltd | 66,283 | |||||||||||||
| 1,659,000 | Raffles Education Corp Ltd | 438,398 | |||||||||||||
| 474,000 | Singapore Airport Terminal Services Ltd | 367,869 | |||||||||||||
| 1,063,000 | Singapore Petroleum Co | 1,821,059 | |||||||||||||
| 2,389,000 | Singapore Post Ltd | 1,183,271 | |||||||||||||
| 1,896,000 | SMRT Corp Ltd | 1,945,062 | |||||||||||||
| 584,000 | United Overseas Land | 625,524 | |||||||||||||
| 341,000 | Venture Corp Ltd | 1,071,768 | |||||||||||||
| 388,000 | Wheelock Properties Ltd | 227,222 | |||||||||||||
| Total Singapore | 9,332,537 | ||||||||||||||
| Sweden — 3.6% | |||||||||||||||
| 88,725 | Axfood AB | 1,698,990 | |||||||||||||
| 1,011,722 | Boliden AB | 2,783,698 | |||||||||||||
| 63,100 | D Carnegie AB (a) | 3,153 | |||||||||||||
| 189,732 | Elekta AB Class B | 2,078,596 | |||||||||||||
| 229,906 | Fabege AB | 817,670 | |||||||||||||
| 42,255 | Getinge AB Class B | 487,533 | |||||||||||||
| 496,233 | Kungsleden AB | 2,141,891 | |||||||||||||
| 222,520 | NCC Class B | 1,189,590 | |||||||||||||
| 45,642 | Oriflame Cosmetics SA SDR | 1,089,289 | |||||||||||||
| 56,900 | Ratos AB Series B | 691,749 | |||||||||||||
| 177,224 | Trelleborg AB Class B | 522,359 | |||||||||||||
See accompanying notes to the financial statements.
12
GMO International Small Companies Fund
(A Series of GMO Trust)
Schedule of Investments — (Continued)
(showing percentage of total net assets)
February 28, 2009
| Shares | Description | Value ($) | |||||||||||||
| Sweden — continued | |||||||||||||||
| 81,342 | Vostok Gas Ltd (a) * | 1,987 | |||||||||||||
| 1,698,305 | West Siberian Resources Ltd SDR * | 400,531 | |||||||||||||
| Total Sweden | 13,907,036 | ||||||||||||||
| Switzerland — 3.0% | |||||||||||||||
| 30,349 | Actelion Ltd (Registered) * | 1,435,250 | |||||||||||||
| 11,014 | Bucher Industries AG | 694,163 | |||||||||||||
| 98,722 | Ciba Holding AG * | 4,160,358 | |||||||||||||
| 156,389 | Clariant AG (Registered) * | 583,018 | |||||||||||||
| 7,774 | Galenica AG | 2,181,045 | |||||||||||||
| 28 | Lindt & Spruengli AG (Registered) | 520,420 | |||||||||||||
| 35,652 | PSP Swiss Property AG (Registered) * | 1,423,410 | |||||||||||||
| 13,461 | Swiss Prime Site AG (Registered) * | 504,269 | |||||||||||||
| 3,237 | Verwaltungs & Private Bank AG | 206,596 | |||||||||||||
| �� | Total Switzerland | 11,708,529 | |||||||||||||
| United Kingdom — 18.5% | |||||||||||||||
| 514,448 | Aggreko Plc | 2,611,350 | |||||||||||||
| 738,148 | Amlin Plc | 3,598,703 | |||||||||||||
| 1,328,724 | ARM Holdings Plc | 1,812,227 | |||||||||||||
| 136,899 | Arriva Plc | 844,811 | |||||||||||||
| 259,459 | Autonomy Corp Plc * | 4,471,636 | |||||||||||||
| 147,909 | Aveva Group Plc | 1,004,039 | |||||||||||||
| 741,691 | BBA Aviation Plc | 736,999 | |||||||||||||
| 516,378 | Brit Insurance Holdings Plc | 1,393,110 | |||||||||||||
| 420,190 | Brixton Plc | 231,294 | |||||||||||||
| 536,649 | Chloride Group Plc | 997,441 | |||||||||||||
| 229,182 | Close Brothers Group Plc | 1,608,725 | |||||||||||||
| 135,775 | Croda International Plc | 944,801 | |||||||||||||
| 361,891 | Dairy Crest Group Plc | 1,263,553 | |||||||||||||
| 89,861 | Dana Petroleum Plc (Ordinary Shares) * | 1,282,604 | |||||||||||||
| 114,841 | De La Rue Plc | 1,687,615 | |||||||||||||
| 1,919,434 | Debenhams Plc | 1,033,196 | |||||||||||||
See accompanying notes to the financial statements.
13
GMO International Small Companies Fund
(A Series of GMO Trust)
Schedule of Investments — (Continued)
(showing percentage of total net assets)
February 28, 2009
| Shares | Description | Value ($) | |||||||||||||
| United Kingdom — continued | |||||||||||||||
| 2,699,447 | Dimension Data Holdings Plc | 1,367,657 | |||||||||||||
| 449,134 | Drax Group Plc | 3,318,035 | |||||||||||||
| 6,858,822 | DSG International Plc | 1,972,655 | |||||||||||||
| 831,313 | Electrocomponents Plc | 1,443,125 | |||||||||||||
| 807,718 | Game Group Plc | 1,679,221 | |||||||||||||
| 59,299 | Go-Ahead Group Plc | 772,980 | |||||||||||||
| 287,705 | Greene King Plc | 1,722,476 | |||||||||||||
| 446,625 | Hiscox Ltd | 1,777,564 | |||||||||||||
| 1,855,627 | HMV Group Plc | 3,381,479 | |||||||||||||
| 111,397 | Intermediate Capital Group Plc | 412,819 | |||||||||||||
| 306,674 | Jardine Lloyd Thompson Group Plc | 1,990,363 | |||||||||||||
| 1,929,537 | Johnston Press Plc | 192,258 | |||||||||||||
| 1,481,265 | Kesa Electricals Plc | 2,228,092 | |||||||||||||
| 108,357 | Ladbrokes Plc | 267,542 | |||||||||||||
| 198,350 | Lancashire Holdings Ltd * | 1,358,199 | |||||||||||||
| 189,364 | LG Group Holdings Plc | 721,597 | |||||||||||||
| 163,607 | Luminar Group Holdings Plc | 233,541 | |||||||||||||
| 525,626 | Melrose Plc | 494,985 | |||||||||||||
| 87,640 | Micro Focus International Plc | 355,720 | |||||||||||||
| 593,092 | Misys Plc | 909,864 | |||||||||||||
| 1,608,289 | Northern Foods Plc | 1,069,477 | |||||||||||||
| 127,850 | Pennon Group Plc | 788,603 | |||||||||||||
| 207,717 | Petrofac Ltd | 1,387,399 | |||||||||||||
| 92,959 | Provident Financial Plc | 1,082,034 | |||||||||||||
| 1,175,965 | Punch Taverns Plc | 636,199 | |||||||||||||
| 203,944 | PV Crystalox Solar Plc | 247,441 | |||||||||||||
| 60,051 | Rotork Plc | 611,652 | |||||||||||||
| 243,582 | Savills Plc | 1,007,743 | |||||||||||||
| 321,904 | Signet Jewelers Ltd | 2,452,164 | |||||||||||||
| 250,009 | Smith News Plc | 206,981 | |||||||||||||
| 240,241 | SSL International Plc | 1,653,576 | |||||||||||||
| 636,816 | Tomkins Plc | 1,023,071 | |||||||||||||
| 490,068 | Travis Perkins Plc | 2,270,808 | |||||||||||||
See accompanying notes to the financial statements.
14
GMO International Small Companies Fund
(A Series of GMO Trust)
Schedule of Investments — (Continued)
(showing percentage of total net assets)
February 28, 2009
| Shares | Description | Value ($) | |||||||||||||
| United Kingdom — continued | |||||||||||||||
| 1,770,189 | Trinity Mirror Plc | 778,000 | |||||||||||||
| 245,489 | Weir Group Plc (The) | 1,208,117 | |||||||||||||
| 676,711 | William Hill Plc | 2,273,435 | |||||||||||||
| 7,203,639 | Woolworths Group Plc (a) | 125,815 | |||||||||||||
| 2,432,394 | Yell Group Plc | 716,988 | |||||||||||||
| Total United Kingdom | 71,661,779 | ||||||||||||||
| TOTAL COMMON STOCKS (COST $663,552,103) | 367,179,165 | ||||||||||||||
| PREFERRED STOCKS — 0.3% | |||||||||||||||
| Germany — 0.3% | |||||||||||||||
| 14,778 | Draegerwerk AG 2.12% | 320,436 | |||||||||||||
| 50,396 | Hugo Boss AG 15.32% | 612,509 | |||||||||||||
| Total Germany | 932,945 | ||||||||||||||
| TOTAL PREFERRED STOCKS (COST $2,358,643) | 932,945 | ||||||||||||||
| RIGHTS AND WARRANTS — 0.0% | |||||||||||||||
| Singapore — 0.0% | |||||||||||||||
| 61,000 | Tat Hong Holdings Ltd Warrants, Expires 08/02/13 * | 1,183 | |||||||||||||
| TOTAL RIGHTS AND WARRANTS (COST $0) | 1,183 | ||||||||||||||
See accompanying notes to the financial statements.
15
GMO International Small Companies Fund
(A Series of GMO Trust)
Schedule of Investments — (Continued)
(showing percentage of total net assets)
February 28, 2009
| Par Value ($) | Description | Value ($) | |||||||||||||
| SHORT-TERM INVESTMENTS — 2.2% | |||||||||||||||
| 33,106 | Bank of Tokyo-Mitsubishi Time Deposit, 0.08%, due 03/02/09 | 33,106 | |||||||||||||
| 600,000 | BNP Paribas Time Deposit, 0.23%, due 03/02/09 | 600,000 | |||||||||||||
| 2,500,000 | Branch Banking & Trust Time Deposit, 0.13%, due 03/02/09 | 2,500,000 | |||||||||||||
| 74,287 | Brown Brothers Harriman Time Deposit, 0.02%-9.25%, due 03/02/09 | 74,287 | |||||||||||||
| 85,984 | Citibank Time Deposit, 0.07%-2.29%, due 03/02/09 | 85,984 | |||||||||||||
| 54,184 | HSBC Bank (Hong Kong) Time Deposit, 0.01%, due 03/02/09 | 54,184 | |||||||||||||
| 28,939 | JPMorgan Chase Time Deposit, 0.01%, due 03/02/09 | 28,939 | |||||||||||||
| 2,500,000 | Royal Bank of Canada Time Deposit, 0.20%, due 03/02/09 | 2,500,000 | |||||||||||||
| 2,755,547 | Societe Generale Time Deposit, 0.25%-0.33%, due 03/02/09 | 2,755,547 | |||||||||||||
| TOTAL SHORT-TERM INVESTMENTS (COST $8,632,047) | 8,632,047 | ||||||||||||||
| TOTAL INVESTMENTS — 97.4% (Cost $674,542,793) | 376,745,340 | ||||||||||||||
| Other Assets and Liabilities (net) — 2.6% | 10,070,627 | ||||||||||||||
| TOTAL NET ASSETS — 100.0% | $ | 386,815,967 | |||||||||||||
See accompanying notes to the financial statements.
16
GMO International Small Companies Fund
(A Series of GMO Trust)
Schedule of Investments — (Continued)
February 28, 2009
A summary of outstanding financial instruments at February 28, 2009 is as follows:
Forward Currency Contracts
| Settlement Date | Deliver/Receive | Units of Currency | Value | Net Unrealized Appreciation (Depreciation) | |||||||||||||||
| Buys | |||||||||||||||||||
| 4/24/09 | CHF | 9,074,574 | $ | 7,765,772 | $ | 44,242 | |||||||||||||
| 4/24/09 | CHF | 9,074,574 | 7,765,771 | 31,342 | |||||||||||||||
| 4/24/09 | CHF | 9,074,574 | 7,765,772 | 11,847 | |||||||||||||||
| 4/24/09 | CHF | 9,074,574 | 7,765,772 | 22,069 | |||||||||||||||
| 4/24/09 | EUR | 3,449,861 | 4,372,432 | (53,015 | ) | ||||||||||||||
| 4/24/09 | JPY | 396,218,688 | 4,064,279 | (249,949 | ) | ||||||||||||||
| 4/24/09 | JPY | 396,218,688 | 4,064,279 | (247,508 | ) | ||||||||||||||
| 4/24/09 | NZD | 2,101,774 | 1,048,902 | (17,705 | ) | ||||||||||||||
| 4/24/09 | SEK | 55,091,026 | 6,116,210 | (273,283 | ) | ||||||||||||||
| 4/24/09 | SEK | 63,188,502 | 7,015,192 | (145,871 | ) | ||||||||||||||
| 4/24/09 | SGD | 11,040,750 | 7,130,947 | (101,391 | ) | ||||||||||||||
| $ | 64,875,328 | $ | (979,222 | ) | |||||||||||||||
| Sales | |||||||||||||||||||
| 4/24/09 | AUD | 10,061,402 | $ | 6,410,125 | $ | (13,790 | ) | ||||||||||||
| 4/24/09 | CAD | 7,488,575 | 5,886,724 | 39,281 | |||||||||||||||
| 4/24/09 | CAD | 7,268,323 | 5,713,585 | 31,875 | |||||||||||||||
| 4/24/09 | CAD | 7,268,323 | 5,713,585 | 32,942 | |||||||||||||||
| 4/24/09 | EUR | 8,632,418 | 10,940,922 | (67,787 | ) | ||||||||||||||
| 4/24/09 | GBP | 3,246,580 | 4,647,323 | (18,424 | ) | ||||||||||||||
| 4/24/09 | GBP | 3,246,580 | 4,647,323 | (18,817 | ) | ||||||||||||||
| 4/24/09 | HKD | 29,026,186 | 3,744,448 | 932 | |||||||||||||||
| 4/24/09 | NOK | 15,289,249 | 2,171,038 | (2,196 | ) | ||||||||||||||
| 4/24/09 | SGD | 6,473,773 | 4,181,250 | 118,689 | |||||||||||||||
| $ | 54,056,323 | $ | 102,705 | ||||||||||||||||
See accompanying notes to the financial statements.
17
GMO International Small Companies Fund
(A Series of GMO Trust)
Schedule of Investments — (Continued)
February 28, 2009
Futures Contracts
| Number of Contracts | Type | Expiration Date | Contract Value | Net Unrealized Appreciation (Depreciation) | |||||||||||||||
| Buys | |||||||||||||||||||
| 5 | Amsterdam Exchanges | March 2009 | $ | 278,081 | $ | 214 | |||||||||||||
| 172 | CAC 40 | March 2009 | 5,817,065 | (417,318 | ) | ||||||||||||||
| 34 | DAX | March 2009 | 4,105,533 | (729,544 | ) | ||||||||||||||
| 21 | FTSE 100 | March 2009 | 1,144,672 | (507 | ) | ||||||||||||||
| 2 | Hang Seng | March 2009 | 162,680 | (1,441 | ) | ||||||||||||||
| 1 | IBEX 35 | March 2009 | 96,577 | 347 | |||||||||||||||
| 6 | MSCI Singapore | March 2009 | 148,939 | 973 | |||||||||||||||
| 43 | OMXS30 IND | March 2009 | 305,544 | 582 | |||||||||||||||
| 53 | S&P/MIB | March 2009 | 5,084,302 | (1,514,741 | ) | ||||||||||||||
| 100 | TOPIX Index | March 2009 | 7,721,829 | (461,300 | ) | ||||||||||||||
| $ | 24,865,222 | $ | (3,122,735 | ) | |||||||||||||||
| Sales | |||||||||||||||||||
| 48 | SPI 200 | March 2009 | $ | 2,505,860 | $ | 195,305 | |||||||||||||
| 127 | S&P Toronto 60 | March 2009 | 9,759,095 | 828,268 | |||||||||||||||
| $ | 12,264,955 | $ | 1,023,573 | ||||||||||||||||
As of February 28, 2009, for the futures contracts held, the Fund had sufficient cash and/or securities to cover any commitments or margin requirements of the relevant broker or exchange.
See accompanying notes to the financial statements.
18
GMO International Small Companies Fund
(A Series of GMO Trust)
Schedule of Investments — (Continued)
February 28, 2009
Notes to Schedule of Investments:
SDR - Swedish Depository Receipt
* Non-income producing security.
(a) Security valued at fair value using methods determined in good faith by or at the direction of the Trustees of GMO Trust (Note 2).
Currency Abbreviations:
AUD - Australian Dollar
CAD - Canadian Dollar
CHF - Swiss Franc
EUR - Euro
GBP - British Pound
HKD - Hong Kong Dollar
JPY - Japanese Yen
NOK - Norwegian Krone
NZD - New Zealand Dollar
SEK - Swedish Krona
SGD - Singapore Dollar
See accompanying notes to the financial statements.
19
GMO International Small Companies Fund
(A Series of GMO Trust)
Statement of Assets and Liabilities — February 28, 2009
| Assets: | |||||||
| Investments, at value (cost $674,542,793) (Note 2) | $ | 376,745,340 | |||||
| Foreign currency, at value (cost $77) (Note 2) | 64 | ||||||
| Receivable for Fund shares sold | 6,600,942 | ||||||
| Dividends and interest receivable | 446,532 | ||||||
| Foreign taxes receivable | 86,136 | ||||||
| Unrealized appreciation on open forward currency contracts (Note 2) | 333,219 | ||||||
| Receivable for collateral on open futures contracts (Note 2) | 4,583,321 | ||||||
| Receivable for expenses reimbursed by Manager (Note 3) | 17,556 | ||||||
| Miscellaneous receivable | 38,403 | ||||||
| Total assets | 388,851,513 | ||||||
| Liabilities: | |||||||
| Payable to affiliate for (Note 3): | |||||||
| Management fee | 191,708 | ||||||
| Shareholder service fee | 47,927 | ||||||
| Trustees and Chief Compliance Officer of GMO Trust fees | 1,463 | ||||||
| Payable for variation margin on open futures contracts (Note 2) | 304,340 | ||||||
| Unrealized depreciation on open forward currency contracts (Note 2) | 1,209,736 | ||||||
| Miscellaneous payable | 37,741 | ||||||
| Accrued expenses | 242,631 | ||||||
| Total liabilities | 2,035,546 | ||||||
| Net assets | $ | 386,815,967 | |||||
| Net assets consist of: | |||||||
| Paid-in capital | $ | 746,889,791 | |||||
| Accumulated undistributed net investment income | 8,428,133 | ||||||
| Distributions in excess of net realized gain | (67,703,418 | ) | |||||
| Net unrealized depreciation | (300,798,539 | ) | |||||
| $ | 386,815,967 | ||||||
| Net assets attributable to: | |||||||
| Class III shares | $ | 386,815,967 | |||||
| Shares outstanding: | |||||||
| Class III | 92,051,975 | ||||||
| Net asset value per share: | |||||||
| Class III | $ | 4.20 | |||||
See accompanying notes to the financial statements.
20
GMO International Small Companies Fund
(A Series of GMO Trust)
Statement of Operations — Year Ended February 28, 2009
| Investment Income: | |||||||
| Dividends (net of withholding taxes of $1,756,208) | $ | 19,261,830 | |||||
| Securities lending income | 519,576 | ||||||
| Interest | 297,246 | ||||||
| Total investment income | 20,078,652 | ||||||
| Expenses: | |||||||
| Management fee (Note 3) | 3,305,724 | ||||||
| Shareholder service fee – Class III (Note 3) | 826,431 | ||||||
| Custodian and fund accounting agent fees | 563,476 | ||||||
| Transfer agent fees | 27,231 | ||||||
| Audit and tax fees | 82,766 | ||||||
| Legal fees | 14,106 | ||||||
| Trustees fees and related expenses (Note 3) | 7,205 | ||||||
| Registration fees | 1,104 | ||||||
| Miscellaneous | 11,220 | ||||||
| Total expenses | 4,839,263 | ||||||
| Fees and expenses reimbursed by Manager (Note 3) | (686,093 | ) | |||||
| Expense reductions (Note 2) | (17,523 | ) | |||||
| Net expenses | 4,135,647 | ||||||
| Net investment income (loss) | 15,943,005 | ||||||
| Realized and unrealized gain (loss): | |||||||
| Net realized gain (loss) on: | |||||||
| Investments | (55,872,293 | ) | |||||
| Closed futures contracts | (9,549,031 | ) | |||||
| Foreign currency, forward contracts and foreign currency related transactions (net of CPMF tax of $158) (Note 2) | 7,857,721 | ||||||
| Net realized gain (loss) | (57,563,603 | ) | |||||
| Change in net unrealized appreciation (depreciation) on: | |||||||
| Investments | (308,749,859 | ) | |||||
| Open futures contracts | 243,018 | ||||||
| Foreign currency, forward contracts and foreign currency related transactions | (3,025,137 | ) | |||||
| Net unrealized gain (loss) | (311,531,978 | ) | |||||
| Net realized and unrealized gain (loss) | (369,095,581 | ) | |||||
| Net increase (decrease) in net assets resulting from operations | $ | (353,152,576 | ) | ||||
See accompanying notes to the financial statements.
21
GMO International Small Companies Fund
(A Series of GMO Trust)
Statement of Changes in Net Assets
| Year Ended February 28, 2009 | Year Ended February 29, 2008 | ||||||||||
| Increase (decrease) in net assets: | |||||||||||
| Operations: | |||||||||||
| Net investment income (loss) | $ | 15,943,005 | $ | 15,669,967 | |||||||
| Net realized gain (loss) | (57,563,603 | ) | 176,668,989 | ||||||||
| Change in net unrealized appreciation (depreciation) | (311,531,978 | ) | (202,960,184 | ) | |||||||
| Net increase (decrease) in net assets from operations | (353,152,576 | ) | (10,621,228 | ) | |||||||
| Distributions to shareholders from: | |||||||||||
| Net investment income | |||||||||||
| Class III | (11,541,650 | ) | (31,841,900 | ) | |||||||
| Net realized gains | |||||||||||
| Class III | (26,984,042 | ) | (142,937,240 | ) | |||||||
| (38,525,692 | ) | (174,779,140 | ) | ||||||||
| Net share transactions (Note 7): | |||||||||||
| Class III | 97,920,776 | 5,871,549 | |||||||||
| Purchase premiums and redemption fees (Notes 2 and 7): | |||||||||||
| Class III | 1,037,841 | 2,593,773 | |||||||||
| Total increase (decrease) in net assets resulting from net share transactions, purchase premiums and redemption fees | 98,958,617 | 8,465,322 | |||||||||
| Total increase (decrease) in net assets | (292,719,651 | ) | (176,935,046 | ) | |||||||
| Net assets: | |||||||||||
| Beginning of period | 679,535,618 | 856,470,664 | |||||||||
| End of period (including accumulated undistributed net investment income of $8,428,133 and distributions in excess of net investment income of $5,790,555, respectively) | $ | 386,815,967 | $ | 679,535,618 | |||||||
See accompanying notes to the financial statements.
22
GMO International Small Companies Fund
(A Series of GMO Trust)
Financial Highlights
(For a Class III share outstanding throughout each period)
| Year Ended February 28/29, | |||||||||||||||||||||||
| 2009 | 2008 | 2007 | 2006 | 2005 | |||||||||||||||||||
| Net asset value, beginning of period | $ | 9.29 | $ | 12.22 | $ | 14.93 | $ | 17.84 | $ | 17.09 | |||||||||||||
| Income (loss) from investment operations: | |||||||||||||||||||||||
| Net investment income (loss)† | 0.20 | 0.24 | 0.25 | 0.34 | 0.30 | ||||||||||||||||||
| Net realized and unrealized gain (loss) | (4.78 | ) | (0.34 | ) | 2.68 | 3.44 | 3.56 | ||||||||||||||||
| Total from investment operations | (4.58 | ) | (0.10 | ) | 2.93 | 3.78 | 3.86 | ||||||||||||||||
| Less distributions to shareholders: | |||||||||||||||||||||||
| From net investment income | (0.13 | ) | (0.51 | ) | (0.33 | ) | (0.44 | ) | (0.54 | ) | |||||||||||||
| From net realized gains | (0.38 | ) | (2.32 | ) | (5.31 | ) | (6.25 | ) | (2.57 | ) | |||||||||||||
| Total distributions | (0.51 | ) | (2.83 | ) | (5.64 | ) | (6.69 | ) | (3.11 | ) | |||||||||||||
| Net asset value, end of period | $ | 4.20 | $ | 9.29 | $ | 12.22 | $ | 14.93 | $ | 17.84 | |||||||||||||
| Total Return(a) | (51.47 | )% | (2.04 | )% | 23.35 | % | 25.77 | % | 24.45 | % | |||||||||||||
| Ratios/Supplemental Data: | |||||||||||||||||||||||
| Net assets, end of period (000's) | $ | 386,816 | $ | 679,536 | $ | 856,471 | $ | 986,602 | $ | 1,517,223 | |||||||||||||
| Net expenses to average daily net assets | 0.75 | %(b) | 0.76 | %(b) | 0.75 | % | 0.75 | % | 0.75 | % | |||||||||||||
| Net investment income to average daily net assets | 2.89 | % | 1.98 | % | 1.79 | % | 2.01 | % | 1.75 | % | |||||||||||||
| Portfolio turnover rate | 64 | % | 72 | % | 48 | % | 49 | % | 53 | % | |||||||||||||
| Fees and expenses reimbursed by the Manager to average daily net assets: | 0.12 | % | 0.13 | % | 0.09 | % | 0.11 | % | 0.11 | % | |||||||||||||
| Purchase premiums and redemption fees consisted of the following per share amounts:† | $ | 0.01 | $ | 0.04 | $ | 0.03 | $ | 0.07 | $ | 0.08 | |||||||||||||
(a) The total returns would have been lower had certain expenses not been reimbursed during the periods shown and assumes the effect of reinvested distributions. Calculation excludes purchase premiums and redemption fees which are borne by the shareholder.
(b) The net expense ratio does not include the effect of expense reductions, except for reimbursements related to securities lending transactions (Note 2).
† Calculated using average shares outstanding throughout the period.
See accompanying notes to the financial statements.
23
GMO International Small Companies Fund
(A Series of GMO Trust)
Notes to Financial Statements
February 28, 2009
1. Organization
GMO International Small Companies Fund (the "Fund") is a series of GMO Trust (the "Trust"). The Fund is registered under the Investment Company Act of 1940, as amended, as an open-end, non-diversified management investment company. The Fund is advised and managed by Grantham, Mayo, Van Otterloo & Co. LLC (the "Manager" or "GMO"). The Trust was established as a Massachusetts business trust under the laws of The Commonwealth of Massachusetts on June 24, 1985. The Declaration of Trust permits the Trustees of the Trust ("Trustees") to create an unlimited number of series of shares ("Funds") and to subdivide Funds into classes.
The Fund seeks high total return. The Fund seeks to achieve its investment objective by outperforming the MSCI EAFE (Europe, Australasia, and Far East) Small Cap Index. The Fund typically makes equity investments in non-U.S. companies, including non-U.S. companies in developed and emerging countries, but excluding the largest 500 non-U.S. companies in developed countries based on full, non-float adjusted market capitalization and any company in an emerging country with a full, non-float adjusted market capitalization that is greater than or equal to that of any of the 500 excluded developed country companies. Effective June 1, 2008, the Fund changed its benchmark from the S&P/Citigroup EMI World ex-U.S. Index to the MSCI EAFE Small Cap Index because the Manager believes the MSCI EAFE Small Cap Index is a more appropriate comparative, broad-based market index for the Fund.
The Fund currently limits subscriptions due to capacity considerations.
2. Significant accounting policies
The following is a summary of significant accounting policies followed by the Fund in the preparation of its financial statements. These policies are in conformity with accounting principles generally accepted in the United States of America ("U.S. GAAP") and have been consistently followed by the Fund in preparing its financial statements. The preparation of financial statements in accordance with U.S. GAAP requires management to make estimates and assumptions that affect the reported amounts and disclosures in the financial statements. Actual results could differ from those estimates. The accounting records of the Fund are maintained in U.S. dollars.
Portfolio valuation
Securities listed on a securities exchange for which market quotations are readily available are valued at the last sale price or official closing price on each business day, or if there is no such reported sale or official closing price, at the most recent quoted bid price. Unlisted securities for which market quotations are readily available are generally valued at the most recent quoted bid price. Debt instruments with a remaining maturity of sixty days or less are generally valued at amortized cost, which approximates fair value. Shares of investment funds are generally valued at their net asset value. Securities for which quotations are not readily available or whose values the Manager has determined to be unreliable are valued at fair value as determined in good faith by the Trustees or persons acting at their direction
24
GMO International Small Companies Fund
(A Series of GMO Trust)
Notes to Financial Statements — (Continued)
February 28, 2009
pursuant to procedures approved by the Trustees. By its nature, a fair value price is a good faith estimate of the value of a security at a given point in time and may not reflect the value that would be realized if the security were sold. The difference between a fair value price and the value realized upon a sale could be material. Because many foreign equity securities markets and exchanges close prior to the close of the New York Stock Exchange ("NYSE"), closing prices for foreign securities in those markets or on those exchanges do not reflect the events that occur after that close but before the close of the NYSE. As a result, the Fund generally values foreign equity securities using fair value prices, which are based on adjustments to closing prices supplied by a third party vendor based on that vendor's proprietary models. As of February 28, 2009, 89.35% of the net assets of the Fund were valued using fair value prices b ased on models used by a third party vendor.
In September 2006, the Financial Accounting Standards Board ("FASB") issued Statement of Financial Accounting Standards No. 157, Fair Value Measurements ("SFAS 157"). SFAS 157 is effective for the Fund's current fiscal year. While the adoption of SFAS 157 does not have an effect on the Fund's net asset value, it does require additional disclosures about fair value measurements. SFAS 157 establishes a three-level hierarchy for disclosure of fair value measurements. The valuation hierarchy is based upon the reliability of inputs to the valuation of the Fund's investments. The three levels are defined as follows:
Level 1 – Valuations based on quoted prices for identical securities in active markets.
Level 2 – Valuations determined using other significant direct or indirect observable inputs.
Level 3 – Valuations based on inputs that are unobservable and significant. The Fund utilized the following fair value techniques on Level 3 investments: The Fund considered certain bankrupt securities to be worthless. The Fund also valued another certain security at the last traded price prior to the company filing for bankruptcy protection.
The inputs or methodology used for valuing securities are not necessarily an indication of the risk associated with investing in those securities.
The following is a summary of the fair valuations according to inputs used as of February 28, 2009 in valuing the Fund's investments:
| Asset Valuation Inputs | Investments in Securities | Other Financial Instruments* | |||||||||
| Level 1 - Quoted Prices | $ | 30,982,565 | $ | 828,268 | |||||||
| Level 2 - Other Significant Observable Inputs | 345,631,820 | 530,640 | |||||||||
| Level 3 - Significant Unobservable Inputs | 130,955 | — | |||||||||
| Total | $ | 376,745,340 | $ | 1,358,908 | |||||||
* Other financial instruments include forward currency contracts and futures contracts.
25
GMO International Small Companies Fund
(A Series of GMO Trust)
Notes to Financial Statements — (Continued)
February 28, 2009
| Liability Valuation Inputs | Investments in Securities | Other Financial Instruments** | |||||||||
| Level 1 - Quoted Prices | $ | — | $ | — | |||||||
| Level 2 - Other Significant Observable Inputs | — | (4,334,587 | ) | ||||||||
| Level 3 - Significant Unobservable Inputs | — | — | |||||||||
| Total | $ | — | $ | (4,334,587 | ) | ||||||
** Other financial instruments include forward currency contracts and futures contracts.
The following is a reconciliation of investments in which significant unobservable inputs (Level 3) were used in determining value:
| Investments in Securities | Other Financial Instruments | ||||||||||
| Balance as of February 29, 2008 | $ | 4,903,629 | $ | — | |||||||
| Realized gain (loss) | (5,308,435 | ) | — | ||||||||
| Change in unrealized appreciation/depreciation | (3,367,432 | ) | — | ||||||||
| Net purchases (sales) | (831,338 | ) | — | ||||||||
| Net transfers in and/or out of Level 3 | 4,734,531 | — | |||||||||
| Balance as of February 28, 2009 | $ | 130,955 | $ | — | |||||||
Foreign currency translation
The market values of foreign securities, currency holdings and related assets and liabilities are translated to U.S. dollars based on the 4 p.m. New York time exchange rates each business day. Income and expenses denominated in foreign currencies are translated at the 4 p.m. New York time exchange rates on the business day the income and expenses are accrued or incurred. The Fund does not isolate realized and unrealized gains and losses attributable to changes in exchange rates from gains and losses that arise from changes in the market value of investments. Such fluctuations are included with net realized and unrealized gain or loss on investments. Net realized gains and losses on foreign currency transactions represent gains and losses on disposition of currencies and forward currency contracts, currency gains and losses realized between the trade and settlement dates on securities transactions, and the difference between the amount of investment income and foreign withholding taxes recorded on the Fund's accounting records and the U.S. dollar equivalent amounts actually received or paid.
Forward currency contracts
The Fund may enter into forward currency contracts including forward cross currency contracts. A forward currency contract is an agreement between two parties to buy and sell a currency at a set price on a future date. The market value of a forward currency contract fluctuates with changes in forward currency exchange rates. Forward currency contracts are marked to market daily using rates supplied by a quotation
26
GMO International Small Companies Fund
(A Series of GMO Trust)
Notes to Financial Statements — (Continued)
February 28, 2009
service and changes in value are recorded by the Fund as an unrealized gain or loss. Realized gains or losses equal to the difference between the value of the contract at the time it was opened and the value at the time it was closed are recorded upon delivery or receipt of the currency or, if a forward currency contract is offset by entering into another forward currency contract with the same broker, upon settlement of the net gain or loss. These contracts may involve market risk in excess of the unrealized gain or loss reflected in the Fund's Statement of Assets and Liabilities. They expose the Fund to the risk of unfavorable movements in currency values and the risk that the counterparty will be unable or unwilling to meet the terms of the contracts. Forward currency contracts outstanding at the end of the period are listed in the Fund's Schedule of Investments.
Futures contracts
The Fund may purchase and sell futures contracts. Upon entering into a futures contract, the Fund is required to deposit cash, U.S. government and agency obligations, or other liquid assets with the futures clearing broker in accordance with the initial margin requirements of the broker or exchange. In addition, the Fund maintains cash or securities in an amount that at least equals the net amount payable in the event the Fund must deliver the full amount of the contract. Futures contracts are marked to market daily and an appropriate payable or receivable for the change in value ("variation margin") is recorded by the Fund. The payable or receivable is settled on the following business day. Gains or losses are recognized but not considered realized until the contracts expire or are closed. Futures contracts involve, to varying degrees, risk of loss in excess of the variation margin disclosed in the Statement of Assets and Liabi lities. Under some circumstances, futures exchanges may establish daily limits on the amount that the price of a futures contract can vary from the previous day's settlement price, thereby effectively preventing liquidation of unfavorable positions. Losses may arise from changes in the value of the underlying instrument if the Fund is unable to liquidate a futures position due to an illiquid secondary market for the contract or the imposition of price limits, or if counterparties do not perform under the contract terms. Futures contracts are generally valued at the settlement price established each day by the board of trade or exchange on which they are traded. Because many foreign exchanges close prior to the close of the New York Stock Exchange ("NYSE"), closing prices for foreign futures in those markets or on those exchanges do not reflect the events that occur after that close but before the close of the NYSE. As a result, the Fund generally values foreign futures using fair value prices, which are base d on adjustments to closing prices supplied by a third party vendor based on that vendor's proprietary models. Futures contracts outstanding at the end of the period are listed in the Fund's Schedule of Investments.
Options
The Fund may write (i.e., sell) call and put options. Writing options alters the Fund's exposure to the underlying instrument by, in the case of a call option, obligating the Fund to sell the underlying instrument at a set price to the option-holder and, in the case of a put option, obligating the Fund to purchase the underlying instrument at a set price from the option-holder. In the case of an index option, settlement will be in cash. When the Fund writes a call or put option, an amount equal to the premium received is recorded as a liability and subsequently marked to market to reflect the current value of the option written.
27
GMO International Small Companies Fund
(A Series of GMO Trust)
Notes to Financial Statements — (Continued)
February 28, 2009
Premiums received from writing options that expire are treated as realized gains. Premiums received from writing options that are exercised or closed are deducted from the amounts paid on the underlying future, security or currency transaction to determine the realized gain or loss. The Fund as a writer of an option has no control over whether the underlying future, security or currency may be sold (call) or purchased (put) and as a result bears the market risk of an unfavorable change in the price of the future, security or currency underlying the option. In the event that the Fund writes uncovered put or call options (i.e. options for investments that the Fund does not own), it bears the risk of substantial losses if the price of the underlying instrument increases during the term of the option. Options expose the Fund to the risk the Fund may not be able to enter into a closing transaction because of an illiquid market. The F und had no open written option contracts during the period.
The Fund may also purchase put and call options. Purchasing options alters the Fund's exposure to the underlying instrument by, in the case of a call option, entitling the Fund to purchase the underlying instrument at a set price from the writer of the option and, in the case of a put option, entitling the Fund to sell the underlying instrument at a set price to the writer of the option. The Fund pays a premium for a purchased option. That premium is disclosed in the Schedule of Investments and is subsequently marked to market to reflect the current value of the option. Premiums paid for purchasing options that expire are treated as realized losses. Premiums paid for purchasing options that are exercised or closed are deducted from the proceeds on the closing transaction to determine the realized gain or loss. The risk associated with purchasing put and call options is limited to the premium paid. The Fund had no purchased optio n contracts outstanding at the end of the period.
The Fund values exchange traded options at the last sale price, or if no sale is reported, the last bid price for options it has purchased and the last ask price for options it has written. The Fund values options traded over-the-counter using inputs provided by primary pricing sources and industry standard models.
Swap agreements
The Fund may enter into various types of swap agreements, including without limitation, interest rate, total return, credit default and variance swap agreements. A swap agreement is an agreement to exchange the return generated by one instrument for the return generated by another instrument. When entering into a swap agreement, the Fund and/or the swap counterparty may post or receive cash or securities as collateral. The party posting the collateral typically receives the interest associated with or payments related to the collateral and has the risk of loss related to the collateral.
Interest rate swap agreements involve an exchange by the parties of their respective commitments to pay or right to receive interest, e.g., an exchange of floating rate interest payments for fixed rate interest payments with respect to the notional amount of principal.
Total return swap agreements involve a commitment by one party to pay interest to the other party in exchange for a payment to it from the other party based on the return of a reference instrument (e.g., a
28
GMO International Small Companies Fund
(A Series of GMO Trust)
Notes to Financial Statements — (Continued)
February 28, 2009
security or basket of securities), both based on notional amounts. To the extent the return of the reference instrument exceeds or falls short of the interest payments, one party will receive a payment from or make a payment to the other party.
In a credit default swap agreement, one party makes payments to another party in exchange for the right to receive a specified return if a credit event occurs with respect to a referenced entity or entities. Buying credit default protection reduces the buyer's exposure in the event of an issuer's default (e.g., it reduces risk where a party owns a security issued by or otherwise has exposure to the issuer). Selling credit default protection subjects the seller to exposure to an issuer's default. A seller of credit default protection receives payments in return for its obligation to pay the principal amount of a debt security (or other agreed-upon value) to the other party upon the occurrence of a credit event (e.g., issuer default or similar event). If no credit event occurs, the seller has no payment obligations. For credit default swap agreements on asset-backed securities, a credit event may be triggered by such events as the issuer's failure to pay interest or principal, an agreement of the holders of an asset-backed security to a maturity extension, a rating downgrade on the security or a write-down on the collateral underlying the security. For credit default swap agreements on corporate or sovereign issuers, a credit event may be triggered by such events as the issuer's bankruptcy, failure to pay interest or principal, repudiation/moratorium or restructuring.
Variance swap agreements involve an agreement by two parties to exchange cash flows based on the measured variance (or square of volatility) of a specified underlying asset. One party agrees to exchange a "fixed rate" or strike price payment for the "floating rate" or realized price variance on the underlying asset with respect to the notional amount. At inception, the strike price chosen is generally fixed at a level such that the fair value of the swap is zero. At the expiration date, the amount paid by one party to the other is the difference between the realized price variance of the underlying asset and the strike price multiplied by the notional amount. A receiver of the realized price variance would receive a payment when the realized price variance of the underlying asset is greater than the strike price and would make a payment when that variance is less than the strike price. A payer of the realized price variance woul d make a payment when the realized price variance of the underlying asset is greater than the strike price and would receive a payment when that variance is less than the strike price. This type of agreement is essentially a forward contract on the future realized price variance of the underlying asset.
The Fund prices its swap agreements daily using models that may incorporate quotations from market makers and records the change in value, if any, as unrealized gain or loss in the Statement of Operations. Payments received or made on swap agreements are recorded as realized gain or loss in the Statement of Operations. Gains or losses are realized upon termination of the swap agreements.
Swap agreements often are not actively traded on financial markets. The values assigned to them may differ significantly from the values that would be realized upon termination, and the differences could be material. Entering into swap agreements involves credit, legal, market and documentation risk that is not reflected in the amounts reported in the Statement of Assets and Liabilities. Such risks include the
29
GMO International Small Companies Fund
(A Series of GMO Trust)
Notes to Financial Statements — (Continued)
February 28, 2009
possibility that the party with whom the Fund contracts may default on its obligations to perform or disagree as to the meaning of contractual terms, or that the collateral that party posts may be insufficient or not timely received by the Fund. Credit risk may be particularly acute in an environment where financial services firms are exposed to systemic risks of the type evidenced by the insolvency of Lehman Brothers and subsequent market disruptions. The Fund had no swap agreements outstanding at the end of the period.
Securities lending
The Fund may lend its securities to qualified brokers. The loans are collateralized with cash or liquid securities with a market value at least equal to the market value of the securities upon entering into the loan. As with other extensions of credit, the Fund may bear the risk of loss with respect to the investment of the collateral, the risk of delay in and/or inability to exercise its rights with respect to the collateral, and the risk of delay in recovery or loss of rights in the loaned securities should the borrower of the securities fail financially. If a loan is collateralized by U.S. government securities, the Fund receives a fee from the borrower. If a loan is collateralized by cash, the Fund typically invests the cash collateral for its own account. As of February 28, 2009, the Fund had no securities on loan.
Taxes and distributions
The Fund intends to qualify each tax year as a regulated investment company under Subchapter M of the Internal Revenue Code of 1986, as amended (the "Code"). The Fund intends to distribute substantially all of its net investment income and all of its net realized short-term and long-term capital gain, if any, after giving effect to any available capital loss carryforwards for U.S. federal income tax purposes. Therefore, no provision for U.S. federal income or excise tax is necessary. Taxes on foreign interest and dividend income are generally withheld in accordance with the applicable country's tax treaty with the United States. The foreign withholding rates applicable to a Fund's investments in certain foreign jurisdictions may be higher if a significant portion of the Fund is held by non-U.S. shareholders.
The Fund's policy is to declare and pay distributions from net investment income, if any, semiannually, and from net realized short-term and long-term capital gain, if any, at least annually. All distributions are paid in shares of the Fund, at net asset value, unless the shareholder elects to receive cash distributions. Distributions to shareholders are recorded by the Fund on the ex-dividend date.
Foreign taxes paid by the Fund may be treated, to the extent permissible under the Code and if the Fund so elects, as if paid by the shareholders of the Fund.
The Fund may be subject to capital gains and repatriation taxes imposed by certain countries in which it invests.
The Fund is subject to a Contribuição Provisória sobre Movimentações Financiera ("CPMF") tax which is applied to foreign exchange transactions representing capital inflows or outflows to/from the Brazilian
30
GMO International Small Companies Fund
(A Series of GMO Trust)
Notes to Financial Statements — (Continued)
February 28, 2009
market. The CPMF tax has been included in the net realized gain (loss) on investments throughout the period. For the year ended February 28, 2009, the Fund incurred $158 in CPMF tax which is included in net realized gain (loss) on foreign currency, forward contracts and foreign currency related transactions in the Statement of Operations.
Income and capital gain distributions are determined in accordance with U.S. federal income tax regulations, which may differ from U.S. GAAP. Certain capital accounts in the financial statements are periodically adjusted for permanent differences in order to reflect their tax character. These adjustments have no impact on net assets or net asset value per share. Temporary differences that arise from recognizing certain items of income, expense, gain or loss in different periods for financial statement and tax purposes will reverse at some time in the future. Distributions in excess of net investment income or net realized gains are temporary over-distributions for financial statement purposes resulting from differences in the recognition or classification of income or distributions for financial statement and tax purposes.
U.S. GAAP and tax accounting differences primarily relate to capital loss carryforwards, derivative contract transactions, foreign currency transactions, losses on wash sale transactions, passive foreign investment company transactions and post-October capital losses.
The following reclassification represents the amount necessary to report the stated components of net assets on a tax basis, excluding certain temporary differences, as of February 28, 2009. The financial highlights exclude these adjustments.
| Accumulated Undistributed Net Investment Income | Distributions in Excess of Net Realized Gain | Paid-in Capital | |||||||||
| $ | 9,817,333 | $ | (9,817,333 | ) | $ | — | |||||
The tax character of distributions declared to shareholders is as follows:
| 2/28/2009 | 2/29/2008 | ||||||||||
| Ordinary income (including any net short-term capital gain) | $ | 11,546,276 | $ | 74,973,732 | |||||||
| Net long-term capital gain | 26,979,416 | 99,805,408 | |||||||||
| Total distributions | $ | 38,525,692 | $ | 174,779,140 | |||||||
Distributions in excess of tax basis earnings and profits, if significant, are reported in the financial statements as a return of capital for tax purposes.
31
GMO International Small Companies Fund
(A Series of GMO Trust)
Notes to Financial Statements — (Continued)
February 28, 2009
As of February 28, 2009, the components of distributable earnings on a tax basis consisted of the following:
| Undistributed ordinary income (including any net short-term capital gain) | $ | 7,957,418 | |||||
As of February 28, 2009, the Fund elected to defer to March 1, 2009 post-October capital and currency losses of $48,125,769.
As of February 28, 2009, the Fund had capital loss carryforwards available to offset future realized gains if any, to the extent permitted by the Code. Utilization of the capital loss carryforwards could be subject to limitations imposed by the Code related to share ownership activity. Such losses expire as follows:
| 2/28/2017 | $ | (16,328,991 | ) | ||||
| Total | $ | (16,328,991 | ) | ||||
As of February 28, 2009, the approximate cost for U.S. federal income tax purposes and gross and net unrealized appreciation (depreciation) in value of investments were as follows:
| Aggregate Cost | Gross Unrealized Appreciation | Gross Unrealized (Depreciation) | Net Unrealized Appreciation (Depreciation) | ||||||||||||
| $ | 678,102,612 | $ | 5,405,620 | $ | (306,762,892 | ) | $ | (301,357,272 | ) | ||||||
The Fund is subject to the provisions of Financial Accounting Standards Board Interpretation No. 48 ("FIN 48"), Accounting for Uncertainty in Income Taxes — an Interpretation of FASB Statement No. 109. FIN 48 sets forth a minimum threshold for financial statement recognition of a tax position taken or expected to be taken in a tax return that could affect the Fund's financial statements. The Fund did not have any unrecognized tax benefits or liabilities at February 28, 2009, nor did it have any increases or decreases in unrecognized tax benefits or liabilities for the period then ended. The Fund is subject to examination prior to the expiration of the statute of limitations by U.S. federal and state tax authorities for tax returns filed.
Security transactions and related investment income
Security transactions in the financial statements are accounted for on the trade date. Dividend income, net of applicable foreign withholding taxes, if any, is recorded on the ex-dividend date or, if later, when the Fund is informed of the ex-dividend date. Interest income is recorded on the accrual basis and is adjusted for the amortization of premiums and accretion of discounts. Principal on inflation indexed securities, is adjusted for inflation and any increase or decrease is recorded as interest income or loss. Income is not recognized on securities for which collection is not expected. Non-cash dividends, if any, are recorded at
32
GMO International Small Companies Fund
(A Series of GMO Trust)
Notes to Financial Statements — (Continued)
February 28, 2009
the fair market value of the asset received. In determining the net gain or loss on securities sold, the Fund uses the identified cost basis for the purposes of determining the cost basis.
Expenses
The majority of the expenses of the Trust are directly identifiable to an individual fund. Expenses that are not readily identifiable to a specific fund are allocated taking into consideration, among other things, the nature and type of expense and the relative size of the funds.
Brown Brothers Harriman & Co. ("BBH") serves as custodian and fund accounting agent of the Fund. State Street Bank and Trust Company ("State Street") serves as transfer agent of the Fund. BBH and State Street's fees may be reduced by an earnings allowance calculated on the average daily cash balances the Fund maintains with each agent. The Fund receives the benefit of the earnings allowance. In addition, Goldman Sachs Agency Lending, the Fund's securities lending agent, has agreed to reimburse the Fund for certain transactional expenses related to securities lending activity. Credit balances or expense reimbursements used to reduce fees, if any, are reported as a reduction of expenses in the Statement of Operations.
Purchases and redemptions of Fund shares
As of February 28, 2009, the premium on cash purchases and fee on cash redemptions of Fund shares were each 0.50% of the amount invested or redeemed. The Fund may impose a new purchase premium and/or redemption fee, or modify or eliminate an existing purchase premium and/or redemption fee, at any time. If the Manager determines that any portion of a cash purchase or redemption is offset by a corresponding cash redemption or purchase on the same day, the Fund will ordinarily waive or reduce the purchase premium or redemption fee with respect to that portion. In addition, the Fund may waive or reduce the purchase premium or redemption fee in extraordinary circumstances if the purchase or redemption will not cause the Fund to incur transaction costs. All purchase premiums and redemption fees are paid to the Fund and recorded by the Fund as paid-in-capital. The Fund will waive or reduce the purchase premium relating to the in-kind p ortion of a purchase transaction except for estimated or known transaction costs (e.g. stamp duties and transfer taxes) incurred by the Fund as a result of the transfer of the purchasing shareholder's securities to the Fund. In-kind redemption transactions are generally not subject to redemption fees except when they include a cash component. However, when a substantial portion of a Fund is being redeemed, the Fund may charge a redemption fee based on estimated or known transaction costs resulting from those redemptions. The Fund charges no premium for reinvested distributions.
Investment risks
The Fund is subject to risks involved in investing in foreign securities that are not presented by investments in U.S. securities. These risks may involve adverse political and economic developments, including expropriation and the possible imposition of capital controls or other foreign governmental laws or restrictions. In addition, the securities of some foreign companies and securities markets are less liquid and at times may be more volatile than securities of comparable U.S. companies and U.S. securities markets.
33
GMO International Small Companies Fund
(A Series of GMO Trust)
Notes to Financial Statements — (Continued)
February 28, 2009
Recently issued accounting pronouncement
In March 2008, FASB issued Statement of Financial Accounting Standards No. 161, Disclosures about Derivative Instruments and Hedging Activities ("SFAS 161"). SFAS 161 is effective for fiscal years and interim periods beginning after November 15, 2008. SFAS 161 requires enhanced disclosures about the Fund's derivative and hedging activities. The Manager is currently evaluating the impact the adoption of SFAS 161 will have on the Fund's financial statement disclosures.
3. Fees and other transactions with affiliates
GMO receives a management fee for the services it provides to the Fund. That fee is paid monthly at the annual rate of 0.60% of average daily net assets. The Fund has adopted a Shareholder Service Plan under which the Fund pays GMO a shareholder service fee for client and shareholder service, reporting, and other support. Pursuant to the Shareholder Service Plan, the shareholder service fee is calculated based on average daily net assets at the annual rate of 0.15% for Class III shares.
Through at least June 30, 2009, the Manager has contractually agreed to reimburse the Fund for Fund expenses incurred through that date to the extent the Fund's total annual operating expenses (excluding "Excluded Expenses", as defined below) exceed 0.60% of the Fund's average daily net assets. Excluded Expenses include shareholder service fees, fees and expenses of the independent Trustees of the Trust, fees and expenses for legal services not approved by the Manager for the Trust, compensation and expenses of the Trust's Chief Compliance Officer ("CCO") (excluding any employee benefits), brokerage commissions, securities lending fees and expenses, interest expense, transfer taxes, and other investment-related costs (including expenses associated with investments in any company that is an investment company or would be an investment company under the 1940 Act, but for the exceptions to the definition of investment company provi ded in Section 3(c)(1) and 3(c)(7) of the 1940 Act), hedging transaction fees, extraordinary, non-recurring and certain other unusual expenses (including taxes).
The Fund's portion of the fees paid by the Trust to the Trust's independent Trustees and CCO during the year ended February 28, 2009 was $6,411 and $4,049, respectively. The compensation and expenses of the CCO are included in miscellaneous expenses in the Statement of Operations. The Fund paid no remuneration to any other officer of the Trust.
4. Purchases and sales of securities
Cost of purchases and proceeds from sales of securities, excluding short-term investments, for the year ended February 28, 2009 aggregated $425,677,266 and $340,893,012, respectively.
34
GMO International Small Companies Fund
(A Series of GMO Trust)
Notes to Financial Statements — (Continued)
February 28, 2009
5. Guarantees
In the normal course of business the Fund enters into contracts with third-party service providers that contain a variety of representations and warranties and that provide general indemnifications. The Fund's maximum exposure under these arrangements is unknown, as it involves future claims that may be made against the Fund that have not yet occurred. Based on experience, management is of the view that the risk of loss in connection with its indemnification obligations is remote; however, there can be no assurance that such obligations will not result in material liabilities that adversely affect the Fund.
6. Principal shareholders and related parties
As of February 28, 2009, 47.71% of the outstanding shares of the Fund were held by three shareholders, each holding more than 10% of the Fund's outstanding shares. On that date, no other shareholder owned more than 10% of the outstanding shares of the Fund. Redemptions from (or investments into) the Fund by or on behalf of these large shareholders may have a material effect on the Fund.
As of February 28, 2009, 0.11% of the Fund's shares were held by senior management of the Manager and GMO Trust officers and 20.93% of the Fund's shares were held by accounts for which the Manager had investment discretion.
7. Share transactions
The Declaration of Trust permits the Trust to issue an unlimited number of shares of beneficial interest (without par value). Transactions in Fund shares were as follows:
| Year Ended February 28, 2009 | Year Ended February 29, 2008 | ||||||||||||||||||
| Class III: | Shares | Amount | Shares | Amount | |||||||||||||||
| Shares sold | 27,018,472 | $ | 144,232,120 | 14,345,120 | $ | 167,353,499 | |||||||||||||
| Shares issued to shareholders in reinvestment of distributions | 5,410,297 | 37,797,241 | 16,860,674 | 173,069,697 | |||||||||||||||
| Shares repurchased | (13,514,910 | ) | (84,108,585 | ) | (28,165,322 | ) | (334,551,647 | ) | |||||||||||
| Purchase premiums | — | 671,626 | — | 803,005 | |||||||||||||||
| Redemption fees | — | 366,215 | — | 1,790,768 | |||||||||||||||
| Net increase (decrease) | 18,913,859 | $ | 98,958,617 | 3,040,472 | $ | 8,465,322 | |||||||||||||
35
Report of Independent Registered Public Accounting Firm
To the Trustees of GMO Trust and the Shareholders of
GMO International Small Companies Fund:
In our opinion, the accompanying statement of assets and liabilities, including the schedule of investments, and the related statements of operations and of changes in net assets and the financial highlights present fairly, in all material respects, the financial position of GMO International Small Companies Fund (the "Fund") at February 28, 2009, the results of its operations for the year then ended, the changes in its net assets for each of the two years in the period then ended and the financial highlights for each of the five years in the period then ended, in conformity with accounting principles generally accepted in the United States of America. These financial statements and financial highlights (hereafter referred to as "financial statements") are the responsibility of the Fund's management. Our responsibility is to express an opinion on these financial statements based on our audits. We conducted our audits of these fi nancial statements in accordance with the standards of the Public Company Accounting Oversight Board (United States). Those standards require that we plan and perform the audit to obtain reasonable assurance about whether the financial statements are free of material misstatement. An audit includes examining, on a test basis, evidence supporting the amounts and disclosures in the financial statements, assessing the accounting principles used and significant estimates made by management, and evaluating the overall financial statement presentation. We believe that our audits, which included confirmation of securities at February 28, 2009 by correspondence with the custodian and brokers, provide a reasonable basis for our opinion.
PricewaterhouseCoopers LLP
Boston, Massachusetts
April 29, 2009
36
GMO International Small Companies Fund
(A Series of GMO Trust)
Fund Expenses
February 28, 2009 (Unaudited)
Expense Examples: The following information is in relation to expenses for the six month period ended February 28, 2009.
As a shareholder of the Fund, you may incur two types of costs: (1) transaction costs, including purchase premiums and redemption fees; and (2) ongoing costs, including management fees, shareholder service fees, and other Fund expenses. This example is intended to help you understand your ongoing costs (in dollars) of investing in the Fund and to compare these costs with the ongoing costs of investing in other mutual funds.
These examples are based on an investment of $1,000 invested at the beginning of the period and held for the entire period, September 1, 2008, through February 28, 2009.
Actual Expenses
The first line of the table below provides information about actual account values and actual expenses. You may use the information in this line, together with the amount you invested, to estimate the expenses that you paid over the period. Simply divide your account value by $1,000 (for example, a $10,000,000 account value divided by $1,000 = 10,000), then multiply the result by the number in the first line under the heading entitled "Net Expense Incurred" to estimate the expenses you paid on your account during this period.
Hypothetical Example for Comparison Purposes
The second line of the table below provides information about hypothetical account values and hypothetical expenses based on the Fund's actual expense ratio and an assumed rate of return of 5% per year before expenses, which is not the Fund's actual return. The hypothetical account values and expenses may not be used to estimate the actual ending account balance or expenses you paid for the period. You may use this information to compare the ongoing costs of investing in the Fund with other funds. To do so, compare this 5% hypothetical example with the 5% hypothetical examples that appear in the shareholder reports of other funds.
Please note that the expenses shown in the table are meant to highlight your ongoing costs only and do not reflect any transactional costs, such as purchase premiums and redemption fees. Therefore, the second line of the table is useful in comparing ongoing costs only, and will not help you determine the relative total costs of owning different funds. In addition, if these transactional costs were included, your costs would have been higher.
| Annualized Net Expense Ratio | Beginning Account Value | Ending Account Value | Net Expense Incurred* | ||||||||||||||||
| Class III | |||||||||||||||||||
| 1) Actual | 0.75 | % | $ | 1,000.00 | $ | 546.90 | $ | 2.88 | |||||||||||
| 2) Hypothetical | 0.75 | % | $ | 1,000.00 | $ | 1,021.08 | $ | 3.76 | |||||||||||
* Expenses are calculated using the Class's annualized net expense ratio for the six months ended February 28, 2009, multiplied by the average account value over the period, multiplied by 181 days in the period, divided by 365 days in the year.
37
GMO International Small Companies Fund
(A Series of GMO Trust)
Tax Information for the Tax Year Ended February 28, 2009 (Unaudited)
The Fund will notify shareholders of amounts for use in preparing 2009 income tax forms in January 2010.
The Fund's distributions to shareholders include $26,979,416 from long-term capital gains.
During the year ended February 28, 2009, the Fund paid foreign taxes of $1,754,550 and recognized foreign source income of $21,018,038.
For taxable, non-corporate shareholders, 100.00% of the income and short-term capital gains, if any, distributed in the Fund's fiscal year ended February 28, 2009 represents qualified dividend income subject to the 15% rate category.
The Fund hereby designates as qualified interest income with respect to its taxable year ended February 28, 2009, $469,477 or if determined to be different, the qualified interest income of such year.
38
Trustees and Officers (Unaudited)
The following tables list the Trust's Trustees and Officers as of the date of this report; their address and date of birth ("DOB"); their position with the Trust; the length of time holding that position with the Trust; their principal occupation(s) during the past five years; the number of portfolios in the fund complex they oversee; and other directorships they hold in companies subject to registration or reporting requirements of the Securities Exchange Act of 1934 (generally called "public companies") or in registered investment companies. The Trust's Statement of Additional Information ("SAI") includes additional information about the Trust's trustees, including changes subsequent to the date of the report. The SAI is available, without charge, upon request by writing GMO, c/o GMO Trust, 40 Rowes Wharf, Boston, MA 02110.
Independent Trustees:
| Name, Address, and DOB | Position(s) Held with Trust | Term of Office1 and Length of Time Served | Principal Occupation(s) During Past Five Years | Number of Portfolios in Fund Complex Overseen by Trustee | Other Directorships Held by Trustee | ||||||||||||||||||
| Donald W. Glazer, Esq. c/o GMO Trust 40 Rowes Wharf Boston, MA 02110 DOB: 07/26/1944 | Chairman of the Board of Trustees | Chairman of the Board of Trustees since March 2005; Lead Independent Trustee (September 2004 – March 2005); Trustee since December 2000. | Consultant – Law and Business2; Author of Legal Treatises. | 59 | None. | ||||||||||||||||||
1 Each Trustee is elected to serve during the continued lifetime of the Trust until he/she dies, resigns or is removed, or if sooner, until the next meeting of Shareholders called for the purpose of electing Trustees and until the election and qualification of his/her successor.
2 As part of Mr. Glazer's work as a consultant, he provides part-time consulting services to Goodwin Procter LLP ("Goodwin"). Goodwin has provided legal services to Renewable Resources, LLC, an affiliate of GMO; GMO, in connection with its relationship with Renewable Resources; and funds managed by Renewable Resources. Mr. Glazer has represented that he has no financial interest in, and is not involved in the provision of, such legal services. In the calendar years ended December 31, 2007 and December 31, 2008, these entities paid $789,416 and $183,864 respectively, in legal fees and disbursements to Goodwin. In correspondence with the Staff of the Securities and Exchange Commission beginning in August 2006, the Independent Trustees' legal counsel provided the Staff with information regarding Mr. Glazer's relationship with Goodwin and h is other business activities. On September 11, 2007, based on information that had been given to the Staff as of that date, the Staff provided oral no-action assurance consistent with the opinion of the Independent Trustees' legal counsel that Mr. Glazer is not an "interested person" of the Trust.
39
Independent Trustees — (Continued)
| Name, Address, and DOB | Position(s) Held with Trust | Term of Office1 and Length of Time Served | Principal Occupation(s) During Past Five Years | Number of Portfolios in Fund Complex Overseen by Trustee | Other Directorships Held by Trustee | ||||||||||||||||||
| W. Nicholas Thorndike c/o GMO Trust 40 Rowes Wharf Boston, MA 02110 DOB: 03/28/1933 | Trustee | Since March 2005. | Director or trustee of various corporations and charitable organizations, including Courier Corporation (a book publisher and manufacturer) (July 1989 – present); Putnam Funds (December 1992 – June 2004); and Providence Journal (a newspaper publisher) (December 1986 – December 2003). | 59 | Director of Courier Corporation (a book publisher and manufacturer); Member of the Investment Committee of Partners HealthCare System, Inc.3 | ||||||||||||||||||
| Peter Tufano c/o GMO Trust 40 Rowes Wharf Boston, MA 02110 DOB: 04/22/1957 | Trustee | Since December 2008. | Sylvan C. Coleman Professor of Financial Management, Harvard Business School (since 1989). | 59 | Trustee of State Street Navigator Securities Lending Trust (3 Portfolios). | ||||||||||||||||||
1 Each Trustee is elected to serve during the continued lifetime of the Trust until he/she dies, resigns or is removed, or if sooner, until the next meeting of Shareholders called for the purpose of electing Trustees and until the election and qualification of his/her successor.
3 Partners HealthCare System, Inc. is a client of the Manager.
40
Principal Officers:
| Name, Address, and DOB | Position(s) Held with Trust | Term of Office4 and Length of Time Served | Principal Occupation(s) During Past Five Years5 | ||||||||||||
| J.B. Kittredge DOB: 08/22/1954 | President and Chief Executive Officer | Since March 2009. | General Counsel, Grantham, Mayo, Van Otterloo & Co. LLC (October 2005 – Present); Partner, Ropes & Gray LLP. | ||||||||||||
| Sheppard N. Burnett c/o GMO Trust 40 Rowes Wharf Boston, MA 02110 DOB: 10/24/1968 | Treasurer and Chief Financial Officer | Chief Financial Officer since March 2007; Treasurer since November 2006; Assistant Treasurer, September 2004 – November 2006. | Fund Administration Staff, Grantham, Mayo, Van Otterloo & Co. LLC (June 2004 – present); Vice President, Director of Tax, Columbia Management Group (2002 – 2004). | ||||||||||||
| Brent C. Arvidson c/o GMO Trust 40 Rowes Wharf Boston, MA 02110 DOB: 06/26/1969 | Assistant Treasurer | Since August 1998. | Senior Fund Administrator, Grantham, Mayo, Van Otterloo & Co. LLC. | ||||||||||||
| John L. Nasrah c/o GMO Trust 40 Rowes Wharf Boston, MA 02110 DOB: 05/27/1977 | Assistant Treasurer | Since March 2007. | Fund Administrator, Grantham, Mayo, Van Otterloo & Co. LLC (September 2004 – present); Tax Analyst, Bain & Company, Inc. (June 2003 – September 2004). | ||||||||||||
| Mahmoodur Rahman c/o GMO Trust 40 Rowes Wharf Boston, MA 02110 DOB: 11/30/1967 | Assistant Treasurer | Since September 2007. | Fund Administrator, Grantham, Mayo, Van Otterloo & Co. LLC (April 2007 – present); Vice President and Senior Tax Manager, Massachusetts Financial Services Company (January 2000 – April 2007). | ||||||||||||
| Michael E. Gillespie c/o GMO Trust 40 Rowes Wharf Boston, MA 02110 DOB: 02/18/1958 | Chief Compliance Officer | Since March 2005. | Vice President of Compliance (June 2004 – February 2005) and Director of Domestic Compliance (March 2002 – June 2004), Fidelity Investments. | ||||||||||||
4 Each officer is elected to hold such office until his or her successor is duly elected and qualified to carry out the duties and responsibilities of the office, or until he or she resigns or is removed from office.
5 Each of Messrs. Burnett, Arvidson, Bohan, and Pottle serves as an officer and/or director of certain pooled investment vehicles of which GMO or an affiliate of GMO serves as the investment adviser.
41
Principal Officers — (Continued)
| Name, Address, and DOB | Position(s) Held with Trust | Term of Office4 and Length of Time Served | Principal Occupation(s) During Past Five Years5 | ||||||||||||
| Jason B. Harrison c/o GMO Trust 40 Rowes Wharf Boston, MA 02110 DOB: 01/29/1977 | Vice President and Clerk | Vice President since November 2006; Clerk since March 2006. | Legal Counsel, Grantham, Mayo, Van Otterloo & Co. LLC (since February 2006) and Attorney, Ropes & Gray LLP (September 2002 – February 2006). | ||||||||||||
| David L. Bohan c/o GMO Trust 40 Rowes Wharf Boston, MA 02110 DOB: 06/21/1964 | Vice President and Assistant Clerk | Vice President since March 2005; Assistant Clerk since March 2006. | Legal Counsel, Grantham, Mayo, Van Otterloo & Co. LLC. | ||||||||||||
| Gregory L. Pottle c/o GMO Trust 40 Rowes Wharf Boston, MA 02110 DOB: 07/09/1971 | Vice President and Assistant Clerk | Since November 2006. | Legal Counsel, Grantham, Mayo, Van Otterloo & Co. LLC. | ||||||||||||
| Anne K. Trinque c/o GMO Trust 40 Rowes Wharf Boston, MA 02110 DOB: 04/15/1978 | Vice President and Assistant Clerk | Since September 2007. | Legal Counsel, Grantham, Mayo, Van Otterloo & Co. LLC (January 2007 – present); Attorney, Goodwin Procter LLP (September 2003 – January 2007). | ||||||||||||
| Cheryl Wakeham c/o GMO Trust 40 Rowes Wharf Boston, MA 02110 DOB: 10/29/1958 | Vice President and Anti-Money Laundering Officer | Since December 2004. | Manager, Client Service Administration, Grantham, Mayo, Van Otterloo & Co. LLC. | ||||||||||||
4 Each officer is elected to hold such office until his or her successor is duly elected and qualified to carry out the duties and responsibilities of the office, or until he or she resigns or is removed from office.
5 Each of Messrs. Burnett, Arvidson, Bohan, and Pottle serves as an officer and/or director of certain pooled investment vehicles of which GMO or an affiliate of GMO serves as the investment adviser.
42
GMO Foreign Fund
(A Series of GMO Trust)
Annual Report
February 28, 2009
For a free copy of the Fund's proxy voting guidelines, shareholders may call 1-617-346-7646 (collect) or visit the Securities and Exchange Commission's website at www.sec.gov. Information regarding how the Fund voted proxies relating to portfolio securities during the most recent 12-month period ended June 30 is available on GMO's website at www.gmo.com, or on the Securities and Exchange Commission's website at www.sec.gov.
The Fund files its complete schedule of portfolio holdings with the Securities and Exchange Commission for the first and third quarter of each fiscal year on Form N-Q, which is available on the Commission's website at www.sec.gov. The Fund's Form N-Q may be reviewed and copied at the Commission's Public Reference Room in Washington, D.C. Information on the operation of the Public Reference Room may be obtained by calling 1-800-SEC-0330. The Fund has a policy with respect to disclosure of portfolio holdings under which it may also make available on GMO's website at www.gmo.com a complete schedule of portfolio holdings.
This report is prepared for the general information of shareholders. It is authorized for distribution to prospective investors only when preceded or accompanied by a prospectus for the GMO Trust, which contains a complete discussion of the risks associated with an investment in this Fund and other important information. The GMO Trust prospectus can be obtained at www.gmo.com.
GMO Foreign Fund
(A Series of GMO Trust)
Portfolio Management
Day-to-day management of the Fund's portfolio is the responsibility of the International Active team at Grantham, Mayo, Van Otterloo & Co. LLC.
Management Discussion and Analysis of Fund Performance
The Class III shares of the GMO Foreign Fund returned -47.4% for the fiscal year ended February 28, 2009, as compared to -50.2% for the MSCI EAFE Index. Consistent with the Fund's investment objectives and policies, the Fund was invested substantially in international equity securities throughout the period.
Stock selection added 2.1% to returns for the fiscal year. Holdings outperformed in the United Kingdom, Japan, and France. Stock selection was negative in the emerging markets.
Country selection was ahead of the MSCI EAFE Index by 0.7%. The largest positive contribution to country selection came from an underweight position in Australia, which added 0.3%.
The views expressed herein are exclusively those of Grantham, Mayo, Van Otterloo & Co. LLC Management as of the date of this report and are subject to change. GMO disclaims any responsibility to update such views. They are not meant as investment advice.
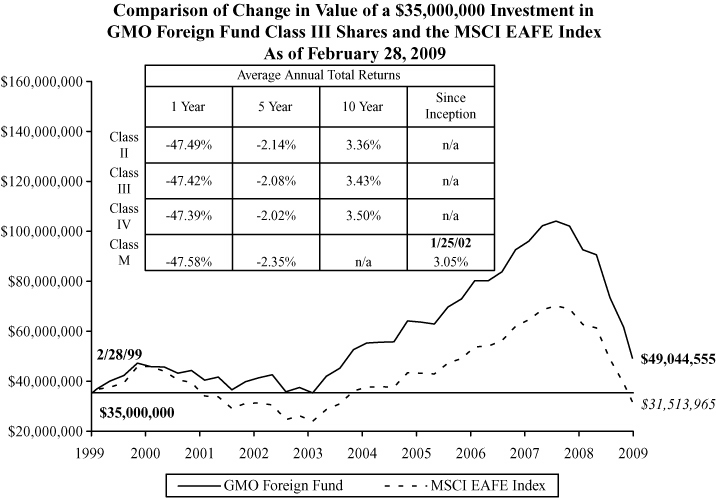
Performance data quoted represents past performance and is not indicative of future results. The investment return and principal value of an investment will fluctuate so that an investor's shares, when redeemed, may be worth more or less than their original cost. Current performance data may be lower or higher than the performance data provided herein. To obtain performance information to the most recent month-end, visit www.gmo.com. Performance shown is net of all fees after reimbursement from the Manager. Returns would have been lower had certain expenses not been reimbursed during the periods shown and do not include the effect of taxes on distributions and redemptions. All information is unaudited. Performance for Class II, IV and M will vary due to different fees.
GMO Foreign Fund
(A Series of GMO Trust)
Investments Concentration Summary
February 28, 2009 (Unaudited)
| Asset Class Summary | % of Total Net Assets | ||||||
| Common Stocks | 96.8 | % | |||||
| Short-Term Investments | 2.9 | ||||||
| Preferred Stocks | 0.1 | ||||||
| Rights and Warrants | 0.0 | ||||||
| Other | 0.2 | ||||||
| 100.0 | % | ||||||
| Country Summary | % of Equity Investments | ||||||
| Japan | 28.9 | % | |||||
| United Kingdom | 24.8 | ||||||
| France | 8.7 | ||||||
| Germany | 7.9 | ||||||
| Italy | 5.1 | ||||||
| Switzerland | 4.6 | ||||||
| Hong Kong | 3.4 | ||||||
| Netherlands | 3.1 | ||||||
| Finland | 2.8 | ||||||
| Spain | 2.6 | ||||||
| Australia | 2.0 | ||||||
| Norway | 1.6 | ||||||
| Singapore | 1.3 | ||||||
| Belgium | 0.8 | ||||||
| South Korea | 0.5 | ||||||
| Taiwan | 0.5 | ||||||
| Austria | 0.3 | ||||||
| Brazil | 0.3 | ||||||
| Greece | 0.3 | ||||||
| India | 0.1 | ||||||
| Indonesia | 0.1 | ||||||
| Ireland | 0.1 | ||||||
| Malaysia | 0.1 | ||||||
| Sweden | 0.1 | ||||||
| Canada | 0.0 | ||||||
| New Zealand | 0.0 | ||||||
| Philippines | 0.0 | ||||||
| 100.0 | % | ||||||
1
GMO Foreign Fund
(A Series of GMO Trust)
Investments Concentration Summary — (Continued)
February 28, 2009 (Unaudited)
| Industry Sector Summary | % of Equity Investments | ||||||
| Financials | 15.2 | % | |||||
| Consumer Staples | 13.3 | ||||||
| Energy | 11.5 | ||||||
| Telecommunication Services | 10.9 | ||||||
| Health Care | 10.7 | ||||||
| Industrials | 10.6 | ||||||
| Consumer Discretionary | 9.5 | ||||||
| Utilities | 9.1 | ||||||
| Information Technology | 5.3 | ||||||
| Materials | 3.9 | ||||||
| 100.0 | % | ||||||
2
GMO Foreign Fund
(A Series of GMO Trust)
Schedule of Investments
(showing percentage of total net assets)
February 28, 2009
| Shares | Description | Value ($) | |||||||||||||
| COMMON STOCKS — 96.8% | |||||||||||||||
| Australia — 1.9% | |||||||||||||||
| 478,260 | Aristocrat Leisure Ltd | 1,117,448 | |||||||||||||
| 808,900 | Australia and New Zealand Banking Group Ltd | 6,775,369 | |||||||||||||
| 1,168,594 | Brambles Ltd | 3,414,518 | |||||||||||||
| 915,506 | Coca Cola Amatil Ltd | 5,224,701 | |||||||||||||
| 118,000 | Commonwealth Bank of Australia | 2,225,065 | |||||||||||||
| 711,402 | Consolidated Media Holdings Ltd | 899,986 | |||||||||||||
| 1,771,424 | Crown Ltd | 5,833,822 | |||||||||||||
| 159,400 | CSL Ltd | 3,686,350 | |||||||||||||
| 2,098,200 | Fairfax Media Ltd (a) | 1,006,270 | |||||||||||||
| 618,758 | Foster's Group Ltd | 2,166,265 | |||||||||||||
| 515,800 | Goodman Group | 82,952 | |||||||||||||
| 1,977,896 | Insurance Australia Group Ltd | 4,287,556 | |||||||||||||
| 410,500 | Insurance Australia Group Ltd (Placement Shares) | 887,230 | |||||||||||||
| 607,863 | Lend Lease Corp Ltd | 2,055,668 | |||||||||||||
| 1,170,600 | Metcash Ltd | 3,109,660 | |||||||||||||
| 236,665 | National Australia Bank Ltd | 2,658,358 | |||||||||||||
| 350,585 | QBE Insurance Group Ltd | 4,210,735 | |||||||||||||
| 911,351 | TABCORP Holdings Ltd | 3,692,972 | |||||||||||||
| 1,731,560 | Tatts Group Ltd | 3,135,832 | |||||||||||||
| 1,187,829 | Telstra Corp Ltd | 2,676,984 | |||||||||||||
| 197,100 | Westpac Banking Corp | 2,101,896 | |||||||||||||
| Total Australia | 61,249,637 | ||||||||||||||
| Austria — 0.3% | |||||||||||||||
| 26,240 | Flughafen Wien AG | 712,090 | |||||||||||||
| 120,190 | OMV AG | 3,131,024 | |||||||||||||
| 344,850 | Telekom Austria AG | 4,487,733 | |||||||||||||
| 114,520 | Wienerberger AG | 922,244 | |||||||||||||
| Total Austria | 9,253,091 | ||||||||||||||
See accompanying notes to the financial statements.
3
GMO Foreign Fund
(A Series of GMO Trust)
Schedule of Investments — (Continued)
(showing percentage of total net assets)
February 28, 2009
| Shares | Description | Value ($) | |||||||||||||
| Belgium — 0.8% | |||||||||||||||
| 219,170 | Belgacom SA | 7,133,787 | |||||||||||||
| 365,873 | Compagnie d'Entreprises CFE | 9,091,500 | |||||||||||||
| 56,875 | Groupe Bruxelles Lambert SA | 3,636,839 | |||||||||||||
| 46,000 | Solvay SA | 2,603,260 | |||||||||||||
| 106,000 | UCB SA | 2,916,294 | |||||||||||||
| Total Belgium | 25,381,680 | ||||||||||||||
| Brazil — 0.3% | |||||||||||||||
| 867,300 | Hypermarcas SA * | 5,095,578 | |||||||||||||
| 210,200 | Sul America SA | 1,744,781 | |||||||||||||
| 132,973 | Totvs SA | 2,379,880 | |||||||||||||
| Total Brazil | 9,220,239 | ||||||||||||||
| Canada — 0.0% | |||||||||||||||
| 220,100 | KAP Resources Ltd * (a) (b) | 1,730 | |||||||||||||
| Finland — 2.7% | |||||||||||||||
| 492,700 | Fortum Oyj | 8,461,983 | |||||||||||||
| 536,000 | KCI Konecranes Oyj | 8,680,655 | |||||||||||||
| 356,668 | Neste Oil Oyj | 4,442,846 | |||||||||||||
| 1,891,100 | Nokia Oyj | 17,720,213 | |||||||||||||
| 1,315,298 | Nokian Renkaat Oyj | 15,492,955 | |||||||||||||
| 310,500 | Outokumpu Oyj | 3,141,140 | |||||||||||||
| 425,600 | Sampo Oyj Class A | 5,597,553 | |||||||||||||
| 734,875 | UPM-Kymmene Oyj | 5,194,533 | |||||||||||||
| 481,800 | Uponor Oyj | 4,857,280 | |||||||||||||
| 127,800 | Wartsila Oyj Class B | 2,923,267 | |||||||||||||
| 1,459,359 | YIT Oyj | 8,748,394 | |||||||||||||
| Total Finland | 85,260,819 | ||||||||||||||
| France — 8.4% | |||||||||||||||
| 82,828 | Accor SA | 2,942,183 | |||||||||||||
| 211,742 | ArcelorMittal | 4,058,402 | |||||||||||||
| 596,612 | AXA | 5,438,267 | |||||||||||||
See accompanying notes to the financial statements.
4
GMO Foreign Fund
(A Series of GMO Trust)
Schedule of Investments — (Continued)
(showing percentage of total net assets)
February 28, 2009
| Shares | Description | Value ($) | |||||||||||||
| France — continued | |||||||||||||||
| 373,361 | BNP Paribas | 12,091,364 | |||||||||||||
| 178,700 | Carrefour SA | 5,973,567 | |||||||||||||
| 56,414 | Casino Guichard-Perrachon SA | 3,485,328 | |||||||||||||
| 76,418 | Compagnie Generale des Etablissements Michelin-Class B | 2,464,212 | |||||||||||||
| 134,045 | Essilor International SA | 4,626,172 | |||||||||||||
| 1,371,011 | France Telecom SA | 30,639,039 | |||||||||||||
| 880,124 | GDF Suez | 27,794,122 | |||||||||||||
| 131,586 | GDF Suez VVPR Strip * | 167 | |||||||||||||
| 206,453 | Groupe Danone | 9,797,500 | |||||||||||||
| 120,055 | L'Oreal SA | 7,722,812 | |||||||||||||
| 60,601 | Lafarge SA | 2,596,550 | |||||||||||||
| 78,814 | Neopost SA | 5,719,297 | |||||||||||||
| 72,938 | Pernod-Ricard SA | 3,971,538 | |||||||||||||
| 69,767 | Peugeot SA | 1,187,181 | |||||||||||||
| 47,931 | Renault SA | 688,255 | |||||||||||||
| 612,247 | Sanofi-Aventis | 31,467,733 | |||||||||||||
| 158,651 | Schneider Electric SA | 9,470,639 | |||||||||||||
| 91,277 | Societe BIC SA | 4,448,694 | |||||||||||||
| 165,034 | Societe Generale | 5,115,663 | |||||||||||||
| 268,721 | Suez Environnement SA * | 3,911,006 | |||||||||||||
| 61,408 | Technip SA | 1,987,580 | |||||||||||||
| 102,496 | Thales SA | 4,114,073 | |||||||||||||
| 1,152,267 | Total SA | 54,135,287 | |||||||||||||
| 791,726 | Vivendi Universal SA | 18,823,188 | |||||||||||||
| 52,343 | Wendel Investissement | 1,303,779 | |||||||||||||
| Total France | 265,973,598 | ||||||||||||||
| Germany — 7.6% | |||||||||||||||
| 173,464 | Adidas AG | 4,986,788 | |||||||||||||
| 232,676 | Allianz SE (Registered) | 15,618,956 | |||||||||||||
| 73,541 | Axel Springer AG | 4,977,001 | |||||||||||||
| 252,800 | BASF AG | 7,012,580 | |||||||||||||
| 414,799 | Bayer AG | 19,953,760 | |||||||||||||
| 173,100 | Bayerische Motoren Werke AG | 4,281,728 | |||||||||||||
See accompanying notes to the financial statements.
5
GMO Foreign Fund
(A Series of GMO Trust)
Schedule of Investments — (Continued)
(showing percentage of total net assets)
February 28, 2009
| Shares | Description | Value ($) | |||||||||||||
| Germany — continued | |||||||||||||||
| 377,901 | Commerzbank AG | 1,303,013 | |||||||||||||
| 403,281 | Daimler AG (Registered) | 9,135,491 | |||||||||||||
| 141,800 | Deutsche Bank AG (Registered) | 3,648,280 | |||||||||||||
| 107,900 | Deutsche Boerse AG | 4,935,761 | |||||||||||||
| 374,284 | Deutsche Post AG (Registered) | 3,580,519 | |||||||||||||
| 2,103,538 | Deutsche Telekom AG (Registered) | 25,437,693 | |||||||||||||
| 860,864 | E.ON AG | 22,137,044 | |||||||||||||
| 99,400 | Fraport AG | 3,009,639 | |||||||||||||
| 233,500 | Fresenius Medical Care AG & Co | 9,494,001 | |||||||||||||
| 254,818 | Heidelberger Druckmaschinen AG | 1,052,902 | |||||||||||||
| 1,011,400 | Infineon Technologies AG * | 613,534 | |||||||||||||
| 35,700 | Linde AG | 2,294,162 | |||||||||||||
| 104,846 | MAN AG | 4,220,243 | |||||||||||||
| 112,500 | Merck KGaA | 8,421,793 | |||||||||||||
| 161,774 | Muenchener Rueckversicherungs-Gesellschaft AG (Registered) | 19,713,338 | |||||||||||||
| 25,680 | Puma AG Rudolf Dassler Sport | 3,838,334 | |||||||||||||
| 312,500 | RWE AG | 19,876,141 | |||||||||||||
| 723,283 | SAP AG | 23,235,219 | |||||||||||||
| 355,937 | Siemens AG (Registered) | 17,980,300 | |||||||||||||
| Total Germany | 240,758,220 | ||||||||||||||
| Greece — 0.3% | |||||||||||||||
| 504,532 | EFG Eurobank Ergasias | 2,570,955 | |||||||||||||
| 227,542 | OPAP SA | 5,849,867 | |||||||||||||
| 240,000 | Piraeus Bank SA | 1,163,703 | |||||||||||||
| Total Greece | 9,584,525 | ||||||||||||||
| Hong Kong — 3.3% | |||||||||||||||
| 1,869,500 | Cheung Kong Holdings Ltd | 15,144,993 | |||||||||||||
| 1,422,000 | CLP Holdings Ltd | 10,512,193 | |||||||||||||
| 4,174,300 | Great Eagle Holdings Ltd | 5,145,446 | |||||||||||||
| 1,198,900 | Hang Seng Bank Ltd | 13,262,267 | |||||||||||||
| 10,159,755 | Link REIT | 19,283,261 | |||||||||||||
| 2,814,500 | MTR Corp Ltd | 6,246,210 | |||||||||||||
See accompanying notes to the financial statements.
6
GMO Foreign Fund
(A Series of GMO Trust)
Schedule of Investments — (Continued)
(showing percentage of total net assets)
February 28, 2009
| Shares | Description | Value ($) | |||||||||||||
| Hong Kong — continued | |||||||||||||||
| 19,879,887 | New World Development Co Ltd | 17,743,669 | |||||||||||||
| 12,601,000 | Shun Tak Holdings Ltd | 3,999,368 | |||||||||||||
| 6,625,000 | Wharf Holdings Ltd (The) | 13,839,098 | |||||||||||||
| Total Hong Kong | 105,176,505 | ||||||||||||||
| India — 0.1% | |||||||||||||||
| 109,300 | Infosys Technologies Sponsored ADR | 2,645,060 | |||||||||||||
| Indonesia — 0.1% | |||||||||||||||
| 8,056,000 | Telekomunikasi Indonesia Tbk PT | 4,239,786 | |||||||||||||
| Ireland — 0.1% | |||||||||||||||
| 116,818 | CRH Plc | 2,399,126 | |||||||||||||
| 7,900 | DCC Plc | 107,323 | |||||||||||||
| 17,500 | FBD Holdings Plc | 168,542 | |||||||||||||
| Total Ireland | 2,674,991 | ||||||||||||||
| Italy — 5.0% | |||||||||||||||
| 721,700 | Alleanza Assicurazioni SPA | 3,573,188 | |||||||||||||
| 687,344 | Assicurazioni Generali SPA | 10,332,828 | |||||||||||||
| 157,800 | Atlantia SPA | 2,051,102 | |||||||||||||
| 2,071,948 | Banca Monte dei Paschi di Siena SPA | 2,558,418 | |||||||||||||
| 354,800 | Banca Popolare di Milano Scarl | 1,423,115 | |||||||||||||
| 301,054 | Buzzi Unicem SPA | 2,802,348 | |||||||||||||
| 4,097,735 | Enel SPA | 20,366,619 | |||||||||||||
| 2,111,321 | ENI SPA | 42,141,086 | |||||||||||||
| 948,010 | Fiat SPA | 4,239,970 | |||||||||||||
| 916,556 | Finmeccanica SPA | 11,680,061 | |||||||||||||
| 3,615,728 | Intesa San Paolo | 8,800,513 | |||||||||||||
| 1,086,223 | Intesa Sanpaolo-Di RISP | 1,807,803 | |||||||||||||
| 574,070 | Italcementi SPA-Di RISP | 3,005,356 | |||||||||||||
| 56,000 | Lottomatica SPA | 897,833 | |||||||||||||
| 492,300 | Mediaset SPA | 2,184,709 | |||||||||||||
| 305,400 | Mediobanca SPA | 2,473,170 | |||||||||||||
See accompanying notes to the financial statements.
7
GMO Foreign Fund
(A Series of GMO Trust)
Schedule of Investments — (Continued)
(showing percentage of total net assets)
February 28, 2009
| Shares | Description | Value ($) | |||||||||||||
| Italy — continued | |||||||||||||||
| 2,242,600 | Pirelli & Co SPA | 481,329 | |||||||||||||
| 434,400 | Snam Rete Gas SPA | 2,152,452 | |||||||||||||
| 13,454,498 | Telecom Italia SPA | 16,354,194 | |||||||||||||
| 13,806,076 | Telecom Italia SPA-Di RISP | 13,130,490 | |||||||||||||
| 3,182,082 | UniCredit SPA | 4,030,454 | |||||||||||||
| Total Italy | 156,487,038 | ||||||||||||||
| Japan — 28.0% | |||||||||||||||
| 996,900 | Asahi Breweries Ltd | 12,482,622 | |||||||||||||
| 838,100 | Astellas Pharma Inc | 27,811,058 | |||||||||||||
| 760,700 | Bridgestone Corp | 10,360,547 | |||||||||||||
| 921,700 | Canon Inc | 23,261,010 | |||||||||||||
| 1,478,000 | Chiba Bank Ltd | 6,937,786 | |||||||||||||
| 3,457,000 | Chuo Mitsui Trust Holdings Inc | 10,479,246 | |||||||||||||
| 281,200 | Circle K Sunkus Co Ltd | 4,322,042 | |||||||||||||
| 780,600 | Daiichi Sankyo Co Ltd | 12,541,076 | |||||||||||||
| 240,300 | Denso Corp | 4,562,438 | |||||||||||||
| 792,900 | East Japan Railway Co | 47,484,949 | |||||||||||||
| 210,600 | Electric Power Development Co Ltd | 6,728,965 | |||||||||||||
| 4,567 | Fuji Media Holdings Inc | 5,201,900 | |||||||||||||
| 1,189,000 | Hitachi Ltd | 2,960,747 | |||||||||||||
| 355,100 | Hokkaido Electric Power Co Inc | 7,520,691 | |||||||||||||
| 1,510,400 | Honda Motor Co Ltd | 36,117,887 | |||||||||||||
| 184,800 | Hoya Corp | 3,349,032 | |||||||||||||
| 736,000 | Itochu Corp | 3,300,168 | |||||||||||||
| 811 | Japan Real Estate Investment Corp | 6,037,605 | |||||||||||||
| 6,658 | Japan Tobacco Inc | 15,880,997 | |||||||||||||
| 705,800 | JSR Corp | 8,284,205 | |||||||||||||
| 6,242 | Jupiter Telecommunications Co Ltd | 4,947,099 | |||||||||||||
| 1,889,000 | Kansai Electric Power Co Inc | 45,418,528 | |||||||||||||
| 1,115,000 | Kao Corp | 21,189,662 | |||||||||||||
| 4,105 | KDDI Corp | 21,504,774 | |||||||||||||
| 905,200 | Kirin Holdings Co Ltd | 8,737,118 | |||||||||||||
| 543,200 | Konami Corp | 7,667,593 | |||||||||||||
See accompanying notes to the financial statements.
8
GMO Foreign Fund
(A Series of GMO Trust)
Schedule of Investments — (Continued)
(showing percentage of total net assets)
February 28, 2009
| Shares | Description | Value ($) | |||||||||||||
| Japan — continued | |||||||||||||||
| 473,700 | Kyushu Electric Power Co Inc | 11,218,518 | |||||||||||||
| 413,500 | Lawson Inc | 17,905,303 | |||||||||||||
| 209,400 | Miraca Holdings Inc | 4,350,376 | |||||||||||||
| 897,500 | Mitsubishi Corp | 11,166,228 | |||||||||||||
| 3,566,000 | Mitsubishi Electric Corp | 14,088,143 | |||||||||||||
| 3,448,800 | Mitsubishi UFJ Financial Group Inc | 15,580,381 | |||||||||||||
| 1,210,000 | Mitsui OSK Lines Ltd | 6,133,107 | |||||||||||||
| 821,000 | Nichirei Corp | 2,710,774 | |||||||||||||
| 116,800 | Nihon Kohden Corp | 1,472,837 | |||||||||||||
| 69,300 | Nintendo Co Ltd | 19,785,117 | |||||||||||||
| 761 | Nippon Building Fund Inc | 6,154,816 | |||||||||||||
| 2,180,000 | Nippon Express Co Ltd | 6,270,191 | |||||||||||||
| 1,625,000 | Nippon Oil Corp | 7,744,472 | |||||||||||||
| 360,700 | Nippon Paper Group Inc | 7,995,721 | |||||||||||||
| 2,681,000 | Nippon Steel Corp | 7,037,741 | |||||||||||||
| 303,000 | Nissin Foods Holding Co Ltd | 9,198,177 | |||||||||||||
| 974 | Nomura Real Estate Office Fund (REIT) | 4,916,692 | |||||||||||||
| 345,700 | Nomura Research Institute | 5,444,109 | |||||||||||||
| 6,548 | NTT Data Corp | 16,225,853 | |||||||||||||
| 43,017 | NTT Docomo Inc | 67,012,755 | |||||||||||||
| 629 | ORIX JREIT Inc (REIT) | 1,869,137 | |||||||||||||
| 2,461,000 | Panasonic Corp | 28,493,977 | |||||||||||||
| 643,000 | Ricoh Company Ltd | 7,263,144 | |||||||||||||
| 1,363,000 | Sekisui Chemical Co Ltd | 5,801,742 | |||||||||||||
| 941,400 | Seven & I Holdings Co Ltd | 20,863,154 | |||||||||||||
| 5,498 | Seven Bank Ltd | 15,086,190 | |||||||||||||
| 110,800 | Shin-Etsu Chemical Co Ltd | 4,932,995 | |||||||||||||
| 855,000 | Shionogi & Co Ltd | 13,884,348 | |||||||||||||
| 960,000 | Shiseido Co Ltd | 14,137,645 | |||||||||||||
| 665,000 | Sompo Japan Insurance Inc | 3,279,440 | |||||||||||||
| 3,212 | Sony Financial Holdings Inc | 8,262,015 | |||||||||||||
| 1,174,000 | Sumitomo Chemical Co Ltd | 3,528,886 | |||||||||||||
| 1,254,400 | Sumitomo Electric Industries Ltd | 9,747,435 | |||||||||||||
| 353,000 | Sumitomo Mitsui Financial Group Inc | 11,190,550 | |||||||||||||
See accompanying notes to the financial statements.
9
GMO Foreign Fund
(A Series of GMO Trust)
Schedule of Investments — (Continued)
(showing percentage of total net assets)
February 28, 2009
| Shares | Description | Value ($) | |||||||||||||
| Japan — continued | |||||||||||||||
| 585,000 | Takeda Pharmaceutical Co Ltd | 23,628,048 | |||||||||||||
| 440,000 | Tohoku Electric Power Co Inc | 10,301,733 | |||||||||||||
| 2,224,000 | Tokyo Gas Co Ltd | 8,909,222 | |||||||||||||
| 376,000 | Toyo Suisan Kaisha Ltd | 8,898,637 | |||||||||||||
| 1,459,800 | Toyota Motor Corp | 46,756,877 | |||||||||||||
| 135,000 | Unicharm Corp | 8,819,603 | |||||||||||||
| 5,656 | West Japan Railway Co | 20,035,308 | |||||||||||||
| Total Japan | 883,191,142 | ||||||||||||||
| Malaysia — 0.1% | |||||||||||||||
| 3,046,600 | IJM Corp Berhad | 3,013,730 | |||||||||||||
| Netherlands — 3.0% | |||||||||||||||
| 91,400 | Akzo Nobel NV | 3,193,836 | |||||||||||||
| 110,907 | Hal Trust (Participating Units) | 5,753,111 | |||||||||||||
| 396,000 | Heineken NV | 10,573,484 | |||||||||||||
| 1,628,022 | ING Groep NV | 7,359,131 | |||||||||||||
| 686,800 | Koninklijke Ahold NV | 7,620,807 | |||||||||||||
| 225,000 | Koninklijke DSM NV | 5,142,032 | |||||||||||||
| 1,325,300 | Koninklijke KPN NV | 16,955,728 | |||||||||||||
| 799,432 | Koninklijke Philips Electronics NV | 12,782,313 | |||||||||||||
| 305,518 | Reed Elsevier NV | 3,394,554 | |||||||||||||
| 891,745 | Unilever NV | 17,086,976 | |||||||||||||
| 206,400 | Wolters Kluwer NV | 3,259,517 | |||||||||||||
| Total Netherlands | 93,121,489 | ||||||||||||||
| New Zealand — 0.0% | |||||||||||||||
| 171,477 | Air New Zealand | 70,090 | |||||||||||||
| 538,152 | Telecom Corp of New Zealand | 652,271 | |||||||||||||
| Total New Zealand | 722,361 | ||||||||||||||
| Norway — 1.5% | |||||||||||||||
| 1,029,700 | DnB NOR ASA | 3,704,031 | |||||||||||||
| 3,224,500 | DNO International ASA * | 1,964,971 | |||||||||||||
See accompanying notes to the financial statements.
10
GMO Foreign Fund
(A Series of GMO Trust)
Schedule of Investments — (Continued)
(showing percentage of total net assets)
February 28, 2009
| Shares | Description | Value ($) | |||||||||||||
| Norway — continued | |||||||||||||||
| 5,854,870 | Prosafe ASA * | 21,001,958 | |||||||||||||
| 4,871,020 | Prosafe Production Public Ltd * | 7,905,479 | |||||||||||||
| 1,130,000 | Telenor ASA | 5,811,038 | |||||||||||||
| 348,600 | Yara International ASA | 7,377,085 | |||||||||||||
| Total Norway | 47,764,562 | ||||||||||||||
| Philippines — 0.0% | |||||||||||||||
| 36,000,000 | Alliance Global Group Inc * | 1,089,740 | |||||||||||||
| Singapore — 1.3% | |||||||||||||||
| 4,254,000 | Ascendas Real Estate Investment Trust (REIT) | 3,407,323 | |||||||||||||
| 2,521,430 | DBS Group Holdings Ltd | 12,593,058 | |||||||||||||
| 2,117,800 | Keppel Corp Ltd | 5,877,707 | |||||||||||||
| 8,599,000 | People's Food Holdings Ltd | 3,524,604 | |||||||||||||
| 1,161,300 | Singapore Airlines Ltd | 7,566,777 | |||||||||||||
| 4,594,000 | Singapore Technologies Engineering Ltd | 6,786,149 | |||||||||||||
| Total Singapore | 39,755,618 | ||||||||||||||
| South Korea — 0.4% | |||||||||||||||
| 73,800 | KB Financial Group Inc * | 1,414,927 | |||||||||||||
| 81,500 | Samsung Card Co Ltd | 1,400,012 | |||||||||||||
| 35,900 | Samsung Electronics Co Ltd | 11,041,694 | |||||||||||||
| Total South Korea | 13,856,633 | ||||||||||||||
| Spain — 2.5% | |||||||||||||||
| 28,040 | ACS Actividades de Construccion y Servicios SA | 1,107,343 | |||||||||||||
| 661,492 | Banco Bilbao Vizcaya Argentaria SA | 4,778,631 | |||||||||||||
| 1,469,932 | Banco Santander SA | 8,979,678 | |||||||||||||
| 119,000 | Gas Natural SDG SA | 2,133,253 | |||||||||||||
| 52,000 | Grifols SA * | 815,230 | |||||||||||||
| 4,170 | Grupo Ferrovial SA | 101,553 | |||||||||||||
| 1,770,612 | Iberdrola SA | 11,514,379 | |||||||||||||
| 40,900 | Inditex SA | 1,534,260 | |||||||||||||
| 522,000 | Mapfre SA | 1,061,207 | |||||||||||||
See accompanying notes to the financial statements.
11
GMO Foreign Fund
(A Series of GMO Trust)
Schedule of Investments — (Continued)
(showing percentage of total net assets)
February 28, 2009
| Shares | Description | Value ($) | |||||||||||||
| Spain — continued | |||||||||||||||
| 89,750 | Red Electrica de Espana | 3,599,494 | |||||||||||||
| 329,729 | Repsol YPF SA | 5,036,232 | |||||||||||||
| 22,723 | Tecnicas Reunidas SA | 631,117 | |||||||||||||
| 1,639,361 | Telefonica SA | 30,170,888 | |||||||||||||
| 378,204 | Union Fenosa SA | 8,523,649 | |||||||||||||
| Total Spain | 79,986,914 | ||||||||||||||
| Sweden — 0.1% | |||||||||||||||
| 98,200 | Elekta AB Class B | 1,075,823 | |||||||||||||
| 441,704 | Svenska Cellulosa AB Class B | 2,858,848 | |||||||||||||
| Total Sweden | 3,934,671 | ||||||||||||||
| Switzerland — 4.5% | |||||||||||||||
| 48,500 | Baloise Holding Ltd | 2,746,459 | |||||||||||||
| 135,040 | Bank Sarasin & Cie AG Class B (Registered) | 2,849,386 | |||||||||||||
| 88,910 | Energiedienst Holding AG (Registered) * | 3,413,275 | |||||||||||||
| 4,940 | Forbo Holdings AG (Registered) * | 696,511 | |||||||||||||
| 31,030 | Geberit AG (Registered) | 2,779,480 | |||||||||||||
| 4,726 | Jelmoli Holding AG (Registered) | 1,818,495 | |||||||||||||
| 1,132,310 | Nestle SA (Registered) | 37,015,701 | |||||||||||||
| 987,890 | Novartis AG (Registered) | 36,041,497 | |||||||||||||
| 198,330 | Roche Holding AG (Non Voting) | 22,513,935 | |||||||||||||
| 100,660 | Swiss Reinsurance Co (Registered) | 1,239,241 | |||||||||||||
| 46,890 | Swisscom AG (Registered) | 14,045,135 | |||||||||||||
| 111,968 | Zurich Financial Services AG | 15,856,625 | |||||||||||||
| Total Switzerland | 141,015,740 | ||||||||||||||
| Taiwan — 0.5% | |||||||||||||||
| 4,630,022 | Asustek Computer Inc | 4,371,756 | |||||||||||||
| 4,916,314 | Chinatrust Financial Holding Co Ltd | 1,470,665 | |||||||||||||
| 236,700 | Chunghwa Telecom Co Ltd ADR | 3,633,345 | |||||||||||||
| 933,800 | Hon Hai Precision Industry Co Ltd | 1,834,305 | |||||||||||||
| 2,860,000 | Taiwan Semiconductor Manufacturing Co Ltd | 3,612,591 | |||||||||||||
| Total Taiwan | 14,922,662 | ||||||||||||||
See accompanying notes to the financial statements.
12
GMO Foreign Fund
(A Series of GMO Trust)
Schedule of Investments — (Continued)
(showing percentage of total net assets)
February 28, 2009
| Shares | Description | Value ($) | |||||||||||||
| United Kingdom — 24.0% | |||||||||||||||
| 279,800 | Amlin Plc | 1,364,113 | |||||||||||||
| 478,843 | Anglo American Plc | 6,754,415 | |||||||||||||
| 760,345 | Associated British Foods Plc | 7,047,775 | |||||||||||||
| 1,000,900 | AstraZeneca Plc | 31,740,342 | |||||||||||||
| 2,326,504 | Aviva Plc | 9,558,555 | |||||||||||||
| 4,981,661 | BAE Systems Plc | 26,300,453 | |||||||||||||
| 3,295,606 | Barclays Plc | 4,323,566 | |||||||||||||
| 72,600 | Berkeley Group Holdings Plc (Unit Shares) * | 897,627 | |||||||||||||
| 2,714,846 | BG Group Plc | 38,807,048 | |||||||||||||
| 1,014,618 | BHP Billiton Plc | 15,812,646 | |||||||||||||
| 12,131,140 | BP Plc | 77,284,620 | |||||||||||||
| 529,100 | British American Tobacco Plc | 13,523,986 | |||||||||||||
| 741,976 | British Sky Broadcasting Group Plc | 4,945,982 | |||||||||||||
| 2,059,501 | BT Group Plc | 2,631,136 | |||||||||||||
| 776,265 | Bunzl Plc | 6,407,539 | |||||||||||||
| 116,920 | Cadbury Plc | 890,175 | |||||||||||||
| 289,700 | Capita Group Plc | 2,733,723 | |||||||||||||
| 2,470,857 | Centrica Plc | 9,502,192 | |||||||||||||
| 1,755,482 | Cobham Plc | 4,818,459 | |||||||||||||
| 1,718,200 | Compass Group Plc | 7,548,804 | |||||||||||||
| 1,105,310 | Diageo Plc | 12,745,608 | |||||||||||||
| 446,734 | Experian Plc | 2,640,231 | |||||||||||||
| 399,681 | Filtrona Plc | 654,406 | |||||||||||||
| 340,045 | Fresnillo Plc | 1,687,035 | |||||||||||||
| 4,004,999 | GlaxoSmithKline Plc | 60,743,018 | |||||||||||||
| 19,400 | Go-Ahead Group Plc | 252,885 | |||||||||||||
| 716,071 | Group 4 Securicor Plc | 1,892,897 | |||||||||||||
| 209,200 | Hiscox Ltd | 832,614 | |||||||||||||
| 418,661 | Home Retail Group Plc | 1,262,002 | |||||||||||||
| 5,313,530 | HSBC Holdings Plc | 36,956,357 | |||||||||||||
| 327,470 | ICAP Plc | 1,090,162 | |||||||||||||
| 1,205,677 | Imperial Tobacco Group Plc | 28,866,241 | |||||||||||||
| 1,175,900 | International Power Plc | 3,976,234 | |||||||||||||
| 941,611 | J Sainsbury Plc | 4,215,363 | |||||||||||||
See accompanying notes to the financial statements.
13
GMO Foreign Fund
(A Series of GMO Trust)
Schedule of Investments — (Continued)
(showing percentage of total net assets)
February 28, 2009
| Shares | Description | Value ($) | |||||||||||||
| United Kingdom — continued | |||||||||||||||
| 126,000 | Jardine Lloyd Thompson Group Plc | 817,760 | |||||||||||||
| 1,477,250 | John Wood Group Plc | 4,063,436 | |||||||||||||
| 205,270 | Johnson Matthey Plc | 2,850,427 | |||||||||||||
| 845,000 | Lamprell Plc | 999,577 | |||||||||||||
| 46,971 | Lancashire Holdings Ltd * | 321,633 | |||||||||||||
| 370,100 | Land Securities Group Plc | 2,890,198 | |||||||||||||
| 4,839,981 | Legal & General Group Plc | 2,761,173 | |||||||||||||
| 2,912,865 | Lloyds Banking Group Plc | 2,391,111 | |||||||||||||
| 39,930 | Lonmin Plc | 572,147 | |||||||||||||
| 937,100 | Marks & Spencer Group Plc | 3,465,498 | |||||||||||||
| 224,628 | Misys Plc | 344,602 | |||||||||||||
| 66,744 | Mondi Ltd | 157,735 | |||||||||||||
| 1,898,167 | National Grid Plc | 16,896,620 | |||||||||||||
| 381,432 | Next Plc | 6,325,263 | |||||||||||||
| 637,600 | Pearson Plc | 5,982,961 | |||||||||||||
| 174,110 | Persimmon Plc | 849,240 | |||||||||||||
| 1,222,517 | Prudential Plc | 4,872,432 | |||||||||||||
| 450,467 | Reckitt Benckiser Group Plc | 17,237,355 | |||||||||||||
| 805,103 | Reed Elsevier Plc | 6,014,537 | |||||||||||||
| 189,228 | Rio Tinto Plc | 4,830,451 | |||||||||||||
| 587,200 | Rolls-Royce Group Plc * | 2,402,032 | |||||||||||||
| 2,946,129 | Royal Bank of Scotland Group Plc | 959,522 | |||||||||||||
| 1,746,600 | Royal Dutch Shell Plc A Shares (London) | 38,345,384 | |||||||||||||
| 1,980,597 | Royal Dutch Shell Plc B Shares (London) | 41,574,385 | |||||||||||||
| 1,526,308 | RSA Insurance Group Plc | 2,984,140 | |||||||||||||
| 542,200 | SABMiller Breweries Plc | 7,850,003 | |||||||||||||
| 472,500 | Sage Group Plc | 1,144,859 | |||||||||||||
| 132,210 | Schroders Plc | 1,372,353 | |||||||||||||
| 487,960 | Scottish & Southern Energy Plc | 7,951,539 | |||||||||||||
| 333,458 | Segro Plc | 508,217 | |||||||||||||
| 612,668 | Serco Group Plc | 3,371,818 | |||||||||||||
| 420,175 | Severn Trent (Ordinary Shares) | 6,513,106 | |||||||||||||
| 602,900 | Shire Plc | 7,147,773 | |||||||||||||
| 521,192 | Smith & Nephew Plc | 3,693,385 | |||||||||||||
See accompanying notes to the financial statements.
14
GMO Foreign Fund
(A Series of GMO Trust)
Schedule of Investments — (Continued)
(showing percentage of total net assets)
February 28, 2009
| Shares | Description | Value ($) | |||||||||||||
| United Kingdom — continued | |||||||||||||||
| 105,800 | Smiths Group Plc | 1,250,663 | |||||||||||||
| 290,400 | Stagecoach Group Plc | 477,640 | |||||||||||||
| 3,629,977 | Tesco Plc | 17,215,026 | |||||||||||||
| 165,564 | Travis Perkins Plc | 767,167 | |||||||||||||
| 902,023 | Unilever Plc | 17,425,031 | |||||||||||||
| 37,379,085 | Vodafone Group Plc | 66,231,676 | |||||||||||||
| 2,841,336 | William Morrison Supermarkets Plc | 10,436,793 | |||||||||||||
| 109,728 | Wolseley Plc | 277,116 | |||||||||||||
| 248,200 | WPP Plc | 1,287,691 | |||||||||||||
| 150,964 | Xstrata Plc | 1,487,252 | |||||||||||||
| Total United Kingdom | 758,026,936 | ||||||||||||||
| TOTAL COMMON STOCKS (COST $4,635,041,862) | 3,058,309,117 | ||||||||||||||
| PREFERRED STOCKS — 0.1% | |||||||||||||||
| Germany — 0.1% | |||||||||||||||
| 44,576 | Volkswagen AG 5.36% | 1,997,417 | |||||||||||||
| Italy — 0.0% | |||||||||||||||
| 81,071 | Exor SPA * | 346,258 | |||||||||||||
| 174,933 | Fiat SPA 19.49% | 451,793 | |||||||||||||
| Total Italy | 798,051 | ||||||||||||||
| TOTAL PREFERRED STOCKS (COST $4,620,701) | 2,795,468 | ||||||||||||||
| RIGHTS AND WARRANTS — 0.0% | |||||||||||||||
| Malaysia — 0.0% | |||||||||||||||
| 304,660 | IJM Land Berhad Warrants, Expires 09/11/13 * | 14,791 | |||||||||||||
| TOTAL RIGHTS AND WARRANTS (COST $8,700) | 14,791 | ||||||||||||||
See accompanying notes to the financial statements.
15
GMO Foreign Fund
(A Series of GMO Trust)
Schedule of Investments — (Continued)
(showing percentage of total net assets)
February 28, 2009
| Par Value ($) | Description | Value ($) | |||||||||||||
| SHORT-TERM INVESTMENTS — 2.9% | |||||||||||||||
| 6,654,486 | Banco Santander Time Deposit, 0.53%, due 03/02/09 | 6,654,486 | |||||||||||||
| 7,200,000 | BNP Paribas Time Deposit, 0.23%, due 03/02/09 | 7,200,000 | |||||||||||||
| 123 | Brown Brothers Harriman Time Deposit, 0.02%-0.05%, due 03/02/09 | 123 | |||||||||||||
| 4,806,849 | Citibank Time Deposit, 0.09%, due 03/02/09 | 4,806,849 | |||||||||||||
| 158,274 | HSBC Bank (Hong Kong) Time Deposit, 0.01%, due 03/02/09 | 158,274 | |||||||||||||
| 357,856 | JPMorgan Chase Time Deposit, 0.01%, due 03/02/09 | 357,856 | |||||||||||||
| 48,000,000 | Royal Bank of Canada Time Deposit, 0.20%, due 03/02/09 | 48,000,000 | |||||||||||||
| 79,905 | Royal Bank of Scotland Time Deposit, 0.08%, due 03/02/09 | 79,905 | |||||||||||||
| 23,956,537 | Societe Generale Time Deposit, 0.53%, due 03/02/09 | 23,956,537 | |||||||||||||
| TOTAL SHORT-TERM INVESTMENTS (COST $91,214,030) | 91,214,030 | ||||||||||||||
| TOTAL INVESTMENTS — 99.8% (Cost $4,730,885,293) | 3,152,333,406 | ||||||||||||||
| Other Assets and Liabilities (net) — 0.2% | 5,541,982 | ||||||||||||||
| TOTAL NET ASSETS — 100.0% | $ | 3,157,875,388 | |||||||||||||
Notes to Schedule of Investments:
ADR - American Depositary Receipt
REIT - Real Estate Investment Trust
* Non-income producing security.
(a) Security valued at fair value using methods determined in good faith by or at the direction of the Trustees of GMO Trust (Note 2).
(b) Bankrupt issuer.
See accompanying notes to the financial statements.
16
GMO Foreign Fund
(A Series of GMO Trust)
Statement of Assets and Liabilities — February 28, 2009
| Assets: | |||||||
| Investments, at value (cost $4,730,885,293) (Note 2) | $ | 3,152,333,406 | |||||
| Cash | 5,506,690 | ||||||
| Foreign currency, at value (cost $2,285,589) (Note 2) | 2,144,838 | ||||||
| Receivable for investments sold | 24,075,303 | ||||||
| Receivable for Fund shares sold | 101,386 | ||||||
| Dividends and interest receivable | 10,699,994 | ||||||
| Foreign taxes receivable | 538,847 | ||||||
| Receivable for expenses reimbursed by Manager (Note 3) | 16,092 | ||||||
| Miscellaneous receivable | 2,255,329 | ||||||
| Total assets | 3,197,671,885 | ||||||
| Liabilities: | |||||||
| Payable for investments purchased | 24,809,307 | ||||||
| Payable for Fund shares repurchased | 10,036,590 | ||||||
| Payable to affiliate for (Note 3): | |||||||
| Management fee | 1,596,497 | ||||||
| Shareholder service fee | 372,665 | ||||||
| Administration fee – Class M | 628 | ||||||
| Trustees and Chief Compliance Officer of GMO Trust fees | 12,500 | ||||||
| Payable for 12b-1 fee – Class M | 1,729 | ||||||
| Miscellaneous payable | 2,009,576 | ||||||
| Accrued expenses | 957,005 | ||||||
| Total liabilities | 39,796,497 | ||||||
| Net assets | $ | 3,157,875,388 | |||||
See accompanying notes to the financial statements.
17
GMO Foreign Fund
(A Series of GMO Trust)
Statement of Assets and Liabilities — February 28, 2009 — (Continued)
| Net assets consist of: | |||||||
| Paid-in capital | $ | 5,052,806,963 | |||||
| Accumulated undistributed net investment income | 62,797,049 | ||||||
| Distributions in excess of net realized gains | (378,546,733 | ) | |||||
| Net unrealized depreciation | (1,579,181,891 | ) | |||||
| $ | 3,157,875,388 | ||||||
| Net assets attributable to: | |||||||
| Class II shares | $ | 765,201,073 | |||||
| Class III shares | $ | 2,054,884,832 | |||||
| Class IV shares | $ | 334,003,041 | |||||
| Class M shares | $ | 3,786,442 | |||||
| Shares outstanding: | |||||||
| Class II | 95,298,643 | ||||||
| Class III | 254,723,122 | ||||||
| Class IV | 41,399,835 | ||||||
| Class M | 469,340 | ||||||
| Net asset value per share: | |||||||
| Class II | $ | 8.03 | |||||
| Class III | $ | 8.07 | |||||
| Class IV | $ | 8.07 | |||||
| Class M | $ | 8.07 | |||||
See accompanying notes to the financial statements.
18
GMO Foreign Fund
(A Series of GMO Trust)
Statement of Operations — Year Ended February 28, 2009
| Investment Income: | |||||||
| Dividends (net of withholding taxes of $22,737,052) | $ | 255,538,361 | |||||
| Securities lending income | 7,213,894 | ||||||
| Interest | 5,656,057 | ||||||
| Total investment income | 268,408,312 | ||||||
| Expenses: | |||||||
| Management fee (Note 3) | 37,348,751 | ||||||
| Shareholder service fee – Class II (Note 3) | 1,410,355 | ||||||
| Shareholder service fee – Class III (Note 3) | 4,612,067 | ||||||
| Shareholder service fee – Class IV (Note 3) | 2,252,871 | ||||||
| 12b-1 fee – Class M (Note 3) | 14,551 | ||||||
| Administration fee – Class M (Note 3) | 11,641 | ||||||
| Custodian and fund accounting agent fees | 2,782,297 | ||||||
| Transfer agent fees | 69,227 | ||||||
| Audit and tax fees | 117,099 | ||||||
| Legal fees | 156,255 | ||||||
| Trustees fees and related expenses (Note 3) | 82,510 | ||||||
| Registration fees | 31,948 | ||||||
| Miscellaneous | 107,895 | ||||||
| Total expenses | 48,997,467 | ||||||
| Fees and expenses reimbursed by Manager (Note 3) | (3,187,460 | ) | |||||
| Expense reductions (Note 2) | (55,061 | ) | |||||
| Net expenses | 45,754,946 | ||||||
| Net investment income (loss) | 222,653,366 | ||||||
| Realized and unrealized gain (loss): | |||||||
| Net realized gain (loss) on: | |||||||
| Investments | (352,641,058 | ) | |||||
| Foreign currency, forward contracts and foreign currency related transactions | (10,715,684 | ) | |||||
| Net realized gain (loss) | (363,356,742 | ) | |||||
| Change in net unrealized appreciation (depreciation) on: | |||||||
| Investments | (3,264,371,136 | ) | |||||
| Foreign currency, forward contracts and foreign currency related transactions | (8,406,455 | ) | |||||
| Net unrealized gain (loss) | (3,272,777,591 | ) | |||||
| Net realized and unrealized gain (loss) | (3,636,134,333 | ) | |||||
| Net increase (decrease) in net assets resulting from operations | $ | (3,413,480,967 | ) | ||||
See accompanying notes to the financial statements.
19
GMO Foreign Fund
(A Series of GMO Trust)
Statement of Changes in Net Assets
| Year Ended February 28, 2009 | Year Ended February 29, 2008 | ||||||||||
| Increase (decrease) in net assets: | |||||||||||
| Operations: | |||||||||||
| Net investment income (loss) | $ | 222,653,366 | $ | 198,735,620 | |||||||
| Net realized gain (loss) | (363,356,742 | ) | 936,210,706 | ||||||||
| Change in net unrealized appreciation (depreciation) | (3,272,777,591 | ) | (1,176,011,293 | ) | |||||||
| Net increase (decrease) in net assets from operations | (3,413,480,967 | ) | (41,064,967 | ) | |||||||
| Distributions to shareholders from: | |||||||||||
| Net investment income | |||||||||||
| Class II | (15,392,810 | ) | (21,412,395 | ) | |||||||
| Class III | (74,322,210 | ) | (104,621,491 | ) | |||||||
| Class IV | (49,698,946 | ) | (96,288,052 | ) | |||||||
| Class M | (136,270 | ) | (177,321 | ) | |||||||
| Total distributions from net investment income | (139,550,236 | ) | (222,499,259 | ) | |||||||
| Net realized gains | |||||||||||
| Class II | (30,952,457 | ) | (81,212,536 | ) | |||||||
| Class III | (153,074,862 | ) | (384,092,710 | ) | |||||||
| Class IV | (132,725,396 | ) | (323,497,643 | ) | |||||||
| Class M | (278,249 | ) | (736,740 | ) | |||||||
| Total distributions from net realized gains | (317,030,964 | ) | (789,539,629 | ) | |||||||
| (456,581,200 | ) | (1,012,038,888 | ) | ||||||||
| Net share transactions (Note 7): | |||||||||||
| Class II | 328,041,113 | (67,333,012 | ) | ||||||||
| Class III | (98,648,505 | ) | (1,411,331 | ) | |||||||
| Class IV | (1,707,487,765 | ) | 620,525,429 | ||||||||
| Class M | 237,607 | 72,341 | |||||||||
| Increase (decrease) in net assets resulting from net share transactions | (1,477,857,550 | ) | 551,853,427 | ||||||||
| Total increase (decrease) in net assets | (5,347,919,717 | ) | (501,250,428 | ) | |||||||
| Net assets: | |||||||||||
| Beginning of period | 8,505,795,105 | 9,007,045,533 | |||||||||
| End of period (including accumulated undistributed net investment income of $62,797,049 and distributions in excess of net investment income of $21,928,667, respectively) | $ | 3,157,875,388 | $ | 8,505,795,105 | |||||||
See accompanying notes to the financial statements.
20
GMO Foreign Fund
(A Series of GMO Trust)
Financial Highlights
(For a Class II share outstanding throughout each period)
| Year Ended February 28/29, | |||||||||||||||||||||||
| 2009 | 2008 | 2007 | 2006 | 2005 | |||||||||||||||||||
| Net asset value, beginning of period | $ | 16.52 | $ | 18.56 | $ | 16.70 | $ | 15.13 | $ | 13.29 | |||||||||||||
| Income (loss) from investment operations: | |||||||||||||||||||||||
| Net investment income (loss)† | 0.45 | 0.40 | 0.38 | 0.28 | 0.26 | ||||||||||||||||||
| Net realized and unrealized gain (loss) | (7.95 | ) | (0.36 | ) | 3.06 | 2.46 | 2.28 | ||||||||||||||||
| Total from investment operations | (7.50 | ) | 0.04 | 3.44 | 2.74 | 2.54 | |||||||||||||||||
| Less distributions to shareholders: | |||||||||||||||||||||||
| From net investment income | (0.33 | ) | (0.44 | ) | (0.43 | ) | (0.33 | ) | (0.34 | ) | |||||||||||||
| From net realized gains | (0.66 | ) | (1.64 | ) | (1.15 | ) | (0.84 | ) | (0.36 | ) | |||||||||||||
| Total distributions | (0.99 | ) | (2.08 | ) | (1.58 | ) | (1.17 | ) | (0.70 | ) | |||||||||||||
| Net asset value, end of period | $ | 8.03 | $ | 16.52 | $ | 18.56 | $ | 16.70 | $ | 15.13 | |||||||||||||
| Total Return(a) | (47.49 | )% | (0.78 | )% | 21.21 | % | 19.01 | % | 19.40 | % | |||||||||||||
| Ratios/Supplemental Data: | |||||||||||||||||||||||
| Net assets, end of period (000's) | $ | 765,201 | $ | 848,359 | $ | 1,018,021 | $ | 1,213,447 | $ | 808,149 | |||||||||||||
| Net expenses to average daily net assets | 0.82 | %(b) | 0.82 | %(b) | 0.82 | % | 0.82 | % | 0.82 | % | |||||||||||||
| Net investment income to average daily net assets | 3.42 | % | 2.10 | % | 2.17 | % | 1.82 | % | 1.92 | % | |||||||||||||
| Portfolio turnover rate | 39 | % | 29 | % | 23 | % | 25 | % | 23 | % | |||||||||||||
| Fees and expenses reimbursed by the Manager to average daily net assets: | 0.05 | % | 0.05 | % | 0.05 | % | 0.05 | % | 0.06 | % | |||||||||||||
(a) The total returns would have been lower had certain expenses not been reimbursed during the periods shown and assumes the effect of reinvested distributions.
(b) The net expense ratio does not include the effect of expense reductions, except for reimbursements related to securities lending transactions (Note 2).
† Calculated using average shares outstanding throughout the period.
See accompanying notes to the financial statements.
21
GMO Foreign Fund
(A Series of GMO Trust)
Financial Highlights
(For a Class III share outstanding throughout each period)
| Year Ended February 28/29, | |||||||||||||||||||||||
| 2009 | 2008 | 2007 | 2006 | 2005 | |||||||||||||||||||
| Net asset value, beginning of period | $ | 16.59 | $ | 18.64 | $ | 16.76 | $ | 15.18 | $ | 13.34 | |||||||||||||
| Income (loss) from investment operations: | |||||||||||||||||||||||
| Net investment income (loss)† | 0.47 | 0.41 | 0.38 | 0.30 | 0.26 | ||||||||||||||||||
| Net realized and unrealized gain (loss) | (7.99 | ) | (0.36 | ) | 3.09 | 2.45 | 2.30 | ||||||||||||||||
| Total from investment operations | (7.52 | ) | 0.05 | 3.47 | 2.75 | 2.56 | |||||||||||||||||
| Less distributions to shareholders: | |||||||||||||||||||||||
| From net investment income | (0.34 | ) | (0.46 | ) | (0.44 | ) | (0.33 | ) | (0.36 | ) | |||||||||||||
| From net realized gains | (0.66 | ) | (1.64 | ) | (1.15 | ) | (0.84 | ) | (0.36 | ) | |||||||||||||
| Total distributions | (1.00 | ) | (2.10 | ) | (1.59 | ) | (1.17 | ) | (0.72 | ) | |||||||||||||
| Net asset value, end of period | $ | 8.07 | $ | 16.59 | $ | 18.64 | $ | 16.76 | $ | 15.18 | |||||||||||||
| Total Return(a) | (47.42 | )% | (0.75 | )% | 21.36 | % | 19.07 | % | 19.41 | % | |||||||||||||
| Ratios/Supplemental Data: | |||||||||||||||||||||||
| Net assets, end of period (000's) | $ | 2,054,885 | $ | 4,078,545 | $ | 4,556,742 | $ | 3,800,326 | $ | 3,663,370 | |||||||||||||
| Net expenses to average daily net assets | 0.75 | %(b) | 0.75 | %(b) | 0.75 | % | 0.75 | % | 0.75 | % | |||||||||||||
| Net investment income to average daily net assets | 3.51 | % | 2.16 | % | 2.11 | % | 1.97 | % | 1.87 | % | |||||||||||||
| Portfolio turnover rate | 39 | % | 29 | % | 23 | % | 25 | % | 23 | % | |||||||||||||
| Fees and expenses reimbursed by the Manager to average daily net assets: | 0.05 | % | 0.05 | % | 0.05 | % | 0.05 | % | 0.06 | % | |||||||||||||
(a) The total returns would have been lower had certain expenses not been reimbursed during the periods shown and assumes the effect of reinvested distributions.
(b) The net expense ratio does not include the effect of expense reductions, except for reimbursements related to securities lending transactions (Note 2).
† Calculated using average shares outstanding throughout the period.
See accompanying notes to the financial statements.
22
GMO Foreign Fund
(A Series of GMO Trust)
Financial Highlights
(For a Class IV share outstanding throughout each period)
| Year Ended February 28/29, | |||||||||||||||||||||||
| 2009 | 2008 | 2007 | 2006 | 2005 | |||||||||||||||||||
| Net asset value, beginning of period | $ | 16.59 | $ | 18.64 | $ | 16.77 | $ | 15.18 | $ | 13.34 | |||||||||||||
| Income (loss) from investment operations: | |||||||||||||||||||||||
| Net investment income (loss)† | 0.51 | 0.40 | 0.36 | 0.31 | 0.28 | ||||||||||||||||||
| Net realized and unrealized gain (loss) | (8.02 | ) | (0.34 | ) | 3.11 | 2.47 | 2.28 | ||||||||||||||||
| Total from investment operations | (7.51 | ) | 0.06 | 3.47 | 2.78 | 2.56 | |||||||||||||||||
| Less distributions to shareholders: | |||||||||||||||||||||||
| From net investment income | (0.35 | ) | (0.47 | ) | (0.45 | ) | (0.35 | ) | (0.36 | ) | |||||||||||||
| From net realized gains | (0.66 | ) | (1.64 | ) | (1.15 | ) | (0.84 | ) | (0.36 | ) | |||||||||||||
| Total distributions | (1.01 | ) | (2.11 | ) | (1.60 | ) | (1.19 | ) | (0.72 | ) | |||||||||||||
| Net asset value, end of period | $ | 8.07 | $ | 16.59 | $ | 18.64 | $ | 16.77 | $ | 15.18 | |||||||||||||
| Total Return(a) | (47.39 | )% | (0.68 | )% | 21.36 | % | 19.22 | % | 19.47 | % | |||||||||||||
| Ratios/Supplemental Data: | |||||||||||||||||||||||
| Net assets, end of period (000's) | $ | 334,003 | $ | 3,571,516 | $ | 3,424,024 | $ | 2,007,037 | $ | 1,169,805 | |||||||||||||
| Net expenses to average daily net assets | 0.69 | %(b) | 0.69 | %(b) | 0.69 | % | 0.69 | % | 0.69 | % | |||||||||||||
| Net investment income to average daily net assets | 3.70 | % | 2.08 | % | 2.04 | % | 1.98 | % | 2.00 | % | |||||||||||||
| Portfolio turnover rate | 39 | % | 29 | % | 23 | % | 25 | % | 23 | % | |||||||||||||
| Fees and expenses reimbursed by the Manager to average daily net assets: | 0.05 | % | 0.05 | % | 0.05 | % | 0.05 | % | 0.06 | % | |||||||||||||
(a) The total returns would have been lower had certain expenses not been reimbursed during the periods shown and assumes the effect of reinvested distributions.
(b) The net expense ratio does not include the effect of expense reductions, except for reimbursements related to securities lending transactions (Note 2).
† Calculated using average shares outstanding throughout the period.
See accompanying notes to the financial statements.
23
GMO Foreign Fund
(A Series of GMO Trust)
Financial Highlights
(For a Class M share outstanding throughout each period)
| Year Ended February 28/29, | |||||||||||||||||||||||
| 2009 | 2008 | 2007 | 2006 | 2005 | |||||||||||||||||||
| Net asset value, beginning of period | $ | 16.58 | $ | 18.63 | $ | 16.75 | $ | 15.19 | $ | 13.25 | |||||||||||||
| Income (loss) from investment operations: | |||||||||||||||||||||||
| Net investment income (loss)† | 0.41 | 0.35 | 0.30 | 0.24 | 0.30 | ||||||||||||||||||
| Net realized and unrealized gain (loss) | (7.96 | ) | (0.36 | ) | 3.12 | 2.46 | 2.21 | ||||||||||||||||
| Total from investment operations | (7.55 | ) | (0.01 | ) | 3.42 | 2.70 | 2.51 | ||||||||||||||||
| Less distributions to shareholders: | |||||||||||||||||||||||
| From net investment income | (0.30 | ) | (0.40 | ) | (0.39 | ) | (0.30 | ) | (0.21 | ) | |||||||||||||
| From net realized gains | (0.66 | ) | (1.64 | ) | (1.15 | ) | (0.84 | ) | (0.36 | ) | |||||||||||||
| Total distributions | (0.96 | ) | (2.04 | ) | (1.54 | ) | (1.14 | ) | (0.57 | ) | |||||||||||||
| Net asset value, end of period | $ | 8.07 | $ | 16.58 | $ | 18.63 | $ | 16.75 | $ | 15.19 | |||||||||||||
| Total Return(a) | (47.58 | )% | (1.05 | )% | 21.04 | % | 18.66 | % | 19.18 | % | |||||||||||||
| Ratios/Supplemental Data: | |||||||||||||||||||||||
| Net assets, end of period (000's) | $ | 3,786 | $ | 7,375 | $ | 8,258 | $ | 5,673 | $ | 3,508 | |||||||||||||
| Net expenses to average daily net assets | 1.05 | %(b) | 1.05 | %(b) | 1.05 | % | 1.05 | % | 1.05 | % | |||||||||||||
| Net investment income to average daily net assets | 3.11 | % | 1.81 | % | 1.69 | % | 1.56 | % | 2.24 | % | |||||||||||||
| Portfolio turnover rate | 39 | % | 29 | % | 23 | % | 25 | % | 23 | % | |||||||||||||
| Fees and expenses reimbursed by the Manager to average daily net assets: | 0.05 | % | 0.05 | % | 0.05 | % | 0.05 | % | 0.06 | % | |||||||||||||
(a) The total returns would have been lower had certain expenses not been reimbursed during the periods shown and assumes the effect of reinvested distributions.
(b) The net expense ratio does not include the effect of expense reductions, except for reimbursements related to securities lending transactions (Note 2).
† Calculated using average shares outstanding throughout the period.
See accompanying notes to the financial statements.
24
GMO Foreign Fund
(A Series of GMO Trust)
Notes to Financial Statements
February 28, 2009
1. Organization
GMO Foreign Fund (the "Fund") is a series of GMO Trust (the "Trust"). The Fund is registered under the Investment Company Act of 1940, as amended, as an open-end, non-diversified management investment company. The Fund is advised and managed by Grantham, Mayo, Van Otterloo & Co. LLC (the "Manager" or "GMO"). The Trust was established as a Massachusetts business trust under the laws of The Commonwealth of Massachusetts on June 24, 1985. The Declaration of Trust permits the Trustees of the Trust ("Trustees") to create an unlimited number of series of shares ("Funds") and to subdivide Funds into classes.
The Fund seeks total return in excess of that of its benchmark, the MSCI EAFE Index (Europe, Australasia, and Far East). The Fund typically makes equity investments in non-U.S. companies, including companies that issue stocks included in the MSCI international developed country universe (the universe of securities from which the MSCI EAFE Index is constructed) and companies in emerging countries. The Fund generally seeks to be fully invested and normally does not take temporary defensive positions, but may hold up to 10% of its total assets in cash and cash equivalents in order to manage cash inflows and outflows as a result of shareholder purchases and redemptions. The Fund may make investments in emerging countries, but these investments generally will represent 10% or less of the Fund's total assets.
Throughout the year ended February 28, 2009, the Fund had four classes of shares outstanding: Class II, Class III, Class IV, and Class M. Class M shares bear an administration fee and a 12b-1 fee while classes II, III, and IV bear a shareholder service fee (See Note 3). The principal economic difference among the classes of shares is the type and level of fees borne by the classes.
The Fund currently limits subscriptions due to capacity considerations.
2. Significant accounting policies
The following is a summary of significant accounting policies followed by the Fund in the preparation of its financial statements. These policies are in conformity with accounting principles generally accepted in the United States of America ("U.S. GAAP") and have been consistently followed by the Fund in preparing its financial statements. The preparation of financial statements in accordance with U.S. GAAP requires management to make estimates and assumptions that affect the reported amounts and disclosures in the financial statements. Actual results could differ from those estimates. The accounting records of the Fund are maintained in U.S. dollars.
Portfolio valuation
Securities listed on a securities exchange for which market quotations are readily available are valued at the last sale price or official closing price on each business day, or if there is no such reported sale or official closing price, at the most recent quoted bid price. Unlisted securities for which market quotations are readily available are generally valued at the most recent quoted bid price. Debt instruments with a
25
GMO Foreign Fund
(A Series of GMO Trust)
Notes to Financial Statements — (Continued)
February 28, 2009
remaining maturity of sixty days or less are generally valued at amortized cost, which approximates fair value. Shares of investment funds are generally valued at their net asset value. Securities for which quotations are not readily available or whose values the Manager has determined to be unreliable are valued at fair value as determined in good faith by the Trustees or persons acting at their direction pursuant to procedures approved by the Trustees. By its nature, a fair value price is a good faith estimate of the value of a security at a given point in time and may not reflect the value that would be realized if the security were sold. The difference between a fair value price and the value realized upon a sale could be material. Because many foreign equity securities markets and exchanges close prior to the close of the New York Stock Exchange ("NYSE"), closing prices for foreign securities in those markets or on those ex changes do not reflect the events that occur after that close but before the close of the NYSE. As a result, the Fund generally values foreign equity securities using fair value prices, which are based on adjustments to closing prices supplied by a third party vendor based on that vendor's proprietary models. As of February 28, 2009, 95.20% of the net assets of the Fund were valued using fair value prices based on models used by a third party vendor.
In September 2006, the Financial Accounting Standards Board ("FASB") issued Statement of Financial Accounting Standards No. 157, Fair Value Measurements ("SFAS 157"). SFAS 157 is effective for the Fund's current fiscal year. While the adoption of SFAS 157 does not have an effect on the Fund's net asset value, it does require additional disclosures about fair value measurements. SFAS 157 establishes a three-level hierarchy for disclosure of fair value measurements. The valuation hierarchy is based upon the reliability of inputs to the valuation of the Fund's investments. The three levels are defined as follows:
Level 1 – Valuations based on quoted prices for identical securities in active markets.
Level 2 – Valuations determined using other significant direct or indirect observable inputs.
Level 3 – Valuations based on inputs that are unobservable and significant. The Fund utilized the following fair value techniques on Level 3 investments: The Fund valued Fairfax Media Ltd at the subscription price of an entitlement offer. The Fund also considered certain bankrupt securities to be worthless.
The inputs or methodology used for valuing securities are not necessarily an indication of the risk associated with investing in those securities.
The following is a summary of the fair valuations according to inputs used as of February 28, 2009 in valuing the Fund's investments:
| Asset Valuation Inputs | Investments in Securities | Other Financial Instruments | |||||||||
| Level 1 - Quoted Prices | $ | 145,056,329 | $ | — | |||||||
| Level 2 - Other Significant Observable Inputs | 3,006,269,077 | — | |||||||||
| Level 3 - Significant Unobservable Inputs | 1,008,000 | — | |||||||||
| Total | $ | 3,152,333,406 | $ | — | |||||||
26
GMO Foreign Fund
(A Series of GMO Trust)
Notes to Financial Statements — (Continued)
February 28, 2009
| Liability Valuation Inputs | Investments in Securities | Other Financial Instruments | |||||||||
| Level 1 - Quoted Prices | $ | — | $ | — | |||||||
| Level 2 - Other Significant Observable Inputs | — | — | |||||||||
| Level 3 - Significant Unobservable Inputs | — | — | |||||||||
| Total | $ | — | $ | — | |||||||
The following is a reconciliation of investments in which significant unobservable inputs (Level 3) were used in determining value:
| Investments in Securities | Other Financial Instruments | ||||||||||
| Balance as of February 29, 2008 | $ | 9,856,883 | $ | — | |||||||
| Realized gain (loss) | (2,840,863 | ) | — | ||||||||
| Change in unrealized appreciation/depreciation | (4,977,512 | ) | — | ||||||||
| Net purchases (sales) | (1,030,508 | ) | — | ||||||||
| Net transfers in and/or out of Level 3 | — | — | |||||||||
| Balance as of February 28, 2009 | $ | 1,008,000 | $ | — | |||||||
Foreign currency translation
The market values of foreign securities, currency holdings and related assets and liabilities are translated to U.S. dollars based on the 4 p.m. New York time exchange rates each business day. Income and expenses denominated in foreign currencies are translated at the 4 p.m. New York time exchange rates on the business day the income and expenses are accrued or incurred. The Fund does not isolate realized and unrealized gains and losses attributable to changes in exchange rates from gains and losses that arise from changes in the market value of investments. Such fluctuations are included with net realized and unrealized gain or loss on investments. Net realized gains and losses on foreign currency transactions represent gains and losses on disposition of currencies and forward currency contracts, currency gains and losses realized between the trade and settlement dates on securities transactions, and the difference between the amount of investment income and foreign withholding taxes recorded on the Fund's accounting records and the U.S. dollar equivalent amounts actually received or paid.
Forward currency contracts
The Fund may enter into forward currency contracts including forward cross currency contracts. A forward currency contract is an agreement between two parties to buy and sell a currency at a set price on a future date. The market value of a forward currency contract fluctuates with changes in forward currency exchange rates. Forward currency contracts are marked to market daily using rates supplied by a quotation service and changes in value are recorded by the Fund as an unrealized gain or loss. Realized gains or losses equal
27
GMO Foreign Fund
(A Series of GMO Trust)
Notes to Financial Statements — (Continued)
February 28, 2009
to the difference between the value of the contract at the time it was opened and the value at the time it was closed are recorded upon delivery or receipt of the currency or, if a forward currency contract is offset by entering into another forward currency contract with the same broker, upon settlement of the net gain or loss. These contracts may involve market risk in excess of the unrealized gain or loss reflected in the Fund's Statement of Assets and Liabilities. They expose the Fund to the risk of unfavorable movements in currency values and the risk that the counterparty will be unable or unwilling to meet the terms of the contracts. The Fund had no forward currency contracts outstanding at the end of the period.
Futures contracts
The Fund may purchase and sell futures contracts. Upon entering into a futures contract, the Fund is required to deposit cash, U.S. government and agency obligations, or other liquid assets with the futures clearing broker in accordance with the initial margin requirements of the broker or exchange. In addition, the Fund maintains cash or securities in an amount that at least equals the net amount payable in the event the Fund must deliver the full amount of the contract. Futures contracts are marked to market daily and an appropriate payable or receivable for the change in value ("variation margin") is recorded by the Fund. The payable or receivable is settled on the following business day. Gains or losses are recognized but not considered realized until the contracts expire or are closed. Futures contracts involve, to varying degrees, risk of loss in excess of the variation margin disclosed in the Statement of Assets and Liabi lities. Under some circumstances, futures exchanges may establish daily limits on the amount that the price of a futures contract can vary from the previous day's settlement price, thereby effectively preventing liquidation of unfavorable positions. Losses may arise from changes in the value of the underlying instrument if the Fund is unable to liquidate a futures position due to an illiquid secondary market for the contract or the imposition of price limits, or if counterparties do not perform under the contract terms. Futures contracts are generally valued at the settlement price established each day by the board of trade or exchange on which they are traded. The Fund had no futures contracts outstanding at the end of the period.
Options
The Fund may write (i.e., sell) call and put options. Writing options alters the Fund's exposure to the underlying instrument by, in the case of a call option, obligating the Fund to sell the underlying instrument at a set price to the option-holder and, in the case of a put option, obligating the Fund to purchase the underlying instrument at a set price from the option-holder. In the case of an index option, settlement will be in cash. When the Fund writes a call or put option, an amount equal to the premium received is recorded as a liability and subsequently marked to market to reflect the current value of the option written. Premiums received from writing options that expire are treated as realized gains. Premiums received from writing options that are exercised or closed are deducted from the amounts paid on the underlying future, security or currency transaction to determine the realized gain or loss. The Fund as a writer of an option has no control over whether the underlying future, security or currency may be sold (call) or purchased (put) and as a result bears the market risk of an unfavorable change in the price of the future, security or currency underlying the option. In the event that the Fund writes uncovered put or call options (i.e. options for investments that the Fund does not own), it bears the risk of substantial losses if the price of the
28
GMO Foreign Fund
(A Series of GMO Trust)
Notes to Financial Statements — (Continued)
February 28, 2009
underlying instrument increases during the term of the option. Options expose the Fund to the risk the Fund may not be able to enter into a closing transaction because of an illiquid market. The Fund had no open written option contracts during the period.
The Fund may also purchase put and call options. Purchasing options alters the Fund's exposure to the underlying instrument by, in the case of a call option, entitling the Fund to purchase the underlying instrument at a set price from the writer of the option and, in the case of a put option, entitling the Fund to sell the underlying instrument at a set price to the writer of the option. The Fund pays a premium for a purchased option. That premium is disclosed in the Schedule of Investments and is subsequently marked to market to reflect the current value of the option. Premiums paid for purchasing options that expire are treated as realized losses. Premiums paid for purchasing options that are exercised or closed are deducted from the proceeds on the closing transaction to determine the realized gain or loss. The risk associated with purchasing put and call options is limited to the premium paid. The Fund had no purchased optio n contracts outstanding at the end of the period.
The Fund values exchange traded options at the last sale price, or if no sale is reported, the last bid price for options it has purchased and the last ask price for options it has written. The Fund values options traded over-the-counter using inputs provided by primary pricing sources and industry standard models.
Securities lending
The Fund may lend its securities to qualified brokers. The loans are collateralized with cash or liquid securities with a market value at least equal to the market value of the securities upon entering into the loan. As with other extensions of credit, the Fund may bear the risk of loss with respect to the investment of the collateral, the risk of delay in and/or inability to exercise its rights with respect to the collateral, and the risk of delay in recovery or loss of rights in the loaned securities should the borrower of the securities fail financially. If a loan is collateralized by U.S. government securities, the Fund receives a fee from the borrower. If a loan is collateralized by cash, the Fund typically invests the cash collateral for its own account. As of February 28, 2009 the Fund had no securities on loan.
Taxes and distributions
The Fund intends to qualify each tax year as a regulated investment company under Subchapter M of the Internal Revenue Code of 1986, as amended (the "Code"). The Fund intends to distribute substantially all of its net investment income and all of its net realized short-term and long-term capital gain, if any, after giving effect to any available capital loss carryforwards for U.S. federal income tax purposes. Therefore, no provision for U.S. federal income or excise tax is necessary. Taxes on foreign interest and dividend income are generally withheld in accordance with the applicable country's tax treaty with the United States. The foreign withholding rates applicable to a Fund's investments in certain foreign jurisdictions may be higher if a significant portion of the Fund is held by non-U.S. shareholders.
29
GMO Foreign Fund
(A Series of GMO Trust)
Notes to Financial Statements — (Continued)
February 28, 2009
The Fund's policy is to declare and pay distributions from net investment income, if any, semiannually, and from net realized short-term and long-term capital gain, if any, at least annually. All distributions are paid in shares of the Fund, at net asset value, unless the shareholder elects to receive cash distributions. Distributions to shareholders are recorded by the Fund on the ex-dividend date.
Foreign taxes paid by the Fund may be treated, to the extent permissible under the Code and if the Fund so elects, as if paid by the shareholders of the Fund.
The Fund may be subject to capital gains and repatriation taxes imposed by certain countries in which it invests.
Income and capital gain distributions are determined in accordance with U.S. federal income tax regulations, which may differ from U.S. GAAP. Certain capital accounts in the financial statements are periodically adjusted for permanent differences in order to reflect their tax character. These adjustments have no impact on net assets or net asset value per share. Temporary differences that arise from recognizing certain items of income, expense, gain or loss in different periods for financial statement and tax purposes will reverse at some time in the future. Distributions in excess of net investment income or net realized gains are temporary over-distributions for financial statement purposes resulting from differences in the recognition or classification of income or distributions for financial statement and tax purposes.
U.S. GAAP and tax accounting differences primarily relate to passive foreign investment company transactions, foreign currency transactions, capital loss carryforwards, losses on wash sale transactions, post-October capital losses and redemption in-kind transactions, and adjustments for securities lending.
The following reclassification represents the amount necessary to report the stated components of net assets on a tax basis, excluding certain temporary differences, as of February 28, 2009. The financial highlights exclude these adjustments.
| Accumulated Undistributed Net Investment Income | Accumulated Net Realized Loss | Paid-in Capital | |||||||||
| $ | 1,622,586 | $ | (13,295,062 | ) | $ | 11,672,476 | |||||
30
GMO Foreign Fund
(A Series of GMO Trust)
Notes to Financial Statements — (Continued)
February 28, 2009
The tax character of distributions declared to shareholders is as follows:
| 2/28/2009 | 2/29/2008 | ||||||||||
| Ordinary income (including any net short-term capital gain) | $ | 139,574,670 | $ | 294,640,270 | |||||||
| Net long-term capital gain | 317,006,530 | 717,398,618 | |||||||||
| Total distributions | $ | 456,581,200 | $ | 1,012,038,888 | |||||||
Distributions in excess of tax basis earnings and profits, if significant, are reported in the financial statements as a return of capital for tax purposes.
As of February 28, 2009, the components of distributable earnings on a tax basis consisted of the following:
| Undistributed ordinary income (including any net short-term capital gain) | $ | 74,537,198 | |||||
As of February 28, 2009, the Fund had capital loss carryforwards available to offset future realized gains if any, to the extent permitted by the Code. Utilization of the capital loss carryforwards could be subject to limitations imposed by the Code related to share ownership activity. Such losses expire as follows:
| 2/28/2017 | $ | (72,173,104 | ) | ||||
| Total | $ | (72,173,104 | ) | ||||
As of February 28, 2009, the Fund elected to defer to March 1, 2009 post-October capital losses of $257,668,488.
As of February 28, 2009, the approximate cost for U.S. federal income tax purposes and gross and net unrealized appreciation (depreciation) in value of investments were as follows:
| Aggregate Cost | Gross Unrealized Appreciation | Gross Unrealized (Depreciation) | Net Unrealized Appreciation (Depreciation) | ||||||||||||
| $ | 4,788,655,945 | $ | 92,591,775 | $ | (1,728,914,314 | ) | $ | (1,636,322,539 | ) | ||||||
For the year ended February 28, 2009, the Fund had net realized gains attributed to redemption in-kind transactions of $12,221,246.
The Fund is subject to the provisions of Financial Accounting Standards Board Interpretation No. 48 ("FIN 48"), Accounting for Uncertainty in Income Taxes — an Interpretation of FASB Statement No. 109.
31
GMO Foreign Fund
(A Series of GMO Trust)
Notes to Financial Statements — (Continued)
February 28, 2009
FIN 48 sets forth a minimum threshold for financial statement recognition of a tax position taken or expected to be taken in a tax return that could affect the Fund's financial statements. The Fund did not have any unrecognized tax benefits or liabilities at February 28, 2009, nor did it have any increases or decreases in unrecognized tax benefits or liabilities for the period then ended. The Fund is subject to examination prior to the expiration of the statute of limitations by U.S. federal and state tax authorities for tax returns filed.
Security transactions and related investment income
Security transactions in the financial statements are accounted for on the trade date. Dividend income, net of applicable foreign withholding taxes, if any, is recorded on the ex-dividend date or, if later, when the Fund is informed of the ex-dividend date. Interest income is recorded on the accrual basis and is adjusted for the amortization of premiums and accretion of discounts. Principal on inflation indexed securities is adjusted for inflation and any increase or decrease is recorded as interest income or loss. Income is not recognized on securities for which collection is not expected. Non-cash dividends, if any, are recorded at the fair market value of the asset received. In determining the net gain or loss on securities sold, the Fund uses the identified cost basis for the purposes of determining the cost basis.
Expenses
The majority of the expenses of the Trust are directly identifiable to an individual fund. Expenses that are not readily identifiable to a specific fund are allocated taking into consideration, among other things, the nature and type of expense and the relative size of the funds. Investment income, common expenses and realized and unrealized gains and losses are allocated pro rata among the classes of shares of the Fund based on the relative net assets of each class. Shareholder service fees, 12b-1, and administration fees, which are directly attributable to a class of shares, are charged to that class's operations.
Brown Brothers Harriman & Co. ("BBH") serves as custodian and fund accounting agent of the Fund. State Street Bank and Trust Company ("State Street") serves as transfer agent of the Fund. BBH and State Street's fees may be reduced by an earnings allowance calculated on the average daily cash balances the Fund maintains with each agent. The Fund receives the benefit of the earnings allowance. In addition, Goldman Sachs Agency Lending, the Fund's securities lending agent, has agreed to reimburse the Fund for certain transactional expenses related to securities lending activity. Credit balances or expense reimbursements used to reduce fees, if any, are reported as a reduction of expenses in the Statement of Operations.
Investment risks
The Fund is subject to risks involved in investing in foreign securities that are not presented by investments in U.S. securities. These risks may involve adverse political and economic developments, including expropriation and the possible imposition of capital controls or other foreign governmental laws or restrictions. In addition, the securities of some foreign companies and securities markets are less liquid and at times may be more volatile than securities of comparable U.S. companies and U.S. securities markets.
32
GMO Foreign Fund
(A Series of GMO Trust)
Notes to Financial Statements — (Continued)
February 28, 2009
Recently issued accounting pronouncement
In March 2008, FASB issued Statement of Financial Accounting Standards No. 161, Disclosures about Derivative Instruments and Hedging Activities ("SFAS 161"). SFAS 161 is effective for fiscal years and interim periods beginning after November 15, 2008. SFAS 161 requires enhanced disclosures about the Fund's derivative and hedging activities. The Manager is currently evaluating the impact the adoption of SFAS 161 will have on the Fund's financial statement disclosures.
3. Fees and other transactions with affiliates
GMO receives a management fee for the services it provides to the Fund. That fee is paid monthly at the annual rate of 0.60% of average daily net assets. The Fund has adopted a Shareholder Service Plan under which the Fund pays GMO a shareholder service fee for client and shareholder service, reporting, and other support. Pursuant to the Shareholder Service Plan, the shareholder service fee is calculated based on average daily net assets of each class at the annual rate of 0.22% for Class II shares, 0.15% for Class III shares, and 0.09% for Class IV shares.
Holders of Class M shares of the Fund pay GMO an administration fee for support services provided to Class M shareholders. That fee is paid monthly at the annual rate of 0.20% of the average daily net assets of Class M shares. Pursuant to a Rule 12b-1 distribution and service plan adopted by the Fund, holders of Class M shares of the Fund may pay a fee, at the annual rate of up to 1.00% of average daily net assets Class M shares for any activities or expenses primarily intended to result in the sale of Class M shares of the Fund and/or for the provision of services to Class M shareholders. The Trustees currently limit payments on Class M shares to 0.25% of the Fund's average daily net assets of Class M shares.
Through at least June 30, 2009, the Manager has contractually agreed to reimburse the Fund for Fund expenses incurred through that date to the extent the Fund's total annual operating expenses (excluding "Excluded Expenses", as defined below) exceed 0.60% of the Fund's average daily net assets. Excluded Expenses include shareholder service fees, administration and distribution (12b-1) fees, fees and expenses of the independent Trustees of the Trust, fees and expenses for legal services not approved by the Manager for the Trust, compensation and expenses of the Trust's Chief Compliance Officer ("CCO") (excluding any employee benefits), brokerage commissions, securities lending fees and expenses, interest expense, transfer taxes, and other investment-related costs (including expenses associated with investments in any company that is an investment company or would be an investment company under the 1940 Act, but for the exceptions to the definition of investment company provided in Section 3(c)(1) and 3(c)(7) of the 1940 Act), hedging transaction fees, extraordinary, non-recurring and certain other unusual expenses (including taxes).
The Fund's portion of the fees paid by the Trust to the Trust's independent Trustees and CCO during the year ended February 28, 2009 was $70,976 and $44,685, respectively. The compensation and expenses of the CCO are included in miscellaneous expenses in the Statement of Operations. The Fund paid no remuneration to any other officer of the Trust.
33
GMO Foreign Fund
(A Series of GMO Trust)
Notes to Financial Statements — (Continued)
February 28, 2009
4. Purchases and sales of securities
Cost of purchases and proceeds from sales of securities, excluding short-term investments, for the year ended February 28, 2009 aggregated $2,313,135,776 and $3,759,246,444, respectively.
5. Guarantees
In the normal course of business the Fund enters into contracts with third-party service providers that contain a variety of representations and warranties and that provide general indemnifications. The Fund's maximum exposure under these arrangements is unknown, as it involves future claims that may be made against the Fund that have not yet occurred. Based on experience, management is of the view that the risk of loss in connection with its indemnification obligations is remote; however, there can be no assurance that such obligations will not result in material liabilities that adversely affect the Fund.
6. Principal shareholders and related parties
As of February 28, 2009, 10.45% of the shares outstanding of the Fund were held by one shareholder. On that date, no other shareholder owned more than 10% of the outstanding shares of the Fund. Redemptions from (or investments into) the Fund by or on behalf of these large shareholders may have a material effect on the Fund.
As of February 28, 2009, 0.01% of the Fund's shares were held by senior management of the Manager and GMO Trust officers and 1.26% of the Fund's shares were held by accounts for which the Manager had investment discretion.
7. Share transactions
The Declaration of Trust permits the Trust to issue an unlimited number of shares of beneficial interest (without par value). Transactions in Fund shares were as follows:
| Year Ended February 28, 2009 | Year Ended February 29, 2008 | ||||||||||||||||||
| Class II: | Shares | Amount | Shares | Amount | |||||||||||||||
| Shares sold | 58,274,223 | $ | 511,976,197 | 16,492,099 | $ | 297,811,599 | |||||||||||||
| Shares issued to shareholders in reinvestment of distributions | 3,196,851 | 40,987,454 | 4,944,763 | 92,077,263 | |||||||||||||||
| Shares repurchased | (17,540,416 | ) | (224,922,538 | ) | (24,912,687 | ) | (457,221,874 | ) | |||||||||||
| Net increase (decrease) | 43,930,658 | $ | 328,041,113 | (3,475,825 | ) | $ | (67,333,012 | ) | |||||||||||
34
GMO Foreign Fund
(A Series of GMO Trust)
Notes to Financial Statements — (Continued)
February 28, 2009
| Year Ended February 28, 2009 | Year Ended February 29, 2008 | ||||||||||||||||||
| Class III: | Shares | Amount | Shares | Amount | |||||||||||||||
| Shares sold | 107,907,531 | $ | 953,731,183 | 40,267,613 | $ | 743,943,093 | |||||||||||||
| Shares issued to shareholders in reinvestment of distributions | 15,342,666 | 200,755,062 | 24,148,643 | 451,660,303 | |||||||||||||||
| Shares repurchased | (114,403,163 | ) | (1,253,134,750 | ) | (63,056,039 | ) | (1,197,014,727 | ) | |||||||||||
| Net increase (decrease) | 8,847,034 | $ | (98,648,505 | ) | 1,360,217 | $ | (1,411,331 | ) | |||||||||||
| Year Ended February 28, 2009 | Year Ended February 29, 2008 | ||||||||||||||||||
| Class IV: | Shares | Amount | Shares | Amount | |||||||||||||||
| Shares sold | 1,297,973 | $ | 19,976,078 | 35,986,533 | $ | 684,663,196 | |||||||||||||
| Shares issued to shareholders in reinvestment of distributions | 11,448,393 | 156,652,652 | 20,380,015 | 379,339,109 | |||||||||||||||
| Shares repurchased | (186,625,494 | ) | (1,884,116,495 | ) | (24,769,071 | ) | (443,476,876 | ) | |||||||||||
| Net increase (decrease) | (173,879,128 | ) | $ | (1,707,487,765 | ) | 31,597,477 | $ | 620,525,429 | |||||||||||
| Year Ended February 28, 2009 | Year Ended February 29, 2008 | ||||||||||||||||||
| Class M: | Shares | Amount | Shares | Amount | |||||||||||||||
| Shares sold | 70,075 | $ | 896,218 | 90,342 | $ | 1,706,341 | |||||||||||||
| Shares issued to shareholders in reinvestment of distributions | 32,761 | 414,519 | 48,969 | 914,061 | |||||||||||||||
| Shares repurchased | (78,335 | ) | (1,073,130 | ) | (137,839 | ) | (2,548,061 | ) | |||||||||||
| Net increase (decrease) | 24,501 | $ | 237,607 | 1,472 | $ | 72,341 | |||||||||||||
35
Report of Independent Registered Public Accounting Firm
To the Trustees of GMO Trust and the Shareholders of
GMO Foreign Fund:
In our opinion, the accompanying statement of assets and liabilities, including the schedule of investments, and the related statements of operations and of changes in net assets and the financial highlights present fairly, in all material respects, the financial position of GMO Foreign Fund (the "Fund") at February 28, 2009, the results of its operations for the year then ended, the changes in its net assets for each of the two years in the period then ended and the financial highlights for each of the five years in the period then ended, in conformity with accounting principles generally accepted in the United States of America. These financial statements and financial highlights (hereafter referred to as "financial statements") are the responsibility of the Fund's management. Our responsibility is to express an opinion on these financial statements based on our audits. We conducted our audits of these financial statements in accordance with the standards of the Public Company Accounting Oversight Board (United States). Those standards require that we plan and perform the audit to obtain reasonable assurance about whether the financial statements are free of material misstatement. An audit includes examining, on a test basis, evidence supporting the amounts and disclosures in the financial statements, assessing the accounting principles used and significant estimates made by management, and evaluating the overall financial statement presentation. We believe that our audits, which included confirmation of securities at February 28, 2009 by correspondence with the custodian and brokers, provide a reasonable basis for our opinion.
PricewaterhouseCoopers LLP
Boston, Massachusetts
April 29, 2009
36
GMO Foreign Fund
(A Series of GMO Trust)
Fund Expenses
February 28, 2009 (Unaudited)
Expense Examples: The following information is in relation to expenses for the six month period ended February 28, 2009.
As a shareholder of the Fund, you may incur two types of costs: (1) transaction costs; and (2) ongoing costs, including management fees, shareholder service fees, distribution (12b-1) and/or administration fees, and other Fund expenses. This example is intended to help you understand your ongoing costs (in dollars) of investing in the Fund and to compare these costs with the ongoing costs of investing in other mutual funds.
These examples are based on an investment of $1,000 invested at the beginning of the period and held for the entire period, September 1, 2008 through February 28, 2009.
Actual Expenses
The first line of the table for each class below provides information about actual account values and actual expenses. You may use the information in this line, together with the amount you invested, to estimate the expenses that you paid over the period. Simply divide your account value by $1,000 (for example, a $35,000,000 account value divided by $1,000 = 35,000), then multiply the result by the number in the first line under the heading entitled "Net Expense Incurred" to estimate the expenses you paid on your account during this period.
Hypothetical Example for Comparison Purposes
The second line of the table for each class below provides information about hypothetical account values and hypothetical expenses based on the Fund's actual expense ratio and an assumed rate of return of 5% per year before expenses, which is not the Fund's actual return. The hypothetical account values and expenses may not be used to estimate the actual ending account balance or expenses you paid for the period. You may use this information to compare the ongoing costs of investing in the Fund with other funds. To do so, compare this 5% hypothetical example with the 5% hypothetical examples that appear in the shareholder reports of other funds.
37
GMO Foreign Fund
(A Series of GMO Trust)
Fund Expenses — (Continued)
February 28, 2009 (Unaudited)
Please note that the expenses shown in the table are meant to highlight your ongoing costs only and do not reflect any transactional costs. Therefore, the second line of the table is useful in comparing ongoing costs only, and will not help you determine the relative total costs of owning different funds. In addition, if these transactional costs were included, your costs would have been higher.
| Annualized Net Expense Ratio | Beginning Account Value | Ending Account Value | Net Expense Incurred* | ||||||||||||||||
| Class II | |||||||||||||||||||
| 1) Actual | 0.83 | % | $ | 1,000.00 | $ | 586.70 | $ | 3.27 | |||||||||||
| 2) Hypothetical | 0.83 | % | $ | 1,000.00 | $ | 1,020.68 | $ | 4.16 | |||||||||||
| Class III | |||||||||||||||||||
| 1) Actual | 0.75 | % | $ | 1,000.00 | $ | 587.10 | $ | 2.95 | |||||||||||
| 2) Hypothetical | 0.75 | % | $ | 1,000.00 | $ | 1,021.08 | $ | 3.76 | |||||||||||
| Class IV | |||||||||||||||||||
| 1) Actual | 0.69 | % | $ | 1,000.00 | $ | 587.30 | $ | 2.72 | |||||||||||
| 2) Hypothetical | 0.69 | % | $ | 1,000.00 | $ | 1,021.37 | $ | 3.46 | |||||||||||
| Class M | |||||||||||||||||||
| 1) Actual | 1.05 | % | $ | 1,000.00 | $ | 586.40 | $ | 4.13 | |||||||||||
| 2) Hypothetical | 1.05 | % | $ | 1,000.00 | $ | 1,019.59 | $ | 5.26 | |||||||||||
* Expenses are calculated using each Class's annualized net expense ratio for the six months ended February 28, 2009, multiplied by the average account value over the period, multiplied by 181 days in the period, divided by 365 days in the year.
38
GMO Foreign Fund
(A Series of GMO Trust)
Tax Information for the Tax Year Ended February 28, 2009 (Unaudited)
The Fund will notify shareholders of amounts for use in preparing 2009 income tax forms in January 2010.
The Fund's distributions to shareholders include $317,006,530 from long-term capital gains.
During the year ended February 28, 2009, the Fund paid foreign taxes of $22,734,508 and recognized foreign source income of $278,272,869.
For taxable, non-corporate shareholders, 100.00% of the income and short-term capital gains, if any, distributed in the Fund's fiscal year ended February 28, 2009 represents qualified dividend income subject to the 15% rate category.
The Fund hereby designates as qualified interest income with respect to its taxable year ended February 28, 2009, $12,473,674 or if determined to be different, the qualified interest income of such year.
39
Trustees and Officers (Unaudited)
The following tables list the Trust's Trustees and Officers as of the date of this report; their address and date of birth ("DOB"); their position with the Trust; the length of time holding that position with the Trust; their principal occupation(s) during the past five years; the number of portfolios in the fund complex they oversee; and other directorships they hold in companies subject to registration or reporting requirements of the Securities Exchange Act of 1934 (generally called "public companies") or in registered investment companies. The Trust's Statement of Additional Information ("SAI") includes additional information about the Trust's trustees, including changes subsequent to the date of the report. The SAI is available, without charge, upon request by writing GMO, c/o GMO Trust, 40 Rowes Wharf, Boston, MA 02110.
Independent Trustees:
| Name, Address, and DOB | Position(s) Held with Trust | Term of Office1 and Length of Time Served | Principal Occupation(s) During Past Five Years | Number of Portfolios in Fund Complex Overseen by Trustee | Other Directorships Held by Trustee | ||||||||||||||||||
| Donald W. Glazer, Esq. c/o GMO Trust 40 Rowes Wharf Boston, MA 02110 DOB: 07/26/1944 | Chairman of the Board of Trustees | Chairman of the Board of Trustees since March 2005; Lead Independent Trustee (September 2004 – March 2005); Trustee since December 2000. | Consultant – Law and Business2; Author of Legal Treatises. | 59 | None. | ||||||||||||||||||
1 Each Trustee is elected to serve during the continued lifetime of the Trust until he/she dies, resigns or is removed, or if sooner, until the next meeting of Shareholders called for the purpose of electing Trustees and until the election and qualification of his/her successor.
2 As part of Mr. Glazer's work as a consultant, he provides part-time consulting services to Goodwin Procter LLP ("Goodwin"). Goodwin has provided legal services to Renewable Resources, LLC, an affiliate of GMO; GMO, in connection with its relationship with Renewable Resources; and funds managed by Renewable Resources. Mr. Glazer has represented that he has no financial interest in, and is not involved in the provision of, such legal services. In the calendar years ended December 31, 2007 and December 31, 2008, these entities paid $789,416 and $183,864 respectively, in legal fees and disbursements to Goodwin. In correspondence with the Staff of the Securities and Exchange Commission beginning in August 2006, the Independent Trustees' legal counsel provided the Staff with information regarding Mr. Glazer's relationship with Goodwin and h is other business activities. On September 11, 2007, based on information that had been given to the Staff as of that date, the Staff provided oral no-action assurance consistent with the opinion of the Independent Trustees' legal counsel that Mr. Glazer is not an "interested person" of the Trust.
40
Independent Trustees — (Continued)
| Name, Address, and DOB | Position(s) Held with Trust | Term of Office1 and Length of Time Served | Principal Occupation(s) During Past Five Years | Number of Portfolios in Fund Complex Overseen by Trustee | Other Directorships Held by Trustee | ||||||||||||||||||
| W. Nicholas Thorndike c/o GMO Trust 40 Rowes Wharf Boston, MA 02110 DOB: 03/28/1933 | Trustee | Since March 2005. | Director or trustee of various corporations and charitable organizations, including Courier Corporation (a book publisher and manufacturer) (July 1989 – present); Putnam Funds (December 1992 – June 2004); and Providence Journal (a newspaper publisher) (December 1986 – December 2003). | 59 | Director of Courier Corporation (a book publisher and manufacturer); Member of the Investment Committee of Partners HealthCare System, Inc.3 | ||||||||||||||||||
| Peter Tufano c/o GMO Trust 40 Rowes Wharf Boston, MA 02110 DOB: 04/22/1957 | Trustee | Since December 2008. | Sylvan C. Coleman Professor of Financial Management, Harvard Business School (since 1989). | 59 | Trustee of State Street Navigator Securities Lending Trust (3 Portfolios). | ||||||||||||||||||
1 Each Trustee is elected to serve during the continued lifetime of the Trust until he/she dies, resigns or is removed, or if sooner, until the next meeting of Shareholders called for the purpose of electing Trustees and until the election and qualification of his/her successor.
3 Partners HealthCare System, Inc. is a client of the Manager.
41
Principal Officers:
| Name, Address, and DOB | Position(s) Held with Trust | Term of Office4 and Length of Time Served | Principal Occupation(s) During Past Five Years5 | ||||||||||||
| J.B. Kittredge DOB: 08/22/1954 | President and Chief Executive Officer | Since March 2009. | General Counsel, Grantham, Mayo, Van Otterloo & Co. LLC (October 2005 – Present); Partner, Ropes & Gray LLP. | ||||||||||||
| Sheppard N. Burnett c/o GMO Trust 40 Rowes Wharf Boston, MA 02110 DOB: 10/24/1968 | Treasurer and Chief Financial Officer | Chief Financial Officer since March 2007; Treasurer since November 2006; Assistant Treasurer, September 2004 – November 2006. | Fund Administration Staff, Grantham, Mayo, Van Otterloo & Co. LLC (June 2004 – present); Vice President, Director of Tax, Columbia Management Group (2002 – 2004). | ||||||||||||
| Brent C. Arvidson c/o GMO Trust 40 Rowes Wharf Boston, MA 02110 DOB: 06/26/1969 | Assistant Treasurer | Since August 1998. | Senior Fund Administrator, Grantham, Mayo, Van Otterloo & Co. LLC. | ||||||||||||
| John L. Nasrah c/o GMO Trust 40 Rowes Wharf Boston, MA 02110 DOB: 05/27/1977 | Assistant Treasurer | Since March 2007. | Fund Administrator, Grantham, Mayo, Van Otterloo & Co. LLC (September 2004 – present); Tax Analyst, Bain & Company, Inc. (June 2003 – September 2004). | ||||||||||||
| Mahmoodur Rahman c/o GMO Trust 40 Rowes Wharf Boston, MA 02110 DOB: 11/30/1967 | Assistant Treasurer | Since September 2007. | Fund Administrator, Grantham, Mayo, Van Otterloo & Co. LLC (April 2007 – present); Vice President and Senior Tax Manager, Massachusetts Financial Services Company (January 2000 – April 2007). | ||||||||||||
| Michael E. Gillespie c/o GMO Trust 40 Rowes Wharf Boston, MA 02110 DOB: 02/18/1958 | Chief Compliance Officer | Since March 2005. | Vice President of Compliance (June 2004 – February 2005) and Director of Domestic Compliance (March 2002 – June 2004), Fidelity Investments. | ||||||||||||
4 Each officer is elected to hold such office until his or her successor is duly elected and qualified to carry out the duties and responsibilities of the office, or until he or she resigns or is removed from office.
5 Each of Messrs. Burnett, Arvidson, Bohan, and Pottle serves as an officer and/or director of certain pooled investment vehicles of which GMO or an affiliate of GMO serves as the investment adviser.
42
Principal Officers — (Continued)
| Name, Address, and DOB | Position(s) Held with Trust | Term of Office4 and Length of Time Served | Principal Occupation(s) During Past Five Years5 | ||||||||||||
| Jason B. Harrison c/o GMO Trust 40 Rowes Wharf Boston, MA 02110 DOB: 01/29/1977 | Vice President and Clerk | Vice President since November 2006; Clerk since March 2006. | Legal Counsel, Grantham, Mayo, Van Otterloo & Co. LLC (since February 2006) and Attorney, Ropes & Gray LLP (September 2002 – February 2006). | ||||||||||||
| David L. Bohan c/o GMO Trust 40 Rowes Wharf Boston, MA 02110 DOB: 06/21/1964 | Vice President and Assistant Clerk | Vice President since March 2005; Assistant Clerk since March 2006. | Legal Counsel, Grantham, Mayo, Van Otterloo & Co. LLC. | ||||||||||||
| Gregory L. Pottle c/o GMO Trust 40 Rowes Wharf Boston, MA 02110 DOB: 07/09/1971 | Vice President and Assistant Clerk | Since November 2006. | Legal Counsel, Grantham, Mayo, Van Otterloo & Co. LLC. | ||||||||||||
| Anne K. Trinque c/o GMO Trust 40 Rowes Wharf Boston, MA 02110 DOB: 04/15/1978 | Vice President and Assistant Clerk | Since September 2007. | Legal Counsel, Grantham, Mayo, Van Otterloo & Co. LLC (January 2007 – present); Attorney, Goodwin Procter LLP (September 2003 – January 2007). | ||||||||||||
| Cheryl Wakeham c/o GMO Trust 40 Rowes Wharf Boston, MA 02110 DOB: 10/29/1958 | Vice President and Anti-Money Laundering Officer | Since December 2004. | Manager, Client Service Administration, Grantham, Mayo, Van Otterloo & Co. LLC. | ||||||||||||
4 Each officer is elected to hold such office until his or her successor is duly elected and qualified to carry out the duties and responsibilities of the office, or until he or she resigns or is removed from office.
5 Each of Messrs. Burnett, Arvidson, Bohan, and Pottle serves as an officer and/or director of certain pooled investment vehicles of which GMO or an affiliate of GMO serves as the investment adviser.
43
GMO Tobacco-Free Core Fund
(A Series of GMO Trust)
Annual Report
February 28, 2009
For a free copy of the Fund's proxy voting guidelines, shareholders may call 1-617-346-7646 (collect) or visit the Securities and Exchange Commission's website at www.sec.gov. Information regarding how the Fund voted proxies relating to portfolio securities during the most recent 12-month period ended June 30 is available on GMO's website at www.gmo.com, or on the Securities and Exchange Commission's website at www.sec.gov.
The Fund files its complete schedule of portfolio holdings with the Securities and Exchange Commission for the first and third quarter of each fiscal year on Form N-Q, which is available on the Commission's website at www.sec.gov. The Fund's Form N-Q may be reviewed and copied at the Commission's Public Reference Room in Washington, D.C. Information on the operation of the Public Reference Room may be obtained by calling 1-800-SEC-0330. The Fund has a policy with respect to disclosure of portfolio holdings under which it may also make available on GMO's website at www.gmo.com a complete schedule of portfolio holdings.
This report is prepared for the general information of shareholders. It is authorized for distribution to prospective investors only when preceded or accompanied by a prospectus for the GMO Trust, which contains a complete discussion of the risks associated with an investment in this Fund and other important information. The GMO Trust prospectus can be obtained at www.gmo.com.
GMO Tobacco-Free Core Fund
(A Series of GMO Trust)
Portfolio Management
Day-to-day management of the Fund's portfolio is the responsibility of the Quantitative Equity team at Grantham, Mayo, Van Otterloo & Co. LLC.
Management Discussion and Analysis of Fund Performance
The GMO Tobacco-Free Core Fund returned -33.8% for the fiscal year ended February 28, 2009, as compared to -43.3% for the S&P 500 Index. Consistent with the Fund's investment objectives and policies, the Fund was invested primarily in U.S. equity securities throughout the period.
Stock selection added to returns relative to the S&P 500 Index. Stock selections within Energy, Consumer Discretionary, and Information Technology added to relative returns while stock selections within Health Care, Utilities, and Telecommunication Services detracted. Individual names adding to relative returns included overweight positions in Wal-Mart Stores and Johnson & Johnson and an underweight in GE. Names detracting from relative returns included underweight positions in AT&T and Verizon Communications and an overweight in Zimmer Holdings.
Sector selection added to returns relative to the S&P 500 Index. Sector weightings positively impacting relative performance included an underweight position in Financials and overweight positions in Health Care and Consumer Staples. Sector weightings negatively impacting relative performance included underweight positions in Telecommunication Services, Utilities, and Consumer Discretionary.
The views expressed herein are exclusively those of Grantham, Mayo, Van Otterloo & Co. LLC Management as of the date of this report and are subject to change. GMO disclaims any responsibility to update such views. They are not meant as investment advice. References to specific securities are not recommendations of such securities and may not be representative of any GMO portfolio's current or future investments.

Performance data quoted represents past performance and is not indicative of future results. The investment return and principal value of an investment will fluctuate so that an investor's shares, when redeemed, may be worth more or less than their original cost. Current performance data may be lower or higher than the performance data provided herein. To obtain performance information to the most recent month-end, visit www.gmo.com. Performance shown is net of all fees after reimbursement from the Manager. Returns would have been lower had certain expenses not been reimbursed during the periods shown and do not include the effect of taxes on distributions and redemptions. All information is unaudited.
GMO Tobacco-Free Core Fund
(A Series of GMO Trust)
Investments Concentration Summary
February 28, 2009 (Unaudited)
| Asset Class Summary | % of Total Net Assets | ||||||
| Common Stocks | 96.2 | % | |||||
| Short-Term Investments | 3.6 | ||||||
| Futures | (0.4 | ) | |||||
| Other | 0.6 | ||||||
| 100.0 | % | ||||||
| Industry Sector Summary | % of Equity Investments | ||||||
| Health Care | 27.9 | % | |||||
| Information Technology | 18.4 | ||||||
| Consumer Staples | 17.0 | ||||||
| Energy | 15.6 | ||||||
| Consumer Discretionary | 8.0 | ||||||
| Industrials | 5.3 | ||||||
| Financials | 4.5 | ||||||
| Materials | 1.5 | ||||||
| Telecommunication Services | 1.3 | ||||||
| Utilities | 0.5 | ||||||
| 100.0 | % | ||||||
1
GMO Tobacco-Free Core Fund
(A Series of GMO Trust)
Schedule of Investments
(showing percentage of total net assets)
February 28, 2009
| Shares | Description | Value ($) | |||||||||||||
| COMMON STOCKS — 96.2% | |||||||||||||||
| Consumer Discretionary — 7.7% | |||||||||||||||
| 600 | Abercrombie & Fitch Co.-Class A | 13,194 | |||||||||||||
| 500 | Advance Auto Parts, Inc. | 19,125 | |||||||||||||
| 100 | Apollo Group, Inc.-Class A * | 7,250 | |||||||||||||
| 560 | AutoZone, Inc. * | 79,649 | |||||||||||||
| 2,200 | Bed Bath & Beyond, Inc. * | 46,860 | |||||||||||||
| 700 | Best Buy Co., Inc. | 20,174 | |||||||||||||
| 700 | Cablevision Systems Corp.-Class A | 9,093 | |||||||||||||
| 3,400 | CBS Corp.-Class B (Non Voting) | 14,518 | |||||||||||||
| 3,200 | Coach, Inc. * | 44,736 | |||||||||||||
| 7,400 | Comcast Corp.-Class A | 96,644 | |||||||||||||
| 900 | DirecTV Group (The), Inc. * | 17,946 | |||||||||||||
| 1,400 | DISH Network Corp.-Class A * | 15,750 | |||||||||||||
| 600 | Dollar Tree, Inc. * | 23,292 | |||||||||||||
| 700 | Family Dollar Stores, Inc. | 19,208 | |||||||||||||
| 1,400 | Gannett Co., Inc. | 4,536 | |||||||||||||
| 1,200 | Gap (The), Inc. | 12,948 | |||||||||||||
| 300 | Genuine Parts Co. | 8,442 | |||||||||||||
| 1,600 | H&R Block, Inc. | 30,560 | |||||||||||||
| 600 | Harley-Davidson, Inc. | 6,060 | |||||||||||||
| 700 | Hasbro, Inc. | 16,023 | |||||||||||||
| 11,800 | Home Depot, Inc. | 246,502 | |||||||||||||
| 100 | ITT Educational Services, Inc. * | 11,350 | |||||||||||||
| 1,200 | J. Crew Group, Inc. * | 13,512 | |||||||||||||
| 1,500 | Kohl's Corp. * | 52,710 | |||||||||||||
| 800 | Leggett & Platt, Inc. | 9,144 | |||||||||||||
| 1,100 | Limited Brands, Inc. | 8,459 | |||||||||||||
| 6,700 | Lowe's Cos., Inc. | 106,128 | |||||||||||||
| 1,400 | McDonald's Corp. | 73,150 | |||||||||||||
| 1,300 | News Corp.-Class A | 7,228 | |||||||||||||
| 27 | NVR, Inc. * | 8,985 | |||||||||||||
| 600 | PetSmart, Inc. | 12,024 | |||||||||||||
| 300 | Polo Ralph Lauren Corp. | 10,341 | |||||||||||||
See accompanying notes to the financial statements.
2
GMO Tobacco-Free Core Fund
(A Series of GMO Trust)
Schedule of Investments — (Continued)
(showing percentage of total net assets)
February 28, 2009
| Shares | Description | Value ($) | |||||||||||||
| Consumer Discretionary — continued | |||||||||||||||
| 1,000 | Ross Stores, Inc. | 29,520 | |||||||||||||
| 300 | Sears Holdings Corp. * | 11,028 | |||||||||||||
| 400 | Sherwin-Williams Co. (The) | 18,380 | |||||||||||||
| 3,800 | Staples, Inc. | 60,610 | |||||||||||||
| 1,300 | Target Corp. | 36,803 | |||||||||||||
| 1,100 | Time Warner Cable, Inc.-Class A * | 20,053 | |||||||||||||
| 1,000 | TJX Cos. (The), Inc. | 22,270 | |||||||||||||
| 1,500 | Urban Outfitters, Inc. * | 24,960 | |||||||||||||
| 300 | Yum! Brands, Inc. | 7,884 | |||||||||||||
| Total Consumer Discretionary | 1,297,049 | ||||||||||||||
| Consumer Staples — 16.3% | |||||||||||||||
| 300 | Archer-Daniels-Midland Co. | 7,998 | |||||||||||||
| 700 | Avon Products, Inc. | 12,313 | |||||||||||||
| 700 | Campbell Soup Co. | 18,739 | |||||||||||||
| 200 | Church & Dwight Co., Inc. | 9,784 | |||||||||||||
| 600 | Clorox Co. | 29,160 | |||||||||||||
| 9,200 | Coca-Cola Co. (The) | 375,820 | |||||||||||||
| 2,000 | Colgate-Palmolive Co. | 120,360 | |||||||||||||
| 413 | Costco Wholesale Corp. | 17,486 | |||||||||||||
| 900 | Estee Lauder Cos. (The), Inc.-Class A | 20,385 | |||||||||||||
| 2,800 | General Mills, Inc. | 146,944 | |||||||||||||
| 800 | Hershey Co. (The) | 26,952 | |||||||||||||
| 900 | HJ Heinz Co. | 29,403 | |||||||||||||
| 200 | JM Smucker Co. (The) | 7,424 | |||||||||||||
| 800 | Kellogg Co. | 31,136 | |||||||||||||
| 1,400 | Kimberly-Clark Corp. | 65,954 | |||||||||||||
| 1,200 | Kraft Foods, Inc.-Class A | 27,336 | |||||||||||||
| 1,800 | Kroger Co. (The) | 37,206 | |||||||||||||
| 400 | McCormick & Co., Inc. (Non Voting) | 12,540 | |||||||||||||
| 8,000 | PepsiCo, Inc. | 385,120 | |||||||||||||
| 6,948 | Procter & Gamble Co. (The) | 334,685 | |||||||||||||
| 365 | Supervalu, Inc. | 5,698 | |||||||||||||
| 500 | Sysco Corp. | 10,750 | |||||||||||||
See accompanying notes to the financial statements.
3
GMO Tobacco-Free Core Fund
(A Series of GMO Trust)
Schedule of Investments — (Continued)
(showing percentage of total net assets)
February 28, 2009
| Shares | Description | Value ($) | |||||||||||||
| Consumer Staples — continued | |||||||||||||||
| 16,200 | Wal-Mart Stores, Inc. | 797,688 | |||||||||||||
| 9,200 | Walgreen Co. | 219,512 | |||||||||||||
| Total Consumer Staples | 2,750,393 | ||||||||||||||
| Energy — 15.0% | |||||||||||||||
| 500 | Anadarko Petroleum Corp. | 17,475 | |||||||||||||
| 860 | Apache Corp. | 50,818 | |||||||||||||
| 300 | Baker Hughes, Inc. | 8,793 | |||||||||||||
| 1,800 | BJ Services Co. | 17,406 | |||||||||||||
| 200 | Cabot Oil & Gas Corp. | 4,074 | |||||||||||||
| 2,100 | Chesapeake Energy Corp. | 32,844 | |||||||||||||
| 10,300 | Chevron Corp. | 625,313 | |||||||||||||
| 500 | Cimarex Energy Co. | 9,825 | |||||||||||||
| 6,051 | ConocoPhillips | 226,005 | |||||||||||||
| 800 | Devon Energy Corp. | 34,936 | |||||||||||||
| 500 | ENSCO International, Inc. | 12,290 | |||||||||||||
| 820 | EOG Resources, Inc. | 41,033 | |||||||||||||
| 13,600 | Exxon Mobil Corp. | 923,440 | |||||||||||||
| 1,700 | Halliburton Co. | 27,727 | |||||||||||||
| 700 | Helmerich & Payne, Inc. | 16,562 | |||||||||||||
| 870 | Hess Corp. | 47,580 | |||||||||||||
| 398 | Murphy Oil Corp. | 16,640 | |||||||||||||
| 1,500 | Nabors Industries Ltd. * | 14,565 | |||||||||||||
| 400 | National Oilwell Varco, Inc. * | 10,692 | |||||||||||||
| 300 | Newfield Exploration Co. * | 5,799 | |||||||||||||
| 300 | Noble Corp. | 7,377 | |||||||||||||
| 400 | Noble Energy, Inc. | 18,216 | |||||||||||||
| 3,500 | Occidental Petroleum Corp. | 181,545 | |||||||||||||
| 1,000 | Patterson-UTI Energy, Inc. | 8,590 | |||||||||||||
| 600 | Pioneer Natural Resources Co. | 8,754 | |||||||||||||
| 700 | Plains Exploration & Production Co. * | 13,398 | |||||||||||||
| 200 | Range Resources Corp. | 7,114 | |||||||||||||
| 1,100 | Southwestern Energy Co. * | 31,647 | |||||||||||||
| 500 | Spectra Energy Corp. | 6,500 | |||||||||||||
See accompanying notes to the financial statements.
4
GMO Tobacco-Free Core Fund
(A Series of GMO Trust)
Schedule of Investments — (Continued)
(showing percentage of total net assets)
February 28, 2009
| Shares | Description | Value ($) | |||||||||||||
| Energy — continued | |||||||||||||||
| 400 | Sunoco, Inc. | 13,380 | |||||||||||||
| 209 | Transocean Ltd. * | 12,492 | |||||||||||||
| 2,600 | Valero Energy Corp. | 50,388 | |||||||||||||
| 1,300 | Weatherford International Ltd. * | 13,871 | |||||||||||||
| 400 | XTO Energy, Inc. | 12,664 | |||||||||||||
| Total Energy | 2,529,753 | ||||||||||||||
| Financials — 4.3% | |||||||||||||||
| 500 | Aflac, Inc. | 8,380 | |||||||||||||
| 3,400 | Allstate Corp. (The) | 57,222 | |||||||||||||
| 500 | Arthur J. Gallagher & Co. | 7,935 | |||||||||||||
| 400 | Assurant, Inc. | 8,160 | |||||||||||||
| 7,988 | Bank of America Corp. | 31,552 | |||||||||||||
| 2,700 | BB&T Corp. | 43,551 | |||||||||||||
| 170 | BlackRock, Inc. | 16,458 | |||||||||||||
| 300 | Capital One Financial Corp. | 3,615 | |||||||||||||
| 2,900 | Chubb Corp. | 113,216 | |||||||||||||
| 400 | Comerica, Inc. | 6,004 | |||||||||||||
| 1,100 | Freddie Mac | 462 | |||||||||||||
| 170 | Goldman Sachs Group (The), Inc. | 15,484 | |||||||||||||
| 2,600 | Hudson City Bancorp, Inc. | 26,962 | |||||||||||||
| 500 | JPMorgan Chase & Co. | 11,425 | |||||||||||||
| 3,000 | Marsh & McLennan Cos., Inc. | 53,790 | |||||||||||||
| 900 | MetLife, Inc. | 16,614 | |||||||||||||
| 900 | Moody's Corp. | 16,155 | |||||||||||||
| 700 | People's United Financial, Inc. | 12,187 | |||||||||||||
| 100 | PNC Financial Services Group, Inc. | 2,734 | |||||||||||||
| 2,900 | Progressive Corp. (The) * | 33,553 | |||||||||||||
| 400 | Prudential Financial, Inc. | 6,564 | |||||||||||||
| 200 | T. Rowe Price Group, Inc. | 4,548 | |||||||||||||
| 300 | Torchmark Corp. | 6,180 | |||||||||||||
| 3,800 | Travelers Cos. (The), Inc. | 137,370 | |||||||||||||
| 35 | Unum Group | 356 | |||||||||||||
| 2,400 | US Bancorp | 34,344 | |||||||||||||
See accompanying notes to the financial statements.
5
GMO Tobacco-Free Core Fund
(A Series of GMO Trust)
Schedule of Investments — (Continued)
(showing percentage of total net assets)
February 28, 2009
| Shares | Description | Value ($) | |||||||||||||
| Financials — continued | |||||||||||||||
| 800 | W.R. Berkley Corp. | 16,648 | |||||||||||||
| 3,200 | Wells Fargo & Co. | 38,720 | |||||||||||||
| Total Financials | 730,189 | ||||||||||||||
| Health Care — 26.9% | |||||||||||||||
| 4,700 | Abbott Laboratories | 222,498 | |||||||||||||
| 1,400 | AmerisourceBergen Corp. | 44,464 | |||||||||||||
| 10,200 | Amgen, Inc. * | 499,086 | |||||||||||||
| 200 | Bard (C.R.), Inc. | 16,052 | |||||||||||||
| 500 | Baxter International, Inc. | 25,455 | |||||||||||||
| 200 | Becton, Dickinson & Co. | 12,378 | |||||||||||||
| 800 | Biogen Idec, Inc. * | 36,832 | |||||||||||||
| 3,600 | Bristol-Myers Squibb Co. | 66,276 | |||||||||||||
| 1,900 | Cardinal Health, Inc. | 61,655 | |||||||||||||
| 400 | Celgene Corp. * | 17,892 | |||||||||||||
| 200 | Cephalon, Inc. * | 13,118 | |||||||||||||
| 200 | Covance, Inc. * | 7,596 | |||||||||||||
| 1,500 | Coventry Health Care, Inc. * | 17,280 | |||||||||||||
| 200 | Covidien Ltd. | 6,334 | |||||||||||||
| 200 | Edwards Lifesciences Corp. * | 11,122 | |||||||||||||
| 5,300 | Eli Lilly & Co. | 155,714 | |||||||||||||
| 1,200 | Express Scripts, Inc. * | 60,360 | |||||||||||||
| 5,600 | Forest Laboratories, Inc. * | 120,064 | |||||||||||||
| 400 | Genentech, Inc. * | 34,220 | |||||||||||||
| 100 | Genzyme Corp. * | 6,093 | |||||||||||||
| 4,400 | Gilead Sciences, Inc. * | 197,120 | |||||||||||||
| 500 | Illumina, Inc. * | 15,665 | |||||||||||||
| 13,120 | Johnson & Johnson | 656,000 | |||||||||||||
| 1,000 | King Pharmaceuticals, Inc. * | 7,340 | |||||||||||||
| 2,700 | McKesson Corp. | 110,754 | |||||||||||||
| 3,300 | Medtronic, Inc. | 97,647 | |||||||||||||
| 6,600 | Merck & Co., Inc. | 159,720 | |||||||||||||
| 200 | Myriad Genetics, Inc. * | 15,770 | |||||||||||||
| 400 | Omnicare, Inc. | 10,372 | |||||||||||||
See accompanying notes to the financial statements.
6
GMO Tobacco-Free Core Fund
(A Series of GMO Trust)
Schedule of Investments — (Continued)
(showing percentage of total net assets)
February 28, 2009
| Shares | Description | Value ($) | |||||||||||||
| Health Care — continued | |||||||||||||||
| 200 | Patterson Cos., Inc. * | 3,614 | |||||||||||||
| 3,400 | PDL BioPharma, Inc. | 19,958 | |||||||||||||
| 53,890 | Pfizer, Inc. | 663,386 | |||||||||||||
| 200 | Quest Diagnostics, Inc. | 9,166 | |||||||||||||
| 2,100 | Schering-Plough Corp. | 36,519 | |||||||||||||
| 500 | Stryker Corp. | 16,835 | |||||||||||||
| 20,967 | UnitedHealth Group, Inc. | 412,001 | |||||||||||||
| 400 | Varian Medical Systems, Inc. * | 12,204 | |||||||||||||
| 400 | Vertex Pharmaceuticals, Inc. * | 12,092 | |||||||||||||
| 4,800 | WellPoint, Inc. * | 162,816 | |||||||||||||
| 7,500 | Wyeth | 306,150 | |||||||||||||
| 4,800 | Zimmer Holdings, Inc. * | 168,096 | |||||||||||||
| Total Health Care | 4,527,714 | ||||||||||||||
| Industrials — 5.1% | |||||||||||||||
| 1,700 | 3M Co. | 77,282 | |||||||||||||
| 1,690 | Burlington Northern Santa Fe Corp. | 99,321 | |||||||||||||
| 1,300 | CH Robinson Worldwide, Inc. | 53,794 | |||||||||||||
| 300 | Copart, Inc. * | 8,106 | |||||||||||||
| 2,500 | CSX Corp. | 61,700 | |||||||||||||
| 200 | Danaher Corp. | 10,152 | |||||||||||||
| 300 | Emerson Electric Co. | 8,025 | |||||||||||||
| 1,300 | Fastenal Co. | 39,156 | |||||||||||||
| 200 | Flowserve Corp. | 10,094 | |||||||||||||
| 1,800 | General Dynamics Corp. | 78,876 | |||||||||||||
| 400 | JB Hunt Transport Services, Inc. | 8,152 | |||||||||||||
| 700 | Joy Global, Inc. | 12,222 | |||||||||||||
| 600 | Kansas City Southern * | 10,614 | |||||||||||||
| 200 | L-3 Communications Holdings, Inc. | 13,530 | |||||||||||||
| 120 | Lockheed Martin Corp. | 7,573 | |||||||||||||
| 200 | Manpower, Inc. | 5,576 | |||||||||||||
| 600 | Masco Corp. | 3,090 | |||||||||||||
| 2,300 | Norfolk Southern Corp. | 72,956 | |||||||||||||
| 150 | Paccar, Inc. | 3,761 | |||||||||||||
See accompanying notes to the financial statements.
7
GMO Tobacco-Free Core Fund
(A Series of GMO Trust)
Schedule of Investments — (Continued)
(showing percentage of total net assets)
February 28, 2009
| Shares | Description | Value ($) | |||||||||||||
| Industrials — continued | |||||||||||||||
| 400 | Parker-Hannifin Corp. | 13,348 | |||||||||||||
| 300 | Rockwell Collins, Inc. | 9,360 | |||||||||||||
| 200 | Ryder System, Inc. | 4,572 | |||||||||||||
| 900 | Southwest Airlines Co. | 5,301 | |||||||||||||
| 100 | SPX Corp. | 4,428 | |||||||||||||
| 2,700 | Tyco International Ltd. | 54,135 | |||||||||||||
| 2,200 | Union Pacific Corp. | 82,544 | |||||||||||||
| 800 | United Parcel Service, Inc.-Class B | 32,944 | |||||||||||||
| 900 | United Technologies Corp. | 36,747 | |||||||||||||
| 100 | W.W. Grainger, Inc. | 6,616 | |||||||||||||
| 800 | Waste Management, Inc. | 21,600 | |||||||||||||
| Total Industrials | 855,575 | ||||||||||||||
| Information Technology — 17.7% | |||||||||||||||
| 1,100 | Affiliated Computer Services, Inc.-Class A * | 51,293 | |||||||||||||
| 300 | Alliance Data Systems Corp. * | 8,880 | |||||||||||||
| 600 | Altera Corp. | 9,198 | |||||||||||||
| 300 | Automatic Data Processing, Inc. | 10,245 | |||||||||||||
| 300 | BMC Software, Inc. * | 8,889 | |||||||||||||
| 30,300 | Cisco Systems, Inc. * | 441,471 | |||||||||||||
| 200 | Citrix Systems, Inc. * | 4,116 | |||||||||||||
| 3,300 | Dell, Inc. * | 28,149 | |||||||||||||
| 6,000 | eBay, Inc. * | 65,220 | |||||||||||||
| 307 | Fiserv, Inc. * | 10,014 | |||||||||||||
| 300 | Global Payments, Inc. | 9,204 | |||||||||||||
| 380 | Google, Inc.-Class A * | 128,436 | |||||||||||||
| 2,190 | International Business Machines Corp. | 201,546 | |||||||||||||
| 3,400 | Lawson Software, Inc. * | 13,056 | |||||||||||||
| 320 | MasterCard, Inc.-Class A | 50,570 | |||||||||||||
| 45,900 | Microsoft Corp. | 741,285 | |||||||||||||
| 800 | NetApp, Inc. * | 10,752 | |||||||||||||
| 31,200 | Oracle Corp. * | 484,848 | |||||||||||||
| 17,132 | Qualcomm, Inc. | 572,723 | |||||||||||||
| 200 | Red Hat, Inc. * | 2,738 | |||||||||||||
See accompanying notes to the financial statements.
8
GMO Tobacco-Free Core Fund
(A Series of GMO Trust)
Schedule of Investments — (Continued)
(showing percentage of total net assets)
February 28, 2009
| Shares | Description | Value ($) | |||||||||||||
| Information Technology — continued | |||||||||||||||
| 200 | Salesforce.com, Inc. * | 5,600 | |||||||||||||
| 2,300 | Symantec Corp. * | 31,809 | |||||||||||||
| 5,400 | VeriFone Holdings, Inc. * | 23,436 | |||||||||||||
| 1,000 | Western Digital Corp. * | 13,660 | |||||||||||||
| 3,300 | Western Union Co. | 36,828 | |||||||||||||
| 1,200 | Xilinx, Inc. | 21,216 | |||||||||||||
| Total Information Technology | 2,985,182 | ||||||||||||||
| Materials — 1.4% | |||||||||||||||
| 3,000 | Alcoa, Inc. | 18,690 | |||||||||||||
| 2,100 | Barrick Gold Corp. | 63,420 | |||||||||||||
| 22,900 | Domtar Corp. * | 18,091 | |||||||||||||
| 400 | Dow Chemical Co. (The) | 2,864 | |||||||||||||
| 200 | FMC Corp. | 8,086 | |||||||||||||
| 530 | Monsanto Co. | 40,423 | |||||||||||||
| 1,400 | Nucor Corp. | 47,110 | |||||||||||||
| 500 | Pactiv Corp. * | 7,915 | |||||||||||||
| 200 | Reliance Steel & Aluminum Co. | 4,758 | |||||||||||||
| 400 | Sigma-Aldrich Corp. | 14,280 | |||||||||||||
| 200 | Vulcan Materials Co. | 8,282 | |||||||||||||
| Total Materials | 233,919 | ||||||||||||||
| Telecommunication Services — 1.3% | |||||||||||||||
| 4,339 | AT&T, Inc. | 103,138 | |||||||||||||
| 1,300 | Frontier Communications Corp. | 9,360 | |||||||||||||
| 3,584 | Verizon Communications, Inc. | 102,251 | |||||||||||||
| Total Telecommunication Services | 214,749 | ||||||||||||||
| Utilities — 0.5% | |||||||||||||||
| 200 | Exelon Corp. | 9,444 | |||||||||||||
| 600 | FirstEnergy Corp. | 25,536 | |||||||||||||
| 500 | MDU Resources Group, Inc. | 7,570 | |||||||||||||
| 300 | PG&E Corp. | 11,466 | |||||||||||||
See accompanying notes to the financial statements.
9
GMO Tobacco-Free Core Fund
(A Series of GMO Trust)
Schedule of Investments — (Continued)
(showing percentage of total net assets)
February 28, 2009
| Shares | Description | Value ($) | |||||||||||||
| Utilities — continued | |||||||||||||||
| 600 | Southern Co. | 18,186 | |||||||||||||
| 900 | TECO Energy, Inc. | 8,631 | |||||||||||||
| Total Utilities | 80,833 | ||||||||||||||
| TOTAL COMMON STOCKS (COST $23,787,697) | 16,205,356 | ||||||||||||||
| SHORT-TERM INVESTMENTS — 3.6% | |||||||||||||||
| Money Market Funds — 3.6% | |||||||||||||||
| 609,711 | State Street Institutional Treasury Money Market Fund-Institutional Class | 609,711 | |||||||||||||
| TOTAL SHORT-TERM INVESTMENTS (COST $609,711) | 609,711 | ||||||||||||||
| TOTAL INVESTMENTS — 99.8% (Cost $24,397,408) | 16,815,067 | ||||||||||||||
| Other Assets and Liabilities (net) — 0.2% | 33,787 | ||||||||||||||
| TOTAL NET ASSETS — 100.0% | $ | 16,848,854 | |||||||||||||
See accompanying notes to the financial statements.
10
GMO Tobacco-Free Core Fund
(A Series of GMO Trust)
Schedule of Investments — (Continued)
February 28, 2009
A summary of outstanding financial instruments at February 28, 2009 is as follows:
Futures Contracts
| Number of Contracts | Type | Expiration Date | Contract Value | Net Unrealized Appreciation (Depreciation) | |||||||||||||||
| Buys | |||||||||||||||||||
| 10 | S&P 500 E-Mini Index | March 2009 | $ | 367,100 | $ | (68,610 | ) | ||||||||||||
As of February 28, 2009, for the futures contracts held, the Fund had sufficient cash and/or securities to cover any commitments or margin requirements of the relevant broker or exchange.
Notes to Schedule of Investments:
* Non-income producing security.
See accompanying notes to the financial statements.
11
GMO Tobacco-Free Core Fund
(A Series of GMO Trust)
Statement of Assets and Liabilities — February 28, 2009
| Assets: | |||||||
| Investments, at value (cost $24,397,408) (Note 2) | $ | 16,815,067 | |||||
| Receivable for investments sold | 18,542 | ||||||
| Dividends and interest receivable | 62,351 | ||||||
| Receivable for collateral on open futures contracts (Note 2) | 49,500 | ||||||
| Receivable for expenses reimbursed by Manager (Note 3) | 7,068 | ||||||
| Total assets | 16,952,528 | ||||||
| Liabilities: | |||||||
| Payable for investments purchased | 21,234 | ||||||
| Payable to affiliate for (Note 3): | |||||||
| Management fee | 4,698 | ||||||
| Shareholder service fee | 2,134 | ||||||
| Trustees and Chief Compliance Officer of GMO Trust fees | 57 | ||||||
| Payable for variation margin on open futures contracts (Note 2) | 8,900 | ||||||
| Accrued expenses | 66,651 | ||||||
| Total liabilities | 103,674 | ||||||
| Net assets | $ | 16,848,854 | |||||
| Net assets consist of: | |||||||
| Paid-in capital | $ | 33,777,322 | |||||
| Accumulated undistributed net investment income | 70,534 | ||||||
| Accumulated net realized loss | (9,348,051 | ) | |||||
| Net unrealized depreciation | (7,650,951 | ) | |||||
| $ | 16,848,854 | ||||||
| Net assets attributable to: | |||||||
| Class III shares | $ | 16,848,854 | |||||
| Shares outstanding: | |||||||
| Class III | 2,575,879 | ||||||
| Net asset value per share: | |||||||
| Class III | $ | 6.54 | |||||
See accompanying notes to the financial statements.
12
GMO Tobacco-Free Core Fund
(A Series of GMO Trust)
Statement of Operations — Year Ended February 28, 2009
| Investment Income: | |||||||
| Dividends (net of withholding taxes of $141) | $ | 528,675 | |||||
| Interest | 1,335 | ||||||
| Total investment income | 530,010 | ||||||
| Expenses: | |||||||
| Management fee (Note 3) | 81,514 | ||||||
| Shareholder service fee – Class III (Note 3) | 37,052 | ||||||
| Custodian, fund accounting agent and transfer agent fees | 29,954 | ||||||
| Audit and tax fees | 61,881 | ||||||
| Legal fees | 428 | ||||||
| Trustees fees and related expenses (Note 3) | 272 | ||||||
| Registration fees | 1,824 | ||||||
| Miscellaneous | 3,392 | ||||||
| Total expenses | 216,317 | ||||||
| Fees and expenses reimbursed by Manager (Note 3) | (97,209 | ) | |||||
| Expense reductions (Note 2) | (733 | ) | |||||
| Net expenses | 118,375 | ||||||
| Net investment income (loss) | 411,635 | ||||||
| Realized and unrealized gain (loss): | |||||||
| Net realized gain (loss) on: | |||||||
| Investments | (5,242,966 | ) | |||||
| Closed futures contracts | (353,130 | ) | |||||
| Net realized gain (loss) | (5,596,096 | ) | |||||
| Change in net unrealized appreciation (depreciation) on: | |||||||
| Investments | (4,006,589 | ) | |||||
| Open futures contracts | 8,556 | ||||||
| Net unrealized gain (loss) | (3,998,033 | ) | |||||
| Net realized and unrealized gain (loss) | (9,594,129 | ) | |||||
| Net increase (decrease) in net assets resulting from operations | $ | (9,182,494 | ) | ||||
See accompanying notes to the financial statements.
13
GMO Tobacco-Free Core Fund
(A Series of GMO Trust)
Statement of Changes in Net Assets
| Year Ended February 28, 2009 | Year Ended February 29, 2008 | ||||||||||
| Increase (decrease) in net assets: | |||||||||||
| Operations: | |||||||||||
| Net investment income (loss) | $ | 411,635 | $ | 2,667,719 | |||||||
| Net realized gain (loss) | (5,596,096 | ) | 26,668,967 | ||||||||
| Change in net unrealized appreciation (depreciation) | (3,998,033 | ) | (21,962,862 | ) | |||||||
| Net increase (decrease) in net assets from operations | (9,182,494 | ) | 7,373,824 | ||||||||
| Distributions to shareholders from: | |||||||||||
| Net investment income | |||||||||||
| Class III | (407,510 | ) | (2,382,432 | ) | |||||||
| Class IV | — | (1,169,636 | ) | ||||||||
| Total distributions from net investment income | (407,510 | ) | (3,552,068 | ) | |||||||
| Net realized gains | |||||||||||
| Class III | — | (15,985,212 | ) | ||||||||
| Class IV | — | (5,014,664 | ) | ||||||||
| Total distributions from net realized gains | — | (20,999,876 | ) | ||||||||
| (407,510 | ) | (24,551,944 | ) | ||||||||
| Net share transactions (Note 7): | |||||||||||
| Class III | (18,757,975 | ) | (122,744,412 | ) | |||||||
| Class IV | — | (141,183,947 | ) | ||||||||
| Increase (decrease) in net assets resulting from net share transactions | (18,757,975 | ) | (263,928,359 | ) | |||||||
| Total increase (decrease) in net assets | (28,347,979 | ) | (281,106,479 | ) | |||||||
| Net assets: | |||||||||||
| Beginning of period | 45,196,833 | 326,303,312 | |||||||||
| End of period (including accumulated undistributed net investment income of $70,534 and $66,409, respectively) | $ | 16,848,854 | $ | 45,196,833 | |||||||
See accompanying notes to the financial statements.
14
GMO Tobacco-Free Core Fund
(A Series of GMO Trust)
Financial Highlights
(For a Class III share outstanding throughout each period)
| Year Ended February 28/29, | |||||||||||||||||||||||
| 2009 | 2008 | 2007 | 2006 | 2005 | |||||||||||||||||||
| Net asset value, beginning of period | $ | 10.03 | $ | 12.88 | $ | 12.45 | $ | 12.24 | $ | 11.76 | |||||||||||||
| Income (loss) from investment operations: | |||||||||||||||||||||||
| Net investment income (loss)† | 0.15 | 0.19 | 0.18 | 0.20 | 0.17 | ||||||||||||||||||
| Net realized and unrealized gain (loss) | (3.50 | ) | (0.96 | )(a) | 0.54 | 0.44 | 0.54 | ||||||||||||||||
| Total from investment operations | (3.35 | ) | (0.77 | ) | 0.72 | 0.64 | 0.71 | ||||||||||||||||
| Less distributions to shareholders: | |||||||||||||||||||||||
| From net investment income | (0.14 | ) | (0.22 | ) | (0.23 | ) | (0.15 | ) | (0.18 | ) | |||||||||||||
| From net realized gains | — | (1.86 | ) | (0.06 | ) | (0.28 | ) | (0.05 | ) | ||||||||||||||
| Total distributions | (0.14 | ) | (2.08 | ) | (0.29 | ) | (0.43 | ) | (0.23 | ) | |||||||||||||
| Net asset value, end of period | $ | 6.54 | $ | 10.03 | $ | 12.88 | $ | 12.45 | $ | 12.24 | |||||||||||||
| Total Return(b) | (33.76 | )% | (7.30 | )% | 5.87 | % | 5.40 | % | 6.16 | % | |||||||||||||
| Ratios/Supplemental Data: | |||||||||||||||||||||||
| Net assets, end of period (000's) | $ | 16,849 | $ | 45,197 | $ | 188,133 | $ | 224,097 | $ | 221,661 | |||||||||||||
| Net expenses to average daily net assets | 0.48 | %(c) | 0.48 | %(c) | 0.48 | % | 0.48 | % | 0.48 | % | |||||||||||||
| Net investment income to average daily net assets | 1.67 | % | 1.52 | % | 1.46 | % | 1.68 | % | 1.43 | % | |||||||||||||
| Portfolio turnover rate | 65 | % | 74 | % | 73 | % | 63 | % | 68 | % | |||||||||||||
| Fees and expenses reimbursed by the Manager to average daily net assets: | 0.39 | % | 0.08 | % | 0.06 | % | 0.04 | % | 0.04 | % | |||||||||||||
(a) The amount shown for a share outstanding does not correspond with the aggregate net realized and unrealized gain (loss) on investments due to the timing of purchases and redemptions of Fund shares in relation to fluctuating market values of the investments of the Fund.
(b) The total returns would have been lower had certain expenses not been reimbursed during the periods shown and assumes the effect of reinvested distributions.
(c) The net expense ratio does not include the effect of expense reductions.
† Calculated using average shares outstanding throughout the period.
See accompanying notes to the financial statements.
15
GMO Tobacco-Free Core Fund
(A Series of GMO Trust)
Notes to Financial Statements
February 28, 2009
1. Organization
GMO Tobacco-Free Core Fund (the "Fund") is a series of GMO Trust (the "Trust"). The Fund is registered under the Investment Company Act of 1940, as amended, as an open-end, diversified management investment company. The Fund is advised and managed by Grantham, Mayo, Van Otterloo & Co. LLC (the "Manager" or "GMO"). The Trust was established as a Massachusetts business trust under the laws of The Commonwealth of Massachusetts on June 24, 1985. The Declaration of Trust permits the Trustees of the Trust ("Trustees") to create an unlimited number of series of shares ("Funds") and to subdivide Funds into classes.
The Fund seeks high total return. The Fund seeks to achieve its objective by outperforming the S&P 500 Index. The Fund typically makes equity investments in companies that issue stocks included in the S&P 500 Index, and in companies with similar market capitalizations, other than tobacco-producing companies.
As of February 28, 2009, the Fund had one class of shares outstanding: Class III. Class IV shares were liquidated on June 21, 2007.
2. Significant accounting policies
The following is a summary of significant accounting policies followed by the Fund in the preparation of its financial statements. These policies are in conformity with accounting principles generally accepted in the United States of America ("U.S. GAAP") and have been consistently followed by the Fund in preparing its financial statements. The preparation of financial statements in accordance with U.S. GAAP requires management to make estimates and assumptions that affect the reported amounts and disclosures in the financial statements. Actual results could differ from those estimates. The accounting records of the Fund are maintained in U.S. dollars.
Portfolio valuation
Securities listed on a securities exchange for which market quotations are readily available are valued at the last sale price or official closing price on each business day, or if there is no such reported sale or official closing price, at the most recent quoted bid price. Unlisted securities for which market quotations are readily available are generally valued at the most recent quoted bid price. Debt instruments with a remaining maturity of sixty days or less are generally valued at amortized cost, which approximates fair value. Shares of investment funds are generally valued at their net asset value. Securities for which quotations are not readily available or whose values the Manager has determined to be unreliable are valued at fair value as determined in good faith by the Trustees or persons acting at their direction pursuant to procedures approved by the Trustees. By its nature, a fair value price is a good faith estim ate of the value of a security at a given point in time and may not reflect the value that would be realized if the security were sold. The difference between a fair value price and the value realized upon a sale could be material.
16
GMO Tobacco-Free Core Fund
(A Series of GMO Trust)
Notes to Financial Statements — (Continued)
February 28, 2009
In September 2006, the Financial Accounting Standards Board ("FASB") issued Statement of Financial Accounting Standards No. 157, Fair Value Measurements ("SFAS 157"). SFAS 157 is effective for the Fund's current fiscal year. While the adoption of SFAS 157 does not have an effect on the Fund's net asset value, it does require additional disclosures about fair value measurements. SFAS 157 establishes a three-level hierarchy for disclosure of fair value measurements. The valuation hierarchy is based upon the reliability of inputs to the valuation of the Fund's investments. The three levels are defined as follows:
Level 1 – Valuations based on quoted prices for identical securities in active markets.
Level 2 – Valuations determined using other significant direct or indirect observable inputs.
Level 3 – Valuations based on inputs that are unobservable and significant.
The inputs or methodology used for valuing securities are not necessarily an indication of the risk associated with investing in those securities.
The following is a summary of the fair valuations according to inputs used as of February 28, 2009 in valuing the Fund's investments:
| Asset Valuation Inputs | Investments in Securities | Other Financial Instruments | |||||||||
| Level 1 - Quoted Prices | $ | 16,205,356 | $ | — | |||||||
| Level 2 - Other Significant Observable Inputs | 609,711 | — | |||||||||
| Level 3 - Significant Unobservable Inputs | — | — | |||||||||
| Total | $ | 16,815,067 | $ | — | |||||||
| Liability Valuation Inputs | Investments in Securities | Other Financial Instruments* | |||||||||
| Level 1 - Quoted Prices | $ | — | $ | (68,610 | ) | ||||||
| Level 2 - Other Significant Observable Inputs | — | — | |||||||||
| Level 3 - Significant Unobservable Inputs | — | — | |||||||||
| Total | $ | — | $ | (68,610 | ) | ||||||
* Other financial instruments include futures contracts.
The Fund held no investments or other financial instruments at either February 29, 2008 or February 28, 2009, whose fair value was determined using Level 3 inputs.
17
GMO Tobacco-Free Core Fund
(A Series of GMO Trust)
Notes to Financial Statements — (Continued)
February 28, 2009
Futures contracts
The Fund may purchase and sell futures contracts. Upon entering into a futures contract, the Fund is required to deposit cash, U.S. government and agency obligations, or other liquid assets with the futures clearing broker in accordance with the initial margin requirements of the broker or exchange. In addition, the Fund maintains cash or securities in an amount that at least equals the net amount payable in the event the Fund must deliver the full amount of the contract. Futures contracts are marked to market daily and an appropriate payable or receivable for the change in value ("variation margin") is recorded by the Fund. The payable or receivable is settled on the following business day. Gains or losses are recognized but not considered realized until the contracts expire or are closed. Futures contracts involve, to varying degrees, risk of loss in excess of the variation margin disclosed in the Statement of Assets and Liabi lities. Under some circumstances, futures exchanges may establish daily limits on the amount that the price of a futures contract can vary from the previous day's settlement price, thereby effectively preventing liquidation of unfavorable positions. Losses may arise from changes in the value of the underlying instrument if the Fund is unable to liquidate a futures position due to an illiquid secondary market for the contract or the imposition of price limits, or if counterparties do not perform under the contract terms. Futures contracts are generally valued at the settlement price established each day by the board of trade or exchange on which they are traded. Futures contracts outstanding at the end of the period are listed in the Fund's Schedule of Investments.
Swap agreements
The Fund may enter into various types of swap agreements, including without limitation, interest rate, total return, credit default and variance swap agreements. A swap agreement is an agreement to exchange the return generated by one instrument for the return generated by another instrument. When entering into a swap agreement, the Fund and/or the swap counterparty may post or receive cash or securities as collateral. The party posting the collateral typically receives the interest associated with or payments related to the collateral and has the risk of loss related to the collateral.
Interest rate swap agreements involve an exchange by the parties of their respective commitments to pay or right to receive interest, e.g., an exchange of floating rate interest payments for fixed rate interest payments with respect to the notional amount of principal.
Total return swap agreements involve a commitment by one party to pay interest to the other party in exchange for a payment to it from the other party based on the return of a reference instrument (e.g., a security or basket of securities), both based on notional amounts. To the extent the return of the reference instrument exceeds or falls short of the interest payments, one party will receive a payment from or make a payment to the other party.
In a credit default swap agreement, one party makes payments to another party in exchange for the right to receive a specified return if a credit event occurs with respect to a referenced entity or entities. Buying credit default protection reduces the buyer's exposure in the event of an issuer's default (e.g., it reduces
18
GMO Tobacco-Free Core Fund
(A Series of GMO Trust)
Notes to Financial Statements — (Continued)
February 28, 2009
risk where a party owns a security issued by or otherwise has exposure to the issuer). Selling credit default protection subjects the seller to exposure to an issuer's default. A seller of credit default protection receives payments in return for its obligation to pay the principal amount of a debt security (or other agreed-upon value) to the other party upon the occurrence of a credit event (e.g., issuer default or similar event). If no credit event occurs, the seller has no payment obligations. For credit default swap agreements on asset-backed securities, a credit event may be triggered by such events as the issuer's failure to pay interest or principal, an agreement of the holders of an asset-backed security to a maturity extension, a rating downgrade on the security or a write-down on the collateral underlying the security. For credit default swap agreements on corporate or sovereign issuers, a credit event may be triggered by such events as the issuer's bankruptcy, failure to pay interest or principal, repudiation/moratorium or restructuring.
Variance swap agreements involve an agreement by two parties to exchange cash flows based on the measured variance (or square of volatility) of a specified underlying asset. One party agrees to exchange a "fixed rate" or strike price payment for the "floating rate" or realized price variance on the underlying asset with respect to the notional amount. At inception, the strike price chosen is generally fixed at a level such that the fair value of the swap is zero. At the expiration date, the amount paid by one party to the other is the difference between the realized price variance of the underlying asset and the strike price multiplied by the notional amount. A receiver of the realized price variance would receive a payment when the realized price variance of the underlying asset is greater than the strike price and would make a payment when that variance is less than the strike price. A payer of the realized price variance woul d make a payment when the realized price variance of the underlying asset is greater than the strike price and would receive a payment when that variance is less than the strike price. This type of agreement is essentially a forward contract on the future realized price variance of the underlying asset.
The Fund prices its swap agreements daily using models that may incorporate quotations from market makers and records the change in value, if any, as unrealized gain or loss in the Statement of Operations. Payments received or made on swap agreements are recorded as realized gain or loss in the Statement of Operations. Gains or losses are realized upon termination of the swap agreements.
Swap agreements often are not actively traded on financial markets. The values assigned to them may differ significantly from the values that would be realized upon termination, and the differences could be material. Entering into swap agreements involves credit, legal, market and documentation risk that is not reflected in the amounts reported in the Statement of Assets and Liabilities. Such risks include the possibility that the party with whom the Fund contracts may default on its obligations to perform or disagree as to the meaning of contractual terms, or that the collateral that party posts may be insufficient or not timely received by the Fund. Credit risk may be particularly acute in an environment where financial services firms are exposed to systemic risks of the type evidenced by the insolvency of Lehman Brothers and subsequent market disruptions. The Fund had no swap agreements outstanding at the end of the period.
19
GMO Tobacco-Free Core Fund
(A Series of GMO Trust)
Notes to Financial Statements — (Continued)
February 28, 2009
Repurchase agreements
The Fund may enter into repurchase agreements. Under a repurchase agreement the Fund acquires a security for cash and obtains a simultaneous commitment from the seller to repurchase the security at an agreed upon price and date. The Fund, through its custodian, takes possession of securities collateralizing the repurchase agreement. The collateral is marked to market daily to ensure that the market value of the underlying assets is at least equal to the amount owed to the Fund in the event of default by the seller. If the seller of a repurchase agreement defaults or enters into insolvency proceedings and the value of the collateral declines, the Fund's recovery of cash may be delayed or limited. The Fund had no repurchase agreements outstanding at the end of the period.
Securities lending
The Fund may lend its securities to qualified brokers. The loans are collateralized with cash or liquid securities with a market value at least equal to the market value of the securities upon entering into the loan. As with other extensions of credit, the Fund may bear the risk of loss with respect to the investment of the collateral, the risk of delay in and/or inability to exercise its rights with respect to the collateral, and the risk of delay in recovery or loss of rights in the loaned securities should the borrower of the securities fail financially. If a loan is collateralized by U.S. government securities, the Fund receives a fee from the borrower. If a loan is collateralized by cash, the Fund typically invests the cash collateral for its own account. For the year from March 1, 2008 through February 28, 2009, the Fund did not participate in securities lending.
Taxes and distributions
The Fund intends to qualify each tax year as a regulated investment company under Subchapter M of the Internal Revenue Code of 1986, as amended (the "Code"). The Fund intends to distribute substantially all of its net investment income and all of its net realized short-term and long-term capital gain, if any, after giving effect to any available capital loss carryforwards for U.S. federal income tax purposes. Therefore, no provision for U.S. federal income or excise tax is necessary.
The Fund's policy is to declare and pay distributions from net investment income, if any, quarterly, and from net realized short-term and long-term capital gain, if any, at least annually. All distributions are paid in shares of the Fund, at net asset value, unless the shareholder elects to receive cash distributions. Distributions to shareholders are recorded by the Fund on the ex-dividend date.
Income and capital gain distributions are determined in accordance with U.S. federal income tax regulations, which may differ from U.S. GAAP. Certain capital accounts in the financial statements are periodically adjusted for permanent differences in order to reflect their tax character. These adjustments have no impact on net assets or net asset value per share. Temporary differences that arise from recognizing certain items of income, expense, gain or loss in different periods for financial statement and tax purposes will reverse at some time in the future. Distributions in excess of net investment income or net realized
20
GMO Tobacco-Free Core Fund
(A Series of GMO Trust)
Notes to Financial Statements — (Continued)
February 28, 2009
gains are temporary over-distributions for financial statement purposes resulting from differences in the recognition or classification of income or distributions for financial statement and tax purposes.
U.S. GAAP and tax accounting differences primarily relate to capital loss carryforwards, losses on wash sale transactions, derivative contract transactions and post-October capital losses.
The following reclassification represents the amount necessary to report the stated components of net assets on a tax basis, excluding certain temporary differences, as of February 28, 2009. The financial highlights exclude these adjustments.
| Accumulated Undistributed Net Investment Income | Accumulated Net Realized Loss | Paid-in Capital | |||||||||
| $ | — | $ | 25,163 | $ | (25,163 | ) | |||||
The tax character of distributions declared to shareholders is as follows:
| 2/28/2009 | 2/29/2008 | ||||||||||
| Ordinary income (including any net short-term capital gain) | $ | 407,510 | $ | 8,717,495 | |||||||
| Net long-term capital gain | — | 15,834,449 | |||||||||
| Total distributions | $ | 407,510 | $ | 24,551,944 | |||||||
Distributions in excess of tax basis earnings and profits, if significant, are reported in the financial statements as a return of capital for tax purposes.
As of February 28, 2009, the components of distributable earnings on a tax basis consisted of the following:
| Undistributed ordinary income (including any net short-term capital gain) | $ | 70,534 | |||||
As of February 28, 2009, the Fund elected to defer to March 1, 2009 post-October capital losses of $2,211,392.
As of February 28, 2009, the Fund had capital loss carryforwards available to offset future realized gains if any, to the extent permitted by the Code. Utilization of the capital loss carryforwards could be subject to limitations imposed by the Code related to share ownership activity. Such losses expire as follows:
| 2/28/2017 | $ | (6,261,595 | ) | ||||
| Total | $ | (6,261,595 | ) | ||||
21
GMO Tobacco-Free Core Fund
(A Series of GMO Trust)
Notes to Financial Statements — (Continued)
February 28, 2009
As of February 28, 2009, the approximate cost for U.S. federal income tax purposes and gross and net unrealized appreciation (depreciation) in value of investments were as follows:
| Aggregate Cost | Gross Unrealized Appreciation | Gross Unrealized (Depreciation) | Net Unrealized Appreciation (Depreciation) | ||||||||||||
| $ | 25,341,081 | $ | 37,789 | $ | (8,563,803 | ) | $ | (8,526,014 | ) | ||||||
The Fund is subject to the provisions of Financial Accounting Standards Board Interpretation No. 48 ("FIN 48"), Accounting for Uncertainty in Income Taxes — an Interpretation of FASB Statement No. 109. FIN 48 sets forth a minimum threshold for financial statement recognition of a tax position taken or expected to be taken in a tax return that could affect the Fund's financial statements. The Fund did not have any unrecognized tax benefits or liabilities at February 28, 2009, nor did it have any increases or decreases in unrecognized tax benefits or liabilities for the period then ended. The Fund is subject to examination prior to the expiration of the statute of limitations by U.S. federal and state tax authorities for tax returns filed.
Security transactions and related investment income
Security transactions in the financial statements are accounted for on the trade date. Dividend income, net of applicable foreign withholding taxes, if any, is recorded on the ex-dividend date or, if later, when the Fund is informed of the ex-dividend date. Interest income is recorded on the accrual basis and is adjusted for the amortization of premiums and accretion of discounts. Principal on inflation indexed securities is adjusted for inflation and any increase or decrease is recorded as interest income or loss. Income is not recognized on securities for which collection is not expected. Non-cash dividends, if any, are recorded at the fair market value of the asset received. In determining the net gain or loss on securities sold, the Fund uses the identified cost basis for the purposes of determining the cost basis.
Expenses
The majority of the expenses of the Trust are directly identifiable to an individual fund. Expenses that are not readily identifiable to a specific fund are allocated taking into consideration, among other things, the nature and type of expense and the relative size of the funds.
State Street Bank and Trust Company ("State Street") serves as custodian, fund accounting agent and transfer agent of the Fund. State Street's fees may be reduced by an earnings allowance calculated on the average daily cash balances the Fund maintains with State Street. The Fund receives the benefit of the earnings allowance. In addition, Goldman Sachs Agency Lending, the Fund's securities lending agent, has agreed to reimburse the Fund for certain transactional expenses related to securities lending activity. Credit balances or expense reimbursements used to reduce fees, if any, are reported as a reduction of expenses in the Statement of Operations.
22
GMO Tobacco-Free Core Fund
(A Series of GMO Trust)
Notes to Financial Statements — (Continued)
February 28, 2009
Recently issued accounting pronouncement
In March 2008, FASB issued Statement of Financial Accounting Standards No. 161, Disclosures about Derivative Instruments and Hedging Activities ("SFAS 161"). SFAS 161 is effective for fiscal years and interim periods beginning after November 15, 2008. SFAS 161 requires enhanced disclosures about the Fund's derivative and hedging activities. The Manager is currently evaluating the impact the adoption of SFAS 161 will have on the Fund's financial statement disclosures.
3. Fees and other transactions with affiliates
GMO receives a management fee for the services it provides to the Fund. That fee is paid monthly at the annual rate of 0.33% of average daily net assets. The Fund has adopted a Shareholder Service Plan under which the Fund pays GMO a shareholder service fee for client and shareholder service, reporting, and other support. Pursuant to the Shareholder Service Plan, the shareholder service fee is calculated based on average daily net assets at the annual rate of 0.15% for Class III shares.
Through at least June 30, 2009, the Manager has contractually agreed to reimburse the Fund for Fund expenses incurred through that date to the extent the Fund's total annual operating expenses (excluding "Excluded Expenses", as defined below) exceed 0.33% of the Fund's average daily net assets. Excluded Expenses include shareholder service fees, fees and expenses of the independent Trustees of the Trust, fees and expenses for legal services not approved by the Manager for the Trust, compensation and expenses of the Trust's Chief Compliance Officer ("CCO") (excluding any employee benefits), brokerage commissions, securities lending fees and expenses, interest expense, transfer taxes, and other investment-related costs (including expenses associated with investments in any company that is an investment company or would be an investment company under the 1940 Act, but for the exceptions to the definition of investment company provi ded in Section 3(c)(1) and 3(c)(7) of the 1940 Act), hedging transaction fees, extraordinary, non-recurring and certain other unusual expenses (including taxes).
The Fund's portion of the fees paid by the Trust to the Trust's independent Trustees and CCO during the year ended February 28, 2009 was $272 and $211, respectively. The compensation and expenses of the CCO are included in miscellaneous expenses in the Statement of Operations. The Fund paid no remuneration to any other officer of the Trust.
4. Purchases and sales of securities
Cost of purchases and proceeds from sales of securities, excluding short-term investments, for the year ended February 28, 2009 aggregated $15,945,063 and $33,362,893, respectively.
5. Guarantees
In the normal course of business the Fund enters into contracts with third-party service providers that contain a variety of representations and warranties and that provide general indemnifications. The Fund's maximum exposure under these arrangements is unknown, as it involves future claims that may be made
23
GMO Tobacco-Free Core Fund
(A Series of GMO Trust)
Notes to Financial Statements — (Continued)
February 28, 2009
against the Fund that have not yet occurred. Based on experience, management is of the view that the risk of loss in connection with its indemnification obligations is remote; however, there can be no assurance that such obligations will not result in material liabilities that adversely affect the Fund.
6. Principal shareholders and related parties
As of February 28, 2009, 86.54% of the outstanding shares of the Fund were held by two shareholders. On that date, no other shareholder owned more than 10% of the outstanding shares of the Fund. Redemptions from (or investments into) the Fund or on behalf of this large shareholder may have a material effect on the Fund.
As of February 28, 2009, no shares of the Fund were held by senior management of the Manager and GMO Trust officers and 10.46% of the Fund's shares were held by accounts for which the Manager had investment discretion.
7. Share transactions
The Declaration of Trust permits the Trust to issue an unlimited number of shares of beneficial interest (without par value). Transactions in Fund shares were as follows:
| Year Ended February 28, 2009 | Year Ended February 29, 2008 | ||||||||||||||||||
| Class III: | Shares | Amount | Shares | Amount | |||||||||||||||
| Shares sold | 431 | $ | 3,713 | 443,012 | $ | 4,612,176 | |||||||||||||
| Shares issued to shareholders in reinvestment of distributions | 41,507 | 366,324 | 1,466,326 | 17,114,056 | |||||||||||||||
| Shares repurchased | (1,971,521 | ) | (19,128,012 | ) | (12,009,243 | ) | (144,470,644 | ) | |||||||||||
| Net increase (decrease) | (1,929,583 | ) | $ | (18,757,975 | ) | (10,099,905 | ) | $ | (122,744,412 | ) | |||||||||
| Year Ended February 28, 2009 | Period Ended June 21, 2007* | ||||||||||||||||||
| Class IV: | Shares | Amount | Shares | Amount | |||||||||||||||
| Shares sold | — | $ | — | — | $ | — | |||||||||||||
| Shares issued to shareholders in reinvestment of distributions | — | — | 469,828 | 6,184,300 | |||||||||||||||
| Shares repurchased | — | — | (11,190,045 | ) | (147,368,247 | ) | |||||||||||||
| Net increase (decrease) | — | $ | — | (10,720,217 | ) | $ | (141,183,947 | ) | |||||||||||
* Effective June 21, 2007, all shareholders redeemed or exchanged out of Class IV.
24
Report of Independent Registered Public Accounting Firm
To the Trustees of GMO Trust and the Shareholders of
GMO Tobacco-Free Core Fund:
In our opinion, the accompanying statement of assets and liabilities, including the schedule of investments, and the related statements of operations and of changes in net assets and the financial highlights present fairly, in all material respects, the financial position of GMO Tobacco-Free Core Fund (the "Fund") at February 28, 2009, the results of its operations for the year then ended, the changes in its net assets for each of the two years in the period then ended and the financial highlights for each of the five years in the period then ended, in conformity with accounting principles generally accepted in the United States of America. These financial statements and financial highlights (hereafter referred to as "financial statements") are the responsibility of the Fund's management. Our responsibility is to express an opinion on these financial statements based on our audits. We conducted our audits of these financial stat ements in accordance with the standards of the Public Company Accounting Oversight Board (United States). Those standards require that we plan and perform the audit to obtain reasonable assurance about whether the financial statements are free of material misstatement. An audit includes examining, on a test basis, evidence supporting the amounts and disclosures in the financial statements, assessing the accounting principles used and significant estimates made by management, and evaluating the overall financial statement presentation. We believe that our audits, which included confirmation of securities at February 28, 2009 by correspondence with the custodian and brokers, provide a reasonable basis for our opinion.
PricewaterhouseCoopers LLP
Boston, Massachusetts
April 29, 2009
25
GMO Tobacco-Free Core Fund
(A Series of GMO Trust)
Fund Expenses
February 28, 2009 (Unaudited)
Expense Examples: The following information is in relation to expenses for the six month period ended February 28, 2009.
As a shareholder of the Fund, you may incur two types of costs: (1) transaction costs, and (2) ongoing costs, including management fees, shareholder service fees, and other Fund expenses. This example is intended to help you understand your ongoing costs (in dollars) of investing in the Fund and to compare these costs with the ongoing costs of investing in other mutual funds.
These examples are based on an investment of $1,000 invested at the beginning of the period and held for the entire period, September 1, 2008 through February 28, 2009.
Actual Expenses
The first line of the table below provides information about actual account values and actual expenses. You may use the information in this line, together with the amount you invested, to estimate the expenses that you paid over the period. Simply divide your account value by $1,000 (for example, a $10,000,000 account value divided by $1,000 = 10,000), then multiply the result by the number in the first line under the heading entitled "Net Expense Incurred" to estimate the expenses you paid on your account during this period.
Hypothetical Example for Comparison Purposes
The second line of the table below provides information about hypothetical account values and hypothetical expenses based on the Fund's actual expense ratio and an assumed rate of return of 5% per year before expenses, which is not the Fund's actual return. The hypothetical account values and expenses may not be used to estimate the actual ending account balance or expenses you paid for the period. You may use this information to compare the ongoing costs of investing in the Fund with other funds. To do so, compare this 5% hypothetical example with the 5% hypothetical examples that appear in the shareholder reports of other funds.
Please note that the expenses shown in the table are meant to highlight your ongoing costs only and do not reflect any transactional costs, such as purchase premiums and redemption fees. Therefore, the second line of the table is useful in comparing ongoing costs only, and will not help you determine the relative total costs of owning different funds. In addition, if these transactional costs were included, your costs would have been higher.
| Annualized Net Expense Ratio | Beginning Account Value | Ending Account Value | Net Expense Incurred* | ||||||||||||||||
| Class III | |||||||||||||||||||
| 1) Actual | 0.48 | % | $ | 1,000.00 | $ | 664.00 | $ | 1.98 | |||||||||||
| 2) Hypothetical | 0.48 | % | $ | 1,000.00 | $ | 1,022.41 | $ | 2.41 | |||||||||||
* Expenses are calculated using the Class's annualized net expense ratio for the six months ended February 28, 2009, multiplied by the average account value over the period, multiplied by 181 days in the period, divided by 365 days in the year.
26
GMO Tobacco-Free Core Fund
(A Series of GMO Trust)
Tax Information for the Tax Year Ended February 28, 2009 (Unaudited)
The Fund will notify shareholders of amounts for use in preparing 2009 income tax forms in January 2010.
For taxable, non-corporate shareholders, 100.00% of the income and short-term capital gains, if any, distributed in the Fund's fiscal year ended February 28, 2009 represents qualified dividend income subject to the 15% rate category.
For corporate shareholders, 100.00% of the income and short-term capital gains, if any, distributed in the Fund's fiscal year ended February 28, 2009 qualified for the dividends-received deduction.
27
Trustees and Officers (Unaudited)
The following tables list the Trust's Trustees and Officers as of the date of this report; their address and date of birth ("DOB"); their position with the Trust; the length of time holding that position with the Trust; their principal occupation(s) during the past five years; the number of portfolios in the fund complex they oversee; and other directorships they hold in companies subject to registration or reporting requirements of the Securities Exchange Act of 1934 (generally called "public companies") or in registered investment companies. The Trust's Statement of Additional Information ("SAI") includes additional information about the Trust's trustees, including changes subsequent to the date of the report. The SAI is available, without charge, upon request by writing GMO, c/o GMO Trust, 40 Rowes Wharf, Boston, MA 02110.
Independent Trustees:
| Name, Address, and DOB | Position(s) Held with Trust | Term of Office1 and Length of Time Served | Principal Occupation(s) During Past Five Years | Number of Portfolios in Fund Complex Overseen by Trustee | Other Directorships Held by Trustee | ||||||||||||||||||
| Donald W. Glazer, Esq. c/o GMO Trust 40 Rowes Wharf Boston, MA 02110 DOB: 07/26/1944 | Chairman of the Board of Trustees | Chairman of the Board of Trustees since March 2005; Lead Independent Trustee (September 2004 – March 2005); Trustee since December 2000. | Consultant – Law and Business2; Author of Legal Treatises. | 59 | None. | ||||||||||||||||||
1 Each Trustee is elected to serve during the continued lifetime of the Trust until he/she dies, resigns or is removed, or if sooner, until the next meeting of Shareholders called for the purpose of electing Trustees and until the election and qualification of his/her successor.
2 As part of Mr. Glazer's work as a consultant, he provides part-time consulting services to Goodwin Procter LLP ("Goodwin"). Goodwin has provided legal services to Renewable Resources, LLC, an affiliate of GMO; GMO, in connection with its relationship with Renewable Resources; and funds managed by Renewable Resources. Mr. Glazer has represented that he has no financial interest in, and is not involved in the provision of, such legal services. In the calendar years ended December 31, 2007 and December 31, 2008, these entities paid $789,416 and $183,864 respectively, in legal fees and disbursements to Goodwin. In correspondence with the Staff of the Securities and Exchange Commission beginning in August 2006, the Independent Trustees' legal counsel provided the Staff with information regarding Mr. Glazer's relationship with Goodwin and h is other business activities. On September 11, 2007, based on information that had been given to the Staff as of that date, the Staff provided oral no-action assurance consistent with the opinion of the Independent Trustees' legal counsel that Mr. Glazer is not an "interested person" of the Trust.
28
Independent Trustees — (Continued)
| Name, Address, and DOB | Position(s) Held with Trust | Term of Office1 and Length of Time Served | Principal Occupation(s) During Past Five Years | Number of Portfolios in Fund Complex Overseen by Trustee | Other Directorships Held by Trustee | ||||||||||||||||||
| W. Nicholas Thorndike c/o GMO Trust 40 Rowes Wharf Boston, MA 02110 DOB: 03/28/1933 | Trustee | Since March 2005. | Director or trustee of various corporations and charitable organizations, including Courier Corporation (a book publisher and manufacturer) (July 1989 – present); Putnam Funds (December 1992 – June 2004); and Providence Journal (a newspaper publisher) (December 1986 – December 2003). | 59 | Director of Courier Corporation (a book publisher and manufacturer); Member of the Investment Committee of Partners HealthCare System, Inc.3 | ||||||||||||||||||
| Peter Tufano c/o GMO Trust 40 Rowes Wharf Boston, MA 02110 DOB: 04/22/1957 | Trustee | Since December 2008. | Sylvan C. Coleman Professor of Financial Management, Harvard Business School (since 1989). | 59 | Trustee of State Street Navigator Securities Lending Trust (3 Portfolios). | ||||||||||||||||||
1 Each Trustee is elected to serve during the continued lifetime of the Trust until he/she dies, resigns or is removed, or if sooner, until the next meeting of Shareholders called for the purpose of electing Trustees and until the election and qualification of his/her successor.
3 Partners HealthCare System, Inc. is a client of the Manager.
29
Principal Officers:
| Name, Address, and DOB | Position(s) Held with Trust | Term of Office4 and Length of Time Served | Principal Occupation(s) During Past Five Years5 | ||||||||||||
| J.B. Kittredge DOB: 08/22/1954 | President and Chief Executive Officer | Since March 2009. | General Counsel, Grantham, Mayo, Van Otterloo & Co. LLC (October 2005 – Present); Partner, Ropes & Gray LLP. | ||||||||||||
| Sheppard N. Burnett c/o GMO Trust 40 Rowes Wharf Boston, MA 02110 DOB: 10/24/1968 | Treasurer and Chief Financial Officer | Chief Financial Officer since March 2007; Treasurer since November 2006; Assistant Treasurer, September 2004 – November 2006. | Fund Administration Staff, Grantham, Mayo, Van Otterloo & Co. LLC (June 2004 – present); Vice President, Director of Tax, Columbia Management Group (2002 – 2004). | ||||||||||||
| Brent C. Arvidson c/o GMO Trust 40 Rowes Wharf Boston, MA 02110 DOB: 06/26/1969 | Assistant Treasurer | Since August 1998. | Senior Fund Administrator, Grantham, Mayo, Van Otterloo & Co. LLC. | ||||||||||||
| John L. Nasrah c/o GMO Trust 40 Rowes Wharf Boston, MA 02110 DOB: 05/27/1977 | Assistant Treasurer | Since March 2007. | Fund Administrator, Grantham, Mayo, Van Otterloo & Co. LLC (September 2004 – present); Tax Analyst, Bain & Company, Inc. (June 2003 – September 2004). | ||||||||||||
| Mahmoodur Rahman c/o GMO Trust 40 Rowes Wharf Boston, MA 02110 DOB: 11/30/1967 | Assistant Treasurer | Since September 2007. | Fund Administrator, Grantham, Mayo, Van Otterloo & Co. LLC (April 2007 – present); Vice President and Senior Tax Manager, Massachusetts Financial Services Company (January 2000 – April 2007). | ||||||||||||
| Michael E. Gillespie c/o GMO Trust 40 Rowes Wharf Boston, MA 02110 DOB: 02/18/1958 | Chief Compliance Officer | Since March 2005. | Vice President of Compliance (June 2004 – February 2005) and Director of Domestic Compliance (March 2002 – June 2004), Fidelity Investments. | ||||||||||||
4 Each officer is elected to hold such office until his or her successor is duly elected and qualified to carry out the duties and responsibilities of the office, or until he or she resigns or is removed from office.
5 Each of Messrs. Burnett, Arvidson, Bohan, and Pottle serves as an officer and/or director of certain pooled investment vehicles of which GMO or an affiliate of GMO serves as the investment adviser.
30
Principal Officers — (Continued)
| Name, Address, and DOB | Position(s) Held with Trust | Term of Office4 and Length of Time Served | Principal Occupation(s) During Past Five Years5 | ||||||||||||
| Jason B. Harrison c/o GMO Trust 40 Rowes Wharf Boston, MA 02110 DOB: 01/29/1977 | Vice President and Clerk | Vice President since November 2006; Clerk since March 2006. | Legal Counsel, Grantham, Mayo, Van Otterloo & Co. LLC (since February 2006) and Attorney, Ropes & Gray LLP (September 2002 – February 2006). | ||||||||||||
| David L. Bohan c/o GMO Trust 40 Rowes Wharf Boston, MA 02110 DOB: 06/21/1964 | Vice President and Assistant Clerk | Vice President since March 2005; Assistant Clerk since March 2006. | Legal Counsel, Grantham, Mayo, Van Otterloo & Co. LLC. | ||||||||||||
| Gregory L. Pottle c/o GMO Trust 40 Rowes Wharf Boston, MA 02110 DOB: 07/09/1971 | Vice President and Assistant Clerk | Since November 2006. | Legal Counsel, Grantham, Mayo, Van Otterloo & Co. LLC. | ||||||||||||
| Anne K. Trinque c/o GMO Trust 40 Rowes Wharf Boston, MA 02110 DOB: 04/15/1978 | Vice President and Assistant Clerk | Since September 2007. | Legal Counsel, Grantham, Mayo, Van Otterloo & Co. LLC (January 2007 – present); Attorney, Goodwin Procter LLP (September 2003 – January 2007). | ||||||||||||
| Cheryl Wakeham c/o GMO Trust 40 Rowes Wharf Boston, MA 02110 DOB: 10/29/1958 | Vice President and Anti-Money Laundering Officer | Since December 2004. | Manager, Client Service Administration, Grantham, Mayo, Van Otterloo & Co. LLC. | ||||||||||||
4 Each officer is elected to hold such office until his or her successor is duly elected and qualified to carry out the duties and responsibilities of the office, or until he or she resigns or is removed from office.
5 Each of Messrs. Burnett, Arvidson, Bohan, and Pottle serves as an officer and/or director of certain pooled investment vehicles of which GMO or an affiliate of GMO serves as the investment adviser.
31
GMO Emerging Markets Fund
(A Series of GMO Trust)
Annual Report
February 28, 2009
For a free copy of the Fund's proxy voting guidelines, shareholders may call 1-617-346-7646 (collect) or visit the Securities and Exchange Commission's website at www.sec.gov. Information regarding how the Fund voted proxies relating to portfolio securities during the most recent 12-month period ended June 30 is available on GMO's website at www.gmo.com, or on the Securities and Exchange Commission's website at www.sec.gov.
The Fund files its complete schedule of portfolio holdings with the Securities and Exchange Commission for the first and third quarter of each fiscal year on Form N-Q, which is available on the Commission's website at www.sec.gov. The Fund's Form N-Q may be reviewed and copied at the Commission's Public Reference Room in Washington, D.C. Information on the operation of the Public Reference Room may be obtained by calling 1-800-SEC-0330. The Fund has a policy with respect to disclosure of portfolio holdings under which it may also make available on GMO's website at www.gmo.com a complete schedule of portfolio holdings.
This report is prepared for the general information of shareholders. It is authorized for distribution to prospective investors only when preceded or accompanied by a prospectus for the GMO Trust, which contains a complete discussion of the risks associated with an investment in this Fund and other important information. The GMO Trust prospectus can be obtained at www.gmo.com.
GMO Emerging Markets Fund
(A Series of GMO Trust)
Portfolio Management
Day-to-day management of the Fund's portfolio is the responsibility of the Emerging Markets team at Grantham, Mayo, Van Otterloo & Co. LLC.
Management Discussion and Analysis of Fund Performance
The Class III shares of the GMO Emerging Markets Fund returned -58.6% for the fiscal year ended February 28, 2009, as compared to -56.3% for the S&P/IFCI Investable Composite Index. Consistent with the Fund's investment objectives and policies, the Fund was invested substantially in emerging markets equities throughout the fiscal year.
Country selection detracted 0.9% from performance during the period. The Fund's underweights in Russia and India and overweight in Brazil contributed to performance. The Fund's overweights in Korea, Hungary and Pakistan and underweight in China, Chile, and Israel detracted from performance.
Stock selection was successful in Taiwan, Poland, and Egypt while it detracted from performance in Korea, Russia, Israel, South Africa, Indonesia, Philippines, and Brazil.
The views expressed herein are exclusively those of Grantham, Mayo, Van Otterloo & Co. LLC Management as of the date of this report and are subject to change. GMO disclaims any responsibility to update such views. They are not meant as investment advice.
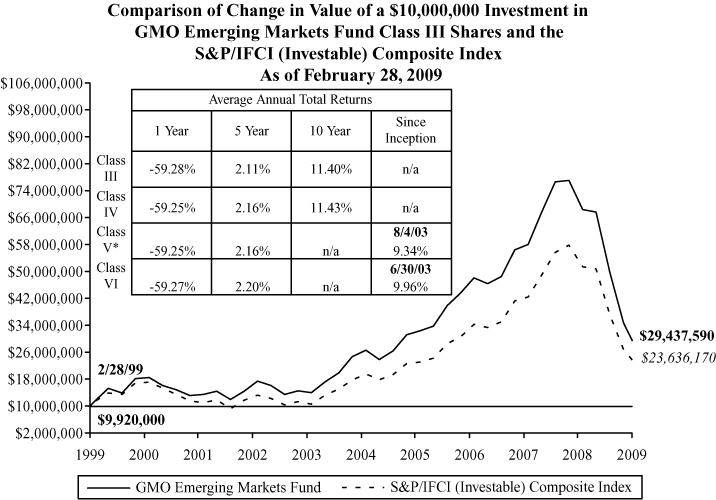
Performance data quoted represents past performance and is not indicative of future results. The investment return and principal value of an investment will fluctuate so that an investor's shares, when redeemed, may be worth more or less than their original cost. Current performance data may be lower or higher than the performance data provided herein. To obtain performance information to the most recent month-end, visit www.gmo.com. Performance shown is net of all fees after reimbursement from the Manager. Each performance figure assumes a purchase at the beginning and redemption at the end of the stated period and reflects a transaction fee of .80% on the purchase and .80% on the redemption. Transaction fees are retained by the Fund to cover trading costs. Returns would have been lower had certain expenses not been reimbursed during the periods shown and do not include the effect of taxes on distributions and redemptions. All information is unaudited. Performance for Class IV, V and VI shares will vary due to different fees
* For the period from 10/26/04 to 2/11/05, no Class V shares were outstanding. Performance for that period is that of Class IVshares, which have higher expenses. Therefore, the performance shown is lower than it would have been if Class V shares had been outstanding.
GMO Emerging Markets Fund
(A Series of GMO Trust)
Investments Concentration Summary
February 28, 2009 (Unaudited)
| Asset Class Summary | % of Total Net Assets | ||||||
| Common Stocks | 80.9 | % | |||||
| Preferred Stocks | 11.7 | ||||||
| Investment Funds | 3.9 | ||||||
| Short-Term Investments | 2.2 | ||||||
| Forward Currency Contracts | 0.0 | ||||||
| Private Equity Securities | 0.6 | ||||||
| Debt Obligations | 0.2 | ||||||
| Convertible Securities | 0.1 | ||||||
| Mutual Funds | 0.0 | ||||||
| Rights and Warrants | 0.0 | ||||||
| Other | 0.4 | ||||||
| 100.0 | % | ||||||
| Country Summary | % of Equity Investments | ||||||
| Brazil | 18.5 | % | |||||
| South Korea | 17.5 | ||||||
| Taiwan | 13.4 | ||||||
| China | 11.4 | ||||||
| South Africa | 7.4 | ||||||
| Turkey | 5.3 | ||||||
| Thailand | 4.8 | ||||||
| Russia | 3.9 | ||||||
| United States* | 3.7 | ||||||
| Malaysia | 2.8 | ||||||
| India | 2.0 | ||||||
| Mexico | 1.6 | ||||||
| Israel | 1.4 | ||||||
| Egypt | 1.1 | ||||||
| Poland | 1.1 | ||||||
| Hungary | 0.8 | ||||||
| Chile | 0.7 | ||||||
| Indonesia | 0.7 | ||||||
| Philippines | 0.7 | ||||||
| Czech Republic | 0.6 | ||||||
| Morocco | 0.5 | ||||||
| Argentina | 0.1 | ||||||
| Lebanon | 0.0 | ||||||
| Peru | 0.0 | ||||||
| Sri Lanka | 0.0 | ||||||
| Ukraine | 0.0 | ||||||
| 100.0 | % | ||||||
* Represents an investment to equitize cash in the iShares® MSCI Emerging Markets Index Fund, which is a separate investment portfolio of iShares, Inc., a registered investment company. The iShares® MSCI Emerging Markets Index Fund invests in global emerging markets and seeks investment results that correspond generally to the price and yield performance, before fees and expenses, of the MSCI Emerging Markets Index. iShares® is a registered trademark of Barclays Global Investors, N.A. ("BGI"). Neither BGI nor the iShares® Funds make any representations regarding the advisability of investing in the iShares® MSCI Emerging Markets Index Fund.
1
GMO Emerging Markets Fund
(A Series of GMO Trust)
Investments Concentration Summary — (Continued)
February 28, 2009 (Unaudited)
| Industry Sector Summary | % of Equity Investments | ||||||
| Financials | 22.1 | % | |||||
| Information Technology | 13.0 | ||||||
| Energy | 11.7 | ||||||
| Telecommunication Services | 11.5 | ||||||
| Materials | 11.1 | ||||||
| Industrials | 7.6 | ||||||
| Consumer Discretionary | 7.3 | ||||||
| Utilities | 5.3 | ||||||
| Consumer Staples | 4.6 | ||||||
| Miscellaneous* | 3.9 | ||||||
| Health Care | 1.9 | ||||||
| 100.0 | % | ||||||
* Represents an investment to equitize cash in the iShares® MSCI Emerging Markets Index Fund, which is a separate investment portfolio of iShares, Inc., a registered investment company. The iShares® MSCI Emerging Markets Index Fund invests in global emerging markets and seeks investment results that correspond generally to the price and yield performance, before fees and expenses, of the MSCI Emerging Markets Index. iShares® is a registered trademark of Barclays Global Investors, N.A. ("BGI"). Neither BGI nor the iShares® Funds make any representations regarding the advisability of investing in the iShares® MSCI Emerging Markets Index Fund.
2
GMO Emerging Markets Fund
(A Series of GMO Trust)
Schedule of Investments
(showing percentage of total net assets)
February 28, 2009
| Shares | Description | Value ($) | |||||||||||||
| COMMON STOCKS — 80.9% | |||||||||||||||
| Argentina — 0.1% | |||||||||||||||
| 1,162,846 | Petrobras Energia Participaciones SA Sponsored ADR | 5,837,487 | |||||||||||||
| 127,710 | Telecom Argentina SA Sponsored ADR * | 910,572 | |||||||||||||
| Total Argentina | 6,748,059 | ||||||||||||||
| Brazil — 6.9% | |||||||||||||||
| 770,588 | Aes Tiete SA | 4,704,602 | |||||||||||||
| 3,628,300 | Banco do Brasil SA | 21,013,613 | |||||||||||||
| 120,110 | Banco Itau Holding Financeira SA | 1,102,610 | |||||||||||||
| 288,800 | Banco Nossa Caixa SA | 8,441,549 | |||||||||||||
| 131,700 | Brasil Telecom Participacoes SA | 3,323,616 | |||||||||||||
| 179,400 | Cia de Saneamento de Minas Gerais-Copasa MG * | 1,559,641 | |||||||||||||
| 589,900 | Companhia de Concessoes Rodoviarias | 5,717,940 | |||||||||||||
| 1,660,102 | Companhia Saneamento Basico Sao Paulo | 16,688,489 | |||||||||||||
| 105,216 | Companhia Siderurgica Nacional SA | 1,379,327 | |||||||||||||
| 3,730,200 | Companhia Vale do Rio Doce | 48,152,243 | |||||||||||||
| 154,910 | Companhia Vale do Rio Doce ADR | 1,996,790 | |||||||||||||
| 1,747,230 | Companhia Vale do Rio Doce Sponsored ADR | 19,481,614 | |||||||||||||
| 631,200 | CPFL Energia SA | 8,301,096 | |||||||||||||
| 1,335,500 | Cyrela Brazil Realty SA | 3,931,555 | |||||||||||||
| 1,007,800 | EDP-Energias Do Brasil SA | 9,861,387 | |||||||||||||
| 1,688,192 | Electrobras (Centro) | 18,495,706 | |||||||||||||
| 2,925,400 | Empresa Brasileira de Aeronautica SA | 8,061,548 | |||||||||||||
| 421,800 | Fertilizantes Heringer SA * | 702,000 | |||||||||||||
| 1,358,200 | Gerdau SA | 5,673,839 | |||||||||||||
| 2,351,000 | JBS SA | 4,532,119 | |||||||||||||
| 1,993,400 | Natura Cosmeticos SA | 18,088,475 | |||||||||||||
| 295,300 | Perdigao SA | 3,656,366 | |||||||||||||
| 3,791,300 | Petroleo Brasileiro SA (Petrobras) | 51,842,230 | |||||||||||||
| 1,475,570 | Petroleo Brasileiro SA (Petrobras) ADR | 40,917,556 | |||||||||||||
| 2,634,900 | Redecard SA | 27,545,580 | |||||||||||||
| 422,104 | Souza Cruz SA | 8,472,439 | |||||||||||||
| 593,900 | Tele Norte Leste Participacoes SA | 8,816,363 | |||||||||||||
See accompanying notes to the financial statements.
3
GMO Emerging Markets Fund
(A Series of GMO Trust)
Schedule of Investments — (Continued)
(showing percentage of total net assets)
February 28, 2009
| Shares | Description | Value ($) | |||||||||||||
| Brazil — continued | |||||||||||||||
| 428,340 | Unibanco-Uniao de Bancos Brasileiros SA GDR | 22,415,032 | |||||||||||||
| 1,397,850 | Usinas Siderurgicas de Minas Gerais SA | 14,391,180 | |||||||||||||
| Total Brazil | 389,266,505 | ||||||||||||||
| Chile — 0.7% | |||||||||||||||
| 138,220 | AFP Provida SA Sponsored ADR | 2,335,918 | |||||||||||||
| 253,310 | Banco Santander Chile SA ADR | 8,848,118 | |||||||||||||
| 113,118 | Compania Cervecerias Unidas ADR | 3,013,463 | |||||||||||||
| 68,145 | Embotelladora Andina SA ADR A Shares | 847,724 | |||||||||||||
| 205,980 | Embotelladora Andina SA ADR B Shares | 2,945,514 | |||||||||||||
| 147,460 | Empresa Nacional de Electricidad SA Sponsored ADR | 5,346,900 | |||||||||||||
| 489,540 | Enersis SA Sponsored ADR | 7,059,167 | |||||||||||||
| 1,194,550 | Lan Airlines SA Sponsored ADR | 9,855,037 | |||||||||||||
| Total Chile | 40,251,841 | ||||||||||||||
| China — 11.0% | |||||||||||||||
| 13,105,990 | Advanced Semiconductor Manufacturing Co Class H * | 156,658 | |||||||||||||
| 185,980,000 | Bank of China Ltd Class H | 51,233,380 | |||||||||||||
| 26,154,880 | Chaoda Modern Agriculture Holdings Ltd | 14,946,079 | |||||||||||||
| 14,872,000 | China Agri-Industries Holdings Ltd * | 6,657,954 | |||||||||||||
| 13,034,000 | China Communication Services Corp Ltd Class H | 7,265,359 | |||||||||||||
| 44,356,000 | China Construction Bank Class H | 22,233,908 | |||||||||||||
| 7,466,000 | China Life Insurance Co Ltd Class H | 20,651,609 | |||||||||||||
| 9,840,000 | China Merchants Bank Co Ltd Class H | 14,276,739 | |||||||||||||
| 10,281,942 | China Mobile Ltd | 89,330,689 | |||||||||||||
| 375,649 | China Mobile Ltd Sponsored ADR | 16,284,384 | |||||||||||||
| 64,697,351 | China Petroleum & Chemical Corp Class H | 33,099,282 | |||||||||||||
| 7,952,000 | China Railway Construction Corp Ltd Class H * | 9,601,564 | |||||||||||||
| 22,780,000 | China Railway Group Ltd Class H * | 12,390,687 | |||||||||||||
| 6,218,000 | China Shipping Development Co Ltd Class H | 4,772,111 | |||||||||||||
| 26,648,000 | China Ting Group Holding Ltd | 1,502,961 | |||||||||||||
| 9,288,000 | CNPC Hong Kong Ltd | 3,122,847 | |||||||||||||
| 8,526,000 | Cosco Pacific Ltd | 6,150,615 | |||||||||||||
| 21,802,000 | Datang International Power Generation Co Ltd | 9,044,938 | |||||||||||||
See accompanying notes to the financial statements.
4
GMO Emerging Markets Fund
(A Series of GMO Trust)
Schedule of Investments — (Continued)
(showing percentage of total net assets)
February 28, 2009
| Shares | Description | Value ($) | |||||||||||||
| China — continued | |||||||||||||||
| 2,025,000 | Dongfang Electrical Machinery Co Ltd | 3,651,541 | |||||||||||||
| 27,852,000 | Dongfeng Motor Group Co Ltd | 10,102,534 | |||||||||||||
| 37,646,000 | Huaneng Power International Inc Class H | 24,522,751 | |||||||||||||
| 55,544,000 | Industrial and Commercial Bank of China Ltd Class H | 22,370,869 | |||||||||||||
| 4,849,500 | Kingboard Chemical Holdings Ltd | 7,849,183 | |||||||||||||
| 557,540 | LDK Solar Co Ltd ADR * | 2,854,605 | |||||||||||||
| 38,781,000 | Maoye International Holdings | 3,445,422 | |||||||||||||
| 902,766 | Mindray Medical International Ltd ADR | 16,475,480 | |||||||||||||
| 453,906 | Netease.Com Inc ADR * | 9,295,995 | |||||||||||||
| 131,890 | New Oriental Education & Technology Group Inc Sponsored ADR * | 5,904,715 | |||||||||||||
| 20,834,000 | Nine Dragons Paper Holdings Ltd | 5,584,031 | |||||||||||||
| 2,850,000 | �� | Pacific Basin Shipping Ltd | 1,298,941 | ||||||||||||
| 7,494,500 | Parkson Retail Group Ltd | 5,992,121 | |||||||||||||
| 6,356,172 | Peace Mark Holdings Ltd * | 1,229,394 | |||||||||||||
| 790,590 | Perfect World Co Ltd ADR * | 9,091,785 | |||||||||||||
| 70,575,101 | PetroChina Co Ltd Class H | 49,990,678 | |||||||||||||
| 33,104,789 | Pico Far East Holdings Ltd | 1,980,247 | |||||||||||||
| 1,158,338 | Shanda Interactive Entertainment Ltd Sponsored ADR * | 38,016,653 | |||||||||||||
| 9,633,500 | Shandong Chenming Paper Holdings Ltd Class H * | 3,644,215 | |||||||||||||
| 1,649,000 | Shandong Weigao Group Medical Polymer Co Ltd Class H | 2,754,773 | |||||||||||||
| 3,474,344 | Shanghai Industrial Holdings Ltd | 7,851,854 | |||||||||||||
| 37,104,000 | Shenzhen Investment Ltd | 5,824,973 | |||||||||||||
| 13,538,000 | Shimao Property Holdings Ltd | 6,908,958 | |||||||||||||
| 839,050 | Sina.com * | 18,014,404 | |||||||||||||
| 464,130 | Suntech Power Holdings Co Ltd ADR * | 2,826,552 | |||||||||||||
| 2,914,000 | Tencent Holdings Ltd | 16,647,515 | |||||||||||||
| 515,790 | VisionChina Media Inc * | 3,125,687 | |||||||||||||
| 349,890 | Wilmar International Ltd | 639,150 | |||||||||||||
| 7,524,000 | Yanzhou Coal Mining Co Ltd Class H | 4,251,432 | |||||||||||||
| 10,428,000 | Zhuzhou CSR Times Electric Co Ltd Class H | 9,415,421 | |||||||||||||
| Total China | 624,283,643 | ||||||||||||||
See accompanying notes to the financial statements.
5
GMO Emerging Markets Fund
(A Series of GMO Trust)
Schedule of Investments — (Continued)
(showing percentage of total net assets)
February 28, 2009
| Shares | Description | Value ($) | |||||||||||||
| Czech Republic — 0.6% | |||||||||||||||
| 227,600 | Central European Media Enterprises Ltd Class A * | 1,320,926 | |||||||||||||
| 795,820 | CEZ AS | 23,842,855 | |||||||||||||
| 493,317 | New World Resources NV Class A | 1,358,902 | |||||||||||||
| 50,630 | Pegas Nonwovens SA | 561,068 | |||||||||||||
| 313,960 | Telefonica 02 Czech Republic AS | 5,292,680 | |||||||||||||
| 617,070 | Unipetrol | 3,108,620 | |||||||||||||
| Total Czech Republic | 35,485,051 | ||||||||||||||
| Egypt — 1.0% | |||||||||||||||
| 455,447 | Alexandria Mineral Oils Co | 2,819,030 | |||||||||||||
| 2,027,835 | Commercial International Bank | 12,301,282 | |||||||||||||
| 239,161 | Egyptian Co for Mobile Services | 5,847,298 | |||||||||||||
| 14,220 | El Ezz Aldekhela Steel Alexa Co | 1,557,337 | |||||||||||||
| 2,330,820 | El Ezz Steel Rebars SAE | 2,863,579 | |||||||||||||
| 142,573 | ElSwedy Cables Holding Co * | 1,005,649 | |||||||||||||
| 244,830 | Orascom Construction Industries | 4,845,483 | |||||||||||||
| 1,797,820 | Orascom Telecom Holding SAE | 5,966,451 | |||||||||||||
| 2,552,070 | Sidi Kerir Petrochemicals Co | 3,687,650 | |||||||||||||
| 8,695,100 | Talaat Moustafa Group * | 3,975,679 | |||||||||||||
| 5,559,359 | Telecom Egypt | 14,272,860 | |||||||||||||
| Total Egypt | 59,142,298 | ||||||||||||||
| Hungary — 0.8% | |||||||||||||||
| 6,344,050 | Magyar Telekom Nyrt | 14,586,597 | |||||||||||||
| 198,940 | MOL Magyar Olaj es Gazipari Nyrt | 7,418,022 | |||||||||||||
| 2,073,040 | OTP Bank Nyrt * | 13,914,638 | |||||||||||||
| 72,140 | Richter Gedeon Nyrt | 7,449,943 | |||||||||||||
| Total Hungary | 43,369,200 | ||||||||||||||
| India — 1.7% | |||||||||||||||
| 63,600 | BF Utilities Ltd * | 425,031 | |||||||||||||
| 620,211 | Bombay Dyeing & Manufacturing Co Ltd | 1,736,633 | |||||||||||||
| 11,896,352 | CBAY Systems Holdings Ltd * (a) | 7,663,868 | |||||||||||||
| 5,948,177 | CBAY Systems Ltd * (b) (c) | 59,482 | |||||||||||||
See accompanying notes to the financial statements.
6
GMO Emerging Markets Fund
(A Series of GMO Trust)
Schedule of Investments — (Continued)
(showing percentage of total net assets)
February 28, 2009
| Shares | Description | Value ($) | |||||||||||||
| India — continued | |||||||||||||||
| 216,500 | Hero Honda Motors Ltd | 3,894,211 | |||||||||||||
| 1,422,400 | Housing Development & Infrastructure Ltd | 2,007,907 | |||||||||||||
| 417,600 | Housing Development Finance Corp Ltd | 10,227,029 | |||||||||||||
| 4,125,500 | Industrial Development Bank of India Ltd | 3,844,782 | |||||||||||||
| 185,550 | Infosys Technologies Ltd | 4,395,594 | |||||||||||||
| 949,047 | Jindal Steel & Power Ltd | 18,973,179 | |||||||||||||
| 947,823 | KSK Energy Ventures Ltd * | 3,102,243 | |||||||||||||
| 854,100 | Maruti Suzuki India Ltd | 11,146,788 | |||||||||||||
| 1,382,513 | PTC India Ltd | 1,611,060 | |||||||||||||
| 1,524,800 | Reliance Energy Ltd | 14,385,656 | |||||||||||||
| 1,869,704 | Reliance Power Ltd | 3,574,286 | |||||||||||||
| 557,200 | State Bank of India | 11,042,837 | |||||||||||||
| Total India | 98,090,586 | ||||||||||||||
| Indonesia — 0.6% | |||||||||||||||
| 10,272,500 | Aneka Tambang Tbk PT | 1,016,940 | |||||||||||||
| 972,500 | Astra International Tbk PT | 903,709 | |||||||||||||
| 184,360,000 | Bakrie & Brothers Tbk PT * | 763,236 | |||||||||||||
| 70,550,500 | Bakrie Sumatera Plantations Tbk PT | 1,852,331 | |||||||||||||
| 19,351,500 | Bank Central Asia Tbk PT | 3,751,082 | |||||||||||||
| 12,089,500 | Bank Mandiri Tbk PT | 1,720,569 | |||||||||||||
| 35,795,000 | Bank Negara Indonesia (Persero) Tbk PT | 2,057,191 | |||||||||||||
| 138,540,500 | Bumi Resources Tbk PT | 8,536,014 | |||||||||||||
| 645,500 | Gudang Garam Tbk PT | 277,868 | |||||||||||||
| 56,515,500 | Indah Kiat Pulp and Paper Corp Tbk PT * | 4,224,141 | |||||||||||||
| 10,905,000 | Indofood Sukses Makmur Tbk PT | 788,176 | |||||||||||||
| 20,634,000 | Kalbe Farma Tbk PT | 1,101,497 | |||||||||||||
| 24,926,600 | Matahari Putra Prima Tbk PT | 1,095,100 | |||||||||||||
| 18,363,500 | Perusahaan Gas Negara PT | 2,878,250 | |||||||||||||
| 8,275,500 | Telekomunikasi Indonesia Tbk PT | 4,355,306 | |||||||||||||
| 161,630,000 | Truba Alam Manunggal Engineering Tbk PT * | 671,415 | |||||||||||||
| Total Indonesia | 35,992,825 | ||||||||||||||
See accompanying notes to the financial statements.
7
GMO Emerging Markets Fund
(A Series of GMO Trust)
Schedule of Investments — (Continued)
(showing percentage of total net assets)
February 28, 2009
| Shares | Description | Value ($) | |||||||||||||
| Israel — 1.4% | |||||||||||||||
| 7,428,550 | Bank Hapoalim BM * | 12,702,598 | |||||||||||||
| 12,972,600 | Bank Leumi Le | 22,221,978 | |||||||||||||
| 73,790 | Delek Group Ltd | 4,881,867 | |||||||||||||
| 57,630 | IDB Development Corp Ltd | 566,966 | |||||||||||||
| 871,330 | Teva Pharmaceutical Industries Ltd Sponsored ADR | 38,843,891 | |||||||||||||
| Total Israel | 79,217,300 | ||||||||||||||
| Lebanon — 0.0% | |||||||||||||||
| 8,700 | Banque Libanaise pour le Commerce Sal * (b) | 35,695 | |||||||||||||
| Malaysia — 2.7% | |||||||||||||||
| 8,254,300 | Berjaya Sports Toto Berhad | 10,602,462 | |||||||||||||
| 980,978 | British American Tobacco Malaysia Berhad | 11,826,639 | |||||||||||||
| 15,119,100 | Genting Berhad | 14,000,511 | |||||||||||||
| 38,735,240 | KNM Group Berhad | 3,812,404 | |||||||||||||
| 2,587,343 | MISC Berhad | 5,949,947 | |||||||||||||
| 2,423,028 | PPB Group Berhad | 6,298,893 | |||||||||||||
| 3,454,148 | Public Bank Berhad | 8,154,491 | |||||||||||||
| 26,948,641 | Resorts World Berhad | 15,956,939 | |||||||||||||
| 44,108,929 | RHB Capital Berhad | 44,188,640 | |||||||||||||
| 8,849,100 | Shangri-La Hotels Berhad | 3,799,325 | |||||||||||||
| 14,890,400 | Sunway City Berhad | 5,871,416 | |||||||||||||
| 3,963,178 | Tanjong Plc | 14,782,039 | |||||||||||||
| 2,746,000 | UMW Holdings Berhad | 4,023,344 | |||||||||||||
| 21,518,621 | WCT Engineering Berhad | 5,817,428 | |||||||||||||
| Total Malaysia | 155,084,478 | ||||||||||||||
| Mexico — 1.6% | |||||||||||||||
| 2,607,400 | Alfa SA de CV Class A | 3,646,594 | |||||||||||||
| 275,700 | America Movil SAB de CV Class L ADR | 7,024,836 | |||||||||||||
| 30,497,839 | Cemex SA de CV CPO | 16,420,373 | |||||||||||||
| 444,680 | Cemex SA de CV Sponsored CPO ADR * | 2,396,825 | |||||||||||||
| 4,100,200 | Corporacion GEO SA de CV Series B * | 3,755,600 | |||||||||||||
| 436,970 | Fomento Economico Mexicano Sponsored ADR | 10,067,789 | |||||||||||||
See accompanying notes to the financial statements.
8
GMO Emerging Markets Fund
(A Series of GMO Trust)
Schedule of Investments — (Continued)
(showing percentage of total net assets)
February 28, 2009
| Shares | Description | Value ($) | |||||||||||||
| Mexico — continued | |||||||||||||||
| 1,602,511 | Grupo Cementos de Chihuahua SA de CV | 2,887,255 | |||||||||||||
| 5,469,150 | Grupo Financiero Banorte SA de CV Class O | 5,760,024 | |||||||||||||
| 27,787,715 | Grupo Mexico SA Class B | 15,855,236 | |||||||||||||
| 1,579,290 | Telefonos de Mexico SA de CV Class L Sponsored ADR | 21,699,445 | |||||||||||||
| Total Mexico | 89,513,977 | ||||||||||||||
| Morocco — 0.5% | |||||||||||||||
| 18,222 | Banque Centrale Populaire | 546,590 | |||||||||||||
| 61,635 | Banque Marocaine du Commerce Exterieur | 1,748,242 | |||||||||||||
| 11,585 | Compagnie Generale Immobiliere | 2,774,085 | |||||||||||||
| 2,308 | Lafarge Ciments | 396,281 | |||||||||||||
| 952,895 | Maroc Telecom | 17,555,533 | |||||||||||||
| 12,495 | ONA SA | 1,959,214 | |||||||||||||
| 3,920 | Societe Nationale De Siderurgie | 1,228,507 | |||||||||||||
| Total Morocco | 26,208,452 | ||||||||||||||
| Peru — 0.0% | |||||||||||||||
| 478,855 | Compania Minera Milpo SA | 729,221 | |||||||||||||
| 9,020 | Credicorp Ltd | 329,320 | |||||||||||||
| 34,100 | Minsur SA | 38,816 | |||||||||||||
| 81,768 | Sociedad Minera Cerro Verde SA | 834,851 | |||||||||||||
| 1,726,507 | Volcan Compania Minera SA Class B | 499,282 | |||||||||||||
| Total Peru | 2,431,490 | ||||||||||||||
| Philippines — 0.7% | |||||||||||||||
| 3,558,000 | Alliance Global Group Inc * | 107,703 | |||||||||||||
| 19,332,300 | Benpres Holdings Corp * | 491,688 | |||||||||||||
| 707,472,942 | Filinvest Land Inc | 5,392,687 | |||||||||||||
| 8,066,900 | First Gen Corp * | 2,519,273 | |||||||||||||
| 712,600 | Manila Electric Co | 1,297,129 | |||||||||||||
| 827,704,087 | Megaworld Corp | 8,964,108 | |||||||||||||
| 118,096 | Philippine Long Distance Telephone Co | 5,197,389 | |||||||||||||
| 45,617,100 | PNOC Energy Development Corp | 2,291,794 | |||||||||||||
See accompanying notes to the financial statements.
9
GMO Emerging Markets Fund
(A Series of GMO Trust)
Schedule of Investments — (Continued)
(showing percentage of total net assets)
February 28, 2009
| Shares | Description | Value ($) | |||||||||||||
| Philippines — continued | |||||||||||||||
| 132,173,510 | Robinsons Land Corp | 11,790,506 | |||||||||||||
| 3,037,300 | Vista Land & Lifescapes Inc | 50,885 | |||||||||||||
| Total Philippines | 38,103,162 | ||||||||||||||
| Poland — 0.4% | |||||||||||||||
| 2,107,390 | Getin Holding SA * | 1,647,409 | |||||||||||||
| 1,881,070 | Polski Koncern Naftowy Orlen SA | 10,554,496 | |||||||||||||
| 955,950 | Powszechna Kasa Oszczednosci Bank Polski SA | 4,981,553 | |||||||||||||
| 1,567,090 | Telekomunikacja Polska SA | 7,554,882 | |||||||||||||
| Total Poland | 24,738,340 | ||||||||||||||
| Russia — 3.6% | |||||||||||||||
| 3,393,804 | Cherepovets MK Severstal GDR (Registered Shares) | 12,319,508 | |||||||||||||
| 580,490 | Lukoil Sponsored ADR | 18,598,900 | |||||||||||||
| 2,440,969 | Magnit Sponsored GDR * | 11,716,651 | |||||||||||||
| 466,580 | Mobile Telesystems Sponsored ADR | 11,053,280 | |||||||||||||
| 6,993,400 | OAO Gazprom Sponsored GDR | 90,844,266 | |||||||||||||
| 146,300 | OAO Tatneft Sponsored GDR (Registered Shares) | 5,208,280 | |||||||||||||
| 164,211 | Rostelecom Sponsored ADR | 7,901,833 | |||||||||||||
| 135,000 | Russia Petroleum * (b) | 917,112 | |||||||||||||
| 18,440,540 | Sberbank RF | 7,225,004 | |||||||||||||
| 4,990,802 | Surgutneftegaz Sponsored ADR | 28,547,387 | |||||||||||||
| 4,133,570 | VTB Bank GDR | 4,422,920 | |||||||||||||
| 369,874 | X5 Retail Group NV GDR (Registered Shares) * | 2,552,131 | |||||||||||||
| Total Russia | 201,307,272 | ||||||||||||||
| South Africa — 7.2% | |||||||||||||||
| 2,415,075 | Absa Group Ltd | 21,146,569 | |||||||||||||
| 1,579,538 | Adcock Ingram Holdings Ltd * | 5,944,753 | |||||||||||||
| 358,900 | AngloGold Ashanti Ltd | 10,619,256 | |||||||||||||
| 1,303,200 | ArcelorMittal South Africa Ltd | 9,493,254 | |||||||||||||
| 3,819,632 | Aveng Ltd | 9,672,571 | |||||||||||||
| 1,859,367 | Bidvest Group Ltd | 15,216,945 | |||||||||||||
| 776,900 | Exxaro Resources Ltd | 5,166,274 | |||||||||||||
See accompanying notes to the financial statements.
10
GMO Emerging Markets Fund
(A Series of GMO Trust)
Schedule of Investments — (Continued)
(showing percentage of total net assets)
February 28, 2009
| Shares | Description | Value ($) | |||||||||||||
| South Africa — continued | |||||||||||||||
| 18,069,100 | FirstRand Ltd | 21,429,005 | |||||||||||||
| 1,386,400 | Gold Fields Ltd | 14,221,062 | |||||||||||||
| 5,333,116 | Grindrod Ltd | 6,903,443 | |||||||||||||
| 2,042,540 | Harmony Gold Mining Co Ltd * | 24,644,372 | |||||||||||||
| 2,418,857 | Imperial Holdings Ltd | 10,573,744 | |||||||||||||
| 2,723,572 | Investec Ltd | 8,078,726 | |||||||||||||
| 2,409,028 | JD Group Ltd | 6,993,095 | |||||||||||||
| 2,053,399 | Massmart Holdings Ltd | 14,676,083 | |||||||||||||
| 2,214,999 | MTN Group Ltd | 18,758,028 | |||||||||||||
| 1,364,388 | Naspers Ltd Class N | 20,694,775 | |||||||||||||
| 1,190,100 | Nedbank Group Ltd | 8,807,941 | |||||||||||||
| 4,113,888 | Remgro Ltd | 26,938,577 | |||||||||||||
| 1,289,238 | Reunert Ltd | 4,741,793 | |||||||||||||
| 4,680,633 | RMB Holdings Ltd | 8,858,972 | |||||||||||||
| 14,076,571 | Sanlam Ltd | 21,166,677 | |||||||||||||
| 796,202 | Sasol Ltd | 19,856,553 | |||||||||||||
| 3,622,726 | Standard Bank Group Ltd | 23,179,352 | |||||||||||||
| 11,819,600 | Steinhoff International Holdings Ltd | 13,080,747 | |||||||||||||
| 2,473,200 | Telkom South Africa Ltd | 24,179,110 | |||||||||||||
| 1,562,832 | Tiger Brands Ltd | 19,499,055 | |||||||||||||
| 4,485,051 | Truworths International Ltd | 13,769,084 | |||||||||||||
| Total South Africa | 408,309,816 | ||||||||||||||
| South Korea — 16.6% | |||||||||||||||
| 8,990 | Amorepacific Corp | 3,204,028 | |||||||||||||
| 4,403,499 | Biomass Korea Co Ltd * (a) | 662,925 | |||||||||||||
| 186,456 | Boryung Pharmaceutical Co Ltd (a) | 2,759,751 | |||||||||||||
| 2,783,681 | Busan Bank | 9,226,567 | |||||||||||||
| 201,060 | Cheil Industries Inc | 4,770,196 | |||||||||||||
| 1,911,470 | Daegu Bank | 7,152,265 | |||||||||||||
| 577,880 | Daehan Pulp Co Ltd * (a) | 1,825,376 | |||||||||||||
| 464,786 | Daelim Industrial Co Ltd | 11,975,158 | |||||||||||||
| 16,434 | Daesun Shipbuilding * | 682,814 | |||||||||||||
| 103,816 | DC Chemical Co Ltd | 14,269,350 | |||||||||||||
See accompanying notes to the financial statements.
11
GMO Emerging Markets Fund
(A Series of GMO Trust)
Schedule of Investments — (Continued)
(showing percentage of total net assets)
February 28, 2009
| Shares | Description | Value ($) | |||||||||||||
| South Korea — continued | |||||||||||||||
| 439,953 | Dongbu Insurance Co Ltd | 4,045,121 | |||||||||||||
| 465,103 | Dongkuk Steel Mill Co Ltd | 6,359,961 | |||||||||||||
| 1,413,948 | Finetex EnE Inc * | 1,529,543 | |||||||||||||
| 328,920 | GS Engineering & Construction Corp | 9,955,241 | |||||||||||||
| 322,900 | GS Holdings Corp | 5,278,131 | |||||||||||||
| 1,940,609 | Hana Financial Group Inc | 22,965,575 | |||||||||||||
| 435,694 | Hanjin Heavy Industries & Construction Holdings Co Ltd | 3,471,314 | |||||||||||||
| 562,610 | Hanjin Shipping | 5,531,798 | |||||||||||||
| 606,050 | Hankook Tire Co Ltd | 4,921,942 | |||||||||||||
| 267,014 | Honam Petrochemical Corp | 8,030,085 | |||||||||||||
| 164,220 | Hyundai Department Store Co Ltd | 5,942,777 | |||||||||||||
| 182,420 | Hyundai Development Co | 3,340,461 | |||||||||||||
| 157,836 | Hyundai Engineering & Construction | 5,207,747 | |||||||||||||
| 295,837 | Hyundai Mipo Dockyard | 22,512,341 | |||||||||||||
| 924,684 | Hyundai Mobis | 44,403,708 | |||||||||||||
| 1,344,150 | Hyundai Motor Co | 42,074,773 | |||||||||||||
| 352,190 | Hyundai Steel Co | 7,769,784 | |||||||||||||
| 413,621 | Hyunjin Materials Co Ltd * | 7,071,534 | |||||||||||||
| 3,017,839 | In the F Co Ltd * (a) | 1,677,571 | |||||||||||||
| 2,579,820 | Industrial Bank of Korea * | 9,802,207 | |||||||||||||
| 531,610 | Kangwon Land Inc | 4,272,826 | |||||||||||||
| 3,147,258 | KB Financial Group Inc * | 60,340,660 | |||||||||||||
| 40,200 | KB Financial Group Inc ADR * | 756,564 | |||||||||||||
| 14,780 | KCC Corp | 2,703,191 | |||||||||||||
| 215,781 | Keangnam Enterprises Ltd * | 707,885 | |||||||||||||
| 1,531,140 | Kia Motors Corp * | 6,591,194 | |||||||||||||
| 1,653,530 | Korea Electric Power Corp * | 25,605,445 | |||||||||||||
| 2,945,440 | Korea Exchange Bank | 10,296,876 | |||||||||||||
| 5,064 | Korea Iron & Steel Co Ltd | 142,135 | |||||||||||||
| 398,630 | Korea Kumho Petrochemical Co Ltd | 4,317,063 | |||||||||||||
| 152,160 | Korea Line Corp | 5,222,954 | |||||||||||||
| 266,439 | Korea Zinc Co Ltd | 15,304,847 | |||||||||||||
| 282,510 | Korean Air Lines Co Ltd * | 5,572,229 | |||||||||||||
| 817,090 | KT Corp | 19,857,275 | |||||||||||||
See accompanying notes to the financial statements.
12
GMO Emerging Markets Fund
(A Series of GMO Trust)
Schedule of Investments — (Continued)
(showing percentage of total net assets)
February 28, 2009
| Shares | Description | Value ($) | |||||||||||||
| South Korea — continued | |||||||||||||||
| 313,740 | KT Corp Sponsored ADR * | 3,771,155 | |||||||||||||
| 182,240 | KT Freetel Co Ltd * | 3,233,772 | |||||||||||||
| 1,216,801 | KT&G Corp | 62,379,034 | |||||||||||||
| 571,050 | Kumho Industrial Co Ltd * | 4,267,418 | |||||||||||||
| 274,650 | LG Chem Ltd | 14,902,041 | |||||||||||||
| 778,080 | LG Corp | 20,345,169 | |||||||||||||
| 784,030 | LG Dacom Corp | 8,851,643 | |||||||||||||
| 913,510 | LG Display Co Ltd | 15,170,536 | |||||||||||||
| 716,890 | LG International Corp | 7,200,648 | |||||||||||||
| 1,717,290 | LG Telecom Ltd | 9,874,916 | |||||||||||||
| 93,660 | Lotte Shopping Co Ltd | 9,926,837 | |||||||||||||
| 470,819 | Maeil Dairy Industry | 2,755,138 | |||||||||||||
| 142,253 | NCSoft Corp | 6,452,079 | |||||||||||||
| 266,349 | POSCO | 53,767,266 | |||||||||||||
| 794,190 | Pumyang Construction Co Ltd (a) | 5,161,915 | |||||||||||||
| 357,630 | S-Oil Corp | 12,153,485 | |||||||||||||
| 251,051 | Samsung Electronics Co Ltd | 77,215,276 | |||||||||||||
| 267,626 | Samsung Fire & Marine Insurance Co Ltd | 27,154,209 | |||||||||||||
| 144,912 | Samsung SDI Co Ltd | 5,370,053 | |||||||||||||
| 2,040,885 | Shinhan Financial Group Co Ltd * | 29,992,101 | |||||||||||||
| 288,893 | SK Energy Co Ltd | 13,415,727 | |||||||||||||
| 917,624 | SK Holdings Co Ltd | 50,421,517 | |||||||||||||
| 1,870,760 | SK Networks Co Ltd | 8,746,484 | |||||||||||||
| 226,365 | SK Telecom Co Ltd | 27,514,964 | |||||||||||||
| 257,510 | SK Telecom Co Ltd ADR | 3,448,059 | |||||||||||||
| 49,476 | Taewoong Co Ltd | 2,825,294 | |||||||||||||
| 2,564,860 | Woori Finance Holdings Co Ltd * | 10,268,177 | |||||||||||||
| 37,730 | Yuhan Corp | 4,717,703 | |||||||||||||
| Total South Korea | 941,413,804 | ||||||||||||||
| Sri Lanka — 0.0% | |||||||||||||||
| 268,604 | Lanka Walltile Ltd | 94,057 | |||||||||||||
See accompanying notes to the financial statements.
13
GMO Emerging Markets Fund
(A Series of GMO Trust)
Schedule of Investments — (Continued)
(showing percentage of total net assets)
February 28, 2009
| Shares | Description | Value ($) | |||||||||||||
| Taiwan — 13.0% | |||||||||||||||
| 13,804,000 | Acer Inc | 18,074,323 | |||||||||||||
| 10,621,000 | Asia Cement Corp | 7,841,324 | |||||||||||||
| 17,190,547 | Asustek Computer Inc | 16,231,648 | |||||||||||||
| 8,175,000 | Catcher Technology Co Ltd | 13,646,843 | |||||||||||||
| 46,588,000 | China Bills Finance Corp * | 8,341,468 | |||||||||||||
| 35,996,261 | China Development Financial Holding Corp | 6,056,964 | |||||||||||||
| 51,089,000 | Chinatrust Financial Holding Co Ltd | 15,282,750 | |||||||||||||
| 37,866,248 | Chunghwa Telecom Co Ltd | 58,297,426 | |||||||||||||
| 235,910 | Chunghwa Telecom Co Ltd ADR | 3,621,219 | |||||||||||||
| 32,243,545 | Compal Electronics Inc | 18,360,955 | |||||||||||||
| 5,797,612 | Delta Electronics Inc | 9,129,644 | |||||||||||||
| 3,014,472 | DFI Inc | 2,935,234 | |||||||||||||
| 12,075,218 | Dimerco Express Taiwan Corp (a) | 6,639,875 | |||||||||||||
| 13,731,445 | Far Eastern Textile Co Ltd | 8,115,592 | |||||||||||||
| 17,737,500 | Far Eastone Telecommunications Co Ltd | 17,134,055 | |||||||||||||
| 37,565,488 | First Financial Holding Co Ltd | 14,880,155 | |||||||||||||
| 6,477,208 | Formosa Chemicals & Fibre Co | 6,461,947 | |||||||||||||
| 29,271,000 | Fubon Financial Holding Co Ltd | 15,547,488 | |||||||||||||
| 4,918,600 | High Tech Computer Corp | 53,342,581 | |||||||||||||
| 26,149,404 | Hon Hai Precision Industry Co Ltd | 51,366,438 | |||||||||||||
| 484,000 | Largan Precision Co Ltd | 3,400,717 | |||||||||||||
| 9,941,455 | Les Enphants Co Ltd (a) | 4,441,616 | |||||||||||||
| 27,905,927 | Lite-On Technology Corp | 16,287,558 | |||||||||||||
| 6,959,618 | MediaTek Inc | 59,697,988 | |||||||||||||
| 12,259,000 | Mitac International Corp | 4,423,789 | |||||||||||||
| 2,301,340 | Motech Industries Inc | 5,073,351 | |||||||||||||
| 15,149,405 | Nan Ya Plastics Corp | 14,286,884 | |||||||||||||
| 8,113,785 | Novatek Microelectronics Corp Ltd | 9,799,419 | |||||||||||||
| 4,949,000 | Powertech Technology Inc | 7,527,626 | |||||||||||||
| 28,861,000 | Quanta Computer Inc | 29,140,344 | |||||||||||||
| 4,964,652 | Siliconware Precision Industries Co | 4,195,626 | |||||||||||||
| 10,994,000 | Synnex Technology International Corp | 12,474,271 | |||||||||||||
| 30,484,663 | Taiwan Cement Corp | 22,565,362 | |||||||||||||
| 9,254,000 | Taiwan Fertilizer Co Ltd | 13,896,696 | |||||||||||||
See accompanying notes to the financial statements.
14
GMO Emerging Markets Fund
(A Series of GMO Trust)
Schedule of Investments — (Continued)
(showing percentage of total net assets)
February 28, 2009
| Shares | Description | Value ($) | |||||||||||||
| Taiwan — continued | |||||||||||||||
| 12,332,288 | Taiwan Mobile Co Ltd | 16,024,719 | |||||||||||||
| 97,305,908 | Taiwan Semiconductor Manufacturing Co Ltd | 122,911,333 | |||||||||||||
| 4,737,000 | U-Ming Marine Transport Corp | 5,997,736 | |||||||||||||
| 1,855,725 | Waterland Financial Holdings | 295,081 | |||||||||||||
| 12,120,000 | Wistron Corp | 9,154,631 | |||||||||||||
| 72,296,000 | Yuanta Financial Holding Co Ltd | 25,997,295 | |||||||||||||
| Total Taiwan | 738,899,971 | ||||||||||||||
| Thailand — 4.7% | |||||||||||||||
| 17,051,590 | Advanced Info Service Pcl (Foreign Registered) (b) | 37,702,468 | |||||||||||||
| 8,203,010 | Bangkok Bank Pcl NVDR (b) | 16,698,902 | |||||||||||||
| 29,855,800 | Bangkok Dusit Medical Service Pcl (Foreign Registered) (b) | 14,032,432 | |||||||||||||
| 37,827,540 | Bank of Ayudhya Pcl (Foreign Registered) (b) | 9,314,239 | |||||||||||||
| 2,094,000 | Bank of Ayudhya Pcl NVDR (b) | 507,058 | |||||||||||||
| 1,802,800 | Banpu Pcl (Foreign Registered) (b) | 10,412,978 | |||||||||||||
| 45,156,920 | BEC World Pcl (Foreign Registered) (b) | 23,939,971 | |||||||||||||
| 18,172,880 | Home Product Center Pcl (Foreign Registered) (b) | 1,837,282 | |||||||||||||
| 146,645,800 | IRPC Pcl (Foreign Registered) (b) | 7,510,454 | |||||||||||||
| 85,679,650 | Italian Thai Development Pcl (Foreign Registered) (b) | 5,415,285 | |||||||||||||
| 15,832,560 | Kasikornbank Pcl (Foreign Registered) (b) | 19,293,096 | |||||||||||||
| 63,924,000 | Krung Thai Bank Pcl (Foreign Registered) (b) | 7,257,031 | |||||||||||||
| 3,318,000 | PTT Chemical Pcl (Foreign Registered) (b) | 2,678,440 | |||||||||||||
| 3,045,000 | PTT Exploration & Production Pcl (Foreign Registered) (b) | 7,395,575 | |||||||||||||
| 10,914,270 | PTT Pcl (Foreign Registered) (b) | 46,567,471 | |||||||||||||
| 10,061,690 | Robinson Department Store Pcl (Foreign Registered) (b) | 1,747,216 | |||||||||||||
| 3,499,793 | Robinson Department Store Pcl NVDR (b) | 607,740 | |||||||||||||
| 13,206,400 | Saha Pathana International Holding Pcl (Foreign Registered) (b) | 6,551,652 | |||||||||||||
| 3,285,838 | Siam Cement Pcl (Foreign Registered) (b) | 9,064,952 | |||||||||||||
| 783,000 | Siam Cement Pcl NVDR (b) | 2,149,335 | |||||||||||||
| 16,834,900 | Siam Commercial Bank Pcl (Foreign Registered) (b) | 25,752,953 | |||||||||||||
| 3,108,050 | Star Block Co Ltd (Foreign Registered) * (a) (b) (d) | 859 | |||||||||||||
| 13,691,320 | Thai Oil Pcl (Foreign Registered) (b) | 8,968,789 | |||||||||||||
| Total Thailand | 265,406,178 | ||||||||||||||
See accompanying notes to the financial statements.
15
GMO Emerging Markets Fund
(A Series of GMO Trust)
Schedule of Investments — (Continued)
(showing percentage of total net assets)
February 28, 2009
| Shares | Description | Value ($) | |||||||||||||
| Turkey — 5.1% | |||||||||||||||
| 9,837,105 | Akbank TAS | 22,674,929 | |||||||||||||
| 991,210 | Anadolu Efes Biracilik ve Malt Sanayii AS | 6,261,513 | |||||||||||||
| 30,080,774 | Dogan Sirketler Grubu Holdings AS * | 9,076,782 | |||||||||||||
| 2,100,954 | Enka Insaat ve Sanayi AS | 7,632,935 | |||||||||||||
| 6,038,816 | Eregli Demir ve Celik Fabrikalari TAS | 12,192,718 | |||||||||||||
| 8,308,351 | Haci Omer Sabanci Holding AS | 12,055,197 | |||||||||||||
| 13,735,516 | KOC Holding AS * | 17,170,001 | |||||||||||||
| 42,150 | Medya Holding AS * (b) (e) | 248 | |||||||||||||
| 1,841,220 | Tupras-Turkiye Petrol Rafineriler AS | 16,699,858 | |||||||||||||
| 3,463,860 | Turk Hava Yollari Anonim Ortakligi * | 11,403,579 | |||||||||||||
| 9,217,150 | Turk Sise ve Cam Fabrikalari AS * | 5,159,674 | |||||||||||||
| 7,685,870 | Turk Telekomunikasyon AS * | 17,586,044 | |||||||||||||
| 12,124,085 | Turkcell Iletisim Hizmet AS | 60,037,790 | |||||||||||||
| 31,702,140 | Turkiye Garanti Bankasi * | 38,655,689 | |||||||||||||
| 3,283,400 | Turkiye Halk Bankasi AS | 6,909,412 | |||||||||||||
| 11,596,310 | Turkiye IS Bankasi Class C | 22,460,731 | |||||||||||||
| 12,196,162 | Turkiye Sinai Kalkinma Bankasi AS * | 4,810,027 | |||||||||||||
| 15,188,060 | Turkiye Vakiflar Bankasi TAO Class D | 9,695,666 | |||||||||||||
| 11,575,033 | Yapi ve Kredi Bankasi AS * | 11,274,100 | |||||||||||||
| Total Turkey | 291,756,893 | ||||||||||||||
| TOTAL COMMON STOCKS (COST $7,323,414,388) | 4,595,150,893 | ||||||||||||||
| PREFERRED STOCKS — 11.7% | |||||||||||||||
| Brazil — 11.2% | |||||||||||||||
| 4,316,880 | Aracruz SA Class B (Registered) 11.82% | 3,086,838 | |||||||||||||
| 5,458,901 | Banco Bradesco SA 0.84% | 47,252,342 | |||||||||||||
| 6,529,375 | Banco Itau Holding Financeira SA 0.65% | 60,613,919 | |||||||||||||
| 1,232,800 | Bradespar SA 1.89% | 11,547,512 | |||||||||||||
| 774,800 | Brasil Telecom Participacoes SA 6.99% | 4,859,915 | |||||||||||||
| 1,080,000 | Brasil Telecom SA 6.36% | 5,279,418 | |||||||||||||
| 531,200 | Companhia Brasileira de Distribuicao Grupo Pao de Acucar 0.79% | 6,395,102 | |||||||||||||
| 600,600 | Companhia de Bebidas das Americas 4.31% | 24,082,769 | |||||||||||||
See accompanying notes to the financial statements.
16
GMO Emerging Markets Fund
(A Series of GMO Trust)
Schedule of Investments — (Continued)
(showing percentage of total net assets)
February 28, 2009
| Shares | Description | Value ($) | |||||||||||||
| Brazil — continued | |||||||||||||||
| 201,200 | Companhia de Transmissao de Energia Eletrica Paulista 1.82% | 3,811,307 | |||||||||||||
| 3,164,464 | Companhia Energetica de Minas Gerais 2.63% | 43,998,674 | |||||||||||||
| 2,002,800 | Companhia Paranaense de Energia Class B 1.17% | 18,676,273 | |||||||||||||
| 5,434,108 | Companhia Vale do Rio Doce Class A 4.07% | 60,967,265 | |||||||||||||
| 727,400 | Duratex SA 2.64% | 4,650,809 | |||||||||||||
| 1,195,800 | Electrobras (Centro) SA Class B 6.65% | 12,126,014 | |||||||||||||
| 861,800 | Eletropaulo Metropolitana SA 7.61% | 10,555,374 | |||||||||||||
| 3,163,700 | Gerdau Metalurgica SA 2.46% | 22,080,017 | |||||||||||||
| 5,219,262 | Gerdau SA 1.29% | 27,630,617 | |||||||||||||
| 14,546,850 | Itausa-Investimentos Itau SA 0.81% | 43,006,703 | |||||||||||||
| 1,130,952 | Net Servicos de Comunicacoa SA * | 7,164,808 | |||||||||||||
| 9,529,504 | Petroleo Brasileiro SA (Petrobras) 0.10% | 105,201,516 | |||||||||||||
| 1,068,560 | Petroleo Brasileiro SA Sponsored ADR 0.10% | 23,914,373 | |||||||||||||
| 5,925,423 | Sadia SA 1.33% | 7,086,522 | |||||||||||||
| 763,900 | Tam SA 1.55% | 5,158,896 | |||||||||||||
| 2,461,330 | Tele Norte Leste Participacoes ADR 1.03% | 29,831,320 | |||||||||||||
| 427,700 | Telecomunicacoes de Sao Paulo SA 10.06% | 7,903,347 | |||||||||||||
| 278,200 | Telemar Norte Leste SA Class A 3.13% | 5,429,286 | |||||||||||||
| 190,900 | Ultrapar Participacoes SA 2.97% | 4,360,988 | |||||||||||||
| 2,668,700 | Usinas Siderrurgicas de Minas Gerais SA Class A 1.93% | 28,936,770 | |||||||||||||
| Total Brazil | 635,608,694 | ||||||||||||||
| Russia — 0.1% | |||||||||||||||
| 29,155 | Transneft 3.44% | 5,574,859 | |||||||||||||
| South Korea — 0.4% | |||||||||||||||
| 448,140 | Hyundai Motor Co 5.64% | 5,138,799 | |||||||||||||
| 118,476 | Samsung Electronics Co Ltd (Non Voting) 3.79% | 20,984,028 | |||||||||||||
| Total South Korea | 26,122,827 | ||||||||||||||
| TOTAL PREFERRED STOCKS (COST $835,420,641) | 667,306,380 | ||||||||||||||
See accompanying notes to the financial statements.
17
GMO Emerging Markets Fund
(A Series of GMO Trust)
Schedule of Investments — (Continued)
(showing percentage of total net assets)
February 28, 2009
| Shares | Description | Value ($) | |||||||||||||
| PRIVATE EQUITY SECURITIES — 0.6% | |||||||||||||||
| Poland — 0.6% | |||||||||||||||
| MHP Investors (Tri Media Holdings Ltd) * (b) (c) | 22,125,725 | ||||||||||||||
| CHP Investors (Multimedia) * (b) (c) | 11,328,691 | ||||||||||||||
| Total Poland | 33,454,416 | ||||||||||||||
| Russia — 0.0% | |||||||||||||||
| 124,330 | Divot Holdings NV, Private Equity Securities-Class E * (b) (c) (f) | 1,244 | |||||||||||||
| 90,000 | Divot Holdings NV, Private Equity Securities-Class D * (b) (c) (f) | 900 | |||||||||||||
| 46,624 | Divot Holdings NV, Convertible Securities-Class F * (b) (c) (f) | 466 | |||||||||||||
| Total Russia | 2,610 | ||||||||||||||
| Sri Lanka — 0.0% | |||||||||||||||
| 2,545,869 | Millenium Information Technology * (a) (b) (c) | 787,469 | |||||||||||||
| Total Sri Lanka | 787,469 | ||||||||||||||
| TOTAL PRIVATE EQUITY SECURITIES (COST $3,925,627) | 34,244,495 | ||||||||||||||
| INVESTMENT FUNDS — 3.9% | |||||||||||||||
| China — 0.2% | |||||||||||||||
| 250,446 | Martin Currie China A Share Fund Ltd Class B * (b) (c) | 7,016,741 | |||||||||||||
| 25,045 | Martin Currie China A Share Fund Ltd Class S * (b) (c) (f) | 1,283,021 | |||||||||||||
| Total China | 8,299,762 | ||||||||||||||
| India — 0.1% | |||||||||||||||
| 10,922 | Fire Capital Mauritius Private Fund * (b) (c) (g) | 6,617,149 | |||||||||||||
| 170 | SPG Infinity Technology Fund I * (b) (c) (f) | 5,582 | |||||||||||||
| 1,371,900 | TDA India Technology Fund II LP * (b) (c) | 907,841 | |||||||||||||
| Total India | 7,530,572 | ||||||||||||||
| Poland — 0.0% | |||||||||||||||
| 1,749,150 | The Emerging European Fund II LP * (b) (c) | 767,055 | |||||||||||||
See accompanying notes to the financial statements.
18
GMO Emerging Markets Fund
(A Series of GMO Trust)
Schedule of Investments — (Continued)
(showing percentage of total net assets)
February 28, 2009
| Shares | Description | Value ($) | |||||||||||||
| Russia — 0.1% | |||||||||||||||
| 9,500,000 | NCH Eagle Fund LP * (b) (c) | 5,586,000 | |||||||||||||
| 2,000 | Steep Rock Russia Fund LP * (b) (c) | 705,343 | |||||||||||||
| Total Russia | 6,291,343 | ||||||||||||||
| Ukraine — 0.0% | |||||||||||||||
| 16,667 | Societe Generale Thalmann Ukraine Fund * (b) (c) (f) | 4,000 | |||||||||||||
| United States — 3.5% | |||||||||||||||
| 9,251,146 | iShares MSCI Emerging Markets Index Fund (h) | 196,401,829 | |||||||||||||
| TOTAL INVESTMENT FUNDS (COST $251,127,908) | 219,294,561 | ||||||||||||||
| DEBT OBLIGATIONS — 0.2% | |||||||||||||||
| United States — 0.2% | |||||||||||||||
| 9,252,072 | U.S. Treasury Inflation Indexed Bond, 0.88% , due 04/15/10 (i) | 9,121,969 | |||||||||||||
| TOTAL DEBT OBLIGATIONS (COST $8,956,328) | 9,121,969 | ||||||||||||||
| RIGHTS AND WARRANTS — 0.0% | |||||||||||||||
| Brazil — 0.0% | |||||||||||||||
| 10,819 | Net Servicos de Comunicacao SA Rights, Expires 03/16/09 * | 6,288 | |||||||||||||
| 15,738 | Ultrapar Participacoes SA Rights, Expires 03/16/09 * | 66 | |||||||||||||
| Total Brazil | 6,354 | ||||||||||||||
| Malaysia — 0.0% | |||||||||||||||
| 4,963,466 | Sunway City Warrants, Expires 10/04/17 * | 281,141 | |||||||||||||
| 3,826,400 | WCT Engineering Warrants, Expires 04/22/13 * | 196,093 | |||||||||||||
| Total Malaysia | 477,234 | ||||||||||||||
See accompanying notes to the financial statements.
19
GMO Emerging Markets Fund
(A Series of GMO Trust)
Schedule of Investments — (Continued)
(showing percentage of total net assets)
February 28, 2009
| Shares / Par Value ($) | Description | Value ($) | |||||||||||||
| South Korea — 0.0% | |||||||||||||||
| 856,082 | Dae Han Pulp Rights, Expires 03/26/09 * | — | |||||||||||||
| 296,427 | Shinhan Financial Group Co Ltd Rights, Expires 03/19/09 * | 618,583 | |||||||||||||
| Total South Korea | 618,583 | ||||||||||||||
| TOTAL RIGHTS AND WARRANTS (COST $2,966,945) | 1,102,171 | ||||||||||||||
| MUTUAL FUNDS — 0.0% | |||||||||||||||
| United States — 0.0% | |||||||||||||||
| Affiliated Issuers | |||||||||||||||
| 8,064 | GMO Special Purpose Holding Fund (b) (d) | 5,887 | |||||||||||||
| TOTAL MUTUAL FUNDS (COST $0) | 5,887 | ||||||||||||||
| CONVERTIBLE SECURITIES — 0.1% | |||||||||||||||
| India — 0.1% | |||||||||||||||
| 3,380,000 | Adani Enterprise, 6.00%, 01/27/12 | 1,782,950 | |||||||||||||
| 4,000,000 | Housing Development Finance Corp, Zero Coupon, 09/27/10 | 4,354,800 | |||||||||||||
| Total India | 6,137,750 | ||||||||||||||
| TOTAL CONVERTIBLE SECURITIES (COST $8,214,950) | 6,137,750 | ||||||||||||||
| SHORT-TERM INVESTMENTS — 2.2% | |||||||||||||||
| 2,750,940 | Banco Santander Time Deposit, 0.02%, due 03/02/09 | 2,750,940 | |||||||||||||
| 55,900,000 | BNP Paribas Time Deposit, 0.23%, due 03/02/09 | 55,900,000 | |||||||||||||
| 65,000,000 | Royal Bank of Canada Time Deposit, 0.20%, due 03/02/09 | 65,000,000 | |||||||||||||
| 48,136 | Royal Bank of Scotland Time Deposit, 0.08%, due 03/02/09 | 48,136 | |||||||||||||
| TOTAL SHORT-TERM INVESTMENTS (COST $123,699,076) | 123,699,076 | ||||||||||||||
| TOTAL INVESTMENTS — 99.6% (Cost $8,557,725,863) | 5,656,063,182 | ||||||||||||||
| Other Assets and Liabilities (net) — 0.4% | 20,643,116 | ||||||||||||||
| TOTAL NET ASSETS — 100.0% | $ | 5,676,706,298 | |||||||||||||
See accompanying notes to the financial statements.
20
GMO Emerging Markets Fund
(A Series of GMO Trust)
Schedule of Investments — (Continued)
February 28, 2009
Additional information on each restricted security is as follows:
| Issuer Description | Acquisition Date | Acquisition Cost | Value as a Percentage of Fund's Net Assets | Value as of February 28, 2009 | |||||||||||||||
| CBAY Systems Ltd | 5/06/03-11/10/05 | $ | — | 0.00 | % | $ | 59,482 | ||||||||||||
| CHP Investors (Multimedia) | 3/05/01 | 18,178,923 | 0.20 | % | 11,328,691 | ||||||||||||||
| Divot Holdings NV, Convertible Securities-Class F | 3/27/02 | 46,624 | 0.00 | % | 466 | ||||||||||||||
| Divot Holdings NV, Private Equity Securities-Class D | 6/2/00 | 1,502,100 | 0.00 | % | 900 | ||||||||||||||
| Divot Holdings NV, Private Equity Securities-Class E | 9/21/01 | 124,330 | 0.00 | % | 1,244 | ||||||||||||||
| Fire Capital Mauritius Private Fund | 9/06/06-10/14/08 | 10,959,863 | 0.12 | % | 6,617,149 | ||||||||||||||
| MHP Investors (Tri Media Holdings Ltd) | 5/01/05 | 27,983,521 | 0.39 | % | 22,125,725 | ||||||||||||||
| Martin Currie China A Share Fund Ltd Class B | 1/20/06 | 2,710,928 | 0.12 | % | 7,016,741 | ||||||||||||||
| Martin Currie China A Share Fund Ltd Class S | 10/14/08 | — | 0.02 | % | 1,283,021 | ||||||||||||||
| Millenium Information Technology | 10/21/99 | 2,252,570 | 0.01 | % | 787,469 | ||||||||||||||
| NCH Eagle Fund LP | 1/08/03 | 9,500,000 | 0.10 | % | 5,586,000 | ||||||||||||||
| SPG Infinity Technology Fund I | 12/23/99 | 62,449 | 0.00 | % | 5,582 | ||||||||||||||
| Societe Generale Thalmann Ukraine Fund | 7/15/97 | 199,943 | 0.00 | % | 4,000 | ||||||||||||||
| Steep Rock Russia Fund LP | 12/22/06 | 2,000,000 | 0.01 | % | 705,343 | ||||||||||||||
| TDA India Technology Fund II LP | 2/23/00-3/23/04 | 787,800 | 0.02 | % | 907,841 | ||||||||||||||
| The Emerging European Fund II LP | 12/05/97-6/24/02 | 1,124,248 | 0.01 | % | 767,055 | ||||||||||||||
| $ | 57,196,709 | ||||||||||||||||||
See accompanying notes to the financial statements.
21
GMO Emerging Markets Fund
(A Series of GMO Trust)
Schedule of Investments — (Continued)
February 28, 2009
A summary of outstanding financial instruments at February 28, 2009 is as follows:
Forward Currency Contracts
| Settlement Date | Deliver/Receive | Units of Currency | Value | Net Unrealized Appreciation (Depreciation) | |||||||||||||||
| Buys | |||||||||||||||||||
| 4/29/09 | HUF | 1,492,248,850 | $ | 6,239,500 | $ | 20,000 | |||||||||||||
| Sales | |||||||||||||||||||
| 4/29/09 | HUF | 11,579,980,800 | $ | 48,419,064 | $ | 1,884,936 | |||||||||||||
Notes to Schedule of Investments:
ADR - American Depositary Receipt
CPO - Ordinary Participation Certificate (Certificado de Participacion Ordinares), representing a bundle of shares of the multiple series of one issuer that trade together as a unit.
Foreign Registered - Shares issued to foreign investors in markets that have foreign ownership limits.
GDR - Global Depository Receipt
NVDR - Non-Voting Depository Receipt
* Non-income producing security.
(a) Affiliated Company (Note 8).
(b) Security valued at fair value using methods determined in good faith by or at the direction of the Trustees of GMO Trust (Note 2).
(c) Direct placement securities are restricted as to resale.
(d) Underlying investment represents interests in defaulted securities.
(e) Bankrupt issuer.
(f) The security is currently in full liquidation.
(g) The Fund is committed to additional capital contributions in the amount of $9,078,481 to this investment.
(h) Represents an investment to equitize cash in the iShares® MSCI Emerging Markets Index Fund, which is a separate investment portfolio of iShares, Inc., a registered investment company. The iShares® MSCI Emerging Markets Index Fund invests in global emerging markets and seeks investment results that correspond generally to the price and yield performance, before fees and expenses, of the MSCI Emerging Markets Index. iShares® is a registered trademark of Barclays Global Investors, N.A. ("BGI"). Neither BGI nor the iShares® Funds make any representations regarding the advisability of investing in the iShares® MSCI Emerging Markets Index Fund.
(i) Indexed security in which price and/or coupon is linked to the prices of a specific instrument or financial statistic (Note 2).
Currency Abbreviations:
HUF - Hungarian Forint
See accompanying notes to the financial statements.
22
GMO Emerging Markets Fund
(A Series of GMO Trust)
Statement of Assets and Liabilities — February 28, 2009
| Assets: | |||||||
| Investments in unaffiliated issuers, at value (cost $8,496,473,761) (Note 2) | $ | 5,624,436,070 | |||||
| Investments in affiliated issuers, at value (cost $61,252,102) (Notes 2 and 8) | 31,627,112 | ||||||
| Cash | 3,703,144 | ||||||
| Foreign currency, at value (cost $22,757,225) (Note 2) | 22,517,712 | ||||||
| Receivable for investments sold | 64,796,776 | ||||||
| Receivable for Fund shares sold | 15,050,000 | ||||||
| Dividends and interest receivable | 27,135,578 | ||||||
| Foreign taxes receivable | 3,195,912 | ||||||
| Unrealized appreciation on open forward currency contracts (Note 2) | 1,904,936 | ||||||
| Receivable for expenses reimbursed by Manager (Note 3) | 29,288 | ||||||
| Miscellaneous receivable | 3,222,923 | ||||||
| Total assets | 5,797,619,451 | ||||||
| Liabilities: | |||||||
| Payable for investments purchased | 108,205,645 | ||||||
| Payable for Fund shares repurchased | 1,661 | ||||||
| Payable to affiliate for (Note 3): | |||||||
| Management fee | 3,785,519 | ||||||
| Shareholder service fee | 435,323 | ||||||
| Trustees and Chief Compliance Officer of GMO Trust fees | 22,340 | ||||||
| Miscellaneous payable | 3,009,875 | ||||||
| Accrued expenses | 5,452,790 | ||||||
| Total liabilities | 120,913,153 | ||||||
| Net assets | $ | 5,676,706,298 | |||||
See accompanying notes to the financial statements.
23
GMO Emerging Markets Fund
(A Series of GMO Trust)
Statement of Assets and Liabilities — February 28, 2009 — (Continued)
| Net assets consist of: | |||||||
| Paid-in capital | $ | 10,785,022,080 | |||||
| Distributions in excess of net investment income | (52,553,842 | ) | |||||
| Distributions in excess of net realized gain | (2,152,722,952 | ) | |||||
| Net unrealized depreciation | (2,903,038,988 | ) | |||||
| $ | 5,676,706,298 | ||||||
| Net assets attributable to: | |||||||
| Class III shares | $ | 2,309,057,035 | |||||
| Class IV shares | $ | 1,345,811,010 | |||||
| Class V shares | $ | 795,585,920 | |||||
| Class VI shares | $ | 1,226,252,333 | |||||
| Shares outstanding: | |||||||
| Class III | 366,473,960 | ||||||
| Class IV | 214,598,103 | ||||||
| Class V | 127,080,529 | ||||||
| Class VI | 195,455,029 | ||||||
| Net asset value per share: | |||||||
| Class III | $ | 6.30 | |||||
| Class IV | $ | 6.27 | |||||
| Class V | $ | 6.26 | |||||
| Class VI | $ | 6.27 | |||||
See accompanying notes to the financial statements.
24
GMO Emerging Markets Fund
(A Series of GMO Trust)
Statement of Operations — Year Ended February 28, 2009
| Investment Income: | |||||||
| Dividends (net of withholding taxes of $34,712,834) | $ | 266,760,707 | |||||
| Interest | 4,782,333 | ||||||
| Securities lending income | 924,913 | ||||||
| Dividends from affiliated issuers (net of withholding taxes of $63,613) | 324,673 | ||||||
| Total investment income | 272,792,626 | ||||||
| Expenses: | |||||||
| Management fee (Note 3) | 77,280,205 | ||||||
| Shareholder service fee – Class III (Note 3) | 3,714,264 | ||||||
| Shareholder service fee – Class IV (Note 3) | 2,000,611 | ||||||
| Shareholder service fee – Class V (Note 3) | 796,784 | ||||||
| Shareholder service fee – Class VI (Note 3) | 2,322,019 | ||||||
| Custodian and fund accounting agent fees | 13,017,020 | ||||||
| Transfer agent fees | 59,262 | ||||||
| Audit and tax fees | 198,527 | ||||||
| Legal fees | 407,360 | ||||||
| Trustees fees and related expenses (Note 3) | 142,417 | ||||||
| Registration fees | 20,842 | ||||||
| Miscellaneous | 157,825 | ||||||
| Total expenses | 100,117,136 | ||||||
| Fees and expenses reimbursed by Manager (Note 3) | (597,813 | ) | |||||
| Expense reductions (Note 2) | (90,157 | ) | |||||
| Net expenses | 99,429,166 | ||||||
| Net investment income (loss) | 173,363,460 | ||||||
| Realized and unrealized gain (loss): | |||||||
| Net realized gain (loss) on: | |||||||
| Investments in unaffiliated issuers (net of foreign capital gains tax refund of $1,270,999) (Note 2) | (1,432,556,170 | ) | |||||
| Investments in affiliated issuers | (3,561,572 | ) | |||||
| Realized gains distributions from affiliated issuers (Note 8) | 18,263 | ||||||
| Foreign currency, forward contracts and foreign currency related transactions (net of CPMF tax of $21,092) (Note 2) | (34,149,921 | ) | |||||
| Net realized gain (loss) | (1,470,249,400 | ) | |||||
| Change in net unrealized appreciation (depreciation) on: | |||||||
| Investments in unaffiliated issuers | (5,937,777,632 | ) | |||||
| Investments in affiliated issuers | (60,074,104 | ) | |||||
| Foreign currency, forward contracts and foreign currency related transactions | (1,684,739 | ) | |||||
| Net unrealized gain (loss) | (5,999,536,475 | ) | |||||
| Net realized and unrealized gain (loss) | (7,469,785,875 | ) | |||||
| Net increase (decrease) in net assets resulting from operations | $ | (7,296,422,415 | ) | ||||
See accompanying notes to the financial statements.
25
GMO Emerging Markets Fund
(A Series of GMO Trust)
Statement of Changes in Net Assets
| Year Ended February 28, 2009 | Year Ended February 29, 2008 | ||||||||||
| Increase (decrease) in net assets: | |||||||||||
| Operations: | |||||||||||
| Net investment income (loss) | $ | 173,363,460 | $ | 145,969,612 | |||||||
| Net realized gain (loss) | (1,470,249,400 | ) | 4,146,502,911 | ||||||||
| Change in net unrealized appreciation (depreciation) | (5,999,536,475 | ) | (788,242,294 | ) | |||||||
| Net increase (decrease) in net assets from operations | (7,296,422,415 | ) | 3,504,230,229 | ||||||||
| Distributions to shareholders from: | |||||||||||
| Net investment income | |||||||||||
| Class III | (28,336,721 | ) | (48,626,770 | ) | |||||||
| Class IV | (18,273,132 | ) | (42,295,439 | ) | |||||||
| Class V | (14,786,743 | ) | (15,014,450 | ) | |||||||
| Class VI | (51,906,362 | ) | (80,326,387 | ) | |||||||
| Total distributions from net investment income | (113,302,958 | ) | (186,263,046 | ) | |||||||
| Net realized gains | |||||||||||
| Class III | (617,696,497 | ) | (949,235,421 | ) | |||||||
| Class IV | (460,831,288 | ) | (772,927,597 | ) | |||||||
| Class V | (246,543,395 | ) | (267,663,344 | ) | |||||||
| Class VI | (1,056,552,888 | ) | (1,418,555,036 | ) | |||||||
| Total distributions from net realized gains | (2,381,624,068 | ) | (3,408,381,398 | ) | |||||||
| (2,494,927,026 | ) | (3,594,644,444 | ) | ||||||||
| Net share transactions (Note 7): | |||||||||||
| Class III | 1,497,926,107 | (1,040,843,043 | ) | ||||||||
| Class IV | 219,935,401 | 486,322,877 | |||||||||
| Class V | 593,348,669 | 616,982,566 | |||||||||
| Class VI | (398,899,272 | ) | 853,624,667 | ||||||||
| Increase (decrease) in net assets resulting from net share transactions | 1,912,310,905 | 916,087,067 | |||||||||
| Purchase premiums and redemption fees (Notes 2 and 7): | |||||||||||
| Class III | 7,610,631 | 6,256,642 | |||||||||
| Class IV | 5,069,941 | 3,200,572 | |||||||||
| Class V | 3,612,956 | 2,262,707 | |||||||||
| Class VI | 22,495,973 | 7,226,204 | |||||||||
| Increase in net assets resulting from purchase premiums and redemption fees | 38,789,501 | 18,946,125 | |||||||||
| Total increase (decrease) in net assets resulting from net share transactions, purchase premiums and redemption fees | 1,951,100,406 | 935,033,192 | |||||||||
| Total increase (decrease) in net assets | (7,840,249,035 | ) | 844,618,977 | ||||||||
| Net assets: | |||||||||||
| Beginning of period | 13,516,955,333 | 12,672,336,356 | |||||||||
| End of period (including distributions in excess of net investment income of $52,553,842 and $89,222,065, respectively) | $ | 5,676,706,298 | $ | 13,516,955,333 | |||||||
See accompanying notes to the financial statements.
26
GMO Emerging Markets Fund
(A Series of GMO Trust)
Financial Highlights
(For a Class III share outstanding throughout each period)
| Year Ended February 28/29, | |||||||||||||||||||||||
| 2009 | 2008 | 2007 | 2006 | 2005 | |||||||||||||||||||
| Net asset value, beginning of period | $ | 20.48 | $ | 20.67 | $ | 22.49 | $ | 19.05 | $ | 15.78 | |||||||||||||
| Income (loss) from investment operations: | |||||||||||||||||||||||
| Net investment income (loss)† | 0.23 | 0.25 | 0.41 | 0.37 | 0.34 | ||||||||||||||||||
| Net realized and unrealized gain (loss) | (10.65 | ) | 5.94 | 3.00 | 6.24 | 4.40 | |||||||||||||||||
| Total from investment operations | (10.42 | ) | 6.19 | 3.41 | 6.61 | 4.74 | |||||||||||||||||
| Less distributions to shareholders: | |||||||||||||||||||||||
| From net investment income | (0.13 | ) | (0.31 | ) | (0.54 | ) | (0.43 | ) | (0.32 | ) | |||||||||||||
| From net realized gains | (3.63 | ) | (6.07 | ) | (4.69 | ) | (2.74 | ) | (1.15 | ) | |||||||||||||
| Total distributions | (3.76 | ) | (6.38 | ) | (5.23 | ) | (3.17 | ) | (1.47 | ) | |||||||||||||
| Net asset value, end of period | $ | 6.30 | $ | 20.48 | $ | 20.67 | $ | 22.49 | $ | 19.05 | |||||||||||||
| Total Return(a) | (58.61 | )% | 28.38 | % | 17.05 | % | 37.99 | % | 31.45 | % | |||||||||||||
| Ratios/Supplemental Data: | |||||||||||||||||||||||
| Net assets, end of period (000's) | $ | 2,309,057 | $ | 3,402,343 | $ | 4,276,782 | $ | 4,788,395 | $ | 4,433,098 | |||||||||||||
| Net expenses to average daily net assets | 1.10 | %(b) | 1.09 | %(b) | 1.07 | % | 1.10 | % | 1.11 | % | |||||||||||||
| Net investment income to average daily net assets | 1.77 | % | 1.04 | % | 1.87 | % | 1.88 | % | 2.17 | % | |||||||||||||
| Portfolio turnover rate | 99 | % | 60 | % | 44 | % | 41 | % | 57 | % | |||||||||||||
| Fees and expenses reimbursed by the Manager to average daily net assets: | 0.01 | % | 0.00 | %(c) | 0.01 | % | 0.01 | % | 0.01 | % | |||||||||||||
| Purchase premiums and redemption fees consisted of the following per share amounts:† | $ | 0.04 | $ | 0.04 | $ | 0.02 | $ | 0.01 | $ | 0.01 | |||||||||||||
(a) The total returns would have been lower had certain expenses not been reimbursed during the periods shown and assumes the effect of reinvested distributions. Calculation excludes purchase premiums and redemption fees which are borne by the shareholder.
(b) The net expense ratio does not include the effect of expense reductions, except for reimbursements related to securities lending transactions (Note 2).
(c) Ratio is less than 0.01%.
† Calculated using average shares outstanding throughout the period.
See accompanying notes to the financial statements.
27
GMO Emerging Markets Fund
(A Series of GMO Trust)
Financial Highlights
(For a Class IV share outstanding throughout each period)
| Year Ended February 28/29, | |||||||||||||||||||||||
| 2009 | 2008 | 2007 | 2006 | 2005 | |||||||||||||||||||
| Net asset value, beginning of period | $ | 20.40 | $ | 20.62 | $ | 22.45 | $ | 19.02 | $ | 15.75 | |||||||||||||
| Income (loss) from investment operations: | |||||||||||||||||||||||
| Net investment income (loss)† | 0.25 | 0.23 | 0.42 | 0.40 | 0.34 | ||||||||||||||||||
| Net realized and unrealized gain (loss) | (10.62 | ) | 5.95 | 2.99 | 6.20 | 4.41 | |||||||||||||||||
| Total from investment operations | (10.37 | ) | 6.18 | 3.41 | 6.60 | 4.75 | |||||||||||||||||
| Less distributions to shareholders: | |||||||||||||||||||||||
| From net investment income | (0.13 | ) | (0.33 | ) | (0.55 | ) | (0.43 | ) | (0.33 | ) | |||||||||||||
| From net realized gains | (3.63 | ) | (6.07 | ) | (4.69 | ) | (2.74 | ) | (1.15 | ) | |||||||||||||
| Total distributions | (3.76 | ) | (6.40 | ) | (5.24 | ) | (3.17 | ) | (1.48 | ) | |||||||||||||
| Net asset value, end of period | $ | 6.27 | $ | 20.40 | $ | 20.62 | $ | 22.45 | $ | 19.02 | |||||||||||||
| Total Return(a) | (58.59 | )% | 28.38 | % | 17.10 | % | 38.05 | % | 31.59 | % | |||||||||||||
| Ratios/Supplemental Data: | |||||||||||||||||||||||
| Net assets, end of period (000's) | $ | 1,345,811 | $ | 3,021,319 | $ | 2,599,002 | $ | 3,081,021 | $ | 3,255,865 | |||||||||||||
| Net expenses to average daily net assets | 1.06 | %(b) | 1.05 | %(b) | 1.03 | % | 1.05 | % | 1.06 | % | |||||||||||||
| Net investment income to average daily net assets | 1.86 | % | 0.98 | % | 1.94 | % | 2.03 | % | 2.13 | % | |||||||||||||
| Portfolio turnover rate | 99 | % | 60 | % | 44 | % | 41 | % | 57 | % | |||||||||||||
| Fees and expenses reimbursed by the Manager to average daily net assets: | 0.01 | % | 0.00 | %(c) | 0.01 | % | 0.01 | % | 0.01 | % | |||||||||||||
| Purchase premiums and redemption fees consisted of the following per share amounts:† | $ | 0.04 | $ | 0.02 | $ | 0.02 | $ | 0.01 | $ | 0.00 | (d) | ||||||||||||
(a) The total returns would have been lower had certain expenses not been reimbursed during the periods shown and assumes the effect of reinvested distributions. Calculation excludes purchase premiums and redemption fees which are borne by the shareholder.
(b) The net expense ratio does not include the effect of expense reductions, except for reimbursements related to securities lending transactions (Note 2).
(c) Ratio is less than 0.01%.
(d) Purchase premiums and redemption fees were less than $0.01 per share.
† Calculated using average shares outstanding throughout the period.
See accompanying notes to the financial statements.
28
GMO Emerging Markets Fund
(A Series of GMO Trust)
Financial Highlights
(For a Class V share outstanding throughout each period)
| Year Ended February 28/29, | Period from February 11, 2005 (commencement of operations) through February 28, | Period from March 1, 2004 through October 26, | |||||||||||||||||||||||||
| 2009 | 2008 | 2007 | 2006 | 2005(a) | 2004(a) | ||||||||||||||||||||||
| Net asset value, beginning of period | $ | 20.39 | $ | 20.61 | $ | 22.44 | $ | 19.02 | $ | 17.88 | $ | 15.77 | |||||||||||||||
| Income (loss) from investment operations: | |||||||||||||||||||||||||||
| Net investment income (loss)† | 0.22 | 0.23 | 0.43 | 0.22 | (0.01 | ) | 0.25 | ||||||||||||||||||||
| Net realized and unrealized gain (loss) | (10.58 | ) | 5.96 | 2.98 | 6.39 | 1.15 | (0.09 | ) | |||||||||||||||||||
| Total from investment operations | (10.36 | ) | 6.19 | 3.41 | 6.61 | 1.14 | 0.16 | ||||||||||||||||||||
| Less distributions to shareholders: | |||||||||||||||||||||||||||
| From net investment income | (0.14 | ) | (0.34 | ) | (0.55 | ) | (0.45 | ) | — | (0.07 | ) | ||||||||||||||||
| From net realized gains | (3.63 | ) | (6.07 | ) | (4.69 | ) | (2.74 | ) | — | (0.00 | )(b) | ||||||||||||||||
| Total distributions | (3.77 | ) | (6.41 | ) | (5.24 | ) | (3.19 | ) | — | (0.07 | ) | ||||||||||||||||
| Net asset value, end of period | $ | 6.26 | $ | 20.39 | $ | 20.61 | $ | 22.44 | $ | 19.02 | $ | 15.86 | |||||||||||||||
| Total Return(c) | (58.59 | )% | 28.43 | % | 17.11 | % | 38.12 | % | 6.38 | %** | 1.10 | %** | |||||||||||||||
| Ratios/Supplemental Data: | |||||||||||||||||||||||||||
| Net assets, end of period (000's) | $ | 795,586 | $ | 1,190,887 | $ | 679,988 | $ | 1,447,059 | $ | 38,564 | $ | 116,417 | |||||||||||||||
| Net expenses to average daily net assets | 1.03 | %(d) | 1.03 | %(d) | 1.01 | % | 1.04 | % | 1.03 | %* | 1.05 | %* | |||||||||||||||
| Net investment income to average daily net assets | 1.81 | % | 0.98 | % | 1.97 | % | 1.06 | % | (0.05 | )%(e)** | 1.70 | %(e)** | |||||||||||||||
| Portfolio turnover rate | 99 | % | 60 | % | 44 | % | 41 | % | 57 | %*** | 57 | %*** | |||||||||||||||
| Fees and expenses reimbursed by the Manager to average daily net assets: | 0.01 | % | 0.00 | %(f) | 0.01 | % | 0.01 | % | 0.02 | %* | 0.01 | %* | |||||||||||||||
| Purchase premiums and redemption fees consisted of the following per share amounts:† | $ | 0.05 | $ | 0.05 | $ | 0.03 | $ | 0.02 | — | — | |||||||||||||||||
(a) The class was inactive from October 27, 2004 to February 11, 2005.
(b) Distributions from net realized gains were less than $0.01 per share.
(c) The total returns would have been lower had certain expenses not been reimbursed during the periods shown and assumes the effect of reinvested distributions. Calculation excludes purchase premiums and redemption fees which are borne by the shareholder.
(d) The net expense ratio does not include the effect of expense reductions, except for reimbursements related to securities lending transactions (Note 2).
(e) The ratio for the period has not been annualized since the Fund believes it would not be appropriate because the Fund's dividend income is not earned ratably throughout the fiscal year.
(f) Ratio is less than 0.01%.
† Calculated using average shares outstanding throughout the period.
* Annualized.
** Not annualized.
*** Calculation represents portfolio turnover of the Fund for the year ended February 28, 2005.
See accompanying notes to the financial statements.
29
GMO Emerging Markets Fund
(A Series of GMO Trust)
Financial Highlights
(For a Class VI share outstanding throughout each period)
| Year Ended February 28/29, | |||||||||||||||||||||||
| 2009 | 2008 | 2007 | 2006 | 2005 | |||||||||||||||||||
| Net asset value, beginning of period | $ | 20.42 | $ | 20.63 | $ | 22.45 | $ | 19.03 | $ | 15.76 | |||||||||||||
| Income (loss) from investment operations: | |||||||||||||||||||||||
| Net investment income (loss)† | 0.23 | 0.25 | 0.42 | 0.38 | 0.34 | ||||||||||||||||||
| Net realized and unrealized gain (loss) | (10.61 | ) | 5.95 | 3.01 | 6.23 | 4.41 | |||||||||||||||||
| Total from investment operations | (10.38 | ) | 6.20 | 3.43 | 6.61 | 4.75 | |||||||||||||||||
| Less distributions to shareholders: | |||||||||||||||||||||||
| From net investment income | (0.14 | ) | (0.34 | ) | (0.56 | ) | (0.45 | ) | (0.33 | ) | |||||||||||||
| From net realized gains | (3.63 | ) | (6.07 | ) | (4.69 | ) | (2.74 | ) | (1.15 | ) | |||||||||||||
| Total distributions | (3.77 | ) | (6.41 | ) | (5.25 | ) | (3.19 | ) | (1.48 | ) | |||||||||||||
| Net asset value, end of period | $ | 6.27 | $ | 20.42 | $ | 20.63 | $ | 22.45 | $ | 19.03 | |||||||||||||
| Total Return(a) | (58.61 | )% | 28.49 | % | 17.20 | % | 38.07 | % | 31.63 | % | |||||||||||||
| Ratios/Supplemental Data: | |||||||||||||||||||||||
| Net assets, end of period (000's) | $ | 1,226,252 | $ | 5,902,406 | $ | 5,116,565 | $ | 3,203,435 | $ | 2,083,376 | |||||||||||||
| Net expenses to average daily net assets | 1.00 | %(b) | 1.00 | %(b) | 0.98 | % | 1.00 | % | 1.01 | % | |||||||||||||
| Net investment income to average daily net assets | 1.83 | % | 1.05 | % | 1.93 | % | 1.94 | % | 2.15 | % | |||||||||||||
| Portfolio turnover rate | 99 | % | 60 | % | 44 | % | 41 | % | 57 | % | |||||||||||||
| Fees and expenses reimbursed by the Manager to average daily net assets: | 0.01 | % | 0.00 | %(c) | 0.01 | % | 0.01 | % | 0.01 | % | |||||||||||||
| Purchase premiums and redemption fees consisted of the following per share amounts:† | $ | 0.07 | $ | 0.03 | $ | 0.02 | $ | 0.02 | $ | 0.03 | |||||||||||||
(a) The total returns would have been lower had certain expenses not been reimbursed during the periods shown and assumes the effect of reinvested distributions. Calculation excludes purchase premiums and redemption fees which are borne by the shareholder.
(b) The net expense ratio does not include the effect of expense reductions, except for reimbursements related to securities lending transactions (Note 2).
(c) Ratio is less than 0.01%.
† Calculated using average shares outstanding throughout the period.
See accompanying notes to the financial statements.
30
GMO Emerging Markets Fund
(A Series of GMO Trust)
Notes to Financial Statements
February 28, 2009
1. Organization
GMO Emerging Markets Fund (the "Fund") is a series of GMO Trust (the "Trust"). The Fund is registered under the Investment Company Act of 1940, as amended, as an open-end, non-diversified management investment company. The Fund is advised and managed by Grantham, Mayo, Van Otterloo & Co. LLC (the "Manager" or "GMO"). The Trust was established as a Massachusetts business trust under the laws of The Commonwealth of Massachusetts on June 24, 1985. The Declaration of Trust permits the Trustees of the Trust ("Trustees") to create an unlimited number of series of shares ("Funds") and to subdivide Funds into classes.
The Fund seeks high total return. The Fund seeks to achieve its investment objective by outperforming the S&P/IFCI (Investable) Composite Index. The Fund typically makes equity investments in companies whose stocks are traded in the securities markets of the world's non-developed markets ("emerging markets"), which excludes countries that are included in the MSCI EAFE Index.
Throughout the year ended February 28, 2009, the Fund had four classes of shares outstanding: Class III, Class IV, Class V and Class VI. Each class of shares bears a different level of shareholder service fees.
The financial statements of the series of the Trust in which the Fund invests ("underlying fund") should be read in conjunction with the Fund's financial statements. These financial statements are available, without charge, upon request, by calling (617) 346-7646 (collect). Shares of GMO Special Purpose Holding Fund are not publicly available for direct purchase.
2. Significant accounting policies
The following is a summary of significant accounting policies followed by the Fund in the preparation of its financial statements. These policies are in conformity with accounting principles generally accepted in the United States of America ("U.S. GAAP") and have been consistently followed by the Fund in preparing its financial statements. The preparation of financial statements in accordance with U.S. GAAP requires management to make estimates and assumptions that affect the reported amounts and disclosures in the financial statements. Actual results could differ from those estimates. The accounting records of the Fund are maintained in U.S. dollars.
Portfolio valuation
Securities listed on a securities exchange for which market quotations are readily available are valued at the last sale price or official closing price on each business day, or if there is no such reported sale or official closing price, at the most recent quoted bid price. Unlisted securities for which market quotations are readily available are generally valued at the most recent quoted bid price. Debt instruments with a remaining maturity of sixty days or less are generally valued at amortized cost, which approximates fair
31
GMO Emerging Markets Fund
(A Series of GMO Trust)
Notes to Financial Statements — (Continued)
February 28, 2009
value. Shares of investment funds are generally valued at their net asset value. Securities for which quotations are not readily available or whose values the Manager has determined to be unreliable are valued at fair value as determined in good faith by the Trustees or persons acting at their direction pursuant to procedures approved by the Trustees. By its nature, a fair value price is a good faith estimate of the value of a security at a given point in time and may not reflect the value that would be realized if the security were sold. The difference between a fair value price and the value realized upon a sale could be material. Because many foreign equity securities markets and exchanges close prior to the close of the New York Stock Exchange ("NYSE"), closing prices for foreign securities in those markets or on those exchanges do not reflect the events that occur after that close but before the close of the NYSE. As a resu lt, the Fund generally values foreign equity securities using fair value prices, which are based on adjustments to closing prices supplied by a third party vendor based on that vendor's proprietary models. As of February 28, 2009, 59.79% of the net assets of the Fund were valued using fair value prices based on models used by a third party vendor.
Indian regulators alleged in 2003 that the Fund violated certain conditions under which it was granted permission to operate in India and have restricted a portion of the Fund's locally held assets pending resolution of the dispute. The amount of these restricted assets represents less than 0.1% of the Fund's net assets as of February 28, 2009. The valuation of this possible claim and all matters relating to the Fund's response to these allegations are subject to the supervision and control of the Trustees, and all costs in respect of this matter are being borne by the Fund.
GMO Special Purpose Holding Fund ("SPHF"), an investment of the Fund, has litigation pending against various entities related to the default of certain asset-backed securities previously held by SPHF. The outcome of the lawsuits against the remaining defendants is not known and any potential recoveries are not reflected in the net asset value of SPHF. For the year ended February 28, 2009, the Fund received $18,263 through SPHF in connection with settlement agreements related to that litigation.
In September 2006, the Financial Accounting Standards Board ("FASB") issued Statement of Financial Accounting Standards No. 157, Fair Value Measurements ("SFAS 157"). SFAS 157 is effective for the Fund's current fiscal year. While the adoption of SFAS 157 does not have an effect on the Fund's net asset value, it does require additional disclosures about fair value measurements. SFAS 157 establishes a
32
GMO Emerging Markets Fund
(A Series of GMO Trust)
Notes to Financial Statements — (Continued)
February 28, 2009
three-level hierarchy for disclosure of fair value measurements. The valuation hierarchy is based upon the reliability of inputs to the valuation of the Fund's investments. The three levels are defined as follows:
Level 1 – Valuations based on quoted prices for identical securities in active markets.
Level 2 – Valuations determined using other significant direct or indirect observable inputs.
Level 3 – Valuations based on inputs that are unobservable and significant. The Fund utilized the following fair value techniques on Level 3 investments: The Fund's securities in Thailand were subject to a premium adjustment upon exceeding foreign ownership limitations. The Fund valued various investment funds based on valuations provided by fund sponsors and adjusted the values for liquidity considerations as well as the timing of the receipt of information. The Fund valued certain private equity securities based on values of underlying securities to which the securities are linked, and certain other equity securities based on the last traded exchange price adjusted for the movement in a related index. The Fund considered certain bankrupt securities to be worthless.
The inputs or methodology used for valuing securities are not necessarily an indication of the risk associated with investing in those securities.
The following is a summary of the fair valuations according to inputs used as of February 28, 2009 in valuing the Fund's investments:
| Asset Valuation Inputs | Investments in Securities | Other Financial Instruments* | |||||||||
| Level 1 - Quoted Prices | $ | 1,921,391,877 | $ | — | |||||||
| Level 2 - Other Significant Observable Inputs | 3,411,109,476 | 1,904,936 | |||||||||
| Level 3 - Significant Unobservable Inputs | 323,561,829 | — | |||||||||
| Total | $ | 5,656,063,182 | $ | 1,904,936 | |||||||
* Other financial instruments include forward currency contracts.
| Liability Valuation Inputs | Investments in Securities | Other Financial Instruments | |||||||||
| Level 1 - Quoted Prices | $ | — | $ | — | |||||||
| Level 2 - Other Significant Observable Inputs | — | — | |||||||||
| Level 3 - Significant Unobservable Inputs | — | — | |||||||||
| Total | $ | — | $ | — | |||||||
For the underlying fund's summary of valuation inputs please refer to the respective fund's portfolio valuation note.
33
GMO Emerging Markets Fund
(A Series of GMO Trust)
Notes to Financial Statements — (Continued)
February 28, 2009
The following is a reconciliation of investments in which significant unobservable inputs (Level 3) were used in determining value:
| Investments in Securities | Other Financial Instruments | ||||||||||
| Balance as of February 29, 2008 | $ | 1,017,388,971 | $ | — | |||||||
| Realized gain (loss) | (20,526,790 | ) | — | ||||||||
| Change in unrealized appreciation/depreciation | (501,191,559 | ) | — | ||||||||
| Net purchases (sales) | (172,108,793 | ) | — | ||||||||
| Net transfers in and/or out of Level 3 | — | — | |||||||||
| Balance as of February 28, 2009 | $ | 323,561,829 | $ | — | |||||||
Foreign currency translation
The market values of foreign securities, currency holdings and related assets and liabilities are translated to U.S. dollars based on the 4 p.m. New York time exchange rates each business day. Income and expenses denominated in foreign currencies are translated at the 4 p.m. New York time exchange rates on the business day the income and expenses are accrued or incurred. The Fund does not isolate realized and unrealized gains and losses attributable to changes in exchange rates from gains and losses that arise from changes in the market value of investments. Such fluctuations are included with net realized and unrealized gain or loss on investments. Net realized gains and losses on foreign currency transactions represent gains and losses on disposition of currencies and forward currency contracts, currency gains and losses realized between the trade and settlement dates on securities transactions, and the difference between the amount of investment income and foreign withholding taxes recorded on the Fund's accounting records and the U.S. dollar equivalent amounts actually received or paid.
Forward currency contracts
The Fund may enter into forward currency contracts including forward cross currency contracts. A forward currency contract is an agreement between two parties to buy and sell a currency at a set price on a future date. The market value of a forward currency contract fluctuates with changes in forward currency exchange rates. Forward currency contracts are marked to market daily using rates supplied by a quotation service and changes in value are recorded by the Fund as an unrealized gain or loss. Realized gains or losses equal to the difference between the value of the contract at the time it was opened and the value at the time it was closed are recorded upon delivery or receipt of the currency or, if a forward currency contract is offset by entering into another forward currency contract with the same broker, upon settlement of the net gain or loss. These contracts may involve market risk in excess of the unrealized gain or lo ss reflected in the Fund's Statement of Assets and Liabilities. They expose the Fund to the risk of unfavorable movements in currency values and the risk that the counterparty will be unable or unwilling to meet the terms of the contracts. Forward currency contracts outstanding at the end of the period are listed in the Fund's Schedule of Investments.
34
GMO Emerging Markets Fund
(A Series of GMO Trust)
Notes to Financial Statements — (Continued)
February 28, 2009
Futures contracts
The Fund may purchase and sell futures contracts. Upon entering into a futures contract, the Fund is required to deposit cash, U.S. government and agency obligations, or other liquid assets with the futures clearing broker in accordance with the initial margin requirements of the broker or exchange. In addition, the Fund maintains cash or securities in an amount that at least equals the net amount payable in the event the Fund must deliver the full amount of the contract. Futures contracts are marked to market daily and an appropriate payable or receivable for the change in value ("variation margin") is recorded by the Fund. The payable or receivable is settled on the following business day. Gains or losses are recognized but not considered realized until the contracts expire or are closed. Futures contracts involve, to varying degrees, risk of loss in excess of the variation margin disclosed in the Statement of Assets and Liabi lities. Under some circumstances, futures exchanges may establish daily limits on the amount that the price of a futures contract can vary from the previous day's settlement price, thereby effectively preventing liquidation of unfavorable positions. Losses may arise from changes in the value of the underlying instrument if the Fund is unable to liquidate a futures position due to an illiquid secondary market for the contract or the imposition of price limits, or if counterparties do not perform under the contract terms. Futures contracts are generally valued at the settlement price established each day by the board of trade or exchange on which they are traded. Because many foreign exchanges close prior to the close of the New York Stock Exchange ("NYSE"), closing prices for foreign futures in those markets or on those markets or on those exchanges do not reflect the events that occur after that close but before the close of the NYSE. As a result, the Fund generally values foreign futures using fair value pr ices, which are based on adjustments to closing prices supplied by a third party vendor based on that vendor's proprietary models. The Fund had no futures contracts outstanding at the end of the period.
Options
The Fund may write (i.e., sell) call and put options. Writing options alters the Fund's exposure to the underlying instrument by, in the case of a call option, obligating the Fund to sell the underlying instrument at a set price to the option-holder and, in the case of a put option, obligating the Fund to purchase the underlying instrument at a set price from the option-holder. In the case of an index option, settlement will be in cash. When the Fund writes a call or put option, an amount equal to the premium received is recorded as a liability and subsequently marked to market to reflect the current value of the option written. Premiums received from writing options that expire are treated as realized gains. Premiums received from writing options that are exercised or closed are deducted from the amounts paid on the underlying future, security or currency transaction to determine the realized gain or loss. The Fund as a writer of an option has no control over whether the underlying future, security or currency may be sold (call) or purchased (put) and as a result bears the market risk of an unfavorable change in the price of the future, security or currency underlying the option. In the event that the Fund writes uncovered put or call options (i.e. options for investments that the Fund does not own), it bears the risk of substantial losses if the price of the underlying instrument increases during the term of the option. Options expose the Fund to the risk the Fund may not be able to enter into a closing transaction because of an illiquid market. The Fund had no open written option contracts during the period.
35
GMO Emerging Markets Fund
(A Series of GMO Trust)
Notes to Financial Statements — (Continued)
February 28, 2009
The Fund may also purchase put and call options. Purchasing options alters the Fund's exposure to the underlying instrument by, in the case of a call option, entitling the Fund to purchase the underlying instrument at a set price from the writer of the option and, in the case of a put option, entitling the Fund to sell the underlying instrument at a set price to the writer of the option. The Fund pays a premium for a purchased option. That premium is disclosed in the Schedule of Investments and is subsequently marked to market to reflect the current value of the option. Premiums paid for purchasing options that expire are treated as realized losses. Premiums paid for purchasing options that are exercised or closed are deducted from the proceeds on the closing transaction to determine the realized gain or loss. The risk associated with purchasing put and call options is limited to the premium paid. The Fund had no purchased optio n contracts outstanding at the end of the period.
The Fund values exchange traded options at the last sale price, or if no sale is reported, the last bid price for options it has purchased and the last ask price for options it has written. The Fund values options traded over-the-counter using inputs provided by primary pricing sources and industry standard models.
Indexed securities
The Fund may invest in indexed securities. Indexed securities are securities whose redemption values and/or coupons are linked to the prices of a specific instrument or financial statistic. The Fund uses indexed securities to increase or decrease its exposure to different underlying instruments and to gain exposure to markets in which investing through conventional securities is difficult. Indexed securities held by the Fund at the end of the period are listed in the Fund's Schedule of Investments.
Swap agreements
The Fund may enter into various types of swap agreements, including without limitation, interest rate, total return, credit default and variance swap agreements. A swap agreement is an agreement to exchange the return generated by one instrument for the return generated by another instrument. When entering into a swap agreement, the Fund and/or the swap counterparty may post or receive cash or securities as collateral. The party posting the collateral typically receives the interest associated with or payments related to the collateral and has the risk of loss related to the collateral.
Interest rate swap agreements involve an exchange by the parties of their respective commitments to pay or right to receive interest, e.g., an exchange of floating rate interest payments for fixed rate interest payments with respect to the notional amount of principal.
Total return swap agreements involve a commitment by one party to pay interest to the other party in exchange for a payment to it from the other party based on the return of a reference instrument (e.g., a security or basket of securities), both based on notional amounts. To the extent the return of the reference instrument exceeds or falls short of the interest payments, one party will receive a payment from or make a payment to the other party.
36
GMO Emerging Markets Fund
(A Series of GMO Trust)
Notes to Financial Statements — (Continued)
February 28, 2009
In a credit default swap agreement, one party makes payments to another party in exchange for the right to receive a specified return if a credit event occurs with respect to a referenced entity or entities. Buying credit default protection reduces the buyer's exposure in the event of an issuer's default (e.g., it reduces risk where a party owns a security issued by or otherwise has exposure to the issuer). Selling credit default protection subjects the seller to exposure to an issuer's default. A seller of credit default protection receives payments in return for its obligation to pay the principal amount of a debt security (or other agreed-upon value) to the other party upon the occurrence of a credit event (e.g., issuer default or similar event). If no credit event occurs, the seller has no payment obligations. For credit default swap agreements on asset-backed securities, a credit event may be triggered by such events as the issuer's failure to pay interest or principal, an agreement of the holders of an asset-backed security to a maturity extension, a rating downgrade on the security or a write-down on the collateral underlying the security. For credit default swap agreements on corporate or sovereign issuers, a credit event may be triggered by such events as the issuer's bankruptcy, failure to pay interest or principal, repudiation/moratorium or restructuring.
Variance swap agreements involve an agreement by two parties to exchange cash flows based on the measured variance (or square of volatility) of a specified underlying asset. One party agrees to exchange a "fixed rate" or strike price payment for the "floating rate" or realized price variance on the underlying asset with respect to the notional amount. At inception, the strike price chosen is generally fixed at a level such that the fair value of the swap is zero. At the expiration date, the amount paid by one party to the other is the difference between the realized price variance of the underlying asset and the strike price multiplied by the notional amount. A receiver of the realized price variance would receive a payment when the realized price variance of the underlying asset is greater than the strike price and would make a payment when that variance is less than the strike price. A payer of the realized price variance woul d make a payment when the realized price variance of the underlying asset is greater than the strike price and would receive a payment when that variance is less than the strike price. This type of agreement is essentially a forward contract on the future realized price variance of the underlying asset.
The Fund prices its swap agreements daily using models that may incorporate quotations from market makers and records the change in value, if any, as unrealized gain or loss in the Statement of Operations. Payments received or made on swap agreements are recorded as realized gain or loss in the Statement of Operations. Gains or losses are realized upon termination of the swap agreements.
Swap agreements often are not actively traded on financial markets. The values assigned to them may differ significantly from the values that would be realized upon termination, and the differences could be material. Entering into swap agreements involves credit, legal, market and documentation risk that is not reflected in the amounts reported in the Statement of Assets and Liabilities. Such risks include the possibility that the party with whom the Fund contracts may default on its obligations to perform or disagree as to the meaning of contractual terms, or that the collateral that party posts may be insufficient or not timely received by the Fund. Credit risk may be particularly acute in an environment where
37
GMO Emerging Markets Fund
(A Series of GMO Trust)
Notes to Financial Statements — (Continued)
February 28, 2009
financial services firms are exposed to systemic risks of the type evidenced by the insolvency of Lehman Brothers and subsequent market disruptions. The Fund had no swap agreements outstanding at the end of the period.
Securities lending
The Fund may lend its securities to qualified brokers. The loans are collateralized with cash or liquid securities with a market value at least equal to the market value of the securities upon entering into the loan. As with other extensions of credit, the Fund may bear the risk of loss with respect to the investment of the collateral, the risk of delay in and/or inability to exercise its rights with respect to the collateral, and the risk of delay in recovery or loss of rights in the loaned securities should the borrower of the securities fail financially. If a loan is collateralized by U.S. government securities, the Fund receives a fee from the borrower. If a loan is collateralized by cash, the Fund typically invests the cash collateral for its own account. As of February 28, 2009 the Fund had no securities on loan.
Taxes and distributions
The Fund intends to qualify each tax year as a regulated investment company under Subchapter M of the Internal Revenue Code of 1986, as amended (the "Code"). The Fund intends to distribute substantially all of its net investment income and all of its net realized short-term and long-term capital gain, if any, after giving effect to any available capital loss carryforwards for U.S. federal income tax purposes. Therefore, no provision for U.S. federal income or excise tax is necessary. Taxes on foreign interest and dividend income are generally withheld in accordance with the applicable country's tax treaty with the United States. The foreign withholding rates applicable to a Fund's investments in certain foreign jurisdictions may be higher if a significant portion of the Fund is held by non-U.S. shareholders.
The Fund's policy is to declare and pay distributions from net investment income, if any, semiannually, and from net realized short-term and long-term capital gain, if any, at least annually. All distributions are paid in shares of the Fund, at net asset value, unless the shareholder elects to receive cash distributions. Distributions to shareholders are recorded by the Fund on the ex-dividend date.
Foreign taxes paid by the Fund may be treated, to the extent permissible under the Code and if the Fund so elects, as if paid by the shareholders of the Fund.
The Fund may be subject to capital gains and repatriation taxes imposed by certain countries in which it invests. For the year ended February 28, 2009, the Fund received $1,270,999 in foreign capital gains tax refund, which is included in net realized gain (loss) in the Statement of Operations.
The Fund is subject to a Contribuição Provisória sobre Movimentações Financiera ("CPMF") tax which is applied to foreign exchange transactions representing capital inflows or outflows to/from the Brazilian market. The CPMF tax has been included in the net realized gain (loss) on investments throughout the period. For the year ended February 28, 2009, the Fund incurred $21,092 in CPMF tax, which is included
38
GMO Emerging Markets Fund
(A Series of GMO Trust)
Notes to Financial Statements — (Continued)
February 28, 2009
in net realized gain (loss) on foreign currency, forward contracts and foreign currency related transactions in the Statement of Operations.
The Fund is currently subject to a Taiwanese security transaction tax of 0.30% of the transaction amount on equities, which must be paid by the Fund upon the sale or transfer of any portfolio securities subject to that tax.
Income and capital gain distributions are determined in accordance with U.S. federal income tax regulations, which may differ from U.S. GAAP. Certain capital accounts in the financial statements are periodically adjusted for permanent differences in order to reflect their tax character. These adjustments have no impact on net assets or net asset value per share. Temporary differences that arise from recognizing certain items of income, expense, gain or loss in different periods for financial statement and tax purposes will reverse at some time in the future. Distributions in excess of net investment income or net realized gains are temporary over-distributions for financial statement purposes resulting from differences in the recognition or classification of income or distributions for financial statement and tax purposes.
U.S. GAAP and tax accounting differences primarily relate to losses on wash sale transactions, partnership interest tax allocation, post-October capital losses and passive foreign investment company transactions.
The following reclassification represents the amount necessary to report the stated components of net assets on a tax basis, excluding certain temporary differences, as of February 28, 2009. The financial highlights exclude these adjustments.
| Distributions In Excess of Net Investment Income | Distributions in Excess of Realized Gain | Paid-in Capital | |||||||||
| $ | (23,392,279 | ) | $ | 23,481,553 | $ | (89,274 | ) | ||||
The tax character of distributions declared to shareholders is as follows:
| 2/28/2009 | 2/29/2008 | ||||||||||
| Ordinary income (including any net short-term capital gain) | $ | 153,846,203 | $ | 563,852,184 | |||||||
| Net long-term capital gain | 2,341,080,823 | 3,030,792,260 | |||||||||
| Total distributions | $ | 2,494,927,026 | $ | 3,594,644,444 | |||||||
Distributions in excess of tax basis earnings and profits, if significant, are reported in the financial statements as a return of capital for tax purposes.
39
GMO Emerging Markets Fund
(A Series of GMO Trust)
Notes to Financial Statements — (Continued)
February 28, 2009
As of February 28, 2009, the components of distributable earnings on a tax basis consisted of the following:
| Undistributed ordinary income (including any net short-term capital gain) | $ | 17,042,086 | |||||
As of February 28, 2009, the Fund elected to defer to March 1, 2009 post-October capital losses of $1,670,327,437.
As of February 28, 2009, the approximate cost for U.S. federal income tax purposes and gross and net unrealized appreciation (depreciation) in value of investments were as follows:
| Aggregate Cost | Gross Unrealized Appreciation | Gross Unrealized (Depreciation) | Net Unrealized Appreciation (Depreciation) | ||||||||||||
| $ | 9,102,590,554 | $ | 199,833,580 | $ | (3,646,360,952 | ) | $ | (3,446,527,372 | ) | ||||||
The Fund is subject to the provisions of Financial Accounting Standards Board Interpretation No. 48 ("FIN 48"), Accounting for Uncertainty in Income Taxes — an Interpretation of FASB Statement No. 109. FIN 48 sets forth a minimum threshold for financial statement recognition of a tax position taken or expected to be taken in a tax return that could affect the Fund's financial statements. The Fund did not have any unrecognized tax benefits or liabilities at February 28, 2009, nor did it have any increases or decreases in unrecognized tax benefits or liabilities for the period then ended. The Fund is subject to examination prior to the expiration of the statute of limitations by U.S. federal and state tax authorities for tax returns filed.
Security transactions and related investment income
Security transactions in the financial statements are accounted for on the trade date. Dividend income, net of applicable foreign withholding taxes, if any, is recorded on the ex-dividend date or, if later, when the Fund is informed of the ex-dividend date. Interest income is recorded on the accrual basis and is adjusted for the amortization of premiums and accretion of discounts. Principal on inflation indexed securities is adjusted for inflation and any increase or decrease is recorded as interest income or loss. Income is not recognized on securities for which collection is not expected. Non-cash dividends, if any, are recorded at the fair market value of the asset received. In determining the net gain or loss on securities sold, the Fund uses the identified cost basis for the purposes of determining the cost basis.
Expenses
The majority of the expenses of the Trust are directly identifiable to an individual fund. Expenses that are not readily identifiable to a specific fund are allocated taking into consideration, among other things, the nature and type of expense and the relative size of the funds. Investment income, common expenses and realized and unrealized gains and losses are allocated pro rata among the classes of shares of the Fund
40
GMO Emerging Markets Fund
(A Series of GMO Trust)
Notes to Financial Statements — (Continued)
February 28, 2009
based on the relative net assets of each class. Shareholder service fees, which are directly attributable to a class of shares, are charged to that class's operations. In addition, the Fund incurs fees and expenses indirectly as a shareholder in the underlying fund.
Brown Brothers Harriman & Co. ("BBH") serves as custodian and fund accounting agent of the Fund. State Street Bank and Trust Company ("State Street") serves as transfer agent of the Fund. BBH and State Street's fees may be reduced by an earnings allowance calculated on the average daily cash balances the Fund maintains with each agent. The Fund receives the benefit of the earnings allowance. In addition, Goldman Sachs Agency Lending, the Fund's securities lending agent, has agreed to reimburse the Fund for certain transactional expenses related to securities lending activity. Credit balances or expense reimbursements used to reduce fees, if any, are reported as a reduction of expenses in the Statement of Operations.
Purchases and redemptions of Fund shares
As of February 28, 2009, the premium on cash purchases and fee on cash redemptions of Fund shares were each 0.80% of the amount invested or redeemed. The Fund may impose a new purchase premium and/or redemption fee, or modify or eliminate an existing purchase premium and/or redemption fee, at any time. If the Manager determines that any portion of a cash purchase or redemption is offset by a corresponding cash redemption or purchase on the same day, the Fund will ordinarily waive or reduce the purchase premium or redemption fee with respect to that portion. In addition, the Fund may waive or reduce the purchase premium or redemption fee in extraordinary circumstances if the purchase or redemption will not cause the Fund to incur transaction costs. All purchase premiums and redemption fees are paid to the Fund and recorded by the Fund as paid-in capital. These fees are allocated relative to each class's net assets on the share tr ansaction date. The Fund will waive or reduce the purchase premium relating to the in-kind portion of a purchase transaction except for estimated or known transaction costs (e.g. stamp duties and transfer taxes) incurred by the Fund as a result of the transfer of the purchasing shareholder's securities to the Fund. In-kind redemption transactions are generally not subject to redemption fees except when they include a cash component. However, when a substantial portion of a Fund is being redeemed, the Fund may charge a redemption fee based on estimated or known transaction costs resulting from those redemptions. The Fund charges no premium for reinvested distributions.
Investment risks
Investments in securities of issuers in emerging countries present risks that are not presented by many other investments. Many emerging countries are subject to political and/or economic instability. The securities markets of emerging countries are generally smaller and less developed than the securities markets of the U.S. and developed foreign markets. Further, countries may expropriate or impose various types of foreign currency regulations or controls that impede the Fund's ability to repatriate amounts it receives. The Fund may acquire interests in securities of companies in some countries based on the Manager's expectations that conditions in those countries will improve. These factors may result in significant volatility in the values of the Fund's holdings. The markets in emerging countries are typically less liquid than those of developed markets. Accordingly, the Fund may not be able to realize in an actual sale amoun ts approximating the values it has placed on its holdings.
41
GMO Emerging Markets Fund
(A Series of GMO Trust)
Notes to Financial Statements — (Continued)
February 28, 2009
Among other trading agreements, the Fund is party to International Swaps and Derivatives Association, Inc. Master Agreements ("ISDA Agreements") with select counterparties that generally govern over-the-counter derivative transactions entered into by the Fund. The ISDA Master Agreements typically include standard representations and warranties as well as contractual terms related to collateral, events of default, termination events, and other standard provisions. Termination events may include the decline in the net assets of the Fund below a certain level over a specified period of time and may entitle a counterparty to elect to terminate early with respect to some or all the transactions under the ISDA Agreement with that counterparty. Such an election by one or more of the counterparties could have a material impact on the Fund's operations. Due to declines in the net assets of the Fund during the year ended February 28, 2009 , one or more counterparties may be entitled to terminate early but none has taken such action.
Recently issued accounting pronouncement
In March 2008, FASB issued Statement of Financial Accounting Standards No. 161, Disclosures about Derivative Instruments and Hedging Activities ("SFAS 161"). SFAS 161 is effective for fiscal years and interim periods beginning after November 15, 2008. SFAS 161 requires enhanced disclosures about the Fund's derivative and hedging activities. The Manager is currently evaluating the impact the adoption of SFAS 161 will have on the Fund's financial statement disclosures.
3. Fees and other transactions with affiliates
GMO receives a management fee for the services it provides to the Fund. That fee is paid monthly at the annual rate of 0.81% of average daily net assets. The Fund has adopted a Shareholder Service Plan under which the Fund pays GMO a shareholder service fee for client and shareholder service, reporting, and other support. Pursuant to the Shareholder Service Plan, the shareholder service fee is calculated based on average daily net assets of each class at the annual rate of 0.15% for Class III shares, 0.105% for Class IV shares, 0.085% for Class V shares, and 0.055% for Class VI shares.
Through at least June 30, 2009, the Manager has contractually agreed to reimburse the Fund for Fund expenses incurred through that date to the extent the Fund's total annual operating expenses (excluding "Excluded Expenses", as defined below) exceed 0.81% of the Fund's average daily net assets. Excluded Expenses include shareholder service fees, custodial fees, expenses indirectly incurred by investment in the underlying funds, fees and expenses of the independent Trustees of the Trust, fees and expenses for legal services not approved by the Manager for the Trust, compensation and expenses of the Trust's Chief Compliance Officer ("CCO") (excluding any employee benefits), brokerage commissions, securities lending fees and expenses, interest expense, transfer taxes, and other investment-related costs (including expenses associated with investments in any company that is an investment company or would be an investment company unde r the 1940 Act, but for the exceptions to the definition of investment company provided in Section 3(c)(1) and 3(c)(7) of the 1940 Act), hedging transaction fees, extraordinary, non-recurring and certain other unusual expenses (including taxes).
42
GMO Emerging Markets Fund
(A Series of GMO Trust)
Notes to Financial Statements — (Continued)
February 28, 2009
The Fund incurs fees and expenses indirectly as a shareholder in the GMO Special Purpose Holding Fund. For the year ended February 28, 2009, these indirect fees and expenses expressed as an annualized percentage of the Fund's average daily net assets were as follows:
| Indirect Net Expenses (excluding shareholder service fees) | Indirect Shareholder Service Fees | Total Indirect Expenses | |||||||||
| < 0.001% | 0.000 | % | < 0.001% | ||||||||
The Fund's portion of the fees paid by the Trust to the Trust's independent Trustees and CCO during the year ended February 28, 2009 was $120,244 and $69,243, respectively. The compensation and expenses of the CCO are included in miscellaneous expenses in the Statement of Operations. The Fund paid no remuneration to any other officer of the Trust.
4. Purchases and sales of securities
For the year ended February 28, 2009, cost of purchases and proceeds from sales of investments, other than short-term obligations, were as follows:
| Purchases | Sales | ||||||||||
| U.S. Government securities | $ | 9,074,376 | $ | 16,132,157 | |||||||
| Investments (non-U.S. Government securities) | 9,310,691,046 | 9,279,983,747 | |||||||||
5. Guarantees
In the normal course of business the Fund enters into contracts with third-party service providers that contain a variety of representations and warranties and that provide general indemnifications. The Fund's maximum exposure under these arrangements is unknown, as it involves future claims that may be made against the Fund that have not yet occurred. Based on experience, management is of the view that the risk of loss in connection with its indemnification obligations is remote; however, there can be no assurance that such obligations will not result in material liabilities that adversely affect the Fund.
6. Principal shareholders and related parties
As of February 28, 2009, the Fund had no shareholders who individually held more than 10% of the Fund's outstanding shares.
As of February 28, 2009, 0.52% of the Fund's shares were held by senior management of the Manager and GMO Trust officers and 18.98% of the Fund's shares were held by accounts for which the Manager had investment discretion.
43
GMO Emerging Markets Fund
(A Series of GMO Trust)
Notes to Financial Statements — (Continued)
February 28, 2009
7. Share transactions
The Declaration of Trust permits the Trust to issue an unlimited number of shares of beneficial interest (without par value). Transactions in Fund shares were as follows:
| Year Ended February 28, 2009 | Year Ended February 29, 2008 | ||||||||||||||||||
| Class III: | Shares | Amount | Shares | Amount | |||||||||||||||
| Shares sold | 199,316,510 | $ | 1,549,659,316 | 511,450 | $ | 11,067,541 | |||||||||||||
| Shares issued to shareholders in reinvestment of distributions | 54,047,677 | 611,126,733 | 41,256,239 | 944,580,044 | |||||||||||||||
| Shares repurchased | (53,039,178 | ) | (662,859,942 | ) | (82,489,753 | ) | (1,996,490,628 | ) | |||||||||||
| Purchase premiums | — | 3,747,220 | — | 34,924 | |||||||||||||||
| Redemption fees | — | 3,863,411 | — | 6,221,718 | |||||||||||||||
| Net increase (decrease) | 200,325,009 | $ | 1,505,536,738 | (40,722,064 | ) | $ | (1,034,586,401 | ) | |||||||||||
| Year Ended February 28, 2009 | Year Ended February 29, 2008 | ||||||||||||||||||
| Class IV: | Shares | Amount | Shares | Amount | |||||||||||||||
| Shares sold | 157,053,136 | $ | 1,026,539,902 | 42,157,428 | $ | 1,040,161,863 | |||||||||||||
| Shares issued to shareholders in reinvestment of distributions | 40,848,201 | 475,454,559 | 35,738,546 | 808,409,341 | |||||||||||||||
| Shares repurchased | (131,400,487 | ) | (1,282,059,060 | ) | (55,851,088 | ) | (1,362,248,327 | ) | |||||||||||
| Purchase premiums | — | 482,899 | — | 4,000 | |||||||||||||||
| Redemption fees | — | 4,587,042 | — | 3,196,572 | |||||||||||||||
| Net increase (decrease) | 66,500,850 | $ | 225,005,342 | 22,044,886 | $ | 489,523,449 | |||||||||||||
| Year Ended February 28, 2009 | Year Ended February 29, 2008 | ||||||||||||||||||
| Class V: | Shares | Amount | Shares | Amount | |||||||||||||||
| Shares sold | 196,888,178 | $ | 1,458,962,017 | 36,562,016 | $ | 922,567,536 | |||||||||||||
| Shares issued to shareholders in reinvestment of distributions | 24,664,677 | 260,296,435 | 12,460,349 | 281,241,715 | |||||||||||||||
| Shares repurchased | (152,881,388 | ) | (1,125,909,783 | ) | (23,612,498 | ) | (586,826,685 | ) | |||||||||||
| Purchase premiums | — | 3,005,084 | — | — | |||||||||||||||
| Redemption fees | — | 607,872 | — | 2,262,707 | |||||||||||||||
| Net increase (decrease) | 68,671,467 | $ | 596,961,625 | 25,409,867 | $ | 619,245,273 | |||||||||||||
44
GMO Emerging Markets Fund
(A Series of GMO Trust)
Notes to Financial Statements — (Continued)
February 28, 2009
| Year Ended February 28, 2009 | Year Ended February 29, 2008 | ||||||||||||||||||
| Class VI: | Shares | Amount | Shares | Amount | |||||||||||||||
| Shares sold | 244,681,931 | $ | 2,170,286,504 | 25,646,673 | $ | 584,700,516 | |||||||||||||
| Shares issued to shareholders in reinvestment of distributions | 88,616,021 | 1,028,385,993 | 64,927,161 | 1,472,096,525 | |||||||||||||||
| Shares repurchased | (426,960,691 | ) | (3,597,571,769 | ) | (49,478,255 | ) | (1,203,172,374 | ) | |||||||||||
| Purchase premiums | — | 10,675,993 | — | 953,166 | |||||||||||||||
| Redemption fees | — | 11,819,980 | — | 6,273,038 | |||||||||||||||
| Net increase (decrease) | (93,662,739 | ) | $ | (376,403,299 | ) | 41,095,579 | $ | 860,850,871 | |||||||||||
8. Investments in affiliated companies and other funds of the Trust
An affiliated company is a company in which the Fund has or had ownership of at least 5% of the voting securities. A summary of the Fund's transactions with companies that are or were affiliates during the year ended February 28, 2009 is set forth below:
| Affiliate | Value, beginning of period | Purchases | Sales Proceeds | Dividend Income | Value, end of period | ||||||||||||||||||
| Bakrie & Brothers Tbk PT* | $ | 52,163,380 | $ | — | $ | 30,662,144 | $ | — | $ | 763,236 | |||||||||||||
| Biomass Korea Co Ltd | 4,806,682 | — | — | — | 662,925 | ||||||||||||||||||
| Boryung Pharmaceutical Co Ltd | 9,623,938 | 152,839 | 629,347 | 47,828 | 2,759,751 | ||||||||||||||||||
| CBAY Systems Holdings Ltd | 18,319,951 | — | — | — | 7,663,868 | ||||||||||||||||||
| Daehan Pulp Co Ltd | 3,241,894 | — | — | — | 1,825,376 | ||||||||||||||||||
| Dimerco Express Taiwan Corp | 13,447,262 | — | — | 154,262 | 6,639,875 | ||||||||||||||||||
| Finetex EnE Inc* | 9,225,369 | — | — | — | 1,529,543 | ||||||||||||||||||
| In The F Co Ltd | 11,011,120 | — | — | — | 1,677,571 | ||||||||||||||||||
| Les Enphants Co Ltd | 8,606,563 | — | 1,291,572 | 62,383 | 4,441,616 | ||||||||||||||||||
| Millenium Information Technology | 787,470 | — | — | 60,200 | 787,469 | ||||||||||||||||||
| Pumyang Construction Co Ltd | 13,435,930 | — | — | — | 5,161,915 | ||||||||||||||||||
| Star Block Co Ltd (Foreign Registered) | 987 | — | — | — | 859 | ||||||||||||||||||
| Totals | $ | 144,670,546 | $ | 152,839 | $ | 32,583,063 | $ | 324,673 | $ | 33,914,004 | |||||||||||||
* No longer an affiliate as of February 28, 2009.
45
GMO Emerging Markets Fund
(A Series of GMO Trust)
Notes to Financial Statements — (Continued)
February 28, 2009
A summary of the Fund's transactions in the shares of other funds of the Trust during the year ended February 28, 2009 is set forth below:
| Affiliate | Value, beginning of period | Purchases | Sales Proceeds | Dividend Income | Distributions of Realized Gains | Value, end of period | |||||||||||||||||||||
| GMO Special Purpose Holding Fund | $ | 10,161 | $ | — | $ | — | $ | — | $ | 18,263 | $ | 5,887 | |||||||||||||||
| Totals | $ | 10,161 | $ | — | $ | — | $ | — | $ | 18,263 | $ | 5,887 | |||||||||||||||
46
Report of Independent Registered Public Accounting Firm
To the Trustees of GMO Trust and the Shareholders of
GMO Emerging Markets Fund:
In our opinion, the accompanying statement of assets and liabilities, including the schedule of investments, and the related statements of operations and of changes in net assets and the financial highlights present fairly, in all material respects, the financial position of GMO Emerging Markets Fund (the "Fund") at February 28, 2009, the results of its operations for the year then ended, the changes in its net assets for each of the two years in the period then ended and the financial highlights for the periods indicated, in conformity with accounting principles generally accepted in the United States of America. These financial statements and financial highlights (hereafter referred to as "financial statements") are the responsibility of the Fund's management. Our responsibility is to express an opinion on these financial statements based on our audits. We conducted our audits of these financial statements in accordance with t he standards of the Public Company Accounting Oversight Board (United States). Those standards require that we plan and perform the audit to obtain reasonable assurance about whether the financial statements are free of material misstatement. An audit includes examining, on a test basis, evidence supporting the amounts and disclosures in the financial statements, assessing the accounting principles used and significant estimates made by management, and evaluating the overall financial statement presentation. We believe that our audits, which included confirmation of securities at February 28, 2009 by correspondence with the custodian and brokers, provide a reasonable basis for our opinion.
PricewaterhouseCoopers LLP
Boston, Massachusetts
April 29, 2009
47
GMO Emerging Markets Fund
(A Series of GMO Trust)
Fund Expenses
February 28, 2009 (Unaudited)
Expense Examples: The following information is in relation to expenses for the six month period ended February 28, 2009.
As a shareholder of the Fund, you may incur two types of costs: (1) transaction costs, including purchase premiums and redemption fees; and (2) ongoing costs, including management fees, shareholder service fees, and other Fund expenses. This example is intended to help you understand your ongoing costs (in dollars) of investing in the Fund and to compare these costs with the ongoing costs of investing in other mutual funds.
These examples are based on an investment of $1,000 invested at the beginning of the period and held for the entire period, September 1, 2008 through February 28, 2009.
Actual Expenses
The first line of the table for each class below provides information about actual account values and actual expenses. You may use the information in this line, together with the amount you invested, to estimate the expenses that you paid over the period. Simply divide your account value by $1,000 (for example, a $10,000,000 account value divided by $1,000 = 10,000), then multiply the result by the number in the first line under the heading entitled "Net Expense Incurred" to estimate the expenses you paid on your account during this period.
Hypothetical Example for Comparison Purposes
The second line of the table for each class below provides information about hypothetical account values and hypothetical expenses based on the Fund's actual expense ratio and an assumed rate of return of 5% per year before expenses, which is not the Fund's actual return. The hypothetical account values and expenses may not be used to estimate the actual ending account balance or expenses you paid for the period. You may use this information to compare the ongoing costs of investing in the Fund with other funds. To do so, compare this 5% hypothetical example with the 5% hypothetical examples that appear in the shareholder reports of other funds.
48
GMO Emerging Markets Fund
(A Series of GMO Trust)
Fund Expenses — (Continued)
February 28, 2009 (Unaudited)
Please note that the expenses shown in the table are meant to highlight your ongoing costs only and do not reflect any transactional costs, such as purchase premiums and redemption fees. Therefore, the second line of the table is useful in comparing ongoing costs only, and will not help you determine the relative total costs of owning different funds. In addition, if these transactional costs were included, your costs would have been higher.
| Annualized Net Expense Ratio | Beginning Account Value | Ending Account Value | Net Expense Incurred* | ||||||||||||||||
| Class III | |||||||||||||||||||
| 1) Actual | 1.11 | % | $ | 1,000.00 | $ | 501.00 | $ | 4.13 | |||||||||||
| 2) Hypothetical | 1.11 | % | $ | 1,000.00 | $ | 1,019.29 | $ | 5.56 | |||||||||||
| Class IV | |||||||||||||||||||
| 1) Actual | 1.06 | % | $ | 1,000.00 | $ | 501.20 | $ | 3.95 | |||||||||||
| 2) Hypothetical | 1.06 | % | $ | 1,000.00 | $ | 1,019.54 | $ | 5.31 | |||||||||||
| Class V | |||||||||||||||||||
| 1) Actual | 1.04 | % | $ | 1,000.00 | $ | 501.30 | $ | 3.87 | |||||||||||
| 2) Hypothetical | 1.04 | % | $ | 1,000.00 | $ | 1,019.64 | $ | 5.21 | |||||||||||
| Class VI | |||||||||||||||||||
| 1) Actual | 1.01 | % | $ | 1,000.00 | $ | 501.20 | $ | 3.76 | |||||||||||
| 2) Hypothetical | 1.01 | % | $ | 1,000.00 | $ | 1,019.79 | $ | 5.06 | |||||||||||
* Expenses are calculated using each Class's annualized net expense ratio (including indirect expenses incurred) for the six months ended February 28, 2009, multiplied by the average account value over the period, multiplied by 181 days in the period, divided by 365 days in the year.
49
GMO Emerging Markets Fund
(A Series of GMO Trust)
Tax Information for the Tax Year Ended February 28, 2009 (Unaudited)
The Fund will notify shareholders of amounts for use in preparing 2009 income tax forms in January 2010.
The Fund's distributions to shareholders include $2,341,080,023 from long-term capital gains.
During the year ended February 28, 2009, the Fund paid foreign taxes of $34,782,526 and recognized foreign source income of $301,861,827.
For taxable, non-corporate shareholders, 100.00% of the income and short-term capital gains, if any, distributed in the Fund's fiscal year ended February 28, 2009 represents qualified dividend income subject to the 15% rate category.
The Fund hereby designates as qualified short-term capital gains with respect to its taxable year ended February 28, 2009, $40,949,785 or if determined to be different, the qualified short term capital gains of such year.
50
GMO Emerging Markets Fund
(A Series of GMO Trust)
Note Concerning Distributions (Unaudited)
The Fund previously reported estimated sources of any dividends, short-term capital gains, and long-term capital gains distributions paid on a per share basis. Pursuant to Rule 19a-1(e) of the Investment Company Act, the following serves as a correction of such estimates. 0.11% of distributions to shareholders declared from net realized gains during the Fund's fiscal year were reclassified to distributions from net investment income and are reflected as such in the Statement of Changes in Net Assets.
51
Trustees and Officers (Unaudited)
The following tables list the Trust's Trustees and Officers as of the date of this report; their address and date of birth ("DOB"); their position with the Trust; the length of time holding that position with the Trust; their principal occupation(s) during the past five years; the number of portfolios in the fund complex they oversee; and other directorships they hold in companies subject to registration or reporting requirements of the Securities Exchange Act of 1934 (generally called "public companies") or in registered investment companies. The Trust's Statement of Additional Information ("SAI") includes additional information about the Trust's trustees, including changes subsequent to the date of the report. The SAI is available, without charge, upon request by writing GMO, c/o GMO Trust, 40 Rowes Wharf, Boston, MA 02110.
Independent Trustees:
| Name, Address, and DOB | Position(s) Held with Trust | Term of Office1 and Length of Time Served | Principal Occupation(s) During Past Five Years | Number of Portfolios in Fund Complex Overseen by Trustee | Other Directorships Held by Trustee | ||||||||||||||||||
| Donald W. Glazer, Esq. c/o GMO Trust 40 Rowes Wharf Boston, MA 02110 DOB: 07/26/1944 | Chairman of the Board of Trustees | Chairman of the Board of Trustees since March 2005; Lead Independent Trustee (September 2004 – March 2005); Trustee since December 2000. | Consultant – Law and Business2; Author of Legal Treatises. | 59 | None. | ||||||||||||||||||
1 Each Trustee is elected to serve during the continued lifetime of the Trust until he/she dies, resigns or is removed, or if sooner, until the next meeting of Shareholders called for the purpose of electing Trustees and until the election and qualification of his/her successor.
2 As part of Mr. Glazer's work as a consultant, he provides part-time consulting services to Goodwin Procter LLP ("Goodwin"). Goodwin has provided legal services to Renewable Resources, LLC, an affiliate of GMO; GMO, in connection with its relationship with Renewable Resources; and funds managed by Renewable Resources. Mr. Glazer has represented that he has no financial interest in, and is not involved in the provision of, such legal services. In the calendar years ended December 31, 2007 and December 31, 2008, these entities paid $789,416 and $183,864 respectively, in legal fees and disbursements to Goodwin. In correspondence with the Staff of the Securities and Exchange Commission beginning in August 2006, the Independent Trustees' legal counsel provided the Staff with information regarding Mr. Glazer's relationship with Goodwin and h is other business activities. On September 11, 2007, based on information that had been given to the Staff as of that date, the Staff provided oral no-action assurance consistent with the opinion of the Independent Trustees' legal counsel that Mr. Glazer is not an "interested person" of the Trust.
52
Independent Trustees — (Continued)
| Name, Address, and DOB | Position(s) Held with Trust | Term of Office1 and Length of Time Served | Principal Occupation(s) During Past Five Years | Number of Portfolios in Fund Complex Overseen by Trustee | Other Directorships Held by Trustee | ||||||||||||||||||
| W. Nicholas Thorndike c/o GMO Trust 40 Rowes Wharf Boston, MA 02110 DOB: 03/28/1933 | Trustee | Since March 2005. | Director or trustee of various corporations and charitable organizations, including Courier Corporation (a book publisher and manufacturer) (July 1989 – present); Putnam Funds (December 1992 – June 2004); and Providence Journal (a newspaper publisher) (December 1986 – December 2003). | 59 | Director of Courier Corporation (a book publisher and manufacturer); Member of the Investment Committee of Partners HealthCare System, Inc.3 | ||||||||||||||||||
| Peter Tufano c/o GMO Trust 40 Rowes Wharf Boston, MA 02110 DOB: 04/22/1957 | Trustee | Since December 2008. | Sylvan C. Coleman Professor of Financial Management, Harvard Business School (since 1989). | 59 | Trustee of State Street Navigator Securities Lending Trust (3 Portfolios). | ||||||||||||||||||
1 Each Trustee is elected to serve during the continued lifetime of the Trust until he/she dies, resigns or is removed, or if sooner, until the next meeting of Shareholders called for the purpose of electing Trustees and until the election and qualification of his/her successor.
3 Partners HealthCare System, Inc. is a client of the Manager.
53
Principal Officers:
| Name, Address, and DOB | Position(s) Held with Trust | Term of Office4 and Length of Time Served | Principal Occupation(s) During Past Five Years5 | ||||||||||||
| J.B. Kittredge DOB: 08/22/1954 | President and Chief Executive Officer | Since March 2009. | General Counsel, Grantham, Mayo, Van Otterloo & Co. LLC (October 2005 – Present); Partner, Ropes & Gray LLP. | ||||||||||||
| Sheppard N. Burnett c/o GMO Trust 40 Rowes Wharf Boston, MA 02110 DOB: 10/24/1968 | Treasurer and Chief Financial Officer | Chief Financial Officer since March 2007; Treasurer since November 2006; Assistant Treasurer, September 2004 – November 2006. | Fund Administration Staff, Grantham, Mayo, Van Otterloo & Co. LLC (June 2004 – present); Vice President, Director of Tax, Columbia Management Group (2002 – 2004). | ||||||||||||
| Brent C. Arvidson c/o GMO Trust 40 Rowes Wharf Boston, MA 02110 DOB: 06/26/1969 | Assistant Treasurer | Since August 1998. | Senior Fund Administrator, Grantham, Mayo, Van Otterloo & Co. LLC. | ||||||||||||
| John L. Nasrah c/o GMO Trust 40 Rowes Wharf Boston, MA 02110 DOB: 05/27/1977 | Assistant Treasurer | Since March 2007. | Fund Administrator, Grantham, Mayo, Van Otterloo & Co. LLC (September 2004 – present); Tax Analyst, Bain & Company, Inc. (June 2003 – September 2004). | ||||||||||||
| Mahmoodur Rahman c/o GMO Trust 40 Rowes Wharf Boston, MA 02110 DOB: 11/30/1967 | Assistant Treasurer | Since September 2007. | Fund Administrator, Grantham, Mayo, Van Otterloo & Co. LLC (April 2007 – present); Vice President and Senior Tax Manager, Massachusetts Financial Services Company (January 2000 – April 2007). | ||||||||||||
| Michael E. Gillespie c/o GMO Trust 40 Rowes Wharf Boston, MA 02110 DOB: 02/18/1958 | Chief Compliance Officer | Since March 2005. | Vice President of Compliance (June 2004 – February 2005) and Director of Domestic Compliance (March 2002 – June 2004), Fidelity Investments. | ||||||||||||
4 Each officer is elected to hold such office until his or her successor is duly elected and qualified to carry out the duties and responsibilities of the office, or until he or she resigns or is removed from office.
5 Each of Messrs. Burnett, Arvidson, Bohan, and Pottle serves as an officer and/or director of certain pooled investment vehicles of which GMO or an affiliate of GMO serves as the investment adviser.
54
Principal Officers — (Continued)
| Name, Address, and DOB | Position(s) Held with Trust | Term of Office4 and Length of Time Served | Principal Occupation(s) During Past Five Years5 | ||||||||||||
| Jason B. Harrison c/o GMO Trust 40 Rowes Wharf Boston, MA 02110 DOB: 01/29/1977 | Vice President and Clerk | Vice President since November 2006; Clerk since March 2006. | Legal Counsel, Grantham, Mayo, Van Otterloo & Co. LLC (since February 2006) and Attorney, Ropes & Gray LLP (September 2002 – February 2006). | ||||||||||||
| David L. Bohan c/o GMO Trust 40 Rowes Wharf Boston, MA 02110 DOB: 06/21/1964 | Vice President and Assistant Clerk | Vice President since March 2005; Assistant Clerk since March 2006. | Legal Counsel, Grantham, Mayo, Van Otterloo & Co. LLC. | ||||||||||||
| Gregory L. Pottle c/o GMO Trust 40 Rowes Wharf Boston, MA 02110 DOB: 07/09/1971 | Vice President and Assistant Clerk | Since November 2006. | Legal Counsel, Grantham, Mayo, Van Otterloo & Co. LLC. | ||||||||||||
| Anne K. Trinque c/o GMO Trust 40 Rowes Wharf Boston, MA 02110 DOB: 04/15/1978 | Vice President and Assistant Clerk | Since September 2007. | Legal Counsel, Grantham, Mayo, Van Otterloo & Co. LLC (January 2007 – present); Attorney, Goodwin Procter LLP (September 2003 – January 2007). | ||||||||||||
| Cheryl Wakeham c/o GMO Trust 40 Rowes Wharf Boston, MA 02110 DOB: 10/29/1958 | Vice President and Anti-Money Laundering Officer | Since December 2004. | Manager, Client Service Administration, Grantham, Mayo, Van Otterloo & Co. LLC. | ||||||||||||
4 Each officer is elected to hold such office until his or her successor is duly elected and qualified to carry out the duties and responsibilities of the office, or until he or she resigns or is removed from office.
5 Each of Messrs. Burnett, Arvidson, Bohan, and Pottle serves as an officer and/or director of certain pooled investment vehicles of which GMO or an affiliate of GMO serves as the investment adviser.
55
GMO U.S. Core Equity Fund
(A Series of GMO Trust)
Annual Report
February 28, 2009
For a free copy of the Fund's proxy voting guidelines, shareholders may call 1-617-346-7646 (collect) or visit the Securities and Exchange Commission's website at www.sec.gov. Information regarding how the Fund voted proxies relating to portfolio securities during the most recent 12-month period ended June 30 is available on GMO's website at www.gmo.com, or on the Securities and Exchange Commission's website at www.sec.gov.
The Fund files its complete schedule of portfolio holdings with the Securities and Exchange Commission for the first and third quarter of each fiscal year on Form N-Q, which is available on the Commission's website at www.sec.gov. The Fund's Form N-Q may be reviewed and copied at the Commission's Public Reference Room in Washington, D.C. Information on the operation of the Public Reference Room may be obtained by calling 1-800-SEC-0330. The Fund has a policy with respect to disclosure of portfolio holdings under which it may also make available on GMO's website at www.gmo.com a complete schedule of portfolio holdings.
This report is prepared for the general information of shareholders. It is authorized for distribution to prospective investors only when preceded or accompanied by a prospectus for the GMO Trust, which contains a complete discussion of the risks associated with an investment in this Fund and other important information. The GMO Trust prospectus can be obtained at www.gmo.com.
GMO U.S. Core Equity Fund
(A Series of GMO Trust)
Portfolio Management
Day-to-day management of the Fund's portfolio is the responsibility of the Quantitative Equity team at Grantham, Mayo, Van Otterloo & Co. LLC.
Management Discussion and Analysis of Fund Performance
The Class III shares of the GMO U.S. Core Equity Fund returned -35.4% for the fiscal year ended February 28, 2009, as compared to -43.3% for the S&P 500 Index. Consistent with the Fund's investment objectives and policies, the Fund was invested primarily in U.S. equity securities throughout the period.
Stock selection added to returns relative to the S&P 500 Index. Stock selections within Energy, Consumer Discretionary, and Information Technology added to relative returns while stock selections within Health Care, Utilities, and Telecommunication Services detracted. Individual names adding to relative returns included overweight positions in Wal-Mart Stores and Johnson & Johnson and an underweight position in GE. Names detracting from relative returns included underweight positions in AT&T, Verizon Communications, and McDonald's.
Sector selection added to returns relative to the S&P 500 Index. Sector weightings positively impacting relative performance included an underweight position in Financials and overweight positions in Health Care and Consumer Staples. Sector weightings negatively impacting relative performance included underweight positions in Telecommunication Services, Utilities, and Consumer Discretionary.
The views expressed herein are exclusively those of Grantham, Mayo, Van Otterloo & Co. LLC Management as of the date of this report and are subject to change. GMO disclaims any responsibility to update such views. They are not meant as investment advice. References to specific securities are not recommendations of such securities and may not be representative of any GMO portfolio's current or future investments.
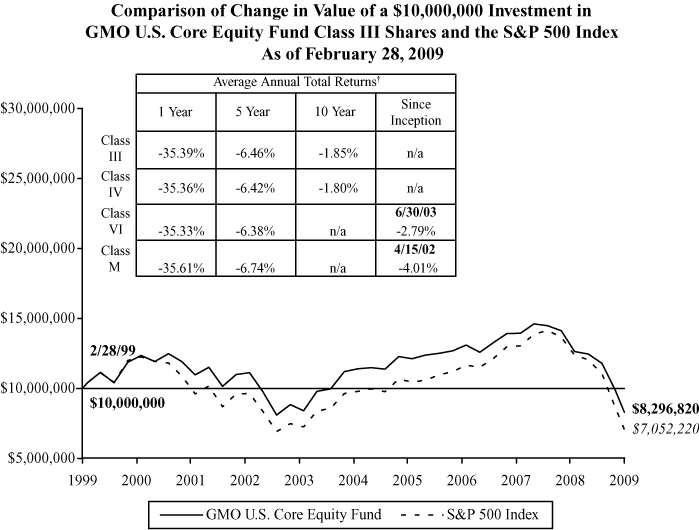
Performance data quoted represents past performance and is not indicative of future results. The investment return and principal value of an investment will fluctuate so that an investor's shares, when redeemed, may be worth more or less than their original cost. Current performance data may be lower or higher than the performance data provided herein. To obtain performance information to the most recent month-end, visit www.gmo.com. Performance shown is net of all fees after reimbursement from the Manager. Returns would have been lower had certain expenses not been reimbursed during the periods shown and do not include the effect of taxes on distributions and redemptions. All information is unaudited. Performance for Classes IV, VI and M will vary due to different fees.
† The Fund is the successor to the GMO U.S. Core Fund, therefore, performance for the periods prior to September 16, 2005 is that of GMO U.S. Core Fund.
GMO U.S. Core Equity Fund
(A Series of GMO Trust)
Investments Concentration Summary
February 28, 2009 (Unaudited)
| Asset Class Summary | % of Total Net Assets | ||||||
| Common Stocks | 95.6 | % | |||||
| Short-Term Investments | 1.5 | ||||||
| Futures | (0.3 | ) | |||||
| Other | 3.2 | ||||||
| 100.0 | % | ||||||
| Industry Sector Summary | % of Equity Investments | ||||||
| Health Care | 27.3 | % | |||||
| Consumer Staples | 19.0 | ||||||
| Information Technology | 17.9 | ||||||
| Energy | 15.4 | ||||||
| Consumer Discretionary | 7.7 | ||||||
| Industrials | 5.1 | ||||||
| Financials | 4.3 | ||||||
| Materials | 1.5 | ||||||
| Telecommunication Services | 1.2 | ||||||
| Utilities | 0.6 | ||||||
| 100.0 | % | ||||||
1
GMO U.S. Core Equity Fund
(A Series of GMO Trust)
Schedule of Investments
(showing percentage of total net assets)
February 28, 2009
| Shares | Description | Value ($) | |||||||||||||
| COMMON STOCKS — 95.6% | |||||||||||||||
| Consumer Discretionary — 7.4% | |||||||||||||||
| 56,300 | Abercrombie & Fitch Co.-Class A | 1,238,037 | |||||||||||||
| 46,000 | Advance Auto Parts, Inc. | 1,759,500 | |||||||||||||
| 11,700 | Apollo Group, Inc.-Class A * | 848,250 | |||||||||||||
| 53,970 | AutoZone, Inc. * | 7,676,153 | |||||||||||||
| 192,100 | Bed Bath & Beyond, Inc. * | 4,091,730 | |||||||||||||
| 83,200 | Best Buy Co., Inc. | 2,397,824 | |||||||||||||
| 36,500 | Cablevision Systems Corp.-Class A | 474,135 | |||||||||||||
| 350,500 | CBS Corp.-Class B (Non Voting) | 1,496,635 | |||||||||||||
| 286,500 | Coach, Inc. * | 4,005,270 | |||||||||||||
| 719,900 | Comcast Corp.-Class A | 9,401,894 | |||||||||||||
| 83,600 | DirecTV Group (The), Inc. * | 1,666,984 | |||||||||||||
| 90,800 | DISH Network Corp.-Class A * | 1,021,500 | |||||||||||||
| 43,900 | Dollar Tree, Inc. * | 1,704,198 | |||||||||||||
| 61,800 | Family Dollar Stores, Inc. | 1,695,792 | |||||||||||||
| 172,800 | Gannett Co., Inc. | 559,872 | |||||||||||||
| 84,000 | Gap (The), Inc. | 906,360 | |||||||||||||
| 16,400 | Genuine Parts Co. | 461,496 | |||||||||||||
| 148,400 | H&R Block, Inc. | 2,834,440 | |||||||||||||
| 26,400 | Harley-Davidson, Inc. | 266,640 | |||||||||||||
| 66,800 | Hasbro, Inc. | 1,529,052 | |||||||||||||
| 1,112,204 | Home Depot, Inc. | 23,233,942 | |||||||||||||
| 35,700 | Interpublic Group of Cos., Inc. * | 136,017 | |||||||||||||
| 12,000 | ITT Educational Services, Inc. * | 1,362,000 | |||||||||||||
| 129,300 | J. Crew Group, Inc. * | 1,455,918 | |||||||||||||
| 35,500 | Johnson Controls, Inc. | 403,990 | |||||||||||||
| 150,000 | Kohl's Corp. * | 5,271,000 | |||||||||||||
| 63,100 | Leggett & Platt, Inc. | 721,233 | |||||||||||||
| 112,100 | Limited Brands, Inc. | 862,049 | |||||||||||||
| 611,100 | Lowe's Cos., Inc. | 9,679,824 | |||||||||||||
| 13,900 | Mattel, Inc. | 164,576 | |||||||||||||
| 126,400 | McDonald's Corp. | 6,604,400 | |||||||||||||
| 22,900 | McGraw-Hill Cos. (The), Inc. | 451,817 | |||||||||||||
See accompanying notes to the financial statements.
2
GMO U.S. Core Equity Fund
(A Series of GMO Trust)
Schedule of Investments — (Continued)
(showing percentage of total net assets)
February 28, 2009
| Shares | Description | Value ($) | |||||||||||||
| Consumer Discretionary — continued | |||||||||||||||
| 4,200 | Mohawk Industries, Inc. * | 94,878 | |||||||||||||
| 150,700 | News Corp.-Class A | 837,892 | |||||||||||||
| 1,721 | NVR, Inc. * | 572,697 | |||||||||||||
| 6,100 | O'Reilly Automotive, Inc. * | 203,496 | |||||||||||||
| 54,000 | PetSmart, Inc. | 1,082,160 | |||||||||||||
| 27,100 | Polo Ralph Lauren Corp. | 934,137 | |||||||||||||
| 78,700 | Ross Stores, Inc. | 2,323,224 | |||||||||||||
| 20,900 | Sears Holdings Corp. * | 768,284 | |||||||||||||
| 40,000 | Sherwin-Williams Co. (The) | 1,838,000 | |||||||||||||
| 364,200 | Staples, Inc. | 5,808,990 | |||||||||||||
| 117,000 | Target Corp. | 3,312,270 | |||||||||||||
| 118,400 | Time Warner Cable, Inc.-Class A * | 2,158,432 | |||||||||||||
| 123,800 | TJX Cos. (The), Inc. | 2,757,026 | |||||||||||||
| 111,500 | Urban Outfitters, Inc. * | 1,855,360 | |||||||||||||
| 5,300 | Whirlpool Corp. | 117,819 | |||||||||||||
| 29,600 | Yum! Brands, Inc. | 777,888 | |||||||||||||
| Total Consumer Discretionary | 121,825,081 | ||||||||||||||
| Consumer Staples — 18.1% | |||||||||||||||
| 1,105,000 | Altria Group, Inc. | 17,061,200 | |||||||||||||
| 41,500 | Archer-Daniels-Midland Co. | 1,106,390 | |||||||||||||
| 82,500 | Avon Products, Inc. | 1,451,175 | |||||||||||||
| 77,300 | Campbell Soup Co. | 2,069,321 | |||||||||||||
| 11,300 | Church & Dwight Co., Inc. | 552,796 | |||||||||||||
| 46,200 | Clorox Co. | 2,245,320 | |||||||||||||
| 835,700 | Coca-Cola Co. (The) | 34,138,345 | |||||||||||||
| 185,100 | Colgate-Palmolive Co. | 11,139,318 | |||||||||||||
| 31,300 | Costco Wholesale Corp. | 1,325,242 | |||||||||||||
| 13,200 | Dean Foods Co. * | 269,940 | |||||||||||||
| 91,100 | Estee Lauder Cos. (The), Inc.-Class A | 2,063,415 | |||||||||||||
| 7,000 | Flowers Foods, Inc. | 156,170 | |||||||||||||
| 266,600 | General Mills, Inc. | 13,991,168 | |||||||||||||
| 76,000 | Hershey Co. (The) | 2,560,440 | |||||||||||||
| 84,600 | HJ Heinz Co. | 2,763,882 | |||||||||||||
See accompanying notes to the financial statements.
3
GMO U.S. Core Equity Fund
(A Series of GMO Trust)
Schedule of Investments — (Continued)
(showing percentage of total net assets)
February 28, 2009
| Shares | Description | Value ($) | |||||||||||||
| Consumer Staples — continued | |||||||||||||||
| 8,100 | Hormel Foods Corp. | 257,823 | |||||||||||||
| 16,800 | JM Smucker Co. (The) | 623,616 | |||||||||||||
| 80,600 | Kellogg Co. | 3,136,952 | |||||||||||||
| 137,000 | Kimberly-Clark Corp. | 6,454,070 | |||||||||||||
| 108,600 | Kraft Foods, Inc.-Class A | 2,473,908 | |||||||||||||
| 161,700 | Kroger Co. (The) | 3,342,339 | |||||||||||||
| 13,900 | McCormick & Co., Inc. (Non Voting) | 435,765 | |||||||||||||
| 772,700 | PepsiCo, Inc. | 37,197,778 | |||||||||||||
| 667,900 | Philip Morris International, Inc. | 22,354,613 | |||||||||||||
| 636,700 | Procter & Gamble Co. (The) | 30,669,839 | |||||||||||||
| 36,525 | Supervalu, Inc. | 570,155 | |||||||||||||
| 16,800 | Sysco Corp. | 361,200 | |||||||||||||
| 18,400 | Tyson Foods, Inc.-Class A | 155,112 | |||||||||||||
| 1,582,400 | Wal-Mart Stores, Inc. | 77,917,376 | |||||||||||||
| 884,300 | Walgreen Co. | 21,099,398 | |||||||||||||
| Total Consumer Staples | 299,944,066 | ||||||||||||||
| Energy — 14.7% | |||||||||||||||
| 49,900 | Anadarko Petroleum Corp. | 1,744,005 | |||||||||||||
| 83,580 | Apache Corp. | 4,938,742 | |||||||||||||
| 27,200 | Baker Hughes, Inc. | 797,232 | |||||||||||||
| 156,600 | BJ Services Co. | 1,514,322 | |||||||||||||
| 36,600 | Cabot Oil & Gas Corp. | 745,542 | |||||||||||||
| 223,900 | Chesapeake Energy Corp. | 3,501,796 | |||||||||||||
| 979,300 | Chevron Corp. | 59,453,303 | |||||||||||||
| 46,900 | Cimarex Energy Co. | 921,585 | |||||||||||||
| 6,200 | CNX Gas Corp. * | 135,222 | |||||||||||||
| 592,268 | ConocoPhillips | 22,121,210 | |||||||||||||
| 77,100 | Devon Energy Corp. | 3,366,957 | |||||||||||||
| 6,800 | Encore Acquisition Co. * | 136,544 | |||||||||||||
| 40,100 | ENSCO International, Inc. | 985,658 | |||||||||||||
| 79,710 | EOG Resources, Inc. | 3,988,689 | |||||||||||||
| 1,292,400 | Exxon Mobil Corp. | 87,753,960 | |||||||||||||
| 15,700 | Forest Oil Corp. * | 222,626 | |||||||||||||
See accompanying notes to the financial statements.
4
GMO U.S. Core Equity Fund
(A Series of GMO Trust)
Schedule of Investments — (Continued)
(showing percentage of total net assets)
February 28, 2009
| Shares | Description | Value ($) | |||||||||||||
| Energy — continued | |||||||||||||||
| 191,000 | Halliburton Co. | 3,115,210 | |||||||||||||
| 55,700 | Helmerich & Payne, Inc. | 1,317,862 | |||||||||||||
| 83,930 | Hess Corp. | 4,590,132 | |||||||||||||
| 26,900 | Murphy Oil Corp. | 1,124,689 | |||||||||||||
| 170,700 | Nabors Industries Ltd. * | 1,657,497 | |||||||||||||
| 29,700 | National Oilwell Varco, Inc. * | 793,881 | |||||||||||||
| 42,600 | Newfield Exploration Co. * | 823,458 | |||||||||||||
| 40,100 | Noble Corp. | 986,059 | |||||||||||||
| 48,000 | Noble Energy, Inc. | 2,185,920 | |||||||||||||
| 337,400 | Occidental Petroleum Corp. | 17,500,938 | |||||||||||||
| 87,900 | Patterson-UTI Energy, Inc. | 755,061 | |||||||||||||
| 73,100 | Pioneer Natural Resources Co. | 1,066,529 | |||||||||||||
| 51,100 | Plains Exploration & Production Co. * | 978,054 | |||||||||||||
| 24,600 | Range Resources Corp. | 875,022 | |||||||||||||
| 105,300 | Southwestern Energy Co. * | 3,029,481 | |||||||||||||
| 78,400 | Spectra Energy Corp. | 1,019,200 | |||||||||||||
| 40,100 | Sunoco, Inc. | 1,341,345 | |||||||||||||
| 17,629 | Transocean Ltd. * | 1,053,685 | |||||||||||||
| 250,200 | Valero Energy Corp. | 4,848,876 | |||||||||||||
| 14,200 | W&T Offshore, Inc. | 114,310 | |||||||||||||
| 110,700 | Weatherford International Ltd. * | 1,181,169 | |||||||||||||
| 46,800 | XTO Energy, Inc. | 1,481,688 | |||||||||||||
| Total Energy | 244,167,459 | ||||||||||||||
| Financials — 4.1% | |||||||||||||||
| 39,700 | Aflac, Inc. | 665,372 | |||||||||||||
| 317,200 | Allstate Corp. (The) | 5,338,476 | |||||||||||||
| 9,800 | American Financial Group, Inc. | 152,488 | |||||||||||||
| 8,700 | Aon Corp. | 332,688 | |||||||||||||
| 22,600 | Arthur J. Gallagher & Co. | 358,662 | |||||||||||||
| 41,100 | Assurant, Inc. | 838,440 | |||||||||||||
| 745,177 | Bank of America Corp. | 2,943,449 | |||||||||||||
| 244,000 | BB&T Corp. | 3,935,720 | |||||||||||||
| 13,910 | BlackRock, Inc. | 1,346,627 | |||||||||||||
See accompanying notes to the financial statements.
5
GMO U.S. Core Equity Fund
(A Series of GMO Trust)
Schedule of Investments — (Continued)
(showing percentage of total net assets)
February 28, 2009
| Shares | Description | Value ($) | |||||||||||||
| Financials — continued | |||||||||||||||
| 9,600 | Brown & Brown, Inc. | 161,952 | |||||||||||||
| 47,500 | Capital One Financial Corp. | 572,375 | |||||||||||||
| 8,400 | Capitol Federal Financial | 311,052 | |||||||||||||
| 281,300 | Chubb Corp. | 10,981,952 | |||||||||||||
| 43,700 | Comerica, Inc. | 655,937 | |||||||||||||
| 4,000 | Cullen/Frost Bankers, Inc. | 172,160 | |||||||||||||
| 10,590 | Goldman Sachs Group (The), Inc. | 964,537 | |||||||||||||
| 7,500 | HCC Insurance Holdings, Inc. | 164,625 | |||||||||||||
| 250,800 | Hudson City Bancorp, Inc. | 2,600,796 | |||||||||||||
| 49,400 | JPMorgan Chase & Co. | 1,128,790 | |||||||||||||
| 282,900 | Marsh & McLennan Cos., Inc. | 5,072,397 | |||||||||||||
| 67,000 | MetLife, Inc. | 1,236,820 | |||||||||||||
| 67,200 | Moody's Corp. | 1,206,240 | |||||||||||||
| 23,700 | Old Republic International Corp. | 215,196 | |||||||||||||
| 51,300 | People's United Financial, Inc. | 893,133 | |||||||||||||
| 6,200 | PNC Financial Services Group, Inc. | 169,508 | |||||||||||||
| 260,400 | Progressive Corp. (The) * | 3,012,828 | |||||||||||||
| 16,900 | Prudential Financial, Inc. | 277,329 | |||||||||||||
| 19,600 | SEI Investments Co. | 232,064 | |||||||||||||
| 12,400 | T. Rowe Price Group, Inc. | 281,976 | |||||||||||||
| 29,400 | Torchmark Corp. | 605,640 | |||||||||||||
| 4,900 | Transatlantic Holdings, Inc. | 147,343 | |||||||||||||
| 352,100 | Travelers Cos. (The), Inc. | 12,728,415 | |||||||||||||
| 15,300 | Unum Group | 155,754 | |||||||||||||
| 200,800 | US Bancorp | 2,873,448 | |||||||||||||
| 10,800 | Valley National Bancorp | 123,444 | |||||||||||||
| 89,750 | W.R. Berkley Corp. | 1,867,698 | |||||||||||||
| 313,000 | Wells Fargo & Co. | 3,787,300 | |||||||||||||
| Total Financials | 68,512,631 | ||||||||||||||
| Health Care — 26.1% | |||||||||||||||
| 439,000 | Abbott Laboratories | 20,782,260 | |||||||||||||
| 115,300 | AmerisourceBergen Corp. | 3,661,928 | |||||||||||||
See accompanying notes to the financial statements.
6
GMO U.S. Core Equity Fund
(A Series of GMO Trust)
Schedule of Investments — (Continued)
(showing percentage of total net assets)
February 28, 2009
| Shares | Description | Value ($) | |||||||||||||
| Health Care — continued | |||||||||||||||
| 972,600 | Amgen, Inc. * | 47,589,318 | |||||||||||||
| 15,900 | Bard (C.R.), Inc. | 1,276,134 | |||||||||||||
| 45,800 | Baxter International, Inc. | 2,331,678 | |||||||||||||
| 14,800 | Becton, Dickinson & Co. | 915,972 | |||||||||||||
| 71,800 | Biogen Idec, Inc. * | 3,305,672 | |||||||||||||
| 91,000 | Boston Scientific Corp. * | 638,820 | |||||||||||||
| 346,600 | Bristol-Myers Squibb Co. | 6,380,906 | |||||||||||||
| 175,600 | Cardinal Health, Inc. | 5,698,220 | |||||||||||||
| 39,800 | Celgene Corp. * | 1,780,254 | |||||||||||||
| 22,600 | Cephalon, Inc. * | 1,482,334 | |||||||||||||
| 22,900 | Covance, Inc. * | 869,742 | |||||||||||||
| 154,000 | Coventry Health Care, Inc. * | 1,774,080 | |||||||||||||
| 29,100 | Covidien Ltd. | 921,597 | |||||||||||||
| 3,700 | DaVita, Inc. * | 173,604 | |||||||||||||
| 15,400 | Edwards Lifesciences Corp. * | 856,394 | |||||||||||||
| 490,400 | Eli Lilly & Co. | 14,407,952 | |||||||||||||
| 114,600 | Express Scripts, Inc. * | 5,764,380 | |||||||||||||
| 552,800 | Forest Laboratories, Inc. * | 11,852,032 | |||||||||||||
| 35,900 | Genentech, Inc. * | 3,071,245 | |||||||||||||
| 10,200 | Genzyme Corp. * | 621,486 | |||||||||||||
| 424,200 | Gilead Sciences, Inc. * | 19,004,160 | |||||||||||||
| 37,700 | Illumina, Inc. * | 1,181,141 | |||||||||||||
| 1,289,700 | Johnson & Johnson | 64,485,000 | |||||||||||||
| 84,100 | King Pharmaceuticals, Inc. * | 617,294 | |||||||||||||
| 259,600 | McKesson Corp. | 10,648,792 | |||||||||||||
| 299,300 | Medtronic, Inc. | 8,856,287 | |||||||||||||
| 590,200 | Merck & Co., Inc. | 14,282,840 | |||||||||||||
| 69,200 | Mylan, Inc. * | 860,156 | |||||||||||||
| 7,900 | Myriad Genetics, Inc. * | 622,915 | |||||||||||||
| 44,800 | Omnicare, Inc. | 1,161,664 | |||||||||||||
| 30,500 | Patterson Cos., Inc. * | 551,135 | |||||||||||||
| 295,400 | PDL BioPharma, Inc. | 1,733,998 | |||||||||||||
| 5,228,780 | Pfizer, Inc. | 64,366,282 | |||||||||||||
| 12,500 | Quest Diagnostics, Inc. | 572,875 | |||||||||||||
See accompanying notes to the financial statements.
7
GMO U.S. Core Equity Fund
(A Series of GMO Trust)
Schedule of Investments — (Continued)
(showing percentage of total net assets)
February 28, 2009
| Shares | Description | Value ($) | |||||||||||||
| Health Care — continued | |||||||||||||||
| 208,800 | Schering-Plough Corp. | 3,631,032 | |||||||||||||
| 47,700 | Stryker Corp. | 1,606,059 | |||||||||||||
| 1,971,372 | UnitedHealth Group, Inc. | 38,737,460 | |||||||||||||
| 45,600 | Varian Medical Systems, Inc. * | 1,391,256 | |||||||||||||
| 38,600 | Vertex Pharmaceuticals, Inc. * | 1,166,878 | |||||||||||||
| 449,700 | WellPoint, Inc. * | 15,253,824 | |||||||||||||
| 702,200 | Wyeth | 28,663,804 | |||||||||||||
| 467,300 | Zimmer Holdings, Inc. * | 16,364,846 | |||||||||||||
| Total Health Care | 431,915,706 | ||||||||||||||
| Industrials — 4.9% | |||||||||||||||
| 148,100 | 3M Co. | 6,732,626 | |||||||||||||
| 169,310 | Burlington Northern Santa Fe Corp. | 9,950,349 | |||||||||||||
| 131,400 | CH Robinson Worldwide, Inc. | 5,437,332 | |||||||||||||
| 37,900 | Copart, Inc. * | 1,024,058 | |||||||||||||
| 254,200 | CSX Corp. | 6,273,656 | |||||||||||||
| 23,100 | Danaher Corp. | 1,172,556 | |||||||||||||
| 7,000 | Dover Corp. | 174,580 | |||||||||||||
| 2,300 | Dun & Bradstreet Corp. | 170,131 | |||||||||||||
| 31,100 | Emerson Electric Co. | 831,925 | |||||||||||||
| 110,600 | Fastenal Co. | 3,331,272 | |||||||||||||
| 17,350 | Flowserve Corp. | 875,654 | |||||||||||||
| 176,100 | General Dynamics Corp. | 7,716,702 | |||||||||||||
| 44,500 | JB Hunt Transport Services, Inc. | 906,910 | |||||||||||||
| 43,600 | Joy Global, Inc. | 761,256 | |||||||||||||
| 31,200 | Kansas City Southern * | 551,928 | |||||||||||||
| 18,000 | L-3 Communications Holdings, Inc. | 1,217,700 | |||||||||||||
| 7,470 | Lockheed Martin Corp. | 471,432 | |||||||||||||
| 12,000 | Manpower, Inc. | 334,560 | |||||||||||||
| 45,800 | Masco Corp. | 235,870 | |||||||||||||
| 223,600 | Norfolk Southern Corp. | 7,092,592 | |||||||||||||
| 12,300 | Owens Corning, Inc. * | 102,705 | |||||||||||||
| 21,300 | Paccar, Inc. | 533,991 | |||||||||||||
See accompanying notes to the financial statements.
8
GMO U.S. Core Equity Fund
(A Series of GMO Trust)
Schedule of Investments — (Continued)
(showing percentage of total net assets)
February 28, 2009
| Shares | Description | Value ($) | |||||||||||||
| Industrials — continued | |||||||||||||||
| 25,900 | Parker-Hannifin Corp. | 864,283 | |||||||||||||
| 10,000 | Robert Half International, Inc. | 153,700 | |||||||||||||
| 17,400 | Rockwell Collins, Inc. | 542,880 | |||||||||||||
| 30,500 | Ryder System, Inc. | 697,230 | |||||||||||||
| 148,900 | Southwest Airlines Co. | 877,021 | |||||||||||||
| 10,730 | SPX Corp. | 475,124 | |||||||||||||
| 260,900 | Tyco International Ltd. | 5,231,045 | |||||||||||||
| 202,800 | Union Pacific Corp. | 7,609,056 | |||||||||||||
| 76,400 | United Parcel Service, Inc.-Class B | 3,146,152 | |||||||||||||
| 92,700 | United Technologies Corp. | 3,784,941 | |||||||||||||
| 4,800 | W.W. Grainger, Inc. | 317,568 | |||||||||||||
| 57,000 | Waste Management, Inc. | 1,539,000 | |||||||||||||
| Total Industrials | 81,137,785 | ||||||||||||||
| Information Technology — 17.1% | |||||||||||||||
| 115,000 | Affiliated Computer Services, Inc.-Class A * | 5,362,450 | |||||||||||||
| 12,900 | Alliance Data Systems Corp. * | 381,840 | |||||||||||||
| 79,000 | Altera Corp. | 1,211,070 | |||||||||||||
| 27,300 | Automatic Data Processing, Inc. | 932,295 | |||||||||||||
| 43,200 | BMC Software, Inc. * | 1,280,016 | |||||||||||||
| 2,813,200 | Cisco Systems, Inc. * | 40,988,324 | |||||||||||||
| 31,900 | Citrix Systems, Inc. * | 656,502 | |||||||||||||
| 140,200 | Dell, Inc. * | 1,195,906 | |||||||||||||
| 511,300 | eBay, Inc. * | 5,557,831 | |||||||||||||
| 24,300 | Fiserv, Inc. * | 792,666 | |||||||||||||
| 22,500 | Global Payments, Inc. | 690,300 | |||||||||||||
| 36,200 | Google, Inc.-Class A * | 12,235,238 | |||||||||||||
| 201,760 | International Business Machines Corp. | 18,567,973 | |||||||||||||
| 315,247 | Lawson Software, Inc. * | 1,210,548 | |||||||||||||
| 9,300 | Linear Technology Corp. | 202,740 | |||||||||||||
| �� | 95,900 | LSI Corp. * | 278,110 | ||||||||||||
| 30,790 | MasterCard, Inc.-Class A | 4,865,744 | |||||||||||||
| 22,800 | McAfee, Inc. * | 637,260 | |||||||||||||
See accompanying notes to the financial statements.
9
GMO U.S. Core Equity Fund
(A Series of GMO Trust)
Schedule of Investments — (Continued)
(showing percentage of total net assets)
February 28, 2009
| Shares | Description | Value ($) | |||||||||||||
| Information Technology — continued | |||||||||||||||
| 4,460,000 | Microsoft Corp. | 72,029,000 | |||||||||||||
| 10,500 | NCR Corp. * | 83,160 | |||||||||||||
| 52,700 | NetApp, Inc. * | 708,288 | |||||||||||||
| 2,878,200 | Oracle Corp. * | 44,727,228 | |||||||||||||
| 1,628,600 | Qualcomm, Inc. | 54,444,098 | |||||||||||||
| 40,300 | Red Hat, Inc. * | 551,707 | |||||||||||||
| 26,800 | Salesforce.com, Inc. * | 750,400 | |||||||||||||
| 203,400 | Symantec Corp. * | 2,813,022 | |||||||||||||
| 589,500 | VeriFone Holdings, Inc. * | 2,558,430 | |||||||||||||
| 3,600 | Visa, Inc.-Class A | 204,156 | |||||||||||||
| 88,200 | Western Digital Corp. * | 1,204,812 | |||||||||||||
| 353,100 | Western Union Co. | 3,940,596 | |||||||||||||
| 99,400 | Xilinx, Inc. | 1,757,392 | |||||||||||||
| Total Information Technology | 282,819,102 | ||||||||||||||
| Materials — 1.4% | |||||||||||||||
| 230,600 | Alcoa, Inc. | 1,436,638 | |||||||||||||
| 191,400 | Barrick Gold Corp. | 5,780,280 | |||||||||||||
| 7,900 | Bemis Co., Inc. | 146,703 | |||||||||||||
| 12,100 | Crown Holdings, Inc. * | 255,068 | |||||||||||||
| 3,076,174 | Domtar Corp. * | 2,430,177 | |||||||||||||
| 82,800 | Dow Chemical Co. (The) | 592,848 | |||||||||||||
| 12,300 | FMC Corp. | 497,289 | |||||||||||||
| 51,480 | Monsanto Co. | 3,926,380 | |||||||||||||
| 137,500 | Nucor Corp. | 4,626,875 | |||||||||||||
| 34,400 | Pactiv Corp. * | 544,552 | |||||||||||||
| 13,600 | Reliance Steel & Aluminum Co. | 323,544 | |||||||||||||
| 11,300 | Sealed Air Corp. | 126,108 | |||||||||||||
| 36,200 | Sigma-Aldrich Corp. | 1,292,340 | |||||||||||||
| 7,400 | Sonoco Products Co. | 142,598 | |||||||||||||
| 19,100 | Vulcan Materials Co. | 790,931 | |||||||||||||
| Total Materials | 22,912,331 | ||||||||||||||
See accompanying notes to the financial statements.
10
GMO U.S. Core Equity Fund
(A Series of GMO Trust)
Schedule of Investments — (Continued)
(showing percentage of total net assets)
February 28, 2009
| Shares | Description | Value ($) | |||||||||||||
| Telecommunication Services — 1.2% | |||||||||||||||
| 395,767 | AT&T, Inc. | 9,407,381 | |||||||||||||
| 6,900 | CenturyTel, Inc. | 181,677 | |||||||||||||
| 66,400 | Frontier Communications Corp. | 478,080 | |||||||||||||
| 13,200 | MetroPCS Communications, Inc. * | 191,400 | |||||||||||||
| 322,622 | Verizon Communications, Inc. | 9,204,406 | |||||||||||||
| 20,700 | Windstream Corp. | 154,422 | |||||||||||||
| Total Telecommunication Services | 19,617,366 | ||||||||||||||
| Utilities — 0.6% | |||||||||||||||
| 9,900 | Consolidated Edison, Inc. | 358,479 | |||||||||||||
| 6,300 | Dominion Resources, Inc./Virginia | 190,134 | |||||||||||||
| 5,500 | Energen Corp. | 147,400 | |||||||||||||
| 22,400 | Exelon Corp. | 1,057,728 | |||||||||||||
| 66,900 | FirstEnergy Corp. | 2,847,264 | |||||||||||||
| 8,800 | Hawaiian Electric Industries, Inc. | 122,056 | |||||||||||||
| 27,900 | MDU Resources Group, Inc. | 422,406 | |||||||||||||
| 6,500 | National Fuel Gas Co. | 197,015 | |||||||||||||
| 5,200 | NSTAR | 167,284 | |||||||||||||
| 37,800 | PG&E Corp. | 1,444,716 | |||||||||||||
| 6,200 | Piedmont Natural Gas Co., Inc. | 149,668 | |||||||||||||
| 45,500 | Southern Co. | 1,379,105 | |||||||||||||
| 71,500 | TECO Energy, Inc. | 685,685 | |||||||||||||
| 9,900 | Xcel Energy, Inc. | 175,626 | |||||||||||||
| Total Utilities | 9,344,566 | ||||||||||||||
| TOTAL COMMON STOCKS (COST $2,339,798,846) | 1,582,196,093 | ||||||||||||||
See accompanying notes to the financial statements.
11
GMO U.S. Core Equity Fund
(A Series of GMO Trust)
Schedule of Investments — (Continued)
(showing percentage of total net assets)
February 28, 2009
| Shares / Par Value ($) | Description | Value ($) | |||||||||||||
| SHORT-TERM INVESTMENTS — 1.5% | |||||||||||||||
| Money Market Funds — 0.3% | |||||||||||||||
| 5,933,603 | State Street Institutional Treasury Money Market Fund-Institutional Class | 5,933,603 | |||||||||||||
| Other Short-Term Investments — 1.2% | |||||||||||||||
| 20,000,000 | U.S. Treasury Bill, 0.35%, due 07/23/09 (a) | 19,972,040 | |||||||||||||
| TOTAL SHORT-TERM INVESTMENTS (COST $25,912,803) | 25,905,643 | ||||||||||||||
| TOTAL INVESTMENTS — 97.1% (Cost $2,365,711,649) | 1,608,101,736 | ||||||||||||||
| Other Assets and Liabilities (net) — 2.9% | 47,306,952 | ||||||||||||||
| TOTAL NET ASSETS — 100.0% | $ | 1,655,408,688 | |||||||||||||
A summary of outstanding financial instruments at February 28, 2009 is as follows:
Futures Contracts
| Number of Contracts | Type | Expiration Date | Contract Value | Net Unrealized Appreciation (Depreciation) | |||||||||||||||
| Buys | |||||||||||||||||||
| 1,210 | S&P 500 E-Mini Index | March 2009 | $ | 44,419,100 | $ | (4,979,701 | ) | ||||||||||||
As of February 28, 2009, for the futures contracts held, the Fund had sufficient cash and/or securities to cover any commitments or margin requirements of the relevant broker or exchange.
Notes to Schedule of Investments:
* Non-income producing security.
(a) Rate shown represents yield-to-maturity.
See accompanying notes to the financial statements.
12
GMO U.S. Core Equity Fund
(A Series of GMO Trust)
Statement of Assets and Liabilities — February 28, 2009
| Assets: | |||||||
| Investments, at value (cost $2,365,711,649) (Note 2) | $ | 1,608,101,736 | |||||
| Cash | 33,705,797 | ||||||
| Receivable for investments sold | 1,573,000 | ||||||
| Receivable for Fund shares sold | 3,588,459 | ||||||
| Dividends and interest receivable | 6,027,207 | ||||||
| Receivable for collateral on open futures contracts (Note 2) | 5,989,500 | ||||||
| Receivable for expenses reimbursed by Manager (Note 3) | 36,400 | ||||||
| Total assets | 1,659,022,099 | ||||||
| Liabilities: | |||||||
| Payable for investments purchased | 1,690,002 | ||||||
| Payable for Fund shares repurchased | 30,979 | ||||||
| Payable to affiliate for (Note 3): | |||||||
| Management fee | 432,226 | ||||||
| Shareholder service fee | 124,508 | ||||||
| Administration fee – Class M | 301 | ||||||
| Trustees and Chief Compliance Officer of GMO Trust fees | 6,319 | ||||||
| Payable for 12b-1 fee – Class M | 903 | ||||||
| Payable for variation margin on open futures contracts (Note 2) | 1,076,900 | ||||||
| Accrued expenses | 251,273 | ||||||
| Total liabilities | 3,613,411 | ||||||
| Net assets | $ | 1,655,408,688 | |||||
See accompanying notes to the financial statements.
13
GMO U.S. Core Equity Fund
(A Series of GMO Trust)
Statement of Assets and Liabilities — February 28, 2009 — (Continued)
| Net assets consist of: | |||||||
| Paid-in capital | $ | 3,022,186,960 | |||||
| Accumulated undistributed net investment income | 7,202,149 | ||||||
| Accumulated net realized loss | (611,390,807 | ) | |||||
| Net unrealized depreciation | (762,589,614 | ) | |||||
| $ | 1,655,408,688 | ||||||
| Net assets attributable to: | |||||||
| Class III shares | $ | 509,119,539 | |||||
| Class IV shares | $ | 286,333,115 | |||||
| Class VI shares | $ | 858,170,448 | |||||
| Class M shares | $ | 1,785,586 | |||||
| Shares outstanding: | |||||||
| Class III | 66,581,777 | ||||||
| Class IV | 37,529,937 | ||||||
| Class VI | 112,501,755 | ||||||
| Class M | 233,522 | ||||||
| Net asset value per share: | |||||||
| Class III | $ | 7.65 | |||||
| Class IV | $ | 7.63 | |||||
| Class VI | $ | 7.63 | |||||
| Class M | $ | 7.65 | |||||
See accompanying notes to the financial statements.
14
GMO U.S. Core Equity Fund
(A Series of GMO Trust)
Statement of Operations — Year Ended February 28, 2009
| Investment Income: | |||||||
| Dividends (net of withholding taxes of $14,124) | $ | 59,835,084 | |||||
| Interest | 746,906 | ||||||
| Total investment income | 60,581,990 | ||||||
| Expenses: | |||||||
| Management fee (Note 3) | 8,713,227 | ||||||
| Shareholder service fee – Class III (Note 3) | 1,190,371 | ||||||
| Shareholder service fee – Class IV (Note 3) | 400,757 | ||||||
| Shareholder service fee – Class VI (Note 3) | 872,078 | ||||||
| 12b-1 fee – Class M (Note 3) | 76,963 | ||||||
| Administration fee – Class M (Note 3) | 61,570 | ||||||
| Custodian, fund accounting agent and transfer agent fees | 471,272 | ||||||
| Audit and tax fees | 63,403 | ||||||
| Legal fees | 76,768 | ||||||
| Trustees fees and related expenses (Note 3) | 35,846 | ||||||
| Registration fees | 36,967 | ||||||
| Miscellaneous | 36,356 | ||||||
| Total expenses | 12,035,578 | ||||||
| Fees and expenses reimbursed by Manager (Note 3) | (657,777 | ) | |||||
| Expense reductions (Note 2) | (29,279 | ) | |||||
| Net expenses | 11,348,522 | ||||||
| Net investment income (loss) | 49,233,468 | ||||||
| Realized and unrealized gain (loss): | |||||||
| Net realized gain (loss) on: | |||||||
| Investments | (553,306,259 | ) | |||||
| Closed futures contracts | (26,279,332 | ) | |||||
| Net realized gain (loss) | (579,585,591 | ) | |||||
| Change in net unrealized appreciation (depreciation) on: | |||||||
| Investments | (500,014,618 | ) | |||||
| Open futures contracts | (3,515,378 | ) | |||||
| Net unrealized gain (loss) | (503,529,996 | ) | |||||
| Net realized and unrealized gain (loss) | (1,083,115,587 | ) | |||||
| Net increase (decrease) in net assets resulting from operations | $ | (1,033,882,119 | ) | ||||
See accompanying notes to the financial statements.
15
GMO U.S. Core Equity Fund
(A Series of GMO Trust)
Statement of Changes in Net Assets
| Year Ended February 28, 2009 | Year Ended February 29, 2008 | ||||||||||
| Increase (decrease) in net assets: | |||||||||||
| Operations: | |||||||||||
| Net investment income (loss) | $ | 49,233,468 | $ | 72,698,949 | |||||||
| Net realized gain (loss) | (579,585,591 | ) | 349,051,892 | ||||||||
| Change in net unrealized appreciation (depreciation) | (503,529,996 | ) | (613,657,620 | ) | |||||||
| Net increase (decrease) in net assets from operations | (1,033,882,119 | ) | (191,906,779 | ) | |||||||
| Distributions to shareholders from: | |||||||||||
| Net investment income | |||||||||||
| Class III | (13,415,542 | ) | (28,161,365 | ) | |||||||
| Class IV | (7,250,680 | ) | (10,426,216 | ) | |||||||
| Class VI | (29,721,224 | ) | (43,036,312 | ) | |||||||
| Class M | (406,196 | ) | (1,560,161 | ) | |||||||
| Total distributions from net investment income | (50,793,642 | ) | (83,184,054 | ) | |||||||
| Net realized gains | |||||||||||
| Class III | — | (171,156,746 | ) | ||||||||
| Class IV | — | (61,162,205 | ) | ||||||||
| Class VI | — | (291,784,061 | ) | ||||||||
| Class M | — | (10,886,017 | ) | ||||||||
| Total distributions from net realized gains | — | (534,989,029 | ) | ||||||||
| (50,793,642 | ) | (618,173,083 | ) | ||||||||
| Net share transactions (Note 7): | |||||||||||
| Class III | (333,388,149 | ) | (378,601,907 | ) | |||||||
| Class IV | (29,109,705 | ) | (15,629,517 | ) | |||||||
| Class VI | (550,731,373 | ) | (1,232,938,512 | ) | |||||||
| Class M | (44,651,124 | ) | (60,272,243 | ) | |||||||
| Increase (decrease) in net assets resulting from net share transactions | (957,880,351 | ) | (1,687,442,179 | ) | |||||||
| Total increase (decrease) in net assets | (2,042,556,112 | ) | (2,497,522,041 | ) | |||||||
| Net assets: | |||||||||||
| Beginning of period | 3,697,964,800 | 6,195,486,841 | |||||||||
| End of period (including accumulated undistributed net investment income of $7,202,149 and $8,762,323, respectively) | $ | 1,655,408,688 | $ | 3,697,964,800 | |||||||
See accompanying notes to the financial statements.
16
GMO U.S. Core Equity Fund
(A Series of GMO Trust)
Financial Highlights
(For a Class III share outstanding throughout each period)
| Year Ended February 28/29, | |||||||||||||||||||||||
| 2009 | 2008 | 2007 | 2006 | 2005 | |||||||||||||||||||
| Net asset value, beginning of period | $ | 12.05 | $ | 14.77 | $ | 14.50 | $ | 14.28 | $ | 13.54 | |||||||||||||
| Income (loss) from investment operations: | |||||||||||||||||||||||
| Net investment income (loss)† | 0.18 | 0.22 | 0.22 | 0.24 | 0.19 | ||||||||||||||||||
| Net realized and unrealized gain (loss) | (4.40 | ) | (1.10 | ) | 0.64 | 0.54 | 0.73 | ||||||||||||||||
| Total from investment operations | (4.22 | ) | (0.88 | ) | 0.86 | 0.78 | 0.92 | ||||||||||||||||
| Less distributions to shareholders: | |||||||||||||||||||||||
| From net investment income | (0.18 | ) | (0.25 | ) | (0.22 | ) | (0.24 | ) | (0.18 | ) | |||||||||||||
| From net realized gains | — | (1.59 | ) | (0.37 | ) | (0.32 | ) | — | |||||||||||||||
| Total distributions | (0.18 | ) | (1.84 | ) | (0.59 | ) | (0.56 | ) | (0.18 | ) | |||||||||||||
| Net asset value, end of period | $ | 7.65 | $ | 12.05 | $ | 14.77 | $ | 14.50 | $ | 14.28 | |||||||||||||
| Total Return(a) | (35.39 | )% | (7.33 | )% | 5.97 | % | 5.60 | % | 6.89 | % | |||||||||||||
| Ratios/Supplemental Data: | |||||||||||||||||||||||
| Net assets, end of period (000's) | $ | 509,120 | $ | 1,131,800 | $ | 1,789,872 | $ | 2,841,959 | $ | 1,739,392 | |||||||||||||
| Net expenses to average daily net assets | 0.46 | %(b) | 0.46 | %(b) | 0.46 | % | 0.47 | % | 0.48 | % | |||||||||||||
| Net investment income to average daily net assets | 1.70 | % | 1.55 | % | 1.51 | % | 1.69 | % | 1.46 | % | |||||||||||||
| Portfolio turnover rate | 62 | % | 71 | % | 78 | % | 65 | % | 65 | % | |||||||||||||
| Fees and expenses reimbursed by the Manager to average daily net assets: | 0.02 | % | 0.02 | % | 0.02 | % | 0.02 | % | 0.02 | % | |||||||||||||
(a) The total returns would have been lower had certain expenses not been reimbursed during the periods shown and assumes the effect of reinvested distributions.
(b) The net expense ratio does not include the effect of expense reductions.
† Calculated using average shares outstanding throughout the period.
See accompanying notes to the financial statements.
17
GMO U.S. Core Equity Fund
(A Series of GMO Trust)
Financial Highlights
(For a Class IV share outstanding throughout each period)
| Year Ended February 28/29, | |||||||||||||||||||||||
| 2009 | 2008 | 2007 | 2006 | 2005 | |||||||||||||||||||
| Net asset value, beginning of period | $ | 12.02 | $ | 14.75 | $ | 14.48 | $ | 14.26 | $ | 13.52 | |||||||||||||
| Income (loss) from investment operations: | |||||||||||||||||||||||
| Net investment income (loss)† | 0.19 | 0.22 | 0.22 | 0.25 | 0.20 | ||||||||||||||||||
| Net realized and unrealized gain (loss) | (4.39 | ) | (1.10 | ) | 0.65 | 0.54 | 0.73 | ||||||||||||||||
| Total from investment operations | (4.20 | ) | (0.88 | ) | 0.87 | 0.79 | 0.93 | ||||||||||||||||
| Less distributions to shareholders: | |||||||||||||||||||||||
| From net investment income | (0.19 | ) | (0.26 | ) | (0.23 | ) | (0.25 | ) | (0.19 | ) | |||||||||||||
| From net realized gains | — | (1.59 | ) | (0.37 | ) | (0.32 | ) | — | |||||||||||||||
| Total distributions | (0.19 | ) | (1.85 | ) | (0.60 | ) | (0.57 | ) | (0.19 | ) | |||||||||||||
| Net asset value, end of period | $ | 7.63 | $ | 12.02 | $ | 14.75 | $ | 14.48 | $ | 14.26 | |||||||||||||
| Total Return(a) | (35.36 | )% | (7.36 | )% | 6.05 | % | 5.66 | % | 6.96 | % | |||||||||||||
| Ratios/Supplemental Data: | |||||||||||||||||||||||
| Net assets, end of period (000's) | $ | 286,333 | $ | 478,084 | $ | 602,048 | $ | 749,822 | $ | 866,206 | |||||||||||||
| Net expenses to average daily net assets | 0.41 | %(b) | 0.41 | %(b) | 0.41 | % | 0.43 | % | 0.44 | % | |||||||||||||
| Net investment income to average daily net assets | 1.78 | % | 1.57 | % | 1.55 | % | 1.76 | % | 1.49 | % | |||||||||||||
| Portfolio turnover rate | 62 | % | 71 | % | 78 | % | 65 | % | 65 | % | |||||||||||||
| Fees and expenses reimbursed by the Manager to average daily net assets: | 0.02 | % | 0.02 | % | 0.02 | % | 0.02 | % | 0.02 | % | |||||||||||||
(a) The total returns would have been lower had certain expenses not been reimbursed during the periods shown and assumes the effect of reinvested distributions.
(b) The net expense ratio does not include the effect of expense reductions.
† Calculated using average shares outstanding throughout the period.
See accompanying notes to the financial statements.
18
GMO U.S. Core Equity Fund
(A Series of GMO Trust)
Financial Highlights
(For a Class VI share outstanding throughout each period)
| Year Ended February 28/29, | |||||||||||||||||||||||
| 2009 | 2008 | 2007 | 2006 | 2005 | |||||||||||||||||||
| Net asset value, beginning of period | $ | 12.02 | $ | 14.75 | $ | 14.47 | $ | 14.26 | $ | 13.52 | |||||||||||||
| Income (loss) from investment operations: | |||||||||||||||||||||||
| Net investment income (loss)† | 0.19 | 0.23 | 0.23 | 0.25 | 0.21 | ||||||||||||||||||
| Net realized and unrealized gain (loss) | (4.38 | ) | (1.11 | ) | 0.65 | 0.54 | 0.72 | ||||||||||||||||
| Total from investment operations | (4.19 | ) | (0.88 | ) | 0.88 | 0.79 | 0.93 | ||||||||||||||||
| Less distributions to shareholders: | |||||||||||||||||||||||
| From net investment income | (0.20 | ) | (0.26 | ) | (0.23 | ) | (0.26 | ) | (0.19 | ) | |||||||||||||
| From net realized gains | — | (1.59 | ) | (0.37 | ) | (0.32 | ) | — | |||||||||||||||
| Total distributions | (0.20 | ) | (1.85 | ) | (0.60 | ) | (0.58 | ) | (0.19 | ) | |||||||||||||
| Net asset value, end of period | $ | 7.63 | $ | 12.02 | $ | 14.75 | $ | 14.47 | $ | 14.26 | |||||||||||||
| Total Return(a) | (35.33 | )% | (7.32 | )% | 6.17 | % | 5.64 | % | 7.01 | % | |||||||||||||
| Ratios/Supplemental Data: | |||||||||||||||||||||||
| Net assets, end of period (000's) | $ | 858,170 | $ | 2,031,659 | $ | 3,671,926 | $ | 2,543,300 | $ | 1,750,325 | |||||||||||||
| Net expenses to average daily net assets | 0.37 | %(b) | 0.37 | %(b) | 0.37 | % | 0.38 | % | 0.39 | % | |||||||||||||
| Net investment income to average daily net assets | 1.78 | % | 1.63 | % | 1.61 | % | 1.78 | % | 1.56 | % | |||||||||||||
| Portfolio turnover rate | 62 | % | 71 | % | 78 | % | 65 | % | 65 | % | |||||||||||||
| Fees and expenses reimbursed by the Manager to average daily net assets: | 0.02 | % | 0.02 | % | 0.02 | % | 0.02 | % | 0.02 | % | |||||||||||||
(a) The total returns would have been lower had certain expenses not been reimbursed during the periods shown and assumes the effect of reinvested distributions.
(b) The net expense ratio does not include the effect of expense reductions.
† Calculated using average shares outstanding throughout the period.
See accompanying notes to the financial statements.
19
GMO U.S. Core Equity Fund
(A Series of GMO Trust)
Financial Highlights
(For a Class M share outstanding throughout each period)
| Year Ended February 28/29, | |||||||||||||||||||||||
| 2009 | 2008 | 2007 | 2006 | 2005 | |||||||||||||||||||
| Net asset value, beginning of period | $ | 12.03 | $ | 14.75 | $ | 14.47 | $ | 14.26 | $ | 13.52 | |||||||||||||
| Income (loss) from investment operations: | |||||||||||||||||||||||
| Net investment income (loss)† | 0.15 | 0.18 | 0.18 | 0.20 | 0.16 | ||||||||||||||||||
| Net realized and unrealized gain (loss) | (4.40 | ) | (1.11 | ) | 0.64 | 0.53 | 0.72 | ||||||||||||||||
| Total from investment operations | (4.25 | ) | (0.93 | ) | 0.82 | 0.73 | 0.88 | ||||||||||||||||
| Less distributions to shareholders: | |||||||||||||||||||||||
| From net investment income | (0.13 | ) | (0.20 | ) | (0.17 | ) | (0.20 | ) | (0.14 | ) | |||||||||||||
| From net realized gains | — | (1.59 | ) | (0.37 | ) | (0.32 | ) | — | |||||||||||||||
| Total distributions | (0.13 | ) | (1.79 | ) | (0.54 | ) | (0.52 | ) | (0.14 | ) | |||||||||||||
| Net asset value, end of period | $ | 7.65 | $ | 12.03 | $ | 14.75 | $ | 14.47 | $ | 14.26 | |||||||||||||
| Total Return(a) | (35.61 | )% | (7.64 | )% | 5.73 | % | 5.22 | % | 6.61 | % | |||||||||||||
| Ratios/Supplemental Data: | |||||||||||||||||||||||
| Net assets, end of period (000's) | $ | 1,786 | $ | 56,422 | $ | 131,640 | $ | 157,009 | $ | 171,316 | |||||||||||||
| Net expenses to average daily net assets | 0.76 | %(b) | 0.76 | %(b) | 0.76 | % | 0.77 | % | 0.78 | % | |||||||||||||
| Net investment income to average daily net assets | 1.29 | % | 1.23 | % | 1.22 | % | 1.41 | % | 1.17 | % | |||||||||||||
| Portfolio turnover rate | 62 | % | 71 | % | 78 | % | 65 | % | 65 | % | |||||||||||||
| Fees and expenses reimbursed by the Manager to average daily net assets: | 0.02 | % | 0.02 | % | 0.02 | % | 0.02 | % | 0.02 | % | |||||||||||||
(a) The total returns would have been lower had certain expenses not been reimbursed during the periods shown and assumes the effect of reinvested distributions.
(b) The net expense ratio does not include the effect of expense reductions.
† Calculated using average shares outstanding throughout the period.
See accompanying notes to the financial statements.
20
GMO U.S. Core Equity Fund
(A Series of GMO Trust)
Notes to Financial Statements
February 28, 2009
1. Organization
GMO U.S. Core Equity Fund (the "Fund") is a series of GMO Trust (the "Trust"). The Fund is registered under the Investment Company Act of 1940, as amended, as an open-end, diversified management investment company. The Fund is advised and managed by Grantham, Mayo, Van Otterloo & Co. LLC (the "Manager" or "GMO"). The Trust was established as a Massachusetts business trust under the laws of The Commonwealth of Massachusetts on June 24, 1985. The Declaration of Trust permits the Trustees of the Trust ("Trustees") to create an unlimited number of series of shares ("Funds") and to subdivide Funds into classes.
The Fund seeks high total return. The Fund seeks to achieve its objective by outperforming the S&P 500 Index. The Fund typically makes equity investments in companies that issue stocks included in the S&P 500 Index, and companies with similar market capitalizations.
Throughout the year ended February 28, 2009, the Fund had four classes of shares outstanding: Class III, Class IV, Class VI, and Class M. Class M shares bear an administration fee and a 12b-1 fee while Classes III, IV and VI bear a shareholder service fee (See Note 3). The principal economic difference among the classes of shares is the type and level of fees borne by the classes.
2. Significant accounting policies
The following is a summary of significant accounting policies followed by the Fund in the preparation of its financial statements. These policies are in conformity with accounting principles generally accepted in the United States of America ("U.S. GAAP") and have been consistently followed by the Fund in preparing its financial statements. The preparation of financial statements in accordance with U.S. GAAP requires management to make estimates and assumptions that affect the reported amounts and disclosures in the financial statements. Actual results could differ from those estimates. The accounting records of the Fund are maintained in U.S. dollars.
Portfolio valuation
Securities listed on a securities exchange for which market quotations are readily available are valued at the last sale price or official closing price on each business day, or if there is no such reported sale or official closing price, at the most recent quoted bid price. Unlisted securities for which market quotations are readily available are generally valued at the most recent quoted bid price. Debt instruments with a remaining maturity of sixty days or less are generally valued at amortized cost, which approximates fair value. Shares of investment funds are generally valued at their net asset value. Securities for which quotations are not readily available or whose values the Manager has determined to be unreliable are valued at fair value as determined in good faith by the Trustees or persons acting at their direction pursuant to procedures approved by the Trustees. By its nature, a fair value price is a good faith estim ate of the value of a security at a given point in time and may not reflect the value that would be realized if
21
GMO U.S. Core Equity Fund
(A Series of GMO Trust)
Notes to Financial Statements — (Continued)
February 28, 2009
the security were sold. The difference between a fair value price and the value realized upon a sale could be material.
In September 2006, the Financial Accounting Standards Board ("FASB") issued Statement of Financial Accounting Standards No. 157, Fair Value Measurements ("SFAS 157"). SFAS 157 is effective for the Fund's current fiscal year. While the adoption of SFAS 157 does not have an effect on the Fund's net asset value, it does require additional disclosures about fair value measurements. SFAS 157 establishes a three-level hierarchy for disclosure of fair value measurements. The valuation hierarchy is based upon the reliability of inputs to the valuation of the Fund's investments. The three levels are defined as follows:
Level 1 – Valuations based on quoted prices for identical securities in active markets.
Level 2 – Valuations determined using other significant direct or indirect observable inputs.
Level 3 – Valuations based on inputs that are unobservable and significant.
The inputs or methodology used for valuing securities are not necessarily an indication of the risk associated with investing in those securities.
The following is a summary of the fair valuations according to inputs used as of February 28, 2009 in valuing the Fund's investments:
| Asset Valuation Inputs | Investments in Securities | Other Financial Instruments | |||||||||
| Level 1 - Quoted Prices | $ | 1,602,168,133 | $ | — | |||||||
| Level 2 - Other Significant Observable Inputs | 5,933,603 | — | |||||||||
| Level 3 - Significant Unobservable Inputs | — | — | |||||||||
| Total | $ | 1,608,101,736 | $ | — | |||||||
| Liability Valuation Inputs | Investments in Securities | Other Financial Instruments* | |||||||||
| Level 1 - Quoted Prices | $ | — | $ | (4,979,701 | ) | ||||||
| Level 2 - Other Significant Observable Inputs | — | — | |||||||||
| Level 3 - Significant Unobservable Inputs | — | — | |||||||||
| Total | $ | — | $ | (4,979,701 | ) | ||||||
* Other financial instruments include futures contracts.
The Fund held no investments or other financial instruments at either February 29, 2008 or February 28, 2009, whose fair value was determined using Level 3 inputs.
22
GMO U.S. Core Equity Fund
(A Series of GMO Trust)
Notes to Financial Statements — (Continued)
February 28, 2009
Futures contracts
The Fund may purchase and sell futures contracts. Upon entering into a futures contract, the Fund is required to deposit cash, U.S. government and agency obligations, or other liquid assets with the futures clearing broker in accordance with the initial margin requirements of the broker or exchange. In addition, the Fund maintains cash or securities in an amount that at least equals the net amount payable in the event the Fund must deliver the full amount of the contract. Futures contracts are marked to market daily and an appropriate payable or receivable for the change in value ("variation margin") is recorded by the Fund. The payable or receivable is settled on the following business day. Gains or losses are recognized but not considered realized until the contracts expire or are closed. Futures contracts involve, to varying degrees, risk of loss in excess of the variation margin disclosed in the Statement of Assets and Liabi lities. Under some circumstances, futures exchanges may establish daily limits on the amount that the price of a futures contract can vary from the previous day's settlement price, thereby effectively preventing liquidation of unfavorable positions. Losses may arise from changes in the value of the underlying instrument if the Fund is unable to liquidate a futures position due to an illiquid secondary market for the contract or the imposition of price limits, or if counterparties do not perform under the contract terms. Futures contracts are generally valued at the settlement price established each day by the board of trade or exchange on which they are traded. Futures contracts outstanding at the end of the period are listed in the Fund's Schedule of Investments.
Swap agreements
The Fund may enter into various types of swap agreements, including without limitation, interest rate, total return, credit default and variance swap agreements. A swap agreement is an agreement to exchange the return generated by one instrument for the return generated by another instrument. When entering into a swap agreement, the Fund and/or the swap counterparty may post or receive cash or securities as collateral. The party posting the collateral typically receives the interest associated with or payments related to the collateral and has the risk of loss related to the collateral.
Interest rate swap agreements involve an exchange by the parties of their respective commitments to pay or right to receive interest, e.g., an exchange of floating rate interest payments for fixed rate interest payments with respect to the notional amount of principal.
Total return swap agreements involve a commitment by one party to pay interest to the other party in exchange for a payment to it from the other party based on the return of a reference instrument (e.g., a security or basket of securities), both based on notional amounts. To the extent the return of the reference instrument exceeds or falls short of the interest payments, one party will receive a payment from or make a payment to the other party.
In a credit default swap agreement, one party makes payments to another party in exchange for the right to receive a specified return if a credit event occurs with respect to a referenced entity or entities. Buying credit default protection reduces the buyer's exposure in the event of an issuer's default (e.g., it reduces
23
GMO U.S. Core Equity Fund
(A Series of GMO Trust)
Notes to Financial Statements — (Continued)
February 28, 2009
risk where a party owns a security issued by or otherwise has exposure to the issuer). Selling credit default protection subjects the seller to exposure to an issuer's default. A seller of credit default protection receives payments in return for its obligation to pay the principal amount of a debt security (or other agreed-upon value) to the other party upon the occurrence of a credit event (e.g., issuer default or similar event). If no credit event occurs, the seller has no payment obligations. For credit default swap agreements on asset-backed securities, a credit event may be triggered by such events as the issuer's failure to pay interest or principal, an agreement of the holders of an asset-backed security to a maturity extension, a rating downgrade on the security or a write-down on the collateral underlying the security. For credit default swap agreements on corporate or sovereign issuers, a credit event may be triggered by such events as the issuer's bankruptcy, failure to pay interest or principal, repudiation/moratorium or restructuring.
Variance swap agreements involve an agreement by two parties to exchange cash flows based on the measured variance (or square of volatility) of a specified underlying asset. One party agrees to exchange a "fixed rate" or strike price payment for the "floating rate" or realized price variance on the underlying asset with respect to the notional amount. At inception, the strike price chosen is generally fixed at a level such that the fair value of the swap is zero. At the expiration date, the amount paid by one party to the other is the difference between the realized price variance of the underlying asset and the strike price multiplied by the notional amount. A receiver of the realized price variance would receive a payment when the realized price variance of the underlying asset is greater than the strike price and would make a payment when that variance is less than the strike price. A payer of the realized price variance woul d make a payment when the realized price variance of the underlying asset is greater than the strike price and would receive a payment when that variance is less than the strike price. This type of agreement is essentially a forward contract on the future realized price variance of the underlying asset.
The Fund prices its swap agreements daily using models that may incorporate quotations from market makers and records the change in value, if any, as unrealized gain or loss in the Statement of Operations. Payments received or made on swap agreements are recorded as realized gain or loss in the Statement of Operations. Gains or losses are realized upon termination of the swap agreements.
Swap agreements often are not actively traded on financial markets. The values assigned to them may differ significantly from the values that would be realized upon termination, and the differences could be material. Entering into swap agreements involves credit, legal, market and documentation risk that is not reflected in the amounts reported in the Statement of Assets and Liabilities. Such risks include the possibility that the party with whom the Fund contracts may default on its obligations to perform or disagree as to the meaning of contractual terms, or that the collateral that party posts may be insufficient or not timely received by the Fund. Credit risk may be particularly acute in an environment where financial services firms are exposed to systemic risks of the type evidenced by the insolvency of Lehman Brothers and subsequent market disruptions. The Fund had no swap agreements outstanding at the end of the period.
24
GMO U.S. Core Equity Fund
(A Series of GMO Trust)
Notes to Financial Statements — (Continued)
February 28, 2009
Repurchase agreements
The Fund may enter into repurchase agreements. Under a repurchase agreement the Fund acquires a security for cash and obtains a simultaneous commitment from the seller to repurchase the security at an agreed upon price and date. The Fund, through its custodian, takes possession of securities collateralizing the repurchase agreement. The collateral is marked to market daily to ensure that the market value of the underlying assets is at least equal to the amount owed to the Fund in the event of default by the seller. If the seller of a repurchase agreement defaults or enters into insolvency proceedings and the value of the collateral declines, the Fund's recovery of cash may be delayed or limited. The Fund had no repurchase agreements outstanding at the end of the period.
Securities lending
The Fund may lend its securities to qualified brokers. The loans are collateralized with cash or liquid securities with a market value at least equal to the market value of the securities upon entering into the loan. As with other extensions of credit, the Fund may bear the risk of loss with respect to the investment of the collateral, the risk of delay in and/or inability to exercise its rights with respect to the collateral, and the risk of delay in recovery or loss of rights in the loaned securities should the borrower of the securities fail financially. If a loan is collateralized by U.S. government securities, the Fund receives a fee from the borrower. If a loan is collateralized by cash, the Fund typically invests the cash collateral for its own account. For the year from March 1, 2008 through February 28, 2009, the Fund did not participate in securities lending.
Taxes and distributions
The Fund intends to qualify each tax year as a regulated investment company under Subchapter M of the Internal Revenue Code of 1986, as amended (the "Code"). The Fund intends to distribute substantially all of its net investment income and all of its net realized short-term and long-term capital gain, if any, after giving effect to any available capital loss carryforwards for U.S. federal income tax purposes. Therefore, no provision for U.S. federal income or excise tax is necessary.
The Fund's policy is to declare and pay distributions from net investment income, if any, quarterly, and from net realized short-term and long-term capital gain, if any, at least annually. All distributions are paid in shares of the Fund, at net asset value, unless the shareholder elects to receive cash distributions. Distributions to shareholders are recorded by the Fund on the ex-dividend date.
Income and capital gain distributions are determined in accordance with U.S. federal income tax regulations, which may differ from U.S. GAAP. Certain capital accounts in the financial statements are periodically adjusted for permanent differences in order to reflect their tax character. These adjustments have no impact on net assets or net asset value per share. Temporary differences that arise from recognizing
25
GMO U.S. Core Equity Fund
(A Series of GMO Trust)
Notes to Financial Statements — (Continued)
February 28, 2009
certain items of income, expense, gain or loss in different periods for financial statement and tax purposes will reverse at some time in the future. Distributions in excess of net investment income or net realized gains are temporary over-distributions for financial statement purposes resulting from differences in the recognition or classification of income or distributions for financial statement and tax purposes.
U.S. GAAP and tax accounting differences primarily relate to capital loss carryforwards, derivative contract transactions, losses on wash sale transactions and post-October capital losses.
The tax character of distributions declared to shareholders is as follows:
| 2/28/2009 | 2/29/2008 | ||||||||||
| Ordinary income (including any net short-term capital gain) | $ | 50,793,642 | $ | 241,940,523 | |||||||
| Net long-term capital gain | — | 376,232,560 | |||||||||
| Total distributions | $ | 50,793,642 | $ | 618,173,083 | |||||||
Distributions in excess of tax basis earnings and profits, if significant, are reported in the financial statements as a return of capital for tax purposes.
As of February 28, 2009, the components of distributable earnings on a tax basis consisted of the following:
| Undistributed ordinary income (including any net short-term capital gain) | $ | 7,202,149 | |||||
As of February 28, 2009, the Fund elected to defer to March 1, 2009 post-October capital losses of $277,985,666.
As of February 28, 2009, the Fund had capital loss carryforwards available to offset future realized gains if any, to the extent permitted by the Code. Utilization of the capital loss carryforwards could be subject to limitations imposed by the Code related to share ownership activity. Such losses expire as follows:
| 2/28/2017 | $ | (253,190,292 | ) | ||||
| Total | $ | (253,190,292 | ) | ||||
26
GMO U.S. Core Equity Fund
(A Series of GMO Trust)
Notes to Financial Statements — (Continued)
February 28, 2009
As of February 28, 2009, the approximate cost for U.S. federal income tax purposes and gross and net unrealized appreciation (depreciation) in value of investments were as follows:
| Aggregate Cost | Gross Unrealized Appreciation | Gross Unrealized (Depreciation) | Net Unrealized Appreciation (Depreciation) | ||||||||||||
| $ | 2,450,906,198 | $ | 3,349,247 | $ | (846,153,709 | ) | $ | (842,804,462 | ) | ||||||
The Fund is subject to the provisions of Financial Accounting Standards Board Interpretation No. 48 ("FIN 48"), Accounting for Uncertainty in Income Taxes — an Interpretation of FASB Statement No. 109. FIN 48 sets forth a minimum threshold for financial statement recognition of a tax position taken or expected to be taken in a tax return that could affect the Fund's financial statements. The Fund did not have any unrecognized tax benefits or liabilities at February 28, 2009, nor did it have any increases or decreases in unrecognized tax benefits or liabilities for the period then ended. The Fund is subject to examination prior to the expiration of the statute of limitations by U.S. federal and state tax authorities for tax returns filed.
Security transactions and related investment income
Security transactions in the financial statements are accounted for on the trade date. Dividend income, net of applicable foreign withholding taxes, if any, is recorded on the ex-dividend date or, if later, when the Fund is informed of the ex-dividend date. Interest income is recorded on the accrual basis and is adjusted for the amortization of premiums and accretion of discounts. Principal on inflation indexed securities, is adjusted for inflation and any increase or decrease is recorded as interest income or loss. Income is not recognized on securities for which collection is not expected. Non-cash dividends, if any, are recorded at the fair market value of the asset received. In determining the net gain or loss on securities sold, the Fund uses the identified cost basis for the purposes of determining the cost basis.
Expenses
The majority of the expenses of the Trust are directly identifiable to an individual fund. Expenses that are not readily identifiable to a specific fund are allocated taking into consideration, among other things, the nature and type of expense and the relative size of the funds. Investment income, common expenses and realized and unrealized gains and losses are allocated pro rata among the classes of shares of the Fund based on the relative net assets of each class. Shareholder service fees, 12b-1, and administration fees, which are directly attributable to a class of shares, are charged to that class's operations.
State Street Bank and Trust Company ("State Street") serves as custodian, fund accounting agent and transfer agent of the Fund. State Street's fees may be reduced by an earnings allowance calculated on the average daily cash balances the Fund maintains with State Street. The Fund receives the benefit of the earnings allowance. In addition, Goldman Sachs Agency Lending, the Fund's securities lending agent, has agreed to reimburse the Fund for certain transactional expenses related to securities lending activity.
27
GMO U.S. Core Equity Fund
(A Series of GMO Trust)
Notes to Financial Statements — (Continued)
February 28, 2009
Credit balances or expense reimbursements used to reduce fees, if any, are reported as a reduction of expenses in the Statement of Operations.
Recently issued accounting pronouncement
In March 2008, FASB issued Statement of Financial Accounting Standards No. 161, Disclosures about Derivative Instruments and Hedging Activities ("SFAS 161"). SFAS 161 is effective for fiscal years and interim periods beginning after November 15, 2008. SFAS 161 requires enhanced disclosures about the Fund's derivative and hedging activities. The Manager is currently evaluating the impact the adoption of SFAS 161 will have on the Fund's financial statement disclosures.
3. Fees and other transactions with affiliates
GMO receives a management fee for the services it provides to the Fund. That fee is paid monthly at the annual rate of 0.31% of average daily net assets. The Fund has adopted a Shareholder Service Plan under which the Fund pays GMO a shareholder service fee for client and shareholder service, reporting, and other support. Pursuant to the Shareholder Service Plan, the shareholder service fee is calculated based on average daily net assets of each class at the annual rate of 0.15% for Class III shares, 0.10% for Class IV shares and 0.055% for Class VI shares.
Holders of Class M shares of the Fund pay GMO an administration fee for support services provided to Class M shareholders. That fee is paid monthly at the annual rate of 0.20% of the average daily net assets of Class M shares. Pursuant to a Rule 12b-1 distribution and service plan adopted by the Fund, holders of Class M shares of the Fund may pay a fee, at the annual rate of up to 1.00% of average daily net assets of Class M shares for any activities or expenses primarily intended to result in the sale of Class M shares of the Fund and/or the provision of services to Class M shareholders. The Trustees currently limit payments on Class M shares to 0.25% of the Fund's average daily net assets of Class M shares.
Through at least June 30, 2009, the Manager has contractually agreed to reimburse the Fund for Fund expenses incurred through that date to the extent the Fund's total annual operating expenses (excluding "Excluded Expenses", as defined below) exceed 0.31% of the Fund's average daily net assets. Excluded Expenses include shareholder service fees, administration and distribution (12b-1) fees, fees and expenses of the independent Trustees of the Trust, fees and expenses for legal services not approved by the Manager for the Trust, compensation and expenses of the Trust's Chief Compliance Officer ("CCO") (excluding any employee benefits), brokerage commissions, securities lending fees and expenses, interest expense, transfer taxes, and other investment-related costs (including expenses associated with investments in any company that is an investment company or would be an investment company under the 1940 Act, but for the exceptions to the definition of investment company provided in Section 3(c)(1) and 3(c)(7) of the 1940 Act), hedging transaction fees, extraordinary, non-recurring and certain other unusual expenses (including taxes).
28
GMO U.S. Core Equity Fund
(A Series of GMO Trust)
Notes to Financial Statements — (Continued)
February 28, 2009
The Fund's portion of the fee paid by the Trust to the Trust's independent Trustees and CCO during the year ended February 28, 2009 was $32,360 and $20,292, respectively. The compensation and expenses of the CCO are included in miscellaneous expenses in the Statement of Operations. The Fund paid no remuneration to any other officer of the Trust.
4. Purchases and sales of securities
Cost of purchases and proceeds from sales of securities, excluding short-term investments and class exchanges, for the year ended February 28, 2009 aggregated $1,688,973,652 and $2,570,677,692, respectively.
5. Guarantees
In the normal course of business the Fund enters into contracts with third-party service providers that contain a variety of representations and warranties and that provide general indemnifications. The Fund's maximum exposure under these arrangements is unknown, as it involves future claims that may be made against the Fund that have not yet occurred. Based on experience, management is of the view that the risk of loss in connection with its indemnification obligations is remote; however, there can be no assurance that such obligations will not result in material liabilities that adversely affect the Fund.
6. Principal shareholders and related parties
As of February 28, 2009, 33.38% of the outstanding shares of the Fund were held by two shareholders, each holding more than 10% of the Fund's outstanding shares. On that date, no other shareholder owned more than 10% of the outstanding shares of the Fund. One of the shareholders is another fund of the Trust. Redemptions from (or investments into) the Fund by or on behalf of these large shareholders may have a material effect on the Fund.
As of February 28, 2009, 0.01% of the Fund's shares were held by senior management of the Manager and GMO Trust officers and 57.13% of the Fund's shares were held by accounts for which the Manager had investment discretion.
29
GMO U.S. Core Equity Fund
(A Series of GMO Trust)
Notes to Financial Statements — (Continued)
February 28, 2009
7. Share transactions
The Declaration of Trust permits the Trust to issue an unlimited number of shares of beneficial interest (without par value). Transactions in Fund shares were as follows:
| Year Ended February 28, 2009 | Year Ended February 29, 2008 | ||||||||||||||||||
| Class III: | Shares | Amount | Shares | Amount | |||||||||||||||
| Shares sold | 10,238,738 | $ | 93,997,492 | 10,821,336 | $ | 155,921,642 | |||||||||||||
| Shares issued to shareholders in reinvestment of distributions | 1,047,915 | 11,222,375 | 13,691,161 | 193,621,517 | |||||||||||||||
| Shares repurchased | (38,645,942 | ) | (438,608,016 | ) | (51,723,168 | ) | (728,145,066 | ) | |||||||||||
| Net increase (decrease) | (27,359,289 | ) | $ | (333,388,149 | ) | (27,210,671 | ) | $ | (378,601,907 | ) | |||||||||
| Year Ended February 28, 2009 | Year Ended February 29, 2008 | ||||||||||||||||||
| Class IV: | Shares | Amount | Shares | Amount | |||||||||||||||
| Shares sold | 10,729,862 | $ | 87,517,393 | 7,471,098 | $ | 107,806,250 | |||||||||||||
| Shares issued to shareholders in reinvestment of distributions | 656,519 | 6,901,870 | 5,018,252 | 70,729,411 | |||||||||||||||
| Shares repurchased | (13,623,143 | ) | (123,528,968 | ) | (13,542,835 | ) | (194,165,178 | ) | |||||||||||
| Net increase (decrease) | (2,236,762 | ) | $ | (29,109,705 | ) | (1,053,485 | ) | $ | (15,629,517 | ) | |||||||||
| Year Ended February 28, 2009 | Year Ended February 29, 2008 | ||||||||||||||||||
| Class VI: | Shares | Amount | Shares | Amount | |||||||||||||||
| Shares sold | 39,043,308 | $ | 402,535,356 | 51,884,829 | $ | 705,180,355 | |||||||||||||
| Shares issued to shareholders in reinvestment of distributions | 2,776,239 | 29,721,224 | 23,622,907 | 334,820,373 | |||||||||||||||
| Shares repurchased | (98,313,498 | ) | (982,987,953 | ) | (155,480,537 | ) | (2,272,939,240 | ) | |||||||||||
| Net increase (decrease) | (56,493,951 | ) | $ | (550,731,373 | ) | (79,972,801 | ) | $ | (1,232,938,512 | ) | |||||||||
30
GMO U.S. Core Equity Fund
(A Series of GMO Trust)
Notes to Financial Statements — (Continued)
February 28, 2009
| Year Ended February 28, 2009 | Year Ended February 29, 2008 | ||||||||||||||||||
| Class M: | Shares | Amount | Shares | Amount | |||||||||||||||
| Shares sold | 10,515 | $ | 128,124 | 124,923 | $ | 1,799,606 | |||||||||||||
| Shares issued to shareholders in reinvestment of distributions | 36,243 | 406,197 | 874,683 | 12,446,178 | |||||||||||||||
| Shares repurchased | (4,504,666 | ) | (45,185,445 | ) | (5,233,840 | ) | (74,518,027 | ) | |||||||||||
| Net increase (decrease) | (4,457,908 | ) | $ | (44,651,124 | ) | (4,234,234 | ) | $ | (60,272,243 | ) | |||||||||
31
Report of Independent Registered Public Accounting Firm
To the Trustees of GMO Trust and the Shareholders of
GMO U.S. Core Equity Fund:
In our opinion, the accompanying statement of assets and liabilities, including the schedule of investments, and the related statements of operations and of changes in net assets and the financial highlights present fairly, in all material respects, the financial position of GMO U.S. Core Equity Fund (the "Fund") at February 28, 2009, the results of its operations for the year then ended, the changes in its net assets for each of the two years in the period then ended and the financial highlights for each of the five years in the period then ended, in conformity with accounting principles generally accepted in the United States of America. These financial statements and financial highlights (hereafter referred to as "financial statements") are the responsibility of the Fund's management. Our responsibility is to express an opinion on these financial statements based on our audits. We conducted our audits of these financial state ments in accordance with the standards of the Public Company Accounting Oversight Board (United States). Those standards require that we plan and perform the audit to obtain reasonable assurance about whether the financial statements are free of material misstatement. An audit includes examining, on a test basis, evidence supporting the amounts and disclosures in the financial statements, assessing the accounting principles used and significant estimates made by management, and evaluating the overall financial statement presentation. We believe that our audits, which included confirmation of securities at February 28, 2009 by correspondence with the custodian and brokers, provide a reasonable basis for our opinion.
PricewaterhouseCoopers LLP
Boston, Massachusetts
April 29, 2009
32
GMO U.S. Core Equity Fund
(A Series of GMO Trust)
Fund Expenses
February 28, 2009 (Unaudited)
Expense Examples: The following information is in relation to expenses for the six month period ended February 28, 2009.
As a shareholder of the Fund, you may incur two types of costs: (1) transaction costs, and (2) ongoing costs, including management fees, shareholder service fees, distribution (12b-1) and/or administration fees, and other Fund expenses. This example is intended to help you understand your ongoing costs (in dollars) of investing in the Fund and to compare these costs with the ongoing costs of investing in other mutual funds.
These examples are based on an investment of $1,000 invested at the beginning of the period and held for the entire period, September 1, 2008 through February 28, 2009.
Actual Expenses
The first line of the table for each class below provides information about actual account values and actual expenses. You may use the information in this line, together with the amount you invested, to estimate the expenses that you paid over the period. Simply divide your account value by $1,000 (for example, a $10,000,000 account value divided by $1,000 = 10,000), then multiply the result by the number in the first line under the heading entitled "Net Expense Incurred" to estimate the expenses you paid on your account during this period.
Hypothetical Example for Comparison Purposes
The second line of the table for each class below provides information about hypothetical account values and hypothetical expenses based on the Fund's actual expense ratio and an assumed rate of return of 5% per year before expenses, which is not the Fund's actual return. The hypothetical account values and expenses may not be used to estimate the actual ending account balance or expenses you paid for the period. You may use this information to compare the ongoing costs of investing in the Fund with other funds. To do so, compare this 5% hypothetical example with the 5% hypothetical examples that appear in the shareholder reports of other funds.
33
GMO U.S. Core Equity Fund
(A Series of GMO Trust)
Fund Expenses — (Continued)
February 28, 2009 (Unaudited)
Please note that the expenses shown in the table are meant to highlight your ongoing costs only and do not reflect any transactional costs, such as purchase premiums and redemption fees. Therefore, the second line of the table is useful in comparing ongoing costs only, and will not help you determine the relative total costs of owning different funds. In addition, if these transactional costs were included, your costs would have been higher.
| Annualized Net Expense Ratio | Beginning Account Value | Ending Account Value | Net Expense Incurred* | ||||||||||||||||
| Class III | |||||||||||||||||||
| 1) Actual | 0.46 | % | $ | 1,000.00 | $ | 654.60 | $ | 1.89 | |||||||||||
| 2) Hypothetical | 0.46 | % | $ | 1,000.00 | $ | 1,022.51 | $ | 2.31 | |||||||||||
| Class IV | |||||||||||||||||||
| 1) Actual | 0.41 | % | $ | 1,000.00 | $ | 654.70 | $ | 1.68 | |||||||||||
| 2) Hypothetical | 0.41 | % | $ | 1,000.00 | $ | 1,022.76 | $ | 2.06 | |||||||||||
| Class VI | |||||||||||||||||||
| 1) Actual | 0.37 | % | $ | 1,000.00 | $ | 654.90 | $ | 1.52 | |||||||||||
| 2) Hypothetical | 0.37 | % | $ | 1,000.00 | $ | 1,022.96 | $ | 1.86 | |||||||||||
| Class M | |||||||||||||||||||
| 1) Actual | 0.76 | % | $ | 1,000.00 | $ | 653.60 | $ | 3.12 | |||||||||||
| 2) Hypothetical | 0.76 | % | $ | 1,000.00 | $ | 1,021.03 | $ | 3.81 | |||||||||||
* Expenses are calculated using each Class's annualized net expense ratio for the six months ended February 28, 2009, multiplied by the average account value over the period, multiplied by 181 days in the period, divided by 365 days in the year.
34
GMO U.S. Core Equity Fund
(A Series of GMO Trust)
Tax Information for the Tax Year Ended February 28, 2009 (Unaudited)
The Fund will notify shareholders of amounts for use in preparing 2009 income tax forms in January 2010.
For taxable, non-corporate shareholders, 100.00% of the income and short-term capital gains, if any, distributed in the Fund's fiscal year ended February 28, 2009 represents qualified dividend income subject to the 15% rate category.
For corporate shareholders, 100.00% of the income and short-term capital gains, if any, distributed in the Fund's fiscal year ended February 28, 2009 qualified for the dividends-received deduction.
35
Trustees and Officers (Unaudited)
The following tables list the Trust's Trustees and Officers as of the date of this report; their address and date of birth ("DOB"); their position with the Trust; the length of time holding that position with the Trust; their principal occupation(s) during the past five years; the number of portfolios in the fund complex they oversee; and other directorships they hold in companies subject to registration or reporting requirements of the Securities Exchange Act of 1934 (generally called "public companies") or in registered investment companies. The Trust's Statement of Additional Information ("SAI") includes additional information about the Trust's trustees, including changes subsequent to the date of the report. The SAI is available, without charge, upon request by writing GMO, c/o GMO Trust, 40 Rowes Wharf, Boston, MA 02110.
Independent Trustees:
| Name, Address, and DOB | Position(s) Held with Trust | Term of Office1 and Length of Time Served | Principal Occupation(s) During Past Five Years | Number of Portfolios in Fund Complex Overseen by Trustee | Other Directorships Held by Trustee | ||||||||||||||||||
| Donald W. Glazer, Esq. c/o GMO Trust 40 Rowes Wharf Boston, MA 02110 DOB: 07/26/1944 | Chairman of the Board of Trustees | Chairman of the Board of Trustees since March 2005; Lead Independent Trustee (September 2004 – March 2005); Trustee since December 2000. | Consultant – Law and Business2; Author of Legal Treatises. | 59 | None. | ||||||||||||||||||
1 Each Trustee is elected to serve during the continued lifetime of the Trust until he/she dies, resigns or is removed, or if sooner, until the next meeting of Shareholders called for the purpose of electing Trustees and until the election and qualification of his/her successor.
2 As part of Mr. Glazer's work as a consultant, he provides part-time consulting services to Goodwin Procter LLP ("Goodwin"). Goodwin has provided legal services to Renewable Resources, LLC, an affiliate of GMO; GMO, in connection with its relationship with Renewable Resources; and funds managed by Renewable Resources. Mr. Glazer has represented that he has no financial interest in, and is not involved in the provision of, such legal services. In the calendar years ended December 31, 2007 and December 31, 2008, these entities paid $789,416 and $183,864 respectively, in legal fees and disbursements to Goodwin. In correspondence with the Staff of the Securities and Exchange Commission beginning in August 2006, the Independent Trustees' legal counsel provided the Staff with information regarding Mr. Glazer's relationship with Goodwin and h is other business activities. On September 11, 2007, based on information that had been given to the Staff as of that date, the Staff provided oral no-action assurance consistent with the opinion of the Independent Trustees' legal counsel that Mr. Glazer is not an "interested person" of the Trust.
36
Independent Trustees — (Continued)
| Name, Address, and DOB | Position(s) Held with Trust | Term of Office1 and Length of Time Served | Principal Occupation(s) During Past Five Years | Number of Portfolios in Fund Complex Overseen by Trustee | Other Directorships Held by Trustee | ||||||||||||||||||
| W. Nicholas Thorndike c/o GMO Trust 40 Rowes Wharf Boston, MA 02110 DOB: 03/28/1933 | Trustee | Since March 2005. | Director or trustee of various corporations and charitable organizations, including Courier Corporation (a book publisher and manufacturer) (July 1989 – present); Putnam Funds (December 1992 – June 2004); and Providence Journal (a newspaper publisher) (December 1986 – December 2003). | 59 | Director of Courier Corporation (a book publisher and manufacturer); Member of the Investment Committee of Partners HealthCare System, Inc.3 | ||||||||||||||||||
| Peter Tufano c/o GMO Trust 40 Rowes Wharf Boston, MA 02110 DOB: 04/22/1957 | Trustee | Since December 2008. | Sylvan C. Coleman Professor of Financial Management, Harvard Business School (since 1989). | 59 | Trustee of State Street Navigator Securities Lending Trust (3 Portfolios). | ||||||||||||||||||
1 Each Trustee is elected to serve during the continued lifetime of the Trust until he/she dies, resigns or is removed, or if sooner, until the next meeting of Shareholders called for the purpose of electing Trustees and until the election and qualification of his/her successor.
3 Partners HealthCare System, Inc. is a client of the Manager.
37
Principal Officers:
| Name, Address, and DOB | Position(s) Held with Trust | Term of Office4 and Length of Time Served | Principal Occupation(s) During Past Five Years5 | ||||||||||||
| J.B. Kittredge DOB: 08/22/1954 | President and Chief Executive Officer | Since March 2009. | General Counsel, Grantham, Mayo, Van Otterloo & Co. LLC (October 2005 – Present); Partner, Ropes & Gray LLP. | ||||||||||||
| Sheppard N. Burnett c/o GMO Trust 40 Rowes Wharf Boston, MA 02110 DOB: 10/24/1968 | Treasurer and Chief Financial Officer | Chief Financial Officer since March 2007; Treasurer since November 2006; Assistant Treasurer, September 2004 – November 2006. | Fund Administration Staff, Grantham, Mayo, Van Otterloo & Co. LLC (June 2004 – present); Vice President, Director of Tax, Columbia Management Group (2002 – 2004). | ||||||||||||
| Brent C. Arvidson c/o GMO Trust 40 Rowes Wharf Boston, MA 02110 DOB: 06/26/1969 | Assistant Treasurer | Since August 1998. | Senior Fund Administrator, Grantham, Mayo, Van Otterloo & Co. LLC. | ||||||||||||
| John L. Nasrah c/o GMO Trust 40 Rowes Wharf Boston, MA 02110 DOB: 05/27/1977 | Assistant Treasurer | Since March 2007. | Fund Administrator, Grantham, Mayo, Van Otterloo & Co. LLC (September 2004 – present); Tax Analyst, Bain & Company, Inc. (June 2003 – September 2004). | ||||||||||||
| Mahmoodur Rahman c/o GMO Trust 40 Rowes Wharf Boston, MA 02110 DOB: 11/30/1967 | Assistant Treasurer | Since September 2007. | Fund Administrator, Grantham, Mayo, Van Otterloo & Co. LLC (April 2007 – present); Vice President and Senior Tax Manager, Massachusetts Financial Services Company (January 2000 – April 2007). | ||||||||||||
| Michael E. Gillespie c/o GMO Trust 40 Rowes Wharf Boston, MA 02110 DOB: 02/18/1958 | Chief Compliance Officer | Since March 2005. | Vice President of Compliance (June 2004 – February 2005) and Director of Domestic Compliance (March 2002 – June 2004), Fidelity Investments. | ||||||||||||
4 Each officer is elected to hold such office until his or her successor is duly elected and qualified to carry out the duties and responsibilities of the office, or until he or she resigns or is removed from office.
5 Each of Messrs. Burnett, Arvidson, Bohan, and Pottle serves as an officer and/or director of certain pooled investment vehicles of which GMO or an affiliate of GMO serves as the investment adviser.
38
Principal Officers — (Continued)
| Name, Address, and DOB | Position(s) Held with Trust | Term of Office4 and Length of Time Served | Principal Occupation(s) During Past Five Years5 | ||||||||||||
| Jason B. Harrison c/o GMO Trust 40 Rowes Wharf Boston, MA 02110 DOB: 01/29/1977 | Vice President and Clerk | Vice President since November 2006; Clerk since March 2006. | Legal Counsel, Grantham, Mayo, Van Otterloo & Co. LLC (since February 2006) and Attorney, Ropes & Gray LLP (September 2002 – February 2006). | ||||||||||||
| David L. Bohan c/o GMO Trust 40 Rowes Wharf Boston, MA 02110 DOB: 06/21/1964 | Vice President and Assistant Clerk | Vice President since March 2005; Assistant Clerk since March 2006. | Legal Counsel, Grantham, Mayo, Van Otterloo & Co. LLC. | ||||||||||||
| Gregory L. Pottle c/o GMO Trust 40 Rowes Wharf Boston, MA 02110 DOB: 07/09/1971 | Vice President and Assistant Clerk | Since November 2006. | Legal Counsel, Grantham, Mayo, Van Otterloo & Co. LLC. | ||||||||||||
| Anne K. Trinque c/o GMO Trust 40 Rowes Wharf Boston, MA 02110 DOB: 04/15/1978 | Vice President and Assistant Clerk | Since September 2007. | Legal Counsel, Grantham, Mayo, Van Otterloo & Co. LLC (January 2007 – present); Attorney, Goodwin Procter LLP (September 2003 – January 2007). | ||||||||||||
| Cheryl Wakeham c/o GMO Trust 40 Rowes Wharf Boston, MA 02110 DOB: 10/29/1958 | Vice President and Anti-Money Laundering Officer | Since December 2004. | Manager, Client Service Administration, Grantham, Mayo, Van Otterloo & Co. LLC. | ||||||||||||
4 Each officer is elected to hold such office until his or her successor is duly elected and qualified to carry out the duties and responsibilities of the office, or until he or she resigns or is removed from office.
5 Each of Messrs. Burnett, Arvidson, Bohan, and Pottle serves as an officer and/or director of certain pooled investment vehicles of which GMO or an affiliate of GMO serves as the investment adviser.
39
GMO U.S. Small/Mid Cap Value Fund
(A Series of GMO Trust)
Annual Report
February 28, 2009
For a free copy of the Fund's proxy voting guidelines, shareholders may call 1-617-346-7646 (collect) or visit the Securities and Exchange Commission's website at www.sec.gov. Information regarding how the Fund voted proxies relating to portfolio securities during the most recent 12-month period ended June 30 is available on GMO's website at www.gmo.com, or on the Securities and Exchange Commission's website at www.sec.gov.
The Fund files its complete schedule of portfolio holdings with the Securities and Exchange Commission for the first and third quarter of each fiscal year on Form N-Q, which is available on the Commission's website at www.sec.gov. The Fund's Form N-Q may be reviewed and copied at the Commission's Public Reference Room in Washington, D.C. Information on the operation of the Public Reference Room may be obtained by calling 1-800-SEC-0330. The Fund has a policy with respect to disclosure of portfolio holdings under which it may also make available on GMO's website at www.gmo.com a complete schedule of portfolio holdings.
This report is prepared for the general information of shareholders. It is authorized for distribution to prospective investors only when preceded or accompanied by a prospectus for the GMO Trust, which contains a complete discussion of the risks associated with an investment in this Fund and other important information. The GMO Trust prospectus can be obtained at www.gmo.com.
GMO U.S. Small/Mid Cap Value Fund
(A Series of GMO Trust)
Portfolio Management
Day-to-day management of the Fund's portfolio is the responsibility of the Quantitative Equity team at Grantham, Mayo, Van Otterloo & Co. LLC.
Management Discussion and Analysis of Fund Performance
The GMO U.S. Small/Mid Cap Value Fund returned -38.8% for the fiscal year ended February 28, 2009, as compared to -43.7% for the Russell 2500 Value Index. Consistent with the Fund's investment objectives and policies, the Fund was invested primarily in U.S. equity securities throughout the period.
Stock selection added to returns relative to the Russell 2500 Value Index. Stock selections within Financials, Consumer Discretionary, and Materials added to relative returns while stock selections within Utilities, Health Care, and Energy detracted. In terms of individual names, overweight positions in Philadelphia Consolidated, Advance Auto Parts, and Dollar Tree added to relative returns. Overweight positions in Patterson-UTI Energy and Cimarex Energy and an underweight in People's United Financial detracted.
Sector selection detracted from returns relative to the Russell 2500 Value Index. Sector weightings positively impacting relative performance included an overweight position in Health Care and an underweight in Materials. Sector weightings negatively impacting relative performance included an underweight in Utilities and overweight positions in Energy and Consumer Discretionary.
The views expressed herein are exclusively those of Grantham, Mayo, Van Otterloo & Co. LLC Management as of the date of this report and are subject to change. GMO disclaims any responsibility to update such views. They are not meant as investment advice. References to specific securities are not recommendations of such securities and may not be representative of any GMO portfolio's current or future investments.
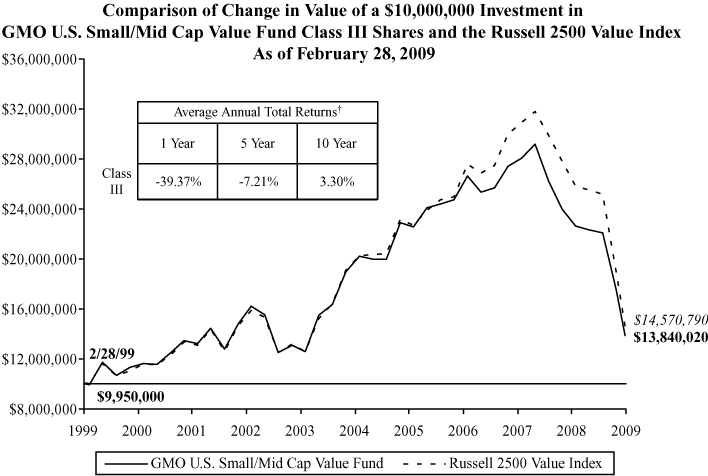
Performance data quoted represents past performance and is not indicative of future results. The investment return and principal value of an investment will fluctuate so that an investor's shares, when redeemed, may be worth more or less than their original cost. Current performance data may be lower or higher than the performance data provided herein. To obtain performance information to the most recent month-end, visit www.gmo.com. Performance shown is net of all fees after reimbursement from the Manager. Each performance figure assumes a purchase at the beginning and redemption at the end of the stated period and reflects a transaction fee of .50% on the purchase and .50% on the redemption. Transaction fees are retained by the Fund to cover trading costs. Returns would have been lower had certain expenses not been reimbursed during the periods shown and do not include the effect of taxes on distributions and redemptions. All information is unaudited.
† The Fund is the successor to the GMO Small/Mid Cap Value Fund, therefore, performance for the periods prior to September 16, 2005 is that of GMO Small/Mid Cap Value Fund.
GMO U.S. Small/Mid Cap Value Fund
(A Series of GMO Trust)
Investments Concentration Summary
February 28, 2009 (Unaudited)
| Asset Class Summary | % of Total Net Assets | ||||||
| Common Stocks | 96.5 | % | |||||
| Short-Term Investments | 3.6 | ||||||
| Futures | (0.4 | ) | |||||
| Other | 0.3 | ||||||
| 100.0 | % | ||||||
| Industry Sector Summary | % of Equity Investments | ||||||
| Financials | 30.7 | % | |||||
| Consumer Discretionary | 19.9 | ||||||
| Health Care | 11.4 | ||||||
| Information Technology | 11.2 | ||||||
| Industrials | 8.8 | ||||||
| Consumer Staples | 5.1 | ||||||
| Energy | 4.7 | ||||||
| Materials | 4.2 | ||||||
| Utilities | 3.2 | ||||||
| Telecommunication Services | 0.8 | ||||||
| 100.0 | % | ||||||
1
GMO U.S. Small/Mid Cap Value Fund
(A Series of GMO Trust)
Schedule of Investments
(showing percentage of total net assets)
February 28, 2009
| Shares | Description | Value ($) | |||||||||||||
| COMMON STOCKS — 96.5% | |||||||||||||||
| Consumer Discretionary — 19.2% | |||||||||||||||
| 700 | 99 Cents Only Stores * | 5,768 | |||||||||||||
| 1,200 | Aaron Rents, Inc. | 28,836 | |||||||||||||
| 1,500 | Abercrombie & Fitch Co.-Class A | 32,985 | |||||||||||||
| 3,100 | Advance Auto Parts, Inc. | 118,575 | |||||||||||||
| 2,000 | Aeropostale, Inc. * | 46,380 | |||||||||||||
| 3,400 | America's Car-Mart, Inc. * | 37,332 | |||||||||||||
| 7,800 | American Eagle Outfitters, Inc. | 76,128 | |||||||||||||
| 600 | Asbury Automotive Group, Inc. | 1,710 | |||||||||||||
| 3,000 | Autoliv, Inc. | 44,640 | |||||||||||||
| 12,500 | AutoNation, Inc. * | 124,750 | |||||||||||||
| 400 | Barnes & Noble, Inc. | 7,176 | |||||||||||||
| 2,100 | Black & Decker Corp. | 49,707 | |||||||||||||
| 1,125 | Blyth, Inc. | 22,961 | |||||||||||||
| 3,500 | Brinker International, Inc. | 38,500 | |||||||||||||
| 2,700 | Career Education Corp. * | 66,609 | |||||||||||||
| 1,500 | Carter's, Inc. * | 24,465 | |||||||||||||
| 1,050 | CEC Entertainment, Inc. * | 24,517 | |||||||||||||
| 300 | Childrens Place Retail Stores (The), Inc. * | 5,484 | |||||||||||||
| 1,700 | Columbia Sportswear Co. | 46,104 | |||||||||||||
| 1,800 | Core-Mark Holding Co., Inc. * | 30,798 | |||||||||||||
| 1,300 | Cracker Barrel Old Country Store, Inc. | 29,094 | |||||||||||||
| 200 | Darden Restaurants, Inc. | 5,428 | |||||||||||||
| 1,500 | Dollar Tree, Inc. * | 58,230 | |||||||||||||
| 2,700 | Dress Barn, Inc. * | 26,784 | |||||||||||||
| 2,900 | Ethan Allen Interiors, Inc. | 27,666 | |||||||||||||
| 6,600 | Family Dollar Stores, Inc. | 181,104 | |||||||||||||
| 9,700 | Foot Locker, Inc. | 80,607 | |||||||||||||
| 1,700 | Fred's, Inc.-Class A | 15,657 | |||||||||||||
| 8,100 | Gannett Co., Inc. | 26,244 | |||||||||||||
| 1,300 | Genesco, Inc. * | 18,590 | |||||||||||||
| 2,500 | Group 1 Automotive, Inc. | 26,750 | |||||||||||||
| 1,600 | Harman International Industries, Inc. | 16,992 | |||||||||||||
See accompanying notes to the financial statements.
2
GMO U.S. Small/Mid Cap Value Fund
(A Series of GMO Trust)
Schedule of Investments — (Continued)
(showing percentage of total net assets)
February 28, 2009
| Shares | Description | Value ($) | |||||||||||||
| Consumer Discretionary — continued | |||||||||||||||
| 3,300 | Harte-Hanks, Inc. | 18,513 | |||||||||||||
| 2,000 | Hasbro, Inc. | 45,780 | |||||||||||||
| 1,200 | Helen of Troy Ltd. * | 12,048 | |||||||||||||
| 700 | ITT Educational Services, Inc. * | 79,450 | |||||||||||||
| 500 | Jakks Pacific, Inc. * | 6,335 | |||||||||||||
| 500 | Jo-Ann Stores, Inc. * | 6,020 | |||||||||||||
| 9,000 | Jones Apparel Group, Inc. | 24,210 | |||||||||||||
| 1,000 | Jos. A. Bank Clothiers, Inc. * | 22,600 | |||||||||||||
| 5,500 | Leggett & Platt, Inc. | 62,865 | |||||||||||||
| 600 | Marvel Entertainment, Inc. * | 15,516 | |||||||||||||
| 124 | MDC Holdings, Inc. | 3,129 | |||||||||||||
| 2,500 | Men's Wearhouse (The), Inc. | 26,700 | |||||||||||||
| 1,800 | Meredith Corp. | 23,130 | |||||||||||||
| 1,100 | Mohawk Industries, Inc. * | 24,849 | |||||||||||||
| 200 | Monro Muffler, Inc. | 4,706 | |||||||||||||
| 400 | National Presto Industries, Inc. | 24,204 | |||||||||||||
| 151 | NVR, Inc. * | 50,248 | |||||||||||||
| 1,700 | O'Reilly Automotive, Inc. * | 56,712 | |||||||||||||
| 2,700 | Oxford Industries, Inc. | 12,609 | |||||||||||||
| 10,100 | Penske Auto Group, Inc. | 57,166 | |||||||||||||
| 1,300 | PetMed Express, Inc. * | 17,914 | |||||||||||||
| 700 | PetSmart, Inc. | 14,028 | |||||||||||||
| 700 | Polaris Industries, Inc. | 12,887 | |||||||||||||
| 3,100 | Pomeroy IT Solutions, Inc. * | 11,160 | |||||||||||||
| 500 | Pre-Paid Legal Services, Inc. * | 15,955 | |||||||||||||
| 6,500 | RadioShack Corp. | 47,645 | |||||||||||||
| 1,200 | RC2 Corp. * | 5,628 | |||||||||||||
| 3,300 | Regis Corp. | 41,580 | |||||||||||||
| 6,300 | Rent-A-Center, Inc. * | 110,376 | |||||||||||||
| 1,600 | Ross Stores, Inc. | 47,232 | |||||||||||||
| 1,000 | Snap-On, Inc. | 23,590 | |||||||||||||
| 2,000 | Stanley Works (The) | 53,520 | |||||||||||||
| 1,300 | Steven Madden, Ltd. * | 21,086 | |||||||||||||
| 110 | Strayer Education, Inc. | 18,673 | |||||||||||||
See accompanying notes to the financial statements.
3
GMO U.S. Small/Mid Cap Value Fund
(A Series of GMO Trust)
Schedule of Investments — (Continued)
(showing percentage of total net assets)
February 28, 2009
| Shares | Description | Value ($) | |||||||||||||
| Consumer Discretionary — continued | |||||||||||||||
| 2,400 | Thor Industries, Inc. | 25,704 | |||||||||||||
| 2,700 | Timberland Co.-Class A * | 30,375 | |||||||||||||
| 1,200 | Toll Brothers, Inc. * | 19,020 | |||||||||||||
| 700 | Tractor Supply Co. * | 21,868 | |||||||||||||
| 300 | Universal Technical Institute, Inc. * | 3,309 | |||||||||||||
| 1,300 | Urban Outfitters, Inc. * | 21,632 | |||||||||||||
| 400 | Weight Watchers International, Inc. | 7,240 | |||||||||||||
| 3,000 | Williams-Sonoma, Inc. | 26,190 | |||||||||||||
| Total Consumer Discretionary | 2,519,973 | ||||||||||||||
| Consumer Staples — 4.9% | |||||||||||||||
| 3,300 | BJ's Wholesale Club, Inc. * | 98,604 | |||||||||||||
| 1,300 | Casey's General Stores, Inc. | 25,883 | |||||||||||||
| 100 | Chattem, Inc. * | 6,343 | |||||||||||||
| 200 | Chiquita Brands International, Inc. * | 984 | |||||||||||||
| 2,300 | Dean Foods Co. * | 47,035 | |||||||||||||
| 900 | Del Monte Foods Co. | 6,435 | |||||||||||||
| 100 | Energizer Holdings, Inc. * | 4,219 | |||||||||||||
| 800 | Flowers Foods, Inc. | 17,848 | |||||||||||||
| 200 | Fresh Del Monte Produce, Inc. * | 3,756 | |||||||||||||
| 2,200 | Ingles Markets, Inc.-Class A | 29,876 | |||||||||||||
| 300 | J&J Snack Foods Corp. | 9,471 | |||||||||||||
| 600 | JM Smucker Co. (The) | 22,272 | |||||||||||||
| 1,100 | McCormick & Co., Inc. (Non Voting) | 34,485 | |||||||||||||
| 1,400 | Nash Finch Co. | 48,776 | |||||||||||||
| 4,700 | NBTY, Inc. * | 69,889 | |||||||||||||
| 1,200 | Nu Skin Enterprises, Inc.-Class A | 11,280 | |||||||||||||
| 2,100 | Pantry, Inc. * | 32,466 | |||||||||||||
| 1,500 | Prestige Brands Holdings, Inc. * | 8,205 | |||||||||||||
| 300 | Ralcorp Holdings, Inc. * | 18,180 | |||||||||||||
| 400 | Spartan Stores, Inc. | 6,120 | |||||||||||||
| 1,700 | Supervalu, Inc. | 26,537 | |||||||||||||
| 300 | Tootsie Roll Industries, Inc. | 6,426 | |||||||||||||
| 8,200 | Tyson Foods, Inc.-Class A | 69,126 | |||||||||||||
See accompanying notes to the financial statements.
4
GMO U.S. Small/Mid Cap Value Fund
(A Series of GMO Trust)
Schedule of Investments — (Continued)
(showing percentage of total net assets)
February 28, 2009
| Shares | Description | Value ($) | |||||||||||||
| Consumer Staples — continued | |||||||||||||||
| 900 | United Natural Foods, Inc. * | 13,392 | |||||||||||||
| 400 | WD-40 Co. | 9,844 | |||||||||||||
| 1,500 | Winn-Dixie Stores, Inc. * | 14,505 | |||||||||||||
| Total Consumer Staples | 641,957 | ||||||||||||||
| Energy — 4.5% | |||||||||||||||
| 4,400 | Cimarex Energy Co. | 86,460 | |||||||||||||
| 600 | Encore Acquisition Co. * | 12,048 | |||||||||||||
| 1,700 | Helmerich & Payne, Inc. | 40,222 | |||||||||||||
| 1,000 | Holly Corp. | 23,310 | |||||||||||||
| 104 | Kinder Morgan Management, LLC. * | 4,339 | |||||||||||||
| 900 | Lufkin Industries, Inc. | 29,565 | |||||||||||||
| 1,900 | Oil States International, Inc. * | 25,308 | |||||||||||||
| 700 | Overseas Shipholding Group, Inc. | 18,004 | |||||||||||||
| 14,800 | Patterson-UTI Energy, Inc. | 127,132 | |||||||||||||
| 1,100 | Pioneer Drilling Co. * | 4,224 | |||||||||||||
| 900 | St. Mary Land & Exploration Co. | 12,222 | |||||||||||||
| 1,700 | Stone Energy Corp. * | 6,732 | |||||||||||||
| 1,300 | Swift Energy Co. * | 9,347 | |||||||||||||
| 700 | Tidewater, Inc. | 24,724 | |||||||||||||
| 4,000 | Unit Corp. * | 85,480 | |||||||||||||
| 800 | VAALCO Energy, Inc. * | 4,560 | |||||||||||||
| 2,100 | W&T Offshore, Inc. | 16,905 | |||||||||||||
| 2,200 | World Fuel Services Corp. | 63,822 | |||||||||||||
| Total Energy | 594,404 | ||||||||||||||
| Financials — 29.7% | |||||||||||||||
| 200 | Allied World Assurance Co. Holdings Ltd. | 7,682 | |||||||||||||
| 2,100 | American Equity Investment Life Holding Co. | 8,064 | |||||||||||||
| 6,150 | American Financial Group, Inc. | 95,694 | |||||||||||||
| 400 | American Physicians Capital, Inc. | 16,948 | |||||||||||||
| 300 | Amerisafe, Inc. * | 4,350 | |||||||||||||
| 1,600 | Annaly Capital Management, Inc. REIT | 22,240 | |||||||||||||
| 2,900 | Arch Capital Group Ltd. * | 156,600 | |||||||||||||
See accompanying notes to the financial statements.
5
GMO U.S. Small/Mid Cap Value Fund
(A Series of GMO Trust)
Schedule of Investments — (Continued)
(showing percentage of total net assets)
February 28, 2009
| Shares | Description | Value ($) | |||||||||||||
| Financials — continued | |||||||||||||||
| 800 | Arthur J. Gallagher & Co. | 12,696 | |||||||||||||
| 4,400 | Aspen Insurance Holdings Ltd. | 95,876 | |||||||||||||
| 7,600 | Associated Banc Corp. | 109,896 | |||||||||||||
| 800 | Assurant, Inc. | 16,320 | |||||||||||||
| 2,250 | Astoria Financial Corp. | 16,087 | |||||||||||||
| 9,300 | Axis Capital Holdings Ltd. | 208,134 | |||||||||||||
| 300 | Bancfirst Corp. | 10,467 | |||||||||||||
| 1,900 | Bancorpsouth, Inc. | 35,397 | |||||||||||||
| 1,400 | Bank of Hawaii Corp. | 44,856 | |||||||||||||
| 100 | Bank of the Ozarks, Inc. | 2,075 | |||||||||||||
| 800 | BOK Financial Corp. | 24,080 | |||||||||||||
| 2,900 | Brown & Brown, Inc. | 48,923 | |||||||||||||
| 200 | Capitol Federal Financial | 7,406 | |||||||||||||
| 2,400 | Cathay General Bancorp | 23,328 | |||||||||||||
| 800 | Center Financial Corp. | 2,360 | |||||||||||||
| 1,100 | Chemical Financial Corp. | 21,032 | |||||||||||||
| 500 | Cincinnati Financial Corp. | 10,270 | |||||||||||||
| 1,200 | City Holding Co. | 31,464 | |||||||||||||
| 1,800 | City National Corp. | 57,744 | |||||||||||||
| 2,300 | CNA Surety Corp. * | 33,465 | |||||||||||||
| 1,400 | Comerica, Inc. | 21,014 | |||||||||||||
| 2,230 | Commerce Bancshares, Inc. | 77,448 | |||||||||||||
| 1,900 | Community Bank System, Inc. | 32,509 | |||||||||||||
| 300 | Community Trust Bancorp | 7,773 | |||||||||||||
| 400 | Cullen/Frost Bankers, Inc. | 17,216 | |||||||||||||
| 1,200 | Delphi Financial Group, Inc.-Class A | 13,008 | |||||||||||||
| 2,000 | Dime Community Bancshares | 19,720 | |||||||||||||
| 1,500 | Encore Capital Group, Inc. * | 5,955 | |||||||||||||
| 4,100 | Endurance Specialty Holdings Ltd. | 91,717 | |||||||||||||
| 200 | Entertainment Properties Trust REIT | 2,982 | |||||||||||||
| 500 | Erie Indemnity Co.-Class A | 15,020 | |||||||||||||
| 600 | FBL Financial Group, Inc.-Class A | 1,818 | |||||||||||||
| 500 | Financial Federal Corp. | 9,500 | |||||||||||||
| 3,416 | First American Corp. | 79,149 | |||||||||||||
See accompanying notes to the financial statements.
6
GMO U.S. Small/Mid Cap Value Fund
(A Series of GMO Trust)
Schedule of Investments — (Continued)
(showing percentage of total net assets)
February 28, 2009
| Shares | Description | Value ($) | |||||||||||||
| Financials — continued | |||||||||||||||
| 300 | First Financial Bankshares, Inc. | 12,906 | |||||||||||||
| 100 | First Merchants Corp. | 1,005 | |||||||||||||
| 2,900 | First Niagara Financial Group, Inc. | 33,698 | |||||||||||||
| 3,000 | FirstMerit Corp. | 44,130 | |||||||||||||
| 1,800 | Flushing Financial Corp. | 11,052 | |||||||||||||
| 600 | FPIC Insurance Group, Inc. * | 22,260 | |||||||||||||
| 6,800 | Fulton Financial Corp. | 42,296 | |||||||||||||
| 1,200 | Hancock Holding Co. | 34,032 | |||||||||||||
| 1,000 | Hanover Insurance Group (The), Inc. | 35,170 | |||||||||||||
| 1,000 | Harleysville Group, Inc. | 29,760 | |||||||||||||
| 7,100 | HCC Insurance Holdings, Inc. | 155,845 | |||||||||||||
| 200 | Health Care REIT, Inc. | 6,154 | |||||||||||||
| 300 | Home Properties, Inc. REIT | 7,962 | |||||||||||||
| 3,400 | Horace Mann Educators Corp. | 26,146 | |||||||||||||
| 900 | Infinity Property & Casualty Corp. | 31,977 | |||||||||||||
| 1,400 | Inland Real Estate Corp. REIT | 10,920 | |||||||||||||
| 5,320 | International Bancshares Corp. | 53,253 | |||||||||||||
| 1,300 | IPC Holdings Ltd. | 33,033 | |||||||||||||
| 273 | Kansas City Life Insurance Co. | 6,495 | |||||||||||||
| 1,600 | Knight Capital Group, Inc.-Class A * | 28,144 | |||||||||||||
| 1,400 | Liberty Property Trust REIT | 25,578 | |||||||||||||
| 800 | LTC Properties, Inc. REIT | 13,648 | |||||||||||||
| 600 | Mack-Cali Realty Corp. REIT | 10,248 | |||||||||||||
| 100 | MainSource Financial Group, Inc. | 559 | |||||||||||||
| 100 | Markel Corp. * | 26,581 | |||||||||||||
| 1,900 | Max Capital Group Ltd. | 31,350 | |||||||||||||
| 1,600 | Mercury General Corp. | 43,136 | |||||||||||||
| 2,800 | Montpelier Re Holdings, Ltd. | 35,560 | |||||||||||||
| 1,900 | Nara Bancorp, Inc. | 5,073 | |||||||||||||
| 500 | Navigators Group, Inc. * | 26,115 | |||||||||||||
| 1,100 | NBT Bancorp, Inc. | 21,615 | |||||||||||||
| 200 | Northwest Bancorp, Inc. | 3,036 | |||||||||||||
| 600 | OceanFirst Financial Corp. | 5,688 | |||||||||||||
| 800 | Odyssey Re Holdings Corp. | 37,168 | |||||||||||||
See accompanying notes to the financial statements.
7
GMO U.S. Small/Mid Cap Value Fund
(A Series of GMO Trust)
Schedule of Investments — (Continued)
(showing percentage of total net assets)
February 28, 2009
| Shares | Description | Value ($) | |||||||||||||
| Financials — continued | |||||||||||||||
| 3,800 | Old National Bancorp | 44,346 | |||||||||||||
| 5,675 | Old Republic International Corp. | 51,529 | |||||||||||||
| 800 | Park National Corp. | 38,680 | |||||||||||||
| 2,800 | PartnerRe Ltd. | 173,320 | |||||||||||||
| 2,500 | Platinum Underwriters Holdings Ltd. | 70,100 | |||||||||||||
| 2,300 | Popular, Inc. | 5,175 | |||||||||||||
| 2,000 | Presidential Life Corp. | 13,200 | |||||||||||||
| 200 | ProAssurance Corp. * | 9,558 | |||||||||||||
| 4,300 | Protective Life Corp. | 16,254 | |||||||||||||
| 2,100 | Provident Financial Services, Inc. | 19,614 | |||||||||||||
| 300 | PS Business Parks, Inc. REIT | 10,320 | |||||||||||||
| 300 | Raymond James Financial, Inc. | 4,188 | |||||||||||||
| 3,200 | Reinsurance Group of America, Inc. | 87,040 | |||||||||||||
| 1,900 | RenaissanceRe Holdings Ltd. | 85,557 | |||||||||||||
| 1,500 | RLI Corp. | 73,470 | |||||||||||||
| 1,000 | S&T Bancorp | 22,690 | |||||||||||||
| 500 | S.Y. Bancorp, Inc. | 11,805 | |||||||||||||
| 2,200 | Safety Insurance Group, Inc. | 68,794 | |||||||||||||
| 2,800 | SEI Investments Co. | 33,152 | |||||||||||||
| 3,600 | Selective Insurance Group, Inc. | 43,308 | |||||||||||||
| 2,400 | StanCorp Financial Group, Inc. | 43,176 | |||||||||||||
| 1,200 | State Auto Financial Corp. | 20,064 | |||||||||||||
| 310 | Student Loan Corp. | 11,693 | |||||||||||||
| 200 | SVB Financial Group * | 3,270 | |||||||||||||
| 2,800 | TCF Financial Corp. | 34,328 | |||||||||||||
| 2,700 | Transatlantic Holdings, Inc. | 81,189 | |||||||||||||
| 3,200 | Trustmark Corp. | 56,928 | |||||||||||||
| 188 | UDR, Inc. REIT | 1,487 | |||||||||||||
| 500 | UMB Financial Corp. | 18,965 | |||||||||||||
| 1,100 | United Bankshares, Inc. | 16,940 | |||||||||||||
| 400 | United Fire & Casualty Co. | 6,784 | |||||||||||||
| 1,100 | Unitrin, Inc. | 11,858 | |||||||||||||
| 700 | Urstadt Biddle Properties, Inc. REIT | 8,477 | |||||||||||||
| 6,000 | W.R. Berkley Corp. | 124,860 | |||||||||||||
See accompanying notes to the financial statements.
8
GMO U.S. Small/Mid Cap Value Fund
(A Series of GMO Trust)
Schedule of Investments — (Continued)
(showing percentage of total net assets)
February 28, 2009
| Shares | Description | Value ($) | |||||||||||||
| Financials — continued | |||||||||||||||
| 700 | Westamerica Bancorporation | 27,909 | |||||||||||||
| 2,500 | Whitney Holding Corp. | 27,625 | |||||||||||||
| 2,800 | Wilmington Trust Corp. | 25,200 | |||||||||||||
| 900 | Wilshire Bancorp, Inc. | 4,284 | |||||||||||||
| 2,500 | Zenith National Insurance Corp. | 54,975 | |||||||||||||
| Total Financials | 3,891,988 | ||||||||||||||
| Health Care — 11.0% | |||||||||||||||
| 1,600 | AMERIGROUP Corp. * | 39,648 | |||||||||||||
| 400 | Catalyst Health Solutions, Inc. * | 8,432 | |||||||||||||
| 3,100 | Centene Corp. * | 52,638 | |||||||||||||
| 800 | Conmed Corp. * | 10,872 | |||||||||||||
| 500 | Cooper Cos (The), Inc. | 10,995 | |||||||||||||
| 800 | Covance, Inc. * | 30,384 | |||||||||||||
| 2,200 | Coventry Health Care, Inc. * | 25,344 | |||||||||||||
| 5,200 | Endo Pharmaceuticals Holdings, Inc. * | 98,696 | |||||||||||||
| 700 | Hanger Orthopedic Group, Inc. * | 9,310 | |||||||||||||
| 4,900 | Health Net, Inc. * | 64,680 | |||||||||||||
| 200 | Henry Schein, Inc. * | 7,336 | |||||||||||||
| 900 | Hill-Rom Holdings, Inc. | 8,838 | |||||||||||||
| 600 | Idexx Laboratories, Inc. * | 18,060 | |||||||||||||
| 400 | Immucor, Inc. * | 8,976 | |||||||||||||
| 2,500 | IMS Health, Inc. | 31,300 | |||||||||||||
| 1,600 | Invacare Corp. | 25,664 | |||||||||||||
| 2,800 | Kindred Healthcare, Inc. * | 40,292 | |||||||||||||
| 27,000 | King Pharmaceuticals, Inc. * | 198,180 | |||||||||||||
| 300 | Landauer, Inc. | 15,003 | |||||||||||||
| 4,400 | LifePoint Hospitals, Inc. * | 92,488 | |||||||||||||
| 1,700 | Lincare Holdings, Inc. * | 35,819 | |||||||||||||
| 400 | Mednax, Inc. * | 11,840 | |||||||||||||
| 2,100 | Molina Healthcare, Inc. * | 39,333 | |||||||||||||
| 4,300 | Mylan, Inc. * | 53,449 | |||||||||||||
| 2,200 | Odyssey HealthCare, Inc. * | 22,792 | |||||||||||||
| 7,300 | Omnicare, Inc. | 189,289 | |||||||||||||
See accompanying notes to the financial statements.
9
GMO U.S. Small/Mid Cap Value Fund
(A Series of GMO Trust)
Schedule of Investments — (Continued)
(showing percentage of total net assets)
February 28, 2009
| Shares | Description | Value ($) | |||||||||||||
| Health Care — continued | |||||||||||||||
| 1,300 | Owens & Minor, Inc. | 43,823 | |||||||||||||
| 2,400 | Patterson Cos., Inc. * | 43,368 | |||||||||||||
| 200 | Res-Care, Inc. * | 2,446 | |||||||||||||
| 400 | ResMed, Inc. * | 14,752 | |||||||||||||
| 600 | Techne Corp. | 29,310 | |||||||||||||
| 400 | Teleflex, Inc. | 19,000 | |||||||||||||
| 4,500 | Tenet Healthcare Corp. * | 4,995 | |||||||||||||
| 1,400 | Universal Health Services, Inc.-Class B | 51,562 | |||||||||||||
| 1,300 | Valeant Pharmaceuticals International * | 22,620 | |||||||||||||
| 1,200 | VCA Antech, Inc. * | 24,948 | |||||||||||||
| 800 | Viropharma, Inc. * | 3,320 | |||||||||||||
| 900 | Waters Corp. * | 31,698 | |||||||||||||
| 800 | WellCare Health Plans, Inc. * | 7,224 | |||||||||||||
| Total Health Care | 1,448,724 | ||||||||||||||
| Industrials — 8.5% | |||||||||||||||
| 300 | A.O. Smith Corp. | 7,659 | |||||||||||||
| 1,000 | ABM Industries, Inc. | 12,230 | |||||||||||||
| 200 | Alliant Techsystems, Inc. * | 14,132 | |||||||||||||
| 500 | Argon ST, Inc. * | 8,505 | |||||||||||||
| 1,200 | Arkansas Best Corp. | 20,904 | |||||||||||||
| 100 | Brady Corp.-Class A | 1,713 | |||||||||||||
| 600 | Carlisle Cos., Inc. | 11,892 | |||||||||||||
| 2,500 | Ceradyne, Inc. * | 42,900 | |||||||||||||
| 2,800 | Cintas Corp. | 56,812 | |||||||||||||
| 700 | Con-way, Inc. | 10,577 | |||||||||||||
| 2,500 | Copart, Inc. * | 67,550 | |||||||||||||
| 300 | Crane Co. | 4,524 | |||||||||||||
| 2,700 | Deluxe Corp. | 20,844 | |||||||||||||
| 1,500 | EMCOR Group, Inc. * | 23,115 | |||||||||||||
| 800 | Encore Wire Corp. | 14,400 | |||||||||||||
| 2,000 | Ennis, Inc. | 16,360 | |||||||||||||
| 1,500 | EnPro Industries, Inc. * | 24,675 | |||||||||||||
| 2,900 | Gardner Denver, Inc. * | 54,868 | |||||||||||||
See accompanying notes to the financial statements.
10
GMO U.S. Small/Mid Cap Value Fund
(A Series of GMO Trust)
Schedule of Investments — (Continued)
(showing percentage of total net assets)
February 28, 2009
| Shares | Description | Value ($) | |||||||||||||
| Industrials — continued | |||||||||||||||
| 900 | GATX Corp. | 16,443 | |||||||||||||
| 200 | Genesee & Wyoming, Inc.-Class A * | 4,178 | |||||||||||||
| 900 | Granite Construction, Inc. | 32,022 | |||||||||||||
| 600 | Griffon Corp. * | 4,362 | |||||||||||||
| 2,800 | HNI Corp. | 27,468 | |||||||||||||
| 800 | HUB Group Inc.-Class A * | 14,368 | |||||||||||||
| 400 | Insituform Technologies, Inc.-Class A * | 4,872 | |||||||||||||
| 1,000 | Insteel Industries, Inc. | 6,300 | |||||||||||||
| 4,600 | Kelly Services, Inc.-Class A | 34,960 | |||||||||||||
| 4,000 | Manpower, Inc. | 111,520 | |||||||||||||
| 300 | Marten Transport Ltd. * | 4,968 | |||||||||||||
| 1,500 | MPS Group, Inc. * | 7,455 | |||||||||||||
| 800 | MSC Industrial Direct Co., Inc.-Class A | 24,472 | |||||||||||||
| 2,000 | Mueller Industries, Inc. | 36,140 | |||||||||||||
| 1,200 | NCI Building Systems, Inc. * | 6,072 | |||||||||||||
| 2,600 | Pacer International, Inc. | 7,618 | |||||||||||||
| 1,400 | R.R. Donnelley & Sons Co. | 10,906 | |||||||||||||
| 1,700 | Ryder System, Inc. | 38,862 | |||||||||||||
| 40 | Seaboard Corp. | 35,200 | |||||||||||||
| 700 | Simpson Manufacturing Co., Inc. | 10,892 | |||||||||||||
| 3,500 | Skywest, Inc. | 35,840 | |||||||||||||
| 1,200 | Standex International Corp. | 12,996 | |||||||||||||
| 500 | Terex Corp. * | 4,460 | |||||||||||||
| 1,400 | Tredegar Corp. | 23,380 | |||||||||||||
| 2,700 | TrueBlue, Inc. * | 18,981 | |||||||||||||
| 1,900 | United Rentals, Inc. * | 7,695 | |||||||||||||
| 1,300 | United Stationers, Inc. * | 28,249 | |||||||||||||
| 600 | Universal Forest Products, Inc. | 13,074 | |||||||||||||
| 2,000 | Volt Information Sciences, Inc. * | 15,600 | |||||||||||||
| 600 | Wabtec Corp. | 16,056 | |||||||||||||
| 600 | Watsco, Inc. | 20,598 | |||||||||||||
| 200 | Watson Wyatt Worldwide, Inc. | 9,822 | |||||||||||||
| 1,600 | Werner Enterprises, Inc. | 21,792 | |||||||||||||
| 2,000 | WESCO International, Inc. * | 33,200 | |||||||||||||
| Total Industrials | 1,114,481 | ||||||||||||||
See accompanying notes to the financial statements.
11
GMO U.S. Small/Mid Cap Value Fund
(A Series of GMO Trust)
Schedule of Investments — (Continued)
(showing percentage of total net assets)
February 28, 2009
| Shares | Description | Value ($) | |||||||||||||
| Information Technology — 10.8% | |||||||||||||||
| 100 | Actel Corp. * | 907 | |||||||||||||
| 3,100 | Acxiom Corp. | 25,668 | |||||||||||||
| 1,500 | Affiliated Computer Services, Inc.-Class A * | 69,945 | |||||||||||||
| 600 | Anixter International, Inc. * | 17,646 | |||||||||||||
| 3,300 | Arrow Electronics, Inc. * | 54,879 | |||||||||||||
| 1,400 | Avnet, Inc. * | 24,178 | |||||||||||||
| 1,600 | Avocent Corp. * | 19,168 | |||||||||||||
| 1,900 | Benchmark Electronics, Inc. * | 18,563 | |||||||||||||
| 900 | Black Box Corp. | 17,856 | |||||||||||||
| 100 | CACI International, Inc.-Class A * | 4,277 | |||||||||||||
| 1,300 | Cognex Corp. | 14,300 | |||||||||||||
| 7,400 | Convergys Corp. * | 47,730 | |||||||||||||
| 2,600 | CSG Systems International, Inc. * | 35,152 | |||||||||||||
| 900 | Diebold, Inc. | 19,908 | |||||||||||||
| 550 | Factset Research Systems, Inc. | 21,197 | |||||||||||||
| 1,200 | Fair Isaac Corp. | 13,140 | |||||||||||||
| 1,400 | FLIR Systems, Inc. * | 28,574 | |||||||||||||
| 2,200 | Global Payments, Inc. | 67,496 | |||||||||||||
| 1,700 | IAC/InterActiveCorp * | 25,381 | |||||||||||||
| 1,500 | Imation Corp. | 12,060 | |||||||||||||
| 15,450 | Ingram Micro, Inc.-Class A * | 168,251 | |||||||||||||
| 2,000 | Insight Enterprises, Inc. * | 5,260 | |||||||||||||
| 2,900 | j2 Global Communications, Inc. * | 54,317 | |||||||||||||
| 6,200 | Jabil Circuit, Inc. | 25,668 | |||||||||||||
| 1,400 | Lam Research Corp. * | 27,384 | |||||||||||||
| 7,500 | Lexmark International, Inc. * | 128,550 | |||||||||||||
| 370 | Mettler-Toledo International, Inc. * | 19,725 | |||||||||||||
| 1,800 | MKS Instruments, Inc. * | 22,662 | |||||||||||||
| 2,100 | ModusLink Global Solutions, Inc. * | 3,990 | |||||||||||||
| 100 | Molex, Inc. | 1,137 | |||||||||||||
| 3,500 | Perot Systems Corp.-Class A * | 39,830 | |||||||||||||
| 600 | Plantronics, Inc. | 5,154 | |||||||||||||
| 9,300 | QLogic Corp. * | 85,746 | |||||||||||||
| 500 | Quest Software, Inc. * | 5,650 | |||||||||||||
See accompanying notes to the financial statements.
12
GMO U.S. Small/Mid Cap Value Fund
(A Series of GMO Trust)
Schedule of Investments — (Continued)
(showing percentage of total net assets)
February 28, 2009
| Shares | Description | Value ($) | |||||||||||||
| Information Technology — continued | |||||||||||||||
| 2,000 | RealNetworks, Inc. * | 4,600 | |||||||||||||
| 500 | Rogers Corp. * | 9,125 | |||||||||||||
| 1,300 | SAIC, Inc. * | 24,583 | |||||||||||||
| 3,900 | Silicon Image, Inc. * | 9,048 | |||||||||||||
| 1,300 | Sybase, Inc. * | 35,334 | |||||||||||||
| 3,300 | SYNNEX Corp. * | 48,906 | |||||||||||||
| 5,597 | Tech Data Corp. * | 96,772 | |||||||||||||
| 500 | Tekelec * | 6,130 | |||||||||||||
| 4,100 | Western Digital Corp. * | 56,006 | |||||||||||||
| Total Information Technology | 1,421,853 | ||||||||||||||
| Materials — 4.1% | |||||||||||||||
| 2,700 | Ashland, Inc. | 15,957 | |||||||||||||
| 1,800 | Ball Corp. | 72,522 | |||||||||||||
| 2,200 | Bemis Co., Inc. | 40,854 | |||||||||||||
| 1,000 | Cabot Corp. | 10,480 | |||||||||||||
| 400 | Carpenter Technology Corp. | 5,480 | |||||||||||||
| 3,300 | Commercial Metals Co. | 33,693 | |||||||||||||
| 400 | Cytec Industries, Inc. | 6,160 | |||||||||||||
| 1,000 | Eastman Chemical Co. | 20,540 | |||||||||||||
| 600 | FMC Corp. | 24,258 | |||||||||||||
| 1,600 | Headwaters, Inc. * | 3,168 | |||||||||||||
| 400 | Innophos Holdings, Inc. | 4,248 | |||||||||||||
| 600 | Olin Corp. | 6,264 | |||||||||||||
| 2,000 | Pactiv Corp. * | 31,660 | |||||||||||||
| 4,400 | Reliance Steel & Aluminum Co. | 104,676 | |||||||||||||
| 100 | Rock-Tenn Co.-Class A | 2,761 | |||||||||||||
| 900 | Schnitzer Steel Industries, Inc.-Class A | 25,776 | |||||||||||||
| 1,700 | Sealed Air Corp. | 18,972 | |||||||||||||
| 500 | Sigma-Aldrich Corp. | 17,850 | |||||||||||||
| 1,900 | Sonoco Products Co. | 36,613 | |||||||||||||
| 558 | Stepan Co. | 15,836 | |||||||||||||
| 1,000 | Valspar Corp. | 16,700 | |||||||||||||
See accompanying notes to the financial statements.
13
GMO U.S. Small/Mid Cap Value Fund
(A Series of GMO Trust)
Schedule of Investments — (Continued)
(showing percentage of total net assets)
February 28, 2009
| Shares | Description | Value ($) | |||||||||||||
| Materials — continued | |||||||||||||||
| 600 | Wausau Paper Corp. | 3,330 | |||||||||||||
| 1,200 | Westlake Chemical Corp. | 14,988 | |||||||||||||
| Total Materials | 532,786 | ||||||||||||||
| Telecommunication Services — 0.7% | |||||||||||||||
| 3,000 | CenturyTel, Inc. | 78,990 | |||||||||||||
| 200 | Telephone & Data Systems, Inc. | 5,900 | |||||||||||||
| 1,200 | USA Mobility, Inc. * | 10,968 | |||||||||||||
| Total Telecommunication Services | 95,858 | ||||||||||||||
| Utilities — 3.1% | |||||||||||||||
| 1,000 | Energen Corp. | 26,800 | |||||||||||||
| 4,100 | Hawaiian Electric Industries, Inc. | 56,867 | |||||||||||||
| 400 | IDACORP, Inc. | 9,736 | |||||||||||||
| 500 | Integrys Energy Group, Inc. | 12,025 | |||||||||||||
| 400 | Laclede Group (The), Inc. | 15,832 | |||||||||||||
| 2,200 | MDU Resources Group, Inc. | 33,308 | |||||||||||||
| 300 | MGE Energy, Inc. | 9,024 | |||||||||||||
| 600 | National Fuel Gas Co. | 18,186 | |||||||||||||
| 800 | New Jersey Resources Corp. | 28,056 | |||||||||||||
| 1,000 | Nicor, Inc. | 31,380 | |||||||||||||
| 1,200 | NSTAR | 38,604 | |||||||||||||
| 900 | Piedmont Natural Gas Co., Inc. | 21,726 | |||||||||||||
| 500 | South Jersey Industries, Inc. | 18,030 | |||||||||||||
| 400 | Southwest Gas Corp. | 7,796 | |||||||||||||
| 3,000 | TECO Energy, Inc. | 28,770 | |||||||||||||
| 300 | UIL Holdings Corp. | 6,156 | |||||||||||||
| 600 | Vectren Corp. | 12,516 | |||||||||||||
| 200 | WGL Holdings, Inc. | 6,072 | |||||||||||||
| 600 | Wisconsin Energy Corp. | 23,892 | |||||||||||||
| Total Utilities | 404,776 | ||||||||||||||
| TOTAL COMMON STOCKS (COST $20,465,624) | 12,666,800 | ||||||||||||||
See accompanying notes to the financial statements.
14
GMO U.S. Small/Mid Cap Value Fund
(A Series of GMO Trust)
Schedule of Investments — (Continued)
(showing percentage of total net assets)
February 28, 2009
| Shares | Description | Value ($) | |||||||||||||
| SHORT-TERM INVESTMENTS — 3.6% | |||||||||||||||
| Money Market Funds — 3.6% | |||||||||||||||
| 471,202 | State Street Institutional Treasury Money Market Fund-Institutional Class | 471,202 | |||||||||||||
| TOTAL SHORT-TERM INVESTMENTS (COST $471,202) | 471,202 | ||||||||||||||
| TOTAL INVESTMENTS — 100.1% (Cost $20,936,826) | 13,138,002 | ||||||||||||||
| Other Assets and Liabilities (net) — (0.1%) | (18,982 | ) | |||||||||||||
| TOTAL NET ASSETS — 100.0% | $ | 13,119,020 | |||||||||||||
See accompanying notes to the financial statements.
15
GMO U.S. Small/Mid Cap Value Fund
(A Series of GMO Trust)
Schedule of Investments — (Continued)
February 28, 2009
A summary of outstanding financial instruments at February 28, 2009 is as follows:
Futures Contracts
| Number of Contracts | Type | Expiration Date | Contract Value | Net Unrealized Appreciation (Depreciation) | |||||||||||||||
| Buys | |||||||||||||||||||
| 3 | Russell 2000 Mini | March 2009 | $ | 116,550 | $ | (25,100 | ) | ||||||||||||
| 4 | S&P Midcap 400 E-Mini | March 2009 | 179,560 | (29,227 | ) | ||||||||||||||
| $ | 296,110 | $ | (54,327 | ) | |||||||||||||||
As of February 28, 2009, for the futures contracts held, the Fund had sufficient cash and/or securities to cover any commitments or margin requirements of the relevant broker or exchange.
Notes to Schedule of Investments:
REIT - Real Estate Investment Trust
* Non-income producing security.
See accompanying notes to the financial statements.
16
GMO U.S. Small/Mid Cap Value Fund
(A Series of GMO Trust)
Statement of Assets and Liabilities — February 28, 2009
| Assets: | |||||||
| Investments, at value (cost $20,936,826) (Note 2) | $ | 13,138,002 | |||||
| Dividends and interest receivable | 25,658 | ||||||
| Receivable for collateral on open futures contracts (Note 2) | 42,900 | ||||||
| Receivable for expenses reimbursed by Manager (Note 3) | 6,449 | ||||||
| Total assets | 13,213,009 | ||||||
| Liabilities: | |||||||
| Payable to affiliate for (Note 3): | |||||||
| Management fee | 3,436 | ||||||
| Shareholder service fee | 1,663 | ||||||
| Trustees and Chief Compliance Officer of GMO Trust fees | 48 | ||||||
| Payable for variation margin on open futures contracts (Note 2) | 3,500 | ||||||
| Accrued expenses | 85,342 | ||||||
| Total liabilities | 93,989 | ||||||
| Net assets | $ | 13,119,020 | |||||
| Net assets consist of: | |||||||
| Paid-in capital | $ | 29,933,497 | |||||
| Accumulated undistributed net investment income | 26,224 | ||||||
| Accumulated net realized loss | (8,987,550 | ) | |||||
| Net unrealized depreciation | (7,853,151 | ) | |||||
| $ | 13,119,020 | ||||||
| Net assets attributable to: | |||||||
| Class III shares | $ | 13,119,020 | |||||
| Shares outstanding: | |||||||
| Class III | 2,951,670 | ||||||
| Net asset value per share: | |||||||
| Class III | $ | 4.44 | |||||
See accompanying notes to the financial statements.
17
GMO U.S. Small/Mid Cap Value Fund
(A Series of GMO Trust)
Statement of Operations — Year Ended February 28, 2009
| Investment Income: | |||||||
| Dividends (net of withholding taxes of $162) | $ | 433,595 | |||||
| Interest | 7,940 | ||||||
| Total investment income | 441,535 | ||||||
| Expenses: | |||||||
| Management fee (Note 3) | 71,313 | ||||||
| Shareholder service fee – Class III (Note 3) | 34,506 | ||||||
| Custodian, fund accounting agent and transfer agent fees | 41,814 | ||||||
| Audit and tax fees | 56,133 | ||||||
| Legal fees | 422 | ||||||
| Trustees fees and related expenses (Note 3) | 244 | ||||||
| Miscellaneous | 1,119 | ||||||
| Total expenses | 205,551 | ||||||
| Fees and expenses reimbursed by Manager (Note 3) | (99,314 | ) | |||||
| Net expenses | 106,237 | ||||||
| Net investment income (loss) | 335,298 | ||||||
| Realized and unrealized gain (loss): | |||||||
| Net realized gain (loss) on: | |||||||
| Investments | (5,615,990 | ) | |||||
| Closed futures contracts | (223,204 | ) | |||||
| Foreign currency, forward contracts and foreign currency related transactions | (10 | ) | |||||
| Net realized gain (loss) | (5,839,204 | ) | |||||
| Change in net unrealized appreciation (depreciation) on: | |||||||
| Investments | (2,843,492 | ) | |||||
| Open futures contracts | (54,327 | ) | |||||
| Net unrealized gain (loss) | (2,897,819 | ) | |||||
| Net realized and unrealized gain (loss) | (8,737,023 | ) | |||||
| Net increase (decrease) in net assets resulting from operations | $ | (8,401,725 | ) | ||||
See accompanying notes to the financial statements.
18
GMO U.S. Small/Mid Cap Value Fund
(A Series of GMO Trust)
Statement of Changes in Net Assets
| Year Ended February 28, 2009 | Year Ended February 29, 2008 | ||||||||||
| Increase (decrease) in net assets: | |||||||||||
| Operations: | |||||||||||
| Net investment income (loss) | $ | 335,298 | $ | 737,962 | |||||||
| Net realized gain (loss) | (5,839,204 | ) | (1,023,435 | ) | |||||||
| Change in net unrealized appreciation (depreciation) | (2,897,819 | ) | (9,361,725 | ) | |||||||
| Net increase (decrease) in net assets from operations | (8,401,725 | ) | (9,647,198 | ) | |||||||
| Distributions to shareholders from: | |||||||||||
| Net investment income | |||||||||||
| Class III | (339,148 | ) | (739,082 | ) | |||||||
| Net realized gains | |||||||||||
| Class III | — | (4,151,014 | ) | ||||||||
| (339,148 | ) | (4,890,096 | ) | ||||||||
| Net share transactions (Note 7): | |||||||||||
| Class III | (13,439,111 | ) | (8,753,035 | ) | |||||||
| Purchase premiums and redemption fees (Notes 2 and 7): | |||||||||||
| Class III | 68,983 | 68,226 | |||||||||
| Total increase (decrease) in net assets resulting from net share transactions, purchase premiums and redemption fees | (13,370,128 | ) | (8,684,809 | ) | |||||||
| Total increase (decrease) in net assets | (22,111,001 | ) | (23,222,103 | ) | |||||||
| Net assets: | |||||||||||
| Beginning of period | 35,230,021 | 58,452,124 | |||||||||
| End of period (including accumulated undistributed net investment income of $26,224 and $31,207, respectively) | $ | 13,119,020 | $ | 35,230,021 | |||||||
See accompanying notes to the financial statements.
19
GMO U.S. Small/Mid Cap Value Fund
(A Series of GMO Trust)
Financial Highlights
(For a Class III share outstanding throughout each period)
| Year Ended February 28/29, | |||||||||||||||||||||||
| 2009 | 2008 | 2007 | 2006 | 2005 | |||||||||||||||||||
| Net asset value, beginning of period | $ | 7.36 | $ | 10.01 | $ | 10.52 | $ | 12.38 | $ | 15.51 | |||||||||||||
| Income (loss) from investment operations: | |||||||||||||||||||||||
| Net investment income (loss)† | 0.10 | 0.13 | 0.15 | 0.20 | 0.19 | ||||||||||||||||||
| Net realized and unrealized gain (loss) | (2.92 | ) | (1.87 | ) | 0.68 | 1.11 | 1.32 | ||||||||||||||||
| Total from investment operations | (2.82 | ) | (1.74 | ) | 0.83 | 1.31 | 1.51 | ||||||||||||||||
| Less distributions to shareholders: | |||||||||||||||||||||||
| From net investment income | (0.10 | ) | (0.13 | ) | (0.20 | ) | (0.21 | ) | (0.16 | ) | |||||||||||||
| From net realized gains | — | (0.78 | ) | (1.14 | ) | (2.96 | ) | (4.48 | ) | ||||||||||||||
| Total distributions | (0.10 | ) | (0.91 | ) | (1.34 | ) | (3.17 | ) | (4.64 | ) | |||||||||||||
| Net asset value, end of period | $ | 4.44 | $ | 7.36 | $ | 10.01 | $ | 10.52 | $ | 12.38 | |||||||||||||
| Total Return(a) | (38.76 | )% | (18.73 | )% | 8.71 | % | 11.67 | % | 14.98 | % | |||||||||||||
| Ratios/Supplemental Data: | |||||||||||||||||||||||
| Net assets, end of period (000's) | $ | 13,119 | $ | 35,230 | $ | 58,452 | $ | 53,389 | $ | 80,084 | |||||||||||||
| Net expenses to average daily net assets | 0.46 | % | 0.46 | % | 0.46 | % | 0.48 | % | 0.48 | % | |||||||||||||
| Net investment income to average daily net assets | 1.46 | % | 1.44 | % | 1.46 | % | 1.71 | % | 1.48 | % | |||||||||||||
| Portfolio turnover rate | 73 | % | 63 | % | 79 | % | 48 | % | 66 | % | |||||||||||||
| Fees and expenses reimbursed by the Manager to average daily net assets: | 0.43 | % | 0.19 | % | 0.22 | % | 0.19 | % | 0.12 | % | |||||||||||||
| Purchase premiums and redemption fees consisted of the following per share amounts:† | $ | 0.02 | $ | 0.01 | $ | 0.02 | $ | 0.04 | $ | 0.09 | |||||||||||||
(a) The total returns would have been lower had certain expenses not been reimbursed during the periods shown and assumes the effect of reinvested distributions. Calculation excludes purchase premiums and redemption fees which are borne by the shareholder.
† Calculated using average shares outstanding throughout the period.
See accompanying notes to the financial statements.
20
GMO U.S. Small/Mid Cap Value Fund
(A Series of GMO Trust)
Notes to Financial Statements
February 28, 2009
1. Organization
GMO U.S. Small/Mid Cap Value Fund (the "Fund") is a series of GMO Trust (the "Trust"). The Fund is registered under the Investment Company Act of 1940, as amended, as an open-end, non-diversified management investment company. The Fund is advised and managed by Grantham, Mayo, Van Otterloo & Co. LLC (the "Manager" or "GMO"). The Trust was established as a Massachusetts business trust under the laws of The Commonwealth of Massachusetts on June 24, 1985. The Declaration of Trust permits the Trustees of the Trust ("Trustees") to create an unlimited number of series of shares ("Funds") and to subdivide Funds into classes.
The Fund seeks long-term capital growth. The Fund seeks to achieve its objective by outperforming the Russell 2500 Value Index. The Fund typically makes equity investments in U.S. companies that issue stocks included in the Russell 2500 Index, and in companies with similar market capitalizations.
2. Significant accounting policies
The following is a summary of significant accounting policies followed by the Fund in the preparation of its financial statements. These policies are in conformity with accounting principles generally accepted in the United States of America ("U.S. GAAP") and have been consistently followed by the Fund in preparing its financial statements. The preparation of financial statements in accordance with U.S. GAAP requires management to make estimates and assumptions that affect the reported amounts and disclosures in the financial statements. Actual results could differ from those estimates. The accounting records of the Fund are maintained in U.S. dollars.
Portfolio valuation
Securities listed on a securities exchange for which market quotations are readily available are valued at the last sale price or official closing price on each business day, or if there is no such reported sale or official closing price, at the most recent quoted bid price. Unlisted securities for which market quotations are readily available are generally valued at the most recent quoted bid price. Debt instruments with a remaining maturity of sixty days or less are generally valued at amortized cost, which approximates fair value. Shares of investment funds are generally valued at their net asset value. Securities for which quotations are not readily available or whose values the Manager has determined to be unreliable are valued at fair value as determined in good faith by the Trustees or persons acting at their direction pursuant to procedures approved by the Trustees. By its nature, a fair value price is a good faith estim ate of the value of a security at a given point in time and may not reflect the value that would be realized if the security were sold. The difference between a fair value price and the value realized upon a sale could be material.
In September 2006, the Financial Accounting Standards Board ("FASB") issued Statement of Financial Accounting Standards No. 157, Fair Value Measurements ("SFAS 157"). SFAS 157 is effective for the Fund's current fiscal year. While the adoption of SFAS 157 does not have an effect on the Fund's net asset
21
GMO U.S. Small/Mid Cap Value Fund
(A Series of GMO Trust)
Notes to Financial Statements — (Continued)
February 28, 2009
value, it does require additional disclosures about fair value measurements. SFAS 157 establishes a three-level hierarchy for disclosure of fair value measurements. The valuation hierarchy is based upon the reliability of inputs to the valuation of the Fund's investments. The three levels are defined as follows:
Level 1 – Valuations based on quoted prices for identical securities in active markets.
Level 2 – Valuations determined using other significant direct or indirect observable inputs.
Level 3 – Valuations based on inputs that are unobservable and significant.
The inputs or methodology used for valuing securities are not necessarily an indication of the risk associated with investing in those securities.
The following is a summary of the fair valuations according to inputs used as of February 28, 2009 in valuing the Fund's investments:
| Asset Valuation Inputs | Investments in Securities | Other Financial Instruments | |||||||||
| Level 1 - Quoted Prices | $ | 12,666,800 | $ | — | |||||||
| Level 2 - Other Significant Observable Inputs | 471,202 | — | |||||||||
| Level 3 - Significant Unobservable Inputs | — | — | |||||||||
| Total | $ | 13,138,002 | $ | — | |||||||
| Liability Valuation Inputs | Investments in Securities | Other Financial Instruments* | |||||||||
| Level 1 - Quoted Prices | $ | — | $ | (54,327 | ) | ||||||
| Level 2 - Other Significant Observable Inputs | — | — | |||||||||
| Level 3 - Significant Unobservable Inputs | — | — | |||||||||
| Total | $ | — | $ | (54,327 | ) | ||||||
* Other financial instruments include futures contracts.
The Fund held no investments or other financial instruments at either February 29, 2008 or February 28, 2009, whose fair value was determined using Level 3 inputs.
Futures contracts
The Fund may purchase and sell futures contracts. Upon entering into a futures contract, the Fund is required to deposit cash, U.S. government and agency obligations, or other liquid assets with the futures clearing broker in accordance with the initial margin requirements of the broker or exchange. In addition,
22
GMO U.S. Small/Mid Cap Value Fund
(A Series of GMO Trust)
Notes to Financial Statements — (Continued)
February 28, 2009
the Fund maintains cash or securities in an amount that at least equals the net amount payable in the event the Fund must deliver the full amount of the contract. Futures contracts are marked to market daily and an appropriate payable or receivable for the change in value ("variation margin") is recorded by the Fund. The payable or receivable is settled on the following business day. Gains or losses are recognized but not considered realized until the contracts expire or are closed. Futures contracts involve, to varying degrees, risk of loss in excess of the variation margin disclosed in the Statement of Assets and Liabilities. Under some circumstances, futures exchanges may establish daily limits on the amount that the price of a futures contract can vary from the previous day's settlement price, thereby effectively preventing liquidation of unfavorable positions. Losses may arise from changes in the value of the underlying ins trument if the Fund is unable to liquidate a futures position due to an illiquid secondary market for the contract or the imposition of price limits, or if counterparties do not perform under the contract terms. Futures contracts are generally valued at the settlement price established each day by the board of trade or exchange on which they are traded. Futures contracts outstanding at the end of the period are listed in the Fund's Schedule of Investments.
Swap agreements
The Fund may enter into various types of swap agreements, including without limitation, interest rate, total return, credit default and variance swap agreements. A swap agreement is an agreement to exchange the return generated by one instrument for the return generated by another instrument. When entering into a swap agreement, the Fund and/or the swap counterparty may post or receive cash or securities as collateral. The party posting the collateral typically receives the interest associated with or payments related to the collateral and has the risk of loss related to the collateral.
Interest rate swap agreements involve an exchange by the parties of their respective commitments to pay or right to receive interest, e.g., an exchange of floating rate interest payments for fixed rate interest payments with respect to the notional amount of principal.
Total return swap agreements involve a commitment by one party to pay interest to the other party in exchange for a payment to it from the other party based on the return of a reference instrument (e.g., a security or basket of securities), both based on notional amounts. To the extent the return of the reference instrument exceeds or falls short of the interest payments, one party will receive a payment from or make a payment to the other party.
In a credit default swap agreement, one party makes payments to another party in exchange for the right to receive a specified return if a credit event occurs with respect to a referenced entity or entities. Buying credit default protection reduces the buyer's exposure in the event of an issuer's default (e.g., it reduces risk where a party owns a security issued by or otherwise has exposure to the issuer). Selling credit default protection subjects the seller to exposure to an issuer's default. A seller of credit default protection receives payments in return for its obligation to pay the principal amount of a debt security (or other agreed-upon value) to the other party upon the occurrence of a credit event (e.g., issuer default or similar
23
GMO U.S. Small/Mid Cap Value Fund
(A Series of GMO Trust)
Notes to Financial Statements — (Continued)
February 28, 2009
event). If no credit event occurs, the seller has no payment obligations. For credit default swap agreements on asset-backed securities, a credit event may be triggered by such events as the issuer's failure to pay interest or principal, an agreement of the holders of an asset-backed security to a maturity extension, a rating downgrade on the security or a write-down on the collateral underlying the security. For credit default swap agreements on corporate or sovereign issuers, a credit event may be triggered by such events as the issuer's bankruptcy, failure to pay interest or principal, repudiation/moratorium or restructuring.
Variance swap agreements involve an agreement by two parties to exchange cash flows based on the measured variance (or square of volatility) of a specified underlying asset. One party agrees to exchange a "fixed rate" or strike price payment for the "floating rate" or realized price variance on the underlying asset with respect to the notional amount. At inception, the strike price chosen is generally fixed at a level such that the fair value of the swap is zero. At the expiration date, the amount paid by one party to the other is the difference between the realized price variance of the underlying asset and the strike price multiplied by the notional amount. A receiver of the realized price variance would receive a payment when the realized price variance of the underlying asset is greater than the strike price and would make a payment when that variance is less than the strike price. A payer of the realized price variance woul d make a payment when the realized price variance of the underlying asset is greater than the strike price and would receive a payment when that variance is less than the strike price. This type of agreement is essentially a forward contract on the future realized price variance of the underlying asset.
The Fund prices its swap agreements daily using models that may incorporate quotations from market makers and records the change in value, if any, as unrealized gain or loss in the Statement of Operations. Payments received or made on swap agreements are recorded as realized gain or loss in the Statement of Operations. Gains or losses are realized upon termination of the swap agreements.
Swap agreements often are not actively traded on financial markets. The values assigned to them may differ significantly from the values that would be realized upon termination, and the differences could be material. Entering into swap agreements involves credit, legal, market and documentation risk that is not reflected in the amounts reported in the Statement of Assets and Liabilities. Such risks include the possibility that the party with whom the Fund contracts may default on its obligations to perform or disagree as to the meaning of contractual terms, or that the collateral that party posts may be insufficient or not timely received by the Fund. Credit risk may be particularly acute in an environment where financial services firms are exposed to systemic risks of the type evidenced by the insolvency of Lehman Brothers and subsequent market disruptions. The Fund had no swap agreements outstanding at the end of the period.
Repurchase agreements
The Fund may enter into repurchase agreements. Under a repurchase agreement the Fund acquires a security for cash and obtains a simultaneous commitment from the seller to repurchase the security at an agreed upon price and date. The Fund, through its custodian, takes possession of securities collateralizing
24
GMO U.S. Small/Mid Cap Value Fund
(A Series of GMO Trust)
Notes to Financial Statements — (Continued)
February 28, 2009
the repurchase agreement. The collateral is marked to market daily to ensure that the market value of the underlying assets is at least equal to the amount owed to the Fund in the event of default by the seller. If the seller of a repurchase agreement defaults or enters into insolvency proceedings and the value of the collateral declines, the Fund's recovery of cash may be delayed or limited. The Fund had no repurchase agreements outstanding at the end of the period.
Securities lending
The Fund may lend its securities to qualified brokers. The loans are collateralized with cash or liquid securities with a market value at least equal to the market value of the securities upon entering into the loan. As with other extensions of credit, the Fund may bear the risk of loss with respect to the investment of the collateral, the risk of delay in and/or inability to exercise its rights with respect to the collateral, and the risk of delay in recovery or loss of rights in the loaned securities should the borrower of the securities fail financially. If a loan is collateralized by U.S. government securities, the Fund receives a fee from the borrower. If a loan is collateralized by cash, the Fund typically invests the cash collateral for its own account. For the year from March 1, 2008 through February 28, 2009, the Fund did not participate in securities lending.
Taxes and distributions
The Fund intends to qualify each tax year as a regulated investment company under Subchapter M of the Internal Revenue Code of 1986, as amended (the "Code"). The Fund intends to distribute substantially all of its net investment income and all of its net realized short-term and long-term capital gain, if any, after giving effect to any available capital loss carryforwards for U.S. federal income tax purposes. Therefore, no provision for U.S. federal income or excise tax is necessary.
The Fund's policy is to declare and pay distributions from net investment income, if any, quarterly, and from net realized short-term and long-term capital gain, if any, at least annually. All distributions are paid in shares of the Fund, at net asset value, unless the shareholder elects to receive cash distributions. Distributions to shareholders are recorded by the Fund on the ex-dividend date.
Income and capital gain distributions are determined in accordance with U.S. federal income tax regulations, which may differ from U.S. GAAP. Certain capital accounts in the financial statements are periodically adjusted for permanent differences in order to reflect their tax character. These adjustments have no impact on net assets or net asset value per share. Temporary differences that arise from recognizing certain items of income, expense, gain or loss in different periods for financial statement and tax purposes will reverse at some time in the future. Distributions in excess of net investment income or net realized gains are temporary over-distributions for financial statement purposes resulting from differences in the recognition or classification of income or distributions for financial statement and tax purposes.
U.S. GAAP and tax accounting differences primarily relate to capital loss carryforwards, losses on wash sale transactions, derivative contract transactions and post-October capital losses.
25
GMO U.S. Small/Mid Cap Value Fund
(A Series of GMO Trust)
Notes to Financial Statements — (Continued)
February 28, 2009
The following reclassification represents the amount necessary to report the stated components of net assets on a tax basis, excluding certain temporary differences, as of February 28, 2009. The financial highlights exclude these adjustments.
| Accumulated Undistributed Net Investment Income | Accumulated Net Realized Loss | Paid-in Capital | |||||||||
| $ | (1,133 | ) | $ | 1,133 | $ | — | |||||
The tax character of distributions declared to shareholders is as follows:
| 2/28/2009 | 2/29/2008 | ||||||||||
| Ordinary income (including any net short-term capital gain) | $ | 339,148 | $ | 1,572,310 | |||||||
| Net long-term capital gain | — | 3,317,786 | |||||||||
| Total distributions | $ | 339,148 | $ | 4,890,096 | |||||||
Distributions in excess of tax basis earnings and profits, if significant, are reported in the financial statements as a retun of capital for tax purposes.
As of February 28, 2009, the components of distributable earnings on a tax basis consisted of the following:
| Undistributed ordinary income (including any net short-term capital gain) | $ | 26,224 | |||||
As of February 28, 2009, the Fund elected to defer to March 1, 2009 post-October capital losses of $2,570,608.
As of February 28, 2009, the Fund had capital loss carryforwards available to offset future realized gains if any, to the extent permitted by the Code. Utilization of the capital loss carryforwards could be subject to limitations imposed by the Code related to share ownership activity. Such losses expire as follows:
| 2/28/2017 | $ | (5,940,234 | ) | ||||
| Total | $ | (5,940,234 | ) |
26
GMO U.S. Small/Mid Cap Value Fund
(A Series of GMO Trust)
Notes to Financial Statements — (Continued)
February 28, 2009
As of February 28, 2009, the approximate cost for U.S. federal income tax purposes and gross and net unrealized appreciation (depreciation) in value of investments were as follows:
| Aggregate Cost | Gross Unrealized Appreciation | Gross Unrealized (Depreciation) | Net Unrealized Appreciation (Depreciation) | ||||||||||||
| $ | 21,467,861 | $ | 137,349 | $ | (8,467,208 | ) | $ | (8,329,859 | ) | ||||||
The Fund is subject to the provisions of Financial Accounting Standards Board Interpretation No. 48 ("FIN 48"), Accounting for Uncertainty in Income Taxes — an Interpretation of FASB Statement No. 109. FIN 48 sets forth a minimum threshold for financial statement recognition of a tax position taken or expected to be taken in a tax return that could affect the Fund's financial statements. The Fund did not have any unrecognized tax benefits or liabilities at February 28, 2009, nor did it have any increases or decreases in unrecognized tax benefits or liabilities for the period then ended. The Fund is subject to examination prior to the expiration of the statute of limitations by U.S. federal and state tax authorities for tax returns filed.
Security transactions and related investment income
Security transactions in the financial statements are accounted for on the trade date. Dividend income, net of applicable foreign withholding taxes, if any, is recorded on the ex-dividend date or, if later, when the Fund is informed of the ex-dividend date. Interest income is recorded on the accrual basis and is adjusted for the amortization of premiums and accretion of discounts. Principal on inflation indexed securities is adjusted for inflation and any increase or decrease is recorded as interest income or loss. Income is not recognized on securities for which collection is not expected. Non-cash dividends, if any, are recorded at the fair market value of the asset received. In determining the net gain or loss on securities sold, the Fund uses the identified cost basis for the purposes of determining the cost basis.
Expenses
The majority of the expenses of the Trust are directly identifiable to an individual fund. Expenses that are not readily identifiable to a specific fund are allocated taking into consideration, among other things, the nature and type of expense and the relative size of the funds.
State Street Bank and Trust Company ("State Street") serves as custodian, fund accounting agent and transfer agent of the Fund. State Street's fees may be reduced by an earnings allowance calculated on the average daily cash balances the Fund maintains with State Street. The Fund receives the benefit of the earnings allowance. In addition, Goldman Sachs Agency Lending, the Fund's securities lending agent, has agreed to reimburse the Fund for certain transactional expenses related to securities lending activity. Credit balances or expense reimbursements used to reduce fees, if any, are reported as a reduction of expenses in the Statement of Operations.
27
GMO U.S. Small/Mid Cap Value Fund
(A Series of GMO Trust)
Notes to Financial Statements — (Continued)
February 28, 2009
Purchases and redemptions of Fund shares
As of February 28, 2009, the premium on cash purchases and fee on cash redemptions of Fund shares were each 0.50% of the amount invested or redeemed. The Fund may impose a new purchase premium and/or redemption fee, or modify or eliminate an existing purchase premium and/or redemption fee, at any time. If the Manager determines that any portion of a cash purchase or redemption is offset by a corresponding cash redemption or purchase on the same day, the Fund will ordinarily waive or reduce the purchase premium or redemption fee with respect to that portion. In addition, the Fund may waive or reduce the purchase premium or redemption fee in extraordinary circumstances if the purchase or redemption will not cause the Fund to incur transaction costs. All purchase premiums and redemption fees are paid to the Fund and recorded by the Fund as paid-in-capital. The Fund will waive or reduce the purchase premium relating to the in-kind p ortion of a purchase transaction except for estimated or known transaction costs (e.g. stamp duties and transfer taxes) incurred by the Fund as a result of the transfer of the purchasing shareholder's securities to the Fund. In-kind redemption transactions are generally not subject to redemption fees except when they include a cash component. However, when a substantial portion of a Fund is being redeemed, the Fund may charge a redemption fee based on estimated or known transaction costs resulting from those redemptions. The Fund charges no premium for reinvested distributions.
Recently issued accounting pronouncement
In March 2008, FASB issued Statement of Financial Accounting Standards No. 161, Disclosures about Derivative Instruments and Hedging Activities ("SFAS 161"). SFAS 161 is effective for fiscal years and interim periods beginning after November 15, 2008. SFAS 161 requires enhanced disclosures about the Fund's derivative and hedging activities. The Manager is currently evaluating the impact the adoption of SFAS 161 will have on the Fund's financial statement disclosures.
3. Fees and other transactions with affiliates
GMO receives a management fee for the services it provides to the Fund. That fee is paid monthly at the annual rate of 0.31% of average daily net assets. The Fund has adopted a Shareholder Service Plan under which the Fund pays GMO a shareholder service fee for client and shareholder service, reporting, and other support. Pursuant to the Shareholder Service Plan, the shareholder service fee is calculated based on average daily net assets at the annual rate of 0.15% for Class III shares.
Through at least June 30, 2009, the Manager has contractually agreed to reimburse the Fund for Fund expenses incurred through that date to the extent the Fund's total annual operating expenses (excluding "Excluded Expenses", as defined below) exceed 0.31% of the Fund's average daily net assets. Excluded Expenses include shareholder service fees, fees and expenses of the independent Trustees of the Trust, fees and expenses for legal services not approved by the Manager for the Trust, compensation and expenses of the Trust's Chief Compliance Officer ("CCO") (excluding any employee benefits), brokerage commissions, securities lending fees and expenses, interest expense, transfer taxes, and other investment-related costs (including expenses associated with investments in any company that is an investment company or would
28
GMO U.S. Small/Mid Cap Value Fund
(A Series of GMO Trust)
Notes to Financial Statements — (Continued)
February 28, 2009
be an investment company under the 1940 Act, but for the exceptions to the definition of investment company provided in Section 3(c)(1) and 3(c)(7) of the 1940 Act), hedging transaction fees, extraordinary, non-recurring and certain other unusual expenses (including taxes).
The Fund's portion of the fee paid by the Trust to the Trust's independent Trustees and CCO during the year ended February 28, 2009 was $244 and $120, respectively. The compensation and expenses of the CCO are included in miscellaneous expenses in the Statement of Operations. The Fund paid no remuneration to any other officer of the Trust.
4. Purchases and sales of securities
Cost of purchases and proceeds from sales of securities, excluding short-term investments, for the year ended February 28, 2009 aggregated $16,361,317 and $28,523,282, respectively.
5. Guarantees
In the normal course of business the Fund enters into contracts with third-party service providers that contain a variety of representations and warranties and that provide general indemnifications. The Fund's maximum exposure under these arrangements is unknown, as it involves future claims that may be made against the Fund that have not yet occurred. Based on experience, management is of the view that the risk of loss in connection with its indemnification obligations is remote; however, there can be no assurance that such obligations will not result in material liabilities that adversely affect the Fund.
6. Principal shareholders and related parties
As of February 28, 2009, 57.46% of the outstanding shares of the Fund were held by one shareholder. On that date, no other shareholder owned more than 10% of the outstanding shares of the Fund. Redemptions from (or investments into) the Fund by or on behalf of this large shareholder may have a material effect on the Fund.
As of February 28, 2009, 0.15% of the Fund's shares were held by senior management of the Manager and GMO Trust officers and 95.79% of the Fund's shares were held by accounts for which the Manager had investment discretion.
29
GMO U.S. Small/Mid Cap Value Fund
(A Series of GMO Trust)
Notes to Financial Statements — (Continued)
February 28, 2009
7. Share transactions
The Declaration of Trust permits the Trust to issue an unlimited number of shares of beneficial interest (without par value). Transactions in Fund shares were as follows:
| Year Ended February 28, 2009 | Year Ended February 29, 2008 | ||||||||||||||||||
| Class III: | Shares | Amount | Shares | Amount | |||||||||||||||
| Shares sold | 4,941 | $ | 32,066 | 3,584 | $ | 31,432 | |||||||||||||
| Shares issued to shareholders in reinvestment of distributions | 47,015 | 308,041 | 541,777 | 4,846,264 | |||||||||||||||
| Shares repurchased | (1,889,957 | ) | (13,779,218 | ) | (1,595,273 | ) | (13,630,731 | ) | |||||||||||
| Purchase premiums | — | 123 | — | 114 | |||||||||||||||
| Redemption fees | — | 68,860 | — | 68,112 | |||||||||||||||
| Net increase (decrease) | (1,838,001 | ) | $ | (13,370,128 | ) | (1,049,912 | ) | $ | (8,684,809 | ) | |||||||||
30
Report of Independent Registered Public Accounting Firm
To the Trustees of GMO Trust and the Shareholders of
GMO U.S. Small/Mid Cap Value Fund
In our opinion, the accompanying statement of assets and liabilities, including the schedule of investments, and the related statements of operations and of changes in net assets and the financial highlights present fairly, in all material respects, the financial position of GMO U.S. Small/Mid Cap Value Fund (the "Fund") at February 28, 2009, the results of its operations for the year then ended, the changes in its net assets for each of the two years in the period then ended and the financial highlights for each of the five years in the period then ended, in conformity with accounting principles generally accepted in the United States of America. These financial statements and financial highlights (hereafter referred to as "financial statements") are the responsibility of the Fund's management. Our responsibility is to express an opinion on these financial statements based on our audits. We conducted our audits of these financi al statements in accordance with the standards of the Public Company Accounting Oversight Board (United States). Those standards require that we plan and perform the audit to obtain reasonable assurance about whether the financial statements are free of material misstatement. An audit includes examining, on a test basis, evidence supporting the amounts and disclosures in the financial statements, assessing the accounting principles used and significant estimates made by management, and evaluating the overall financial statement presentation. We believe that our audits, which included confirmation of securities at February 28, 2009 by correspondence with the custodian, provide a reasonable basis for our opinion.
PricewaterhouseCoopers LLP
Boston, Massachusetts
April 29, 2009
31
GMO U.S. Small/Mid Cap Value Fund
(A Series of GMO Trust)
Fund Expenses
February 28, 2009 (Unaudited)
Expense Examples: The following information is in relation to expenses for the six month period ended February 28, 2009.
As a shareholder of the Fund, you may incur two types of costs: (1) transaction costs, including purchase premiums and redemption fees; and (2) ongoing costs, including management fees, shareholder service fees and other Fund expenses. This example is intended to help you understand your ongoing costs (in dollars) of investing in the Fund and to compare these costs with the ongoing costs of investing in other mutual funds.
These examples are based on an investment of $1,000 invested at the beginning of the period and held for the entire period, September 1, 2008 through February 28, 2009.
Actual Expenses
The first line of the table for each class below provides information about actual account values and actual expenses. You may use the information in this line, together with the amount you invested, to estimate the expenses that you paid over the period. Simply divide your account value by $1,000 (for example, a $10,000,000 account value divided by $1,000 = 10,000), then multiply the result by the number in the first line under the heading entitled "Net Expense Incurred" to estimate the expenses you paid on your account during this period.
Hypothetical Example for Comparison Purposes
The second line of the table for each class below provides information about hypothetical account values and hypothetical expenses based on the Fund's actual expense ratio and an assumed rate of return of 5% per year before expenses, which is not the Fund's actual return. The hypothetical account values and expenses may not be used to estimate the actual ending account balance or expenses you paid for the period. You may use this information to compare the ongoing costs of investing in the Fund with other funds. To do so, compare this 5% hypothetical example with the 5% hypothetical examples that appear in the shareholder reports of other funds.
Please note that the expenses shown in the table are meant to highlight your ongoing costs only and do not reflect any transactional costs. Therefore, the second line of the table is useful in comparing ongoing costs only, and will not help you determine the relative total costs of owning different funds. In addition, if these transactional costs were included, your costs would have been higher.
| Annualized Net Expense Ratio | Beginning Account Value | Ending Account Value | Net Expense Incurred* | ||||||||||||||||
| Class III | |||||||||||||||||||
| 1) Actual | 0.46 | % | $ | 1,000.00 | $ | 591.30 | $ | 1.81 | |||||||||||
| 2) Hypothetical | 0.46 | % | $ | 1,000.00 | $ | 1,022.51 | $ | 2.31 | |||||||||||
* Expenses are calculated using the Class's annualized expense ratio for the six months ended February 28, 2009, multiplied by the average account value over the period, multiplied by 181 days in the period, divided by 365 days in the year.
32
GMO U.S. Small/Mid Cap Value Fund
(A Series of GMO Trust)
Tax Information for the Tax Year Ended February 28, 2009 (Unaudited)
The Fund will notify shareholders of amounts for use in preparing 2009 income tax forms in January 2010.
For taxable, non-corporate shareholders, 100.00% of the income and short-term capital gains, if any, distributed in the Fund's fiscal year ended February 28, 2009 represents qualified dividend income subject to the 15% rate category.
For corporate shareholders, 100.00% of the income and short-term capital gains, if any, distributed in the Fund's fiscal year ended February 28, 2009 qualified for the dividends-received deduction.
33
Trustees and Officers (Unaudited)
The following tables list the Trust's Trustees and Officers as of the date of this report; their address and date of birth ("DOB"); their position with the Trust; the length of time holding that position with the Trust; their principal occupation(s) during the past five years; the number of portfolios in the fund complex they oversee; and other directorships they hold in companies subject to registration or reporting requirements of the Securities Exchange Act of 1934 (generally called "public companies") or in registered investment companies. The Trust's Statement of Additional Information ("SAI") includes additional information about the Trust's trustees, including changes subsequent to the date of the report. The SAI is available, without charge, upon request by writing GMO, c/o GMO Trust, 40 Rowes Wharf, Boston, MA 02110.
Independent Trustees:
| Name, Address, and DOB | Position(s) Held with Trust | Term of Office1 and Length of Time Served | Principal Occupation(s) During Past Five Years | Number of Portfolios in Fund Complex Overseen by Trustee | Other Directorships Held by Trustee | ||||||||||||||||||
| Donald W. Glazer, Esq. c/o GMO Trust 40 Rowes Wharf Boston, MA 02110 DOB: 07/26/1944 | Chairman of the Board of Trustees | Chairman of the Board of Trustees since March 2005; Lead Independent Trustee (September 2004 – March 2005); Trustee since December 2000. | Consultant – Law and Business2; Author of Legal Treatises. | 59 | None. | ||||||||||||||||||
1 Each Trustee is elected to serve during the continued lifetime of the Trust until he/she dies, resigns or is removed, or if sooner, until the next meeting of Shareholders called for the purpose of electing Trustees and until the election and qualification of his/her successor.
2 As part of Mr. Glazer's work as a consultant, he provides part-time consulting services to Goodwin Procter LLP ("Goodwin"). Goodwin has provided legal services to Renewable Resources, LLC, an affiliate of GMO; GMO, in connection with its relationship with Renewable Resources; and funds managed by Renewable Resources. Mr. Glazer has represented that he has no financial interest in, and is not involved in the provision of, such legal services. In the calendar years ended December 31, 2007 and December 31, 2008, these entities paid $789,416 and $183,864 respectively, in legal fees and disbursements to Goodwin. In correspondence with the Staff of the Securities and Exchange Commission beginning in August 2006, the Independent Trustees' legal counsel provided the Staff with information regarding Mr. Glazer's relationship with Goodwin and h is other business activities. On September 11, 2007, based on information that had been given to the Staff as of that date, the Staff provided oral no-action assurance consistent with the opinion of the Independent Trustees' legal counsel that Mr. Glazer is not an "interested person" of the Trust.
34
Independent Trustees — (Continued)
| Name, Address, and DOB | Position(s) Held with Trust | Term of Office1 and Length of Time Served | Principal Occupation(s) During Past Five Years | Number of Portfolios in Fund Complex Overseen by Trustee | Other Directorships Held by Trustee | ||||||||||||||||||
| W. Nicholas Thorndike c/o GMO Trust 40 Rowes Wharf Boston, MA 02110 DOB: 03/28/1933 | Trustee | Since March 2005. | Director or trustee of various corporations and charitable organizations, including Courier Corporation (a book publisher and manufacturer) (July 1989 – present); Putnam Funds (December 1992 – June 2004); and Providence Journal (a newspaper publisher) (December 1986 – December 2003). | 59 | Director of Courier Corporation (a book publisher and manufacturer); Member of the Investment Committee of Partners HealthCare System, Inc.3 | ||||||||||||||||||
| Peter Tufano c/o GMO Trust 40 Rowes Wharf Boston, MA 02110 DOB: 04/22/1957 | Trustee | Since December 2008. | Sylvan C. Coleman Professor of Financial Management, Harvard Business School (since 1989). | 59 | Trustee of State Street Navigator Securities Lending Trust (3 Portfolios). | ||||||||||||||||||
1 Each Trustee is elected to serve during the continued lifetime of the Trust until he/she dies, resigns or is removed, or if sooner, until the next meeting of Shareholders called for the purpose of electing Trustees and until the election and qualification of his/her successor.
3 Partners HealthCare System, Inc. is a client of the Manager.
35
Principal Officers:
| Name, Address, and DOB | Position(s) Held with Trust | Term of Office4 and Length of Time Served | Principal Occupation(s) During Past Five Years5 | ||||||||||||
| J.B. Kittredge DOB: 08/22/1954 | President and Chief Executive Officer | Since March 2009. | General Counsel, Grantham, Mayo, Van Otterloo & Co. LLC (October 2005 – Present); Partner, Ropes & Gray LLP. | ||||||||||||
| Sheppard N. Burnett c/o GMO Trust 40 Rowes Wharf Boston, MA 02110 DOB: 10/24/1968 | Treasurer and Chief Financial Officer | Chief Financial Officer since March 2007; Treasurer since November 2006; Assistant Treasurer, September 2004 – November 2006. | Fund Administration Staff, Grantham, Mayo, Van Otterloo & Co. LLC (June 2004 – present); Vice President, Director of Tax, Columbia Management Group (2002 – 2004). | ||||||||||||
| Brent C. Arvidson c/o GMO Trust 40 Rowes Wharf Boston, MA 02110 DOB: 06/26/1969 | Assistant Treasurer | Since August 1998. | Senior Fund Administrator, Grantham, Mayo, Van Otterloo & Co. LLC. | ||||||||||||
| John L. Nasrah c/o GMO Trust 40 Rowes Wharf Boston, MA 02110 DOB: 05/27/1977 | Assistant Treasurer | Since March 2007. | Fund Administrator, Grantham, Mayo, Van Otterloo & Co. LLC (September 2004 – present); Tax Analyst, Bain & Company, Inc. (June 2003 – September 2004). | ||||||||||||
| Mahmoodur Rahman c/o GMO Trust 40 Rowes Wharf Boston, MA 02110 DOB: 11/30/1967 | Assistant Treasurer | Since September 2007. | Fund Administrator, Grantham, Mayo, Van Otterloo & Co. LLC (April 2007 – present); Vice President and Senior Tax Manager, Massachusetts Financial Services Company (January 2000 – April 2007). | ||||||||||||
| Michael E. Gillespie c/o GMO Trust 40 Rowes Wharf Boston, MA 02110 DOB: 02/18/1958 | Chief Compliance Officer | Since March 2005. | Vice President of Compliance (June 2004 – February 2005) and Director of Domestic Compliance (March 2002 – June 2004), Fidelity Investments. | ||||||||||||
4 Each officer is elected to hold such office until his or her successor is duly elected and qualified to carry out the duties and responsibilities of the office, or until he or she resigns or is removed from office.
5 Each of Messrs. Burnett, Arvidson, Bohan, and Pottle serves as an officer and/or director of certain pooled investment vehicles of which GMO or an affiliate of GMO serves as the investment adviser.
36
Principal Officers — (Continued)
| Name, Address, and DOB | Position(s) Held with Trust | Term of Office4 and Length of Time Served | Principal Occupation(s) During Past Five Years5 | ||||||||||||
| Jason B. Harrison c/o GMO Trust 40 Rowes Wharf Boston, MA 02110 DOB: 01/29/1977 | Vice President and Clerk | Vice President since November 2006; Clerk since March 2006. | Legal Counsel, Grantham, Mayo, Van Otterloo & Co. LLC (since February 2006) and Attorney, Ropes & Gray LLP (September 2002 – February 2006). | ||||||||||||
| David L. Bohan c/o GMO Trust 40 Rowes Wharf Boston, MA 02110 DOB: 06/21/1964 | Vice President and Assistant Clerk | Vice President since March 2005; Assistant Clerk since March 2006. | Legal Counsel, Grantham, Mayo, Van Otterloo & Co. LLC. | ||||||||||||
| Gregory L. Pottle c/o GMO Trust 40 Rowes Wharf Boston, MA 02110 DOB: 07/09/1971 | Vice President and Assistant Clerk | Since November 2006. | Legal Counsel, Grantham, Mayo, Van Otterloo & Co. LLC. | ||||||||||||
| Anne K. Trinque c/o GMO Trust 40 Rowes Wharf Boston, MA 02110 DOB: 04/15/1978 | Vice President and Assistant Clerk | Since September 2007. | Legal Counsel, Grantham, Mayo, Van Otterloo & Co. LLC (January 2007 – present); Attorney, Goodwin Procter LLP (September 2003 – January 2007). | ||||||||||||
| Cheryl Wakeham c/o GMO Trust 40 Rowes Wharf Boston, MA 02110 DOB: 10/29/1958 | Vice President and Anti-Money Laundering Officer | Since December 2004. | Manager, Client Service Administration, Grantham, Mayo, Van Otterloo & Co. LLC. | ||||||||||||
4 Each officer is elected to hold such office until his or her successor is duly elected and qualified to carry out the duties and responsibilities of the office, or until he or she resigns or is removed from office.
5 Each of Messrs. Burnett, Arvidson, Bohan, and Pottle serves as an officer and/or director of certain pooled investment vehicles of which GMO or an affiliate of GMO serves as the investment adviser.
37
GMO Flexible Equities Fund
(A Series of GMO Trust)
Annual Report
February 28, 2009
For a free copy of the Fund's proxy voting guidelines, shareholders may call 1-617-346-7646 (collect) or visit the Securities and Exchange Commission's website at www.sec.gov. Information regarding how the Fund voted proxies relating to portfolio securities during the most recent 12-month period ended June 30 is available on GMO's website at www.gmo.com, or on the Securities and Exchange Commission's website at www.sec.gov.
The Fund files its complete schedule of portfolio holdings with the Securities and Exchange Commission for the first and third quarter of each fiscal year on Form N-Q, which is available on the Commission's website at www.sec.gov. The Fund's Form N-Q may be reviewed and copied at the Commission's Public Reference Room in Washington, D.C. Information on the operation of the Public Reference Room may be obtained by calling 1-800-SEC-0330.
This report is prepared for the general information of shareholders. It is authorized for distribution to prospective investors only when preceded or accompanied by a private placement memorandum, which contains a complete discussion of the risks associated with an investment in this Fund and other important information. The private placement memorandum can be obtained by calling 1-617-346-7646 (collect).
GMO Flexible Equities Fund
(A Series of GMO Trust)
Portfolio Management
Day-to-day management of the Fund's portfolio is the responsibility of the Asset Allocation team at Grantham, Mayo, Van Otterloo & Co. LLC.
Management Discussion and Analysis of Fund Performance
Since its inception on December 12, 2008, the Class III shares of the GMO Flexible Equities Fund returned -23.0% for the period ended February 28, 2009, as compared to -14.8% for the Fund's benchmark, the MSCI World Index.
Implementation detracted from performance, driven by positions in Japanese equities.
The views expressed herein are exclusively those of Grantham, Mayo, Van Otterloo & Co. LLC Management as of the date of this report and are subject to change. GMO disclaims any responsibility to update such views. They are not meant as investment advice.
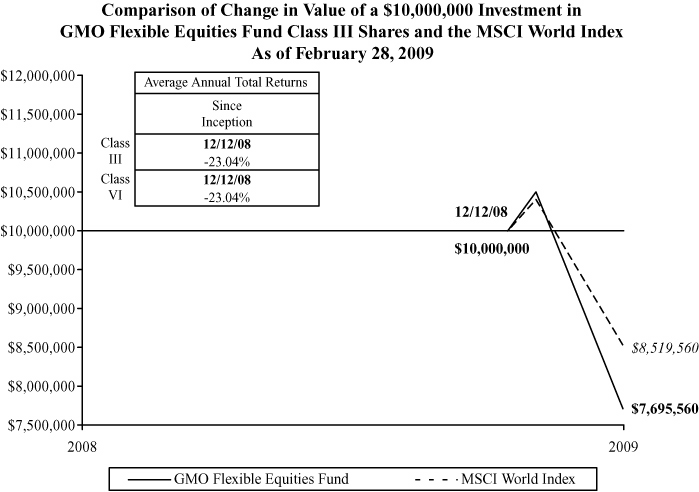
Performance data quoted represents past performance and is not indicative of future results. The investment return and principal value of an investment will fluctuate so that an investor's shares, when redeemed, may be worth more or less than their original cost. Current performance data may be lower or higher than the performance data provided herein. To obtain performance information to the most recent month-end, visit www.gmo.com. Performance shown is net of all fees after reimbursement from the Manager. Returns would have been lower had certain expenses not been reimbursed during the periods shown and do not include the effect of taxes on distributions and redemptions. All information is unaudited. Performance for Class VI shares will vary due to different fees.
GMO Flexible Equities Fund
(A Series of GMO Trust)
Investments Concentration Summary
February 28, 2009 (Unaudited)
| Asset Class Summary | % of Total Net Assets | ||||||
| Common Stocks | 97.9 | % | |||||
| Short-Term Investments | 1.1 | ||||||
| Other | 1.0 | ||||||
| 100.0 | % | ||||||
| Country Summary | % of Equity Investments | ||||||
| Japan | 100.0 | % | |||||
| 100.0 | % | ||||||
| Industry Sector Summary | % of Equity Investments | ||||||
| Financials | 24.3 | % | |||||
| Consumer Staples | 15.9 | ||||||
| Consumer Discretionary | 15.9 | ||||||
| Industrials | 14.3 | ||||||
| Utilities | 13.9 | ||||||
| Telecommunication Services | 8.5 | ||||||
| Materials | 3.8 | ||||||
| Health Care | 1.8 | ||||||
| Information Technology | 1.6 | ||||||
| 100.0 | % | ||||||
1
GMO Flexible Equities Fund
(A Series of GMO Trust)
Schedule of Investments
(showing percentage of total net assets)
February 28, 2009
| Shares | Description | Value ($) | |||||||||||||
| COMMON STOCKS — 97.9% | |||||||||||||||
| Japan — 97.9% | |||||||||||||||
| 36,100 | ABC-Mart Inc | 790,250 | |||||||||||||
| 314 | Accordia Golf Co Ltd | 183,163 | |||||||||||||
| 52,580 | Acom Co Ltd | 1,286,353 | |||||||||||||
| 141,000 | Aeon Credit Service Co Ltd | 1,078,636 | |||||||||||||
| 12,000 | Aeon Delight Co Ltd | 155,053 | |||||||||||||
| 55,500 | Aica Kogyo Co Ltd | 473,510 | |||||||||||||
| 388,950 | Aiful Corp | 401,475 | |||||||||||||
| 19,200 | Alfresa Holdings Corp | 747,840 | |||||||||||||
| 33,800 | Alpen Co Ltd | 539,679 | |||||||||||||
| 1,273,000 | Aozora Bank Ltd | 1,426,818 | |||||||||||||
| 21,000 | Arcs Co Ltd | 302,830 | |||||||||||||
| 12,000 | Ariake Japan Co Ltd | 184,378 | |||||||||||||
| 75,900 | Asahi Breweries Ltd | 950,377 | |||||||||||||
| 228,000 | Asahi Glass Co Ltd | 986,045 | |||||||||||||
| 17,900 | Asatsu-DK Inc | 337,789 | |||||||||||||
| 164,500 | Atrium Co Ltd * | 179,111 | |||||||||||||
| 24,000 | Autobacs Seven Co Ltd | 611,844 | |||||||||||||
| 22,000 | Awa Bank Ltd (The) | 125,575 | |||||||||||||
| 4,800 | Bank of Ikeda Ltd (The) * | 186,780 | |||||||||||||
| 6,200 | Bank of Okinawa Ltd (The) | 216,665 | |||||||||||||
| 39,000 | Bank of Saga Ltd (The) | 126,291 | |||||||||||||
| 22,200 | Bank of the Ryukyus Ltd | 186,455 | |||||||||||||
| 385,000 | Bank of Yokohama Ltd (The) | 1,630,511 | |||||||||||||
| 93,900 | Belluna Co Ltd | 218,933 | |||||||||||||
| 68,000 | Best Denki Co Ltd | 185,869 | |||||||||||||
| 2,707 | BIC Camera Inc | 474,570 | |||||||||||||
| 11,000 | BML Inc | 219,809 | |||||||||||||
| 31,000 | Bunka Shutter Co Ltd | 92,707 | |||||||||||||
| 19,500 | Canon Marketing Japan Inc | 270,363 | |||||||||||||
| 19,100 | Cawachi Ltd | 315,494 | |||||||||||||
| 290,000 | Central Glass Co Ltd | 752,942 | |||||||||||||
| 33 | Central Japan Railway Co | 200,479 | |||||||||||||
See accompanying notes to the financial statements.
2
GMO Flexible Equities Fund
(A Series of GMO Trust)
Schedule of Investments — (Continued)
(showing percentage of total net assets)
February 28, 2009
| Shares | Description | Value ($) | |||||||||||||
| Japan — continued | |||||||||||||||
| 55,400 | Century Leasing System Inc | 297,953 | |||||||||||||
| 291,000 | Chiba Bank Ltd | 1,365,965 | |||||||||||||
| 28,600 | Chiba Kogyo Bank Ltd * | 282,651 | |||||||||||||
| 12,500 | Chiyoda Co Ltd | 162,622 | |||||||||||||
| 30,300 | Chiyoda Integre Co Ltd | 332,969 | |||||||||||||
| 152,800 | Chubu Electric Power Co Inc | 3,767,268 | |||||||||||||
| 123,000 | Chugai Ro Co Ltd | 279,886 | |||||||||||||
| 64,400 | Chugoku Electric Power Co Inc | 1,542,908 | |||||||||||||
| 615,000 | Chuo Mitsui Trust Holdings Inc | 1,864,257 | |||||||||||||
| 76,300 | Circle K Sunkus Co Ltd | 1,172,731 | |||||||||||||
| 9,000 | Coca-Cola Central Japan Co Ltd | 123,821 | |||||||||||||
| 6,500 | Cocokara Fine Holdings Inc * | 60,018 | |||||||||||||
| 137,000 | COMSYS Holdings Corp | 980,823 | |||||||||||||
| 124,600 | Credit Saison Co Ltd | 810,685 | |||||||||||||
| 74,100 | CSK Holdings Corp * | 130,371 | |||||||||||||
| 108,400 | Culture Convenience Club Co Ltd | 747,946 | |||||||||||||
| 447 | CyberAgent Inc | 203,209 | |||||||||||||
| 190 | DA Office Investment Corp | 247,870 | |||||||||||||
| 32,000 | Dai Nippon Printing Co Ltd | 270,419 | |||||||||||||
| 25,800 | Daidoh Ltd | 134,151 | |||||||||||||
| 256,300 | Daiei Inc * | 797,396 | |||||||||||||
| 12,400 | Daiichikosho Co Ltd | 116,076 | |||||||||||||
| 34,000 | Daiken Corp | 57,856 | |||||||||||||
| 983,000 | Daikyo Inc | 433,977 | |||||||||||||
| 39,000 | Daimei Telecom Engineering Corp | 312,744 | |||||||||||||
| 91,000 | Daio Paper Corp | 705,993 | |||||||||||||
| 20,500 | Daiseki Co Ltd | 287,644 | |||||||||||||
| 66,000 | Daishi Bank Ltd (The) | 260,296 | |||||||||||||
| 65,600 | Daito Trust Construction Co Ltd | 2,065,832 | |||||||||||||
| 47,000 | Daiwa House Industry Co Ltd | 308,345 | |||||||||||||
| 558,000 | Daiwa Securities Group Inc | 1,916,790 | |||||||||||||
| 92,600 | DCM Japan Holdings Co Ltd | 421,185 | |||||||||||||
| 97,700 | Don Quijote Co Ltd | 1,152,685 | |||||||||||||
| 23,900 | Doshisha Co Ltd | 267,418 | |||||||||||||
See accompanying notes to the financial statements.
3
GMO Flexible Equities Fund
(A Series of GMO Trust)
Schedule of Investments — (Continued)
(showing percentage of total net assets)
February 28, 2009
| Shares | Description | Value ($) | |||||||||||||
| Japan — continued | |||||||||||||||
| 17,600 | DTS Corp | 112,348 | |||||||||||||
| 201,400 | Edion Corp | 500,557 | |||||||||||||
| 13,000 | Electric Power Development Co Ltd | 415,368 | |||||||||||||
| 23,000 | Ezaki Glico Co Ltd | 210,093 | |||||||||||||
| 58,100 | FamilyMart Co Ltd | 1,959,965 | |||||||||||||
| 117,500 | Fast Retailing Co Ltd | 11,802,880 | |||||||||||||
| 3,000 | FP Corp | 136,525 | |||||||||||||
| 33 | Frontier Real Estate Investment Corp | 157,577 | |||||||||||||
| 1,034,000 | Fuji Electric Holdings Co Ltd | 925,321 | |||||||||||||
| 102,400 | Fuji Oil Co Ltd | 1,287,317 | |||||||||||||
| 18,000 | Fuji Soft Inc | 263,930 | |||||||||||||
| 11,000 | Fujicco Co Ltd | 123,710 | |||||||||||||
| 44,100 | Fuyo General Lease Co Ltd | 515,584 | |||||||||||||
| 863 | Geo Corp | 550,661 | |||||||||||||
| 52 | Global One REIT Co Ltd | 322,570 | |||||||||||||
| 62,700 | GMO internet Inc | 239,407 | |||||||||||||
| 49,220 | Goldcrest Co Ltd | 874,679 | |||||||||||||
| 75 | Gourmet Navigator Inc | 150,059 | |||||||||||||
| 181,000 | GS Yuasa Corp | 743,457 | |||||||||||||
| 23,760 | Gulliver International Co Ltd | 307,640 | |||||||||||||
| 41,400 | H.I.S. Co Ltd | 591,554 | |||||||||||||
| 193,000 | Hachijuni Bank Ltd (The) | 1,066,663 | |||||||||||||
| 13,120 | Hakuhodo DY Holdings Inc | 568,397 | |||||||||||||
| 46,000 | Hankyu Hanshin Holdings Inc | 211,902 | |||||||||||||
| 3,892,000 | Haseko Corp | 1,329,031 | |||||||||||||
| 15,200 | Heiwado Co Ltd | 208,586 | |||||||||||||
| 62,000 | Higashi-Nippon Bank Ltd (The) | 167,072 | |||||||||||||
| 70,900 | Hikari Tsushin Inc | 1,142,403 | |||||||||||||
| 193,000 | Hiroshima Bank Ltd (The) | 720,304 | |||||||||||||
| 206,000 | Hitachi Cable Ltd | 311,827 | |||||||||||||
| 72,600 | Hitachi Capital Corp | 623,496 | |||||||||||||
| 17,000 | Hitachi Software Engineering Co Ltd | 196,624 | |||||||||||||
| 16,900 | Hitachi Systems & Services Ltd | 153,234 | |||||||||||||
| 29,800 | Hitachi Transport System Ltd | 271,679 | |||||||||||||
See accompanying notes to the financial statements.
4
GMO Flexible Equities Fund
(A Series of GMO Trust)
Schedule of Investments — (Continued)
(showing percentage of total net assets)
February 28, 2009
| Shares | Description | Value ($) | |||||||||||||
| Japan — continued | |||||||||||||||
| 21,900 | Hogy Medical Co Ltd | 1,214,729 | |||||||||||||
| 145,100 | Hokkaido Electric Power Co Inc | 3,073,084 | |||||||||||||
| 71,000 | Hokuetsu Bank Ltd (The) | 120,160 | |||||||||||||
| 110,000 | Hokuetsu Paper Mills Ltd | 401,008 | |||||||||||||
| 38,000 | Hokuriku Electric Power Co | 1,007,694 | |||||||||||||
| 29,300 | Hokuto Corp | 571,923 | |||||||||||||
| 82,070 | Honeys Co Ltd | 364,291 | |||||||||||||
| 53,000 | Hyakugo Bank Ltd (The) | 275,870 | |||||||||||||
| 62,000 | Hyakujushi Bank Ltd (The) | 291,731 | |||||||||||||
| 22,000 | IBJ Leasing Co Ltd | 214,522 | |||||||||||||
| 71,000 | Ito En Ltd | 905,335 | |||||||||||||
| 128,000 | Itoham Foods Inc | 373,120 | |||||||||||||
| 20,100 | Itoki Corp | 53,636 | |||||||||||||
| 100,000 | Iyo Bank Ltd (The) | 1,048,883 | |||||||||||||
| 37,200 | Izumi Co Ltd | 387,716 | |||||||||||||
| 76,000 | Izumiya Co Ltd | 378,949 | |||||||||||||
| 170,000 | J-Oil Mills Inc | 454,745 | |||||||||||||
| 202,000 | JACCS Co Ltd * | 341,480 | |||||||||||||
| 8,800 | Jafco Co Ltd | 128,102 | |||||||||||||
| 110 | Japan Retail Fund Investment Corp REIT | 356,060 | |||||||||||||
| 610,200 | Joint Corp | 475,468 | |||||||||||||
| 38,000 | Joshin Denki Co Ltd | 212,265 | |||||||||||||
| 174,100 | JS Group Corp | 1,865,065 | |||||||||||||
| 63,200 | K's Holdings Corp | 755,317 | |||||||||||||
| 56,000 | Kagoshima Bank Ltd (The) | 394,805 | |||||||||||||
| 1,344,000 | Kajima Corp | 2,809,487 | |||||||||||||
| 329 | Kakaku.com Inc | 970,335 | |||||||||||||
| 169,000 | Kamigumi Co Ltd | 1,082,832 | |||||||||||||
| 72,000 | Kandenko Co Ltd | 455,659 | |||||||||||||
| 19,600 | Kansai Electric Power Co Inc | 471,256 | |||||||||||||
| 126,000 | Kansai Urban Banking Corp | 184,221 | |||||||||||||
| 63,500 | Kanto Tsukuba Bank Ltd (The) | 126,798 | |||||||||||||
| 32,000 | Kasumi Co Ltd | 128,240 | |||||||||||||
| 24,700 | Kato Sangyo Co Ltd | 353,005 | |||||||||||||
See accompanying notes to the financial statements.
5
GMO Flexible Equities Fund
(A Series of GMO Trust)
Schedule of Investments — (Continued)
(showing percentage of total net assets)
February 28, 2009
| Shares | Description | Value ($) | |||||||||||||
| Japan — continued | |||||||||||||||
| 60,000 | Keihan Electric Railway Co Ltd | 247,612 | |||||||||||||
| 64,000 | Keihin Electric Express Railway Co Ltd | 450,590 | |||||||||||||
| 41,000 | Keisei Electric Railway Co Ltd | 190,300 | |||||||||||||
| 45,000 | Keiyo Bank Ltd (The) | 206,645 | |||||||||||||
| 39,400 | Keiyo Co Ltd | 207,732 | |||||||||||||
| 7,265 | Kenedix Inc * | 502,250 | |||||||||||||
| 52,000 | Kinden Corp | 365,786 | |||||||||||||
| 202,000 | Kintetsu Corp | 820,296 | |||||||||||||
| 155,000 | Kiyo Holdings Inc | 182,679 | |||||||||||||
| 14,422 | KK daVinci Holdings * | 361,528 | |||||||||||||
| 41,400 | Kohnan Shoji Co Ltd | 384,242 | |||||||||||||
| 30,700 | Kojima Co Ltd | 63,808 | |||||||||||||
| 14,900 | Komeri Co Ltd | 242,905 | |||||||||||||
| 193,000 | Krosaki Harima Corp | 339,344 | |||||||||||||
| 128,000 | Kurabo Industries Ltd | 172,424 | |||||||||||||
| 30,000 | Kyodo Printing Co Ltd | 62,598 | |||||||||||||
| 17,400 | Kyoritsu Maintenance Co Ltd | 300,092 | |||||||||||||
| 125,000 | Kyowa Exeo Corp | 1,022,067 | |||||||||||||
| 43,000 | Kyudenko Corp | 298,342 | |||||||||||||
| 105,900 | Kyushu Electric Power Co Inc | 2,508,003 | |||||||||||||
| 92,100 | Lawson Inc | 3,988,098 | |||||||||||||
| 157,700 | Leopalace21 Corp | 876,058 | |||||||||||||
| 225,000 | Maeda Corp | 688,731 | |||||||||||||
| 62,000 | Maeda Road Construction Co Ltd | 506,255 | |||||||||||||
| 19,200 | Mandom Corp | 325,313 | |||||||||||||
| 67,000 | Marudai Food Co Ltd | 154,661 | |||||||||||||
| 55,000 | Maruetsu Inc (The) * | 253,048 | |||||||||||||
| 590,000 | Maruha Group Inc | 698,945 | |||||||||||||
| 128,400 | Marui Group Co Ltd | 537,834 | |||||||||||||
| 22,000 | Maruzen Showa Unyu Co Ltd | 64,226 | |||||||||||||
| 20,800 | Matsuda Sangyo Co Ltd | 226,159 | |||||||||||||
| 152,700 | Matsui Securities Co Ltd | 872,967 | |||||||||||||
| 14,000 | Matsumotokiyoshi Holdings Co Ltd | 251,389 | |||||||||||||
| 131,800 | Mediceo Paltac Holdings Co Ltd | 1,386,594 | |||||||||||||
See accompanying notes to the financial statements.
6
GMO Flexible Equities Fund
(A Series of GMO Trust)
Schedule of Investments — (Continued)
(showing percentage of total net assets)
February 28, 2009
| Shares | Description | Value ($) | |||||||||||||
| Japan — continued | |||||||||||||||
| 207,000 | Meiji Dairies Corp | 782,410 | |||||||||||||
| 53,000 | Mercian Corp | 80,598 | |||||||||||||
| 198 | MID REIT Inc | 321,549 | |||||||||||||
| 18,200 | Mikuni Coca-Cola Bottling Co Ltd | 133,535 | |||||||||||||
| 8,000 | Ministop Co Ltd | 126,454 | |||||||||||||
| 64,400 | Miraca Holdings Inc | 1,337,938 | |||||||||||||
| 374,000 | Mitsubishi Electric Corp | 1,477,556 | |||||||||||||
| 417,000 | Mitsubishi Paper Mills Ltd | 527,179 | |||||||||||||
| 1,864,400 | Mitsubishi UFJ Financial Group Inc | 8,422,658 | |||||||||||||
| 107,240 | Mitsubishi UFJ Lease & Finance Co Ltd | 1,866,239 | |||||||||||||
| 25,000 | Mitsui Home Co Ltd | 108,108 | |||||||||||||
| 8,019,300 | Mizuho Financial Group Inc | 15,114,698 | |||||||||||||
| 449,000 | Mizuho Investors Securities | 343,531 | |||||||||||||
| 77,000 | Morinaga & Co Ltd | 153,095 | |||||||||||||
| 193,000 | Morinaga Milk Industry Co Ltd | 582,508 | |||||||||||||
| 157,000 | Nankai Electric Railway Co Ltd | 688,643 | |||||||||||||
| 61,000 | Nanto Bank Ltd (The) | 317,888 | |||||||||||||
| 14,800 | NEC Fielding Ltd | 172,733 | |||||||||||||
| 14,300 | NEC Networks & System Integration Corp | 125,900 | |||||||||||||
| 652 | Net One Systems Co Ltd | 915,927 | |||||||||||||
| 427,000 | Nichias Corp | 871,453 | |||||||||||||
| 19,200 | Nichiha Corp | 116,222 | |||||||||||||
| 150,000 | Nichirei Corp | 495,269 | |||||||||||||
| 49,200 | Nihon Unisys Ltd | 345,766 | |||||||||||||
| 94,000 | Nihon Yamamura Glass Co Ltd | 200,809 | |||||||||||||
| 72,000 | Nippon Corp | 576,299 | |||||||||||||
| 47,000 | Nippon Densetsu Kogyo Co Ltd | 454,555 | |||||||||||||
| 365,000 | Nippon Express Co Ltd | 1,049,826 | |||||||||||||
| 124,000 | Nippon Flour Mills Co Ltd | 557,972 | |||||||||||||
| 44,000 | Nippon Konpo Unyu Soko Co Ltd | 373,647 | |||||||||||||
| 152,000 | Nippon Meat Packers Inc | 1,471,386 | |||||||||||||
| 168,200 | Nippon Paper Group Inc | 3,728,529 | |||||||||||||
| 256 | Nippon Residential Investment Corp | 99,882 | |||||||||||||
| 62,600 | Nippon Signal Co Ltd (The) | 317,177 | |||||||||||||
See accompanying notes to the financial statements.
7
GMO Flexible Equities Fund
(A Series of GMO Trust)
Schedule of Investments — (Continued)
(showing percentage of total net assets)
February 28, 2009
| Shares | Description | Value ($) | |||||||||||||
| Japan — continued | |||||||||||||||
| 397,300 | Nippon Suisan Kaisha Ltd | 862,611 | |||||||||||||
| 454,600 | Nippon Telegraph & Telephone Corp | 19,438,450 | |||||||||||||
| 155,000 | Nishi-Nippon City Bank Ltd (The) | 314,748 | |||||||||||||
| 1,279,000 | Nishimatsu Construction Co Ltd | 1,089,249 | |||||||||||||
| 90,700 | Nishimatsuya Chain Co Ltd | 667,574 | |||||||||||||
| 65,000 | Nissay Dowa General Insurance Co Ltd | 271,392 | |||||||||||||
| 32,400 | Nissen Holdings Co Ltd | 141,694 | |||||||||||||
| 20,200 | Nissha Printing Co Ltd | 501,218 | |||||||||||||
| 228,000 | Nisshin Oillio Group Ltd (The) | 1,100,041 | |||||||||||||
| 110,500 | Nisshin Seifun Group Inc | 1,115,449 | |||||||||||||
| 34,000 | Nisshinbo Industries Inc | 242,645 | |||||||||||||
| 26,000 | Nissin Corp | 56,766 | |||||||||||||
| 14,600 | Nissin Foods Holding Co Ltd | 443,212 | |||||||||||||
| 47,350 | Nitori Co Ltd | 2,507,246 | |||||||||||||
| 424,000 | Nitto Boseki Co Ltd | 629,924 | |||||||||||||
| 19,900 | Nitto Kogyo Corp | 145,094 | |||||||||||||
| 6,423 | NTT Docomo Inc | 10,005,880 | |||||||||||||
| 1,024,000 | Obayashi Corp | 4,305,312 | |||||||||||||
| 5,390 | Obic Co Ltd | 711,032 | |||||||||||||
| 86,000 | Odakyu Electric Railway Co Ltd | 635,202 | |||||||||||||
| 33,000 | Oita Bank Ltd (The) | 179,026 | |||||||||||||
| 953,000 | OJI Paper Co Ltd | 3,524,804 | |||||||||||||
| 36,000 | Okamura Corp | 195,824 | |||||||||||||
| 50 | Okinawa Cellular Telephone Co | 89,742 | |||||||||||||
| 14,000 | Okinawa Electric Power Co | 854,938 | |||||||||||||
| 11,000 | Okuwa Co Ltd | 149,437 | |||||||||||||
| 242,700 | OMC Card Inc * | 348,771 | |||||||||||||
| 106,000 | Onward Holdings Co Ltd | 596,672 | |||||||||||||
| 11,700 | Oracle Corp | 365,754 | |||||||||||||
| 774,500 | Orient Corp * | 545,281 | |||||||||||||
| 38,200 | Oriental Land Co Ltd | 2,506,276 | |||||||||||||
| 174,030 | ORIX Corp | 3,535,264 | |||||||||||||
| 363,000 | Osaka Gas Co Ltd | 1,297,907 | |||||||||||||
| 18,000 | Paris Miki Inc | 131,059 | |||||||||||||
See accompanying notes to the financial statements.
8
GMO Flexible Equities Fund
(A Series of GMO Trust)
Schedule of Investments — (Continued)
(showing percentage of total net assets)
February 28, 2009
| Shares | Description | Value ($) | |||||||||||||
| Japan — continued | |||||||||||||||
| 349 | Pasona Group Inc | 183,231 | |||||||||||||
| 437,000 | Penta Ocean Construction Co Ltd * | 523,470 | |||||||||||||
| 30,700 | Pigeon Corp | 593,184 | |||||||||||||
| 126 | PILOT Corp | 143,056 | |||||||||||||
| 35,500 | PLENUS Co Ltd | 496,555 | |||||||||||||
| 39,470 | Point Inc | 1,614,441 | |||||||||||||
| 1,911 | Rakuten Inc | 983,344 | |||||||||||||
| 86,000 | Rengo Co Ltd | 470,266 | |||||||||||||
| 704,800 | Resona Holdings Inc | 12,084,513 | |||||||||||||
| 20,000 | Resorttrust Inc | 174,273 | |||||||||||||
| 27,400 | Ricoh Leasing Co Ltd | 351,863 | |||||||||||||
| 34,700 | Right On Co Ltd | 338,806 | |||||||||||||
| 155,800 | Round One Corp | 903,890 | |||||||||||||
| 48,000 | Ryohin Keikaku Co Ltd | 1,688,974 | |||||||||||||
| 14,500 | Ryoshoku Ltd | 325,888 | |||||||||||||
| 50,000 | Sagami Railway Co Ltd | 201,772 | |||||||||||||
| 11,600 | Saint Marc Holdings Co Ltd | 292,503 | |||||||||||||
| 16,300 | Sakata Seed Corp | 214,088 | |||||||||||||
| 6,800 | San-A Co Ltd | 205,168 | |||||||||||||
| 38,000 | San-In Godo Bank Ltd (The) | 269,921 | |||||||||||||
| 21,600 | Sanei-International Co Ltd | 121,686 | |||||||||||||
| 57,000 | Sanki Engineering | 287,696 | |||||||||||||
| 149,000 | Sankyo-Tateyama Holdings Inc | 92,227 | |||||||||||||
| 213,000 | Sankyu Inc | 555,266 | |||||||||||||
| 27,100 | Sanrio Co Ltd | 255,956 | |||||||||||||
| 185,000 | Sanwa Shutter Corp | 463,023 | |||||||||||||
| 140,000 | Sanyo Shokai Ltd | 424,618 | |||||||||||||
| 8,491 | SBI Holdings Inc | 676,235 | |||||||||||||
| 151,000 | Seiko Holdings Corp | 264,851 | |||||||||||||
| 161,000 | Seino Holdings Co Ltd | 751,465 | |||||||||||||
| 64,400 | Seiren Co Ltd | 293,655 | |||||||||||||
| 257,000 | Sekisui Chemical Co Ltd | 1,093,945 | |||||||||||||
| 257,000 | Sekisui House Ltd | 1,683,843 | |||||||||||||
| 48,000 | Senko Co Ltd | 150,888 | |||||||||||||
See accompanying notes to the financial statements.
9
GMO Flexible Equities Fund
(A Series of GMO Trust)
Schedule of Investments — (Continued)
(showing percentage of total net assets)
February 28, 2009
| Shares | Description | Value ($) | |||||||||||||
| Japan — continued | |||||||||||||||
| 19,900 | Senshukai Co Ltd | 125,888 | |||||||||||||
| 950,900 | Seven & I Holdings Co Ltd | 21,073,691 | |||||||||||||
| 373 | Seven Bank Ltd | 1,023,490 | |||||||||||||
| 38,000 | Shikoku Bank Ltd (The) | 157,020 | |||||||||||||
| 28,800 | Shimamura Co Ltd | 1,486,469 | |||||||||||||
| 376,000 | Shimizu Corp | 1,416,872 | |||||||||||||
| 533,000 | Shinsei Bank Ltd | 469,409 | |||||||||||||
| 62,000 | Shizuoka Gas Co Ltd | 395,202 | |||||||||||||
| 25,400 | SHO-BOND Holdings Co Ltd | 492,691 | |||||||||||||
| 44,000 | Shoei Co Ltd | 177,574 | |||||||||||||
| 35,000 | Showa Sangyo Co Ltd | 99,793 | |||||||||||||
| 105,000 | Snow Brand Milk Products Co Ltd | 282,457 | |||||||||||||
| 15,100 | Sumisho Computer Systems Corp | 162,796 | |||||||||||||
| 563,000 | Sumitomo Electric Industries Ltd | 4,374,845 | |||||||||||||
| 150,800 | Sumitomo Forestry Co Ltd | 877,704 | |||||||||||||
| 412,000 | Sumitomo Osaka Cement Co Ltd | 881,079 | |||||||||||||
| 1,361,000 | Sumitomo Trust & Banking Co Ltd | 4,495,069 | |||||||||||||
| 11,300 | Sundrug Co Ltd | 187,849 | |||||||||||||
| 33,000 | Suruga Bank Ltd | 254,496 | |||||||||||||
| 30,200 | Suzuken Co Ltd | 834,700 | |||||||||||||
| 781,000 | SWCC Showa Holdings Co Ltd | 457,008 | |||||||||||||
| 18,400 | T&D Holdings Inc | 411,811 | |||||||||||||
| 395 | T-Gaia Corp | 412,983 | |||||||||||||
| 101,000 | Taihei Kogyo Co Ltd | 225,836 | |||||||||||||
| 1,674,000 | Taiheiyo Cement Co Ltd | 2,371,257 | |||||||||||||
| 37,600 | Taikisha Ltd | 453,240 | |||||||||||||
| 1,771,000 | Taisei Corp | 3,135,453 | |||||||||||||
| 79,000 | Takara Holdings Inc | 320,287 | |||||||||||||
| 28,000 | Takara Standard Co Ltd | 160,024 | |||||||||||||
| 41,000 | Takasago Thermal Engineering Co Ltd | 223,474 | |||||||||||||
| 158,600 | Takefuji Corp | 523,625 | |||||||||||||
| 163,000 | TOA Corp * | 199,366 | |||||||||||||
| 29,000 | Tochigi Bank Ltd (The) | 144,449 | |||||||||||||
| 49,000 | Toho Bank Ltd (The) | 189,686 | |||||||||||||
See accompanying notes to the financial statements.
10
GMO Flexible Equities Fund
(A Series of GMO Trust)
Schedule of Investments — (Continued)
(showing percentage of total net assets)
February 28, 2009
| Shares | Description | Value ($) | |||||||||||||
| Japan — continued | |||||||||||||||
| 157,000 | Toho Gas Co Ltd | 808,818 | |||||||||||||
| 51,300 | Toho Pharmaceutical Co Ltd | 494,874 | |||||||||||||
| 15,800 | Tohoku Electric Power Co Inc | 369,926 | |||||||||||||
| 226,000 | Tokai Tokyo Securities Co Ltd | 375,869 | |||||||||||||
| 18,050 | Token Corp | 372,781 | |||||||||||||
| 97,500 | Tokio Marine Holdings Inc | 2,214,318 | |||||||||||||
| 921,800 | Tokyo Electric Power Co Inc (The) | 26,022,453 | |||||||||||||
| 1,382,000 | Tokyo Gas Co Ltd | 5,536,216 | |||||||||||||
| 147,000 | Tokyo Tatemono Co Ltd | 324,923 | |||||||||||||
| 30,500 | Tokyo Tomin Bank Ltd (The) | 445,031 | |||||||||||||
| 57,760 | Tokyu Construction Co Ltd | 129,460 | |||||||||||||
| 105,000 | Tokyu Land Corp | 235,747 | |||||||||||||
| 53,200 | Toppan Forms Co Ltd | 574,937 | |||||||||||||
| 125,000 | Toppan Printing Co Ltd | 744,541 | |||||||||||||
| 52,000 | Toshiba Plant Systems & Services Corp | 491,799 | |||||||||||||
| 636,000 | Toyo Construction Co Ltd * | 205,702 | |||||||||||||
| 91,000 | Toyo Securities Co Ltd | 120,852 | |||||||||||||
| 97,000 | Toyo Suisan Kaisha Ltd | 2,295,659 | |||||||||||||
| 469,000 | Toyobo Co Ltd | 630,776 | |||||||||||||
| 18,000 | Uchida Yoko Co Ltd | 51,282 | |||||||||||||
| 12,000 | Unicharm Petcare Corp | 368,728 | |||||||||||||
| 49,300 | United Arrows Ltd | 245,475 | |||||||||||||
| 523,000 | Unitika Ltd | 322,623 | |||||||||||||
| 372,000 | UNY Co Ltd | 2,720,669 | |||||||||||||
| 44,390 | USS Co Ltd | 1,790,761 | |||||||||||||
| 34,400 | Valor Co Ltd | 259,313 | |||||||||||||
| 19,200 | WATAMI Co Ltd | 410,080 | |||||||||||||
| 16,000 | Wood One Co Ltd | 32,906 | |||||||||||||
| 46,700 | Xebio Co Ltd | 701,705 | |||||||||||||
| 11,900 | Yachiyo Bank Ltd (The) | 404,067 | |||||||||||||
| 2,092 | Yahoo Japan Corp | 598,420 | |||||||||||||
| 23,100 | Yakult Honsha Co Ltd | 372,013 | |||||||||||||
| 42,000 | Yamaguchi Financial Group Inc | 366,308 | |||||||||||||
| 142,000 | Yamazaki Baking Co Ltd | 1,789,129 | |||||||||||||
See accompanying notes to the financial statements.
11
GMO Flexible Equities Fund
(A Series of GMO Trust)
Schedule of Investments — (Continued)
(showing percentage of total net assets)
February 28, 2009
| Shares / Par Value ($) | Description | Value ($) | |||||||||||||
| Japan — continued | |||||||||||||||
| 7,000 | Yaoko Co Ltd | 200,875 | |||||||||||||
| 11,000 | Yokohama Reito Co Ltd | 67,367 | |||||||||||||
| 24,500 | Yonekyu Corp | 246,810 | |||||||||||||
| 17,000 | Yurtec Corp | 81,598 | |||||||||||||
| 29,100 | Yusen Air & Sea Service Co Ltd | 298,876 | |||||||||||||
| 56,900 | Zensho Co Ltd | 278,913 | |||||||||||||
| Total Japan | 346,329,272 | ||||||||||||||
| TOTAL COMMON STOCKS (COST $437,751,399) | 346,329,272 | ||||||||||||||
| SHORT-TERM INVESTMENTS — 1.1% | |||||||||||||||
| 800,000 | BNP Paribas Time Deposit, 0.23%, due 03/02/09 | 800,000 | |||||||||||||
| 800,000 | Branch Banking & Trust Time Deposit, 0.13%, due 03/02/09 | 800,000 | |||||||||||||
| 700,000 | HSBC Bank (USA) Time Deposit, 0.19%, due 03/02/09 | 700,000 | |||||||||||||
| 800,000 | Royal Bank of Canada Time Deposit, 0.20%, due 03/02/09 | 800,000 | |||||||||||||
| 36,291 | Royal Bank of Scotland Time Deposit, 0.08%, due 03/02/09 | 36,291 | |||||||||||||
| 800,000 | Societe Generale Time Deposit, 0.25%, due 03/02/09 | 800,000 | |||||||||||||
| TOTAL SHORT-TERM INVESTMENTS (COST $3,936,291) | 3,936,291 | ||||||||||||||
| TOTAL INVESTMENTS — 99.0% (Cost $441,687,690) | 350,265,563 | ||||||||||||||
| Other Assets and Liabilities (net) — 1.0% | 3,588,095 | ||||||||||||||
| TOTAL NET ASSETS — 100.0% | $ | 353,853,658 | |||||||||||||
Notes to Schedule of Investments:
REIT - Real Estate Investment Trust
* Non-income producing security.
See accompanying notes to the financial statements.
12
GMO Flexible Equities Fund
(A Series of GMO Trust)
Statement of Assets and Liabilities — February 28, 2009
| Assets: | |||||||
| Investments, at value (cost $441,687,690) (Note 2) | $ | 350,265,563 | |||||
| Foreign currency, at value (cost $12,089) (Note 2) | 11,700 | ||||||
| Receivable for investments sold | 5,313 | ||||||
| Receivable for Fund shares sold | 3,000,000 | ||||||
| Dividends and interest receivable | 859,940 | ||||||
| Receivable for expenses reimbursed by Manager (Note 3) | 66,164 | ||||||
| Total assets | 354,208,680 | ||||||
| Liabilities: | |||||||
| Payable to affiliate for (Note 3): | |||||||
| Management fee | 155,514 | ||||||
| Shareholder service fee | 18,947 | ||||||
| Trustees and Chief Compliance Officer of GMO Trust fees | 868 | ||||||
| Accrued expenses | 179,693 | ||||||
| Total liabilities | 355,022 | ||||||
| Net assets | $ | 353,853,658 | |||||
| Net assets consist of: | |||||||
| Paid-in capital | $ | 446,246,527 | |||||
| Distributions in excess of net investment income | (932,281 | ) | |||||
| Accumulated net realized loss | (14,250 | ) | |||||
| Net unrealized depreciation | (91,446,338 | ) | |||||
| $ | 353,853,658 | ||||||
| Net assets attributable to: | |||||||
| Class III shares | $ | 43,788,134 | |||||
| Class VI shares | $ | 310,065,524 | |||||
| Shares outstanding: | |||||||
| Class III | 2,845,402 | ||||||
| Class VI | 20,142,389 | ||||||
| Net asset value per share: | |||||||
| Class III | $ | 15.39 | |||||
| Class VI | $ | 15.39 | |||||
See accompanying notes to the financial statements.
13
GMO Flexible Equities Fund
(A Series of GMO Trust)
Statement of Operations — Period from December 12, 2008
(commencement of operations) through February 28, 2009
| Investment Income: | |||||||
| Dividends (net of withholding taxes of $66,715) | $ | 886,362 | |||||
| Interest | 5,620 | ||||||
| Total investment income | 891,982 | ||||||
| Expenses: | |||||||
| Management fee (Note 3) | 378,481 | ||||||
| Shareholder service fee – Class III (Note 3) | 13,367 | ||||||
| Shareholder service fee – Class VI (Note 3) | 32,947 | ||||||
| Custodian and fund accounting agent fees | 102,570 | ||||||
| Transfer agent fees | 8,736 | ||||||
| Audit and tax fees | 62,088 | ||||||
| Legal fees | 2,134 | ||||||
| Trustees fees and related expenses (Note 3) | 1,162 | ||||||
| Registration fees | 3,108 | ||||||
| Miscellaneous | 2,358 | ||||||
| Total expenses | 606,951 | ||||||
| Fees and expenses reimbursed by Manager (Note 3) | (180,164 | ) | |||||
| Net expenses | 426,787 | ||||||
| Net investment income (loss) | 465,195 | ||||||
| Realized and unrealized gain (loss): | |||||||
| Net realized gain (loss) on: | |||||||
| Investments | 1,204,865 | ||||||
| Closed futures contracts | 589,657 | ||||||
| Foreign currency, forward contracts and foreign currency related transactions | (3,171,152 | ) | |||||
| Net realized gain (loss) | (1,376,630 | ) | |||||
| Change in net unrealized appreciation (depreciation) on: | |||||||
| Investments | (91,422,127 | ) | |||||
| Foreign currency, forward contracts and foreign currency related transactions | (24,211 | ) | |||||
| Net unrealized gain (loss) | (91,446,338 | ) | |||||
| Net realized and unrealized gain (loss) | (92,822,968 | ) | |||||
| Net increase (decrease) in net assets resulting from operations | $ | (92,357,773 | ) | ||||
See accompanying notes to the financial statements.
14
GMO Flexible Equities Fund
(A Series of GMO Trust)
Statement of Changes in Net Assets
| Period from December 12, 2008 (commencement of operations) through February 28, 2009 | |||||||
| Increase (decrease) in net assets: | |||||||
| Operations: | |||||||
| Net investment income (loss) | $ | 465,195 | |||||
| Net realized gain (loss) | (1,376,630 | ) | |||||
| Change in net unrealized appreciation (depreciation) | (91,446,338 | ) | |||||
| Net increase (decrease) in net assets from operations | (92,357,773 | ) | |||||
| Distributions to shareholders from: | |||||||
| Net investment income | |||||||
| Class III | (2,863 | ) | |||||
| Class VI | (32,233 | ) | |||||
| Total distributions from net investment income | (35,096 | ) | |||||
| Net share transactions (Note 7): | |||||||
| Class III | 55,644,468 | ||||||
| Class VI | 390,602,059 | ||||||
| Increase (decrease) in net assets resulting from net share transactions | 446,246,527 | ||||||
| Total increase (decrease) in net assets | 353,853,658 | ||||||
| Net assets: | |||||||
| Beginning of period | — | ||||||
| End of period (including distributions in excess of net investment income of $932,281) | $ | 353,853,658 | |||||
See accompanying notes to the financial statements.
15
GMO Flexible Equities Fund
(A Series of GMO Trust)
Financial Highlights
(For a Class III share outstanding throughout the period)
| Period from December 12, 2008 (commencement of operations) through February 28, 2009 | |||||||
| Net asset value, beginning of period | $ | 20.00 | |||||
| Income (loss) from investment operations: | |||||||
| Net investment income (loss)† | 0.02 | ||||||
| Net realized and unrealized gain (loss) | (4.63 | ) | |||||
| Total from investment operations | (4.61 | ) | |||||
| Less distributions to shareholders: | |||||||
| From net investment income | (0.00 | )(a) | |||||
| Total distributions | (0.00 | ) | |||||
| Net asset value, end of period | $ | 15.39 | |||||
| Total Return(b) | (23.04 | )%** | |||||
| Ratios/Supplemental Data: | |||||||
| Net assets, end of period (000's) | $ | 43,788 | |||||
| Net expenses to average daily net assets | 0.70 | %* | |||||
| Net investment income to average daily net assets | 0.56 | %* | |||||
| Portfolio turnover rate | 7 | %** | |||||
| Fees and expenses reimbursed by the Manager to average daily net assets: | 0.26 | %* | |||||
(a) Distributions from net investment income were less than $0.01 per share.
(b) The total returns would have been lower had certain expenses not been reimbursed during the periods shown and assumes the effect of reinvested distributions.
† Calculated using average shares outstanding throughout the period.
* Annualized.
** Not annualized.
See accompanying notes to the financial statements.
16
GMO Flexible Equities Fund
(A Series of GMO Trust)
Financial Highlights
(For a Class VI share outstanding throughout the period)
| Period from December 12, 2008 (commencement of operations) through February 28, 2009 | |||||||
| Net asset value, beginning of period | $ | 20.00 | |||||
| Income (loss) from investment operations: | |||||||
| Net investment income (loss)† | 0.03 | ||||||
| Net realized and unrealized gain (loss) | (4.64 | ) | |||||
| Total from investment operations | (4.61 | ) | |||||
| Less distributions to shareholders: | |||||||
| From net investment income | (0.00 | )(a) | |||||
| Total distributions | (0.00 | ) | |||||
| Net asset value, end of period | $ | 15.39 | |||||
| Total Return(b) | (23.04 | )%** | |||||
| Ratios/Supplemental Data: | |||||||
| Net assets, end of period (000's) | $ | 310,066 | |||||
| Net expenses to average daily net assets | 0.61 | %* | |||||
| Net investment income to average daily net assets | 0.69 | %* | |||||
| Portfolio turnover rate | 7 | %** | |||||
| Fees and expenses reimbursed by the Manager to average daily net assets: | 0.26 | %* | |||||
(a) Distributions from net investment income were less than $0.01 per share.
(b) The total returns would have been lower had certain expenses not been reimbursed during the periods shown and assumes the effect of reinvested distributions.
† Calculated using average shares outstanding throughout the period.
* Annualized.
** Not annualized.
See accompanying notes to the financial statements.
17
GMO Flexible Equities Fund
(A Series of GMO Trust)
Notes to Financial Statements
February 28, 2009
1. Organization
GMO Flexible Equities Fund (the "Fund"), which commenced operations on December 12, 2008, is a series of GMO Trust (the "Trust"). The Fund is registered under the Investment Company Act of 1940, as amended, as an open-end, non-diversified management investment company. The Fund is advised and managed by Grantham, Mayo, Van Otterloo & Co. LLC (the "Manager" or "GMO"). The Trust was established as a Massachusetts business trust under the laws of The Commonwealth of Massachusetts on June 24, 1985. The Declaration of Trust permits the Trustees of the Trust ("Trustees") to create an unlimited number of series of shares ("Funds") and to subdivide Funds into classes.
The Fund seeks total return in excess of that of its benchmark, the MSCI World Index. The Fund typically makes equity investments in companies from the world's developed markets, including the U.S.
For the period December 12, 2008 through February 28, 2009, the Fund had two classes of shares outstanding: Class III and Class VI. Each class of shares bears a different level of shareholder service fees.
Shares of the Fund are not publicly offered and are principally available only to other funds of the Trust and certain accredited investors as part of a broader asset allocation strategy offered by GMO.
The Fund currently limits subscriptions due to capacity considerations.
2. Significant accounting policies
The following is a summary of significant accounting policies followed by the Fund in the preparation of its financial statements. These policies are in conformity with accounting principles generally accepted in the United States of America ("U.S. GAAP") and have been consistently followed by the Fund in preparing its financial statements. The preparation of financial statements in accordance with U.S. GAAP requires management to make estimates and assumptions that affect the reported amounts and disclosures in the financial statements. Actual results could differ from those estimates. The accounting records of the Fund are maintained in U.S. dollars.
Portfolio valuation
Securities listed on a securities exchange for which market quotations are readily available are valued at the last sale price or official closing price on each business day, or if there is no such reported sale or official closing price, at the most recent quoted bid price. Unlisted securities for which market quotations are readily available are generally valued at the most recent quoted bid price. Debt instruments with a remaining maturity of sixty days or less are generally valued at amortized cost, which approximates fair value. Shares of investment funds are generally valued at their net asset value. Securities for which quotations are not readily available or whose values the Manager has determined to be unreliable are valued at fair value as determined in good faith by the Trustees or persons acting at their direction
18
GMO Flexible Equities Fund
(A Series of GMO Trust)
Notes to Financial Statements — (Continued)
February 28, 2009
pursuant to procedures approved by the Trustees. By its nature, a fair value price is a good faith estimate of the value of a security at a given point in time and may not reflect the value that would be realized if the security were sold. The difference between a fair value price and the value realized upon a sale could be material. Because many foreign equity securities markets and exchanges close prior to the close of the New York Stock Exchange ("NYSE"), closing prices for foreign securities in those markets or on those exchanges do not reflect the events that occur after that close but before the close of the NYSE. As a result, the Fund generally values foreign equity securities using fair value prices, which are based on adjustments to closing prices supplied by a third party vendor based on that vendor's proprietary models. As of February 28, 2009, 97.87% of the net assets of the Fund were valued using fair value prices b ased on models used by a third party vendor.
In September 2006, the Financial Accounting Standards Board ("FASB") issued Statement of Financial Accounting Standards No. 157, Fair Value Measurements ("SFAS 157"). SFAS 157 is effective for the Fund's current fiscal year. While the adoption of SFAS 157 does not have an effect on the Fund's net asset value, it does require additional disclosures about fair value measurements. SFAS 157 establishes a three-level hierarchy for disclosure of fair value measurements. The valuation hierarchy is based upon the reliability of inputs to the valuation of the Fund's investments. The three levels are defined as follows:
Level 1 – Valuations based on quoted prices for identical securities in active markets.
Level 2 – Valuations determined using other significant direct or indirect observable inputs.
Level 3 – Valuations based on inputs that are unobservable and significant.
The inputs or methodology used for valuing securities are not necessarily an indication of the risk associated with investing in those securities.
The following is a summary of the fair valuations according to inputs used as of February 28, 2009 in valuing the Fund's investments:
| Asset Valuation Inputs | Investments in Securities | Other Financial Instruments | |||||||||
| Level 1 - Quoted Prices | $ | 3,936,291 | $ | — | |||||||
| Level 2 - Other Significant Observable Inputs | 346,329,272 | — | |||||||||
| Level 3 - Significant Unobservable Inputs | — | — | |||||||||
| Total | $ | 350,265,563 | $ | — | |||||||
19
GMO Flexible Equities Fund
(A Series of GMO Trust)
Notes to Financial Statements — (Continued)
February 28, 2009
| Liability Valuation Inputs | Investments in Securities | Other Financial Instruments | |||||||||
| Level 1 - Quoted Prices | $ | — | $ | — | |||||||
| Level 2 - Other Significant Observable Inputs | — | — | |||||||||
| Level 3 - Significant Unobservable Inputs | — | — | |||||||||
| Total | $ | — | $ | — | |||||||
The Fund held no investments or other financial instruments at February 28, 2009, whose fair value was determined using Level 3 inputs.
Foreign currency translation
The market values of foreign securities, currency holdings and related assets and liabilities are translated to U.S. dollars based on the 4 p.m. New York time exchange rates each business day. Income and expenses denominated in foreign currencies are translated at the 4 p.m. New York time exchange rates on the business day the income and expenses are accrued or incurred. The Fund does not isolate realized and unrealized gains and losses attributable to changes in exchange rates from gains and losses that arise from changes in the market value of investments. Such fluctuations are included with net realized and unrealized gain or loss on investments. Net realized gains and losses on foreign currency transactions represent gains and losses on disposition of currencies and forward currency contracts, currency gains and losses realized between the trade and settlement dates on securities transactions, and the difference between the amount of investment income and foreign withholding taxes recorded on the Fund's accounting records and the U.S. dollar equivalent amounts actually received or paid.
Forward currency contracts
The Fund may enter into forward currency contracts including forward cross currency contracts. A forward currency contract is an agreement between two parties to buy and sell a currency at a set price on a future date. The market value of a forward currency contract fluctuates with changes in forward currency exchange rates. Forward currency contracts are marked to market daily using rates supplied by a quotation service and changes in value are recorded by the Fund as an unrealized gain or loss. Realized gains or losses equal to the difference between the value of the contract at the time it was opened and the value at the time it was closed are recorded upon delivery or receipt of the currency or, if a forward currency contract is offset by entering into another forward currency contract with the same broker, upon settlement of the net gain or loss. These contracts may involve market risk in excess of the unrealized gain or lo ss reflected in the Fund's Statement of Assets and Liabilities. They expose the Fund to the risk of unfavorable movements in currency values and the risk that the counterparty will be unable or unwilling to meet the terms of the contracts. The Fund had no forward currency contracts outstanding at the end of the period.
Futures contracts
The Fund may purchase and sell futures contracts. Upon entering into a futures contract, the Fund is required to deposit cash, U.S. government and agency obligations, or other liquid assets with the futures clearing broker in accordance with the initial margin requirements of the broker or exchange. In addition,
20
GMO Flexible Equities Fund
(A Series of GMO Trust)
Notes to Financial Statements — (Continued)
February 28, 2009
the Fund maintains cash or securities in an amount that at least equals the net amount payable in the event the Fund must deliver the full amount of the contract. Futures contracts are marked to market daily and an appropriate payable or receivable for the change in value ("variation margin") is recorded by the Fund. The payable or receivable is settled on the following business day. Gains or losses are recognized but not considered realized until the contracts expire or are closed. Futures contracts involve, to varying degrees, risk of loss in excess of the variation margin disclosed in the Statement of Assets and Liabilities. Under some circumstances, futures exchanges may establish daily limits on the amount that the price of a futures contract can vary from the previous day's settlement price, thereby effectively preventing liquidation of unfavorable positions. Losses may arise from changes in the value of the underlying ins trument if the Fund is unable to liquidate a futures position due to an illiquid secondary market for the contract or the imposition of price limits, or if counterparties do not perform under the contract terms. Futures contracts are generally valued at the settlement price established each day by the board of trade or exchange on which they are traded. Because many foreign exchanges close prior to the close of the New York Stock Exchange ("NYSE"), closing prices for foreign futures in those markets or on those markets or on those exchanges do not reflect the events that occur after that close but before the close of the NYSE. As a result, the Fund generally values foreign futures using fair value prices, which are based on adjustments to closing prices supplied by a third party vendor based on that vendor's proprietary models. The Fund had no futures contracts outstanding at the end of the period.
Options
The Fund may write (i.e., sell) call and put options. Writing options alters the Fund's exposure to the underlying instrument by, in the case of a call option, obligating the Fund to sell the underlying instrument at a set price to the option-holder and, in the case of a put option, obligating the Fund to purchase the underlying instrument at a set price from the option-holder. In the case of an index option, settlement will be in cash. When the Fund writes a call or put option, an amount equal to the premium received is recorded as a liability and subsequently marked to market to reflect the current value of the option written. Premiums received from writing options that expire are treated as realized gains. Premiums received from writing options that are exercised or closed are deducted from the amounts paid on the underlying future, security or currency transaction to determine the realized gain or loss. The Fund as a writer of an option has no control over whether the underlying future, security or currency may be sold (call) or purchased (put) and as a result bears the market risk of an unfavorable change in the price of the future, security or currency underlying the option. In the event that the Fund writes uncovered put or call options (i.e. options for investments that the Fund does not own), it bears the risk of substantial losses if the price of the underlying instrument increases during the term of the option. Options expose the Fund to the risk the Fund may not be able to enter into a closing transaction because of an illiquid market. The Fund had no open written option contracts during the period.
The Fund may also purchase put and call options. Purchasing options alters the Fund's exposure to the underlying instrument by, in the case of a call option, entitling the Fund to purchase the underlying instrument at a set price from the writer of the option and, in the case of a put option, entitling the Fund to sell the underlying instrument at a set price to the writer of the option. The Fund pays a premium for a
21
GMO Flexible Equities Fund
(A Series of GMO Trust)
Notes to Financial Statements — (Continued)
February 28, 2009
purchased option. That premium is disclosed in the Schedule of Investments and is subsequently marked to market to reflect the current value of the option. Premiums paid for purchasing options that expire are treated as realized losses. Premiums paid for purchasing options that are exercised or closed are deducted from the proceeds on the closing transaction to determine the realized gain or loss. The risk associated with purchasing put and call options is limited to the premium paid. The Fund had no purchased option contracts outstanding at the end of the period.
The Fund values exchange traded options at the last sale price, or if no sale is reported, the last bid price for options it has purchased and the last ask price for options it has written. The Fund values options traded over-the-counter using inputs provided by primary pricing sources and industry standard models.
Swap agreements
The Fund may enter into various types of swap agreements, including without limitation, interest rate, total return, credit default and variance swap agreements. A swap agreement is an agreement to exchange the return generated by one instrument for the return generated by another instrument. When entering into a swap agreement, the Fund and/or the swap counterparty may post or receive cash or securities as collateral. The party posting the collateral typically receives the interest associated with or payments related to the collateral and has the risk of loss related to the collateral.
Interest rate swap agreements involve an exchange by the parties of their respective commitments to pay or right to receive interest, e.g., an exchange of floating rate interest payments for fixed rate interest payments with respect to the notional amount of principal.
Total return swap agreements involve a commitment by one party to pay interest to the other party in exchange for a payment to it from the other party based on the return of a reference instrument (e.g., a security or basket of securities), both based on notional amounts. To the extent the return of the reference instrument exceeds or falls short of the interest payments, one party will receive a payment from or make a payment to the other party.
In a credit default swap agreement, one party makes payments to another party in exchange for the right to receive a specified return if a credit event occurs with respect to a referenced entity or entities. Buying credit default protection reduces the buyer's exposure in the event of an issuer's default (e.g., it reduces risk where a party owns a security issued by or otherwise has exposure to the issuer). Selling credit default protection subjects the seller to exposure to an issuer's default. A seller of credit default protection receives payments in return for its obligation to pay the principal amount of a debt security (or other agreed-upon value) to the other party upon the occurrence of a credit event (e.g., issuer default or similar event). If no credit event occurs, the seller has no payment obligations. For credit default swap agreements on asset-backed securities, a credit event may be triggered by such events as the issuer's failure to pay interest or principal, an agreement of the holders of an asset-backed security to a maturity extension, a rating downgrade on the security or a write-down on the collateral underlying the security. For credit default swap agreements on corporate or sovereign issuers, a credit event may be triggered by such events as the issuer's bankruptcy, failure to pay interest or principal, repudiation/moratorium or restructuring.
22
GMO Flexible Equities Fund
(A Series of GMO Trust)
Notes to Financial Statements — (Continued)
February 28, 2009
Variance swap agreements involve an agreement by two parties to exchange cash flows based on the measured variance (or square of volatility) of a specified underlying asset. One party agrees to exchange a "fixed rate" or strike price payment for the "floating rate" or realized price variance on the underlying asset with respect to the notional amount. At inception, the strike price chosen is generally fixed at a level such that the fair value of the swap is zero. At the expiration date, the amount paid by one party to the other is the difference between the realized price variance of the underlying asset and the strike price multiplied by the notional amount. A receiver of the realized price variance would receive a payment when the realized price variance of the underlying asset is greater than the strike price and would make a payment when that variance is less than the strike price. A payer of the realized price variance woul d make a payment when the realized price variance of the underlying asset is greater than the strike price and would receive a payment when that variance is less than the strike price. This type of agreement is essentially a forward contract on the future realized price variance of the underlying asset.
The Fund prices its swap agreements daily using models that may incorporate quotations from market makers and records the change in value, if any, as unrealized gain or loss in the Statement of Operations. Payments received or made on swap agreements are recorded as realized gain or loss in the Statement of Operations. Gains or losses are realized upon termination of the swap agreements.
Swap agreements often are not actively traded on financial markets. The values assigned to them may differ significantly from the values that would be realized upon termination, and the differences could be material. Entering into swap agreements involves credit, legal, market and documentation risk that is not reflected in the amounts reported in the Statement of Assets and Liabilities. Such risks include the possibility that the party with whom the Fund contracts may default on its obligations to perform or disagree as to the meaning of contractual terms, or that the collateral that party posts may be insufficient or not timely received by the Fund. Credit risk may be particularly acute in an environment where financial services firms are exposed to systemic risks of the type evidenced by the insolvency of Lehman Brothers and subsequent market disruptions. The Fund had no swap agreements outstanding at the end of the period.
Repurchase agreements
The Fund may enter into repurchase agreements. Under a repurchase agreement the Fund acquires a security for cash and obtains a simultaneous commitment from the seller to repurchase the security at an agreed upon price and date. The Fund, through its custodian, takes possession of securities collateralizing the repurchase agreement. The collateral is marked to market daily to ensure that the market value of the underlying assets is at least equal to the amount owed to the Fund in the event of default by the seller. If the seller of a repurchase agreement defaults or enters into insolvency proceedings and the value of the collateral declines, the Fund's recovery of cash may be delayed or limited. The Fund had no repurchase agreements outstanding at the end of the period.
23
GMO Flexible Equities Fund
(A Series of GMO Trust)
Notes to Financial Statements — (Continued)
February 28, 2009
Securities lending
The Fund may lend its securities to qualified brokers. The loans are collateralized with cash or liquid securities with a market value at least equal to the market value of the securities upon entering into the loan. As with other extensions of credit, the Fund may bear the risk of loss with respect to the investment of the collateral, the risk of delay in and/or inability to exercise its rights with respect to the collateral, and the risk of delay in recovery or loss of rights in the loaned securities should the borrower of the securities fail financially. If a loan is collateralized by U.S. government securities, the Fund receives a fee from the borrower. If a loan is collateralized by cash, the Fund typically invests the cash collateral for its own account. For the period from December 12, 2008 through February 28, 2009, the Fund did not participate in securities lending.
Taxes and distributions
The Fund intends to qualify each tax year as a regulated investment company under Subchapter M of the Internal Revenue Code of 1986, as amended (the "Code"). The Fund intends to distribute substantially all of its net investment income and all of its net realized short-term and long-term capital gain, if any, after giving effect to any available capital loss carryforwards for U.S. federal income tax purposes. Therefore, no provision for U.S. federal income or excise tax is necessary. Taxes on foreign interest and dividend income are generally withheld in accordance with the applicable country's tax treaty with the United States. The foreign withholding rates applicable to a Fund's investments in certain foreign jurisdictions may be higher if a significant portion of the Fund is held by non-U.S. shareholders.
The Fund's policy is to declare and pay distributions from net investment income, if any, semiannually, and from net realized short-term and long-term capital gain, if any, at least annually. All distributions are paid in shares of the Fund, at net asset value, unless the shareholder elects to receive cash distributions. Distributions to shareholders are recorded by the Fund on the ex-dividend date.
Foreign taxes paid by the Fund may be treated, to the extent permissible under the Code and if the Fund so elects, as if paid by the shareholders of the Fund.
The Fund may be subject to capital gains and repatriation taxes imposed by certain countries in which it invests.
Income and capital gain distributions are determined in accordance with U.S. federal income tax regulations, which may differ from U.S. GAAP. Certain capital accounts in the financial statements are periodically adjusted for permanent differences in order to reflect their tax character. These adjustments have no impact on net assets or net asset value per share. Temporary differences that arise from recognizing certain items of income, expense, gain or loss in different periods for financial statement and tax purposes will reverse at some time in the future. Distributions in excess of net investment income or net realized gains are temporary over-distributions for financial statement purposes resulting from differences in the recognition or classification of income or distributions for financial statement and tax purposes.
24
GMO Flexible Equities Fund
(A Series of GMO Trust)
Notes to Financial Statements — (Continued)
February 28, 2009
U.S. GAAP and tax accounting differences primarily relate to net operating losses, foreign currency transactions, and post-October currency losses.
The following reclassification represents the amount necessary to report the stated components of net assets on a tax basis, excluding certain temporary differences, as of February 28, 2009, the financial highlights exclude these adjustments.
| Distributions In Excess of Net Investment Income | Accumulated Net Realized Loss | Paid-in Capital | |||||||||
| $ | (1,362,380 | ) | $ | 1,362,380 | $ | — | |||||
The tax character of distributions declared to shareholders is as follows:
| 2/28/2009 | |||||||
| Ordinary income (including any net short-term capital gain) | $ | 35,096 | |||||
| Total distributions | $ | 35,096 | |||||
Distributions in excess of tax basis earnings and profits, if significant, are reported in the financial statements as a return of capital for tax purposes.
As of February 28, 2009, the Fund elected to defer to March 1, 2009 post-October currency losses of $932,281.
As of February 28, 2009, the approximate cost for U.S. federal income tax purposes and gross and net unrealized appreciation (depreciation) in value of investments were as follows:
| Aggregate Cost | Gross Unrealized Appreciation | Gross Unrealized (Depreciation) | Net Unrealized Appreciation (Depreciation) | ||||||||||||
| $ | 441,701,941 | $ | 1,771,199 | $ | (93,207,577 | ) | $ | (91,436,378 | ) | ||||||
The Fund is subject to the provisions of Financial Accounting Standards Board Interpretation No. 48 ("FIN 48"), Accounting for Uncertainty in Income Taxes — an Interpretation of FASB Statement No. 109. FIN 48 sets forth a minimum threshold for financial statement recognition of a tax position taken or expected to be taken in a tax return that could affect the Fund's financial statements. The Fund did not have any unrecognized tax benefits or liabilities at February 28, 2009, nor did it have any increases or decreases in unrecognized tax benefits or liabilities for the period then ended. The Fund is subject to examination prior to the expiration of the statute of limitations by U.S. federal and state tax authorities for tax returns filed.
25
GMO Flexible Equities Fund
(A Series of GMO Trust)
Notes to Financial Statements — (Continued)
February 28, 2009
Security transactions and related investment income
Security transactions in the financial statements are accounted for on the trade date. Dividend income, net of applicable foreign withholding taxes, if any, is recorded on the ex-dividend date or, if later, when the Fund is informed of the ex-dividend date. Interest income is recorded on the accrual basis and is adjusted for the amortization of premiums and accretion of discounts. Principal on inflation indexed securities is adjusted for inflation and any increase or decrease is recorded as interest income or loss. Income is not recognized on securities for which collection is not expected. Non-cash dividends, if any, are recorded at the fair market value of the asset received. In determining the net gain or loss on securities sold, the Fund uses the identified cost basis for the purposes of determining the cost basis.
Expenses
The majority of the expenses of the Trust are directly identifiable to an individual fund. Expenses that are not readily identifiable to a specific fund are allocated taking into consideration, among other things, the nature and type of expense and the relative size of the funds. Investment income, common expenses and realized and unrealized gains and losses are allocated pro rata among the classes of shares of the Fund based on the relative net assets of each class. Shareholder service fees, which are directly attributable to a class of shares, are charged to that class's operations.
Brown Brothers Harriman & Co. ("BBH") serves as custodian and fund accounting agent of the Fund. State Street Bank and Trust Company ("State Street") serves as transfer agent of the Fund. BBH and State Street's fees may be reduced by an earnings allowance calculated on the average daily cash balances the Fund maintains with each agent. The Fund receives the benefit of the earnings allowance. In addition, Goldman Sachs Agency Lending, the Fund's securities lending agent, has agreed to reimburse the Fund for certain transactional expenses related to securities lending activity. Credit balances or expense reimbursements used to reduce fees, if any, are reported as a reduction of expenses in the Statement of Operations.
Investment risks
The Fund is subject to risks involved in investing in foreign securities that are not presented by investments in U.S. securities. These risks may involve adverse political and economic developments, including expropriation and the possible imposition of capital controls or other foreign governmental laws or restrictions. In addition, the securities of some foreign companies and securities markets are less liquid and at times may be more volatile than securities of comparable U.S. companies and U.S. securities markets.
Recently issued accounting pronouncement
In March 2008, FASB issued Statement of Financial Accounting Standards No. 161, Disclosures about Derivative Instruments and Hedging Activities ("SFAS 161"). SFAS 161 is effective for fiscal years and interim periods beginning after November 15, 2008. SFAS 161 requires enhanced disclosures about the Fund's derivative and hedging activities. The Manager is currently evaluating the impact the adoption of SFAS 161 will have on the Fund's financial statement disclosures.
26
GMO Flexible Equities Fund
(A Series of GMO Trust)
Notes to Financial Statements — (Continued)
February 28, 2009
3. Fees and other transactions with affiliates
GMO receives a management fee for the services it provides to the Fund. That fee is paid monthly at the annual rate of 0.55% of average daily net assets. The Fund has adopted a Shareholder Service Plan under which the Fund pays GMO a shareholder service fee for client and shareholder service, reporting, and other support. Pursuant to the Shareholder Service Plan, the shareholder service fee is calculated based on average daily net assets of each class at the annual rate of 0.15% for Class III shares and 0.055% for Class VI shares.
Through at least June 30, 2009, the Manager has contractually agreed to reimburse the Fund for Fund expenses incurred through that date to the extent the Fund's total annual operating expenses (excluding "Excluded Expenses", as defined below) exceed 0.55% of the Fund's average daily net assets. Excluded Expenses include shareholder service fees, fees and expenses of the independent Trustees of the Trust, fees and expenses for legal services not approved by the Manager for the Trust, compensation and expenses of the Trust's Chief Compliance Officer ("CCO") (excluding any employee benefits), brokerage commissions, securities lending fees and expenses, interest expense, transfer taxes, and other investment-related costs (including expenses associated with investments in any company that is an investment company or would be an investment company under the 1940 Act, but for the exceptions to the definition of investment company provi ded in Section 3(c)(1) and 3(c)(7) of the 1940 Act), hedging transaction fees, extraordinary, non-recurring and certain other unusual expenses (including taxes).
The Fund's portion of the fees paid by the Trust to the Trust's independent Trustees and CCO during the period ended February 28, 2009, was $800 and $830, respectively. The compensation and expenses of the CCO are included in miscellaneous expenses in the Statement of Operations. The Fund paid no remuneration to any other officer of the Trust.
4. Purchases and sales of securities
Cost of purchases and proceeds from sales of securities, excluding short-term investments, for the period ended February 28, 2009 aggregated $457,384,529 and $20,837,995, respectively.
5. Guarantees
In the normal course of business the Fund enters into contracts with third-party service providers that contain a variety of representations and warranties and that provide general indemnifications. The Fund's maximum exposure under these arrangements is unknown, as it involves future claims that may be made against the Fund that have not yet occurred. Based on experience, management is of the view that the risk of loss in connection with its indemnification obligations is remote; however, there can be no assurance that such obligations will not result in material liabilities that adversely affect the Fund.
27
GMO Flexible Equities Fund
(A Series of GMO Trust)
Notes to Financial Statements — (Continued)
February 28, 2009
6. Principal shareholders and related parties
As of February 28, 2009, 68.52% of the outstanding shares of the Fund were held by three shareholders, each holding more than 10% of the Fund's outstanding shares. On that date, no other shareholders owned more than 10% of the outstanding shares of the Fund. Redemptions from (or investments into) the Fund by or on behalf of these large shareholders may have a material effect on the Fund.
As of February 28, 2009, no shares of the Fund were held by senior management of the Manager and GMO Trust officers and all of the Fund's shares were held by accounts for which the Manager had investment discretion.
7. Share transactions
The Declaration of Trust permits the Trust to issue an unlimited number of shares of beneficial interest (without par value). Transactions in Fund shares were as follows:
| Period from December 12, 2008, (commencement of operations) through February 28, 2009 | |||||||||||
| Class III: | Shares | Amount | |||||||||
| Shares sold | 2,853,090 | $ | 55,792,551 | ||||||||
| Shares issued to shareholders in reinvestment of distributions | 92 | 1,917 | |||||||||
| Shares repurchased | (7,780 | ) | (150,000 | ) | |||||||
| Net increase (decrease) | 2,845,402 | $ | 55,644,468 | ||||||||
| Period from December 12, 2008, (commencement of operations) through February 28, 2009 | |||||||||||
| Class VI: | Shares | Amount | |||||||||
| Shares sold | 20,213,445 | $ | 392,035,724 | ||||||||
| Shares issued to shareholders in reinvestment of distributions | 1,571 | 32,233 | |||||||||
| Shares repurchased | (72,627 | ) | (1,465,898 | ) | |||||||
| Net increase (decrease) | 20,142,389 | $ | 390,602,059 | ||||||||
28
Report of Independent Registered Public Accounting Firm
To the Trustees of GMO Trust and the Shareholders of
GMO Flexible Equities Fund:
In our opinion, the accompanying statement of assets and liabilities, including the schedule of investments, and the related statements of operations and of changes in net assets and the financial highlights present fairly, in all material respects, the financial position of GMO Flexible Equities Fund (the "Fund") at February 28, 2009, the results of its operations, the changes in its net assets and the financial highlights for the period December 12, 2008 (commencement of operations) through February 28, 2009, in conformity with accounting principles generally accepted in the United States of America. These financial statements and financial highlights (hereafter referred to as "financial statements") are the responsibility of the Fund's management. Our responsibility is to express an opinion on these financial statements based on our audit. We conducted our audit of these financial statements in accordance with the standards o f the Public Company Accounting Oversight Board (United States). Those standards require that we plan and perform the audit to obtain reasonable assurance about whether the financial statements are free of material misstatement. An audit includes examining, on a test basis, evidence supporting the amounts and disclosures in the financial statements, assessing the accounting principles used and significant estimates made by management, and evaluating the overall financial statement presentation. We believe that our audit, which included confirmation of securities at February 28, 2009 by correspondence with the custodian and brokers, provides a reasonable basis for our opinion.
PricewaterhouseCoopers LLP
Boston, Massachusetts
April 29, 2009
29
GMO Flexible Equities Fund
(A Series of GMO Trust)
Fund Expenses
February 28, 2009 (Unaudited)
Expense Examples: The following information is in relation to expenses for the six month period ended February 28, 2009.
As a shareholder of the Fund, you may incur two types of costs: (1) transaction costs and (2) ongoing costs, including management fees, shareholder service fees, and other Fund expenses. This example is intended to help you understand your ongoing costs (in dollars) of investing in the Fund and to compare these costs with the ongoing costs of investing in other mutual funds.
These examples are based on an investment of $1,000 invested at the beginning of the period and held for the entire period, December 12, 2008 through February 28, 2009.
Actual Expenses
The first line of the table for each class below provides information about actual account values and actual expenses. You may use the information in this line, together with the amount you invested, to estimate the expenses that you paid over the period. Simply divide your account value by $1,000 (for example, a $10,000,000 account value divided by $1,000 = 10,000), then multiply the result by the number in the first line under the heading entitled "Net Expense Incurred" to estimate the expenses you paid on your account during this period.
Hypothetical Example for Comparison Purposes
The second line of the table for each class below provides information about hypothetical account values and hypothetical expenses based on the Fund's actual expense ratio and an assumed rate of return of 5% per year before expenses, which is not the Fund's actual return. The hypothetical account values and expenses may not be used to estimate the actual ending account balance or expenses you paid for the period. You may use this information to compare the ongoing costs of investing in the Fund with other funds. To do so, compare this 5% hypothetical example with the 5% hypothetical examples that appear in the shareholder reports of other funds.
Please note that the expenses shown in the table are meant to highlight your ongoing costs only and do not reflect any transactional costs, such as purchase premiums and redemption fees. Therefore, the second line of the table is useful in comparing ongoing costs only, and will not help you determine the relative total costs of owning different funds. In addition, if these transactional costs were included, your costs would have been higher.
| Annualized Net Expense Ratio | Beginning Account Value | Ending Account Value | Net Expense Incurred | ||||||||||||||||
| Class III | |||||||||||||||||||
| 1) Actual | 0.70 | % | $ | 1,000.00 | $ | 769.60 | $ | 1.32 | (a) | ||||||||||
| 2) Hypothetical | 0.70 | % | $ | 1,000.00 | $ | 1,021.32 | $ | 3.51 | (b) | ||||||||||
| Class VI | |||||||||||||||||||
| 1) Actual | 0.61 | % | $ | 1,000.00 | $ | 769.60 | $ | 1.15 | (a) | ||||||||||
| 2) Hypothetical | 0.61 | % | $ | 1,000.00 | $ | 1,021.77 | $ | 3.06 | (b) | ||||||||||
(a) For the period December 12, 2008 (commencement of operations) through February 28, 2009. Expense is calculated using each Class's annualized net expense ratio for the period ended February 28, 2009, multiplied by the average account value over the period, multiplied by 78 days in the period, divided by 365 days in the year.
(b) For the period September 1, 2008 through February 28, 2009. Expense is calculated using each Class's annualized net expense ratio for the period ended February 28, 2009, multiplied by the average account value over the period, multiplied by 181 days in the period, divided by 365 days in the year.
30
GMO Flexible Equities Fund
(A Series of GMO Trust)
Tax Information for the Tax Year Ended February 28, 2009 (Unaudited)
The Fund will notify shareholders of amounts for use in preparing 2009 income tax forms in January 2010.
During the year ended February 28, 2009, the Fund paid foreign taxes of $66,715 and recognized foreign source income of $953,077.
31
Trustees and Officers (Unaudited)
The following tables list the Trust's Trustees and Officers as of the date of this report; their address and date of birth ("DOB"); their position with the Trust; the length of time holding that position with the Trust; their principal occupation(s) during the past five years; the number of portfolios in the fund complex they oversee; and other directorships they hold in companies subject to registration or reporting requirements of the Securities Exchange Act of 1934 (generally called "public companies") or in registered investment companies. The Trust's Statement of Additional Information ("SAI") includes additional information about the Trust's trustees, including changes subsequent to the date of the report. The SAI is available, without charge, upon request by writing GMO, c/o GMO Trust, 40 Rowes Wharf, Boston, MA 02110.
Independent Trustees:
| Name, Address, and DOB | Position(s) Held with Trust | Term of Office1 and Length of Time Served | Principal Occupation(s) During Past Five Years | Number of Portfolios in Fund Complex Overseen by Trustee | Other Directorships Held by Trustee | ||||||||||||||||||
| Donald W. Glazer, Esq. c/o GMO Trust 40 Rowes Wharf Boston, MA 02110 DOB: 07/26/1944 | Chairman of the Board of Trustees | Chairman of the Board of Trustees since March 2005; Lead Independent Trustee (September 2004 – March 2005); Trustee since December 2000. | Consultant – Law and Business2; Author of Legal Treatises. | 59 | None. | ||||||||||||||||||
1 Each Trustee is elected to serve during the continued lifetime of the Trust until he/she dies, resigns or is removed, or if sooner, until the next meeting of Shareholders called for the purpose of electing Trustees and until the election and qualification of his/her successor.
2 As part of Mr. Glazer's work as a consultant, he provides part-time consulting services to Goodwin Procter LLP ("Goodwin"). Goodwin has provided legal services to Renewable Resources, LLC, an affiliate of GMO; GMO, in connection with its relationship with Renewable Resources; and funds managed by Renewable Resources. Mr. Glazer has represented that he has no financial interest in, and is not involved in the provision of, such legal services. In the calendar years ended December 31, 2007 and December 31, 2008, these entities paid $789,416 and $183,864 respectively, in legal fees and disbursements to Goodwin. In correspondence with the Staff of the Securities and Exchange Commission beginning in August 2006, the Independent Trustees' legal counsel provided the Staff with information regarding Mr. Glazer's relationship with Goodwin and h is other business activities. On September 11, 2007, based on information that had been given to the Staff as of that date, the Staff provided oral no-action assurance consistent with the opinion of the Independent Trustees' legal counsel that Mr. Glazer is not an "interested person" of the Trust.
32
Independent Trustees — (Continued)
| Name, Address, and DOB | Position(s) Held with Trust | Term of Office1 and Length of Time Served | Principal Occupation(s) During Past Five Years | Number of Portfolios in Fund Complex Overseen by Trustee | Other Directorships Held by Trustee | ||||||||||||||||||
| W. Nicholas Thorndike c/o GMO Trust 40 Rowes Wharf Boston, MA 02110 DOB: 03/28/1933 | Trustee | Since March 2005. | Director or trustee of various corporations and charitable organizations, including Courier Corporation (a book publisher and manufacturer) (July 1989 – present); Putnam Funds (December 1992 – June 2004); and Providence Journal (a newspaper publisher) (December 1986 – December 2003). | 59 | Director of Courier Corporation (a book publisher and manufacturer); Member of the Investment Committee of Partners HealthCare System, Inc.3 | ||||||||||||||||||
| Peter Tufano c/o GMO Trust 40 Rowes Wharf Boston, MA 02110 DOB: 04/22/1957 | Trustee | Since December 2008. | Sylvan C. Coleman Professor of Financial Management, Harvard Business School (since 1989). | 59 | Trustee of State Street Navigator Securities Lending Trust (3 Portfolios). | ||||||||||||||||||
1 Each Trustee is elected to serve during the continued lifetime of the Trust until he/she dies, resigns or is removed, or if sooner, until the next meeting of Shareholders called for the purpose of electing Trustees and until the election and qualification of his/her successor.
3 Partners HealthCare System, Inc. is a client of the Manager.
33
Principal Officers:
| Name, Address, and DOB | Position(s) Held with Trust | Term of Office4 and Length of Time Served | Principal Occupation(s) During Past Five Years5 | ||||||||||||
| J.B. Kittredge DOB: 08/22/1954 | President and Chief Executive Officer | Since March 2009. | General Counsel, Grantham, Mayo, Van Otterloo & Co. LLC (October 2005 – Present); Partner, Ropes & Gray LLP. | ||||||||||||
| Sheppard N. Burnett c/o GMO Trust 40 Rowes Wharf Boston, MA 02110 DOB: 10/24/1968 | Treasurer and Chief Financial Officer | Chief Financial Officer since March 2007; Treasurer since November 2006; Assistant Treasurer, September 2004 – November 2006. | Fund Administration Staff, Grantham, Mayo, Van Otterloo & Co. LLC (June 2004 – present); Vice President, Director of Tax, Columbia Management Group (2002 – 2004). | ||||||||||||
| Brent C. Arvidson c/o GMO Trust 40 Rowes Wharf Boston, MA 02110 DOB: 06/26/1969 | Assistant Treasurer | Since August 1998. | Senior Fund Administrator, Grantham, Mayo, Van Otterloo & Co. LLC. | ||||||||||||
| John L. Nasrah c/o GMO Trust 40 Rowes Wharf Boston, MA 02110 DOB: 05/27/1977 | Assistant Treasurer | Since March 2007. | Fund Administrator, Grantham, Mayo, Van Otterloo & Co. LLC (September 2004 – present); Tax Analyst, Bain & Company, Inc. (June 2003 – September 2004). | ||||||||||||
| Mahmoodur Rahman c/o GMO Trust 40 Rowes Wharf Boston, MA 02110 DOB: 11/30/1967 | Assistant Treasurer | Since September 2007. | Fund Administrator, Grantham, Mayo, Van Otterloo & Co. LLC (April 2007 – present); Vice President and Senior Tax Manager, Massachusetts Financial Services Company (January 2000 – April 2007). | ||||||||||||
| Michael E. Gillespie c/o GMO Trust 40 Rowes Wharf Boston, MA 02110 DOB: 02/18/1958 | Chief Compliance Officer | Since March 2005. | Vice President of Compliance (June 2004 – February 2005) and Director of Domestic Compliance (March 2002 – June 2004), Fidelity Investments. | ||||||||||||
4 Each officer is elected to hold such office until his or her successor is duly elected and qualified to carry out the duties and responsibilities of the office, or until he or she resigns or is removed from office.
5 Each of Messrs. Burnett, Arvidson, Bohan, and Pottle serves as an officer and/or director of certain pooled investment vehicles of which GMO or an affiliate of GMO serves as the investment adviser.
34
Principal Officers — (Continued)
| Name, Address, and DOB | Position(s) Held with Trust | Term of Office4 and Length of Time Served | Principal Occupation(s) During Past Five Years5 | ||||||||||||
| Jason B. Harrison c/o GMO Trust 40 Rowes Wharf Boston, MA 02110 DOB: 01/29/1977 | Vice President and Clerk | Vice President since November 2006; Clerk since March 2006. | Legal Counsel, Grantham, Mayo, Van Otterloo & Co. LLC (since February 2006) and Attorney, Ropes & Gray LLP (September 2002 – February 2006). | ||||||||||||
| David L. Bohan c/o GMO Trust 40 Rowes Wharf Boston, MA 02110 DOB: 06/21/1964 | Vice President and Assistant Clerk | Vice President since March 2005; Assistant Clerk since March 2006. | Legal Counsel, Grantham, Mayo, Van Otterloo & Co. LLC. | ||||||||||||
| Gregory L. Pottle c/o GMO Trust 40 Rowes Wharf Boston, MA 02110 DOB: 07/09/1971 | Vice President and Assistant Clerk | Since November 2006. | Legal Counsel, Grantham, Mayo, Van Otterloo & Co. LLC. | ||||||||||||
| Anne K. Trinque c/o GMO Trust 40 Rowes Wharf Boston, MA 02110 DOB: 04/15/1978 | Vice President and Assistant Clerk | Since September 2007. | Legal Counsel, Grantham, Mayo, Van Otterloo & Co. LLC (January 2007 – present); Attorney, Goodwin Procter LLP (September 2003 – January 2007). | ||||||||||||
| Cheryl Wakeham c/o GMO Trust 40 Rowes Wharf Boston, MA 02110 DOB: 10/29/1958 | Vice President and Anti-Money Laundering Officer | Since December 2004. | Manager, Client Service Administration, Grantham, Mayo, Van Otterloo & Co. LLC. | ||||||||||||
4 Each officer is elected to hold such office until his or her successor is duly elected and qualified to carry out the duties and responsibilities of the office, or until he or she resigns or is removed from office.
5 Each of Messrs. Burnett, Arvidson, Bohan, and Pottle serves as an officer and/or director of certain pooled investment vehicles of which GMO or an affiliate of GMO serves as the investment adviser.
35
GMO Currency Hedged International Equity Fund
(A Series of GMO Trust)
Annual Report
February 28, 2009
For a free copy of the Fund's proxy voting guidelines, shareholders may call 1-617-346-7646 (collect) or visit the Securities and Exchange Commission's website at www.sec.gov. Information regarding how the Fund voted proxies relating to portfolio securities during the most recent 12-month period ended June 30 is available on GMO's website at www.gmo.com, or on the Securities and Exchange Commission's website at www.sec.gov.
The Fund files its complete schedule of portfolio holdings with the Securities and Exchange Commission for the first and third quarter of each fiscal year on Form N-Q, which is available on the Commission's website at www.sec.gov. The Fund's Form N-Q may be reviewed and copied at the Commission's Public Reference Room in Washington, D.C. Information on the operation of the Public Reference Room may be obtained by calling 1-800-SEC-0330. The Fund has a policy with respect to disclosure of portfolio holdings under which it may also make available on GMO's website at www.gmo.com a complete schedule of portfolio holdings.
This report is prepared for the general information of shareholders. It is authorized for distribution to prospective investors only when preceded or accompanied by a prospectus for the GMO Trust, which contains a complete discussion of the risks associated with an investment in this Fund and other important information. The GMO Trust prospectus can be obtained at www.gmo.com.
GMO Currency Hedged International Equity Fund
(A Series of GMO Trust)
Portfolio Management
Day-to-day management of the Fund's portfolio is the responsibility of the Asset Allocation team at Grantham, Mayo, Van Otterloo & Co. LLC.
Management Discussion and Analysis of Fund Performance
The GMO Currency Hedged International Equity Fund returned -35.6% for the fiscal year ended February 28, 2009, as compared to -40.7% for the MSCI EAFE Index (Hedged). Consistent with the Fund's investment objectives and policies, during the fiscal year the Fund was fully exposed to international equity securities through its investment in underlying GMO mutual funds.
The Fund's exposure to international equities comes indirectly through investments in the GMO International Intrinsic Value Fund and the GMO International Growth Equity Fund. The Fund also holds currency hedges in addition to the shares of those Funds, which make predominantly unhedged investments.
Currency hedging had a positive impact on our international equity investing. The US dollar rose against most foreign currencies, but hedging insulated the Fund's return from those losses. In U.S. dollar terms the unhedged MSCI EAFE Index returned -50.2% during the period, almost 10% less than the hedged benchmark.
The Fund is fairly evenly allocated between the GMO International Intrinsic Value Fund which returned -48.0% and the GMO International Growth Equity Fund, which returned -43.5% during the period. The Fund outperformed as the Growth Fund and the Value Fund each outperformed their respective style benchmarks and the currency hedge protected from declining foreign currencies.
The views expressed herein are exclusively those of Grantham, Mayo, Van Otterloo & Co. LLC Management as of the date of this report and are subject to change. GMO disclaims any responsibility to update such views. They are not meant as investment advice. References to specific securities are not recommendations of such securities and may not be representative of any GMO portfolio's current or future investments.
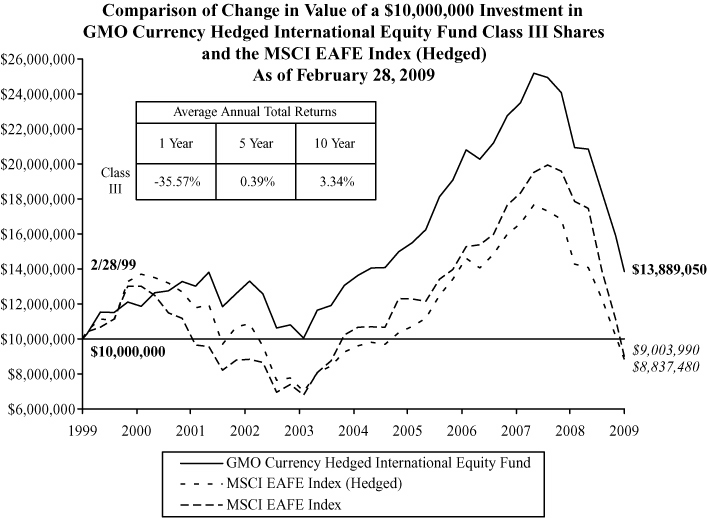
Performance data quoted represents past performance and is not indicative of future results. The investment return and principal value of an investment will fluctuate so that an investor's shares, when redeemed, may be worth more or less than their original cost. Current performance data may be lower or higher than the performance data provided herein. To obtain performance information to the most recent month-end, visit www.gmo.com. Performance shown is net of all fees after reimbursement from the Manager. Returns would have been lower had certain expenses not been reimbursed during the periods shown and do not include the effect of taxes on distributions and redemptions. All information is unaudited.
GMO Currency Hedged International Equity Fund
(A Series of GMO Trust)
Investments Concentration Summary
February 28, 2009 (Unaudited)
| Asset Class Summary* | % of Total Net Assets | ||||||
| Common Stocks | 93.0 | % | |||||
| Short-Term Investments | 4.2 | ||||||
| Forward Currency Contracts | 0.3 | ||||||
| Rights and Warrants | 0.0 | ||||||
| Preferred Stocks | 0.0 | ||||||
| Futures | (0.7 | ) | |||||
| Other | 3.2 | ||||||
| 100.0 | % | ||||||
| Country / Region Summary** | % of Investments | ||||||
| Japan | 27.0 | % | |||||
| Euro Region*** | 26.6 | ||||||
| United Kingdom | 21.3 | ||||||
| Switzerland | 12.4 | ||||||
| Canada | 2.9 | ||||||
| Australia | 2.9 | ||||||
| Hong Kong | 2.5 | ||||||
| Singapore | 1.4 | ||||||
| Denmark | 1.4 | ||||||
| Sweden | 1.1 | ||||||
| Norway | 0.4 | ||||||
| New Zealand | 0.1 | ||||||
| 100.0 | % | ||||||
* The table above incorporates aggregate indirect asset class exposure associated with investments in other funds of GMO Trust ("underlying funds").
** The table above incorporates aggregate indirect country exposure associated with investments in the underlying funds. The table excludes short-term investments. The table includes exposure through the use of derivative contracts.
*** The "Euro Region" is comprised of Austria, Belgium, Finland, France, Germany, Greece, Ireland, Italy, Netherlands, Portugal and Spain.
1
GMO Currency Hedged International Equity Fund
(A Series of GMO Trust)
Schedule of Investments
(showing percentage of total net assets)
February 28, 2009
| Shares / Par Value ($) | Description | Value ($) | |||||||||
| MUTUAL FUNDS — 98.3% | |||||||||||
| United States — 98.3% | |||||||||||
| Affiliated Issuers | |||||||||||
| 864,413 | GMO International Growth Equity Fund, Class IV | 12,499,409 | |||||||||
| 890,998 | GMO International Intrinsic Value Fund, Class IV | 12,473,977 | |||||||||
| TOTAL MUTUAL FUNDS (COST $44,365,968) | 24,973,386 | ||||||||||
| SHORT-TERM INVESTMENTS — 0.7% | |||||||||||
| Short-Term Investments — 0.7% | |||||||||||
| 12 | Brown Brothers Harriman Time Deposit, 0.05%-1.79%, due 03/02/09 | 12 | |||||||||
| 100,000 | Royal Bank of Canada Time Deposit, 0.20%, due 03/02/09 | 100,000 | |||||||||
| 88,126 | Royal Bank of Scotland Time Deposit, 0.08%, due 03/02/09 | 88,126 | |||||||||
| TOTAL SHORT-TERM INVESTMENTS (COST $188,138) | 188,138 | ||||||||||
| TOTAL INVESTMENTS — 99.0% (Cost $44,554,106) | 25,161,524 | ||||||||||
| Other Assets and Liabilities (net) — 1.0% | 255,617 | ||||||||||
| TOTAL NET ASSETS — 100.0% | $ | 25,417,141 | |||||||||
See accompanying notes to the financial statements.
2
GMO Currency Hedged International Equity Fund
(A Series of GMO Trust)
Schedule of Investments — (Continued)
February 28, 2009
A summary of outstanding financial instruments at February 28, 2009 is as follows:
Forward Currency Contracts
| Settlement Date | Deliver/Receive | Units of Currency | Value | Net Unrealized Appreciation (Depreciation) | |||||||||||||||
| Buys | |||||||||||||||||||
| 4/24/09 | AUD | 200,000 | $ | 127,420 | $ | (2,073 | ) | ||||||||||||
| 4/24/09 | CAD | 552,000 | 433,924 | (2,448 | ) | ||||||||||||||
| 4/24/09 | EUR | 471,000 | 596,956 | (7,389 | ) | ||||||||||||||
| 4/24/09 | GBP | 63,000 | 90,182 | (998 | ) | ||||||||||||||
| 4/24/09 | JPY | 18,672,000 | 191,531 | (1,761 | ) | ||||||||||||||
| 4/24/09 | NOK | 446,000 | 63,331 | (1,551 | ) | ||||||||||||||
| 4/24/09 | NZD | 191,000 | 95,320 | (2,300 | ) | ||||||||||||||
| 4/24/09 | SGD | 174,000 | 112,382 | (1,449 | ) | ||||||||||||||
| $ | 1,711,046 | $ | (19,969 | ) | |||||||||||||||
| Sales | |||||||||||||||||||
| 4/24/09 | AUD | 737,131 | $ | 469,627 | $ | (1,401 | ) | ||||||||||||
| 4/24/09 | AUD | 1,180,131 | 751,862 | 767 | |||||||||||||||
| 4/24/09 | CHF | 645,140 | 552,093 | (920 | ) | ||||||||||||||
| 4/24/09 | CHF | 727,000 | 622,147 | 2,418 | |||||||||||||||
| 4/24/09 | CHF | 664,690 | 568,823 | (2,426 | ) | ||||||||||||||
| 4/24/09 | CHF | 1,030,140 | 881,565 | (1,591 | ) | ||||||||||||||
| 4/24/09 | DKK | 3,935,321 | 668,437 | (2,626 | ) | ||||||||||||||
| 4/24/09 | DKK | 2,085,321 | 354,204 | (2,194 | ) | ||||||||||||||
| 4/24/09 | DKK | 2,148,513 | 364,937 | (2,227 | ) | ||||||||||||||
| 4/24/09 | EUR | 534,730 | 677,729 | (4,034 | ) | ||||||||||||||
| 4/24/09 | EUR | 534,730 | 677,729 | (4,194 | ) | ||||||||||||||
| 4/24/09 | EUR | 534,730 | 677,729 | (4,199 | ) | ||||||||||||||
| 4/24/09 | EUR | 534,730 | 677,729 | (2,953 | ) | ||||||||||||||
| 4/24/09 | EUR | 534,730 | 677,729 | (2,550 | ) | ||||||||||||||
| 4/24/09 | EUR | 534,730 | 677,729 | (5,835 | ) | ||||||||||||||
| 4/24/09 | EUR | 2,891,730 | 3,665,044 | 5,493 | |||||||||||||||
| 4/24/09 | GBP | 275,835 | 394,845 | (2,767 | ) | ||||||||||||||
| 4/24/09 | GBP | 275,835 | 394,845 | (2,574 | ) | ||||||||||||||
| 4/24/09 | GBP | 275,835 | 394,845 | (1,599 | ) | ||||||||||||||
| 4/24/09 | GBP | 275,835 | 394,845 | (1,516 | ) | ||||||||||||||
See accompanying notes to the financial statements.
3
GMO Currency Hedged International Equity Fund
(A Series of GMO Trust)
Schedule of Investments — (Continued)
February 28, 2009
Forward Currency Contracts — continued
| Settlement Date | Deliver/Receive | Units of Currency | Value | Net Unrealized Appreciation (Depreciation) | |||||||||||||||
| 4/24/09 | GBP | 275,835 | $ | 394,845 | $ | (2,535 | ) | ||||||||||||
| 4/24/09 | GBP | 275,835 | 394,845 | (1,456 | ) | ||||||||||||||
| 4/24/09 | GBP | 937,835 | 1,342,465 | 805 | |||||||||||||||
| 4/24/09 | HKD | 1,008,000 | 130,034 | (21 | ) | ||||||||||||||
| 4/24/09 | HKD | 2,933,380 | 378,413 | 88 | |||||||||||||||
| 4/24/09 | JPY | 218,897,563 | 2,245,378 | 31,959 | |||||||||||||||
| 4/24/09 | JPY | 117,371,563 | 1,203,958 | 35,660 | |||||||||||||||
| 4/24/09 | JPY | 58,781,563 | 602,962 | 36,570 | |||||||||||||||
| 4/24/09 | JPY | 58,781,563 | 602,962 | 36,294 | |||||||||||||||
| 4/24/09 | JPY | 58,781,563 | 602,962 | 36,719 | |||||||||||||||
| 4/24/09 | JPY | 58,781,563 | 602,962 | 36,490 | |||||||||||||||
| 4/24/09 | JPY | 58,781,563 | 602,962 | 36,781 | |||||||||||||||
| 4/24/09 | NOK | 3,872,262 | 549,852 | (788 | ) | ||||||||||||||
| 4/24/09 | NOK | 2,288,262 | 324,928 | 941 | |||||||||||||||
| 4/24/09 | NZD | 126,000 | 62,881 | 699 | |||||||||||||||
| 4/24/09 | SEK | 1,693,000 | 187,957 | 278 | |||||||||||||||
| 4/24/09 | SEK | 2,015,899 | 223,805 | 6,968 | |||||||||||||||
| 4/24/09 | SEK | 2,852,899 | 316,729 | 8,527 | |||||||||||||||
| 4/24/09 | SGD | 118,584 | 76,590 | 1,101 | |||||||||||||||
| $ | 25,391,983 | $ | 228,152 | ||||||||||||||||
Currency Abbreviations:
| AUD - Australian Dollar CAD - Canadian Dollar CHF - Swiss Franc DKK - Danish Krone EUR - Euro GBP - British Pound | HKD - Hong Kong Dollar JPY - Japanese Yen NOK - Norwegian Krone NZD - New Zealand Dollar SEK - Swedish Krona SGD - Singapore Dollar | ||||||
See accompanying notes to the financial statements.
4
GMO Currency Hedged International Equity Fund
(A Series of GMO Trust)
Statement of Assets and Liabilities — February 28, 2009
| Assets: | |||||||
| Investments in unaffiliated issuers, at value (cost $188,138) (Note 2) | $ | 188,138 | |||||
| Investments in affiliated issuers, at value (cost $44,365,968) (Notes 2 and 8) | 24,973,386 | ||||||
| Receivable for Fund shares sold | 7,122,195 | ||||||
| Unrealized appreciation on open forward currency contracts (Note 2) | 278,558 | ||||||
| Receivable for expenses reimbursed by Manager (Note 3) | 24,980 | ||||||
| Total assets | 32,587,257 | ||||||
| Liabilities: | |||||||
| Payable for investments purchased | 7,000,000 | ||||||
| Payable to affiliate for (Note 3): | |||||||
| Management fee | 7,995 | ||||||
| Shareholder service fee | 2,224 | ||||||
| Trustees and Chief Compliance Officer of GMO Trust fees | 31 | ||||||
| Unrealized depreciation on open forward currency contracts (Note 2) | 70,375 | ||||||
| Accrued expenses | 89,491 | ||||||
| Total liabilities | 7,170,116 | ||||||
| Net assets | $ | 25,417,141 | |||||
| Net assets consist of: | |||||||
| Paid-in capital | $ | 43,588,527 | |||||
| Accumulated undistributed net investment income | 2,534,055 | ||||||
| Accumulated net realized loss | (1,521,042 | ) | |||||
| Net unrealized depreciation | (19,184,399 | ) | |||||
| $ | 25,417,141 | ||||||
| Net assets attributable to: | |||||||
| Class III shares | $ | 25,417,141 | |||||
| Shares outstanding: | |||||||
| Class III | 11,251,086 | ||||||
| Net asset value per share: | |||||||
| Class III | $ | 2.26 | |||||
See accompanying notes to the financial statements.
5
GMO Currency Hedged International Equity Fund
(A Series of GMO Trust)
Statement of Operations — Year Ended February 28, 2009
| Investment Income: | |||||||
| Dividends from affiliated issuers (Note 8) | $ | 1,019,438 | |||||
| Interest | 10,036 | ||||||
| Total investment income | 1,029,474 | ||||||
| Expenses: | |||||||
| Management fee (Note 3) | 136,868 | ||||||
| Shareholder service fee – Class III (Note 3) | 38,019 | ||||||
| Custodian and fund accounting agent fees | 64,652 | ||||||
| Transfer agent fees | 26,685 | ||||||
| Audit and tax fees | 65,928 | ||||||
| Legal fees | 462 | ||||||
| Trustees fees and related expenses (Note 3) | 218 | ||||||
| Registration fees | 6,180 | ||||||
| Miscellaneous | 2,541 | ||||||
| Total expenses | 341,553 | ||||||
| Fees and expenses reimbursed by Manager (Note 3) | (166,294 | ) | |||||
| Expense reductions (Note 2) | (1,243 | ) | |||||
| Indirectly incurred fees waived or borne by Manager (Note 3) | (125,593 | ) | |||||
| Shareholder service fee waived (Note 3) | (22,076 | ) | |||||
| Net expenses | 26,347 | ||||||
| Net investment income (loss) | 1,003,127 | ||||||
| Realized and unrealized gain (loss): | |||||||
| Net realized gain (loss) on: | |||||||
| Investments in affiliated issuers | (1,643,694 | ) | |||||
| Realized gains distributions from affiliated issuers (Note 8) | 1,265,664 | ||||||
| Foreign currency, forward contracts and foreign currency related transactions | 2,194,132 | ||||||
| Net realized gain (loss) | 1,816,102 | ||||||
| Change in net unrealized appreciation (depreciation) on: | |||||||
| Investments in affiliated issuers | (14,208,915 | ) | |||||
| Foreign currency, forward contracts and foreign currency related transactions | 1,042,206 | ||||||
| Net unrealized gain (loss) | (13,166,709 | ) | |||||
| Net realized and unrealized gain (loss) | (11,350,607 | ) | |||||
| Net increase (decrease) in net assets resulting from operations | $ | (10,347,480 | ) | ||||
See accompanying notes to the financial statements.
6
GMO Currency Hedged International Equity Fund
(A Series of GMO Trust)
Statement of Changes in Net Assets
| Year Ended February 28, 2009 | Year Ended February 29, 2008 | ||||||||||
| Increase (decrease) in net assets: | |||||||||||
| Operations: | |||||||||||
| Net investment income (loss) | $ | 1,003,127 | $ | 725,814 | |||||||
| Net realized gain (loss) | 1,816,102 | 33,909,730 | |||||||||
| Change in net unrealized appreciation (depreciation) | (13,166,709 | ) | (24,076,799 | ) | |||||||
| Net increase (decrease) in net assets from operations | (10,347,480 | ) | 10,558,745 | ||||||||
| Distributions to shareholders from: | |||||||||||
| Net investment income | |||||||||||
| Class III | (1,457,990 | ) | — | ||||||||
| Net realized gains | |||||||||||
| Class III | (8,027,267 | ) | (48,200,678 | ) | |||||||
| (9,485,257 | ) | (48,200,678 | ) | ||||||||
| Net share transactions (Note 7): | |||||||||||
| Class III | 14,976,832 | (159,181,264 | ) | ||||||||
| Total increase (decrease) in net assets | (4,855,905 | ) | (196,823,197 | ) | |||||||
| Net assets: | |||||||||||
| Beginning of period | 30,273,046 | 227,096,243 | |||||||||
| End of period (including accumulated undistributed net investment income of $2,534,055 and $794,785, respectively) | $ | 25,417,141 | $ | 30,273,046 | |||||||
See accompanying notes to the financial statements.
7
GMO Currency Hedged International Equity Fund
(A Series of GMO Trust)
Financial Highlights
(For a Class III share outstanding throughout each period)
| Year Ended February 28/29, | |||||||||||||||||||||||
| 2009 | 2008 | 2007 | 2006 | 2005 | |||||||||||||||||||
| Net asset value, beginning of period | $ | 5.32 | $ | 7.45 | $ | 9.07 | $ | 8.38 | $ | 7.33 | |||||||||||||
| Income (loss) from investment operations: | |||||||||||||||||||||||
| Net investment income (loss)(a)† | 0.15 | 0.03 | 0.10 | 0.07 | 0.21 | ||||||||||||||||||
| Net realized and unrealized gain (loss) | (1.60 | ) | (0.29 | ) | 1.17 | 2.17 | 0.84 | ||||||||||||||||
| Total from investment operations | (1.45 | ) | (0.26 | ) | 1.27 | 2.24 | 1.05 | ||||||||||||||||
| Less distributions to shareholders: | |||||||||||||||||||||||
| From net investment income | (0.20 | ) | — | (0.12 | ) | (0.71 | )(b) | — | |||||||||||||||
| From net realized gains | (1.41 | ) | (1.87 | ) | (2.77 | ) | (0.84 | ) | — | ||||||||||||||
| Total distributions | (1.61 | ) | (1.87 | ) | (2.89 | ) | (1.55 | ) | — | ||||||||||||||
| Net asset value, end of period | $ | 2.26 | $ | 5.32 | $ | 7.45 | $ | 9.07 | $ | 8.38 | |||||||||||||
| Total Return(c) | (35.57 | )% | (6.75 | )% | 15.60 | % | 28.42 | % | 14.32 | % | |||||||||||||
| Ratios/Supplemental Data: | |||||||||||||||||||||||
| Net assets, end of period (000's) | $ | 25,417 | $ | 30,273 | $ | 227,096 | $ | 728,814 | $ | 580,905 | |||||||||||||
| Net expenses to average daily net assets(d) | 0.11 | %(e) | 0.08 | %(e) | 0.07 | % | 0.05 | % | 0.04 | % | |||||||||||||
| Net investment income to average daily net assets(a) | 3.96 | % | 0.42 | % | 1.23 | % | 0.82 | % | 2.64 | % | |||||||||||||
| Portfolio turnover rate | 17 | % | 11 | % | 18 | % | 36 | % | 3 | % | |||||||||||||
| Fees and expenses reimbursed and/or waived by the Manager to average daily net assets: | 1.24 | % | 0.71 | % | 0.68 | % | 0.67 | % | 0.71 | % | |||||||||||||
(a) Net investment income is affected by the timing of the declaration of dividends by the underlying funds in which the Fund invests.
(b) Distributions from net investment income include amounts (approximately $0.07 per share) from foreign currency transactions which are treated as realized capital gain for book purposes.
(c) The total returns would have been lower had certain expenses not been reimbursed and/or waived during the periods shown and assumes the effect of reinvested distributions.
(d) Net expenses exclude expenses incurred indirectly through investment in the underlying funds (See Note 3).
(e) The net expense ratio does not include the effect of expense reductions.
† Calculated using average shares outstanding throughout the period.
See accompanying notes to the financial statements.
8
GMO Currency Hedged International Equity Fund
(A Series of GMO Trust)
Notes to Financial Statements
February 28, 2009
1. Organization
GMO Currency Hedged International Equity Fund (the "Fund") is a series of GMO Trust (the "Trust"). The Fund is registered under the Investment Company Act of 1940, as amended, as an open-end, non-diversified management investment company. The Fund is advised and managed by Grantham, Mayo, Van Otterloo & Co. LLC (the "Manager" or "GMO"). The Trust was established as a Massachusetts business trust under the laws of The Commonwealth of Massachusetts on June 24, 1985. The Declaration of Trust permits the Trustees of the Trust ("Trustees") to create an unlimited number of series of shares ("Funds") and to subdivide Funds into classes.
The Fund seeks total return greater than that of the MSCI EAFE Index (Europe, Australasia, and Far East) (Hedged). The Fund is a fund of funds and invests primarily in other GMO Funds. The Fund may invest to varying extents in GMO International Core Equity Fund, GMO International Intrinsic Value Fund, GMO International Growth Equity Fund, GMO International Small Companies Fund, and GMO Flexible Equities Fund ("underlying funds"). GMO attempts to hedge at least 70% of the foreign currency exposure in the underlying funds' investments relative to the U.S. dollar.
The financial statements of the underlying funds should be read in conjunction with the Fund's financial statements. These financial statements are available, without charge, upon request by calling (617) 346-7646 (collect) or visiting GMO's website at www.gmo.com.
2. Significant accounting policies
The following is a summary of significant accounting policies followed by the Fund in the preparation of its financial statements. These policies are in conformity with accounting principles generally accepted in the United States of America ("U.S. GAAP") and have been consistently followed by the Fund in preparing its financial statements. The preparation of financial statements in accordance with U.S. GAAP requires management to make estimates and assumptions that affect the reported amounts and disclosures in the financial statements. Actual results could differ from those estimates. The accounting records of the Fund are maintained in U.S. dollars.
Portfolio valuation
Shares of the underlying funds and other mutual funds are generally valued at their net asset value.
Investments held by the underlying funds are valued as follows. Securities listed on a securities exchange for which market quotations are readily available are valued at the last sale price or official closing price on each business day, or if there is no such reported sale or official closing price, at the most recent quoted bid price. Unlisted securities for which market quotations are readily available are generally valued at the most recent quoted bid price. Debt instruments with a remaining maturity of sixty days or less are generally valued at amortized cost, which approximates fair value. Securities for which quotations are not
9
GMO Currency Hedged International Equity Fund
(A Series of GMO Trust)
Notes to Financial Statements — (Continued)
February 28, 2009
readily available or whose values the Manager has determined to be unreliable are valued at fair value as determined in good faith by the Trustees or persons acting at their direction pursuant to procedures approved by the Trustees. By its nature, a fair value price is a good faith estimate of the value of a security at a given point in time and may not reflect the value that would be realized if the security were sold. The difference between a fair value price and the value realized upon a sale could be material. Because many foreign equity securities markets and exchanges close prior to the close of the New York Stock Exchange ("NYSE"), closing prices for foreign securities in those markets or on those exchanges do not reflect the events that occur after that close but before the close of the NYSE. As a result, the Fund generally values foreign equity securities using fair value prices, which are based on adjustments to closin g prices supplied by a third party vendor based on that vendor's proprietary models. As of February 28, 2009, 84.85% of the net assets of the Fund, through investments in the underlying funds, were valued using fair value prices based on models used by a third party vendor.
In September 2006, the Financial Accounting Standards Board ("FASB") issued Statement of Financial Accounting Standards No. 157, Fair Value Measurements ("SFAS 157"). SFAS 157 is effective for the Fund's current fiscal year. While the adoption of SFAS 157 does not have an effect on the Fund's net asset value, it does require additional disclosures about fair value measurements. SFAS 157 establishes a three-level hierarchy for disclosure of fair value measurements. The valuation hierarchy is based upon the reliability of inputs to the valuation of the Fund's investments. The three levels are defined as follows:
Level 1 – Valuations based on quoted prices for identical securities in active markets.
Level 2 – Valuations determined using other significant direct or indirect observable inputs.
Level 3 – Valuations based on inputs that are unobservable and significant.
The inputs or methodology used for valuing securities are not necessarily an indication of the risk associated with investing in those securities.
The following is a summary of the fair valuations according to inputs used as of February 28, 2009 in valuing the Fund's investments:
| Asset Valuation Inputs | Investments in Securities | Other Financial Instruments* | |||||||||
| Level 1 - Quoted Prices | $ | 25,161,524 | $ | — | |||||||
| Level 2 - Other Significant Observable Inputs | — | 278,558 | |||||||||
| Level 3 - Significant Unobservable Inputs | — | — | |||||||||
| Total | $ | 25,161,524 | $ | 278,558 | |||||||
* Other financial instruments include forward currency contracts.
10
GMO Currency Hedged International Equity Fund
(A Series of GMO Trust)
Notes to Financial Statements — (Continued)
February 28, 2009
| Liability Valuation Inputs | Investments in Securities | Other Financial Instruments** | |||||||||
| Level 1 - Quoted Prices | $ | — | $ | — | |||||||
| Level 2 - Other Significant Observable Inputs | — | (70,375 | ) | ||||||||
| Level 3 - Significant Unobservable Inputs | — | — | |||||||||
| Total | $ | — | $ | (70,375 | ) | ||||||
** Other financial instruments include forward currency contracts.
For the underlying fund's summary of valuation inputs please refer to the respective fund's portfolio valuation note.
The Fund held no investments or other financial instruments at either February 29, 2008 or February 28, 2009, whose fair value was determined using Level 3 inputs.
Foreign currency translation
The market values of foreign securities, currency holdings and related assets and liabilities are translated to U.S. dollars based on the 4 p.m. New York time exchange rates each business day. Income and expenses denominated in foreign currencies are translated at the 4 p.m. New York time exchange rates on the business day the income and expenses are accrued or incurred. The Fund does not isolate realized and unrealized gains and losses attributable to changes in exchange rates from gains and losses that arise from changes in the market value of investments. Such fluctuations are included with net realized and unrealized gain or loss on investments. Net realized gains and losses on foreign currency transactions represent gains and losses on disposition of currencies and forward currency contracts, currency gains and losses realized between the trade and settlement dates on securities transactions, and the difference between the amount of investment income and foreign withholding taxes recorded on the Fund's accounting records and the U.S. dollar equivalent amounts actually received or paid.
Forward currency contracts
The Fund may enter into forward currency contracts including forward cross currency contracts. A forward currency contract is an agreement between two parties to buy and sell a currency at a set price on a future date. The market value of a forward currency contract fluctuates with changes in forward currency exchange rates. Forward currency contracts are marked to market daily using rates supplied by a quotation service and changes in value are recorded by the Fund as an unrealized gain or loss. Realized gains or losses equal to the difference between the value of the contract at the time it was opened and the value at the time it was closed are recorded upon delivery or receipt of the currency or, if a forward currency contract is offset by entering into another forward currency contract with the same broker, upon settlement of the net gain or loss. These contracts may involve market risk in excess of the unrealized gain or lo ss reflected in the Fund's Statement of Assets and Liabilities. They expose the Fund to the risk of unfavorable movements in currency values and the risk that the counterparty will be unable or unwilling to meet the
11
GMO Currency Hedged International Equity Fund
(A Series of GMO Trust)
Notes to Financial Statements — (Continued)
February 28, 2009
terms of the contracts. Forward currency contracts outstanding at the end of the period are listed in the Fund's Schedule of Investments.
Futures contracts
The Fund may purchase and sell futures contracts. Upon entering into a futures contract, the Fund is required to deposit cash, U.S. government and agency obligations, or other liquid assets with the futures clearing broker in accordance with the initial margin requirements of the broker or exchange. In addition, the Fund maintains cash or securities in an amount that at least equals the net amount payable in the event the Fund must deliver the full amount of the contract. Futures contracts are marked to market daily and an appropriate payable or receivable for the change in value ("variation margin") is recorded by the Fund. The payable or receivable is settled on the following business day. Gains or losses are recognized but not considered realized until the contracts expire or are closed. Futures contracts involve, to varying degrees, risk of loss in excess of the variation margin disclosed in the Statement of Assets and Liabi lities. Under some circumstances, futures exchanges may establish daily limits on the amount that the price of a futures contract can vary from the previous day's settlement price, thereby effectively preventing liquidation of unfavorable positions. Losses may arise from changes in the value of the underlying instrument if the Fund is unable to liquidate a futures position due to an illiquid secondary market for the contract or the imposition of price limits, or if counterparties do not perform under the contract terms. Futures contracts are generally valued at the settlement price established each day by the board of trade or exchange on which they are traded. The Fund had no futures contracts outstanding at the end of the period.
Options
The Fund may write (i.e., sell) call and put options. Writing options alters the Fund's exposure to the underlying instrument by, in the case of a call option, obligating the Fund to sell the underlying instrument at a set price to the option-holder and, in the case of a put option, obligating the Fund to purchase the underlying instrument at a set price from the option-holder. In the case of an index option, settlement will be in cash. When the Fund writes a call or put option, an amount equal to the premium received is recorded as a liability and subsequently marked to market to reflect the current value of the option written. Premiums received from writing options that expire are treated as realized gains. Premiums received from writing options that are exercised or closed are deducted from the amounts paid on the underlying future, security or currency transaction to determine the realized gain or loss. The Fund as a writer of an option has no control over whether the underlying future, security or currency may be sold (call) or purchased (put) and as a result bears the market risk of an unfavorable change in the price of the future, security or currency underlying the option. In the event that the Fund writes uncovered put or call options (i.e. options for investments that the Fund does not own), it bears the risk of substantial losses if the price of the underlying instrument increases during the term of the option. Options expose the Fund to the risk the Fund may not be able to enter into a closing transaction because of an illiquid market. The Fund had no open written option contracts during the period.
12
GMO Currency Hedged International Equity Fund
(A Series of GMO Trust)
Notes to Financial Statements — (Continued)
February 28, 2009
The Fund may also purchase put and call options. Purchasing options alters the Fund's exposure to the underlying instrument by, in the case of a call option, entitling the Fund to purchase the underlying instrument at a set price from the writer of the option and, in the case of a put option, entitling the Fund to sell the underlying instrument at a set price to the writer of the option. The Fund pays a premium for a purchased option. That premium is disclosed in the Schedule of Investments and is subsequently marked to market to reflect the current value of the option. Premiums paid for purchasing options that expire are treated as realized losses. Premiums paid for purchasing options that are exercised or closed are deducted from the proceeds on the closing transaction to determine the realized gain or loss. The risk associated with purchasing put and call options is limited to the premium paid. The Fund had no purchased optio n contracts outstanding at the end of the period.
The Fund values exchange traded options at the last sale price, or if no sale is reported, the last bid price for options it has purchased and the last ask price for options it has written. The Fund values options traded over-the-counter using inputs provided by primary pricing sources and industry standard models.
Swap agreements
The Fund may enter into various types of swap agreements, including without limitation, interest rate, total return, credit default and variance swap agreements. A swap agreement is an agreement to exchange the return generated by one instrument for the return generated by another instrument. When entering into a swap agreement, the Fund and/or the swap counterparty may post or receive cash or securities as collateral. The party posting the collateral typically receives the interest associated with or payments related to the collateral and has the risk of loss related to the collateral.
Interest rate swap agreements involve an exchange by the parties of their respective commitments to pay or right to receive interest, e.g., an exchange of floating rate interest payments for fixed rate interest payments with respect to the notional amount of principal.
Total return swap agreements involve a commitment by one party to pay interest to the other party in exchange for a payment to it from the other party based on the return of a reference instrument (e.g., a security or basket of securities), both based on notional amounts. To the extent the return of the reference instrument exceeds or falls short of the interest payments, one party will receive a payment from or make a payment to the other party.
In a credit default swap agreement, one party makes payments to another party in exchange for the right to receive a specified return if a credit event occurs with respect to a referenced entity or entities. Buying credit default protection reduces the buyer's exposure in the event of an issuer's default (e.g., it reduces risk where a party owns a security issued by or otherwise has exposure to the issuer). Selling credit default protection subjects the seller to exposure to an issuer's default. A seller of credit default protection receives payments in return for its obligation to pay the principal amount of a debt security (or other agreed-upon value) to the other party upon the occurrence of a credit event (e.g., issuer default or similar
13
GMO Currency Hedged International Equity Fund
(A Series of GMO Trust)
Notes to Financial Statements — (Continued)
February 28, 2009
event). If no credit event occurs, the seller has no payment obligations. For credit default swap agreements on asset-backed securities, a credit event may be triggered by such events as the issuer's failure to pay interest or principal, an agreement of the holders of an asset-backed security to a maturity extension, a rating downgrade on the security or a write-down on the collateral underlying the security. For credit default swap agreements on corporate or sovereign issuers, a credit event may be triggered by such events as the issuer's bankruptcy, failure to pay interest or principal, repudiation/moratorium or restructuring.
Variance swap agreements involve an agreement by two parties to exchange cash flows based on the measured variance (or square of volatility) of a specified underlying asset. One party agrees to exchange a "fixed rate" or strike price payment for the "floating rate" or realized price variance on the underlying asset with respect to the notional amount. At inception, the strike price chosen is generally fixed at a level such that the fair value of the swap is zero. At the expiration date, the amount paid by one party to the other is the difference between the realized price variance of the underlying asset and the strike price multiplied by the notional amount. A receiver of the realized price variance would receive a payment when the realized price variance of the underlying asset is greater than the strike price and would make a payment when that variance is less than the strike price. A payer of the realized price variance woul d make a payment when the realized price variance of the underlying asset is greater than the strike price and would receive a payment when that variance is less than the strike price. This type of agreement is essentially a forward contract on the future realized price variance of the underlying asset.
The Fund prices its swap agreements daily using models that may incorporate quotations from market makers and records the change in value, if any, as unrealized gain or loss in the Statement of Operations. Payments received or made on swap agreements are recorded as realized gain or loss in the Statement of Operations. Gains or losses are realized upon termination of the swap agreements.
Swap agreements often are not actively traded on financial markets. The values assigned to them may differ significantly from the values that would be realized upon termination, and the differences could be material. Entering into swap agreements involves credit, legal, market and documentation risk that is not reflected in the amounts reported in the Statement of Assets and Liabilities. Such risks include the possibility that the party with whom the Fund contracts may default on its obligations to perform or disagree as to the meaning of contractual terms, or that the collateral that party posts may be insufficient or not timely received by the Fund. Credit risk may be particularly acute in an environment where financial services firms are exposed to systemic risks of the type evidenced by the insolvency of Lehman Brothers and subsequent market disruptions. The Fund had no swap agreements outstanding at the end of the period.
Securities lending
The Fund may lend its securities to qualified brokers. The loans are collateralized with cash or liquid securities with a market value at least equal to the market value of the securities upon entering into the loan. As with other extensions of credit, the Fund may bear the risk of loss with respect to the investment of the collateral, the risk of delay in and/or inability to exercise its rights with respect to the collateral, and the risk of delay in recovery or loss of rights in the loaned securities should the borrower of the securities
14
GMO Currency Hedged International Equity Fund
(A Series of GMO Trust)
Notes to Financial Statements — (Continued)
February 28, 2009
fail financially. If a loan is collateralized by U.S. government securities, the Fund receives a fee from the borrower. If a loan is collateralized by cash, the Fund typically invests the cash collateral for its own account. For the year from March 1, 2008 through February 28, 2009, the Fund did not participate in securities lending.
Taxes and distributions
The Fund intends to qualify each tax year as a regulated investment company under Subchapter M of the Internal Revenue Code of 1986, as amended (the "Code"). The Fund intends to distribute substantially all of its net investment income and all of its net realized short-term and long-term capital gain, if any, after giving effect to any available capital loss carryforwards for U.S. federal income tax purposes. Therefore, no provision for U.S. federal income or excise tax is necessary. Taxes on foreign interest and dividend income are generally withheld in accordance with the applicable country's tax treaty with the United States. The foreign withholding rates applicable to a Fund's investments in certain foreign jurisdictions may be higher if a significant portion of the Fund is held by non-U.S. shareholders.
The Fund's policy is to declare and pay distributions from net investment income, if any, semiannually, and from net realized short-term and long-term capital gain, if any, at least annually. All distributions are paid in shares of the Fund, at net asset value, unless the shareholder elects to receive cash distributions. Distributions to shareholders are recorded by the Fund on the ex-dividend date.
Income and capital gain distributions are determined in accordance with U.S. federal income tax regulations, which may differ from U.S. GAAP. Certain capital accounts in the financial statements are periodically adjusted for permanent differences in order to reflect their tax character. These adjustments have no impact on net assets or net asset value per share. Temporary differences that arise from recognizing certain items of income, expense, gain or loss in different periods for financial statement and tax purposes will reverse at some time in the future. Distributions in excess of net investment income or net realized gains are temporary over-distributions for financial statement purposes resulting from differences in the recognition or classification of income or distributions for financial statement and tax purposes.
U.S. GAAP and tax accounting differences primarily relate to foreign currency transactions and losses on wash sale transactions.
The following reclassification represents the amount necessary to report the stated components of net assets on a tax basis, excluding certain temporary differences, as of February 28, 2009. The financial highlights exclude these adjustments.
| Accumulated Undistributed Net Investment Income | Accumulated Net Realized Loss | Paid-in Capital | |||||||||
| $ | 2,194,133 | $ | (2,194,133 | ) | $ | — | |||||
15
GMO Currency Hedged International Equity Fund
(A Series of GMO Trust)
Notes to Financial Statements — (Continued)
February 28, 2009
The tax character of distributions declared to shareholders is as follows:
| 2/28/2009 | 2/29/2008 | ||||||||||
| Ordinary income (including any net short-term capital gain) | $ | 1,457,990 | $ | — | |||||||
| Net long-term capital gain | 8,027,267 | 48,200,678 | |||||||||
| Total distributions | $ | 9,485,257 | $ | 48,200,678 | |||||||
Distributions in excess of tax basis earnings and profits, if significant, are reported in the financial statements as a return of capital for tax purposes.
As of February 28, 2009, the components of distributable earnings on a tax basis consisted of the following:
| Undistributed ordinary income (including any net short-term capital gain) | $ | 2,749,761 | |||||
As of February 28, 2009, the approximate cost for U.S. federal income tax purposes and gross and net unrealized appreciation (depreciation) in value of investments were as follows:
| Aggregate Cost | Gross Unrealized Appreciation | Gross Unrealized (Depreciation) | Net Unrealized Appreciation (Depreciation) | ||||||||||||
| $ | 46,075,148 | $ | — | $ | (20,913,624 | ) | $ | (20,913,624 | ) | ||||||
The Fund is subject to the provisions of Financial Accounting Standards Board Interpretation No. 48 ("FIN 48"), Accounting for Uncertainty in Income Taxes — an Interpretation of FASB Statement No. 109. FIN 48 sets forth a minimum threshold for financial statement recognition of a tax position taken or expected to be taken in a tax return that could affect the Fund's financial statements. The Fund did not have any unrecognized tax benefits or liabilities at February 28, 2009, nor did it have any increases or decreases in unrecognized tax benefits or liabilities for the period then ended. The Fund is subject to examination prior to the expiration of the statute of limitations by U.S. federal and state tax authorities for tax returns filed.
Security transactions and related investment income
Security transactions in the financial statements are accounted for on the trade date. Dividend income, net of applicable foreign withholding taxes, if any, is recorded on the ex-dividend date or, if later, when the Fund is informed of the ex-dividend date. Interest income is recorded on the accrual basis and is adjusted for the amortization of premiums and accretion of discounts. Principal on inflation indexed securities is adjusted for inflation and any increase or decrease is recorded as interest income or loss. Income is not
16
GMO Currency Hedged International Equity Fund
(A Series of GMO Trust)
Notes to Financial Statements — (Continued)
February 28, 2009
recognized on securities for which collection is not expected. Non-cash dividends, if any, are recorded at the fair market value of the asset received. In determining the net gain or loss on securities sold, the Fund uses the identified cost basis for the purposes of determining the cost basis.
Expenses
The majority of the expenses of the Trust are directly identifiable to an individual fund. Expenses that are not readily identifiable to a specific fund are allocated taking into consideration, among other things, the nature and type of expense and the relative size of the funds. In addition, the Fund incurs fees and expenses indirectly as a shareholder in the underlying funds. Because the underlying funds have different expense and fee levels and the Fund may own different proportions of the underlying funds at different times, the amount of fees and expenses indirectly incurred by the Fund will vary (See Note 3).
Brown Brothers Harriman & Co. ("BBH") serves as custodian and fund accounting agent of the Fund. State Street Bank and Trust Company ("State Street") serves as transfer agent of the Fund. BBH and State Street's fees may be reduced by an earnings allowance calculated on the average daily cash balances the Fund maintains with each agent. The Fund receives the benefit of the earnings allowance. In addition, Goldman Sachs Agency Lending, the Fund's securities lending agent, has agreed to reimburse the Fund for certain transactional expenses related to securities lending activity. Credit balances or expense reimbursements used to reduce fees, if any, are reported as a reduction of expenses in the Statement of Operations.
Investment risks
The Fund is subject to risks involved in investing in foreign securities that are not presented by investments in U.S. securities. These risks may involve adverse political and economic developments, including expropriation and the possible imposition of capital controls or other foreign governmental laws or restrictions. In addition, the securities of some foreign companies and securities markets are less liquid and at times may be more volatile than securities of comparable U.S. companies and U.S. securities markets.
Recently issued accounting pronouncement
In March 2008, FASB issued Statement of Financial Accounting Standards No. 161, Disclosures about Derivative Instruments and Hedging Activities ("SFAS 161"). SFAS 161 is effective for fiscal years and interim periods beginning after November 15, 2008. SFAS 161 requires enhanced disclosures about the Fund's derivative and hedging activities. The Manager is currently evaluating the impact the adoption of SFAS 161 will have on the Fund's financial statement disclosures.
3. Fees and other transactions with affiliates
GMO receives a management fee for the services it provides to the Fund. That fee is paid monthly at the annual rate of 0.54% of average daily net assets. The Fund has adopted a Shareholder Service Plan under which the Fund pays GMO a shareholder service fee for client and shareholder service, reporting, and
17
GMO Currency Hedged International Equity Fund
(A Series of GMO Trust)
Notes to Financial Statements — (Continued)
February 28, 2009
other support. Pursuant to the Shareholder Service Plan, the shareholder service fee is calculated based on average daily net assets at the annual rate of 0.15% for Class III shares.
The Manager will waive the Fund's shareholder service fee to the extent that the aggregate of any direct and indirect shareholder service fees borne by the Fund exceeds 0.15%; provided, however, that the amount of this waiver will not exceed 0.15%.
Through at least June 30, 2009, the Manager has contractually agreed to reimburse the Fund for Fund expenses incurred through that date to the extent the Fund's total annual operating expenses (excluding "Excluded Expenses", as defined below) exceed 0.54% of the Fund's average daily net assets. Excluded Expenses include fees and expenses of the independent Trustees of the Trust, fees and expenses for legal services not approved by the Manager for the Trust, compensation and expenses of the Trust's Chief Compliance Officer ("CCO") (excluding any employee benefits), brokerage commissions, securities lending fees and expenses, interest expense, transfer taxes, and other investment-related costs (including expenses associated with investments in any company that is an investment company or would be an investment company under the 1940 Act, but for the exceptions to the definition of investment company provided in Section 3(c)(1) and 3(c)(7) of the 1940 Act), hedging transaction fees, extraordinary, non-recurring and certain other unusual expenses (including taxes) (collectively, "Excluded Fund Fees and Expenses"). In addition, the Manager has contractually agreed to reimburse the Fund through at least June 30, 2009 to the extent that the sum of (a) the Fund's total annual operating expenses (excluding Excluded Fund Fees and Expenses) and (b) the amount of fees and expenses incurred indirectly by the Fund through its investment in the underlying funds (excluding these Funds' Excluded Fund Fees and Expenses), exceeds 0.54% of the Fund's average daily net assets, subject to a maximum total reimbursement to the Fund equal to 0.54% of the Fund's average daily net assets.
The Fund incurs varying fees and expenses indirectly as a shareholder in the underlying funds because of that variation the levels of indirect net expenses set forth below are affected by the Manager's asset allocation decisions. For the year ended February 28, 2009, these indirect fees and expenses expressed as an annualized percentage of the Fund's average daily net assets were as follows:
| Indirect Net Expenses (excluding shareholder service fees) | Indirect Shareholder Service Fees | Total Indirect Expenses | |||||||||||||
| 0.498 | % | 0.087 | % | 0.585 | % | ||||||||||
The Fund's portion of the fees paid by the Trust to the Trust's independent Trustees and CCO during the year ended February 28, 2009 was $218 and $154, respectively. The compensation and expenses of the CCO are included in miscellaneous expenses in the Statement of Operations. The Fund paid no remuneration to any other officer of the Trust.
18
GMO Currency Hedged International Equity Fund
(A Series of GMO Trust)
Notes to Financial Statements — (Continued)
February 28, 2009
4. Purchases and sales of securities
Cost of purchases and proceeds from sales of securities, excluding short-term investments, for the year ended February 28, 2009 aggregated $14,961,102 and $4,199,000, respectively.
5. Guarantees
In the normal course of business the Fund enters into contracts with third-party service providers that contain a variety of representations and warranties and that provide general indemnifications. The Fund's maximum exposure under these arrangements is unknown, as it involves future claims that may be made against the Fund that have not yet occurred. Based on experience, management is of the view that the risk of loss in connection with its indemnification obligations is remote; however, there can be no assurance that such obligations will not result in material liabilities that adversely affect the Fund.
6. Principal shareholders and related parties
As of February 28, 2009, 99.84% of the outstanding shares of the Fund were held by one shareholder. On that date, no other shareholder owned more than 10% of the outstanding shares of the Fund. Redemptions from (or investments into) the Fund by or on behalf of this large shareholder may have a material effect on the Fund.
As of February 28, 2009, 0.1% of the Fund's shares were held by senior management of the Manager and GMO Trust officers and 99.84% of the Fund's shares were held by accounts for which the Manager had investment discretion.
7. Share transactions
The Declaration of Trust permits the Trust to issue an unlimited number of shares of beneficial interest (without par value). Transactions in Fund shares were as follows:
| Year Ended February 28, 2009 | Year Ended February 29, 2008 | ||||||||||||||||||
| Class III: | Shares | Amount | Shares | Amount | |||||||||||||||
| Shares sold | 3,152,794 | $ | 7,126,233 | 839,414 | $ | 6,424,624 | |||||||||||||
| Shares issued to shareholders in reinvestment of distributions | 2,760,917 | 9,207,751 | 7,433,717 | 47,788,021 | |||||||||||||||
| Shares repurchased | (353,573 | ) | (1,357,152 | ) | (33,056,614 | ) | (213,393,909 | ) | |||||||||||
| Net increase (decrease) | 5,560,138 | $ | 14,976,832 | (24,783,483 | ) | $ | (159,181,264 | ) | |||||||||||
19
GMO Currency Hedged International Equity Fund
(A Series of GMO Trust)
Notes to Financial Statements — (Continued)
February 28, 2009
8. Investments in affiliated issuers
A summary of the Fund's transactions in the shares of other funds of the Trust during the year ended February 28, 2009 is set forth below:
| Affiliate | Value, beginning of period | Purchases | Sales Proceeds | Dividend Income | Distributions of Realized Gains | Value, end of period | |||||||||||||||||||||
| GMO International Growth Equity Fund, Class IV | $ | 15,047,067 | $ | 7,386,840 | $ | 2,519,000 | $ | 483,829 | $ | 488,011 | $ | 12,499,409 | |||||||||||||||
| GMO International Intrinsic Value Fund, Class IV | 15,016,826 | 7,574,262 | 1,680,000 | 535,609 | 777,653 | 12,473,977 | |||||||||||||||||||||
| Totals | $ | 30,063,893 | $ | 14,961,102 | $ | 4,199,000 | $ | 1,019,438 | $ | 1,265,664 | $ | 24,973,386 | |||||||||||||||
20
Report of Independent Registered Public Accounting Firm
To the Trustees of GMO Trust and the Shareholders of
GMO Currency Hedged International Equity Fund:
In our opinion, the accompanying statement of assets and liabilities, including the schedule of investments, and the related statements of operations and of changes in net assets and the financial highlights present fairly, in all material respects, the financial position of GMO Currency Hedged International Equity Fund (the "Fund") at February 28, 2009, the results of its operations for the year then ended, the changes in its net assets for each of the two years in the period then ended and the financial highlights for each of the five years in the period then ended, in conformity with accounting principles generally accepted in the United States of America. These financial statements and financial highlights (hereafter referred to as "financial statements") are the responsibility of the Fund's management. Our responsibility is to express an opinion on these financial statements based on our audits. We conducted our audits of t hese financial statements in accordance with the standards of the Public Company Accounting Oversight Board (United States). Those standards require that we plan and perform the audit to obtain reasonable assurance about whether the financial statements are free of material misstatement. An audit includes examining, on a test basis, evidence supporting the amounts and disclosures in the financial statements, assessing the accounting principles used and significant estimates made by management, and evaluating the overall financial statement presentation. We believe that our audits, which included confirmation of securities at February 28, 2009 by correspondence with the custodian and brokers, provide a reasonable basis for our opinion.
PricewaterhouseCoopers LLP
Boston, Massachusetts
April 29, 2009
21
GMO Currency Hedged International Equity Fund
(A Series of GMO Trust)
Fund Expenses
February 28, 2009 (Unaudited)
Expense Examples: The following information is in relation to expenses for the six month period ended February 28, 2009.
As a shareholder of the Fund, you may incur two types of costs: (1) transaction costs, and (2) ongoing costs, including management fees, shareholder service fees, and other Fund expenses. This example is intended to help you understand your ongoing costs (in dollars) of investing in the Fund and to compare these costs with the ongoing costs of investing in other mutual funds.
These examples are based on an investment of $1,000 invested at the beginning of the period and held for the entire period, September 1, 2008 through February 28, 2009.
Actual Expenses
The first line of the table below provides information about actual account values and actual expenses. You may use the information in this line, together with the amount you invested, to estimate the expenses that you paid over the period. Simply divide your account value by $1,000 (for example, a $10,000,000 account value divided by $1,000 = 10,000), then multiply the result by the number in the first line under the heading entitled "Net Expense Incurred" to estimate the expenses you paid on your account during this period.
Hypothetical Example for Comparison Purposes
The second line of the table below provides information about hypothetical account values and hypothetical expenses based on the Fund's actual expense ratio and an assumed rate of return of 5% per year before expenses, which is not the Fund's actual return. The hypothetical account values and expenses may not be used to estimate the actual ending account balance or expenses you paid for the period. You may use this information to compare the ongoing costs of investing in the Fund with other funds. To do so, compare this 5% hypothetical example with the 5% hypothetical examples that appear in the shareholder reports of other funds.
Please note that the expenses shown in the table are meant to highlight your ongoing costs only and do not reflect any transactional costs. Therefore, the second line of the table is useful in comparing ongoing costs only, and will not help you determine the relative total costs of owning different funds. In addition, if these transactional costs were included, your costs would have been higher.
| Annualized Net Expense Ratio | Beginning Account Value | Ending Account Value | Net Expense Incurred* | ||||||||||||||||
| Class III | |||||||||||||||||||
| 1) Actual | 0.69 | % | $ | 1,000.00 | $ | 673.60 | $ | 2.86 | |||||||||||
| 2) Hypothetical | 0.69 | % | $ | 1,000.00 | $ | 1,021.37 | $ | 3.46 | |||||||||||
* Expenses are calculated using the Class's annualized expense ratio (including indirect expenses incurred) for the six months ended February 28, 2009, multiplied by the average account value over the period, multiplied by 181 days in the period, divided by 365 days in the year.
22
GMO Currency Hedged International Equity Fund
(A Series of GMO Trust)
Tax Information for the Tax Year Ended February 28, 2009 (Unaudited)
The Fund will notify shareholders of amounts for use in preparing 2009 income tax forms in early 2010.
The Fund's distributions to shareholders include $8,027,267 from long-term capital gains.
For taxable, non-corporate shareholders, 47.87% of the income and short-term capital gains, if any, distributed in the Fund's fiscal year ended February 28, 2009 represents qualified dividend income subject to the 15% rate category.
23
GMO Currency Hedged International Equity Fund
(A Series of GMO Trust)
Note Concerning Distributions (Unaudited)
The Fund previously reported estimated sources of any dividends, short-term capital gains, and long-term capital gains distributions paid on a per share basis. Pursuant to Rule 19a-1(e) of the Investment Company Act, the following serves as a correction of such estimates. 0.71% of distributions to shareholders declared from net realized gains during the Fund's fiscal year were reclassified to distributions from net investment income and are reflected as such in the Statement of Changes in Net Assets.
24
Trustees and Officers (Unaudited)
The following tables list the Trust's Trustees and Officers as of the date of this report; their address and date of birth ("DOB"); their position with the Trust; the length of time holding that position with the Trust; their principal occupation(s) during the past five years; the number of portfolios in the fund complex they oversee; and other directorships they hold in companies subject to registration or reporting requirements of the Securities Exchange Act of 1934 (generally called "public companies") or in registered investment companies. The Trust's Statement of Additional Information ("SAI") includes additional information about the Trust's trustees, including changes subsequent to the date of the report. The SAI is available, without charge, upon request by writing GMO, c/o GMO Trust, 40 Rowes Wharf, Boston, MA 02110.
Independent Trustees:
| Name, Address, and DOB | Position(s) Held with Trust | Term of Office1 and Length of Time Served | Principal Occupation(s) During Past Five Years | Number of Portfolios in Fund Complex Overseen by Trustee | Other Directorships Held by Trustee | ||||||||||||||||||
| Donald W. Glazer, Esq. c/o GMO Trust 40 Rowes Wharf Boston, MA 02110 DOB: 07/26/1944 | Chairman of the Board of Trustees | Chairman of the Board of Trustees since March 2005; Lead Independent Trustee (September 2004 – March 2005); Trustee since December 2000. | Consultant – Law and Business2; Author of Legal Treatises. | 59 | None. | ||||||||||||||||||
1 Each Trustee is elected to serve during the continued lifetime of the Trust until he/she dies, resigns or is removed, or if sooner, until the next meeting of Shareholders called for the purpose of electing Trustees and until the election and qualification of his/her successor.
2 As part of Mr. Glazer's work as a consultant, he provides part-time consulting services to Goodwin Procter LLP ("Goodwin"). Goodwin has provided legal services to Renewable Resources, LLC, an affiliate of GMO; GMO, in connection with its relationship with Renewable Resources; and funds managed by Renewable Resources. Mr. Glazer has represented that he has no financial interest in, and is not involved in the provision of, such legal services. In the calendar years ended December 31, 2007 and December 31, 2008, these entities paid $789,416 and $183,864 respectively, in legal fees and disbursements to Goodwin. In correspondence with the Staff of the Securities and Exchange Commission beginning in August 2006, the Independent Trustees' legal counsel provided the Staff with information regarding Mr. Glazer's relationship with Goodwin and h is other business activities. On September 11, 2007, based on information that had been given to the Staff as of that date, the Staff provided oral no-action assurance consistent with the opinion of the Independent Trustees' legal counsel that Mr. Glazer is not an "interested person" of the Trust.
25
Independent Trustees — (Continued)
| Name, Address, and DOB | Position(s) Held with Trust | Term of Office1 and Length of Time Served | Principal Occupation(s) During Past Five Years | Number of Portfolios in Fund Complex Overseen by Trustee | Other Directorships Held by Trustee | ||||||||||||||||||
| W. Nicholas Thorndike c/o GMO Trust 40 Rowes Wharf Boston, MA 02110 DOB: 03/28/1933 | Trustee | Since March 2005. | Director or trustee of various corporations and charitable organizations, including Courier Corporation (a book publisher and manufacturer) (July 1989 – present); Putnam Funds (December 1992 – June 2004); and Providence Journal (a newspaper publisher) (December 1986 – December 2003). | 59 | Director of Courier Corporation (a book publisher and manufacturer); Member of the Investment Committee of Partners HealthCare System, Inc.3 | ||||||||||||||||||
| Peter Tufano c/o GMO Trust 40 Rowes Wharf Boston, MA 02110 DOB: 04/22/1957 | Trustee | Since December 2008. | Sylvan C. Coleman Professor of Financial Management, Harvard Business School (since 1989). | 59 | Trustee of State Street Navigator Securities Lending Trust (3 Portfolios). | ||||||||||||||||||
1 Each Trustee is elected to serve during the continued lifetime of the Trust until he/she dies, resigns or is removed, or if sooner, until the next meeting of Shareholders called for the purpose of electing Trustees and until the election and qualification of his/her successor.
3 Partners HealthCare System, Inc. is a client of the Manager.
26
Principal Officers:
| Name, Address, and DOB | Position(s) Held with Trust | Term of Office4 and Length of Time Served | Principal Occupation(s) During Past Five Years5 | ||||||||||||
| J.B. Kittredge DOB: 08/22/1954 | President and Chief Executive Officer | Since March 2009. | General Counsel, Grantham, Mayo, Van Otterloo & Co. LLC (October 2005 – Present); Partner, Ropes & Gray LLP. | ||||||||||||
| Sheppard N. Burnett c/o GMO Trust 40 Rowes Wharf Boston, MA 02110 DOB: 10/24/1968 | Treasurer and Chief Financial Officer | Chief Financial Officer since March 2007; Treasurer since November 2006; Assistant Treasurer, September 2004 – November 2006. | Fund Administration Staff, Grantham, Mayo, Van Otterloo & Co. LLC (June 2004 – present); Vice President, Director of Tax, Columbia Management Group (2002 – 2004). | ||||||||||||
| Brent C. Arvidson c/o GMO Trust 40 Rowes Wharf Boston, MA 02110 DOB: 06/26/1969 | Assistant Treasurer | Since August 1998. | Senior Fund Administrator, Grantham, Mayo, Van Otterloo & Co. LLC. | ||||||||||||
| John L. Nasrah c/o GMO Trust 40 Rowes Wharf Boston, MA 02110 DOB: 05/27/1977 | Assistant Treasurer | Since March 2007. | Fund Administrator, Grantham, Mayo, Van Otterloo & Co. LLC (September 2004 – present); Tax Analyst, Bain & Company, Inc. (June 2003 – September 2004). | ||||||||||||
| Mahmoodur Rahman c/o GMO Trust 40 Rowes Wharf Boston, MA 02110 DOB: 11/30/1967 | Assistant Treasurer | Since September 2007. | Fund Administrator, Grantham, Mayo, Van Otterloo & Co. LLC (April 2007 – present); Vice President and Senior Tax Manager, Massachusetts Financial Services Company (January 2000 – April 2007). | ||||||||||||
| Michael E. Gillespie c/o GMO Trust 40 Rowes Wharf Boston, MA 02110 DOB: 02/18/1958 | Chief Compliance Officer | Since March 2005. | Vice President of Compliance (June 2004 – February 2005) and Director of Domestic Compliance (March 2002 – June 2004), Fidelity Investments. | ||||||||||||
4 Each officer is elected to hold such office until his or her successor is duly elected and qualified to carry out the duties and responsibilities of the office, or until he or she resigns or is removed from office.
5 Each of Messrs. Burnett, Arvidson, Bohan, and Pottle serves as an officer and/or director of certain pooled investment vehicles of which GMO or an affiliate of GMO serves as the investment adviser.
27
Principal Officers — (Continued)
| Name, Address, and DOB | Position(s) Held with Trust | Term of Office4 and Length of Time Served | Principal Occupation(s) During Past Five Years5 | ||||||||||||
| Jason B. Harrison c/o GMO Trust 40 Rowes Wharf Boston, MA 02110 DOB: 01/29/1977 | Vice President and Clerk | Vice President since November 2006; Clerk since March 2006. | Legal Counsel, Grantham, Mayo, Van Otterloo & Co. LLC (since February 2006) and Attorney, Ropes & Gray LLP (September 2002 – February 2006). | ||||||||||||
| David L. Bohan c/o GMO Trust 40 Rowes Wharf Boston, MA 02110 DOB: 06/21/1964 | Vice President and Assistant Clerk | Vice President since March 2005; Assistant Clerk since March 2006. | Legal Counsel, Grantham, Mayo, Van Otterloo & Co. LLC. | ||||||||||||
| Gregory L. Pottle c/o GMO Trust 40 Rowes Wharf Boston, MA 02110 DOB: 07/09/1971 | Vice President and Assistant Clerk | Since November 2006. | Legal Counsel, Grantham, Mayo, Van Otterloo & Co. LLC. | ||||||||||||
| Anne K. Trinque c/o GMO Trust 40 Rowes Wharf Boston, MA 02110 DOB: 04/15/1978 | Vice President and Assistant Clerk | Since September 2007. | Legal Counsel, Grantham, Mayo, Van Otterloo & Co. LLC (January 2007 – present); Attorney, Goodwin Procter LLP (September 2003 – January 2007). | ||||||||||||
| Cheryl Wakeham c/o GMO Trust 40 Rowes Wharf Boston, MA 02110 DOB: 10/29/1958 | Vice President and Anti-Money Laundering Officer | Since December 2004. | Manager, Client Service Administration, Grantham, Mayo, Van Otterloo & Co. LLC. | ||||||||||||
4 Each officer is elected to hold such office until his or her successor is duly elected and qualified to carry out the duties and responsibilities of the office, or until he or she resigns or is removed from office.
5 Each of Messrs. Burnett, Arvidson, Bohan, and Pottle serves as an officer and/or director of certain pooled investment vehicles of which GMO or an affiliate of GMO serves as the investment adviser.
28
GMO Global Equity Allocation Fund
(formerly GMO Global (U.S.+) Equity Allocation Fund)
(A Series of GMO Trust)
Annual Report
February 28, 2009
For a free copy of the Fund's proxy voting guidelines, shareholders may call 1-617-346-7646 (collect) or visit the Securities and Exchange Commission's website at www.sec.gov. Information regarding how the Fund voted proxies relating to portfolio securities during the most recent 12-month period ended June 30 is available on GMO's website at www.gmo.com, or on the Securities and Exchange Commission's website at www.sec.gov.
The Fund files its complete schedule of portfolio holdings with the Securities and Exchange Commission for the first and third quarter of each fiscal year on Form N-Q, which is available on the Commission's website at www.sec.gov. The Fund's Form N-Q may be reviewed and copied at the Commission's Public Reference Room in Washington, D.C. Information on the operation of the Public Reference Room may be obtained by calling 1-800-SEC-0330. The Fund has a policy with respect to disclosure of portfolio holdings under which it may also make available on GMO's website at www.gmo.com a complete schedule of portfolio holdings.
This report is prepared for the general information of shareholders. It is authorized for distribution to prospective investors only when preceded or accompanied by a prospectus for the GMO Trust, which contains a complete discussion of the risks associated with an investment in this Fund and other important information. The GMO Trust prospectus can be obtained at www.gmo.com.
GMO Global Equity Allocation Fund
(formerly GMO Global (U.S.+) Equity Allocation Fund)
(A Series of GMO Trust)
Portfolio Management
Day-to-day management of the Fund's portfolio is the responsibility of the Asset Allocation team at Grantham, Mayo, Van Otterloo & Co. LLC.
Management Discussion and Analysis of Fund Performance
The GMO Global Equity Allocation Fund (formerly GMO Global (U.S.+) Equity Allocation Fund) returned -39.4% for the fiscal year ended February 28, 2009, as compared to -48.2% for the Fund's benchmark, the MSCI ACWI (All Country World Index) Index. During the fiscal year the Fund was exposed to global equity and fixed income securities through its investment in underlying GMO mutual funds.
Implementation was positive, with U.S. Quality Equity Fund, U.S. Core Equity Fund, and Alpha Only Fund outperforming their benchmarks by large amounts and International Intrinsic Value Fund, International Growth Equity Fund, and International Core Equity Fund also outperforming. Emerging Markets Fund and Flexible Equities Fund underperformed their benchmarks.
Asset allocation was also positive, driven by the Fund's overweight to U.S. equities and underweight to overall equities.
The views expressed herein are exclusively those of Grantham, Mayo, Van Otterloo & Co. LLC Management as of the date of this report and are subject to change. GMO disclaims any responsibility to update such views. They are not meant as investment advice. References to specific securities are not recommendations of such securities and may not be representative of any GMO portfolio's current or future investments.
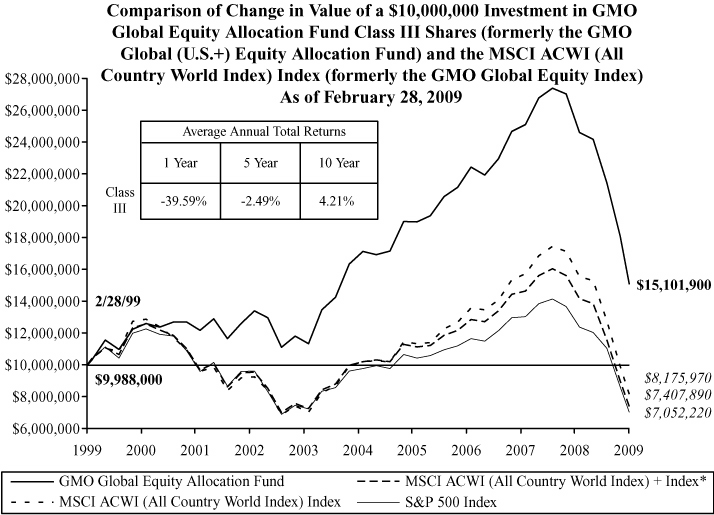
Performance data quoted represents past performance and is not indicative of future results. The investment return and principal value of an investment will fluctuate so that an investor's shares, when redeemed, may be worth more or less than their original cost. Current performance data may be lower or higher than the performance data provided herein. To obtain performance information to the most recent month-end, visit www.gmo.com. Performance shown is net of all fees after reimbursement from the Manager. Each performance figure assumes a purchase at the beginning and redemption at the end of the stated period and reflects a transaction fee of .12% on the purchase and .12% on the redemption. Transaction fees are retained by the Fund to cover trading costs. Returns would have been lower had certain expenses not been reimbursed during the periods shown and do not include the effect of taxes on distributions and redemptions. All information is unaudited.
* The MSCI ACWI (All Country World Index) + Index represents 75% S&P 500 Index and 25% MSCI ACWI (All Country World Index) Index prior to 5/30/08 and MSCI ACWI (All Country World Index) Index thereafter.
GMO Global Equity Allocation Fund
(formerly GMO Global (U.S.+) Equity Allocation Fund)
(A Series of GMO Trust)
Investments Concentration Summary
February 28, 2009 (Unaudited)
| Asset Class Summary* | % of Total Net Assets | ||||||
| Common Stocks | 92.3 | % | |||||
| Short-Term Investments | 3.9 | ||||||
| Cash and Cash Equivalents | 2.9 | ||||||
| Preferred Stocks | 1.1 | ||||||
| Investment Funds | 0.3 | ||||||
| Private Equity Securities | 0.1 | ||||||
| Debt Obligations | 0.0 | ||||||
| Convertible Securities | 0.0 | ||||||
| Rights and Warrants | 0.0 | ||||||
| Forward Currency Contracts | (0.1 | ) | |||||
| Swaps | (1.3 | ) | |||||
| Futures | (1.6 | ) | |||||
| Other | 2.4 | ||||||
| 100.0 | % | ||||||
* The table above incorporates aggregate indirect asset class exposure associated with investments in other funds of GMO Trust ("underlying funds").
1
GMO Global Equity Allocation Fund
(formerly GMO Global (U.S.+) Equity Allocation Fund)
(A Series of GMO Trust)
Investments Concentration Summary — (Continued)
February 28, 2009 (Unaudited)
| Country Summary** | % of Investments | ||||||
| United States | 51.4 | % | |||||
| Japan | 12.2 | ||||||
| Euro Region*** | 10.7 | ||||||
| United Kingdom | 8.1 | ||||||
| Switzerland | 4.2 | ||||||
| Brazil | 1.7 | ||||||
| Korea | 1.7 | ||||||
| Taiwan | 1.3 | ||||||
| Australia | 1.1 | ||||||
| China | 1.1 | ||||||
| Hong Kong | 0.9 | ||||||
| Canada | 0.8 | ||||||
| South Africa | 0.7 | ||||||
| Singapore | 0.5 | ||||||
| Sweden | 0.5 | ||||||
| Turkey | 0.5 | ||||||
| Denmark | 0.4 | ||||||
| Thailand | 0.4 | ||||||
| Russia | 0.3 | ||||||
| India | 0.2 | ||||||
| Malaysia | 0.2 | ||||||
| Norway | 0.2 | ||||||
| Chile | 0.1 | ||||||
| Czech Republic | 0.1 | ||||||
| Egypt | 0.1 | ||||||
| Hungary | 0.1 | ||||||
| Indonesia | 0.1 | ||||||
| Israel | 0.1 | ||||||
| Mexico | 0.1 | ||||||
| Philippines | 0.1 | ||||||
| Poland | 0.1 | ||||||
| 100.0 | % | ||||||
** The table above incorporates aggregate indirect country exposure associated with investments in the underlying funds except for GMO Alpha Only Fund. The table excludes short-term investments. The table includes exposure through the use of derivative contracts.
*** The "Euro Region" is comprised of Austria, Belgium, Finland, France, Germany, Greece, Ireland, Italy, Netherlands, Portugal and Spain.
2
GMO Global Equity Allocation Fund
(formerly GMO Global (U.S.+) Equity Allocation Fund)
(A Series of GMO Trust)
Schedule of Investments
(showing percentage of total net assets)
February 28, 2009
| Shares / Par Value ($) | Description | Value ($) | |||||||||
| AFFILIATED ISSUERS — 100.0% | |||||||||||
| Mutual Funds — 100.0% | |||||||||||
| 2,639,208 | GMO Alpha Only Fund, Class IV | 15,228,232 | |||||||||
| 6,223,360 | GMO Emerging Markets Fund, Class VI | 39,020,469 | |||||||||
| 539,898 | GMO Flexible Equities Fund, Class VI | 8,309,024 | |||||||||
| 5,010,203 | GMO International Core Equity Fund, Class VI | 90,834,974 | |||||||||
| 2,599,738 | GMO International Growth Equity Fund, Class IV | 37,592,210 | |||||||||
| 2,309,868 | GMO International Intrinsic Value Fund, Class IV | 32,338,156 | |||||||||
| 16,772 | GMO Short-Duration Investment Fund, Class III | 119,922 | |||||||||
| 3,788,516 | GMO U.S. Core Equity Fund, Class VI | 28,906,379 | |||||||||
| 1,333 | GMO U.S. Growth Fund, Class III | 13,953 | |||||||||
| 12,618,178 | GMO U.S. Quality Equity Fund, Class VI | 178,925,759 | |||||||||
| 431,289,078 | |||||||||||
| Private Investment Fund — 0.0% | |||||||||||
| 175 | GMO SPV I, LLC (a)(b) | 49 | |||||||||
| TOTAL AFFILIATED ISSUERS (COST $631,300,623) | 431,289,127 | ||||||||||
| SHORT-TERM INVESTMENTS — 0.0% | |||||||||||
| 24,943 | State Street Eurodollar Time Deposit, 0.01%, due 03/02/09 | 24,943 | |||||||||
| TOTAL SHORT-TERM INVESTMENTS (COST $24,943) | 24,943 | ||||||||||
| TOTAL INVESTMENTS — 100.0% (Cost $631,325,566) | 431,314,070 | ||||||||||
| Other Assets and Liabilities (net) — (0.0%) | (35,883 | ) | |||||||||
| TOTAL NET ASSETS — 100.0% | $ | 431,278,187 | |||||||||
See accompanying notes to the financial statements.
3
GMO Global Equity Allocation Fund
(formerly GMO Global (U.S.+) Equity Allocation Fund)
(A Series of GMO Trust)
Schedule of Investments — (Continued)
February 28, 2009
Notes to Schedule of Investments:
(a) Security valued at fair value using methods determined in good faith by or at the direction of the Trustees of GMO Trust (Note 2).
(b) Underlying investment represents interests in defaulted securities.
See accompanying notes to the financial statements.
4
GMO Global Equity Allocation Fund
(formerly GMO Global (U.S.+) Equity Allocation Fund)
(A Series of GMO Trust)
Statement of Assets and Liabilities — February 28, 2009
| Assets: | |||||||
| Investments in unaffiliated issuers, at value (cost $24,943) (Note 2) | $ | 24,943 | |||||
| Investments in affiliated issuers, at value (cost $631,300,623) (Notes 2 and 8) | 431,289,127 | ||||||
| Receivable for expenses reimbursed by Manager (Note 3) | 10,052 | ||||||
| Total assets | 431,324,122 | ||||||
| Liabilities: | |||||||
| Payable to affiliate for (Note 3): | |||||||
| Trustees and Chief Compliance Officer of GMO Trust fees | 1,059 | ||||||
| Accrued expenses | 44,876 | ||||||
| Total liabilities | 45,935 | ||||||
| Net assets | $ | 431,278,187 | |||||
| Net assets consist of: | |||||||
| Paid-in capital | $ | 647,912,797 | |||||
| Accumulated net realized loss | (16,623,114 | ) | |||||
| Net unrealized depreciation | (200,011,496 | ) | |||||
| $ | 431,278,187 | ||||||
| Net assets attributable to: | |||||||
| Class III shares | $ | 431,278,187 | |||||
| Shares outstanding: | |||||||
| Class III | 81,452,202 | ||||||
| Net asset value per share: | |||||||
| Class III | $ | 5.29 | |||||
See accompanying notes to the financial statements.
5
GMO Global Equity Allocation Fund
(formerly GMO Global (U.S.+) Equity Allocation Fund)
(A Series of GMO Trust)
Statement of Operations — Year Ended February 28, 2009
| Investment Income: | |||||||
| Dividends from affiliated issuers (Note 8) | $ | 14,474,949 | |||||
| Interest | 339 | ||||||
| Total investment income | 14,475,288 | ||||||
| Expenses: | |||||||
| Custodian, fund accounting agent and transfer agent fees | 35,585 | ||||||
| Audit and tax fees | 33,380 | ||||||
| Legal fees | 8,378 | ||||||
| Trustees fees and related expenses (Note 3) | 4,891 | ||||||
| Registration fees | 9,929 | ||||||
| Miscellaneous | 4,459 | ||||||
| Total expenses | 96,622 | ||||||
| Fees and expenses reimbursed by Manager (Note 3) | (89,320 | ) | |||||
| Expense reductions (Note 2) | (2,263 | ) | |||||
| Net expenses | 5,039 | ||||||
| Net investment income (loss) | 14,470,249 | ||||||
| Realized and unrealized gain (loss): | |||||||
| Net realized gain (loss) on: | |||||||
| Investments in affiliated issuers | (25,254,379 | ) | |||||
| Realized gains distributions from affiliated issuers (Note 8) | 17,361,022 | ||||||
| Net realized gain (loss) | (7,893,357 | ) | |||||
| Change in net unrealized appreciation (depreciation) on: | |||||||
| Investments in affiliated issuers | (182,023,986 | ) | |||||
| Net realized and unrealized gain (loss) | (189,917,343 | ) | |||||
| Net increase (decrease) in net assets resulting from operations | $ | (175,447,094 | ) | ||||
See accompanying notes to the financial statements.
6
GMO Global Equity Allocation Fund
(formerly GMO Global (U.S.+) Equity Allocation Fund)
(A Series of GMO Trust)
Statement of Changes in Net Assets
| Year Ended February 28, 2009 | Year Ended February 29, 2008 | ||||||||||
| Increase (decrease) in net assets: | |||||||||||
| Operations: | |||||||||||
| Net investment income (loss) | $ | 14,470,249 | $ | 6,114,741 | |||||||
| Net realized gain (loss) | (7,893,357 | ) | 65,404,358 | ||||||||
| Change in net unrealized appreciation (depreciation) | (182,023,986 | ) | (67,173,593 | ) | |||||||
| Net increase (decrease) in net assets from operations | (175,447,094 | ) | 4,345,506 | ||||||||
| Distributions to shareholders from: | |||||||||||
| Net investment income | |||||||||||
| Class III | (15,018,150 | ) | (15,144,364 | ) | |||||||
| Net realized gains | |||||||||||
| Class III | (35,633,100 | ) | (46,141,439 | ) | |||||||
| (50,651,250 | ) | (61,285,803 | ) | ||||||||
| Net share transactions (Note 7): | |||||||||||
| Class III | 300,532,912 | 59,195,425 | |||||||||
| Purchase premiums and redemption fees (Notes 2 and 7): | |||||||||||
| Class III | 319,677 | 32,563 | |||||||||
| Total increase (decrease) in net assets resulting from net share transactions, purchase premiums and redemption fees | 300,852,589 | 59,227,988 | |||||||||
| Total increase (decrease) in net assets | 74,754,245 | 2,287,691 | |||||||||
| Net assets: | |||||||||||
| Beginning of period | 356,523,942 | 354,236,251 | |||||||||
| End of period (including accumulated undistributed net investment income of $0 and $3, respectively) | $ | 431,278,187 | $ | 356,523,942 | |||||||
See accompanying notes to the financial statements.
7
GMO Global Equity Allocation Fund
(formerly GMO Global (U.S.+) Equity Allocation Fund)
(A Series of GMO Trust)
Financial Highlights
(For a Class III share outstanding throughout each period)
| Year Ended February 28/29, | |||||||||||||||||||||||
| 2009 | 2008 | 2007 | 2006 | 2005 | |||||||||||||||||||
| Net asset value, beginning of period | $ | 10.25 | $ | 11.96 | $ | 11.89 | $ | 11.63 | $ | 10.86 | |||||||||||||
| Income (loss) from investment operations: | |||||||||||||||||||||||
| Net investment income (loss)(a)† | 0.34 | 0.20 | 0.23 | 0.23 | 0.23 | ||||||||||||||||||
| Net realized and unrealized gain (loss) | (4.01 | ) | 0.09 | (b) | 1.08 | 1.32 | 1.23 | ||||||||||||||||
| Total from investment operations | (3.67 | ) | 0.29 | 1.31 | 1.55 | 1.46 | |||||||||||||||||
| Less distributions to shareholders: | |||||||||||||||||||||||
| From net investment income | (0.31 | ) | (0.49 | ) | (0.38 | ) | (0.34 | ) | (0.27 | ) | |||||||||||||
| From net realized gains | (0.98 | ) | (1.51 | ) | (0.86 | ) | (0.95 | ) | (0.42 | ) | |||||||||||||
| Total distributions | (1.29 | ) | (2.00 | ) | (1.24 | ) | (1.29 | ) | (0.69 | ) | |||||||||||||
| Net asset value, end of period | $ | 5.29 | $ | 10.25 | $ | 11.96 | $ | 11.89 | $ | 11.63 | |||||||||||||
| Total Return(c) | (39.44 | )% | 1.01 | % | 11.56 | % | 13.91 | % | 13.70 | % | |||||||||||||
| Ratios/Supplemental Data: | |||||||||||||||||||||||
| Net assets, end of period (000's) | $ | 431,278 | $ | 356,524 | $ | 354,236 | $ | 326,032 | $ | 335,819 | |||||||||||||
| Net expenses to average daily net assets(d)(e) | 0.00 | %(f) | 0.00 | %(f) | 0.00 | % | 0.00 | % | 0.00 | % | |||||||||||||
| Net investment income to average daily net assets(a) | 4.27 | % | 1.63 | % | 1.90 | % | 1.99 | % | 2.11 | % | |||||||||||||
| Portfolio turnover rate | 52 | % | 30 | % | 15 | % | 20 | % | 17 | % | |||||||||||||
| Fees and expenses reimbursed by the Manager to average daily net assets: | 0.03 | % | 0.02 | % | 0.02 | % | 0.02 | % | 0.04 | % | |||||||||||||
| Purchase premiums and redemption fees consisted of the following per share amounts:† | $ | 0.01 | $ | 0.00 | (g) | $ | 0.00 | (g) | $ | 0.00 | (g) | $ | 0.00 | (g) | |||||||||
(a) Net investment income is affected by the timing of the declaration of dividends by the underlying funds in which the Fund invests.
(b) The amount shown for a share outstanding does not correspond with the aggregate net realized and unrealized gain (loss) on investments due to the timing of purchases and redemptions of Fund shares in relation to fluctuating market values of the investments of the Fund.
(c) The total returns would have been lower had certain expenses not been reimbursed and/or waived during the periods shown and assumes the effect of reinvested distributions. Calculation excludes purchase premiums and redemption fees which are borne by the shareholder.
(d) Net expenses exclude expenses incurred indirectly through investment in the underlying funds (See Note 3).
(e) Net expenses to average daily net assets were less than 0.01%.
(f) The net expense ratio does not include the effect of expense reductions.
(g) Purchase premiums and redemption fees were less than $0.01 per share.
† Calculated using average shares outstanding throughout the period.
See accompanying notes to the financial statements.
8
GMO Global Equity Allocation Fund
(formerly GMO Global (U.S.+) Equity Allocation Fund)
(A Series of GMO Trust)
Notes to Financial Statements
February 28, 2009
1. Organization
GMO Global Equity Allocation Fund (formerly GMO Global (U.S.+) Equity Allocation Fund) (the "Fund"), is a series of GMO Trust (the "Trust"). The Fund is registered under the Investment Company Act of 1940, as amended, as an open-end, diversified management investment company. The Fund is advised and managed by Grantham, Mayo, Van Otterloo & Co. LLC (the "Manager" or "GMO"). The Trust was established as a Massachusetts business trust under the laws of The Commonwealth of Massachusetts on June 24, 1985. The Declaration of Trust permits the Trustees of the Trust ("Trustees") to create an unlimited number of series of shares ("Funds") and to subdivide Funds into classes.
The Fund seeks total return greater than that of the MSCI ACWI (All Country World Index) Index. The Fund is a fund of funds and invests primarily in shares of the GMO International Equity Funds (which may include one or more of the GMO Emerging Markets Funds) and the GMO U.S. Equity Funds. The Fund may also invest in shares of other GMO Funds, including the GMO Fixed Income Funds, GMO Alpha Only Fund, GMO Flexible Equities Fund, and GMO Alternative Asset Opportunity Fund. Effective June 1, 2008, the Fund changed its benchmark from the GMO Global Equity Index (composite index computed by GMO consisting of: (i) the S&P 500 Index (75%) and (ii) the MSCI ACWI ex-U.S. Index (25%)) to the MSCI ACWI (All Country World Index) Index because the Manager expects that the Fund will tend to have a larger allocation to non-U.S. equities.
The financial statements of the series of the Trust in which the Fund invests ("underlying funds") should be read in conjunction with the Fund's financial statements. These financial statements are available, without charge, upon request, by calling (617) 346-7646 (collect). Shares of GMO Flexible Equities Fund are not publicly available for direct purchase.
2. Significant accounting policies
The following is a summary of significant accounting policies followed by the Fund in the preparation of its financial statements. These policies are in conformity with accounting principles generally accepted in the United States of America ("U.S. GAAP") and have been consistently followed by the Fund in preparing its financial statements. The preparation of financial statements in accordance with U.S. GAAP requires management to make estimates and assumptions that affect the reported amounts and disclosures in the financial statements. Actual results could differ from those estimates. The accounting records of the Fund are maintained in U.S. dollars.
Portfolio valuation
Shares of the underlying funds and other mutual funds are generally valued at their net asset value.
9
GMO Global Equity Allocation Fund
(formerly GMO Global (U.S.+) Equity Allocation Fund)
(A Series of GMO Trust)
Notes to Financial Statements — (Continued)
February 28, 2009
Investments held by the underlying funds are valued as follows. Securities listed on a securities exchange for which market quotations are readily available are valued at the last sale price or official closing price on each business day, or if there is no such reported sale or official closing price, at the most recent quoted bid price. Unlisted securities for which market quotations are readily available are generally valued at the most recent quoted bid price. Debt instruments with a remaining maturity of sixty days or less are generally valued at amortized cost, which approximates fair value. Securities for which quotations are not readily available or whose values the Manager has determined to be unreliable are valued at fair value as determined in good faith by the Trustees or persons acting at their direction pursuant to procedures approved by the Trustees. By its nature, a fair value price is a good faith estimate of the value of a security at a given point in time and may not reflect the value that would be realized if the security were sold. The difference between a fair value price and the value realized upon a sale could be material. Because many foreign equity securities markets and exchanges close prior to the close of the New York Stock Exchange ("NYSE"), closing prices for foreign securities in those markets or on those exchanges do not reflect the events that occur after that close but before the close of the NYSE. As a result, the Fund generally values foreign equity securities using fair value prices, which are based on adjustments to closing prices supplied by a third party vendor based on that vendor's proprietary models. As of February 28, 2009, 41.10% of the net assets of the Fund, through investments in the underlying funds, were valued using fair value prices based on models used by a third party vendor.
In September 2006, the Financial Accounting Standards Board ("FASB") issued Statement of Financial Accounting Standards No. 157, Fair Value Measurements ("SFAS 157"). SFAS 157 is effective for the Fund's current fiscal year. While the adoption of SFAS 157 does not have an effect on the Fund's net asset value, it does require additional disclosures about fair value measurements. SFAS 157 establishes a three-level hierarchy for disclosure of fair value measurements. The valuation hierarchy is based upon the reliability of inputs to the valuation of the Fund's investments. The three levels are defined as follows:
Level 1 – Valuations based on quoted prices for identical securities in active markets.
Level 2 – Valuations determined using other significant direct or indirect observable inputs.
Level 3 – Valuations based on inputs that are unobservable and significant. The Fund utilized the following fair value techniques on Level 3 investments: The Fund considered interest in certain bankrupt securities to be worthless.
The inputs or methodology used for valuing securities are not necessarily an indication of the risk associated with investing in those securities.
10
GMO Global Equity Allocation Fund
(formerly GMO Global (U.S.+) Equity Allocation Fund)
(A Series of GMO Trust)
Notes to Financial Statements — (Continued)
February 28, 2009
The following is a summary of the fair valuations according to inputs used as of February 28, 2009 in valuing the Fund's investments:
| Asset Valuation Inputs | Investments in Securities | Other Financial Instruments | |||||||||
| Level 1 - Quoted Prices | $ | 423,004,997 | $ | — | |||||||
| Level 2 - Other Significant Observable Inputs | 8,309,024 | — | |||||||||
| Level 3 - Significant Unobservable Inputs | 49 | — | |||||||||
| Total | $ | 431,314,070 | $ | — | |||||||
| Liability Valuation Inputs | Investments in Securities | Other Financial Instruments | |||||||||
| Level 1 - Quoted Prices | $ | — | $ | — | |||||||
| Level 2 - Other Significant Observable Inputs | — | — | |||||||||
| Level 3 - Significant Unobservable Inputs | — | — | |||||||||
| Total | $ | — | $ | — | |||||||
For the underlying fund's summary of valuation inputs please refer to the respective fund's portfolio valuation note.
The following is a reconciliation of investments in which significant unobservable inputs (Level 3) were used in determining value:
| Investments in Securities | Other Financial Instruments | ||||||||||
| Balance as of February 29, 2008 | $ | 49 | $ | — | |||||||
| Accrued discounts/premiums | — | — | |||||||||
| Realized gain (loss) | — | — | |||||||||
| Realized gain distributions received | 171 | — | |||||||||
| Realized gain distributions paid | (171 | ) | — | ||||||||
| Change in unrealized appreciation/depreciation | — | — | |||||||||
| Net purchases (sales) | — | — | |||||||||
| Net transfers in and/or out of Level 3 | — | — | |||||||||
| Balance as of February 28, 2009 | $ | 49 | $ | — | |||||||
11
GMO Global Equity Allocation Fund
(formerly GMO Global (U.S.+) Equity Allocation Fund)
(A Series of GMO Trust)
Notes to Financial Statements — (Continued)
February 28, 2009
Repurchase agreements
The Fund may enter into repurchase agreements. Under a repurchase agreement the Fund acquires a security for cash and obtains a simultaneous commitment from the seller to repurchase the security at an agreed upon price and date. The Fund, through its custodian, takes possession of securities collateralizing the repurchase agreement. The collateral is marked to market daily to ensure that the market value of the underlying assets is at least equal to the amount owed to the Fund in the event of default by the seller. If the seller of a repurchase agreement defaults or enters into insolvency proceedings and the value of the collateral declines, the Fund's recovery of cash may be delayed or limited. The Fund had no repurchase agreements outstanding at the end of the period.
Taxes and distributions
The Fund intends to qualify each tax year as a regulated investment company under Subchapter M of the Internal Revenue Code of 1986, as amended (the "Code"). The Fund intends to distribute substantially all of its net investment income and all of its net realized short-term and long-term capital gain, if any, after giving effect to any available capital loss carryforwards for U.S. federal income tax purposes. Therefore, no provision for U.S. federal income or excise tax is necessary.
The Fund's policy is to declare and pay distributions from net investment income, if any, semiannually, and from net realized short-term and long-term capital gain, if any, at least annually. All distributions are paid in shares of the Fund, at net asset value, unless the shareholder elects to receive cash distributions. Distributions to shareholders are recorded by the Fund on the ex-dividend date.
Income and capital gain distributions are determined in accordance with U.S. federal income tax regulations, which may differ from U.S. GAAP. Certain capital accounts in the financial statements are periodically adjusted for permanent differences in order to reflect their tax character. These adjustments have no impact on net assets or net asset value per share. Temporary differences that arise from recognizing certain items of income, expense, gain or loss in different periods for financial statement and tax purposes will reverse at some time in the future. Distributions in excess of net investment income or net realized gains are temporary over-distributions for financial statement purposes resulting from differences in the recognition or classification of income or distributions for financial statement and tax purposes.
U.S. GAAP and tax accounting differences primarily relate to differing treatment of mutual fund distributions received and losses on wash sale transactions.
12
GMO Global Equity Allocation Fund
(formerly GMO Global (U.S.+) Equity Allocation Fund)
(A Series of GMO Trust)
Notes to Financial Statements — (Continued)
February 28, 2009
The following reclassification represents the amount necessary to report the stated components of net assets on a tax basis, excluding certain temporary differences, as of February 28, 2009. The financial highlights exclude these adjustments.
| Distributions In Excess of Net Investment Income | Accumulated Net Realized Loss | Paid-in Capital | |||||||||
| $ | 547,898 | $ | (547,898 | ) | $ | — | |||||
The tax character of distributions declared to shareholders is as follows:
| 2/28/2009 | 2/29/2008 | ||||||||||
| Ordinary income (including any net short-term capital gain) | $ | 15,011,630 | $ | 15,140,737 | |||||||
| Net long-term capital gain | 35,639,620 | 46,145,066 | |||||||||
| Total distributions | $ | 50,651,250 | $ | 61,285,803 | |||||||
Distributions in excess of tax basis earnings and profits, if significant, are reported in the financial statements as a return of capital for tax purposes.
As of February 28, 2009, the components of distributable earnings on a tax basis consisted of the following:
| Undistributed net long-term capital gain | $ | 3,638,604 | |||||
As of February 28, 2009, the approximate cost for U.S. federal income tax purposes and gross and net unrealized appreciation (depreciation) in value of investments were as follows:
| Aggregate Cost | Gross Unrealized Appreciation | Gross Unrealized (Depreciation) | Net Unrealized Appreciation (Depreciation) | ||||||||||||
| $ | 651,587,283 | $ | 49 | $ | (220,273,262 | ) | $ | (220,273,213 | ) | ||||||
The Fund is subject to the provisions of Financial Accounting Standards Board Interpretation No. 48 ("FIN 48"), Accounting for Uncertainty in Income Taxes — an Interpretation of FASB Statement No. 109. FIN 48 sets forth a minimum threshold for financial statement recognition of a tax position taken or expected to be taken in a tax return that could affect the Fund's financial statements. The Fund did not have any unrecognized tax benefits or liabilities at February 28, 2009, nor did it have any increases or
13
GMO Global Equity Allocation Fund
(formerly GMO Global (U.S.+) Equity Allocation Fund)
(A Series of GMO Trust)
Notes to Financial Statements — (Continued)
February 28, 2009
decreases in unrecognized tax benefits or liabilities for the period then ended. The Fund is subject to examination prior to the expiration of the statute of limitations by U.S. federal and state tax authorities for tax returns filed.
Security transactions and related investment income
Security transactions in the financial statements are accounted for on the trade date. Income dividends and capital gain distributions from the underlying funds are recorded on the ex-dividend date. Interest income is recorded on the accrual basis. Non-cash dividends, if any, are recorded at the fair market value of the asset received. In determining the net gain or loss on securities sold, the Fund uses the identified cost basis for the purposes of determining the cost basis.
Expenses
The majority of the expenses of the Trust are directly identifiable to an individual fund. Expenses that are not readily identifiable to a specific fund are allocated taking into consideration, among other things, the nature and type of expense and the relative size of the funds. In addition, the Fund incurs fees and expenses indirectly as a shareholder in the underlying funds. Because the underlying funds have different expense and fee levels and the Fund may own different proportions of the underlying funds at different times, the amount of fees and expenses indirectly incurred by the Fund will vary and the manager has a conflict in allocating among the underlying funds (See Note 3).
State Street Bank and Trust Company ("State Street") serves as custodian, fund accounting agent and transfer agent of the Fund. State Street's fees may be reduced by an earnings allowance calculated on the average daily cash balances the Fund maintains with State Street. The Fund receives the benefit of the earnings allowance. Credit balances or expense reimbursements used to reduce fees, if any, are reported as a reduction of expenses in the Statement of Operations.
Purchases and redemptions of Fund shares
Effective June 30, 2008, the premium on cash purchases and fee on cash redemptions of Fund shares were each changed to 0.11% of the amount invested or redeemed. Effective September 30, 2008, the premium on cash purchases and fee on cash redemptions were each changed to 0.07% of the amount invested or redeemed. Effective October 8, 2008, the premium on cash purchases and fee on cash redemptions were each changed to 0.08% of the amount invested or redeemed. Effective October 21, 2008, the premium on cash purchases and fee on cash redemptions were each changed to 0.12% of the amount invested or redeemed. As of February 28, 2009, the premium on cash purchases and fee on cash redemptions were each 0.12% of the amount invested or redeemed. The level of purchase premium for the Fund may be adjusted to account for changes in the Fund's investments (i.e., changes in the percentage of Fund assets allocated to each underlying fund). The Fu nd may impose a new purchase premium and/or redemption fee, or modify or eliminate an existing purchase premium and/or redemption fee, at any time. If the Manager determines that any portion of a cash purchase or redemption is offset by a corresponding cash redemption
14
GMO Global Equity Allocation Fund
(formerly GMO Global (U.S.+) Equity Allocation Fund)
(A Series of GMO Trust)
Notes to Financial Statements — (Continued)
February 28, 2009
or purchase on the same day, the Fund will ordinarily waive or reduce the purchase premium or redemption fee with respect to that portion. All or a portion of the redemption fees may be waived at the Manager's discretion under circumstances in which the Manager deems it equitable to do so, including without limitation in cases where the weighted average of (i) the estimated transaction costs for directly held assets and (ii) the redemption fees, if any, imposed by the underlying funds is less than the Fund's redemption fee. In addition, the Fund may waive or reduce the purchase premium or redemption fee in extraordinary circumstances if the purchase or redemption will not cause the Fund to incur transaction costs. All purchase premiums and redemption fees are paid to the Fund and recorded by the Fund as paid-in capital. The Fund will waive or reduce the purchase premium relating to the in-kind portion of a purchase transaction e xcept for estimated or known transaction costs (e.g. stamp duties and transfer taxes) incurred by the Fund as a result of the transfer of the purchasing shareholder's securities to the Fund. In-kind redemption transactions are generally not subject to redemption fees except when they include a cash component. However, when a substantial portion of a Fund is being redeemed, the Fund may charge a redemption fee based on estimated or known transaction costs resulting from those redemptions. The Fund charges no premium for reinvested distributions.
Investment risks
The Fund is subject to the investment risks associated with an investment in the underlying funds, some of which may invest in foreign securities. The Fund is subject to risks involved in investing in foreign securities that are not presented by investments in U.S. securities. These risks may involve adverse political and economic developments, including expropriation and the possible imposition of capital controls or other foreign governmental laws or restrictions. In addition, the securities of some foreign companies and securities markets are less liquid and at times more volatile than securities of comparable U.S. companies and U.S. securities markets. The risks described above apply to an even greater extent to investments in emerging markets. The securities markets of emerging countries are generally smaller, less developed, less liquid, and more volatile than the securities markets of the U.S. and developed foreign market s. Additionally, the investment risks associated with an investment in the underlying funds may be greater to the extent that the underlying funds engage in derivative transactions.
Recently issued accounting pronouncement
In March 2008, FASB issued Statement of Financial Accounting Standards No. 161, Disclosures about Derivative Instruments and Hedging Activities ("SFAS 161"). SFAS 161 is effective for fiscal years and interim periods beginning after November 15, 2008. SFAS 161 requires enhanced disclosures about the Fund's derivative and hedging activities. The Manager is currently evaluating the impact the adoption of SFAS 161 will have on the Fund's financial statement disclosures.
3. Fees and other transactions with affiliates
The Manager decides how to allocate the assets of the Fund among underlying funds. The Manager does not directly charge the Fund an advisory fee or shareholder service fee, but it receives varying
15
GMO Global Equity Allocation Fund
(formerly GMO Global (U.S.+) Equity Allocation Fund)
(A Series of GMO Trust)
Notes to Financial Statements — (Continued)
February 28, 2009
management and shareholder service fees from the underlying funds in which the Fund invests. Because of that variation the levels of indirect net expenses set forth below are affected by the managers asset allocation decisions.
Through at least June 30, 2009, the Manager has contractually agreed to reimburse the Fund for Fund expenses incurred through that date (excluding "Excluded Expenses", as defined below). Excluded Expenses include fees and expenses of the independent Trustees of the Trust, fees and expenses for legal services not approved by the Manager for the Trust, compensation and expenses of the Trust's Chief Compliance Officer ("CCO") (excluding any employee benefits), brokerage commissions, securities lending fees and expenses, interest expense, transfer taxes, and other investment-related costs (including expenses associated with investments in any company that is an investment company or would be an investment company under the 1940 Act, but for the exceptions to the definition of investment company provided in Section 3(c)(1) and 3(c)(7) of the 1940 Act), hedging transaction fees, extraordinary, non-recurring and certain other unusual e xpenses (including taxes).
The Fund incurs fees and expenses indirectly as a shareholder in the underlying funds. For the year ended February 28, 2009, these indirect fees and expenses expressed as an annualized percentage of the Fund's average daily net assets were as follows:
| Indirect Net Expenses (excluding shareholder service fees and interest expense) | Indirect Shareholder Service Fees | Indirect Interest Expense | Total Indirect Expenses | ||||||||||||
| 0.447 | % | 0.064 | % | 0.000 | % | 0.511 | % | ||||||||
The Fund's portion of the fees paid by the Trust to the Trust's independent Trustees and CCO during the year ended February 28, 2009 was $3,889 and $2,411, respectively. The compensation and expenses of the CCO are included in miscellaneous expenses in the Statement of Operations. The Fund paid no remuneration to any other officer of the Trust.
4. Purchases and sales of securities
Cost of purchases and proceeds from sales of securities, excluding short-term investments and class exchanges, for the year ended February 28, 2009 aggregated $461,669,867 and $179,615,355, respectively.
16
GMO Global Equity Allocation Fund
(formerly GMO Global (U.S.+) Equity Allocation Fund)
(A Series of GMO Trust)
Notes to Financial Statements — (Continued)
February 28, 2009
5. Guarantees
In the normal course of business the Fund enters into contracts with third-party service providers that contain a variety of representations and warranties and that provide general indemnifications. The Fund's maximum exposure under these arrangements is unknown, as it involves future claims that may be made against the Fund that have not yet occurred. Based on experience, management is of the view that the risk of loss in connection with its indemnification obligations is remote; however, there can be no assurance that such obligations will not result in material liabilities that adversely affect the Fund.
6. Principal shareholders and related parties
As of February 28, 2009, 31.08% of the outstanding shares of the Fund were held by two shareholders, each holding more than 10% of the Fund's outstanding shares. On that date, no other shareholder owned more than 10% of the outstanding shares of the Fund. Redemptions from (or investments into) the Fund by or on behalf of these large shareholders may have a material effect on the Fund.
As of February 28, 2009, 20.80% of the Fund's shares were held by senior management of the Manager and GMO Trust officers and none of the Fund's shares were held by accounts for which the Manager had investment discretion
7. Share transactions
The Declaration of Trust permits the Trust to issue an unlimited number of shares of beneficial interest (without par value). Transactions in Fund shares were as follows:
| Year Ended February 28, 2009 | Year Ended February 29, 2008 | ||||||||||||||||||
| Class III: | Shares | Amount | Shares | Amount | |||||||||||||||
| Shares sold | 43,957,397 | $ | 281,047,058 | 1,944,098 | $ | 23,157,515 | |||||||||||||
| Shares issued to shareholders in reinvestment of distributions | 5,687,137 | 43,314,729 | 4,518,134 | 52,432,161 | |||||||||||||||
| Shares repurchased | (2,975,721 | ) | (23,828,875 | ) | (1,300,196 | ) | (16,394,251 | ) | |||||||||||
| Purchase premiums | — | 310,403 | — | 23,181 | |||||||||||||||
| Redemption fees | — | 9,274 | — | 9,382 | |||||||||||||||
| Net increase (decrease) | 46,668,813 | $ | 300,852,589 | 5,162,036 | $ | 59,227,988 | |||||||||||||
17
GMO Global Equity Allocation Fund
(formerly GMO Global (U.S.+) Equity Allocation Fund)
(A Series of GMO Trust)
Notes to Financial Statements — (Continued)
February 28, 2009
8. Investments in affiliated issuers
A summary of the Fund's transactions in the shares of other funds of the Trust during the year ended February 28, 2009 is set forth below:
| Affiliate | Value, beginning of period | Purchases | Sales Proceeds | Dividend Income | Distributions of Realized Gains | Value, end of period | |||||||||||||||||||||
| GMO Alpha Only Fund, Class IV | $ | 22,706,205 | $ | 14,786,511 | $ | 16,000,000 | $ | 5,119,453 | $ | 3,470,383 | $ | 15,228,232 | |||||||||||||||
| GMO Emerging Countries Fund, Class III | 8,443,861 | 1,022,610 | 7,544,143 | — | 1,022,610 | — | |||||||||||||||||||||
| GMO Emerging Country Debt Fund, Class IV | 1,702,519 | — | 1,711,767 | — | — | — | |||||||||||||||||||||
| GMO Emerging Markets Fund, Class VI | 36,561,535 | 59,212,537 | 17,746,320 | 514,990 | 9,409,426 | 39,020,469 | |||||||||||||||||||||
| GMO Flexible Equities Fund, Class VI | — | 10,073,353 | — | 307 | — | 8,309,024 | |||||||||||||||||||||
| GMO International Core Equity Fund, Class VI | — | 155,422,896 | 1,452,813 | 3,421,860 | 665,818 | 90,834,974 | |||||||||||||||||||||
| GMO International Growth Equity Fund, Class IV | 29,271,874 | 33,077,953 | 8,360,166 | 1,085,404 | 873,754 | 37,592,210 | |||||||||||||||||||||
| GMO International Intrinsic Value Fund, Class IV | 28,827,179 | 30,386,468 | 8,312,833 | 1,234,893 | 1,384,494 | 32,338,156 | |||||||||||||||||||||
| GMO Short-Duration Investment Fund, Class III | 135,936 | 5,007 | — | 5,007 | — | 119,922 | |||||||||||||||||||||
| GMO SPV I, LLC | 49 | — | — | — | 171 | 49 | |||||||||||||||||||||
| GMO U.S. Core Equity Fund, Class VI | 134,495,007 | 15,760,503 | 111,354,500 | 972,873 | — | 28,906,379 | |||||||||||||||||||||
| GMO U.S. Growth Fund, Class III | 17,965 | 2,332 | — | 235 | — | 13,953 | |||||||||||||||||||||
| GMO U.S. Quality Equity Fund, Class VI | 94,350,851 | 141,919,697 | 7,132,813 | 2,119,927 | 534,366 | 178,925,759 | |||||||||||||||||||||
| Totals | $ | 356,512,981 | $ | 461,669,867 | $ | 179,615,355 | $ | 14,474,949 | $ | 17,361,022 | $ | 431,289,127 | |||||||||||||||
18
Report of Independent Registered Public Accounting Firm
To the Trustees of GMO Trust and the Shareholders of
GMO Global Equity Allocation Fund
(formerly GMO Global (U.S.+) Equity Allocation Fund):
In our opinion, the accompanying statement of assets and liabilities, including the schedule of investments, and the related statements of operations and of changes in net assets and the financial highlights present fairly, in all material respects, the financial position of GMO Global Equity Allocation Fund (formerly GMO Global (U.S.+) Equity Allocation Fund) (the "Fund") at February 28, 2009, the results of its operations for the year then ended, the changes in its net assets for each of the two years in the period then ended and the financial highlights for each of the five years in the period then ended, in conformity with accounting principles generally accepted in the United States of America. These financial statements and financial highlights (hereafter referred to as "financial statements") are the responsibility of the Fund's management. Our responsibility is to express an opinion on these financial statements based on our audits. We conducted our audits of these financial statements in accordance with the standards of the Public Company Accounting Oversight Board (United States). Those standards require that we plan and perform the audit to obtain reasonable assurance about whether the financial statements are free of material misstatement. An audit includes examining, on a test basis, evidence supporting the amounts and disclosures in the financial statements, assessing the accounting principles used and significant estimates made by management, and evaluating the overall financial statement presentation. We believe that our audits, which included confirmation of securities at February 28, 2009 by correspondence with the custodian, provide a reasonable basis for our opinion.
PricewaterhouseCoopers LLP
Boston, Massachusetts
April 29, 2009
19
GMO Global Equity Allocation Fund
(formerly GMO Global (U.S.+) Equity Allocation Fund)
(A Series of GMO Trust)
Fund Expenses
February 28, 2009 (Unaudited)
Expense Examples: The following information is in relation to expenses for the six month period ended February 28, 2009.
As a shareholder of the Fund, you may incur two types of costs: (1) transaction costs, including purchase premiums and redemption fees; and (2) ongoing costs, including indirect management fees, shareholder service fees, and other Fund expenses. This example is intended to help you understand your ongoing costs (in dollars) of investing in the Fund and to compare these costs with the ongoing costs of investing in other mutual funds.
These examples are based on an investment of $1,000 invested at the beginning of the period and held for the entire period, September 1, 2008 through February 28, 2009.
Actual Expenses
The first line of the table below provides information about actual account values and actual expenses. You may use the information in this line, together with the amount you invested, to estimate the expenses that you paid over the period. Simply divide your account value by $1,000 (for example, a $10,000,000 account value divided by $1,000 = 10,000), then multiply the result by the number in the first line under the heading entitled "Net Expense Incurred" to estimate the expenses you paid on your account during this period.
Hypothetical Example for Comparison Purposes
The second line of the table below provides information about hypothetical account values and hypothetical expenses based on the Fund's actual expense ratio and an assumed rate of return of 5% per year before expenses, which is not the Fund's actual return. The hypothetical account values and expenses may not be used to estimate the actual ending account balance or expenses you paid for the period. You may use this information to compare the ongoing costs of investing in the Fund with other funds. To do so, compare this 5% hypothetical example with the 5% hypothetical examples that appear in the shareholder reports of other funds.
Please note that the expenses shown in the table are meant to highlight your ongoing costs only and do not reflect any transactional costs, such as purchase premiums and redemption fees. Therefore, the second line of the table is useful in comparing ongoing costs only, and will not help you determine the relative total costs of owning different funds. In addition, if these transactional costs were included, your costs would have been higher.
| Annualized Net Expense Ratio | Beginning Account Value | Ending Account Value | Net Expense Incurred* | ||||||||||||||||
| Class III | |||||||||||||||||||
| 1) Actual | 0.50 | % | $ | 1,000.00 | $ | 644.30 | $ | 2.04 | |||||||||||
| 2) Hypothetical | 0.50 | % | $ | 1,000.00 | $ | 1,022.32 | $ | 2.51 | |||||||||||
* Expenses are calculated using the Class's annualized expense ratio (including indirect expenses incurred) for the six months ended February 28, 2009, multiplied by the average account value over the period, multiplied by 181 days in the period, divided by 365 days in the year.
20
GMO Global Equity Allocation Fund
(formerly GMO Global (U.S.+) Equity Allocation Fund)
(A Series of GMO Trust)
Tax Information for the Tax Year Ended February 28, 2009 (Unaudited)
The Fund will notify shareholders of amounts for use in preparing 2009 income tax forms in early 2010.
The Fund's distributions to shareholders include $35,639,619 from long-term capital gains.
For taxable, non-corporate shareholders, 52.26% of the income and short-term capital gains, if any, distributed in the Fund's fiscal year ended February 28, 2009 represents qualified dividend income subject to the 15% rate category.
For corporate shareholders, 21.35% of the income and short-term capital gains, if any, distributed in the Fund's fiscal year ended February 28, 2009 qualified for the dividends-received deduction.
21
Trustees and Officers (Unaudited)
The following tables list the Trust's Trustees and Officers as of the date of this report; their address and date of birth ("DOB"); their position with the Trust; the length of time holding that position with the Trust; their principal occupation(s) during the past five years; the number of portfolios in the fund complex they oversee; and other directorships they hold in companies subject to registration or reporting requirements of the Securities Exchange Act of 1934 (generally called "public companies") or in registered investment companies. The Trust's Statement of Additional Information ("SAI") includes additional information about the Trust's trustees, including changes subsequent to the date of the report. The SAI is available, without charge, upon request by writing GMO, c/o GMO Trust, 40 Rowes Wharf, Boston, MA 02110.
Independent Trustees:
| Name, Address, and DOB | Position(s) Held with Trust | Term of Office1 and Length of Time Served | Principal Occupation(s) During Past Five Years | Number of Portfolios in Fund Complex Overseen by Trustee | Other Directorships Held by Trustee | ||||||||||||||||||
| Donald W. Glazer, Esq. c/o GMO Trust 40 Rowes Wharf Boston, MA 02110 DOB: 07/26/1944 | Chairman of the Board of Trustees | Chairman of the Board of Trustees since March 2005; Lead Independent Trustee (September 2004 – March 2005); Trustee since December 2000. | Consultant – Law and Business2; Author of Legal Treatises. | 59 | None. | ||||||||||||||||||
1 Each Trustee is elected to serve during the continued lifetime of the Trust until he/she dies, resigns or is removed, or if sooner, until the next meeting of Shareholders called for the purpose of electing Trustees and until the election and qualification of his/her successor.
2 As part of Mr. Glazer's work as a consultant, he provides part-time consulting services to Goodwin Procter LLP ("Goodwin"). Goodwin has provided legal services to Renewable Resources, LLC, an affiliate of GMO; GMO, in connection with its relationship with Renewable Resources; and funds managed by Renewable Resources. Mr. Glazer has represented that he has no financial interest in, and is not involved in the provision of, such legal services. In the calendar years ended December 31, 2007 and December 31, 2008, these entities paid $789,416 and $183,864 respectively, in legal fees and disbursements to Goodwin. In correspondence with the Staff of the Securities and Exchange Commission beginning in August 2006, the Independent Trustees' legal counsel provided the Staff with information regarding Mr. Glazer's relationship with Goodwin and h is other business activities. On September 11, 2007, based on information that had been given to the Staff as of that date, the Staff provided oral no-action assurance consistent with the opinion of the Independent Trustees' legal counsel that Mr. Glazer is not an "interested person" of the Trust.
22
Independent Trustees — (Continued)
| Name, Address, and DOB | Position(s) Held with Trust | Term of Office1 and Length of Time Served | Principal Occupation(s) During Past Five Years | Number of Portfolios in Fund Complex Overseen by Trustee | Other Directorships Held by Trustee | ||||||||||||||||||
| W. Nicholas Thorndike c/o GMO Trust 40 Rowes Wharf Boston, MA 02110 DOB: 03/28/1933 | Trustee | Since March 2005. | Director or trustee of various corporations and charitable organizations, including Courier Corporation (a book publisher and manufacturer) (July 1989 – present); Putnam Funds (December 1992 – June 2004); and Providence Journal (a newspaper publisher) (December 1986 – December 2003). | 59 | Director of Courier Corporation (a book publisher and manufacturer); Member of the Investment Committee of Partners HealthCare System, Inc.3 | ||||||||||||||||||
| Peter Tufano c/o GMO Trust 40 Rowes Wharf Boston, MA 02110 DOB: 04/22/1957 | Trustee | Since December 2008. | Sylvan C. Coleman Professor of Financial Management, Harvard Business School (since 1989). | 59 | Trustee of State Street Navigator Securities Lending Trust (3 Portfolios). | ||||||||||||||||||
1 Each Trustee is elected to serve during the continued lifetime of the Trust until he/she dies, resigns or is removed, or if sooner, until the next meeting of Shareholders called for the purpose of electing Trustees and until the election and qualification of his/her successor.
3 Partners HealthCare System, Inc. is a client of the Manager.
23
Principal Officers:
| Name, Address, and DOB | Position(s) Held with Trust | Term of Office4 and Length of Time Served | Principal Occupation(s) During Past Five Years5 | ||||||||||||
| J.B. Kittredge DOB: 08/22/1954 | President and Chief Executive Officer | Since March 2009. | General Counsel, Grantham, Mayo, Van Otterloo & Co. LLC (October 2005 – Present); Partner, Ropes & Gray LLP. | ||||||||||||
| Sheppard N. Burnett c/o GMO Trust 40 Rowes Wharf Boston, MA 02110 DOB: 10/24/1968 | Treasurer and Chief Financial Officer | Chief Financial Officer since March 2007; Treasurer since November 2006; Assistant Treasurer, September 2004 – November 2006. | Fund Administration Staff, Grantham, Mayo, Van Otterloo & Co. LLC (June 2004 – present); Vice President, Director of Tax, Columbia Management Group (2002 – 2004). | ||||||||||||
| Brent C. Arvidson c/o GMO Trust 40 Rowes Wharf Boston, MA 02110 DOB: 06/26/1969 | Assistant Treasurer | Since August 1998. | Senior Fund Administrator, Grantham, Mayo, Van Otterloo & Co. LLC. | ||||||||||||
| John L. Nasrah c/o GMO Trust 40 Rowes Wharf Boston, MA 02110 DOB: 05/27/1977 | Assistant Treasurer | Since March 2007. | Fund Administrator, Grantham, Mayo, Van Otterloo & Co. LLC (September 2004 – present); Tax Analyst, Bain & Company, Inc. (June 2003 – September 2004). | ||||||||||||
| Mahmoodur Rahman c/o GMO Trust 40 Rowes Wharf Boston, MA 02110 DOB: 11/30/1967 | Assistant Treasurer | Since September 2007. | Fund Administrator, Grantham, Mayo, Van Otterloo & Co. LLC (April 2007 – present); Vice President and Senior Tax Manager, Massachusetts Financial Services Company (January 2000 – April 2007). | ||||||||||||
| Michael E. Gillespie c/o GMO Trust 40 Rowes Wharf Boston, MA 02110 DOB: 02/18/1958 | Chief Compliance Officer | Since March 2005. | Vice President of Compliance (June 2004 – February 2005) and Director of Domestic Compliance (March 2002 – June 2004), Fidelity Investments. | ||||||||||||
4 Each officer is elected to hold such office until his or her successor is duly elected and qualified to carry out the duties and responsibilities of the office, or until he or she resigns or is removed from office.
5 Each of Messrs. Burnett, Arvidson, Bohan, and Pottle serves as an officer and/or director of certain pooled investment vehicles of which GMO or an affiliate of GMO serves as the investment adviser.
24
Principal Officers — (Continued)
| Name, Address, and DOB | Position(s) Held with Trust | Term of Office4 and Length of Time Served | Principal Occupation(s) During Past Five Years5 | ||||||||||||
| Jason B. Harrison c/o GMO Trust 40 Rowes Wharf Boston, MA 02110 DOB: 01/29/1977 | Vice President and Clerk | Vice President since November 2006; Clerk since March 2006. | Legal Counsel, Grantham, Mayo, Van Otterloo & Co. LLC (since February 2006) and Attorney, Ropes & Gray LLP (September 2002 – February 2006). | ||||||||||||
| David L. Bohan c/o GMO Trust 40 Rowes Wharf Boston, MA 02110 DOB: 06/21/1964 | Vice President and Assistant Clerk | Vice President since March 2005; Assistant Clerk since March 2006. | Legal Counsel, Grantham, Mayo, Van Otterloo & Co. LLC. | ||||||||||||
| Gregory L. Pottle c/o GMO Trust 40 Rowes Wharf Boston, MA 02110 DOB: 07/09/1971 | Vice President and Assistant Clerk | Since November 2006. | Legal Counsel, Grantham, Mayo, Van Otterloo & Co. LLC. | ||||||||||||
| Anne K. Trinque c/o GMO Trust 40 Rowes Wharf Boston, MA 02110 DOB: 04/15/1978 | Vice President and Assistant Clerk | Since September 2007. | Legal Counsel, Grantham, Mayo, Van Otterloo & Co. LLC (January 2007 – present); Attorney, Goodwin Procter LLP (September 2003 – January 2007). | ||||||||||||
| Cheryl Wakeham c/o GMO Trust 40 Rowes Wharf Boston, MA 02110 DOB: 10/29/1958 | Vice President and Anti-Money Laundering Officer | Since December 2004. | Manager, Client Service Administration, Grantham, Mayo, Van Otterloo & Co. LLC. | ||||||||||||
4 Each officer is elected to hold such office until his or her successor is duly elected and qualified to carry out the duties and responsibilities of the office, or until he or she resigns or is removed from office.
5 Each of Messrs. Burnett, Arvidson, Bohan, and Pottle serves as an officer and/or director of certain pooled investment vehicles of which GMO or an affiliate of GMO serves as the investment adviser.
25
GMO Strategic Opportunities Allocation Fund
(A Series of GMO Trust)
Annual Report
February 28, 2009
For a free copy of the Fund's proxy voting guidelines, shareholders may call 1-617-346-7646 (collect) or visit the Securities and Exchange Commission's website at www.sec.gov. Information regarding how the Fund voted proxies relating to portfolio securities during the most recent 12-month period ended June 30 is available on GMO's website at www.gmo.com, or on the Securities and Exchange Commission's website at www.sec.gov.
The Fund files its complete schedule of portfolio holdings with the Securities and Exchange Commission for the first and third quarter of each fiscal year on Form N-Q, which is available on the Commission's website at www.sec.gov. The Fund's Form N-Q may be reviewed and copied at the Commission's Public Reference Room in Washington, D.C. Information on the operation of the Public Reference Room may be obtained by calling 1-800-SEC-0330. The Fund has a policy with respect to disclosure of portfolio holdings under which it may also make available on GMO's website at www.gmo.com a complete schedule of portfolio holdings.
This report is prepared for the general information of shareholders. It is authorized for distribution to prospective investors only when preceded or accompanied by a prospectus for the GMO Trust, which contains a complete discussion of the risks associated with an investment in this Fund and other important information. The GMO Trust prospectus can be obtained at www.gmo.com.
GMO Strategic Opportunities Allocation Fund
(A Series of GMO Trust)
Portfolio Management
Day-to-day management of the Fund's portfolio is the responsibility of the Asset Allocation team at Grantham, Mayo, Van Otterloo & Co. LLC.
Management Discussion and Analysis of Fund Performance
The GMO Strategic Opportunities Allocation Fund returned -26.8% for the fiscal year ended February 28, 2009, as compared to -37.2% for the Fund's benchmark, the GMO Strategic Opportunities Allocation Index (75% MSCI World Index / 25% Barclays Capital U.S. Aggregate Index) for the same period. During the fiscal year the Fund was exposed to global equity and fixed income securities through direct investment and indirectly through its investment in underlying GMO mutual funds. The Fund received fixed income securities from certain underlying GMO mutual funds during the year via an in-kind transaction.
Implementation was positive. The primary drivers of the outperformance were positive relative returns from the GMO U.S. Core Equity, GMO U.S. Quality Equity, GMO International Intrinsic Value, and GMO International Growth Funds.
Asset allocation also added value. The Fund's underweight to equities and overweights to fixed income were the primary drivers of the outperformance.
The views expressed herein are exclusively those of Grantham, Mayo, Van Otterloo & Co. LLC Management as of the date of this report and are subject to change. GMO disclaims any responsibility to update such views. They are not meant as investment advice. References to specific securities are not recommendations of such securities and may not be representative of any GMO portfolio's current or future investments.

Performance data quoted represents past performance and is not indicative of future results. The investment return and principal value of an investment will fluctuate so that an investor's shares, when redeemed, may be worth more or less than their original cost. Current performance data may be lower or higher than the performance data provided herein. To obtain performance information to the most recent month-end, visit www.gmo.com. Performance shown is net of all fees after reimbursement from the Manager. Each performance figure assumes a purchase at the beginning and redemption at the end of the stated period and reflects a transaction fee of .03% on the purchase and 2.00% on the redemption. Transaction fees are retained by the Fund to cover trading costs. Returns would have been lower had certain expenses not been reimbursed during the periods shown and do not include the effect of taxes on distributions and redemptions. All information is unaudited.
* The GMO Strategic Opportunities Allocation Index is a composite benchmark computed by GMO and comprised of 75% MSCI World Index and 25% Barclays Capital U.S. Aggregate Index.
GMO Strategic Opportunities Allocation Fund
(A Series of GMO Trust)
Investments Concentration Summary
February 28, 2009 (Unaudited)
| Asset Class Summary* | % of Total Net Assets | ||||||
| Common Stocks | 70.0 | % | |||||
| Debt Obligations | 17.6 | ||||||
| Cash and Cash Equivalents | 10.5 | ||||||
| Short-Term Investments | 9.6 | ||||||
| Options Purchased | 0.3 | ||||||
| Loan Participations | 0.0 | ||||||
| Loan Assignments | 0.0 | ||||||
| Rights and Warrants | 0.0 | ||||||
| Preferred Stocks | 0.0 | ||||||
| Promissory Notes | 0.0 | ||||||
| Reverse Repurchase Agreements | (0.0 | ) | |||||
| Forward Currency Contracts | (0.1 | ) | |||||
| Written Options | (0.1 | ) | |||||
| Futures | (4.9 | ) | |||||
| Swaps | (5.2 | ) | |||||
| Other | 2.3 | ||||||
| 100.0 | % | ||||||
| Country / Region Summary** | % of Investments | ||||||
| United States | 68.2 | % | |||||
| Japan | 9.4 | ||||||
| Euro Region*** | 8.1 | ||||||
| United Kingdom | 6.6 | ||||||
| Switzerland | 3.9 | ||||||
| Canada | 0.9 | ||||||
| Hong Kong | 0.7 | ||||||
| Australia | 0.6 | ||||||
| Sweden | 0.6 | ||||||
| Denmark | 0.4 | ||||||
| Singapore | 0.3 | ||||||
| Emerging | 0.2 | ||||||
| Norway | 0.1 | ||||||
| 100.0 | % | ||||||
* The table above incorporates aggregate indirect asset class exposure associated with investments in other funds of GMO Trust ("underlying funds").
** The table above incorporates aggregate indirect country exposure associated with investments in the underlying funds except for GMO Alpha Only Fund. The table excludes short-term investments. The table includes exposure through the use of derivative contracts.
*** The "Euro Region" is comprised of Austria, Belgium, Finland, France, Germany, Greece, Ireland, Italy, Netherlands, Portugal and Spain.
1
GMO Strategic Opportunities Allocation Fund
(A Series of GMO Trust)
Schedule of Investments
(showing percentage of total net assets)
February 28, 2009
| Par Value ($) | Description | Value ($) | |||||||||||||
| DEBT OBLIGATIONS — 3.2% | |||||||||||||||
| Asset-Backed Securities — 3.1% | |||||||||||||||
| Auto Financing — 0.4% | |||||||||||||||
| 600,000 | BMW Vehicle Lease Trust, Series 07-1, Class A3B, 1 mo. LIBOR + .24%, 0.70%, due 08/15/13 | 577,932 | |||||||||||||
| 600,000 | Capital Auto Receivable Asset Trust, Series 08-1, Class A4B, 1 mo. LIBOR + 1.35%, 1.81%, due 07/15/14 | 459,750 | |||||||||||||
| 500,000 | Daimler Chrysler Auto Trust, Series 08-B, Class A4B, 1 mo. LIBOR + 1.85%, 2.30%, due 11/10/14 | 394,000 | |||||||||||||
| 300,000 | Daimler Chrysler Master Owner Trust, Series 06-A, Class A, 1 mo. LIBOR + .03%, 0.49%, due 11/15/11 | 195,000 | |||||||||||||
| 800,000 | Ford Credit Auto Owner Trust, Series 07-B, Class A4B, 1 mo. LIBOR + .38%, 0.84%, due 07/15/12 | 600,240 | |||||||||||||
| 700,000 | Ford Credit Floorplan Master Owner Trust, Series 06-4, Class A, 1 mo. LIBOR + .25%, 0.71%, due 06/15/13 | 420,000 | |||||||||||||
| 300,000 | Nissan Auto Lease Trust, Series 08-A, Class A3B, 1 mo. LIBOR + 2.20%, 2.66%, due 07/15/11 | 276,094 | |||||||||||||
| 300,000 | Nissan Auto Receivables Owner Trust, Series 07-A, Class A4, 1 mo. LIBOR, 0.46%, due 06/17/13 | 284,556 | |||||||||||||
| 200,000 | Nissan Master Owner Trust Receivables, Series 07-A, Class A, 1 mo. LIBOR, 0.46%, due 05/15/12 | 162,000 | |||||||||||||
| 389,494 | Sovereign Dealer Floor Plan Master Trust, Series 06-1, Class A, 144A, 1 mo. LIBOR + .05%, 0.51%, due 08/15/11 | 350,544 | |||||||||||||
| 500,000 | Swift Master Auto Receivables Trust, Series 07-1, Class A, 1 mo. LIBOR + .10%, 0.56%, due 06/15/12 | 335,000 | |||||||||||||
| 800,000 | Truck Retail Installment Paper Corp., Series 05-1A, Class A, 144A, 1 mo. LIBOR + .27%, 0.73%, due 12/15/16 | 560,000 | |||||||||||||
| Total Auto Financing | 4,615,116 | ||||||||||||||
| Bank Loan Collateralized Debt Obligations — 0.2% | |||||||||||||||
| 949,217 | Arran Corp. Loans No. 1 B.V., Series 06-1A, Class A3, 144A, 3 mo. LIBOR + .17%, 1.70%, due 06/20/25 | 902,053 | |||||||||||||
| 1,120,000 | Omega Capital Europe Plc, Series GLOB-5A, Class A1, 144A, 3 mo. LIBOR + .25%, 1.68%, due 07/05/11 | 992,387 | |||||||||||||
| Total Bank Loan Collateralized Debt Obligations | 1,894,440 | ||||||||||||||
See accompanying notes to the financial statements.
2
GMO Strategic Opportunities Allocation Fund
(A Series of GMO Trust)
Schedule of Investments — (Continued)
(showing percentage of total net assets)
February 28, 2009
| Par Value ($) | Description | Value ($) | |||||||||||||
| Business Loans — 0.2% | |||||||||||||||
| 1,121,264 | Bayview Commercial Asset Trust, Series 05-4A, Class A2, 144A, 1 mo. LIBOR + .39%, 0.86%, due 01/25/36 | 716,712 | |||||||||||||
| 427,205 | GE Business Loan Trust, Series 04-1, Class A, 144A, 1 mo. LIBOR + .29%, 0.75%, due 05/15/32 | 304,503 | |||||||||||||
| 700,000 | GE Dealer Floorplan Master Trust, Series 06-4, Class A, 1 mo. LIBOR + .01%, 0.48%, due 10/20/11 | 579,495 | |||||||||||||
| 855,184 | Lehman Brothers Small Balance Commercial, Series 05-2A, Class 1A, 144A, 1 mo. LIBOR + .25%, 0.72%, due 09/25/30 | 410,489 | |||||||||||||
| 400,000 | Navistar Financial Dealer Note Master Trust, Series 05-1, Class A, 1 mo. LIBOR + .11%, 0.58%, due 02/25/13 | 343,160 | |||||||||||||
| Total Business Loans | 2,354,359 | ||||||||||||||
| CMBS — 0.2% | |||||||||||||||
| 600,000 | Commercial Mortgage Pass-Through Certificates, Series 06-FL12, Class AJ, 144A, 1 mo. LIBOR + .13%, 0.59%, due 12/15/20 | 443,340 | |||||||||||||
| 500,000 | GE Capital Commercial Mortgage Corp., Series 05-C4, Class A2, 5.31%, due 11/10/45 | 458,759 | |||||||||||||
| 600,000 | GS Mortgage Securities Corp., Series 07-EOP, Class A2, 144A, 1 mo. LIBOR + .13%, 0.58%, due 03/06/20 | 447,540 | |||||||||||||
| 600,000 | J.P. Morgan Chase Commercial Mortgage Securities Corp., Series 06-LDP7, Class A2, 5.86%, due 04/15/45 | 528,144 | |||||||||||||
| 400,000 | Merrill Lynch Mortgage Trust, Series 06-C1, Class A2, 5.61%, due 05/12/39 | 348,625 | |||||||||||||
| 398,933 | Wachovia Bank Commercial Mortgage Trust, Series 06-WL7A, Class A1, 144A, 1 mo. LIBOR + .09%, 0.55%, due 09/15/21 | 279,253 | |||||||||||||
| Total CMBS | 2,505,661 | ||||||||||||||
| Credit Cards — 0.6% | |||||||||||||||
| 800,000 | American Express Credit Account Master Trust, Series 05-5, Class A, 1 mo. LIBOR + .04%, 0.50%, due 02/15/13 | 760,192 | |||||||||||||
| 800,000 | Cabela's Master Credit Card Trust, Series 08-4A, Class A2, 144A, 1 mo. LIBOR + 3.00%, 3.46%, due 09/15/14 | 658,200 | |||||||||||||
| 1,000,000 | Capital One Multi-Asset Execution Trust, Series 04-A7, Class A7, 3 mo. LIBOR + .15%, 1.38%, due 06/16/14 | 899,799 | |||||||||||||
| 300,000 | Capital One Multi-Asset Execution Trust, Series 07-A6, Class A6, 1 mo. LIBOR + .07%, 0.53%, due 05/15/13 | 284,094 | |||||||||||||
| 700,000 | Charming Shoppes Master Trust, Series 07-1A, Class A1, 144A, 1 mo. LIBOR + 1.25%, 1.71%, due 09/15/17 | 481,663 | |||||||||||||
See accompanying notes to the financial statements.
3
GMO Strategic Opportunities Allocation Fund
(A Series of GMO Trust)
Schedule of Investments — (Continued)
(showing percentage of total net assets)
February 28, 2009
| Par Value ($) | Description | Value ($) | |||||||||||||
| Credit Cards — continued | |||||||||||||||
| EUR | 600,000 | Citibank Credit Card Issuance Trust, Series 04-A2, Class A, 3 mo. EUR LIBOR + 0.10%, 1.97%, due 05/24/13 | 687,148 | ||||||||||||
| 300,000 | Citibank OMNI Master Trust, Series 07-A9A, Class A9, 144A, 1 mo. LIBOR + 1.10%, 1.57%, due 12/23/13 | 270,990 | |||||||||||||
| 1,200,000 | Discover Card Master Trust I, Series 06-2, Class A2, 1 mo. LIBOR + .03%, 0.49%, due 01/16/14 | 1,053,768 | |||||||||||||
| 600,000 | GE Capital Credit Card Master Note Trust, Series 07-3, Class A1, 1 mo. LIBOR + .01%, 0.47%, due 06/15/13 | 547,500 | |||||||||||||
| 600,000 | Household Credit Card Master Note Trust I, Series 07-2, Class A, 1 mo. LIBOR + .55%, 1.01%, due 07/15/13 | 499,875 | |||||||||||||
| 100,000 | MBNA Credit Card Master Note Trust, Series 04-A8, Class A8, 1 mo. LIBOR + .15%, 0.61%, due 01/15/14 | 91,529 | |||||||||||||
| 500,000 | National City Credit Card Master Trust, Series 08-3, Class A, 1 mo. LIBOR + 1.80%, 2.26%, due 05/15/13 | 392,500 | |||||||||||||
| 500,000 | World Financial Network Credit Card Master Trust, Series 04-A, Class A, 1 mo. LIBOR + .18%, 0.64%, due 03/15/13 | 490,320 | |||||||||||||
| Total Credit Cards | 7,117,578 | ||||||||||||||
| Equipment Leases — 0.1% | |||||||||||||||
| 400,000 | CNH Equipment Trust, Series 07-B, Class A3B, 1 mo. LIBOR + .60%, 1.06%, due 10/17/11 | 389,544 | |||||||||||||
| 400,000 | GE Equipment Midticket LLC, Series 07-1, Class A3B, 1 mo. LIBOR + .25%, 0.71%, due 06/14/11 | 358,000 | |||||||||||||
| Total Equipment Leases | 747,544 | ||||||||||||||
| Insurance Premiums — 0.0% | |||||||||||||||
| 400,000 | AICCO Premium Finance Master Trust, Series 07-AA, Class A, 144A, 1 mo. LIBOR + .05%, 0.51%, due 12/15/11 | 382,880 | |||||||||||||
| Insured Auto Financing — 0.3% | |||||||||||||||
| 1,000,000 | AmeriCredit Automobile Receivables Trust, Series 07-DF, Class A4B, FSA, 1 mo. LIBOR + .80%, 1.25%, due 06/06/14 | 545,690 | |||||||||||||
| 350,000 | ARG Funding Corp., Series 05-2A, Class A3, 144A, AMBAC, 1 mo. LIBOR + .14%, 0.61%, due 05/20/10 | 334,824 | |||||||||||||
| 876,137 | Capital One Auto Finance Trust, Series 06-A, Class A4, AMBAC, 1 mo. LIBOR + .01%, 0.47%, due 12/15/12 | 794,043 | |||||||||||||
See accompanying notes to the financial statements.
4
GMO Strategic Opportunities Allocation Fund
(A Series of GMO Trust)
Schedule of Investments — (Continued)
(showing percentage of total net assets)
February 28, 2009
| Par Value ($) | Description | Value ($) | |||||||||||||
| Insured Auto Financing — continued | |||||||||||||||
| 800,000 | Santander Drive Auto Receivables Trust, Series 07-3, Class A4B, FGIC, 1 mo. LIBOR + .65%, 1.11%, due 10/15/14 | 544,824 | |||||||||||||
| 700,000 | Triad Auto Receivables Owner Trust, Series 07-B, Class A4B, FSA, 1 mo. LIBOR + 1.20%, 1.65%, due 07/14/14 | 494,130 | |||||||||||||
| Total Insured Auto Financing | 2,713,511 | ||||||||||||||
| Insured Other — 0.1% | |||||||||||||||
| 1,100,000 | DB Master Finance LLC, Series 06-1, Class A2, 144A, AMBAC, 5.78%, due 06/20/31 | 770,000 | |||||||||||||
| 900,000 | Dominos Pizza Master Issuer LLC, Series 07-1, Class A2, 144A, MBIA, 5.26%, due 04/25/37 | 450,000 | |||||||||||||
| Total Insured Other | 1,220,000 | ||||||||||||||
| Insured Residential Asset-Backed Securities (United States) — 0.0% | |||||||||||||||
| 303,214 | Residential Asset Mortgage Products, Inc., Series 05-RS9, Class AI3, FGIC, 1 mo. LIBOR + .22%, 0.69%, due 11/25/35 | 70,042 | |||||||||||||
| Insured Residential Mortgage-Backed Securities (United States) — 0.0% | |||||||||||||||
| 827,419 | Countrywide Home Equity Loan Trust, Series 07-E, Class A, MBIA, 1 mo. LIBOR + .15%, 0.61%, due 06/15/37 | 206,855 | |||||||||||||
| Insured Time Share — 0.0% | |||||||||||||||
| 395,320 | Sierra Receivables Funding Co., Series 07-2A, Class A2, 144A, MBIA, 1 mo. LIBOR + 1.00%, 1.47%, due 09/20/19 | 242,432 | |||||||||||||
| Investment Grade Corporate Collateralized Debt Obligations — 0.1% | |||||||||||||||
| 2,000,000 | Morgan Stanley ACES SPC, Series 05-15, Class A, 144A, 3 mo. LIBOR + .40%, 1.93%, due 12/20/10 | 807,000 | |||||||||||||
| 1,100,000 | Morgan Stanley ACES SPC, Series 06-13A, Class A, 144A, 3 mo. LIBOR + .29%, 1.82%, due 06/20/13 | 185,350 | |||||||||||||
| Total Investment Grade Corporate Collateralized Debt Obligations | 992,350 | ||||||||||||||
See accompanying notes to the financial statements.
5
GMO Strategic Opportunities Allocation Fund
(A Series of GMO Trust)
Schedule of Investments — (Continued)
(showing percentage of total net assets)
February 28, 2009
| Par Value ($) | Description | Value ($) | |||||||||||||
| Residential Asset-Backed Securities (United States) — 0.5% | |||||||||||||||
| 507,897 | ACE Securities Corp., Series 06-SL3, Class A1, 1 mo. LIBOR + .10%, 0.57%, due 06/25/36 | 35,553 | |||||||||||||
| 716,465 | ACE Securities Corp., Series 07-WM1, Class A2A, 1 mo. LIBOR + .07%, 0.54%, due 11/25/36 | 374,575 | |||||||||||||
| 287,987 | Argent Securities, Inc., Series 06-W2, Class A2B, 1 mo. LIBOR + .19%, 0.66%, due 03/25/36 | 143,994 | |||||||||||||
| 300,000 | Argent Securities, Inc., Series 06-M2, Class A2B, 1 mo. LIBOR + .11%, 0.58%, due 09/25/36 | 123,000 | |||||||||||||
| 900,000 | Asset Backed Funding Certificates, Series 06-OPT2, Class A3B, 1 mo. LIBOR + .11%, 0.58%, due 10/25/36 | 785,700 | |||||||||||||
| 333,157 | Asset Backed Funding Certificates, Series 07-NC1, Class A1, 144A, 1 mo. LIBOR + .22%, 0.69%, due 05/25/37 | 224,415 | |||||||||||||
| 682,765 | Bayview Financial Acquisition Trust, Series 04-B, Class A2, 144A, 1 mo. LIBOR + .65%, 1.71%, due 05/28/39 | 455,677 | |||||||||||||
| 1,200,000 | Carrington Mortgage Loan Trust, Series 07-FRE1, Class A2, 1 mo. LIBOR + .20%, 0.67%, due 02/25/37 | 570,000 | |||||||||||||
| 36,554 | Chase Funding Mortgage Loan Trust, Series 03-3, Class 2A2, 1 mo. LIBOR + .27%, 1.01%, due 04/25/33 | 26,319 | |||||||||||||
| 1,600,000 | Countrywide Asset-Backed Certificates, Series 06-BC3, Class 2A2, 1 mo. LIBOR + .14%, 0.61%, due 02/25/37 | 1,009,920 | |||||||||||||
| 1,100,000 | J.P. Morgan Mortgage Acquisition Corp., Series 06-WMC4, Class A3, 1 mo. LIBOR + .12%, 0.59%, due 12/25/36 | 374,000 | |||||||||||||
| 400,000 | Master Asset-Backed Securities Trust, Series 06-FRE2, Class A4, 1 mo. LIBOR + .15%, 0.62%, due 03/25/36 | 160,000 | |||||||||||||
| 850,575 | Morgan Stanley Home Equity Loans, Series 07-2, Class A1, 1 mo. LIBOR + .10%, 0.57%, due 04/25/37 | 671,954 | |||||||||||||
| 756,241 | Residential Asset Securities Corp., Series 05-KS12, Class A2, 1 mo. LIBOR + .25%, 0.72%, due 01/25/36 | 586,465 | |||||||||||||
| Total Residential Asset-Backed Securities (United States) | 5,541,572 | ||||||||||||||
| Residential Mortgage-Backed Securities (Australian) — 0.1% | |||||||||||||||
| 240,228 | Interstar Millennium Trust, Series 05-1G, Class A, 3 mo. LIBOR + .12%, 2.31%, due 12/08/36 | 184,978 | |||||||||||||
| 252,530 | Superannuation Members Home Loans Global Fund, Series 7, Class A1, 3 mo. LIBOR + .14%, 2.33%, due 03/09/36 | 220,245 | |||||||||||||
| 679,345 | Westpac Securitization Trust, Series 07-1G, Class A2A, 3 mo. LIBOR + .05%, 1.30%, due 05/21/38 | 575,887 | |||||||||||||
| Total Residential Mortgage-Backed Securities (Australian) | 981,110 | ||||||||||||||
See accompanying notes to the financial statements.
6
GMO Strategic Opportunities Allocation Fund
(A Series of GMO Trust)
Schedule of Investments — (Continued)
(showing percentage of total net assets)
February 28, 2009
| Par Value ($) | Description | Value ($) | |||||||||||||
| Residential Mortgage-Backed Securities (European) — 0.2% | |||||||||||||||
| 300,000 | Aire Valley Mortgages, Series 07-1A, Class 1A2, 144A, 3 mo. LIBOR + .09%, 1.62%, due 03/20/30 | 268,800 | |||||||||||||
| 200,000 | Arkle Master Issuer Plc, Series 06-1A, Class 3A, 144A, 3 mo. LIBOR + .05%, 1.29%, due 08/17/11 | 195,520 | |||||||||||||
| 600,000 | Brunel Residential Mortgages, Series 07-1A, Class A4C, 144A, 3 mo. LIBOR + .10%, 1.36%, due 01/13/39 | 484,380 | |||||||||||||
| 500,634 | Paragon Mortgages Plc, Series 7A, Class A1A, 144A, 3 mo. LIBOR + .21%, 1.45%, due 05/15/34 | 462,401 | |||||||||||||
| 500,000 | Pendeford Master Issuer Plc, Series 07-1A, Class 3A, 144A, 3 mo. LIBOR + .10%, 1.32%, due 02/12/16 | 437,000 | |||||||||||||
| 100,000 | Permanent Financing Plc, Series 4, Class 3A, 3 mo. LIBOR + .14%, 2.33%, due 03/10/24 | 99,817 | |||||||||||||
| Total Residential Mortgage-Backed Securities (European) | 1,947,918 | ||||||||||||||
| Student Loans — 0.1% | |||||||||||||||
| 500,000 | College Loan Corp. Trust, Series 06-1, Class A2, 3 mo. LIBOR + .02%, 1.18%, due 04/25/22 | 488,150 | |||||||||||||
| 123,110 | National Collegiate Student Loan Trust, Series 06-1, Class A2, 1 mo. LIBOR + .14%, 0.61%, due 08/25/23 | 110,799 | |||||||||||||
| 117,297 | National Collegiate Student Loan Trust, Series 06-A, Class A1, 144A, 1 mo. LIBOR + .08%, 0.55%, due 08/26/19 | 107,913 | |||||||||||||
| 600,000 | Nelnet Student Loan Trust, Series 05-2, Class A4, 3 mo. LIBOR + .08%, 1.61%, due 12/23/19 | 546,354 | |||||||||||||
| Total Student Loans | 1,253,216 | ||||||||||||||
| Total Asset-Backed Securities | 34,786,584 | ||||||||||||||
| Corporate Debt — 0.0% | |||||||||||||||
| 147,000 | Health Care Property Investors, Inc., Series G, MTN, 5.63%, due 02/28/13 | 132,751 | |||||||||||||
| U.S. Government Agency — 0.1% | |||||||||||||||
| 300,000 | Agency for International Development Floater (Support of Morocco), 6 mo. U.S. Treasury Bill + .45%, 5.62%, due 11/15/14 (a) | 284,357 | |||||||||||||
| 200,000 | Agency for International Development Floater (Support of Zimbabwe), 3 mo. U.S. Treasury Bill x 115%, 1.00%, due 01/01/12 (a) | 191,979 | |||||||||||||
| Total U.S. Government Agency | 476,336 | ||||||||||||||
| TOTAL DEBT OBLIGATIONS (COST $37,970,425) | 35,395,671 | ||||||||||||||
See accompanying notes to the financial statements.
7
GMO Strategic Opportunities Allocation Fund
(A Series of GMO Trust)
Schedule of Investments — (Continued)
(showing percentage of total net assets)
February 28, 2009
| Shares / Par Value ($) | Description | Value ($) | |||||||||||||
| MUTUAL FUNDS — 95.6% | |||||||||||||||
| Affiliated Issuers — 95.6% | |||||||||||||||
| 24,703,213 | GMO Alpha Only Fund, Class IV | 142,537,541 | |||||||||||||
| 6,340,885 | GMO Domestic Bond Fund, Class VI | 50,663,671 | |||||||||||||
| 781,384 | GMO Emerging Country Debt Fund, Class IV | 4,571,097 | |||||||||||||
| 1,501,441 | GMO Flexible Equities Fund, Class VI | 23,107,183 | |||||||||||||
| 1,255,553 | GMO Inflation Indexed Plus Bond Fund, Class VI | 18,670,080 | |||||||||||||
| 10,398,827 | GMO International Growth Equity Fund, Class IV | 150,367,034 | |||||||||||||
| 10,209,073 | GMO International Intrinsic Value Fund, Class IV | 142,927,020 | |||||||||||||
| 1,088,951 | GMO Special Situations Fund, Class VI | 27,779,151 | |||||||||||||
| 5,263,196 | GMO Strategic Fixed Income Fund, Class VI | 91,316,446 | |||||||||||||
| 6,526,064 | GMO U.S. Core Equity Fund, Class VI | 49,793,872 | |||||||||||||
| 24,673,504 | GMO U.S. Quality Equity Fund, Class VI | 349,870,292 | |||||||||||||
| 389,594 | GMO World Opportunity Overlay Fund | 7,149,055 | |||||||||||||
| TOTAL MUTUAL FUNDS (COST $1,546,993,003) | 1,058,752,442 | ||||||||||||||
| SHORT-TERM INVESTMENTS — 1.2% | |||||||||||||||
| Money Market Funds — 1.2% | |||||||||||||||
| 13,052,307 | State Street Institutional U.S. Government Money Market Fund- Institutional Class | 13,052,307 | |||||||||||||
| Other Short-Term Investments — 0.0% | |||||||||||||||
| 8,068 | State Street Eurodollar Time Deposit, 0.01%, due 03/02/09 | 8,068 | |||||||||||||
| TOTAL SHORT-TERM INVESTMENTS (COST $13,060,375) | 13,060,375 | ||||||||||||||
| TOTAL INVESTMENTS — 100.0% (Cost $1,598,023,803) | 1,107,208,488 | ||||||||||||||
| Other Assets and Liabilities (net) — 0.00% | 49,261 | ||||||||||||||
| TOTAL NET ASSETS — 100.0% | $ | 1,107,257,749 | |||||||||||||
See accompanying notes to the financial statements.
8
GMO Strategic Opportunities Allocation Fund
(A Series of GMO Trust)
Schedule of Investments — (Continued)
February 28, 2009
Notes to Schedule of Investments:
144A - Securities exempt from registration under Rule 144A of the Securities Act of 1933. These securities may be resold in transactions exempt from registration, normally to qualified institutional investors.
AMBAC - Insured as to the payment of principal and interest by AMBAC Assurance Corporation.
CMBS - Collateralized Mortgage Backed Security
EUR LIBOR - London Interbank Offered Rate denominated in Euros.
FGIC - Insured as to the payment of principal and interest by Financial Guaranty Insurance Corporation.
FSA - Insured as to the payment of principal and interest by Financial Security Assurance.
LIBOR - London Interbank Offered Rate
MBIA - Insured as to the payment of principal and interest by MBIA Insurance Corp.
MTN - Medium Term Note
The rates shown on variable rate notes are the current interest rates at February 28, 2009, which are subject to change based on the terms of the security.
(a) Security valued at fair value using methods determined in good faith by or at the direction of the Trustees of GMO Trust (Note 2).
Currency Abbreviations:
EUR - Euro
See accompanying notes to the financial statements.
9
GMO Strategic Opportunities Allocation Fund
(A Series of GMO Trust)
Statement of Assets and Liabilities — February 28, 2009
| Assets: | |||||||
| Investments in unaffiliated issuers, at value (cost $51,030,800) (Note 2) | $ | 48,456,046 | |||||
| Investments in affiliated issuers, at value (cost $1,546,993,003) (Notes 2 and 8) | 1,058,752,442 | ||||||
| Receivable for investments sold | 33,333 | ||||||
| Receivable for Fund shares sold | 47,685,501 | ||||||
| Dividends and interest receivable | 66,971 | ||||||
| Receivable for expenses reimbursed by Manager (Note 3) | 10,388 | ||||||
| Miscellaneous receivable | 14,310 | ||||||
| Total assets | 1,155,018,991 | ||||||
| Liabilities: | |||||||
| Payable for investments purchased | 47,699,811 | ||||||
| Payable to affiliate for (Note 3): | |||||||
| Trustees and Chief Compliance Officer of GMO Trust fees | 3,474 | ||||||
| Accrued expenses | 57,957 | ||||||
| Total liabilities | 47,761,242 | ||||||
| Net assets | $ | 1,107,257,749 | |||||
| Net assets consist of: | |||||||
| Paid-in capital | $ | 1,607,995,689 | |||||
| Distributions in excess of net investment income | (2,367,089 | ) | |||||
| Accumulated net realized loss | (7,555,536 | ) | |||||
| Net unrealized depreciation | (490,815,315 | ) | |||||
| $ | 1,107,257,749 | ||||||
| Net assets attributable to: | |||||||
| Class III shares | $ | 1,107,257,749 | |||||
| Shares outstanding: | |||||||
| Class III | 77,044,584 | ||||||
| Net asset value per share: | |||||||
| Class III | $ | 14.37 | |||||
See accompanying notes to the financial statements.
10
GMO Strategic Opportunities Allocation Fund
(A Series of GMO Trust)
Statement of Operations — Year Ended February 28, 2009
| Investment Income: | |||||||
| Dividends from affiliated issuers (Note 8) | $ | 85,938,127 | |||||
| Interest | 1,051,827 | ||||||
| Dividends | 15,614 | ||||||
| Total investment income | 87,005,568 | ||||||
| Expenses: | |||||||
| Custodian, fund accounting agent and transfer agent fees | 45,839 | ||||||
| Audit and tax fees | 37,577 | ||||||
| Legal fees | 24,446 | ||||||
| Chief Compliance Officer (Note 3) | 7,843 | ||||||
| Trustees fees and related expenses (Note 3) | 18,861 | ||||||
| Registration fees | 7,637 | ||||||
| Miscellaneous | 5,046 | ||||||
| Total expenses | 147,249 | ||||||
| Fees and expenses reimbursed by Manager (Note 3) | (120,545 | ) | |||||
| Expense reductions (Note 2) | (12,605 | ) | |||||
| Net expenses | 14,099 | ||||||
| Net investment income (loss) | 86,991,469 | ||||||
| Realized and unrealized gain (loss): | |||||||
| Net realized gain (loss) on: | |||||||
| Investments in unaffiliated issuers | (71,906 | ) | |||||
| Investments in affiliated issuers | (45,603,831 | ) | |||||
| Realized gains distributions from affiliated issuers (Note 8) | 60,642,365 | ||||||
| Foreign currency, forward contracts and foreign currency related transactions | 532 | ||||||
| Net realized gain (loss) | 14,967,160 | ||||||
| Change in net unrealized appreciation (depreciation) on: | |||||||
| Investments in unaffiliated issuers | (2,574,754 | ) | |||||
| Investments in affiliated issuers | (431,309,387 | ) | |||||
| Net unrealized gain (loss) | (433,884,141 | ) | |||||
| Net realized and unrealized gain (loss) | (418,916,981 | ) | |||||
| Net increase (decrease) in net assets resulting from operations | $ | (331,925,512 | ) | ||||
See accompanying notes to the financial statements.
11
GMO Strategic Opportunities Allocation Fund
(A Series of GMO Trust)
Statement of Changes in Net Assets
| Year Ended February 28, 2009 | Year Ended February 29, 2008 | ||||||||||
| Increase (decrease) in net assets: | |||||||||||
| Operations: | |||||||||||
| Net investment income (loss) | $ | 86,991,469 | $ | 32,758,480 | |||||||
| Net realized gain (loss) | 14,967,160 | 61,340,612 | |||||||||
| Change in net unrealized appreciation (depreciation) | (433,884,141 | ) | (89,711,146 | ) | |||||||
| Net increase (decrease) in net assets from operations | (331,925,512 | ) | 4,387,946 | ||||||||
| Distributions to shareholders from: | |||||||||||
| Net investment income | |||||||||||
| Class III | (97,614,780 | ) | (43,466,039 | ) | |||||||
| Net realized gains | |||||||||||
| Class III | (55,458,846 | ) | (24,846,890 | ) | |||||||
| (153,073,626 | ) | (68,312,929 | ) | ||||||||
| Net share transactions (Note 7): | |||||||||||
| Class III | 491,786,568 | 634,481,810 | |||||||||
| Purchase premiums and redemption fees (Notes 2 and 7): | |||||||||||
| Class III | 304,811 | 234,265 | |||||||||
| Total increase (decrease) in net assets resulting from net share transactions, purchase premiums and redemption fees | 492,091,379 | 634,716,075 | |||||||||
| Total increase (decrease) in net assets | 7,092,241 | 570,791,092 | |||||||||
| Net assets: | |||||||||||
| Beginning of period | 1,100,165,508 | 529,374,416 | |||||||||
| End of period (including distributions in excess of net investment income of $2,367,089 and accumulated undistributed net investment income of $5,027,700, respectively) | $ | 1,107,257,749 | $ | 1,100,165,508 | |||||||
See accompanying notes to the financial statements.
12
GMO Strategic Opportunities Allocation Fund
(A Series of GMO Trust)
Financial Highlights
(For a Class III share outstanding throughout each period)
| Year Ended February 28/29, | |||||||||||||||||||
| 2009 | 2008 | 2007 | 2006(a) | ||||||||||||||||
| Net asset value, beginning of period | $ | 22.70 | $ | 23.71 | $ | 22.37 | $ | 20.00 | |||||||||||
| Income (loss) from investment operations: | |||||||||||||||||||
| Net investment income (loss)(b)† | 1.57 | 0.99 | 0.69 | 0.52 | |||||||||||||||
| Net realized and unrealized gain (loss) | (7.23 | ) | (0.15 | ) | 2.17 | 2.34 | |||||||||||||
| Total from investment operations | (5.66 | ) | 0.84 | 2.86 | 2.86 | ||||||||||||||
| Less distributions to shareholders: | |||||||||||||||||||
| From net investment income | (1.61 | ) | (1.02 | ) | (0.90 | ) | (0.47 | ) | |||||||||||
| From net realized gains | (1.06 | ) | (0.83 | ) | (0.62 | ) | (0.02 | ) | |||||||||||
| Total distributions | (2.67 | ) | (1.85 | ) | (1.52 | ) | (0.49 | ) | |||||||||||
| Net asset value, end of period | $ | 14.37 | $ | 22.70 | $ | 23.71 | $ | 22.37 | |||||||||||
| Total Return(c) | (26.75 | )% | 3.15 | % | 12.98 | % | 14.42 | %** | |||||||||||
| Ratios/Supplemental Data: | |||||||||||||||||||
| Net assets, end of period (000's) | $ | 1,107,258 | $ | 1,100,116 | $ | 529,374 | $ | 366,622 | |||||||||||
| Net expenses to average daily net assets(d)(e) | 0.00 | %(f) | 0.00 | %(f) | 0.00 | % | 0.00 | %* | |||||||||||
| Net investment income to average daily net assets(b) | 8.05 | % | 4.05 | % | 2.98 | % | 3.22 | %* | |||||||||||
| Portfolio turnover rate | 34 | % | 47 | % | 23 | % | 10 | %** | |||||||||||
| Fees and expenses reimbursed by the Manager to average daily net assets: | 0.01 | % | 0.01 | % | 0.02 | % | 0.06 | %* | |||||||||||
| Purchase premiums and redemption fees consisted of the following per share amounts:† | $ | 0.01 | $ | 0.01 | $ | 0.00 | (g) | $ | 0.02 | ||||||||||
(a) Period from May 31, 2005 (commencement of operations) through February 28, 2006.
(b) Net investment income is affected by the timing of the declaration of dividends by the underlying funds in which the Fund invests.
(c) The total returns would have been lower had certain expenses not been reimbursed and/or waived during the periods shown and assumes the effect of reinvested distributions. Calculation excludes purchase premiums and redemption fees which are borne by the shareholder.
(d) Net expenses exclude expenses incurred indirectly through investment in the underlying funds (See Note 3).
(e) Net expenses to average daily net assets were less than 0.01%.
(f) The net expense ratio does not include the effect of expense reductions.
(g) Purchase premiums and redemption fees were less than $0.01 per share.
† Calculated using average shares outstanding throughout the period.
* Annualized.
** Not annualized.
See accompanying notes to the financial statements.
13
GMO Strategic Opportunities Allocation Fund
(A Series of GMO Trust)
Notes to Financial Statements
February 28, 2009
1. Organization
GMO Strategic Opportunities Allocation Fund (the "Fund") is a series of GMO Trust (the "Trust"). The Fund is registered under the Investment Company Act of 1940, as amended, as an open-end, diversified management investment company. The Fund is advised and managed by Grantham, Mayo, Van Otterloo & Co. LLC (the "Manager" or "GMO"). The Trust was established as a Massachusetts business trust under the laws of The Commonwealth of Massachusetts on June 24, 1985. The Declaration of Trust permits the Trustees of the Trust ("Trustees") to create an unlimited number of series of shares ("Funds") and to subdivide Funds into classes.
The Fund seeks total return greater than that of its benchmark, the GMO Strategic Opportunities Allocation Index. The GMO Strategic Opportunities Allocation Index is a composite benchmark computed by GMO consisting of: (i) the MSCI World Index, and (ii) the Barclays Capital U.S. Aggregate Index in the following proportions: 75% (MSCI World Index) and 25% (Barclays Capital U.S. Aggregate Index). The Fund is a fund of funds and invests primarily in shares of other GMO Funds, which may include the GMO International Equity Funds (including one or more of the GMO Emerging Markets Funds), the GMO U.S. Equity Funds, the GMO Fixed Income Funds, GMO Alpha Only Fund, GMO Alternative Asset Opportunity Fund, GMO Flexible Equities Fund, GMO Short-Duration Collateral Fund, GMO Special Situations Fund, and GMO World Opportunity Overlay Fund. In addition, the Fund may hold securities (particularly asset-backed securities) directly or through on e or more subsidiaries or other entities.
The financial statements of the underlying funds in which the Fund invests should be read in conjunction with the Fund's financial statements. These financial statements are available, without charge, upon request, by calling (617) 346-7646 (collect) or by visiting GMO's website at www.gmo.com. Shares of GMO Alternative Asset Opportunity Fund, GMO Flexible Equities Fund, GMO Short-Duration Collateral Fund, GMO Special Situations Fund, and GMO World Opportunity Overlay Fund are not publicly available for direct purchase.
The Fund directly and indirectly (through underlying funds) invests in securities with contractual cash flows, such as collateralized mortgage obligations and commercial mortgage-backed securities, including securities backed by sub-prime mortgage loans, credit card receivables and auto loan receivables. The value, liquidity and related income of these securities are sensitive to changes in economic conditions, including real estate values, delinquencies and/or defaults, and may be adversely affected by changes in interest rates and shifts in the market's perception of the securities' market values.
2. Significant accounting policies
The following is a summary of significant accounting policies followed by the Fund in the preparation of its financial statements. These policies are in conformity with accounting principles generally accepted in the United States of America ("U.S. GAAP") and have been consistently followed by the Fund in
14
GMO Strategic Opportunities Allocation Fund
(A Series of GMO Trust)
Notes to Financial Statements — (Continued)
February 28, 2009
preparing its financial statements. The preparation of financial statements in accordance with U.S. GAAP requires management to make estimates and assumptions that affect the reported amounts and disclosures in the financial statements. Actual results could differ from those estimates. The accounting records of the Fund are maintained in U.S. dollars.
Portfolio valuation
Shares of the underlying funds and other mutual funds are generally valued at their net asset value.
Investments held by the underlying funds are valued as follows. Securities listed on a securities exchange for which market quotations are readily available are valued at the last sale price or official closing price on each business day, or if there is no such reported sale or official closing price, at the most recent quoted bid price. Unlisted securities for which market quotations are readily available are generally valued at the most recent quoted bid price. Debt instruments with a remaining maturity of sixty days or less are generally valued at amortized cost, which approximates fair value. Securities for which quotations are not readily available or whose values the Manager has determined to be unreliable are valued at fair value as determined in good faith by the Trustees or persons acting at their direction pursuant to procedures approved by the Trustees. By its nature, a fair value price is a good faith estimate of the value of a security at a given point in time and may not reflect the value that would be realized if the security were sold. The difference between a fair value price and the value realized upon a sale could be material. Because many foreign equity securities markets and exchanges close prior to the close of the New York Stock Exchange ("NYSE"), closing prices for foreign securities in those markets or on those exchanges do not reflect the events that occur after that close but before the close of the NYSE. As a result, the Fund generally values foreign equity securities using fair value prices, which are based on adjustments to closing prices supplied by a third party vendor based on that vendor's proprietary models. As of February 28, 2009, 28.98% of the net assets of the Fund, through investments in the underlying funds, were valued using fair value prices based on models used by a third party vendor.
Typically the Fund and the underlying funds value debt instruments based on prices supplied by a primary pricing source chosen by the Manager. The Manager evaluates primary pricing sources on an ongoing basis and may change a pricing source should the Manager deem it appropriate. If it deems appropriate, the Manager, at its discretion, may override a price supplied by a primary source by using a price provided by another source. The prices provided by primary pricing sources may differ from the value that would be realized if the securities were sold, and the differences could be material.
Certain securities held by the Fund and underlying funds are valued on the basis of prices provided by a single source. As of February 28, 2009, the total value of these securities represented 4.90% of the net assets. The single source prices provided may differ from the value that would be realized if the securities were sold, and the differences could be material. In addition, although alternative prices are available for other securities held by the Fund, those alternative sources would not necessarily confirm the security
15
GMO Strategic Opportunities Allocation Fund
(A Series of GMO Trust)
Notes to Financial Statements — (Continued)
February 28, 2009
price used by the Fund. Therefore, the existence of those alternative sources does not necessarily provide greater certainty about the prices used by the Fund.
In September 2006, the Financial Accounting Standards Board ("FASB") issued Statement of Financial Accounting Standards No. 157, Fair Value Measurements ("SFAS 157"). SFAS 157 is effective for the Fund's current fiscal year. While the adoption of SFAS 157 does not have an effect on the Fund's net asset value, it does require additional disclosures about fair value measurements. SFAS 157 establishes a three-level hierarchy for disclosure of fair value measurements. The valuation hierarchy is based upon the reliability of inputs to the valuation of the Fund's investments. The three levels are defined as follows:
Level 1 – Valuations based on quoted prices for identical securities in active markets.
Level 2 – Valuations determined using other significant direct or indirect observable inputs.
Level 3 – Valuations based on inputs that are unobservable and significant. The Fund utilized the following fair value techniques on Level 3 investments: the Fund valued debt securities using bids received from primary pricing sources.
The inputs or methodology used for valuing securities are not necessarily an indication of the risk associated with investing in those securities.
The following is a summary of the fair valuations according to inputs used as of February 28, 2009 in valuing the Fund's investments:
| Asset Valuation Inputs | Investments in Securities | Other Financial Instruments | |||||||||
| Level 1 - Quoted Prices | $ | 1,000,725,121 | $ | — | |||||||
| Level 2 - Other Significant Observable Inputs | 71,220,447 | — | |||||||||
| Level 3 - Significant Unobservable Inputs | 35,262,920 | — | |||||||||
| Total | $ | 1,107,208,488 | $ | — | |||||||
| Liability Valuation Inputs | Investments in Securities | Other Financial Instruments | |||||||||
| Level 1 - Quoted Prices | $ | — | $ | — | |||||||
| Level 2 - Other Significant Observable Inputs | — | — | |||||||||
| Level 3 - Significant Unobservable Inputs | — | — | |||||||||
| Total | $ | — | $ | — | |||||||
16
GMO Strategic Opportunities Allocation Fund
(A Series of GMO Trust)
Notes to Financial Statements — (Continued)
February 28, 2009
For the underlying fund's summary of valuation inputs please refer to the respective fund's portfolio valuation note.
The following is a reconciliation of investments in which significant unobservable inputs (Level 3) were used in determining value:
| Investments in Securities | Other Financial Instruments | ||||||||||
| Balance as of February 29, 2008 | $ | — | $ | — | |||||||
| Accrued discounts/premiums | 392,953 | — | |||||||||
| Realized gain (loss) | 368,942 | — | |||||||||
| Change in unrealized appreciation/depreciation | (2,578,028 | ) | — | ||||||||
| Net purchases (sales) | 37,079,053 | — | |||||||||
| Net transfers in and/or out of Level 3 | — | — | |||||||||
| Balance as of February 28, 2009 | $ | 35,262,920 | $ | — | |||||||
Foreign currency translation
The market values of foreign securities, currency holdings and related assets and liabilities are translated to U.S. dollars based on the 4 p.m. New York time exchange rates each business day. Income and expenses denominated in foreign currencies are translated at the 4 p.m. New York time exchange rates on the business day the income and expenses are accrued or incurred. The Fund does not isolate realized and unrealized gains and losses attributable to changes in exchange rates from gains and losses that arise from changes in the market value of investments. Such fluctuations are included with net realized and unrealized gain or loss on investments. Net realized gains and losses on foreign currency transactions represent gains and losses on disposition of currencies and forward currency contracts, currency gains and losses realized between the trade and settlement dates on securities transactions, and the difference between the amount of investment income and foreign withholding taxes recorded on the Fund's accounting records and the U.S. dollar equivalent amounts actually received or paid.
Repurchase agreements
The Fund may enter into repurchase agreements. Under a repurchase agreement the Fund acquires a security for cash and obtains a simultaneous commitment from the seller to repurchase the security at an agreed upon price and date. The Fund, through its custodian, takes possession of securities collateralizing the repurchase agreement. The collateral is marked to market daily to ensure that the market value of the underlying assets is at least equal to the amount owed to the Fund in the event of default by the seller. If the seller of a repurchase agreement defaults or enters into insolvency proceedings and the value of the collateral declines, the Fund's recovery of cash may be delayed or limited. The Fund had no repurchase agreements outstanding at the end of the period.
17
GMO Strategic Opportunities Allocation Fund
(A Series of GMO Trust)
Notes to Financial Statements — (Continued)
February 28, 2009
Taxes and distributions
The Fund intends to qualify each tax year as a regulated investment company under Subchapter M of the Internal Revenue Code of 1986, as amended (the "Code"). The Fund intends to distribute substantially all of its net investment income and all of its net realized short-term and long-term capital gain, if any, after giving effect to any available capital loss carryforwards for U.S. federal income tax purposes. Therefore, no provision for U.S. federal income or excise tax is necessary.
The Fund's policy is to declare and pay distributions from net investment income, if any, semiannually, and from net realized short-term and long-term capital gain, if any, at least annually. All distributions are paid in shares of the Fund, at net asset value, unless the shareholder elects to receive cash distributions. Distributions to shareholders are recorded by the Fund on the ex-dividend date.
Income and capital gain distributions are determined in accordance with U.S. federal income tax regulations, which may differ from U.S. GAAP. Certain capital accounts in the financial statements are periodically adjusted for permanent differences in order to reflect their tax character. These adjustments have no impact on net assets or net asset value per share. Temporary differences that arise from recognizing certain items of income, expense, gain or loss in different periods for financial statement and tax purposes will reverse at some time in the future. Distributions in excess of net investment income or net realized gains are temporary over-distributions for financial statement purposes resulting from differences in the recognition or classification of income or distributions for financial statement and tax purposes.
U.S. GAAP and tax accounting differences primarily relate to differing treatment of mutual fund distributions received, subscription in-kind transactions, partnership interest tax allocations, losses on wash sale transactions and post-October capital losses.
The following reclassification represents the amount necessary to report the stated components of net assets on a tax basis, excluding certain temporary differences, as of February 28, 2009. The financial highlights exclude these adjustments.
| Distributions In Excess of Net Investment Income | Accumulated Net Realized Loss | Paid-in Capital | |||||||||
| $ | 3,228,522 | $ | (1,776,117 | ) | $ | (1,452,405 | ) | ||||
18
GMO Strategic Opportunities Allocation Fund
(A Series of GMO Trust)
Notes to Financial Statements — (Continued)
February 28, 2009
The tax character of distributions declared to shareholders is as follows:
| 2/28/2009 | 2/29/2008 | ||||||||||
| Ordinary income (including any net short-term capital gain) | $ | 97,617,350 | $ | 44,599,754 | |||||||
| Net long-term capital gain | 55,456,276 | 23,713,175 | |||||||||
| Total distributions | $ | 153,073,626 | $ | 68,312,929 | |||||||
Distributions in excess of tax basis earnings and profits, if significant, are reported in the financial statements as a return of capital for tax purposes.
As of February 28, 2009, the components of distributable earnings on a tax basis consisted of the following:
Undistributed ordinary income (including any
net short-term capital gain) $ 8,439,095
As of February 28, 2009, the Fund elected to defer to March 1, 2009 post-October capital losses of $3,243,689.
As of February 28, 2009, the approximate cost for U.S. federal income tax purposes and gross and net unrealized appreciation (depreciation) in value of investments were as follows:
| Aggregate Cost | Gross Unrealized Appreciation | Gross Unrealized (Depreciation) | Net Unrealized Appreciation (Depreciation) | ||||||||||||
| $ | 1,613,101,576 | $ | 5,564,944 | $ | (511,458,032 | ) | $ | (505,893,088 | ) | ||||||
The Fund is subject to the provisions of Financial Accounting Standards Board Interpretation No. 48 ("FIN 48"), Accounting for Uncertainty in Income Taxes — an Interpretation of FASB Statement No. 109. FIN 48 sets forth a minimum threshold for financial statement recognition of a tax position taken or expected to be taken in a tax return that could affect the Fund's financial statements. The Fund did not have any unrecognized tax benefits or liabilities at February 28, 2009, nor did it have any increases or decreases in unrecognized tax benefits or liabilities for the period then ended. The Fund is subject to examination prior to the expiration of the statute of limitations by U.S. federal and state tax authorities for tax returns filed.
19
GMO Strategic Opportunities Allocation Fund
(A Series of GMO Trust)
Notes to Financial Statements — (Continued)
February 28, 2009
Security transactions and related investment income
Security transactions in the financial statements are accounted for on the trade date. Income dividends and capital gain distributions from the underlying funds are recorded on the ex-dividend date. Interest income is recorded on the accrual basis. Non-cash dividends, if any, are recorded at the fair market value of the asset received. In determining the net gain or loss on securities sold, the Fund uses the identified cost basis for the purposes of determining the cost basis.
Expenses
The majority of the expenses of the Trust are directly identifiable to an individual fund. Expenses that are not readily identifiable to a specific fund are allocated taking into consideration, among other things, the nature and type of expense and the relative size of the funds. In addition, the Fund incurs fees and expenses indirectly as a shareholder in the underlying funds. Because the underlying funds have different expense and fee levels and the Fund may own different proportions of the underlying funds at different times, the amount of fees and expenses indirectly incurred by the Fund will vary and the Manager has a conflict in allocating among the underlying funds. (See Note 3).
State Street Bank and Trust Company ("State Street") serves as custodian, fund accounting agent and transfer agent of the Fund. State Street's fees may be reduced by an earnings allowance calculated on the average daily cash balances the Fund maintains with State Street. The Fund receives the benefit of the earnings allowance. In addition, Goldman Sachs Agency Lending, the Fund's securities lending agent, has agreed to reimburse the Fund for certain transactional expenses related to securities lending activity. Credit balances or expense reimbursements used to reduce fees, if any, are reported as a reduction of expenses in the Statement of Operations.
Purchases and redemptions of Fund shares
Effective June 30, 2008, the premium on cash purchases of Fund shares was changed to 0.07% of the amount invested and the fee on cash redemptions remained at 0.04% of the amount redeemed. Effective September 30, 2008, the Fund no longer charged a premium on cash purchases or fee on cash redemptions of the amount invested or redeemed. Effective October 8, 2008, the fee on cash redemptions was changed to 0.22% of the amount redeemed. Effective October 21, 2008, the premium on cash purchases was changed to 0.03% of the amount invested and the fee on cash redemptions was changed to 0.50% of the amount redeemed. Effective November 24, 2008, the fee on cash redemptions was changed to 2.00% of the amount redeemed. As of February 28, 2009, the premium on cash purchases was 0.03% of the amount invested and the fee on cash redemptions was 2.00% of the amount redeemed. The level of purchase premium for the Fund may be adjusted to account f or changes in the Fund's investments (i.e., changes in the percentage of Fund assets allocated to each underlying fund). The Fund may impose a new purchase premium and/or redemption fee, or modify or eliminate an existing purchase premium and/or redemption fee, at any time. If the Manager determines that any portion of a cash purchase or redemption is offset by a corresponding cash redemption or purchase on the same day, the Fund will ordinarily waive or reduce the purchase premium or redemption fee with respect to that portion. All or portion of the redemption fees may be waived at the manager's discretion under circumstances in which the Manager deems it equitable
20
GMO Strategic Opportunities Allocation Fund
(A Series of GMO Trust)
Notes to Financial Statements — (Continued)
February 28, 2009
to do so, including without limitation in cases where the weighted average of (i) the estimated transaction costs for directly held assets and (ii) the redemption fees, if any, imposed by the underlying funds is less than the Fund's redemption fee. In addition, the Fund may waive or reduce the purchase premium or redemption fee in extraordinary circumstances if the purchase or redemption will not cause the Fund to incur transaction costs. All purchase premiums and redemption fees are paid to the Fund and recorded by the Fund as paid-in capital. The Fund will waive or reduce the purchase premium relating to the in-kind portion of a purchase transaction except for estimated or known transaction costs (e.g. stamp duties and transfer taxes) incurred by the Fund as a result of the transfer of the purchasing shareholder's securities to the Fund. In-kind redemption transactions are generally not subject to redemption fees except when t hey include a cash component. However, when a substantial portion of a Fund is being redeemed, the Fund may charge a redemption fee based on estimated or known transaction costs resulting from those redemptions. The Fund charges no premium for reinvested distributions.
Investment risks
The Fund is subject to the investment risks associated with an investment in the underlying funds, some of which may invest in foreign securities. The Fund is subject to risks involved in investing in foreign securities that are not presented by investments in U.S. securities. These risks may involve adverse political and economic developments, including expropriation and the possible imposition of capital controls or other foreign governmental laws or restrictions. In addition, the securities of some foreign companies and securities markets are less liquid and at times more volatile than securities of comparable U.S. companies and U.S. securities markets. The risks described above apply to an even greater extent to investments in emerging markets. The securities markets of emerging countries are generally smaller, less developed, less liquid, and more volatile than the securities markets of the U.S. and developed foreign market s. Additionally, the investment risks associated with an investment in the underlying funds may be greater to the extent that the underlying funds engage in derivative transactions.
Recently issued accounting pronouncement
In March 2008, FASB issued Statement of Financial Accounting Standards No. 161, Disclosures about Derivative Instruments and Hedging Activities ("SFAS 161"). SFAS 161 is effective for fiscal years and interim periods beginning after November 15, 2008. SFAS 161 requires enhanced disclosures about the Fund's derivative and hedging activities. The Manager is currently evaluating the impact the adoption of SFAS 161 will have on the Fund's financial statement disclosures.
3. Fees and other transactions with affiliates
The Manager decides how to allocate the assets of the Fund among underlying funds. The Manager does not directly charge the Fund a management fee or shareholder service fee, but it receives varying management and shareholder service fees from the underlying funds in which the Fund invests. Because of that variation the levels of indirect net expenses set forth below are affected by the Manager's asset allocation decisions.
21
GMO Strategic Opportunities Allocation Fund
(A Series of GMO Trust)
Notes to Financial Statements — (Continued)
February 28, 2009
Through at least June 30, 2009, the Manager has contractually agreed to reimburse the Fund for Fund expenses incurred through that date (excluding "Excluded Expenses", as defined below). Excluded Expenses include fees and expenses of the independent Trustees of the Trust, fees and expenses for legal services not approved by the Manager for the Trust, compensation and expenses of the Trust's Chief Compliance Officer ("CCO") (excluding any employee benefits), brokerage commissions, securities lending fees and expenses, interest expense, transfer taxes, and other investment-related costs (including expenses associated with investments in any company that is an investment company or would be an investment company under the 1940 Act, but for the exceptions to the definition of investment company provided in Section 3(c)(1) and 3(c)(7) of the 1940 Act), hedging transaction fees, extraordinary, non-recurring and certain other unusual e xpenses (including taxes).
The Fund incurs fees and expenses indirectly as a shareholder in the underlying funds. For the year ended February 28, 2009, these indirect fees and expenses expressed as an annualized percentage of the Fund's average daily net assets were as follows:
| Indirect Net Expenses (excluding shareholder service fees and interest expense) | Indirect Shareholder Service Fees | Indirect Interest Expense | Total Indirect Expenses | ||||||||||||
| 0.388 | % | 0.070 | % | 0.002 | % | 0.460 | % | ||||||||
The Fund's portion of the fees paid by the Trust to the Trust's independent Trustees and CCO during the year ended February 28, 2009 was $15,221 and $7,843, respectively. The compensation and expenses of the CCO are included expenses in the Statement of Operations. The Fund paid no remuneration to any other officer of the Trust.
4. Purchases and sales of securities
Cost of purchases and proceeds from sales of securities, excluding short-term investments and class exchanges, for the year ended February 28, 2009 aggregated $849,254,175 and $374,296,374, respectively. Cost of purchases and proceeds from sales of securities for in-kind transactions for the year ended February 28, 2009 were $53,926,966 and $53,926,966, respectively.
22
GMO Strategic Opportunities Allocation Fund
(A Series of GMO Trust)
Notes to Financial Statements — (Continued)
February 28, 2009
5. Guarantees
In the normal course of business the Fund enters into contracts with third-party service providers that contain a variety of representations and warranties and that provide general indemnifications. The Fund's maximum exposure under these arrangements is unknown, as it involves future claims that may be made against the Fund that have not yet occurred. Based on experience, management is of the view that the risk of loss in connection with its indemnification obligations is remote; however, there can be no assurance that such obligations will not result in material liabilities that adversely affect the Fund.
6. Principal shareholders and related parties
As of February 28, 2009, 34.27% of the outstanding shares of the Fund were held by two shareholders, each holding more than 10% of the Fund's outstanding shares. On that date, no other shareholder owned more than 10% of the outstanding shares of the Fund. Redemptions from (or investments into) the Fund by or on behalf of these large shareholders may have a material effect on the Fund.
As of February 28, 2009, less than 0.01% of the Fund's shares were held by senior management of the Manager and GMO Trust officers and 99.97% of the Fund's shares were held by accounts for which the Manager had investment discretion.
7. Share transactions
The Declaration of Trust permits the Trust to issue an unlimited number of shares of beneficial interest (without par value). Transactions in Fund shares were as follows:
| Year Ended February 28, 2009 | Year Ended February 29, 2008 | ||||||||||||||||||
| Class III: | Shares | Amount | Shares | Amount | |||||||||||||||
| Shares sold | 21,710,901 | $ | 377,255,235 | 23,859,232 | $ | 579,450,743 | |||||||||||||
| Shares issued to shareholders in reinvestment of distributions | 8,772,878 | 152,047,372 | 2,788,898 | 67,229,949 | |||||||||||||||
| Shares repurchased | (1,914,307 | ) | (37,516,039 | ) | (502,061 | ) | (12,198,882 | ) | |||||||||||
| Purchase premiums | — | 100,056 | — | 232,499 | |||||||||||||||
| Redemption fees | — | 204,755 | — | 1,766 | |||||||||||||||
| Net increase (decrease) | 28,569,472 | $ | 492,091,379 | 26,146,069 | $ | 634,716,075 | |||||||||||||
23
GMO Strategic Opportunities Allocation Fund
(A Series of GMO Trust)
Notes to Financial Statements — (Continued)
February 28, 2009
8. Investments in affiliated issuers
A summary of the Fund's transactions in the shares of other funds of the Trust during the year ended February 28, 2009 is set forth below:
| Affiliate | Value, beginning of period | Purchases | Sales Proceeds | Dividend Income | Distributions of Realized Gains | Value, end of period | |||||||||||||||||||||
| GMO Alpha Only Fund, Class IV | $ | 90,584,368 | $ | 172,849,657 | $ | 64,917,000 | $ | 53,148,310 | $ | 20,852,738 | $ | 142,537,541 | |||||||||||||||
| GMO Core Plus Bond Fund, Class IV | 26,514,728 | 1,060,589 | 24,107,963 | 1,060,589 | — | — | |||||||||||||||||||||
| GMO Domestic Bond Fund, Class VI | — | 76,396,191 | 17,978,726 | 2,362,184 | 107,501 | 50,663,671 | |||||||||||||||||||||
| GMO Emerging Country Debt Fund, Class IV | 5,743,483 | 1,398,477 | — | 593,444 | 121,321 | 4,571,097 | |||||||||||||||||||||
| GMO Emerging Markets Fund, Class VI | — | 43,592,103 | 41,304,113 | — | — | — | |||||||||||||||||||||
| GMO Emerging Markets Opportunities Fund, Class VI | 103,926,197 | 24,950,520 | 98,007,614 | 516,691 | 24,433,829 | — | |||||||||||||||||||||
| GMO Flexible Equities Fund, Class VI | — | 29,503,125 | — | 3,125 | — | 23,107,183 | |||||||||||||||||||||
| GMO Inflation Indexed Plus Bond Fund, Class VI | — | 33,080,572 | 7,373,388 | 2,198,726 | — | 18,670,080 | |||||||||||||||||||||
| GMO International Bond Fund, Class III | 5,569,426 | 413,051 | 4,885,337 | 413,051 | — | — | |||||||||||||||||||||
| GMO International Growth Equity Fund, Class IV | 156,545,575 | 86,336,488 | 2,000,000 | 6,093,686 | 5,319,696 | 150,367,034 | |||||||||||||||||||||
| GMO International Intrinsic Value Fund, Class IV | 159,656,664 | 92,573,960 | 5,323,371 | 6,948,146 | 8,446,880 | 142,927,020 | |||||||||||||||||||||
| GMO Special Situations Fund, Class VI | 58,396,773 | 2,489,304 | 40,916,000 | — | — | 27,779,151 | |||||||||||||||||||||
24
GMO Strategic Opportunities Allocation Fund
(A Series of GMO Trust)
Notes to Financial Statements — (Continued)
February 28, 2009
| Affiliate | Value, beginning of period | Purchases | Sales Proceeds | Dividend Income | Distributions of Realized Gains | Value, end of period | |||||||||||||||||||||
| GMO Strategic Fixed Income Fund, Class VI | $ | 216,621,119 | $ | 22,373,936 | $ | 108,912,458 | $ | 6,199,523 | $ | — | $ | 91,316,446 | |||||||||||||||
| GMO U.S. Core Equity Fund, Class VI | 69,986,654 | 9,095,736 | 3,000,000 | 1,158,720 | — | 49,793,872 | |||||||||||||||||||||
| GMO U.S. Quality Equity Fund, Class VI | 206,637,036 | 253,895,823 | 3,510,000 | 5,241,932 | 1,360,400 | 349,870,292 | |||||||||||||||||||||
| GMO World Opportunity Overlay Fund | — | 7,710,071 | — | — | — | 7,149,055 | |||||||||||||||||||||
| Totals | $ | 1,100,182,023 | $ | 857,719,603 | $ | 422,235,970 | $ | 85,938,127 | $ | 60,642,365 | $ | 1,058,752,442 | |||||||||||||||
25
Report of Independent Registered Public Accounting Firm
To the Trustees of GMO Trust and the Shareholders of
GMO Strategic Opportunities Allocation Fund:
In our opinion, the accompanying statement of assets and liabilities, including the schedule of investments, and the related statements of operations and of changes in net assets and the financial highlights present fairly, in all material respects, the financial position of GMO Strategic Opportunities Allocation Fund (the "Fund") at February 28, 2009, the results of its operations for the year then ended, the changes in its net assets for each of the two years in the period then ended and the financial highlights for the periods indicated, in conformity with accounting principles generally accepted in the United States of America. These financial statements and financial highlights (hereafter referred to as "financial statements") are the responsibility of the Fund's management. Our responsibility is to express an opinion on these financial statements based on our audits. We conducted our audits of these financial statements in accordance with the standards of the Public Company Accounting Oversight Board (United States). Those standards require that we plan and perform the audit to obtain reasonable assurance about whether the financial statements are free of material misstatement. An audit includes examining, on a test basis, evidence supporting the amounts and disclosures in the financial statements, assessing the accounting principles used and significant estimates made by management, and evaluating the overall financial statement presentation. We believe that our audits, which included confirmation of securities at February 28, 2009 by correspondence with the custodian and brokers, provide a reasonable basis for our opinion.
PricewaterhouseCoopers LLP
Boston, Massachusetts
April 29, 2009
26
GMO Strategic Opportunities Allocation Fund
(A Series of GMO Trust)
Fund Expenses
February 28, 2009 (Unaudited)
Expense Examples: The following information is in relation to expenses for the six month period ended February 28, 2009.
As a shareholder of the Fund, you may incur two types of costs: (1) transaction costs, including purchase premiums and redemption fees; and (2) ongoing costs, including indirect management fees, shareholder service fees, and other Fund expenses. This example is intended to help you understand your ongoing costs (in dollars) of investing in the Fund and to compare these costs with the ongoing costs of investing in other mutual funds.
These examples are based on an investment of $1,000 invested at the beginning of the period and held for the entire period, September 1, 2008 through February 28, 2009.
Actual Expenses
The first line of the table below provides information about actual account values and actual expenses. You may use the information in this line, together with the amount you invested, to estimate the expenses that you paid over the period. Simply divide your account value by $1,000 (for example, a $10,000,000 account value divided by $1,000 = 10,000), then multiply the result by the number in the first line under the heading entitled "Net Expense Incurred" to estimate the expenses you paid on your account during this period.
Hypothetical Example for Comparison Purposes
The second line of the table below provides information about hypothetical account values and hypothetical expenses based on the Fund's actual expense ratio and an assumed rate of return of 5% per year before expenses, which is not the Fund's actual return. The hypothetical account values and expenses may not be used to estimate the actual ending account balance or expenses you paid for the period. You may use this information to compare the ongoing costs of investing in the Fund with other funds. To do so, compare this 5% hypothetical example with the 5% hypothetical examples that appear in the shareholder reports of other funds.
Please note that the expenses shown in the table are meant to highlight your ongoing costs only and do not reflect any transactional costs, such as purchase premiums and redemption fees. Therefore, the second line of the table is useful in comparing ongoing costs only, and will not help you determine the relative total costs of owning different funds. In addition, if these transactional costs were included, your costs would have been higher.
| Annualized Net Expense Ratio | Beginning Account Value | Ending Account Value | Net Expense Incurred* | ||||||||||||||||
| Class III | |||||||||||||||||||
| 1) Actual | 0.45 | % | $ | 1,000.00 | $ | 758.50 | $ | 1.96 | |||||||||||
| 2) Hypothetical | 0.45 | % | $ | 1,000.00 | $ | 1,022.56 | $ | 2.26 | |||||||||||
* Expenses are calculated using the Class's annualized expense ratio (including indirect expenses incurred) for the six months ended February 28, 2009, multiplied by the average account value over the period, multiplied by 181 days in the period, divided by 365 days in the year.
27
GMO Strategic Opportunities Allocation Fund
(A Series of GMO Trust)
Tax Information for the Tax Year Ended February 28, 2009 (Unaudited)
The Fund will notify shareholders of amounts for use in preparing 2009 income tax forms in early 2010.
The Fund's distributions to shareholders include $55,456,276 from long-term capital gains.
For taxable, non-corporate shareholders, 18.85% of the income and short-term capital gains, if any, distributed in the Fund's fiscal year ended February 28, 2009 represents qualified dividend income subject to the 15% rate category.
For corporate shareholders, 7.77% of the income and short-term capital gains, if any, distributed in the Fund's fiscal year ended February 28, 2009 qualified for the dividends-received deduction.
The Fund hereby designates as qualified interest income with respect to its taxable year ended February 28, 2009, $9,335,780 or if determined to be different, the qualified interest income of such year.
28
Trustees and Officers (Unaudited)
The following tables list the Trust's Trustees and Officers as of the date of this report; their address and date of birth ("DOB"); their position with the Trust; the length of time holding that position with the Trust; their principal occupation(s) during the past five years; the number of portfolios in the fund complex they oversee; and other directorships they hold in companies subject to registration or reporting requirements of the Securities Exchange Act of 1934 (generally called "public companies") or in registered investment companies. The Trust's Statement of Additional Information ("SAI") includes additional information about the Trust's trustees, including changes subsequent to the date of the report. The SAI is available, without charge, upon request by writing GMO, c/o GMO Trust, 40 Rowes Wharf, Boston, MA 02110.
Independent Trustees:
| Name, Address, and DOB | Position(s) Held with Trust | Term of Office1 and Length of Time Served | Principal Occupation(s) During Past Five Years | Number of Portfolios in Fund Complex Overseen by Trustee | Other Directorships Held by Trustee | ||||||||||||||||||
| Donald W. Glazer, Esq. c/o GMO Trust 40 Rowes Wharf Boston, MA 02110 DOB: 07/26/1944 | Chairman of the Board of Trustees | Chairman of the Board of Trustees since March 2005; Lead Independent Trustee (September 2004 – March 2005); Trustee since December 2000. | Consultant – Law and Business2; Author of Legal Treatises. | 59 | None. | ||||||||||||||||||
1 Each Trustee is elected to serve during the continued lifetime of the Trust until he/she dies, resigns or is removed, or if sooner, until the next meeting of Shareholders called for the purpose of electing Trustees and until the election and qualification of his/her successor.
2 As part of Mr. Glazer's work as a consultant, he provides part-time consulting services to Goodwin Procter LLP ("Goodwin"). Goodwin has provided legal services to Renewable Resources, LLC, an affiliate of GMO; GMO, in connection with its relationship with Renewable Resources; and funds managed by Renewable Resources. Mr. Glazer has represented that he has no financial interest in, and is not involved in the provision of, such legal services. In the calendar years ended December 31, 2007 and December 31, 2008, these entities paid $789,416 and $183,864 respectively, in legal fees and disbursements to Goodwin. In correspondence with the Staff of the Securities and Exchange Commission beginning in August 2006, the Independent Trustees' legal counsel provided the Staff with information regarding Mr. Glazer's relationship with Goodwin and h is other business activities. On September 11, 2007, based on information that had been given to the Staff as of that date, the Staff provided oral no-action assurance consistent with the opinion of the Independent Trustees' legal counsel that Mr. Glazer is not an "interested person" of the Trust.
29
Independent Trustees — (Continued)
| Name, Address, and DOB | Position(s) Held with Trust | Term of Office1 and Length of Time Served | Principal Occupation(s) During Past Five Years | Number of Portfolios in Fund Complex Overseen by Trustee | Other Directorships Held by Trustee | ||||||||||||||||||
| W. Nicholas Thorndike c/o GMO Trust 40 Rowes Wharf Boston, MA 02110 DOB: 03/28/1933 | Trustee | Since March 2005. | Director or trustee of various corporations and charitable organizations, including Courier Corporation (a book publisher and manufacturer) (July 1989 – present); Putnam Funds (December 1992 – June 2004); and Providence Journal (a newspaper publisher) (December 1986 – December 2003). | 59 | Director of Courier Corporation (a book publisher and manufacturer); Member of the Investment Committee of Partners HealthCare System, Inc.3 | ||||||||||||||||||
| Peter Tufano c/o GMO Trust 40 Rowes Wharf Boston, MA 02110 DOB: 04/22/1957 | Trustee | Since December 2008. | Sylvan C. Coleman Professor of Financial Management, Harvard Business School (since 1989). | 59 | Trustee of State Street Navigator Securities Lending Trust (3 Portfolios). | ||||||||||||||||||
1 Each Trustee is elected to serve during the continued lifetime of the Trust until he/she dies, resigns or is removed, or if sooner, until the next meeting of Shareholders called for the purpose of electing Trustees and until the election and qualification of his/her successor.
3 Partners HealthCare System, Inc. is a client of the Manager.
30
Principal Officers:
| Name, Address, and DOB | Position(s) Held with Trust | Term of Office4 and Length of Time Served | Principal Occupation(s) During Past Five Years5 | ||||||||||||
| J.B. Kittredge DOB: 08/22/1954 | President and Chief Executive Officer | Since March 2009. | General Counsel, Grantham, Mayo, Van Otterloo & Co. LLC (October 2005 – Present); Partner, Ropes & Gray LLP. | ||||||||||||
| Sheppard N. Burnett c/o GMO Trust 40 Rowes Wharf Boston, MA 02110 DOB: 10/24/1968 | Treasurer and Chief Financial Officer | Chief Financial Officer since March 2007; Treasurer since November 2006; Assistant Treasurer, September 2004 – November 2006. | Fund Administration Staff, Grantham, Mayo, Van Otterloo & Co. LLC (June 2004 – present); Vice President, Director of Tax, Columbia Management Group (2002 – 2004). | ||||||||||||
| Brent C. Arvidson c/o GMO Trust 40 Rowes Wharf Boston, MA 02110 DOB: 06/26/1969 | Assistant Treasurer | Since August 1998. | Senior Fund Administrator, Grantham, Mayo, Van Otterloo & Co. LLC. | ||||||||||||
| John L. Nasrah c/o GMO Trust 40 Rowes Wharf Boston, MA 02110 DOB: 05/27/1977 | Assistant Treasurer | Since March 2007. | Fund Administrator, Grantham, Mayo, Van Otterloo & Co. LLC (September 2004 – present); Tax Analyst, Bain & Company, Inc. (June 2003 – September 2004). | ||||||||||||
| Mahmoodur Rahman c/o GMO Trust 40 Rowes Wharf Boston, MA 02110 DOB: 11/30/1967 | Assistant Treasurer | Since September 2007. | Fund Administrator, Grantham, Mayo, Van Otterloo & Co. LLC (April 2007 – present); Vice President and Senior Tax Manager, Massachusetts Financial Services Company (January 2000 – April 2007). | ||||||||||||
| Michael E. Gillespie c/o GMO Trust 40 Rowes Wharf Boston, MA 02110 DOB: 02/18/1958 | Chief Compliance Officer | Since March 2005. | Vice President of Compliance (June 2004 – February 2005) and Director of Domestic Compliance (March 2002 – June 2004), Fidelity Investments. | ||||||||||||
4 Each officer is elected to hold such office until his or her successor is duly elected and qualified to carry out the duties and responsibilities of the office, or until he or she resigns or is removed from office.
5 Each of Messrs. Burnett, Arvidson, Bohan, and Pottle serves as an officer and/or director of certain pooled investment vehicles of which GMO or an affiliate of GMO serves as the investment adviser.
31
Principal Officers — (Continued)
| Name, Address, and DOB | Position(s) Held with Trust | Term of Office4 and Length of Time Served | Principal Occupation(s) During Past Five Years5 | ||||||||||||
| Jason B. Harrison c/o GMO Trust 40 Rowes Wharf Boston, MA 02110 DOB: 01/29/1977 | Vice President and Clerk | Vice President since November 2006; Clerk since March 2006. | Legal Counsel, Grantham, Mayo, Van Otterloo & Co. LLC (since February 2006) and Attorney, Ropes & Gray LLP (September 2002 – February 2006). | ||||||||||||
| David L. Bohan c/o GMO Trust 40 Rowes Wharf Boston, MA 02110 DOB: 06/21/1964 | Vice President and Assistant Clerk | Vice President since March 2005; Assistant Clerk since March 2006. | Legal Counsel, Grantham, Mayo, Van Otterloo & Co. LLC. | ||||||||||||
| Gregory L. Pottle c/o GMO Trust 40 Rowes Wharf Boston, MA 02110 DOB: 07/09/1971 | Vice President and Assistant Clerk | Since November 2006. | Legal Counsel, Grantham, Mayo, Van Otterloo & Co. LLC. | ||||||||||||
| Anne K. Trinque c/o GMO Trust 40 Rowes Wharf Boston, MA 02110 DOB: 04/15/1978 | Vice President and Assistant Clerk | Since September 2007. | Legal Counsel, Grantham, Mayo, Van Otterloo & Co. LLC (January 2007 – present); Attorney, Goodwin Procter LLP (September 2003 – January 2007). | ||||||||||||
| Cheryl Wakeham c/o GMO Trust 40 Rowes Wharf Boston, MA 02110 DOB: 10/29/1958 | Vice President and Anti-Money Laundering Officer | Since December 2004. | Manager, Client Service Administration, Grantham, Mayo, Van Otterloo & Co. LLC. | ||||||||||||
4 Each officer is elected to hold such office until his or her successor is duly elected and qualified to carry out the duties and responsibilities of the office, or until he or she resigns or is removed from office.
5 Each of Messrs. Burnett, Arvidson, Bohan, and Pottle serves as an officer and/or director of certain pooled investment vehicles of which GMO or an affiliate of GMO serves as the investment adviser.
32
GMO Emerging Country Debt Fund
(A Series of GMO Trust)
Annual Report
February 28, 2009
For a free copy of the Fund's proxy voting guidelines, shareholders may call 1-617-346-7646 (collect) or visit the Securities and Exchange Commission's website at www.sec.gov. Information regarding how the Fund voted proxies relating to portfolio securities during the most recent 12-month period ended June 30 is available on GMO's website at www.gmo.com, or on the Securities and Exchange Commission's website at www.sec.gov.
The Fund files its complete schedule of portfolio holdings with the Securities and Exchange Commission for the first and third quarter of each fiscal year on Form N-Q, which is available on the Commission's website at www.sec.gov. The Fund's Form N-Q may be reviewed and copied at the Commission's Public Reference Room in Washington, D.C. Information on the operation of the Public Reference Room may be obtained by calling 1-800-SEC-0330. The Fund has a policy with respect to disclosure of portfolio holdings under which it may also make available on GMO's website at www.gmo.com a complete schedule of portfolio holdings.
This report is prepared for the general information of shareholders. It is authorized for distribution to prospective investors only when preceded or accompanied by a prospectus for the GMO Trust, which contains a complete discussion of the risks associated with an investment in this Fund and other important information. The GMO Trust prospectus can be obtained at www.gmo.com.
GMO Emerging Country Debt Fund
(A Series of GMO Trust)
Portfolio Management
Day-to-day management of the Fund's portfolio is the responsibility of the Fixed Income Division at Grantham, Mayo, Van Otterloo & Co. LLC.
Management Discussion and Analysis of Fund Performance
The Class III shares of the GMO Emerging Country Debt Fund returned -32.8% for the fiscal year ended February 28, 2009, compared with -11.8% for the JPMorgan Emerging Markets Bond Index Global (EMBIG).
The Fund underperformed the benchmark during the fiscal year by 21.0%. EMBIG spreads over U.S. Treasuries widened 366 basis points to 672 basis points, while the yield on the 10-year U.S. Treasury bond fell by 51 basis points to 3.0%.
The biggest gainers of the fiscal year in the index were Lebanon (+11.0%), Egypt (+6.8%), and China (+5.5%). The worst performing countries in the index for the year were Ecuador (-66.4%), Ukraine (-59.1%), and Argentina (-55.8%).
Market selection subtracted 401 basis points of relative value. Underperformance derived primarily from the Argentina and Ukraine overweights, and the Lebanon underweight which were offset in part by overweighting Russia and underweighting Ecuador. Security selection cost 1,269 basis points of alpha in total, with the largest loss coming from the sale of credit protection for Venezuela. Exposure to quasi-sovereign credits in Russia and negative bond selection in South Africa also had negative impacts. Further, non-index bonds from the Republic of Congo and Ivory Coast underperformed the EMBIG by a wide margin. Direct and indirect exposure to ABS securities also contributed negatively, costing 422 basis points of relative performance. Credit default swap protection helped in Mexico and Ukraine, offsetting a portion of the other Mexican and Ukraine positions' losses.
The views expressed herein are exclusively those of Grantham, Mayo, Van Otterloo & Co. LLC Management as of the date of this report and are subject to change. GMO disclaims any responsibility to update such views. They are not meant as investment advice.

Performance data quoted represents past performance and is not indicative of future results. The investment return and principal value of an investment will fluctuate so that an investor's shares, when redeemed, may be worth more or less than their original cost. Current performance data may be lower or higher than the performance data provided herein. To obtain performance information to the most recent month-end, visit www.gmo.com. Performance shown is net of all fees after reimbursement from the Manager. Each performance figure assumes a purchase at the beginning and redemption at the end of the stated period and reflects a transaction fee of .50% on the purchase and 2.00% on the redemption. Transaction fees are retained by the Fund to cover trading costs. Returns would have been lower had certain expenses not been reimbursed during the periods shown and do not include the effect of taxes on distributions and redemptions. All information is unaudited. Performance for Class IV shares will vary due to different fees.
* JPMorgan EMBIG + represents the JPMorgan EMBI+ prior to 12/31/99 and the JPMorgan EMBIG thereafter. The Manager changed the benchmark due to the belief that the EMBIG is more diversified and representative of the universe of emerging country debt.
GMO Emerging Country Debt Fund
(A Series of GMO Trust)
Investments Concentration Summary
February 28, 2009 (Unaudited)
| Asset Class Summary* | % of Total Net Assets | ||||||
| Debt Obligations | 89.5 | % | |||||
| Loan Participations | 6.0 | ||||||
| Short-Term Investments | 2.1 | ||||||
| Forward Currency Contracts | 1.8 | ||||||
| Loan Assignments | 1.7 | ||||||
| Options Purchased | 0.4 | ||||||
| Rights and Warrants | 0.3 | ||||||
| Promissory Notes | 0.2 | ||||||
| Futures | (0.0 | ) | |||||
| Written Options | (0.1 | ) | |||||
| Reverse Repurchase Agreements | (0.1 | ) | |||||
| Swap Market Values, see Schedule of Investments for Notional Values | (6.1 | ) | |||||
| Other | 4.3 | ||||||
| 100.0 | % | ||||||
* The table above incorporates aggregate indirect asset class exposure associated with investments in other funds of GMO Trust ("underlying funds").
1
GMO Emerging Country Debt Fund
(A Series of GMO Trust)
Investments Concentration Summary — (Continued)
February 28, 2009 (Unaudited)
| Country / Region Summary** | % of Investments | ||||||
| United States | 13.8 | % | |||||
| Philippines | 10.2 | ||||||
| Russia | 9.6 | ||||||
| Venezuela | 8.6 | ||||||
| Brazil | 5.6 | ||||||
| Argentina | 5.3 | ||||||
| Colombia | 4.6 | ||||||
| Uruguay | 4.3 | ||||||
| Mexico | 3.7 | ||||||
| Ivory Coast | 3.2 | ||||||
| Vietnam | 2.6 | ||||||
| Peru | 2.5 | ||||||
| Indonesia | 2.4 | ||||||
| Dominican Republic | 2.4 | ||||||
| Ukraine | 2.4 | ||||||
| Turkey | 1.8 | ||||||
| Egypt | 1.5 | ||||||
| Kazakhstan | 1.4 | ||||||
| Congo | 1.4 | ||||||
| El Salvador | 1.2 | ||||||
| Iraq | 1.2 | ||||||
| Serbia | 1.0 | ||||||
| Aruba | 1.0 | ||||||
| Africa | 0.8 | ||||||
| Israel | 0.8 | ||||||
| Jamaica | 0.8 | ||||||
| Sri Lanka | 0.8 | ||||||
| Chile | 0.5 | ||||||
| Bosnia | 0.5 | ||||||
| Pakistan | 0.5 | ||||||
| Ecuador | 0.5 | ||||||
| Tunisia | 0.5 | ||||||
| Gabon | 0.4 | ||||||
| South Africa | 0.4 | ||||||
| India | 0.4 | ||||||
| Georgia | 0.3 | ||||||
| Costa Rica | 0.3 | ||||||
| South Korea | 0.3 | ||||||
| Malaysia | 0.3 | ||||||
| Nicaragua | 0.2 | ||||||
| Poland | 0.1 | ||||||
| Belize | 0.1 | ||||||
| Lebanon | (0.2 | ) | |||||
| 100.0 | % | ||||||
** The table above incorporates aggregate indirect country exposure associated with investments in the underlying funds. The table excludes short-term investments. The table includes exposure through the use of derivative contracts. The table
2
GMO Emerging Country Debt Fund
(A Series of GMO Trust)
Investments Concentration Summary — (Continued)
February 28, 2009 (Unaudited)
is based on duration-adjusted exposures, taking into account the market value of securities and the notional amounts of swaps and other derivative contracts. Duration is based on the Manager's models. The greater the duration of a bond, the greater its contribution to the concentration percentage. Credit default swap exposures (both positive and negative) are factored into the duration-adjusted exposure using the reference security and applying the same methodology to that security.
3
GMO Emerging Country Debt Fund
(A Series of GMO Trust)
Schedule of Investments
(showing percentage of total net assets)
February 28, 2009
| Par Value | Description | Value ($) | |||||||||||||
| DEBT OBLIGATIONS — 84.6% | |||||||||||||||
| Argentina — 6.8% | |||||||||||||||
| Foreign Government Obligations — 5.2% | |||||||||||||||
| USD | 9,000,000 | Province of Buenos Aires, Reg S, Step Up, 3.00%, due 05/15/35 | 1,530,000 | ||||||||||||
| USD | 10,000,000 | Republic of Argentina, 8.88%, due 03/01/29 (a) (b) | 1,121,566 | ||||||||||||
| USD | 7,211,000 | Republic of Argentina, Series BGLO, 8.38%, due 12/20/03 (b) | 865,320 | ||||||||||||
| USD | 46,000,000 | Republic of Argentina, Series F, due 10/15/04 (b) | 5,060,000 | ||||||||||||
| EUR | 284,000,000 | Republic of Argentina Par Bond, Step Up, 1.20%, due 12/31/38 | 59,406,769 | ||||||||||||
| EUR | 7,367,096 | Republic of Argentina Discount Bond, 7.82%, due 12/31/33 | 2,036,041 | ||||||||||||
| USD | 21,000,000 | Republic of Argentina Par Bond, Step Up, 1.33%, due 12/31/38 | 2,940,000 | ||||||||||||
| USD | 23,391,698 | Republic of Argentina Discount Bond, 8.28%, due 12/31/33 (a) | 5,824,128 | ||||||||||||
| USD | 2,587,924 | Republic of Argentina Capitalization Bond, Series 2031, 12.00%, due 06/19/31 (a) (b) | 237,308 | ||||||||||||
| DEM | 3,830,000 | Republic of Argentina Discount Bond, Series DM, 6 mo. DEM LIBOR + .81%, 4.71%, due 03/31/23 (b) | 1,117,156 | ||||||||||||
| EUR | 214,800,000 | Republic of Argentina GDP Linked, 1.99%, due 12/15/35 (d) | 5,446,254 | ||||||||||||
| USD | 71,474 | Republic of Argentina GDP Linked, 2.28%, due 12/15/35 (d) | 1,573 | ||||||||||||
| ARS | 28,000,000 | Republic of Argentina GDP Linked, 2.45%, due 12/15/35 (a) (d) | 226,821 | ||||||||||||
| USD | 24,819,166 | Republic of Argentina Global Bond, Series 2018, 12.25%, due 06/19/18 (a) (b) | 2,892,432 | ||||||||||||
| EUR | 3,500,000 | Republic of Argentina Global Bond, Series FEB, Step Down, 8.00%, due 02/26/08 (b) | 454,805 | ||||||||||||
| DEM | 5,000,000 | Republic of Argentina Global Bond, Step Down, 9.00%, due 11/19/08 (a) (b) | 259,276 | ||||||||||||
| ARS | 28,000,000 | Republic of Argentina Global Par Bond, Step Up, 0.63%, due 12/31/38 (a) | 693,438 | ||||||||||||
| USD | 31,390,000 | Republic of Argentina Global Bond, EMTN, Reg S, 3 mo. LIBOR + .58%, 1.99%, due 04/06/49 (b) | 3,452,900 | ||||||||||||
| USD | 1,815,200 | Republic of Argentina Pro 4, 2.00%, due 12/28/10 (b) | 108,912 | ||||||||||||
| 93,674,699 | |||||||||||||||
| Judgements — 1.6% | |||||||||||||||
| USD | 3,540,000 | Republic of Argentina, 8.88%, due 03/01/29 (a) (b) (c) | 397,034 | ||||||||||||
| USD | 43,132,075 | Republic of Argentina Capitalization Bond, Series 2031, 12.00%, due 06/19/31 (a) (b) (c) | 3,955,130 | ||||||||||||
See accompanying notes to the financial statements.
4
GMO Emerging Country Debt Fund
(A Series of GMO Trust)
Schedule of Investments — (Continued)
(showing percentage of total net assets)
February 28, 2009
| Par Value | Description | Value ($) | |||||||||||||
| Judgements — continued | |||||||||||||||
| USD | 32,000,000 | Republic of Argentina Discount Bond, Series L-GL, 6 mo. LIBOR + .81%, 3.40%, due 03/31/23 (b) (c) | 14,400,000 | ||||||||||||
| USD | 3,235,359 | Republic of Argentina Global Bond, Series 2018, 12.25%, due 06/19/18 (a) (b) (c) | 377,050 | ||||||||||||
| USD | 26,545,000 | Republic of Argentina Global Bond, 12.13%, due 02/25/19 (a) (b) (c) | 2,389,050 | ||||||||||||
| USD | 6,931,000 | Republic of Argentina Global Bond, 12.00%, due 02/01/20 (a) (b) (c) | 623,790 | ||||||||||||
| USD | 8,000,000 | Republic of Argentina Global Bond, 9.75%, due 09/19/27 (a) (b) (c) | 720,000 | ||||||||||||
| USD | 198,230 | Republic of Argentina Global Bond, Series 2008, Step Up, 15.50%, due 12/19/49 (a) (b) (c) | 17,841 | ||||||||||||
| USD | 15,000,000 | Republic of Argentina Global Par Bond, Series L-GP, Step Up, 6.00%, due 03/31/23 (b) (c) | 6,750,000 | ||||||||||||
| 29,629,895 | |||||||||||||||
| Total Argentina | 123,304,594 | ||||||||||||||
| Aruba — 1.3% | |||||||||||||||
| Foreign Government Obligations | |||||||||||||||
| USD | 5,000,000 | Government of Aruba, 6.19%, due 10/30/12 (a) | 4,586,100 | ||||||||||||
| USD | 17,500,000 | Government of Aruba, Reg S, 6.40%, due 09/06/15 | 16,205,350 | ||||||||||||
| USD | 3,752,000 | Government of Aruba, 6.80%, due 04/02/14 (a) | 3,398,172 | ||||||||||||
| Total Aruba | 24,189,622 | ||||||||||||||
| Belize — 0.1% | |||||||||||||||
| Foreign Government Obligations | |||||||||||||||
| USD | 4,023,400 | Government of Belize, Reg S, Step Up, 4.25%, due 02/20/29 | 1,528,892 | ||||||||||||
| Bosnia & Herzegovina — 0.4% | |||||||||||||||
| Foreign Government Obligations | |||||||||||||||
| DEM | 22,214,720 | Bosnia & Herzegovina, Series A, 6 mo. DEM LIBOR + .81%, 3.03%, due 12/11/17 | 6,767,702 | ||||||||||||
| Brazil — 3.5% | |||||||||||||||
| Corporate Debt — 0.4% | |||||||||||||||
| USD | 7,000,000 | Petrobras International Finance Co., 7.88%, due 03/15/19 | 7,026,250 | ||||||||||||
See accompanying notes to the financial statements.
5
GMO Emerging Country Debt Fund
(A Series of GMO Trust)
Schedule of Investments — (Continued)
(showing percentage of total net assets)
February 28, 2009
| Par Value | Description | Value ($) | |||||||||||||
| Foreign Government Obligations — 3.1% | |||||||||||||||
| USD | 12,000,000 | Brazilian Government International Bond, 5.88%, due 01/15/19 | 11,400,000 | ||||||||||||
| USD | 329,548 | Brazilian Government International Exit Bonds, 6.00%, due 09/15/13 | 329,548 | ||||||||||||
| USD | 8,416,667 | Brazilian Government International Exit Bonds, 6.00%, due 09/15/13 | 8,248,333 | ||||||||||||
| USD | 12,500,000 | Republic of Brazil, 8.00%, due 01/15/18 | 13,475,000 | ||||||||||||
| USD | 22,000,000 | Republic of Brazil, 8.25%, due 01/20/34 | 23,870,000 | ||||||||||||
| 57,322,881 | |||||||||||||||
| Total Brazil | 64,349,131 | ||||||||||||||
| Colombia — 0.7% | |||||||||||||||
| Foreign Government Obligations | |||||||||||||||
| USD | 8,000,000 | Republic of Colombia, 8.70%, due 02/15/16 | 8,560,000 | ||||||||||||
| USD | 3,800,000 | Republic of Colombia, 11.85%, due 03/09/28 | 4,959,000 | ||||||||||||
| Total Colombia | 13,519,000 | ||||||||||||||
| Congo Republic (Brazzaville) — 1.4% | |||||||||||||||
| Foreign Government Obligations | |||||||||||||||
| USD | 109,865,600 | Republic of Congo, 144A, 3.00%, due 06/30/29 | 25,818,416 | ||||||||||||
| USD | 1,425,000 | Republic of Congo, Reg S, 3.00%, due 06/30/29 | 334,875 | ||||||||||||
| Total Congo Republic (Brazzaville) | 26,153,291 | ||||||||||||||
| Costa Rica — 0.2% | |||||||||||||||
| Foreign Government Obligations | |||||||||||||||
| USD | 3,710,000 | Republic of Costa Rica, Reg S, 10.00%, due 08/01/20 | 4,285,050 | ||||||||||||
| Dominican Republic — 2.4% | |||||||||||||||
| Asset-Backed Securities — 0.4% | |||||||||||||||
| USD | 15,250,310 | Autopistas Del Nordeste Ltd., Reg S, 9.39%, due 01/15/24 | 7,320,149 | ||||||||||||
| Foreign Government Obligations — 2.0% | |||||||||||||||
| USD | 9,000,000 | Dominican Republic, Reg S, 8.63%, due 04/20/27 | 5,670,000 | ||||||||||||
| USD | 196,439 | Dominican Republic Bond, Series RG, 6 mo. LIBOR + .81%, 2.63%, due 08/31/09 | 194,965 | ||||||||||||
See accompanying notes to the financial statements.
6
GMO Emerging Country Debt Fund
(A Series of GMO Trust)
Schedule of Investments — (Continued)
(showing percentage of total net assets)
February 28, 2009
| Par Value | Description | Value ($) | |||||||||||||
| Foreign Government Obligations — continued | |||||||||||||||
| USD | 2,206,784 | Dominican Republic Bond, 6 mo. LIBOR + .81%, 2.59%, due 08/30/09 | 2,151,614 | ||||||||||||
| USD | 42,557,000 | Dominican Republic Discount Bond, 6 mo. LIBOR + .81%, 3.38%, due 08/30/24 | 28,513,190 | ||||||||||||
| 36,529,769 | |||||||||||||||
| Total Dominican Republic | 43,849,918 | ||||||||||||||
| Ecuador — 0.3% | |||||||||||||||
| Foreign Government Obligations | |||||||||||||||
| USD | 2,233,332 | Republic of Ecuador PDI (Global Bearer Capitalization Bond), PIK, 6 mo. LIBOR + .81%, 2.63%, due 02/27/15 (a) | 504,956 | ||||||||||||
| USD | 18,587,000 | Republic of Ecuador, Step Up, 10.00%, due 08/15/30 (b) | 5,576,100 | ||||||||||||
| Total Ecuador | 6,081,056 | ||||||||||||||
| Egypt — 0.1% | |||||||||||||||
| Corporate Debt | |||||||||||||||
| USD | 1,360,363 | Petroleum Export, 144A, 5.27%, due 06/15/11 | 1,169,912 | ||||||||||||
| El Salvador — 1.2% | |||||||||||||||
| Foreign Government Obligations | |||||||||||||||
| USD | 29,700,000 | Republic of El Salvador, Reg S, 7.65%, due 06/15/35 | 21,087,000 | ||||||||||||
| Gabon — 0.3% | |||||||||||||||
| Foreign Government Obligations | |||||||||||||||
| USD | 9,000,000 | Gabonese Republic, Reg S, 8.20%, due 12/12/17 | 5,850,000 | ||||||||||||
| Grenada — 0.1% | |||||||||||||||
| Foreign Government Obligations | |||||||||||||||
| USD | 6,000,000 | Republic of Grenada, Reg S, Step Up, 2.50%, due 09/15/25 | 2,100,000 | ||||||||||||
| Indonesia — 0.9% | |||||||||||||||
| Foreign Government Agency | |||||||||||||||
| USD | 31,000,000 | Majapahit Holding BV, 144A, 7.88%, due 06/29/37 | 16,740,000 | ||||||||||||
See accompanying notes to the financial statements.
7
GMO Emerging Country Debt Fund
(A Series of GMO Trust)
Schedule of Investments — (Continued)
(showing percentage of total net assets)
February 28, 2009
| Par Value | Description | Value ($) | |||||||||||||
| Iraq — 0.4% | |||||||||||||||
| Foreign Government Obligations | |||||||||||||||
| USD | 16,000,000 | Republic of Iraq, Reg S, 5.80%, due 01/15/28 | 7,040,000 | ||||||||||||
| Israel — 0.7% | |||||||||||||||
| Foreign Government Agency | |||||||||||||||
| USD | 13,000,000 | Israel Electric Corp. Ltd., 144A, 7.25%, due 01/15/19 (a) | 13,000,528 | ||||||||||||
| Ivory Coast — 1.4% | |||||||||||||||
| Foreign Government Obligations | |||||||||||||||
| FRF | 37,500,000 | Ivory Coast Discount Bond, Series FRF, Step Up, 4.00%, due 03/31/28 (b) | 2,427,920 | ||||||||||||
| USD | 69,850,000 | Ivory Coast FLIRB, Step Up, 4.00%, due 03/31/18 (b) | 9,779,000 | ||||||||||||
| FRF | 85,905,000 | Ivory Coast FLIRB, Series FRF, Step Up, 4.00%, due 03/31/18 (b) | 5,644,892 | ||||||||||||
| FRF | 256,889,500 | Ivory Coast PDI, Series FRF, Step Up, 2.90%, due 03/30/18 (b) | 6,950,765 | ||||||||||||
| Total Ivory Coast | 24,802,577 | ||||||||||||||
| Jamaica — 0.3% | |||||||||||||||
| Foreign Government Agency — 0.2% | |||||||||||||||
| USD | 6,500,000 | Air Jamaica Ltd., Reg S, 9.38%, due 07/08/15 | 4,615,000 | ||||||||||||
| Foreign Government Obligations — 0.1% | |||||||||||||||
| USD | 2,500,000 | Government of Jamaica, 8.00%, due 03/15/39 | 1,375,000 | ||||||||||||
| Total Jamaica | 5,990,000 | ||||||||||||||
| Malaysia — 1.3% | |||||||||||||||
| Asset Backed Securities | |||||||||||||||
| MYR | 45,000,000 | Transshipment Megahub Berhad, Series C, 5.45%, due 11/03/09 | 11,688,469 | ||||||||||||
| MYR | 50,000,000 | Transshipment Megahub Berhad, Series F, 6.70%, due 11/02/12 | 11,712,745 | ||||||||||||
| Total Malaysia | 23,401,214 | ||||||||||||||
| Mexico — 6.0% | |||||||||||||||
| Foreign Government Agency — 3.6% | |||||||||||||||
| GBP | 7,689,000 | Pemex Project Funding Master Trust, EMTN, 7.50%, due 12/18/13 | 10,732,385 | ||||||||||||
| EUR | 30,000,000 | Pemex Project Funding Master Trust, Reg S, 6.38%, due 08/05/16 | 33,468,603 | ||||||||||||
| EUR | 26,500,000 | Pemex Project Funding Master Trust, Reg S, 5.50%, due 02/24/25 | 21,836,995 | ||||||||||||
| 66,037,983 | |||||||||||||||
See accompanying notes to the financial statements.
8
GMO Emerging Country Debt Fund
(A Series of GMO Trust)
Schedule of Investments — (Continued)
(showing percentage of total net assets)
February 28, 2009
| Par Value | Description | Value ($) | |||||||||||||
| Foreign Government Obligations — 2.4% | |||||||||||||||
| GBP | 29,994,000 | United Mexican States, GMTN, 6.75%, due 02/06/24 | 37,571,991 | ||||||||||||
| USD | 8,000,000 | United Mexican States, 6.05%, due 01/11/40 | 6,600,000 | ||||||||||||
| 44,171,991 | |||||||||||||||
| Total Mexico | 110,209,974 | ||||||||||||||
| Nicaragua — 0.2% | |||||||||||||||
| Foreign Government Obligations | |||||||||||||||
| USD | 4,926,395 | Republic of Nicaragua BPI, Series E, 5.00%, due 02/01/11 | 4,359,860 | ||||||||||||
| Pakistan — 0.4% | |||||||||||||||
| Foreign Government Obligations | |||||||||||||||
| USD | 20,000,000 | Islamic Republic of Pakistan, Reg S, 7.88%, due 03/31/36 | 8,000,000 | ||||||||||||
| Peru — 1.6% | |||||||||||||||
| Foreign Government Obligations | |||||||||||||||
| USD | 12,452,000 | Peru Enhanced Pass-Through Finance Ltd., Reg S, 0.00%, due 06/02/25 | 3,113,000 | ||||||||||||
| USD | 25,000,000 | Peru Par Bond, Series 30 Yr., Step Up, 3.00%, due 03/07/27 | 20,000,000 | ||||||||||||
| USD | 4,625,077 | Peru Trust, Series 97-I-P, Class A3, due 12/31/15 (a) | 3,976,901 | ||||||||||||
| USD | 1,640,372 | Peru Trust II, Series 98-A LB, 0.00%, due 02/28/16 | 1,193,617 | ||||||||||||
| USD | 1,539,783 | Racers, Series 1998 I-P, due 03/10/16 (a) | 1,323,992 | ||||||||||||
| Total Peru | 29,607,510 | ||||||||||||||
| Philippines — 7.0% | |||||||||||||||
| Foreign Government Agency — 2.3% | |||||||||||||||
| USD | 6,000,000 | National Power Corp., 9.88%, due 03/16/10 | 5,936,250 | ||||||||||||
| USD | 31,600,000 | National Power Corp., 9.63%, due 05/15/28 | 27,492,000 | ||||||||||||
| USD | 8,500,000 | National Power Corp., Global Bond, 8.40%, due 12/15/16 | 8,160,000 | ||||||||||||
| 41,588,250 | |||||||||||||||
| Foreign Government Obligations — 4.7% | |||||||||||||||
| USD | 59,501,000 | Central Bank of Philippines, Series A, 8.60%, due 06/15/27 | 58,519,234 | ||||||||||||
| USD | 9,000,000 | Philippine Government International Bond, 8.38%, due 06/17/19 | 9,551,250 | ||||||||||||
| USD | 6,843,000 | Republic of Philippines, 8.38%, due 02/15/11 | 7,348,013 | ||||||||||||
See accompanying notes to the financial statements.
9
GMO Emerging Country Debt Fund
(A Series of GMO Trust)
Schedule of Investments — (Continued)
(showing percentage of total net assets)
February 28, 2009
| Par Value | Description | Value ($) | |||||||||||||
| Foreign Government Obligations — continued | |||||||||||||||
| EUR | 8,000,000 | Republic of Philippines, 9.13%, due 02/22/10 | 10,269,790 | ||||||||||||
| 85,688,287 | |||||||||||||||
| Total Philippines | 127,276,537 | ||||||||||||||
| Poland — 0.6% | |||||||||||||||
| Foreign Government Obligations | |||||||||||||||
| USD | 10,000,000 | Delphes Co. No. 2 Ltd., EMTN, Reg S, 7.75%, due 05/05/09 | 10,106,470 | ||||||||||||
| Russia — 8.8% | |||||||||||||||
| Corporate Debt — 7.6% | |||||||||||||||
| EUR | 38,000,000 | Gaz Capital (Gazprom), EMTN, Reg S, 5.88%, due 06/01/15 | 31,855,390 | ||||||||||||
| EUR | 21,000,000 | Gaz Capital (Gazprom), Reg S, 5.44%, due 11/02/17 | 14,709,071 | ||||||||||||
| EUR | 40,000,000 | Gaz Capital (Gazprom), EMTN, 5.36%, due 10/31/14 | 33,722,152 | ||||||||||||
| USD | 12,767,949 | Gazprom International SA, Reg S, 7.20%, due 02/01/20 | 10,373,958 | ||||||||||||
| USD | 21,977,973 | Gazstream SA, Reg S, 5.63%, due 07/22/13 | 19,340,617 | ||||||||||||
| USD | 8,000,000 | Sberbank Capital SA, EMTN, 6.48%, due 05/15/13 | 6,517,600 | ||||||||||||
| USD | 14,900,000 | Transcapital Ltd. (Transneft), 144A, 8.70%, due 08/07/18 | 11,249,500 | ||||||||||||
| USD | 19,000,000 | VTB Capital SA, Reg S, 6.25%, due 06/30/35 | 11,210,000 | ||||||||||||
| 138,978,288 | |||||||||||||||
| Foreign Government Agency — 1.2% | |||||||||||||||
| USD | 36,500,000 | RSHB Capital SA, 144A, 6.30%, due 05/15/17 | 20,907,200 | ||||||||||||
| USD | 2,300,000 | RSHB Capital SA, 144A, 7.75%, due 05/29/18 | 1,368,500 | ||||||||||||
| 22,275,700 | |||||||||||||||
| Total Russia | 161,253,988 | ||||||||||||||
| Serbia — 0.6% | |||||||||||||||
| Foreign Government Obligations | |||||||||||||||
| USD | 14,966,026 | Republic of Serbia, Reg S, Step Up, 3.75%, due 11/01/24 | 10,326,558 | ||||||||||||
| South Africa — 0.2% | |||||||||||||||
| Foreign Government Agency — 0.1% | |||||||||||||||
| ZAR | 163,000,000 | Eskom Holdings Ltd., 0.00%, due 12/31/32 | 1,438,852 | ||||||||||||
See accompanying notes to the financial statements.
10
GMO Emerging Country Debt Fund
(A Series of GMO Trust)
Schedule of Investments — (Continued)
(showing percentage of total net assets)
February 28, 2009
| Par Value | Description | Value ($) | |||||||||||||
| Foreign Government Obligations — 0.1% | |||||||||||||||
| USD | 2,000,000 | Republic of South Africa, 5.88%, due 05/30/22 | 1,760,000 | ||||||||||||
| Total South Africa | 3,198,852 | ||||||||||||||
| South Korea — 0.2% | |||||||||||||||
| Foreign Government Agency | |||||||||||||||
| USD | 4,000,000 | Korea Southern Power Co., Reg S, 5.38%, due 04/18/13 | 3,618,120 | ||||||||||||
| Sri Lanka — 0.7% | |||||||||||||||
| Foreign Government Obligations | |||||||||||||||
| USD | 19,000,000 | Republic of Sri Lanka, 144A, 8.25%, due 10/24/12 | 12,920,000 | ||||||||||||
| Tunisia — 0.2% | |||||||||||||||
| Foreign Government Agency | |||||||||||||||
| JPY | 360,000,000 | Banque Centrale De Tunisie, Series 6BR, 4.35%, due 08/15/17 | 2,831,125 | ||||||||||||
| Turkey — 0.5% | |||||||||||||||
| Foreign Government Obligations | |||||||||||||||
| USD | 9,000,000 | Republic of Turkey, 7.50%, due 07/14/17 | 8,482,500 | ||||||||||||
| Ukraine — 4.4% | |||||||||||||||
| Foreign Government Agency — 0.5% | |||||||||||||||
| USD | 9,000,000 | Credit Suisse First Boston, the EXIM of Ukraine, 6.80%, due 10/04/12 | 3,600,000 | ||||||||||||
| USD | 10,000,000 | Dresdner Kleinwort Wasserstein for CJSC, the EXIM of Ukraine, 7.75%, due 09/23/09 | 6,000,000 | ||||||||||||
| 9,600,000 | |||||||||||||||
| Foreign Government Obligations — 3.9% | |||||||||||||||
| USD | 18,000,000 | City of Kyiv, Reg S, 8.25%, due 11/26/12 | 5,850,000 | ||||||||||||
| CHF | 100,000,000 | Ukraine Government, 3.50%, due 09/15/18 | 64,965,594 | ||||||||||||
| 70,815,594 | |||||||||||||||
| Total Ukraine | 80,415,594 | ||||||||||||||
See accompanying notes to the financial statements.
11
GMO Emerging Country Debt Fund
(A Series of GMO Trust)
Schedule of Investments — (Continued)
(showing percentage of total net assets)
February 28, 2009
| Par Value | Description | Value ($) | |||||||||||||
| United States — 19.4% | |||||||||||||||
| Asset-Backed Securities — 9.8% | |||||||||||||||
| USD | 4,000,000 | Aircraft Finance Trust, Series 99-1A, Class A1, 144A, 1 mo. LIBOR + .48%, 0.94%, due 05/15/24 | 1,000,000 | ||||||||||||
| USD | 24,779,727 | Capital One Auto Finance Trust, Series 07-C, Class A3B, FGIC, 1 mo. LIBOR + .51%, 0.97%, due 04/16/12 | 23,064,227 | ||||||||||||
| USD | 51,040,000 | Capital One Auto Finance Trust, Series 06-C, Class A4, FGIC, 1 mo. LIBOR + .03%, 0.49%, due 05/15/13 | 33,763,981 | ||||||||||||
| USD | 45,000,000 | Chase Issuance Trust, Series 06-A5, Class A, 1 mo. LIBOR + .02%, 0.48%, due 11/15/13 | 41,702,373 | ||||||||||||
| USD | 225,067 | Chevy Chase Mortgage Funding Corp., Series 03-4A, Class A1, 144A, AMBAC, 1 mo. LIBOR + .34%, 0.81%, due 10/25/34 | 108,032 | ||||||||||||
| USD | 1,070,431 | CHYPS CBO Ltd., Series 97-1A, Class A2A, 144A, 6.72%, due 01/15/10 (a) | 1,070 | ||||||||||||
| USD | 25,000,000 | Citibank Credit Card Issuance Trust, Series 06-A8, Class A8, 3mo. LIBOR + .04%, 1.13%, due 12/17/18 | 18,631,850 | ||||||||||||
| USD | 1,624,069 | CNL Commercial Mortgage Loan Trust, Series 03-2A, Class A1, 144A, AMBAC, 1 mo. LIBOR + .44%, 0.91%, due 10/25/30 | 324,814 | ||||||||||||
| USD | 25,630,214 | Countrywide Home Equity Loan Trust, Series 05-F, Class 2A, AMBAC, 1 mo. LIBOR + .24%, 0.70%, due 12/15/35 | 5,894,949 | ||||||||||||
| USD | 19,691,143 | Countrywide Home Equity Loan Trust, Series 05-H, Class 2A, FGIC, 1 mo. LIBOR + .24%, 0.70%, due 12/15/35 | 4,332,051 | ||||||||||||
| USD | 14,077,826 | Countrywide Home Equity Loan Trust, Series 06-D, Class 2A, XL, 1 mo. LIBOR + .20%, 0.66%, due 05/15/36 | 3,237,900 | ||||||||||||
| USD | 5,930,611 | First Franklin Mortgage Loan Asset Backed Certificates, Series 05-FF10, Class A6M, 1 mo. LIBOR + .35%, 0.82%, due 11/25/35 | 2,633,562 | ||||||||||||
| USD | 21,505,829 | Greenpoint Morgage Funding Trust, Series 07-HE1, Class A1, XL, 1 mo. LIBOR + .15%, 0.60%, due 12/13/32 | 2,150,583 | ||||||||||||
| USD | 5,592,963 | GSAMP Trust, Series 05-HE6, Class A2B, 1 mo. LIBOR + .19%, 0.66%, due 11/25/35 | 4,754,018 | ||||||||||||
| USD | 9,250,000 | Home Equity Asset Trust, Series 07-1, Class 2A4, 1 mo. LIBOR + .23%, 0.70%, due 05/25/37 | 1,794,500 | ||||||||||||
| USD | 10,000,000 | IXIS Real Estate Capital Trust, Series 06-HE2, Class A3, 1 mo. LIBOR + .16%, 0.63%, due 08/25/36 | 5,572,000 | ||||||||||||
| USD | 13,000,000 | Master Asset-Backed Securities Trust, Series 06-NC3, Class A4, 1 mo. LIBOR + .16%, 0.63%, due 10/25/36 | 3,445,000 | ||||||||||||
| USD | 506,634 | Master Asset-Backed Securities Trust, Series 06-FRE1, Class A2, 1 mo. LIBOR + .12%, 0.59%, due 12/25/35 | 493,969 | ||||||||||||
See accompanying notes to the financial statements.
12
GMO Emerging Country Debt Fund
(A Series of GMO Trust)
Schedule of Investments — (Continued)
(showing percentage of total net assets)
February 28, 2009
| Par Value | Description | Value ($) | |||||||||||||
| Asset-Backed Securities — continued | |||||||||||||||
| USD | 13,000,000 | Morgan Stanley ABS Capital I, Series 06-NC3, Class A2C, 1 mo. LIBOR + .17%, 0.64%, due 03/25/36 | 4,550,000 | ||||||||||||
| USD | 10,000,000 | Morgan Stanley ACES SPC, Series 04-15, Class I, 144A, 3 mo. LIBOR + .45%, 1.98%, due 12/20/09 | 6,885,000 | ||||||||||||
| USD | 15,000,000 | Morgan Stanley IXIS Real Estate Capital Trust, Series 06-2, Class A3, 1 mo. LIBOR + .15%, 0.62%, due 11/25/36 | 5,250,000 | ||||||||||||
| USD | 15,200,000 | Morgan Stanley IXIS Real Estate Capital Trust, Series 06-2, Class A4, 1 mo. LIBOR + .22%, 0.69%, due 11/25/36 | 3,804,560 | ||||||||||||
| USD | 12,868,000 | Option One Mortgage Loan Turst, Series 06-3, Class 2A4, 1 mo. LIBOR + .22%, 0.69%, due 02/25/37 | 3,281,340 | ||||||||||||
| USD | 8,000,000 | Wamu Asset-Backed Certificates, Series 07-HE2, Class 2A4, 1 mo. LIBOR + .36%, 0.83%, due 04/25/37 | 2,000,000 | ||||||||||||
| 178,675,779 | |||||||||||||||
| U.S. Government — 9.6% | |||||||||||||||
| USD | 25,000,000 | U.S. Treasury Bond, 5.25%, due 02/15/29 | 29,339,844 | ||||||||||||
| USD | 73,822,980 | U.S. Treasury Inflation Indexed Bond, 0.88%, due 04/15/10 (d) (e) | 72,830,947 | ||||||||||||
| USD | 50,000,000 | U.S. Treasury Principal Strip Bond, due 11/15/21 | 29,548,150 | ||||||||||||
| USD | 30,000,000 | U.S. Treasury Strip Coupon Bond, due 05/15/23 | 16,371,810 | ||||||||||||
| USD | 50,000,000 | U.S. Treasury Strip Coupon Bond, due 11/15/23 | 26,741,500 | ||||||||||||
| 174,832,251 | |||||||||||||||
| Total United States | 353,508,030 | ||||||||||||||
| Uruguay — 4.5% | |||||||||||||||
| Foreign Government Obligations | |||||||||||||||
| EUR | 2,000,000 | Republic of Uruguay, 7.00%, due 06/28/19 | 2,155,175 | ||||||||||||
| USD | 51,851,571 | Republic of Uruguay, 7.63%, due 03/21/36 | 42,777,546 | ||||||||||||
| USD | 14,533,294 | Republic of Uruguay, PIK, 7.88%, due 01/15/33 | 12,353,300 | ||||||||||||
| JPY | 1,318,400,000 | Republica Oriental de Uruguay, Series 3BR, Step Up, 2.50%, due 03/14/11 (a) | 12,928,800 | ||||||||||||
| USD | 400,000 | Republica Oriental de Uruguay, 7.25%, due 05/04/14 (a) | 332,888 | ||||||||||||
| EUR | 10,000,000 | Republica Oriental de Uruguay, 6.88%, due 01/19/16 | 11,599,913 | ||||||||||||
| Total Uruguay | 82,147,622 | ||||||||||||||
See accompanying notes to the financial statements.
13
GMO Emerging Country Debt Fund
(A Series of GMO Trust)
Schedule of Investments — (Continued)
(showing percentage of total net assets)
February 28, 2009
| Par Value | Description | Value ($) | |||||||||||||
| Venezuela — 4.5% | |||||||||||||||
| Foreign Government Agency — 0.3% | |||||||||||||||
| USD | 16,000,000 | Petroleos de Venezuela, 5.38%, due 04/12/27 | 5,120,000 | ||||||||||||
| Foreign Government Obligations — 4.2% | |||||||||||||||
| EUR | 7,400,000 | Republic of Venezuela, 11.13%, due 07/25/11 | 8,255,589 | ||||||||||||
| EUR | 10,000,000 | Republic of Venezuela, 7.00%, due 03/16/15 | 5,831,650 | ||||||||||||
| USD | 23,000,000 | Republic of Venezuela, 7.00%, due 03/31/38 | 9,372,500 | ||||||||||||
| USD | 69,500,000 | Republic of Venezuela, Reg S, 9.00%, due 05/07/23 | 34,402,500 | ||||||||||||
| USD | 22,000,000 | Republic of Venezuela, Reg S, 9.25%, due 05/07/28 | 10,835,000 | ||||||||||||
| USD | 262,360 | Republic of Venezuela Restructured Debt, 0.00%, due 04/15/20 | 4,436,508 | ||||||||||||
| USD | 8,000,000 | Venezuela Government International Bond, 7.65%, due 04/21/25 | 3,520,000 | ||||||||||||
| USD | 3,000,000 | Venezuela Government International Bond, Reg S, 6.00%, due 12/09/20 | 1,275,000 | ||||||||||||
| 77,928,747 | |||||||||||||||
| Total Venezuela | 83,048,747 | ||||||||||||||
| Vietnam — 1.0% | |||||||||||||||
| Foreign Government Obligations | |||||||||||||||
| USD | 3,913,044 | Socialist Republic of Vietnam, Series 18 Yr., 6 mo. LIBOR + .81%, 2.81%, due 03/12/16 | 2,915,217 | ||||||||||||
| USD | 19,750,000 | Socialist Republic of Vietnam, Series 30 Yr., Step Up, 4.00%, due 03/12/28 | 12,640,000 | ||||||||||||
| USD | 4,000,000 | Socialist Republic of Vietnam, Series 30 Yr., 6 mo. LIBOR + .81%, 2.81%, due 03/13/28 | 2,960,000 | ||||||||||||
| Total Vietnam | 18,515,217 | ||||||||||||||
| TOTAL DEBT OBLIGATIONS (COST $2,320,205,477) | 1,545,036,191 | ||||||||||||||
| LOAN ASSIGNMENTS — 1.7% | |||||||||||||||
| Indonesia — 1.0% | |||||||||||||||
| EUR | 3,262,131 | Repbulic of Indonesia, Indonesia Paris Club Debt (f) | 3,065,489 | ||||||||||||
| JPY | 125,820,002 | Republic of Indonesia Loan Agreement, 6 mo. JPY LIBOR + .88%, 4.50%, due 03/28/13 | 966,904 | ||||||||||||
| USD | 2,738,082 | Republic of Indonesia Loan Agreement, 6 mo. LIBOR +.88%, 4.50%, due 03/29/13 | 2,053,561 | ||||||||||||
See accompanying notes to the financial statements.
14
GMO Emerging Country Debt Fund
(A Series of GMO Trust)
Schedule of Investments — (Continued)
(showing percentage of total net assets)
February 28, 2009
| Par Value | Description | Value ($) | |||||||||||||
| Indonesia — continued | |||||||||||||||
| USD | 3,720,125 | Republic of Indonesia Loan Agreement, dated June 14, 1995, 3 mo. LIBOR + .88%, 3.00%, due 12/14/19 | 2,046,069 | ||||||||||||
| USD | 3,720,125 | Republic of Indonesia Loan Agreement, dated June 14, 1995, 3 mo. LIBOR + .88%, 3.00%, due 12/14/19 | 2,046,069 | ||||||||||||
| USD | 5,012,800 | Republic of Indonesia Loan Agreement, dated June 14, 1995, 3 mo. LIBOR + .88%, 3.00%, due 12/14/19 | 2,728,961 | ||||||||||||
| USD | 2,644,865 | Republic of Indonesia Loan Agreement, dated September 29, 1994, 7.24%, due 12/01/19 | 2,115,892 | ||||||||||||
| USD | 2,731,802 | Republic of Indonesia Loan Agreement, dated September 29, 1994, 4.50%, due 12/01/19 | 2,185,442 | ||||||||||||
| Total Indonesia | 17,208,387 | ||||||||||||||
| Russia — 0.3% | |||||||||||||||
| USD | 3,955,201 | Russia Foreign Trade Obligations (a) (f) | 4,924,430 | ||||||||||||
| GBP | 14,162 | Russia Foreign Trade Obligations (a) (f) | 33,102 | ||||||||||||
| USD | 80,572 | Russia Foreign Trade Obligations (a) (f) | 96,937 | ||||||||||||
| USD | 265,723 | Russia Foreign Trade Obligations (a) (f) | 324,921 | ||||||||||||
| DEM | 45,916 | Russia Foreign Trade Obligations (a) (f) | 29,691 | ||||||||||||
| FIM | 1,740,000 | Russia Foreign Trade Obligations (a) (f) | 390,956 | ||||||||||||
| Total Russia | 5,800,037 | ||||||||||||||
| Vietnam — 0.4% | |||||||||||||||
| USD | 16,000,000 | Vietnam Shipbuilding Industry Group Loan Agreement, 6 mo. LIBOR + 1.50%, 4.63%, due 06/26/16 (a) | 7,994,906 | ||||||||||||
| TOTAL LOAN ASSIGNMENTS (COST $40,392,301) | 31,003,330 | ||||||||||||||
| LOAN PARTICIPATIONS — 6.0% | |||||||||||||||
| Egypt — 0.2% | |||||||||||||||
| CHF | 5,133,825 | Paris Club Loan Agreement (Participation with Standard Chartered Bank), due 01/03/24 (f) | 3,517,881 | ||||||||||||
See accompanying notes to the financial statements.
15
GMO Emerging Country Debt Fund
(A Series of GMO Trust)
Schedule of Investments — (Continued)
(showing percentage of total net assets)
February 28, 2009
| Par Value | Description | Value ($) | |||||||||||||
| Indonesia — 1.9% | |||||||||||||||
| USD | 457,862 | Republic of Indonesia Loan Agreement (Participation with CitiBank), 3 mo. LIBOR + .88%, 3.00%, due 12/14/19 | 251,824 | ||||||||||||
| USD | 457,862 | Republic of Indonesia Loan Agreement (Participation with CitiBank), 3 mo. LIBOR + .88%, 3.00%, due 12/14/19 | 251,824 | ||||||||||||
| USD | 610,677 | Republic of Indonesia Loan Agreement (Participation with CitiBank), 3 mo. LIBOR + .88%, 3.00%, due 12/14/19 | 335,873 | ||||||||||||
| USD | 20,037,697 | Republic of Indonesia Loan Agreement (Participation with Deutsche Bank), 3 mo. LIBOR + 1.25%, 4.50%, due 02/12/13 | 16,030,158 | ||||||||||||
| USD | 14,732,165 | Republic of Indonesia Loan Agreement (Participation with Deutsche Bank), 6 mo. LIBOR +.88%, 4.50%, due 09/29/19 | 11,785,732 | ||||||||||||
| JPY | 743,849,772 | Republic of Indonesia Loan Agreement (Participation with Deutsche Bank), 6 mo. LIBOR +.88%, 1.76%, due 03/29/13 | 5,716,351 | ||||||||||||
| Total Indonesia | 34,371,762 | ||||||||||||||
| Iraq — 1.5% | |||||||||||||||
| USD | 3,402,097 | Republic of Iraq Paris Club Loan Agreement (Participation with Credit Suisse), due 01/01/28 | 850,524 | ||||||||||||
| JPY | 4,926,803,587 | Republic of Iraq Paris Club Loan Agreement (Participation with Deutsche Bank), due 01/01/28 | 23,635,734 | ||||||||||||
| JPY | 643,772,123 | Republic of Iraq Paris Club Loan, T Chatani (Participation with Deutsche Bank), due 01/01/28 | 3,026,412 | ||||||||||||
| Total Iraq | 27,512,670 | ||||||||||||||
| Poland — 0.2% | |||||||||||||||
| JPY | 349,999,985 | Poland Paris Club Loan Debt (Participation with Deutsche Bank), due 03/31/09 | 3,609,201 | ||||||||||||
| Russia — 1.1% | |||||||||||||||
| EUR | 57,042,402 | Russian Foreign Trade Obligations (Participation with GML International Ltd.) (a) (f) | 20,628,108 | ||||||||||||
| Vietnam — 1.1% | |||||||||||||||
| JPY | 2,754,949,499 | Socialist Republic of Vietnam Loan Agreement (Participation with Deutsche Bank), 6 mo. JPY LIBOR + .60%, 1.50%, due 09/01/17 | 19,759,872 | ||||||||||||
| TOTAL LOAN PARTICIPATIONS (COST $112,247,501) | 109,399,494 | ||||||||||||||
See accompanying notes to the financial statements.
16
GMO Emerging Country Debt Fund
(A Series of GMO Trust)
Schedule of Investments — (Continued)
(showing percentage of total net assets)
February 28, 2009
| Par Value / Principal Amount | Description | Value ($) | |||||||||||||
| PROMISSORY NOTES — 0.2% | |||||||||||||||
| Dominican Republic — 0.1% | |||||||||||||||
| USD | 1,089,012 | Dominican Republic Promissory Notes, 0.00%, due 09/15/09 | 969,220 | ||||||||||||
| USD | 817,249 | Dominican Republic Promissory Notes, 0.00%, due 09/15/11 | 433,142 | ||||||||||||
| USD | 817,249 | Dominican Republic Promissory Notes, 0.00%, due 09/15/10 | 580,247 | ||||||||||||
| Total Dominican Republic | 1,982,609 | ||||||||||||||
| Ghana — 0.0% | |||||||||||||||
| USD | 3,312,500 | Republic of Ghana Promissory Notes, 0.00%, due 08/09/10 (b) (c) (g) | 331,250 | ||||||||||||
| Nigeria — 0.1% | |||||||||||||||
| USD | 33,450,000 | Central Bank of Nigeria Promissory Notes, Series RC, 5.09%, due 01/05/10 | 2,090,625 | ||||||||||||
| TOTAL PROMISSORY NOTES (COST $21,849,094) | 4,404,484 | ||||||||||||||
| OPTIONS PURCHASED — 0.2% | |||||||||||||||
| Options on Interest Rates — 0.1% | |||||||||||||||
| TWD | 1,849,200,000 | TWD Interest Rate Floor Call Option, Expires 03/16/10, Strike 2.19% | 924,084 | ||||||||||||
| TWD | 1,849,200,000 | TWD Interest Rate Cap Call Option, Expires 03/16/10, Strike 2.19% | 106 | ||||||||||||
| Total Options on Interest Rates | 924,190 | ||||||||||||||
| Options on Interest Rate Swaps — 0.1% | |||||||||||||||
| KRW | 50,000,000,000 | KRW Swaption Call, Expires 03/21/11, Strike 5.64% | 2,674,753 | ||||||||||||
| KRW | 50,000,000,000 | KRW Swaption Put, Expires 03/21/11, Strike 5.64% | 132,577 | ||||||||||||
| KRW | 90,000,000,000 | KRW Swaption Put, Expires 04/27/09, Strike 5.42% | 1,232 | ||||||||||||
| KRW | 72,000,000,000 | KRW Swaption Put, Expires 04/08/09, Strike 6.20% | — | ||||||||||||
| Total Options on Interest Rate Swaps | 2,808,562 | ||||||||||||||
| TOTAL OPTIONS PURCHASED (COST $7,973,214) | 3,732,752 | ||||||||||||||
See accompanying notes to the financial statements.
17
GMO Emerging Country Debt Fund
(A Series of GMO Trust)
Schedule of Investments — (Continued)
(showing percentage of total net assets)
February 28, 2009
| Shares | Description | Value ($) | |||||||||||||
| MUTUAL FUNDS — 5.3% | |||||||||||||||
| United States — 5.3% | |||||||||||||||
| Affiliated Issuers | |||||||||||||||
| 3,976,082 | GMO Short-Duration Collateral Fund | 67,991,002 | |||||||||||||
| 21,409 | GMO Special Purpose Holding Fund (a) (h) | 15,629 | |||||||||||||
| 1,515,449 | GMO World Opportunity Overlay Fund | 27,808,483 | |||||||||||||
| Total United States | 95,815,114 | ||||||||||||||
| TOTAL MUTUAL FUNDS (COST $124,904,720) | 95,815,114 | ||||||||||||||
| RIGHTS AND WARRANTS — 0.3% | |||||||||||||||
| Nigeria — 0.1% | |||||||||||||||
| 25,000 | Central Bank of Nigeria Warrants, Expires 11/15/20 * | 2,500,000 | |||||||||||||
| Uruguay — 0.0% | |||||||||||||||
| 4,000,000 | Banco Central Del Uruguay Value Recovery Rights, VRRB, Expires 01/02/21 * (a) | — | |||||||||||||
| Venezuela — 0.2% | |||||||||||||||
| 164,215 | Republic of Venezuela Bond Warrants, Expires 04/15/20 * | 2,776,876 | |||||||||||||
| TOTAL RIGHTS AND WARRANTS (COST $0) | 5,276,876 | ||||||||||||||
| SHORT-TERM INVESTMENTS — 1.9% | |||||||||||||||
| Money Market Funds — 1.9% | |||||||||||||||
| 10,666,373 | State Street Institutional Liquid Reserves Fund-Institutional Class | 10,666,373 | |||||||||||||
| 24,072,589 | State Street Institutional Treasury Plus Money Market Fund-Institutional Class | 24,072,589 | |||||||||||||
| TOTAL SHORT-TERM INVESTMENTS (COST $34,738,962) | 34,738,962 | ||||||||||||||
| TOTAL INVESTMENTS — 100.2% (Cost $2,662,311,269) | 1,829,407,203 | ||||||||||||||
| Other Assets and Liabilities (net) — (0.2%) | (2,955,747 | ) | |||||||||||||
| TOTAL NET ASSETS — 100.0% | $ | 1,826,451,456 | |||||||||||||
See accompanying notes to the financial statements.
18
GMO Emerging Country Debt Fund
(A Series of GMO Trust)
Schedule of Investments — (Continued)
February 28, 2009
A summary of outstanding financial instruments at February 28, 2009 is as follows:
Forward Currency Contracts
| Settlement Date | Deliver/Receive | Units of Currency | Value | Net Unrealized Appreciation (Depreciation) | |||||||||||||||
| Buys | |||||||||||||||||||
| 3/10/09 | EUR | 5,900,000 | $ | 7,479,379 | $ | (72,621 | ) | ||||||||||||
| Sales | |||||||||||||||||||
| 4/28/09 | CHF | 80,000,000 | $ | 68,465,959 | $ | (206,574 | ) | ||||||||||||
| 3/10/09 | EUR | 264,700,000 | 335,557,905 | 27,486,575 | |||||||||||||||
| 4/14/09 | GBP | 20,000,000 | 28,628,812 | 691,188 | |||||||||||||||
| 3/17/09 | JPY | 6,000,000,000 | 61,493,669 | 4,311,679 | |||||||||||||||
| $ | 494,146,345 | $ | 32,282,868 | ||||||||||||||||
Futures Contracts
| Number of Contracts | Type | Expiration Date | Contract Value | Net Unrealized Appreciation (Depreciation) | |||||||||||||||
| Buys | |||||||||||||||||||
| 5,800 | Federal Funds 30 day | March 2009 | $ | 2,411,180,379 | $ | (29,089 | ) | ||||||||||||
Reverse Repurchase Agreements
| Face Value | Description | Market Value | |||||||||||||
| USD | 1,968,931 | JP Morgan Chase Bank, 0.50%, dated 02/26/09, to be repurchased on demand at face value plus accrued interest. | $ | (1,968,931 | ) | ||||||||||
| Average balance outstanding | $ | (185,976,854 | ) | ||||
| Average interest rate | 3.02 | % | |||||
| Maximum balance outstanding | $ | (563,557,754 | ) | ||||
| Average shares outstanding | 287,129,071 | ||||||
| Average balance per share outstanding | $ | (0.65 | ) | ||||
| Days outstanding | 365 | ||||||
Average balance outstanding was calculated based on daily balances outstanding during the period that the Fund had entered into reverse repurchase agreements.
See accompanying notes to the financial statements.
19
GMO Emerging Country Debt Fund
(A Series of GMO Trust)
Schedule of Investments — (Continued)
February 28, 2009
Swap Agreements
Credit Default Swaps
| Notional Amount | Expiration Date | Counterparty | Receive (Pay)u | Annual Premium | Implied Credit Spread (1) | Deliverable on Default | Maximum Potential Amount of Future Payments by the Fund Under the Contract (2) | Market Value | |||||||||||||||||||||||||||||||||||
| 5,000,000 | USD | 3/20/2009 | JP Morgan | Receive | 2.85 | % | 1.21 | % | Republic of | 5,000,000 | USD | $ | 67,299 | ||||||||||||||||||||||||||||||
| Chase Bank | Peru | ||||||||||||||||||||||||||||||||||||||||||
| 10,000,000 | USD | 3/20/2009 | JP Morgan Chase Bank | Receive | 4.30 | % | 3.71 | % | Republic of Philippines | 10,000,000 | USD | 83,446 | |||||||||||||||||||||||||||||||
| 10,000,000 | USD | 4/17/2009 | Deutsche Bank AG | Receive | 3.90 | % | 14.06 | % | Gazprom Loan Facility | 10,000,000 | USD | 7,566 | |||||||||||||||||||||||||||||||
| 100,000,000 | USD | 4/20/2009 | JP Morgan Chase Bank | (Pay) | 0.29% | 2.01 | % | United Mexican States | N/A | 142,545 | |||||||||||||||||||||||||||||||||
| 10,000,000 | USD | 4/20/2009 | JP Morgan Chase Bank | (Pay) | 0.43% | 0.96 | % | Republic of Brazil | N/A | (7,890 | ) | ||||||||||||||||||||||||||||||||
| 6,789,768 | USD | 6/6/2009 | Deutsche Bank AG | Receive | 1.85 | % | 35.20 | % | Deutsche Bank Loan to Ukrnafta | 6,789,768 | USD | (546,411 | ) | ||||||||||||||||||||||||||||||
| 7,000,000 | USD | 8/5/2009 | Deutsche Bank AG | Receive | 4.85 | % | 39.30 | % | Government of Ukraine | 7,000,000 | USD | (918,703 | ) | ||||||||||||||||||||||||||||||
| 100,000,000 | CHF | 9/20/2009 | Morgan Stanley | (Pay) | 0.78% | 67.62 | % | Government of Ukraine | N/A | 25,421,349 | |||||||||||||||||||||||||||||||||
| 10,000,000 | USD | 9/20/2009 | JP Morgan Chase Bank | (Pay) | 0.97% | 14.49 | % | Gazprom OAO | N/A | 682,520 | |||||||||||||||||||||||||||||||||
| 849,572,575 | RUB | 11/5/2009 | Deutsche Bank AG | Receive | 1.45 | % | 11.92 | % | Russia Post Office | 849,572,575 | RUB | (1,328,153 | ) | ||||||||||||||||||||||||||||||
| 10,000,000 | USD | 11/20/2009 | JP Morgan Chase Bank | (Pay) | 0.88% | 3.07 | % | United Mexican States | N/A | 134,531 | |||||||||||||||||||||||||||||||||
| 10,000,000 | USD | 11/20/2009 | JP Morgan Chase Bank | (Pay) | 0.90% | 3.07 | % | United Mexican States | N/A | 132,534 | |||||||||||||||||||||||||||||||||
| 25,000,000 | USD | 12/29/2009 | Deutsche Bank AG | Receive | 2.25 | % | 18.64 | % | Videocon Loan Facility | 25,000,000 | USD | (2,954,585 | ) | ||||||||||||||||||||||||||||||
See accompanying notes to the financial statements.
20
GMO Emerging Country Debt Fund
(A Series of GMO Trust)
Schedule of Investments — (Continued)
February 28, 2009
Credit Default Swaps — continued
| Notional Amount | Expiration Date | Counterparty | Receive (Pay)u | Annual Premium | Implied Credit Spread (1) | Deliverable on Default | Maximum Potential Amount of Future Payments by the Fund Under the Contract (2) | Market Value | |||||||||||||||||||||||||||||||||||
| 7,000,000 | USD | 2/5/2010 | Deutsche | Receive | 4.85 | % | 40.33 | % | Government | 7,000,000 | USD | $ | (1,779,719 | ) | |||||||||||||||||||||||||||||
| Bank AG | of Ukraine | ||||||||||||||||||||||||||||||||||||||||||
| 3,000,000 | USD | 3/29/2010 | JP Morgan Chase Bank | Receive | 4.70 | % | 5.05 | % | Arab Republic of Egypt | 3,000,000 | USD | 48,187 | |||||||||||||||||||||||||||||||
| 85,000,000 | USD | 6/20/2010 | Deutsche Bank AG | (Pay) | 2.10 | % | N/A | Reference security within CDX Index | N/A | 3,722,292 | |||||||||||||||||||||||||||||||||
| 12,000,000 | USD | 6/20/2010 | JP Morgan Chase Bank | (Pay) | 3.87 | % | 43.71 | % | Republic of Argentina | N/A | 4,383,099 | ||||||||||||||||||||||||||||||||
| 150,000,000 | USD | 6/20/2010 | Deutsche Bank AG | (Pay) | 1.47 | % | 2.67 | % | Republic of Brazil | N/A | 1,919,480 | ||||||||||||||||||||||||||||||||
| 12,000,000 | USD | 6/20/2010 | JP Morgan Chase Bank | (Pay) | 4.00 | % | 43.71 | % | Republic of Argentina | N/A | 4,365,621 | ||||||||||||||||||||||||||||||||
| 10,000,000 | USD | 7/20/2010 | Deutsche Bank AG | (Pay) | 3.77 | % | 43.50 | % | Republic of Argentina | N/A | 3,827,826 | ||||||||||||||||||||||||||||||||
| 6,000,000 | USD | 7/20/2010 | Deutsche Bank AG | (Pay) | 3.80 | % | 43.50 | % | Republic of Argentina | N/A | 2,294,754 | ||||||||||||||||||||||||||||||||
| 140,000,000 | USD | 7/20/2010 | UBS AG | (Pay) | 0.89 | % | 5.04 | % | Republic of Turkey | N/A | 7,632,142 | ||||||||||||||||||||||||||||||||
| 5,000,000 | USD | 7/23/2010 | Deutsche Bank AG | Receive | 4.56 | % | 38.66 | % | Government of Ukraine | 5,000,000 | USD | (1,605,209 | ) | ||||||||||||||||||||||||||||||
| 7,000,000 | USD | 8/5/2010 | Deutsche Bank AG | Receive | 4.90 | % | 38.58 | % | Government of Ukraine | 7,000,000 | USD | (2,266,459 | ) | ||||||||||||||||||||||||||||||
| 3,000,000 | USD | 8/25/2010 | Deutsche Bank AG | Receive | 6.47 | % | 49.36 | % | Deutsche Bank Loan to Ukrtelekom | 3,000,000 | USD | (1,934,553 | ) | ||||||||||||||||||||||||||||||
| 35,000,000 | USD | 9/20/2010 | JP Morgan Chase Bank | (Pay) | 0.70 | % | 4.38 | % | Republic of Philippines | N/A | 1,879,652 | ||||||||||||||||||||||||||||||||
| 50,000,000 | USD | 9/20/2010 | JP Morgan Chase Bank | (Pay) | 0.97 | % | 13.55 | % | Gazprom OAO | N/A | 8,275,658 | ||||||||||||||||||||||||||||||||
| 20,000,000 | USD | 10/18/2010 | JP Morgan Chase Bank | Receive | 2.00 | % | 16.67 | % | VTB Leasing | 20,000,000 | USD | (3,898,329 | ) | ||||||||||||||||||||||||||||||
See accompanying notes to the financial statements.
21
GMO Emerging Country Debt Fund
(A Series of GMO Trust)
Schedule of Investments — (Continued)
February 28, 2009
Credit Default Swaps — continued
| Notional Amount | Expiration Date | Counterparty | Receive (Pay)u | Annual Premium | Implied Credit Spread (1) | Deliverable on Default | Maximum Potential Amount of Future Payments by the Fund Under the Contract (2) | Market Value | |||||||||||||||||||||||||||||||||||
| 20,000,000 | USD | 10/20/2010 | Goldman Sachs | (Pay) | 2.74 | % | 4.25 | % | Petroleos | N/A | $ | 259,551 | |||||||||||||||||||||||||||||||
| Mexicanos | |||||||||||||||||||||||||||||||||||||||||||
| 5,000,000 | USD | 10/25/2010 | Deutsche Bank AG | Receive | 4.60 | % | 38.38 | % | Government of Ukraine | 5,000,000 | USD | (1,714,053 | ) | ||||||||||||||||||||||||||||||
| 10,000,000 | USD | 12/20/2010 | JP Morgan Chase Bank | (Pay) | 3.57 | % | 43.51 | % | Republic of Argentina | N/A | 4,511,584 | ||||||||||||||||||||||||||||||||
| 5,000,000 | USD | 12/20/2010 | JP Morgan Chase Bank | (Pay) | 3.43 | % | 43.51 | % | Republic of Argentina | N/A | 2,265,114 | ||||||||||||||||||||||||||||||||
| 5,000,000 | USD | 1/25/2011 | Deutsche Bank AG | Receive | 4.63 | % | 38.64 | % | Government of Ukraine | 5,000,000 | USD | (1,936,367 | ) | ||||||||||||||||||||||||||||||
| 7,000,000 | USD | 2/7/2011 | Deutsche Bank AG | Receive | 4.95 | % | 38.71 | % | Government of Ukraine | 7,000,000 | USD | (2,729,425 | ) | ||||||||||||||||||||||||||||||
| 5,000,000 | USD | 2/20/2011 | Morgan Stanley | (Pay) | 2.80 | % | 43.93 | % | Republic of Argentina | N/A | 2,473,739 | ||||||||||||||||||||||||||||||||
| 3,000,000 | USD | 2/25/2011 | Deutsche Bank AG | Receive | 6.57 | % | 48.50 | % | Deutsche Bank Loan to Ukrtelekom | 3,000,000 | USD | (2,040,847 | ) | ||||||||||||||||||||||||||||||
| 8,000,000 | USD | 3/20/2011 | UBS AG | (Pay) | 3.55 | % | 8.14 | % | Republic of Iraq | N/A | 530,710 | ||||||||||||||||||||||||||||||||
| 8,000,000 | USD | 3/20/2011 | Citigroup | (Pay) | 3.70 | % | 7.79 | % | Republic of Iraq | N/A | 456,763 | ||||||||||||||||||||||||||||||||
| 5,000,000 | USD | 4/26/2011 | Deutsche Bank AG | Receive | 4.66 | % | 38.44 | % | Government of Ukraine | 5,000,000 | USD | (1,991,508 | ) | ||||||||||||||||||||||||||||||
| 6,000,000 | USD | 6/20/2011 | JP Morgan Chase Bank | Receive | 3.75 | % | 17.85 | % | Republic of Georgia | 6,000,000 | USD | (1,474,644 | ) | ||||||||||||||||||||||||||||||
| 10,000,000 | USD | 6/20/2011 | Deutsche Bank AG | (Pay) | 1.89 | % | 26.34 | % | Islamic Republic of Pakistan | N/A | 3,493,182 | ||||||||||||||||||||||||||||||||
| 34,000,000 | USD | 6/20/2011 | Deutsche Bank AG | (Pay) | 1.35 | % | N/A | Reference security within CDX Index | N/A | 5,249,175 | |||||||||||||||||||||||||||||||||
See accompanying notes to the financial statements.
22
GMO Emerging Country Debt Fund
(A Series of GMO Trust)
Schedule of Investments — (Continued)
February 28, 2009
Credit Default Swaps — continued
| Notional Amount | Expiration Date | Counterparty | Receive (Pay)u | Annual Premium | Implied Credit Spread (1) | Deliverable on Default | Maximum Potential Amount of Future Payments by the Fund Under the Contract (2) | Market Value | |||||||||||||||||||||||||||||||||||
| 11,000,000 | USD | 6/20/2011 | JP Morgan | (Pay) | 1.35 | % | N/A | Reference | N/A | $ | 1,698,262 | ||||||||||||||||||||||||||||||||
| Chase Bank | security | ||||||||||||||||||||||||||||||||||||||||||
| within CDX | |||||||||||||||||||||||||||||||||||||||||||
| Index | |||||||||||||||||||||||||||||||||||||||||||
| 9,000,000 | USD | 7/17/2011 | UBS AG | Receive | 5.05 | % | 38.03 | % | Government of Ukraine | 9,000,000 | USD | (3,771,616 | ) | ||||||||||||||||||||||||||||||
| 5,000,000 | USD | 7/25/2011 | Deutsche Bank AG | Receive | 4.68 | % | 38.00 | % | Government of Ukraine | 5,000,000 | USD | (2,132,446 | ) | ||||||||||||||||||||||||||||||
| 7,000,000 | USD | 8/5/2011 | Deutsche Bank AG | Receive | 5.00 | % | 37.96 | % | Government of Ukraine | 7,000,000 | USD | (2,978,400 | ) | ||||||||||||||||||||||||||||||
| 620,000,000 | MXN | 8/20/2011 | Deutsche Bank AG | Receive | 0.40 | % | 2.58 | % | United Mexican States | 620,000,000 | MXN | (1,889,410 | ) | ||||||||||||||||||||||||||||||
| 20,000,000 | USD | 8/20/2011 | Deutsche Bank AG | (Pay) | 0.57 | % | 4.13 | % | United Mexican States | N/A | 1,637,595 | ||||||||||||||||||||||||||||||||
| 3,000,000 | USD | 8/25/2011 | Deutsche Bank AG | Receive | 6.67 | % | 49.32 | % | Deutsche Bank Loan to Ukrtelekom | 3,000,000 | USD | (2,096,561 | ) | ||||||||||||||||||||||||||||||
| 7,000,000 | USD | 10/20/2011 | JP Morgan Chase Bank | (Pay) | 2.75 | % | 40.38 | % | Republic of Argentina | N/A | 3,617,753 | ||||||||||||||||||||||||||||||||
| 5,000,000 | USD | 10/25/2011 | Deutsche Bank AG | Receive | 4.70 | % | 37.80 | % | Government of Ukraine | 5,000,000 | USD | (2,157,977 | ) | ||||||||||||||||||||||||||||||
| 19,000,000 | USD | 10/30/2011 | Deutsche Bank AG | Receive | 4.00 | % | 64.02 | % | Naftofaz Ukraine | 19,000,000 | USD | (12,164,071 | ) | ||||||||||||||||||||||||||||||
| 8,000,000 | USD | 11/20/2011 | JP Morgan Chase Bank | (Pay) | 2.16 | % | 40.02 | % | Republic of Argentina | N/A | 4,261,807 | ||||||||||||||||||||||||||||||||
| 7,916,740 | USD | 12/20/2011 | Deutsche Bank AG | Receive | 1.60 | % | 5.67 | % | Stemcor UK Ltd. | 7,916,740 | USD | (132,651 | ) | ||||||||||||||||||||||||||||||
| 65,000,000 | USD | 12/20/2011 | JP Morgan Chase Bank | (Pay) | 1.40 | % | N/A | Reference security within CDX Index | N/A | 11,556,639 | |||||||||||||||||||||||||||||||||
| 5,000,000 | USD | 12/20/2011 | JP Morgan Chase Bank | (Pay) | 0.66 | % | 4.53 | % | Petroleos Mexicanos | N/A | 486,570 | ||||||||||||||||||||||||||||||||
See accompanying notes to the financial statements.
23
GMO Emerging Country Debt Fund
(A Series of GMO Trust)
Schedule of Investments — (Continued)
February 28, 2009
Credit Default Swaps — continued
| Notional Amount | Expiration Date | Counterparty | Receive (Pay)u | Annual Premium | Implied Credit Spread (1) | Deliverable on Default | Maximum Potential Amount of Future Payments by the Fund Under the Contract (2) | Market Value | |||||||||||||||||||||||||||||||||||
| 19,000,000 | EUR | 1/20/2012 | Duetsche | (Pay) | 0.42 | % | 15.36 | % | Republic of | N/A | $ | 7,408,442 | |||||||||||||||||||||||||||||||
| Bank AG | Kazakhstan | ||||||||||||||||||||||||||||||||||||||||||
| 8,600,000,000 | KZT | 1/20/2012 | Deutsche Bank AG | Receive | 0.32 | % | 11.57 | % | Republic of Kazakhstan | 8,600,000,000 | KZT | (12,587,553 | ) | ||||||||||||||||||||||||||||||
| 25,000,000 | USD | 2/20/2012 | JP Morgan Chase Bank | (Pay) | 0.96 | % | 3.48 | % | Republic of Brazil | N/A | 1,739,891 | ||||||||||||||||||||||||||||||||
| 3,000,000 | USD | 2/25/2012 | Deutsche Bank AG | Receive | 6.75 | % | 52.14 | % | Deutsche Bank Loan to Ukrtelekom | 3,000,000 | USD | (2,122,820 | ) | ||||||||||||||||||||||||||||||
| 19,000,000 | USD | 5/5/2012 | Deutsche Bank AG | Receive | 4.00 | % | 49.63 | % | Naftofaz Ukraine | 19,000,000 | USD | (12,374,673 | ) | ||||||||||||||||||||||||||||||
| 50,000,000 | USD | 6/20/2012 | Morgan Stanley | (Pay) | 1.25 | % | N/A | Reference security within CDX Index | N/A | 9,958,681 | |||||||||||||||||||||||||||||||||
| 5,000,000 | USD | 7/30/2012 | JP Morgan Chase Bank | Receive | 3.05 | % | 2.46 | % | Republic of Chile | 5,000,000 | USD | 105,965 | |||||||||||||||||||||||||||||||
| 5,000,000 | USD | 8/20/2012 | JP Morgan Chase Bank | Receive | 3.50 | % | 11.05 | % | Republic of Jamaica | 5,000,000 | USD | (995,744 | ) | ||||||||||||||||||||||||||||||
| 3,000,000 | USD | 8/25/2012 | Deutsche Bank AG | Receive | 6.82 | % | 51.57 | % | Deutsche Bank Loan to Ukrtelekom | 3,000,000 | USD | (2,134,188 | ) | ||||||||||||||||||||||||||||||
| 2,000,000 | USD | 9/20/2012 | Goldman Sachs | (Pay) | 9.20 | % | 37.42 | % | Republic of Argentina | N/A | 833,507 | ||||||||||||||||||||||||||||||||
| 10,000,000 | USD | 9/20/2012 | JP Morgan Chase Bank | (Pay) | 1.25 | % | 11.13 | % | Gazprom OAO | N/A | 2,540,083 | ||||||||||||||||||||||||||||||||
| 85,000,000 | PEN | 9/20/2012 | JP Morgan Chase Bank | Receive | 0.92 | % | 3.37 | % | Republic of Peru | 85,000,000 | PEN | (1,834,585 | ) | ||||||||||||||||||||||||||||||
| 15,000,000 | USD | 9/20/2012 | JP Morgan Chase Bank | (Pay) | 1.15 | % | 4.13 | % | Republic of Peru | N/A | 1,315,417 | ||||||||||||||||||||||||||||||||
| 10,000,000 | USD | 10/4/2012 | JP Morgan Chase Bank | Receive | 2.95 | % | 2.50 | % | Republic of Chile | 10,000,000 | USD | 269,138 | |||||||||||||||||||||||||||||||
| 4,000,000 | USD | 10/20/2012 | UBS AG | (Pay) | 4.13 | % | 25.59 | % | Petroleos de Venezuela | N/A | 1,511,715 | ||||||||||||||||||||||||||||||||
See accompanying notes to the financial statements.
24
GMO Emerging Country Debt Fund
(A Series of GMO Trust)
Schedule of Investments — (Continued)
February 28, 2009
Credit Default Swaps — continued
| Notional Amount | Expiration Date | Counterparty | Receive (Pay)u | Annual Premium | Implied Credit Spread (1) | Deliverable on Default | Maximum Potential Amount of Future Payments by the Fund Under the Contract (2) | Market Value | |||||||||||||||||||||||||||||||||||
| 15,000,000 | USD | 10/20/2012 | JP Morgan | Receive | 0.80 | % | 3.64 | % | Republic of | 15,000,000 | USD | $ | (1,360,611 | ) | |||||||||||||||||||||||||||||
| Chase Bank | Brazil | ||||||||||||||||||||||||||||||||||||||||||
| 4,000,000 | USD | 10/20/2012 | UBS AG | (Pay) | 3.90 | % | 25.59 | % | Petroleos de Venezuela | N/A | 1,531,873 | ||||||||||||||||||||||||||||||||
| 20,000,000 | USD | 10/20/2012 | JP Morgan Chase Bank | Receive | 0.80 | % | 3.64 | % | Republic of Brazil | 20,000,000 | USD | (1,814,148 | ) | ||||||||||||||||||||||||||||||
| 5,000,000 | USD | 11/5/2012 | Deutsche Bank AG | Receive | 6.50 | % | 10.99 | % | Republic of Jamaica | 5,000,000 | USD | (518,228 | ) | ||||||||||||||||||||||||||||||
| 42,000,000 | USD | 12/20/2012 | Morgan Stanley | (Pay) | 1.20 | % | 1.19 | % | Reference security within CDX Index | N/A | (115,960 | ) | |||||||||||||||||||||||||||||||
| 204,179,760 | USD | 12/20/2012 | Morgan Stanley | Receive | 0.71 | % | 0.58 | % | Reference security within CDX Index | 204,179,760 | USD | 1,237,837 | |||||||||||||||||||||||||||||||
| 50,000,000 | USD | 12/20/2012 | JP Morgan Chase Bank | (Pay) | 1.75 | % | N/A | Reference security within CDX Index | N/A | 9,962,153 | |||||||||||||||||||||||||||||||||
| 20,000,000 | USD | 3/20/2013 | Deutsche Bank AG | (Pay) | 1.48 | % | 4.37 | % | United Mexican States | N/A | 1,841,664 | ||||||||||||||||||||||||||||||||
| 22,000,000 | USD | 6/20/2013 | Deutsche Bank AG | (Pay) | 5.79 | % | 35.87 | % | Republic of Argentina | N/A | 11,439,596 | ||||||||||||||||||||||||||||||||
| 14,000,000 | USD | 6/20/2013 | JP Morgan Chase Bank | Receive | 3.72 | % | 9.82 | % | Russia AG Bank | 14,000,000 | USD | (2,629,450 | ) | ||||||||||||||||||||||||||||||
| 229,162,350 | RUB | 6/21/2013 | Deutsche Bank AG | Receive | 2.35 | % | 23.47 | % | VTB Leasing | 229,162,350 | RUB | (888,971 | ) | ||||||||||||||||||||||||||||||
| 11,441,275 | EUR | 6/24/2013 | JP Morgan Chase Bank | Receive | 1.37 | % | 18.12 | % | VTB Leasing | 11,441,275 | EUR | (4,190,755 | ) | ||||||||||||||||||||||||||||||
| 8,433,786 | EUR | 6/24/2013 | JP Morgan Chase Bank | Receive | 1.37 | % | 18.12 | % | VTB Leasing | 8,433,786 | EUR | (3,089,160 | ) | ||||||||||||||||||||||||||||||
| 50,000,000 | USD | 8/20/2013 | JP Morgan Chase Bank | (Pay) | 1.20 | % | 4.24 | % | Republic of Peru | N/A | 5,882,542 | ||||||||||||||||||||||||||||||||
See accompanying notes to the financial statements.
25
GMO Emerging Country Debt Fund
(A Series of GMO Trust)
Schedule of Investments — (Continued)
February 28, 2009
Credit Default Swaps — continued
| Notional Amount | Expiration Date | Counterparty | Receive (Pay)u | Annual Premium | Implied Credit Spread (1) | Deliverable on Default | Maximum Potential Amount of Future Payments by the Fund Under the Contract (2) | Market Value | |||||||||||||||||||||||||||||||||||
| 277,250,000 | PEN | 8/20/2013 | JP Morgan | Receive | 0.96 | % | 3.60 | % | Republic of | 277,250,000 | PEN | $ | (8,171,791 | ) | |||||||||||||||||||||||||||||
| Chase Bank | Peru | ||||||||||||||||||||||||||||||||||||||||||
| 80,000,000 | USD | 10/20/2013 | Deutsche Bank AG | Receive | 4.05 | % | 3.86 | % | Republic of Brazil | 80,000,000 | USD | 1,767,630 | |||||||||||||||||||||||||||||||
| 13,050,000,000 | JPY | 10/20/2013 | Deutsche Bank AG | (Pay) | 3.20 | % | 4.05 | % | Republic of Brazil | N/A | 1,536,942 | ||||||||||||||||||||||||||||||||
| 7,830,000,000 | JPY | 10/20/2013 | Deutsche Bank AG | (Pay) | 3.95 | % | 4.05 | % | Republic of Brazil | N/A | (1,615,556 | ) | |||||||||||||||||||||||||||||||
| 130,000,000 | USD | 10/20/2013 | Deutsche Bank AG | Receive | 3.30 | % | 3.86 | % | Republic of Brazil | 130,000,000 | USD | (1,408,172 | ) | ||||||||||||||||||||||||||||||
| 45,000,000 | USD | 10/20/2013 | Goldman Sachs | (Pay) | 12.35 | % | 35.20 | % | Republic of Argentina | N/A | 16,466,430 | ||||||||||||||||||||||||||||||||
| 10,000,000 | USD | 12/24/2013 | JP Morgan Chase Bank | Receive | 3.80 | % | 4.92 | % | Republic of Turkey | 10,000,000 | USD | (378,440 | ) | ||||||||||||||||||||||||||||||
| 14,000,000 | USD | 3/20/2014 | Deutsche Bank AG | (Pay) | 2.80 | % | 2.50 | % | Hellenic Republic of Greece | N/A | (222,152 | ) | |||||||||||||||||||||||||||||||
| 14,000,000 | USD | 3/20/2014 | Deutsche Bank AG | (Pay) | 1.68 | % | 1.86 | % | Republic of Italy | N/A | 94,650 | ||||||||||||||||||||||||||||||||
| 39,000,000 | USD | 3/20/2014 | Deutsche Bank AG | (Pay) | 1.49 | % | 2.45 | % | Republic of Austria | N/A | 1,610,939 | ||||||||||||||||||||||||||||||||
| 28,000,000 | USD | 3/20/2014 | Deutsche Bank | (Pay) | 1.70 | % | 1.86 | % | Republic of Italy | N/A | 165,050 | ||||||||||||||||||||||||||||||||
| 14,000,000 | USD | 3/20/2014 | Deutsche Bank AG | (Pay) | 1.45 | % | 1.46 | % | United Kingdom Government | N/A | (14,376 | ) | |||||||||||||||||||||||||||||||
| 14,000,000 | USD | 3/20/2014 | Deutsche Bank AG | (Pay) | 1.85 | % | 1.86 | % | Republic of Italy | N/A | (19,063 | ) | |||||||||||||||||||||||||||||||
| 39,000,000 | USD | 3/20/2014 | Deutsche Bank AG | (Pay) | 2.39 | % | 2.50 | % | Hellenic Republic of Greece | N/A | 148,022 | ||||||||||||||||||||||||||||||||
| 39,000,000 | USD | 3/20/2014 | Deutsche Bank AG | (Pay) | 1.28 | % | 1.46 | % | United Kingdom Government | N/A | 289,993 | ||||||||||||||||||||||||||||||||
See accompanying notes to the financial statements.
26
GMO Emerging Country Debt Fund
(A Series of GMO Trust)
Schedule of Investments — (Continued)
February 28, 2009
Credit Default Swaps — continued
| Notional Amount | Expiration Date | Counterparty | Receive (Pay)u | Annual Premium | Implied Credit Spread (1) | Deliverable on Default | Maximum Potential Amount of Future Payments by the Fund Under the Contract (2) | Market Value | |||||||||||||||||||||||||||||||||||
| 10,000,000 | USD | 5/14/2014 | Deutsche | Receive | 6.64 | % | 4.90 | % | Republic of | 10,000,000 | USD | $ | 931,096 | ||||||||||||||||||||||||||||||
| Bank AG | Turkey | ||||||||||||||||||||||||||||||||||||||||||
| 5,000,000 | USD | 5/19/2014 | Deutsche Bank AG | Receive | 6.42 | % | 4.90 | % | Republic of Turkey | 5,000,000 | USD | 411,961 | |||||||||||||||||||||||||||||||
| 10,000,000 | USD | 6/16/2014 | Deutsche Bank AG | Receive | 6.22 | % | 4.90 | % | Republic of Turkey | 10,000,000 | USD | 694,625 | |||||||||||||||||||||||||||||||
| 2,000,000 | USD | 8/24/2014 | Deutsche Bank AG | (Pay) | 4.25 | % | 5.33 | % | Lebanese Republic | N/A | 88,302 | ||||||||||||||||||||||||||||||||
| 765,000,000 | USD | 3/20/2015 | Deutsche Bank AG | Receive | 3.80 | % | 24.06 | % | Bolivarian Republic of Venezuela | 765,000,000 | USD | (362,877,613 | ) | ||||||||||||||||||||||||||||||
| 575,500,000 | EUR | 3/20/2015 | Deutsche Bank AG | (Pay) | 3.72 | % | 23.92 | % | Venezuela Eurobond | N/A | 344,779,676 | ||||||||||||||||||||||||||||||||
| 300,000,000 | EUR | 4/20/2015 | Deutsche Bank AG | (Pay) | 4.32 | % | 23.89 | % | Bolivarian Republic of Venezuela | N/A | 174,931,402 | ||||||||||||||||||||||||||||||||
| 412,500,000 | USD | 4/20/2015 | Deutsche Bank AG | Receive | 4.40 | % | 24.03 | % | Bolivarian Republic of Venezuela | 412,500,000 | USD | (190,479,594 | ) | ||||||||||||||||||||||||||||||
| 56,950,000,000 | COP | 11/20/2015 | Citigroup | Receive | 1.81 | % | 3.26 | % | Republic of Colombia | 56,950,000,000 | COP | (1,355,491 | ) | ||||||||||||||||||||||||||||||
| 15,000,000 | USD | 2/20/2016 | Citigroup | (Pay) | 2.16 | % | 4.78 | % | Republic of Colombia | N/A | 2,080,700 | ||||||||||||||||||||||||||||||||
| 56,700,000,000 | COP | 2/20/2016 | Citigroup | Receive | 1.46 | % | 3.27 | % | Republic of Colombia | 56,700,000,000 | COP | (1,854,595 | ) | ||||||||||||||||||||||||||||||
| 114,800,000,000 | COP | 4/20/2016 | Citigroup | Receive | 1.33 | % | 3.28 | % | Republic of Colombia | 114,800,000,000 | COP | (3,885,937 | ) | ||||||||||||||||||||||||||||||
| 25,000,000 | USD | 4/20/2016 | Citigroup | (Pay) | 1.90 | % | 4.79 | % | Republic of Colombia | N/A | 3,715,640 | ||||||||||||||||||||||||||||||||
| 22,000,000 | EUR | 6/17/2016 | Deutsche Bank AG | Receive | 5.60 | % | 24.88 | % | Republic of Angola | 22,000,000 | EUR | (9,317,628 | ) | ||||||||||||||||||||||||||||||
| 20,000,000 | USD | 8/20/2016 | Deutsche Bank AG | (Pay) | 0.87 | % | 4.55 | % | United Mexican States | N/A | 4,108,927 | ||||||||||||||||||||||||||||||||
See accompanying notes to the financial statements.
27
GMO Emerging Country Debt Fund
(A Series of GMO Trust)
Schedule of Investments — (Continued)
February 28, 2009
Credit Default Swaps — continued
| Notional Amount | Expiration Date | Counterparty | Receive (Pay)u | Annual Premium | Implied Credit Spread (1) | Deliverable on Default | Maximum Potential Amount of Future Payments by the Fund Under the Contract (2) | Market Value | |||||||||||||||||||||||||||||||||||
| 22,000,000 | USD | 8/20/2016 | JP Morgan | Receive | 1.99 | % | 4.05 | % | Republic of | 22,000,000 | USD | $ | (2,598,849 | ) | |||||||||||||||||||||||||||||
| Chase Bank | Brazil | ||||||||||||||||||||||||||||||||||||||||||
| 20,000,000 | USD | 8/20/2016 | Citigroup | (Pay) | 2.15 | % | 4.79 | % | Republic of Colombia | N/A | 2,922,534 | ||||||||||||||||||||||||||||||||
| 97,680,000,000 | COP | 8/20/2016 | Citigroup | Receive | 1.51 | % | 3.28 | % | Republic of Colombia | 97,680,000,000 | COP | (3,254,935 | ) | ||||||||||||||||||||||||||||||
| 620,000,000 | MXN | 8/20/2016 | Deutsche Bank AG | Receive | 0.61 | % | 2.85 | % | United Mexican States | 620,000,000 | MXN | (4,462,119 | ) | ||||||||||||||||||||||||||||||
| 87,500,000 | USD | 2/20/2017 | Deutsche Bank AG | Receive | 2.43 | % | 23.38 | % | Bolivarian Republic of Venezuela | 87,500,000 | USD | (47,482,778 | ) | ||||||||||||||||||||||||||||||
| 32,000,000 | PEN | 5/20/2017 | Deutsche Bank AG | Receive | 0.79 | % | 3.86 | % | Republic of Peru | 32,000,000 | PEN | (1,658,401 | ) | ||||||||||||||||||||||||||||||
| 2,500,000 | USD | 5/20/2017 | Deutsche Bank AG | (Pay) | 1.05 | % | 4.53 | % | Republic of Peru | N/A | 485,122 | ||||||||||||||||||||||||||||||||
| 35,000,000 | USD | 7/20/2017 | UBS AG | Receive | 2.26 | % | 4.82 | % | Republic of Turkey | 35,000,000 | USD | (5,274,836 | ) | ||||||||||||||||||||||||||||||
| 4,500,000 | USD | 7/20/2017 | JP Morgan Chase Bank | Receive | 3.30 | % | 10.15 | % | Republic of Jamaica | 4,500,000 | USD | (1,383,661 | ) | ||||||||||||||||||||||||||||||
| 8,000,000 | USD | 8/20/2017 | JP Morgan Chase Bank | Receive | 2.20 | % | 4.81 | % | Republic of Colombia | 8,000,000 | USD | (1,253,961 | ) | ||||||||||||||||||||||||||||||
| 17,000,000 | USD | 9/20/2017 | JP Morgan Chase Bank | Receive | 1.74 | % | 4.48 | % | Republic of Philippines | 17,000,000 | USD | (2,786,872 | ) | ||||||||||||||||||||||||||||||
| 30,000,000 | USD | 9/20/2017 | JP Morgan Chase Bank | Receive | 1.77 | % | 4.48 | % | Republic of Philippines | 30,000,000 | USD | (4,870,789 | ) | ||||||||||||||||||||||||||||||
| 21,000,000 | USD | 10/20/2017 | Deutsche Bank AG | Receive | 1.78 | % | 10.96 | % | Vneshtorg Bank Bond & Loan | 21,000,000 | USD | (8,573,117 | ) | ||||||||||||||||||||||||||||||
| 4,000,000 | USD | 11/20/2017 | JP Morgan Chase Bank | Receive | 4.85 | % | 23.09 | % | Bolivarian Republic of Venezuela | 4,000,000 | USD | (1,875,078 | ) | ||||||||||||||||||||||||||||||
| 4,000,000 | USD | 11/20/2017 | JP Morgan Chase Bank | Receive | 4.90 | % | 23.09 | % | Bolivarian Republic of Venezuela | 4,000,000 | USD | (1,869,242 | ) | ||||||||||||||||||||||||||||||
See accompanying notes to the financial statements.
28
GMO Emerging Country Debt Fund
(A Series of GMO Trust)
Schedule of Investments — (Continued)
February 28, 2009
Credit Default Swaps — continued
| Notional Amount | Expiration Date | Counterparty | Receive (Pay)u | Annual Premium | Implied Credit Spread (1) | Deliverable on Default | Maximum Potential Amount of Future Payments by the Fund Under the Contract (2) | Market Value | |||||||||||||||||||||||||||||||||||
| 25,000,000 | USD | 1/20/2018 | Deutsche | Receive | 1.50 | % | 4.11 | % | Republic of | 25,000,000 | USD | $ | (4,152,643 | ) | |||||||||||||||||||||||||||||
| Bank AG | Brazil | ||||||||||||||||||||||||||||||||||||||||||
| 45,000,000 | USD | 10/20/2018 | Goldman Sachs | Receive | 12.20 | % | 32.90 | % | Republic of Argentina | 45,000,000 | USD | (18,437,975 | ) | ||||||||||||||||||||||||||||||
| 10,000,000 | USD | 12/20/2018 | Deutsche Bank AG | Receive | 0.44 | % | 1.46 | % | United Kingdom Government | 10,000,000 | USD | (780,608 | ) | ||||||||||||||||||||||||||||||
| 10,000,000 | USD | 3/20/2019 | Deutsche Bank AG | Receive | 2.61 | % | 2.40 | % | Hellenic Republic of Greece | 10,000,000 | USD | 179,157 | |||||||||||||||||||||||||||||||
| 10,000,000 | USD | 3/20/2019 | Deutsche Bank AG | Receive | 1.35 | % | 1.46 | % | United Kingdom Government | 10,000,000 | USD | (73,112 | ) | ||||||||||||||||||||||||||||||
| 10,000,000 | USD | 3/20/2019 | Deutsche Bank AG | Receive | 1.70 | % | 1.81 | % | Republic of Italy | 10,000,000 | USD | (68,102 | ) | ||||||||||||||||||||||||||||||
| 10,000,000 | USD | 3/20/2019 | Deutsche Bank AG | Receive | 1.62 | % | 1.81 | % | Republic of Italy | 10,000,000 | USD | (133,396 | ) | ||||||||||||||||||||||||||||||
| 30,000,000 | USD | 3/20/2019 | Deutsche Bank AG | Receive | 1.46 | % | 2.35 | % | Republic of Austria | 30,000,000 | USD | (1,946,302 | ) | ||||||||||||||||||||||||||||||
| 20,000,000 | USD | 3/20/2019 | Deutsche Bank | Receive | 1.66 | % | 1.81 | % | Republic of Italy | 20,000,000 | USD | (205,724 | ) | ||||||||||||||||||||||||||||||
| 30,000,000 | USD | 3/20/2019 | Deutsche Bank AG | Receive | 2.25 | % | 2.40 | % | Hellenic Republic of Greece | 30,000,000 | USD | (303,408 | ) | ||||||||||||||||||||||||||||||
| 30,000,000 | USD | 3/20/2019 | Deutsche Bank AG | Receive | 1.25 | % | 1.46 | % | United Kingdom Government | 30,000,000 | USD | (474,326 | ) | ||||||||||||||||||||||||||||||
| 30,000,000 | USD | 8/15/2031 | Goldman Sachs | (Pay) | 1.84 | % | 4.78 | % | United Mexican States | N/A | 8,208,504 | ||||||||||||||||||||||||||||||||
| $ | (67,912,724 | ) | |||||||||||||||||||||||||||||||||||||||||
| Premiums to (Pay) Receive | $ | (341,102 | ) | ||||||||||||||||||||||||||||||||||||||||
See accompanying notes to the financial statements.
29
GMO Emerging Country Debt Fund
(A Series of GMO Trust)
Schedule of Investments — (Continued)
February 28, 2009
u Receive - Fund receives premium and sells credit protection.
(Pay) - Fund pays premium and buys credit protection.
(1) Implied credit spreads, represented in absolute terms, utilized in determining the market value of credit default swap agreements on the reference security, as of February 28, 2009, serve as an indicator of the current status of the payment/performance risk and reflect the likelihood or risk of default for the credit derivative. The implied credit spread of a particular referenced entity reflects the cost of buying/selling protection and may include upfront payments required to be made to enter into the agreement. Wider credit spreads represent a deterioration of the referenced entity's credit soundness and a greater likelihood or risk of default or other credit event occurring as defined under the terms of the agreement.
(2) The maximum potential amount the Fund could be required to make as a seller of credit protection if a credit event occurs as defined under the terms of that particular swap agreement.
Interest Rate Swaps
| Notional Amount | Expiration Date | Counterparty | Receive (Pay)# | Fixed Rate | Variable Rate | Market Value | |||||||||||||||||||||||||
| 20,000,000 | USD | 1/4/2010 | JP Morgan Chase Bank | (Pay) | 5.11 | % | 6 month LIBOR | $ | (587,080 | ) | |||||||||||||||||||||
| 20,000,000 | USD | 1/4/2010 | JP Morgan Chase Bank | Receive | 5.62 | % | 6 month LIBOR | 2,484,145 | |||||||||||||||||||||||
| 2,644,898 | USD | 12/1/2011 | Citigroup | (Pay) | 6.32 | % | 6 month LIBOR | (298,353 | ) | ||||||||||||||||||||||
| 75,000,000 | USD | 12/17/2018 | Bank of America | Receive | 2.75 | % | 3 month LIBOR | (3,766,973 | ) | ||||||||||||||||||||||
| 244,800,000 | PEN | 4/21/2014 | JP Morgan Chase Bank | Receive | 5.03 | % | 6 month LIBOR | (16,376,845 | ) | ||||||||||||||||||||||
| 244,800,000 | PEN | 4/21/2009 | JP Morgan Chase Bank | (Pay) | 0.81 | % | 6 month LIBOR | 16,973,675 | |||||||||||||||||||||||
| 80,000,000 | PEN | 2/19/2010 | JP Morgan Chase Bank | (Pay) | 3.15 | % | 6 month LIBOR | 3,649,012 | |||||||||||||||||||||||
| 90,000,000,000 | KRW | 5/29/2010 | Bank of America | (Pay) | 4.79 | % | 3 month KRW LIBOR | (1,463,390 | ) | ||||||||||||||||||||||
| 51,000,000 | BRL | 1/2/2013 | JP Morgan Chase Bank | Receive | 13.80 | % | Floating Rate CDI | 548,396 | |||||||||||||||||||||||
| $ | 1,162,587 | ||||||||||||||||||||||||||||||
| Premiums to (Pay) Receive | $ | (718,303 | ) | ||||||||||||||||||||||||||||
# Receive - Fund receives fixed rate and pays variable rate.
(Pay) - Fund pays fixed rate and receives variable rate.
See accompanying notes to the financial statements.
30
GMO Emerging Country Debt Fund
(A Series of GMO Trust)
Schedule of Investments — (Continued)
February 28, 2009
Total Return Swaps
| Notional Amount | Expiration Date | Counterparty | Pay | Receive | Market Value | ||||||||||||||||||||||
| 100,000,000 | USD | 4/10/2009 | JP Morgan | 3 month | EMBI + Total Return | $ | (12,729,201 | ) | |||||||||||||||||||
| Chase Bank | LIBOR - 0.20% | ||||||||||||||||||||||||||
| 45,335,905 | USD | 12/19/2011 | JP Morgan Chase Bank | CER Index + 1.24% | 3 month LIBOR | 11,855,285 | |||||||||||||||||||||
| 27,967,218 | USD | 12/19/2011 | JP Morgan Chase Bank | 3 month LIBOR + 0.35% | Return on Prestamos Garatizados | (15,689,191 | ) | ||||||||||||||||||||
| 27,967,218 | USD | 12/19/2011 | JP Morgan Chase Bank | CER Index + 3.59% | 3 month LIBOR | 6,370,002 | |||||||||||||||||||||
| 45,797,706 | USD | 12/19/2011 | JP Morgan Chase Bank | 3 month LIBOR + 0.35% | Return on Prestamos Garatizados | (27,759,793 | ) | ||||||||||||||||||||
| 300,000,000 | RUB | 3/26/2017 | Morgan Stanley | 6 month LIBOR + 0.25% | Return on Sukhoi | (4,746,463 | ) | ||||||||||||||||||||
| $ | (42,699,361 | ) | |||||||||||||||||||||||||
| Premiums to (Pay) Receive | $ | — | |||||||||||||||||||||||||
As of February 28, 2009, for the futures and/or swap contracts held, the Fund had sufficient cash and/or securities to cover any commitments or margin requirements of the relevant broker or exchange.
Notes to Schedule of Investments:
144A - Securities exempt from registration under Rule 144A of the Securities Act of 1933. These securities may be resold in transactions exempt from registration, normally to qualified institutional investors.
ACES - Aerolineas Centrales de Colombia
AMBAC - Insured as to the payment of principal and interest by AMBAC Assurance Corporation.
BPI - Indemnification payment bonds
CBO - Collateralized Bond Obligation
CDI - Certificado de Deposito Interbabcario
CER - Coeficiente de Estabilizacion de Referencia
DEM LIBOR - London Interbank Offered Rate denominated in Deutsche Marks
EMBI - Emerging Markets Bond Index
EMTN - Euromarket Medium Term Note
FGIC - Insured as to the payment of principal and interest by Financial Guaranty Insurance Corporation.
FLIRB - Front Loaded Interest Reduction Bond
GDP - Gross Domestic Product
GMTN - Global Medium Term Note
See accompanying notes to the financial statements.
31
GMO Emerging Country Debt Fund
(A Series of GMO Trust)
Schedule of Investments — (Continued)
February 28, 2009
JPY LIBOR - London Interbank Offered Rate denominated in Japanese Yen
KRW LIBOR - London Interbank Offered Rate denominated in South Korean Won
LIBOR - London Interbank Offered Rate
PDI - Past Due Interest
PIK - Payment In Kind
VRRB - Variable Rate Reduction Bond
XL - Insured as to the payment of principal and interest by XL Capital Assurance.
The rates shown on variable, step up and step down rate notes are the current interest rates at February 28, 2009, which are subject to change based on the terms of the security, including varying reset dates.
* Non-income producing security.
(a) Security valued at fair value using methods determined in good faith by or at the direction of the Trustees of GMO Trust (Note 2).
(b) Security is in default.
(c) In July 2005, the Fund entered into litigation against the Government of Argentina ("Argentina") relating to Argentina's failure to make payments on sovereign debt held by the Fund. That debt, which continues to be valued according to the Fund's valuation policy, represented 1.63% of the net assets of the Fund as of February 28, 2009. Judgments were awarded in the Fund's favor on September 24, 2007; however, the Fund's ability to collect on those judgments remains uncertain. Costs associated with this action are being borne by the Fund. (Note 2).
(d) Indexed security in which price and/or coupon is linked to the prices of a specific instrument or financial statistic (Note 2).
(e) All or a portion of this security has been segregated to cover collateral requirements on open swap contracts (Note 2).
(f) Non-performing. Borrower not currently paying interest.
(g) Past due maturity payment.
(h) Underlying investment represents interests in defaulted securities.
Currency Abbreviations:
| ARS - Argentine Peso BRL - Brazilian Dollar CHF - Swiss Franc COP - Colombian Peso DEM - Deutsche Mark EUR - Euro FIM - Finnish Markka FRF - French Franc GBP - British Pound JPY - Japanese Yen | KRW - South Korean Won KZT - Kazakhstan Tenge MXN - Mexican Peso MYR - Malaysian Ringgit PEN - Peruvian Sol RUB - Russian Ruble TWD - Taiwan Dollar USD - United States Dollar ZAR - South African Rand | ||||||
See accompanying notes to the financial statements.
32
GMO Emerging Country Debt Fund
(A Series of GMO Trust)
Statement of Assets and Liabilities — February 28, 2009
| Assets: | |||||||
| Investments in unaffiliated issuers, at value (cost $2,537,406,549) (Note 2) | $ | 1,733,592,089 | |||||
| Investments in affiliated issuers, at value (cost $124,904,720) (Notes 2 and 8) | 95,815,114 | ||||||
| Foreign currency, at value (cost $1,781,412) (Note 2) | 1,451,677 | ||||||
| Receivable for investments sold | 205,649 | ||||||
| Dividends and interest receivable | 31,332,760 | ||||||
| Unrealized appreciation on open forward currency contracts (Note 2) | 32,489,442 | ||||||
| Receivable for collateral on open futures contracts (Note 2) | 4,836,500 | ||||||
| Receivable for open swap contracts (Note 2) | 772,595,266 | ||||||
| Receivable for closed swap contracts (Note 2) | 6,720,000 | ||||||
| Receivable for collateral on open swap contracts (Note 2) | 82,267,000 | ||||||
| Total assets | 2,761,305,497 | ||||||
| Liabilities: | |||||||
| Payable for investments purchased | 30,253,086 | ||||||
| Payable for Fund shares repurchased | 102,041 | ||||||
| Payable to affiliate for (Note 3): | |||||||
| Management fee | 490,265 | ||||||
| Shareholder service fee | 154,988 | ||||||
| Trustees and Chief Compliance Officer of GMO Trust fees | 6,049 | ||||||
| Payable for variation margin on open futures contracts (Note 2) | 246 | ||||||
| Unrealized depreciation on open forward currency contracts (Note 2) | 279,195 | ||||||
| Interest payable for open swap contracts | 1,280,731 | ||||||
| Payable for open swap contracts (Note 2) | 882,044,764 | ||||||
| Payable for reverse repurchase agreements (Note 2) | 1,968,931 | ||||||
| Miscellaneous payable | 17,475,582 | ||||||
| Accrued expenses | 798,163 | ||||||
| Total liabilities | 934,854,041 | ||||||
| Net assets | $ | 1,826,451,456 | |||||
See accompanying notes to the financial statements.
33
GMO Emerging Country Debt Fund
(A Series of GMO Trust)
Statement of Assets and Liabilities — February 28, 2009 — (Continued)
| Net assets consist of: | |||||||
| Paid-in capital | $ | 2,868,866,689 | |||||
| Distributions in excess of net investment income | (24,595,647 | ) | |||||
| Accumulated net realized loss | (105,486,716 | ) | |||||
| Net unrealized depreciation | (912,332,870 | ) | |||||
| $ | 1,826,451,456 | ||||||
| Net assets attributable to: | |||||||
| Class III shares | $ | 535,193,509 | |||||
| Class IV shares | $ | 1,291,257,947 | |||||
| Shares outstanding: | |||||||
| Class III | 91,489,778 | ||||||
| Class IV | 220,877,215 | ||||||
| Net asset value per share: | |||||||
| Class III | $ | 5.85 | |||||
| Class IV | $ | 5.85 | |||||
See accompanying notes to the financial statements.
34
GMO Emerging Country Debt Fund
(A Series of GMO Trust)
Statement of Operations — Year Ended February 28, 2009
| Investment Income: | |||||||
| Interest | $ | 167,001,550 | |||||
| Dividends from affiliated issuers (Note 8) | 4,463,272 | ||||||
| Dividends | 945,207 | ||||||
| Total investment income | 172,410,029 | ||||||
| Expenses: | |||||||
| Management fee (Note 3) | 8,355,373 | ||||||
| Interest expense (Note 2) | 5,623,994 | ||||||
| Shareholder service fee – Class III (Note 3) | 847,858 | ||||||
| Shareholder service fee – Class IV (Note 3) | 1,822,011 | ||||||
| Custodian, fund accounting agent and transfer agent fees | 1,564,287 | ||||||
| Audit and tax fees | 146,887 | ||||||
| Legal fees | 212,267 | ||||||
| Trustees fees and related expenses (Note 3) | 85,029 | ||||||
| Registration fees | 14,080 | ||||||
| Miscellaneous | 29,515 | ||||||
| Total expenses | 18,701,301 | ||||||
| Expense reductions (Note 2) | (279 | ) | |||||
| Net expenses | 18,701,022 | ||||||
| Net investment income (loss) | 153,709,007 | ||||||
| Realized and unrealized gain (loss): | |||||||
| Net realized gain (loss) on: | |||||||
| Investments in unaffiliated issuers | (40,945,772 | ) | |||||
| Investments in affiliated issuers | (9,923,602 | ) | |||||
| Realized gains distributions from affiliated issuers (Note 8) | 48,484 | ||||||
| Closed futures contracts | (197,363 | ) | |||||
| Closed swap contracts | 14,220,658 | ||||||
| Written options | (13,738,332 | ) | |||||
| Foreign currency, forward contracts and foreign currency related transactions | 24,369,632 | ||||||
| Net realized gain (loss) | (26,166,295 | ) | |||||
| Change in net unrealized appreciation (depreciation) on: | |||||||
| Investments in unaffiliated issuers | (947,911,326 | ) | |||||
| Investments in affiliated issuers | (21,979,883 | ) | |||||
| Open futures contracts | (29,089 | ) | |||||
| Open swap contracts | (125,741,201 | ) | |||||
| Written options | 21,372,283 | ||||||
| Foreign currency, forward contracts and foreign currency related transactions | 47,425,544 | ||||||
| Net unrealized gain (loss) | (1,026,863,672 | ) | |||||
| Net realized and unrealized gain (loss) | (1,053,029,967 | ) | |||||
| Net increase (decrease) in net assets resulting from operations | $ | (899,320,960 | ) | ||||
See accompanying notes to the financial statements.
35
GMO Emerging Country Debt Fund
(A Series of GMO Trust)
Statement of Changes in Net Assets
| Year Ended February 28, 2009 | Year Ended February 29, 2008 | ||||||||||
| Increase (decrease) in net assets: | |||||||||||
| Operations: | |||||||||||
| Net investment income (loss) | $ | 153,709,007 | $ | 189,122,789 | |||||||
| Net realized gain (loss) | (26,166,295 | ) | 109,322,686 | ||||||||
| Change in net unrealized appreciation (depreciation) | (1,026,863,672 | ) | (151,247,533 | ) | |||||||
| Net increase (decrease) in net assets from operations | (899,320,960 | ) | 147,197,942 | ||||||||
| Distributions to shareholders from: | |||||||||||
| Net investment income | |||||||||||
| Class III | (44,778,489 | ) | (60,758,567 | ) | |||||||
| Class IV | (170,454,066 | ) | (147,592,816 | ) | |||||||
| Total distributions from net investment income | (215,232,555 | ) | (208,351,383 | ) | |||||||
| Net realized gains | |||||||||||
| Class III | (14,329,630 | ) | (37,184,110 | ) | |||||||
| Class IV | (44,349,438 | ) | (85,627,144 | ) | |||||||
| Total distributions from net realized gains | (58,679,068 | ) | (122,811,254 | ) | |||||||
| (273,911,623 | ) | (331,162,637 | ) | ||||||||
| Net share transactions (Note 7): | |||||||||||
| Class III | 74,710,846 | (87,026,767 | ) | ||||||||
| Class IV | 75,473,817 | 246,523,243 | |||||||||
| Increase (decrease) in net assets resulting from net share transactions | 150,184,663 | 159,496,476 | |||||||||
| Purchase premiums and redemption fees (Notes 2 and 7): | |||||||||||
| Class III | 95,851 | 614,140 | |||||||||
| Class IV | 301,304 | 127,854 | |||||||||
| Increase in net assets resulting from purchase premiums and redemption fees | 397,155 | 741,994 | |||||||||
| Total increase (decrease) in net assets resulting from net share transactions, purchase premiums and redemption fees | 150,581,818 | 160,238,470 | |||||||||
| Total increase (decrease) in net assets | (1,022,650,765 | ) | (23,726,225 | ) | |||||||
| Net assets: | |||||||||||
| Beginning of period | 2,849,102,221 | 2,872,828,446 | |||||||||
| End of period (including distributions in excess of net investment income of $24,595,647 and $38,763,889, respectively) | $ | 1,826,451,456 | $ | 2,849,102,221 | |||||||
See accompanying notes to the financial statements.
36
GMO Emerging Country Debt Fund
(A Series of GMO Trust)
Financial Highlights
(For a Class III share outstanding throughout each period)
| Year Ended February 28/29, | |||||||||||||||||||||||
| 2009 | 2008 | 2007 | 2006 | 2005 | |||||||||||||||||||
| Net asset value, beginning of period | $ | 10.06 | $ | 10.73 | $ | 11.30 | $ | 11.09 | $ | 10.51 | |||||||||||||
| Income (loss) from investment operations: | |||||||||||||||||||||||
| Net investment income (loss)† | 0.54 | 0.68 | 0.86 | 0.88 | 0.89 | ||||||||||||||||||
| Net realized and unrealized gain (loss) | (3.77 | ) | (0.13 | ) | 0.30 | 1.14 | 1.16 | ||||||||||||||||
| Total from investment operations | (3.23 | ) | 0.55 | 1.16 | 2.02 | 2.05 | |||||||||||||||||
| Less distributions to shareholders: | |||||||||||||||||||||||
| From net investment income | (0.77 | ) | (0.76 | ) | (0.94 | ) | (1.26 | ) | (1.18 | ) | |||||||||||||
| From net realized gains | (0.21 | ) | (0.46 | ) | (0.79 | ) | (0.55 | ) | (0.29 | ) | |||||||||||||
| Total distributions | (0.98 | ) | (1.22 | ) | (1.73 | ) | (1.81 | ) | (1.47 | ) | |||||||||||||
| Net asset value, end of period | $ | 5.85 | $ | 10.06 | $ | 10.73 | $ | 11.30 | $ | 11.09 | |||||||||||||
| Total Return(a) | (32.75 | )% | 5.07 | % | 10.98 | % | 19.50 | % | 20.58 | % | |||||||||||||
| Ratios/Supplemental Data: | |||||||||||||||||||||||
| Net assets, end of period (000's) | $ | 535,194 | $ | 734,921 | $ | 876,598 | $ | 1,020,976 | $ | 1,088,609 | |||||||||||||
| Net operating expenses to average daily net assets(b) | 0.59 | %(c) | 0.57 | %(c) | 0.57 | % | 0.57 | % | 0.57 | % | |||||||||||||
| Interest expense to average daily net assets(d) | 0.23 | % | 0.74 | % | 0.48 | % | 0.22 | % | 0.08 | % | |||||||||||||
| Total net expenses to average daily net assets | 0.82 | %(c) | 1.31 | %(c) | 1.05 | % | 0.79 | % | 0.65 | % | |||||||||||||
| Net investment income to average daily net assets | 6.36 | % | 6.36 | % | 7.91 | % | 7.75 | % | 8.22 | % | |||||||||||||
| Portfolio turnover rate | 38 | % | 53 | % | 83 | % | 144 | % | 121 | % | |||||||||||||
| Purchase premiums and redemption fees consisted of the following per share amounts:† | $ | 0.00 | (e) | $ | 0.01 | $ | 0.01 | $ | 0.01 | $ | 0.01 | ||||||||||||
(a) Calculation excludes purchase premiums and redemption fees which are borne by the shareholder and assumes the effect of reinvested distributions.
(b) Net expenses exclude expenses incurred indirectly through investment in the underlying funds (See Note 3).
(c) The net expense ratio does not include the effect of expense reductions.
(d) Interest expense incurred as a result of entering into reverse repurchase agreements is included in the Fund's net expenses. Income earned on investing proceeds from reverse repurchase agreements is included in interest income.
(e) Purchase premiums and redemption fees were less than $0.01 per share.
† Calculated using average shares outstanding throughout the period.
See accompanying notes to the financial statements.
37
GMO Emerging Country Debt Fund
(A Series of GMO Trust)
Financial Highlights
(For a Class IV share outstanding throughout each period)
| Year Ended February 28/29, | |||||||||||||||||||||||
| 2009 | 2008 | 2007 | 2006 | 2005 | |||||||||||||||||||
| Net asset value, beginning of period | $ | 10.06 | $ | 10.73 | $ | 11.30 | $ | 11.09 | $ | 10.51 | |||||||||||||
| Income (loss) from investment operations: | |||||||||||||||||||||||
| Net investment income (loss)† | 0.53 | 0.69 | 0.87 | 0.88 | 0.90 | ||||||||||||||||||
| Net realized and unrealized gain (loss) | (3.76 | ) | (0.13 | ) | 0.29 | 1.15 | 1.16 | ||||||||||||||||
| Total from investment operations | (3.23 | ) | 0.56 | 1.16 | 2.03 | 2.06 | |||||||||||||||||
| Less distributions to shareholders: | |||||||||||||||||||||||
| From net investment income | (0.77 | ) | (0.77 | ) | (0.94 | ) | (1.27 | ) | (1.19 | ) | |||||||||||||
| From net realized gains | (0.21 | ) | (0.46 | ) | (0.79 | ) | (0.55 | ) | (0.29 | ) | |||||||||||||
| Total distributions | (0.98 | ) | (1.23 | ) | (1.73 | ) | (1.82 | ) | (1.48 | ) | |||||||||||||
| Net asset value, end of period | $ | 5.85 | $ | 10.06 | $ | 10.73 | $ | 11.30 | $ | 11.09 | |||||||||||||
| Total Return(a) | (32.66 | )% | 5.13 | % | 11.06 | % | 19.57 | % | 20.64 | % | |||||||||||||
| Ratios/Supplemental Data: | |||||||||||||||||||||||
| Net assets, end of period (000's) | $ | 1,291,258 | $ | 2,114,181 | $ | 1,996,230 | $ | 1,799,792 | $ | 1,550,402 | |||||||||||||
| Net operating expenses to average daily net assets(b) | 0.54 | %(c) | 0.53 | %(c) | 0.52 | % | 0.52 | % | 0.52 | % | |||||||||||||
| Interest expense to average daily net assets(d) | 0.23 | % | 0.74 | % | 0.48 | % | 0.22 | % | 0.08 | % | |||||||||||||
| Total net expenses to average daily net assets | 0.77 | %(c) | 1.27 | %(c) | 1.00 | % | 0.74 | % | 0.60 | % | |||||||||||||
| Net investment income to average daily net assets | 6.46 | % | 6.45 | % | 7.97 | % | 7.75 | % | 8.29 | % | |||||||||||||
| Portfolio turnover rate | 38 | % | 53 | % | 83 | % | 144 | % | 121 | % | |||||||||||||
| Purchase premiums and redemption fees consisted of the following per share amounts:† | $ | 0.00 | (e) | $ | 0.00 | (e) | $ | 0.01 | $ | 0.00 | (e) | $ | 0.01 | ||||||||||
(a) Calculation excludes purchase premiums and redemption fees which are borne by the shareholder and assumes the effect of reinvested distributions.
(b) Net expenses exclude expenses incurred indirectly through investment in the underlying funds (See Note 3).
(c) The net expense ratio does not include the effect of expense reductions.
(d) Interest expense incurred as a result of entering into reverse repurchase agreements is included in the Fund's net expenses. Income earned on investing proceeds from reverse repurchase agreements is included in interest income.
(e) Purchase premiums and redemption fees were less than $0.01 per share.
† Calculated using average shares outstanding throughout the period.
See accompanying notes to the financial statements.
38
GMO Emerging Country Debt Fund
(A Series of GMO Trust)
Notes to Financial Statements
February 28, 2009
1. Organization
GMO Emerging Country Debt Fund (the "Fund") is a series of GMO Trust (the "Trust"). The Fund is registered under the Investment Company Act of 1940, as amended, as an open-end, non-diversified management investment company. The Fund is advised and managed by Grantham, Mayo, Van Otterloo & Co. LLC (the "Manager" or "GMO"). The Trust was established as a Massachusetts business trust under the laws of The Commonwealth of Massachusetts on June 24, 1985. The Declaration of Trust permits the Trustees of the Trust ("Trustees") to create an unlimited number of series of shares ("Funds") and to subdivide Funds into classes.
The Fund seeks total return in excess of that of its benchmark, the JPMorgan Emerging Markets Bond Index Global (EMBIG). The Fund invests primarily in sovereign debt of emerging countries, although it may also make investments in entities related to, but not guaranteed by emerging countries, or in entities wholly unrelated to emerging countries. Such investments may be either direct or indirect. Direct investments involve the purchase of a debt instrument. Indirect investments typically involve the pairing of a derivative instrument with a high-quality cash investment to create an economic exposure similar to that of a direct investment. The Fund typically uses credit default swaps in this instance to gain the desired risk exposure, although the Fund may also purchase credit default swaps as a form of insurance against adverse credit events. Further, the related cash investment may include domestic or foreign fixed income securi ties, including asset-backed securities issued by governments and private issuers, directly or indirectly through the purchase of shares of the GMO Short Duration Collateral Fund. The Fund may invest a substantial portion of its assets in below investment grade securities (also known as "junk bonds"). The Fund's investment program is subject to many risks, including market risk, foreign investment risk, credit and counterparty risk, derivatives risk, leveraging risk, liquidity risk, and high yield risk.
Throughout the year ended February 28, 2009, the Fund had two classes of shares outstanding: Class III and Class IV. Each class of shares bears a different level of shareholder service fees.
The financial statements of the series of the Trust in which the Fund invests ("underlying funds") should be read in conjunction with the Fund's financial statements. These financial statements are available, without charge, upon request, by calling (617) 346-7646 (collect). Shares of GMO Short-Duration Collateral Fund, GMO Special Purpose Holding Fund and GMO World Opportunity Overlay Fund are not publicly available for direct purchase.
The Fund directly and indirectly (through underlying funds) invests in securities with contractual cash flows, such as collateralized mortgage obligations and commercial mortgage-backed securities, including securities backed by sub-prime mortgage loans, credit card receivables and auto loan receivables. The value, liquidity and related income of these securities are sensitive to changes in economic conditions, including real estate values, delinquencies and/or defaults, and may be adversely affected by changes in interest rates and shifts in the market's perception of the securities' market values.
39
GMO Emerging Country Debt Fund
(A Series of GMO Trust)
Notes to Financial Statements — (Continued)
February 28, 2009
The Fund will, if deemed prudent by the Manager, take temporary defensive measures (until the Manager has determined that normal conditions have returned or that it is otherwise prudent to resume investing in accordance with the Fund's normal investment strategies) and may not achieve its investment objectives during those periods. Recent changes in the credit markets have reduced the liquidity of all types of fixed income securities, including asset-backed securities.
The Fund currently limits subscriptions due to capacity considerations.
2. Significant accounting policies
The following is a summary of significant accounting policies followed by the Fund in the preparation of its financial statements. These policies are in conformity with accounting principles generally accepted in the United States of America ("U.S. GAAP") and have been consistently followed by the Fund in preparing its financial statements. The preparation of financial statements in accordance with U.S. GAAP requires management to make estimates and assumptions that affect the reported amounts and disclosures in the financial statements. Actual results could differ from those estimates. The accounting records of the Fund are maintained in U.S. dollars.
Portfolio valuation
Securities listed on a securities exchange for which market quotations are readily available are valued at the last sale price or official closing price on each business day, or if there is no such reported sale or official closing price, at the most recent quoted bid price. Unlisted securities for which market quotations are readily available are generally valued at the most recent quoted bid price. Debt instruments with a remaining maturity of sixty days or less are generally valued at amortized cost, which approximates fair value. Shares of investment funds are generally valued at their net asset value. Securities for which quotations are not readily available or whose values the Manager has determined to be unreliable are valued at fair value as determined in good faith by the Trustees or persons acting at their direction pursuant to procedures approved by the Trustees. By its nature, a fair value price is a good faith estim ate of the value of a security at a given point in time and may not reflect the value that would be realized if the security were sold. The difference between a fair value price and the value realized upon a sale could be material. For information about the pricing of some specific positions (e.g. swaps) see relevant descriptions below.
Typically the Fund and the underlying funds value debt instruments based on prices supplied by a primary pricing source chosen by the Manager. The Manager evaluates primary pricing sources on an ongoing basis and may change a pricing source should the Manager deem it appropriate. If it deems appropriate, the Manager, at its discretion, may override a price supplied by a primary source by using a price provided by another source. The prices provided by primary pricing sources may differ from the value that would be realized if the securities were sold, and the differences could be material.
Certain securities held by the Fund and underlying funds are valued on the basis of prices provided by a single source. As of February 28, 2009, the total value of these securities represented 32.38% of the net
40
GMO Emerging Country Debt Fund
(A Series of GMO Trust)
Notes to Financial Statements — (Continued)
February 28, 2009
assets. The single source prices provided may differ from the value that would be realized if the securities were sold, and the differences could be material. In addition, although alternative prices are available for other securities held by the Fund, those alternative sources would not necessarily confirm the security price used by the Fund. Therefore, the existence of those alternative sources does not necessarily provide greater certainty about the prices used by the Fund.
GMO Special Purpose Holding Fund ("SPHF"), an investment of the Fund, has litigation pending against various entities related to the default of certain asset-backed securities previously held by SPHF. The outcome of the lawsuits against the remaining defendants is not known and any potential recoveries are not reflected in the net asset value of SPHF. For the year ended February 28, 2009, the Fund received $48,484 through SPHF in connection with settlement agreements related to that litigation.
In September 2006, the Financial Accounting Standards Board ("FASB") issued Statement of Financial Accounting Standards No. 157, Fair Value Measurements ("SFAS 157"). SFAS 157 is effective for the Fund's current fiscal year. While the adoption of SFAS 157 does not have an effect on the Fund's net asset value, it does require additional disclosures about fair value measurements. SFAS 157 establishes a three-level hierarchy for disclosure of fair value measurements. The valuation hierarchy is based upon the reliability of inputs to the valuation of the Fund's investments. The three levels are defined as follows:
Level 1 – Valuations based on quoted prices for identical securities in active markets.
Level 2 – Valuations determined using other significant direct or indirect observable inputs.
Level 3 – Valuations based on inputs that are unobservable and significant. The Fund utilized the following fair value techniques on Level 3 investments: The Fund valued certain debt securities using a specified spread above the country specific LIBOR rate. The Fund certain valued debt securities using bids received from primary pricing sources. The Fund valued certain debt securities using bids received from primary pricing sources adjusted by a specified discount for liquidity considerations. The Fund valued certain debt securities using comparable securities issued by the same country adjusted by a specified spread. The Fund also valued certain credit default swaps using industry standard models (or non-conventional models to the extent industry standard models are not appropriate) and inputs from pricing vendors.
The inputs or methodology used for valuing securities are not necessarily an indication of the risk associated with investing in those securities.
41
GMO Emerging Country Debt Fund
(A Series of GMO Trust)
Notes to Financial Statements — (Continued)
February 28, 2009
The following is a summary of the fair valuations according to inputs used as of February 28, 2009 in valuing the Fund's investments:
| Asset Valuation Inputs | Investments in Securities | Other Financial Instruments* | |||||||||
| Level 1 - Quoted Prices | $ | 29,339,844 | $ | — | |||||||
| Level 2 - Other Significant Observable Inputs | 279,763,606 | 53,660,525 | |||||||||
| Level 3 - Significant Unobservable Inputs | 1,520,303,753 | 751,424,183 | |||||||||
| Total | $ | 1,829,407,203 | $ | 805,084,708 | |||||||
* Other financial instruments include forward currency contracts and swap agreements.
| Liability Valuation Inputs | Investments in Securities | Other Financial Instruments** | |||||||||
| Level 1 - Quoted Prices | $ | — | $ | (29,089 | ) | ||||||
| Level 2 - Other Significant Observable Inputs | — | (68,007,293 | ) | ||||||||
| Level 3 - Significant Unobservable Inputs | — | (814,316,666 | ) | ||||||||
| Total | $ | — | $ | (882,353,048 | ) | ||||||
** Other financial instruments include forward currency contracts, futures contracts and swap agreements.
For the underlying fund's summary of valuation inputs please refer to the respective fund's portfolio valuation note.
The following is a reconciliation of investments in which significant unobservable inputs (Level 3) were used in determining value:
| Investments in Securities | Other Financial Instruments*** | ||||||||||
| Balance as of February 29, 2008 | $ | 139,080,487 | $ | (5,866,346 | ) | ||||||
| Accrued discounts/premiums | 26,672,999 | — | |||||||||
| Realized gain (loss) | (30,597,141 | ) | (1,670,319 | ) | |||||||
| Realized gain distributions received | 37,043 | — | |||||||||
| Realized gain distributions paid | (48,484 | ) | — | ||||||||
| Change in unrealized appreciation/depreciation | (840,521,996 | ) | (55,006,594 | ) | |||||||
| Net purchases (sales) | 26,744,986 | 1,670,319 | |||||||||
| Net transfers in and/or out of Level 3 | 2,198,935,859 | (2,019,543 | ) | ||||||||
| Balance as of February 28, 2009 | $ | 1,520,303,753 | $ | (62,892,483 | ) | ||||||
*** Other financial instruments include swap agreements.
42
GMO Emerging Country Debt Fund
(A Series of GMO Trust)
Notes to Financial Statements — (Continued)
February 28, 2009
Foreign currency translation
The market values of foreign securities, currency holdings and related assets and liabilities are translated to U.S. dollars based on the 4 p.m. New York time exchange rates each business day. Income and expenses denominated in foreign currencies are translated at the 4 p.m. New York time exchange rates on the business day the income and expenses are accrued or incurred. The Fund does not isolate realized and unrealized gains and losses attributable to changes in exchange rates from gains and losses that arise from changes in the market value of investments. Such fluctuations are included with net realized and unrealized gain or loss on investments. Net realized gains and losses on foreign currency transactions represent gains and losses on disposition of currencies and forward currency contracts, currency gains and losses realized between the trade and settlement dates on securities transactions, and the difference between the amount of investment income and foreign withholding taxes recorded on the Fund's accounting records and the U.S. dollar equivalent amounts actually received or paid.
Forward currency contracts
The Fund may enter into forward currency contracts including forward cross currency contracts. A forward currency contract is an agreement between two parties to buy and sell a currency at a set price on a future date. The market value of a forward currency contract fluctuates with changes in forward currency exchange rates. Forward currency contracts are marked to market daily using rates supplied by a quotation service and changes in value are recorded by the Fund as an unrealized gain or loss. Realized gains or losses equal to the difference between the value of the contract at the time it was opened and the value at the time it was closed are recorded upon delivery or receipt of the currency or, if a forward currency contract is offset by entering into another forward currency contract with the same broker, upon settlement of the net gain or loss. These contracts may involve market risk in excess of the unrealized gain or lo ss reflected in the Fund's Statement of Assets and Liabilities. They expose the Fund to the risk of unfavorable movements in currency values and the risk that the counterparty will be unable or unwilling to meet the terms of the contracts. Forward currency contracts outstanding at the end of the period are listed in the Fund's Schedule of Investments.
Futures contracts
The Fund may purchase and sell futures contracts. Upon entering into a futures contract, the Fund is required to deposit cash, U.S. government and agency obligations, or other liquid assets with the futures clearing broker in accordance with the initial margin requirements of the broker or exchange. In addition, the Fund maintains cash or securities in an amount that at least equals the net amount payable in the event the Fund must deliver the full amount of the contract. Futures contracts are marked to market daily and an appropriate payable or receivable for the change in value ("variation margin") is recorded by the Fund. The payable or receivable is settled on the following business day. Gains or losses are recognized but not considered realized until the contracts expire or are closed. Futures contracts involve, to varying degrees, risk of loss in excess of the variation margin disclosed in the Statement of Assets and Liabi lities. Under some circumstances, futures exchanges may establish daily limits on the amount that the price of a futures contract can vary from the previous day's settlement price, thereby effectively preventing liquidation of unfavorable positions. Losses may arise from changes in the value of the underlying instrument if the
43
GMO Emerging Country Debt Fund
(A Series of GMO Trust)
Notes to Financial Statements — (Continued)
February 28, 2009
Fund is unable to liquidate a futures position due to an illiquid secondary market for the contract or the imposition of price limits, or if counterparties do not perform under the contract terms. Futures contracts are generally valued at the settlement price established each day by the board of trade or exchange on which they are traded. Futures contracts outstanding at the end of the period are listed in the Fund's Schedule of Investments.
Options
The Fund may write (i.e., sell) call and put options. Writing options alters the Fund's exposure to the underlying instrument by, in the case of a call option, obligating the Fund to sell the underlying instrument at a set price to the option-holder and, in the case of a put option, obligating the Fund to purchase the underlying instrument at a set price from the option-holder. In the case of an index option, settlement will be in cash. When the Fund writes a call or put option, an amount equal to the premium received is recorded as a liability and subsequently marked to market to reflect the current value of the option written. Premiums received from writing options that expire are treated as realized gains. Premiums received from writing options that are exercised or closed are deducted from the amounts paid on the underlying future, security or currency transaction to determine the realized gain or loss. The Fund as a writer of an option has no control over whether the underlying future, security or currency may be sold (call) or purchased (put) and as a result bears the market risk of an unfavorable change in the price of the future, security or currency underlying the option. In the event that the Fund writes uncovered put or call options (i.e. options for investments that the Fund does not own), it bears the risk of substantial losses if the price of the underlying instrument increases (calls) or decreases (puts) during the term of the option. Options expose the Fund to the risk the Fund may not be able to enter into a closing transaction because of an illiquid market. The Fund had no open written option contracts outstanding at the end of the period.
For the year ended February 28, 2009, the Fund's investment activity in options contracts written by the Fund was as follows:
| Puts | Calls | ||||||||||||||||||
| Principal Amount of Contracts | Premiums | Principal Amount of Contracts | Premiums | ||||||||||||||||
| Outstanding, beginning of year | $ | — | $ | — | $ | (115,000,000 | ) | $ | (2,060,625 | ) | |||||||||
| Options written | — | — | — | — | |||||||||||||||
| Options exercised | — | — | 70,000,000 | 1,470,000 | |||||||||||||||
| Options expired | — | — | 45,000,000 | 590,625 | |||||||||||||||
| Options sold | — | — | — | — | |||||||||||||||
| Outstanding, end of year | $ | — | $ | — | $ | — | $ | — | |||||||||||
44
GMO Emerging Country Debt Fund
(A Series of GMO Trust)
Notes to Financial Statements — (Continued)
February 28, 2009
The Fund may also purchase put and call options. Purchasing options alters the Fund's exposure to the underlying instrument by, in the case of a call option, entitling the Fund to purchase the underlying instrument at a set price from the writer of the option and, in the case of a put option, entitling the Fund to sell the underlying instrument at a set price to the writer of the option. The Fund pays a premium for a purchased option. That premium is disclosed in the Schedule of Investments and is subsequently marked to market to reflect the current value of the option. Premiums paid for purchasing options that expire are treated as realized losses. Premiums paid for purchasing options that are exercised or closed are deducted from the proceeds on the closing transaction to determine the realized gain or loss. The risk associated with purchasing put and call options is limited to the premium paid. Options contracts purchased by the Fund and outstanding at the end of the period are listed in the Fund's Schedule of Investments.
The Fund values exchange traded options at the last sale price, or if no sale is reported, the last bid price for options it has purchased and the last ask price for options it has written. The Fund values options traded over-the-counter using inputs provided by primary pricing sources and industry standard models.
Loan agreements
The Fund may invest in loans to corporate, governmental, or other borrowers. The Fund's investments in loans may be in the form of participations in loans or assignments of all or a portion of loans from third parties. A loan is often administered by a bank or other financial institution (the "lender") that acts as agent for all holders. The agent administers the terms of the loan, as specified in the loan agreement. When investing in a loan participation, (i) the Fund has the right to receive payments of principal, interest and any fees to which it is entitled only from the lender selling the participation in the loan agreement and only upon receipt by the lender of payments from the borrower and (ii) the Fund generally has no right to enforce compliance by the borrower with the terms of the loan agreement. As a result, the Fund may be subject to the credit risk of both the borrower and the lender that has sold the participatio n in the loan agreement. When the Fund purchases assignments from lenders, it acquires direct rights against the borrower on the loan. Loan agreements outstanding at the end of the period are listed in the Fund's Schedule of Investments.
Indexed securities
The Fund may invest in indexed securities. Indexed securities are securities whose redemption values and/or coupons are linked to the prices of a specific instrument or financial statistic. The Fund uses indexed securities to increase or decrease its exposure to different underlying instruments and to gain exposure to markets in which investing through conventional securities is difficult. Indexed securities held by the Fund at the end of the period are listed in the Fund's Schedule of Investments.
Swap agreements
The Fund may enter into various types of swap agreements, including without limitation, interest rate, total return, credit default and variance swap agreements. A swap agreement is an agreement to exchange the return generated by one instrument for the return generated by another instrument. When entering into a swap agreement, the Fund and/or the swap counterparty may post or receive cash or securities as
45
GMO Emerging Country Debt Fund
(A Series of GMO Trust)
Notes to Financial Statements — (Continued)
February 28, 2009
collateral. The party posting the collateral typically receives the interest associated with or payments related to the collateral and has the risk of loss related to the collateral.
Interest rate swap agreements involve an exchange by the parties of their respective commitments to pay or right to receive interest, e.g., an exchange of floating rate interest payments for fixed rate interest payments with respect to the notional amount of principal.
Total return swap agreements involve a commitment by one party to pay interest to the other party in exchange for a payment to it from the other party based on the return of a reference instrument (e.g., a security or basket of securities), both based on notional amounts. To the extent the return of the reference instrument exceeds or falls short of the interest payments, one party will receive a payment from or make a payment to the other party.
In a credit default swap agreement, one party makes payments to another party in exchange for the right to receive a specified return if a credit event occurs with respect to a referenced entity or entities. Buying credit default protection reduces the buyer's exposure (or increases negative exposure) in the event of an issuer's default (e.g., it reduces risk where a party owns a security issued by or otherwise has exposure to the issuer). Selling credit default protection subjects the seller to exposure to an issuer's default or other credit events. A seller of credit default protection receives payments in return for its obligation to pay the principal amount of a debt security (or other agreed-upon value) to the other party upon the occurrence of a credit event (e.g., issuer default or similar event). If no credit event occurs, the seller has no payment obligations. For credit default swap agreements on asset-backed securitie s, a credit event may be triggered by such events as the issuer's failure to pay interest or principal, an agreement of the holders of an asset-backed security to a maturity extension, a rating downgrade on the security or a write-down on the collateral underlying the security. For credit default swap agreements on corporate or sovereign issuers, a credit event may be triggered by such events as the issuer's bankruptcy, failure to pay interest or principal, repudiation/moratorium or restructuring.
Variance swap agreements involve an agreement by two parties to exchange cash flows based on the measured variance (or square of volatility) of a specified underlying asset. One party agrees to exchange a "fixed rate" or strike price payment for the "floating rate" or realized price variance on the underlying asset with respect to the notional amount. At inception, the strike price chosen is generally fixed at a level such that the fair value of the swap is zero. At the expiration date, the amount paid by one party to the other is the difference between the realized price variance of the underlying asset and the strike price multiplied by the notional amount. A receiver of the realized price variance would receive a payment when the realized price variance of the underlying asset is greater than the strike price and would make a payment when that variance is less than the strike price. A payer of the realized price variance woul d make a payment when the realized price variance of the underlying asset is greater than the strike price and would receive a payment when that variance is less than the strike price. This type of agreement is essentially a forward contract on the future realized price variance of the underlying asset.
46
GMO Emerging Country Debt Fund
(A Series of GMO Trust)
Notes to Financial Statements — (Continued)
February 28, 2009
The Fund prices its swap agreements daily using models that may incorporate quotations from market makers and records the change in value, if any, as unrealized gain or loss in the Statement of Operations. Payments received or made on swap agreements are recorded as realized gain or loss in the Statement of Operations. Gains or losses are realized upon termination of the swap agreements.
Swap agreements often are not actively traded on financial markets. The values assigned to them may differ significantly from the values that would be realized upon termination, and the differences could be material. Entering into swap agreements involves credit, legal, market and documentation risk that is not reflected in the amounts reported in the Statement of Assets and Liabilities. Such risks include the possibility that the party with whom the Fund contracts may default on its obligations to perform or disagree as to the meaning of contractual terms, or that the collateral that party posts may be insufficient or not timely received by the Fund. Credit risk may be particularly acute in an environment where financial services firms are exposed to systemic risks of the type evidenced by the insolvency of Lehman Brothers and subsequent market disruptions. Swap agreements outstanding at the end of the period are listed in the Fund's Schedule of Investments.
Repurchase agreements
The Fund may enter into repurchase agreements. Under a repurchase agreement the Fund acquires a security for cash and obtains a simultaneous commitment from the seller to repurchase the security at an agreed upon price and date. The Fund, through its custodian, takes possession of securities collateralizing the repurchase agreement. The collateral is marked to market daily to ensure that the market value of the underlying assets is at least equal to the amount owed to the Fund in the event of default by the seller. If the seller of a repurchase agreement defaults or enters into insolvency proceedings and the value of the collateral declines, the Fund's recovery of cash may be delayed or limited. The Fund had no repurchase agreements outstanding at the end of the period.
Reverse repurchase agreements
The Fund may enter into reverse repurchase agreements. Under a reverse repurchase agreement the Fund sells portfolio assets subject to an agreement by the Fund to repurchase the same assets at a later date at a fixed price. In connection with these agreements, the Fund establishes segregated accounts with its custodian in which the Fund maintains assets equal in value to its obligations under the reverse repurchase agreement into which it has entered. Reverse repurchase agreements expose the Fund to the risk that the market value of the securities the Fund has sold under the agreement may decline below the price at which the Fund is obligated to repurchase them under the agreement. If the buyer in a reverse repurchase agreement files for bankruptcy or becomes insolvent, the Fund's use of proceeds from the sale of its securities may be restricted while the other party or its trustee or receiver determines whether to honor the Fun d's right to repurchase the securities. Furthermore, in that situation the Fund may be unable to recover the securities it sold and as a result would realize a loss equal to the difference between the value of the securities and the payment it received for them. This loss would be greater to the extent the buyer paid less than the value of the securities the Fund sold to it (e.g., a buyer may pay $95 for a bond with a market value of $100). The market value of the securities the Fund has sold is determined daily and any additional
47
GMO Emerging Country Debt Fund
(A Series of GMO Trust)
Notes to Financial Statements — (Continued)
February 28, 2009
required collateral is allocated to or sent by the Fund on the next business day. As of February 28, 2009, the Fund had entered into reverse repurchase agreements, plus accrued interest, amounting to $1,968,931, collateralized by securities with a market value, plus accrued interest, of $2,000,000. Reverse repurchase agreements outstanding at the end of the period are listed in the Fund's Schedule of Investments.
Securities lending
The Fund may lend its securities to qualified brokers. The loans are collateralized with cash or liquid securities with a market value at least equal to the market value of the securities upon entering into the loan. As with other extensions of credit, the Fund may bear the risk of loss with respect to the investment of the collateral, the risk of delay in and/or inability to exercise its rights with respect to the collateral, and the risk of delay in recovery or loss of rights in the loaned securities should the borrower of the securities fail financially. If a loan is collateralized by U.S. government securities, the Fund receives a fee from the borrower. If a loan is collateralized by cash, the Fund typically invests the cash collateral for its own account. For the year from March 1, 2008 through February 28, 2009, the Fund did not participate in securities lending.
Taxes and distributions
The Fund intends to qualify each tax year as a regulated investment company under Subchapter M of the Internal Revenue Code of 1986, as amended (the "Code"). The Fund intends to distribute substantially all of its net investment income and all of its net realized short-term and long-term capital gain, if any, after giving effect to any available capital loss carryforwards for U.S. federal income tax purposes. Therefore, no provision for U.S. federal income or excise tax is necessary.
The Fund's policy is to declare and pay distributions from net investment income, if any, semiannually, and from net realized short-term and long-term capital gain, if any, at least annually. All distributions are paid in shares of the Fund, at net asset value, unless the shareholder elects to receive cash distributions. Distributions to shareholders are recorded by the Fund on the ex-dividend date.
Income and capital gain distributions are determined in accordance with U.S. federal income tax regulations, which may differ from U.S. GAAP. Certain capital accounts in the financial statements are periodically adjusted for permanent differences in order to reflect their tax character. These adjustments have no impact on net assets or net asset value per share. Temporary differences that arise from recognizing certain items of income, expense, gain or loss in different periods for financial statement and tax purposes will reverse at some time in the future. Distributions in excess of net investment income or net realized gains are temporary over-distributions for financial statement purposes resulting from differences in the recognition or classification of income or distributions for financial statement and tax purposes.
U.S. GAAP and tax accounting differences primarily relate to capital loss carryforwards, derivative contract transactions, differing treatment for defaulted bonds, foreign currency transactions, partnership interest tax allocations, losses on wash sale transactions and amortization and accretion on debt securities.
48
GMO Emerging Country Debt Fund
(A Series of GMO Trust)
Notes to Financial Statements — (Continued)
February 28, 2009
The following reclassification represents the amount necessary to report the stated components of net assets on a tax basis, excluding certain temporary differences, as of February 28, 2009. The financial highlights exclude these adjustments.
| Distributions In Excess of Net Investment Income | Accumulated Net Realized Loss | Paid-in Capital | |||||||||
| $ | 75,691,790 | $ | (75,691,790 | ) | $ | — | |||||
The tax character of distributions declared to shareholders is as follows:
| 2/28/2009 | 2/29/2008 | ||||||||||
| Ordinary income (including any net short-term capital gain) | $ | 216,864,234 | $ | 209,641,890 | |||||||
| Net long-term capital gain | 57,047,389 | 121,520,747 | |||||||||
| Total distributions | $ | 273,911,623 | $ | 331,162,637 | |||||||
Distributions in excess of tax basis earnings and profits, if significant, are reported in the financial statements as a return of capital for tax purposes.
As of February 28, 2009, the components of distributable earnings on a tax basis consisted of the following:
| Undistributed ordinary income (including any net short-term capital gain) | $ | 34,073,989 | |||||
As of February 28, 2009, the Fund had capital loss carryforwards available to offset future realized gains if any, to the extent permitted by the Code. Utilization of the capital loss carryforwards could be subject to limitations imposed by the Code related to share ownership activity. Such losses expire as follows:
| 2/28/2017 | $ | (105,395,789 | ) | ||||
| Total | $ | (105,395,789 | ) | ||||
49
GMO Emerging Country Debt Fund
(A Series of GMO Trust)
Notes to Financial Statements — (Continued)
February 28, 2009
As of February 28, 2009, the approximate cost for U.S. federal income tax purposes and gross and net unrealized appreciation (depreciation) in value of investments were as follows:
| Aggregate Cost | Gross Unrealized Appreciation | Gross Unrealized (Depreciation) | Net Unrealized Appreciation (Depreciation) | ||||||||||||
| $ | 2,682,467,959 | $ | 45,779,590 | $ | (898,840,346 | ) | $ | (853,060,756 | ) | ||||||
The Fund is subject to the provisions of Financial Accounting Standards Board Interpretation No. 48 ("FIN 48"), Accounting for Uncertainty in Income Taxes — an Interpretation of FASB Statement No. 109. FIN 48 sets forth a minimum threshold for financial statement recognition of a tax position taken or expected to be taken in a tax return that could affect the Fund's financial statements. The Fund did not have any unrecognized tax benefits or liabilities at February 28, 2009, nor did it have any increases or decreases in unrecognized tax benefits or liabilities for the period then ended. The Fund is subject to examination prior to the expiration of the statute of limitations by U.S. federal and state tax authorities for tax returns filed.
Security transactions and related investment income
Security transactions in the financial statements are accounted for on the trade date. Dividend income, net of applicable foreign withholding taxes, if any, is recorded on the ex-dividend date or, if later, when the Fund is informed of the ex-dividend date. Interest income is recorded on the accrual basis and is adjusted for the amortization of premiums and accretion of discounts. Principal on inflation indexed securities, is adjusted for inflation and any increase or decrease is recorded as interest income or loss. Income is not recognized on securities for which collection is not expected. Non-cash dividends, if any, are recorded at the fair market value of the asset received. In determining the net gain or loss on securities sold, the Fund uses the identified cost basis for the purposes of determining the cost basis.
Expenses
The majority of the expenses of the Trust are directly identifiable to an individual fund. Expenses that are not readily identifiable to a specific fund are allocated taking into consideration, among other things, the nature and type of expense and the relative size of the funds. Investment income, common expenses and realized and unrealized gains and losses are allocated pro rata among the classes of shares of the Fund based on the relative net assets of each class. Shareholder service fees, which are directly attributable to a class of shares, are charged to that class's operations. In addition, the Fund incurs fees and expenses indirectly as a shareholder in the underlying funds. Because the underlying funds have different expense and fee levels and the Fund may own different proportions of the underlying funds at different times, the amount of fees and expenses indirectly incurred by the Fund will vary (See Note 3).
50
GMO Emerging Country Debt Fund
(A Series of GMO Trust)
Notes to Financial Statements — (Continued)
February 28, 2009
State Street Bank and Trust Company ("State Street") serves as custodian, fund accounting agent and transfer agent of the Fund. State Street's fees may be reduced by an earnings allowance calculated on the average daily cash balances the Fund maintains with State Street. The Fund receives the benefit of the earnings allowance. In addition, Goldman Sachs Agency Lending, the Fund's securities lending agent, has agreed to reimburse the Fund for certain transactional expenses related to securities lending activity. Credit balances or expense reimbursements used to reduce fees, if any, are reported as a reduction of expenses in the Statement of Operations.
Purchases and redemptions of Fund shares
As of August 31, 2008, the premium on cash purchases of Fund shares was 0.50% of the amount invested and the fee on cash redemptions was 0.25% of the amount redeemed. Effective October 8, 2008, the fee on cash redemptions was changed to 2.00% of the amount redeemed. As of February 28, 2009, the premium on cash purchases of Fund shares was 0.50% of the amount invested and the fee on cash redemptions was 2.00% of the amount redeemed. The Fund may impose a new purchase premium and/or redemption fee, or modify or eliminate an existing purchase premium and/or redemption fee, at any time. If the Manager determines that any portion of a cash purchase or redemption is offset by a corresponding cash redemption or purchase on the same day, the Fund will ordinarily waive or reduce the purchase premium or redemption fee with respect to that portion. In addition, the Fund may waive or reduce the purchase premium or redemption fee in extraord inary circumstances if the purchase or redemption will not cause the Fund to incur transaction costs. All purchase premiums and redemption fees are paid to the Fund and recorded by the Fund as paid-in-capital. These fees are allocated relative to each class's net assets on the share transaction date. The Fund will waive or reduce the purchase premium relating to the in-kind portion of a purchase transaction except for estimated or known transaction costs (e.g. stamp duties and transfer taxes) incurred by the Fund as a result of the transfer of the purchasing shareholder's securities to the Fund. In-kind redemption transactions are generally not subject to redemption fees except when they include a cash component. However, when a substantial portion of a Fund is being redeemed, the Fund may charge a redemption fee based on estimated or known transaction costs resulting from those redemptions. The Fund charges no premium for reinvested distributions.
The Fund expects to honor nearly all redemptions of its shares in-kind for the foreseeable future. If redeeming shareholders from the Fund choose to sell assets received in-kind immediately and current adverse market conditions continue, they may experience difficulty selling the assets at favorable prices. To the extent that the Fund honors redemptions in cash, redeeming shareholders will bear the redemption fees described above.
Investment risks
Investments in emerging country debt present risks that are not presented by many other securities. Many emerging countries are subject to political and/or economic instability, which may result in the Fund's inability to collect on a timely basis, or in full, principal and interest payments. Further, countries may expropriate or impose various types of foreign currency regulations or controls that impede the Fund's
51
GMO Emerging Country Debt Fund
(A Series of GMO Trust)
Notes to Financial Statements — (Continued)
February 28, 2009
ability to repatriate amounts it receives. The Fund may acquire interests in securities of some countries based on the Manager's expectations that conditions in those countries will improve. These factors may result in significant volatility in the values of its holdings. The markets for emerging country debt are typically less liquid than those of developed markets.
The Fund has exposure to many countries that subject it to a significant risk of default. Its largest exposures are in Philippines, Russia, Venezuela and Brazil. The Fund's financial position would be adversely affected in the event of a default by any of these countries on obligations held by the Fund, or on obligations issued by them generally. The Fund also makes extensive use of derivatives, which rely on the creditworthiness of the counterparty.
To manage the Fund's cash collateral needs in extraordinary market conditions, the Manager reserves the right to reduce or eliminate the Fund's derivative exposures, including those that are intended to cause the Fund to track its benchmark more closely. A reduction in those exposures without replacing them with benchmark securities will tend to cause the performance of the Fund to track its benchmark less closely and make the Fund's performance more dependent on the performance of the asset-backed securities it holds directly or indirectly.
Other matters
In July 2005, the Fund entered into litigation against the Government of Argentina ("Argentina") relating to Argentina's failure to make payments on sovereign debt held by the Fund. That debt, which continues to be valued according to the Fund's valuation policy, represented 1.63% of the net assets of the Fund as of February 28, 2009. Judgments were awarded in the Fund's favor on September 24, 2007; however, the Fund's ability to collect on those judgments remains uncertain. Costs associated with this action are being borne by the Fund.
Recently issued accounting pronouncement
In March 2008, FASB issued Statement of Financial Accounting Standards No. 161, Disclosures about Derivative Instruments and Hedging Activities ("SFAS 161"). SFAS 161 is effective for fiscal years and interim periods beginning after November 15, 2008. SFAS 161 requires enhanced disclosures about the Fund's derivative and hedging activities. The Manager is currently evaluating the impact the adoption of SFAS 161 will have on the Fund's financial statement disclosures.
3. Fees and other transactions with affiliates
GMO receives a management fee for the services it provides to the Fund. That fee is paid monthly at the annual rate of 0.35% of average daily net assets. The Fund has adopted a Shareholder Service Plan under which the Fund pays GMO a shareholder service fee for client and shareholder service, reporting, and other support. Pursuant to the Shareholder Service Plan, the shareholder service fee is calculated based on average daily net assets of each class at the annual rate of 0.15% for Class III shares and 0.10% for Class IV shares.
52
GMO Emerging Country Debt Fund
(A Series of GMO Trust)
Notes to Financial Statements — (Continued)
February 28, 2009
The Fund incurs fees and expenses indirectly as a shareholder in the underlying funds. For the year ended February 28, 2009, these indirect fees and expenses expressed as an annualized percentage of the Fund's average daily net assets were as follows:
| Indirect Net Expenses (excluding shareholder service fees and interest expense) | Indirect Shareholder Service Fees | Indirect Interest Expense | Total Indirect Expenses | ||||||||||||
| < 0.001% | 0.000 | % | 0.000 | % | < 0.001% | ||||||||||
The Fund's portion of the fees paid by the Trust to the Trust's independent Trustees and Chief Compliance Officer ("CCO") during the year ended February 28, 2009 was $79,808 and $17,036, respectively. The compensation and expenses of the CCO are included in miscellaneous expenses in the Statement of Operations. The Fund paid no remuneration to any other officer of the Trust.
4. Purchases and sales of securities
For the year ended February 28, 2009, cost of purchases and proceeds from sales of investments, other than short-term obligations, were as follows:
| Purchases | Sales | ||||||||||
| U.S. Government securities | $ | 482,911,232 | $ | 311,034,462 | |||||||
| Investments (non-U.S. Government securities) | 452,486,780 | 1,168,829,407 | |||||||||
5. Guarantees
In the normal course of business the Fund enters into contracts with third-party service providers that contain a variety of representations and warranties and that provide general indemnifications. The Fund's maximum exposure under these arrangements is unknown, as it involves future claims that may be made against the Fund that have not yet occurred. Based on experience, management is of the view that the risk of loss in connection with its indemnification obligations is remote; however, there can be no assurance that such obligations will not result in material liabilities that adversely affect the Fund.
6. Principal shareholders and related parties
As of February 28, 2009, 58.31% of the outstanding shares of the Fund were held by four shareholders, each holding more than 10% of the Fund's outstanding shares. On that date, no other shareholder owned
53
GMO Emerging Country Debt Fund
(A Series of GMO Trust)
Notes to Financial Statements — (Continued)
February 28, 2009
more than 10% of the outstanding shares of the Fund. Redemptions from (or investments into) the Fund by or on behalf of these large shareholders may have a material effect on the Fund.
As of February 28, 2009, 0.25% of the Fund's shares were held by senior management of the Manager and GMO Trust officers and 12.19% of the Fund's shares were held by accounts for which the Manager had investment discretion.
7. Share transactions
The Declaration of Trust permits the Trust to issue an unlimited number of shares of beneficial interest (without par value). Transactions in Fund shares were as follows:
| Year Ended February 28, 2009 | Year Ended February 29, 2008 | ||||||||||||||||||
| Class III: | Shares | Amount | Shares | Amount | |||||||||||||||
| Shares sold | 29,283,609 | $ | 176,799,786 | 11,479,041 | $ | 123,985,827 | |||||||||||||
| Shares issued to shareholders in reinvestment of distributions | 8,768,892 | 57,123,655 | 9,161,344 | 94,844,498 | |||||||||||||||
| Shares repurchased | (19,580,527 | ) | (159,212,595 | ) | (29,333,184 | ) | (305,857,092 | ) | |||||||||||
| Purchase premiums | — | 3,273 | — | 178,678 | |||||||||||||||
| Redemption fees | — | 92,578 | — | 435,462 | |||||||||||||||
| Net increase (decrease) | 18,471,974 | $ | 74,806,697 | (8,692,799 | ) | $ | (86,412,627 | ) | |||||||||||
| Year Ended February 28, 2009 | Year Ended February 29, 2008 | ||||||||||||||||||
| Class IV: | Shares | Amount | Shares | Amount | |||||||||||||||
| Shares sold | 8,624,354 | $ | 56,358,374 | 7,884,742 | $ | 82,812,310 | |||||||||||||
| Shares issued to shareholders in reinvestment of distributions | 32,907,567 | 209,783,649 | 22,455,867 | 232,182,559 | |||||||||||||||
| Shares repurchased | (30,713,578 | ) | (190,668,206 | ) | (6,365,177 | ) | (68,471,626 | ) | |||||||||||
| Purchase premiums | — | 7,071 | — | 39,052 | |||||||||||||||
| Redemption fees | — | 294,233 | — | 88,802 | |||||||||||||||
| Net increase (decrease) | 10,818,343 | $ | 75,775,121 | 23,975,432 | $ | 246,651,097 | |||||||||||||
54
GMO Emerging Country Debt Fund
(A Series of GMO Trust)
Notes to Financial Statements — (Continued)
February 28, 2009
8. Investments in affiliated issuers
A summary of the Fund's transactions in the shares of other funds of the Trust during the year ended February 28, 2009 is set forth below:
| Affiliate | Value, beginning of period | Purchases | Sales Proceeds | Dividend Income | Distributions of Realized Gains | Value, end of period | |||||||||||||||||||||
| GMO Short-Duration Collateral Fund | $ | 140,673,840 | $ | 62,669,168 | $ | 106,000,000 | $ | 4,463,272 | u | $ | — | $ | 67,991,002 | ||||||||||||||
| GMO Special Purpose Holding Fund | 26,976 | — | — | — | 48,484 | 15,629 | |||||||||||||||||||||
| GMO World Opportunity Overlay Fund | 49,665,090 | — | 10,500,001 | — | — | 27,808,483 | |||||||||||||||||||||
| Totals | $ | 190,365,906 | $ | 62,669,168 | $ | 116,500,001 | $ | 4,463,272 | $ | 48,484 | $ | 95,815,114 | |||||||||||||||
u The Fund received total distributions in the amount of $13,279,747 of which $8,816,475 was a return of capital.
55
Report of Independent Registered Public Accounting Firm
To the Trustees of GMO Trust and the Shareholders of
GMO Emerging Country Debt Fund:
In our opinion, the accompanying statement of assets and liabilities, including the schedule of investments, and the related statements of operations, of changes in net assets, and the financial highlights present fairly, in all material respects, the financial position of GMO Emerging Country Debt Fund (the "Fund") at February 28, 2009, the results of its operations for the year then ended, the changes in its net assets for each of the two years in the period then ended and the financial highlights for each of the five years in the period then ended, in conformity with accounting principles generally accepted in the United States of America. These financial statements and financial highlights (hereafter referred to as "financial statements") are the responsibility of the Fund's management. Our responsibility is to express an opinion on these financial statements based on our audits. We conducted our audits of these financial st atements in accordance with the standards of the Public Company Accounting Oversight Board (United States). Those standards require that we plan and perform the audit to obtain reasonable assurance about whether the financial statements are free of material misstatement. An audit includes examining, on a test basis, evidence supporting the amounts and disclosures in the financial statements, assessing the accounting principles used and significant estimates made by management, and evaluating the overall financial statement presentation. We believe that our audits, which included confirmation of securities at February 28, 2009 by correspondence with the custodian and brokers, provide a reasonable basis for our opinion.
PricewaterhouseCoopers LLP
Boston, Massachusetts
April 29, 2009
56
GMO Emerging Country Debt Fund
(A Series of GMO Trust)
Fund Expenses
February 28, 2009 (Unaudited)
Expense Examples: The following information is in relation to expenses for the six month period ended February 28, 2009.
As a shareholder of the Fund, you may incur two types of costs: (1) transaction costs, including purchase premiums and redemption fees; and (2) ongoing costs, including management fees, shareholder service fees, and other Fund expenses. This example is intended to help you understand your ongoing costs (in dollars) of investing in the Fund and to compare these costs with the ongoing costs of investing in other mutual funds.
These examples are based on an investment of $1,000 invested at the beginning of the period and held for the entire period, September 1, 2008 through February 28, 2009.
Actual Expenses
The first line of the table for each class below provides information about actual account values and actual expenses. You may use the information in this line, together with the amount you invested, to estimate the expenses that you paid over the period. Simply divide your account value by $1,000 (for example, a $10,000,000 account value divided by $1,000 = 10,000), then multiply the result by the number in the first line under the heading entitled "Net Expense Incurred" to estimate the expenses you paid on your account during this period.
Hypothetical Example for Comparison Purposes
The second line of the table for each class below provides information about hypothetical account values and hypothetical expenses based on the Fund's actual expense ratio and an assumed rate of return of 5% per year before expenses, which is not the Fund's actual return. The hypothetical account values and expenses may not be used to estimate the actual ending account balance or expenses you paid for the period. You may use this information to compare the ongoing costs of investing in the Fund with other funds. To do so, compare this 5% hypothetical example with the 5% hypothetical examples that appear in the shareholder reports of other funds.
Please note that the expenses shown in the table are meant to highlight your ongoing costs only and do not reflect any transactional costs, such as purchase premiums and redemption fees. Therefore, the second line of the table is useful in comparing ongoing costs only, and will not help you determine the relative total costs of owning different funds. In addition, if these transactional costs were included, your costs would have been higher.
| Annualized Expense Ratio | Beginning Account Value | Ending Account Value | Net Expense Incurred* | ||||||||||||||||
| Class III | |||||||||||||||||||
| 1) Actual | 0.72 | % | $ | 1,000.00 | $ | 689.90 | $ | 3.02 | |||||||||||
| 2) Hypothetical | 0.72 | % | $ | 1,000.00 | $ | 1,021.22 | $ | 3.61 | |||||||||||
| Class IV | |||||||||||||||||||
| 1) Actual | 0.67 | % | $ | 1,000.00 | $ | 690.70 | $ | 2.81 | |||||||||||
| 2) Hypothetical | 0.67 | % | $ | 1,000.00 | $ | 1,021.47 | $ | 3.36 | |||||||||||
* Expenses are calculated using each Class's annualized expense ratio (including interest expense and indirect expenses incurred) for the six months ended February 28, 2009, multiplied by the average account value over the period, multiplied by 181 days in the period, divided by 365 days in the year.
57
GMO Emerging Country Debt Fund
(A Series of GMO Trust)
Tax Information for the Tax Year Ended February 28, 2009 (Unaudited)
The Fund will notify shareholders of amounts for use in preparing 2009 income tax forms in early 2010.
The Fund's distributions to shareholders include $57,047,389 from long-term capital gains.
The Fund hereby designates as qualified interest income and qualified short-term capital gains with respect to its taxable year ended February 28, 2009, $18,547,920 and $1,601,594, respectively, or if determined to be different, the qualified interest income and qualified short-term capital gains of such year.
58
Trustees and Officers (Unaudited)
The following tables list the Trust's Trustees and Officers as of the date of this report; their address and date of birth ("DOB"); their position with the Trust; the length of time holding that position with the Trust; their principal occupation(s) during the past five years; the number of portfolios in the fund complex they oversee; and other directorships they hold in companies subject to registration or reporting requirements of the Securities Exchange Act of 1934 (generally called "public companies") or in registered investment companies. The Trust's Statement of Additional Information ("SAI") includes additional information about the Trust's trustees, including changes subsequent to the date of the report. The SAI is available, without charge, upon request by writing GMO, c/o GMO Trust, 40 Rowes Wharf, Boston, MA 02110.
Independent Trustees:
| Name, Address, and DOB | Position(s) Held with Trust | Term of Office1 and Length of Time Served | Principal Occupation(s) During Past Five Years | Number of Portfolios in Fund Complex Overseen by Trustee | Other Directorships Held by Trustee | ||||||||||||||||||
| Donald W. Glazer, Esq. c/o GMO Trust 40 Rowes Wharf Boston, MA 02110 DOB: 07/26/1944 | Chairman of the Board of Trustees | Chairman of the Board of Trustees since March 2005; Lead Independent Trustee (September 2004 – March 2005); Trustee since December 2000. | Consultant – Law and Business2; Author of Legal Treatises. | 59 | None. | ||||||||||||||||||
1 Each Trustee is elected to serve during the continued lifetime of the Trust until he/she dies, resigns or is removed, or if sooner, until the next meeting of Shareholders called for the purpose of electing Trustees and until the election and qualification of his/her successor.
2 As part of Mr. Glazer's work as a consultant, he provides part-time consulting services to Goodwin Procter LLP ("Goodwin"). Goodwin has provided legal services to Renewable Resources, LLC, an affiliate of GMO; GMO, in connection with its relationship with Renewable Resources; and funds managed by Renewable Resources. Mr. Glazer has represented that he has no financial interest in, and is not involved in the provision of, such legal services. In the calendar years ended December 31, 2007 and December 31, 2008, these entities paid $789,416 and $183,864 respectively, in legal fees and disbursements to Goodwin. In correspondence with the Staff of the Securities and Exchange Commission beginning in August 2006, the Independent Trustees' legal counsel provided the Staff with information regarding Mr. Glazer's relationship with Goodwin and h is other business activities. On September 11, 2007, based on information that had been given to the Staff as of that date, the Staff provided oral no-action assurance consistent with the opinion of the Independent Trustees' legal counsel that Mr. Glazer is not an "interested person" of the Trust.
59
Independent Trustees — (Continued)
| Name, Address, and DOB | Position(s) Held with Trust | Term of Office1 and Length of Time Served | Principal Occupation(s) During Past Five Years | Number of Portfolios in Fund Complex Overseen by Trustee | Other Directorships Held by Trustee | ||||||||||||||||||
| W. Nicholas Thorndike c/o GMO Trust 40 Rowes Wharf Boston, MA 02110 DOB: 03/28/1933 | Trustee | Since March 2005. | Director or trustee of various corporations and charitable organizations, including Courier Corporation (a book publisher and manufacturer) (July 1989 – present); Putnam Funds (December 1992 – June 2004); and Providence Journal (a newspaper publisher) (December 1986 – December 2003). | 59 | Director of Courier Corporation (a book publisher and manufacturer); Member of the Investment Committee of Partners HealthCare System, Inc.3 | ||||||||||||||||||
| Peter Tufano c/o GMO Trust 40 Rowes Wharf Boston, MA 02110 DOB: 04/22/1957 | Trustee | Since December 2008. | Sylvan C. Coleman Professor of Financial Management, Harvard Business School (since 1989). | 59 | Trustee of State Street Navigator Securities Lending Trust (3 Portfolios). | ||||||||||||||||||
1 Each Trustee is elected to serve during the continued lifetime of the Trust until he/she dies, resigns or is removed, or if sooner, until the next meeting of Shareholders called for the purpose of electing Trustees and until the election and qualification of his/her successor.
3 Partners HealthCare System, Inc. is a client of the Manager.
60
Principal Officers:
| Name, Address, and DOB | Position(s) Held with Trust | Term of Office4 and Length of Time Served | Principal Occupation(s) During Past Five Years5 | ||||||||||||
| J.B. Kittredge DOB: 08/22/1954 | President and Chief Executive Officer | Since March 2009. | General Counsel, Grantham, Mayo, Van Otterloo & Co. LLC (October 2005 – Present); Partner, Ropes & Gray LLP. | ||||||||||||
| Sheppard N. Burnett c/o GMO Trust 40 Rowes Wharf Boston, MA 02110 DOB: 10/24/1968 | Treasurer and Chief Financial Officer | Chief Financial Officer since March 2007; Treasurer since November 2006; Assistant Treasurer, September 2004 – November 2006. | Fund Administration Staff, Grantham, Mayo, Van Otterloo & Co. LLC (June 2004 – present); Vice President, Director of Tax, Columbia Management Group (2002 – 2004). | ||||||||||||
| Brent C. Arvidson c/o GMO Trust 40 Rowes Wharf Boston, MA 02110 DOB: 06/26/1969 | Assistant Treasurer | Since August 1998. | Senior Fund Administrator, Grantham, Mayo, Van Otterloo & Co. LLC. | ||||||||||||
| John L. Nasrah c/o GMO Trust 40 Rowes Wharf Boston, MA 02110 DOB: 05/27/1977 | Assistant Treasurer | Since March 2007. | Fund Administrator, Grantham, Mayo, Van Otterloo & Co. LLC (September 2004 – present); Tax Analyst, Bain & Company, Inc. (June 2003 – September 2004). | ||||||||||||
| Mahmoodur Rahman c/o GMO Trust 40 Rowes Wharf Boston, MA 02110 DOB: 11/30/1967 | Assistant Treasurer | Since September 2007. | Fund Administrator, Grantham, Mayo, Van Otterloo & Co. LLC (April 2007 – present); Vice President and Senior Tax Manager, Massachusetts Financial Services Company (January 2000 – April 2007). | ||||||||||||
| Michael E. Gillespie c/o GMO Trust 40 Rowes Wharf Boston, MA 02110 DOB: 02/18/1958 | Chief Compliance Officer | Since March 2005. | Vice President of Compliance (June 2004 – February 2005) and Director of Domestic Compliance (March 2002 – June 2004), Fidelity Investments. | ||||||||||||
4 Each officer is elected to hold such office until his or her successor is duly elected and qualified to carry out the duties and responsibilities of the office, or until he or she resigns or is removed from office.
5 Each of Messrs. Burnett, Arvidson, Bohan, and Pottle serves as an officer and/or director of certain pooled investment vehicles of which GMO or an affiliate of GMO serves as the investment adviser.
61
Principal Officers — (Continued)
| Name, Address, and DOB | Position(s) Held with Trust | Term of Office4 and Length of Time Served | Principal Occupation(s) During Past Five Years5 | ||||||||||||
| Jason B. Harrison c/o GMO Trust 40 Rowes Wharf Boston, MA 02110 DOB: 01/29/1977 | Vice President and Clerk | Vice President since November 2006; Clerk since March 2006. | Legal Counsel, Grantham, Mayo, Van Otterloo & Co. LLC (since February 2006) and Attorney, Ropes & Gray LLP (September 2002 – February 2006). | ||||||||||||
| David L. Bohan c/o GMO Trust 40 Rowes Wharf Boston, MA 02110 DOB: 06/21/1964 | Vice President and Assistant Clerk | Vice President since March 2005; Assistant Clerk since March 2006. | Legal Counsel, Grantham, Mayo, Van Otterloo & Co. LLC. | ||||||||||||
| Gregory L. Pottle c/o GMO Trust 40 Rowes Wharf Boston, MA 02110 DOB: 07/09/1971 | Vice President and Assistant Clerk | Since November 2006. | Legal Counsel, Grantham, Mayo, Van Otterloo & Co. LLC. | ||||||||||||
| Anne K. Trinque c/o GMO Trust 40 Rowes Wharf Boston, MA 02110 DOB: 04/15/1978 | Vice President and Assistant Clerk | Since September 2007. | Legal Counsel, Grantham, Mayo, Van Otterloo & Co. LLC (January 2007 – present); Attorney, Goodwin Procter LLP (September 2003 – January 2007). | ||||||||||||
| Cheryl Wakeham c/o GMO Trust 40 Rowes Wharf Boston, MA 02110 DOB: 10/29/1958 | Vice President and Anti-Money Laundering Officer | Since December 2004. | Manager, Client Service Administration, Grantham, Mayo, Van Otterloo & Co. LLC. | ||||||||||||
4 Each officer is elected to hold such office until his or her successor is duly elected and qualified to carry out the duties and responsibilities of the office, or until he or she resigns or is removed from office.
5 Each of Messrs. Burnett, Arvidson, Bohan, and Pottle serves as an officer and/or director of certain pooled investment vehicles of which GMO or an affiliate of GMO serves as the investment adviser.
62
GMO International Opportunities Equity Allocation Fund
(A Series of GMO Trust)
Annual Report
February 28, 2009
For a free copy of the Fund's proxy voting guidelines, shareholders may call 1-617-346-7646 (collect) or visit the Securities and Exchange Commission's website at www.sec.gov. Information regarding how the Fund voted proxies relating to portfolio securities during the most recent 12-month period ended June 30 is available on GMO's website at www.gmo.com, or on the Securities and Exchange Commission's website at www.sec.gov.
The Fund files its complete schedule of portfolio holdings with the Securities and Exchange Commission for the first and third quarter of each fiscal year on Form N-Q, which is available on the Commission's website at www.sec.gov. The Fund's Form N-Q may be reviewed and copied at the Commission's Public Reference Room in Washington, D.C. Information on the operation of the Public Reference Room may be obtained by calling 1-800-SEC-0330. The Fund has a policy with respect to disclosure of portfolio holdings under which it may also make available on GMO's website at www.gmo.com a complete schedule of portfolio holdings.
This report is prepared for the general information of shareholders. It is authorized for distribution to prospective investors only when preceded or accompanied by a prospectus for the GMO Trust, which contains a complete discussion of the risks associated with an investment in this Fund and other important information. The GMO Trust prospectus can be obtained at www.gmo.com.
GMO International Opportunities Equity Allocation Fund
(A Series of GMO Trust)
Portfolio Management
Day-to-day management of the Fund's portfolio is the responsibility of the Asset Allocation team at Grantham, Mayo, Van Otterloo & Co. LLC.
Management Discussion and Analysis of Fund Performance
The GMO International Opportunities Equity Allocation Fund returned -46.1% for the fiscal year ended February 28, 2009, as compared to -50.2% for the Fund's benchmark, the MSCI EAFE Index. During the fiscal year the Fund was exposed to global equity securities through its investment in underlying GMO mutual funds.
Implementation was positive, with both International Intrinsic Value Fund and International Growth Equity Fund outperforming their benchmarks. Asset allocation was slightly negative due to the Fund's overweight in emerging equities for part of the year.
Asset allocation detracted 2.3%. The Fund's overweights to emerging market equities and international value equities were the primary drivers of the relative underperformance.
The views expressed herein are exclusively those of Grantham, Mayo, Van Otterloo & Co. LLC Management as of the date of this report and are subject to change. GMO disclaims any responsibility to update such views. They are not meant as investment advice. References to specific securities are not recommendations of such securities and may not be representative of any GMO portfolio's current or future investments.
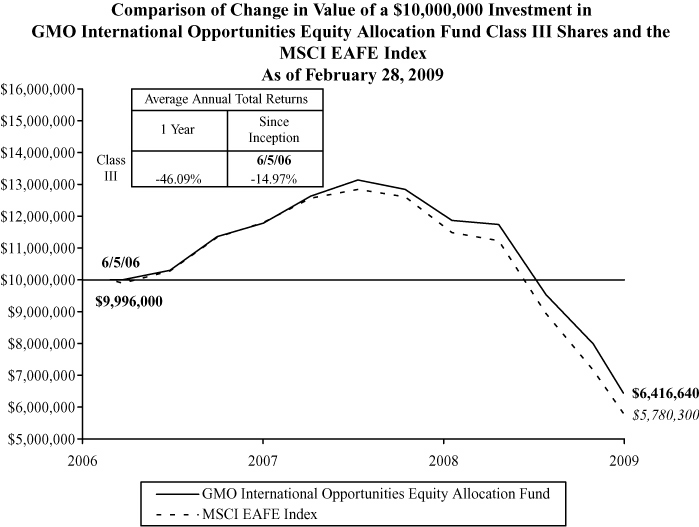
Performance data quoted represents past performance and is not indicative of future results. The investment return and principal value of an investment will fluctuate so that an investor's shares, when redeemed, may be worth more or less than their original cost. Current performance data may be lower or higher than the performance data provided herein. To obtain performance information to the most recent month-end, visit www.gmo.com. Performance shown is net of all fees after reimbursement from the Manager. Each performance figure assumes a purchase at the beginning and redemption at the end of the stated period and reflects a transaction fee of .04% on the purchase and .04% on the redemption. Transaction fees are retained by the Fund to cover trading costs. Returns would have been lower had certain expenses not been reimbursed during the periods shown and do not include the effect of taxes on distributions and redemptions. All information is unaudited.
GMO International Opportunities Equity Allocation Fund
(A Series of GMO Trust)
Investments Concentration Summary
February 28, 2009 (Unaudited)
| Asset Class Summary* | % of Total Net Assets | ||||||
| Common Stocks | 94.7 | % | |||||
| Short-Term Investments | 3.4 | ||||||
| Rights and Warrants | 0.0 | ||||||
| Preferred Stocks | 0.0 | ||||||
| Forward Currency Contracts | (0.5 | ) | |||||
| Futures | (0.7 | ) | |||||
| Other | 3.1 | ||||||
| 100.0 | % | ||||||
| Country/Region Summary** | % of Investments | ||||||
| Japan | 28.2 | % | |||||
| Euro Region*** | 25.7 | ||||||
| United Kingdom | 21.8 | ||||||
| Switzerland | 11.9 | ||||||
| Australia | 2.9 | ||||||
| Canada | 2.9 | ||||||
| Hong Kong | 2.4 | ||||||
| Denmark | 1.4 | ||||||
| Singapore | 1.3 | ||||||
| Sweden | 1.0 | ||||||
| Norway | 0.4 | ||||||
| New Zealand | 0.1 | ||||||
| 100.0 | % | ||||||
* The table above incorporates aggregate indirect asset class exposure associated with investments in other funds of GMO Trust ("underlying funds").
** The table above incorporates aggregate indirect country exposure associated with investments in the underlying funds. The table excludes short-term investments. The table includes exposure through the use of derivative contracts.
*** The "Euro Region" is comprised of Austria, Belgium, Finland, France, Germany, Greece, Ireland, Italy, Netherlands, Portugal and Spain.
1
GMO International Opportunities Equity Allocation Fund
(A Series of GMO Trust)
Schedule of Investments
(showing percentage of total net assets)
February 28, 2009
| Shares / Par Value ($) | Description | Value ($) | |||||||||||||
| MUTUAL FUNDS — 100.0% | |||||||||||||||
| Affiliated Issuers — 100.0% | |||||||||||||||
| 652,133 | GMO Flexible Equities Fund, Class VI | 10,036,327 | |||||||||||||
| 14,146,977 | GMO International Growth Equity Fund, Class IV | 204,565,281 | |||||||||||||
| 13,907,756 | GMO International Intrinsic Value Fund, Class IV | 194,708,590 | |||||||||||||
| TOTAL MUTUAL FUNDS (COST $859,372,794) | 409,310,198 | ||||||||||||||
| SHORT-TERM INVESTMENTS — 0.0% | |||||||||||||||
| 19,160 | State Street Eurodollar Time Deposit, 0.01%, due 03/02/09 | 19,160 | |||||||||||||
| TOTAL SHORT-TERM INVESTMENTS (COST $19,160) | 19,160 | ||||||||||||||
| TOTAL INVESTMENTS — 100.0% (Cost $859,391,954) | 409,329,358 | ||||||||||||||
| Other Assets and Liabilities (net) — (0.0%) | (51,085 | ) | |||||||||||||
| TOTAL NET ASSETS — 100.0% | $ | 409,278,273 | |||||||||||||
See accompanying notes to the financial statements.
2
GMO International Opportunities Equity Allocation Fund
(A Series of GMO Trust)
Statement of Assets and Liabilities — February 28, 2009
| Assets: | |||||||
| Investments in unaffiliated issuers, at value (cost $19,160) (Note 2) | $ | 19,160 | |||||
| Investments in affiliated issuers, at value (cost $859,372,794) (Notes 2 and 8) | 409,310,198 | ||||||
| Receivable for Fund shares sold | 71,736 | ||||||
| Receivable for expenses reimbursed by Manager (Note 3) | 3,976 | ||||||
| Total assets | 409,405,070 | ||||||
| Liabilities: | |||||||
| Payable for investments purchased | 71,736 | ||||||
| Payable to affiliate for (Note 3): | |||||||
| Trustees and Chief Compliance Officer of GMO Trust fees | 1,622 | ||||||
| Accrued expenses | 53,439 | ||||||
| Total liabilities | 126,797 | ||||||
| Net assets | $ | 409,278,273 | |||||
| Net assets consist of: | |||||||
| Paid-in capital | $ | 902,497,581 | |||||
| Accumulated net realized loss | (43,156,712 | ) | |||||
| Net unrealized depreciation | (450,062,596 | ) | |||||
| $ | 409,278,273 | ||||||
| Net assets attributable to: | |||||||
| Class III shares | $ | 409,278,273 | |||||
| Shares outstanding: | |||||||
| Class III | 44,507,738 | ||||||
| Net asset value per share: | |||||||
| Class III | $ | 9.20 | |||||
See accompanying notes to the financial statements.
3
GMO International Opportunities Equity Allocation Fund
(A Series of GMO Trust)
Statement of Operations — Year Ended February 28, 2009
| Investment Income: | |||||||
| Dividends from affiliated issuers (Note 8) | $ | 24,902,057 | |||||
| Interest | 324 | ||||||
| Total investment income | 24,902,381 | ||||||
| Expenses: | |||||||
| Custodian, fund accounting agent and transfer agent fees | 30,618 | ||||||
| Audit and tax fees | 33,380 | ||||||
| Legal fees | 15,390 | ||||||
| Trustees fees and related expenses (Note 3) | 9,149 | ||||||
| Registration fees | 3,800 | ||||||
| Miscellaneous | 7,803 | ||||||
| Total expenses | 100,140 | ||||||
| Fees and expenses reimbursed by Manager (Note 3) | (86,583 | ) | |||||
| Expense reductions (Note 2) | (15,122 | ) | |||||
| Net expenses | (1,565 | ) | |||||
| Net investment income (loss) | 24,903,946 | ||||||
| Realized and unrealized gain (loss): | |||||||
| Net realized gain (loss) on: | |||||||
| Investments in affiliated issuers | (58,235,039 | ) | |||||
| Realized gains distributions from affiliated issuers (Note 8) | 41,343,170 | ||||||
| Net realized gain (loss) | (16,891,869 | ) | |||||
| Change in net unrealized appreciation (depreciation) on: | |||||||
| Investments in affiliated issuers | (351,591,999 | ) | |||||
| Net realized and unrealized gain (loss) | (368,483,868 | ) | |||||
| Net increase (decrease) in net assets resulting from operations | $ | (343,579,922 | ) | ||||
See accompanying notes to the financial statements.
4
GMO International Opportunities Equity Allocation Fund
(A Series of GMO Trust)
Statement of Changes in Net Assets
| Year Ended February 28, 2009 | Year Ended February 29, 2008 | ||||||||||
| Increase (decrease) in net assets: | |||||||||||
| Operations: | |||||||||||
| Net investment income (loss) | $ | 24,903,946 | $ | 13,263,942 | |||||||
| Net realized gain (loss) | (16,891,869 | ) | 98,425,498 | ||||||||
| Change in net unrealized appreciation (depreciation) | (351,591,999 | ) | (103,922,554 | ) | |||||||
| Net increase (decrease) in net assets from operations | (343,579,922 | ) | 7,766,886 | ||||||||
| Distributions to shareholders from: | |||||||||||
| Net investment income | |||||||||||
| Class III | (24,913,805 | ) | (38,253,569 | ) | |||||||
| Net realized gains | |||||||||||
| Class III | (81,291,869 | ) | (36,477,386 | ) | |||||||
| (106,205,674 | ) | (74,730,955 | ) | ||||||||
| Net share transactions (Note 7): | |||||||||||
| Class III | 140,586,628 | 344,825,641 | |||||||||
| Purchase premiums and redemption fees (Notes 2 and 7): | |||||||||||
| Class III | 87,418 | 96,754 | |||||||||
| Total increase (decrease) in net assets resulting from net share transactions, purchase premiums and redemption fees | 140,674,046 | 344,922,395 | |||||||||
| Total increase (decrease) in net assets | (309,111,550 | ) | 277,958,326 | ||||||||
| Net assets: | |||||||||||
| Beginning of period | 718,389,823 | 440,431,497 | |||||||||
| End of period | $ | 409,278,273 | $ | 718,389,823 | |||||||
See accompanying notes to the financial statements.
5
GMO International Opportunities Equity Allocation Fund
(A Series of GMO Trust)
Financial Highlights
(For a Class III share outstanding throughout each period)
| Year Ended February 28/29, | |||||||||||||||
| 2009 | 2008 | 2007(a) | |||||||||||||
| Net asset value, beginning of period | $ | 20.63 | $ | 22.16 | $ | 20.00 | |||||||||
| Income (loss) from investment operations: | |||||||||||||||
| Net investment income (loss)(b)† | 0.65 | 0.47 | 0.53 | ||||||||||||
| Net realized and unrealized gain (loss) | (9.20 | ) | 0.52 | 2.45 | |||||||||||
| Total from investment operations | (8.55 | ) | 0.99 | 2.98 | |||||||||||
| Less distributions to shareholders: | |||||||||||||||
| From net investment income | (0.62 | ) | (1.24 | ) | (0.72 | ) | |||||||||
| From net realized gains | (2.26 | ) | (1.28 | ) | (0.10 | ) | |||||||||
| Total distributions | (2.88 | ) | (2.52 | ) | (0.82 | ) | |||||||||
| Net asset value, end of period | $ | 9.20 | $ | 20.63 | $ | 22.16 | |||||||||
| Total Return(c) | (46.05 | )% | 3.57 | % | 14.93 | %** | |||||||||
| Ratios/Supplemental Data: | |||||||||||||||
| Net assets, end of period (000's) | $ | 409,278 | $ | 718,390 | $ | 440,431 | |||||||||
| Net expenses to average daily net assets(d)(e) | 0.00 | %(f) | 0.00 | %(f) | 0.00 | %* | |||||||||
| Net investment income to average daily net assets(b) | 4.12 | % | 2.04 | % | 3.32 | %* | |||||||||
| Portfolio turnover rate | 33 | % | 4 | % | 1 | %** | |||||||||
| Fees and expenses reimbursed by the Manager to average daily net assets: | 0.01 | % | 0.02 | % | 0.03 | %* | |||||||||
| Purchase premiums and redemption fees consisted of the following per share amounts:† | $ | 0.00 | (g) | $ | 0.00 | (g) | $ | 0.01 | |||||||
(a) Period from June 5, 2006 (commencement of operations) through February 28, 2007.
(b) Net investment income is affected by the timing of the declaration of dividends by the underlying funds in which the Fund invests.
(c) The total returns would have been lower had certain expenses not been reimbursed during the periods shown and assumes the effect of reinvested distributions. Calculation excludes purchase premiums and redemption fees which are borne by the shareholder.
(d) Net expenses to average daily net assets were less than 0.01%.
(e) Net expenses exclude expenses incurred indirectly through investment in the underlying funds (See Note 3).
(f) The net expense ratio does not include the effect of expense reductions.
(g) Purchase premiums and redemption fees were less than $0.01 per share.
† Calculated using average shares outstanding throughout the period.
* Annualized.
** Not annualized.
See accompanying notes to the financial statements.
6
GMO International Opportunities Equity Allocation Fund
(A Series of GMO Trust)
Notes to Financial Statements
February 28, 2009
1. Organization
GMO International Opportunities Equity Allocation Fund (the "Fund") is a series of GMO Trust (the "Trust"). The Fund is registered under the Investment Company Act of 1940, as amended, as an open-end, diversified management investment company. The Fund is advised and managed by Grantham, Mayo, Van Otterloo & Co. LLC (the "Manager" or "GMO"). The Trust was established as a Massachusetts business trust under the laws of The Commonwealth of Massachusetts on June 24, 1985. The Declaration of Trust permits the Trustees of the Trust ("Trustees") to create an unlimited number of series of shares ("Funds") and to subdivide Funds into classes.
The Fund seeks total return greater than that of the MSCI EAFE Index (Europe, Australasia, and Far East). The Fund is a fund of funds and invests primarily in shares of the GMO International Equity Funds (which may include one or more of the GMO Emerging Markets Funds). The Fund may also invest in shares of other GMO Funds, including the GMO Fixed Income Funds, GMO Alpha Only Fund, GMO Flexible Equities Fund, and GMO Alternative Asset Opportunity Fund.
The financial statements of the series of the Trust in which the Fund invests ("underlying funds") should be read in conjunction with the Fund's financial statements. These financial statements are available, without charge, upon request, by calling (617) 346-7646 (collect) or by visiting GMO's website at www.gmo.com. Shares of GMO Flexible Equities Fund are not publicly available for direct purchase.
2. Significant accounting policies
The following is a summary of significant accounting policies followed by the Fund in the preparation of its financial statements. These policies are in conformity with accounting principles generally accepted in the United States of America ("U.S. GAAP") and have been consistently followed by the Fund in preparing its financial statements. The preparation of financial statements in accordance with U.S. GAAP requires management to make estimates and assumptions that affect the reported amounts and disclosures in the financial statements. Actual results could differ from those estimates. The accounting records of the Fund are maintained in U.S. dollars.
Portfolio valuation
Shares of the underlying funds and other mutual funds are generally valued at their net asset value.
Investments held by the underlying funds are valued as follows. Securities listed on a securities exchange for which market quotations are readily available are valued at the last sale price or official closing price on each business day, or if there is no such reported sale or official closing price, at the most recent quoted bid price. Unlisted securities for which market quotations are readily available are generally valued at the most recent quoted bid price. Debt instruments with a remaining maturity of sixty days or less are generally valued at amortized cost, which approximates fair value. Securities for which quotations are not
7
GMO International Opportunities Equity Allocation Fund
(A Series of GMO Trust)
Notes to Financial Statements — (Continued)
February 28, 2009
readily available or whose values the Manager has determined to be unreliable are valued at fair value as determined in good faith by the Trustees or persons acting at their direction pursuant to procedures approved by the Trustees. By its nature, a fair value price is a good faith estimate of the value of a security at a given point in time and may not reflect the value that would be realized if the security were sold. The difference between a fair value price and the value realized upon a sale could be material. Because many foreign equity securities markets and exchanges close prior to the close of the New York Stock Exchange ("NYSE"), closing prices for foreign securities in those markets or on those exchanges do not reflect the events that occur after that close but before the close of the NYSE. As a result, the Fund generally values foreign equity securities using fair value prices, which are based on adjustments to closin g prices supplied by a third party vendor based on that vendor's proprietary models. As of February 28, 2009, 86.61% of the net assets of the Fund, through investments in the underlying funds, were valued using fair value prices based on models used by a third party vendor.
In September 2006, the Financial Accounting Standards Board ("FASB") issued Statement of Financial Accounting Standards No. 157, Fair Value Measurements ("SFAS 157"). SFAS 157 is effective for the Fund's current fiscal year. While the adoption of SFAS 157 does not have an effect on the Fund's net asset value, it does require additional disclosures about fair value measurements. SFAS 157 establishes a three-level hierarchy for disclosure of fair value measurements. The valuation hierarchy is based upon the reliability of inputs to the valuation of the Fund's investments. The three levels are defined as follows:
Level 1 – Valuations based on quoted prices for identical securities in active markets.
Level 2 – Valuations determined using other significant direct or indirect observable inputs.
Level 3 – Valuations based on inputs that are unobservable and significant.
The inputs or methodology used for valuing securities are not necessarily an indication of the risk associated with investing in those securities.
The following is a summary of the fair valuations according to inputs used as of February 28, 2009 in valuing the Fund's investments:
| Asset Valuation Inputs | Investments in Securities | Other Financial Instruments | |||||||||
| Level 1 - Quoted Prices | $ | 399,293,031 | $ | — | |||||||
| Level 2 - Other Significant Observable Inputs | 10,036,327 | — | |||||||||
| Level 3 - Significant Unobservable Inputs | — | — | |||||||||
| Total | $ | 409,329,358 | $ | — | |||||||
8
GMO International Opportunities Equity Allocation Fund
(A Series of GMO Trust)
Notes to Financial Statements — (Continued)
February 28, 2009
| Liability Valuation Inputs | Investments in Securities | Other Financial Instruments | |||||||||
| Level 1 - Quoted Prices | $ | — | $ | — | |||||||
| Level 2 - Other Significant Observable Inputs | — | — | |||||||||
| Level 3 - Significant Unobservable Inputs | — | — | |||||||||
| Total | $ | — | $ | — | |||||||
For the underlying fund's summary of valuation inputs please refer to the respective fund's portfolio valuation note.
The Fund held no investments or other financial instruments at either February 29, 2008 or February 28, 2009, whose fair value was determined using Level 3 inputs.
Repurchase agreements
The Fund may enter into repurchase agreements. Under a repurchase agreement the Fund acquires a security for cash and obtains a simultaneous commitment from the seller to repurchase the security at an agreed upon price and date. The Fund, through its custodian, takes possession of securities collateralizing the repurchase agreement. The collateral is marked to market daily to ensure that the market value of the underlying assets is at least equal to the amount owed to the Fund in the event of default by the seller. If the seller of a repurchase agreement defaults or enters into insolvency proceedings and the value of the collateral declines, the Fund's recovery of cash may be delayed or limited. The Fund had no repurchase agreements outstanding at the end of the period.
Taxes and distributions
The Fund intends to qualify each tax year as a regulated investment company under Subchapter M of the Internal Revenue Code of 1986, as amended (the "Code"). The Fund intends to distribute substantially all of its net investment income and all of its net realized short-term and long-term capital gain, if any, after giving effect to any available capital loss carryforwards for U.S. federal income tax purposes. Therefore, no provision for U.S. federal income or excise tax is necessary.
The Fund's policy is to declare and pay distributions from net investment income, if any, semiannually, and from net realized short-term and long-term capital gain, if any, at least annually. All distributions are paid in shares of the Fund, at net asset value, unless the shareholder elects to receive cash distributions. Distributions to shareholders are recorded by the Fund on the ex-dividend date.
Income and capital gain distributions are determined in accordance with U.S. federal income tax regulations, which may differ from U.S. GAAP. Certain capital accounts in the financial statements are periodically adjusted for permanent differences in order to reflect their tax character. These adjustments have no impact on net assets or net asset value per share. Temporary differences that arise from recognizing
9
GMO International Opportunities Equity Allocation Fund
(A Series of GMO Trust)
Notes to Financial Statements — (Continued)
February 28, 2009
certain items of income, expense, gain or loss in different periods for financial statement and tax purposes will reverse at some time in the future. Distributions in excess of net investment income or net realized gains are temporary over-distributions for financial statement purposes resulting from differences in the recognition or classification of income or distributions for financial statement and tax purposes.
U.S. GAAP and tax accounting differences primarily relate to losses on wash sale transactions and post-October capital losses.
The following reclassification represents the amount necessary to report the stated components of net assets on a tax basis, excluding certain temporary differences, as of February 28, 2009. The financial highlights exclude these adjustments.
| Distributions In Excess of Net Investment Income | Accumulated Net Realized Loss | Paid-in Capital | |||||||||
| $ | 9,859 | $ | (1,343 | ) | $ | (8,516 | ) | ||||
The tax character of distributions declared to shareholders is as follows:
| 2/28/2009 | 2/29/2008 | ||||||||||
| Ordinary income (including any net short-term capital gain) | $ | 24,919,575 | $ | 39,207,726 | |||||||
| Net long-term capital gain | 81,286,099 | 35,523,229 | |||||||||
| Total distributions | $ | 106,205,674 | $ | 74,730,955 | |||||||
Distributions in excess of tax basis earnings and profits, if significant, are reported in the financial statements as a return of capital for tax purposes.
As of February 28, 2009, the Fund elected to defer March 1, 2009 post-October capital losses of $7,394,778.
As of February 28, 2009, the approximate cost for U.S. federal income tax purposes and gross and net unrealized appreciation (depreciation) in value of investments were as follows:
| Aggregate Cost | Gross Unrealized Appreciation | Gross Unrealized (Depreciation) | Net Unrealized Appreciation (Depreciation) | ||||||||||||
| $ | 895,153,888 | $ | — | $ | (485,824,530 | ) | $ | (485,824,530 | ) | ||||||
10
GMO International Opportunities Equity Allocation Fund
(A Series of GMO Trust)
Notes to Financial Statements — (Continued)
February 28, 2009
The Fund is subject to the provisions of Financial Accounting Standards Board Interpretation No. 48 ("FIN 48"), Accounting for Uncertainty in Income Taxes — an Interpretation of FASB Statement No. 109. FIN 48 sets forth a minimum threshold for financial statement recognition of a tax position taken or expected to be taken in a tax return that could affect the Fund's financial statements. The Fund did not have any unrecognized tax benefits or liabilities at February 28, 2009, nor did it have any increases or decreases in unrecognized tax benefits or liabilities for the period then ended. The Fund is subject to examination prior to the expiration of the statute of limitations by U.S. federal and state tax authorities for tax returns filed.
Security transactions and related investment income
Security transactions in the financial statements are accounted for on the trade date. Income dividends and capital gain distributions from the underlying funds are recorded on the ex-dividend date. Interest income is recorded on the accrual basis. Non-cash dividends, if any, are recorded at the fair market value of the asset received. In determining the net gain or loss on securities sold, the Fund uses the identified cost basis for the purposes of determining the cost basis.
Expenses
The majority of the expenses of the Trust are directly identifiable to an individual fund. Expenses that are not readily identifiable to a specific fund are allocated taking into consideration, among other things, the nature and type of expense and the relative size of the funds. In addition, the Fund incurs fees and expenses indirectly as a shareholder in the underlying funds. Because the underlying funds have different expense and fee levels and the Fund may own different proportions of the underlying funds at different times, the amount of fees and expenses indirectly incurred by the Fund will vary and the manager has a conflict in allocating among the underlying funds (See Note 3).
State Street Bank and Trust Company ("State Street") serves as custodian, fund accounting agent and transfer agent of the Fund. State Street's fees may be reduced by an earnings allowance calculated on the average daily cash balances the Fund maintains with State Street. The Fund receives the benefit of the earnings allowance. Credit balances or expense reimbursements used to reduce fees, if any, are reported as a reduction of expenses in the Statement of Operations.
Purchases and redemptions of Fund shares
Effective June 30, 2008, the premium on cash purchases of Fund shares was changed to 0.04% of the amount invested and the fee on cash redemptions was changed to 0.02% of the amount redeemed. Effective September 30, 2008, the Fund no longer charged a premium on cash purchases or fee on cash redemptions of the amount invested or redeemed. Effective October 21, 2008, the premium on cash purchases and fee on cash redemptions were each changed to 0.04% of the amount invested or redeemed. As of February 28, 2009, the premium on cash purchases of Fund shares were each 0.04% of the amount invested or redeemed. The level of purchase premium for the Fund may be adjusted to account for changes in the Fund's investments (i.e., changes in the percentage of Fund assets allocated to each underlying
11
GMO International Opportunities Equity Allocation Fund
(A Series of GMO Trust)
Notes to Financial Statements — (Continued)
February 28, 2009
fund). The Fund may impose a new purchase premium and/or redemption fee, or modify or eliminate an existing purchase premium and/or redemption fee, at any time. If the Manager determines that any portion of a cash purchase or redemption is offset by a corresponding cash redemption or purchase on the same day, the Fund will ordinarily waive or reduce the purchase premium or redemption fee with respect to that portion. All or a portion of the redemption fees may be waived at the Manager's discretion under circumstances in which the Manager deems it equitable to do so, including without limitation in cases where the weighted average of (i) the estimated transaction costs for directly held assets and (ii) the redemption fees, if any, imposed by the underlying funds is less than the Fund's redemption fee. In addition, the Fund may waive or reduce the purchase premium or redemption fee in extraordinary circumstances if the purchase or redemption will not cause the Fund to incur transaction costs. All purchase premiums and redemption fees are paid to the Fund and recorded by the Fund as paid-in capital. The Fund will waive or reduce the purchase premium relating to the in-kind portion of a purchase transaction except for estimated or known transaction costs (e.g. stamp duties and transfer taxes) incurred by the Fund as a result of the transfer of the purchasing shareholder's securities to the Fund. In-kind redemption transactions are generally not subject to redemption fees except when they include a cash component. However, when a substantial portion of a Fund is being redeemed, the Fund may charge a redemption fee based on estimated or known transaction costs resulting from those redemptions. The Fund charges no premium for reinvested distributions.
Investment risks
The Fund is subject to the investment risks associated with an investment in the underlying funds, some of which may invest in foreign securities. The Fund is subject to risks involved in investing in foreign securities that are not presented by investments in U.S. securities. These risks may involve adverse political and economic developments, including expropriation and the possible imposition of capital controls or other foreign governmental laws or restrictions. In addition, the securities of some foreign companies and securities markets are less liquid and at times more volatile than securities of comparable U.S. companies and U.S. securities markets. The risks described above apply to an even greater extent to investments in emerging markets. The securities markets of emerging countries are generally smaller, less developed, less liquid, and more volatile than the securities markets of the U.S. and developed foreign market s. Additionally, the investment risks associated with an investment in the underlying funds may be greater to the extent that the underlying funds engage in derivative transactions.
Recently issued accounting pronouncement
In March 2008, FASB issued Statement of Financial Accounting Standards No. 161, Disclosures about Derivative Instruments and Hedging Activities ("SFAS 161"). SFAS 161 is effective for fiscal years and interim periods beginning after November 15, 2008. SFAS 161 requires enhanced disclosures about the Fund's derivative and hedging activities. The Manager is currently evaluating the impact the adoption of SFAS 161 will have on the Fund's financial statement disclosures.
12
GMO International Opportunities Equity Allocation Fund
(A Series of GMO Trust)
Notes to Financial Statements — (Continued)
February 28, 2009
3. Fees and other transactions with affiliates
The Manager decides how to allocate the assets of the Fund among underlying funds. The Manager does not directly charge the Fund a management fee or shareholder service fee, but it receives varying management and shareholder service fees from the underlying funds in which the Fund invests. Because of that variation the levels of indirect net expenses set forth are affected by the managers asset allocation decisions.
Through at least June 30, 2009, the Manager has contractually agreed to reimburse the Fund for Fund expenses incurred through that date (excluding "Excluded Expenses", as defined below). Excluded Expenses include fees and expenses of the independent Trustees of the Trust, fees and expenses for legal services not approved by the Manager for the Trust, compensation and expenses of the Trust's Chief Compliance Officer ("CCO") (excluding any employee benefits), brokerage commissions, securities lending fees and expenses, interest expense, transfer taxes, and other investment-related costs (including expenses associated with investments in any company that is an investment company or would be an investment company under the 1940 Act, but for the exceptions to the definition of investment company provided in Section 3(c)(1) and 3(c)(7) of the 1940 Act), hedging transaction fees, extraordinary, non-recurring and certain other unusual e xpenses (including taxes).
The Fund incurs fees and expenses indirectly as a shareholder in the underlying funds. For the year ended February 28, 2009, these indirect fees and expenses expressed as an annualized percentage of the Fund's average daily net assets were as follows:
| Indirect Net Expenses (excluding shareholder service fees) | Indirect Shareholder Service Fees | Total Indirect Expenses | |||||||||
| 0.517 | % | 0.089 | % | 0.606 | % | ||||||
The Fund's portion of the fees paid by the Trust to the Trust's independent Trustees and CCO during the year ended February 28, 2009 was $7,117 and $4,407, respectively. The compensation and expenses of the CCO are included in miscellaneous expenses in the Statement of Operations. The Fund paid no remuneration to any other officer of the Trust.
4. Purchases and sales of securities
Cost of purchases and proceeds from sales of securities, excluding short-term investments and class exchanges, for the year ended February 28, 2009 aggregated $299,985,617 and $199,237,470, respectively.
13
GMO International Opportunities Equity Allocation Fund
(A Series of GMO Trust)
Notes to Financial Statements — (Continued)
February 28, 2009
5. Guarantees
In the normal course of business the Fund enters into contracts with third-party service providers that contain a variety of representations and warranties and that provide general indemnifications. The Fund's maximum exposure under these arrangements is unknown, as it involves future claims that may be made against the Fund that have not yet occurred. Based on experience, management is of the view that the risk of loss in connection with its indemnification obligations is remote; however, there can be no assurance that such obligations will not result in material liabilities that adversely affect the Fund.
6. Principal shareholders and related parties
As of February 28, 2009, 22.91% of the outstanding shares of the Fund were held by two shareholders, each holding more than 10% of the Fund's outstanding shares. On that date, no other shareholder owned more than 10% of the outstanding shares of the Fund. Redemptions from (or investments into) the Fund by or on behalf of these large shareholders may have a material effect on the Fund.
As of February 28, 2009, less than 0.01% of the Fund's shares were held senior management of the Manager and GMO Trust officers and none of the Fund's shares were held by accounts for which the Manager had investment discretion.
7. Share transactions
The Declaration of Trust permits the Trust to issue an unlimited number of shares of beneficial interest (without par value). Transactions in Fund shares were as follows:
| Year Ended February 28, 2009 | Year Ended February 29, 2008 | ||||||||||||||||||
| Class III: | Shares | Amount | Shares | Amount | |||||||||||||||
| Shares sold | 9,740,750 | $ | 162,721,575 | 12,892,226 | $ | 299,095,066 | |||||||||||||
| Shares issued to shareholders in reinvestment of distributions | 7,405,391 | 104,659,498 | 3,158,687 | 72,167,816 | |||||||||||||||
| Shares repurchased | (7,459,920 | ) | (126,794,445 | ) | (1,108,147 | ) | (26,437,241 | ) | |||||||||||
| Purchase premiums | — | 55,087 | — | 89,316 | |||||||||||||||
| Redemption fees | — | 32,331 | — | 7,438 | |||||||||||||||
| Net increase (decrease) | 9,686,221 | $ | 140,674,046 | 14,942,766 | $ | 344,922,395 | |||||||||||||
14
GMO International Opportunities Equity Allocation Fund
(A Series of GMO Trust)
Notes to Financial Statements — (Continued)
February 28, 2009
8. Investments in affiliated issuers
A summary of the Fund's transactions in the shares of other funds of the Trust during the year ended February 28, 2009 is set forth below:
| Affiliate | Value, beginning of period | Purchases | Sales Proceeds | Dividend Income | Distributions of Realized Gains | Value, end of period | |||||||||||||||||||||
| GMO Emerging Markets Fund, Class IV | $ | — | $ | 16,680,728 | $ | 14,705,818 | $ | — | $ | 299,278 | $ | — | |||||||||||||||
| GMO Emerging Markets Opportunities Fund, Class IV | 52,923,870 | 10,283,374 | 50,085,676 | 212,954 | 10,070,419 | — | |||||||||||||||||||||
| GMO Flexible Equities Fund, Class VI | — | 13,029,066 | — | 1,597 | — | 10,036,327 | |||||||||||||||||||||
| GMO International Growth Equity Fund, Class IV | 336,900,951 | 126,249,024 | 74,644,816 | 11,881,046 | 11,980,329 | 204,565,281 | |||||||||||||||||||||
| GMO International Intrinsic Value Fund, Class IV | 328,564,268 | 133,743,425 | 59,801,160 | 12,806,460 | 18,993,144 | 194,708,590 | |||||||||||||||||||||
| Totals | $ | 718,389,089 | $ | 299,985,617 | $ | 199,237,470 | $ | 24,902,057 | $ | 41,343,170 | $ | 409,310,198 | |||||||||||||||
15
Report of Independent Registered Public Accounting Firm
To the Trustees of GMO Trust and the Shareholders of
GMO International Opportunities Equity Allocation Fund:
In our opinion, the accompanying statement of assets and liabilities, including the schedule of investments, and the related statements of operations and of changes in net assets and the financial highlights present fairly, in all material respects, the financial position of GMO International Opportunities Equity Allocation Fund (the "Fund") at February 28, 2009, the results of its operations for the year then ended, the changes in its net assets for each of the two years in the period then ended and the financial highlights for the periods indicated, in conformity with accounting principles generally accepted in the United States of America. These financial statements and financial highlights (hereafter referred to as "financial statements") are the responsibility of the Fund's management. Our responsibility is to express an opinion on these financial statements based on our audits. We conducted our audits of these financial st atements in accordance with the standards of the Public Company Accounting Oversight Board (United States). Those standards require that we plan and perform the audit to obtain reasonable assurance about whether the financial statements are free of material misstatement. An audit includes examining, on a test basis, evidence supporting the amounts and disclosures in the financial statements, assessing the accounting principles used and significant estimates made by management, and evaluating the overall financial statement presentation. We believe that our audits, which included confirmation of securities at February 28, 2009 by correspondence with the custodian, provide a reasonable basis for our opinion.
PricewaterhouseCoopers LLP
Boston, Massachusetts
April 29, 2009
16
GMO International Opportunities Equity Allocation Fund
(A Series of GMO Trust)
Fund Expenses
February 28, 2009 (Unaudited)
Expense Examples: The following information is in relation to expenses for the six month period ended February 28, 2009.
As a shareholder of the Fund, you may incur two types of costs: (1) transaction costs, including purchase premiums and redemption fees; and (2) ongoing costs, including indirect management fees, shareholder service fees, and other Fund expenses. This example is intended to help you understand your ongoing costs (in dollars) of investing in the Fund and to compare these costs with the ongoing costs of investing in other mutual funds.
These examples are based on an investment of $1,000 invested at the beginning of the period and held for the entire period, September 1, 2008 through February 28, 2009.
Actual Expenses
The first line of the table below provides information about actual account values and actual expenses. You may use the information in this line, together with the amount you invested, to estimate the expenses that you paid over the period. Simply divide your account value by $1,000 (for example, a $10,000,000 account value divided by $1,000 = 10,000), then multiply the result by the number in the first line under the heading entitled "Net Expense Incurred" to estimate the expenses you paid on your account during this period.
Hypothetical Example for Comparison Purposes
The second line of the table below provides information about hypothetical account values and hypothetical expenses based on the Fund's actual expense ratio and an assumed rate of return of 5% per year before expenses, which is not the Fund's actual return. The hypothetical account values and expenses may not be used to estimate the actual ending account balance or expenses you paid for the period. You may use this information to compare the ongoing costs of investing in the Fund with other funds. To do so, compare this 5% hypothetical example with the 5% hypothetical examples that appear in the shareholder reports of other funds.
Please note that the expenses shown in the table are meant to highlight your ongoing costs only and do not reflect any transactional costs, such as purchase premiums and redemption fees. Therefore, the second line of the table is useful in comparing ongoing costs only, and will not help you determine the relative total costs of owning different funds. In addition, if these transactional costs were included, your costs would have been higher.
| Annualized Net Expense Ratio | Beginning Account Value | Ending Account Value | Net Expense Incurred* | ||||||||||||||||
| Class III | |||||||||||||||||||
| 1) Actual | 0.60 | % | $ | 1,000.00 | $ | 587.00 | $ | 2.36 | |||||||||||
| 2) Hypothetical | 0.60 | % | $ | 1,000.00 | $ | 1,021.82 | $ | 3.01 | |||||||||||
* Expenses are calculated using the Class's annualized expense ratio (including indirect expenses incurred) for the six months ended February 28, 2009, multiplied by the average account value over the period, multiplied by 181 days in the period, divided by 365 days in the year.
17
GMO International Opportunities Equity Allocation Fund
(A Series of GMO Trust)
Tax Information for the Tax Year Ended February 28, 2009 (Unaudited)
The Fund will notify shareholders of amounts for use in preparing 2009 income tax forms in early 2010.
The Fund's distributions to shareholders include $81,286,099 from long-term capital gains.
For taxable, non-corporate shareholders, 65.94% of the income and short-term capital gains, if any, distributed in the Fund's fiscal year ended February 28, 2009 represents qualified dividend income subject to the 15% rate category.
18
Trustees and Officers (Unaudited)
The following tables list the Trust's Trustees and Officers as of the date of this report; their address and date of birth ("DOB"); their position with the Trust; the length of time holding that position with the Trust; their principal occupation(s) during the past five years; the number of portfolios in the fund complex they oversee; and other directorships they hold in companies subject to registration or reporting requirements of the Securities Exchange Act of 1934 (generally called "public companies") or in registered investment companies. The Trust's Statement of Additional Information ("SAI") includes additional information about the Trust's trustees, including changes subsequent to the date of the report. The SAI is available, without charge, upon request by writing GMO, c/o GMO Trust, 40 Rowes Wharf, Boston, MA 02110.
Independent Trustees:
| Name, Address, and DOB | Position(s) Held with Trust | Term of Office1 and Length of Time Served | Principal Occupation(s) During Past Five Years | Number of Portfolios in Fund Complex Overseen by Trustee | Other Directorships Held by Trustee | ||||||||||||||||||
| Donald W. Glazer, Esq. c/o GMO Trust 40 Rowes Wharf Boston, MA 02110 DOB: 07/26/1944 | Chairman of the Board of Trustees | Chairman of the Board of Trustees since March 2005; Lead Independent Trustee (September 2004 – March 2005); Trustee since December 2000. | Consultant – Law and Business2; Author of Legal Treatises. | 59 | None. | ||||||||||||||||||
1 Each Trustee is elected to serve during the continued lifetime of the Trust until he/she dies, resigns or is removed, or if sooner, until the next meeting of Shareholders called for the purpose of electing Trustees and until the election and qualification of his/her successor.
2 As part of Mr. Glazer's work as a consultant, he provides part-time consulting services to Goodwin Procter LLP ("Goodwin"). Goodwin has provided legal services to Renewable Resources, LLC, an affiliate of GMO; GMO, in connection with its relationship with Renewable Resources; and funds managed by Renewable Resources. Mr. Glazer has represented that he has no financial interest in, and is not involved in the provision of, such legal services. In the calendar years ended December 31, 2007 and December 31, 2008, these entities paid $789,416 and $183,864 respectively, in legal fees and disbursements to Goodwin. In correspondence with the Staff of the Securities and Exchange Commission beginning in August 2006, the Independent Trustees' legal counsel provided the Staff with information regarding Mr. Glazer's relationship with Goodwin and h is other business activities. On September 11, 2007, based on information that had been given to the Staff as of that date, the Staff provided oral no-action assurance consistent with the opinion of the Independent Trustees' legal counsel that Mr. Glazer is not an "interested person" of the Trust.
19
Independent Trustees — (Continued)
| Name, Address, and DOB | Position(s) Held with Trust | Term of Office1 and Length of Time Served | Principal Occupation(s) During Past Five Years | Number of Portfolios in Fund Complex Overseen by Trustee | Other Directorships Held by Trustee | ||||||||||||||||||
| W. Nicholas Thorndike c/o GMO Trust 40 Rowes Wharf Boston, MA 02110 DOB: 03/28/1933 | Trustee | Since March 2005. | Director or trustee of various corporations and charitable organizations, including Courier Corporation (a book publisher and manufacturer) (July 1989 – present); Putnam Funds (December 1992 – June 2004); and Providence Journal (a newspaper publisher) (December 1986 – December 2003). | 59 | Director of Courier Corporation (a book publisher and manufacturer); Member of the Investment Committee of Partners HealthCare System, Inc.3 | ||||||||||||||||||
| Peter Tufano c/o GMO Trust 40 Rowes Wharf Boston, MA 02110 DOB: 04/22/1957 | Trustee | Since December 2008. | Sylvan C. Coleman Professor of Financial Management, Harvard Business School (since 1989). | 59 | Trustee of State Street Navigator Securities Lending Trust (3 Portfolios). | ||||||||||||||||||
1 Each Trustee is elected to serve during the continued lifetime of the Trust until he/she dies, resigns or is removed, or if sooner, until the next meeting of Shareholders called for the purpose of electing Trustees and until the election and qualification of his/her successor.
3 Partners HealthCare System, Inc. is a client of the Manager.
20
Principal Officers:
| Name, Address, and DOB | Position(s) Held with Trust | Term of Office4 and Length of Time Served | Principal Occupation(s) During Past Five Years5 | ||||||||||||
| J.B. Kittredge DOB: 08/22/1954 | President and Chief Executive Officer | Since March 2009. | General Counsel, Grantham, Mayo, Van Otterloo & Co. LLC (October 2005 – Present); Partner, Ropes & Gray LLP. | ||||||||||||
| Sheppard N. Burnett c/o GMO Trust 40 Rowes Wharf Boston, MA 02110 DOB: 10/24/1968 | Treasurer and Chief Financial Officer | Chief Financial Officer since March 2007; Treasurer since November 2006; Assistant Treasurer, September 2004 – November 2006. | Fund Administration Staff, Grantham, Mayo, Van Otterloo & Co. LLC (June 2004 – present); Vice President, Director of Tax, Columbia Management Group (2002 – 2004). | ||||||||||||
| Brent C. Arvidson c/o GMO Trust 40 Rowes Wharf Boston, MA 02110 DOB: 06/26/1969 | Assistant Treasurer | Since August 1998. | Senior Fund Administrator, Grantham, Mayo, Van Otterloo & Co. LLC. | ||||||||||||
| John L. Nasrah c/o GMO Trust 40 Rowes Wharf Boston, MA 02110 DOB: 05/27/1977 | Assistant Treasurer | Since March 2007. | Fund Administrator, Grantham, Mayo, Van Otterloo & Co. LLC (September 2004 – present); Tax Analyst, Bain & Company, Inc. (June 2003 – September 2004). | ||||||||||||
| Mahmoodur Rahman c/o GMO Trust 40 Rowes Wharf Boston, MA 02110 DOB: 11/30/1967 | Assistant Treasurer | Since September 2007. | Fund Administrator, Grantham, Mayo, Van Otterloo & Co. LLC (April 2007 – present); Vice President and Senior Tax Manager, Massachusetts Financial Services Company (January 2000 – April 2007). | ||||||||||||
| Michael E. Gillespie c/o GMO Trust 40 Rowes Wharf Boston, MA 02110 DOB: 02/18/1958 | Chief Compliance Officer | Since March 2005. | Vice President of Compliance (June 2004 – February 2005) and Director of Domestic Compliance (March 2002 – June 2004), Fidelity Investments. | ||||||||||||
4 Each officer is elected to hold such office until his or her successor is duly elected and qualified to carry out the duties and responsibilities of the office, or until he or she resigns or is removed from office.
5 Each of Messrs. Burnett, Arvidson, Bohan, and Pottle serves as an officer and/or director of certain pooled investment vehicles of which GMO or an affiliate of GMO serves as the investment adviser.
21
Principal Officers — (Continued)
| Name, Address, and DOB | Position(s) Held with Trust | Term of Office4 and Length of Time Served | Principal Occupation(s) During Past Five Years5 | ||||||||||||
| Jason B. Harrison c/o GMO Trust 40 Rowes Wharf Boston, MA 02110 DOB: 01/29/1977 | Vice President and Clerk | Vice President since November 2006; Clerk since March 2006. | Legal Counsel, Grantham, Mayo, Van Otterloo & Co. LLC (since February 2006) and Attorney, Ropes & Gray LLP (September 2002 – February 2006). | ||||||||||||
| David L. Bohan c/o GMO Trust 40 Rowes Wharf Boston, MA 02110 DOB: 06/21/1964 | Vice President and Assistant Clerk | Vice President since March 2005; Assistant Clerk since March 2006. | Legal Counsel, Grantham, Mayo, Van Otterloo & Co. LLC. | ||||||||||||
| Gregory L. Pottle c/o GMO Trust 40 Rowes Wharf Boston, MA 02110 DOB: 07/09/1971 | Vice President and Assistant Clerk | Since November 2006. | Legal Counsel, Grantham, Mayo, Van Otterloo & Co. LLC. | ||||||||||||
| Anne K. Trinque c/o GMO Trust 40 Rowes Wharf Boston, MA 02110 DOB: 04/15/1978 | Vice President and Assistant Clerk | Since September 2007. | Legal Counsel, Grantham, Mayo, Van Otterloo & Co. LLC (January 2007 – present); Attorney, Goodwin Procter LLP (September 2003 – January 2007). | ||||||||||||
| Cheryl Wakeham c/o GMO Trust 40 Rowes Wharf Boston, MA 02110 DOB: 10/29/1958 | Vice President and Anti-Money Laundering Officer | Since December 2004. | Manager, Client Service Administration, Grantham, Mayo, Van Otterloo & Co. LLC. | ||||||||||||
4 Each officer is elected to hold such office until his or her successor is duly elected and qualified to carry out the duties and responsibilities of the office, or until he or she resigns or is removed from office.
5 Each of Messrs. Burnett, Arvidson, Bohan, and Pottle serves as an officer and/or director of certain pooled investment vehicles of which GMO or an affiliate of GMO serves as the investment adviser.
22
GMO U.S. Equity Allocation Fund
(A Series of GMO Trust)
Annual Report
February 28, 2009
For a free copy of the Fund's proxy voting guidelines, shareholders may call 1-617-346-7646 (collect) or visit the Securities and Exchange Commission's website at www.sec.gov. Information regarding how the Fund voted proxies relating to portfolio securities during the most recent 12-month period ended June 30 is available on GMO's website at www.gmo.com, or on the Securities and Exchange Commission's website at www.sec.gov.
The Fund files its complete schedule of portfolio holdings with the Securities and Exchange Commission for the first and third quarter of each fiscal year on Form N-Q, which is available on the Commission's website at www.sec.gov. The Fund's Form N-Q may be reviewed and copied at the Commission's Public Reference Room in Washington, D.C. Information on the operation of the Public Reference Room may be obtained by calling 1-800-SEC-0330. The Fund has a policy with respect to disclosure of portfolio holdings under which it may also make available on GMO's website at www.gmo.com a complete schedule of portfolio holdings.
This report is prepared for the general information of shareholders. It is authorized for distribution to prospective investors only when preceded or accompanied by a prospectus for the GMO Trust, which contains a complete discussion of the risks associated with an investment in this Fund and other important information. The GMO Trust prospectus can be obtained at www.gmo.com.
GMO U.S. Equity Allocation Fund
(A Series of GMO Trust)
Portfolio Management
Day-to-day management of the Fund's portfolio is the responsibility of the Asset Allocation team at Grantham, Mayo, Van Otterloo & Co. LLC.
Management Discussion and Analysis of Fund Performance
The GMO U.S. Equity Allocation Fund returned -32.4% for the fiscal year ended February 28, 2009, as compared to -43.5% for the Russell 3000 Index. During the fiscal year the Fund was exposed substantially to common stocks through its investment in underlying GMO mutual funds.
Implementation was positive, as the GMO U.S. Core Equity, GMO U.S. Quality Equity, and GMO U.S. Small/Mid Cap Value Funds outperformed their respective benchmarks. Asset allocation was relatively neutral during the period.
The views expressed herein are exclusively those of Grantham, Mayo, Van Otterloo & Co. LLC Management as of the date of this report and are subject to change. GMO disclaims any responsibility to update such views. They are not meant as investment advice. References to specific securities are not recommendations of such securities and may not be representative of any GMO portfolio's current or future investments.
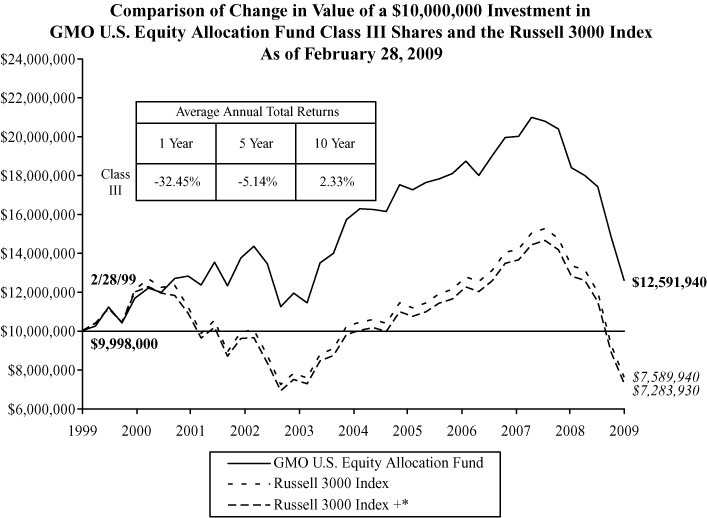
Performance data quoted represents past performance and is not indicative of future results. The investment return and principal value of an investment will fluctuate so that an investor's shares, when redeemed, may be worth more or less than their original cost. Current performance data may be lower or higher than the performance data provided herein. To obtain performance information to the most recent month-end, visit www.gmo.com. Performance shown is net of all fees after reimbursement from the Manager. Each performance figure assumes a purchase at the beginning and redemption at the end of the stated period and reflects a transaction fee of .02% on the purchase and .02% on the redemption. Transaction fees are retained by the Fund to cover trading costs. Returns would have been lower had certain expenses not been reimbursed during the periods shown and do not include the effect of taxes on distributions and redemptions. All information is unaudited.
* Russell 3000 Index + represents the S&P 500 Index prior to 2/28/03 and the Russell 3000 Index thereafter.
GMO U.S. Equity Allocation Fund
(A Series of GMO Trust)
Investments Concentration Summary
February 28, 2009 (Unaudited)
| Asset Class Summary* | % of Total Net Assets | ||||||
| Common Stocks | 94.7 | % | |||||
| Short-Term Investments | 3.0 | ||||||
| Futures | (0.2 | ) | |||||
| Other | 2.5 | ||||||
| 100.0 | % | ||||||
* The table above incorporates aggregate indirect asset class exposure associated with investments in other funds of GMO Trust ("underlying funds").
1
GMO U.S. Equity Allocation Fund
(A Series of GMO Trust)
Schedule of Investments
(showing percentage of total net assets)
February 28, 2009
| Shares / Par Value ($) | Description | Value ($) | |||||||||||||
| MUTUAL FUNDS — 100.0% | |||||||||||||||
| Affiliated Issuers — 100.0% | |||||||||||||||
| 4,104,850 | GMO U.S. Core Equity Fund, Class VI | 31,320,002 | |||||||||||||
| 2,604,864 | GMO U.S. Quality Equity Fund, Class VI | 36,936,978 | |||||||||||||
| 71,932 | GMO U.S. Small/Mid Cap Growth Fund, Class III | 542,365 | |||||||||||||
| 139,529 | GMO U.S. Small/Mid Cap Value Fund, Class III | 619,508 | |||||||||||||
| TOTAL MUTUAL FUNDS (COST $109,572,657) | 69,418,853 | ||||||||||||||
| SHORT-TERM INVESTMENTS — 0.0% | |||||||||||||||
| 18,801 | State Street Eurodollar Time Deposit, 0.01%, due 03/02/09 | 18,801 | |||||||||||||
| TOTAL SHORT-TERM INVESTMENTS (COST $18,801) | 18,801 | ||||||||||||||
| TOTAL INVESTMENTS — 100.0% (Cost $109,591,458) | 69,437,654 | ||||||||||||||
| Other Assets and Liabilities (net) — (0.0%) | (22,199 | ) | |||||||||||||
| TOTAL NET ASSETS — 100.0% | $ | 69,415,455 | |||||||||||||
See accompanying notes to the financial statements.
2
GMO U.S. Equity Allocation Fund
(A Series of GMO Trust)
Statement of Assets and Liabilities — February 28, 2009
| Assets: | |||||||
| Investments in unaffiliated issuers, at value (cost $18,801) (Note 2) | $ | 18,801 | |||||
| Investments in affiliated issuers, at value (cost $109,572,657) (Notes 2 and 8) | 69,418,853 | ||||||
| Receivable for expenses reimbursed by Manager (Note 3) | 7,410 | ||||||
| Total assets | 69,445,064 | ||||||
| Liabilities: | |||||||
| Payable to affiliate for (Note 3): | |||||||
| Trustees and Chief Compliance Officer of GMO Trust fees | 262 | ||||||
| Accrued expenses | 29,347 | ||||||
| Total liabilities | 29,609 | ||||||
| Net assets | $ | 69,415,455 | |||||
| Net assets consist of: | |||||||
| Paid-in capital | $ | 117,979,408 | |||||
| Distributions in excesss of net realized gain | (8,410,149 | ) | |||||
| Net unrealized depreciation | (40,153,804 | ) | |||||
| $ | 69,415,455 | ||||||
| Net assets attributable to: | |||||||
| Class III shares | $ | 69,415,455 | |||||
| Shares outstanding: | |||||||
| Class III | 20,959,119 | ||||||
| Net asset value per share: | |||||||
| Class III | $ | 3.31 | |||||
See accompanying notes to the financial statements.
3
GMO U.S. Equity Allocation Fund
(A Series of GMO Trust)
Statement of Operations — Year Ended February 28, 2009
| Investment Income: | |||||||
| Dividends from affiliated issuers (Note 8) | $ | 1,642,605 | |||||
| Interest | 192 | ||||||
| Total investment income | 1,642,797 | ||||||
| Expenses: | |||||||
| Custodian, fund accounting agent and transfer agent fees | 8,114 | ||||||
| Audit and tax fees | 35,521 | ||||||
| Legal fees | 1,569 | ||||||
| Trustees fees and related expenses (Note 3) | 1,026 | ||||||
| Registration fees | 5,990 | ||||||
| Miscellaneous | 2,006 | ||||||
| Total expenses | 54,226 | ||||||
| Fees and expenses reimbursed by Manager (Note 3) | (52,597 | ) | |||||
| Expense reductions (Note 2) | (989 | ) | |||||
| Net expenses | 640 | ||||||
| Net investment income (loss) | 1,642,157 | ||||||
| Realized and unrealized gain (loss): | |||||||
| Net realized gain (loss) on: | |||||||
| Investments in affiliated issuers | (8,121,992 | ) | |||||
| Realized gains distributions from affiliated issuers (Note 8) | 225,985 | ||||||
| Net realized gain (loss) | (7,896,007 | ) | |||||
| Change in net unrealized appreciation (depreciation) on: | |||||||
| Investments in affiliated issuers | (27,592,432 | ) | |||||
| Net realized and unrealized gain (loss) | (35,488,439 | ) | |||||
| Net increase (decrease) in net assets resulting from operations | $ | (33,846,282 | ) | ||||
See accompanying notes to the financial statements.
4
GMO U.S. Equity Allocation Fund
(A Series of GMO Trust)
Statement of Changes in Net Assets
| Year Ended February 28, 2009 | Year Ended February 29, 2008 | ||||||||||
| Increase (decrease) in net assets: | |||||||||||
| Operations: | |||||||||||
| Net investment income (loss) | $ | 1,642,157 | $ | 2,248,159 | |||||||
| Net realized gain (loss) | (7,896,007 | ) | 11,547,121 | ||||||||
| Change in net unrealized appreciation (depreciation) | (27,592,432 | ) | (18,144,547 | ) | |||||||
| Net increase (decrease) in net assets from operations | (33,846,282 | ) | (4,349,267 | ) | |||||||
| Distributions to shareholders from: | |||||||||||
| Net investment income | |||||||||||
| Class III | (1,637,551 | ) | (5,352,652 | ) | |||||||
| Net realized gains | |||||||||||
| Class III | (1,644,462 | ) | (11,494,628 | ) | |||||||
| (3,282,013 | ) | (16,847,280 | ) | ||||||||
| Net share transactions (Note 7): | |||||||||||
| Class III | 11,468,444 | (33,069,596 | ) | ||||||||
| Purchase premiums and redemption fees (Notes 2 and 7): | |||||||||||
| Class III | 8,571 | 20,815 | |||||||||
| Total increase (decrease) in net assets resulting from net share transactions, purchase premiums and redemption fees | 11,477,015 | (33,048,781 | ) | ||||||||
| Total increase (decrease) in net assets | (25,651,280 | ) | (54,245,328 | ) | |||||||
| Net assets: | |||||||||||
| Beginning of period | 95,066,735 | 149,312,063 | |||||||||
| End of period | $ | 69,415,455 | $ | 95,066,735 | |||||||
See accompanying notes to the financial statements.
5
GMO U.S. Equity Allocation Fund
(A Series of GMO Trust)
Financial Highlights
(For a Class III share outstanding throughout each period)
| Year Ended February 28/29, | |||||||||||||||||||||||
| 2009 | 2008 | 2007 | 2006 | 2005 | |||||||||||||||||||
| Net asset value, beginning of period | $ | 5.11 | $ | 6.38 | $ | 6.56 | $ | 6.41 | $ | 6.40 | |||||||||||||
| Income (loss) from investment operations: | |||||||||||||||||||||||
| Net investment income (loss)(a)† | 0.09 | 0.11 | 0.10 | 0.10 | 0.11 | ||||||||||||||||||
| Net realized and unrealized gain (loss) | (1.70 | ) | (0.42 | ) | 0.28 | 0.31 | 0.34 | ||||||||||||||||
| Total from investment operations | (1.61 | ) | (0.31 | ) | 0.38 | 0.41 | 0.45 | ||||||||||||||||
| Less distributions to shareholders: | |||||||||||||||||||||||
| From net investment income | (0.08 | ) | (0.32 | ) | (0.15 | ) | (0.12 | ) | (0.14 | ) | |||||||||||||
| From net realized gains | (0.11 | ) | (0.64 | ) | (0.41 | ) | (0.14 | ) | (0.30 | ) | |||||||||||||
| Total distributions | (0.19 | ) | (0.96 | ) | 0.56 | (0.26 | ) | (0.44 | ) | ||||||||||||||
| Net asset value, end of period | $ | 3.31 | $ | 5.11 | $ | 6.38 | $ | 6.56 | $ | 6.41 | |||||||||||||
| Total Return(b) | (32.42 | )% | (6.43 | )% | 6.48 | % | 6.45 | % | 7.18 | % | |||||||||||||
| Ratios/Supplemental Data: | |||||||||||||||||||||||
| Net assets, end of period (000's) | $ | 69,415 | $ | 95,067 | $ | 149,312 | $ | 173,146 | $ | 151,378 | |||||||||||||
| Net expenses to average daily net assets(c) | 0.00 | %(d)(e) | 0.00 | %(d)(e) | 0.04 | % | 0.01 | % | 0.00 | %(e) | |||||||||||||
| Net investment income to average daily net assets(a) | 1.94 | % | 1.78 | % | 1.63 | % | 1.52 | % | 1.75 | % | |||||||||||||
| Portfolio turnover rate | 39 | % | 26 | % | 35 | % | 13 | % | 16 | % | |||||||||||||
| Fees and expenses reimbursed by the Manager to average daily net assets: | 0.06 | % | 0.04 | % | 0.18 | % | 0.51 | % | 0.54 | % | |||||||||||||
| Purchase premiums and redemption fees consisted of the following per share amounts:(f)† | $ | 0.00 | $ | 0.00 | $ | 0.00 | $ | 0.00 | $ | 0.00 | |||||||||||||
(a) Net investment income is affected by the timing of the declaration of dividends by the underlying funds in which the Fund invests.
(b) The total returns would have been lower had certain expenses not been reimbursed and/or waived during the periods shown and assumes the effect of reinvested distributions. Calculation excludes purchase premiums and redemption fees which are borne by the shareholder.
(c) Net expenses exclude expenses incurred indirectly through investment in the underlying funds (See Note 3).
(d) The net expense ratio does not include the effect of expense reductions.
(e) Net expenses were less than 0.01%.
(f) Purchase premiums and redemption fees were less than $0.01 per share.
† Calculated using average shares outstanding throughout the period.
See accompanying notes to the financial statements.
6
GMO U.S. Equity Allocation Fund
(A Series of GMO Trust)
Notes to Financial Statements
February 28, 2009
1. Organization
GMO U.S. Equity Allocation Fund (the "Fund") is a series of GMO Trust (the "Trust"). The Fund is registered under the Investment Company Act of 1940, as amended, as an open-end, non-diversified management investment company. The Fund is advised and managed by Grantham, Mayo, Van Otterloo & Co. LLC (the "Manager" or "GMO"). The Trust was established as a Massachusetts business trust under the laws of The Commonwealth of Massachusetts on June 24, 1985. The Declaration of Trust permits the Trustees of the Trust ("Trustees") to create an unlimited number of series of shares ("Funds") and to subdivide Funds into classes.
The Fund seeks total return greater than that of the Russell 3000 Index. The Fund is a fund of funds and invests primarily in shares of the GMO U.S. Equity Funds, and also may invest in shares of GMO Flexible Equities Fund (collectively, the "underlying Funds"). The Fund seeks exposure to U.S. equity securities in the Wilshire 5000 Stock Index through its investments in each of the underlying Funds.
The financial statements of the underlying funds should be read in conjunction with the Fund's financial statements. These financial statements are available, without charge, upon request, by calling (617) 346-7646 (collect) or by visiting GMO's website at www.gmo.com. Shares of GMO Flexible Equities Fund are not publicly available for direct purchase.
2. Significant accounting policies
The following is a summary of significant accounting policies followed by the Fund in the preparation of its financial statements. These policies are in conformity with accounting principles generally accepted in the United States of America ("U.S. GAAP") and have been consistently followed by the Fund in preparing its financial statements. The preparation of financial statements in accordance with U.S. GAAP requires management to make estimates and assumptions that affect the reported amounts and disclosures in the financial statements. Actual results could differ from those estimates. The accounting records of the Fund are maintained in U.S. dollars.
Portfolio valuation
Shares of the underlying funds and other mutual funds are generally valued at their net asset value.
Investments held by the underlying funds are valued as follows. Securities listed on a securities exchange for which market quotations are readily available are valued at the last sale price or official closing price on each business day, or if there is no such reported sale or official closing price, at the most recent quoted bid price. Unlisted securities for which market quotations are readily available are generally valued at the most recent quoted bid price. Debt instruments with a remaining maturity of sixty days or less are generally valued at amortized cost, which approximates fair value. Securities for which quotations are not readily available or whose values the Manager has determined to be unreliable are valued at fair value as
7
GMO U.S. Equity Allocation Fund
(A Series of GMO Trust)
Notes to Financial Statements — (Continued)
February 28, 2009
determined in good faith by the Trustees or persons acting at their direction pursuant to procedures approved by the Trustees. By its nature, a fair value price is a good faith estimate of the value of a security at a given point in time and may not reflect the value that would be realized if the security were sold. The difference between a fair value price and the value realized upon a sale could be material.
In September 2006, the Financial Accounting Standards Board ("FASB") issued Statement of Financial Accounting Standards No. 157, Fair Value Measurements ("SFAS 157"). SFAS 157 is effective for the Fund's current fiscal year. While the adoption of SFAS 157 does not have an effect on the Fund's net asset value, it does require additional disclosures about fair value measurements. SFAS 157 establishes a three-level hierarchy for disclosure of fair value measurements. The valuation hierarchy is based upon the reliability of inputs to the valuation of the Fund's investments. The three levels are defined as follows:
Level 1 – Valuations based on quoted prices for identical securities in active markets.
Level 2 – Valuations determined using other significant direct or indirect observable inputs.
Level 3 – Valuations based on inputs that are unobservable and significant.
The inputs or methodology used for valuing securities are not necessarily an indication of the risk associated with investing in those securities.
The following is a summary of the fair valuations according to inputs used as of February 28, 2009 in valuing the Fund's investments:
| Asset Valuation Inputs | Investments in Securities | Other Financial Instruments | |||||||||
| Level 1 - Quoted Prices | $ | 69,437,654 | $ | — | |||||||
| Level 2 - Other Significant Observable Inputs | — | — | |||||||||
| Level 3 - Significant Unobservable Inputs | — | — | |||||||||
| Total | $ | 69,437,654 | $ | — | |||||||
| Liability Valuation Inputs | Investments in Securities | Other Financial Instruments | |||||||||
| Level 1 - Quoted Prices | $ | — | $ | — | |||||||
| Level 2 - Other Significant Observable Inputs | — | — | |||||||||
| Level 3 - Significant Unobservable Inputs | — | — | |||||||||
| Total | $ | — | $ | — | |||||||
For the underlying fund's summary of valuation inputs please refer to the respective fund's portfolio valuation note.
The Fund held no investments or other financial instruments at either February 29, 2008 or February 28, 2009, whose fair value was determined using Level 3 inputs.
8
GMO U.S. Equity Allocation Fund
(A Series of GMO Trust)
Notes to Financial Statements — (Continued)
February 28, 2009
Repurchase agreements
The Fund may enter into repurchase agreements. Under a repurchase agreement the Fund acquires a security for cash and obtains a simultaneous commitment from the seller to repurchase the security at an agreed upon price and date. The Fund, through its custodian, takes possession of securities collateralizing the repurchase agreement. The collateral is marked to market daily to ensure that the market value of the underlying assets is at least equal to the amount owed to the Fund in the event of default by the seller. If the seller of a repurchase agreement defaults or enters into insolvency proceedings and the value of the collateral declines, the Fund's recovery of cash may be delayed or limited. The Fund had no repurchase agreements outstanding at the end of the period.
Taxes and distributions
The Fund intends to qualify each tax year as a regulated investment company under Subchapter M of the Internal Revenue Code of 1986, as amended (the "Code"). The Fund intends to distribute substantially all of its net investment income and all of its net realized short-term and long-term capital gain, if any, after giving effect to any available capital loss carryforwards for U.S. federal income tax purposes. Therefore, no provision for U.S. federal income or excise tax is necessary.
The Fund's policy is to declare and pay distributions from net investment income, if any, semiannually, and from net realized short-term and long-term capital gain, if any, at least annually. All distributions are paid in shares of the Fund, at net asset value, unless the shareholder elects to receive cash distributions. Distributions to shareholders are recorded by the Fund on the ex-dividend date.
Income and capital gain distributions are determined in accordance with U.S. federal income tax regulations, which may differ from U.S. GAAP. Certain capital accounts in the financial statements are periodically adjusted for permanent differences in order to reflect their tax character. These adjustments have no impact on net assets or net asset value per share. Temporary differences that arise from recognizing certain items of income, expense, gain or loss in different periods for financial statement and tax purposes will reverse at some time in the future. Distributions in excess of net investment income or net realized gains are temporary over-distributions for financial statement purposes resulting from differences in the recognition or classification of income or distributions for financial statement and tax purposes.
U.S. GAAP and tax accounting differences primarily relate to capital loss carryforwards and losses on wash sale transactions.
The following reclassification represents the amount necessary to report the stated components of net assets on a tax basis, excluding certain temporary differences, as of February 28, 2009. The financial highlights exclude these adjustments.
| Distributions in Excess of Net Investment Income | Distributions in Excess of Net Realized Gain | Paid-in Capital | |||||||||
| $ | (4,606 | ) | $ | 9,376 | $ | (4,770 | ) | ||||
9
GMO U.S. Equity Allocation Fund
(A Series of GMO Trust)
Notes to Financial Statements — (Continued)
February 28, 2009
The tax character of distributions declared to shareholders is as follows:
| 2/28/2009 | 2/29/2008 | ||||||||||
| Ordinary income (including any net short-term capital gain) | $ | 1,646,927 | $ | 5,350,424 | |||||||
| Net long-term capital gain | 1,635,086 | 11,496,856 | |||||||||
| Total distributions | $ | 3,282,013 | $ | 16,847,280 | |||||||
Distributions in excess of tax basis earnings and profits, if significant, are reported in the financial statements as a return of capital for tax purposes.
As of February 28, 2009, the Fund had capital loss carryforwards available to offset future realized gains if any, to the extent permitted by the Code. Utilization of the capital loss carryforwards could be subject to limitations imposed by the Code related to share ownership activity. Such losses expire as follows:
| 2/29/2012 | $ | (136,192 | ) | ||||
| 2/28/2017 | (4,328,424 | ) | |||||
| Total | $ | (4,464,616 | ) | ||||
As of February 28, 2009, the Fund elected to defer March 1, 2009 post-October capital losses of $62,690.
As of February 28, 2009, the approximate cost for U.S. federal income tax purposes and gross and net unrealized appreciation (depreciation) in value of investments were as follows:
| Aggregate Cost | Gross Unrealized Appreciation | Gross Unrealized (Depreciation) | Net Unrealized Appreciation (Depreciation) | ||||||||||||
| $ | 113,474,300 | $ | — | $ | (44,036,646 | ) | $ | (44,036,646 | ) | ||||||
The Fund is subject to the provisions of Financial Accounting Standards Board Interpretation No. 48 ("FIN 48"), Accounting for Uncertainty in Income Taxes — an Interpretation of FASB Statement No. 109. FIN 48 sets forth a minimum threshold for financial statement recognition of a tax position taken or expected to be taken in a tax return that could affect the Fund's financial statements. The Fund did not have any unrecognized tax benefits or liabilities at February 28, 2009, nor did it have any increases or decreases in unrecognized tax benefits or liabilities for the period then ended. The Fund is subject to examination prior to the expiration of the statute of limitations by U.S. federal and state tax authorities for tax returns filed.
10
GMO U.S. Equity Allocation Fund
(A Series of GMO Trust)
Notes to Financial Statements — (Continued)
February 28, 2009
Security transactions and related investment income
Security transactions in the financial statements are accounted for on the trade date. Income dividends and capital gain distributions from the underlying funds are recorded on the ex-dividend date. Interest income is recorded on the accrual basis. Non-cash dividends, if any, are recorded at the fair market value of the asset received. In determining the net gain or loss on securities sold, the Fund uses the identified cost basis for the purposes of determining the cost basis.
Expenses
The majority of the expenses of the Trust are directly identifiable to an individual fund. Expenses that are not readily identifiable to a specific fund are allocated taking into consideration, among other things, the nature and type of expense and the relative size of the funds. In addition, the Fund incurs fees and expenses indirectly as a shareholder in the underlying funds. Because the underlying funds have different expense and fee levels and the Fund may own different proportions of the underlying funds at different times, the amount of fees and expenses indirectly incurred by the Fund will vary and the Manager has a conflict in allocating among the underlying funds. (See Note 3).
State Street Bank and Trust Company ("State Street") serves as custodian, fund accounting agent and transfer agent of the Fund. State Street's fees may be reduced by an earnings allowance calculated on the average daily cash balances the Fund maintains with State Street. The Fund receives the benefit of the earnings allowance. Credit balances or expense reimbursements used to reduce fees, if any, are reported as a reduction of expenses in the Statement of Operations.
Purchases and redemptions of Fund shares
Effective June 30, 2008, the premium on cash purchases and fee on cash redemptions of Fund shares were each changed to 0.01% of the amount invested or redeemed. Effective September 30, 2008, the premium on cash purchases and fee on cash redemptions were each changed to 0.02% of the amount invested or redeemed. As of February 28, 2009, the premium on cash purchases and fee on cash redemptions were each 0.02% of the amount invested or redeemed. The level of purchase premium and redemption fee for the Fund may be adjusted to account for changes in the Fund's investments (i.e., changes in the percentage of Fund assets allocated to each underlying fund). The Fund may impose a new purchase premium and/or redemption fee, or modify or eliminate an existing purchase premium and/or redemption fee, at any time. If the Manager determines that any portion of a cash purchase or redemption is offset by a corresponding cash redemption or purcha se on the same day, the Fund will ordinarily waive or reduce the purchase premium or redemption fee with respect to that portion. All or portion of the redemption fees may be waived at the manager's discretion under circumstances in which the Manager deems it equitable to do so, including without limitation in cases where the weighted average of (i) the estimated transaction costs for directly held assets and (ii) the redemption fees, if any, imposed by the underlying funds is less than the Fund's redemption fee. In addition, the Fund may waive or reduce the purchase premium or redemption fee in extraordinary circumstances if the purchase or redemption will not cause the Fund to incur transaction costs. All purchase premiums and redemption fees are paid to the Fund and recorded by the Fund as paid-in capital. The Fund will waive or reduce the purchase premium relating to the in-kind portion of a purchase transaction except for estimated or known transaction costs (e.g. stamp duties and transfer taxes) incurr ed by the Fund as a result of the transfer of the purchasing shareholder's securities to the
11
GMO U.S. Equity Allocation Fund
(A Series of GMO Trust)
Notes to Financial Statements — (Continued)
February 28, 2009
Fund. In-kind redemption transactions are generally not subject to redemption fees except when they include a cash component. However, when a substantial portion of a Fund is being redeemed, the Fund may charge a redemption fee based on estimated or known transaction costs resulting from those redemptions. The Fund charges no premium for reinvested distributions.
Recently issued accounting pronouncement
In March 2008, FASB issued Statement of Financial Accounting Standards No. 161, Disclosures about Derivative Instruments and Hedging Activities ("SFAS 161"). SFAS 161 is effective for fiscal years and interim periods beginning after November 15, 2008. SFAS 161 requires enhanced disclosures about the Fund's derivative and hedging activities. The Manager is currently evaluating the impact the adoption of SFAS 161 will have on the Fund's financial statement disclosures.
3. Fees and other transactions with affiliates
The Manager decides how to allocate the assets of the Fund among underlying funds. The Manager does not directly charge the Fund an advisory fee or shareholder service fee, but it receives varying management and shareholder service fees from the underlying funds in which the Fund invests. Because of that variation the levels of indirect net expenses set forth below are affected by the Manager's asset allocation decisions.
Through at least June 30, 2009, the Manager has contractually agreed to reimburse the Fund for Fund expenses incurred through that date (excluding "Excluded Expenses", as defined below). Excluded Expenses include fees and expenses of the independent Trustees of the Trust, fees and expenses for legal services not approved by the Manager for the Trust, compensation and expenses of the Trust's Chief Compliance Officer ("CCO") (excluding any employee benefits), brokerage commissions, securities lending fees and expenses, interest expense, transfer taxes, and other investment-related costs (including expenses associated with investments in any company that is an investment company or would be an investment company under the 1940 Act, but for the exceptions to the definition of investment company provided in Section 3(c)(1) and 3(c)(7) of the 1940 Act), hedging transaction fees, extraordinary, non-recurring and certain other unusual e xpenses (including taxes).
The Fund incurs fees and expenses indirectly as a shareholder in the underlying funds. For the year ended February 28, 2009, these indirect fees and expenses expressed as an annualized percentage of the Fund's average daily net assets were as follows:
| Indirect Net Expenses (excluding shareholder service fees) | Indirect Shareholder Service Fees | Total Indirect Expenses | |||||||||
| 0.322 | % | 0.057 | % | 0.379 | % | ||||||
The Fund's portion of the fees paid by the Trust to the Trust's independent Trustees and CCO during the year ended February 28, 2009 was $995 and $603, respectively. The compensation and expenses of the
12
GMO U.S. Equity Allocation Fund
(A Series of GMO Trust)
Notes to Financial Statements — (Continued)
February 28, 2009
CCO are included in miscellaneous expenses in the Statement of Operations. The Fund paid no remuneration to any other officer of the Trust.
4. Purchases and sales of securities
Cost of purchases and proceeds from sales of securities, excluding short-term investments and class exchanges, for the year ended February 28, 2009 aggregated $43,901,715 and $33,833,587, respectively.
5. Guarantees
In the normal course of business the Fund enters into contracts with third-party service providers that contain a variety of representations and warranties and that provide general indemnifications. The Fund's maximum exposure under these arrangements is unknown, as it involves future claims that may be made against the Fund that have not yet occurred. Based on experience, management is of the view that the risk of loss in connection with its indemnification obligations is remote; however, there can be no assurance that such obligations will not result in material liabilities that adversely affect the Fund.
6. Principal shareholders and related parties
As of February 28, 2009, 69.32% of the outstanding shares of the Fund were held by two shareholders, each holding more than 10% of the Fund's outstanding shares. On that date, no other shareholder owned more than 10% of the outstanding shares of the Fund. Redemptions from (or investments into) the Fund by or on behalf of these large shareholders may have a material effect on the Fund.
As of February 28, 2009, less than 0.01% of the Fund's shares were held by senior management of the Manager and GMO Trust officers and none of the Fund's shares were held by accounts for which the Manager had investment discretion.
7. Share transactions
The Declaration of Trust permits the Trust to issue an unlimited number of shares of beneficial interest (without par value). Transactions in Fund shares were as follows:
| Year Ended February 28, 2009 | Year Ended February 29, 2008 | ||||||||||||||||||
| Class III: | Shares | Amount | Shares | Amount | |||||||||||||||
| Shares sold | 7,356,216 | $ | 34,747,429 | 1,644,319 | $ | 9,739,477 | |||||||||||||
| Shares issued to shareholders in reinvestment of distributions | 743,764 | 3,203,902 | 2,858,946 | 16,847,279 | |||||||||||||||
| Shares repurchased | (5,738,257 | ) | (26,482,887 | ) | (9,315,683 | ) | (59,656,352 | ) | |||||||||||
| Purchase premiums | — | 3,848 | — | 2,918 | |||||||||||||||
| Redemption fees | — | 4,723 | — | 17,897 | |||||||||||||||
| Net increase (decrease) | 2,361,723 | $ | 11,477,015 | (4,812,418 | ) | $ | (33,048,781 | ) | |||||||||||
13
GMO U.S. Equity Allocation Fund
(A Series of GMO Trust)
Notes to Financial Statements — (Continued)
February 28, 2009
8. Investments in affiliated issuers
A summary of the Fund's transactions in the shares of affiliated issuers during the year ended February 28, 2009 is set forth below:
| Affiliate | Value, beginning of period | Purchases | Sales Proceeds | Dividend Income | Distributions of Realized Gains | Value, end of period | |||||||||||||||||||||
| GMO U.S. Core Equity Fund, Class VI | $ | 56,188,236 | $ | 17,090,524 | $ | 23,593,098 | $ | 779,123 | $ | — | $ | 31,320,002 | |||||||||||||||
| GMO U.S. Quality Equity Fund, Class VI | 36,390,514 | 26,792,904 | 9,790,489 | 845,195 | 225,985 | 36,936,978 | |||||||||||||||||||||
| GMO U.S. Small/Mid Cap Growth Fund, Class III | 1,229,704 | 3,346 | 225,000 | 3,346 | — | 542,365 | |||||||||||||||||||||
| GMO U.S. Small/Mid Cap Value Fund, Class III | 1,256,760 | 14,941 | 225,000 | 14,941 | — | 619,508 | |||||||||||||||||||||
| Totals | $ | 95,065,214 | $ | 43,901,715 | $ | 33,833,587 | $ | 1,642,605 | $ | 225,985 | $ | 69,418,853 | |||||||||||||||
14
Report of Independent Registered Public Accounting Firm
To the Trustees of GMO Trust and the Shareholders of
GMO U.S. Equity Allocation Fund:
In our opinion, the accompanying statement of assets and liabilities, including the schedule of investments, and the related statements of operations and of changes in net assets and the financial highlights present fairly, in all material respects, the financial position of GMO U.S. Equity Allocation Fund (the "Fund") at February 28, 2009, the results of its operations for the year then ended, the changes in its net assets for each of the two years in the period then ended and the financial highlights for each of the five years in the period then ended, in conformity with accounting principles generally accepted in the United States of America. These financial statements and financial highlights (hereafter referred to as "financial statements") are the responsibility of the Fund's management. Our responsibility is to express an opinion on these financial statements based on our audits. We conducted our audits of these financial statements in accordance with the standards of the Public Company Accounting Oversight Board (United States). Those standards require that we plan and perform the audit to obtain reasonable assurance about whether the financial statements are free of material misstatement. An audit includes examining, on a test basis, evidence supporting the amounts and disclosures in the financial statements, assessing the accounting principles used and significant estimates made by management, and evaluating the overall financial statement presentation. We believe that our audits, which included confirmation of securities at February 28, 2009 by correspondence with the custodian, provide a reasonable basis for our opinion.
PricewaterhouseCoopers LLP
Boston, Massachusetts
April 29, 2009
15
GMO U.S. Equity Allocation Fund
(A Series of GMO Trust)
Fund Expenses
February 28, 2009 (Unaudited)
Expense Examples: The following information is in relation to expenses for the six month period ended February 28, 2009.
As a shareholder of the Fund, you may incur two types of costs: (1) transaction costs, including purchase premiums and redemption fees; and (2) ongoing costs, including indirect management fees, shareholder service fees, and other Fund expenses. This example is intended to help you understand your ongoing costs (in dollars) of investing in the Fund and to compare these costs with the ongoing costs of investing in other mutual funds.
These examples are based on an investment of $1,000 invested at the beginning of the period and held for the entire period, September 1, 2008 through February 28, 2009.
Actual Expenses
The first line of the table below provides information about actual account values and actual expenses. You may use the information in this line, together with the amount you invested, to estimate the expenses that you paid over the period. Simply divide your account value by $1,000 (for example, a $10,000,000 account value divided by $1,000 = 10,000), then multiply the result by the number in the first line under the heading entitled "Net Expense Incurred" to estimate the expenses you paid on your account during this period.
Hypothetical Example for Comparison Purposes
The second line of the table below provides information about hypothetical account values and hypothetical expenses based on the Fund's actual expense ratio and an assumed rate of return of 5% per year before expenses, which is not the Fund's actual return. The hypothetical account values and expenses may not be used to estimate the actual ending account balance or expenses you paid for the period. You may use this information to compare the ongoing costs of investing in the Fund with other funds. To do so, compare this 5% hypothetical example with the 5% hypothetical examples that appear in the shareholder reports of other funds.
Please note that the expenses shown in the table are meant to highlight your ongoing costs only and do not reflect any transactional costs, such as purchase premiums and redemption fees. Therefore, the second line of the table is useful in comparing ongoing costs only, and will not help you determine the relative total costs of owning different funds. In addition, if these transactional costs were included, your costs would have been higher.
| Annualized Net Expense Ratio | Beginning Account Value | Ending Account Value | Net Expense Incurred* | ||||||||||||||||
| Class III | |||||||||||||||||||
| 1) Actual | 0.38 | % | $ | 1,000.00 | $ | 679.90 | $ | 1.58 | |||||||||||
| 2) Hypothetical | 0.38 | % | $ | 1,000.00 | $ | 1,022.91 | $ | 1.91 | |||||||||||
* Expenses are calculated using the Class's annualized expense ratio (including indirect expenses incurred) for the six months ended February 28, 2009, multiplied by the average account value over the period, multiplied by 181 days in the period, divided by 365 days in the year.
16
GMO U.S. Equity Allocation Fund
(A Series of GMO Trust)
Tax Information for the Tax Year Ended February 28, 2009 (Unaudited)
The Fund will notify shareholders of amounts for use in preparing 2009 income tax forms in January 2010.
The Fund's distributions to shareholders include $1,635,086 from long-term capital gains.
For taxable, non-corporate shareholders, 100.00% of the income and short-term capital gains, if any, distributed in the Fund's fiscal year ended February 28, 2009 represents qualified dividend income subject to the 15% rate category.
For corporate shareholders, 100.00% of the income and short-term capital gains, if any, distributed in the Fund's fiscal year ended February 28, 2009 qualified for the dividends-received deduction.
17
Trustees and Officers (Unaudited)
The following tables list the Trust's Trustees and Officers as of the date of this report; their address and date of birth ("DOB"); their position with the Trust; the length of time holding that position with the Trust; their principal occupation(s) during the past five years; the number of portfolios in the fund complex they oversee; and other directorships they hold in companies subject to registration or reporting requirements of the Securities Exchange Act of 1934 (generally called "public companies") or in registered investment companies. The Trust's Statement of Additional Information ("SAI") includes additional information about the Trust's trustees, including changes subsequent to the date of the report. The SAI is available, without charge, upon request by writing GMO, c/o GMO Trust, 40 Rowes Wharf, Boston, MA 02110.
Independent Trustees:
| Name, Address, and DOB | Position(s) Held with Trust | Term of Office1 and Length of Time Served | Principal Occupation(s) During Past Five Years | Number of Portfolios in Fund Complex Overseen by Trustee | Other Directorships Held by Trustee | ||||||||||||||||||
| Donald W. Glazer, Esq. c/o GMO Trust 40 Rowes Wharf Boston, MA 02110 DOB: 07/26/1944 | Chairman of the Board of Trustees | Chairman of the Board of Trustees since March 2005; Lead Independent Trustee (September 2004 – March 2005); Trustee since December 2000. | Consultant – Law and Business2; Author of Legal Treatises. | 59 | None. | ||||||||||||||||||
1 Each Trustee is elected to serve during the continued lifetime of the Trust until he/she dies, resigns or is removed, or if sooner, until the next meeting of Shareholders called for the purpose of electing Trustees and until the election and qualification of his/her successor.
2 As part of Mr. Glazer's work as a consultant, he provides part-time consulting services to Goodwin Procter LLP ("Goodwin"). Goodwin has provided legal services to Renewable Resources, LLC, an affiliate of GMO; GMO, in connection with its relationship with Renewable Resources; and funds managed by Renewable Resources. Mr. Glazer has represented that he has no financial interest in, and is not involved in the provision of, such legal services. In the calendar years ended December 31, 2007 and December 31, 2008, these entities paid $789,416 and $183,864 respectively, in legal fees and disbursements to Goodwin. In correspondence with the Staff of the Securities and Exchange Commission beginning in August 2006, the Independent Trustees' legal counsel provided the Staff with information regarding Mr. Glazer's relationship with Goodwin and h is other business activities. On September 11, 2007, based on information that had been given to the Staff as of that date, the Staff provided oral no-action assurance consistent with the opinion of the Independent Trustees' legal counsel that Mr. Glazer is not an "interested person" of the Trust.
18
Independent Trustees — (Continued)
| Name, Address, and DOB | Position(s) Held with Trust | Term of Office1 and Length of Time Served | Principal Occupation(s) During Past Five Years | Number of Portfolios in Fund Complex Overseen by Trustee | Other Directorships Held by Trustee | ||||||||||||||||||
| W. Nicholas Thorndike c/o GMO Trust 40 Rowes Wharf Boston, MA 02110 DOB: 03/28/1933 | Trustee | Since March 2005. | Director or trustee of various corporations and charitable organizations, including Courier Corporation (a book publisher and manufacturer) (July 1989 – present); Putnam Funds (December 1992 – June 2004); and Providence Journal (a newspaper publisher) (December 1986 – December 2003). | 59 | Director of Courier Corporation (a book publisher and manufacturer); Member of the Investment Committee of Partners HealthCare System, Inc.3 | ||||||||||||||||||
| Peter Tufano c/o GMO Trust 40 Rowes Wharf Boston, MA 02110 DOB: 04/22/1957 | Trustee | Since December 2008. | Sylvan C. Coleman Professor of Financial Management, Harvard Business School (since 1989). | 59 | Trustee of State Street Navigator Securities Lending Trust (3 Portfolios). | ||||||||||||||||||
1 Each Trustee is elected to serve during the continued lifetime of the Trust until he/she dies, resigns or is removed, or if sooner, until the next meeting of Shareholders called for the purpose of electing Trustees and until the election and qualification of his/her successor.
3 Partners HealthCare System, Inc. is a client of the Manager.
19
Principal Officers:
| Name, Address, and DOB | Position(s) Held with Trust | Term of Office4 and Length of Time Served | Principal Occupation(s) During Past Five Years5 | ||||||||||||
| J.B. Kittredge DOB: 08/22/1954 | President and Chief Executive Officer | Since March 2009. | General Counsel, Grantham, Mayo, Van Otterloo & Co. LLC (October 2005 – Present); Partner, Ropes & Gray LLP. | ||||||||||||
| Sheppard N. Burnett c/o GMO Trust 40 Rowes Wharf Boston, MA 02110 DOB: 10/24/1968 | Treasurer and Chief Financial Officer | Chief Financial Officer since March 2007; Treasurer since November 2006; Assistant Treasurer, September 2004 – November 2006. | Fund Administration Staff, Grantham, Mayo, Van Otterloo & Co. LLC (June 2004 – present); Vice President, Director of Tax, Columbia Management Group (2002 – 2004). | ||||||||||||
| Brent C. Arvidson c/o GMO Trust 40 Rowes Wharf Boston, MA 02110 DOB: 06/26/1969 | Assistant Treasurer | Since August 1998. | Senior Fund Administrator, Grantham, Mayo, Van Otterloo & Co. LLC. | ||||||||||||
| John L. Nasrah c/o GMO Trust 40 Rowes Wharf Boston, MA 02110 DOB: 05/27/1977 | Assistant Treasurer | Since March 2007. | Fund Administrator, Grantham, Mayo, Van Otterloo & Co. LLC (September 2004 – present); Tax Analyst, Bain & Company, Inc. (June 2003 – September 2004). | ||||||||||||
| Mahmoodur Rahman c/o GMO Trust 40 Rowes Wharf Boston, MA 02110 DOB: 11/30/1967 | Assistant Treasurer | Since September 2007. | Fund Administrator, Grantham, Mayo, Van Otterloo & Co. LLC (April 2007 – present); Vice President and Senior Tax Manager, Massachusetts Financial Services Company (January 2000 – April 2007). | ||||||||||||
| Michael E. Gillespie c/o GMO Trust 40 Rowes Wharf Boston, MA 02110 DOB: 02/18/1958 | Chief Compliance Officer | Since March 2005. | Vice President of Compliance (June 2004 – February 2005) and Director of Domestic Compliance (March 2002 – June 2004), Fidelity Investments. | ||||||||||||
4 Each officer is elected to hold such office until his or her successor is duly elected and qualified to carry out the duties and responsibilities of the office, or until he or she resigns or is removed from office.
5 Each of Messrs. Burnett, Arvidson, Bohan, and Pottle serves as an officer and/or director of certain pooled investment vehicles of which GMO or an affiliate of GMO serves as the investment adviser.
20
Principal Officers — (Continued)
| Name, Address, and DOB | Position(s) Held with Trust | Term of Office4 and Length of Time Served | Principal Occupation(s) During Past Five Years5 | ||||||||||||
| Jason B. Harrison c/o GMO Trust 40 Rowes Wharf Boston, MA 02110 DOB: 01/29/1977 | Vice President and Clerk | Vice President since November 2006; Clerk since March 2006. | Legal Counsel, Grantham, Mayo, Van Otterloo & Co. LLC (since February 2006) and Attorney, Ropes & Gray LLP (September 2002 – February 2006). | ||||||||||||
| David L. Bohan c/o GMO Trust 40 Rowes Wharf Boston, MA 02110 DOB: 06/21/1964 | Vice President and Assistant Clerk | Vice President since March 2005; Assistant Clerk since March 2006. | Legal Counsel, Grantham, Mayo, Van Otterloo & Co. LLC. | ||||||||||||
| Gregory L. Pottle c/o GMO Trust 40 Rowes Wharf Boston, MA 02110 DOB: 07/09/1971 | Vice President and Assistant Clerk | Since November 2006. | Legal Counsel, Grantham, Mayo, Van Otterloo & Co. LLC. | ||||||||||||
| Anne K. Trinque c/o GMO Trust 40 Rowes Wharf Boston, MA 02110 DOB: 04/15/1978 | Vice President and Assistant Clerk | Since September 2007. | Legal Counsel, Grantham, Mayo, Van Otterloo & Co. LLC (January 2007 – present); Attorney, Goodwin Procter LLP (September 2003 – January 2007). | ||||||||||||
| Cheryl Wakeham c/o GMO Trust 40 Rowes Wharf Boston, MA 02110 DOB: 10/29/1958 | Vice President and Anti-Money Laundering Officer | Since December 2004. | Manager, Client Service Administration, Grantham, Mayo, Van Otterloo & Co. LLC. | ||||||||||||
4 Each officer is elected to hold such office until his or her successor is duly elected and qualified to carry out the duties and responsibilities of the office, or until he or she resigns or is removed from office.
5 Each of Messrs. Burnett, Arvidson, Bohan, and Pottle serves as an officer and/or director of certain pooled investment vehicles of which GMO or an affiliate of GMO serves as the investment adviser.
21
GMO World Opportunities Equity Allocation Fund
(A Series of GMO Trust)
Annual Report
February 28, 2009
For a free copy of the Fund's proxy voting guidelines, shareholders may call 1-617-346-7646 (collect) or visit the Securities and Exchange Commission's website at www.sec.gov. Information regarding how the Fund voted proxies relating to portfolio securities during the most recent 12-month period ended June 30 is available on GMO's website at www.gmo.com, or on the Securities and Exchange Commission's website at www.sec.gov.
The Fund files its complete schedule of portfolio holdings with the Securities and Exchange Commission for the first and third quarter of each fiscal year on Form N-Q, which is available on the Commission's website at www.sec.gov. The Fund's Form N-Q may be reviewed and copied at the Commission's Public Reference Room in Washington, D.C. Information on the operation of the Public Reference Room may be obtained by calling 1-800-SEC-0330. The Fund has a policy with respect to disclosure of portfolio holdings under which it may also make available on GMO's website at www.gmo.com a complete schedule of portfolio holdings.
This report is prepared for the general information of shareholders. It is authorized for distribution to prospective investors only when preceded or accompanied by a prospectus for the GMO Trust, which contains a complete discussion of the risks associated with an investment in this Fund and other important information. The GMO Trust prospectus can be obtained at www.gmo.com.
GMO World Opportunities Equity Allocation Fund
(A Series of GMO Trust)
Portfolio Management
Day-to-day management of the Fund's portfolio is the responsibility of the Asset Allocation team at Grantham, Mayo, Van Otterloo & Co. LLC.
Management Discussion and Analysis of Fund Performance
The GMO World Opportunities Equity Allocation Fund returned -38.6% for the fiscal year ended February 28, 2009, as compared to -47.1% for the Fund's benchmark, the MSCI World Index. During the fiscal year the Fund was fully exposed to global equity securities through its investment in underlying GMO mutual funds.
Implementation was positive, with U.S. Quality Equity Fund and U.S. Core Equity Fund outperforming their benchmarks by large amounts and International Intrinsic Value Fund and International Growth Equity Fund and Emerging Markets Opportunities Fund also outperforming. Emerging Markets Fund and Flexible Equities Fund underperformed their benchmarks.
Asset allocation was also positive, driven by the Fund's overweight to U.S. equities over the course of the year.
The views expressed herein are exclusively those of Grantham, Mayo, Van Otterloo & Co. LLC Management as of the date of this report and are subject to change. GMO disclaims any responsibility to update such views. They are not meant as investment advice. References to specific securities are not recommendations of such securities and may not be representative of any GMO portfolio's current or future investments.

Performance data quoted represents past performance and is not indicative of future results. The investment return and principal value of an investment will fluctuate so that an investor's shares, when redeemed, may be worth more or less than their original cost. Current performance data may be lower or higher than the performance data provided herein. To obtain performance information to the most recent month-end, visit www.gmo.com. Performance shown is net of all fees after reimbursement from the Manager. Each performance figure assumes a purchase at the beginning and redemption at the end of the stated period and reflects a transaction fee of .04% on the purchase and .04% on the redemption. Transaction fees are retained by the Fund to cover trading costs. Returns would have been lower had certain expenses not been reimbursed during the periods shown and do not include the effect of taxes on distributions and redemptions. All information is unaudited.
GMO World Opportunities Equity Allocation Fund
(A Series of GMO Trust)
Investments Concentration Summary
February 28, 2009 (Unaudited)
| Asset Class Summary* | % of Total Net Assets | ||||||
| Common Stocks | 94.6 | % | |||||
| Short-Term Investments | 3.3 | ||||||
| Rights and Warrants | 0.0 | ||||||
| Preferred Stocks | 0.0 | ||||||
| Forward Currency Contracts | (0.2 | ) | |||||
| Futures | (0.4 | ) | |||||
| Other | 2.7 | ||||||
| 100.0 | % | ||||||
| Country / Region Summary** | % of Investments | ||||||
| United States | 56.9 | % | |||||
| Japan | 13.0 | ||||||
| Euro Region*** | 11.9 | ||||||
| United Kingdom | 9.2 | ||||||
| Switzerland | 5.1 | ||||||
| Canada | 1.2 | ||||||
| Hong Kong | 1.0 | ||||||
| Denmark | 0.6 | ||||||
| Singapore | 0.5 | ||||||
| Sweden | 0.4 | ||||||
| Norway | 0.2 | ||||||
| 100.0 | % | ||||||
* The table above incorporates aggregate indirect asset class exposure associated with investments in other funds of GMO Trust ("underlying funds").
** The table above incorporates aggregate indirect country exposure associated with investments in the underlying funds. The table excludes short-term investments. The table includes exposure through the use of derivative contracts.
*** The "Euro Region" is comprised of Austria, Belgium, Finland, France, Germany, Greece, Ireland, Italy, Netherlands, Portugal and Spain.
1
GMO World Opportunities Equity Allocation Fund
(A Series of GMO Trust)
Schedule of Investments
(showing percentage of total net assets)
February 28, 2009
| Shares / Par Value ($) | Description | Value ($) | |||||||||||||
| MUTUAL FUNDS — 100.0% | |||||||||||||||
| Affiliated Issuers — 100.0% | |||||||||||||||
| 950,700 | GMO Flexible Equities Fund, Class VI | 14,631,268 | |||||||||||||
| 10,115,855 | GMO International Growth Equity Fund, Class IV | 146,275,269 | |||||||||||||
| 10,006,146 | GMO International Intrinsic Value Fund, Class IV | 140,086,040 | |||||||||||||
| 16,034,561 | GMO U.S. Core Equity Fund, Class VI | 122,343,703 | |||||||||||||
| 19,408,226 | GMO U.S. Quality Equity Fund, Class VI | 275,208,643 | |||||||||||||
| TOTAL MUTUAL FUNDS (COST $1,185,295,156) | 698,544,923 | ||||||||||||||
| SHORT-TERM INVESTMENTS — 0.0% | |||||||||||||||
| 30,959 | State Street Eurodollar Time Deposit, 0.01%, due 03/02/09 | 30,959 | |||||||||||||
| TOTAL SHORT-TERM INVESTMENTS (COST $30,959) | 30,959 | ||||||||||||||
| TOTAL INVESTMENTS — 100.0% (Cost $1,185,326,115) | 698,575,882 | ||||||||||||||
| Other Assets and Liabilities (net) — (0.0%) | (51,006 | ) | |||||||||||||
| TOTAL NET ASSETS — 100.0% | $ | 698,524,876 | |||||||||||||
See accompanying notes to the financial statements.
2
GMO World Opportunities Equity Allocation Fund
(A Series of GMO Trust)
Statement of Assets and Liabilities — February 28, 2009
| Assets: | |||||||
| Investments in unaffiliated issuers, at value (cost $30,959) (Note 2) | $ | 30,959 | |||||
| Investments in affiliated issuers, at value (cost $1,185,295,156) (Notes 2 and 8) | 698,544,923 | ||||||
| Receivable for Fund shares sold | 9,378,790 | ||||||
| Receivable for expenses reimbursed by Manager (Note 3) | 6,776 | ||||||
| Total assets | 707,961,448 | ||||||
| Liabilities: | |||||||
| Payable for investments purchased | 9,378,790 | ||||||
| Payable to affiliate for (Note 3): | |||||||
| Trustees and Chief Compliance Officer of GMO Trust fees | 2,465 | ||||||
| Accrued expenses | 55,317 | ||||||
| Total liabilities | 9,436,572 | ||||||
| Net assets | $ | 698,524,876 | |||||
| Net assets consist of: | |||||||
| Paid-in capital | $ | 1,253,057,855 | |||||
| Distributions in excess of net realized gain | (67,782,746 | ) | |||||
| Net unrealized depreciation | (486,750,233 | ) | |||||
| $ | 698,524,876 | ||||||
| Net assets attributable to: | |||||||
| Class III shares | $ | 698,524,876 | |||||
| Shares outstanding: | |||||||
| Class III | 56,829,828 | ||||||
| Net asset value per share: | |||||||
| Class III | $ | 12.29 | |||||
See accompanying notes to the financial statements.
3
GMO World Opportunities Equity Allocation Fund
(A Series of GMO Trust)
Statement of Operations — Year Ended February 28, 2009
| Investment Income: | |||||||
| Dividends from affiliated issuers (Note 8) | $ | 27,365,491 | |||||
| Interest | 457 | ||||||
| Total investment income | 27,365,948 | ||||||
| Expenses: | |||||||
| Custodian, fund accounting agent and transfer agent fees | 46,502 | ||||||
| Audit and tax fees | 33,380 | ||||||
| Legal fees | 24,274 | ||||||
| Trustees fees and related expenses (Note 3) | 14,095 | ||||||
| Registration fees | 4,375 | ||||||
| Miscellaneous | 11,870 | ||||||
| Total expenses | 134,496 | ||||||
| Fees and expenses reimbursed by Manager (Note 3) | (113,667 | ) | |||||
| Expense reductions (Note 2) | (14,780 | ) | |||||
| Net expenses | 6,049 | ||||||
| Net investment income (loss) | 27,359,899 | ||||||
| Realized and unrealized gain (loss): | |||||||
| Net realized gain (loss) on: | |||||||
| Investments in affiliated issuers | (109,004,829 | ) | |||||
| Realized gains distributions from affiliated issuers (Note 8) | 41,963,597 | ||||||
| Net realized gain (loss) | (67,041,232 | ) | |||||
| Change in net unrealized appreciation (depreciation) on: | |||||||
| Investments in affiliated issuers | (387,000,660 | ) | |||||
| Net realized and unrealized gain (loss) | (454,041,892 | ) | |||||
| Net increase (decrease) in net assets resulting from operations | $ | (426,681,993 | ) | ||||
See accompanying notes to the financial statements.
4
GMO World Opportunities Equity Allocation Fund
(A Series of GMO Trust)
Statement of Changes in Net Assets
| Year Ended February 28, 2009 | Year Ended February 29, 2008 | ||||||||||
| Increase (decrease) in net assets: | |||||||||||
| Operations: | |||||||||||
| Net investment income (loss) | $ | 27,359,899 | $ | 16,856,249 | |||||||
| Net realized gain (loss) | (67,041,232 | ) | 117,754,564 | ||||||||
| Change in net unrealized appreciation (depreciation) | (387,000,660 | ) | (134,909,725 | ) | |||||||
| Net increase (decrease) in net assets from operations | (426,681,993 | ) | (298,912 | ) | |||||||
| Distributions to shareholders from: | |||||||||||
| Net investment income | |||||||||||
| Class III | (27,428,339 | ) | (44,014,224 | ) | |||||||
| Net realized gains | |||||||||||
| Class III | (48,768,521 | ) | (72,725,181 | ) | |||||||
| (76,196,860 | ) | (116,739,405 | ) | ||||||||
| Net share transactions (Note 7): | |||||||||||
| Class III | 256,821,808 | 159,046,461 | |||||||||
| Purchase premiums and redemption fees (Notes 2 and 7): | |||||||||||
| Class III | 207,495 | 42,292 | |||||||||
| Total increase (decrease) in net assets resulting from net share transactions, purchase premiums and redemption fees | 257,029,303 | 159,088,753 | |||||||||
| Total increase (decrease) in net assets | (245,849,550 | ) | 42,050,436 | ||||||||
| Net assets: | |||||||||||
| Beginning of period | 944,374,426 | 902,323,990 | |||||||||
| End of period | $ | 698,524,876 | $ | 944,374,426 | |||||||
See accompanying notes to the financial statements.
5
GMO World Opportunities Equity Allocation Fund
(A Series of GMO Trust)
Financial Highlights
(For a Class III share outstanding throughout each period)
| Year Ended February 28/29, | |||||||||||||||||||
| 2009 | 2008 | 2007 | 2006(a) | ||||||||||||||||
| Net asset value, beginning of period | $ | 21.71 | $ | 24.25 | $ | 22.49 | $ | 20.00 | |||||||||||
| Income (loss) from investment operations: | |||||||||||||||||||
| Net investment income (loss)(b)† | 0.53 | 0.43 | 0.40 | 0.37 | |||||||||||||||
| Net realized and unrealized gain (loss) | (8.50 | ) | 0.01 | (c) | 2.93 | 2.78 | |||||||||||||
| Total from investment operations | (7.97 | ) | 0.44 | 3.33 | 3.15 | ||||||||||||||
| Less distributions to shareholders: | |||||||||||||||||||
| From net investment income | (0.54 | ) | (1.10 | ) | (0.73 | ) | (0.46 | ) | |||||||||||
| From net realized gains | (0.91 | ) | (1.88 | ) | (0.84 | ) | (0.20 | ) | |||||||||||
| Total distributions | (1.45 | ) | (2.98 | ) | (1.57 | ) | (0.66 | ) | |||||||||||
| Net asset value, end of period | $ | 12.29 | $ | 21.71 | $ | 24.25 | $ | 22.49 | |||||||||||
| Total Return(d) | (38.63 | )% | 0.72 | % | 14.94 | % | 15.90 | %** | |||||||||||
| Ratios/Supplemental Data: | |||||||||||||||||||
| Net assets, end of period (000's) | $ | 698,525 | $ | 944,374 | $ | 902,324 | $ | 407,230 | |||||||||||
| Net expenses to average daily net assets(e)(f) | 0.00 | %(g) | 0.00 | %(g) | 0.00 | % | 0.00 | %* | |||||||||||
| Net investment income to average daily net assets(b) | 2.89 | % | 1.72 | % | 1.68 | % | 2.42 | %* | |||||||||||
| Portfolio turnover rate | 35 | % | 20 | % | 12 | % | 5 | %** | |||||||||||
| Fees and expenses reimbursed by the Manager to average daily net assets: | 0.01 | % | 0.01 | % | 0.02 | % | 0.06 | %* | |||||||||||
| Purchase premiums and redemption fees consisted of the following per share amounts:† | — | (h) | — | (h) | $ | 0.01 | $ | 0.02 | |||||||||||
(a) Period from June 16, 2005 (commencement of operations) through February 28, 2006.
(b) Net investment income is affected by the timing of the declaration of dividends by the underlying funds in which the Fund invests.
(c) The amount shown for a share outstanding does not correspond with the aggregate net realized and unrealized gain (loss) on investments due to the timing of purchases and redemptions of Fund shares in relation to fluctuating market values of the investments of the Fund.
(d) The total returns would have been lower had certain expenses not been reimbursed and/or waived during the periods shown and assumes the effect of reinvested distributions. Calculation excludes purchase premiums and redemption fees which are borne by the shareholder.
(e) Net expenses exclude expenses incurred indirectly through investment in the underlying funds (See Note 3).
(f) Net expenses to average daily net assets were less than 0.01%.
(g) The net expense ratio does not include the effect of expense reductions.
(h) Purchase premiums and redemption fees were less than $0.01 per share.
† Calculated using average shares outstanding throughout the period.
* Annualized.
** Not annualized.
See accompanying notes to the financial statements.
6
GMO World Opportunities Equity Allocation Fund
(A Series of GMO Trust)
Notes to Financial Statements
February 28, 2009
1. Organization
GMO World Opportunities Equity Allocation Fund (the "Fund") is a series of GMO Trust (the "Trust"). The Fund is registered under the Investment Company Act of 1940, as amended, as an open-end, diversified management investment company. The Fund is advised and managed by Grantham, Mayo, Van Otterloo & Co. LLC (the "Manager" or "GMO"). The Trust was established as a Massachusetts business trust under the laws of The Commonwealth of Massachusetts on June 24, 1985. The Declaration of Trust permits the Trustees of the Trust ("Trustees") to create an unlimited number of series of shares ("Funds") and to subdivide Funds into classes.
The Fund seeks total return greater than that of the MSCI World Index. The Fund is a fund of funds and invests primarily in shares of the GMO International Equity Funds (which may include one or more of the GMO Emerging Markets Funds) and the GMO U.S. Equity Funds. The Fund may also invest in shares of other GMO Funds, including the GMO Fixed Income Funds, GMO Alpha Only Fund, GMO Flexible Equities Fund, and GMO Alternative Asset Opportunity Fund.
The financial statements of the series of the Trust in which the Fund invests ("underlying funds") should be read in conjunction with the Fund's financial statements. These financial statements are available, without charge, upon request, by calling (617) 346-7646 (collect) or by visiting GMO's website at www.gmo.com. Shares of GMO Flexible Equities Fund are not publicly available for direct purchase.
2. Significant accounting policies
The following is a summary of significant accounting policies followed by the Fund in the preparation of its financial statements. These policies are in conformity with accounting principles generally accepted in the United States of America ("U.S. GAAP") and have been consistently followed by the Fund in preparing its financial statements. The preparation of financial statements in accordance with U.S. GAAP requires management to make estimates and assumptions that affect the reported amounts and disclosures in the financial statements. Actual results could differ from those estimates. The accounting records of the Fund are maintained in U.S. dollars.
Portfolio valuation
Shares of the underlying funds and other mutual funds are generally valued at their net asset value.
Investments held by the underlying funds are valued as follows. Securities listed on a securities exchange for which market quotations are readily available are valued at the last sale price or official closing price on each business day, or if there is no such reported sale or official closing price, at the most recent quoted bid price. Unlisted securities for which market quotations are readily available are generally valued at the most recent quoted bid price. Debt instruments with a remaining maturity of sixty days or less are generally valued at amortized cost, which approximates fair value. Securities for which quotations are not readily
7
GMO World Opportunities Equity Allocation Fund
(A Series of GMO Trust)
Notes to Financial Statements — (Continued)
February 28, 2009
available or whose values the Manager has determined to be unreliable are valued at fair value as determined in good faith by the Trustees or persons acting at their direction pursuant to procedures approved by the Trustees. By its nature, a fair value price is a good faith estimate of the value of a security at a given point in time and may not reflect the value that would be realized if the security were sold. The difference between a fair value price and the value realized upon a sale could be material. Because many foreign equity securities markets and exchanges close prior to the close of the New York Stock Exchange ("NYSE"), closing prices for foreign securities in those markets or on those exchanges do not reflect the events that occur after that close but before the close of the NYSE. As a result, the Fund generally values foreign equity securities using fair value prices, which are based on adjustments to closing prices supplied by a third party vendor based on that vendor's proprietary models. As of February 28, 2009, 37.44% of the net assets of the Fund, through investments in the underlying funds, were valued using fair value prices based on models used by a third party vendor.
In September 2006, the Financial Accounting Standards Board ("FASB") issued Statement of Financial Accounting Standards No. 157, Fair Value Measurements ("SFAS 157"). SFAS 157 is effective for the Fund's current fiscal year. While the adoption of SFAS 157 does not have an effect on the Fund's net asset value, it does require additional disclosures about fair value measurements. SFAS 157 establishes a three-level hierarchy for disclosure of fair value measurements. The valuation hierarchy is based upon the reliability of inputs to the valuation of the Fund's investments. The three levels are defined as follows:
Level 1 – Valuations based on quoted prices for identical securities in active markets.
Level 2 – Valuations determined using other significant direct or indirect observable inputs.
Level 3 – Valuations based on inputs that are unobservable and significant.
The inputs or methodology used for valuing securities are not necessarily an indication of the risk associated with investing in those securities.
The following is a summary of the fair valuations according to inputs used as of February 28, 2009 in valuing the Fund's investments:
| Asset Valuation Inputs | Investments in Securities | Other Financial Instruments | |||||||||
| Level 1 - Quoted Prices | $ | 683,944,614 | $ | — | |||||||
| Level 2 - Other Significant Observable Inputs | 14,631,268 | — | |||||||||
| Level 3 - Significant Unobservable Inputs | — | — | |||||||||
| Total | $ | 698,575,882 | $ | — | |||||||
8
GMO World Opportunities Equity Allocation Fund
(A Series of GMO Trust)
Notes to Financial Statements — (Continued)
February 28, 2009
| Liability Valuation Inputs | Investments in Securities | Other Financial Instruments | |||||||||
| Level 1 - Quoted Prices | $ | — | $ | — | |||||||
| Level 2 - Other Significant Observable Inputs | — | — | |||||||||
| Level 3 - Significant Unobservable Inputs | — | — | |||||||||
| Total | $ | — | $ | — | |||||||
For the underlying fund's summary of valuation inputs please refer to the respective fund's portfolio valuation note.
The Fund held no investments or other financial instruments at either February 29, 2008 or February 28, 2009, whose fair value was determined using Level 3 inputs.
Repurchase agreements
The Fund may enter into repurchase agreements. Under a repurchase agreement the Fund acquires a security for cash and obtains a simultaneous commitment from the seller to repurchase the security at an agreed upon price and date. The Fund, through its custodian, takes possession of securities collateralizing the repurchase agreement. The collateral is marked to market daily to ensure that the market value of the underlying assets is at least equal to the amount owed to the Fund in the event of default by the seller. If the seller of a repurchase agreement defaults or enters into insolvency proceedings and the value of the collateral declines, the Fund's recovery of cash may be delayed or limited. The Fund had no repurchase agreements outstanding at the end of the period.
Taxes and distributions
The Fund intends to qualify each tax year as a regulated investment company under Subchapter M of the Internal Revenue Code of 1986, as amended (the "Code"). The Fund intends to distribute substantially all of its net investment income and all of its net realized short-term and long-term capital gain, if any, after giving effect to any available capital loss carryforwards for U.S. federal income tax purposes. Therefore, no provision for U.S. federal income or excise tax is necessary.
The Fund's policy is to declare and pay distributions from net investment income, if any, semiannually, and from net realized short-term and long-term capital gain, if any, at least annually. All distributions are paid in shares of the Fund, at net asset value, unless the shareholder elects to receive cash distributions. Distributions to shareholders are recorded by the Fund on the ex-dividend date.
Income and capital gain distributions are determined in accordance with U.S. federal income tax regulations, which may differ from U.S. GAAP. Certain capital accounts in the financial statements are periodically adjusted for permanent differences in order to reflect their tax character. These adjustments have no impact on net assets or net asset value per share. Temporary differences that arise from recognizing certain items of income, expense, gain or loss in different periods for financial statement and tax purposes will reverse at
9
GMO World Opportunities Equity Allocation Fund
(A Series of GMO Trust)
Notes to Financial Statements — (Continued)
February 28, 2009
some time in the future. Distributions in excess of net investment income or net realized gains are temporary over-distributions for financial statement purposes resulting from differences in the recognition or classification of income or distributions for financial statement and tax purposes.
U.S. GAAP and tax accounting differences primarily relate to losses on wash sale transactions and post-October capital losses.
The following reclassification represents the amount necessary to report the stated components of net assets on a tax basis, excluding certain temporary differences, as of February 28, 2009. The financial highlights exclude these adjustments.
| Distributions In Excess of Net Investment Income | Distributions In Excess of Net Realized Gain | Paid-in Capital | |||||||||
| $ | 68,440 | $ | (44,942 | ) | $ | (23,498 | ) | ||||
The tax character of distributions declared to shareholders is as follows:
| 2/28/2009 | 2/29/2008 | ||||||||||
| Ordinary income (including any net short-term capital gain) | $ | 27,435,560 | $ | 44,009,605 | |||||||
| Net long-term capital gain | 48,761,300 | 72,729,800 | |||||||||
| Total distributions | $ | 76,196,860 | $ | 116,739,405 | |||||||
Distributions in excess of tax basis earnings and profits, if significant, are reported in the financial statements as a return of capital for tax purposes.
As of February 28, 2009, the Fund elected to defer March 1, 2009 post-October capital losses of $17,086,019.
As of February 28, 2009, the approximate cost for U.S. federal income tax purposes and gross and net unrealized appreciation (depreciation) in value of investments were as follows:
| Aggregate Cost | Gross Unrealized Appreciation | Gross Unrealized (Depreciation) | Net Unrealized Appreciation (Depreciation) | ||||||||||||
| $ | 1,236,022,842 | $ | — | $ | (537,446,960 | ) | $ | (537,446,960 | ) | ||||||
The Fund is subject to the provisions of Financial Accounting Standards Board Interpretation No. 48 ("FIN 48"), Accounting for Uncertainty in Income Taxes — an Interpretation of FASB Statement No. 109. FIN 48 sets forth a minimum threshold for financial statement recognition of a tax position taken or
10
GMO World Opportunities Equity Allocation Fund
(A Series of GMO Trust)
Notes to Financial Statements — (Continued)
February 28, 2009
expected to be taken in a tax return that could affect the Fund's financial statements. The Fund did not have any unrecognized tax benefits or liabilities at February 28, 2009, nor did it have any increases or decreases in unrecognized tax benefits or liabilities for the period then ended. The Fund is subject to examination prior to the expiration of the statute of limitations by U.S. federal and state tax authorities for tax returns filed.
Security transactions and related investment income
Security transactions in the financial statements are accounted for on the trade date. Income dividends and capital gain distributions from the underlying funds are recorded on the ex-dividend date. Interest income is recorded on the accrual basis. Non-cash dividends, if any, are recorded at the fair market value of the asset received. In determining the net gain or loss on securities sold, the Fund uses the identified cost basis for the purposes of determining the cost basis.
Expenses
The majority of the expenses of the Trust are directly identifiable to an individual fund. Expenses that are not readily identifiable to a specific fund are allocated taking into consideration, among other things, the nature and type of expense and the relative size of the funds. In addition, the Fund incurs fees and expenses indirectly as a shareholder in the underlying funds. Because the underlying funds have different expense and fee levels and the Fund may own different proportions of the underlying funds at different times, the amount of fees and expenses indirectly incurred by the Fund will vary and the Manager has a conflict in allocating among the underlying funds. (See Note 3).
State Street Bank and Trust Company ("State Street") serves as custodian, fund accounting agent and transfer agent of the Fund. State Street's fees may be reduced by an earnings allowance calculated on the average daily cash balances the Fund maintains with State Street. The Fund receives the benefit of the earnings allowance. Credit balances or expense reimbursements used to reduce fees, if any, are reported as a reduction of expenses in the Statement of Operations.
Purchases and redemptions of Fund shares
Effective June 30, 2008, the premium on cash purchases of Fund shares remained at 0.04% of the amount invested and the fee on cash redemptions was changed to 0.03% of the amount redeemed. Effective September 30, 2008, the Fund no longer charged a premium on cash purchases or fee on cash redemptions of the amount invested or redeemed. Effective October 21, 2008, the premium on cash purchases and fee on cash redemptions were each changed to 0.04% of the amount invested or redeemed. As of February 28, 2009, the premium on cash purchases and fee on cash redemptions of Fund shares were each 0.04% of the amount invested or redeemed. The level of purchase premium and redemption fee for the Fund may be adjusted to account for changes in the Fund's investments (i.e., changes in the percentage of Fund assets allocated to each underlying fund). The Fund may impose a new purchase premium and/or redemption fee, or modify or eliminate an exis ting purchase premium and/or redemption fee, at any time. If the Manager determines that any portion of a cash purchase or redemption is offset by a corresponding cash redemption
11
GMO World Opportunities Equity Allocation Fund
(A Series of GMO Trust)
Notes to Financial Statements — (Continued)
February 28, 2009
or purchase on the same day, the Fund will ordinarily waive or reduce the purchase premium or redemption fee with respect to that portion. In addition, the Fund may waive or reduce the purchase premium or redemption fee in extraordinary circumstances if the purchase or redemption will not cause the Fund to incur transaction costs. All purchase premiums and redemption fees are paid to the Fund and recorded by the Fund as paid-in capital. The Fund will waive or reduce the purchase premium relating to the in-kind portion of a purchase transaction except for estimated or known transaction costs (e.g. stamp duties and transfer taxes) incurred by the Fund as a result of the transfer of the purchasing shareholder's securities to the Fund. In-kind redemption transactions are generally not subject to redemption fees except when they include a cash component. However, when a substantial portion of a Fund is being redeemed, the Fund may ch arge a redemption fee based on estimated or known transaction costs resulting from those redemptions. The Fund charges no premium for reinvested distributions.
Investment risks
The Fund is subject to the investment risks associated with an investment in the underlying funds, some of which may invest in foreign securities. The Fund is subject to risks involved in investing in foreign securities that are not presented by investments in U.S. securities. These risks may involve adverse political and economic developments, including expropriation and the possible imposition of capital controls or other foreign governmental laws or restrictions. In addition, the securities of some foreign companies and securities markets are less liquid and at times more volatile than securities of comparable U.S. companies and U.S. securities markets. The risks described above apply to an even greater extent to investments in emerging markets. The securities markets of emerging countries are generally smaller, less developed, less liquid, and more volatile than the securities markets of the U.S. and developed foreign market s. Additionally, the investment risks associated with an investment in the underlying funds may be greater to the extent that the underlying funds engage in derivative transactions.
Recently issued accounting pronouncement
In March 2008, FASB issued Statement of Financial Accounting Standards No. 161, Disclosures about Derivative Instruments and Hedging Activities ("SFAS 161"). SFAS 161 is effective for fiscal years and interim periods beginning after November 15, 2008. SFAS 161 requires enhanced disclosures about the Fund's derivative and hedging activities. The Manager is currently evaluating the impact the adoption of SFAS 161 will have on the Fund's financial statement disclosures.
3. Fees and other transactions with affiliates
The Manager decides how to allocate the assets of the Fund among underlying funds. The Manager does not directly charge the Fund a management fee or shareholder service fee, but it receives varying management and shareholder service fees from the underlying funds in which the Fund invests. Because of that variation the levels of indirect net expenses set forth below are affected by the Manager's asset allocation decisions.
12
GMO World Opportunities Equity Allocation Fund
(A Series of GMO Trust)
Notes to Financial Statements — (Continued)
February 28, 2009
Through at least June 30, 2009, the Manager has contractually agreed to reimburse the Fund for Fund expenses incurred through that date (excluding "Excluded Expenses", as defined below). Excluded Expenses include fees and expenses of the independent Trustees of the Trust, fees and expenses for legal services not approved by the Manager for the Trust, compensation and expenses of the Trust's Chief Compliance Officer ("CCO") (excluding any employee benefits), brokerage commissions, securities lending fees and expenses, interest expense, transfer taxes, and other investment-related costs (including expenses associated with investments in any company that is an investment company or would be an investment company under the 1940 Act, but for the exceptions to the definition of investment company provided in Section 3(c)(1) and 3(c)(7) of the 1940 Act), hedging transaction fees, extraordinary, non-recurring and certain other unusual e xpenses (including taxes).
The Fund incurs fees and expenses indirectly as a shareholder in the underlying funds. For the year ended February 28, 2009, these indirect fees and expenses expressed as an annualized percentage of the Fund's average daily net assets were as follows:
| Indirect Net Expenses (excluding shareholder service fees) | Indirect Shareholder Service Fees | Total Indirect Expenses | |||||||||
| 0.419 | % | 0.071 | % | 0.490 | % | ||||||
The Fund's portion of the fees paid by the Trust to the Trust's independent Trustees and CCO during the year ended February 28, 2009 was $11,186 and $6,734, respectively. The compensation and expenses of the CCO are included in miscellaneous expenses in the Statement of Operations. The Fund paid no remuneration to any other officer of the Trust.
4. Purchases and sales of securities
Cost of purchases and proceeds from sales of securities, excluding short-term investments and class exchanges, for the year ended February 28, 2009 aggregated $578,764,513 and $328,577,709, respectively.
5. Guarantees
In the normal course of business the Fund enters into contracts with third-party service providers that contain a variety of representations and warranties and that provide general indemnifications. The Fund's maximum exposure under these arrangements is unknown, as it involves future claims that may be made against the Fund that have not yet occurred. Based on experience, management is of the view that the risk of loss in connection with its indemnification obligations is remote; however, there can be no assurance that such obligations will not result in material liabilities that adversely affect the Fund.
13
GMO World Opportunities Equity Allocation Fund
(A Series of GMO Trust)
Notes to Financial Statements — (Continued)
February 28, 2009
6. Principal shareholders and related parties
As of February 28, 2009, 22.45% of the outstanding shares of the Fund were held by two shareholders, each holding more than 10% of the Fund's outstanding shares. On that date, no other shareholder owned more than 10% of the outstanding shares of the Fund. Redemptions from (or investments into) the Fund by or on behalf of these large shareholders may have a material effect on the Fund.
As of February 28, 2009, less than 0.01% of the Fund's shares were held senior management of the Manager and GMO Trust officers and 8.75% of the Fund's shares were held by accounts for which the Manager had investment discretion.
7. Share transactions
The Declaration of Trust permits the Trust to issue an unlimited number of shares of beneficial interest (without par value). Transactions in Fund shares were as follows:
| Year Ended February 28, 2009 | Year Ended February 29, 2008 | ||||||||||||||||||
| Class III: | Shares | Amount | Shares | Amount | |||||||||||||||
| Shares sold | 21,444,708 | $ | 386,255,390 | 4,764,267 | $ | 122,806,681 | |||||||||||||
| Shares issued to shareholders in reinvestment of distributions | 4,310,232 | 76,196,861 | 4,778,197 | 116,284,024 | |||||||||||||||
| Shares repurchased | (12,427,876 | ) | (205,630,443 | ) | (3,254,416 | ) | (80,044,244 | ) | |||||||||||
| Purchase premiums | — | 147,229 | — | 10,322 | |||||||||||||||
| Redemption fees | — | 60,266 | — | 31,970 | |||||||||||||||
| Net increase (decrease) | 13,327,064 | $ | 257,029,303 | 6,288,048 | $ | 159,088,753 | |||||||||||||
14
GMO World Opportunities Equity Allocation Fund
(A Series of GMO Trust)
Notes to Financial Statements — (Continued)
February 28, 2009
8. Investments in affiliated issuers
A summary of the Fund's transactions in the shares of other funds of the Trust during the year ended February 28, 2009 is set forth below:
| Affiliate | Value, beginning of period | Purchases | Sales Proceeds | Dividend Income | Distributions of Realized Gains | Value, end of period | |||||||||||||||||||||
| GMO Flexible Equities Fund, Class VI | $ | — | $ | 18,090,527 | $ | 404,838 | $ | 1,000 | $ | — | $ | 14,631,268 | |||||||||||||||
| GMO Alpha Only Fund, Class IV | — | 738,869 | 722,877 | 6,749 | 65,044 | — | |||||||||||||||||||||
| GMO Emerging Markets Fund, Class VI | — | 39,184,630 | 33,460,415 | — | 2,194,706 | — | |||||||||||||||||||||
| GMO Emerging Markets Opportunities Fund, Class VI | 80,556,568 | 14,281,406 | 76,112,925 | 295,748 | 13,985,658 | — | |||||||||||||||||||||
| GMO International Growth Equity Fund, Class IV | 224,920,412 | 97,033,707 | 45,334,133 | 8,571,422 | 9,255,424 | 146,275,269 | |||||||||||||||||||||
| GMO International Intrinsic Value Fund, Class IV | 221,378,801 | 110,034,495 | 45,031,416 | 8,995,032 | 14,665,950 | 140,086,040 | |||||||||||||||||||||
| GMO U.S. Core Equity Fund, Class VI | 224,789,300 | 50,384,722 | 71,628,817 | 3,784,722 | — | 122,343,703 | |||||||||||||||||||||
| GMO U.S. Quality Equity Fund, Class VI | 192,718,528 | 249,016,157 | 55,882,288 | 5,710,818 | 1,796,815 | 275,208,643 | |||||||||||||||||||||
| Totals | $ | 944,363,609 | $ | 578,764,513 | $ | 328,577,709 | $ | 27,365,491 | $ | 41,963,597 | $ | 698,544,923 | |||||||||||||||
15
Report of Independent Registered Public Accounting Firm
To the Trustees of GMO Trust and the Shareholders of
GMO World Opportunities Equity Allocation Fund:
In our opinion, the accompanying statement of assets and liabilities, including the schedule of investments, and the related statements of operations and of changes in net assets and the financial highlights present fairly, in all material respects, the financial position of GMO World Opportunities Equity Allocation Fund (the "Fund") at February 28, 2009, the results of its operations for the year then ended, the changes in its net assets for each of the two years in the period then ended and the financial highlights for the periods indicated, in conformity with accounting principles generally accepted in the United States of America. These financial statements and financial highlights (hereafter referred to as "financial statements") are the responsibility of the Fund's management. Our responsibility is to express an opinion on these financial statements based on our audits. We conducted our audits of these financial statements in accordance with the standards of the Public Company Accounting Oversight Board (United States). Those standards require that we plan and perform the audit to obtain reasonable assurance about whether the financial statements are free of material misstatement. An audit includes examining, on a test basis, evidence supporting the amounts and disclosures in the financial statements, assessing the accounting principles used and significant estimates made by management, and evaluating the overall financial statement presentation. We believe that our audits, which included confirmation of securities at February 28, 2009 by correspondence with the custodian, provide a reasonable basis for our opinion.
PricewaterhouseCoopers LLP
Boston, Massachusetts
April 29, 2009
16
GMO World Opportunities Equity Allocation Fund
(A Series of GMO Trust)
Fund Expenses
February 28, 2009 (Unaudited)
Expense Examples: The following information is in relation to expenses for the six month period ended February 28, 2009.
As a shareholder of the Fund, you may incur two types of costs: (1) transaction costs, including purchase premiums and redemption fees; and (2) ongoing costs, including indirect management fees, shareholder service fees, and other Fund expenses. This example is intended to help you understand your ongoing costs (in dollars) of investing in the Fund and to compare these costs with the ongoing costs of investing in other mutual funds.
These examples are based on an investment of $1,000 invested at the beginning of the period and held for the entire period, September 1, 2008 through February 28, 2009.
Actual Expenses
The first line of the table below provides information about actual account values and actual expenses. You may use the information in this line, together with the amount you invested, to estimate the expenses that you paid over the period. Simply divide your account value by $1,000 (for example, a $10,000,000 account value divided by $1,000 = 10,000), then multiply the result by the number in the first line under the heading entitled "Net Expense Incurred" to estimate the expenses you paid on your account during this period.
Hypothetical Example for Comparison Purposes
The second line of the table below provides information about hypothetical account values and hypothetical expenses based on the Fund's actual expense ratio and an assumed rate of return of 5% per year before expenses, which is not the Fund's actual return. The hypothetical account values and expenses may not be used to estimate the actual ending account balance or expenses you paid for the period. You may use this information to compare the ongoing costs of investing in the Fund with other funds. To do so, compare this 5% hypothetical example with the 5% hypothetical examples that appear in the shareholder reports of other funds.
Please note that the expenses shown in the table are meant to highlight your ongoing costs only and do not reflect any transactional costs, such as purchase premiums and redemption fees. Therefore, the second line of the table is useful in comparing ongoing costs only, and will not help you determine the relative total costs of owning different funds. In addition, if these transactional costs were included, your costs would have been higher.
| Annualized Net Expense Ratio | Beginning Account Value | Ending Account Value | Net Expense Incurred* | ||||||||||||||||
| Class III | |||||||||||||||||||
| 1) Actual | 0.48 | % | $ | 1,000.00 | $ | 642.10 | $ | 1.95 | |||||||||||
| 2) Hypothetical | 0.48 | % | $ | 1,000.00 | $ | 1,022.41 | $ | 2.41 | |||||||||||
* Expenses are calculated using the Class's annualized expense ratio (including indirect expenses incurred) for the six months ended February 28, 2009, multiplied by the average account value over the period, multiplied by 181 days in the period, divided by 365 days in the year.
17
GMO World Opportunities Equity Allocation Fund
(A Series of GMO Trust)
Tax Information for the Tax Year Ended February 28, 2009 (Unaudited)
The Fund will notify shareholders of amounts for use in preparing 2009 income tax forms in January 2010.
The Fund's distributions to shareholders include $48,761,300 from long-term capital gains.
For taxable, non-corporate shareholders, 77.71% of the income and short-term capital gains, if any, distributed in the Fund's fiscal year ended February 28, 2009 represents qualified dividend income subject to the 15% rate category.
For corporate shareholders, 34.62% of the income and short-term capital gains, if any, distributed in the Fund's fiscal year ended February 28, 2009 qualified for the dividends-received deduction.
18
Trustees and Officers (Unaudited)
The following tables list the Trust's Trustees and Officers as of the date of this report; their address and date of birth ("DOB"); their position with the Trust; the length of time holding that position with the Trust; their principal occupation(s) during the past five years; the number of portfolios in the fund complex they oversee; and other directorships they hold in companies subject to registration or reporting requirements of the Securities Exchange Act of 1934 (generally called "public companies") or in registered investment companies. The Trust's Statement of Additional Information ("SAI") includes additional information about the Trust's trustees, including changes subsequent to the date of the report. The SAI is available, without charge, upon request by writing GMO, c/o GMO Trust, 40 Rowes Wharf, Boston, MA 02110.
Independent Trustees:
| Name, Address, and DOB | Position(s) Held with Trust | Term of Office1 and Length of Time Served | Principal Occupation(s) During Past Five Years | Number of Portfolios in Fund Complex Overseen by Trustee | Other Directorships Held by Trustee | ||||||||||||||||||
| Donald W. Glazer, Esq. c/o GMO Trust 40 Rowes Wharf Boston, MA 02110 DOB: 07/26/1944 | Chairman of the Board of Trustees | Chairman of the Board of Trustees since March 2005; Lead Independent Trustee (September 2004 – March 2005); Trustee since December 2000. | Consultant – Law and Business2; Author of Legal Treatises. | 59 | None. | ||||||||||||||||||
1 Each Trustee is elected to serve during the continued lifetime of the Trust until he/she dies, resigns or is removed, or if sooner, until the next meeting of Shareholders called for the purpose of electing Trustees and until the election and qualification of his/her successor.
2 As part of Mr. Glazer's work as a consultant, he provides part-time consulting services to Goodwin Procter LLP ("Goodwin"). Goodwin has provided legal services to Renewable Resources, LLC, an affiliate of GMO; GMO, in connection with its relationship with Renewable Resources; and funds managed by Renewable Resources. Mr. Glazer has represented that he has no financial interest in, and is not involved in the provision of, such legal services. In the calendar years ended December 31, 2007 and December 31, 2008, these entities paid $789,416 and $183,864 respectively, in legal fees and disbursements to Goodwin. In correspondence with the Staff of the Securities and Exchange Commission beginning in August 2006, the Independent Trustees' legal counsel provided the Staff with information regarding Mr. Glazer's relationship with Goodwin and h is other business activities. On September 11, 2007, based on information that had been given to the Staff as of that date, the Staff provided oral no-action assurance consistent with the opinion of the Independent Trustees' legal counsel that Mr. Glazer is not an "interested person" of the Trust.
19
Independent Trustees — (Continued)
| Name, Address, and DOB | Position(s) Held with Trust | Term of Office1 and Length of Time Served | Principal Occupation(s) During Past Five Years | Number of Portfolios in Fund Complex Overseen by Trustee | Other Directorships Held by Trustee | ||||||||||||||||||
| W. Nicholas Thorndike c/o GMO Trust 40 Rowes Wharf Boston, MA 02110 DOB: 03/28/1933 | Trustee | Since March 2005. | Director or trustee of various corporations and charitable organizations, including Courier Corporation (a book publisher and manufacturer) (July 1989 – present); Putnam Funds (December 1992 – June 2004); and Providence Journal (a newspaper publisher) (December 1986 – December 2003). | 59 | Director of Courier Corporation (a book publisher and manufacturer); Member of the Investment Committee of Partners HealthCare System, Inc.3 | ||||||||||||||||||
| Peter Tufano c/o GMO Trust 40 Rowes Wharf Boston, MA 02110 DOB: 04/22/1957 | Trustee | Since December 2008. | Sylvan C. Coleman Professor of Financial Management, Harvard Business School (since 1989). | 59 | Trustee of State Street Navigator Securities Lending Trust (3 Portfolios). | ||||||||||||||||||
1 Each Trustee is elected to serve during the continued lifetime of the Trust until he/she dies, resigns or is removed, or if sooner, until the next meeting of Shareholders called for the purpose of electing Trustees and until the election and qualification of his/her successor.
3 Partners HealthCare System, Inc. is a client of the Manager.
20
Principal Officers:
| Name, Address, and DOB | Position(s) Held with Trust | Term of Office4 and Length of Time Served | Principal Occupation(s) During Past Five Years5 | ||||||||||||
| J.B. Kittredge DOB: 08/22/1954 | President and Chief Executive Officer | Since March 2009. | General Counsel, Grantham, Mayo, Van Otterloo & Co. LLC (October 2005 – Present); Partner, Ropes & Gray LLP. | ||||||||||||
| Sheppard N. Burnett c/o GMO Trust 40 Rowes Wharf Boston, MA 02110 DOB: 10/24/1968 | Treasurer and Chief Financial Officer | Chief Financial Officer since March 2007; Treasurer since November 2006; Assistant Treasurer, September 2004 – November 2006. | Fund Administration Staff, Grantham, Mayo, Van Otterloo & Co. LLC (June 2004 – present); Vice President, Director of Tax, Columbia Management Group (2002 – 2004). | ||||||||||||
| Brent C. Arvidson c/o GMO Trust 40 Rowes Wharf Boston, MA 02110 DOB: 06/26/1969 | Assistant Treasurer | Since August 1998. | Senior Fund Administrator, Grantham, Mayo, Van Otterloo & Co. LLC. | ||||||||||||
| John L. Nasrah c/o GMO Trust 40 Rowes Wharf Boston, MA 02110 DOB: 05/27/1977 | Assistant Treasurer | Since March 2007. | Fund Administrator, Grantham, Mayo, Van Otterloo & Co. LLC (September 2004 – present); Tax Analyst, Bain & Company, Inc. (June 2003 – September 2004). | ||||||||||||
| Mahmoodur Rahman c/o GMO Trust 40 Rowes Wharf Boston, MA 02110 DOB: 11/30/1967 | Assistant Treasurer | Since September 2007. | Fund Administrator, Grantham, Mayo, Van Otterloo & Co. LLC (April 2007 – present); Vice President and Senior Tax Manager, Massachusetts Financial Services Company (January 2000 – April 2007). | ||||||||||||
| Michael E. Gillespie c/o GMO Trust 40 Rowes Wharf Boston, MA 02110 DOB: 02/18/1958 | Chief Compliance Officer | Since March 2005. | Vice President of Compliance (June 2004 – February 2005) and Director of Domestic Compliance (March 2002 – June 2004), Fidelity Investments. | ||||||||||||
4 Each officer is elected to hold such office until his or her successor is duly elected and qualified to carry out the duties and responsibilities of the office, or until he or she resigns or is removed from office.
5 Each of Messrs. Burnett, Arvidson, Bohan, and Pottle serves as an officer and/or director of certain pooled investment vehicles of which GMO or an affiliate of GMO serves as the investment adviser.
21
Principal Officers — (Continued)
| Name, Address, and DOB | Position(s) Held with Trust | Term of Office4 and Length of Time Served | Principal Occupation(s) During Past Five Years5 | ||||||||||||
| Jason B. Harrison c/o GMO Trust 40 Rowes Wharf Boston, MA 02110 DOB: 01/29/1977 | Vice President and Clerk | Vice President since November 2006; Clerk since March 2006. | Legal Counsel, Grantham, Mayo, Van Otterloo & Co. LLC (since February 2006) and Attorney, Ropes & Gray LLP (September 2002 – February 2006). | ||||||||||||
| David L. Bohan c/o GMO Trust 40 Rowes Wharf Boston, MA 02110 DOB: 06/21/1964 | Vice President and Assistant Clerk | Vice President since March 2005; Assistant Clerk since March 2006. | Legal Counsel, Grantham, Mayo, Van Otterloo & Co. LLC. | ||||||||||||
| Gregory L. Pottle c/o GMO Trust 40 Rowes Wharf Boston, MA 02110 DOB: 07/09/1971 | Vice President and Assistant Clerk | Since November 2006. | Legal Counsel, Grantham, Mayo, Van Otterloo & Co. LLC. | ||||||||||||
| Anne K. Trinque c/o GMO Trust 40 Rowes Wharf Boston, MA 02110 DOB: 04/15/1978 | Vice President and Assistant Clerk | Since September 2007. | Legal Counsel, Grantham, Mayo, Van Otterloo & Co. LLC (January 2007 – present); Attorney, Goodwin Procter LLP (September 2003 – January 2007). | ||||||||||||
| Cheryl Wakeham c/o GMO Trust 40 Rowes Wharf Boston, MA 02110 DOB: 10/29/1958 | Vice President and Anti-Money Laundering Officer | Since December 2004. | Manager, Client Service Administration, Grantham, Mayo, Van Otterloo & Co. LLC. | ||||||||||||
4 Each officer is elected to hold such office until his or her successor is duly elected and qualified to carry out the duties and responsibilities of the office, or until he or she resigns or is removed from office.
5 Each of Messrs. Burnett, Arvidson, Bohan, and Pottle serves as an officer and/or director of certain pooled investment vehicles of which GMO or an affiliate of GMO serves as the investment adviser.
22
GMO Alpha Only Fund
(A Series of GMO Trust)
Annual Report
February 28, 2009
For a free copy of the Fund's proxy voting guidelines, shareholders may call 1-617-346-7646 (collect) or visit the Securities and Exchange Commission's website at www.sec.gov. Information regarding how the Fund voted proxies relating to portfolio securities during the most recent 12-month period ended June 30 is available on GMO's website at www.gmo.com, or on the Securities and Exchange Commission's website at www.sec.gov.
The Fund files its complete schedule of portfolio holdings with the Securities and Exchange Commission for the first and third quarter of each fiscal year on Form N-Q, which is available on the Commission's website at www.sec.gov. The Fund's Form N-Q may be reviewed and copied at the Commission's Public Reference Room in Washington, D.C. Information on the operation of the Public Reference Room may be obtained by calling 1-800-SEC-0330. The Fund has a policy with respect to disclosure of portfolio holdings under which it may also make available on GMO's website at www.gmo.com a complete schedule of portfolio holdings.
This report is prepared for the general information of shareholders. It is authorized for distribution to prospective investors only when preceded or accompanied by a prospectus for the GMO Trust, which contains a complete discussion of the risks associated with an investment in this Fund and other important information. The GMO Trust prospectus can be obtained at www.gmo.com.
GMO Alpha Only Fund
(A Series of GMO Trust)
Portfolio Management
Day-to-day management of the Fund's portfolio is the responsibility of the Asset Allocation team at Grantham, Mayo, Van Otterloo & Co. LLC.
Management Discussion and Analysis of Fund Performance
The Class III shares of the GMO Alpha Only Fund returned +11.9% for the fiscal year ended February 28, 2009, as compared to +1.3% for the Citigroup 3 Month Treasury Bill Index. During the fiscal year the Fund invested in global equity securities indirectly through its investment in underlying GMO mutual funds.
Implementation was positive as the GMO U.S. Core Equity, GMO U.S. Quality Equity, and GMO International Intrinsic Value Funds outperformed their respective benchmarks.
The views expressed herein are exclusively those of Grantham, Mayo, Van Otterloo & Co. LLC Management as of the date of this report and are subject to change. GMO disclaims any responsibility to update such views. They are not meant as investment advice. References to specific securities are not recommendations of such securities and may not be representative of any GMO portfolio's current or future investments.
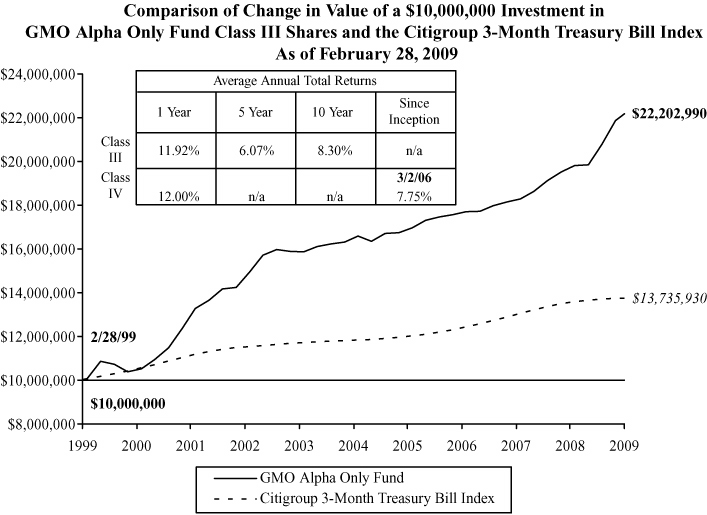
Performance data quoted represents past performance and is not indicative of future results. The investment return and principal value of an investment will fluctuate so that an investor's shares, when redeemed, may be worth more or less than their original cost. Current performance data may be lower or higher than the performance data provided herein. To obtain performance information to the most recent month-end, visit www.gmo.com. Performance shown is net of all fees after reimbursement from the Manager. Returns would have been lower had certain expenses not been reimbursed during the periods shown and do not include the effect of taxes on distributions and redemptions. All information is unaudited. Performance for Class IV shares will vary due to different fees.
GMO Alpha Only Fund
(A Series of GMO Trust)
Investments Concentration Summary
February 28, 2009 (Unaudited)
| Asset Class Summary* | % of Total Net Assets | ||||||
| Cash and Cash Equivalents | 81.9 | % | |||||
| Common Stocks | 69.2 | ||||||
| Short-Term Investments | 17.7 | ||||||
| Forward Currency Contracts | 0.3 | ||||||
| Rights and Warrants | 0.0 | ||||||
| Preferred Stocks | 0.0 | ||||||
| Swaps | (36.2 | ) | |||||
| Futures | (36.5 | ) | |||||
| Other | 3.6 | ||||||
| 100.0 | % | ||||||
* The table above incorporates aggregate indirect asset class exposure associated with investments in other funds of GMO Trust ("underlying funds"). Swaps and futures concentrations assume the notional value of the respective contracts.
1
GMO Alpha Only Fund
(A Series of GMO Trust)
Schedule of Investments
(showing percentage of total net assets)
February 28, 2009
| Shares / Par Value ($) | Description | Value ($) | |||||||||||||
| MUTUAL FUNDS — 73.2% | |||||||||||||||
| United States — 73.2% | |||||||||||||||
| Affiliated Issuers | |||||||||||||||
| 25,472,414 | GMO International Growth Equity Fund, Class IV | 368,331,113 | |||||||||||||
| 25,348,249 | GMO International Intrinsic Value Fund, Class IV | 354,875,492 | |||||||||||||
| 33,476,803 | GMO U.S. Core Equity Fund, Class VI | 255,428,005 | |||||||||||||
| 32,980,191 | GMO U.S. Quality Equity Fund, Class VI | 467,659,107 | |||||||||||||
| TOTAL MUTUAL FUNDS (COST $2,041,467,216) | 1,446,293,717 | ||||||||||||||
| SHORT-TERM INVESTMENTS — 15.3% | |||||||||||||||
| 60,400,000 | BNP Paribas Time Deposit, 0.23%, due 03/02/09 | 60,400,000 | |||||||||||||
| 60,400,000 | Branch Banking & Trust Time Deposit, 0.13%, due 03/02/09 | 60,400,000 | |||||||||||||
| 60,400,000 | HSBC Bank (USA) Time Deposit, 0.19%, due 03/02/09 | 60,400,000 | |||||||||||||
| 99,994 | Royal Bank of Scotland Time Deposit, 0.08%, due 03/02/09 | 99,994 | |||||||||||||
| 60,200,000 | Societe Generale Time Deposit, 0.25%, due 03/02/09 | 60,200,000 | |||||||||||||
| 60,400,000 | Wells Fargo Time Deposit, 0.35%, due 03/02/09 | 60,400,000 | |||||||||||||
| TOTAL SHORT-TERM INVESTMENTS (COST $301,899,994) | 301,899,994 | ||||||||||||||
| TOTAL INVESTMENTS — 88.5% (Cost $2,343,367,210) | 1,748,193,711 | ||||||||||||||
| Other Assets and Liabilities (net) — 11.5% | 227,670,541 | ||||||||||||||
| TOTAL NET ASSETS — 100.0% | $ | 1,975,864,252 | |||||||||||||
See accompanying notes to the financial statements.
2
GMO Alpha Only Fund
(A Series of GMO Trust)
Schedule of Investments — (Continued)
February 28, 2009
A summary of outstanding financial instruments at February 28, 2009 is as follows:
Forward Currency Contracts
| Settlement Date | Deliver/Receive | Units of Currency | Value | Net Unrealized Appreciation (Depreciation) | |||||||||||||||
| Buys | |||||||||||||||||||
| 4/24/09 | DKK | 84,101,000 | $ | 14,285,047 | $ | (318,356 | ) | ||||||||||||
| 4/24/09 | EUR | 41,351,000 | 52,409,195 | (1,152,342 | ) | ||||||||||||||
| 4/24/09 | EUR | 41,351,000 | 52,409,195 | (1,246,622 | ) | ||||||||||||||
| 4/24/09 | NOK | 64,985,000 | 9,227,722 | (112,693 | ) | ||||||||||||||
| 4/24/09 | SEK | 240,233,000 | 26,670,686 | (2,253,882 | ) | ||||||||||||||
| $ | 155,001,845 | $ | (5,083,895 | ) | |||||||||||||||
| Sales | |||||||||||||||||||
| 4/24/09 | AUD | 32,564,000 | $ | 20,746,546 | $ | 26,681 | |||||||||||||
| 4/24/09 | AUD | 36,759,846 | 23,419,722 | (73,544 | ) | ||||||||||||||
| 4/24/09 | CHF | 4,833,000 | 4,135,949 | 97,954 | |||||||||||||||
| 4/24/09 | CHF | 39,410,044 | 33,726,037 | (56,196 | ) | ||||||||||||||
| 4/24/09 | DKK | 21,108,878 | 3,585,466 | (21,884 | ) | ||||||||||||||
| 4/24/09 | EUR | 33,673,584 | 42,678,664 | (160,612 | ) | ||||||||||||||
| 4/24/09 | EUR | 34,693,996 | 43,971,957 | (390,053 | ) | ||||||||||||||
| 4/24/09 | EUR | 33,673,584 | 42,678,664 | (264,091 | ) | ||||||||||||||
| 4/24/09 | GBP | 19,481,806 | 27,887,270 | (195,441 | ) | ||||||||||||||
| 4/24/09 | GBP | 18,908,812 | 27,067,057 | (173,810 | ) | ||||||||||||||
| 4/24/09 | GBP | 18,908,812 | 27,067,057 | (109,595 | ) | ||||||||||||||
| 4/24/09 | HKD | 62,760,000 | 8,096,191 | 1,351 | |||||||||||||||
| 4/24/09 | HKD | 69,173,470 | 8,923,544 | 913 | |||||||||||||||
| 4/24/09 | JPY | 4,218,766,000 | 43,274,688 | 4,206,668 | |||||||||||||||
| 4/24/09 | JPY | 4,218,766,000 | 43,274,688 | 4,365,915 | |||||||||||||||
| 4/24/09 | JPY | 4,913,374,084 | 50,399,745 | 3,056,755 | |||||||||||||||
| 4/24/09 | JPY | 4,913,374,084 | 50,399,745 | 3,099,537 | |||||||||||||||
| 4/24/09 | NOK | 19,489,199 | 2,767,422 | (7,303 | ) | ||||||||||||||
| 4/24/09 | NZD | 1,414,268 | 705,798 | 11,532 | |||||||||||||||
| 4/24/09 | SEK | 65,149,897 | 7,232,946 | 225,183 | |||||||||||||||
| 4/24/09 | SGD | 13,147,742 | 8,491,801 | 167,796 | |||||||||||||||
| $ | 520,530,957 | $ | 13,807,756 | ||||||||||||||||
See accompanying notes to the financial statements.
3
GMO Alpha Only Fund
(A Series of GMO Trust)
Schedule of Investments — (Continued)
February 28, 2009
Futures Contracts
| Number of Contracts | Type | Expiration Date | Contract Value | Net Unrealized Appreciation (Depreciation) | |||||||||||||||
| Buys | |||||||||||||||||||
| 2,859 | OMXS 30 | March 2009 | $ | 20,066,153 | $ | (474,713 | ) | ||||||||||||
| 77 | AEX | March 2009 | 4,227,930 | (393,658 | ) | ||||||||||||||
| 70 | IBEX 35 | March 2009 | 6,669,707 | (256,285 | ) | ||||||||||||||
| 69 | DAX | March 2009 | 8,314,210 | (1,081,134 | ) | ||||||||||||||
| $ | 39,278,000 | $ | (2,205,790 | ) | |||||||||||||||
| Sales | |||||||||||||||||||
| 7,513 | S&P 500 E-Mini Index | March 2009 | $ | 275,802,230 | $ | 42,843,504 | |||||||||||||
| 348 | MSCI EAFE E-Mini | March 2009 | 17,038,080 | 4,940,729 | |||||||||||||||
| 331 | MSCI Singapore | March 2009 | 8,107,637 | 119,692 | |||||||||||||||
| 2,429 | TOPIX | March 2009 | 186,410,229 | 13,704,736 | |||||||||||||||
| 202 | S&P/MIB | March 2009 | 19,369,836 | 4,797,836 | |||||||||||||||
| 214 | Hang Seng | March 2009 | 17,293,907 | 246,270 | |||||||||||||||
| 1,528 | FTSE | March 2009 | 82,501,116 | 11,505,476 | |||||||||||||||
| 732 | CAC 40 | March 2009 | 24,731,104 | 1,918,787 | |||||||||||||||
| 837 | SPI 200 | March 2009 | 43,722,887 | 3,579,474 | |||||||||||||||
| $ | 674,977,026 | $ | 83,656,504 | ||||||||||||||||
See accompanying notes to the financial statements.
4
GMO Alpha Only Fund
(A Series of GMO Trust)
Schedule of Investments — (Continued)
February 28, 2009
Swap Agreements
Total Return Swaps
| Notional Amount | Expiration Date | Counterparty | Pay | Receive | Market Value | ||||||||||||||||||||||
| 211,861,464 | USD | 8/7/2009 | JP Morgan Chase Bank | Custom Low Quality Equity Basket | 3 month LIBOR -0.75% | $ | 41,051,304 | ||||||||||||||||||||
| 201,676,000 | USD | 8/10/2009 | Citigroup | Custom Low Quality Equity Basket | 3 month LIBOR -0.56% | 37,003,753 | |||||||||||||||||||||
| 192,111,944 | USD | 1/11/2010 | Morgan Stanley | Custom Low Quality Equity Basket | Daily Federal Funds Rate -0.52% | 18,061,597 | |||||||||||||||||||||
| 110,020,493 | USD | 2/3/2010 | Goldman Sachs | Custom Low Quality Equity Basket | Daily Federal Funds Rate -0.80% | 10,915,591 | |||||||||||||||||||||
| $ | 107,032,245 | ||||||||||||||||||||||||||
| Premiums to (Pay) Receive | $ | — | |||||||||||||||||||||||||
As of February 28, 2009, for the futures and/or swap contracts held, the Fund had sufficient cash and/or securities to cover any commitments or margin requirements of the relevant broker or exchange.
Notes to Schedule of Investments:
LIBOR - London Interbank Offered Rate
Currency Abbreviations:
| AUD - Australian Dollar CHF - Swiss Franc DKK - Danish Krone EUR - Euro GBP - Brit ish Pound HKD - Hong Kong Dollar | JPY - Japanese Yen NOK - Norwegian Krone NZD - New Zealand Dollar SEK - Swedish Krona SGD - Singapore Dollar USD - United States Dollar | ||||||
See accompanying notes to the financial statements.
5
GMO Alpha Only Fund
(A Series of GMO Trust)
Statement of Assets and Liabilities — February 28, 2009
| Assets: | |||||||
| Investments in unaffiliated issuers, at value (cost $301,899,994) (Note 2) | $ | 301,899,994 | |||||
| Investments in affiliated issuers, at value (cost $2,041,467,216) (Notes 2 and 8) | 1,446,293,717 | ||||||
| Interest receivable | 3,831 | ||||||
| Unrealized appreciation on open forward currency contracts (Note 2) | 15,260,285 | ||||||
| Receivable for collateral on open futures contracts (Note 2) | 104,936,000 | ||||||
| Receivable for variation margin on open futures contracts (Note 2) | 9,384,283 | ||||||
| Receivable for open swap contracts (Note 2) | 107,032,245 | ||||||
| Receivable for collateral on open swap contracts (Note 2) | 115,573 | ||||||
| Receivable for expenses reimbursed by Manager (Note 3) | 633,475 | ||||||
| Total assets | 1,985,559,403 | ||||||
| Liabilities: | |||||||
| Payable for Fund shares repurchased | 2,000,000 | ||||||
| Payable to affiliate for (Note 3): | |||||||
| Management fee | 764,763 | ||||||
| Shareholder service fee | 157,616 | ||||||
| Trustees and Chief Compliance Officer of GMO Trust fees | 6,449 | ||||||
| Unrealized depreciation on open forward currency contracts (Note 2) | 6,536,424 | ||||||
| Accrued expenses | 229,899 | ||||||
| Total liabilities | 9,695,151 | ||||||
| Net assets | $ | 1,975,864,252 | |||||
| Net assets consist of: | |||||||
| Paid-in capital | $ | 2,893,860,836 | |||||
| Accumulated undistributed net investment income | 67,448,822 | ||||||
| Distributions in excess of net realized gain | (587,478,727 | ) | |||||
| Net unrealized depreciation | (397,966,679 | ) | |||||
| $ | 1,975,864,252 | ||||||
| Net assets attributable to: | |||||||
| Class III shares | $ | 121,710,866 | |||||
| Class IV shares | $ | 1,854,153,386 | |||||
| Shares outstanding: | |||||||
| Class III | 21,083,486 | ||||||
| Class IV | 321,223,845 | ||||||
| Net asset value per share: | |||||||
| Class III | $ | 5.77 | |||||
| Class IV | $ | 5.77 | |||||
See accompanying notes to the financial statements.
6
GMO Alpha Only Fund
(A Series of GMO Trust)
Statement of Operations — Year Ended February 28, 2009
| Investment Income: | |||||||
| Dividends from affiliated issuers (Note 8) | $ | 65,927,951 | |||||
| Interest | 4,336,733 | ||||||
| Dividends | 2,358,668 | ||||||
| Total investment income | 72,623,352 | ||||||
| Expenses: | |||||||
| Management fee (Note 3) | 13,453,668 | ||||||
| Shareholder service fee – Class III (Note 3) | 274,605 | ||||||
| Shareholder service fee – Class IV (Note 3) | 2,507,652 | ||||||
| Custodian and fund accounting agent fees | 317,061 | ||||||
| Transfer agent fees | 41,738 | ||||||
| Audit and tax fees | 70,904 | ||||||
| Legal fees | 115,776 | ||||||
| Trustees fees and related expenses (Note 3) | 41,348 | ||||||
| Registration fees | 9,226 | ||||||
| Miscellaneous | 35,205 | ||||||
| Total expenses | 16,867,183 | ||||||
| Fees and expenses reimbursed by Manager (Note 3) | (520,089 | ) | |||||
| Expense reductions (Note 2) | (7,853 | ) | |||||
| Indirectly incurred fees waived or borne by Manager (Note 3) | (9,727,684 | ) | |||||
| Shareholder service fee waived (Note 3) | (1,622,293 | ) | |||||
| Net expenses | 4,989,264 | ||||||
| Net investment income (loss) | 67,634,088 | ||||||
| Realized and unrealized gain (loss): | |||||||
| Net realized gain (loss) on: | |||||||
| Investments in unaffiliated issuers | (58,629,810 | ) | |||||
| Investments in affiliated issuers | (881,353,399 | ) | |||||
| Realized gains distributions from affiliated issuers (Note 8) | 87,407,437 | ||||||
| Closed futures contracts | 547,607,458 | ||||||
| Closed swap contracts | 863,759,221 | ||||||
| Foreign currency, forward contracts and foreign currency related transactions | 71,434,047 | ||||||
| Net realized gain (loss) | 630,224,954 | ||||||
| Change in net unrealized appreciation (depreciation) on: | |||||||
| Investments in affiliated issuers | (391,979,894 | ) | |||||
| Open futures contracts | (15,748,770 | ) | |||||
| Open swap contracts | 44,982,978 | ||||||
| Foreign currency, forward contracts and foreign currency related transactions | 30,012,002 | ||||||
| Net unrealized gain (loss) | (332,733,684 | ) | |||||
| Net realized and unrealized gain (loss) | 297,491,270 | ||||||
| Net increase (decrease) in net assets resulting from operations | $ | 365,125,358 | |||||
See accompanying notes to the financial statements.
7
GMO Alpha Only Fund
(A Series of GMO Trust)
Statement of Changes in Net Assets
| Year Ended February 28, 2009 | Year Ended February 29, 2008 | ||||||||||
| Increase (decrease) in net assets: | |||||||||||
| Operations: | |||||||||||
| Net investment income (loss) | $ | 67,634,088 | $ | 37,393,719 | |||||||
| Net realized gain (loss) | 630,224,954 | 269,696,616 | |||||||||
| Change in net unrealized appreciation (depreciation) | (332,733,684 | ) | (146,534,773 | ) | |||||||
| Net increase (decrease) in net assets from operations | 365,125,358 | 160,555,562 | |||||||||
| Distributions to shareholders from: | |||||||||||
| Net investment income | |||||||||||
| Class III | (57,987,423 | ) | (3,121,593 | ) | |||||||
| Class IV | (869,600,332 | ) | (37,623,319 | ) | |||||||
| Total distributions from net investment income | (927,587,755 | ) | (40,744,912 | ) | |||||||
| Net realized gains | |||||||||||
| Class III | (30,565,835 | ) | — | ||||||||
| Class IV | (445,995,777 | ) | — | ||||||||
| Total distributions from net realized gains | (476,561,612 | ) | — | ||||||||
| (1,404,149,367 | ) | (40,744,912 | ) | ||||||||
| Net share transactions (Note 7): | |||||||||||
| Class III | 7,583,957 | (140,995 | ) | ||||||||
| Class IV | 272,747,018 | 752,392,494 | |||||||||
| Increase (decrease) in net assets resulting from net share transactions | 280,330,975 | 752,251,499 | |||||||||
| Purchase premiums and redemption fees (Notes 2 and 7): | |||||||||||
| Class III | 73,187 | 148,551 | |||||||||
| Class IV | 447,577 | 1,407,214 | |||||||||
| Increase in net assets resulting from purchase premiums and redemption fees | 520,764 | 1,555,765 | |||||||||
| Total increase (decrease) in net assets resulting from net share transactions, purchase premiums and redemption fees | 280,851,739 | 753,807,264 | |||||||||
| Total increase (decrease) in net assets | (758,172,270 | ) | 873,617,914 | ||||||||
| Net assets: | |||||||||||
| Beginning of period | 2,734,036,522 | 1,860,418,608 | |||||||||
| End of period (including accumulated undistributed net investment income of $67,448,822 and distributions in excess of net investment income of $4,242,356, respectively) | $ | 1,975,864,252 | $ | 2,734,036,522 | |||||||
See accompanying notes to the financial statements.
8
GMO Alpha Only Fund
(A Series of GMO Trust)
Financial Highlights
(For a Class III share outstanding throughout each period)
| Year Ended February 28/29, | |||||||||||||||||||||||
| 2009 | 2008 | 2007 | 2006 | 2005 | |||||||||||||||||||
| Net asset value, beginning of period | $ | 11.11 | $ | 10.42 | $ | 10.36 | $ | 10.26 | $ | 9.99 | |||||||||||||
| Income (loss) from investment operations: | |||||||||||||||||||||||
| Net investment income (loss)(a)† | 0.23 | 0.21 | 0.17 | 0.16 | 0.19 | ||||||||||||||||||
| Net realized and unrealized gain (loss) | 0.93 | 0.70 | 0.10 | 0.31 | 0.08 | ||||||||||||||||||
| Total from investment operations | 1.16 | 0.91 | 0.27 | 0.47 | 0.27 | ||||||||||||||||||
| Less distributions to shareholders: | |||||||||||||||||||||||
| From net investment income | (4.41 | ) | (0.22 | ) | (0.21 | ) | (0.37 | ) | — | ||||||||||||||
| From net realized gains | (2.09 | ) | — | — | — | — | |||||||||||||||||
| Total distributions | (6.50 | ) | (0.22 | ) | (0.21 | ) | (0.37 | ) | — | ||||||||||||||
| Net asset value, end of period | $ | 5.77 | $ | 11.11 | $ | 10.42 | $ | 10.36 | $ | 10.26 | |||||||||||||
| Total Return(b) | 11.92 | % | 8.74 | % | 2.64 | % | 4.63 | % | 2.70 | % | |||||||||||||
| Ratios/Supplemental Data: | |||||||||||||||||||||||
| Net assets, end of period (000's) | $ | 121,711 | $ | 176,067 | $ | 166,626 | $ | 1,460,161 | $ | 179,488 | |||||||||||||
| Net expenses to average daily net assets(c) | 0.23 | %(d) | 0.16 | %(d) | 0.15 | % | 0.10 | % | 0.18 | % | |||||||||||||
| Net investment income to average daily net assets(a) | 2.37 | % | 1.91 | % | 1.66 | % | 1.52 | % | 1.94 | % | |||||||||||||
| Portfolio turnover rate | 87 | % | 44 | % | 22 | % | 40 | % | 19 | % | |||||||||||||
| Fees and expenses reimbursed and/or waived by the Manager to average daily net assets: | 0.44 | % | 0.51 | % | 0.53 | % | 0.59 | % | 0.62 | % | |||||||||||||
| Purchase premiums and redemption fees consisted of the following per share amounts:† | $ | 0.00 | (e) | $ | 0.01 | $ | 0.01 | $ | 0.02 | $ | 0.01 | ||||||||||||
(a) Net investment income is affected by the timing of the declaration of dividends by the underlying funds in which the Fund invests.
(b) The total returns would have been lower had certain expenses not been reimbursed and/or waived during the periods shown and assumes the effect of reinvested distributions. Calculation excludes purchase premiums and redemption fees which are borne by the shareholder.
(c) Net expenses exclude expenses incurred indirectly through investment in the underlying funds (See Note 3).
(d) The net expense ratio does not include the effect of expense reductions.
(e) Purchase premiums and redemption fees were less than $0.01 per share.
† Calculated using average shares outstanding throughout the period.
See accompanying notes to the financial statements.
9
GMO Alpha Only Fund
(A Series of GMO Trust)
Financial Highlights
(For a Class IV share outstanding throughout each period)
| Year Ended February 28/29, | |||||||||||||||
| 2009 | 2008 | 2007(a) | |||||||||||||
| Net asset value, beginning of period | $ | 11.11 | $ | 10.41 | $ | 10.37 | |||||||||
| Income (loss) from investment operations: | |||||||||||||||
| Net investment income (loss)(b)† | 0.24 | 0.21 | 0.20 | ||||||||||||
| Net realized and unrealized gain (loss) | 0.92 | 0.71 | 0.06 | ||||||||||||
| Total from investment operations | 1.16 | 0.92 | 0.26 | ||||||||||||
| Less distributions to shareholders: | |||||||||||||||
| From net investment income | (4.41 | ) | (0.22 | ) | (0.22 | ) | |||||||||
| From net realized gains | (2.09 | ) | — | — | |||||||||||
| Total distributions | (6.50 | ) | (0.22 | ) | (0.22 | ) | |||||||||
| Net asset value, end of period | $ | 5.77 | $ | 11.11 | $ | 10.41 | |||||||||
| Total Return(c) | 12.00 | % | 8.90 | % | 2.54 | %** | |||||||||
| Ratios/Supplemental Data: | |||||||||||||||
| Net assets, end of period (000's) | $ | 1,854,153 | $ | 2,557,970 | $ | 1,693,793 | |||||||||
| Net expenses to average daily net assets(d) | 0.18 | %(e) | 0.11 | %(e) | 0.10 | %* | |||||||||
| Net investment income to average daily net assets(b) | 2.52 | % | 1.96 | % | 1.93 | %* | |||||||||
| Portfolio turnover rate | 87 | % | 44 | % | 22 | %†† | |||||||||
| Fees and expenses reimbursed and/or waived by the Manager to average daily net assets: | 0.44 | % | 0.51 | % | 0.53 | %* | |||||||||
| Purchase premiums and redemption fees consisted of the following per share amounts:† | $ | 0.00 | (f) | $ | 0.01 | $ | 0.00 | (f) | |||||||
(a) Period from March 2, 2006 (commencement of operations) through February 28, 2007.
(b) Net investment income is affected by the timing of the declaration of dividends by the underlying funds in which the Fund invests.
(c) The total returns would have been lower had certain expenses not been reimbursed and/or waived during the periods shown and assumes the effect of reinvested distributions. Calculation excludes purchase premiums and redemption fees which are borne by the shareholder.
(d) Net expenses exclude expenses incurred indirectly through investment in the underlying funds (See Note 3).
(e) The net expense ratio does not include the effect of expense reductions.
(f) Purchase premiums and redemption fees were less than $0.01 per share.
† Calculated using average shares outstanding throughout the period.
†† Calculation represents portfolio turnover of the Fund for the year ended February 28, 2007.
* Annualized.
** Not annualized.
See accompanying notes to the financial statements.
10
GMO Alpha Only Fund
(A Series of GMO Trust)
Notes to Financial Statements
February 28, 2009
1. Organization
GMO Alpha Only Fund (the "Fund") is a series of GMO Trust (the "Trust"). The Fund is registered under the Investment Company Act of 1940, as amended, as an open-end, non-diversified management investment company. The Fund is advised and managed by Grantham, Mayo, Van Otterloo & Co. LLC (the "Manager" or "GMO"). The Trust was established as a Massachusetts business trust under the laws of The Commonwealth of Massachusetts on June 24, 1985. The Declaration of Trust permits the Trustees of the Trust ("Trustees") to create an unlimited number of series of shares ("Funds") and to subdivide Funds into classes.
The Fund seeks to outperform the Citigroup 3 Month Treasury Bill Index. The Fund invests primarily in shares of the GMO U.S. Equity Funds and the GMO International Equity Funds (which may include one or more of the GMO Emerging Markets Funds). The Fund also may invest in shares of GMO Emerging Country Debt Fund ("ECDF") and GMO Flexible Equities Fund. In addition, the Fund may invest directly in securities of the type in which the underlying funds invest. The Fund invests in sub-asset classes that it expects to outperform the relevant broader asset class and implements its strategy with either direct or indirect investments in a combination of U.S., foreign, and emerging country equities and emerging country debt. The Fund seeks to hedge some or all of the expected return (and foreign currency exposure) of the broader asset class. To the extent that the Fund's hedges are effective, the performance of the Fund's portfolio is expe cted to have a low correlation to the performance of the broader global asset classes in which the Fund directly or indirectly invests. Instead, the Fund is expected to produce returns more like a short-term fixed income fund, with variation in return (alpha) resulting from aggregate outperformance or underperformance of the underlying funds and/or securities as well as the sub-asset classes in which the Fund invests relative to the relevant broader asset classes.
Throughout the year ended February 28, 2009, the Fund had two classes of shares outstanding: Class III and Class IV. Each class of shares bears a different level of shareholder service fees.
The financial statements of the series of the Trust in which the Fund invests ("underlying funds") should be read in conjunction with the Fund's financial statements. These financial statements are available, without charge, upon request by calling (617) 346-7646 (collect) or by visiting GMO's website at www.gmo.com.
2. Significant accounting policies
The following is a summary of significant accounting policies followed by the Fund in the preparation of its financial statements. These policies are in conformity with accounting principles generally accepted in the United States of America ("U.S. GAAP") and have been consistently followed by the Fund in preparing its financial statements. The preparation of financial statements in accordance with U.S. GAAP requires management to make estimates and assumptions that affect the reported amounts and disclosures in the financial statements. Actual results could differ from those estimates. The accounting records of the Fund are maintained in U.S. dollars.
11
GMO Alpha Only Fund
(A Series of GMO Trust)
Notes to Financial Statements — (Continued)
February 28, 2009
Portfolio valuation
Shares of the underlying funds and other mutual funds are generally valued at their net asset value.
Investments held by the underlying funds are valued as follows. Securities listed on a securities exchange for which market quotations are readily available are valued at the last sale price or official closing price on each business day, or if there is no such reported sale or official closing price, at the most recent quoted bid price. Unlisted securities for which market quotations are readily available are generally valued at the most recent quoted bid price. Debt instruments with a remaining maturity of sixty days or less are generally valued at amortized cost, which approximates fair value. Securities for which quotations are not readily available or whose values the Manager has determined to be unreliable are valued at fair value as determined in good faith by the Trustees or persons acting at their direction pursuant to procedures approved by the Trustees. By its nature, a fair value price is a good faith estimate of the value of a security at a given point in time and may not reflect the value that would be realized if the security were sold. The difference between a fair value price and the value realized upon a sale could be material. Because many foreign equity securities markets and exchanges close prior to the close of the New York Stock Exchange ("NYSE"), closing prices for foreign securities in those markets or on those exchanges do not reflect the events that occur after that close but before the close of the NYSE. As a result, the Fund generally values foreign equity securities using fair value prices, which are based on adjustments to closing prices supplied by a third party vendor based on that vendor's proprietary models. As of February 28, 2009, 31.60% of the net assets of the Fund, through investments in the underlying funds, were valued using fair value prices based on models used by a third party vendor.
In September 2006, the Financial Accounting Standards Board ("FASB") issued Statement of Financial Accounting Standards No. 157, Fair Value Measurements ("SFAS 157"). SFAS 157 is effective for the Fund's current fiscal year. While the adoption of SFAS 157 does not have an effect on the Fund's net asset value, it does require additional disclosures about fair value measurements. SFAS 157 establishes a three-level hierarchy for disclosure of fair value measurements. The valuation hierarchy is based upon the reliability of inputs to the valuation of the Fund's investments. The three levels are defined as follows:
Level 1 – Valuations based on quoted prices for identical securities in active markets.
Level 2 – Valuations determined using other significant direct or indirect observable inputs.
Level 3 – Valuations based on inputs that are unobservable and significant.
The inputs or methodology used for valuing securities are not necessarily an indication of the risk associated with investing in those securities.
12
GMO Alpha Only Fund
(A Series of GMO Trust)
Notes to Financial Statements — (Continued)
February 28, 2009
The following is a summary of the fair valuations according to inputs used as of February 28, 2009 in valuing the Fund's investments:
| Asset Valuation Inputs | Investments in Securities | Other Financial Instruments* | |||||||||
| Level 1 - Quoted Prices | $ | 1,748,193,711 | $ | 47,784,233 | |||||||
| Level 2 - Other Significant Observable Inputs | — | 158,164,801 | |||||||||
| Level 3 - Significant Unobservable Inputs | — | — | |||||||||
| Total | $ | 1,748,193,711 | $ | 205,949,034 | |||||||
* Other financial instruments include forward currency contracts, futures contracts and swap agreements.
| Liability Valuation Inputs | Investments in Securities | Other Financial Instruments** | |||||||||
| Level 1 - Quoted Prices | $ | — | $ | — | |||||||
| Level 2 - Other Significant Observable Inputs | — | (8,742,214 | ) | ||||||||
| Level 3 - Significant Unobservable Inputs | — | — | |||||||||
| Total | $ | — | $ | (8,742,214 | ) | ||||||
** Other financial instruments include forward currency contracts and futures contracts.
For the underlying fund's summary of valuation inputs please refer to the respective fund's portfolio valuation note.
The Fund held no investments or other financial instruments at either February 29, 2008 or February 28, 2009, whose fair value was determined using Level 3 inputs.
Foreign currency translation
The market values of foreign securities, currency holdings and related assets and liabilities are translated to U.S. dollars based on the 4 p.m. New York time exchange rates each business day. Income and expenses denominated in foreign currencies are translated at the 4 p.m. New York time exchange rates on the business day the income and expenses are accrued or incurred. The Fund does not isolate realized and unrealized gains and losses attributable to changes in exchange rates from gains and losses that arise from changes in the market value of investments. Such fluctuations are included with net realized and unrealized gain or loss on investments. Net realized gains and losses on foreign currency transactions represent gains and losses on disposition of currencies and forward currency contracts, currency gains and losses realized between the trade and settlement dates on securities transactions, and the difference between the amount of investment income and foreign withholding taxes recorded on the Fund's accounting records and the U.S. dollar equivalent amounts actually received or paid.
13
GMO Alpha Only Fund
(A Series of GMO Trust)
Notes to Financial Statements — (Continued)
February 28, 2009
Forward currency contracts
The Fund may enter into forward currency contracts including forward cross currency contracts. A forward currency contract is an agreement between two parties to buy and sell a currency at a set price on a future date. The market value of a forward currency contract fluctuates with changes in forward currency exchange rates. Forward currency contracts are marked to market daily using rates supplied by a quotation service and changes in value are recorded by the Fund as an unrealized gain or loss. Realized gains or losses equal to the difference between the value of the contract at the time it was opened and the value at the time it was closed are recorded upon delivery or receipt of the currency or, if a forward currency contract is offset by entering into another forward currency contract with the same broker, upon settlement of the net gain or loss. These contracts may involve market risk in excess of the unrealized gain or lo ss reflected in the Fund's Statement of Assets and Liabilities. They expose the Fund to the risk of unfavorable movements in currency values and the risk that the counterparty will be unable or unwilling to meet the terms of the contracts. Forward currency contracts outstanding at the end of the period are listed in the Fund's Schedule of Investments.
Futures contracts
The Fund may purchase and sell futures contracts. Upon entering into a futures contract, the Fund is required to deposit cash, U.S. government and agency obligations, or other liquid assets with the futures clearing broker in accordance with the initial margin requirements of the broker or exchange. In addition, the Fund maintains cash or securities in an amount that at least equals the net amount payable in the event the Fund must deliver the full amount of the contract. Futures contracts are marked to market daily and an appropriate payable or receivable for the change in value ("variation margin") is recorded by the Fund. The payable or receivable is settled on the following business day. Gains or losses are recognized but not considered realized until the contracts expire or are closed. Futures contracts involve, to varying degrees, risk of loss in excess of the variation margin disclosed in the Statement of Assets and Liabi lities. Under some circumstances, futures exchanges may establish daily limits on the amount that the price of a futures contract can vary from the previous day's settlement price, thereby effectively preventing liquidation of unfavorable positions. Losses may arise from changes in the value of the underlying instrument if the Fund is unable to liquidate a futures position due to an illiquid secondary market for the contract or the imposition of price limits, or if counterparties do not perform under the contract terms. Futures contracts are generally valued at the settlement price established each day by the board of trade or exchange on which they are traded. Because many foreign exchanges close prior to the close of the New York Stock Exchange ("NYSE"), closing prices for foreign futures in those markets or on those markets or on those exchanges do not reflect the events that occur after that close but before the close of the NYSE. As a result, the Fund generally values foreign futures using fair value pr ices, which are based on adjustments to closing prices supplied by a third party vendor based on that vendor's proprietary models. Futures contracts outstanding at the end of the period are listed in the Fund's Schedule of Investments.
14
GMO Alpha Only Fund
(A Series of GMO Trust)
Notes to Financial Statements — (Continued)
February 28, 2009
Options
The Fund may write (i.e., sell) call and put options. Writing options alters the Fund's exposure to the underlying instrument by, in the case of a call option, obligating the Fund to sell the underlying instrument at a set price to the option-holder and, in the case of a put option, obligating the Fund to purchase the underlying instrument at a set price from the option-holder. In the case of an index option, settlement will be in cash. When the Fund writes a call or put option, an amount equal to the premium received is recorded as a liability and subsequently marked to market to reflect the current value of the option written. Premiums received from writing options that expire are treated as realized gains. Premiums received from writing options that are exercised or closed are deducted from the amounts paid on the underlying future, security or currency transaction to determine the realized gain or loss. The Fund as a writer of an option has no control over whether the underlying future, security or currency may be sold (call) or purchased (put) and as a result bears the market risk of an unfavorable change in the price of the future, security or currency underlying the option. In the event that the Fund writes uncovered put or call options (i.e. options for investments that the Fund does not own), it bears the risk of substantial losses if the price of the underlying instrument increases during the term of the option. Options expose the Fund to the risk the Fund may not be able to enter into a closing transaction because of an illiquid market. The Fund had no open written option contracts during the period.
The Fund may also purchase put and call options. Purchasing options alters the Fund's exposure to the underlying instrument by, in the case of a call option, entitling the Fund to purchase the underlying instrument at a set price from the writer of the option and, in the case of a put option, entitling the Fund to sell the underlying instrument at a set price to the writer of the option. The Fund pays a premium for a purchased option. That premium is disclosed in the Schedule of Investments and is subsequently marked to market to reflect the current value of the option. Premiums paid for purchasing options that expire are treated as realized losses. Premiums paid for purchasing options that are exercised or closed are deducted from the proceeds on the closing transaction to determine the realized gain or loss. The risk associated with purchasing put and call options is limited to the premium paid. The Fund had no purchased optio n contracts outstanding at the end of the period.
The Fund values exchange traded options at the last sale price, or if no sale is reported, the last bid price for options it has purchased and the last ask price for options it has written. The Fund values options traded over-the-counter using inputs provided by primary pricing sources and industry standard models.
Swap agreements
The Fund may enter into various types of swap agreements, including without limitation, interest rate, total return, credit default and variance swap agreements. A swap agreement is an agreement to exchange the return generated by one instrument for the return generated by another instrument. When entering into a swap agreement, the Fund and/or the swap counterparty may post or receive cash or securities as collateral. The party posting the collateral typically receives the interest associated with or payments related to the collateral and has the risk of loss related to the collateral.
15
GMO Alpha Only Fund
(A Series of GMO Trust)
Notes to Financial Statements — (Continued)
February 28, 2009
Interest rate swap agreements involve an exchange by the parties of their respective commitments to pay or right to receive interest, e.g., an exchange of floating rate interest payments for fixed rate interest payments with respect to the notional amount of principal.
Total return swap agreements involve a commitment by one party to pay interest to the other party in exchange for a payment to it from the other party based on the return of a reference instrument (e.g., a security or basket of securities), both based on notional amounts. To the extent the return of the reference instrument exceeds or falls short of the interest payments, one party will receive a payment from or make a payment to the other party.
In a credit default swap agreement, one party makes payments to another party in exchange for the right to receive a specified return if a credit event occurs with respect to a referenced entity or entities. Buying credit default protection reduces the buyer's exposure in the event of an issuer's default (e.g., it reduces risk where a party owns a security issued by or otherwise has exposure to the issuer). Selling credit default protection subjects the seller to exposure to an issuer's default. A seller of credit default protection receives payments in return for its obligation to pay the principal amount of a debt security (or other agreed-upon value) to the other party upon the occurrence of a credit event (e.g., issuer default or similar event). If no credit event occurs, the seller has no payment obligations. For credit default swap agreements on asset-backed securities, a credit event may be triggered by such events as the issuer's failure to pay interest or principal, an agreement of the holders of an asset-backed security to a maturity extension, a rating downgrade on the security or a write-down on the collateral underlying the security. For credit default swap agreements on corporate or sovereign issuers, a credit event may be triggered by such events as the issuer's bankruptcy, failure to pay interest or principal, repudiation/moratorium or restructuring.
Variance swap agreements involve an agreement by two parties to exchange cash flows based on the measured variance (or square of volatility) of a specified underlying asset. One party agrees to exchange a "fixed rate" or strike price payment for the "floating rate" or realized price variance on the underlying asset with respect to the notional amount. At inception, the strike price chosen is generally fixed at a level such that the fair value of the swap is zero. At the expiration date, the amount paid by one party to the other is the difference between the realized price variance of the underlying asset and the strike price multiplied by the notional amount. A receiver of the realized price variance would receive a payment when the realized price variance of the underlying asset is greater than the strike price and would make a payment when that variance is less than the strike price. A payer of the realized price variance woul d make a payment when the realized price variance of the underlying asset is greater than the strike price and would receive a payment when that variance is less than the strike price. This type of agreement is essentially a forward contract on the future realized price variance of the underlying asset.
The Fund prices its swap agreements daily using models that may incorporate quotations from market makers and records the change in value, if any, as unrealized gain or loss in the Statement of Operations.
16
GMO Alpha Only Fund
(A Series of GMO Trust)
Notes to Financial Statements — (Continued)
February 28, 2009
Payments received or made on swap agreements are recorded as realized gain or loss in the Statement of Operations. Gains or losses are realized upon termination of the swap agreements.
Swap agreements often are not actively traded on financial markets. The values assigned to them may differ significantly from the values that would be realized upon termination, and the differences could be material. Entering into swap agreements involves credit, legal, market and documentation risk that is not reflected in the amounts reported in the Statement of Assets and Liabilities. Such risks include the possibility that the party with whom the Fund contracts may default on its obligations to perform or disagree as to the meaning of contractual terms, or that the collateral that party posts may be insufficient or not timely received by the Fund. Credit risk may be particularly acute in an environment where financial services firms are exposed to systemic risks of the type evidenced by the insolvency of Lehman Brothers and subsequent market disruptions. Swap agreements outstanding at the end of the period are listed in the Fund's Schedule of Investments.
Taxes and distributions
The Fund intends to qualify each tax year as a regulated investment company under Subchapter M of the Internal Revenue Code of 1986, as amended (the "Code"). The Fund intends to distribute substantially all of its net investment income and all of its net realized short-term and long-term capital gain, if any, after giving effect to any available capital loss carryforwards for U.S. federal income tax purposes. Therefore, no provision for U.S. federal income or excise tax is necessary.
The Fund's policy is to declare and pay distributions from net investment income, if any, semiannually, and from net realized short-term and long-term capital gain, if any, at least annually. All distributions are paid in shares of the Fund, at net asset value, unless the shareholder elects to receive cash distributions. Distributions to shareholders are recorded by the Fund on the ex-dividend date.
Income and capital gain distributions are determined in accordance with U.S. federal income tax regulations, which may differ from U.S. GAAP. Certain capital accounts in the financial statements are periodically adjusted for permanent differences in order to reflect their tax character. These adjustments have no impact on net assets or net asset value per share. Temporary differences that arise from recognizing certain items of income, expense, gain or loss in different periods for financial statement and tax purposes will reverse at some time in the future. Distributions in excess of net investment income or net realized gains are temporary over-distributions for financial statement purposes resulting from differences in the recognition or classification of income or distributions for financial statement and tax purposes.
U.S. GAAP and tax accounting differences primarily relate to derivative contract transactions, differing treatment of mutual fund distributions received, foreign currency transactions, losses on wash sale transactions and post-October capital losses.
17
GMO Alpha Only Fund
(A Series of GMO Trust)
Notes to Financial Statements — (Continued)
February 28, 2009
The following reclassification represents the amount necessary to report the stated components of net assets on a tax basis, excluding certain temporary differences, as of February 28, 2009. The financial highlights exclude these adjustments.
| Accumulated Undistributed Net Investment Income | Distributions in Excess of Net Realized Gain | Paid-in Capital | |||||||||
| $ | 931,644,845 | $ | (931,644,845 | ) | $ | — | |||||
The tax character of distributions declared to shareholders is as follows:
| 2/28/2009 | 2/29/2008 | ||||||||||
| Ordinary income (including any net short-term capital gain) | $ | 987,673,928 | $ | 40,744,912 | |||||||
| Net long-term capital gain | 416,475,439 | — | |||||||||
| Total distributions | $ | 1,404,149,367 | $ | 40,744,912 | |||||||
Distributions in excess of tax basis earnings and profits, if significant, are reported in the financial statements as a return of capital for tax purposes.
As of February 28, 2009, the components of distributable earnings on a tax basis consisted of the following:
| Undistributed ordinary income (including any net short-term capital gain) | $ | 93,465,400 | |||||
As of February 28, 2009, the Fund elected to defer to March 1, 2009 post-October capital losses of $96,558,266.
As of February 28, 2009, the approximate cost for U.S. federal income tax purposes and gross and net unrealized appreciation (depreciation) in value of investments were as follows:
| Aggregate Cost | Gross Unrealized Appreciation | Gross Unrealized (Depreciation) | Net Unrealized Appreciation (Depreciation) | ||||||||||||
| $ | 2,786,503,438 | $ | — | $ | (1,038,309,727 | ) | $ | (1,038,309,727 | ) | ||||||
The Fund is subject to the provisions of Financial Accounting Standards Board Interpretation No. 48 ("FIN 48"), Accounting for Uncertainty in Income Taxes — an Interpretation of FASB Statement No. 109.
18
GMO Alpha Only Fund
(A Series of GMO Trust)
Notes to Financial Statements — (Continued)
February 28, 2009
FIN 48 sets forth a minimum threshold for financial statement recognition of a tax position taken or expected to be taken in a tax return that could affect the Fund's financial statements. The Fund did not have any unrecognized tax benefits or liabilities at February 28, 2009, nor did it have any increases or decreases in unrecognized tax benefits or liabilities for the period then ended. The Fund is subject to examination prior to the expiration of the statute of limitations by U.S. federal and state tax authorities for tax returns filed.
Security transactions and related investment income
Security transactions in the financial statements are accounted for on the trade date. Income dividends and capital gain distributions from the underlying funds are recorded on the ex-dividend date. Interest income is recorded on the accrual basis. Non-cash dividends, if any, are recorded at the fair market value of the asset received. In determining the net gain or loss on securities sold, the Fund uses the identified cost basis for the purposes of determining the cost basis.
Expenses
The majority of the expenses of the Trust are directly identifiable to an individual fund. Expenses that are not readily identifiable to a specific fund are allocated taking into consideration, among other things, the nature and type of expense and the relative size of the funds. Investment income, common expenses and realized and unrealized gains and losses are allocated pro rata among the classes of shares of the Fund based on the relative net assets of each class. Shareholder service fees, which are directly attributable to a class of shares, are charged to that class's operations. In addition, the Fund incurs fees and expenses indirectly as a shareholder in the underlying funds. Because the underlying funds have different expense and fee levels and the Fund may own different proportions of the underlying funds at different times, the amount of fees and expenses indirectly incurred by the Fund will vary (See Note 3).
Brown Brothers Harriman & Co. ("BBH") serves as custodian and fund accounting agent of the Fund. State Street Bank and Trust Company ("State Street") serves as transfer agent of the Fund. BBH and State Street's fees may be reduced by an earnings allowance calculated on the average daily cash balances the Fund maintains with each agent. The Fund receives the benefit of the earnings allowance. In addition, Goldman Sachs Agency Lending, the Fund's securities lending agent, has agreed to reimburse the Fund for certain transactional expenses related to securities lending activity. Credit balances or expense reimbursements used to reduce fees, if any, are reported as a reduction of expenses in the Statement of Operations.
Purchases and redemptions of Fund shares
Effective June 30, 2008, the premium on cash purchases and fee on cash redemptions of Fund shares were each changed to 0.06% of the amount invested or redeemed. Effective September 30, 2008, the Fund no longer charged a premium on cash purchases or fee on cash redemptions of the amount invested or redeemed. As of February 28, 2009, the Fund did not charge a premium on cash purchases or fee on cash redemptions of the amount invested or redeemed. The Fund may impose a new purchase premium and/or
19
GMO Alpha Only Fund
(A Series of GMO Trust)
Notes to Financial Statements — (Continued)
February 28, 2009
redemption fee, or modify or eliminate an existing purchase premium and/or redemption fee, at any time. The level of purchase premium and redemption fee for the Fund may be adjusted to account for changes in the Fund's investments (i.e. changes in the percentage of Fund assets allocated to each underlying fund and direct investments). If the Manager determines that any portion of a cash purchase or redemption is offset by a corresponding cash redemption or purchase on the same day, the Fund will ordinarily waive or reduce the purchase premium or redemption fee with respect to that portion. All or portion of the redemption fees may be waived at the manager's discretion under circumstances in which the Manager deems it equitable to do so, including without limitation in cases where the weighted average of (i) the estimated transaction costs for directly held assets and (ii) the redemption fees, if any, imposed by the underlying fu nds is less than the Fund's redemption fee. In addition, the Fund may waive or reduce the purchase premium or redemption fee in extraordinary circumstances if the purchase or redemption will not cause the Fund to incur transaction costs. All purchase premiums and redemption fees are paid to the Fund and recorded by the Fund as paid-in capital. These fees are allocated relative to each class's net assets on the share transaction date. The Fund will waive or reduce the purchase premium relating to the in-kind portion of a purchase transaction except for estimated or known transaction costs (e.g. stamp duties and transfer taxes) incurred by the Fund as a result of the transfer of the purchasing shareholder's securities to the Fund. In-kind redemption transactions are generally not subject to redemption fees except when they include a cash component. However, when a substantial portion of a Fund is being redeemed, the Fund may charge a redemption fee based on estimated or known transaction costs resulting from t hose redemptions. The Fund charges no premium for reinvested distributions.
Investment risks
The Fund is subject to the investment risks associated with an investment in the underlying funds, some of which may invest in foreign securities. The Fund is subject to risks involved in investing in foreign securities that are not presented by investments in U.S. securities. These risks may involve adverse political and economic developments, including expropriation and the possible imposition of capital controls or other foreign governmental laws or restrictions. In addition, the securities of some foreign companies and securities markets are less liquid and at times more volatile than securities of comparable U.S. companies and U.S. securities markets. The risks described above apply to an even greater extent to investments in emerging markets. The securities markets of emerging countries are generally smaller, less developed, less liquid, and more volatile than the securities markets of the U.S. and developed foreign market s. Additionally, the investment risks associated with an investment in the underlying funds may be greater to the extent that the underlying funds engage in derivative transactions.
Recently issued accounting pronouncement
In March 2008, FASB issued Statement of Financial Accounting Standards No. 161, Disclosures about Derivative Instruments and Hedging Activities ("SFAS 161"). SFAS 161 is effective for fiscal years and interim periods beginning after November 15, 2008. SFAS 161 requires enhanced disclosures about the Fund's derivative and hedging activities. The Manager is currently evaluating the impact the adoption of SFAS 161 will have on the Fund's financial statement disclosures.
20
GMO Alpha Only Fund
(A Series of GMO Trust)
Notes to Financial Statements — (Continued)
February 28, 2009
3. Fees and other transactions with affiliates
GMO receives a management fee for the services it provides to the Fund. That fee is paid monthly at the annual rate of 0.50% of average daily net assets. The Fund has adopted a Shareholder Service Plan under which the Fund pays GMO a shareholder service fee for client and shareholder service, reporting, and other support. Pursuant to the Shareholder Service Plan, the shareholder service fee is calculated based on average daily net assets of each class at the annual rate of 0.15% for Class III shares and 0.10% for Class IV shares. The Manager will waive the Fund's shareholder service fee to the extent that the aggregate of any direct and indirect shareholder service fees borne by a class of shares of the Fund exceeds 0.15% for Class III shares and 0.10% for Class IV shares; provided, however, that the amount of this waiver will not exceed the respective Class' shareholder service fee.
Through at least June 30, 2009, the Manager has contractually agreed to reimburse the Fund for Fund expenses incurred through that date (excluding "Excluded Expenses", as defined below). Excluded Expenses include fees and expenses of the independent Trustees of the Trust, fees and expenses for legal services not approved by the Manager for the Trust, compensation and expenses of the Trust's Chief Compliance Officer ("CCO") (excluding any employee benefits), brokerage commissions, securities lending fees and expenses, interest expense, transfer taxes, and other investment-related costs (including expenses associated with investments in any company that is an investment company or would be an investment company under the 1940 Act, but for the exceptions to the definition of investment company provided in Section 3(c)(1) and 3(c)(7) of the 1940 Act), hedging transaction fees, extraordinary, non-recurring and certain other unusual e xpenses (including taxes) (collectively, "Excluded Fund Fees and Expenses"). In addition, the Manager has contractually agreed to reimburse the Fund through at least June 30, 2009 to the extent that the sum of (a) the Fund's total annual operating expenses (excluding Excluded Fund Fees and Expenses) and (b) the amount of fees and expenses incurred indirectly by the Fund through its investment in underlying funds (excluding these Funds' Excluded Fund Fees and Expenses) exceeds 0.50% of the Fund's average daily net assets, subject to a maximum total reimbursement to the Fund equal to 0.50% of the Fund's average daily net assets.
The Fund incurs varying fees and expenses indirectly as a shareholder in the underlying funds. Because of that variation the levels of indirect net expenses set forth below are affected by the Manager's asset allocation decisions. For the year ended February 28, 2009, these indirect fees and expenses expressed as an annualized percentage of the Fund's average daily net assets were as follows:
| Indirect Net Expenses (excluding shareholder service fees) | Indirect Shareholder Service Fees | Total Indirect Expenses | |||||||||
| 0.368 | % | 0.060 | % | 0.428 | % | ||||||
The Fund's portion of the fees paid by the Trust to the Trust's independent Trustees and CCO during the year ended February 28, 2009 was $33,951 and $18,387, respectively. The compensation and expenses of
21
GMO Alpha Only Fund
(A Series of GMO Trust)
Notes to Financial Statements — (Continued)
February 28, 2009
the CCO are included in miscellaneous expenses in the Statement of Operations. The Fund paid no remuneration to any other officer of the Trust.
4. Purchases and sales of securities
Cost of purchases and proceeds from sales of securities, excluding short-term investments, for the year ended February 28, 2009 aggregated $2,410,555,556 and $1,995,543,845, respectively.
5. Guarantees
In the normal course of business the Fund enters into contracts with third-party service providers that contain a variety of representations and warranties and that provide general indemnifications. The Fund's maximum exposure under these arrangements is unknown, as it involves future claims that may be made against the Fund that have not yet occurred. Based on experience, management is of the view that the risk of loss in connection with its indemnification obligations is remote; however, there can be no assurance that such obligations will not result in material liabilities that adversely affect the Fund.
6. Principal shareholders and related parties
As of February 28, 2009, 77.18% of the outstanding shares of the Fund were held by three shareholders, each holding more than 10% of the Fund's outstanding shares. On that date, no other shareholder owned more than 10% of the outstanding shares of the Fund. Two of the shareholders are other funds of the Trust. Redemptions from (or investments into) the Fund by or on behalf of these large shareholders may have a material effect on the Fund.
As of February 28, 2009, 1.01% of the Fund's shares were held by senior management of the Manager and GMO Trust officers and 98.21% of the Fund's shares were held by accounts for which the Manager had investment discretion.
22
GMO Alpha Only Fund
(A Series of GMO Trust)
Notes to Financial Statements — (Continued)
February 28, 2009
7. Share transactions
The Declaration of Trust permits the Trust to issue an unlimited number of shares of beneficial interest (without par value). Transactions in Fund shares were as follows:
| Year Ended February 28, 2009 | Year Ended February 29, 2008 | ||||||||||||||||||
| Class III: | Shares | Amount | Shares | Amount | |||||||||||||||
| Shares sold | 10,891,534 | $ | 107,005,790 | 7,060,158 | $ | 77,385,165 | |||||||||||||
| Shares issued to shareholders in reinvestment of distributions | 10,963,624 | 75,954,352 | 219,377 | 2,393,411 | |||||||||||||||
| Shares repurchased | (16,617,931 | ) | (175,376,185 | ) | (7,426,248 | ) | (79,919,571 | ) | |||||||||||
| Purchase premiums | — | 65,115 | — | 77,245 | |||||||||||||||
| Redemption fees | — | 8,072 | — | 71,306 | |||||||||||||||
| Net increase (decrease) | 5,237,227 | $ | 7,657,144 | (146,713 | ) | $ | 7,556 | ||||||||||||
| Year Ended February 28, 2009 | Year Ended February 29, 2008 | ||||||||||||||||||
| Class IV: | Shares | Amount | Shares | Amount | |||||||||||||||
| Shares sold | 81,138,618 | $ | 775,605,728 | 111,659,135 | $ | 1,226,989,475 | |||||||||||||
| Shares issued to shareholders in reinvestment of distributions | 192,685,490 | 1,315,596,109 | 3,451,680 | 37,623,319 | |||||||||||||||
| Shares repurchased | (182,907,526 | ) | (1,818,454,819 | ) | (47,448,673 | ) | (512,220,300 | ) | |||||||||||
| Purchase premiums | — | 404,109 | — | 1,070,665 | |||||||||||||||
| Redemption fees | — | 43,468 | — | 336,549 | |||||||||||||||
| Net increase (decrease) | 90,916,582 | $ | 273,194,595 | 67,662,142 | $ | 753,799,708 | |||||||||||||
23
GMO Alpha Only Fund
(A Series of GMO Trust)
Notes to Financial Statements — (Continued)
February 28, 2009
8. Investments in affiliated issuers
A summary of the Fund's transactions in the shares of other funds of the Trust during the year ended February 28, 2009 is set forth below:
| Affiliate | Value, beginning of period | Purchases | Sales Proceeds | Dividend Income | Distributions of Realized Gains | Value, end of period | |||||||||||||||||||||
| GMO Emerging Markets Fund, Class VI | $ | 257,477,237 | $ | 67,225,874 | $ | 281,175,938 | $ | — | $ | 24,225,874 | $ | — | |||||||||||||||
| GMO International Growth Equity Fund, Class IV | 580,969,085 | 486,659,134 | 333,221,000 | 21,825,351 | 23,250,628 | 368,331,113 | |||||||||||||||||||||
| GMO International Intrinsic Value Fund, Class IV | 580,446,151 | 513,405,048 | 325,413,000 | 23,551,038 | 37,138,814 | 354,875,492 | |||||||||||||||||||||
| GMO U.S. Core Equity Fund, Class VI | 612,178,641 | 289,273,752 | 444,615,000 | 9,326,850 | — | 255,428,005 | |||||||||||||||||||||
| GMO U.S. Quality Equity Fund, Class VI | 332,173,994 | 910,186,032 | 525,943,000 | 11,224,712 | 2,792,121 | 467,659,107 | |||||||||||||||||||||
| Totals | $ | 2,363,245,108 | $ | 2,266,749,840 | $ | 1,910,367,938 | $ | 65,927,951 | $ | 87,407,437 | $ | 1,446,293,717 | |||||||||||||||
9. Subsequent event
Subsequent to February 28, 2009, the Fund received redemption requests in the amount of $1,015,796,278.
24
Report of Independent Registered Public Accounting Firm
To the Trustees of GMO Trust and the Shareholders of
GMO Alpha Only Fund:
In our opinion, the accompanying statement of assets and liabilities, including the schedule of investments, and the related statements of operations and of changes in net assets and the financial highlights present fairly, in all material respects, the financial position of GMO Alpha Only Fund (the "Fund") at February 28, 2009, the results of its operations for the year then ended, the changes in its net assets for each of the two years in the period then ended and the financial highlights for the periods indicated, in conformity with accounting principles generally accepted in the United States of America. These financial statements and financial highlights (hereafter referred to as "financial statements") are the responsibility of the Fund's management. Our responsibility is to express an opinion on these financial statements based on our audits. We conducted our audits of these financial statements in accordance with the sta ndards of the Public Company Accounting Oversight Board (United States). Those standards require that we plan and perform the audit to obtain reasonable assurance about whether the financial statements are free of material misstatement. An audit includes examining, on a test basis, evidence supporting the amounts and disclosures in the financial statements, assessing the accounting principles used and significant estimates made by management, and evaluating the overall financial statement presentation. We believe that our audits, which included confirmation of securities at February 28, 2009 by correspondence with the custodian and brokers, provide a reasonable basis for our opinion.
PricewaterhouseCoopers LLP
Boston, Massachusetts
April 29, 2009
25
GMO Alpha Only Fund
(A Series of GMO Trust)
Fund Expenses
February 28, 2009 (Unaudited)
Expense Examples: The following information is in relation to expenses for the six month period ended February 28, 2009.
As a shareholder of the Fund, you may incur two types of costs: (1) transaction costs, including purchase premiums and redemption fees; and (2) ongoing costs, including management fees, shareholder service fees, and other Fund expenses. This example is intended to help you understand your ongoing costs (in dollars) of investing in the Fund and to compare these costs with the ongoing costs of investing in other mutual funds.
These examples are based on an investment of $1,000 invested at the beginning of the period and held for the entire period, September 1, 2008 through February 28, 2009.
Actual Expenses
The first line of the table for each class below provides information about actual account values and actual expenses. You may use the information in this line, together with the amount you invested, to estimate the expenses that you paid over the period. Simply divide your account value by $1,000 (for example, a $10,000,000 account value divided by $1,000 = 10,000), then multiply the result by the number in the first line under the heading entitled "Net Expense Incurred" to estimate the expenses you paid on your account during this period.
Hypothetical Example for Comparison Purposes
The second line of the table for each class below provides information about hypothetical account values and hypothetical expenses based on the Fund's actual expense ratio and an assumed rate of return of 5% per year before expenses, which is not the Fund's actual return. The hypothetical account values and expenses may not be used to estimate the actual ending account balance or expenses you paid for the period. You may use this information to compare the ongoing costs of investing in the Fund with other funds. To do so, compare this 5% hypothetical example with the 5% hypothetical examples that appear in the shareholder reports of other funds.
Please note that the expenses shown in the table are meant to highlight your ongoing costs only and do not reflect any transactional costs, such as purchase premiums and redemption fees. Therefore, the second line of the table is useful in comparing ongoing costs only, and will not help you determine the relative total costs of owning different funds. In addition, if these transactional costs were included, your costs would have been higher.
| Annualized Net Expense Ratio | Beginning Account Value | Ending Account Value | Net Expense Incurred* | ||||||||||||||||
| Class III | |||||||||||||||||||
| 1) Actual | 0.66 | % | $ | 1,000.00 | $ | 1,111.70 | $ | 3.46 | |||||||||||
| 2) Hypothetical | 0.66 | % | $ | 1,000.00 | $ | 1,021.52 | $ | 3.31 | |||||||||||
| Class IV | |||||||||||||||||||
| 1) Actual | 0.61 | % | $ | 1,000.00 | $ | 1,112.40 | $ | 3.19 | |||||||||||
| 2) Hypothetical | 0.61 | % | $ | 1,000.00 | $ | 1,021.77 | $ | 3.06 | |||||||||||
* Expenses are calculated using each Class's annualized net expense ratio (including indirect expenses incurred) for the six months ended February 28, 2009, multiplied by the average account value over the period, multiplied by 181 days in the period, divided by 365 days in the year.
26
GMO Alpha Only Fund
(A Series of GMO Trust)
Tax Information for the Tax Year Ended February 28, 2009 (Unaudited)
The Fund will notify shareholders of amounts for use in preparing 2009 income tax forms in early 2010.
The Fund's distributions to shareholders include $416,475,439 from long-term capital gains.
For taxable, non-corporate shareholders, 5.43% of the income and short-term capital gains, if any, distributed in the Fund's fiscal year ended February 28, 2009 represents qualified dividend income subject to the 15% rate category.
For corporate shareholders, 2.08% of the income and short-term capital gains, if any, distributed in the Fund's fiscal year ended February 28, 2009 qualified for the dividends-received deduction.
The Fund hereby designates as qualified interest income and qualified short-term capital gains with respect to its taxable year ended February 28, 2009, $3,015,633 and $59,977,898, respectively, or if determined to be different, the qualified interest income and qualified short-term capital gains of such year.
27
Trustees and Officers (Unaudited)
The following tables list the Trust's Trustees and Officers as of the date of this report; their address and date of birth ("DOB"); their position with the Trust; the length of time holding that position with the Trust; their principal occupation(s) during the past five years; the number of portfolios in the fund complex they oversee; and other directorships they hold in companies subject to registration or reporting requirements of the Securities Exchange Act of 1934 (generally called "public companies") or in registered investment companies. The Trust's Statement of Additional Information ("SAI") includes additional information about the Trust's trustees, including changes subsequent to the date of the report. The SAI is available, without charge, upon request by writing GMO, c/o GMO Trust, 40 Rowes Wharf, Boston, MA 02110.
Independent Trustees:
| Name, Address, and DOB | Position(s) Held with Trust | Term of Office1 and Length of Time Served | Principal Occupation(s) During Past Five Years | Number of Portfolios in Fund Complex Overseen by Trustee | Other Directorships Held by Trustee | ||||||||||||||||||
| Donald W. Glazer, Esq. c/o GMO Trust 40 Rowes Wharf Boston, MA 02110 DOB: 07/26/1944 | Chairman of the Board of Trustees | Chairman of the Board of Trustees since March 2005; Lead Independent Trustee (September 2004 – March 2005); Trustee since December 2000. | Consultant – Law and Business2; Author of Legal Treatises. | 59 | None. | ||||||||||||||||||
1 Each Trustee is elected to serve during the continued lifetime of the Trust until he/she dies, resigns or is removed, or if sooner, until the next meeting of Shareholders called for the purpose of electing Trustees and until the election and qualification of his/her successor.
2 As part of Mr. Glazer's work as a consultant, he provides part-time consulting services to Goodwin Procter LLP ("Goodwin"). Goodwin has provided legal services to Renewable Resources, LLC, an affiliate of GMO; GMO, in connection with its relationship with Renewable Resources; and funds managed by Renewable Resources. Mr. Glazer has represented that he has no financial interest in, and is not involved in the provision of, such legal services. In the calendar years ended December 31, 2007 and December 31, 2008, these entities paid $789,416 and $183,864 respectively, in legal fees and disbursements to Goodwin. In correspondence with the Staff of the Securities and Exchange Commission beginning in August 2006, the Independent Trustees' legal counsel provided the Staff with information regarding Mr. Glazer's relationship with Goodwin and h is other business activities. On September 11, 2007, based on information that had been given to the Staff as of that date, the Staff provided oral no-action assurance consistent with the opinion of the Independent Trustees' legal counsel that Mr. Glazer is not an "interested person" of the Trust.
28
Independent Trustees — (Continued)
| Name, Address, and DOB | Position(s) Held with Trust | Term of Office1 and Length of Time Served | Principal Occupation(s) During Past Five Years | Number of Portfolios in Fund Complex Overseen by Trustee | Other Directorships Held by Trustee | ||||||||||||||||||
| W. Nicholas Thorndike c/o GMO Trust 40 Rowes Wharf Boston, MA 02110 DOB: 03/28/1933 | Trustee | Since March 2005. | Director or trustee of various corporations and charitable organizations, including Courier Corporation (a book publisher and manufacturer) (July 1989 – present); Putnam Funds (December 1992 – June 2004); and Providence Journal (a newspaper publisher) (December 1986 – December 2003). | 59 | Director of Courier Corporation (a book publisher and manufacturer); Member of the Investment Committee of Partners HealthCare System, Inc.3 | ||||||||||||||||||
| Peter Tufano c/o GMO Trust 40 Rowes Wharf Boston, MA 02110 DOB: 04/22/1957 | Trustee | Since December 2008. | Sylvan C. Coleman Professor of Financial Management, Harvard Business School (since 1989). | 59 | Trustee of State Street Navigator Securities Lending Trust (3 Portfolios). | ||||||||||||||||||
1 Each Trustee is elected to serve during the continued lifetime of the Trust until he/she dies, resigns or is removed, or if sooner, until the next meeting of Shareholders called for the purpose of electing Trustees and until the election and qualification of his/her successor.
3 Partners HealthCare System, Inc. is a client of the Manager.
29
Principal Officers:
| Name, Address, and DOB | Position(s) Held with Trust | Term of Office4 and Length of Time Served | Principal Occupation(s) During Past Five Years5 | ||||||||||||
| J.B. Kittredge DOB: 08/22/1954 | President and Chief Executive Officer | Since March 2009. | General Counsel, Grantham, Mayo, Van Otterloo & Co. LLC (October 2005 – Present); Partner, Ropes & Gray LLP. | ||||||||||||
| Sheppard N. Burnett c/o GMO Trust 40 Rowes Wharf Boston, MA 02110 DOB: 10/24/1968 | Treasurer and Chief Financial Officer | Chief Financial Officer since March 2007; Treasurer since November 2006; Assistant Treasurer, September 2004 – November 2006. | Fund Administration Staff, Grantham, Mayo, Van Otterloo & Co. LLC (June 2004 – present); Vice President, Director of Tax, Columbia Management Group (2002 – 2004). | ||||||||||||
| Brent C. Arvidson c/o GMO Trust 40 Rowes Wharf Boston, MA 02110 DOB: 06/26/1969 | Assistant Treasurer | Since August 1998. | Senior Fund Administrator, Grantham, Mayo, Van Otterloo & Co. LLC. | ||||||||||||
| John L. Nasrah c/o GMO Trust 40 Rowes Wharf Boston, MA 02110 DOB: 05/27/1977 | Assistant Treasurer | Since March 2007. | Fund Administrator, Grantham, Mayo, Van Otterloo & Co. LLC (September 2004 – present); Tax Analyst, Bain & Company, Inc. (June 2003 – September 2004). | ||||||||||||
| Mahmoodur Rahman c/o GMO Trust 40 Rowes Wharf Boston, MA 02110 DOB: 11/30/1967 | Assistant Treasurer | Since September 2007. | Fund Administrator, Grantham, Mayo, Van Otterloo & Co. LLC (April 2007 – present); Vice President and Senior Tax Manager, Massachusetts Financial Services Company (January 2000 – April 2007). | ||||||||||||
| Michael E. Gillespie c/o GMO Trust 40 Rowes Wharf Boston, MA 02110 DOB: 02/18/1958 | Chief Compliance Officer | Since March 2005. | Vice President of Compliance (June 2004 – February 2005) and Director of Domestic Compliance (March 2002 – June 2004), Fidelity Investments. | ||||||||||||
4 Each officer is elected to hold such office until his or her successor is duly elected and qualified to carry out the duties and responsibilities of the office, or until he or she resigns or is removed from office.
5 Each of Messrs. Burnett, Arvidson, Bohan, and Pottle serves as an officer and/or director of certain pooled investment vehicles of which GMO or an affiliate of GMO serves as the investment adviser.
30
Principal Officers — (Continued)
| Name, Address, and DOB | Position(s) Held with Trust | Term of Office4 and Length of Time Served | Principal Occupation(s) During Past Five Years5 | ||||||||||||
| Jason B. Harrison c/o GMO Trust 40 Rowes Wharf Boston, MA 02110 DOB: 01/29/1977 | Vice President and Clerk | Vice President since November 2006; Clerk since March 2006. | Legal Counsel, Grantham, Mayo, Van Otterloo & Co. LLC (since February 2006) and Attorney, Ropes & Gray LLP (September 2002 – February 2006). | ||||||||||||
| David L. Bohan c/o GMO Trust 40 Rowes Wharf Boston, MA 02110 DOB: 06/21/1964 | Vice President and Assistant Clerk | Vice President since March 2005; Assistant Clerk since March 2006. | Legal Counsel, Grantham, Mayo, Van Otterloo & Co. LLC. | ||||||||||||
| Gregory L. Pottle c/o GMO Trust 40 Rowes Wharf Boston, MA 02110 DOB: 07/09/1971 | Vice President and Assistant Clerk | Since November 2006. | Legal Counsel, Grantham, Mayo, Van Otterloo & Co. LLC. | ||||||||||||
| Anne K. Trinque c/o GMO Trust 40 Rowes Wharf Boston, MA 02110 DOB: 04/15/1978 | Vice President and Assistant Clerk | Since September 2007. | Legal Counsel, Grantham, Mayo, Van Otterloo & Co. LLC (January 2007 – present); Attorney, Goodwin Procter LLP (September 2003 – January 2007). | ||||||||||||
| Cheryl Wakeham c/o GMO Trust 40 Rowes Wharf Boston, MA 02110 DOB: 10/29/1958 | Vice President and Anti-Money Laundering Officer | Since December 2004. | Manager, Client Service Administration, Grantham, Mayo, Van Otterloo & Co. LLC. | ||||||||||||
4 Each officer is elected to hold such office until his or her successor is duly elected and qualified to carry out the duties and responsibilities of the office, or until he or she resigns or is removed from office.
5 Each of Messrs. Burnett, Arvidson, Bohan, and Pottle serves as an officer and/or director of certain pooled investment vehicles of which GMO or an affiliate of GMO serves as the investment adviser.
31
GMO Inflation Indexed Plus Bond Fund
(A Series of GMO Trust)
Annual Report
February 28, 2009
For a free copy of the Fund's proxy voting guidelines, shareholders may call 1-617-346-7646 (collect) or visit the Securities and Exchange Commission's website at www.sec.gov. Information regarding how the Fund voted proxies relating to portfolio securities during the most recent 12-month period ended June 30 is available on GMO's website at www.gmo.com, or on the Securities and Exchange Commission's website at www.sec.gov.
The Fund files its complete schedule of portfolio holdings with the Securities and Exchange Commission for the first and third quarter of each fiscal year on Form N-Q, which is available on the Commission's website at www.sec.gov. The Fund's Form N-Q may be reviewed and copied at the Commission's Public Reference Room in Washington, D.C. Information on the operation of the Public Reference Room may be obtained by calling 1-800-SEC-0330. The Fund has a policy with respect to disclosure of portfolio holdings under which it may also make available on GMO's website at www.gmo.com a complete schedule of portfolio holdings.
This report is prepared for the general information of shareholders. It is authorized for distribution to prospective investors only when preceded or accompanied by a prospectus for the GMO Trust, which contains a complete discussion of the risks associated with an investment in this Fund and other important information. The GMO Trust prospectus can be obtained at www.gmo.com.
GMO Inflation Indexed Plus Bond Fund
(A Series of GMO Trust)
Portfolio Management
Day-to-day management of the Fund's portfolio is the responsibility of the Fixed Income Division at Grantham, Mayo, Van Otterloo & Co. LLC.
Management Discussion and Analysis of Fund Performance
The GMO Inflation Indexed Plus Bond Fund returned -26.9% for the for the fiscal year ended February 28, 2009, as compared to the -7.5% return for the Barclays Capital U.S. Treasury Inflation Notes Index (formerly Lehman Brothers U.S. Treasury Inflation Notes Index). The Fund's exposure to various issues is achieved directly, through investments in inflation indexed bonds and other securities, and indirectly through its investment in certain underlying GMO mutual funds, primarily in the GMO Emerging Country Debt Fund (ECDF), the GMO World Opportunity Overlay Fund (WOOF), and the GMO Short-Duration Collateral Fund (SDCF).
The Fund underperformed the benchmark during the fiscal year by 19.4%. Exposures to SDCF and WOOF were by far the largest negative contributors during the fiscal year, followed by negative contributions from developed interest-rate strategies, currency selection, and exposure to emerging country debt via ECDF.
About 75% of the fiscal year's underperformance was due to price declines in the two funds in which the Fund invests a substantial portion of its total assets: SDCF and WOOF. These funds invest primarily in asset-backed securities. The positions in SDCF and WOOF collateralize derivatives positions that seek to deliver the return of the benchmark as well as create active exposures in global interest-rate and currency markets.
As the fiscal year was marked by sharply deteriorating liquidity conditions in securitized credit markets, spreads widened to all-time highs in the asset-backed securities held indirectly in the Inflation Indexed Plus Bond Fund via holdings of SDCF and WOOF. Such ABS exposure contributed (19.50%) to the Fund's performance. To increase flexibility, the Fund began holding more U.S. government securities and money market funds. In addition to widening spreads, both SDCF and WOOF's portfolios suffered credit downgrades during the year. SDCF had 123 downgraded securities, and WOOF had 82, representing 27.4% and 25.5% of their respective market values from the beginning of the year. At fiscal year end, 73% of SDCF's portfolio was rated AAA, 8% was rated AA, 2% was rated A, 12% was rated BBB and 5% was rated below BBB. At fiscal year end, 74% of WOOF's portfolio was rated AAA, 6% was rated AA, 2% was rated A, 12% was rated BBB and 6% w as rated below BBB.
Further underperformance was attributable to interest-rate and currency strategies. Given the adverse market conditions for interest rates and currencies, characterized by poor liquidity and choppy, gapping prices, the Fund temporarily suspended model-based positions in interest rates and currencies starting in October.
In interest-rate strategies, underperformance of U.S. Treasury principal strips versus LIBOR and other opportunistic trades contributed to developed interest-rate strategy losses. Before model-based interest-rate positions were suspended, Euro-area, U.S., Swedish, and Swiss market positions had contributed positively. Further, the slope and volatility strategies also added value during this time.
GMO Inflation Indexed Plus Bond Fund
(A Series of GMO Trust)
Management Discussion and Analysis of Fund Performance — (Continued)
Currency contribution was concentrated before positions were suspended in October. Negative relative currency performance during this time came mainly from the Fund's Swedish krona, Norwegian krone, yen, and New Zealand dollar positions.
A small exposure to emerging country debt also detracted value as spread widening on the asset class contributed negatively, as did negative contributions from both security and country selection.
The views expressed herein are exclusively those of Grantham, Mayo, Van Otterloo & Co. LLC Management as of the date of this report and are subject to change. GMO disclaims any responsibility to update such views. They are not meant as investment advice. References to specific securities are not recommendations of such securities and may not be representative of any GMO portfolio's current or future investments.

Performance data quoted represents past performance and is not indicative of future results. The investment return and principal value of an investment will fluctuate so that an investor's shares, when redeemed, may be worth more or less than their original cost. Current performance data may be lower or higher than the performance data provided herein. To obtain performance information to the most recent month-end, visit www.gmo.com. Performance shown is net of all fees after reimbursement from the Manager. Each performance figure assumes a redemption at the end of the stated period and reflects a transaction fee of 2.00% on the redemption. Transaction fees are retained by the Fund to cover trading costs. Returns would have been lower had certain expenses not been reimbursed during the periods shown and do not include the effect of taxes on distributions and redem ptions. All information is unaudited. Performance for Class VI shares will vary due to different fees.
* Class III performance information represents Class VI performance from May 31, 2006 to June 29, 2006 and Class III performance thereafter.
This page has been left blank intentionally.
GMO Inflation Indexed Plus Bond Fund
(A Series of GMO Trust)
Investments Concentration Summary
February 28, 2009 (Unaudited)
| Asset Class Summary* | % of Total Net Assets | ||||||
| Debt Obligations | 95.1 | % | |||||
| Short-Term Investments | 5.6 | ||||||
| Options Purchased | 2.1 | ||||||
| Loan Participations | 0.2 | ||||||
| Forward Currency Contracts | 0.1 | ||||||
| Loan Assignments | 0.1 | ||||||
| Rights and Warrants | 0.0 | ||||||
| Promissory Notes | 0.0 | ||||||
| Futures | (0.0 | ) | |||||
| Reverse Repurchase Agreements | (0.0 | ) | |||||
| Written Options | (0.8 | ) | |||||
| Swaps | (3.5 | ) | |||||
| Other | 1.1 | ||||||
| 100.0 | % | ||||||
| Country / Region Summary** | % of Investments | ||||||
| Emerging*** | 116.3 | % | |||||
| United Kingdom | 72.3 | ||||||
| Australia | (17.9 | ) | |||||
| Euro Region**** | (28.9 | ) | |||||
| United States | (41.8 | ) | |||||
| 100.0 | % | ||||||
* The table above incorporates aggregate indirect asset class exposure associated with investments in other funds of GMO Trust ("underlying funds").
** The table above incorporates aggregate indirect country exposure associated with investments in the underlying funds. The table excludes short-term investments. The table includes exposure through the use of derivative contracts.
*** The "Emerging" exposure is associated with investments in the GMO Emerging Country Debt Fund, which is exposed to emerging countries primarily comprised of Philippines, Russia, Venezuela, Brazil, Argentina, Colombia, Uruguay, Mexico, Ivory Coast, and Vietnam. Additional information about the fund's emerging country exposure is available in the financial statements of the GMO Emerging Country Debt Fund.
**** The "Euro Region" is comprised of Austria, Belgium, Finland, France, Germany, Greece, Ireland, Italy, Netherlands, Portugal and Spain.
1
GMO Inflation Indexed Plus Bond Fund
(A Series of GMO Trust)
Schedule of Investments
(showing percentage of total net assets)
February 28, 2009
| Par Value ($) / Shares | Description | Value ($) | |||||||||||||
| DEBT OBLIGATIONS — 10.8% | |||||||||||||||
| U.S. Government — 10.8% | |||||||||||||||
| 12,792,900 | U.S. Treasury Inflation Indexed Bond, 3.88%, due 04/15/29 (a) (b) | 15,103,618 | |||||||||||||
| 10,540,635 | U.S. Treasury Inflation Indexed Bond, 1.75%, due 01/15/28 (a) | 9,216,468 | |||||||||||||
| 4,225,878 | U.S. Treasury Inflation Indexed Bond, 3.63%, due 04/15/28 (a) | 4,810,899 | |||||||||||||
| 11,157,000 | U.S. Treasury Inflation Indexed Bond, 2.38%, due 01/15/25 (a) | 10,710,720 | |||||||||||||
| Total U.S. Government | 39,841,705 | ||||||||||||||
| TOTAL DEBT OBLIGATIONS (COST $42,560,430) | 39,841,705 | ||||||||||||||
| MUTUAL FUNDS — 89.3% | |||||||||||||||
| Affiliated Issuers — 89.3% | |||||||||||||||
| 2,030,584 | GMO Emerging Country Debt Fund, Class III | 11,878,915 | |||||||||||||
| 13,970,321 | GMO Short-Duration Collateral Fund | 238,892,494 | |||||||||||||
| 28,918 | GMO Special Purpose Holding Fund (c) (d) | 21,110 | |||||||||||||
| 4,225,208 | GMO World Opportunity Overlay Fund | 77,532,563 | |||||||||||||
| TOTAL MUTUAL FUNDS (COST $409,215,050) | 328,325,082 | ||||||||||||||
| SHORT-TERM INVESTMENTS — 2.2% | |||||||||||||||
| Money Market Funds — 2.2% | |||||||||||||||
| 8,027,764 | State Street Institutional Treasury Plus Money Market Fund-Institutional Class | 8,027,764 | |||||||||||||
| TOTAL SHORT-TERM INVESTMENTS (COST $8,027,764) | 8,027,764 | ||||||||||||||
| TOTAL INVESTMENTS — 102.3% (Cost $459,803,244) | 376,194,551 | ||||||||||||||
| Other Assets and Liabilities (net) — (2.3%) | (8,425,172 | ) | |||||||||||||
| TOTAL NET ASSETS — 100.0% | $ | 367,769,379 | |||||||||||||
See accompanying notes to the financial statements.
2
GMO Inflation Indexed Plus Bond Fund
(A Series of GMO Trust)
Schedule of Investments — (Continued)
February 28, 2009
A summary of outstanding financial instruments at February 28, 2009 is as follows:
Swaps
Total Return Swaps
| Notional Amount | Expiration Date | Counterparty | Pay | Receive | Market Value | ||||||||||||||||||||||
| 275,000,000 | USD | 4/14/2009 | Barclays Bank PLC | 1.03 | % to maturity | Barclays TIPS | |||||||||||||||||||||
| Index Total Return (a) | $ | (8,510,192 | ) | ||||||||||||||||||||||||
| $ | (8,510,192 | ) | |||||||||||||||||||||||||
| Premiums to (Pay) Receive | $ | — | |||||||||||||||||||||||||
As of February 28, 2009, for the swap contracts held, the Fund had sufficient cash and/or securities to cover any commitments or margin requirements of the relevant broker or exchange.
Notes to Schedule of Investments:
TIPS - Treasury Inflation Protected Securities
(a) Indexed security in which price and/or coupon is linked to the prices of a specific instrument or financial statistic (Note 2).
(b) All or a portion of this security has been segregated to cover collateral requirements on open swap contracts (Note 2).
(c) Underlying investment represents interests in defaulted securities.
(d) Security valued at fair value using methods determined in good faith by or at the direction of the Trustees of GMO Trust (Note 2).
Currency Abbreviations:
USD - United States Dollar
See accompanying notes to the financial statements.
3
GMO Inflation Indexed Plus Bond Fund
(A Series of GMO Trust)
Statement of Assets and Liabilities — February 28, 2009
| Assets: | |||||||
| Investments in unaffiliated issuers, at value (cost $50,588,194) (Note 2) | $ | 47,869,469 | |||||
| Investments in affiliated issuers, at value (cost $409,215,050) (Notes 2 and 8) | 328,325,082 | ||||||
| Dividends and interest receivable | 300,924 | ||||||
| Receivable for variation margin on closed futures contracts (Note 2) | 73 | ||||||
| Receivable for expenses reimbursed by Manager (Note 3) | 24,866 | ||||||
| Total assets | 376,520,414 | ||||||
| Liabilities: | |||||||
| Payable to affiliate for (Note 3): | |||||||
| Management fee | 71,963 | ||||||
| Shareholder service fee | 20,794 | ||||||
| Trustees and Chief Compliance Officer of GMO Trust fees | 1,112 | ||||||
| Payable for open swap contracts (Note 2) | 8,510,192 | ||||||
| Accrued expenses | 146,974 | ||||||
| Total liabilities | 8,751,035 | ||||||
| Net assets | $ | 367,769,379 | |||||
| Net assets consist of: | |||||||
| Paid-in capital | $ | 535,955,366 | |||||
| Distributions in excess of net investment income | (15,321,702 | ) | |||||
| Accumulated net realized loss | (60,745,400 | ) | |||||
| Net unrealized depreciation | (92,118,885 | ) | |||||
| $ | 367,769,379 | ||||||
| Net assets attributable to: | |||||||
| Class III shares | $ | 114,858,650 | |||||
| Class VI shares | $ | 252,910,729 | |||||
| Shares outstanding: | |||||||
| Class III | 7,718,280 | ||||||
| Class VI | 17,005,845 | ||||||
| Net asset value per share: | |||||||
| Class III | $ | 14.88 | |||||
| Class VI | $ | 14.87 | |||||
See accompanying notes to the financial statements.
4
GMO Inflation Indexed Plus Bond Fund
(A Series of GMO Trust)
Statement of Operations — Year Ended February 28, 2009
| Investment Income: | |||||||
| Dividends from affiliated issuers (Note 8) | $ | 15,387,079 | |||||
| Interest | 1,339,421 | ||||||
| Dividends | 82,698 | ||||||
| Total investment income | 16,809,198 | ||||||
| Expenses: | |||||||
| Management fee (Note 3) | 594,279 | ||||||
| Shareholder service fee – Class III (Note 3) | 98,068 | ||||||
| Shareholder service fee – Class VI (Note 3) | 94,783 | ||||||
| Custodian, fund accounting agent and transfer agent fees | 91,125 | ||||||
| Audit and tax fees | 61,348 | ||||||
| Legal fees | 29,817 | ||||||
| Trustees fees and related expenses (Note 3) | 11,677 | ||||||
| Registration fees | 1,748 | ||||||
| Miscellaneous | 8,274 | ||||||
| Total expenses | 991,119 | ||||||
| Fees and expenses reimbursed by Manager (Note 3) | (177,588 | ) | |||||
| Expense reductions (Note 2) | (3,411 | ) | |||||
| Indirectly incurred fees waived or borne by Manager (Note 3) | (31,724 | ) | |||||
| Shareholder service fee waived (Note 3) | (11,249 | ) | |||||
| Net expenses | 767,147 | ||||||
| Net investment income (loss) | 16,042,051 | ||||||
| Realized and unrealized gain (loss): | |||||||
| Net realized gain (loss) on: | |||||||
| Investments in unaffiliated issuers | (2,914,658 | ) | |||||
| Investments in affiliated issuers | (13,428,367 | ) | |||||
| Realized gains distributions from affiliated issuers (Note 8) | 163,196 | ||||||
| Closed futures contracts | (733,923 | ) | |||||
| Closed swap contracts | 6,029 | ||||||
| Written options | (363,512 | ) | |||||
| Foreign currency, forward contracts and foreign currency related transactions | (4,790,311 | ) | |||||
| Net realized gain (loss) | (22,061,546 | ) | |||||
| Change in net unrealized appreciation (depreciation) on: | |||||||
| Investments in unaffiliated issuers | (4,268,812 | ) | |||||
| Investments in affiliated issuers | (79,199,513 | ) | |||||
| Open futures contracts | 443,407 | ||||||
| Open swap contracts | (12,931,795 | ) | |||||
| Foreign currency, forward contracts and foreign currency related transactions | 1,656,428 | ||||||
| Net unrealized gain (loss) | (94,300,285 | ) | |||||
| Net realized and unrealized gain (loss) | (116,361,831 | ) | |||||
| Net increase (decrease) in net assets resulting from operations | $ | (100,319,780 | ) | ||||
See accompanying notes to the financial statements.
5
GMO Inflation Indexed Plus Bond Fund
(A Series of GMO Trust)
Statement of Changes in Net Assets
| Year Ended February 28, 2009 | Year Ended February 29, 2008 | ||||||||||
| Increase (decrease) in net assets: | |||||||||||
| Operations: | |||||||||||
| Net investment income (loss) | $ | 16,042,051 | $ | 150,978,933 | |||||||
| Net realized gain (loss) | (22,061,546 | ) | (10,341,661 | ) | |||||||
| Change in net unrealized appreciation (depreciation) | (94,300,285 | ) | (30,465,632 | ) | |||||||
| Net increase (decrease) in net assets from operations | (100,319,780 | ) | 110,171,640 | ||||||||
| Distributions to shareholders from: | |||||||||||
| Net investment income | |||||||||||
| Class III | (11,449,888 | ) | (26,975,972 | ) | |||||||
| Class IV | — | (14,948,171 | ) | ||||||||
| Class VI | (37,250,183 | ) | (347,623,757 | ) | |||||||
| Total distributions from net investment income | (48,700,071 | ) | (389,547,900 | ) | |||||||
| Class III | — | (643,125 | ) | ||||||||
| Class IV | — | (654,425 | ) | ||||||||
| Class VI | — | (7,445,282 | ) | ||||||||
| Total distributions from net realized gains | — | (8,742,832 | ) | ||||||||
| (48,700,071 | ) | (398,290,732 | ) | ||||||||
| Net share transactions (Note 7): | |||||||||||
| Class III | 9,787,174 | (103,779,537 | ) | ||||||||
| Class IV | — | (83,542,832 | ) | ||||||||
| Class VI | 279,038,782 | (1,526,536,264 | ) | ||||||||
| Increase (decrease) in net assets resulting from net share transactions | 288,825,956 | (1,713,858,633 | ) | ||||||||
| Redemption fees (Notes 2 and 7): | |||||||||||
| Class III | 20,582 | — | |||||||||
| Class VI | 90,895 | — | |||||||||
| Increase in net assets resulting from redemption fees | 111,477 | — | |||||||||
| Total increase (decrease) in net assets resulting from net share transactions and redemption fees | 288,937,433 | (1,713,858,633 | ) | ||||||||
| Total increase (decrease) in net assets | 139,917,582 | (2,001,977,725 | ) | ||||||||
| Net assets: | |||||||||||
| Beginning of period | 227,851,797 | 2,229,829,522 | |||||||||
| End of period (including distributions in excess of net investment income of $15,321,702 and $126,305,693, respectively) | $ | 367,769,379 | $ | 227,851,797 | |||||||
See accompanying notes to the financial statements.
6
GMO Inflation Indexed Plus Bond Fund
(A Series of GMO Trust)
Financial Highlights
(For a Class III share outstanding throughout each period)
| Year Ended February 28/29, | |||||||||||||||
| 2009 | 2008 | 2007(a) | |||||||||||||
| Net asset value, beginning of period | $ | 23.52 | $ | 25.47 | $ | 24.96 | |||||||||
| Income (loss) from investment operations: | |||||||||||||||
| Net investment income (loss)(b)† | 0.82 | 1.13 | 0.75 | ||||||||||||
| Net realized and unrealized gain (loss) | (6.90 | ) | (0.21 | ) | 0.68 | ||||||||||
| Total from investment operations | (6.08 | ) | 0.92 | 1.43 | |||||||||||
| Less distributions to shareholders: | |||||||||||||||
| From net investment income | (2.56 | ) | (2.81 | ) | (0.87 | ) | |||||||||
| From net realized gains | — | (0.06 | ) | (0.05 | ) | ||||||||||
| Total distributions | (2.56 | ) | (2.87 | ) | (0.92 | ) | |||||||||
| Net asset value, end of period | $ | 14.88 | $ | 23.52 | $ | 25.47 | |||||||||
| Total Return(c) | (26.89 | )% | 3.95 | % | 5.79 | %** | |||||||||
| Ratios/Supplemental Data: | |||||||||||||||
| Net assets, end of period (000's) | $ | 114,859 | $ | 137,492 | $ | 260,205 | |||||||||
| Net operating expenses to average daily net assets(d) | 0.39 | %(e) | 0.37 | %(e) | 0.39 | %* | |||||||||
| Interest expense to average daily net assets | — | 0.07 | % | — | |||||||||||
| Total net expenses to average daily net assets | 0.39 | %(e) | 0.44 | %(e) | 0.39 | %* | |||||||||
| Net investment income to average daily net assets(b) | 4.17 | % | 4.51 | % | 4.37 | %* | |||||||||
| Portfolio turnover rate | 56 | % | 131 | % | 37 | %†† | |||||||||
| Fees and expenses reimbursed and/or waived by the Manager to average daily net assets: | 0.11 | % | 0.06 | % | 0.06 | %* | |||||||||
| Redemption fees consisted of the following per share amounts:† | $ | 0.01 | — | — | |||||||||||
(a) Period from June 29, 2006 (commencement of operations) through February 28, 2007.
(b) Net investment income is affected by the timing of the declaration of dividends by the underlying funds in which the Fund invests.
(c) The total returns would have been lower had certain expenses not been reimbursed and/or waived during the periods shown and assumes the effect of reinvested distributions. Calculation excludes redemption fees which are borne by the shareholder.
(d) Net expenses exclude expenses incurred indirectly through investment in the underlying funds (See Note 3).
(e) The net expense ratio does not include the effect of expense reductions.
† Calculated using average shares outstanding throughout the period.
†† Calculation represents portfolio turnover of the Fund for the period from May 31, 2006 (commencement of operations) through February 28, 2007.
* Annualized.
** Not annualized.
See accompanying notes to the financial statements.
7
GMO Inflation Indexed Plus Bond Fund
(A Series of GMO Trust)
Financial Highlights
(For a Class VI share outstanding throughout each period)
| Year Ended February 28/29, | |||||||||||||||
| 2009 | 2008 | 2007(a) | |||||||||||||
| Net asset value, beginning of period | $ | 23.51 | $ | 25.48 | $ | 25.00 | |||||||||
| Income (loss) from investment operations: | |||||||||||||||
| Net investment income (loss)(b)† | 1.37 | 1.38 | 0.83 | ||||||||||||
| Net realized and unrealized gain (loss) | (7.43 | ) | (0.45 | ) | 0.60 | ||||||||||
| Total from investment operations | (6.06 | ) | 0.93 | 1.43 | |||||||||||
| Less distributions to shareholders: | |||||||||||||||
| From net investment income | (2.58 | ) | (2.84 | ) | (0.90 | ) | |||||||||
| From net realized gains | — | (0.06 | ) | (0.05 | ) | ||||||||||
| Total distributions | (2.58 | ) | (2.90 | ) | (0.95 | ) | |||||||||
| Net asset value, end of period | $ | 14.87 | $ | 23.51 | $ | 25.48 | |||||||||
| Total Return(c) | (26.82 | )% | 4.00 | % | 5.75 | %** | |||||||||
| Ratios/Supplemental Data: | |||||||||||||||
| Net assets, end of period (000's) | $ | 252,911 | $ | 90,360 | $ | 1,874,841 | |||||||||
| Net operating expenses to average daily net assets(d) | 0.30 | %(e) | 0.29 | %(e) | 0.29 | %* | |||||||||
| Interest expense to average daily net assets | — | 0.07 | % | — | |||||||||||
| Total net expenses to average daily net assets | 0.30 | %(e) | 0.36 | %(e) | 0.29 | %* | |||||||||
| Net investment income to average daily net assets(b) | 7.73 | % | 5.48 | % | 4.33 | %* | |||||||||
| Portfolio turnover rate | 56 | % | 131 | % | 37 | %** | |||||||||
| Fees and expenses reimbursed and/or waived by the Manager to average daily net assets: | 0.09 | % | 0.06 | % | 0.06 | %* | |||||||||
| Redemption fees consisted of the following per share amounts:† | $ | 0.01 | — | — | |||||||||||
(a) Period from May 31, 2006 (commencement of operations) through February 28, 2007.
(b) Net investment income is affected by the timing of the declaration of dividends by the underlying funds in which the Fund invests.
(c) The total returns would have been lower had certain expenses not been reimbursed and/or waived during the periods shown and assumes the effect of reinvested distributions. Calculation excludes redemption fees which are borne by the shareholder.
(d) Net expenses exclude expenses incurred indirectly through investment in the underlying funds (See Note 3).
(e) The net expense ratio does not include the effect of expense reductions.
† Calculated using average shares outstanding throughout the period.
* Annualized.
** Not annualized.
See accompanying notes to the financial statements.
8
GMO Inflation Indexed Plus Bond Fund
(A Series of GMO Trust)
Notes to Financial Statements
February 28, 2009
1. Organization
GMO Inflation Indexed Plus Bond Fund (the "Fund") is a series of GMO Trust (the "Trust"). The Fund is registered under the Investment Company Act of 1940, as amended, as an open-end, non-diversified management investment company. The Fund is advised and managed by Grantham, Mayo, Van Otterloo & Co. LLC (the "Manager" or "GMO"). The Trust was established as a Massachusetts business trust under the laws of The Commonwealth of Massachusetts on June 24, 1985. The Declaration of Trust permits the Trustees of the Trust ("Trustees") to create an unlimited number of series of shares ("Funds") and to subdivide Funds into classes.
The Fund seeks total return in excess of that of the Barclay's Capital U.S. Treasury Inflation Notes Index. The Fund primarily makes investments that are indexed or otherwise "linked" to general measures of inflation in the country of issue. The Fund seeks additional returns by seeking to exploit differences in global interest rates and currency and emerging country debt markets. The Fund may invest a substantial portion of its assets in shares of GMO Short-Duration Collateral Fund; in inflation indexed bonds issued by the U.S. and foreign governments and their agencies or instrumentalities (including securities neither guaranteed nor insured by the U.S. government), including Inflation-Protected Securities issued by the U.S. Treasury (TIPS), and inflation indexed bonds issued by corporations; in shares of GMO World Opportunity Overlay Fund; in futures contracts, swap contracts, currency forwards, currency options and other type s of derivatives; up to 5% of the Fund's total assets in sovereign debt of emerging countries (including below investment grade securities (also known as "junk bonds")), primarily through investment in shares of GMO Emerging Country Debt Fund; and in non-inflation indexed (or nominal) fixed income securities issued by the U.S. and foreign governments and their agencies or instrumentalities (including securities neither guaranteed nor insured by the U.S. Government) and by corporations (to gain direct exposure to such securities and/or for use as part of a synthetic position).
Throughout the year ended February 28, 2009, the Fund had two classes of shares outstanding: Class III and Class VI. Each class of shares bears a different level of shareholder service fees.
The financial statements of the series of the Trust in which the Fund invests ("underlying funds") should be read in conjunction with the Fund's financial statements. These financial statements are available, without charge, upon request, by calling (617) 346-7646 (collect). Shares of GMO Short-Duration Collateral Fund, GMO Special Purpose Holding Fund and GMO World Opportunity Overlay Fund are not publicly available.
The Fund directly and indirectly (through underlying funds) invests in securities with contractual cash flows, such as collateralized mortgage obligations and commercial mortgage-backed securities, including securities backed by sub-prime mortgage loans, credit card receivables and auto loan receivables. The value, liquidity and related income of these securities are sensitive to changes in economic conditions, including real estate values, delinquencies and/or defaults, and may be adversely affected by changes in interest rates and shifts in the market's perception of the securities' market values.
9
GMO Inflation Indexed Plus Bond Fund
(A Series of GMO Trust)
Notes to Financial Statements — (Continued)
February 28, 2009
The Fund will, if deemed prudent by the Manager, take temporary defensive measures (until the Manager has determined that normal conditions have returned or that it is otherwise prudent to resume investing in accordance with the Fund's normal investment strategies) and may not achieve its investment objectives during those periods. Recent changes in the credit markets have reduced the liquidity of all types of fixed income securities, including asset-backed securities.
2. Significant accounting policies
The following is a summary of significant accounting policies followed by the Fund in the preparation of its financial statements. These policies are in conformity with accounting principles generally accepted in the United States of America ("U.S. GAAP") and have been consistently followed by the Fund in preparing its financial statements. The preparation of financial statements in accordance with U.S. GAAP requires management to make estimates and assumptions that affect the reported amounts and disclosures in the financial statements. Actual results could differ from those estimates. The accounting records of the Fund are maintained in U.S. dollars.
Portfolio valuation
Securities listed on a securities exchange for which market quotations are readily available are valued at the last sale price or official closing price on each business day, or if there is no such reported sale or official closing price, at the most recent quoted bid price. Unlisted securities for which market quotations are readily available are generally valued at the most recent quoted bid price. Debt instruments with a remaining maturity of sixty days or less are generally valued at amortized cost, which approximates fair value. Shares of investment funds are generally valued at their net asset value. Securities for which quotations are not readily available or whose values the Manager has determined to be unreliable are valued at fair value as determined in good faith by the Trustees or persons acting at their direction pursuant to procedures approved by the Trustees. By its nature, a fair value price is a good faith estim ate of the value of a security at a given point in time and may not reflect the value that would be realized if the security were sold. The difference between a fair value price and the value realized upon a sale could be material.
Typically the Fund and the underlying funds value debt instruments based on prices supplied by a primary pricing source chosen by the Manager. The Manager evaluates primary pricing sources on an ongoing basis and may change a pricing source should the Manager deem it appropriate. If it deems appropriate, the Manager, at its discretion, may override a price supplied by a primary source by using a price provided by another source. The prices provided by primary pricing sources may differ from the value that would be realized if the securities were sold, and the differences could be material.
Certain securities held by the Fund and underlying funds are valued on the basis of prices provided by a single source. As of February 28, 2009, the total value of these securities represented 32.99% of the net assets. The single source prices provided may differ from the value that would be realized if the securities were sold, and the differences could be material. In addition, although alternative prices are available for
10
GMO Inflation Indexed Plus Bond Fund
(A Series of GMO Trust)
Notes to Financial Statements — (Continued)
February 28, 2009
other securities held by the Fund, those alternative sources would not necessarily confirm the security price used by the Fund. Therefore, the existence of those alternative sources does not necessarily provide greater certainty about the prices used by the Fund.
GMO Special Purpose Holding Fund ("SPHF"), an investment of the Fund, has litigation pending against various entities related to the default of certain asset-backed securities previously held by SPHF. The outcome of the lawsuits against the remaining defendants is not known and any potential recoveries are not reflected in the net asset value of SPHF. For the year ended February 28, 2009, the Fund received $65,489 through SPHF in connection with settlement agreements related to that litigation.
In September 2006, the Financial Accounting Standards Board ("FASB") issued Statement of Financial Accounting Standards No. 157, Fair Value Measurements ("SFAS 157"). SFAS 157 is effective for the Fund's current fiscal year. While the adoption of SFAS 157 does not have an effect on the Fund's net asset value, it does require additional disclosures about fair value measurements. SFAS 157 establishes a three-level hierarchy for disclosure of fair value measurements. The valuation hierarchy is based upon the reliability of inputs to the valuation of the Fund's investments. The three levels are defined as follows:
Level 1 – Valuations based on quoted prices for identical securities in active markets.
Level 2 – Valuations determined using other significant direct or indirect observable inputs.
Level 3 – Valuations based on inputs that are unobservable and significant. The Fund utilized the following fair value techniques on Level 3 investments: The Fund considered interest in certain bankrupt securities to be worthless.
The inputs or methodology used for valuing securities are not necessarily an indication of the risk associated with investing in those securities.
The following is a summary of the fair valuations according to inputs used as of February 28, 2009 in valuing the Fund's investments:
| Asset Valuation Inputs | Investments in Securities | Other Financial Instruments | |||||||||
| Level 1 - Quoted Prices | $ | 11,878,915 | $ | — | |||||||
| Level 2 - Other Significant Observable Inputs | 364,294,526 | — | |||||||||
| Level 3 - Significant Unobservable Inputs | 21,110 | — | |||||||||
| Total | $ | 376,194,551 | $ | — | |||||||
11
GMO Inflation Indexed Plus Bond Fund
(A Series of GMO Trust)
Notes to Financial Statements — (Continued)
February 28, 2009
| Liability Valuation Inputs | Investments in Securities | Other Financial Instruments* | |||||||||
| Level 1 - Quoted Prices | $ | — | $ | — | |||||||
| Level 2 - Other Significant Observable Inputs | — | (8,510,192 | ) | ||||||||
| Level 3 - Significant Unobservable Inputs | — | — | |||||||||
| Total | $ | — | $ | (8,510,192 | ) | ||||||
* Other financial instruments include swap agreements.
For the underlying fund's summary of valuation inputs please refer to the respective fund's portfolio valuation note.
The following is a reconciliation of investments in which significant unobservable inputs (Level 3) were used in determining value:
| Investments in Securities | Other Financial Instruments | ||||||||||
| Balance as of February 29, 2008 | $ | 36,437 | $ | — | |||||||
| Accrued discounts/premiums | — | — | |||||||||
| Realized gain (loss) | — | — | |||||||||
| Realized gain distributions received | 50,020 | — | |||||||||
| Realized gain distributions paid | (65,489 | ) | — | ||||||||
| Change in unrealized appreciation/depreciation | 142 | — | |||||||||
| Net purchases (sales) | — | — | |||||||||
| Net transfers in and/or out of Level 3 | — | — | |||||||||
| Balance as of February 28, 2009 | $ | 21,110 | $ | — | |||||||
Foreign currency translation
The market values of foreign securities, currency holdings and related assets and liabilities are translated to U.S. dollars based on the 4 p.m. New York time exchange rates each business day. Income and expenses denominated in foreign currencies are translated at the 4 p.m. New York time exchange rates on the business day the income and expenses are accrued or incurred. The Fund does not isolate realized and unrealized gains and losses attributable to changes in exchange rates from gains and losses that arise from changes in the market value of investments. Such fluctuations are included with net realized and unrealized gain or loss on investments. Net realized gains and losses on foreign currency transactions represent gains and losses on disposition of currencies and forward currency contracts, currency gains and losses realized between the trade and settlement dates on securities transactions, and the difference between the amount of investment income and foreign withholding taxes recorded on the Fund's accounting records and the U.S. dollar equivalent amounts actually received or paid.
12
GMO Inflation Indexed Plus Bond Fund
(A Series of GMO Trust)
Notes to Financial Statements — (Continued)
February 28, 2009
Forward currency contracts
The Fund may enter into forward currency contracts including forward cross currency contracts. A forward currency contract is an agreement between two parties to buy and sell a currency at a set price on a future date. The market value of a forward currency contract fluctuates with changes in forward currency exchange rates. Forward currency contracts are marked to market daily using rates supplied by a quotation service and changes in value are recorded by the Fund as an unrealized gain or loss. Realized gains or losses equal to the difference between the value of the contract at the time it was opened and the value at the time it was closed are recorded upon delivery or receipt of the currency or, if a forward currency contract is offset by entering into another forward currency contract with the same broker, upon settlement of the net gain or loss. These contracts may involve market risk in excess of the unrealized gain or lo ss reflected in the Fund's Statement of Assets and Liabilities. They expose the Fund to the risk of unfavorable movements in currency values and the risk that the counterparty will be unable or unwilling to meet the terms of the contracts. The Fund had no forward currency contracts outstanding at the end of the period.
Futures contracts
The Fund may purchase and sell futures contracts. Upon entering into a futures contract, the Fund is required to deposit cash, U.S. government and agency obligations, or other liquid assets with the futures clearing broker in accordance with the initial margin requirements of the broker or exchange. In addition, the Fund maintains cash or securities in an amount that at least equals the net amount payable in the event the Fund must deliver the full amount of the contract. Futures contracts are marked to market daily and an appropriate payable or receivable for the change in value ("variation margin") is recorded by the Fund. The payable or receivable is settled on the following business day. Gains or losses are recognized but not considered realized until the contracts expire or are closed. Futures contracts involve, to varying degrees, risk of loss in excess of the variation margin disclosed in the Statement of Assets and Liabi lities. Under some circumstances, futures exchanges may establish daily limits on the amount that the price of a futures contract can vary from the previous day's settlement price, thereby effectively preventing liquidation of unfavorable positions. Losses may arise from changes in the value of the underlying instrument if the Fund is unable to liquidate a futures position due to an illiquid secondary market for the contract or the imposition of price limits, or if counterparties do not perform under the contract terms. Futures contracts are generally valued at the settlement price established each day by the board of trade or exchange on which they are traded. The Fund had no futures contracts outstanding at the end of the period.
Options
The Fund may write (i.e., sell) call and put options. Writing options alters the Fund's exposure to the underlying instrument by, in the case of a call option, obligating the Fund to sell the underlying instrument at a set price to the option-holder and, in the case of a put option, obligating the Fund to purchase the underlying instrument at a set price from the option-holder. In the case of an index option, settlement will be in cash. When the Fund writes a call or put option, an amount equal to the premium received is recorded as a liability and subsequently marked to market to reflect the current value of the option written. Premiums received from writing options that expire are treated as realized gains. Premiums received from
13
GMO Inflation Indexed Plus Bond Fund
(A Series of GMO Trust)
Notes to Financial Statements — (Continued)
February 28, 2009
writing options that are exercised or closed are deducted from the amounts paid on the underlying future, security or currency transaction to determine the realized gain or loss. The Fund as a writer of an option has no control over whether the underlying future, security or currency may be sold (call) or purchased (put) and as a result bears the market risk of an unfavorable change in the price of the future, security or currency underlying the option. In the event that the Fund writes uncovered put or call options (i.e. options for investments that the Fund does not own), it bears the risk of substantial losses if the price of the underlying instrument increases during the term of the option. Options expose the Fund to the risk the Fund may not be able to enter into a closing transaction because of an illiquid market.
For the year ended February 28, 2009, the Fund's investment activity in written options contracts was as follows:
| Puts | Calls | ||||||||||||||||||
| Principal Amount of Contracts | Premiums | Principal Amount of Contracts | Premiums | ||||||||||||||||
| Outstanding, beginning of year | $ | — | $ | — | $ | — | $ | — | |||||||||||
| Options written | — | — | JPY | (1,508,000,000 | ) | (141,116 | ) | ||||||||||||
| Options exercised | — | — | JPY | 1,508,000,000 | 141,116 | ||||||||||||||
| Options expired | — | — | — | — | |||||||||||||||
| Options sold | — | — | — | — | |||||||||||||||
| Outstanding, end of year | $ | — | $ | — | $ | — | $ | — | |||||||||||
The Fund may also purchase put and call options. Purchasing options alters the Fund's exposure to the underlying instrument by, in the case of a call option, entitling the Fund to purchase the underlying instrument at a set price from the writer of the option and, in the case of a put option, entitling the Fund to sell the underlying instrument at a set price to the writer of the option. The Fund pays a premium for a purchased option. That premium is disclosed in the Schedule of Investments and is subsequently marked to market to reflect the current value of the option. Premiums paid for purchasing options that expire are treated as realized losses. Premiums paid for purchasing options that are exercised or closed are deducted from the proceeds on the closing transaction to determine the realized gain or loss. The risk associated with purchasing put and call options is limited to the premium paid. The Fund had no purchased optio n contracts outstanding at the end of the period.
The Fund values exchange traded options at the last sale price, or if no sale is reported, the last bid price for options it has purchased and the last ask price for options it has written. The Fund values options traded over-the-counter using inputs provided by primary pricing sources and industry standard models.
14
GMO Inflation Indexed Plus Bond Fund
(A Series of GMO Trust)
Notes to Financial Statements — (Continued)
February 28, 2009
Loan agreements
The Fund may invest in loans to corporate, governmental, or other borrowers. The Fund's investments in loans may be in the form of participations in loans or assignments of all or a portion of loans from third parties. A loan is often administered by a bank or other financial institution (the "lender") that acts as agent for all holders. The agent administers the terms of the loan, as specified in the loan agreement. When investing in a loan participation, (i) the Fund has the right to receive payments of principal, interest and any fees to which it is entitled only from the lender selling the participation in the loan agreement and only upon receipt by the lender of payments from the borrower and (ii) the Fund generally has no right to enforce compliance by the borrower with the terms of the loan agreement. As a result, the Fund may be subject to the credit risk of both the borrower and the lender has sold the participation in the loan agreement. When the Fund purchases assignments from lenders, it acquires direct rights against the borrower on the loan. The Fund had no loan agreements outstanding at the end of the period.
Indexed securities
The Fund may invest in indexed securities. Indexed securities are securities whose redemption values and/or coupons are linked to the prices of a specific instrument or financial statistic. The Fund uses indexed securities to increase or decrease its exposure to different underlying instruments and to gain exposure to markets in which investing through conventional securities is difficult. Indexed securities held by the Fund at the end of the period are listed in the Fund's Schedule of Investments.
Swap agreements
The Fund may enter into various types of swap agreements, including without limitation, interest rate, total return, credit default and variance swap agreements. A swap agreement is an agreement to exchange the return generated by one instrument for the return generated by another instrument. When entering into a swap agreement, the Fund and/or the swap counterparty may post or receive cash or securities as collateral. The party posting the collateral typically receives the interest associated with or payments related to the collateral and has the risk of loss related to the collateral.
Interest rate swap agreements involve an exchange by the parties of their respective commitments to pay or right to receive interest, e.g., an exchange of floating rate interest payments for fixed rate interest payments with respect to the notional amount of principal.
Total return swap agreements involve a commitment by one party to pay interest to the other party in exchange for a payment to it from the other party based on the return of a reference instrument (e.g., a security or basket of securities), both based on notional amounts. To the extent the return of the reference instrument exceeds or falls short of the interest payments, one party will receive a payment from or make a payment to the other party.
In a credit default swap agreement, one party makes payments to another party in exchange for the right to receive a specified return if a credit event occurs with respect to a referenced entity or entities. Buying
15
GMO Inflation Indexed Plus Bond Fund
(A Series of GMO Trust)
Notes to Financial Statements — (Continued)
February 28, 2009
credit default protection reduces the buyer's exposure in the event of an issuer's default (e.g., it reduces risk where a party owns a security issued by or otherwise has exposure to the issuer). Selling credit default protection subjects the seller to exposure to an issuer's default. A seller of credit default protection receives payments in return for its obligation to pay the principal amount of a debt security (or other agreed-upon value) to the other party upon the occurrence of a credit event (e.g., issuer default or similar event). If no credit event occurs, the seller has no payment obligations. For credit default swap agreements on asset-backed securities, a credit event may be triggered by such events as the issuer's failure to pay interest or principal, an agreement of the holders of an asset-backed security to a maturity extension, a rating downgrade on the security or a write-down on the collateral underlying the se curity. For credit default swap agreements on corporate or sovereign issuers, a credit event may be triggered by such events as the issuer's bankruptcy, failure to pay interest or principal, repudiation/moratorium or restructuring.
Variance swap agreements involve an agreement by two parties to exchange cash flows based on the measured variance (or square of volatility) of a specified underlying asset. One party agrees to exchange a "fixed rate" or strike price payment for the "floating rate" or realized price variance on the underlying asset with respect to the notional amount. At inception, the strike price chosen is generally fixed at a level such that the fair value of the swap is zero. At the expiration date, the amount paid by one party to the other is the difference between the realized price variance of the underlying asset and the strike price multiplied by the notional amount. A receiver of the realized price variance would receive a payment when the realized price variance of the underlying asset is greater than the strike price and would make a payment when that variance is less than the strike price. A payer of the realized price variance woul d make a payment when the realized price variance of the underlying asset is greater than the strike price and would receive a payment when that variance is less than the strike price. This type of agreement is essentially a forward contract on the future realized price variance of the underlying asset.
The Fund prices its swap agreements daily using models that may incorporate quotations from market makers and records the change in value, if any, as unrealized gain or loss in the Statement of Operations. Payments received or made on swap agreements are recorded as realized gain or loss in the Statement of Operations. Gains or losses are realized upon termination of the swap agreements.
Swap agreements often are not actively traded on financial markets. The values assigned to them may differ significantly from the values that would be realized upon termination, and the differences could be material. Entering into swap agreements involves credit, legal, market and documentation risk that is not reflected in the amounts reported in the Statement of Assets and Liabilities. Such risks include the possibility that the party with whom the Fund contracts may default on its obligations to perform or disagree as to the meaning of contractual terms, or that the collateral that party posts may be insufficient or not timely received by the Fund. Credit risk may be particularly acute in an environment where financial services firms are exposed to systemic risks of the type evidenced by the insolvency of Lehman Brothers and subsequent market disruptions. Swap agreements outstanding at the end of the period are listed in the Fund's Schedule of Investments.
16
GMO Inflation Indexed Plus Bond Fund
(A Series of GMO Trust)
Notes to Financial Statements — (Continued)
February 28, 2009
Repurchase agreements
The Fund may enter into repurchase agreements. Under a repurchase agreement the Fund acquires a security for cash and obtains a simultaneous commitment from the seller to repurchase the security at an agreed upon price and date. The Fund, through its custodian, takes possession of securities collateralizing the repurchase agreement. The collateral is marked to market daily to ensure that the market value of the underlying assets is at least equal to the amount owed to the Fund in the event of default by the seller. If the seller of a repurchase agreement defaults or enters into insolvency proceedings and the value of the collateral declines, the Fund's recovery of cash may be delayed or limited. The Fund had no repurchase agreements outstanding at the end of the period.
Reverse repurchase agreements
The Fund may enter into reverse repurchase agreements. Under a reverse repurchase agreement the Fund sells portfolio assets subject to an agreement by the Fund to repurchase the same assets at a later date at a fixed price. In connection with these agreements, the Fund establishes segregated accounts with its custodian in which the Fund maintains cash, U.S. government securities or other assets equal in value to its obligations under the reverse repurchase agreement into which it has entered. Reverse repurchase agreements expose the Fund to the risk that the market value of the securities the Fund has sold under the agreement may decline below the price at which the Fund is obligated to repurchase them under the agreement. If the buyer in a reverse repurchase agreement files for bankruptcy or becomes insolvent, the Fund's use of proceeds from the sale of its securities may be restricted while the other party or its trustee or re ceiver determines whether to honor the Fund's right to repurchase the securities. Furthermore, in that situation the Fund may be unable to recover the securities it sold and as a result would realize a loss equal to the difference between the value of the securities and the payment it received for them. This loss would be greater to the extent the buyer paid less than the value of the securities the Fund sold to it (e.g., a buyer may pay $95 for a bond with a market value of $100). The market value of the securities the Fund has sold is determined daily and any additional required collateral is allocated to or sent by the Fund on the next business day. The Fund had no reverse repurchase agreements outstanding at the end of the period.
Securities lending
The Fund may lend its securities to qualified brokers. The loans are collateralized with cash or liquid securities with a market value at least equal to the market value of the securities upon entering into the loan. As with other extensions of credit, the Fund may bear the risk of loss with respect to the investment of the collateral, the risk of delay in and/or inability to exercise its rights with respect to the collateral, and the risk of delay in recovery or loss of rights in the loaned securities should the borrower of the securities fail financially. If a loan is collateralized by U.S. government securities, the Fund receives a fee from the borrower. If a loan is collateralized by cash, the Fund typically invests the cash collateral for its own account. For the year from March 1, 2008 through February 28, 2009, the Fund did not participate in securities lending.
17
GMO Inflation Indexed Plus Bond Fund
(A Series of GMO Trust)
Notes to Financial Statements — (Continued)
February 28, 2009
Taxes and distributions
The Fund intends to qualify each tax year as a regulated investment company under Subchapter M of the Internal Revenue Code of 1986, as amended (the "Code"). The Fund has adopted a tax year-end of December 31. Unless otherwise indicated, all applicable tax disclosures reflect tax adjusted balances as of December 31, 2008. The Fund intends to distribute substantially all of its net investment income and all of its net realized short-term and long-term capital gain, if any, after giving effect to any available capital loss carryforwards for U.S. federal income tax purposes. Therefore, no provision for U.S. federal income or excise tax is necessary.
The Fund's policy is to declare and pay distributions from net investment income, if any, semiannually, and from net realized short-term and long-term capital gain, if any, at least annually. All distributions are paid in shares of the Fund, at net asset value, unless the shareholder elects to receive cash distributions. Distributions to shareholders are recorded by the Fund on the ex-dividend date.
Income and capital gain distributions are determined in accordance with U.S. federal income tax regulations, which may differ from U.S. GAAP. Certain capital accounts in the financial statements are periodically adjusted for permanent differences in order to reflect their tax character. These adjustments have no impact on net assets or net asset value per share. Temporary differences that arise from recognizing certain items of income, expense, gain or loss in different periods for financial statement and tax purposes will reverse at some time in the future. Distributions in excess of net investment income or net realized gains are temporary over-distributions for financial statement purposes resulting from differences in the recognition or classification of income or distributions for financial statement and tax purposes.
U.S. GAAP and tax accounting differences primarily relate to capital loss carryforwards, derivative contract transactions, foreign currency transactions, partnership interest tax allocations, losses on wash sale transactions, post-October capital losses, and differing treatment for security transactions.
The following reclassification represents the amount necessary to report the stated components of net assets on a tax basis, excluding certain temporary differences, as of December 31, 2008. The financial highlights exclude these adjustments.
| Distributions In Excess of Net Investment Income | Accumulated Net Realized Loss | Paid-in Capital | |||||||||
| $ | 143,642,011 | $ | 114,700,709 | $ | (258,342,720 | ) | |||||
18
GMO Inflation Indexed Plus Bond Fund
(A Series of GMO Trust)
Notes to Financial Statements — (Continued)
February 28, 2009
The tax character of distributions declared to shareholders is as follows:
| 12/31/2008 | 12/31/2007 | ||||||||||
| Ordinary income (including any net short-term capital gain) | $ | 144,796,844 | $ | 302,193,959 | |||||||
| Total distributions | $ | 144,796,844 | $ | 302,193,959 | |||||||
Distributions in excess of tax basis earnings and profits, if significant, are reported in the financial statements as a return of capital for tax purposes.
As of December 31, 2008, the components of distributable earnings on a tax basis consisted of the following:
| Undistributed ordinary income (including any net short-term capital gain) | $ | 6,472,114 | |||||
As of December 31, 2008, the Fund elected to defer to January 1, 2009 post-October capital losses of $1,829,159.
As of December 31, 2008, the Fund had capital loss carryforwards available to offset future realized gains if any, to the extent permitted by the Code. Such losses expire as follows:
| 12/31/2015 | $ | (33,561,953 | ) | ||||
| 12/31/2016 | (23,863,587 | ) | |||||
| Total | $ | (57,425,540 | ) | ||||
As of February 28, 2009, the approximate cost for U.S. federal income tax purposes and gross and net unrealized appreciation (depreciation) in value of investments were as follows:
Aggregate Cost | Gross Unrealized Appreciation | Gross Unrealized (Depreciation) | Net Unrealized Appreciation (Depreciation) | ||||||||||||
| $ | 486,692,050 | $ | 21,110 | $ | (110,518,609 | ) | $ | (110,497,499 | ) | ||||||
Utilization of the capital loss carryforwards, post-October capital losses, and future losses, if any, realized subsequent to February 28, 2009 could be subject to limitations imposed by the Code related to share ownership activity.
For the period ended December 31, 2008, the Fund had net realized losses attributed to redemption in-kind transactions of $14,212,292.
19
GMO Inflation Indexed Plus Bond Fund
(A Series of GMO Trust)
Notes to Financial Statements — (Continued)
February 28, 2009
The Fund is subject to the provisions of Financial Accounting Standards Board Interpretation No. 48 ("FIN 48"), Accounting for Uncertainty in Income Taxes — an Interpretation of FASB Statement No. 109. FIN 48 sets forth a minimum threshold for financial statement recognition of a tax position taken or expected to be taken in a tax return that could affect the Fund's financial statements. The Fund did not have any unrecognized tax benefits or liabilities at December 31, 2008, nor did it have any increases or decreases in unrecognized tax benefits or liabilities for the period then ended. The Fund is subject to examination prior to the expiration of the statute of limitations by U.S. federal and state tax authorities for tax returns filed.
Security transactions and related investment income
Security transactions in the financial statements are accounted for on the trade date. Dividend income, net of applicable foreign withholding taxes, if any, is recorded on the ex-dividend date or, if later, when the Fund is informed of the ex-dividend date. Interest income is recorded on the accrual basis and is adjusted for the amortization of premiums and accretion of discounts. Principal on inflation indexed securities, is adjusted for inflation and any increase or decrease is recorded as interest income or loss. Income is not recognized on securities for which collection is not expected. Non-cash dividends, if any, are recorded at the fair market value of the asset received. In determining the net gain or loss on securities sold, the Fund uses the identified cost basis for the purposes of determining the cost basis.
Expenses
The majority of the expenses of the Trust are directly identifiable to an individual fund. Expenses that are not readily identifiable to a specific fund are allocated taking into consideration, among other things, the nature and type of expense and the relative size of the funds. Investment income, common expenses and realized and unrealized gains and losses are allocated pro rata among the classes of shares of the Fund based on the relative net assets of each class. Shareholder service fees, which are directly attributable to a class of shares, are charged to that class's operations. In addition, the Fund incurs fees and expenses indirectly as a shareholder in the underlying funds. Because the underlying funds have different expense and fee levels and the Fund may own different proportions of the underlying funds at different times, the amount of fees and expenses indirectly incurred by the Fund will vary (See Note 3).
State Street Bank and Trust Company ("State Street") serves as custodian, fund accounting agent and transfer agent of the Fund. State Street's fees may be reduced by an earnings allowance calculated on the average daily cash balances the Fund maintains with State Street. The Fund receives the benefit of the earnings allowance. In addition, Goldman Sachs Agency Lending, the Fund's securities lending agent, has agreed to reimburse the Fund for certain transactional expenses related to securities lending activity. Credit balances or expense reimbursements used to reduce fees, if any, are reported as a reduction of expenses in the Statement of Operations.
20
GMO Inflation Indexed Plus Bond Fund
(A Series of GMO Trust)
Notes to Financial Statements — (Continued)
February 28, 2009
Purchases and redemptions of Fund shares
Effective October 8, 2008, the Fund instituted a fee on cash redemptions of 0.91% of the amount redeemed. Effective October 21, 2008, the fee on cash redemptions was changed to 2.00% of the amount redeemed. As of February 28, 2009, the fee on cash redemptions was 2.00% of the amount redeemed. The Fund may impose a new purchase premium and/or redemption fee, or modify or eliminate an existing purchase premium and/or redemption fee, at any time. If the Manager determines that any portion of a cash redemption is offset by a corresponding cash purchase on the same day, the Fund will ordinarily waive or reduce the redemption fee with respect to that portion. In addition, the Fund may waive or reduce the redemption fee in extraordinary circumstances if the purchase or redemption will not cause the Fund to incur transaction costs. All redemption fees are paid to the Fund and recorded by the Fund as paid-in-capital. These fees are alloc ated relative to each class's net assets on the share transaction date. In-kind redemption transactions are generally not subject to redemption fees except when they include a cash component. However, when a substantial portion of a Fund is being redeemed, the Fund may charge a redemption fee based on estimated or known transaction costs resulting from those redemptions.
Investment risks
To manage the Fund's cash collateral needs in extraordinary market conditions, the Manager reserves the right to reduce or eliminate the Fund's derivative exposures, including those that are intended to cause the Fund to track its benchmark more closely. A reduction in those exposures without replacing them with benchmark securities will tend to cause the performance of the Fund to track its benchmark less closely and make the Fund's performance more dependent on the performance of the asset-backed securities it holds directly or indirectly.
To address in part the cash management issues described above, the Fund expects to honor nearly all redemptions of its shares in-kind for the foreseeable future. If redeeming shareholders from the Fund choose to sell assets received in-kind immediately and current adverse market conditions continue, they may experience difficulty selling the assets at favorable prices. To the extent that the Fund honors redemptions in cash, redeeming shareholders will bear the redemption fees described in the Purchases and Redemptions of Fund Shares note.
Recently issued accounting pronouncement
In March 2008, FASB issued Statement of Financial Accounting Standards No. 161, Disclosures about Derivative Instruments and Hedging Activities ("SFAS 161"). SFAS 161 is effective for fiscal years and interim periods beginning after November 15, 2008. SFAS 161 requires enhanced disclosures about the Fund's derivative and hedging activities. The Manager is currently evaluating the impact the adoption of SFAS 161 will have on the Fund's financial statement disclosures.
21
GMO Inflation Indexed Plus Bond Fund
(A Series of GMO Trust)
Notes to Financial Statements — (Continued)
February 28, 2009
3. Fees and other transactions with affiliates
GMO receives a management fee for the services it provides to the Fund. That fee is paid monthly at the annual rate of 0.25% of average daily net assets. The Fund has adopted a Shareholder Service Plan under which the Fund pays GMO a shareholder service fee for client and shareholder service, reporting, and other support. Pursuant to the Shareholder Service Plan, the shareholder service fee is calculated based on average daily net assets of each class at the annual rate of 0.15% for Class III shares and 0.055% for Class VI shares. The Manager will waive the Fund's shareholder service fee to the extent that the aggregate of any direct and indirect shareholder service fees borne by a class of shares of the Fund exceeds 0.15% for Class III shares and 0.055% for Class VI shares; provided, however, that the amount of this waiver will not exceed the respective Class' shareholder service fee.
Through at least June 30, 2009, the Manager has contractually agreed to reimburse the Fund for Fund expenses incurred through that date to the extent the Fund's total annual operating expenses (excluding "Excluded Expenses", as defined below) exceed 0.25% of the Fund's average daily net assets. Excluded Expenses include shareholder service fees, expenses indirectly incurred by investment in the underlying funds, fees and expenses of the independent Trustees of the Trust, fees and expenses for legal services not approved by the Manager for the Trust, compensation and expenses of the Trust's Chief Compliance Officer ("CCO") (excluding any employee benefits), brokerage commissions, securities lending fees and expenses, interest expense, transfer taxes, and other investment-related costs (including expenses associated with investments in any company that is an investment company or would be an investment company under the 1940 Act, but for the exceptions to the definition of investment company provided in Section 3(c)(1) and 3(c)(7) of the 1940 Act), hedging transaction fees, extraordinary, non-recurring and certain other unusual expenses (including taxes). In addition, the Manager has contractually agreed to reimburse the Fund through at least June 30, 2009 to the extent that the sum of (a) the Fund's total annual operating expenses (excluding Excluded Expenses) and (b) the amount of fees and expenses incurred indirectly by the Fund through its investment in ECDF (excluding ECDF's Excluded Expenses), exceeds 0.25% of the Fund's average daily net assets, subject to a maximum total reimbursement to the Fund equal to 0.25% of the Fund's average daily net assets.
The Fund incurs fees and expenses indirectly as a shareholder in underlying funds. For the year ended February 28, 2009, these indirect fees and expenses expressed as an annualized percentage of the Fund's average daily net assets were as follows:
| Indirect Net Expenses (excluding shareholder service fees and interest expense) | Indirect Shareholder Service Fees | Indirect Interest Expense | Total Indirect Expenses | ||||||||||||
| 0.018 | % | 0.005 | % | 0.007 | % | 0.030 | % | ||||||||
22
GMO Inflation Indexed Plus Bond Fund
(A Series of GMO Trust)
Notes to Financial Statements — (Continued)
February 28, 2009
The Fund's portion of the fees paid by the Trust to the Trust's independent Trustees and CCO during the year ended February 28, 2009 was $10,676 and $1,806, respectively. The compensation and expenses of the CCO are included in miscellaneous expenses in the Statement of Operations. The Fund paid no remuneration to any other officer of the Trust.
4. Purchases and sales of securities
For the year ended February 28, 2009, cost of purchases and proceeds from sales of investments, other than short-term obligations and class exchanges, were as follows:
| Purchases | Sales | ||||||||||
| U.S. Government securities | $ | 35,077,507 | $ | 29,749,801 | |||||||
| Investments (non-U.S. Government securities) | 438,253,663 | 104,882,965 | |||||||||
Proceeds from sale of securities for in-kind transactions for the year ended February 28, 2009 were $57,609,197.
5. Guarantees
In the normal course of business the Fund enters into contracts with third-party service providers that contain a variety of representations and warranties and that provide general indemnifications. The Fund's maximum exposure under these arrangements is unknown, as it involves future claims that may be made against the Fund that have not yet occurred. Based on experience, management is of the view that the risk of loss in connection with its indemnification obligations is remote; however, there can be no assurance that such obligations will not result in material liabilities that adversely affect the Fund.
6. Principal shareholders and related parties
As of February 28, 2009, 78.09% of the outstanding shares of the Fund were held by four shareholders, each holding more than 10% of the Fund's outstanding shares. On that date, no other shareholder owned more than 10% of the outstanding shares of the Fund. Redemptions from (or investments into) the Fund by or on behalf of these large shareholders may have a material effect on the Fund.
As of February 28, 2009, 0.04% of the Fund's shares were held by senior management of the Manager and GMO Trust officers and 73.79% of the Fund's shares were held by accounts for which the Manager had investment discretion.
23
GMO Inflation Indexed Plus Bond Fund
(A Series of GMO Trust)
Notes to Financial Statements — (Continued)
February 28, 2009
7. Share transactions
The Declaration of Trust permits the Trust to issue an unlimited number of shares of beneficial interest (without par value). Transactions in Fund shares were as follows:
| Year Ended February 28, 2009 | Year Ended February 29, 2008 | ||||||||||||||||||
| Class III: | Shares | Amount | Shares | Amount | |||||||||||||||
| Shares sold | 4,861,784 | $ | 80,097,939 | 7,753,239 | $ | 195,318,795 | |||||||||||||
| Shares issued to shareholders in reinvestment of distributions | 628,052 | 11,067,193 | 1,015,942 | 24,078,255 | |||||||||||||||
| Shares repurchased | (3,617,561 | ) | (81,377,958 | ) | (13,137,888 | ) | (323,176,587 | ) | |||||||||||
| Redemption fees | — | 20,582 | — | — | |||||||||||||||
| Net increase (decrease) | 1,872,275 | $ | 9,807,756 | (4,368,707 | ) | $ | (103,779,537 | ) | |||||||||||
| Year Ended February 28, 2009 | Period Ended February 13, 2008* | ||||||||||||||||||
| Class IV: | Shares | Amount | Shares | Amount | |||||||||||||||
| Shares sold | — | $ | — | 7,496,338 | $ | 190,386,804 | |||||||||||||
| Shares issued to shareholders in reinvestment of distributions | — | — | 637,724 | 15,178,849 | |||||||||||||||
| Shares repurchased | — | — | (11,854,634 | ) | (289,108,485 | ) | |||||||||||||
| Net increase (decrease) | — | $ | — | (3,720,572 | ) | $ | (83,542,832 | ) | |||||||||||
| Year Ended February 28, 2009 | Year Ended February 29, 2008 | ||||||||||||||||||
| Class VI: | Shares | Amount | Shares | Amount | |||||||||||||||
| Shares sold | 20,092,219 | $ | 400,069,195 | 81,536,209 | $ | 2,064,407,172 | |||||||||||||
| Shares issued to shareholders in reinvestment of distributions | 1,168,087 | 18,646,359 | 14,977,254 | 355,069,039 | |||||||||||||||
| Shares repurchased | (8,097,642 | ) | (139,676,772 | ) | (166,263,657 | ) | (3,946,012,475 | ) | |||||||||||
| Redemption fees | — | 90,895 | — | — | |||||||||||||||
| Net increase (decrease) | 13,162,664 | $ | 279,129,677 | (69,750,194 | ) | $ | (1,526,536,264 | ) | |||||||||||
* Effective February 13, 2008, all shareholders redeemed or exchanged out of class IV.
24
GMO Inflation Indexed Plus Bond Fund
(A Series of GMO Trust)
Notes to Financial Statements — (Continued)
February 28, 2009
8. Investments in affiliated issuers
A summary of the Fund's transactions in the shares of other funds of the Trust during the year ended February 28, 2009 is set forth below:
| Affiliate | Value, beginning of period | Purchases | Sales Proceeds | Dividend Income | Distributions of Realized Gains | Value, end of period | |||||||||||||||||||||
| GMO Emerging Country Debt Fund, Class III | $ | 6,756,250 | $ | 14,009,581 | $ | 3,826,156 | $ | 1,311,874 | $ | 97,707 | $ | 11,878,915 | |||||||||||||||
| GMO Short- Duration Collateral Fund | 114,960,626 | 326,884,004 | 111,786,485 | 14,075,205 | u | — | 238,892,494 | ||||||||||||||||||||
| GMO Special Purpose Holding Fund | 36,437 | — | — | — | 65,489 | 21,110 | |||||||||||||||||||||
| GMO World Opportunity Overlay Fund | 44,675,992 | 96,900,000 | 34,103,515 | — | — | 77,532,563 | |||||||||||||||||||||
| Totals | $ | 166,429,305 | $ | 437,793,585 | $ | 149,716,156 | $ | 15,387,079 | $ | 163,196 | $ | 328,325,082 | |||||||||||||||
u The Fund received total distributions in the amount of $47,628,977, of which $33,553,772 was a return of capital.
25
Report of Independent Registered Public Accounting Firm
To the Trustees of GMO Trust and the Shareholders of
GMO Inflation Indexed Plus Bond Fund:
In our opinion, the accompanying statement of assets and liabilities, including the schedule of investments, and the related statements of operations and of changes in net assets and the financial highlights present fairly, in all material respects, the financial position of GMO Inflation Indexed Plus Bond Fund (the "Fund") at February 28, 2009, the results of its operations for the year then ended, the changes in its net assets for each of the two years in the period then ended and the financial highlights for the periods indicated, in conformity with accounting principles generally accepted in the United States of America. These financial statements and financial highlights (hereafter referred to as "financial statements") are the responsibility of the Fund's management. Our responsibility is to express an opinion on these financial statements based on our audits. We conducted our audits of these financial statements in accord ance with the standards of the Public Company Accounting Oversight Board (United States). Those standards require that we plan and perform the audit to obtain reasonable assurance about whether the financial statements are free of material misstatement. An audit includes examining, on a test basis, evidence supporting the amounts and disclosures in the financial statements, assessing the accounting principles used and significant estimates made by management, and evaluating the overall financial statement presentation. We believe that our audits, which included confirmation of securities at February 28, 2009 by correspondence with the custodian and brokers, provide a reasonable basis for our opinion.
PricewaterhouseCoopers LLP
Boston, Massachusetts
April 29, 2009
26
GMO Inflation Indexed Plus Bond Fund
(A Series of GMO Trust)
Fund Expenses
February 28, 2009 (Unaudited)
Expense Examples: The following information is in relation to expenses for the six month period ended February 28, 2009.
As a shareholder of the Fund, you may incur two types of costs: (1) transaction costs, including redemption fees; (2) ongoing costs, including management fees, shareholder service fees, and other Fund expenses. This example is intended to help you understand your ongoing costs (in dollars) of investing in the Fund and to compare these costs with the ongoing costs of investing in other mutual funds.
These examples are based on an investment of $1,000 invested at the beginning of the period and held for the entire period, September 1, 2008 through February 28, 2009.
Actual Expenses
The first line of the table for each class below provides information about actual account values and actual expenses. You may use the information in this line, together with the amount you invested, to estimate the expenses that you paid over the period. Simply divide your account value by $1,000 (for example, a $10,000,000 account value divided by $1,000 = 10,000), then multiply the result by the number in the first line under the heading entitled "Net Expense Incurred" to estimate the expenses you paid on your account during this period.
Hypothetical Example for Comparison Purposes
The second line of the table for each class below provides information about hypothetical account values and hypothetical expenses based on the Fund's actual expense ratio and an assumed rate of return of 5% per year before expenses, which is not the Fund's actual return. The hypothetical account values and expenses may not be used to estimate the actual ending account balance or expenses you paid for the period. You may use this information to compare the ongoing costs of investing in the Fund with other funds. To do so, compare this 5% hypothetical example with the 5% hypothetical examples that appear in the shareholder reports of other funds.
Please note that the expenses shown in the table are meant to highlight your ongoing costs only and do not reflect any transactional costs, such as purchase premiums and redemption fees. Therefore, the second line of the table is useful in comparing ongoing costs only, and will not help you determine the relative total costs of owning different funds. In addition, if these transactional costs were included, your costs would have been higher.
| Annualized Net Expense Ratio | Beginning Account Value | Ending Account Value | Net Expense Incurred* | ||||||||||||||||
| Class III | |||||||||||||||||||
| 1) Actual | 0.43 | % | $ | 1,000.00 | $ | 732.70 | $ | 1.85 | |||||||||||
| 2) Hypothetical | 0.43 | % | $ | 1,000.00 | $ | 1,022.66 | $ | 2.16 | |||||||||||
| Class VI | |||||||||||||||||||
| 1) Actual | 0.33 | % | $ | 1,000.00 | $ | 732.60 | $ | 1.42 | |||||||||||
| 2) Hypothetical | 0.33 | % | $ | 1,000.00 | $ | 1,023.16 | $ | 1.66 | |||||||||||
* Expenses are calculated using each Class's annualized net expense ratio (including indirect expenses incurred) for the six months ended February 28, 2009, multiplied by the average account value over the period, multiplied by 181 days in the period, divided by 365 days in the year.
27
GMO Inflation Indexed Plus Bond Fund
(A Series of GMO Trust)
Tax Information for the Tax Year Ended December 31, 2008 (Unaudited)
The Fund will notify shareholders of amounts for use in preparing 2009 income tax forms in early 2010.
The Fund hereby designates as qualified interest income with respect to its taxable year ended December 31, 2008, $7,635,202 or if determined to be different, the qualified interest income of such year.
28
Trustees and Officers (Unaudited)
The following tables list the Trust's Trustees and Officers as of the date of this report; their address and date of birth ("DOB"); their position with the Trust; the length of time holding that position with the Trust; their principal occupation(s) during the past five years; the number of portfolios in the fund complex they oversee; and other directorships they hold in companies subject to registration or reporting requirements of the Securities Exchange Act of 1934 (generally called "public companies") or in registered investment companies. The Trust's Statement of Additional Information ("SAI") includes additional information about the Trust's trustees, including changes subsequent to the date of the report. The SAI is available, without charge, upon request by writing GMO, c/o GMO Trust, 40 Rowes Wharf, Boston, MA 02110.
Independent Trustees:
| Name, Address, and DOB | Position(s) Held with Trust | Term of Office1 and Length of Time Served | Principal Occupation(s) During Past Five Years | Number of Portfolios in Fund Complex Overseen by Trustee | Other Directorships Held by Trustee | ||||||||||||||||||
| Donald W. Glazer, Esq. c/o GMO Trust 40 Rowes Wharf Boston, MA 02110 DOB: 07/26/1944 | Chairman of the Board of Trustees | Chairman of the Board of Trustees since March 2005; Lead Independent Trustee (September 2004 – March 2005); Trustee since December 2000. | Consultant – Law and Business2; Author of Legal Treatises. | 59 | None. | ||||||||||||||||||
1 Each Trustee is elected to serve during the continued lifetime of the Trust until he/she dies, resigns or is removed, or if sooner, until the next meeting of Shareholders called for the purpose of electing Trustees and until the election and qualification of his/her successor.
2 As part of Mr. Glazer's work as a consultant, he provides part-time consulting services to Goodwin Procter LLP ("Goodwin"). Goodwin has provided legal services to Renewable Resources, LLC, an affiliate of GMO; GMO, in connection with its relationship with Renewable Resources; and funds managed by Renewable Resources. Mr. Glazer has represented that he has no financial interest in, and is not involved in the provision of, such legal services. In the calendar years ended December 31, 2007 and December 31, 2008, these entities paid $789,416 and $183,864 respectively, in legal fees and disbursements to Goodwin. In correspondence with the Staff of the Securities and Exchange Commission beginning in August 2006, the Independent Trustees' legal counsel provided the Staff with information regarding Mr. Glazer's relationship with Goodwin and h is other business activities. On September 11, 2007, based on information that had been given to the Staff as of that date, the Staff provided oral no-action assurance consistent with the opinion of the Independent Trustees' legal counsel that Mr. Glazer is not an "interested person" of the Trust.
29
Independent Trustees — (Continued)
| Name, Address, and DOB | Position(s) Held with Trust | Term of Office1 and Length of Time Served | Principal Occupation(s) During Past Five Years | Number of Portfolios in Fund Complex Overseen by Trustee | Other Directorships Held by Trustee | ||||||||||||||||||
| W. Nicholas Thorndike c/o GMO Trust 40 Rowes Wharf Boston, MA 02110 DOB: 03/28/1933 | Trustee | Since March 2005. | Director or trustee of various corporations and charitable organizations, including Courier Corporation (a book publisher and manufacturer) (July 1989 – present); Putnam Funds (December 1992 – June 2004); and Providence Journal (a newspaper publisher) (December 1986 – December 2003). | 59 | Director of Courier Corporation (a book publisher and manufacturer); Member of the Investment Committee of Partners HealthCare System, Inc.3 | ||||||||||||||||||
| Peter Tufano c/o GMO Trust 40 Rowes Wharf Boston, MA 02110 DOB: 04/22/1957 | Trustee | Since December 2008. | Sylvan C. Coleman Professor of Financial Management, Harvard Business School (since 1989). | 59 | Trustee of State Street Navigator Securities Lending Trust (3 Portfolios). | ||||||||||||||||||
1 Each Trustee is elected to serve during the continued lifetime of the Trust until he/she dies, resigns or is removed, or if sooner, until the next meeting of Shareholders called for the purpose of electing Trustees and until the election and qualification of his/her successor.
3 Partners HealthCare System, Inc. is a client of the Manager.
30
Principal Officers:
| Name, Address, and DOB | Position(s) Held with Trust | Term of Office4 and Length of Time Served | Principal Occupation(s) During Past Five Years5 | ||||||||||||
| J.B. Kittredge DOB: 08/22/1954 | President and Chief Executive Officer | Since March 2009. | General Counsel, Grantham, Mayo, Van Otterloo & Co. LLC (October 2005 – Present); Partner, Ropes & Gray LLP. | ||||||||||||
| Sheppard N. Burnett c/o GMO Trust 40 Rowes Wharf Boston, MA 02110 DOB: 10/24/1968 | Treasurer and Chief Financial Officer | Chief Financial Officer since March 2007; Treasurer since November 2006; Assistant Treasurer, September 2004 – November 2006. | Fund Administration Staff, Grantham, Mayo, Van Otterloo & Co. LLC (June 2004 – present); Vice President, Director of Tax, Columbia Management Group (2002 – 2004). | ||||||||||||
| Brent C. Arvidson c/o GMO Trust 40 Rowes Wharf Boston, MA 02110 DOB: 06/26/1969 | Assistant Treasurer | Since August 1998. | Senior Fund Administrator, Grantham, Mayo, Van Otterloo & Co. LLC. | ||||||||||||
| John L. Nasrah c/o GMO Trust 40 Rowes Wharf Boston, MA 02110 DOB: 05/27/1977 | Assistant Treasurer | Since March 2007. | Fund Administrator, Grantham, Mayo, Van Otterloo & Co. LLC (September 2004 – present); Tax Analyst, Bain & Company, Inc. (June 2003 – September 2004). | ||||||||||||
| Mahmoodur Rahman c/o GMO Trust 40 Rowes Wharf Boston, MA 02110 DOB: 11/30/1967 | Assistant Treasurer | Since September 2007. | Fund Administrator, Grantham, Mayo, Van Otterloo & Co. LLC (April 2007 – present); Vice President and Senior Tax Manager, Massachusetts Financial Services Company (January 2000 – April 2007). | ||||||||||||
| Michael E. Gillespie c/o GMO Trust 40 Rowes Wharf Boston, MA 02110 DOB: 02/18/1958 | Chief Compliance Officer | Since March 2005. | Vice President of Compliance (June 2004 – February 2005) and Director of Domestic Compliance (March 2002 – June 2004), Fidelity Investments. | ||||||||||||
4 Each officer is elected to hold such office until his or her successor is duly elected and qualified to carry out the duties and responsibilities of the office, or until he or she resigns or is removed from office.
5 Each of Messrs. Burnett, Arvidson, Bohan, and Pottle serves as an officer and/or director of certain pooled investment vehicles of which GMO or an affiliate of GMO serves as the investment adviser.
31
Principal Officers — (Continued)
| Name, Address, and DOB | Position(s) Held with Trust | Term of Office4 and Length of Time Served | Principal Occupation(s) During Past Five Years5 | ||||||||||||
| Jason B. Harrison c/o GMO Trust 40 Rowes Wharf Boston, MA 02110 DOB: 01/29/1977 | Vice President and Clerk | Vice President since November 2006; Clerk since March 2006. | Legal Counsel, Grantham, Mayo, Van Otterloo & Co. LLC (since February 2006) and Attorney, Ropes & Gray LLP (September 2002 – February 2006). | ||||||||||||
| David L. Bohan c/o GMO Trust 40 Rowes Wharf Boston, MA 02110 DOB: 06/21/1964 | Vice President and Assistant Clerk | Vice President since March 2005; Assistant Clerk since March 2006. | Legal Counsel, Grantham, Mayo, Van Otterloo & Co. LLC. | ||||||||||||
| Gregory L. Pottle c/o GMO Trust 40 Rowes Wharf Boston, MA 02110 DOB: 07/09/1971 | Vice President and Assistant Clerk | Since November 2006. | Legal Counsel, Grantham, Mayo, Van Otterloo & Co. LLC. | ||||||||||||
| Anne K. Trinque c/o GMO Trust 40 Rowes Wharf Boston, MA 02110 DOB: 04/15/1978 | Vice President and Assistant Clerk | Since September 2007. | Legal Counsel, Grantham, Mayo, Van Otterloo & Co. LLC (January 2007 – present); Attorney, Goodwin Procter LLP (September 2003 – January 2007). | ||||||||||||
| Cheryl Wakeham c/o GMO Trust 40 Rowes Wharf Boston, MA 02110 DOB: 10/29/1958 | Vice President and Anti-Money Laundering Officer | Since December 2004. | Manager, Client Service Administration, Grantham, Mayo, Van Otterloo & Co. LLC. | ||||||||||||
4 Each officer is elected to hold such office until his or her successor is duly elected and qualified to carry out the duties and responsibilities of the office, or until he or she resigns or is removed from office.
5 Each of Messrs. Burnett, Arvidson, Bohan, and Pottle serves as an officer and/or director of certain pooled investment vehicles of which GMO or an affiliate of GMO serves as the investment adviser.
32
GMO International Bond Fund
(A Series of GMO Trust)
Annual Report
February 28, 2009
For a free copy of the Fund's proxy voting guidelines, shareholders may call 1-617-346-7646 (collect) or visit the Securities and Exchange Commission's website at www.sec.gov. Information regarding how the Fund voted proxies relating to portfolio securities during the most recent 12-month period ended June 30 is available on GMO's website at www.gmo.com, or on the Securities and Exchange Commission's website at www.sec.gov.
The Fund files its complete schedule of portfolio holdings with the Securities and Exchange Commission for the first and third quarter of each fiscal year on Form N-Q, which is available on the Commission's website at www.sec.gov. The Fund's Form N-Q may be reviewed and copied at the Commission's Public Reference Room in Washington, D.C. Information on the operation of the Public Reference Room may be obtained by calling 1-800-SEC-0330. The Fund has a policy with respect to disclosure of portfolio holdings under which it may also make available on GMO's website at www.gmo.com a complete schedule of portfolio holdings.
This report is prepared for the general information of shareholders. It is authorized for distribution to prospective investors only when preceded or accompanied by a prospectus for the GMO Trust, which contains a complete discussion of the risks associated with an investment in this Fund and other important information. The GMO Trust prospectus can be obtained at www.gmo.com.
GMO International Bond Fund
(A Series of GMO Trust)
Portfolio Management
Day-to-day management of the Fund's portfolio is the responsibility of the Fixed Income Division at Grantham, Mayo, Van Otterloo & Co. LLC.
Management Discussion and Analysis of Fund Performance
The GMO International Bond Fund returned -24.5% for the fiscal year ended February 28, 2009, as compared to the -4.1% return for the JPMorgan Non-U.S. Government Bond Index. The Fund's exposure to various issues is achieved directly, and indirectly, through its investment in certain underlying GMO mutual funds, primarily in the GMO Emerging Country Debt Fund (ECDF), the GMO World Opportunity Overlay Fund (WOOF), and the GMO Short-Duration Collateral Fund (SDCF).
The Fund underperformed the benchmark during the fiscal year by 20.4%. Exposures to SDCF and WOOF were by far the largest negative contributors during the fiscal year, followed by negative contributions from developed interest-rate strategies, exposure to emerging country debt via ECDF, and currency selection.
About 78% of the fiscal year's underperformance was due to price declines in the two funds in which the Fund invests a substantial portion of its total assets: SDCF and WOOF. These funds invest primarily in asset-backed securities. The positions in SDCF and WOOF collateralize the Fund's derivatives positions that seek to deliver the return of the benchmark or to create active exposures in global interest-rate and currency markets.
As the fiscal year was marked by sharply deteriorating liquidity conditions in securitized credit markets, spreads widened to all-time highs in the asset-backed securities held indirectly in the International Bond Fund via holdings of SDCF and WOOF. Such ABS exposure contributed -1,673 bps to the Fund's performance. To increase flexibility, the Fund began holding more U.S. government securities and money market funds. In addition to widening spreads, both SDCF and WOOF's portfolios suffered credit downgrades during the year. SDCF had 123 downgraded securities, and WOOF had 82, representing 27.4% and 25.5% of their respective market values from the beginning of the year. At fiscal year end, 73% of SDCF's portfolio was rated AAA, 8% was rated AA, 2% was rated A, 12% was rated BBB and 5% was rated below BBB. At fiscal year end, 74% of WOOF's portfolio was rated AAA, 6% was rated AA, 2% was rated A, 12% was rated BBB and 6% was rate d below BBB.
Further underperformance was attributable to interest-rate and currency strategies. Given the adverse market conditions for interest rates and currencies, characterized by poor liquidity and choppy, gapping prices, the Fund temporarily suspended model-based positions in interest rates and currencies starting in October.
In interest-rate strategies, underperformance of U.S. Treasury principal strips versus LIBOR and other opportunistic trades contributed to developed interest-rate strategy losses. Before model-based interest-rate positions were suspended, Euro-area, U.S., Swedish, and Swiss market positions had contributed positively. Further, the slope and volatility strategies also added value during this time.
GMO International Bond Fund
(A Series of GMO Trust)
Management Discussion and Analysis of Fund Performance — (Continued)
Currency contribution was concentrated before positions were suspended in October. Negative relative currency performance during this time came mainly from the Fund's Swedish krona, Norwegian krone, euro, and New Zealand dollar positions.
A small exposure to emerging country debt also detracted value as spread widening on that asset class contributed negatively, as did negative contributions from both security and country selection.
The views expressed herein are exclusively those of Grantham, Mayo, Van Otterloo & Co. LLC Management as of the date of this report and are subject to change. GMO disclaims any responsibility to update such views. They are not meant as investment advice. References to specific securities are not recommendations of such securities and may not be representative of any GMO portfolio's current or future investments.
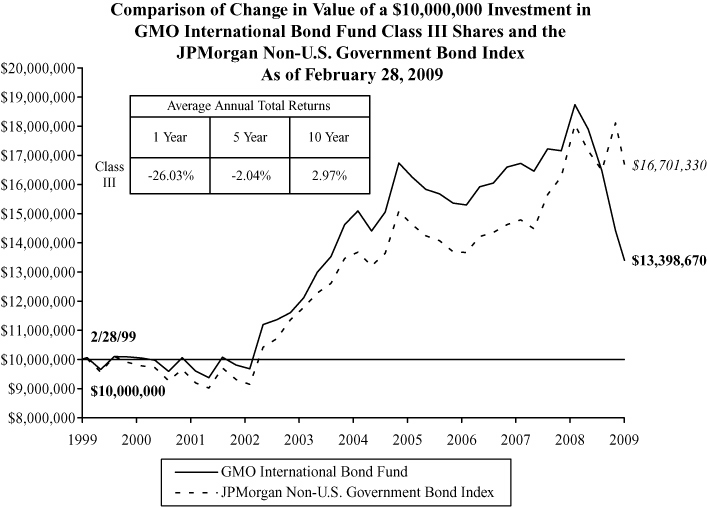
Performance data quoted represents past performance and is not indicative of future results. The investment return and principal value of an investment will fluctuate so that an investor's shares, when redeemed, may be worth more or less than their original cost. Current performance data may be lower or higher than the performance data provided herein. To obtain performance information to the most recent month-end, visit www.gmo.com. Performance shown is net of all fees after reimbursement from the Manager. Each performance figure assumes a redemption at the end of the stated period and reflects a transaction fee of 2.00% on the redemption. Transaction fees are retained by the Fund to cover trading costs. Returns would have been lower had certain expenses not been reimbursed during the periods shown and do not include the effect of taxes on distributions and redem ptions. All information is unaudited.
This page has been left blank intentionally.
GMO International Bond Fund
(A Series of GMO Trust)
Investments Concentration Summary
February 28, 2009 (Unaudited)
| Asset Class Summary* | % of Total Net Assets | ||||||
| Debt Obligations | 91.2 | % | |||||
| Short-Term Investments | 10.2 | ||||||
| Options Purchased | 1.7 | ||||||
| Loan Participations | 0.2 | ||||||
| Futures | 0.2 | ||||||
| Loan Assignments | 0.1 | ||||||
| Rights and Warrants | 0.0 | ||||||
| Promissory Notes | 0.0 | ||||||
| Reverse Repurchase Agreements | (0.0 | ) | |||||
| Written Options | (0.6 | ) | |||||
| Swaps | (1.0 | ) | |||||
| Forward Currency Contracts | (4.9 | ) | |||||
| Other | 2.9 | ||||||
| 100.0 | % | ||||||
| Country Summary** | % of Investments | ||||||
| Japan | 45.2 | % | |||||
| Euro Region*** | 44.6 | ||||||
| United Kingdom | 8.9 | ||||||
| Emerging**** | 3.4 | ||||||
| Canada | 2.2 | ||||||
| Australia | (0.1 | ) | |||||
| United States | (4.2 | ) | |||||
| 100.0 | % | ||||||
* The table above incorporates aggregate indirect asset class exposure associated with investments in other funds of GMO Trust ("underlying funds").
** The table above incorporates aggregate indirect country exposure associated with investments in the underlying funds. The table excludes short-term investments. The table includes exposure through the use of derivative contracts.
*** The "Euro Region" is comprised of Austria, Belgium, Finland, France, Germany, Greece, Ireland, Italy, Netherlands, Portugal and Spain.
**** The "Emerging" exposure is associated with investments in the GMO Emerging Country Debt Fund, which is exposed to emerging countries primarily comprised of Philippines, Russia, Venezuela, Brazil, Argentina, Columbia, Uruguay, Mexico, Ivory Coast, and Vietnam. Additional information about the Fund's emerging country exposure is available in the financial statements of the GMO Emerging Country Debt Fund.
1
GMO International Bond Fund
(A Series of GMO Trust)
Schedule of Investments
(showing percentage of total net assets)
February 28, 2009
| Par Value | Description | Value ($) | |||||||||||||
| DEBT OBLIGATIONS — 18.0% | |||||||||||||||
| Canada — 1.1% | |||||||||||||||
| Foreign Government Obligations | |||||||||||||||
| CAD | 2,000,000 | Government of Canada, 8.00%, due 06/01/23 | 2,337,148 | ||||||||||||
| France — 2.9% | |||||||||||||||
| Foreign Government Obligations | |||||||||||||||
| EUR | 5,000,000 | Government of France, 4.00%, due 10/25/38 | 6,187,318 | ||||||||||||
| Germany — 3.3% | |||||||||||||||
| Foreign Government Obligations | |||||||||||||||
| EUR | 5,000,000 | Republic of Deutschland, 4.75%, due 07/04/34 | 7,056,297 | ||||||||||||
| Japan — 3.1% | |||||||||||||||
| Foreign Government Obligations | |||||||||||||||
| JPY | 600,000,000 | Japan Government Twenty Year Bond, 2.20%, due 06/20/26 | 6,463,671 | ||||||||||||
| United Kingdom — 3.3% | |||||||||||||||
| Foreign Government Obligations | |||||||||||||||
| GBP | 5,000,000 | U.K. Treasury Gilt, 4.25%, due 12/07/27 | 6,961,157 | ||||||||||||
| United States — 4.3% | |||||||||||||||
| U.S. Government | |||||||||||||||
| USD | 9,158,490 | U.S. Treasury Inflation Indexed Bond, 0.88%, due 04/15/10 (a) (b) | 9,035,418 | ||||||||||||
| TOTAL DEBT OBLIGATIONS (COST $41,529,446) | 38,041,009 | ||||||||||||||
See accompanying notes to the financial statements.
2
GMO International Bond Fund
(A Series of GMO Trust)
Schedule of Investments — (Continued)
(showing percentage of total net assets)
February 28, 2009
| Shares | Description | Value ($) | |||||||||||||
| MUTUAL FUNDS — 77.4% | |||||||||||||||
| United States — 77.4% | |||||||||||||||
| Affiliated Issuers | |||||||||||||||
| 1,119,196 | GMO Emerging Country Debt Fund, Class III | 6,547,297 | |||||||||||||
| 7,084,243 | GMO Short-Duration Collateral Fund | 121,140,551 | |||||||||||||
| 37,466 | GMO Special Purpose Holding Fund (c) (d) | 27,350 | |||||||||||||
| 1,971,169 | GMO World Opportunity Overlay Fund | 36,170,948 | |||||||||||||
| Total United States | 163,886,146 | ||||||||||||||
| TOTAL MUTUAL FUNDS (COST $217,115,278) | 163,886,146 | ||||||||||||||
| SHORT-TERM INVESTMENTS — 7.2% | |||||||||||||||
| Money Market Funds — 7.2% | |||||||||||||||
| 15,382,178 | State Street Institutional Treasury Plus Money Market Fund-Institutional Class | 15,382,178 | |||||||||||||
| TOTAL SHORT-TERM INVESTMENTS (COST $15,382,178) | 15,382,178 | ||||||||||||||
| TOTAL INVESTMENTS — 102.6% (Cost $274,026,902) | 217,309,333 | ||||||||||||||
| Other Assets and Liabilities (net) — (2.6%) | (5,545,659 | ) | |||||||||||||
| TOTAL NET ASSETS — 100.0% | $ | 211,763,674 | |||||||||||||
See accompanying notes to the financial statements.
3
GMO International Bond Fund
(A Series of GMO Trust)
Schedule of Investments — (Continued)
February 28, 2009
A summary of outstanding financial instruments at February 28, 2009 is as follows:
Forward Currency Contracts
| Settlement Date | Deliver/Receive | Units of Currency | Value | Net Unrealized Appreciation (Depreciation) | |||||||||||||||
| Buys | |||||||||||||||||||
| 3/31/09 | AUD | 900,000 | $ | 574,334 | $ | (9,766 | ) | ||||||||||||
| 4/07/09 | CAD | 5,600,000 | 4,401,666 | (206,250 | ) | ||||||||||||||
| 3/10/09 | EUR | 66,300,000 | 84,047,938 | (7,008,482 | ) | ||||||||||||||
| 4/14/09 | GBP | 4,300,000 | 6,155,194 | (148,605 | ) | ||||||||||||||
| 3/17/09 | JPY | 6,589,600,000 | 67,536,447 | (4,735,373 | ) | ||||||||||||||
| $ | 162,715,579 | $ | (12,108,476 | ) | |||||||||||||||
| Sales | |||||||||||||||||||
| 4/07/09 | CAD | 3,000,000 | $ | 2,358,035 | $ | 64,602 | |||||||||||||
| 3/10/09 | EUR | 10,900,000 | 13,817,836 | 1,427,424 | |||||||||||||||
| $ | 16,175,871 | $ | 1,492,026 | ||||||||||||||||
Forward Cross Currency Contracts
| Settlement Date | Deliver/Units of Currency | Receive/In Exchange For | Net Unrealized Appreciation (Depreciation) | ||||||||||||
| 4/21/09 | EUR | 1,300,000 | SEK | 14,040,000 | $ | (88,995 | ) | ||||||||
Futures Contracts
| Number of Contracts | Type | Expiration Date | Contract Value | Net Unrealized Appreciation (Depreciation) | |||||||||||||||
| Buys | |||||||||||||||||||
| 4 | Australian Government Bond 10 Yr. | March 2009 | $ | 288,884 | $ | (1,451 | ) | ||||||||||||
| 7 | Australian Government Bond 3 Yr. | March 2009 | 482,277 | 2,962 | |||||||||||||||
| 15 | Canadian Government Bond 10 Yr. | June 2009 | 1,464,239 | (12,576 | ) | ||||||||||||||
| 186 | Euro BOBL | March 2009 | 27,589,220 | 254,595 | |||||||||||||||
| 225 | Euro Bund | March 2009 | 35,634,428 | 92,530 | |||||||||||||||
| 700 | Federal Funds 30 day | March 2009 | 291,004,528 | (3,558 | ) | ||||||||||||||
See accompanying notes to the financial statements.
4
GMO International Bond Fund
(A Series of GMO Trust)
Schedule of Investments — (Continued)
February 28, 2009
Futures Contracts — continued
| Number of Contracts | Type | Expiration Date | Contract Value | Net Unrealized Appreciation (Depreciation) | |||||||||||||||
| 57 | Japanese Government Bond 10 Yr. (TSE) | March 2009 | $ | 81,266,229 | $ | 53,088 | |||||||||||||
| 31 | UK Gilt Long Bond | June 2009 | 5,267,395 | (72,779 | ) | ||||||||||||||
| $ | 442,997,200 | $ | 312,811 | ||||||||||||||||
| Sales | |||||||||||||||||||
| 1 | U.S. Long Bond (CBT) | March 2009 | $ | 124,609 | $ | (73 | ) | ||||||||||||
| 45 | U.S. Treasury Note 10 Yr. (CBT) | June 2009 | 5,401,406 | 45,920 | |||||||||||||||
| 14 | U.S. Treasury Note 2 Yr. (CBT) | June 2009 | 3,032,531 | 1,926 | |||||||||||||||
| $ | 8,558,546 | $ | 47,773 | ||||||||||||||||
Swap Agreements
Credit Default Swaps
| Notional Amount | Expiration Date | Counterparty | Receiveu (Pay) | Annual Premium | Implied Credit Spread (1) | Deliverable on Default | Maximum Potential Amount of Future Payments by the Fund Under the Contract (2) | Market Value | |||||||||||||||||||||||||||
| 21,000,000 USD | 3/20/2014 | Deutsche Bank | (Pay) | 1.70% | 1.86% | Republic of Italy | N/A | $ | 123,788 | ||||||||||||||||||||||||||
| 15,000,000 USD | 3/20/2019 | Deutsche Bank | Receive | 1.66% | 1.81% | Republic of Italy | 15,000,000 USD | (154,293 | ) | ||||||||||||||||||||||||||
| $ | (30,505 | ) | |||||||||||||||||||||||||||||||||
| Premiums to (Pay) Receive | $ | — | |||||||||||||||||||||||||||||||||
u Receive - Fund receives premium and sells credit protection.
(Pay) - Fund pays premium and buys credit protection.
(1) Implied credit spreads, represented in absolute terms, utilized in determining the market value of credit default swap agreements on the reference security, as of February 28, 2009, serve as an indicator of the current status of the payment/performance risk and reflect the likelihood or risk of default for the credit derivative. The implied credit spread of a particular referenced entity reflects the cost of buying/selling protection and may include upfront payments required to be made to enter into the agreement. Wider credit spreads represent a deterioration of the referenced entity's credit soundness and a greater likelihood or risk of default or other credit event occurring as defined under the terms of the agreement.
(2) The maximum potential amount the Fund could be required to make as a seller of credit protection if a credit event occurs as defined under the terms of that particular swap agreement.
See accompanying notes to the financial statements.
5
GMO International Bond Fund
(A Series of GMO Trust)
Schedule of Investments — (Continued)
February 28, 2009
As of February 28, 2009, for the futures and/or swap contracts held, the Fund had sufficient cash and/or securities to cover any commitments or margin requirements of the relevant broker or exchange.
Notes to Schedule of Investments:
(a) Indexed security in which price and/or coupon is linked to the prices of a specific instrument or financial statistic (Note 2).
(b) All or a portion of this security has been segregated to cover margin requirements on open financial futures contracts and/or collateral on open swap contracts (Note 2).
(c) Underlying investment represents interests in defaulted securities.
(d) Security valued at fair value using methods determined in good faith by or at the direction of the Trustees of GMO Trust (Note 2).
Currency Abbreviations:
AUD - Australian Dollar
CAD - Canadian Dollar
EUR - Euro
GBP - British Pound
JPY - Japanese Yen
SEK - Swedish Krona
USD - United States Dollar
See accompanying notes to the financial statements.
6
GMO International Bond Fund
(A Series of GMO Trust)
Statement of Assets and Liabilities — February 28, 2009
| Assets: | |||||||
| Investments in unaffiliated issuers, at value (cost $56,911,624) (Note 2) | $ | 53,423,187 | |||||
| Investments in affiliated issuers, at value (cost $217,115,278) (Notes 2 and 8) | 163,886,146 | ||||||
| Cash | 4,880,000 | ||||||
| Dividends and interest receivable | 446,835 | ||||||
| Unrealized appreciation on open forward currency contracts (Note 2) | 1,492,026 | ||||||
| Receivable for open swap contracts (Note 2) | 123,788 | ||||||
| Receivable for variation margin on open futures contracts (Note 2) | 26,707 | ||||||
| Receivable for expenses reimbursed by Manager (Note 3) | 28,659 | ||||||
| Other expense reimbursement from Manager (Note 2) | 830,768 | ||||||
| Total assets | 225,138,116 | ||||||
| Liabilities: | |||||||
| Payable to affiliate for (Note 3): | |||||||
| Management fee | 41,545 | ||||||
| Shareholder service fee | 24,927 | ||||||
| Trustees and Chief Compliance Officer of GMO Trust fees | 710 | ||||||
| Unrealized depreciation on open forward currency contracts (Note 2) | 12,197,471 | ||||||
| Payable for open swap contracts (Note 2) | 154,293 | ||||||
| Accrued expenses | 955,496 | ||||||
| Total liabilities | 13,374,442 | ||||||
| Net assets | $ | 211,763,674 | |||||
| Net assets consist of: | |||||||
| Paid-in capital | $ | 304,787,150 | |||||
| Accumulated undistributed net investment income | 36,205,632 | ||||||
| Accumulated net realized loss | (62,099,139 | ) | |||||
| Net unrealized depreciation | (67,129,969 | ) | |||||
| $ | 211,763,674 | ||||||
| Net assets attributable to: | |||||||
| Class III shares | $ | 211,763,674 | |||||
| Shares outstanding: | |||||||
| Class III | 34,308,510 | ||||||
| Net asset value per share: | |||||||
| Class III | $ | 6.17 | |||||
See accompanying notes to the financial statements.
7
GMO International Bond Fund
(A Series of GMO Trust)
Statement of Operations — Year Ended February 28, 2009
| Investment Income: | |||||||
| Dividends from affiliated issuers (Note 8) | $ | 9,649,678 | |||||
| Dividends | 94,502 | ||||||
| Interest | 336,778 | ||||||
| Total investment income | 10,080,958 | ||||||
| Expenses: | |||||||
| Management fee (Note 3) | 974,604 | ||||||
| Shareholder service fee – Class III (Note 3) | 584,762 | ||||||
| Custodian, fund accounting agent and transfer agent fees | 178,570 | ||||||
| Audit and tax fees | 70,030 | ||||||
| Legal fees | 18,400 | ||||||
| Trustees fees and related expenses (Note 3) | 8,689 | ||||||
| Registration fees | 3,503 | ||||||
| Miscellaneous | 5,492 | ||||||
| Total expenses | 1,844,050 | ||||||
| Fees and expenses reimbursed by Manager (Note 3) | (264,543 | ) | |||||
| Indirectly incurred fees waived or borne by Manager (Note 3) | (51,113 | ) | |||||
| Shareholder service fee waived (Note 3) | (17,935 | ) | |||||
| Net expenses | 1,510,459 | ||||||
| Net investment income (loss) | 8,570,499 | ||||||
| Realized and unrealized gain (loss): | |||||||
| Net realized gain (loss) on: | |||||||
| Investments in unaffiliated issuers | 3,519,186 | ||||||
| Investments in affiliated issuers | (35,703,191 | ) | |||||
| Realized gains distributions from affiliated issuers (Note 8) | 416,726 | ||||||
| Closed futures contracts | 7,701,798 | ||||||
| Closed swap contracts | 4,769,163 | ||||||
| Written options | (1,374,173 | ) | |||||
| Foreign currency, forward contracts and foreign currency related transactions | (7,047,247 | ) | |||||
| Net realized gain (loss) | (27,717,738 | ) | |||||
| Change in net unrealized appreciation (depreciation) on: | |||||||
| Investments in unaffiliated issuers | (5,441,902 | ) | |||||
| Investments in affiliated issuers | (29,011,852 | ) | |||||
| Open futures contracts | (6,429,000 | ) | |||||
| Open swap contracts | (1,537,600 | ) | |||||
| Foreign currency, forward contracts and foreign currency related transactions | (32,091,067 | ) | |||||
| Net unrealized gain (loss) | (74,511,421 | ) | |||||
| Net realized and unrealized gain (loss) | (102,229,159 | ) | |||||
| Net increase (decrease) in net assets resulting from operations | $ | (93,658,660 | ) | ||||
See accompanying notes to the financial statements.
8
GMO International Bond Fund
(A Series of GMO Trust)
Statement of Changes in Net Assets
| Year Ended February 28, 2009 | Year Ended February 29, 2008 | ||||||||||
| Increase (decrease) in net assets: | |||||||||||
| Operations: | |||||||||||
| Net investment income (loss) | $ | 8,570,499 | $ | 21,814,702 | |||||||
| Net realized gain (loss) | (27,717,738 | ) | 12,166,724 | ||||||||
| Change in net unrealized appreciation (depreciation) | (74,511,421 | ) | 4,962,721 | ||||||||
| Net increase (decrease) in net assets from operations | (93,658,660 | ) | 38,944,147 | ||||||||
| Distributions to shareholders from: | |||||||||||
| Net investment income | |||||||||||
| Class III | (53,793,041 | ) | (48,502,819 | ) | |||||||
| Net share transactions (Note 7): | |||||||||||
| Class III | (155,905,746 | ) | 74,650,906 | ||||||||
| Redemption fees (Notes 2 and 7): | |||||||||||
| Class III | 550,622 | — | |||||||||
| Total increase (decrease) in net assets resulting from net share transactions and redemption fees | (155,355,124 | ) | 74,650,906 | ||||||||
| Total increase (decrease) in net assets | (302,806,825 | ) | 65,092,234 | ||||||||
| Net assets: | |||||||||||
| Beginning of period | 514,570,499 | 449,478,265 | |||||||||
| End of period (including accumulated undistributed net investment income of $36,205,632 and $199,241, respectively) | $ | 211,763,674 | $ | 514,570,499 | |||||||
See accompanying notes to the financial statements.
9
GMO International Bond Fund
(A Series of GMO Trust)
Financial Highlights
(For a Class III share outstanding throughout each period)
| Year Ended February 28/29, | |||||||||||||||||||||||
| 2009 | 2008 | 2007 | 2006 | 2005 | |||||||||||||||||||
| Net asset value, beginning of period | $ | 9.51 | $ | 9.73 | $ | 9.57 | $ | 10.61 | $ | 10.38 | |||||||||||||
| Income (loss) from investment operations: | |||||||||||||||||||||||
| Net investment income (loss)(a)† | 0.19 | 0.41 | 0.41 | 0.21 | 0.17 | ||||||||||||||||||
| Net realized and unrealized gain (loss) | (2.32 | ) | 0.31 | 0.38 | (0.93 | ) | 1.02 | ||||||||||||||||
| Total from investment operations | (2.13 | ) | 0.72 | 0.79 | (0.72 | ) | 1.19 | ||||||||||||||||
| Less distributions to shareholders: | |||||||||||||||||||||||
| From net investment income | (1.21 | ) | (0.94 | ) | (0.54 | ) | (0.31 | ) | (0.91 | ) | |||||||||||||
| From net realized gains | — | — | (0.09 | ) | (0.01 | ) | (0.05 | ) | |||||||||||||||
| Total distributions | (1.21 | ) | (0.94 | ) | (0.63 | ) | (0.32 | ) | (0.96 | ) | |||||||||||||
| Net asset value, end of period | $ | 6.17 | $ | 9.51 | $ | 9.73 | $ | 9.57 | $ | 10.61 | |||||||||||||
| Total Return(b) | (24.52 | )% | 8.09 | % | 8.32 | % | (6.83 | )% | 11.81 | % | |||||||||||||
| Ratios/Supplemental Data: | |||||||||||||||||||||||
| Net assets, end of period (000's) | $ | 211,764 | $ | 514,570 | $ | 449,478 | $ | 422,528 | $ | 438,365 | |||||||||||||
| Net expenses to average daily net assets(c) | 0.39 | % | 0.38 | %(d) | 0.39 | % | 0.39 | % | 0.39 | % | |||||||||||||
| Net investment income to average daily net assets(a) | 2.20 | % | 4.26 | % | 4.17 | % | 2.13 | % | 1.65 | % | |||||||||||||
| Portfolio turnover rate | 47 | % | 51 | % | 32 | % | 36 | % | 51 | % | |||||||||||||
| Fees and expenses reimbursed and/or waived by the Manager to average daily net assets: | 0.09 | % | 0.07 | % | 0.26 | %(e) | 0.08 | % | 0.09 | % | |||||||||||||
| Redemption fees consisted of the following per share amounts:† | $ | 0.01 | — | — | — | — | |||||||||||||||||
(a) Net investment income is affected by the timing of the declaration of dividends by the underlying funds in which the Fund invests.
(b) The total returns would have been lower had certain expenses not been reimbursed and/or waived during the periods shown and assumes the effect of reinvested distributions. Calculation excludes redemption fees which are borne by the shareholder.
(c) Net expenses exclude expenses incurred indirectly through investment in the underlying funds (See Note 3).
(d) The net expense ratio does not include the effect of expense reductions.
(e) Includes 0.19% non-recurring Internal Revenue Code Section 860 expense reimbursed by the Manager (Note 2).
† Calculated using average shares outstanding throughout the period.
See accompanying notes to the financial statements.
10
GMO International Bond Fund
(A Series of GMO Trust)
Notes to Financial Statements
February 28, 2009
1. Organization
GMO International Bond Fund (the "Fund") is a series of GMO Trust (the "Trust"). The Fund is registered under the Investment Company Act of 1940, as amended, as an open-end, non-diversified management investment company. The Fund is advised and managed by Grantham, Mayo, Van Otterloo & Co. LLC (the "Manager" or "GMO"). The Trust was established as a Massachusetts business trust under the laws of The Commonwealth of Massachusetts on June 24, 1985. The Declaration of Trust permits the Trustees of the Trust ("Trustees") to create an unlimited number of series of shares ("Funds") and to subdivide Funds into classes.
The Fund seeks total return in excess of that of the JPMorgan Non-U.S. Government Bond Index. The Fund typically invests in bonds included in the JPMorgan Non-U.S. Government Bond Index and in securities and instruments with similar characteristics. The Fund seeks additional returns by seeking to exploit differences in global interest rates and currency and emerging country debt markets. The Fund may invest a substantial portion of its total assets in shares of GMO Short-Duration Collateral Fund; in futures contracts, currency options, currency forwards, swap contracts, and other types of derivatives; in investment-grade bonds denominated in various currencies, including foreign and U.S. government securities and asset-backed securities issued by foreign governments and U.S. government agencies (including securities neither guaranteed nor insured by the U.S. government), corporate bonds, and mortgage-backed and other asset-backe d securities issued by private issuers; in shares of GMO World Opportunity Overlay Fund; and up to 5% of the Fund's total assets in sovereign debt of emerging countries (including below investment grade securities (also known as "junk bonds")), primarily through investment in shares of GMO Emerging Country Debt Fund ("ECDF").
The financial statements of the series of the Trust in which the Fund invests ("underlying funds") should be read in conjunction with the Fund's financial statements. These financial statements are available, upon request, without charge by calling (617) 346-7646 (collect). Shares of the GMO Short-Duration Collateral Fund, the GMO World Opportunity Overlay Fund and the GMO Special Purpose Holding Fund are not publicly available for direct purchase.
The Fund directly and indirectly (through underlying funds) invests in securities with contractual cash flows, such as collateralized mortgage obligations and commercial mortgage-backed securities, including securities backed by sub-prime mortgage loans, credit card receivables and auto loan receivables. The value, liquidity and related income of these securities are sensitive to changes in economic conditions, including real estate values, delinquencies and/or defaults, and may be adversely affected by changes in interest rates and shifts in the market's perception of the securities' market values.
The Fund will, if deemed prudent by the Manager, take temporary defensive measures (until the Manager has determined that normal conditions have returned or that it is otherwise prudent to resume investing in accordance with the Fund's normal investment strategies) and may not achieve its investment objectives
11
GMO International Bond Fund
(A Series of GMO Trust)
Notes to Financial Statements — (Continued)
February 28, 2009
during those periods. Recent changes in the credit markets have reduced the liquidity of all types of fixed income securities, including asset-backed securities. The Fund took temporary defensive measures during the last fiscal year.
2. Significant accounting policies
The following is a summary of significant accounting policies followed by the Fund in the preparation of its financial statements. These policies are in conformity with accounting principles generally accepted in the United States of America ("U.S. GAAP") and have been consistently followed by the Fund in preparing its financial statements. The preparation of financial statements in accordance with U.S. GAAP requires management to make estimates and assumptions that affect the reported amounts and disclosures in the financial statements. Actual results could differ from those estimates. The accounting records of the Fund are maintained in U.S. dollars.
Portfolio valuation
Securities listed on a securities exchange for which market quotations are readily available are valued at the last sale price or official closing price on each business day, or if there is no such reported sale or official closing price, at the most recent quoted bid price. Unlisted securities for which market quotations are readily available are generally valued at the most recent quoted bid price. Debt instruments with a remaining maturity of sixty days or less are generally valued at amortized cost, which approximates fair value. Shares of investment funds are generally valued at their net asset value. Securities for which quotations are not readily available or whose values the Manager has determined to be unreliable are valued at fair value as determined in good faith by the Trustees or persons acting at their direction pursuant to procedures approved by the Trustees. By its nature, a fair value price is a good faith estim ate of the value of a security at a given point in time and may not reflect the value that would be realized if the security were sold. The difference between a fair value price and the value realized upon a sale could be material.
Typically the Fund and the underlying funds value debt instruments based on prices supplied by a primary pricing source chosen by the Manager. The Manager evaluates primary pricing sources on an ongoing basis and may change a pricing source should the Manager deem it appropriate. If it deems appropriate, the Manager, at its discretion, may override a price supplied by a primary source by using a price provided by another source. The prices provided by primary pricing sources may differ from the value that would be realized if the securities were sold, and the differences could be material.
Certain securities held by the Fund and underlying funds are valued on the basis of prices provided by a single source. As of February 28, 2009, the total value of these securities represented 41.23% of the net assets. The single source prices provided may differ from the value that would be realized if the securities were sold, and the differences could be material. In addition, although alternative prices are available for other securities held by the Fund, those alternative sources would not necessarily confirm the security
12
GMO International Bond Fund
(A Series of GMO Trust)
Notes to Financial Statements — (Continued)
February 28, 2009
price used by the Fund. Therefore, the existence of those alternative sources does not necessarily provide greater certainty about the prices used by the Fund.
GMO Special Purpose Holding Fund ("SPHF"), an investment of the Fund, has litigation pending against various entities related to the default of certain asset-backed securities previously held by SPHF. The outcome of the lawsuits against the remaining defendants is not known and any potential recoveries are not reflected in the net asset value of SPHF. For the year ended February 28, 2009, the Fund received $84,846 through SPHF in connection with settlement agreements related to that litigation.
In September 2006, the Financial Accounting Standards Board ("FASB") issued Statement of Financial Accounting Standards No. 157, Fair Value Measurements ("SFAS 157"). SFAS 157 is effective for the Fund's current fiscal year. While the adoption of SFAS 157 does not have an effect on the Fund's net asset value, it does require additional disclosures about fair value measurements. SFAS 157 establishes a three-level hierarchy for disclosure of fair value measurements. The valuation hierarchy is based upon the reliability of inputs to the valuation of the Fund's investments. The three levels are defined as follows:
Level 1 – Valuations based on quoted prices for identical securities in active markets.
Level 2 – Valuations determined using other significant direct or indirect observable inputs.
Level 3 – Valuations based on inputs that are unobservable and significant. The Fund utilized the following fair value techniques on Level 3 investments: The Fund considered interest in certain bankrupt securities to be worthless.
The inputs or methodology used for valuing securities are not necessarily an indication of the risk associated with investing in those securities.
The following is a summary of the fair valuations according to inputs used as of February 28, 2009 in valuing the Fund's investments:
| Asset Valuation Inputs | Investments in Securities | Other Financial Instruments* | |||||||||
| Level 1 - Quoted Prices | $ | 6,547,297 | $ | 451,021 | |||||||
| Level 2 - Other Significant Observable Inputs | 210,734,686 | 1,492,026 | |||||||||
| Level 3 - Significant Unobservable Inputs | 27,350 | 123,788 | |||||||||
| Total | $ | 217,309,333 | $ | 2,066,835 | |||||||
* Other financial instruments include forward currency contracts, futures contracts and swap agreements.
13
GMO International Bond Fund
(A Series of GMO Trust)
Notes to Financial Statements — (Continued)
February 28, 2009
| Liability Valuation Inputs | Investments in Securities | Other Financial Instruments** | |||||||||
| Level 1 - Quoted Prices | $ | — | $ | (90,437 | ) | ||||||
| Level 2 - Other Significant Observable Inputs | — | (12,197,471 | ) | ||||||||
| Level 3 - Significant Unobservable Inputs | — | (154,293 | ) | ||||||||
| Total | $ | — | $ | (12,442,201 | ) | ||||||
** Other financial instruments include forward currency contracts, futures contracts and swap agreements.
For the underlying fund's summary of valuation inputs please refer to the respective fund's portfolio valuation note.
The following is a reconciliation of investments in which significant unobservable inputs (Level 3) were used in determining value:
| Investments in Securities | Other Financial Instruments*** | ||||||||||
| Balance as of February 29, 2008 | $ | 47,207 | $ | — | |||||||
| Accrued discounts/premiums | — | — | |||||||||
| Realized gain (loss) | — | — | |||||||||
| Realized gain distributions received | 64,805 | — | |||||||||
| Realized gain distributions paid | (84,846 | ) | — | ||||||||
| Change in unrealized appreciation/depreciation | 184 | (30,505 | ) | ||||||||
| Net purchases (sales) | — | — | |||||||||
| Net transfers in and/or out of Level 3 | — | — | |||||||||
| Balance as of February 28, 2009 | $ | 27,350 | $ | (30,505 | ) | ||||||
*** Other financial instruments include swap agreements.
Foreign currency translation
The market values of foreign securities, currency holdings and related assets and liabilities are translated to U.S. dollars based on the 4 p.m. New York time exchange rates each business day. Income and expenses denominated in foreign currencies are translated at the 4 p.m. New York time exchange rates on the business day the income and expenses are accrued or incurred. The Fund does not isolate realized and unrealized gains and losses attributable to changes in exchange rates from gains and losses that arise from changes in the market value of investments. Such fluctuations are included with net realized and unrealized gain or loss on investments. Net realized gains and losses on foreign currency transactions represent gains and losses on disposition of currencies and forward currency contracts, currency gains and losses realized between the trade and settlement dates on securities transactions, and the difference
14
GMO International Bond Fund
(A Series of GMO Trust)
Notes to Financial Statements — (Continued)
February 28, 2009
between the amount of investment income and foreign withholding taxes recorded on the Fund's accounting records and the U.S. dollar equivalent amounts actually received or paid.
Forward currency contracts
The Fund may enter into forward currency contracts including forward cross currency contracts. A forward currency contract is an agreement between two parties to buy and sell a currency at a set price on a future date. The market value of a forward currency contract fluctuates with changes in forward currency exchange rates. Forward currency contracts are marked to market daily using rates supplied by a quotation service and changes in value are recorded by the Fund as an unrealized gain or loss. Realized gains or losses equal to the difference between the value of the contract at the time it was opened and the value at the time it was closed are recorded upon delivery or receipt of the currency or, if a forward currency contract is offset by entering into another forward currency contract with the same broker, upon settlement of the net gain or loss. These contracts may involve market risk in excess of the unrealized gain or lo ss reflected in the Fund's Statement of Assets and Liabilities. They expose the Fund to the risk of unfavorable movements in currency values and the risk that the counterparty will be unable or unwilling to meet the terms of the contracts. Forward currency contracts outstanding at the end of the period are listed in the Fund's Schedule of Investments.
Futures contracts
The Fund may purchase and sell futures contracts. Upon entering into a futures contract, the Fund is required to deposit cash, U.S. government and agency obligations, or other liquid assets with the futures clearing broker in accordance with the initial margin requirements of the broker or exchange. In addition, the Fund maintains cash or securities in an amount that at least equals the net amount payable in the event the Fund must deliver the full amount of the contract. Futures contracts are marked to market daily and an appropriate payable or receivable for the change in value ("variation margin") is recorded by the Fund. The payable or receivable is settled on the following business day. Gains or losses are recognized but not considered realized until the contracts expire or are closed. Futures contracts involve, to varying degrees, risk of loss in excess of the variation margin disclosed in the Statement of Assets and Liabi lities. Under some circumstances, futures exchanges may establish daily limits on the amount that the price of a futures contract can vary from the previous day's settlement price, thereby effectively preventing liquidation of unfavorable positions. Losses may arise from changes in the value of the underlying instrument if the Fund is unable to liquidate a futures position due to an illiquid secondary market for the contract or the imposition of price limits, or if counterparties do not perform under the contract terms. Futures contracts are generally valued at the settlement price established each day by the board of trade or exchange on which they are traded. Futures contracts outstanding at the end of the period are listed in the Fund's Schedule of Investments.
Options
The Fund may write (i.e., sell) call and put options. Writing options alters the Fund's exposure to the underlying instrument by, in the case of a call option, obligating the Fund to sell the underlying instrument
15
GMO International Bond Fund
(A Series of GMO Trust)
Notes to Financial Statements — (Continued)
February 28, 2009
at a set price to the option-holder and, in the case of a put option, obligating the Fund to purchase the underlying instrument at a set price from the option-holder. In the case of an index option, settlement will be in cash. When the Fund writes a call or put option, an amount equal to the premium received is recorded as a liability and subsequently marked to market to reflect the current value of the option written. Premiums received from writing options that expire are treated as realized gains. Premiums received from writing options that are exercised or closed are deducted from the amounts paid on the underlying future, security or currency transaction to determine the realized gain or loss. The Fund as a writer of an option has no control over whether the underlying future, security or currency may be sold (call) or purchased (put) and as a result bears the market risk of an unfavorable change in the price of the future, security or currency underlying the option. In the event that the Fund writes uncovered put or call options (i.e. options for investments that the Fund does not own), it bears the risk of substantial losses if the price of the underlying instrument increases during the term of the option. Options expose the Fund to the risk the Fund may not be able to enter into a closing transaction because of an illiquid market. The Fund had no open written option contracts outstanding at the end of the period.
For the year ended February 28, 2009, the Fund's investment activity in options contracts written by the Fund was as follows:
| Puts | Calls | ||||||||||||||||||
| Principal of Contracts | Amount Premiums | Principal of Contracts | Amount Premiums | ||||||||||||||||
| Outstanding, beginning of year | $ | — | $ | — | — | $ | — | ||||||||||||
| Options written | — | — | JPY | 5,701,000,000 | 533,496 | ||||||||||||||
| Options exercised | — | — | JPY | (5,701,000,000 | ) | (533,496 | ) | ||||||||||||
| Options expired | — | — | — | — | |||||||||||||||
| Options sold | — | — | — | — | |||||||||||||||
| Outstanding, end of year | $ | — | $ | — | — | $ | — | ||||||||||||
The Fund may also purchase put and call options. Purchasing options alters the Fund's exposure to the underlying instrument by, in the case of a call option, entitling the Fund to purchase the underlying instrument at a set price from the writer of the option and, in the case of a put option, entitling the Fund to sell the underlying instrument at a set price to the writer of the option. The Fund pays a premium for a purchased option. That premium is disclosed in the Schedule of Investments and is subsequently marked to market to reflect the current value of the option. Premiums paid for purchasing options that expire are treated as realized losses. Premiums paid for purchasing options that are exercised or closed are deducted from the proceeds on the closing transaction to determine the realized gain or loss. The risk associated with purchasing put and call options is limited to the premium paid. The Fund had no purchased optio n contracts outstanding at the end of the period.
16
GMO International Bond Fund
(A Series of GMO Trust)
Notes to Financial Statements — (Continued)
February 28, 2009
The Fund values exchange traded options at the last sale price, or if no sale is reported, the last bid price for options it has purchased and the last ask price for options it has written. The Fund values options traded over-the-counter using inputs provided by primary pricing sources and industry standard models.
Indexed securities
The Fund may invest in indexed securities. Indexed securities are securities whose redemption values and/or coupons are linked to the prices of a specific instrument or financial statistic. The Fund uses indexed securities to increase or decrease its exposure to different underlying instruments and to gain exposure to markets in which investing through conventional securities is difficult. Indexed securities held by the Fund at the end of the period are listed in the Fund's Schedule of Investments.
Swap agreements
The Fund may enter into various types of swap agreements, including without limitation, interest rate, total return, credit default and variance swap agreements. A swap agreement is an agreement to exchange the return generated by one instrument for the return generated by another instrument. When entering into a swap agreement, the Fund and/or the swap counterparty may post or receive cash or securities as collateral. The party posting the collateral typically receives the interest associated with or payments related to the collateral and has the risk of loss related to the collateral.
Interest rate swap agreements involve an exchange by the parties of their respective commitments to pay or right to receive interest, e.g., an exchange of floating rate interest payments for fixed rate interest payments with respect to the notional amount of principal.
Total return swap agreements involve a commitment by one party to pay interest to the other party in exchange for a payment to it from the other party based on the return of a reference instrument (e.g., a security or basket of securities), both based on notional amounts. To the extent the return of the reference instrument exceeds or falls short of the interest payments, one party will receive a payment from or make a payment to the other party.
In a credit default swap agreement, one party makes payments to another party in exchange for the right to receive a specified return if a credit event occurs with respect to a referenced entity or entities. Buying credit default protection reduces the buyer's exposure in the event of an issuer's default (e.g., it reduces risk where a party owns a security issued by or otherwise has exposure to the issuer). Selling credit default protection subjects the seller to exposure to an issuer's default. A seller of credit default protection receives payments in return for its obligation to pay the principal amount of a debt security (or other agreed-upon value) to the other party upon the occurrence of a credit event (e.g., issuer default or similar event). If no credit event occurs, the seller has no payment obligations. For credit default swap agreements on asset-backed securities, a credit event may be triggered by such events as the issuer's failure to pay interest or principal, an agreement of the holders of an asset-backed security to a maturity extension, a rating downgrade on the security or a write-down on the collateral underlying the security. For credit
17
GMO International Bond Fund
(A Series of GMO Trust)
Notes to Financial Statements — (Continued)
February 28, 2009
default swap agreements on corporate or sovereign issuers, a credit event may be triggered by such events as the issuer's bankruptcy, failure to pay interest or principal, repudiation/moratorium or restructuring.
Variance swap agreements involve an agreement by two parties to exchange cash flows based on the measured variance (or square of volatility) of a specified underlying asset. One party agrees to exchange a "fixed rate" or strike price payment for the "floating rate" or realized price variance on the underlying asset with respect to the notional amount. At inception, the strike price chosen is generally fixed at a level such that the fair value of the swap is zero. At the expiration date, the amount paid by one party to the other is the difference between the realized price variance of the underlying asset and the strike price multiplied by the notional amount. A receiver of the realized price variance would receive a payment when the realized price variance of the underlying asset is greater than the strike price and would make a payment when that variance is less than the strike price. A payer of the realized price variance woul d make a payment when the realized price variance of the underlying asset is greater than the strike price and would receive a payment when that variance is less than the strike price. This type of agreement is essentially a forward contract on the future realized price variance of the underlying asset.
The Fund prices its swap agreements daily using models that may incorporate quotations from market makers and records the change in value, if any, as unrealized gain or loss in the Statement of Operations. Payments received or made on swap agreements are recorded as realized gain or loss in the Statement of Operations. Gains or losses are realized upon termination of the swap agreements.
Swap agreements often are not actively traded on financial markets. The values assigned to them may differ significantly from the values that would be realized upon termination, and the differences could be material. Entering into swap agreements involves credit, legal, market and documentation risk that is not reflected in the amounts reported in the Statement of Assets and Liabilities. Such risks include the possibility that the party with whom the Fund contracts may default on its obligations to perform or disagree as to the meaning of contractual terms, or that the collateral that party posts may be insufficient or not timely received by the Fund. Credit risk may be particularly acute in an environment where financial services firms are exposed to systemic risks of the type evidenced by the insolvency of Lehman Brothers and subsequent market disruptions. Swap agreements outstanding at the end of the period are listed in the Fund's Schedule of Investments.
Repurchase agreements
The Fund may enter into repurchase agreements. Under a repurchase agreement the Fund acquires a security for cash and obtains a simultaneous commitment from the seller to repurchase the security at an agreed upon price and date. The Fund, through its custodian, takes possession of securities collateralizing the repurchase agreement. The collateral is marked to market daily to ensure that the market value of the underlying assets is at least equal to the amount owed to the Fund in the event of default by the seller. If the seller of a repurchase agreement defaults or enters into insolvency proceedings and the value of the collateral declines, the Fund's recovery of cash may be delayed or limited. The Fund had no repurchase agreements outstanding at the end of the period.
18
GMO International Bond Fund
(A Series of GMO Trust)
Notes to Financial Statements — (Continued)
February 28, 2009
Reverse repurchase agreements
The Fund may enter into reverse repurchase agreements. Under a reverse repurchase agreement the Fund sells portfolio assets subject to an agreement by the Fund to repurchase the same assets at a later date at a fixed price. In connection with these agreements, the Fund establishes segregated accounts with its custodian in which the Fund maintains cash, U.S. government securities or other assets equal in value to its obligations under the reverse repurchase agreement into which it has entered. Reverse repurchase agreements expose the Fund to the risk that the market value of the securities the Fund has sold under the agreement may decline below the price at which the Fund is obligated to repurchase them under the agreement. If the buyer in a reverse repurchase agreement files for bankruptcy or becomes insolvent, the Fund's use of proceeds from the sale of its securities may be restricted while the other party or its trustee or re ceiver determines whether to honor the Fund's right to repurchase the securities. Furthermore, in that situation the Fund may be unable to recover the securities it sold and as a result would realize a loss equal to the difference between the value of the securities and the payment it received for them. This loss would be greater to the extent the buyer paid less than the value of the securities the Fund sold to it (e.g., a buyer may pay $95 for a bond with a market value of $100). The market value of the securities the Fund has sold is determined daily and any additional required collateral is allocated to or sent by the Fund on the next business day. The Fund had no reverse repurchase agreements outstanding at the end of the period.
Securities lending
The Fund may lend its securities to qualified brokers. The loans are collateralized with cash or liquid securities with a market value at least equal to the market value of the securities upon entering into the loan. As with other extensions of credit, the Fund may bear the risk of loss with respect to the investment of the collateral, the risk of delay in and/or inability to exercise its rights with respect to the collateral, and the risk of delay in recovery or loss of rights in the loaned securities should the borrower of the securities fail financially. If a loan is collateralized by U.S. government securities, the Fund receives a fee from the borrower. If a loan is collateralized by cash, the Fund typically invests the cash collateral for its own account. For the year from March 1, 2008 through February 28, 2009, the Fund did not participate in securities lending.
Taxes and distributions
The Fund intends to qualify each tax year as a regulated investment company under Subchapter M of the Internal Revenue Code of 1986, as amended (the "Code"). The Fund intends to distribute substantially all of its net investment income and all of its net realized short-term and long-term capital gain, if any, after giving effect to any available capital loss carryforwards for U.S. federal income tax purposes. Therefore, no provision for U.S. federal income or excise tax is necessary.
The Fund's policy is to declare and pay distributions from net investment income, if any, semiannually, and from net realized short-term and long-term capital gain, if any, at least annually. All distributions are paid in shares of the Fund, at net asset value, unless the shareholder elects to receive cash distributions. Distributions to shareholders are recorded by the Fund on the ex-dividend date.
19
GMO International Bond Fund
(A Series of GMO Trust)
Notes to Financial Statements — (Continued)
February 28, 2009
Income and capital gain distributions are determined in accordance with U.S. federal income tax regulations, which may differ from U.S. GAAP. Certain capital accounts in the financial statements are periodically adjusted for permanent differences in order to reflect their tax character. These adjustments have no impact on net assets or net asset value per share. Temporary differences that arise from recognizing certain items of income, expense, gain or loss in different periods for financial statement and tax purposes will reverse at some time in the future. Distributions in excess of net investment income or net realized gains are temporary over-distributions for financial statement purposes resulting from differences in the recognition or classification of income or distributions for financial statement and tax purposes.
U.S. GAAP and tax accounting differences primarily relate to capital loss carryforwards, derivative contract transactions, foreign currency transactions, partnership interest tax allocations, losses on wash sale transactions, post-October capital losses and differing treatment for security transactions.
The following reclassification represents the amount necessary to report the stated components of net assets on a tax basis, excluding certain temporary differences, as of February 28, 2009. The financial highlights exclude these adjustments.
| Accumulated Undistributed Net Investment Income | Accumulated Net Realized Loss | Paid-in Capital | |||||||||
| $ | 81,228,933 | $ | (10,706,310 | ) | $ | (70,522,623 | ) | ||||
The tax character of distributions declared to shareholders is as follows:
| 2/28/2009 | 2/29/2008 | ||||||||||
| Ordinary income (including any net short-term capital gain) | $ | 53,793,041 | $ | 48,502,819 | |||||||
| Total distributions | $ | 53,793,041 | $ | 48,502,819 | |||||||
Distributions in excess of tax basis earnings and profits, if significant, are reported in the financial statements as a return of capital for tax purposes.
As of February 28, 2009, the components of distributable earnings on a tax basis consisted of the following:
| Undistributed ordinary income (including any net short-term capital gain) | $ | 20,822,918 | |||||
As of February 28, 2009, the Fund elected to defer March 1, 2009 post-October capital losses of $8,848,476.
20
GMO International Bond Fund
(A Series of GMO Trust)
Notes to Financial Statements — (Continued)
February 28, 2009
As of February 28, 2009, the Fund had capital loss carryforwards available to offset future realized gains if any, to the extent permitted by the Code. Such losses expire as follows:
| 2/28/2015 | $ | (23,687,952 | ) | ||||
| 2/29/2016 | (507,910 | ) | |||||
| 2/28/2017 | (14,485,912 | ) | |||||
| Total | $ | (38,681,774 | ) | ||||
Utilization of the capital loss carryforwards, post-October capital losses and future losses, if any, realized subsequent to February 28, 2009 could be subject to limitations imposed by the Code related to share ownership activity.
As of February 28, 2009, the approximate cost for U.S. federal income tax purposes and gross and net unrealized appreciation (depreciation) in value of investments were as follows:
| Aggregate Cost | Gross Unrealized Appreciation | Gross Unrealized (Depreciation) | Net Unrealized Appreciation (Depreciation) | ||||||||||||
| $ | 283,882,887 | $ | 27,350 | $ | (66,600,904 | ) | $ | (66,573,554 | ) | ||||||
On October 12, 2006, the Fund paid a dividend under Code Section 860 of $0.09229 per share to shareholders of record as of October 11, 2006. It is anticipated the Fund will be required to make a payment, estimated to be, $830,768 to the Internal Revenue Service ("IRS") related to such dividend, which has been included in accrued expenses on the Statement of Assets and Liabilities. The Manager will make a reimbursement payment to the Fund concurrent with the Fund's payment to the IRS.
The Fund is subject to the provisions of Financial Accounting Standards Board Interpretation No. 48 ("FIN 48"), Accounting for Uncertainty in Income Taxes — an Interpretation of FASB Statement No. 109. FIN 48 sets forth a minimum threshold for financial statement recognition of a tax position taken or expected to be taken in a tax return that could affect the Fund's financial statements. The Fund did not have any unrecognized tax benefits or liabilities at February 28, 2009, nor did it have any increases or decreases in unrecognized tax benefits or liabilities for the period then ended. The Fund is subject to examination prior to the expiration of the statute of limitations by U.S. federal and state tax authorities for tax returns filed.
Security transactions and related investment income
Security transactions in the financial statements are accounted for on the trade date. Dividend income, net of applicable foreign withholding taxes, if any, is recorded on the ex-dividend date or, if later, when the Fund is informed of the ex-dividend date. Interest income is recorded on the accrual basis and is adjusted for the amortization of premiums and accretion of discounts. Principal on inflation indexed securities, is
21
GMO International Bond Fund
(A Series of GMO Trust)
Notes to Financial Statements — (Continued)
February 28, 2009
adjusted for inflation and any increase or decrease is recorded as interest income or loss. Income is not recognized on securities for which collection is not expected. Non-cash dividends, if any, are recorded at the fair market value of the asset received. In determining the net gain or loss on securities sold, the Fund uses the identified cost basis for the purposes of determining the cost basis.
Expenses
The majority of the expenses of the Trust are directly identifiable to an individual fund. Expenses that are not readily identifiable to a specific fund are allocated taking into consideration, among other things, the nature and type of expense and the relative size of the funds. In addition, the Fund incurs fees and expenses indirectly as a shareholder in the underlying funds. Because the underlying funds have different expense and fee levels and the Fund may own different proportions of the underlying funds at different times, the amount of fees and expenses indirectly incurred by the Fund will vary (See Note 3).
State Street Bank and Trust Company ("State Street") serves as custodian, fund accounting agent and transfer agent of the Fund. State Street's fees may be reduced by an earnings allowance calculated on the average daily cash balances the Fund maintains with State Street. The Fund receives the benefit of the earnings allowance. In addition, Goldman Sachs Agency Lending, the Fund's securities lending agent, has agreed to reimburse the Fund for certain transactional expenses related to securities lending activity. Credit balances or expense reimbursements used to reduce fees, if any, are reported as a reduction of expenses in the Statement of Operations.
Purchases and redemptions of Fund shares
Effective October 8, 2008, the Fund instituted a fee on cash redemptions of 0.97% of the amount redeemed. Effective October 21, 2008, the fee on cash redemptions was changed to 2.00% of the amount redeemed. As of February 28, 2009, the fee on cash redemptions was 2.00% of the amount redeemed. The Fund may impose a new purchase premium and/or redemption fee, or modify or eliminate an existing purchase premium and/or redemption fee, at any time. If the Manager determines that any portion of a cash redemption is offset by a corresponding cash purchase on the same day, the Fund will ordinarily waive or reduce the redemption fee with respect to that portion. In addition, the Fund may waive or reduce the redemption fee in extraordinary circumstances if the purchase or redemption will not cause the Fund to incur transaction costs. All redemption fees are paid to the Fund and recorded by the Fund as paid-in-capital. In-kind redemption t ransactions are generally not subject to redemption fees except when they include a cash component. However, when a substantial portion of a Fund is being redeemed, the Fund may charge a redemption fee based on estimated or known transaction costs resulting from those redemptions.
Investment risks
The Fund is subject to risks involved in investing in foreign securities that are not presented by investments in U.S. securities. These risks may involve adverse political and economic developments, including expropriation and the possible imposition of capital controls or other foreign governmental laws or restrictions. In addition, the securities of some foreign companies and securities markets are less liquid
22
GMO International Bond Fund
(A Series of GMO Trust)
Notes to Financial Statements — (Continued)
February 28, 2009
and at times may be more volatile than securities of comparable U.S. companies and U.S. securities markets. The risks described above apply to an even greater extent to investments in emerging markets. The securities markets of emerging countries are generally smaller, less developed, less liquid, and more volatile than the securities markets of the U.S. and developed foreign markets. Additionally, the investment risks associated with an investment in the underlying funds may be greater to the extent that the underlying funds engage in derivative transactions.
To manage the Fund's cash collateral needs in extraordinary market conditions, the Manager reserves the right to reduce or eliminate the Fund's derivative exposures, including those that are intended to cause the Fund to track its benchmark more closely. A reduction in those exposures without replacing them with benchmark securities will tend to cause the performance of the Fund to track its benchmark less closely and make the Fund's performance more dependent on the performance of the asset-backed securities it holds directly or indirectly.
To address in part the cash management issues described above, the Fund expects to honor nearly all redemptions of its shares in-kind for the foreseeable future. If redeeming shareholders from the Fund choose to sell assets received in-kind immediately and current adverse market conditions continue, they may experience difficulty selling the assets at favorable prices. To the extent that the Fund honors redemptions in cash, redeeming shareholders will bear the redemption fees described in the Purchases and Redemptions of Fund Shares note.
Among other trading agreements, the Fund is party to International Swaps and Derivatives Association, Inc. Master Agreements ("ISDA Agreements") with select counterparties that generally govern over-the-counter derivative transactions entered into by the Fund. The ISDA Master Agreements typically include standard representations and warranties as well as contractual terms related to collateral, events of default, termination events, and other standard provisions. Termination events may include the decline in the net assets of the Fund below a certain level over a specified period of time and may entitle a counterparty to elect to terminate early with respect to some or all the transactions under the ISDA Agreement with that counterparty. Such an election by one or more of the counterparties could have a material impact on the Fund's operations. Due to declines in the net assets of the Fund during the year ended February 28, 2009 , one or more counterparties may be entitled to terminate early but none has taken such action.
Recently issued accounting pronouncement
In March 2008, FASB issued Statement of Financial Accounting Standards No. 161, Disclosures about Derivative Instruments and Hedging Activities ("SFAS 161"). SFAS 161 is effective for fiscal years and interim periods beginning after November 15, 2008. SFAS 161 requires enhanced disclosures about the Fund's derivative and hedging activities. The Manager is currently evaluating the impact the adoption of SFAS 161 will have on the Fund's financial statement disclosures.
23
GMO International Bond Fund
(A Series of GMO Trust)
Notes to Financial Statements — (Continued)
February 28, 2009
3. Fees and other transactions with affiliates
GMO receives a management fee for the services it provides to the Fund. That fee is paid monthly at the annual rate of 0.25% of average daily net assets. The Fund has adopted a Shareholder Service Plan under which the Fund pays GMO a shareholder service fee for client and shareholder service, reporting, and other support. Pursuant to the Shareholder Service Plan, the shareholder service fee is calculated based on average daily net assets at the annual rate of 0.15% for Class III shares. The Manager will waive the Fund's shareholder service fee to the extent that the aggregate of any direct and indirect shareholder service fees borne by the Fund exceeds 0.15%; provided, however, that the amount of this waiver will not exceed 0.15%.
Through at least June 30, 2009, the Manager has contractually agreed to reimburse the Fund for Fund expenses incurred through that date to the extent the Fund's total annual operating expenses (excluding "Excluded Expenses", as defined below) exceed 0.25% of the Fund's average daily net assets. Excluded Expenses include shareholder service fees, expenses indirectly incurred by investment in the underlying funds, fees and expenses of the independent Trustees of the Trust, fees and expenses for legal services not approved by the Manager for the Trust, compensation and expenses of the Trust's Chief Compliance Officer ("CCO") (excluding any employee benefits), brokerage commissions, securities lending fees and expenses, interest expense, transfer taxes, and other investment-related costs (including expenses associated with investments in any company that is an investment company or would be an investment company under the 1940 Act, but for the exceptions to the definition of investment company provided in Section 3(c)(1) and 3(c)(7) of the 1940 Act), hedging transaction fees, extraordinary, non-recurring and certain other unusual expenses (including taxes). In addition, the Manager has contractually agreed to reimburse the Fund through at least June 30, 2009 to the extent that the sum of (a) the Fund's total annual operating expenses (excluding Excluded Expenses) and (b) the amount of fees and expenses incurred indirectly by the Fund through its investment in ECDF (excluding ECDF's Excluded Expenses), exceeds 0.25% of the Fund's average daily net assets, subject to a maximum total reimbursement to the Fund equal to 0.25% of the Fund's average daily net assets.
The Fund incurs fees and expenses indirectly as a shareholder in the underlying funds. For the year ended February 28, 2009, these indirect fees and expenses expressed as an annualized percentage of the Fund's average daily net assets were as follows:
| Indirect Net Expenses (excluding shareholder service fees and interest expense) | Indirect Shareholder Service Fees | Indirect Interest Expense | Total Indirect Expenses | ||||||||||||
| 0.018 | % | 0.005 | % | 0.007 | % | 0.030 | % | ||||||||
24
GMO International Bond Fund
(A Series of GMO Trust)
Notes to Financial Statements — (Continued)
February 28, 2009
The Fund's portion of the fees paid by the Trust to the Trust's independent Trustees and CCO during the year ended February 28, 2009 was $8,020 and $2,726, respectively. The compensation and expenses of the CCO are included in miscellaneous expenses in the Statement of Operations. The Fund paid no remuneration to any other officer of the Trust.
4. Purchases and sales of securities
For the year ended February 28, 2009, cost of purchases and proceeds from sales of investments, other than short-term obligations and class exchanges, were as follows:
| Purchases | Sales | ||||||||||
| U.S. Government securities | $ | 28,596,888 | $ | 19,045,988 | |||||||
| Investments (non-U.S. Government securities) | 144,198,263 | 352,310,355 | |||||||||
5. Guarantees
In the normal course of business the Fund enters into contracts with third-party service providers that contain a variety of representations and warranties and that provide general indemnifications. The Fund's maximum exposure under these arrangements is unknown, as it involves future claims that may be made against the Fund that have not yet occurred. Based on experience, management is of the view that the risk of loss in connection with its indemnification obligations is remote; however, there can be no assurance that such obligations will not result in material liabilities that adversely affect the Fund.
6. Principal shareholders and related parties
As of February 28, 2009, 60.24% of the outstanding shares of the Fund were held by three shareholders, each holding more than 10% of the Fund's outstanding shares. On that date, no other shareholder owned more than 10% of the outstanding shares of the Fund. Redemptions from (or investments into) the Fund by or on behalf of these large shareholders may have a material effect on the Fund.
As of February 28, 2009, 2.17% of the Fund's shares were held by senior management of the Manager and GMO Trust officers and 26.63% of the Fund's shares were held by accounts for which the Manager had investment discretion.
25
GMO International Bond Fund
(A Series of GMO Trust)
Notes to Financial Statements — (Continued)
February 28, 2009
7. Share transactions
The Declaration of Trust permits the Trust to issue an unlimited number of shares of beneficial interest (without par value). Transactions in Fund shares were as follows:
| Year Ended February 28, 2009 | Year Ended February 29, 2008 | ||||||||||||||||||
| Class III: | Shares | Amount | Shares | Amount | |||||||||||||||
| Shares sold | 251,099 | $ | 2,399,856 | 17,938,459 | $ | 170,818,174 | |||||||||||||
| Shares issued to shareholders in reinvestment of distributions | 6,462,644 | 51,930,698 | 5,136,298 | 46,494,576 | |||||||||||||||
| Shares repurchased | (26,487,403 | ) | (210,236,300 | ) | (15,192,711 | ) | (142,661,844 | ) | |||||||||||
| Redemption Fees | — | 550,622 | — | — | |||||||||||||||
| Net increase (decrease) | (19,773,660 | ) | $ | (155,355,124 | ) | 7,882,046 | $ | 74,650,906 | |||||||||||
8. Investments in affiliated issuers
A summary of the Fund's transactions in the shares of other funds of the Trust during the year ended February 28, 2009 is set forth below:
| Affiliate | Value, beginning of period | Purchases | Sales Proceeds | Dividend Income | Distributions of Realized Gains | Value, end of period | |||||||||||||||||||||
| GMO Emerging Country Debt Fund, Class III | $ | 15,711,607 | $ | 1,125,728 | $ | 4,800,000 | $ | 793,848 | $ | 331,880 | $ | 6,547,297 | |||||||||||||||
| GMO Short-Duration Collateral Fund | 362,492,061 | 98,652,165 | 280,879,778 | 8,855,830 | u | — | 121,140,551 | ||||||||||||||||||||
| GMO Special Purpose Holding Fund | 47,207 | — | — | — | 84,846 | 27,350 | |||||||||||||||||||||
| GMO World Opportunity Overlay Fund | 99,460,635 | 10,600,000 | 58,100,000 | — | — | 36,170,948 | |||||||||||||||||||||
| Totals | $ | 477,711,510 | $ | 110,377,893 | $ | 343,779,778 | $ | 9,649,678 | $ | 416,726 | $ | 163,886,146 | |||||||||||||||
u The Fund received total distributions in the amount of $24,564,273, of which $15,708,443 was a return of capital.
26
Report of Independent Registered Public Accounting Firm
To the Trustees of GMO Trust and the Shareholders of
GMO International Bond Fund:
In our opinion, the accompanying statement of assets and liabilities, including the schedule of investments, and the related statements of operations and of changes in net assets and the financial highlights present fairly, in all material respects, the financial position of GMO International Bond Fund (the "Fund") at February 28, 2009, the results of its operations for the year then ended, the changes in its net assets for each of the two years in the period then ended and the financial highlights for each of the five years in the period then ended, in conformity with accounting principles generally accepted in the United States of America. These financial statements and financial highlights (hereafter referred to as "financial statements") are the responsibility of the Fund's management. Our responsibility is to express an opinion on these financial statements based on our audits. We conducted our audits of these financial sta tements in accordance with the standards of the Public Company Accounting Oversight Board (United States). Those standards require that we plan and perform the audit to obtain reasonable assurance about whether the financial statements are free of material misstatement. An audit includes examining, on a test basis, evidence supporting the amounts and disclosures in the financial statements, assessing the accounting principles used and significant estimates made by management, and evaluating the overall financial statement presentation. We believe that our audits, which included confirmation of securities at February 28, 2009 by correspondence with the custodian and brokers, provide a reasonable basis for our opinion.
PricewaterhouseCoopers LLP
Boston, Massachusetts
April 29, 2009
27
GMO International Bond Fund
(A Series of GMO Trust)
Fund Expenses
February 28, 2009 (Unaudited)
Expense Examples: The following information is in relation to expenses for the six month period ended February 28, 2009.
As a shareholder of the Fund, you may incur two types of costs: (1) transaction costs, including redemption fees; and (2) ongoing costs, including management fees, shareholder service fees, and other Fund expenses. This example is intended to help you understand your ongoing costs (in dollars) of investing in the Fund and to compare these costs with the ongoing costs of investing in other mutual funds.
These examples are based on an investment of $1,000 invested at the beginning of the period and held for the entire period, September 1, 2008 through February 28, 2009.
Actual Expenses
The first line of the table below provides information about actual account values and actual expenses. You may use the information in this line, together with the amount you invested, to estimate the expenses that you paid over the period. Simply divide your account value by $1,000 (for example, a $10,000,000 account value divided by $1,000 = 10,000), then multiply the result by the number in the first line under the heading entitled "Net Expense Incurred" to estimate the expenses you paid on your account during this period.
Hypothetical Example for Comparison Purposes
The second line of the table below provides information about hypothetical account values and hypothetical expenses based on the Fund's actual expense ratio and an assumed rate of return of 5% per year before expenses, which is not the Fund's actual return. The hypothetical account values and expenses may not be used to estimate the actual ending account balance or expenses you paid for the period. You may use this information to compare the ongoing costs of investing in the Fund with other funds. To do so, compare this 5% hypothetical example with the 5% hypothetical examples that appear in the shareholder reports of other funds.
Please note that the expenses shown in the table are meant to highlight your ongoing costs only and do not reflect any transactional costs, such as purchase premiums and redemption fees. Therefore, the second line of the table is useful in comparing ongoing costs only, and will not help you determine the relative total costs of owning different funds. In addition, if these transactional costs were included, your costs would have been higher.
| Annualized Net Expense Ratio | Beginning Account Value | Ending Account Value | Net Expense Incurred* | ||||||||||||||||
| Class III | |||||||||||||||||||
| 1) Actual | 0.42 | % | $ | 1,000.00 | $ | 800.40 | $ | 1.87 | |||||||||||
| 2) Hypothetical | 0.42 | % | $ | 1,000.00 | $ | 1,022.71 | $ | 2.11 | |||||||||||
* Expenses are calculated using the Class's annualized expense ratio (including indirect expenses incurred) for the six months ended February 28, 2009, multiplied by the average account value over the period, multiplied by 0 days in the period, divided by 365 days in the year.
28
GMO International Bond Fund
(A Series of GMO Trust)
Tax Information for the Tax Year Ended February 28, 2009 (Unaudited)
The Fund will notify shareholders of amounts for use in preparing 2009 income tax forms in early 2010.
The Fund hereby designates as qualified interest income with respect to its taxable year ended February 28, 2009, $6,519,998 or if determined to be different, the qualified interest income of such year.
29
Trustees and Officers (Unaudited)
The following tables list the Trust's Trustees and Officers as of the date of this report; their address and date of birth ("DOB"); their position with the Trust; the length of time holding that position with the Trust; their principal occupation(s) during the past five years; the number of portfolios in the fund complex they oversee; and other directorships they hold in companies subject to registration or reporting requirements of the Securities Exchange Act of 1934 (generally called "public companies") or in registered investment companies. The Trust's Statement of Additional Information ("SAI") includes additional information about the Trust's trustees, including changes subsequent to the date of the report. The SAI is available, without charge, upon request by writing GMO, c/o GMO Trust, 40 Rowes Wharf, Boston, MA 02110.
Independent Trustees:
| Name, Address, and DOB | Position(s) Held with Trust | Term of Office1 and Length of Time Served | Principal Occupation(s) During Past Five Years | Number of Portfolios in Fund Complex Overseen by Trustee | Other Directorships Held by Trustee | ||||||||||||||||||
| Donald W. Glazer, Esq. c/o GMO Trust 40 Rowes Wharf Boston, MA 02110 DOB: 07/26/1944 | Chairman of the Board of Trustees | Chairman of the Board of Trustees since March 2005; Lead Independent Trustee (September 2004 – March 2005); Trustee since December 2000. | Consultant – Law and Business2; Author of Legal Treatises. | 59 | None. | ||||||||||||||||||
1 Each Trustee is elected to serve during the continued lifetime of the Trust until he/she dies, resigns or is removed, or if sooner, until the next meeting of Shareholders called for the purpose of electing Trustees and until the election and qualification of his/her successor.
2 As part of Mr. Glazer's work as a consultant, he provides part-time consulting services to Goodwin Procter LLP ("Goodwin"). Goodwin has provided legal services to Renewable Resources, LLC, an affiliate of GMO; GMO, in connection with its relationship with Renewable Resources; and funds managed by Renewable Resources. Mr. Glazer has represented that he has no financial interest in, and is not involved in the provision of, such legal services. In the calendar years ended December 31, 2007 and December 31, 2008, these entities paid $789,416 and $183,864 respectively, in legal fees and disbursements to Goodwin. In correspondence with the Staff of the Securities and Exchange Commission beginning in August 2006, the Independent Trustees' legal counsel provided the Staff with information regarding Mr. Glazer's relationship with Goodwin and h is other business activities. On September 11, 2007, based on information that had been given to the Staff as of that date, the Staff provided oral no-action assurance consistent with the opinion of the Independent Trustees' legal counsel that Mr. Glazer is not an "interested person" of the Trust.
30
Independent Trustees — (Continued)
| Name, Address, and DOB | Position(s) Held with Trust | Term of Office1 and Length of Time Served | Principal Occupation(s) During Past Five Years | Number of Portfolios in Fund Complex Overseen by Trustee | Other Directorships Held by Trustee | ||||||||||||||||||
| W. Nicholas Thorndike c/o GMO Trust 40 Rowes Wharf Boston, MA 02110 DOB: 03/28/1933 | Trustee | Since March 2005. | Director or trustee of various corporations and charitable organizations, including Courier Corporation (a book publisher and manufacturer) (July 1989 – present); Putnam Funds (December 1992 – June 2004); and Providence Journal (a newspaper publisher) (December 1986 – December 2003). | 59 | Director of Courier Corporation (a book publisher and manufacturer); Member of the Investment Committee of Partners HealthCare System, Inc.3 | ||||||||||||||||||
| Peter Tufano c/o GMO Trust 40 Rowes Wharf Boston, MA 02110 DOB: 04/22/1957 | Trustee | Since December 2008. | Sylvan C. Coleman Professor of Financial Management, Harvard Business School (since 1989). | 59 | Trustee of State Street Navigator Securities Lending Trust (3 Portfolios). | ||||||||||||||||||
1 Each Trustee is elected to serve during the continued lifetime of the Trust until he/she dies, resigns or is removed, or if sooner, until the next meeting of Shareholders called for the purpose of electing Trustees and until the election and qualification of his/her successor.
3 Partners HealthCare System, Inc. is a client of the Manager.
31
Principal Officers:
| Name, Address, and DOB | Position(s) Held with Trust | Term of Office4 and Length of Time Served | Principal Occupation(s) During Past Five Years5 | ||||||||||||
| J.B. Kittredge DOB: 08/22/1954 | President and Chief Executive Officer | Since March 2009. | General Counsel, Grantham, Mayo, Van Otterloo & Co. LLC (October 2005 – Present); Partner, Ropes & Gray LLP. | ||||||||||||
| Sheppard N. Burnett c/o GMO Trust 40 Rowes Wharf Boston, MA 02110 DOB: 10/24/1968 | Treasurer and Chief Financial Officer | Chief Financial Officer since March 2007; Treasurer since November 2006; Assistant Treasurer, September 2004 – November 2006. | Fund Administration Staff, Grantham, Mayo, Van Otterloo & Co. LLC (June 2004 – present); Vice President, Director of Tax, Columbia Management Group (2002 – 2004). | ||||||||||||
| Brent C. Arvidson c/o GMO Trust 40 Rowes Wharf Boston, MA 02110 DOB: 06/26/1969 | Assistant Treasurer | Since August 1998. | Senior Fund Administrator, Grantham, Mayo, Van Otterloo & Co. LLC. | ||||||||||||
| John L. Nasrah c/o GMO Trust 40 Rowes Wharf Boston, MA 02110 DOB: 05/27/1977 | Assistant Treasurer | Since March 2007. | Fund Administrator, Grantham, Mayo, Van Otterloo & Co. LLC (September 2004 – present); Tax Analyst, Bain & Company, Inc. (June 2003 – September 2004). | ||||||||||||
| Mahmoodur Rahman c/o GMO Trust 40 Rowes Wharf Boston, MA 02110 DOB: 11/30/1967 | Assistant Treasurer | Since September 2007. | Fund Administrator, Grantham, Mayo, Van Otterloo & Co. LLC (April 2007 – present); Vice President and Senior Tax Manager, Massachusetts Financial Services Company (January 2000 – April 2007). | ||||||||||||
| Michael E. Gillespie c/o GMO Trust 40 Rowes Wharf Boston, MA 02110 DOB: 02/18/1958 | Chief Compliance Officer | Since March 2005. | Vice President of Compliance (June 2004 – February 2005) and Director of Domestic Compliance (March 2002 – June 2004), Fidelity Investments. | ||||||||||||
4 Each officer is elected to hold such office until his or her successor is duly elected and qualified to carry out the duties and responsibilities of the office, or until he or she resigns or is removed from office.
5 Each of Messrs. Burnett, Arvidson, Bohan, and Pottle serves as an officer and/or director of certain pooled investment vehicles of which GMO or an affiliate of GMO serves as the investment adviser.
32
Principal Officers — (Continued)
| Name, Address, and DOB | Position(s) Held with Trust | Term of Office4 and Length of Time Served | Principal Occupation(s) During Past Five Years5 | ||||||||||||
| Jason B. Harrison c/o GMO Trust 40 Rowes Wharf Boston, MA 02110 DOB: 01/29/1977 | Vice President and Clerk | Vice President since November 2006; Clerk since March 2006. | Legal Counsel, Grantham, Mayo, Van Otterloo & Co. LLC (since February 2006) and Attorney, Ropes & Gray LLP (September 2002 – February 2006). | ||||||||||||
| David L. Bohan c/o GMO Trust 40 Rowes Wharf Boston, MA 02110 DOB: 06/21/1964 | Vice President and Assistant Clerk | Vice President since March 2005; Assistant Clerk since March 2006. | Legal Counsel, Grantham, Mayo, Van Otterloo & Co. LLC. | ||||||||||||
| Gregory L. Pottle c/o GMO Trust 40 Rowes Wharf Boston, MA 02110 DOB: 07/09/1971 | Vice President and Assistant Clerk | Since November 2006. | Legal Counsel, Grantham, Mayo, Van Otterloo & Co. LLC. | ||||||||||||
| Anne K. Trinque c/o GMO Trust 40 Rowes Wharf Boston, MA 02110 DOB: 04/15/1978 | Vice President and Assistant Clerk | Since September 2007. | Legal Counsel, Grantham, Mayo, Van Otterloo & Co. LLC (January 2007 – present); Attorney, Goodwin Procter LLP (September 2003 – January 2007). | ||||||||||||
| Cheryl Wakeham c/o GMO Trust 40 Rowes Wharf Boston, MA 02110 DOB: 10/29/1958 | Vice President and Anti-Money Laundering Officer | Since December 2004. | Manager, Client Service Administration, Grantham, Mayo, Van Otterloo & Co. LLC. | ||||||||||||
4 Each officer is elected to hold such office until his or her successor is duly elected and qualified to carry out the duties and responsibilities of the office, or until he or she resigns or is removed from office.
5 Each of Messrs. Burnett, Arvidson, Bohan, and Pottle serves as an officer and/or director of certain pooled investment vehicles of which GMO or an affiliate of GMO serves as the investment adviser.
33
GMO Benchmark-Free Allocation Fund
(A Series of GMO Trust)
Annual Report
February 28, 2009
For a free copy of the Fund's proxy voting guidelines, shareholders may call 1-617-346-7646 (collect) or visit the Securities and Exchange Commission's website at www.sec.gov. Information regarding how the Fund voted proxies relating to portfolio securities during the most recent 12-month period ended June 30 is available on GMO's website at www.gmo.com, or on the Securities and Exchange Commission's website at www.sec.gov.
The Fund files its complete schedule of portfolio holdings with the Securities and Exchange Commission for the first and third quarter of each fiscal year on Form N-Q, which is available on the Commission's website at www.sec.gov. The Fund's Form N-Q may be reviewed and copied at the Commission's Public Reference Room in Washington, D.C. Information on the operation of the Public Reference Room may be obtained by calling 1-800-SEC-0330. The Fund has a policy with respect to disclosure of portfolio holdings under which it may also make available on GMO's website at www.gmo.com a complete schedule of portfolio holdings.
This report is prepared for the general information of shareholders. It is authorized for distribution to prospective investors only when preceded or accompanied by a prospectus for the GMO Trust, which contains a complete discussion of the risks associated with an investment in this Fund and other important information. The GMO Trust prospectus can be obtained at www.gmo.com.
GMO Benchmark-Free Allocation Fund
(A Series of GMO Trust)
Portfolio Management
Day-to-day management of the Fund's portfolio is the responsibility of the Asset Allocation team at Grantham, Mayo, Van Otterloo & Co. LLC.
Management Discussion and Analysis of Fund Performance
The GMO Benchmark-Free Allocation Fund returned -15.1% for the fiscal year ended February 28, 2009, as compared to +0.2% for the CPI Index. During the fiscal year the Fund was exposed to a range of asset classes through direct investment and indirectly through its investment in underlying GMO mutual funds. The Fund received fixed income securities from certain underlying GMO mutual funds during the year via an in-kind transaction.
Implementation was negative, detracting 0.2%, as several of the underlying GMO mutual funds underperformed their respective benchmarks. The GMO Strategic Fixed Income Fund was the primary driver of the underperformance.
Asset allocation detracted 14.7%. The Fund's weightings in equities and exposure to fixed income drove the underperformance.
The views expressed herein are exclusively those of Grantham, Mayo, Van Otterloo & Co. LLC Management as of the date of this report and are subject to change. GMO disclaims any responsibility to update such views. They are not meant as investment advice. References to specific securities are not recommendations of such securities and may not be representative of any GMO portfolio's current or future investments.

Performance data quoted represents past performance and is not indicative of future results. The investment return and principal value of an investment will fluctuate so that an investor's shares, when redeemed, may be worth more or less than their original cost. Current performance data may be lower or higher than the performance data provided herein. To obtain performance information to the most recent month-end, visit www.gmo.com. Performance shown is net of all fees after reimbursement from the Manager. Each performance figure assumes a purchase at the beginning and redemption at the end of the stated period and reflects a transaction fee of .10% on the purchase and 2.00% on the redemption. Transaction fees are retained by the Fund to cover trading costs. Returns would have been lower had certain expenses not been reimbursed during the periods shown and do not include the effect of taxes on distributions and redemptions. All information is unaudited.
GMO Benchmark-Free Allocation Fund
(A Series of GMO Trust)
Investments Concentration Summary
February 28, 2009 (Unaudited)
| Asset Class Summary* | % of Total Net Assets | ||||||
| Common Stocks | 56.9 | % | |||||
| Cash and Cash Equivalents | 24.8 | ||||||
| Debt Obligations | 24.5 | ||||||
| Short-Term Investments | 13.7 | ||||||
| Preferred Stocks | 0.5 | ||||||
| Options Purchased | 0.5 | ||||||
| Investment Funds | 0.2 | ||||||
| Forward Currency Contracts | 0.1 | ||||||
| Loan Participations | 0.1 | ||||||
| Loan Assignments | 0.0 | ||||||
| Private Equity Securities | 0.0 | ||||||
| Rights and Warrants | 0.0 | ||||||
| Convertible Securities | 0.0 | ||||||
| Promissory Notes | 0.0 | ||||||
| Reverse Repurchase Agreements | (0.0 | ) | |||||
| Written Options | (0.2 | ) | |||||
| Futures | (11.1 | ) | |||||
| Swaps | (12.2 | ) | |||||
| Other | 2.2 | ||||||
| 100.0 | % | ||||||
* The table above incorporates aggregate indirect asset class exposure associated with investments in other funds of GMO Trust ("underlying funds").
1
GMO Benchmark-Free Allocation Fund
(A Series of GMO Trust)
Investments Concentration Summary — (Continued)
February 28, 2009 (Unaudited)
| Country / Region Summary** | % of Investments | ||||||
| United States | 92.0 | % | |||||
| Japan | 2.1 | ||||||
| Brazil | 1.3 | ||||||
| Korea | 1.0 | ||||||
| Taiwan | 0.8 | ||||||
| China | 0.6 | ||||||
| Sweden | 0.6 | ||||||
| South Africa | 0.5 | ||||||
| Russia | 0.4 | ||||||
| Turkey | 0.4 | ||||||
| Philippines | 0.3 | ||||||
| Thailand | 0.3 | ||||||
| Argentina | 0.1 | ||||||
| Canada | 0.1 | ||||||
| Colombia | 0.1 | ||||||
| Egypt | 0.1 | ||||||
| India | 0.1 | ||||||
| Indonesia | 0.1 | ||||||
| Israel | 0.1 | ||||||
| Ivory Coast | 0.1 | ||||||
| Malaysia | 0.1 | ||||||
| Mexico | 0.1 | ||||||
| Poland | 0.1 | ||||||
| Switzerland | 0.1 | ||||||
| Uruguay | 0.1 | ||||||
| Venezuela | 0.1 | ||||||
| Singapore | (0.1 | ) | |||||
| Hong Kong | (0.4 | ) | |||||
| United Kingdom | (0.5 | ) | |||||
| Euro Region*** | (0.7 | ) | |||||
| 100.0 | % | ||||||
** The table above incorporates aggregate indirect country exposure associated with investments in the underlying funds except for GMO Alpha Only Fund. The table excludes short-term investments. The table includes exposure through the use of derivative contracts.
*** The "Euro Region" is comprised of Austria, Belgium, Finland, France, Germany, Greece, Ireland, Italy, Netherlands, Portugal and Spain.
2
GMO Benchmark-Free Allocation Fund
(A Series of GMO Trust)
Schedule of Investments
(showing percentage of total net assets)
February 28, 2009
| Par Value ($) | Description | Value ($) | |||||||||||||
| DEBT OBLIGATIONS — 3.9% | |||||||||||||||
| Asset-Backed Securities — 3.9% | |||||||||||||||
| Auto Financing — 0.6% | |||||||||||||||
| 800,000 | BMW Vehicle Lease Trust, Series 07-1, Class A3B, 1 mo. LIBOR + .24%, 0.70%, due 08/15/13 | 770,576 | |||||||||||||
| 100,000 | Capital Auto Receivable Asset Trust, Series 07-SN1, Class A4, 1 mo. LIBOR + .10%, 0.56%, due 02/15/11 | 77,270 | |||||||||||||
| 700,000 | Capital Auto Receivable Asset Trust, Series 08-1, Class A4B, 1 mo. LIBOR + 1.35%, 1.81%, due 07/15/14 | 536,375 | |||||||||||||
| 500,000 | Daimler Chrysler Auto Trust, Series 08-B, Class A4B, 1 mo. LIBOR + 1.85%, 2.30%, due 11/10/14 | 394,000 | |||||||||||||
| 300,000 | Daimler Chrysler Auto Trust, Series 08-B, Class A4A, 5.32%, due 11/10/14 | 210,600 | |||||||||||||
| 500,000 | Daimler Chrysler Master Owner Trust, Series 06-A, Class A, 1 mo. LIBOR + .03%, 0.49%, due 11/15/11 | 325,000 | |||||||||||||
| 1,400,000 | Ford Credit Auto Owner Trust, Series 08-B, Class A4B, 1 mo. LIBOR + 2.00%, 2.46%, due 03/15/13 | 1,129,982 | |||||||||||||
| 1,300,000 | Ford Credit Floorplan Master Owner Trust, Series 06-4, Class A, 1 mo. LIBOR + .25%, 0.71%, due 06/15/13 | 780,000 | |||||||||||||
| 600,000 | Nissan Auto Lease Trust, Series 08-A, Class A3B, 1 mo. LIBOR + 2.20%, 2.66%, due 07/15/11 | 552,188 | |||||||||||||
| 600,000 | Nissan Auto Receivables Owner Trust, Series 07-A, Class A4, 1 mo. LIBOR, 0.46%, due 06/17/13 | 569,112 | |||||||||||||
| 600,000 | Nissan Master Owner Trust Receivables, Series 07-A, Class A, 1 mo. LIBOR, 0.46%, due 05/15/12 | 486,000 | |||||||||||||
| 667,703 | Sovereign Dealer Floor Plan Master Trust, Series 06-1, Class A, 144A, 1 mo. LIBOR + .05%, 0.51%, due 08/15/11 | 600,933 | |||||||||||||
| 1,100,000 | Swift Master Auto Receivables Trust, Series 07-1, Class A, 1 mo. LIBOR + .10%, 0.56%, due 06/15/12 | 737,000 | |||||||||||||
| 1,200,000 | Truck Retail Installment Paper Corp., Series 05-1A, Class A, 144A, 1 mo. LIBOR + .27%, 0.73%, due 12/15/16 | 840,000 | |||||||||||||
| Total Auto Financing | 8,009,036 | ||||||||||||||
| Bank Loan Collateralized Debt Obligations — 0.1% | |||||||||||||||
| 1,840,000 | Omega Capital Europe Plc, Series GLOB-5A, Class A1, 144A, 3 mo. LIBOR + .25%, 1.68%, due 07/05/11 | 1,630,350 | |||||||||||||
See accompanying notes to the financial statements.
3
GMO Benchmark-Free Allocation Fund
(A Series of GMO Trust)
Schedule of Investments — (Continued)
(showing percentage of total net assets)
February 28, 2009
| Par Value ($) | Description | Value ($) | |||||||||||||
| Business Loans — 0.3% | |||||||||||||||
| 549,873 | Bayview Commercial Asset Trust, Series 04-3, Class A1, 144A, 1 mo. LIBOR + .37%, 0.84%, due 01/25/35 | 383,041 | |||||||||||||
| 534,006 | GE Business Loan Trust, Series 04-1, Class A, 144A, 1 mo. LIBOR + .29%, 0.75%, due 05/15/32 | 380,629 | |||||||||||||
| 1,600,000 | GE Dealer Floorplan Master Trust, Series 07-2, Class A, 1 mo. LIBOR + .01%, 0.48%, due 07/20/12 | 1,148,153 | |||||||||||||
| 1,458,843 | Lehman Brothers Small Balance Commercial, Series 05-2A, Class 1A, 144A, 1 mo. LIBOR + .25%, 0.72%, due 09/25/30 | 700,245 | |||||||||||||
| 700,000 | Navistar Financial Dealer Note Master Trust, Series 05-1, Class A, 1 mo. LIBOR + .11%, 0.58%, due 02/25/13 | 600,530 | |||||||||||||
| 600,000 | Textron Financial Floorplan Master Note, Series 07-AA, Class A, 144A, 1 mo. LIBOR + .06%, 0.51%, due 03/13/12 | 492,900 | |||||||||||||
| Total Business Loans | 3,705,498 | ||||||||||||||
| CMBS — 0.3% | |||||||||||||||
| 700,000 | Commercial Mortgage Pass-Through Certificates, Series 06-FL12, Class AJ, 144A, 1 mo. LIBOR + .13%, 0.59%, due 12/15/20 | 517,230 | |||||||||||||
| 800,000 | GE Capital Commercial Mortgage Corp., Series 05-C4, Class A2, 5.31%, due 11/10/45 | 734,014 | |||||||||||||
| 178,376 | Greenwich Capital Commercial Funding Corp., Series 06-FL4A, Class A1, 144A, 1 mo. LIBOR + .09%, 0.54%, due 11/05/21 | 147,941 | |||||||||||||
| 822,268 | GS Mortgage Securities Corp., Series 07-EOP, Class A1, 144A, 1 mo. LIBOR + .09%, 0.54%, due 03/06/20 | 649,839 | |||||||||||||
| 1,100,000 | J.P. Morgan Chase Commercial Mortgage Securities Corp., Series 06-LDP7, Class A2, 5.86%, due 04/15/45 | 968,264 | |||||||||||||
| 500,000 | Merrill Lynch Mortgage Trust, Series 06-C1, Class A2, 5.61%, due 05/12/39 | 435,781 | |||||||||||||
| 140,111 | Morgan Stanley Dean Witter Capital I, Series 03-TOP9, Class A1, 3.98%, due 11/13/36 | 134,991 | |||||||||||||
| 531,911 | Wachovia Bank Commercial Mortgage Trust, Series 06-WL7A, Class A1, 144A, 1 mo. LIBOR + .09%, 0.55%, due 09/15/21 | 372,337 | |||||||||||||
| Total CMBS | 3,960,397 | ||||||||||||||
| CMBS Collateralized Debt Obligations — 0.1% | |||||||||||||||
| 1,600,000 | American Capital Strategies Ltd. Commercial Real Estate CDO Trust, Series 07-1A, Class A, 144A, 3 mo. LIBOR + .80%, 2.05%, due 11/23/52 | 128,000 | |||||||||||||
| 1,724,065 | Crest Exeter Street Solar, Series 04-1A, Class A1, 144A, 3 mo. LIBOR + .35%, 1.82%, due 06/28/19 | 1,241,327 | |||||||||||||
| Total CMBS Collateralized Debt Obligations | 1,369,327 | ||||||||||||||
See accompanying notes to the financial statements.
4
GMO Benchmark-Free Allocation Fund
(A Series of GMO Trust)
Schedule of Investments — (Continued)
(showing percentage of total net assets)
February 28, 2009
| Par Value ($) | Description | Value ($) | |||||||||||||
| Credit Cards — 0.7% | |||||||||||||||
| 1,400,000 | American Express Credit Account Master Trust, Series 05-5, Class A, 1 mo. LIBOR + .04%, 0.50%, due 02/15/13 | 1,330,336 | |||||||||||||
| 1,900,000 | Capital One Multi-Asset Execution Trust, Series 04-A7, Class A7, 3 mo. LIBOR + .15%, 1.38%, due 06/16/14 | 1,709,618 | |||||||||||||
| 700,000 | Charming Shoppes Master Trust, Series 07-1A, Class A1, 144A, 1 mo. LIBOR + 1.25%, 1.71%, due 09/15/17 | 481,663 | |||||||||||||
| 800,000 | Citibank OMNI Master Trust, Series 07-A9A, Class A9, 144A, 1 mo. LIBOR + 1.10%, 1.57%, due 12/23/13 | 722,640 | |||||||||||||
| 1,600,000 | Discover Card Master Trust I, Series 96-4, Class A, 1 mo. LIBOR + .38%, 0.83%, due 10/16/13 | 1,435,200 | |||||||||||||
| 1,200,000 | GE Capital Credit Card Master Note Trust, Series 05-1, Class A, 1 mo. LIBOR + .04%, 0.50%, due 03/15/13 | 1,110,576 | |||||||||||||
| 1,100,000 | Household Credit Card Master Note Trust I, Series 07-1, Class A, 1 mo. LIBOR + .05%, 0.51%, due 04/15/13 | 941,188 | |||||||||||||
| 200,000 | MBNA Credit Card Master Note Trust, Series 04-A8, Class A8, 1 mo. LIBOR + .15%, 0.61%, due 01/15/14 | 183,058 | |||||||||||||
| 800,000 | National City Credit Card Master Trust, Series 08-3, Class A, 1 mo. LIBOR + 1.80%, 2.26%, due 05/15/13 | 628,000 | |||||||||||||
| 1,300,000 | World Financial Network Credit Card Master Trust, Series 06-A, Class A, 144A, 1 mo. LIBOR + .13%, 0.59%, due 02/15/17 | 922,454 | |||||||||||||
| Total Credit Cards | 9,464,733 | ||||||||||||||
| Equipment Leases — 0.1% | |||||||||||||||
| 800,000 | CNH Equipment Trust, Series 08-A, Class A4B, 1 mo. LIBOR + 1.95%, 2.41%, due 08/15/14 | 716,000 | |||||||||||||
| 1,000,000 | GE Equipment Midticket LLC, Series 07-1, Class A3B, 1 mo. LIBOR + .25%, 0.71%, due 06/14/11 | 895,000 | |||||||||||||
| Total Equipment Leases | 1,611,000 | ||||||||||||||
| Insurance Premiums — 0.1% | |||||||||||||||
| 800,000 | AICCO Premium Finance Master Trust, Series 07-AA, Class A, 144A, 1 mo. LIBOR + .05%, 0.51%, due 12/15/11 | 765,760 | |||||||||||||
| Insured Auto Financing — 0.3% | |||||||||||||||
| 130,733 | AmeriCredit Automobile Receivables Trust, Series 05-BM, Class A4, MBIA, 1 mo. LIBOR + .08%, 0.53%, due 05/06/12 | 120,258 | |||||||||||||
See accompanying notes to the financial statements.
5
GMO Benchmark-Free Allocation Fund
(A Series of GMO Trust)
Schedule of Investments — (Continued)
(showing percentage of total net assets)
February 28, 2009
| Par Value ($) | Description | Value ($) | |||||||||||||
| Insured Auto Financing — continued | |||||||||||||||
| 1,400,000 | AmeriCredit Automobile Receivables Trust, Series 07-AX, Class A4, XL, 1 mo. LIBOR + .04%, 0.49%, due 10/06/13 | 938,420 | |||||||||||||
| 800,000 | AmeriCredit Prime Automobile Receivable Trust, Series 07-2M, Class A4B, MBIA, 1 mo. LIBOR + .50%, 0.95%, due 03/08/16 | 422,728 | |||||||||||||
| 200,000 | ARG Funding Corp., Series 05-2A, Class A3, 144A, AMBAC, 1 mo. LIBOR + .14%, 0.61%, due 05/20/10 | 191,328 | |||||||||||||
| 800,000 | Capital One Auto Finance Trust, Series 06-B, Class A4, MBIA, 1 mo. LIBOR + .02%, 0.47%, due 07/15/13 | 638,008 | |||||||||||||
| 953,066 | Capital One Auto Finance Trust, Series 07-C, Class A3B, FGIC, 1 mo. LIBOR + .51%, 0.97%, due 04/16/12 | 887,086 | |||||||||||||
| 1,100,000 | Santander Drive Auto Receivables Trust, Series 07-3, Class A4B, FGIC, 1 mo. LIBOR + .65%, 1.11%, due 10/15/14 | 749,133 | |||||||||||||
| 1,100,000 | Triad Auto Receivables Owner Trust, Series 07-B, Class A4B, FSA, 1 mo. LIBOR + 1.20%, 1.65%, due 07/14/14 | 776,490 | |||||||||||||
| Total Insured Auto Financing | 4,723,451 | ||||||||||||||
| Insured Credit Cards — 0.1% | |||||||||||||||
| 1,200,000 | Cabela's Master Credit Card Trust, Series 04-2A, Class A, 144A, AMBAC, 1 mo. LIBOR + .12%, 0.58%, due 03/15/11 | 1,198,425 | |||||||||||||
| Insured Other — 0.1% | |||||||||||||||
| 1,000,000 | Dominos Pizza Master Issuer LLC, Series 07-1, Class A2, 144A, MBIA, 5.26%, due 04/25/37 | 500,000 | |||||||||||||
| 860,283 | Henderson Receivables LLC, Series 06-4A, Class A1, 144A, MBIA, 1 mo. LIBOR + .20%, 0.66%, due 12/15/41 | 548,060 | |||||||||||||
| 2,500,000 | Toll Road Investment Part II, Series C, 144A, MBIA, Zero Coupon, due 02/15/37 | 256,325 | |||||||||||||
| Total Insured Other | 1,304,385 | ||||||||||||||
| Insured Residential Asset-Backed Securities (United States) — 0.0% | |||||||||||||||
| 530,624 | Residential Asset Mortgage Products, Inc., Series 05-RS9, Class AI3, FGIC, 1 mo. LIBOR + .22%, 0.69%, due 11/25/35 | 122,574 | |||||||||||||
See accompanying notes to the financial statements.
6
GMO Benchmark-Free Allocation Fund
(A Series of GMO Trust)
Schedule of Investments — (Continued)
(showing percentage of total net assets)
February 28, 2009
| Par Value ($) | Description | Value ($) | |||||||||||||
| Insured Residential Mortgage-Backed Securities (United States) — 0.0% | |||||||||||||||
| 233,461 | Chevy Chase Mortgage Funding Corp., Series 04-1A, Class A2, 144A, AMBAC, 1 mo. LIBOR + .33%, 0.80%, due 01/25/35 | 95,720 | |||||||||||||
| 116,677 | GreenPoint Home Equity Loan Trust, Series 04-4, Class A, AMBAC, 1 mo. LIBOR + .28%, 1.02%, due 08/15/30 | 51,290 | |||||||||||||
| 368,667 | Wachovia Asset Securitization, Inc., Series 04-HE1, Class A, MBIA, 1 mo. LIBOR + .22%, 0.69%, due 06/25/34 | 143,975 | |||||||||||||
| Total Insured Residential Mortgage-Backed Securities (United States) | 290,985 | ||||||||||||||
| Insured Time Share — 0.0% | |||||||||||||||
| 37,232 | Cendant Timeshare Receivables Funding LLC, Series 04-1A, Class A2, 144A, MBIA, 1 mo. LIBOR + .18%, 0.65%, due 05/20/16 | 30,020 | |||||||||||||
| 201,924 | Cendant Timeshare Receivables Funding LLC, Series 05-1A, Class A2, 144A, FGIC, 1 mo. LIBOR + .18%, 0.65%, due 05/20/17 | 145,322 | |||||||||||||
| Total Insured Time Share | 175,342 | ||||||||||||||
| Investment Grade Corporate Collateralized Debt Obligations — 0.1% | |||||||||||||||
| 1,600,000 | Morgan Stanley ACES SPC, Series 04-15, Class II, 144A, 3 mo. LIBOR + .65%, 2.18%, due 12/20/09 | 885,600 | |||||||||||||
| 1,000,000 | Morgan Stanley ACES SPC, Series 05-10, Class A1, 144A, 3 mo. LIBOR + .52%, 2.05%, due 03/20/10 | 388,000 | |||||||||||||
| 1,400,000 | Salisbury International Investments Ltd., 3 mo. LIBOR + .42%, 1.95%, due 06/22/10 | 339,920 | |||||||||||||
| Total Investment Grade Corporate Collateralized Debt Obligations | 1,613,520 | ||||||||||||||
| Residential Asset-Backed Securities (United States) — 0.6% | |||||||||||||||
| 29,142 | ACE Securities Corp., Series 06-ASL1, Class A, 1 mo. LIBOR + .14%, 0.61%, due 02/25/36 | 4,659 | |||||||||||||
| 1,074,698 | ACE Securities Corp., Series 07-WM1, Class A2A, 1 mo. LIBOR + .07%, 0.54%, due 11/25/36 | 561,863 | |||||||||||||
| 600,000 | Argent Securities, Inc., Series 06-M1, Class A2C, 1 mo. LIBOR + .15%, 0.62%, due 07/25/36 | 151,125 | |||||||||||||
| 1,200,000 | Asset Backed Funding Certificates, Series 06-OPT2, Class A3C, 1 mo. LIBOR + .15%, 0.62%, due 10/25/36 | 565,440 | |||||||||||||
| 122,119 | Asset Backed Funding Certificates, Series 06-OPT3, Class A3A, 1 mo. LIBOR + .06%, 0.53%, due 11/25/36 | 112,899 | |||||||||||||
See accompanying notes to the financial statements.
7
GMO Benchmark-Free Allocation Fund
(A Series of GMO Trust)
Schedule of Investments — (Continued)
(showing percentage of total net assets)
February 28, 2009
| Par Value ($) | Description | Value ($) | |||||||||||||
| Residential Asset-Backed Securities (United States) — continued | |||||||||||||||
| 597,419 | Bayview Financial Acquisition Trust, Series 04-B, Class A2, 144A, 1 mo. LIBOR + .65%, 1.80%, due 05/28/39 | 398,717 | |||||||||||||
| 938,802 | Bayview Financial Acquisition Trust, Series 04-B, Class A1, 144A, 1 mo. LIBOR + .50%, 1.50%, due 05/28/39 | 626,181 | |||||||||||||
| 560,302 | Carrington Mortgage Loan Trust, Series 07-FRE1, Class A1, 1 mo. LIBOR + .12%, 0.59%, due 02/25/37 | 467,852 | |||||||||||||
| 1,200,000 | Centex Home Equity, Series 06-A, Class AV3, 1 mo. LIBOR + .16%, 0.63%, due 06/25/36 | 816,240 | |||||||||||||
| 723,260 | Countrywide Asset-Backed Certificates, Series 06-BC5, Class 2A1, 1 mo. LIBOR + .08%, 0.55%, due 03/25/37 | 663,230 | |||||||||||||
| 117,977 | Equity One ABS, Inc., Series 04-1, Class AV2, 1 mo. LIBOR + .30%, 0.77%, due 04/25/34 | 21,015 | |||||||||||||
| 800,000 | First Franklin Mortgage Loan Asset Backed Certificates, Series 06-FF5, Class 2A3, 1 mo. LIBOR + .16%, 0.63%, due 04/25/36 | 317,000 | |||||||||||||
| 509,895 | Fremont Home Loan Trust, Series 06-B, Class 2A2, 1 mo. LIBOR + .10%, 0.57%, due 08/25/36 | 451,894 | |||||||||||||
| 888,990 | Household Home Equity Loan Trust, Series 05-3, Class A2, 1 mo. LIBOR + .29%, 0.76%, due 01/20/35 | 552,424 | |||||||||||||
| 600,000 | Master Asset-Backed Securities Trust, Series 06-FRE2, Class A4, 1 mo. LIBOR + .15%, 0.62%, due 03/25/36 | 240,000 | |||||||||||||
| 2,400,000 | Master Asset-Backed Securities Trust, Series 06-HE3, Class A3, 1 mo. LIBOR + .15%, 0.62%, due 08/25/36 | 600,000 | |||||||||||||
| 841,175 | Master Second Lien Trust, Series 06-1, Class A, 1 mo. LIBOR + .16%, 0.63%, due 03/25/36 | 92,529 | |||||||||||||
| 403,935 | Merrill Lynch Mortgage Investors, Series 07-HE2, Class A2A, 1 mo. LIBOR + .12%, 0.59%, due 02/25/37 | 316,142 | |||||||||||||
| 1,150,778 | Morgan Stanley Home Equity Loans, Series 07-2, Class A1, 1 mo. LIBOR + .10%, 0.57%, due 04/25/37 | 909,115 | |||||||||||||
| 1,154,263 | Residential Asset Securities Corp., Series 05-KS12, Class A2, 1 mo. LIBOR + .25%, 0.72%, due 01/25/36 | 895,131 | |||||||||||||
| Total Residential Asset-Backed Securities (United States) | 8,763,456 | ||||||||||||||
| Residential Mortgage-Backed Securities (Australian) — 0.1% | |||||||||||||||
| 720,387 | Interstar Millennium Trust, Series 03-3G, Class A2, 3 mo. LIBOR + .25%, 1.72%, due 09/27/35 | 575,359 | |||||||||||||
| 320,304 | Interstar Millennium Trust, Series 05-1G, Class A, 3 mo. LIBOR + .12%, 2.31%, due 12/08/36 | 246,637 | |||||||||||||
See accompanying notes to the financial statements.
8
GMO Benchmark-Free Allocation Fund
(A Series of GMO Trust)
Schedule of Investments — (Continued)
(showing percentage of total net assets)
February 28, 2009
| Par Value ($) | Description | Value ($) | |||||||||||||
| Residential Mortgage-Backed Securities (Australian) — continued | |||||||||||||||
| 826,209 | Medallion Trust, Series 06-1G, Class A1, 3 mo. LIBOR + .05%, 2.05%, due 06/14/37 | 674,962 | |||||||||||||
| 398,166 | Superannuation Members Home Loans Global Fund, Series 8, Class A1, 3 mo. LIBOR + .07%, 1.42%, due 01/12/37 | 328,360 | |||||||||||||
| Total Residential Mortgage-Backed Securities (Australian) | 1,825,318 | ||||||||||||||
| Residential Mortgage-Backed Securities (European) — 0.2% | |||||||||||||||
| 700,000 | Aire Valley Mortgages, Series 06-1A, Class 1A, 144A, 3 mo. LIBOR + .11%, 1.64%, due 09/20/66 | 636,160 | |||||||||||||
| 700,000 | Brunel Residential Mortgages, Series 07-1A, Class A4C, 144A, 3 mo. LIBOR + .10%, 1.36%, due 01/13/39 | 565,110 | |||||||||||||
| 279,369 | Granite Master Issuer Plc, Series 06-2, Class A4, 1 mo. LIBOR + .04%, 0.51%, due 12/20/54 | 173,209 | |||||||||||||
| 41,720 | Paragon Mortgages Plc, Series 7A, Class A1A, 144A, 3 mo. LIBOR + .21%, 1.45%, due 05/15/34 | 38,533 | |||||||||||||
| 572,565 | Paragon Mortgages Plc, Series 14A, Class A2C, 144A, 3 mo. LIBOR + .10%, 2.10%, due 09/15/39 | 499,609 | |||||||||||||
| 800,000 | Pendeford Master Issuer Plc, Series 07-1A, Class 3A, 144A, 3 mo. LIBOR + .10%, 1.32%, due 02/12/16 | 699,200 | |||||||||||||
| 350,000 | Permanent Financing Plc, Series 4, Class 3A, 3 mo. LIBOR + .14%, 2.33%, due 03/10/24 | 349,359 | |||||||||||||
| Total Residential Mortgage-Backed Securities (European) | 2,961,180 | ||||||||||||||
| Residential Mortgage-Backed Securities (United States) — 0.0% | |||||||||||||||
| 129,500 | Chevy Chase Mortgage Funding Corp., Series 04-3A, Class A2, 144A, 1 mo. LIBOR + .30%, 0.77%, due 08/25/35 | 53,095 | |||||||||||||
| Student Loans — 0.1% | |||||||||||||||
| 1,500,000 | College Loan Corp. Trust, Series 06-1, Class A2, 3 mo. LIBOR + .02%, 1.18%, due 04/25/22 | 1,464,450 | |||||||||||||
| Time Share — 0.0% | |||||||||||||||
| 287,940 | Sierra Receivables Funding Co., Series 08-1A, Class A2, 144A, 1 mo. LIBOR + 4.00%, 4.47%, due 02/20/20 | 244,479 | |||||||||||||
| Total Asset-Backed Securities | 55,256,761 | ||||||||||||||
See accompanying notes to the financial statements.
9
GMO Benchmark-Free Allocation Fund
(A Series of GMO Trust)
Schedule of Investments — (Continued)
(showing percentage of total net assets)
February 28, 2009
| Par Value ($) / Shares | Description | Value ($) | |||||||||||||
| U.S. Government Agency — 0.0% | |||||||||||||||
| 66,850 | Agency for International Development Floater (Support of C.A.B.E.I), 6 mo. U.S. Treasury Bill + .40%, 0.90%, due 10/01/12 (a) | 64,515 | |||||||||||||
| 201,584 | Agency for International Development Floater (Support of Honduras), 3 mo. U.S. Treasury Bill x 117%, 0.07%, due 10/01/11 (a) | 194,851 | |||||||||||||
| 200,000 | Agency for International Development Floater (Support of Zimbabwe), 3 mo. U.S. Treasury Bill x 115%, 1.00%, due 01/01/12 (a) | 191,978 | |||||||||||||
| Total U.S. Government Agency | 451,344 | ||||||||||||||
| TOTAL DEBT OBLIGATIONS (COST $60,280,576) | 55,708,105 | ||||||||||||||
| MUTUAL FUNDS — 95.1% | |||||||||||||||
| Affiliated Issuers — 95.1% | |||||||||||||||
| 75,355,860 | GMO Alpha Only Fund, Class IV | 434,803,314 | |||||||||||||
| 746,276 | GMO Alternative Asset Opportunity Fund | 16,373,298 | |||||||||||||
| 3,603,614 | GMO Emerging Country Debt Fund, Class IV | 21,081,143 | |||||||||||||
| 10,333,178 | GMO Emerging Markets Fund, Class VI | 64,789,027 | |||||||||||||
| 3,031,314 | GMO Flexible Equities Fund, Class VI | 46,651,926 | |||||||||||||
| 10,171,588 | GMO International Small Companies Fund, Class III | 42,720,670 | |||||||||||||
| 1,769,722 | GMO Special Situations Fund, Class VI | 45,145,613 | |||||||||||||
| 15,899,118 | GMO Strategic Fixed Income Fund, Class VI | 275,849,692 | |||||||||||||
| 28,330,407 | GMO U.S. Quality Equity Fund, Class VI | 401,725,164 | |||||||||||||
| 935,677 | GMO World Opportunity Overlay Fund | 17,169,667 | |||||||||||||
| TOTAL MUTUAL FUNDS (COST $1,865,631,447) | 1,366,309,514 | ||||||||||||||
See accompanying notes to the financial statements.
10
GMO Benchmark-Free Allocation Fund
(A Series of GMO Trust)
Schedule of Investments — (Continued)
(showing percentage of total net assets)
February 28, 2009
| Shares | Description | Value ($) | |||||||||||||
| SHORT-TERM INVESTMENTS — 1.0% | |||||||||||||||
| Money Market Funds — 1.0% | |||||||||||||||
| 14,873,128 | State Street Institutional U.S. Government Money Market Fund-Institutional Class | 14,873,128 | |||||||||||||
| TOTAL SHORT-TERM INVESTMENTS (COST $14,873,128) | 14,873,128 | ||||||||||||||
| TOTAL INVESTMENTS — 100.0% (Cost $1,940,785,151) | 1,436,890,747 | ||||||||||||||
| Other Assets and Liabilities (net) — 0.00% | 60,003 | ||||||||||||||
| TOTAL NET ASSETS — 100.0% | $ | 1,436,950,750 | |||||||||||||
Notes to Schedule of Investments:
144A - Securities exempt from registration under Rule 144A of the Securities Act of 1933. These securities may be resold in transactions exempt from registration, normally to qualified institutional investors.
ACES - Aerolineas Centrales de Colombia
AMBAC - Insured as to the payment of principal and interest by AMBAC Assurance Corporation.
C.A.B.E.I. - Central American Bank of Economic Integration
CDO - Collateralized Debt Obligation
CMBS - Collateralized Mortgage Backed Security
FGIC - Insured as to the payment of principal and interest by Financial Guaranty Insurance Corporation.
FSA - Insured as to the payment of principal and interest by Financial Security Assurance.
LIBOR - London Interbank Offered Rate
MBIA - Insured as to the payment of principal and interest by MBIA Insurance Corp.
XL - Insured as to the payment of principal and interest by XL Capital Assurance.
The rates shown on variable rate notes are the current interest rates at February 28, 2009, which are subject to change based on the terms of the security.
(a) Security valued at fair value using methods determined in good faith by or at the direction of the Trustees of GMO Trust (Note 2).
See accompanying notes to the financial statements.
11
GMO Benchmark-Free Allocation Fund
(A Series of GMO Trust)
Statement of Assets and Liabilities — February 28, 2009
| Assets: | |||||||
| Investments in unaffiliated issuers, at value (cost $75,153,704) (Note 2) | $ | 70,581,233 | |||||
| Investments in affiliated issuers, at value (cost $1,865,631,447) (Notes 2 and 8) | 1,366,309,514 | ||||||
| Receivable for investments sold | 35,149 | ||||||
| Receivable for Fund shares sold | 10,759,373 | ||||||
| Interest receivable | 87,479 | ||||||
| Receivable for expenses reimbursed by Manager (Note 3) | 9,772 | ||||||
| Miscellaneous receivable | 10,770 | ||||||
| Total assets | 1,447,793,290 | ||||||
| Liabilities: | |||||||
| Payable for investments purchased | 10,771,958 | ||||||
| Payable to affiliate for (Note 3): | |||||||
| Trustees and Chief Compliance Officer of GMO Trust fees | 4,743 | ||||||
| Accrued expenses | 65,839 | ||||||
| Total liabilities | 10,842,540 | ||||||
| Net assets | $ | 1,436,950,750 | |||||
| Net assets consist of: | |||||||
| Paid-in capital | $ | 1,945,874,201 | |||||
| Distributions in excess of net investment income | (13,947,767 | ) | |||||
| Accumulated net realized gain | 8,918,720 | ||||||
| Net unrealized depreciation | (503,894,404 | ) | |||||
| $ | 1,436,950,750 | ||||||
| Net assets attributable to: | |||||||
| Class III shares | $ | 1,436,950,750 | |||||
| Shares outstanding: | |||||||
| Class III | 82,048,049 | ||||||
| Net asset value per share: | |||||||
| Class III | $ | 17.51 | |||||
See accompanying notes to the financial statements.
12
GMO Benchmark-Free Allocation Fund
(A Series of GMO Trust)
Statement of Operations — Year Ended February 28, 2009
| Investment Income: | |||||||
| Dividends from affiliated issuers (Note 8) | $ | 216,163,148 | |||||
| Interest | 1,657,025 | ||||||
| Total investment income | 217,820,173 | ||||||
| Expenses: | |||||||
| Custodian, fund accounting agent and transfer agent fees | 49,153 | ||||||
| Audit and tax fees | 31,829 | ||||||
| Legal fees | 38,948 | ||||||
| Chief Compliance Officer (Note 3) | 11,194 | ||||||
| Trustees fees and related expenses (Note 3) | 26,698 | ||||||
| Registration fees | 4,669 | ||||||
| Miscellaneous | 7,248 | ||||||
| Total expenses | 169,739 | ||||||
| Fees and expenses reimbursed by Manager (Note 3) | (131,847 | ) | |||||
| Expense reductions (Note 2) | (64 | ) | |||||
| Net expenses | 37,828 | ||||||
| Net investment income (loss) | 217,782,345 | ||||||
| Realized and unrealized gain (loss): | |||||||
| Net realized gain (loss) on: | |||||||
| Investments in unaffiliated issuers | (292,903 | ) | |||||
| Investments in affiliated issuers | (86,021,943 | ) | |||||
| Realized gains distributions from affiliated issuers (Note 8) | 119,483,196 | ||||||
| Net realized gain (loss) | 33,168,350 | ||||||
| Change in net unrealized appreciation (depreciation) on: | |||||||
| Investments in unaffiliated issuers | (4,572,471 | ) | |||||
| Investments in affiliated issuers | (494,607,766 | ) | |||||
| Net unrealized gain (loss) | (499,180,237 | ) | |||||
| Net realized and unrealized gain (loss) | (466,011,887 | ) | |||||
| Net increase (decrease) in net assets resulting from operations | $ | (248,229,542 | ) | ||||
See accompanying notes to the financial statements.
13
GMO Benchmark-Free Allocation Fund
(A Series of GMO Trust)
Statement of Changes in Net Assets
| Year Ended February 28, 2009 | Year Ended February 29, 2008 | ||||||||||
| Increase (decrease) in net assets: | |||||||||||
| Operations: | |||||||||||
| Net investment income (loss) | $ | 217,782,345 | $ | 62,933,065 | |||||||
| Net realized gain (loss) | 33,168,350 | 145,547,623 | |||||||||
| Change in net unrealized appreciation (depreciation) | (499,180,237 | ) | (101,039,835 | ) | |||||||
| Net increase (decrease) in net assets from operations | (248,229,542 | ) | 107,440,853 | ||||||||
| Distributions to shareholders from: | |||||||||||
| Net investment income | |||||||||||
| Class III | (249,189,711 | ) | (64,024,461 | ) | |||||||
| Net realized gains | |||||||||||
| Class III | (37,083,602 | ) | (155,574,713 | ) | |||||||
| (286,273,313 | ) | (219,599,174 | ) | ||||||||
| Net share transactions (Note 7): | |||||||||||
| Class III | 361,232,562 | 425,678,284 | |||||||||
| Purchase premiums and redemption fees (Notes 2 and 7): | |||||||||||
| Class III | 154,811 | 149,820 | |||||||||
| Total increase (decrease) in net assets resulting from net share transactions, purchase premiums and redemption fees | 361,387,373 | 425,828,104 | |||||||||
| Total increase (decrease) in net assets | (173,115,482 | ) | 313,669,783 | ||||||||
| Net assets: | |||||||||||
| Beginning of period | 1,610,066,232 | 1,296,396,449 | |||||||||
| End of period (including distributions in excess of net investment income of $13,947,767 and accumulated undistributed net investment income of $5,684,233, respectively) | $ | 1,436,950,750 | $ | 1,610,066,232 | |||||||
See accompanying notes to the financial statements.
14
GMO Benchmark-Free Allocation Fund
(A Series of GMO Trust)
Financial Highlights
(For a Class III share outstanding throughout each period)
| Year Ended February 28/29, | |||||||||||||||||||||||
| 2009 | 2008 | 2007 | 2006 | 2005 | |||||||||||||||||||
| Net asset value, beginning of period | $ | 25.30 | $ | 26.92 | $ | 27.76 | $ | 26.50 | $ | 24.28 | |||||||||||||
| Income (loss) from investment operations: | |||||||||||||||||||||||
| Net investment income (loss)(a)† | 3.21 | 1.19 | 0.80 | 1.26 | 0.98 | ||||||||||||||||||
| Net realized and unrealized gain (loss) | (6.72 | ) | 1.18 | 1.63 | 2.93 | 3.00 | |||||||||||||||||
| Total from investment operations | (3.51 | ) | 2.37 | 2.43 | 4.19 | 3.98 | |||||||||||||||||
| Less distributions to shareholders: | |||||||||||||||||||||||
| From net investment income | (3.71 | ) | (1.12 | ) | (1.16 | ) | (1.51 | ) | (0.99 | ) | |||||||||||||
| From net realized gains | (0.57 | ) | (2.87 | ) | (2.11 | ) | (1.42 | ) | (0.77 | ) | |||||||||||||
| Total distributions | (4.28 | ) | (3.99 | ) | (3.27 | ) | (2.93 | ) | (1.76 | ) | |||||||||||||
| Net asset value, end of period | $ | 17.51 | $ | 25.30 | $ | 26.92 | $ | 27.76 | $ | 26.50 | |||||||||||||
| Total Return(b) | (15.11 | )% | 8.60 | % | 9.31 | % | 16.50 | % | 16.74 | % | |||||||||||||
| Ratios/Supplemental Data: | |||||||||||||||||||||||
| Net assets, end of period (000's) | $ | 1,436,951 | $ | 1,610,066 | $ | 1,296,396 | $ | 1,207,625 | $ | 1,068,099 | |||||||||||||
| Net expenses to average daily net assets(c)(d) | 0.00 | %(e) | 0.00 | %(e) | 0.00 | % | 0.00 | % | 0.00 | % | |||||||||||||
| Net investment income to average daily net assets(a) | 14.05 | % | 4.30 | % | 2.94 | % | 4.64 | % | 3.92 | % | |||||||||||||
| Portfolio turnover rate | 40 | % | 57 | % | 45 | % | 47 | % | 50 | % | |||||||||||||
| Fees and expenses reimbursed and/or waived by the Manager to average daily net assets: | 0.01 | % | 0.01 | % | 0.01 | % | 0.01 | % | 0.02 | % | |||||||||||||
| Purchase premiums and redemption fees consisted of the following per share amounts:† | $ | 0.00 | (f) | $ | 0.00 | (f) | $ | 0.00 | (f) | $ | 0.00 | (f) | $ | 0.07 | |||||||||
(a) Net investment income is affected by the timing of the declaration of dividends by the underlying funds in which the Fund invests.
(b) The total returns would have been lower had certain expenses not been reimbursed and/or waived during the periods shown and assumes the effect of reinvested distributions. Calculation excludes purchase premiums and redemption fees which are borne by the shareholder.
(c) Net expenses exclude expenses incurred indirectly through investment in the underlying funds (See Note 3).
(d) Net expenses to average daily net assets were less than 0.01%.
(e) The net expense ratio does not include the effect of expense reductions.
(f) Purchase premiums and redemption fees were less than $0.01 per share.
† Calculated using average shares outstanding throughout the period.
See accompanying notes to the financial statements.
15
GMO Benchmark-Free Allocation Fund
(A Series of GMO Trust)
Notes to Financial Statements
February 28, 2009
1. Organization
GMO Benchmark-Free Allocation Fund (the "Fund") is a series of GMO Trust (the "Trust"). The Fund is registered under the Investment Company Act of 1940, as amended, as an open-end, non-diversified management investment company. The Fund is advised and managed by Grantham, Mayo, Van Otterloo & Co. LLC (the "Manager" or "GMO"). The Trust was established as a Massachusetts business trust under the laws of The Commonwealth of Massachusetts on June 24, 1985. The Declaration of Trust permits the Trustees of the Trust ("Trustees") to create an unlimited number of series of shares ("Funds") and to subdivide Funds into classes.
The Fund seeks a positive total return. The Fund does not seek to control risk relative to a particular securities market index or benchmark. In addition, the Fund does not seek to outperform a particular securities market index or blend of market indices (i.e., the Fund seeks positive return, not "relative" return). The Fund is a fund of funds and invests primarily in shares of other GMO Funds ("underlying funds"), which may include the GMO International Equity Funds (including one or more of the GMO Emerging Markets Funds), the GMO U.S. Equity Funds, the GMO Fixed Income Funds, GMO Alpha Only Fund, GMO Alternative Asset Opportunity Fund, GMO Flexible Equities Fund, GMO Short-Duration Collateral Fund, GMO Special Situations Fund, and GMO World Opportunity Overlay Fund. In addition, the Fund may hold securities (particularly asset-backed securities) directly or through one or more subsidiaries or other entities. The Fund is not restricted in its exposure to any particular asset class, and at times may be substantially invested in underlying funds that primarily invest in a single asset class (e.g., Fixed Income Funds). In addition, the Fund is not restricted in its exposure to any particular market. While the Fund generally will have exposure to both emerging countries and developed countries, including the U.S., at times, it may have substantial exposure to a particular country or type of country (e.g., emerging countries).
The financial statements of the underlying funds should be read in conjunction with the Fund's financial statements. These financial statements are available, without charge, upon request by calling (617) 346-7646 (collect). Shares of GMO Alternative Asset Opportunity Fund, GMO Flexible Equities Fund, GMO Short-Duration Collateral Fund, GMO Special Situations Fund, and GMO World Opportunity Overlay Fund are not publicly available for direct purchase.
The Fund directly and indirectly (through underlying funds) invests in securities with contractual cash flows, such as collateralized mortgage obligations and commercial mortgage-backed securities, including securities backed by sub-prime mortgage loans, credit card receivables and auto loan receivables. The value, liquidity and related income of these securities are sensitive to changes in economic conditions, including real estate values, delinquencies and/or defaults, and may be adversely affected by changes in interest rates and shifts in the market's perception of the securities' market values.
The Fund currently limits subscriptions due to capacity considerations.
16
GMO Benchmark-Free Allocation Fund
(A Series of GMO Trust)
Notes to Financial Statements — (Continued)
February 28, 2009
2. Significant accounting policies
The following is a summary of significant accounting policies followed by the Fund in the preparation of its financial statements. These policies are in conformity with accounting principles generally accepted in the United States of America ("U.S. GAAP") and have been consistently followed by the Fund in preparing its financial statements. The preparation of financial statements in accordance with U.S. GAAP requires management to make estimates and assumptions that affect the reported amounts and disclosures in the financial statements. Actual results could differ from those estimates. The accounting records of the Fund are maintained in U.S. dollars.
Portfolio valuation
Shares of the underlying funds and other mutual funds are generally valued at their net asset value.
Investments held by the underlying funds are valued as follows. Securities listed on a securities exchange for which market quotations are readily available are valued at the last sale price or official closing price on each business day, or if there is no such reported sale or official closing price, at the most recent quoted bid price. Unlisted securities for which market quotations are readily available are generally valued at the most recent quoted bid price. Debt instruments with a remaining maturity of sixty days or less are generally valued at amortized cost, which approximates fair value. Securities for which quotations are not readily available or whose values the Manager has determined to be unreliable are valued at fair value as determined in good faith by the Trustees or persons acting at their direction pursuant to procedures approved by the Trustees. By its nature, a fair value price is a good faith estimate of the value of a security at a given point in time and may not reflect the value that would be realized if the security were sold. The difference between a fair value price and the value realized upon a sale could be material. Because many foreign equity securities markets and exchanges close prior to the close of the New York Stock Exchange ("NYSE"), closing prices for foreign securities in those markets or on those exchanges do not reflect the events that occur after that close but before the close of the NYSE. As a result, the Fund generally values foreign equity securities using fair value prices, which are based on adjustments to closing prices supplied by a third party vendor based on that vendor's proprietary models. As of February 28, 2009, 18.09% of the net assets of the Fund, through investments in the underlying funds, were valued using fair value prices based on models used by a third party vendor.
Typically the Fund and the underlying funds value debt instruments based on prices supplied by a primary pricing source chosen by the Manager. The Manager evaluates primary pricing sources on an ongoing basis and may change a pricing source should the Manager deem it appropriate. If it deems appropriate, the Manager, at its discretion, may override a price supplied by a primary source by using a price provided by another source. The prices provided by primary pricing sources may differ from the value that would be realized if the securities were sold, and the differences could be material.
17
GMO Benchmark-Free Allocation Fund
(A Series of GMO Trust)
Notes to Financial Statements — (Continued)
February 28, 2009
Certain securities held by the Fund and underlying funds are valued on the basis of prices provided by a single source. As of February 28, 2009, the total value of these securities represented 7.35% of the net assets. The single source prices provided may differ from the value that would be realized if the securities were sold, and the differences could be material. In addition, although alternative prices are available for other securities held by the Fund, those alternative sources would not necessarily confirm the security price used by the Fund. Therefore, the existence of those alternative sources does not necessarily provide greater certainty about the prices used by the Fund.
In September 2006, the Financial Accounting Standards Board ("FASB") issued Statement of Financial Accounting Standards No. 157, Fair Value Measurements ("SFAS 157"). SFAS 157 is effective for the Fund's current fiscal year. While the adoption of SFAS 157 does not have an effect on the Fund's net asset value, it does require additional disclosures about fair value measurements. SFAS 157 establishes a three-level hierarchy for disclosure of fair value measurements. The valuation hierarchy is based upon the reliability of inputs to the valuation of the Fund's investments. The three levels are defined as follows:
Level 1 – Valuations based on quoted prices for identical securities in active markets.
Level 2 – Valuations determined using other significant direct or indirect observable inputs.
Level 3 – Valuations based on inputs that are unobservable and significant. The Fund utilized the following fair value techniques on Level 3 investments: The Fund valued debt securities using indicative bids received from primary pricing sources.
The inputs or methodology used for valuing securities are not necessarily an indication of the risk associated with investing in those securities.
The following is a summary of the fair valuations according to inputs used as of February 28, 2009 in valuing the Fund's investments:
| Asset Valuation Inputs | Investments in Securities | Other Financial Instruments | |||||||||
| Level 1 - Quoted Prices | $ | 1,240,969,010 | $ | — | |||||||
| Level 2 - Other Significant Observable Inputs | 140,213,632 | — | |||||||||
| Level 3 - Significant Unobservable Inputs | 55,708,105 | — | |||||||||
| Total | $ | 1,436,890,747 | $ | — | |||||||
| Liability Valuation Inputs | Investments in Securities | Other Financial Instruments | |||||||||
| Level 1 - Quoted Prices | $ | — | $ | — | |||||||
| Level 2 - Other Significant Observable Inputs | — | — | |||||||||
| Level 3 - Significant Unobservable Inputs | — | — | |||||||||
| Total | $ | — | $ | — | |||||||
18
GMO Benchmark-Free Allocation Fund
(A Series of GMO Trust)
Notes to Financial Statements — (Continued)
February 28, 2009
For the underlying fund's summary of valuation inputs please refer to the respective fund's portfolio valuation note.
The following is a reconciliation of investments in which significant unobservable inputs (Level 3) were used in determining value:
| Investments in Securities | Other Financial Instruments | ||||||||||
| Balance as of February 29, 2008 | $ | — | $ | — | |||||||
| Accrued discounts/premiums | 653,375 | — | |||||||||
| Realized gain (loss) | 551,395 | — | |||||||||
| Change in unrealized appreciation/depreciation | (4,586,861 | ) | — | ||||||||
| Net purchases (sales) | 59,090,196 | — | |||||||||
| Net transfers in and/or out of Level 3 | — | — | |||||||||
| Balance as of February 28, 2009 | $ | 55,708,105 | $ | — | |||||||
Repurchase agreements
The Fund may enter into repurchase agreements. Under a repurchase agreement the Fund acquires a security for cash and obtains a simultaneous commitment from the seller to repurchase the security at an agreed upon price and date. The Fund, through its custodian, takes possession of securities collateralizing the repurchase agreement. The collateral is marked to market daily to ensure that the market value of the underlying assets is at least equal to the amount owed to the Fund in the event of default by the seller. If the seller of a repurchase agreement defaults or enters into insolvency proceedings and the value of the collateral declines, the Fund's recovery of cash may be delayed or limited. The Fund had no repurchase agreements outstanding at the end of the period.
Taxes and distributions
The Fund intends to qualify each tax year as a regulated investment company under Subchapter M of the Internal Revenue Code of 1986, as amended (the "Code"). The Fund intends to distribute substantially all of its net investment income and all of its net realized short-term and long-term capital gain, if any, after giving effect to any available capital loss carryforwards for U.S. federal income tax purposes. Therefore, no provision for U.S. federal income or excise tax is necessary.
The Fund's policy is to declare and pay distributions from net investment income, if any, semiannually, and from net realized short-term and long-term capital gain, if any, at least annually. All distributions are paid in shares of the Fund, at net asset value, unless the shareholder elects to receive cash distributions. Distributions to shareholders are recorded by the Fund on the ex-dividend date.
19
GMO Benchmark-Free Allocation Fund
(A Series of GMO Trust)
Notes to Financial Statements — (Continued)
February 28, 2009
Income and capital gain distributions are determined in accordance with U.S. federal income tax regulations, which may differ from U.S. GAAP. Certain capital accounts in the financial statements are periodically adjusted for permanent differences in order to reflect their tax character. These adjustments have no impact on net assets or net asset value per share. Temporary differences that arise from recognizing certain items of income, expense, gain or loss in different periods for financial statement and tax purposes will reverse at some time in the future. Distributions in excess of net investment income or net realized gains are temporary over-distributions for financial statement purposes resulting from differences in the recognition or classification of income or distributions for financial statement and tax purposes.
U.S. GAAP and tax accounting differences primarily relate to differing treatment of mutual fund distributions received, partnership interest tax allocations, losses on wash sale transactions, amortization and accretion of debt securities, and redemption-in-kind transactions.
The following reclassification represents the amount necessary to report the stated components of net assets on a tax basis, excluding certain temporary differences, as of February 28, 2009. The financial highlights exclude these adjustments.
| Distributions In Excess of Net Investment Income | Accumulated Net Realized Gain | Paid-in Capital | |||||||||
| $ | 11,775,366 | $ | (11,031,123 | ) | $ | (744,243 | ) | ||||
The tax character of distributions declared to shareholders is as follows:
| 2/28/2009 | 2/29/2008 | ||||||||||
| Ordinary income (including any net short-term capital gain) | $ | 249,189,711 | $ | 64,214,608 | |||||||
| Net long-term capital gain | 37,083,602 | 155,384,566 | |||||||||
| Total distributions | $ | 286,273,313 | $ | 219,599,174 | |||||||
Distributions in excess of tax basis earnings and profits, if significant, are reported in the financial statements as a return of capital for tax purposes.
As of February 28, 2009, the components of distributable earnings on a tax basis consisted of the following:
| Undistributed ordinary income (including any net short-term capital gain) | $ | 11,604,457 | |||||
| Undistributed net long-term capital gain | $ | 1,382,594 | |||||
20
GMO Benchmark-Free Allocation Fund
(A Series of GMO Trust)
Notes to Financial Statements — (Continued)
February 28, 2009
As of February 28, 2009, the approximate cost for U.S. federal income tax purposes and gross and net unrealized appreciation (depreciation) in value of investments were as follows:
| Aggregate Cost | Gross Unrealized Appreciation | Gross Unrealized (Depreciation) | Net Unrealized Appreciation (Depreciation) | ||||||||||||
| $ | 1,958,801,249 | $ | 10,400,955 | $ | (532,311,457 | ) | $ | (521,910,502 | ) | ||||||
For the year ended February 28, 2009, the Fund had net realized losses attributed to redemption in-kind transactions of $744,243.
The Fund is subject to the provisions of Financial Accounting Standards Board Interpretation No. 48 ("FIN 48"), Accounting for Uncertainty in Income Taxes — an Interpretation of FASB Statement No. 109. FIN 48 sets forth a minimum threshold for financial statement recognition of a tax position taken or expected to be taken in a tax return that could affect the Fund's financial statements. The Fund did not have any unrecognized tax benefits or liabilities at February 28, 2009, nor did it have any increases or decreases in unrecognized tax benefits or liabilities for the period then ended. The Fund is subject to examination prior to the expiration of the statute of limitations by U.S. federal and state tax authorities for tax returns filed.
Security transactions and related investment income
Security transactions in the financial statements are accounted for on the trade date. Income dividends and capital gain distributions from the underlying funds are recorded on the ex-dividend date. Interest income is recorded on the accrual basis. Non-cash dividends, if any, are recorded at the fair market value of the asset received. In determining the net gain or loss on securities sold, the Fund uses the identified cost basis for the purposes of determining the cost basis.
Expenses
The majority of the expenses of the Trust are directly identifiable to an individual fund. Expenses that are not readily identifiable to a specific fund are allocated taking into consideration, among other things, the nature and type of expense and the relative size of the funds. In addition, the Fund incurs fees and expenses indirectly as a shareholder in the underlying funds. Because the underlying funds have different expense and fee levels and the Fund may own different proportions of the underlying funds at different times, the amount of fees and expenses indirectly incurred by the Fund will vary, and the Manager has a conflict in allocating among the underlying funds. (See Note 3).
State Street Bank and Trust Company ("State Street") serves as custodian, fund accounting agent and transfer agent of the Fund. State Street's fees may be reduced by an earnings allowance calculated on the average daily cash balances the Fund maintains with State Street. The Fund receives the benefit of the earnings allowance. Credit balances or expense reimbursements used to reduce fees, if any, are reported as a reduction of expenses in the Statement of Operations.
21
GMO Benchmark-Free Allocation Fund
(A Series of GMO Trust)
Notes to Financial Statements — (Continued)
February 28, 2009
Purchases and redemptions of Fund shares
Effective June 30, 2008, the premium on cash purchases of Fund shares was changed to 0.13% of the amount invested and the fee on cash redemptions was changed to 0.12% of the amount redeemed. Effective September 30, 2008, the premium on cash purchases and fee on cash redemptions were each changed to 0.01% of the amount invested or redeemed. Effective October 8, 2008, the fee on cash redemptions was changed to 0.30% of the amount redeemed. Effective October 21, 2008, the premium on cash purchases was changed to 0.10% of the amount invested and the fee on cash redemptions was changed to 0.72% of the amount redeemed. Effective November 24, 2008, the fee on cash redemptions was changed to 2.00% of the amount redeemed. As of February 28, 2009, the premium on cash purchases was 0.10% of the amount invested and the fee on cash redemptions was 2.00% of the amount redeemed. The Fund may impose a new purchase premium and/or redemption fee, or modify or eliminate an existing purchase premium and/or redemption fee, at any time. If the Manager determines that any portion of a cash purchase or redemption is offset by a corresponding cash redemption or purchase on the same day, the Fund will ordinarily waive or reduce the purchase premium or redemption fee with respect to that portion. All or a portion of the redemption fees may be waived at the Manager's discretion under circumstances in which the Manager deems it equitable to do so, including without limitation in cases where the weighted average of (i) the estimated transaction costs for directly held assets and (ii) the redemptions fees, if any, imposed by the underlying funds is less than the Fund's redemption fee. In addition, the Fund may waive or reduce the purchase premium or redemption fee in extraordinary circumstances if the purchase or redemption will not cause the Fund to incur transaction costs. All purchase premiums and redemption fees are paid to the Fund and recorded by the Fund as paid-in-capital. The Fund will waive or reduce the purchase premium relating to the in-kind portion of a purchase transaction except for estimated or known transaction costs (e.g. stamp duties and transfer taxes) incurred by the Fund as a result of the transfer of the purchasing shareholder's securities to the Fund. In-kind redemption transactions are generally not subject to redemption fees except when they include a cash component. However, when a substantial portion of a Fund is being redeemed, the Fund may charge a redemption fee based on estimated or known transaction costs resulting from those redemptions. The Fund charges no premium for reinvested distributions.
Investment risks
The Fund is subject to the investment risks associated with an investment in the underlying funds, some of which may invest in foreign securities. The Fund is subject to risks involved in investing in foreign securities that are not presented by investments in U.S. securities. These risks may involve adverse political and economic developments, including expropriation and the possible imposition of capital controls or other foreign governmental laws or restrictions. In addition, the securities of some foreign companies and securities markets are less liquid and at times more volatile than securities of comparable U.S. companies and U.S. securities markets. The risks described above apply to an even greater extent to investments in emerging markets. The securities markets of emerging countries are generally smaller, less developed, less liquid, and more volatile than the securities markets of the U.S. and developed foreign market s. Additionally, the investment risks associated with an investment in the underlying funds may be greater to the extent that the underlying funds engage in derivative transactions.
22
GMO Benchmark-Free Allocation Fund
(A Series of GMO Trust)
Notes to Financial Statements — (Continued)
February 28, 2009
Recently issued accounting pronouncement
In March 2008, FASB issued Statement of Financial Accounting Standards No. 161, Disclosures about Derivative Instruments and Hedging Activities ("SFAS 161"). SFAS 161 is effective for fiscal years and interim periods beginning after November 15, 2008. SFAS 161 requires enhanced disclosures about the Fund's derivative and hedging activities. The Manager is currently evaluating the impact the adoption of SFAS 161 will have on the Fund's financial statement disclosures.
3. Fees and other transactions with affiliates
The Manager decides how to allocate the assets of the Fund among underlying funds. The Manager does not directly charge the Fund an advisory fee or shareholder service fee, but it receives varying management and shareholder service fees from the underlying funds in which the Fund invests. Because of that variation the levels of indirect net expenses set forth below are affected by the Manager's asset allocation decisions.
Through at least June 30, 2009, the Manager has contractually agreed to reimburse the Fund for Fund expenses incurred through that date (excluding "Excluded Expenses", as defined below). Excluded Expenses include fees and expenses of the independent Trustees of the Trust, fees and expenses for legal services not approved by the Manager for the Trust, compensation and expenses of the Trust's Chief Compliance Officer ("CCO") (excluding any employee benefits), brokerage commissions, securities lending fees and expenses, interest expense, transfer taxes, and other investment-related costs (including expenses associated with investments in any company that is an investment company or would be an investment company under the 1940 Act, but for the exceptions to the definition of investment company provided in Section 3(c)(1) and 3(c)(7) of the 1940 Act), hedging transaction fees, extraordinary, non-recurring and certain other unusual e xpenses (including taxes).
The Fund incurs fees and expenses indirectly as a shareholder in the underlying funds. For the year ended February 28, 2009, these indirect fees and expenses expressed as an annualized percentage of the Fund's average daily net assets were as follows:
| Indirect Net Expenses (excluding shareholder service fees and interest expense) | Indirect Shareholder Service Fees | Indirect Interest Expense | Total Indirect Expenses | ||||||||||||
| 0.415 | % | 0.071 | % | 0.005 | % | 0.491 | % | ||||||||
The Fund's portion of the fees paid by the Trust to the Trust's independent Trustees and CCO during the year ended February 28, 2009 was $21,812 and $11,194, respectively. The compensation and expenses of the CCO are included in the Statement of Operations. The Fund paid no remuneration to any other officer of the Trust.
23
GMO Benchmark-Free Allocation Fund
(A Series of GMO Trust)
Notes to Financial Statements — (Continued)
February 28, 2009
4. Purchases and sales of securities
Cost of purchases and proceeds from sales of securities, excluding short-term investments and class exchanges, for the year ended February 28, 2009 aggregated $1,021,300,463 and $618,482,001, respectively. Cost of purchases and proceeds from sales of securities for in-kind transactions for the year ended February 28, 2009 were 96,781,930 and 96,781,930, respectively.
5. Guarantees
In the normal course of business the Fund enters into contracts with third-party service providers that contain a variety of representations and warranties and that provide general indemnifications. The Fund's maximum exposure under these arrangements is unknown, as it involves future claims that may be made against the Fund that have not yet occurred. Based on experience, management is of the view that the risk of loss in connection with its indemnification obligations is remote; however, there can be no assurance that such obligations will not result in material liabilities that adversely affect the Fund.
6. Principal shareholders and related parties
As of February 28, 2009, 22.51% of the outstanding shares of the Fund were held by two shareholders, each holding more than 10% of the Fund's outstanding shares. On that date, no other shareholder owned more than 10% of the outstanding shares of the Fund. Redemptions from (or investments into) the Fund by or on behalf of these large shareholders may have a material effect on the Fund.
As of February 28, 2009, 1.10% of the Fund's shares were held by senior management of the Manager and GMO Trust officers and 97.26% of the Fund's shares were held by accounts for which the Manager had investment discretion.
7. Share transactions
The Declaration of Trust permits the Trust to issue an unlimited number of shares of beneficial interest (without par value). Transactions in Fund shares were as follows:
| Year Ended February 28, 2009 | Year Ended February 29, 2008 | ||||||||||||||||||
| Class III: | Shares | Amount | Shares | Amount | |||||||||||||||
| Shares sold | 5,802,830 | $ | 125,161,583 | 9,819,038 | $ | 279,628,825 | |||||||||||||
| Shares issued to shareholders in reinvestment of distributions | 14,154,108 | 273,113,176 | 7,959,463 | 209,394,517 | |||||||||||||||
| Shares repurchased | (1,546,197 | ) | (37,042,197 | ) | (2,301,160 | ) | (63,345,058 | ) | |||||||||||
| Purchase premiums | — | 97,972 | — | 7,597 | |||||||||||||||
| Redemption fees | — | 56,839 | — | 142,223 | |||||||||||||||
| Net increase (decrease) | 18,410,741 | $ | 361,387,373 | 15,477,341 | $ | 425,828,104 | |||||||||||||
24
GMO Benchmark-Free Allocation Fund
(A Series of GMO Trust)
Notes to Financial Statements — (Continued)
February 28, 2009
8. Investments in affiliated issuers
A summary of the Fund's transactions in the shares of other funds of the Trust during the year ended February 28, 2009 is set forth below:
| Affiliate | Value, beginning of period | Purchases | Sales Proceeds | Dividend Income | Distributions of Realized Gains | Value, end of period | |||||||||||||||||||||
| GMO Alpha Only Fund, Class IV | $ | 407,035,363 | $ | 450,879,144 | $ | 218,772,424 | $ | 184,628,593 | $ | 82,726,158 | $ | 434,803,314 | |||||||||||||||
| GMO Alternative Asset Opportunity Fund | 24,885,255 | — | 134,760 | — | — | 16,373,298 | |||||||||||||||||||||
| GMO Emerging Country Debt Fund, Class IV | 32,949,175 | 2,508,930 | 145,509 | 2,772,449 | 695,994 | 21,081,143 | |||||||||||||||||||||
| GMO Emerging Markets Fund, Class VI | 285,823,205 | 179,090,131 | 320,065,726 | 1,236,621 | 33,853,509 | 64,789,027 | |||||||||||||||||||||
| GMO Flexible Equities Fund, Class VI | — | 60,229,753 | — | 7,208 | — | 46,651,926 | |||||||||||||||||||||
| GMO International Small Companies Fund, Class III | — | 52,680,453 | — | 1,180,453 | — | 42,720,670 | |||||||||||||||||||||
| GMO Special Situations Fund, Class VI | 80,727,015 | — | 45,980,720 | — | — | 45,145,613 | |||||||||||||||||||||
| GMO Strategic Fixed Income Fund, Class VI | 488,748,982 | 18,876,276 | 117,097,469 | 18,736,964 | — | 275,849,692 | |||||||||||||||||||||
| GMO U.S. Core Equity Fund, Class VI | 2,807 | 46 | 1,815 | 46 | — | — | |||||||||||||||||||||
| GMO U.S. Quality Equity Fund, Class VI | 289,904,690 | 258,667,216 | 2,388,066 | 7,600,814 | 2,207,535 | 401,725,164 | |||||||||||||||||||||
| GMO World Opportunity Overlay Fund | — | 18,522,133 | 4,865 | — | — | 17,169,667 | |||||||||||||||||||||
| Totals | $ | 1,610,076,492 | $ | 1,041,454,082 | $ | 704,591,354 | $ | 216,163,148 | $ | 119,483,196 | $ | 1,366,309,514 | |||||||||||||||
25
Report of Independent Registered Public Accounting Firm
To the Trustees of GMO Trust and the Shareholders of
GMO Benchmark-Free Allocation Fund:
In our opinion, the accompanying statement of assets and liabilities, including the schedule of investments, and the related statements of operations and of changes in net assets and the financial highlights present fairly, in all material respects, the financial position of GMO Benchmark-Free Allocation Fund (the "Fund") at February 28, 2009, the results of its operations for the year then ended, the changes in its net assets for each of the two years in the period then ended and the financial highlights for each of the five years in the period then ended, in conformity with accounting principles generally accepted in the United States of America. These financial statements and financial highlights (hereafter referred to as "financial statements") are the responsibility of the Fund's management. Our responsibility is to express an opinion on these financial statements based on our audits. We conducted our audits of these financ ial statements in accordance with the standards of the Public Company Accounting Oversight Board (United States). Those standards require that we plan and perform the audit to obtain reasonable assurance about whether the financial statements are free of material misstatement. An audit includes examining, on a test basis, evidence supporting the amounts and disclosures in the financial statements, assessing the accounting principles used and significant estimates made by management, and evaluating the overall financial statement presentation. We believe that our audits, which included confirmation of securities at February 28, 2009 by correspondence with the custodian and brokers, provide a reasonable basis for our opinion.
PricewaterhouseCoopers LLP
Boston, Massachusetts
April 29, 2009
26
GMO Benchmark-Free Allocation Fund
(A Series of GMO Trust)
Fund Expenses
February 28, 2009 (Unaudited)
Expense Examples: The following information is in relation to expenses for the six month period ended February 28, 2009.
As a shareholder of the Fund, you may incur two types of costs: (1) transaction costs, including purchase premiums and redemption fees; and (2) ongoing costs, including management fees, shareholder service fees, and other Fund expenses. This example is intended to help you understand your ongoing costs (in dollars) of investing in the Fund and to compare these costs with the ongoing costs of investing in other mutual funds.
These examples are based on an investment of $1,000 invested at the beginning of the period and held for the entire period, September 1, 2008 through February 28, 2009.
Actual Expenses
The first line of the table below provides information about actual account values and actual expenses. You may use the information in this line, together with the amount you invested, to estimate the expenses that you paid over the period. Simply divide your account value by $1,000 (for example, a $10,000,000 account value divided by $1,000 = 10,000), then multiply the result by the number in the first line under the heading entitled "Net Expense Incurred" to estimate the expenses you paid on your account during this period.
Hypothetical Example for Comparison Purposes
The second line of the table below provides information about hypothetical account values and hypothetical expenses based on the Fund's actual expense ratio and an assumed rate of return of 5% per year before expenses, which is not the Fund's actual return. The hypothetical account values and expenses may not be used to estimate the actual ending account balance or expenses you paid for the period. You may use this information to compare the ongoing costs of investing in the Fund with other funds. To do so, compare this 5% hypothetical example with the 5% hypothetical examples that appear in the shareholder reports of other funds.
Please note that the expenses shown in the table are meant to highlight your ongoing costs only and do not reflect any transactional costs, such as purchase premiums and redemption fees. Therefore, the second line of the table is useful in comparing ongoing costs only, and will not help you determine the relative total costs of owning different funds. In addition, if these transactional costs were included, your costs would have been higher.
| Annualized Net Expense Ratio | Beginning Account Value | Ending Account Value | Net Expense Incurred* | ||||||||||||||||
| Class III | |||||||||||||||||||
| 1) Actual | 0.48 | % | $ | 1,000.00 | $ | 870.50 | $ | 2.23 | |||||||||||
| 2) Hypothetical | 0.48 | % | $ | 1,000.00 | $ | 1,022.41 | $ | 2.41 | |||||||||||
* Expenses are calculated using the Class's annualized expense ratio (including indirect expenses incurred) for the six months ended February 28, 2009, multiplied by the average account value over the period, multiplied by 181 days in the period, divided by 365 days in the year.
27
GMO Benchmark-Free Allocation Fund
(A Series of GMO Trust)
Tax Information for the Tax Year Ended February 28, 2009 (Unaudited)
The Fund will notify shareholders of amounts for use in preparing 2009 income tax forms in early 2010.
The Fund's distributions to shareholders include $37,083,602 from long-term capital gains.
For taxable, non-corporate shareholders, 8.06% of the income and short-term capital gains, if any, distributed in the Fund's fiscal year ended February 28, 2009 represents qualified dividend income subject to the 15% rate category.
For corporate shareholders, 4.70% of the income and short-term capital gains, if any, distributed in the Fund's fiscal year ended February 28, 2009 qualified for the dividends-received deduction.
The Fund hereby designates as qualified interest income with respect to its taxable year ended February 28, 2009, $20,325,691 or if determined to be different, the qualified interest income of such year.
28
Trustees and Officers (Unaudited)
The following tables list the Trust's Trustees and Officers as of the date of this report; their address and date of birth ("DOB"); their position with the Trust; the length of time holding that position with the Trust; their principal occupation(s) during the past five years; the number of portfolios in the fund complex they oversee; and other directorships they hold in companies subject to registration or reporting requirements of the Securities Exchange Act of 1934 (generally called "public companies") or in registered investment companies. The Trust's Statement of Additional Information ("SAI") includes additional information about the Trust's trustees, including changes subsequent to the date of the report. The SAI is available, without charge, upon request by writing GMO, c/o GMO Trust, 40 Rowes Wharf, Boston, MA 02110.
Independent Trustees:
| Name, Address, and DOB | Position(s) Held with Trust | Term of Office1 and Length of Time Served | Principal Occupation(s) During Past Five Years | Number of Portfolios in Fund Complex Overseen by Trustee | Other Directorships Held by Trustee | ||||||||||||||||||
| Donald W. Glazer, Esq. c/o GMO Trust 40 Rowes Wharf Boston, MA 02110 DOB: 07/26/1944 | Chairman of the Board of Trustees | Chairman of the Board of Trustees since March 2005; Lead Independent Trustee (September 2004 – March 2005); Trustee since December 2000. | Consultant – Law and Business2; Author of Legal Treatises. | 59 | None. | ||||||||||||||||||
1 Each Trustee is elected to serve during the continued lifetime of the Trust until he/she dies, resigns or is removed, or if sooner, until the next meeting of Shareholders called for the purpose of electing Trustees and until the election and qualification of his/her successor.
2 As part of Mr. Glazer's work as a consultant, he provides part-time consulting services to Goodwin Procter LLP ("Goodwin"). Goodwin has provided legal services to Renewable Resources, LLC, an affiliate of GMO; GMO, in connection with its relationship with Renewable Resources; and funds managed by Renewable Resources. Mr. Glazer has represented that he has no financial interest in, and is not involved in the provision of, such legal services. In the calendar years ended December 31, 2007 and December 31, 2008, these entities paid $789,416 and $183,864 respectively, in legal fees and disbursements to Goodwin. In correspondence with the Staff of the Securities and Exchange Commission beginning in August 2006, the Independent Trustees' legal counsel provided the Staff with information regarding Mr. Glazer's relationship with Goodwin and h is other business activities. On September 11, 2007, based on information that had been given to the Staff as of that date, the Staff provided oral no-action assurance consistent with the opinion of the Independent Trustees' legal counsel that Mr. Glazer is not an "interested person" of the Trust.
29
Independent Trustees — (Continued)
| Name, Address, and DOB | Position(s) Held with Trust | Term of Office1 and Length of Time Served | Principal Occupation(s) During Past Five Years | Number of Portfolios in Fund Complex Overseen by Trustee | Other Directorships Held by Trustee | ||||||||||||||||||
| W. Nicholas Thorndike c/o GMO Trust 40 Rowes Wharf Boston, MA 02110 DOB: 03/28/1933 | Trustee | Since March 2005. | Director or trustee of various corporations and charitable organizations, including Courier Corporation (a book publisher and manufacturer) (July 1989 – present); Putnam Funds (December 1992 – June 2004); and Providence Journal (a newspaper publisher) (December 1986 – December 2003). | 59 | Director of Courier Corporation (a book publisher and manufacturer); Member of the Investment Committee of Partners HealthCare System, Inc.3 | ||||||||||||||||||
| Peter Tufano c/o GMO Trust 40 Rowes Wharf Boston, MA 02110 DOB: 04/22/1957 | Trustee | Since December 2008. | Sylvan C. Coleman Professor of Financial Management, Harvard Business School (since 1989). | 59 | Trustee of State Street Navigator Securities Lending Trust (3 Portfolios). | ||||||||||||||||||
1 Each Trustee is elected to serve during the continued lifetime of the Trust until he/she dies, resigns or is removed, or if sooner, until the next meeting of Shareholders called for the purpose of electing Trustees and until the election and qualification of his/her successor.
3 Partners HealthCare System, Inc. is a client of the Manager.
30
Principal Officers:
| Name, Address, and DOB | Position(s) Held with Trust | Term of Office4 and Length of Time Served | Principal Occupation(s) During Past Five Years5 | ||||||||||||
| J.B. Kittredge DOB: 08/22/1954 | President and Chief Executive Officer | Since March 2009. | General Counsel, Grantham, Mayo, Van Otterloo & Co. LLC (October 2005 – Present); Partner, Ropes & Gray LLP. | ||||||||||||
| Sheppard N. Burnett c/o GMO Trust 40 Rowes Wharf Boston, MA 02110 DOB: 10/24/1968 | Treasurer and Chief Financial Officer | Chief Financial Officer since March 2007; Treasurer since November 2006; Assistant Treasurer, September 2004 – November 2006. | Fund Administration Staff, Grantham, Mayo, Van Otterloo & Co. LLC (June 2004 – present); Vice President, Director of Tax, Columbia Management Group (2002 – 2004). | ||||||||||||
| Brent C. Arvidson c/o GMO Trust 40 Rowes Wharf Boston, MA 02110 DOB: 06/26/1969 | Assistant Treasurer | Since August 1998. | Senior Fund Administrator, Grantham, Mayo, Van Otterloo & Co. LLC. | ||||||||||||
| John L. Nasrah c/o GMO Trust 40 Rowes Wharf Boston, MA 02110 DOB: 05/27/1977 | Assistant Treasurer | Since March 2007. | Fund Administrator, Grantham, Mayo, Van Otterloo & Co. LLC (September 2004 – present); Tax Analyst, Bain & Company, Inc. (June 2003 – September 2004). | ||||||||||||
| Mahmoodur Rahman c/o GMO Trust 40 Rowes Wharf Boston, MA 02110 DOB: 11/30/1967 | Assistant Treasurer | Since September 2007. | Fund Administrator, Grantham, Mayo, Van Otterloo & Co. LLC (April 2007 – present); Vice President and Senior Tax Manager, Massachusetts Financial Services Company (January 2000 – April 2007). | ||||||||||||
| Michael E. Gillespie c/o GMO Trust 40 Rowes Wharf Boston, MA 02110 DOB: 02/18/1958 | Chief Compliance Officer | Since March 2005. | Vice President of Compliance (June 2004 – February 2005) and Director of Domestic Compliance (March 2002 – June 2004), Fidelity Investments. | ||||||||||||
4 Each officer is elected to hold such office until his or her successor is duly elected and qualified to carry out the duties and responsibilities of the office, or until he or she resigns or is removed from office.
5 Each of Messrs. Burnett, Arvidson, Bohan, and Pottle serves as an officer and/or director of certain pooled investment vehicles of which GMO or an affiliate of GMO serves as the investment adviser.
31
Principal Officers — (Continued)
| Name, Address, and DOB | Position(s) Held with Trust | Term of Office4 and Length of Time Served | Principal Occupation(s) During Past Five Years5 | ||||||||||||
| Jason B. Harrison c/o GMO Trust 40 Rowes Wharf Boston, MA 02110 DOB: 01/29/1977 | Vice President and Clerk | Vice President since November 2006; Clerk since March 2006. | Legal Counsel, Grantham, Mayo, Van Otterloo & Co. LLC (since February 2006) and Attorney, Ropes & Gray LLP (September 2002 – February 2006). | ||||||||||||
| David L. Bohan c/o GMO Trust 40 Rowes Wharf Boston, MA 02110 DOB: 06/21/1964 | Vice President and Assistant Clerk | Vice President since March 2005; Assistant Clerk since March 2006. | Legal Counsel, Grantham, Mayo, Van Otterloo & Co. LLC. | ||||||||||||
| Gregory L. Pottle c/o GMO Trust 40 Rowes Wharf Boston, MA 02110 DOB: 07/09/1971 | Vice President and Assistant Clerk | Since November 2006. | Legal Counsel, Grantham, Mayo, Van Otterloo & Co. LLC. | ||||||||||||
| Anne K. Trinque c/o GMO Trust 40 Rowes Wharf Boston, MA 02110 DOB: 04/15/1978 | Vice President and Assistant Clerk | Since September 2007. | Legal Counsel, Grantham, Mayo, Van Otterloo & Co. LLC (January 2007 – present); Attorney, Goodwin Procter LLP (September 2003 – January 2007). | ||||||||||||
| Cheryl Wakeham c/o GMO Trust 40 Rowes Wharf Boston, MA 02110 DOB: 10/29/1958 | Vice President and Anti-Money Laundering Officer | Since December 2004. | Manager, Client Service Administration, Grantham, Mayo, Van Otterloo & Co. LLC. | ||||||||||||
4 Each officer is elected to hold such office until his or her successor is duly elected and qualified to carry out the duties and responsibilities of the office, or until he or she resigns or is removed from office.
5 Each of Messrs. Burnett, Arvidson, Bohan, and Pottle serves as an officer and/or director of certain pooled investment vehicles of which GMO or an affiliate of GMO serves as the investment adviser.
32
GMO Global Balanced Asset Allocation Fund
(A Series of GMO Trust)
Annual Report
February 28, 2009
For a free copy of the Fund's proxy voting guidelines, shareholders may call 1-617-346-7646 (collect) or visit the Securities and Exchange Commission's website at www.sec.gov. Information regarding how the Fund voted proxies relating to portfolio securities during the most recent 12-month period ended June 30 is available on GMO's website at www.gmo.com, or on the Securities and Exchange Commission's website at www.sec.gov.
The Fund files its complete schedule of portfolio holdings with the Securities and Exchange Commission for the first and third quarter of each fiscal year on Form N-Q, which is available on the Commission's website at www.sec.gov. The Fund's Form N-Q may be reviewed and copied at the Commission's Public Reference Room in Washington, D.C. Information on the operation of the Public Reference Room may be obtained by calling 1-800-SEC-0330. The Fund has a policy with respect to disclosure of portfolio holdings under which it may also make available on GMO's website at www.gmo.com a complete schedule of portfolio holdings.
This report is prepared for the general information of shareholders. It is authorized for distribution to prospective investors only when preceded or accompanied by a prospectus for the GMO Trust, which contains a complete discussion of the risks associated with an investment in this Fund and other important information. The GMO Trust prospectus can be obtained at www.gmo.com.
GMO Global Balanced Asset Allocation Fund
(A Series of GMO Trust)
Portfolio Management
Day-to-day management of the Fund's portfolio is the responsibility of the Asset Allocation team at Grantham, Mayo, Van Otterloo & Co. LLC.
Management Discussion and Analysis of Fund Performance
The GMO Global Balanced Asset Allocation Fund returned -24.3% for the fiscal year ended February 28, 2009, as compared to -33.6% for the Fund's benchmark, the GMO Global Balanced Index (65% MSCI ACWI [All Country World Index] Index and 35% Barclays Capital U.S. Aggregate Index). During the fiscal year the Fund was exposed to global equity and fixed income securities through direct investment and indirectly through its investment in underlying GMO mutual funds. The Fund received fixed income securities from certain underlying GMO mutual funds during the year via an in-kind transaction.
Implementation was slightly positive, as the GMO U.S. Quality Equity Fund and the GMO International Intrinsic Value Fund outperformed their respective benchmarks.
Asset allocation was responsible for the bulk of the fund's outperformance of its benchmark. The Fund's underweight to global equities and overweight to fixed income were the primary drivers of the outperformance.
The views expressed herein are exclusively those of Grantham, Mayo, Van Otterloo & Co. LLC Management as of the date of this report and are subject to change. GMO disclaims any responsibility to update such views. They are not meant as investment advice. References to specific securities are not recommendations of such securities and may not be representative of any GMO portfolio's current or future investments.
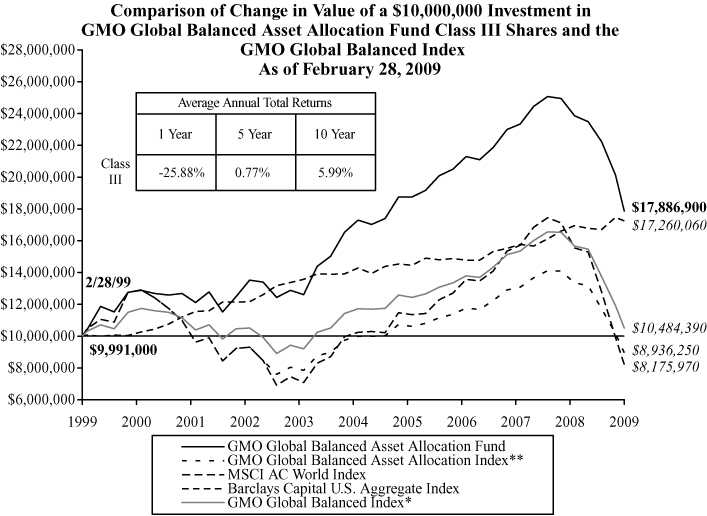
Performance data quoted represents past performance and is not indicative of future results. The investment return and principal value of an investment will fluctuate so that an investor's shares, when redeemed, may be worth more or less than their original cost. Current performance data may be lower or higher than the performance data provided herein. To obtain performance information to the most recent month-end, visit www.gmo.com. Performance shown is net of all fees after reimbursement from the Manager. Each performance figure assumes a purchase at the beginning and redemption at the end of the stated period and reflects a transaction fee of .09% on the purchase and 2.00% on the redemption. Transaction fees are retained by the Fund to cover trading costs. Returns would have been lower had certain expenses not been reimbursed during the periods shown and do not include the effect of taxes on distributions and redemptions. All infor mation is unaudited.
* The GMO Global Balanced Index is a composite benchmark computed by GMO and comprised of 48.75% S&P 500 Index, 16.25% MSCI ACWI (All Country World Index) ex-U.S. Index and 35% Barclays Capital U.S. Aggregate Index prior to 3/31/2007 and 65% MSCI ACWI (All Country World Index) Index and 35% Barclays Capital U.S. Aggregate Index thereafter.
** The GMO Global Balanced Asset Allocation Index is comprised of MSCI ACWI (All Country World Index) prior to 6/30/2002 and GMO Global Balanced Index thereafter.
GMO Global Balanced Asset Allocation Fund
(A Series of GMO Trust)
Investments Concentration Summary
February 28, 2009 (Unaudited)
| Asset Class Summary* | % of Total Net Assets | ||||||
| Common Stocks | 60.4 | % | |||||
| Debt Obligations | 24.7 | ||||||
| Cash and Cash Equivalents | 13.8 | ||||||
| Short-Term Investments | 11.0 | ||||||
| Preferred Stocks | 0.8 | ||||||
| Options Purchased | 0.3 | ||||||
| Investment Funds | 0.2 | ||||||
| Private Equity Securities | 0.0 | ||||||
| Loan Participations | 0.0 | ||||||
| Loan Assignments | 0.0 | ||||||
| Convertible Securities | 0.0 | ||||||
| Forward Currency Contracts | 0.0 | ||||||
| Rights and Warrants | 0.0 | ||||||
| Promissory Notes | 0.0 | ||||||
| Reverse Repurchase Agreements | (0.0 | ) | |||||
| Written Options | (0.2 | ) | |||||
| Futures | (6.3 | ) | |||||
| Swaps | (6.8 | ) | |||||
| Other | 2.1 | ||||||
| 100.0 | % | ||||||
* The table above incorporates aggregate indirect asset class exposure associated with investments in other funds of GMO Trust ("underlying funds").
1
GMO Global Balanced Asset Allocation Fund
(A Series of GMO Trust)
Investments Concentration Summary — (Continued)
February 28, 2009 (Unaudited)
| Country / Region Summary** | % of Investments | ||||||
| United States | 74.1 | % | |||||
| Japan | 6.1 | ||||||
| Euro Region*** | 5.2 | ||||||
| United Kingdom | 3.8 | ||||||
| Switzerland | 2.2 | ||||||
| Brazil | 1.3 | ||||||
| Korea | 1.2 | ||||||
| Taiwan | 1.0 | ||||||
| China | 0.9 | ||||||
| South Africa | 0.5 | ||||||
| Sweden | 0.5 | ||||||
| Canada | 0.4 | ||||||
| Russia | 0.4 | ||||||
| Thailand | 0.4 | ||||||
| Turkey | 0.4 | ||||||
| Denmark | 0.3 | ||||||
| Hong Kong | 0.2 | ||||||
| Malaysia | 0.2 | ||||||
| Singapore | 0.2 | ||||||
| Egypt | 0.1 | ||||||
| India | 0.1 | ||||||
| Israel | 0.1 | ||||||
| Mexico | 0.1 | ||||||
| Norway | 0.1 | ||||||
| Philippines | 0.1 | ||||||
| Poland | 0.1 | ||||||
| 100.0 | % | ||||||
** The table above incorporates aggregate indirect country exposure associated with investments in the underlying funds except for GMO Alpha Only Fund. The table excludes short-term investments. The table includes exposure through the use of derivative contracts.
*** The "Euro Region" is comprised of Austria, Belgium, Finland, France, Germany, Greece, Ireland, Italy, Netherlands, Portugal and Spain.
2
GMO Global Balanced Asset Allocation Fund
(A Series of GMO Trust)
Schedule of Investments
(showing percentage of total net assets)
February 28, 2009
| Par Value ($) | Description | Value ($) | |||||||||||||
| DEBT OBLIGATIONS — 4.4% | |||||||||||||||
| Asset-Backed Securities — 4.3% | |||||||||||||||
| ABS Collateralized Debt Obligations — 0.0% | |||||||||||||||
| 500,000 | Paragon CDO Ltd., Series 04-1A, Class A, 144A, 3 mo. LIBOR + .65%, 1.79%, due 10/20/44 | 15,000 | |||||||||||||
| Airlines — 0.0% | |||||||||||||||
| 600,000 | Aircraft Finance Trust, Series 99-1A, Class A1, 144A, 1 mo. LIBOR + .48%, 0.94%, due 05/15/24 | 150,000 | |||||||||||||
| Auto Financing — 0.6% | |||||||||||||||
| 1,600,000 | BMW Vehicle Lease Trust, Series 07-1, Class A3B, 1 mo. LIBOR + .24%, 0.70%, due 08/15/13 | 1,541,152 | |||||||||||||
| 900,000 | Capital Auto Receivable Asset Trust, Series 07-2, Class A4B, 1 mo. LIBOR + .40%, 0.86%, due 02/18/14 | 739,350 | |||||||||||||
| 200,000 | Capital Auto Receivable Asset Trust, Series 08-1, Class A4B, 1 mo. LIBOR + 1.35%, 1.81%, due 07/15/14 | 153,250 | |||||||||||||
| 400,000 | Capital Auto Receivable Asset Trust, Series 07-SN1, Class A4, 1 mo. LIBOR + .10%, 0.56%, due 02/15/11 | 309,080 | |||||||||||||
| 800,000 | Carmax Auto Owner Trust, Series 08-2, Class A4B, 1 mo. LIBOR + 1.65%, 2.11%, due 08/15/13 | 613,272 | |||||||||||||
| 700,000 | Daimler Chrysler Auto Trust, Series 08-B, Class A4A, 5.32%, due 11/10/14 | 491,400 | |||||||||||||
| 600,000 | Daimler Chrysler Auto Trust, Series 08-B, Class A4B, 1 mo. LIBOR + 1.85%, 2.30%, due 11/10/14 | 472,800 | |||||||||||||
| 900,000 | Daimler Chrysler Master Owner Trust, Series 06-A, Class A, 1 mo. LIBOR + .03%, 0.49%, due 11/15/11 | 585,000 | |||||||||||||
| 800,000 | Ford Credit Auto Owner Trust, Series 06-C, Class A4B, 1 mo. LIBOR + .04%, 0.50%, due 02/15/12 | 721,168 | |||||||||||||
| 500,000 | Ford Credit Auto Owner Trust, Series 07-B, Class A4B, 1 mo. LIBOR + .38%, 0.84%, due 07/15/12 | 375,150 | |||||||||||||
| 1,100,000 | Ford Credit Auto Owner Trust, Series 08-B, Class A4B, 1 mo. LIBOR + 2.00%, 2.46%, due 03/15/13 | 887,843 | |||||||||||||
| 2,200,000 | Ford Credit Floorplan Master Owner Trust, Series 06-4, Class A, 1 mo. LIBOR + .25%, 0.71%, due 06/15/13 | 1,320,000 | |||||||||||||
| 300,000 | Franklin Auto Trust, Series 08-A, Class A4B, 1 mo. LIBOR + 1.95%, 2.42%, due 05/20/16 | 219,660 | |||||||||||||
See accompanying notes to the financial statements.
3
GMO Global Balanced Asset Allocation Fund
(A Series of GMO Trust)
Schedule of Investments — (Continued)
(showing percentage of total net assets)
February 28, 2009
| Par Value ($) | Description | Value ($) | |||||||||||||
| Auto Financing — continued | |||||||||||||||
| 1,000,000 | Nissan Auto Lease Trust, Series 08-A, Class A3B, 1 mo. LIBOR + 2.20%, 2.66%, due 07/15/11 | 920,312 | |||||||||||||
| 1,000,000 | Nissan Auto Receivables Owner Trust, Series 07-A, Class A4, 1 mo. LIBOR, 0.46%, due 06/17/13 | 948,520 | |||||||||||||
| 1,000,000 | Nissan Master Owner Trust Receivables, Series 07-A, Class A, 1 mo. LIBOR, 0.46%, due 05/15/12 | 810,000 | |||||||||||||
| 1,112,839 | Sovereign Dealer Floor Plan Master Trust, Series 06-1, Class A, 144A, 1 mo. LIBOR + .05%, 0.51%, due 08/15/11 | 1,001,555 | |||||||||||||
| 1,100,000 | Swift Master Auto Receivables Trust, Series 07-1, Class A, 1 mo. LIBOR + .10%, 0.56%, due 06/15/12 | 737,000 | |||||||||||||
| 500,000 | Swift Master Auto Receivables Trust, Series 07-2, Class A, 1 mo. LIBOR + .65%, 1.11%, due 10/15/12 | 327,500 | |||||||||||||
| 1,100,000 | Truck Retail Installment Paper Corp., Series 05-1A, Class A, 144A, 1 mo. LIBOR + .27%, 0.73%, due 12/15/16 | 770,000 | |||||||||||||
| 400,000 | Wachovia Auto Owner Trust, Series 08-A, Class A4B, 1 mo. LIBOR + 1.15%, 1.62%, due 03/20/14 | 362,232 | |||||||||||||
| 600,000 | World Omni Auto Receivables Trust, Series 07-A, Class A4, 1 mo. LIBOR, 0.46%, due 11/15/12 | 549,786 | |||||||||||||
| Total Auto Financing | 14,856,030 | ||||||||||||||
| Bank Loan Collateralized Debt Obligations — 0.1% | |||||||||||||||
| 508,509 | Arran Corp. Loans No. 1 B.V., Series 06-1A, Class A3, 144A, 3 mo. LIBOR + .17%, 1.70%, due 06/20/25 | 483,243 | |||||||||||||
| 880,000 | Omega Capital Europe Plc, Series GLOB-5A, Class A1, 144A, 3 mo. LIBOR + .25%, 1.68%, due 07/05/11 | 779,733 | |||||||||||||
| Total Bank Loan Collateralized Debt Obligations | 1,262,976 | ||||||||||||||
| Business Loans — 0.3% | |||||||||||||||
| 663,914 | ACAS Business Loan Trust, Series 07-1A, Class A, 144A, 3 mo. LIBOR + .14%, 1.38%, due 08/16/19 | 519,314 | |||||||||||||
| 1,000,000 | Bayview Commercial Asset Trust, Series 07-6A, Class A2, 144A, 1 mo. LIBOR + 1.30%, 1.77%, due 12/25/37 | 698,200 | |||||||||||||
| 113,657 | Bayview Commercial Asset Trust, Series 04-1, Class A, 144A, 1 mo. LIBOR + .36%, 0.83%, due 04/25/34 | 80,492 | |||||||||||||
| 73,316 | Bayview Commercial Asset Trust, Series 04-3, Class A1, 144A, 1 mo. LIBOR + .37%, 0.84%, due 01/25/35 | 51,072 | |||||||||||||
See accompanying notes to the financial statements.
4
GMO Global Balanced Asset Allocation Fund
(A Series of GMO Trust)
Schedule of Investments — (Continued)
(showing percentage of total net assets)
February 28, 2009
| Par Value ($) | Description | Value ($) | |||||||||||||
| Business Loans — continued | |||||||||||||||
| 373,755 | Bayview Commercial Asset Trust, Series 05-4A, Class A2, 144A, 1 mo. LIBOR + .39%, 0.86%, due 01/25/36 | 238,904 | |||||||||||||
| 308,784 | Bayview Commercial Asset Trust, Series 07-3, Class A1, 144A, 1 mo. LIBOR + .24%, 0.71%, due 07/25/37 | 230,487 | |||||||||||||
| 270,318 | Capitalsource Commercial Loan Trust, Series 07-1A, Class A, 144A, 1 mo. LIBOR + .13%, 0.60%, due 03/20/17 | 216,309 | |||||||||||||
| 143,702 | Capitalsource Commercial Loan Trust, Series 06-1A, Class A1, 144A, 1 mo. LIBOR + .12%, 0.59%, due 08/22/16 | 123,153 | |||||||||||||
| 500,000 | CNH Wholesale Master Note Trust, Series 06-1A, Class A, 144A, 1 mo. LIBOR + .06%, 0.52%, due 07/15/12 | 461,426 | |||||||||||||
| 106,801 | GE Business Loan Trust, Series 04-1, Class A, 144A, 1 mo. LIBOR + .29%, 0.75%, due 05/15/32 | 76,126 | |||||||||||||
| 146,750 | GE Business Loan Trust, Series 05-2A, Class A, 144A, 1 mo. LIBOR + .24%, 0.70%, due 11/15/33 | 95,160 | |||||||||||||
| 900,000 | GE Dealer Floorplan Master Trust, Series 06-4, Class A, 1 mo. LIBOR + .01%, 0.48%, due 10/20/11 | 745,065 | |||||||||||||
| 1,400,000 | GE Dealer Floorplan Master Trust, Series 07-2, Class A, 1 mo. LIBOR + .01%, 0.48%, due 07/20/12 | 1,004,634 | |||||||||||||
| 176,284 | Lehman Brothers Small Balance Commercial, Series 07-3A, Class 1A1, 144A, 1 mo. LIBOR + .65%, 1.12%, due 10/25/37 | 137,501 | |||||||||||||
| 800,000 | Lehman Brothers Small Balance Commercial, Series 07-3A, Class 1A2, 144A, 1 mo. LIBOR + .85%, 1.32%, due 10/25/37 | 416,000 | |||||||||||||
| 287,319 | Lehman Brothers Small Balance Commercial, Series 05-1A, Class A, 144A, 1 mo. LIBOR + .25%, 0.72%, due 02/25/30 | 137,913 | |||||||||||||
| 251,525 | Lehman Brothers Small Balance Commercial, Series 05-2A, Class 1A, 144A, 1 mo. LIBOR + .25%, 0.72%, due 09/25/30 | 120,732 | |||||||||||||
| 800,000 | Navistar Financial Dealer Note Master Trust, Series 05-1, Class A, 1 mo. LIBOR + .11%, 0.58%, due 02/25/13 | 686,320 | |||||||||||||
| 700,000 | Textron Financial Floorplan Master Note, Series 07-AA, Class A, 144A, 1 mo. LIBOR + .06%, 0.51%, due 03/13/12 | 575,050 | |||||||||||||
| 19,943 | The Money Store Business Loan Backed Trust, Series 99-1, Class AN, 1 mo. LIBOR + .50%, 1.46%, due 09/15/17 | 17,155 | |||||||||||||
| Total Business Loans | 6,631,013 | ||||||||||||||
See accompanying notes to the financial statements.
5
GMO Global Balanced Asset Allocation Fund
(A Series of GMO Trust)
Schedule of Investments — (Continued)
(showing percentage of total net assets)
February 28, 2009
| Par Value ($) | Description | Value ($) | |||||||||||||
| CMBS — 0.3% | |||||||||||||||
| 700,000 | Citigroup/Deutsche Bank Commercial Mortgage, Series 05-CD1, Class A2FL, 1 mo. LIBOR + .12%, 0.58%, due 07/15/44 | 510,440 | |||||||||||||
| 1,100,000 | Commercial Mortgage Pass-Through Certificates, Series 06-FL12, Class AJ, 144A, 1 mo. LIBOR + .13%, 0.59%, due 12/15/20 | 812,790 | |||||||||||||
| 900,000 | GE Capital Commercial Mortgage Corp., Series 05-C4, Class A2, 5.31%, due 11/10/45 | 825,765 | |||||||||||||
| 500,000 | GE Capital Commercial Mortgage Corp., Series 06-C1, Class A2, 5.33%, due 03/10/44 | 437,927 | |||||||||||||
| 124,863 | Greenwich Capital Commercial Funding Corp., Series 06-FL4A, Class A1, 144A, 1 mo. LIBOR + .09%, 0.54%, due 11/05/21 | 103,559 | |||||||||||||
| 900,000 | GS Mortgage Securities Corp., Series 06-GG6, Class A2, 5.51%, due 04/10/38 | 791,156 | |||||||||||||
| 213,181 | GS Mortgage Securities Corp., Series 07-EOP, Class A1, 144A, 1 mo. LIBOR + .09%, 0.54%, due 03/06/20 | 168,477 | |||||||||||||
| 300,000 | GS Mortgage Securities Corp., Series 07-EOP, Class A2, 144A, 1 mo. LIBOR + .13%, 0.58%, due 03/06/20 | 223,770 | |||||||||||||
| 297,334 | J.P. Morgan Chase Commercial Mortgage Securities Corp., Series 06-FL1A, Class A1B, 144A, 1 mo. LIBOR + .12%, 0.58%, due 02/15/20 | 223,000 | |||||||||||||
| 1,400,000 | J.P. Morgan Chase Commercial Mortgage Securities Corp., Series 06-LDP7, Class A2, 5.86%, due 04/15/45 | 1,232,336 | |||||||||||||
| 110,085 | Lehman Brothers Floating Rate Commercial, Series 06-LLFA, Class A1, 144A, 1 mo. LIBOR + .08%, 0.54%, due 09/15/21 | 77,059 | |||||||||||||
| 900,000 | Merrill Lynch Mortgage Trust, Series 06-C1, Class A2, 5.61%, due 05/12/39 | 784,406 | |||||||||||||
| 300,000 | Morgan Stanley Capital I, Series 06-IQ11, Class A2, 5.69%, due 10/15/42 | 256,548 | |||||||||||||
| 400,000 | Morgan Stanley Capital I, Series 06-IQ11, Class A3, 5.74%, due 10/15/42 | 294,324 | |||||||||||||
| 140,111 | Morgan Stanley Dean Witter Capital I, Series 03-TOP9, Class A1, 3.98%, due 11/13/36 | 134,991 | |||||||||||||
| 864,355 | Wachovia Bank Commercial Mortgage Trust, Series 06-WL7A, Class A1, 144A, 1 mo. LIBOR + .09%, 0.55%, due 09/15/21 | 605,049 | |||||||||||||
| Total CMBS | 7,481,597 | ||||||||||||||
| CMBS Collateralized Debt Obligations — 0.1% | |||||||||||||||
| 500,000 | American Capital Strategies Ltd. Commercial Real Estate CDO Trust, Series 07-1A, Class A, 144A, 3 mo. LIBOR + .80%, 2.05%, due 11/23/52 | 40,000 | |||||||||||||
| 432,799 | G-Force LLC, Series 05-RR2, Class A2, 144A, 5.16%, due 12/25/39 | 331,914 | |||||||||||||
| 700,000 | Guggenheim Structured Real Estate Funding, Series 05-2A, Class A, 144A, 1 mo. LIBOR + .32%, 0.79%, due 08/26/30 | 315,000 | |||||||||||||
| 800,000 | Marathon Real Estate CDO, Series 06-1A, Class A1, 144A, 1 mo. LIBOR + .33%, 0.80%, due 05/25/46 | 295,750 | |||||||||||||
| Total CMBS Collateralized Debt Obligations | 982,664 | ||||||||||||||
See accompanying notes to the financial statements.
6
GMO Global Balanced Asset Allocation Fund
(A Series of GMO Trust)
Schedule of Investments — (Continued)
(showing percentage of total net assets)
February 28, 2009
| Par Value ($) | Description | Value ($) | |||||||||||||
| Collateralized Loan Obligations — 0.0% | |||||||||||||||
| 290,476 | Archimedes Funding IV (Cayman) Ltd., Series 4A, Class A1, 144A, 3 mo. LIBOR + .48%, 1.73%, due 02/25/13 | 264,532 | |||||||||||||
| Credit Cards — 0.8% | |||||||||||||||
| 1,900,000 | American Express Credit Account Master Trust, Series 05-5, Class A, 1 mo. LIBOR + .04%, 0.50%, due 02/15/13 | 1,805,456 | |||||||||||||
| 700,000 | American Express Credit Account Master Trust, Series 06-1, Class A, 1 mo. LIBOR + .03%, 0.49%, due 12/15/13 | 641,123 | |||||||||||||
| 300,000 | American Express Issuance Trust, Series 07-1, Class A, 1 mo. LIBOR + .20%, 0.66%, due 09/15/11 | 286,638 | |||||||||||||
| 100,000 | Bank of America Credit Card Trust, Series 06-A12, Class A12, 1 mo. LIBOR + .02%, 0.48%, due 03/15/14 | 89,440 | |||||||||||||
| 1,100,000 | Cabela's Master Credit Card Trust, Series 08-4A, Class A2, 144A, 1 mo. LIBOR + 3.00%, 3.46%, due 09/15/14 | 905,025 | |||||||||||||
| 700,000 | Capital One Multi-Asset Execution Trust, Series 04-A7, Class A7, 3 mo. LIBOR + .15%, 1.38%, due 06/16/14 | 629,859 | |||||||||||||
| 800,000 | Capital One Multi-Asset Execution Trust, Series 06-A14, Class A, 1 mo. LIBOR + .01%, 0.47%, due 08/15/13 | 743,600 | |||||||||||||
| 200,000 | Capital One Multi-Asset Execution Trust, Series 07-A4, Class A4, 1 mo. LIBOR + .03%, 0.49%, due 03/16/15 | 170,740 | |||||||||||||
| 500,000 | Capital One Multi-Asset Execution Trust, Series 07-A6, Class A6, 1 mo. LIBOR + .07%, 0.53%, due 05/15/13 | 473,490 | |||||||||||||
| 600,000 | Capital One Multi-Asset Execution Trust, Series 08-A6, Class A6, 1 mo. LIBOR + 1.10%, 1.56%, due 03/17/14 | 548,250 | |||||||||||||
| 1,300,000 | Charming Shoppes Master Trust, Series 07-1A, Class A1, 144A, 1 mo. LIBOR + 1.25%, 1.71%, due 09/15/17 | 894,517 | |||||||||||||
| EUR | 1,100,000 | Citibank Credit Card Issuance Trust, Series 04-A2, Class A, 3 mo. EUR LIBOR + 0.10%, 1.97%, due 05/24/13 | 1,259,772 | ||||||||||||
| 1,300,000 | Citibank OMNI Master Trust, Series 07-A9A, Class A9, 144A, 1 mo. LIBOR + 1.10%, 1.57%, due 12/23/13 | 1,174,290 | |||||||||||||
| 400,000 | Discover Card Master Trust I, Series 96-4, Class A, 1 mo. LIBOR + .38%, 0.83%, due 10/16/13 | 358,800 | |||||||||||||
| 400,000 | Discover Card Master Trust I, Series 05-4, Class A1, 1 mo. LIBOR + .06%, 0.52%, due 06/18/13 | 358,000 | |||||||||||||
| 500,000 | Discover Card Master Trust I, Series 05-4, Class A2, 1 mo. LIBOR + .09%, 0.55%, due 06/16/15 | 372,031 | |||||||||||||
See accompanying notes to the financial statements.
7
GMO Global Balanced Asset Allocation Fund
(A Series of GMO Trust)
Schedule of Investments — (Continued)
(showing percentage of total net assets)
February 28, 2009
| Par Value ($) | Description | Value ($) | |||||||||||||
| Credit Cards — continued | |||||||||||||||
| 1,900,000 | Discover Card Master Trust I, Series 06-2, Class A2, 1 mo. LIBOR + .03%, 0.49%, due 01/16/14 | 1,668,466 | |||||||||||||
| 100,000 | Discover Card Master Trust I, Series 07-1, Class A, 1 mo. LIBOR + .01%, 0.47%, due 08/15/12 | 94,500 | |||||||||||||
| 700,000 | GE Capital Credit Card Master Note Trust, Series 05-1, Class A, 1 mo. LIBOR + .04%, 0.50%, due 03/15/13 | 647,836 | |||||||||||||
| 1,200,000 | GE Capital Credit Card Master Note Trust, Series 07-3, Class A1, 1 mo. LIBOR + .01%, 0.47%, due 06/15/13 | 1,095,000 | |||||||||||||
| 1,300,000 | Household Credit Card Master Note Trust I, Series 07-1, Class A, 1 mo. LIBOR + .05%, 0.51%, due 04/15/13 | 1,112,313 | |||||||||||||
| 600,000 | Household Credit Card Master Note Trust I, Series 07-2, Class A, 1 mo. LIBOR + .55%, 1.01%, due 07/15/13 | 499,875 | |||||||||||||
| 400,000 | MBNA Credit Card Master Note Trust, Series 04-A8, Class A8, 1 mo. LIBOR + .15%, 0.61%, due 01/15/14 | 366,116 | |||||||||||||
| 1,300,000 | National City Credit Card Master Trust, Series 08-3, Class A, 1 mo. LIBOR + 1.80%, 2.26%, due 05/15/13 | 1,020,500 | |||||||||||||
| 1,400,000 | World Financial Network Credit Card Master Trust, Series 04-A, Class A, 1 mo. LIBOR + .18%, 0.64%, due 03/15/13 | 1,372,896 | |||||||||||||
| 400,000 | World Financial Network Credit Card Master Trust, Series 06-A, Class A, 144A, 1 mo. LIBOR + .13%, 0.59%, due 02/15/17 | 283,832 | |||||||||||||
| Total Credit Cards | 18,872,365 | ||||||||||||||
| Equipment Leases — 0.1% | |||||||||||||||
| 400,000 | CNH Equipment Trust, Series 08-A, Class A4B, 1 mo. LIBOR + 1.95%, 2.41%, due 08/15/14 | 358,000 | |||||||||||||
| 600,000 | CNH Equipment Trust, Series 07-B, Class A3B, 1 mo. LIBOR + .60%, 1.06%, due 10/17/11 | 584,316 | |||||||||||||
| 1,100,000 | GE Equipment Midticket LLC, Series 07-1, Class A3B, 1 mo. LIBOR + .25%, 0.71%, due 06/14/11 | 984,500 | |||||||||||||
| Total Equipment Leases | 1,926,816 | ||||||||||||||
| Insurance Premiums — 0.0% | |||||||||||||||
| 1,000,000 | AICCO Premium Finance Master Trust, Series 07-AA, Class A, 144A, 1 mo. LIBOR + .05%, 0.51%, due 12/15/11 | 957,200 | |||||||||||||
See accompanying notes to the financial statements.
8
GMO Global Balanced Asset Allocation Fund
(A Series of GMO Trust)
Schedule of Investments — (Continued)
(showing percentage of total net assets)
February 28, 2009
| Par Value ($) | Description | Value ($) | |||||||||||||
| Insured Auto Financing — 0.3% | |||||||||||||||
| 300,000 | Aesop Funding II LLC, Series 05-1A, Class A3, 144A, MBIA, 1 mo. LIBOR + .12%, 0.59%, due 04/20/11 | 243,984 | |||||||||||||
| 800,000 | AmeriCredit Automobile Receivables Trust, Series 07-AX, Class A4, XL, 1 mo. LIBOR + .04%, 0.49%, due 10/06/13 | 536,240 | |||||||||||||
| 326,832 | AmeriCredit Automobile Receivables Trust, Series 05-BM, Class A4, MBIA, 1 mo. LIBOR + .08%, 0.53%, due 05/06/12 | 300,646 | |||||||||||||
| 500,000 | AmeriCredit Automobile Receivables Trust, Series 07-BF, Class A4, FSA, 1 mo. LIBOR + .05%, 0.50%, due 12/06/13 | 325,000 | |||||||||||||
| 500,000 | AmeriCredit Automobile Receivables Trust, Series 07-DF, Class A4B, FSA, 1 mo. LIBOR + .80%, 1.25%, due 06/06/14 | 272,845 | |||||||||||||
| 287,966 | AmeriCredit Automobile Receivables Trust, Series 07-CM, Class A3B, MBIA, 1 mo. LIBOR + .03%, 0.48%, due 05/07/12 | 264,929 | |||||||||||||
| 800,000 | AmeriCredit Prime Automobile Receivable Trust, Series 07-2M, Class A4B, MBIA, 1 mo. LIBOR + .50%, 0.95%, due 03/08/16 | 422,728 | |||||||||||||
| 400,000 | ARG Funding Corp., Series 05-2A, Class A3, 144A, AMBAC, 1 mo. LIBOR + .14%, 0.61%, due 05/20/10 | 382,656 | |||||||||||||
| 876,137 | Capital One Auto Finance Trust, Series 06-A, Class A4, AMBAC, 1 mo. LIBOR + .01%, 0.47%, due 12/15/12 | 794,043 | |||||||||||||
| 800,000 | Capital One Auto Finance Trust, Series 06-B, Class A4, MBIA, 1 mo. LIBOR + .02%, 0.47%, due 07/15/13 | 638,008 | |||||||||||||
| 200,000 | Capital One Auto Finance Trust, Series 07-A, Class A4, AMBAC, 1 mo. LIBOR + .02%, 0.48%, due 11/15/13 | 140,066 | |||||||||||||
| 857,760 | Capital One Auto Finance Trust, Series 07-C, Class A3B, FGIC, 1 mo. LIBOR + .51%, 0.97%, due 04/16/12 | 798,377 | |||||||||||||
| 100,000 | Hertz Vehicle Financing LLC, Series 05-2A, Class A3, 144A, AMBAC, 1 mo. LIBOR + .20%, 0.67%, due 02/25/11 | 76,610 | |||||||||||||
| 300,000 | Hertz Vehicle Financing LLC, Series 05-2A, Class A5, 144A, AMBAC, 1 mo. LIBOR + .25%, 0.72%, due 11/25/11 | 177,807 | |||||||||||||
| 1,300,000 | Santander Drive Auto Receivables Trust, Series 07-1, Class A4, FGIC, 1 mo. LIBOR + .05%, 0.51%, due 09/15/14 | 884,938 | |||||||||||||
| 800,000 | Santander Drive Auto Receivables Trust, Series 07-3, Class A4B, FGIC, 1 mo. LIBOR + .65%, 1.11%, due 10/15/14 | 544,824 | |||||||||||||
| 1,700,000 | Triad Auto Receivables Owner Trust, Series 07-B, Class A4B, FSA, 1 mo. LIBOR + 1.20%, 1.65%, due 07/14/14 | 1,200,030 | |||||||||||||
| 135,584 | UPFC Auto Receivables Trust, Series 06-B, Class A3, AMBAC, 5.01%, due 08/15/12 | 124,059 | |||||||||||||
| Total Insured Auto Financing | 8,127,790 | ||||||||||||||
See accompanying notes to the financial statements.
9
GMO Global Balanced Asset Allocation Fund
(A Series of GMO Trust)
Schedule of Investments — (Continued)
(showing percentage of total net assets)
February 28, 2009
| Par Value ($) | Description | Value ($) | |||||||||||||
| Insured Business Loans — 0.0% | |||||||||||||||
| 324,814 | CNL Commercial Mortgage Loan Trust, Series 03-2A, Class A1, 144A, AMBAC, 1 mo. LIBOR + .44%, 0.91%, due 10/25/30 | 64,963 | |||||||||||||
| Insured Credit Cards — 0.1% | |||||||||||||||
| 1,000,000 | Cabela's Master Credit Card Trust, Series 04-2A, Class A, 144A, AMBAC, 1 mo. LIBOR + .12%, 0.58%, due 03/15/11 | 998,687 | |||||||||||||
| Insured High Yield Collateralized Debt Obligations — 0.0% | |||||||||||||||
| 149,799 | GSC Partners CDO Fund Ltd., Series 2A, Class A, 144A, FSA, 6 mo. LIBOR + .52%, 3.06%, due 05/22/13 | 106,791 | |||||||||||||
| 500,000 | GSC Partners CDO Fund Ltd., Series 03-4A, Class A3, 144A, AMBAC, 3 mo. LIBOR + .46%, 1.60%, due 12/16/15 | 400,000 | |||||||||||||
| Total Insured High Yield Collateralized Debt Obligations | 506,791 | ||||||||||||||
| Insured Other — 0.1% | |||||||||||||||
| 800,000 | DB Master Finance LLC, Series 06-1, Class A2, 144A, AMBAC, 5.78%, due 06/20/31 | 560,000 | |||||||||||||
| 1,500,000 | Dominos Pizza Master Issuer LLC, Series 07-1, Class A2, 144A, MBIA, 5.26%, due 04/25/37 | 750,000 | |||||||||||||
| 843,644 | Henderson Receivables LLC, Series 06-3A, Class A1, 144A, MBIA, 1 mo. LIBOR + .20%, 0.66%, due 09/15/41 | 530,357 | |||||||||||||
| 860,283 | Henderson Receivables LLC, Series 06-4A, Class A1, 144A, MBIA, 1 mo. LIBOR + .20%, 0.66%, due 12/15/41 | 548,060 | |||||||||||||
| 633,413 | TIB Card Receivables Fund, 144A, FGIC, 3 mo. LIBOR + .25%, 1.68%, due 01/05/14 | 401,584 | |||||||||||||
| 100,000 | Toll Road Investment Part II, Series B, 144A, MBIA, Zero Coupon, due 02/15/30 | 18,138 | |||||||||||||
| 900,000 | Toll Road Investment Part II, Series C, 144A, MBIA, Zero Coupon, due 02/15/37 | 92,277 | |||||||||||||
| Total Insured Other | 2,900,416 | ||||||||||||||
| Insured Residential Asset-Backed Securities (United States) — 0.0% | |||||||||||||||
| 108,046 | Ameriquest Mortgage Securities, Inc., Series 04-R6, Class A1, XL, 1 mo. LIBOR + .21%, 0.68%, due 07/25/34 | 61,587 | |||||||||||||
| 134,765 | Citigroup Mortgage Loan Trust, Inc., Series 03-HE3, Class A, AMBAC, 1 mo. LIBOR + .38%, 0.85%, due 12/25/33 | 76,816 | |||||||||||||
See accompanying notes to the financial statements.
10
GMO Global Balanced Asset Allocation Fund
(A Series of GMO Trust)
Schedule of Investments — (Continued)
(showing percentage of total net assets)
February 28, 2009
| Par Value ($) | Description | Value ($) | |||||||||||||
| Insured Residential Asset-Backed Securities (United States) — continued | |||||||||||||||
| 35,049 | Quest Trust, Series 04-X1, Class A, 144A, AMBAC, 1 mo. LIBOR + .33%, 0.80%, due 03/25/34 | 22,291 | |||||||||||||
| 985,445 | Residential Asset Mortgage Products, Inc., Series 05-RS9, Class AI3, FGIC, 1 mo. LIBOR + .22%, 0.69%, due 11/25/35 | 227,638 | |||||||||||||
| Total Insured Residential Asset-Backed Securities (United States) | 388,332 | ||||||||||||||
| Insured Residential Mortgage-Backed Securities (United States) — 0.0% | |||||||||||||||
| 19,291 | Chevy Chase Mortgage Funding Corp., Series 03-4A, Class A1, 144A, AMBAC, 1 mo. LIBOR + .34%, 0.81%, due 10/25/34 | 9,260 | |||||||||||||
| 44,168 | Chevy Chase Mortgage Funding Corp., Series 04-1A, Class A2, 144A, AMBAC, 1 mo. LIBOR + .33%, 0.80%, due 01/25/35 | 18,109 | |||||||||||||
| 551,612 | Countrywide Home Equity Loan Trust, Series 07-E, Class A, MBIA, 1 mo. LIBOR + .15%, 0.61%, due 06/15/37 | 137,903 | |||||||||||||
| 300,000 | GMAC Mortgage Corp. Loan Trust, Series 04-HE3, Class A3, FSA, 1 mo. LIBOR + .23%, 0.70%, due 10/25/34 | 270,000 | |||||||||||||
| 20,807 | GreenPoint Home Equity Loan Trust, Series 04-1, Class A, AMBAC, 1 mo. LIBOR + .23%, 0.93%, due 07/25/29 | 11,380 | |||||||||||||
| 25,056 | GreenPoint Home Equity Loan Trust, Series 04-4, Class A, AMBAC, 1 mo. LIBOR + .28%, 1.02%, due 08/15/30 | 10,945 | |||||||||||||
| 48,301 | Lehman ABS Corp., Series 04-2, Class A, AMBAC, 1 mo. LIBOR + .22%, 0.91%, due 06/25/34 | 11,592 | |||||||||||||
| 11,839 | Residential Funding Mortgage Securities II, Series 03-HS1, Class AII, FGIC, 1 mo. LIBOR + .29%, 0.76%, due 12/25/32 | 5,753 | |||||||||||||
| 195,058 | SBI Heloc Trust, Series 05-HE1, Class 1A, 144A, FSA, 1 mo. LIBOR + .19%, 0.66%, due 11/25/35 | 97,529 | |||||||||||||
| 78,150 | Wachovia Asset Securitization, Inc., Series 02-HE1, Class A, AMBAC, 1 mo. LIBOR + .37%, 0.84%, due 09/27/32 | 44,792 | |||||||||||||
| 68,272 | Wachovia Asset Securitization, Inc., Series 04-HE1, Class A, MBIA, 1 mo. LIBOR + .22%, 0.69%, due 06/25/34 | 26,662 | |||||||||||||
| Total Insured Residential Mortgage-Backed Securities (United States) | 643,925 | ||||||||||||||
| Insured Time Share — 0.0% | |||||||||||||||
| 37,232 | Cendant Timeshare Receivables Funding LLC, Series 04-1A, Class A2, 144A, MBIA, 1 mo. LIBOR + .18%, 0.65%, due 05/20/16 | 30,020 | |||||||||||||
| 91,784 | Cendant Timeshare Receivables Funding LLC, Series 05-1A, Class A2, 144A, FGIC, 1 mo. LIBOR + .18%, 0.65%, due 05/20/17 | 66,056 | |||||||||||||
See accompanying notes to the financial statements.
11
GMO Global Balanced Asset Allocation Fund
(A Series of GMO Trust)
Schedule of Investments — (Continued)
(showing percentage of total net assets)
February 28, 2009
| Par Value ($) | Description | Value ($) | |||||||||||||
| Insured Time Share — continued | |||||||||||||||
| 162,354 | Sierra Receivables Funding Co., Series 06-1A, Class A2, 144A, MBIA, 1 mo. LIBOR + .15%, 0.62%, due 05/20/18 | 123,016 | |||||||||||||
| 193,917 | Sierra Receivables Funding Co., Series 07-1A, Class A2, 144A, FGIC, 1 mo. LIBOR + .15%, 0.92%, due 03/20/19 | 135,681 | |||||||||||||
| 543,565 | Sierra Receivables Funding Co., Series 07-2A, Class A2, 144A, MBIA, 1 mo. LIBOR + 1.00%, 1.47%, due 09/20/19 | 333,344 | |||||||||||||
| Total Insured Time Share | 688,117 | ||||||||||||||
| Insured Transportation — 0.0% | |||||||||||||||
| 206,667 | GE Seaco Finance SRL, Series 04-1A, Class A, 144A, AMBAC, 1 mo. LIBOR + .30%, 0.76%, due 04/17/19 | 111,600 | |||||||||||||
| Investment Grade Corporate Collateralized Debt Obligations — 0.2% | |||||||||||||||
| 1,000,000 | Counts Trust, Series 04-2, 144A, 3 mo. LIBOR + .95%, 2.48%, due 09/20/09 | 960,820 | |||||||||||||
| 1,000,000 | Morgan Stanley ACES SPC, Series 04-12, Class I, 144A, 3 mo. LIBOR + .80%, 3.58%, due 08/05/09 | 628,500 | |||||||||||||
| 1,000,000 | Morgan Stanley ACES SPC, Series 04-15, Class I, 144A, 3 mo. LIBOR + .45%, 1.98%, due 12/20/09 | 688,500 | |||||||||||||
| 1,000,000 | Morgan Stanley ACES SPC, Series 04-15, Class II, 144A, 3 mo. LIBOR + .65%, 2.18%, due 12/20/09 | 553,500 | |||||||||||||
| 1,000,000 | Morgan Stanley ACES SPC, Series 05-2A, Class A, 144A, 3 mo. LIBOR + .45%, 1.98%, due 03/20/10 | 487,500 | |||||||||||||
| 1,000,000 | Morgan Stanley ACES SPC, Series 05-10, Class A1, 144A, 3 mo. LIBOR + .52%, 2.05%, due 03/20/10 | 388,000 | |||||||||||||
| 1,000,000 | Morgan Stanley ACES SPC, Series 05-15, Class A, 144A, 3 mo. LIBOR + .40%, 1.93%, due 12/20/10 | 403,500 | |||||||||||||
| 1,000,000 | Morgan Stanley ACES SPC, Series 06-13A, Class A, 144A, 3 mo. LIBOR + .29%, 1.82%, due 06/20/13 | 168,500 | |||||||||||||
| 1,000,000 | Prism Orso Trust, Series 04-MAPL, Class CERT, 144A, 3 mo. LIBOR + .70%, 2.23%, due 08/01/11 | 572,700 | |||||||||||||
| 1,000,000 | Salisbury International Investments Ltd., 3 mo. LIBOR + .42%, 1.95%, due 06/22/10 | 242,800 | |||||||||||||
| Total Investment Grade Corporate Collateralized Debt Obligations | 5,094,320 | ||||||||||||||
See accompanying notes to the financial statements.
12
GMO Global Balanced Asset Allocation Fund
(A Series of GMO Trust)
Schedule of Investments — (Continued)
(showing percentage of total net assets)
February 28, 2009
| Par Value ($) | Description | Value ($) | |||||||||||||
| Residential Asset-Backed Securities (United States) — 0.6% | |||||||||||||||
| 74,371 | Accredited Mortgage Loan Trust, Series 07-1, Class A1, 1 mo. LIBOR + .05%, 0.52%, due 02/25/37 | 66,190 | |||||||||||||
| 37,311 | Accredited Mortgage Loan Trust, Series 04-4, Class A1B, 1 mo. LIBOR + .39%, 0.86%, due 01/25/35 | 16,277 | |||||||||||||
| 700,000 | ACE Securities Corp., Series 06-CW1, Class A2B, 1 mo. LIBOR + .10%, 0.57%, due 07/25/36 | 298,046 | |||||||||||||
| 348,820 | ACE Securities Corp., Series 06-HE3, Class A2B, 1 mo. LIBOR + .09%, 0.56%, due 06/25/36 | 232,743 | |||||||||||||
| 307,056 | ACE Securities Corp., Series 07-WM1, Class A2A, 1 mo. LIBOR + .07%, 0.54%, due 11/25/36 | 160,532 | |||||||||||||
| 116,566 | ACE Securities Corp., Series 06-ASL1, Class A, 1 mo. LIBOR + .14%, 0.61%, due 02/25/36 | 18,637 | |||||||||||||
| 400,000 | ACE Securities Corp., Series 06-OP1, Class A2C, 1 mo. LIBOR + .15%, 0.62%, due 04/25/36 | 147,324 | |||||||||||||
| 391,475 | ACE Securities Corp., Series 07-HE1, Class A2A, 1 mo. LIBOR + .09%, 0.56%, due 01/25/37 | 236,494 | |||||||||||||
| 149,888 | ACE Securities Corp., Series 06-SL1, Class A, 1 mo. LIBOR + .16%, 0.63%, due 09/25/35 | 16,846 | |||||||||||||
| 307,028 | ACE Securities Corp., Series 06-ASP1, Class A2B, 1 mo. LIBOR + .15%, 0.62%, due 12/25/35 | 185,082 | |||||||||||||
| 193,109 | ACE Securities Corp., Series 05-ASP1, Class A2C, 1 mo. LIBOR + .27%, 0.74%, due 09/25/35 | 117,797 | |||||||||||||
| 391,729 | ACE Securities Corp., Series 06-ASP4, Class A2B, 1 mo. LIBOR + .10%, 0.57%, due 08/25/36 | 195,865 | |||||||||||||
| 400,000 | ACE Securities Corp., Series 06-SL3, Class A2, 1 mo. LIBOR + .17%, 0.64%, due 06/25/36 | 15,092 | |||||||||||||
| 391,385 | ACE Securities Corp., Series 06-ASP2, Class A2B, 1 mo. LIBOR + .14%, 0.61%, due 03/25/36 | 263,296 | |||||||||||||
| 300,000 | ACE Securities Corp., Series 06-ASP2, Class A2C, 1 mo. LIBOR + .18%, 0.65%, due 03/25/36 | 107,688 | |||||||||||||
| 200,000 | ACE Securities Corp., Series 06-HE2, Class A2C, 1 mo. LIBOR + .16%, 0.63%, due 05/25/36 | 73,662 | |||||||||||||
| 700,000 | ACE Securities Corp., Series 06-ASP5, Class A2C, 1 mo. LIBOR + .18%, 0.65%, due 10/25/36 | 168,000 | |||||||||||||
| 312,552 | ACE Securities Corp., Series 06-SL3, Class A1, 1 mo. LIBOR + .10%, 0.57%, due 06/25/36 | 21,879 | |||||||||||||
See accompanying notes to the financial statements.
13
GMO Global Balanced Asset Allocation Fund
(A Series of GMO Trust)
Schedule of Investments — (Continued)
(showing percentage of total net assets)
February 28, 2009
| Par Value ($) | Description | Value ($) | |||||||||||||
| Residential Asset-Backed Securities (United States) — continued | |||||||||||||||
| 387,257 | Alliance Bancorp Trust, Series 07-S1, Class A1, 144A, 1 mo. LIBOR + .20%, 0.67%, due 05/25/37 | 49,701 | |||||||||||||
| 518,376 | Argent Securities, Inc., Series 06-W2, Class A2B, 1 mo. LIBOR + .19%, 0.66%, due 03/25/36 | 259,188 | |||||||||||||
| 1,600,000 | Argent Securities, Inc., Series 06-M1, Class A2C, 1 mo. LIBOR + .15%, 0.62%, due 07/25/36 | 403,000 | |||||||||||||
| 300,000 | Argent Securities, Inc., Series 06-W5, Class A2C, 1 mo. LIBOR + .15%, 0.62%, due 06/25/36 | 203,250 | |||||||||||||
| 500,000 | Argent Securities, Inc., Series 06-M2, Class A2B, 1 mo. LIBOR + .11%, 0.58%, due 09/25/36 | 205,000 | |||||||||||||
| 130,475 | Argent Securities, Inc., Series 04-W8, Class A5, 1 mo. LIBOR + .52%, 0.99%, due 05/25/34 | 18,878 | |||||||||||||
| 1,066,104 | Asset Backed Funding Certificates, Series 07-NC1, Class A1, 144A, 1 mo. LIBOR + .22%, 0.69%, due 05/25/37 | 718,128 | |||||||||||||
| 300,000 | Asset Backed Funding Certificates, Series 06-OPT2, Class A3C, 1 mo. LIBOR + .15%, 0.62%, due 10/25/36 | 141,360 | |||||||||||||
| 600,000 | Asset Backed Funding Certificates, Series 06-OPT2, Class A3B, 1 mo. LIBOR + .11%, 0.58%, due 10/25/36 | 523,800 | |||||||||||||
| 61,060 | Asset Backed Funding Certificates, Series 06-OPT3, Class A3A, 1 mo. LIBOR + .06%, 0.53%, due 11/25/36 | 56,450 | |||||||||||||
| 256,037 | Bayview Financial Acquisition Trust, Series 04-B, Class A1, 144A, 1 mo. LIBOR + .50%, 1.50%, due 05/28/39 | 170,776 | |||||||||||||
| 256,037 | Bayview Financial Acquisition Trust, Series 04-B, Class A2, 144A, 1 mo. LIBOR + .65%, 1.80%, due 05/28/39 | 170,879 | |||||||||||||
| 400,000 | Bayview Financial Acquisition Trust, Series 05-A, Class A1, 144A, 1 mo. LIBOR + .50%, 1.50%, due 02/28/40 | 220,375 | |||||||||||||
| 177,184 | Bear Stearns Asset Backed Securities, Inc., Series 07-AQ1, Class A1, 1 mo. LIBOR + .11%, 0.58%, due 11/25/36 | 115,169 | |||||||||||||
| 300,000 | Bear Stearns Asset Backed Securities, Inc., Series 07-AQ1, Class A2, 1 mo. LIBOR + .20%, 0.67%, due 11/25/36 | 60,000 | |||||||||||||
| 256,824 | Bear Stearns Mortgage Funding Trust, Series 07-SL2, Class 1A, 1 mo. LIBOR + .16%, 0.63%, due 02/25/37 | 19,262 | |||||||||||||
| 152,810 | Carrington Mortgage Loan Trust, Series 07-FRE1, Class A1, 1 mo. LIBOR + .12%, 0.59%, due 02/25/37 | 127,596 | |||||||||||||
| 1,300,000 | Carrington Mortgage Loan Trust, Series 07-FRE1, Class A2, 1 mo. LIBOR + .20%, 0.67%, due 02/25/37 | 617,500 | |||||||||||||
See accompanying notes to the financial statements.
14
GMO Global Balanced Asset Allocation Fund
(A Series of GMO Trust)
Schedule of Investments — (Continued)
(showing percentage of total net assets)
February 28, 2009
| Par Value ($) | Description | Value ($) | |||||||||||||
| Residential Asset-Backed Securities (United States) — continued | |||||||||||||||
| 500,000 | Centex Home Equity, Series 06-A, Class AV3, 1 mo. LIBOR + .16%, 0.63%, due 06/25/36 | 340,100 | |||||||||||||
| 12,185 | Chase Funding Mortgage Loan Trust, Series 03-3, Class 2A2, 1 mo. LIBOR + .27%, 1.01%, due 04/25/33 | 8,773 | |||||||||||||
| 400,000 | Citigroup Mortgage Loan Trust, Inc., Series 06-HE3, Class A2C, 1 mo. LIBOR + .16%, 0.63%, due 12/25/36 | 104,000 | |||||||||||||
| 6,079 | Citigroup Mortgage Loan Trust, Inc., Series 04-OPT1, Class A1B, 1 mo. LIBOR + .41%, 0.88%, due 10/25/34 | 2,348 | |||||||||||||
| 1,000,000 | Countrywide Asset-Backed Certificates, Series 06-BC3, Class 2A2, 1 mo. LIBOR + .14%, 0.61%, due 02/25/37 | 631,200 | |||||||||||||
| 333,812 | Countrywide Asset-Backed Certificates, Series 06-BC5, Class 2A1, 1 mo. LIBOR + .08%, 0.55%, due 03/25/37 | 306,106 | |||||||||||||
| 206,124 | Credit-Based Asset Servicing & Securitization, Series 06-RP1, Class A1, 144A, 1 mo. LIBOR + .11%, 0.58%, due 04/25/36 | 173,821 | |||||||||||||
| 18,434 | Equity One ABS, Inc., Series 04-1, Class AV2, 1 mo. LIBOR + .30%, 0.77%, due 04/25/34 | 3,284 | |||||||||||||
| 500,000 | First Franklin Mortgage Loan Asset Backed Certificates, Series 06-FF5, Class 2A3, 1 mo. LIBOR + .16%, 0.63%, due 04/25/36 | 198,125 | |||||||||||||
| 154,784 | First Franklin Mortgage Loan Asset Backed Certificates, Series 06-FF18, Class A2A, 1 mo. LIBOR + .07%, 0.54%, due 12/25/37 | 144,723 | |||||||||||||
| 191,211 | Fremont Home Loan Trust, Series 06-B, Class 2A2, 1 mo. LIBOR + .10%, 0.57%, due 08/25/36 | 169,460 | |||||||||||||
| 600,000 | Fremont Home Loan Trust, Series 06-B, Class 2A3, 1 mo. LIBOR + .16%, 0.63%, due 08/25/36 | 192,000 | |||||||||||||
| 177,768 | Fremont Home Loan Trust, Series 06-A, Class 1A2, 1 mo. LIBOR + .20%, 0.67%, due 05/25/36 | 114,716 | |||||||||||||
| 152,609 | Household Home Equity Loan Trust, Series 05-2, Class A2, 1 mo. LIBOR + .31%, 0.78%, due 01/20/35 | 93,759 | |||||||||||||
| 142,238 | Household Home Equity Loan Trust, Series 05-3, Class A2, 1 mo. LIBOR + .29%, 0.76%, due 01/20/35 | 88,388 | |||||||||||||
| 456,762 | Household Home Equity Loan Trust, Series 06-1, Class A1, 1 mo. LIBOR + .16%, 0.63%, due 01/20/36 | 301,249 | |||||||||||||
| 1,000,000 | J.P. Morgan Mortgage Acquisition Corp., Series 06-WMC4, Class A3, 1 mo. LIBOR + .12%, 0.59%, due 12/25/36 | 340,000 | |||||||||||||
| 188,279 | Master Asset-Backed Securities Trust, Series 05-FRE1, Class A4, 1 mo. LIBOR + .25%, 0.72%, due 10/25/35 | 145,916 | |||||||||||||
See accompanying notes to the financial statements.
15
GMO Global Balanced Asset Allocation Fund
(A Series of GMO Trust)
Schedule of Investments — (Continued)
(showing percentage of total net assets)
February 28, 2009
| Par Value ($) | Description | Value ($) | |||||||||||||
| Residential Asset-Backed Securities (United States) — continued | |||||||||||||||
| 418,876 | Master Asset-Backed Securities Trust, Series 06-WMC1, Class A2, 1 mo. LIBOR + .11%, 0.58%, due 02/25/36 | 389,555 | |||||||||||||
| 400,000 | Master Asset-Backed Securities Trust, Series 06-HE2, Class A3, 1 mo. LIBOR + .15%, 0.62%, due 06/25/36 | 106,000 | |||||||||||||
| 296,096 | Master Asset-Backed Securities Trust, Series 06-AM3, Class A2, 1 mo. LIBOR + .13%, 0.60%, due 10/25/36 | 257,604 | |||||||||||||
| 800,000 | Master Asset-Backed Securities Trust, Series 06-HE3, Class A3, 1 mo. LIBOR + .15%, 0.62%, due 08/25/36 | 200,000 | |||||||||||||
| 500,000 | Master Asset-Backed Securities Trust, Series 06-NC3, Class A4, 1 mo. LIBOR + .16%, 0.63%, due 10/25/36 | 132,500 | |||||||||||||
| 700,000 | Master Asset-Backed Securities Trust, Series 06-FRE2, Class A4, 1 mo. LIBOR + .15%, 0.62%, due 03/25/36 | 280,000 | |||||||||||||
| 232,048 | Master Second Lien Trust, Series 06-1, Class A, 1 mo. LIBOR + .16%, 0.63%, due 03/25/36 | 25,525 | |||||||||||||
| 403,935 | Merrill Lynch Mortgage Investors, Series 07-HE2, Class A2A, 1 mo. LIBOR + .12%, 0.59%, due 02/25/37 | 316,142 | |||||||||||||
| 144,742 | Morgan Stanley Capital, Inc., Series 04-SD1, Class A, 1 mo. LIBOR + .40%, 0.87%, due 08/25/34 | 96,977 | |||||||||||||
| 1,000,000 | Morgan Stanley Capital, Inc., Series 07-HE4, Class A2C, 1 mo. LIBOR + .23%, 0.70%, due 02/25/37 | 280,000 | |||||||||||||
| 450,304 | Morgan Stanley Home Equity Loans, Series 07-2, Class A1, 1 mo. LIBOR + .10%, 0.57%, due 04/25/37 | 355,740 | |||||||||||||
| 300,000 | Morgan Stanley IXIS Real Estate Capital Trust, Series 06-2, Class A3, 1 mo. LIBOR + .15%, 0.62%, due 11/25/36 | 105,000 | |||||||||||||
| 331,428 | People's Choice Home Loan Securities Trust, Series 05-4, Class 1A2, 1 mo. LIBOR + .26%, 0.73%, due 12/25/35 | 248,571 | |||||||||||||
| 455,957 | RAAC Series Trust, Series 06-SP1, Class A2, 1 mo. LIBOR + .19%, 0.66%, due 09/25/45 | 370,982 | |||||||||||||
| 92,461 | Residential Asset Mortgage Products, Inc., Series 05-RS4, Class A3, 1 mo. LIBOR + .23%, 0.70%, due 04/25/35 | 84,139 | |||||||||||||
| 158,951 | Residential Asset Mortgage Products, Inc., Series 05-RS8, Class A2, 1 mo. LIBOR + .29%, 0.76%, due 10/25/33 | 111,265 | |||||||||||||
| 138,197 | Residential Asset Mortgage Products, Inc., Series 06-RZ4, Class A1, 1 mo. LIBOR + .09%, 0.56%, due 10/25/36 | 129,905 | |||||||||||||
| 311,849 | Residential Asset Securities Corp., Series 07-KS3, Class AI1, 1 mo. LIBOR + .11%, 0.58%, due 04/25/37 | 271,309 | |||||||||||||
See accompanying notes to the financial statements.
16
GMO Global Balanced Asset Allocation Fund
(A Series of GMO Trust)
Schedule of Investments — (Continued)
(showing percentage of total net assets)
February 28, 2009
| Par Value ($) | Description | Value ($) | |||||||||||||
| Residential Asset-Backed Securities (United States) — continued | |||||||||||||||
| 398,022 | Residential Asset Securities Corp., Series 05-KS12, Class A2, 1 mo. LIBOR + .25%, 0.72%, due 01/25/36 | 308,666 | |||||||||||||
| 9,319 | Saxon Asset Securities Trust, Series 04-1, Class A, 1 mo. LIBOR + .27%, 1.01%, due 03/25/35 | 2,414 | |||||||||||||
| 181,035 | Securitized Asset Backed Receivables LLC, Series 06-NC1, Class A2, 1 mo. LIBOR + .16%, 0.63%, due 03/25/36 | 135,776 | |||||||||||||
| 153,226 | Security National Mortgage Loan Trust, Series 06-2A, Class A1, 144A, 1 mo. LIBOR + .29%, 0.76%, due 10/25/36 | 139,819 | |||||||||||||
| 88,956 | SG Mortgage Securities Trust, Series 05-OPT1, Class A2, 1 mo. LIBOR + .26%, 0.73%, due 10/25/35 | 73,389 | |||||||||||||
| 124,804 | Soundview Home Equity Loan Trust, Series 07-NS1, Class A1, 1 mo. LIBOR + .12%, 0.59%, due 01/25/37 | 103,158 | |||||||||||||
| 500,000 | Specialty Underwriting & Residential Finance, Series 06-BC3, Class A2C, 1 mo. LIBOR + .15%, 0.62%, due 06/25/37 | 227,969 | |||||||||||||
| 300,000 | Structured Asset Investment Loan Trust, Series 06-1, Class A3, 1 mo. LIBOR + .20%, 0.67%, due 01/25/36 | 105,000 | |||||||||||||
| 233,213 | Structured Asset Securities Corp., Series 05-S6, Class A2, 1 mo. LIBOR + .29%, 0.76%, due 11/25/35 | 37,314 | |||||||||||||
| 672,555 | Yale Mortgage Loan Trust, Series 07-1, Class A, 144A, 1 mo. LIBOR + .40%, 0.87%, due 06/25/37 | 393,445 | |||||||||||||
| Total Residential Asset-Backed Securities (United States) | 15,067,894 | ||||||||||||||
| Residential Mortgage-Backed Securities (Australian) — 0.2% | |||||||||||||||
| 178,544 | Australian Mortgage Securities II, Series G3, Class A1A, 3 mo. LIBOR + .21%, 1.56%, due 01/10/35 | 156,282 | |||||||||||||
| 334,623 | Crusade Global Trust, Series 06-1, Class A1, 144A, 3 mo. LIBOR + .06%, 1.20%, due 07/20/38 | 286,202 | |||||||||||||
| 522,896 | Crusade Global Trust, Series 07-1, Class A1, 3 mo. LIBOR + .06%, 1.20%, due 04/19/38 | 423,976 | |||||||||||||
| 132,703 | Interstar Millennium Trust, Series 03-3G, Class A2, 3 mo. LIBOR + .25%, 1.72%, due 09/27/35 | 105,987 | |||||||||||||
| 1,004,683 | Interstar Millennium Trust, Series 04-2G, Class A, 3 mo. LIBOR + .20%, 2.20%, due 03/14/36 | 816,174 | |||||||||||||
| 80,076 | Interstar Millennium Trust, Series 05-1G, Class A, 3 mo. LIBOR + .12%, 2.31%, due 12/08/36 | 61,659 | |||||||||||||
| 106,527 | Interstar Millennium Trust, Series 06-2GA, Class A2, 144A, 3 mo. LIBOR + .08%, 1.34%, due 05/27/38 | 81,189 | |||||||||||||
See accompanying notes to the financial statements.
17
GMO Global Balanced Asset Allocation Fund
(A Series of GMO Trust)
Schedule of Investments — (Continued)
(showing percentage of total net assets)
February 28, 2009
| Par Value ($) | Description | Value ($) | |||||||||||||
| Residential Mortgage-Backed Securities (Australian) — continued | |||||||||||||||
| 60,194 | Medallion Trust, Series 05-1G, Class A1, 3 mo. LIBOR + .08%, 1.32%, due 05/10/36 | 52,169 | |||||||||||||
| 391,362 | Medallion Trust, Series 06-1G, Class A1, 3 mo. LIBOR + .05%, 2.05%, due 06/14/37 | 319,719 | |||||||||||||
| 507,980 | National RMBS Trust, Series 06-3, Class A1, 144A, 3 mo. LIBOR + .07%, 1.16%, due 10/20/37 | 439,748 | |||||||||||||
| 547,460 | Puma Finance Ltd., Series G5, Class A1, 144A, 3 mo. LIBOR + .07%, 1.32%, due 02/21/38 | 447,056 | |||||||||||||
| 679,523 | Superannuation Members Home Loans Global Fund, Series 07-1, Class A1, 3 mo. LIBOR + .06%, 2.16%, due 06/12/40 | 553,774 | |||||||||||||
| 32,475 | Superannuation Members Home Loans Global Fund, Series 6, Class A, 3 mo. LIBOR + .16%, 1.40%, due 11/09/35 | 27,184 | |||||||||||||
| 84,177 | Superannuation Members Home Loans Global Fund, Series 7, Class A1, 3 mo. LIBOR + .14%, 2.33%, due 03/09/36 | 73,415 | |||||||||||||
| 72,394 | Superannuation Members Home Loans Global Fund, Series 8, Class A1, 3 mo. LIBOR + .07%, 1.42%, due 01/12/37 | 59,702 | |||||||||||||
| 485,246 | Westpac Securitization Trust, Series 07-1G, Class A2A, 3 mo. LIBOR + .05%, 1.30%, due 05/21/38 | 411,348 | |||||||||||||
| Total Residential Mortgage-Backed Securities (Australian) | 4,315,584 | ||||||||||||||
| Residential Mortgage-Backed Securities (European) — 0.3% | |||||||||||||||
| 500,000 | Aire Valley Mortgages, Series 07-1A, Class 1A2, 144A, 3 mo. LIBOR + .09%, 1.62%, due 03/20/30 | 448,000 | |||||||||||||
| 500,000 | Aire Valley Mortgages, Series 06-1A, Class 1A, 144A, 3 mo. LIBOR + .11%, 1.64%, due 09/20/66 | 454,400 | |||||||||||||
| 400,000 | Arkle Master Issuer Plc, Series 06-1A, Class 3A, 144A, 3 mo. LIBOR + .05%, 1.29%, due 08/17/11 | 391,040 | |||||||||||||
| 1,100,000 | Brunel Residential Mortgages, Series 07-1A, Class A4C, 144A, 3 mo. LIBOR + .10%, 1.36%, due 01/13/39 | 888,030 | |||||||||||||
| 109,120 | Gracechurch Mortgage Funding Plc, Series 1A, Class A2B, 144A, 3 mo. LIBOR + .07%, 1.42%, due 10/11/41 | 100,387 | |||||||||||||
| 223,495 | Granite Master Issuer Plc, Series 06-2, Class A4, 1 mo. LIBOR + .04%, 0.51%, due 12/20/54 | 138,567 | |||||||||||||
| 127,181 | Granite Mortgages Plc, Series 04-3, Class 2A1, 3 mo. LIBOR + .14%, 1.67%, due 09/20/44 | 86,483 | |||||||||||||
| 644,781 | Kildare Securities Ltd., Series 07-1A, Class A2, 144A, 3 mo. LIBOR + .06%, 2.25%, due 12/10/43 | 478,163 | |||||||||||||
See accompanying notes to the financial statements.
18
GMO Global Balanced Asset Allocation Fund
(A Series of GMO Trust)
Schedule of Investments — (Continued)
(showing percentage of total net assets)
February 28, 2009
| Par Value ($) | Description | Value ($) | |||||||||||||
| Residential Mortgage-Backed Securities (European) — continued | |||||||||||||||
| 34,836 | Leek Finance Plc, Series 14A, Class A2B, 144A, 3 mo. LIBOR + .18%, 1.71%, due 09/21/36 | 32,882 | |||||||||||||
| 113,974 | Leek Finance Plc, Series 15A, Class AB, 144A, 3 mo. LIBOR + .14%, 1.67%, due 03/21/37 | 98,018 | |||||||||||||
| 111,770 | Leek Finance Plc, Series 17A, Class A2B, 144A, 3 mo. LIBOR + .14%, 1.67%, due 12/21/37 | 74,799 | |||||||||||||
| 400,000 | Mound Financing Plc, Series 5A, Class 2A, 144A, 3 mo. LIBOR + .04%, 1.28%, due 05/08/16 | 377,000 | |||||||||||||
| 208,598 | Paragon Mortgages Plc, Series 7A, Class A1A, 144A, 3 mo. LIBOR + .21%, 1.45%, due 05/15/34 | 192,667 | |||||||||||||
| 337,684 | Paragon Mortgages Plc, Series 12A, Class A2C, 144A, 3 mo. LIBOR + .11%, 1.35%, due 11/15/38 | 198,855 | |||||||||||||
| 245,385 | Paragon Mortgages Plc, Series 14A, Class A2C, 144A, 3 mo. LIBOR + .10%, 2.10%, due 09/15/39 | 214,118 | |||||||||||||
| 1,300,000 | Pendeford Master Issuer Plc, Series 07-1A, Class 3A, 144A, 3 mo. LIBOR + .10%, 1.32%, due 02/12/16 | 1,136,200 | |||||||||||||
| 100,000 | Permanent Financing Plc, Series 4, Class 3A, 3 mo. LIBOR + .14%, 2.33%, due 03/10/24 | 99,817 | |||||||||||||
| 1,000,000 | Permanent Master Issuer Plc, Series 06-1, Class 5A, 3 mo. LIBOR + .11%, 1.20%, due 07/15/33 | 825,000 | |||||||||||||
| 200,000 | Permanent Master Issuer Plc, Series 07-1, Class 4A, 3 mo. LIBOR + .08%, 1.17%, due 10/15/33 | 163,630 | |||||||||||||
| 10,145 | RMAC Securities Plc, Series 06-NS4A, Class A1B, 144A, 3 mo. LIBOR + .07%, 2.17%, due 06/12/25 | 10,119 | |||||||||||||
| Total Residential Mortgage-Backed Securities (European) | 6,408,175 | ||||||||||||||
| Residential Mortgage-Backed Securities (United States) — 0.0% | |||||||||||||||
| 29,888 | Chevy Chase Mortgage Funding Corp., Series 04-3A, Class A2, 144A, 1 mo. LIBOR + .30%, 0.77%, due 08/25/35 | 12,253 | |||||||||||||
| 54,940 | GreenPoint Mortgage Funding Trust, Series 05-HE4, Class 2A3C, 1 mo. LIBOR + .25%, 0.72%, due 07/25/30 | 35,677 | |||||||||||||
| 108,791 | Mellon Residential Funding Corp., Series 04-TBC1, Class A, 144A, 1 mo. LIBOR + .25%, 0.73%, due 02/26/34 | 65,427 | |||||||||||||
| Total Residential Mortgage-Backed Securities (United States) | 113,357 | ||||||||||||||
See accompanying notes to the financial statements.
19
GMO Global Balanced Asset Allocation Fund
(A Series of GMO Trust)
Schedule of Investments — (Continued)
(showing percentage of total net assets)
February 28, 2009
| Par Value ($) | Description | Value ($) | |||||||||||||
| Student Loans — 0.2% | |||||||||||||||
| 185,668 | College Loan Corp. Trust, Series 04-1, Class A2, 3 mo. LIBOR + .11%, 1.27%, due 04/25/16 | 180,748 | |||||||||||||
| 400,000 | College Loan Corp. Trust, Series 06-1, Class A2, 3 mo. LIBOR + .02%, 1.18%, due 04/25/22 | 390,520 | |||||||||||||
| 700,000 | College Loan Corp. Trust, Series 07-2, Class A1, 3 mo. LIBOR + .25%, 1.41%, due 01/25/24 | 665,000 | |||||||||||||
| 164,000 | College Loan Corp. Trust, Series 07-1, Class A1, 3 mo. LIBOR + .01%, 1.17%, due 01/25/23 | 159,277 | |||||||||||||
| 155,544 | Goal Capital Funding Trust, Series 06-1, Class A1, 3 mo. LIBOR, 1.25%, due 08/25/20 | 153,241 | |||||||||||||
| 182,291 | Goal Capital Funding Trust, Series 07-1, Class A1, 3 mo. LIBOR + .02%, 1.49%, due 06/25/21 | 180,304 | |||||||||||||
| 86,035 | Keycorp Student Loan Trust, Series 05-A, Class 2A1, 3 mo. LIBOR + .05%, 1.52%, due 09/27/21 | 83,281 | |||||||||||||
| 132,088 | Montana Higher Education Student Assistance Corp., Series 05-1, Class A, 3 mo. LIBOR + .04%, 1.57%, due 06/20/15 | 127,201 | |||||||||||||
| 369,331 | National Collegiate Student Loan Trust, Series 06-1, Class A2, 1 mo. LIBOR + .14%, 0.61%, due 08/25/23 | 332,398 | |||||||||||||
| 351,891 | National Collegiate Student Loan Trust, Series 06-A, Class A1, 144A, 1 mo. LIBOR + .08%, 0.55%, due 08/26/19 | 323,739 | |||||||||||||
| 400,000 | Nelnet Student Loan Trust, Series 05-2, Class A4, 3 mo. LIBOR + .08%, 1.61%, due 12/23/19 | 364,236 | |||||||||||||
| 313,480 | SLC Student Loan Trust, Series 06-A, Class A2, 3 mo. LIBOR + .03%, 1.12%, due 10/15/15 | 306,439 | |||||||||||||
| 476,294 | SLM Student Loan Trust, Series 07-A, Class A1, 3 mo. LIBOR + .03%, 2.03%, due 09/15/22 | 400,087 | |||||||||||||
| Total Student Loans | 3,666,471 | ||||||||||||||
| Time Share — 0.0% | |||||||||||||||
| 287,940 | Sierra Receivables Funding Co., Series 08-1A, Class A2, 144A, 1 mo. LIBOR + 4.00%, 4.47%, due 02/20/20 | 244,479 | |||||||||||||
| Trade Receivables — 0.0% | |||||||||||||||
| 1,000,000 | SSCE Funding LLC, Series 04-1A, Class A, 144A, 1 mo. LIBOR + .23%, 0.69%, due 11/15/10 | 950,000 | |||||||||||||
| Total Asset-Backed Securities | 103,691,094 | ||||||||||||||
See accompanying notes to the financial statements.
20
GMO Global Balanced Asset Allocation Fund
(A Series of GMO Trust)
Schedule of Investments — (Continued)
(showing percentage of total net assets)
February 28, 2009
| Par Value ($) / Shares | Description | Value ($) | |||||||||||||
| Corporate Debt — 0.0% | |||||||||||||||
| 598,000 | Health Care Property Investors, Inc., Series G, MTN, 5.63%, due 02/28/13 | 540,036 | |||||||||||||
| U.S. Government Agency — 0.1% | |||||||||||||||
| 267,400 | Agency for International Development Floater (Support of C.A.B.E.I), 6 mo. U.S. Treasury Bill + .40%, 0.90%, due 10/01/12 (a) | 258,059 | |||||||||||||
| 201,584 | Agency for International Development Floater (Support of Honduras), 3 mo. U.S. Treasury Bill x 117%, 0.07%, due 10/01/11 (a) | 194,851 | |||||||||||||
| 970,000 | Agency for International Development Floater (Support of India), 3 mo. LIBOR + .10%, 1.27%, due 02/01/27 (a) | 859,507 | |||||||||||||
| 660,311 | Agency for International Development Floater (Support of Jamaica), 6 mo. U.S. Treasury Bill + 0.75%, 1.25%, due 03/30/19 (a) | 613,587 | |||||||||||||
| 82,367 | Agency for International Development Floater (Support of Peru), Series B, 6 mo. U.S. Treasury Bill +.35%, 1.47%, due 05/01/14 (a) | 78,230 | |||||||||||||
| 600,001 | Agency for International Development Floater (Support of Zimbabwe), 3 mo. U.S. Treasury Bill x 115%, 1.00%, due 01/01/12 (a) | 575,935 | |||||||||||||
| Total U.S. Government Agency | 2,580,169 | ||||||||||||||
| TOTAL DEBT OBLIGATIONS (COST $116,387,523) | 106,811,299 | ||||||||||||||
| MUTUAL FUNDS — 94.8% | |||||||||||||||
| Affiliated Issuers — 94.8% | |||||||||||||||
| 71,040,496 | GMO Alpha Only Fund, Class IV | 409,903,662 | |||||||||||||
| 25,633,419 | GMO Domestic Bond Fund, Class VI | 204,811,016 | |||||||||||||
| 1,401,205 | GMO Emerging Country Debt Fund, Class IV | 8,197,052 | |||||||||||||
| 23,845,810 | GMO Emerging Markets Fund, Class VI | 149,513,226 | |||||||||||||
| 3,369,441 | GMO Flexible Equities Fund, Class VI | 51,855,694 | |||||||||||||
| 1,861,156 | GMO Inflation Indexed Plus Bond Fund, Class VI | 27,675,383 | |||||||||||||
| 13,363,759 | GMO International Core Equity Fund, Class VI | 242,284,954 | |||||||||||||
| 5,889,873 | GMO International Growth Equity Fund, Class IV | 85,167,566 | |||||||||||||
| 5,520,717 | GMO International Intrinsic Value Fund, Class IV | 77,290,040 | |||||||||||||
| 359,664 | GMO Short-Duration Investment Fund, Class III | 2,571,600 | |||||||||||||
| 3,397,046 | GMO Special Situations Fund, Class VI | 86,658,653 | |||||||||||||
| 15,579,339 | GMO Strategic Fixed Income Fund, Class VI | 270,301,534 | |||||||||||||
| 4,520,206 | GMO U.S. Core Equity Fund, Class VI | 34,489,170 | |||||||||||||
See accompanying notes to the financial statements.
21
GMO Global Balanced Asset Allocation Fund
(A Series of GMO Trust)
Schedule of Investments — (Continued)
(showing percentage of total net assets)
February 28, 2009
| Shares / Par Value ($) | Description | Value ($) | |||||||||||||
| Affiliated Issuers — continued | |||||||||||||||
| 44,944,684 | GMO U.S. Quality Equity Fund, Class VI | 637,315,620 | |||||||||||||
| 1,036,598 | GMO World Opportunity Overlay Fund | 19,021,564 | |||||||||||||
| TOTAL MUTUAL FUNDS (COST $3,409,266,170) | 2,307,056,734 | ||||||||||||||
| PREFERRED STOCKS — 0.0% | |||||||||||||||
| Banking — 0.0% | |||||||||||||||
| 1,000 | Home Ownership Funding 2 Preferred 144A, 1.00% (a) | 90,000 | |||||||||||||
| TOTAL PREFERRED STOCKS (COST $158,807) | 90,000 | ||||||||||||||
| SHORT-TERM INVESTMENTS — 0.8% | |||||||||||||||
| Money Market Funds — 0.8% | |||||||||||||||
| 19,907,563 | State Street Institutional U.S. Government Money Market Fund - Institutional Class | 19,907,563 | |||||||||||||
| Other Short-Term Investments — 0.0% | |||||||||||||||
| 14,791 | State Street Eurodollar Time Deposit, 0.01%, due 03/02/09 | 14,791 | |||||||||||||
| TOTAL SHORT-TERM INVESTMENTS (COST $19,922,354) | 19,922,354 | ||||||||||||||
| TOTAL INVESTMENTS — 100.0% (Cost $3,545,734,854) | 2,433,880,387 | ||||||||||||||
| Other Assets and Liabilities (net) — (0.0%) | (893,345 | ) | |||||||||||||
| TOTAL NET ASSETS — 100.0% | $ | 2,432,987,042 | |||||||||||||
See accompanying notes to the financial statements.
22
GMO Global Balanced Asset Allocation Fund
(A Series of GMO Trust)
Schedule of Investments — (Continued)
February 28, 2009
Notes to Schedule of Investments:
144A - Securities exempt from registration under Rule 144A of the Securities Act of 1933. These securities may be resold in transactions exempt from registration, normally to qualified institutional investors.
AMBAC - Insured as to the payment of principal and interest by AMBAC Assurance Corporation.
C.A.B.E.I. - Central American Bank of Economic Integration
CDO - Collateralized Debt Obligation
CMBS - Collateralized Mortgage Backed Security
EUR LIBOR - London Interbank Offered Rate denominated in Euros.
FGIC - Insured as to the payment of principal and interest by Financial Guaranty Insurance Corporation.
FSA - Insured as to the payment of principal and interest by Financial Security Assurance.
LIBOR - London Interbank Offered Rate
MBIA - Insured as to the payment of principal and interest by MBIA Insurance Corp.
MTN - Medium Term Note
RMAC - Residential Mortgage Acceptance Corp.
RMBS - Residential Mortgage Backed Security
XL - Insured as to the payment of principal and interest by XL Capital Assurance.
The rates shown on variable rate notes are the current interest rates at February 28, 2009, which are subject to change based on the terms of the security.
(a) Security valued at fair value using methods determined in good faith by or at the direction of the Trustees of GMO Trust (Note 2).
Currency Abbreviations:
EUR - Euro
See accompanying notes to the financial statements.
23
GMO Global Balanced Asset Allocation Fund
(A Series of GMO Trust)
Statement of Assets and Liabilities — February 28, 2009
| Assets: | |||||||
| Investments in unaffiliated issuers, at value (cost $136,468,684) (Note 2) | $ | 126,823,653 | |||||
| Investments in affiliated issuers, at value (cost $3,409,266,170) (Notes 2 and 8) | 2,307,056,734 | ||||||
| Receivable for investments sold | 2,100,558 | ||||||
| Dividends and interest receivable | 181,008 | ||||||
| Receivable for expenses reimbursed by Manager (Note 3) | 7,784 | ||||||
| Total assets | 2,436,169,737 | ||||||
| Liabilities: | |||||||
| Payable for Fund shares repurchased | 3,086,885 | ||||||
| Payable to affiliate for (Note 3): | |||||||
| Trustees and Chief Compliance Officer of GMO Trust fees | 8,443 | ||||||
| Accrued expenses | 87,367 | ||||||
| Total liabilities | 3,182,695 | ||||||
| Net assets | $ | 2,432,987,042 | |||||
| Net assets consist of: | |||||||
| Paid-in capital | $ | 3,718,740,453 | |||||
| Distributions in excess of net investment income | (11,627,915 | ) | |||||
| Accumulated net realized loss | (162,271,029 | ) | |||||
| Net unrealized depreciation | (1,111,854,467 | ) | |||||
| $ | 2,432,987,042 | ||||||
| Net assets attributable to: | |||||||
| Class III shares | $ | 2,432,987,042 | |||||
| Shares outstanding: | |||||||
| Class III | 334,045,761 | ||||||
| Net asset value per share: | |||||||
| Class III | $ | 7.28 | |||||
See accompanying notes to the financial statements.
24
GMO Global Balanced Asset Allocation Fund
(A Series of GMO Trust)
Statement of Operations — Year Ended February 28, 2009
| Investment Income: | |||||||
| Dividends from affiliated issuers (Note 8) | $ | 264,258,765 | |||||
| Interest | 3,141,914 | ||||||
| Dividends | 37,494 | ||||||
| Total investment income | 267,438,173 | ||||||
| Expenses: | |||||||
| Custodian, fund accounting agent and transfer agent fees | 48,533 | ||||||
| Audit and tax fees | 34,220 | ||||||
| Legal fees | 76,993 | ||||||
| Chief Compliance Officer (Note 3) | 22,324 | ||||||
| Trustees fees and related expenses (Note 3) | 51,443 | ||||||
| Registration fees | 1,840 | ||||||
| Miscellaneous | 14,869 | ||||||
| Total expenses | 250,222 | ||||||
| Fees and expenses reimbursed by Manager (Note 3) | (176,455 | ) | |||||
| Expense reductions (Note 2) | (26,139 | ) | |||||
| Net expenses | 47,628 | ||||||
| Net investment income (loss) | 267,390,545 | ||||||
| Realized and unrealized gain (loss): | |||||||
| Net realized gain (loss) on: | |||||||
| Investments in unaffiliated issuers | (323,173 | ) | |||||
| Investments in affiliated issuers | (288,462,630 | ) | |||||
| Realized gains distributions from affiliated issuers (Note 8) | 182,670,563 | ||||||
| Foreign currency, forward contracts and foreign currency related transactions | 974 | ||||||
| Net realized gain (loss) | (106,114,266 | ) | |||||
| Change in net unrealized appreciation (depreciation) on: | |||||||
| Investments in unaffiliated issuers | (9,645,031 | ) | |||||
| Investments in affiliated issuers | (950,322,419 | ) | |||||
| Net unrealized gain (loss) | (959,967,450 | ) | |||||
| Net realized and unrealized gain (loss) | (1,066,081,716 | ) | |||||
| Net increase (decrease) in net assets resulting from operations | $ | (798,691,171 | ) | ||||
See accompanying notes to the financial statements.
25
GMO Global Balanced Asset Allocation Fund
(A Series of GMO Trust)
Statement of Changes in Net Assets
| Year Ended February 28, 2009 | Year Ended February 29, 2008 | ||||||||||
| Increase (decrease) in net assets: | |||||||||||
| Operations: | |||||||||||
| Net investment income (loss) | $ | 267,390,545 | $ | 138,520,227 | |||||||
| Net realized gain (loss) | (106,114,266 | ) | 256,198,017 | ||||||||
| Change in net unrealized appreciation (depreciation) | (959,967,450 | ) | (284,868,880 | ) | |||||||
| Net increase (decrease) in net assets from operations | (798,691,171 | ) | 109,849,364 | ||||||||
| Distributions to shareholders from: | |||||||||||
| Net investment income | |||||||||||
| Class III | (309,984,149 | ) | (163,753,134 | ) | |||||||
| Net realized gains | |||||||||||
| Class III | (146,420,155 | ) | (185,650,495 | ) | |||||||
| (456,404,304 | ) | (349,403,629 | ) | ||||||||
| Net share transactions (Note 7): | |||||||||||
| Class III | 322,020,967 | 524,385,283 | |||||||||
| Purchase premiums and redemption fees (Notes 2 and 7): | |||||||||||
| Class III | 1,206,564 | 860,204 | |||||||||
| Total increase (decrease) in net assets resulting from net share transactions, purchase premiums and redemption fees | 323,227,531 | 525,245,487 | |||||||||
| Total increase (decrease) in net assets | (931,867,944 | ) | 285,691,222 | ||||||||
| Net assets: | |||||||||||
| Beginning of period | 3,364,854,986 | 3,079,163,764 | |||||||||
| End of period (including distributions in excess of net investment income of $11,627,915 and accumulated undistributed net investment income of $18,656,535, respectively) | $ | 2,432,987,042 | $ | 3,364,854,986 | |||||||
See accompanying notes to the financial statements.
26
GMO Global Balanced Asset Allocation Fund
(A Series of GMO Trust)
Financial Highlights
(For a Class III share outstanding throughout each period)
| Year Ended February 28/29, | |||||||||||||||||||||||
| 2009 | 2008 | 2007 | 2006 | 2005 | |||||||||||||||||||
| Net asset value, beginning of period | $ | 11.37 | $ | 12.01 | $ | 11.76 | $ | 11.33 | $ | 10.74 | |||||||||||||
| Income (loss) from investment operations: | |||||||||||||||||||||||
| Net investment income (loss)(a)† | 0.87 | 0.48 | 0.39 | 0.36 | 0.27 | ||||||||||||||||||
| Net realized and unrealized gain (loss) | (3.43 | ) | 0.05 | 0.66 | 0.86 | 0.90 | |||||||||||||||||
| Total from investment operations | (2.56 | ) | 0.53 | 1.05 | 1.22 | 1.17 | |||||||||||||||||
| Less distributions to shareholders: | |||||||||||||||||||||||
| From net investment income | (1.04 | ) | (0.53 | ) | (0.43 | ) | (0.37 | ) | (0.32 | ) | |||||||||||||
| From net realized gains | (0.49 | ) | (0.64 | ) | (0.37 | ) | (0.42 | ) | (0.26 | ) | |||||||||||||
| Total distributions | (1.53 | ) | (1.17 | ) | (0.80 | ) | (0.79 | ) | (0.58 | ) | |||||||||||||
| Net asset value, end of period | $ | 7.28 | $ | 11.37 | $ | 12.01 | $ | 11.76 | $ | 11.33 | |||||||||||||
| Total Return(b) | (24.30 | )% | 4.10 | % | 9.22 | % | 11.05 | % | 11.07 | % | |||||||||||||
| Ratios/Supplemental Data: | |||||||||||||||||||||||
| Net assets, end of period (000's) | $ | 2,432,987 | $ | 3,364,855 | $ | 3,079,164 | $ | 1,812,191 | $ | 1,030,238 | |||||||||||||
| Net expenses to average daily net assets(c)(d) | 0.00 | %(e) | 0.00 | %(e) | 0.00 | % | 0.00 | % | 0.00 | % | |||||||||||||
| Net investment income to average daily net assets(a) | 8.81 | % | 3.89 | % | 3.28 | % | 3.17 | % | 2.53 | % | |||||||||||||
| Portfolio turnover rate | 44 | % | 76 | % | 23 | % | 16 | % | 10 | % | |||||||||||||
| Fees and expenses reimbursed by the Manager to average daily net assets: | 0.01 | % | 0.01 | % | 0.01 | % | 0.01 | % | 0.02 | % | |||||||||||||
| Purchase premiums and redemption fees consisted of the following per share amounts:† | $ | 0.00 | (f) | $ | 0.00 | (f) | $ | 0.01 | $ | 0.01 | $ | 0.01 | |||||||||||
(a) Net investment income is affected by the timing of the declaration of dividends by the underlying funds in which the Fund invests.
(b) The total returns would have been lower had certain expenses not been reimbursed and/or waived during the periods shown and assumes the effect of reinvested distributions. Calculation excludes purchase premiums and redemption fees which are borne by the shareholder.
(c) Net expenses exclude expenses incurred indirectly through investment in the underlying funds (See Note 3).
(d) Net expenses to average daily net assets were less than 0.01%.
(e) The net expense ratio does not include the effect of expense reductions.
(f) Purchase premiums and redemption fees were less than $0.01 per share.
† Calculated using average shares outstanding throughout the period.
See accompanying notes to the financial statements.
27
GMO Global Balanced Asset Allocation Fund
(A Series of GMO Trust)
Notes to Financial Statements
February 28, 2009
1. Organization
GMO Global Balanced Asset Allocation Fund (the "Fund") is a series of GMO Trust (the "Trust"). The Fund is registered under the Investment Company Act of 1940, as amended, as an open-end, diversified management investment company. The Fund is advised and managed by Grantham, Mayo, Van Otterloo & Co. LLC (the "Manager" or "GMO"). The Trust was established as a Massachusetts business trust under the laws of The Commonwealth of Massachusetts on June 24, 1985. The Declaration of Trust permits the Trustees of the Trust ("Trustees") to create an unlimited number of series of shares ("Funds") and to subdivide Funds into classes.
The Fund seeks total return greater than that of the GMO Global Balanced Index. The GMO Global Balanced Index is a composite index computed by GMO consisting of: (i) the MSCI ACWI (All Country World Index) Index and (ii) the Barclays Capital U.S. Aggregate Index in the following proportions: 65% (MSCI ACWI (All Country World Index) Index) and 35% (Barclays Capital U.S. Aggregate Index). The Fund is a fund of funds and invests primarily in shares of other GMO Funds, which may include the GMO International Equity Funds (including one or more of the GMO Emerging Markets Funds), GMO U.S. Equity Funds, GMO Fixed Income Funds, GMO Alpha Only Fund, GMO Alternative Asset Opportunity Fund, GMO Flexible Equities Fund, GMO Short-Duration Collateral Fund, GMO Special Situations Fund, and GMO World Opportunity Overlay Fund. The Fund typically exposes at least 25% of its assets to fixed income investments and at least 25% of its assets to equ ity investments. In addition, the Fund may hold securities (particularly asset-backed securities) directly or through one or more subsidiaries or other entities.
The financial statements of the series of the Trust in which the Fund invests ("underlying funds") should be read in conjunction with the Fund's financial statements. These financial statements are available, without charge, upon request, by calling (617) 346-7646 (collect). Shares of GMO Alternative Asset Opportunity Fund, GMO Flexible Equities Fund, GMO Short-Duration Collateral Fund, GMO Special Situations Fund, and GMO World Opportunity Overlay Fund are not publicly available for direct purchase.
The Fund directly and indirectly (through underlying funds) invests in securities with contractual cash flows, such as collateralized mortgage obligations and commercial mortgage-backed securities, including securities backed by sub-prime mortgage loans, credit card receivables and auto loan receivables. The value, liquidity and related income of these securities are sensitive to changes in economic conditions, including real estate values, delinquencies and/or defaults, and may be adversely affected by changes in interest rates and shifts in the market's perception of the securities' market values.
2. Significant accounting policies
The following is a summary of significant accounting policies followed by the Fund in the preparation of its financial statements. These policies are in conformity with accounting principles generally accepted in the United States of America ("U.S. GAAP") and have been consistently followed by the Fund in preparing its financial statements. The preparation of financial statements in accordance with U.S. GAAP
28
GMO Global Balanced Asset Allocation Fund
(A Series of GMO Trust)
Notes to Financial Statements — (Continued)
February 28, 2009
requires management to make estimates and assumptions that affect the reported amounts and disclosures in the financial statements. Actual results could differ from those estimates. The accounting records of the Fund are maintained in U.S. dollars.
Portfolio valuation
Shares of the underlying funds and other mutual funds are generally valued at their net asset value.
Investments held by the underlying funds are valued as follows. Securities listed on a securities exchange for which market quotations are readily available are valued at the last sale price or official closing price on each business day, or if there is no such reported sale or official closing price, at the most recent quoted bid price. Unlisted securities for which market quotations are readily available are generally valued at the most recent quoted bid price. Debt instruments with a remaining maturity of sixty days or less are generally valued at amortized cost, which approximates fair value. Securities for which quotations are not readily available or whose values the Manager has determined to be unreliable are valued at fair value as determined in good faith by the Trustees or persons acting at their direction pursuant to procedures approved by the Trustees. By its nature, a fair value price is a good faith estimate of the value of a security at a given point in time and may not reflect the value that would be realized if the security were sold. The difference between a fair value price and the value realized upon a sale could be material. Because many foreign equity securities markets and exchanges close prior to the close of the New York Stock Exchange ("NYSE"), closing prices for foreign securities in those markets or on those exchanges do not reflect the events that occur after that close but before the close of the NYSE. As a result, the Fund generally values foreign equity securities using fair value prices, which are based on adjustments to closing prices supplied by a third party vendor based on that vendor's proprietary models. As of February 28, 2009, 25.72% of the net assets of the Fund, through investments in the underlying funds, were valued using fair value prices based on models used by a third party vendor.
Typically the Fund and the underlying funds value debt instruments based on prices supplied by a primary pricing source chosen by the Manager. The Manager evaluates primary pricing sources on an ongoing basis and may change a pricing source should the Manager deem it appropriate. If it deems appropriate, the Manager, at its discretion, may override a price supplied by a primary source by using a price provided by another source. The prices provided by primary pricing sources may differ from the value that would be realized if the securities were sold, and the differences could be material.
Certain securities held by the Fund and underlying funds are valued on the basis of prices provided by a single source. As of February 28, 2009, the total value of these securities represented 6.81% of the net assets. The single source prices provided may differ from the value that would be realized if the securities were sold, and the differences could be material. In addition, although alternative prices are available for other securities held by the Fund, those alternative sources would not necessarily confirm the security price used by the Fund. Therefore, the existence of those alternative sources does not necessarily provide greater certainty about the prices used by the Fund.
29
GMO Global Balanced Asset Allocation Fund
(A Series of GMO Trust)
Notes to Financial Statements — (Continued)
February 28, 2009
In September 2006, the Financial Accounting Standards Board ("FASB") issued Statement of Financial Accounting Standards No. 157, Fair Value Measurements ("SFAS 157"). SFAS 157 is effective for the Fund's current fiscal year. While the adoption of SFAS 157 does not have an effect on the Fund's net asset value, it does require additional disclosures about fair value measurements. SFAS 157 establishes a three-level hierarchy for disclosure of fair value measurements. The valuation hierarchy is based upon the reliability of inputs to the valuation of the Fund's investments. The three levels are defined as follows:
Level 1 – Valuations based on quoted prices for identical securities in active markets.
Level 2 – Valuations determined using other significant direct or indirect observable inputs.
Level 3 – Valuations based on inputs that are unobservable and significant. The Fund utilized the following fair value techniques on Level 3 investments: the Fund valued debt securities using bids received from primary pricing sources.
The inputs or methodology used for valuing securities are not necessarily an indication of the risk associated with investing in those securities.
The following is a summary of the fair valuations according to inputs used as of February 28, 2009 in valuing the Fund's investments:
| Asset Valuation Inputs | Investments in Securities | Other Financial Instruments | |||||||||
| Level 1 - Quoted Prices | $ | 2,149,535,614 | $ | — | |||||||
| Level 2 - Other Significant Observable Inputs | 177,983,510 | — | |||||||||
| Level 3 - Significant Unobservable Inputs | 106,361,263 | — | |||||||||
| Total | $ | 2,433,880,387 | $ | — | |||||||
| Liability Valuation Inputs | Investments in Securities | Other Financial Instruments | |||||||||
| Level 1 - Quoted Prices | $ | — | $ | — | |||||||
| Level 2 - Other Significant Observable Inputs | — | — | |||||||||
| Level 3 - Significant Unobservable Inputs | — | — | |||||||||
| Total | $ | — | $ | — | |||||||
For the underlying fund's summary of valuation inputs please refer to the respective fund's portfolio valuation note.
30
GMO Global Balanced Asset Allocation Fund
(A Series of GMO Trust)
Notes to Financial Statements — (Continued)
February 28, 2009
The following is a reconciliation of investments in which significant unobservable inputs (Level 3) were used in determining value:
| Investments in Securities | Other Financial Instruments | ||||||||||
| Balance as of February 29, 2008 | $ | — | $ | — | |||||||
| Accrued discounts/premiums | 1,268,047 | — | |||||||||
| Realized gain (loss) | 1,029,653 | — | |||||||||
| Change in unrealized appreciation/depreciation | (9,671,797 | ) | — | ||||||||
| Net purchases (sales) | 113,735,360 | — | |||||||||
| Net transfers in and/or out of Level 3 | — | — | |||||||||
| Balance as of February 28, 2009 | $ | 106,361,263 | $ | — | |||||||
Repurchase agreements
The Fund may enter into repurchase agreements. Under a repurchase agreement the Fund acquires a security for cash and obtains a simultaneous commitment from the seller to repurchase the security at an agreed upon price and date. The Fund, through its custodian, takes possession of securities collateralizing the repurchase agreement. The collateral is marked to market daily to ensure that the market value of the underlying assets is at least equal to the amount owed to the Fund in the event of default by the seller. If the seller of a repurchase agreement defaults or enters into insolvency proceedings and the value of the collateral declines, the Fund's recovery of cash may be delayed or limited. The Fund had no repurchase agreements outstanding at the end of the period.
Taxes and distributions
The Fund intends to qualify each tax year as a regulated investment company under Subchapter M of the Internal Revenue Code of 1986, as amended (the "Code"). The Fund intends to distribute substantially all of its net investment income and all of its net realized short-term and long-term capital gain, if any, after giving effect to any available capital loss carryforwards for U.S. federal income tax purposes. Therefore, no provision for U.S. federal income or excise tax is necessary.
The Fund's policy is to declare and pay distributions from net investment income, if any, semiannually, and from net realized short-term and long-term capital gain, if any, at least annually. All distributions are paid in shares of the Fund, at net asset value, unless the shareholder elects to receive cash distributions. Distributions to shareholders are recorded by the Fund on the ex-dividend date.
Income and capital gain distributions are determined in accordance with U.S. federal income tax regulations, which may differ from U.S. GAAP. Certain capital accounts in the financial statements are periodically adjusted for permanent differences in order to reflect their tax character. These adjustments have no impact on net assets or net asset value per share. Temporary differences that arise from recognizing certain items of income, expense, gain or loss in different periods for financial statement and tax purposes
31
GMO Global Balanced Asset Allocation Fund
(A Series of GMO Trust)
Notes to Financial Statements — (Continued)
February 28, 2009
will reverse at some time in the future. Distributions in excess of net investment income or net realized gains are temporary over-distributions for financial statement purposes resulting from differences in the recognition or classification of income or distributions for financial statement and tax purposes.
U.S. GAAP and tax accounting differences primarily relate to differing treatment of mutual fund distributions received, partnership interest tax allocations, amortization and accretion of debt securities, losses on wash sale transactions, post-October capital losses and redemption in-kind transactions.
The following reclassification represents the amount necessary to report the stated components of net assets on a tax basis, excluding certain temporary differences, as of February 28, 2009. The financial highlights exclude these adjustments.
| Distributions In Excess of Net Investment Income | Accumulated Net Realized Loss | Paid-in Capital | |||||||||
| $ | 12,309,154 | $ | (11,778,314 | ) | $ | (530,840 | ) | ||||
The tax character of distributions declared to shareholders is as follows:
| 2/28/2009 | 2/29/2008 | ||||||||||
| Ordinary income (including any net short-term capital gain) | $ | 310,011,148 | $ | 165,809,077 | |||||||
| Net long-term capital gain | 146,393,156 | 183,594,552 | |||||||||
| Total distributions | $ | 456,404,304 | $ | 349,403,629 | |||||||
Distributions in excess of tax basis earnings and profits, if significant, are reported in the financial statements as a return of capital for tax purposes.
As of February 28, 2009, the components of distributable earnings on a tax basis consisted of the following:
| Undistributed ordinary income (including any net short-term capital gain) | $ | 26,621,953 | |||||
As of February 28, 2009, the Fund had capital loss carryforwards available to offset future realized gains if any, to the extent permitted by the Code. Utilization of the capital loss carryforwards could be subject to limitations imposed by the Code related to share ownership activity. Such losses expire as follows:
| 2/28/2010 | $ | (638 | ) | ||||
| Total | $ | (638 | ) | ||||
32
GMO Global Balanced Asset Allocation Fund
(A Series of GMO Trust)
Notes to Financial Statements — (Continued)
February 28, 2009
As of February 28, 2009, the Fund elected to defer to March 1, 2009 post-October capital losses of $103,692,912.
As of February 28, 2009, the approximate cost for U.S. federal income tax purposes and gross and net unrealized appreciation (depreciation) in value of investments were as follows:
| Aggregate Cost | Gross Unrealized Appreciation | Gross Unrealized (Depreciation) | Net Unrealized Appreciation (Depreciation) | ||||||||||||
| $ | 3,642,562,201 | $ | — | $ | (1,208,681,814 | ) | $ | (1,208,681,814 | ) | ||||||
For the period ended February 28, 2009, the Fund had net realized losses attributed to redemption in-kind transactions of $530,840.
The Fund is subject to the provisions of Financial Accounting Standards Board Interpretation No. 48 ("FIN 48"), Accounting for Uncertainty in Income Taxes — an Interpretation of FASB Statement No. 109. FIN 48 sets forth a minimum threshold for financial statement recognition of a tax position taken or expected to be taken in a tax return that could affect the Fund's financial statements. The Fund did not have any unrecognized tax benefits or liabilities at February 28, 2009, nor did it have any increases or decreases in unrecognized tax benefits or liabilities for the period then ended. The Fund is subject to examination prior to the expiration of the statute of limitations by U.S. federal and state tax authorities for tax returns filed.
Security transactions and related investment income
Security transactions in the financial statements are accounted for on the trade date. Income dividends and capital gain distributions from the underlying funds are recorded on the ex-dividend date. Interest income is recorded on the accrual basis. Non-cash dividends, if any, are recorded at the fair market value of the asset received. In determining the net gain or loss on securities sold, the Fund uses the identified cost basis for the purposes of determining the cost basis.
Expenses
The majority of the expenses of the Trust are directly identifiable to an individual fund. Expenses that are not readily identifiable to a specific fund are allocated taking into consideration, among other things, the nature and type of expense and the relative size of the funds. In addition, the Fund incurs fees and expenses indirectly as a shareholder in the underlying funds. Because the underlying funds have different expense and fee levels and the Fund may own different proportions of the underlying funds at different times, the amount of fees and expenses indirectly incurred by the Fund will vary and the Manager has a conflict in allocating among the underlying funds. (See Note 3).
State Street Bank and Trust Company ("State Street") serves as custodian, fund accounting agent and transfer agent of the Fund. State Street's fees may be reduced by an earnings allowance calculated on the average daily cash balances the Fund maintains with State Street. The Fund receives the benefit of the
33
GMO Global Balanced Asset Allocation Fund
(A Series of GMO Trust)
Notes to Financial Statements — (Continued)
February 28, 2009
earnings allowance. Credit balances or expense reimbursements used to reduce fees, if any, are reported as a reduction of expenses in the Statement of Operations.
Purchases and redemptions of Fund shares
Effective September 30, 2008, the premium on cash purchases and fee on cash redemptions were each changed to 0.04% of the amount invested or redeemed. Effective October 8, 2008, the premium on cash purchases was changed to 0.05% of the amount invested and the fee on cash redemptions was changed to 0.31% of the amount redeemed. Effective October 21, 2008, the premium on cash purchases was changed to 0.09% of the amount invested and the fee on cash redemptions was changed to 0.64% of the amount redeemed. Effective November 24, 2008, the fee on cash redemptions was changed to 2.00% of the amount redeemed. As of February 28, 2009, the premium on cash purchases was 0.09% of the amount invested and the fee on cash redemptions was 2.00% of the amount redeemed. The level of purchase premium for the Fund may be adjusted to account for changes in the Fund's investments (i.e., changes in the percentage of Fund assets allocated to each unde rlying fund). The Fund may impose a new purchase premium and/or redemption fee, or modify or eliminate an existing purchase premium and/or redemption fee, at any time. If the Manager determines that any portion of a cash purchase or redemption is offset by a corresponding cash redemption or purchase on the same day, the Fund will ordinarily waive or reduce the purchase premium or redemption fee with respect to that portion. All or a portion of the redemption fees may be waived at the Manager's discretion under circumstances in which the Manager deems it equitable to do so, including without limitation in cases where the weighted average of (i) the estimated transaction costs for directly held assets and (ii) the redemption fees, if any, imposed by the underlying funds is less than the Fund's redemption fee. In addition, the Fund may waive or reduce the purchase premium or redemption fee in extraordinary circumstances if the purchase or redemption will not cause the Fund to incur transaction costs. All purcha se premiums and redemption fees are paid to the Fund and recorded by the Fund as paid-in capital. The Fund will waive or reduce the purchase premium relating to the in-kind portion of a purchase transaction except for estimated or known transaction costs (e.g. stamp duties and transfer taxes) incurred by the Fund as a result of the transfer of the purchasing shareholder's securities to the Fund. In-kind redemption transactions are generally not subject to redemption fees except when they include a cash component. However, when a substantial portion of a Fund is being redeemed, the Fund may charge a redemption fee based on estimated or known transaction costs resulting from those redemptions. The Fund charges no premium for reinvested distributions.
Investment risks
The Fund is subject to the investment risks associated with an investment in the underlying funds, some of which may invest in foreign securities. The Fund is subject to risks involved in investing in foreign securities that are not presented by investments in U.S. securities. These risks may involve adverse political and economic developments, including expropriation and the possible imposition of capital controls or other foreign governmental laws or restrictions. In addition, the securities of some foreign companies and securities markets are less liquid and at times more volatile than securities of comparable U.S. companies and U.S. securities markets. The risks described above apply to an even greater extent to investments in emerging markets. The securities markets of emerging countries are generally smaller, less
34
GMO Global Balanced Asset Allocation Fund
(A Series of GMO Trust)
Notes to Financial Statements — (Continued)
February 28, 2009
developed, less liquid, and more volatile than the securities markets of the U.S. and developed foreign markets. Additionally, the investment risks associated with an investment in the underlying funds may be greater to the extent that the underlying funds engage in derivative transactions.
Recently issued accounting pronouncement
In March 2008, FASB issued Statement of Financial Accounting Standards No. 161, Disclosures about Derivative Instruments and Hedging Activities ("SFAS 161"). SFAS 161 is effective for fiscal years and interim periods beginning after November 15, 2008. SFAS 161 requires enhanced disclosures about the Fund's derivative and hedging activities. The Manager is currently evaluating the impact the adoption of SFAS 161 will have on the Fund's financial statement disclosures.
3. Fees and other transactions with affiliates
The Manager decides how to allocate the assets of the Fund among underlying funds. The Manager does not directly charge the Fund a management fee or shareholder service fee, but it receives varying management and shareholder service fees from the underlying funds in which the Fund invests. Because of that variation the levels of indirect net expenses set forth below are affected by the Manager's asset allocation decisions.
Through at least June 30, 2009, the Manager has contractually agreed to reimburse the Fund for Fund expenses incurred through that date (excluding "Excluded Expenses", as defined below). Excluded Expenses include fees and expenses of the independent Trustees of the Trust, fees and expenses for legal services not approved by the Manager for the Trust, compensation and expenses of the Trust's Chief Compliance Officer ("CCO") (excluding any employee benefits), brokerage commissions, securities lending fees and expenses, interest expense, transfer taxes, and other investment-related costs (including expenses associated with investments in any company that is an investment company or would be an investment company under the 1940 Act, but for the exceptions to the definition of investment company provided in Section 3(c)(1) and 3(c)(7) of the 1940 Act), hedging transaction fees, extraordinary, non-recurring and certain other unusual e xpenses (including taxes).
The Fund incurs fees and expenses indirectly as a shareholder in the underlying funds. For the year ended February 28, 2009, these indirect fees and expenses expressed as an annualized percentage of the Fund's average daily net assets were as follows:
| Indirect Net Expenses (excluding shareholder service fees and interest expense) | Indirect Shareholder Service Fees | Indirect Interest Expense | Total Indirect Expenses | ||||||||||||
| 0.404 | % | 0.066 | % | 0.002 | % | 0.472 | % | ||||||||
35
GMO Global Balanced Asset Allocation Fund
(A Series of GMO Trust)
Notes to Financial Statements — (Continued)
February 28, 2009
The Fund's portion of the fees paid by the Trust to Trust's independent Trustees and CCO during the year ended February 28, 2009 was $42,057 and $22,324, respectively. The compensation and expenses of the CCO are included in the Statement of Operations. The Fund paid no remuneration to any other officer of the Trust.
4. Purchases and sales of securities
Cost of purchases and proceeds from sales of securities, excluding short-term investments and class exchanges, for the year ended February 28, 2009 aggregated $1,624,839,107 and $1,328,761,392, respectively. Cost of purchases and proceeds from sales of securities for in-kind transactions for the year ended February 28, 2009 were $166,517,242 and $166,517,242 respectively.
5. Guarantees
In the normal course of business the Fund enters into contracts with third-party service providers that contain a variety of representations and warranties and that provide general indemnifications. The Fund's maximum exposure under these arrangements is unknown, as it involves future claims that may be made against the Fund that have not yet occurred. Based on experience, management is of the view that the risk of loss in connection with its indemnification obligations is remote; however, there can be no assurance that such obligations will not result in material liabilities that adversely affect the Fund.
6. Principal shareholders and related parties
As of February 28, 2009, 14.72% of the outstanding shares of the Fund were held by one shareholder. On that date, no other shareholder owned more than 10% of the outstanding shares of the Fund. Redemptions from (or investment into) the Fund by or on behalf of this large shareholder may have a material effect on the Fund.
As of February 28, 2009, 0.07% of the Fund's shares were held by senior management of the Manager and GMO Trust officers and none of the Fund's shares were held by accounts for which the Manager had investment discretion.
36
GMO Global Balanced Asset Allocation Fund
(A Series of GMO Trust)
Notes to Financial Statements — (Continued)
February 28, 2009
7. Share transactions
The Declaration of Trust permits the Trust to issue an unlimited number of shares of beneficial interest (without par value). Transactions in Fund shares were as follows:
| Year Ended February 28, 2009 | Year Ended February 29, 2008 | ||||||||||||||||||
| Class III: | Shares | Amount | Shares | Amount | |||||||||||||||
| Shares sold | 15,432,640 | $ | 163,016,462 | 71,503,366 | $ | 884,679,303 | |||||||||||||
| Shares issued to shareholders in reinvestment of distributions | 48,859,380 | 425,639,992 | 28,319,819 | 339,998,843 | |||||||||||||||
| Shares repurchased | (26,134,315 | ) | (266,635,487 | ) | (60,342,225 | ) | (700,292,863 | ) | |||||||||||
| Purchase premiums | — | 136,196 | — | 770,412 | |||||||||||||||
| Redemption fees | — | 1,070,368 | — | 89,792 | |||||||||||||||
| Net increase (decrease) | 38,157,705 | $ | 323,227,531 | 39,480,960 | $ | 525,245,487 | |||||||||||||
8. Investments in affiliated issuers
A summary of the Fund's transactions in the shares of other funds of the Trust during the year ended February 28, 2009 is set forth below:
| Affiliate | Value, beginning of period | Purchases | Sales Proceeds | Dividend Income | Distributions of Realized Gains | Value, end of period | |||||||||||||||||||||
| GMO Alpha Only Fund, Class IV | $ | 535,974,748 | $ | 403,696,515 | $ | 316,882,524 | $ | 186,637,036 | $ | 95,637,496 | $ | 409,903,662 | |||||||||||||||
| GMO Core Plus Bond Fund, Class IV | 49,187,750 | 1,622,218 | 45,703,575 | 1,622,218 | — | — | |||||||||||||||||||||
| GMO Domestic Bond Fund, Class VI | 47,058,826 | 312,910,229 | 117,863,038 | 10,685,898 | 561,986 | 204,811,016 | |||||||||||||||||||||
| GMO Emerging Countries Fund, Class III | 24,700,654 | 3,011,181 | 22,291,876 | — | 3,011,181 | — | |||||||||||||||||||||
| GMO Emerging Country Debt Fund, Class IV | 10,781,541 | 2,207,873 | 33,037 | 1,066,840 | 227,741 | 8,197,052 | |||||||||||||||||||||
| GMO Emerging Markets Fund, Class VI | 325,787,540 | 277,136,285 | 231,961,223 | 3,053,320 | 62,740,769 | 149,513,226 | |||||||||||||||||||||
| GMO Flexible Equities Fund, Class VI | — | 67,842,514 | 462,708 | 8,423 | — | 51,855,694 | |||||||||||||||||||||
37
GMO Global Balanced Asset Allocation Fund
(A Series of GMO Trust)
Notes to Financial Statements — (Continued)
February 28, 2009
| Affiliate | Value, beginning of period | Purchases | Sales Proceeds | Dividend Income | Distributions of Realized Gains | Value, end of period | |||||||||||||||||||||
| GMO Inflation Indexed Plus Bond Fund, Class VI | $ | — | $ | 50,868,296 | $ | 12,103,317 | $ | 3,260,479 | $ | — | $ | 27,675,383 | |||||||||||||||
| GMO International Bond Fund, Class III | 19,794,069 | 1,445,618 | 17,444,784 | 1,445,618 | — | — | |||||||||||||||||||||
| GMO International Core Equity Fund, Class VI | 353,485,226 | 111,318,612 | 14,346,487 | 14,317,867 | 2,825,624 | 242,284,954 | |||||||||||||||||||||
| GMO International Growth Equity Fund, Class IV | 178,541,031 | 13,641,748 | 29,350,461 | 5,249,458 | 5,589,542 | 85,167,566 | |||||||||||||||||||||
| GMO International Intrinsic Value Fund, Class IV | 177,101,792 | 16,261,686 | 29,148,676 | 5,479,464 | 8,723,288 | 77,290,040 | |||||||||||||||||||||
| GMO Short-Duration Investment Fund, Class III | 3,034,068 | 22,197 | 16,427 | 111,247 | — | 2,571,600 | |||||||||||||||||||||
| GMO Special Situations Fund, Class VI | 183,337,321 | 2,772,482 | 124,489,189 | — | — | 86,658,653 | |||||||||||||||||||||
| GMO Strategic Fixed Income Fund, Class VI | 825,676,074 | 28,677,793 | 460,083,089 | 18,373,200 | — | 270,301,534 | |||||||||||||||||||||
| GMO U.S. Core Equity Fund, Class VI | 83,499,236 | 2,431,090 | 31,048,396 | 1,051,608 | — | 34,489,170 | |||||||||||||||||||||
| GMO U.S. Quality EquityFund, Class VI | 546,781,435 | 330,893,528 | 12,962,513 | 11,896,089 | 3,352,936 | 637,315,620 | |||||||||||||||||||||
| GMO World Opportunity Overlay Fund | — | 20,522,050 | 7,219 | — | — | 19,021,564 | |||||||||||||||||||||
| Totals | $ | 3,364,741,311 | $ | 1,647,281,915 | $ | 1,466,198,539 | $ | 264,258,765 | $ | 182,670,563 | $ | 2,307,056,734 | |||||||||||||||
38
Report of Independent Registered Public Accounting Firm
To the Trustees of GMO Trust and the Shareholders of
GMO Global Balanced Asset Allocation Fund:
In our opinion, the accompanying statement of assets and liabilities, including the schedule of investments, and the related statements of operations and of changes in net assets and the financial highlights present fairly, in all material respects, the financial position of GMO Global Balanced Asset Allocation Fund (the "Fund") at February 28, 2009, the results of its operations for the year then ended, the changes in its net assets for each of the two years in the period then ended and the financial highlights for each of the five years in the period then ended, in conformity with accounting principles generally accepted in the United States of America. These financial statements and financial highlights (hereafter referred to as "financial statements") are the responsibility of the Fund's management. Our responsibility is to express an opinion on these financial statements based on our audits. We conducted our audits of these financial statements in accordance with the standards of the Public Company Accounting Oversight Board (United States). Those standards require that we plan and perform the audit to obtain reasonable assurance about whether the financial statements are free of material misstatement. An audit includes examining, on a test basis, evidence supporting the amounts and disclosures in the financial statements, assessing the accounting principles used and significant estimates made by management, and evaluating the overall financial statement presentation. We believe that our audits, which included confirmation of securities at February 28, 2009 by correspondence with the custodian and brokers, provide a reasonable basis for our opinion.
PricewaterhouseCoopers LLP
Boston, Massachusetts
April 29, 2009
39
GMO Global Balanced Asset Allocation Fund
(A Series of GMO Trust)
Fund Expenses
February 28, 2009 (Unaudited)
Expense Examples: The following information is in relation to expenses for the six month period ended February 28, 2009.
As a shareholder of the Fund, you may incur two types of costs: (1) transaction costs, including purchase premiums and redemption fees; and (2) ongoing costs, including indirect management fees, shareholder service fees, and other Fund expenses. This example is intended to help you understand your ongoing costs (in dollars) of investing in the Fund and to compare these costs with the ongoing costs of investing in other mutual funds.
These examples are based on an investment of $1,000 invested at the beginning of the period and held for the entire period, September 1, 2008 through February 28, 2009.
Actual Expenses
The first line of the table below provides information about actual account values and actual expenses. You may use the information in this line, together with the amount you invested, to estimate the expenses that you paid over the period. Simply divide your account value by $1,000 (for example, a $10,000,000 account value divided by $1,000 = 10,000), then multiply the result by the number in the first line under the heading entitled "Net Expense Incurred" to estimate the expenses you paid on your account during this period.
Hypothetical Example for Comparison Purposes
The second line of the table below provides information about hypothetical account values and hypothetical expenses based on the Fund's actual expense ratio and an assumed rate of return of 5% per year before expenses, which is not the Fund's actual return. The hypothetical account values and expenses may not be used to estimate the actual ending account balance or expenses you paid for the period. You may use this information to compare the ongoing costs of investing in the Fund with other funds. To do so, compare this 5% hypothetical example with the 5% hypothetical examples that appear in the shareholder reports of other funds.
Please note that the expenses shown in the table are meant to highlight your ongoing costs only and do not reflect any transactional costs, such as purchase premiums and redemption fees. Therefore, the second line of the table is useful in comparing ongoing costs only, and will not help you determine the relative total costs of owning different funds. In addition, if these transactional costs were included, your costs would have been higher.
| Annualized Net Expense Ratio | Beginning Account Value | Ending Account Value | Net Expense Incurred* | ||||||||||||||||
| Class III | |||||||||||||||||||
| 1) Actual | 0.46 | % | $ | 1,000.00 | $ | 786.80 | $ | 2.04 | |||||||||||
| 2) Hypothetical | 0.46 | % | $ | 1,000.00 | $ | 1,022.51 | $ | 2.31 | |||||||||||
* Expenses are calculated using the Class's annualized expense ratio (including indirect expenses incurred) for the six months ended February 28, 2009, multiplied by the average account value over the period, multiplied by 181 days in the period, divided by 365 days in the year.
40
GMO Global Balanced Asset Allocation Fund
(A Series of GMO Trust)
Tax Information for the Tax Year Ended February 28, 2009 (Unaudited)
The Fund will notify shareholders of amounts for use in preparing 2009 income tax forms in January 2010.
The Fund's distributions to shareholders include $146,393,156 from long-term capital gains.
For taxable, non-corporate shareholders, 13.99% of the income and short-term capital gains, if any, distributed in the Fund's fiscal year ended February 28, 2009 represents qualified dividend income subject to the 15% rate category.
For corporate shareholders, 5.51% of the income and short-term capital gains, if any, distributed in the Fund's fiscal year ended February 28, 2009 qualified for the dividends-received deduction.
The Fund hereby designates as qualified interest income with respect to its taxable year ended February 28, 2009, $31,524,200 or if determined to be different, the qualified interest income of such year.
41
Trustees and Officers (Unaudited)
The following tables list the Trust's Trustees and Officers as of the date of this report; their address and date of birth ("DOB"); their position with the Trust; the length of time holding that position with the Trust; their principal occupation(s) during the past five years; the number of portfolios in the fund complex they oversee; and other directorships they hold in companies subject to registration or reporting requirements of the Securities Exchange Act of 1934 (generally called "public companies") or in registered investment companies. The Trust's Statement of Additional Information ("SAI") includes additional information about the Trust's trustees, including changes subsequent to the date of the report. The SAI is available, without charge, upon request by writing GMO, c/o GMO Trust, 40 Rowes Wharf, Boston, MA 02110.
Independent Trustees:
| Name, Address, and DOB | Position(s) Held with Trust | Term of Office1 and Length of Time Served | Principal Occupation(s) During Past Five Years | Number of Portfolios in Fund Complex Overseen by Trustee | Other Directorships Held by Trustee | ||||||||||||||||||
| Donald W. Glazer, Esq. c/o GMO Trust 40 Rowes Wharf Boston, MA 02110 DOB: 07/26/1944 | Chairman of the Board of Trustees | Chairman of the Board of Trustees since March 2005; Lead Independent Trustee (September 2004 – March 2005); Trustee since December 2000. | Consultant – Law and Business2; Author of Legal Treatises. | 59 | None. | ||||||||||||||||||
1 Each Trustee is elected to serve during the continued lifetime of the Trust until he/she dies, resigns or is removed, or if sooner, until the next meeting of Shareholders called for the purpose of electing Trustees and until the election and qualification of his/her successor.
2 As part of Mr. Glazer's work as a consultant, he provides part-time consulting services to Goodwin Procter LLP ("Goodwin"). Goodwin has provided legal services to Renewable Resources, LLC, an affiliate of GMO; GMO, in connection with its relationship with Renewable Resources; and funds managed by Renewable Resources. Mr. Glazer has represented that he has no financial interest in, and is not involved in the provision of, such legal services. In the calendar years ended December 31, 2007 and December 31, 2008, these entities paid $789,416 and $183,864 respectively, in legal fees and disbursements to Goodwin. In correspondence with the Staff of the Securities and Exchange Commission beginning in August 2006, the Independent Trustees' legal counsel provided the Staff with information regarding Mr. Glazer's relationship with Goodwin and h is other business activities. On September 11, 2007, based on information that had been given to the Staff as of that date, the Staff provided oral no-action assurance consistent with the opinion of the Independent Trustees' legal counsel that Mr. Glazer is not an "interested person" of the Trust.
42
Independent Trustees — (Continued)
| Name, Address, and DOB | Position(s) Held with Trust | Term of Office1 and Length of Time Served | Principal Occupation(s) During Past Five Years | Number of Portfolios in Fund Complex Overseen by Trustee | Other Directorships Held by Trustee | ||||||||||||||||||
| W. Nicholas Thorndike c/o GMO Trust 40 Rowes Wharf Boston, MA 02110 DOB: 03/28/1933 | Trustee | Since March 2005. | Director or trustee of various corporations and charitable organizations, including Courier Corporation (a book publisher and manufacturer) (July 1989 – present); Putnam Funds (December 1992 – June 2004); and Providence Journal (a newspaper publisher) (December 1986 – December 2003). | 59 | Director of Courier Corporation (a book publisher and manufacturer); Member of the Investment Committee of Partners HealthCare System, Inc.3 | ||||||||||||||||||
| Peter Tufano c/o GMO Trust 40 Rowes Wharf Boston, MA 02110 DOB: 04/22/1957 | Trustee | Since December 2008. | Sylvan C. Coleman Professor of Financial Management, Harvard Business School (since 1989). | 59 | Trustee of State Street Navigator Securities Lending Trust (3 Portfolios). | ||||||||||||||||||
1 Each Trustee is elected to serve during the continued lifetime of the Trust until he/she dies, resigns or is removed, or if sooner, until the next meeting of Shareholders called for the purpose of electing Trustees and until the election and qualification of his/her successor.
3 Partners HealthCare System, Inc. is a client of the Manager.
43
Principal Officers:
| Name, Address, and DOB | Position(s) Held with Trust | Term of Office4 and Length of Time Served | Principal Occupation(s) During Past Five Years5 | ||||||||||||
| J.B. Kittredge DOB: 08/22/1954 | President and Chief Executive Officer | Since March 2009. | General Counsel, Grantham, Mayo, Van Otterloo & Co. LLC (October 2005 – Present); Partner, Ropes & Gray LLP. | ||||||||||||
| Sheppard N. Burnett c/o GMO Trust 40 Rowes Wharf Boston, MA 02110 DOB: 10/24/1968 | Treasurer and Chief Financial Officer | Chief Financial Officer since March 2007; Treasurer since November 2006; Assistant Treasurer, September 2004 – November 2006. | Fund Administration Staff, Grantham, Mayo, Van Otterloo & Co. LLC (June 2004 – present); Vice President, Director of Tax, Columbia Management Group (2002 – 2004). | ||||||||||||
| Brent C. Arvidson c/o GMO Trust 40 Rowes Wharf Boston, MA 02110 DOB: 06/26/1969 | Assistant Treasurer | Since August 1998. | Senior Fund Administrator, Grantham, Mayo, Van Otterloo & Co. LLC. | ||||||||||||
| John L. Nasrah c/o GMO Trust 40 Rowes Wharf Boston, MA 02110 DOB: 05/27/1977 | Assistant Treasurer | Since March 2007. | Fund Administrator, Grantham, Mayo, Van Otterloo & Co. LLC (September 2004 – present); Tax Analyst, Bain & Company, Inc. (June 2003 – September 2004). | ||||||||||||
| Mahmoodur Rahman c/o GMO Trust 40 Rowes Wharf Boston, MA 02110 DOB: 11/30/1967 | Assistant Treasurer | Since September 2007. | Fund Administrator, Grantham, Mayo, Van Otterloo & Co. LLC (April 2007 – present); Vice President and Senior Tax Manager, Massachusetts Financial Services Company (January 2000 – April 2007). | ||||||||||||
| Michael E. Gillespie c/o GMO Trust 40 Rowes Wharf Boston, MA 02110 DOB: 02/18/1958 | Chief Compliance Officer | Since March 2005. | Vice President of Compliance (June 2004 – February 2005) and Director of Domestic Compliance (March 2002 – June 2004), Fidelity Investments. | ||||||||||||
4 Each officer is elected to hold such office until his or her successor is duly elected and qualified to carry out the duties and responsibilities of the office, or until he or she resigns or is removed from office.
5 Each of Messrs. Burnett, Arvidson, Bohan, and Pottle serves as an officer and/or director of certain pooled investment vehicles of which GMO or an affiliate of GMO serves as the investment adviser.
44
Principal Officers — (Continued)
| Name, Address, and DOB | Position(s) Held with Trust | Term of Office4 and Length of Time Served | Principal Occupation(s) During Past Five Years5 | ||||||||||||
| Jason B. Harrison c/o GMO Trust 40 Rowes Wharf Boston, MA 02110 DOB: 01/29/1977 | Vice President and Clerk | Vice President since November 2006; Clerk since March 2006. | Legal Counsel, Grantham, Mayo, Van Otterloo & Co. LLC (since February 2006) and Attorney, Ropes & Gray LLP (September 2002 – February 2006). | ||||||||||||
| David L. Bohan c/o GMO Trust 40 Rowes Wharf Boston, MA 02110 DOB: 06/21/1964 | Vice President and Assistant Clerk | Vice President since March 2005; Assistant Clerk since March 2006. | Legal Counsel, Grantham, Mayo, Van Otterloo & Co. LLC. | ||||||||||||
| Gregory L. Pottle c/o GMO Trust 40 Rowes Wharf Boston, MA 02110 DOB: 07/09/1971 | Vice President and Assistant Clerk | Since November 2006. | Legal Counsel, Grantham, Mayo, Van Otterloo & Co. LLC. | ||||||||||||
| Anne K. Trinque c/o GMO Trust 40 Rowes Wharf Boston, MA 02110 DOB: 04/15/1978 | Vice President and Assistant Clerk | Since September 2007. | Legal Counsel, Grantham, Mayo, Van Otterloo & Co. LLC (January 2007 – present); Attorney, Goodwin Procter LLP (September 2003 – January 2007). | ||||||||||||
| Cheryl Wakeham c/o GMO Trust 40 Rowes Wharf Boston, MA 02110 DOB: 10/29/1958 | Vice President and Anti-Money Laundering Officer | Since December 2004. | Manager, Client Service Administration, Grantham, Mayo, Van Otterloo & Co. LLC. | ||||||||||||
4 Each officer is elected to hold such office until his or her successor is duly elected and qualified to carry out the duties and responsibilities of the office, or until he or she resigns or is removed from office.
5 Each of Messrs. Burnett, Arvidson, Bohan, and Pottle serves as an officer and/or director of certain pooled investment vehicles of which GMO or an affiliate of GMO serves as the investment adviser.
45
GMO International Equity Allocation Fund
(A Series of GMO Trust)
Annual Report
February 28, 2009
For a free copy of the Fund's proxy voting guidelines, shareholders may call 1-617-346-7646 (collect) or visit the Securities and Exchange Commission's website at www.sec.gov. Information regarding how the Fund voted proxies relating to portfolio securities during the most recent 12-month period ended June 30 is available on GMO's website at www.gmo.com, or on the Securities and Exchange Commission's website at www.sec.gov.
The Fund files its complete schedule of portfolio holdings with the Securities and Exchange Commission for the first and third quarter of each fiscal year on Form N-Q, which is available on the Commission's website at www.sec.gov. The Fund's Form N-Q may be reviewed and copied at the Commission's Public Reference Room in Washington, D.C. Information on the operation of the Public Reference Room may be obtained by calling 1-800-SEC-0330. The Fund has a policy with respect to disclosure of portfolio holdings under which it may also make available on GMO's website at www.gmo.com a complete schedule of portfolio holdings.
This report is prepared for the general information of shareholders. It is authorized for distribution to prospective investors only when preceded or accompanied by a prospectus for the GMO Trust, which contains a complete discussion of the risks associated with an investment in this Fund and other important information. The GMO Trust prospectus can be obtained at www.gmo.com.
GMO International Equity Allocation Fund
(A Series of GMO Trust)
Portfolio Management
Day-to-day management of the Fund's portfolio is the responsibility of the Asset Allocation team at Grantham, Mayo, Van Otterloo & Co. LLC.
Management Discussion and Analysis of Fund Performance
The GMO International Equity Allocation Fund returned -48.6% for the fiscal year ended February 28, 2009, as compared to -51.5% for the MSCI ACWI (All Country World Index) ex-U.S. Index. During the fiscal year the Fund was exposed to international equity securities through its investment in underlying GMO mutual funds.
Implementation was positive as the GMO International Growth Equity and GMO International Intrinsic Value Funds outperformed their respective benchmarks.
Asset allocation detracted slightly, as the Fund spent part of the year overweight in emerging market equities.
The views expressed herein are exclusively those of Grantham, Mayo, Van Otterloo & Co. LLC Management as of the date of this report and are subject to change. GMO disclaims any responsibility to update such views. They are not meant as investment advice. References to specific securities are not recommendations of such securities and may not be representative of any GMO portfolio's current or future investments.
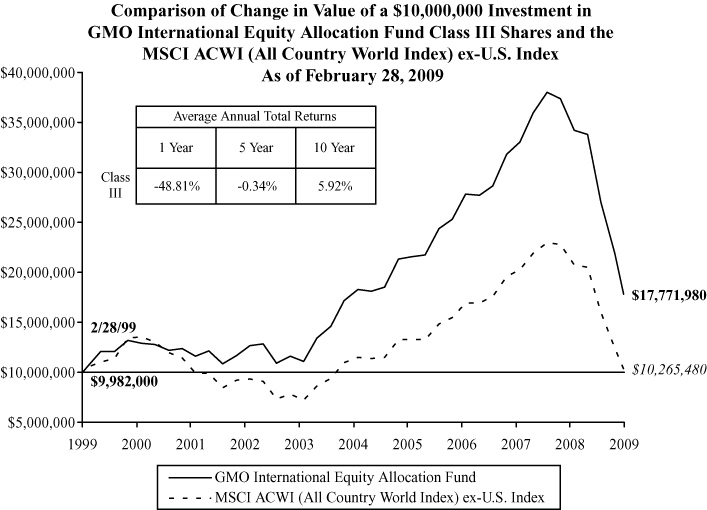
Performance data quoted represents past performance and is not indicative of future results. The investment return and principal value of an investment will fluctuate so that an investor's shares, when redeemed, may be worth more or less than their original cost. Current performance data may be lower or higher than the performance data provided herein. To obtain performance information to the most recent month-end, visit www.gmo.com. Performance shown is net of all fees after reimbursement from the Manager. Each performance figure assumes a purchase at the beginning and redemption at the end of the stated period and reflects a transaction fee of .18% on the purchase and .18% on the redemption. Transaction fees are retained by the Fund to cover trading costs. Returns would have been lower had certain expenses not been reimbursed during the periods shown and do not include the effect of taxes on distributions and redemptions. All information is unaudited.
GMO International Equity Allocation Fund
(A Series of GMO Trust)
Investments Concentration Summary
February 28, 2009 (Unaudited)
| Asset Class Summary* | % of Total Net Assets | ||||||
| Common Stocks | 92.3 | % | |||||
| Short-Term Investments | 3.2 | ||||||
| Preferred Stocks | 2.0 | ||||||
| Investment Funds | 0.7 | ||||||
| Private Equity Securities | 0.1 | ||||||
| Debt Obligations | 0.0 | ||||||
| Convertible Securities | 0.0 | ||||||
| Rights and Warrants | 0.0 | ||||||
| Forward Currency Contracts | (0.4 | ) | |||||
| Futures | (0.6 | ) | |||||
| Other | 2.7 | ||||||
| 100.0 | % | ||||||
* The table above incorporates aggregate indirect asset class exposure associated with investments in other funds of GMO Trust ("underlying funds").
1
GMO International Equity Allocation Fund
(A Series of GMO Trust)
Investments Concentration Summary — (Continued)
February 28, 2009 (Unaudited)
| Country/Region Summary** | % of Investments | ||||||
| Japan | 23.6 | % | |||||
| Euro Region*** | 21.2 | ||||||
| United Kingdom | 18.1 | ||||||
| Switzerland | 9.9 | ||||||
| Brazil | 3.1 | ||||||
| Korea | 3.0 | ||||||
| Australia | 2.4 | ||||||
| Canada | 2.4 | ||||||
| Taiwan | 2.3 | ||||||
| China | 2.0 | ||||||
| Hong Kong | 2.0 | ||||||
| South Africa | 1.2 | ||||||
| Denmark | 1.1 | ||||||
| Singapore | 1.1 | ||||||
| Sweden | 0.9 | ||||||
| Turkey | 0.9 | ||||||
| Thailand | 0.8 | ||||||
| Russia | 0.6 | ||||||
| United States | 0.6 | ||||||
| Malaysia | 0.5 | ||||||
| Norway | 0.4 | ||||||
| India | 0.3 | ||||||
| Mexico | 0.3 | ||||||
| Egypt | 0.2 | ||||||
| Israel | 0.2 | ||||||
| Poland | 0.2 | ||||||
| Chile | 0.1 | ||||||
| Czech Republic | 0.1 | ||||||
| Hungary | 0.1 | ||||||
| Indonesia | 0.1 | ||||||
| Morocco | 0.1 | ||||||
| New Zealand | 0.1 | ||||||
| Philippines | 0.1 | ||||||
| 100.0 | % | ||||||
** The table above incorporates aggregate indirect country exposure associated with investments in the underlying funds. The table excludes short-term investments. The table includes exposure through the use of derivative contracts.
*** The "Euro Region" is comprised of Austria, Belgium, Finland, France, Germany, Greece, Ireland, Italy, Netherlands, Portugal and Spain.
2
GMO International Equity Allocation Fund
(A Series of GMO Trust)
Schedule of Investments
(showing percentage of total net assets)
February 28, 2009
| Shares / Par Value ($) | Description | Value ($) | |||||||||
| MUTUAL FUNDS — 100.0% | |||||||||||
| Affiliated Issuers — 100.0% | |||||||||||
| 14,270,388 | GMO Emerging Markets Fund, Class VI | 89,475,333 | |||||||||
| 747,041 | GMO Flexible Equities Fund, Class VI | 11,496,954 | |||||||||
| 14,803,816 | GMO International Growth Equity Fund, Class IV | 214,063,176 | |||||||||
| 14,617,554 | GMO International Intrinsic Value Fund, Class IV | 204,645,762 | |||||||||
| TOTAL MUTUAL FUNDS (COST $927,707,007) | 519,681,225 | ||||||||||
| SHORT-TERM INVESTMENTS — 0.0% | |||||||||||
| 26,246 | State Street Eurodollar Time Deposit, 0.01%, due 03/02/09 | 26,246 | |||||||||
| TOTAL SHORT-TERM INVESTMENTS (COST $26,246) | 26,246 | ||||||||||
| TOTAL INVESTMENTS — 100.0% (Cost $927,733,253) | 519,707,471 | ||||||||||
| Other Assets and Liabilities (net) — (0.0%) | (44,584 | ) | |||||||||
| TOTAL NET ASSETS — 100.0% | $ | 519,662,887 | |||||||||
See accompanying notes to the financial statements.
3
GMO International Equity Allocation Fund
(A Series of GMO Trust)
Statement of Assets and Liabilities — February 28, 2009
| Assets: | |||||||
| Investments in unaffiliated issuers, at value (cost $26,246) (Note 2) | $ | 26,246 | |||||
| Investments in affiliated issuers, at value (cost $927,707,007) (Notes 2 and 8) | 519,681,225 | ||||||
| Receivable for Fund shares sold | 1,152,812 | ||||||
| Receivable for expenses reimbursed by Manager (Note 3) | 9,324 | ||||||
| Miscellaneous receivable | 1,963 | ||||||
| Total assets | 520,871,570 | ||||||
| Liabilities: | |||||||
| Payable for investments purchased | 1,072,673 | ||||||
| Payable for Fund shares repurchased | 81,624 | ||||||
| Payable to affiliate for (Note 3): | |||||||
| Trustees and Chief Compliance Officer of GMO Trust fees | 1,922 | ||||||
| Accrued expenses | 52,464 | ||||||
| Total liabilities | 1,208,683 | ||||||
| Net assets | $ | 519,662,887 | |||||
| Net assets consist of: | |||||||
| Paid-in capital | $ | 974,514,072 | |||||
| Accumulated net realized loss | (46,825,403 | ) | |||||
| Net unrealized depreciation | (408,025,782 | ) | |||||
| $ | 519,662,887 | ||||||
| Net assets attributable to: | |||||||
| Class III shares | $ | 519,662,887 | |||||
| Shares outstanding: | |||||||
| Class III | 84,198,555 | ||||||
| Net asset value per share: | |||||||
| Class III | $ | 6.17 | |||||
See accompanying notes to the financial statements.
4
GMO International Equity Allocation Fund
(A Series of GMO Trust)
Statement of Operations — Year Ended February 28, 2009
| Investment Income: | |||||||
| Dividends from affiliated issuers (Note 8) | $ | 23,497,018 | |||||
| Interest | 310 | ||||||
| Total investment income | 23,497,328 | ||||||
| Expenses: | |||||||
| Custodian, fund accounting agent and transfer agent fees | 46,539 | ||||||
| Audit and tax fees | 33,380 | ||||||
| Legal fees | 17,106 | ||||||
| Trustees fees and related expenses (Note 3) | 9,713 | ||||||
| Registration fees | 8,550 | ||||||
| Miscellaneous | 8,617 | ||||||
| Total expenses | 123,905 | ||||||
| Fees and expenses reimbursed by Manager (Note 3) | (109,246 | ) | |||||
| Expense reductions (Note 2) | (3,630 | ) | |||||
| Net expenses | 11,029 | ||||||
| Net investment income (loss) | 23,486,299 | ||||||
| Realized and unrealized gain (loss): | |||||||
| Net realized gain (loss) on: | |||||||
| Investments in affiliated issuers | (40,554,833 | ) | |||||
| Realized gains distributions from affiliated issuers (Note 8) | 60,958,671 | ||||||
| Net realized gain (loss) | 20,403,838 | ||||||
| Change in net unrealized appreciation (depreciation) on: | |||||||
| Investments in affiliated issuers | (463,476,207 | ) | |||||
| Net realized and unrealized gain (loss) | (443,072,369 | ) | |||||
| Net increase (decrease) in net assets resulting from operations | $ | (419,586,070 | ) | ||||
See accompanying notes to the financial statements.
5
GMO International Equity Allocation Fund
(A Series of GMO Trust)
Statement of Changes in Net Assets
| Year Ended February 28, 2009 | Year Ended February 29, 2008 | ||||||||||
| Increase (decrease) in net assets: | |||||||||||
| Operations: | |||||||||||
| Net investment income (loss) | $ | 23,486,299 | $ | 13,683,208 | |||||||
| Net realized gain (loss) | 20,403,838 | 164,601,980 | |||||||||
| Change in net unrealized appreciation (depreciation) | (463,476,207 | ) | (115,404,606 | ) | |||||||
| Net increase (decrease) in net assets from operations | (419,586,070 | ) | 62,880,582 | ||||||||
| Distributions to shareholders from: | |||||||||||
| Net investment income | |||||||||||
| Class III | (24,219,892 | ) | (42,033,244 | ) | |||||||
| Net realized gains | |||||||||||
| Class III | (163,749,117 | ) | (90,134,712 | ) | |||||||
| (187,969,009 | ) | (132,167,956 | ) | ||||||||
| Net share transactions (Note 7): | |||||||||||
| Class III | 370,949,981 | 65,994,952 | |||||||||
| Purchase premiums and redemption fees (Notes 2 and 7): | |||||||||||
| Class III | 725,960 | 77,341 | |||||||||
| Total increase (decrease) in net assets resulting from net share transactions, purchase premiums and redemption fees | 371,675,941 | 66,072,293 | |||||||||
| Total increase (decrease) in net assets | (235,879,138 | ) | (3,215,081 | ) | |||||||
| Net assets: | |||||||||||
| Beginning of period | 755,542,025 | 758,757,106 | |||||||||
| End of period | $ | 519,662,887 | $ | 755,542,025 | |||||||
See accompanying notes to the financial statements.
6
GMO International Equity Allocation Fund
(A Series of GMO Trust)
Financial Highlights
(For a Class III share outstanding throughout each period)
| Year Ended February 28/29, | |||||||||||||||||||||||
| 2009 | 2008 | 2007 | 2006 | 2005 | |||||||||||||||||||
| Net asset value, beginning of period | $ | 16.45 | $ | 17.96 | $ | 17.13 | $ | 15.19 | $ | 12.83 | |||||||||||||
| Income (loss) from investment operations: | |||||||||||||||||||||||
| Net investment income (loss)(a)† | 0.40 | 0.31 | 0.33 | 0.18 | 0.29 | ||||||||||||||||||
| Net realized and unrealized gain (loss) | (7.20 | ) | 1.32 | 2.85 | 2.90 | 2.65 | |||||||||||||||||
| Total from investment operations | (6.80 | ) | 1.63 | 3.18 | 3.08 | 2.94 | |||||||||||||||||
| Less distributions to shareholders: | |||||||||||||||||||||||
| From net investment income | (0.39 | ) | (1.00 | ) | (0.83 | ) | (0.47 | ) | (0.42 | ) | |||||||||||||
| From net realized gains | (3.09 | ) | (2.14 | ) | (1.52 | ) | (0.67 | ) | (0.16 | ) | |||||||||||||
| Total distributions | (3.48 | ) | (3.14 | ) | (2.35 | ) | (1.14 | ) | (0.58 | ) | |||||||||||||
| Net asset value, end of period | $ | 6.17 | $ | 16.45 | $ | 17.96 | $ | 17.13 | $ | 15.19 | |||||||||||||
| Total Return(b) | (48.63 | )% | 7.81 | % | 19.33 | % | 21.15 | % | 23.25 | % | |||||||||||||
| Ratios/Supplemental Data: | |||||||||||||||||||||||
| Net assets, end of period (000's) | $ | 519,663 | $ | 755,542 | $ | 758,757 | $ | 659,520 | $ | 489,026 | |||||||||||||
| Net expenses to average daily net assets(c)(d) | 0.00 | %(e) | 0.00 | %(e) | 0.00 | % | 0.00 | % | 0.00 | % | |||||||||||||
| Net investment income to average daily net assets(a) | 3.46 | % | 1.66 | % | 1.87 | % | 1.15 | % | 2.18 | % | |||||||||||||
| Portfolio turnover rate | 33 | % | 9 | % | 4 | % | 7 | % | 15 | % | |||||||||||||
| Fees and expenses reimbursed by the Manager to average daily net assets: | 0.02 | % | 0.01 | % | 0.01 | % | 0.02 | % | 0.03 | % | |||||||||||||
| Purchase premiums and redemption fees consisted of the following per share amounts:† | $ | 0.01 | $ | 0.00 | (f) | $ | 0.00 | (f) | $ | 0.00 | (f) | $ | 0.01 | ||||||||||
(a) Net investment income is affected by the timing of the declaration of dividends by the underlying funds in which the Fund invests.
(b) The total returns would have been lower had certain expenses not been reimbursed during the periods shown and assumes the effect of reinvested distributions. Calculation excludes purchase premiums and redemption fees which are borne by the shareholder.
(c) Net expenses exclude expenses incurred indirectly through investment in the underlying funds (See Note 3).
(d) Net expenses to average daily net assets were less than 0.01%.
(e) The net expense ratio does not include the effect of expense reductions.
(f) Purchase premiums and redemption fees were less than $0.01 per share.
† Calculated using average shares outstanding throughout the period.
See accompanying notes to the financial statements.
7
GMO International Equity Allocation Fund
(A Series of GMO Trust)
Notes to Financial Statements
February 28, 2009
1. Organization
GMO International Equity Allocation Fund (the "Fund") is a series of GMO Trust (the "Trust"). The Fund is registered under the Investment Company Act of 1940, as amended, as an open-end, diversified management investment company. The Fund is advised and managed by Grantham, Mayo, Van Otterloo & Co. LLC (the "Manager" or "GMO"). The Trust was established as a Massachusetts business trust under the laws of The Commonwealth of Massachusetts on June 24, 1985. The Declaration of Trust permits the Trustees of the Trust ("Trustees") to create an unlimited number of series of shares ("Funds") and to subdivide Funds into classes.
The Fund seeks total return greater than that of the MSCI ACWI (All Country World Index) ex-U.S. Index. The Fund is a fund of funds and invests primarily in shares of the GMO International Equity Funds (which may include one or more of the GMO Emerging Markets Funds). The Fund may also invest in shares of other GMO Funds, including the GMO Fixed Income Funds, GMO Alpha Only Fund, GMO Flexible Equities Fund, and GMO Alternative Asset Opportunity Fund.
The financial statements of the series of the Trust in which the Fund invests ("underlying funds") should be read in conjunction with the Fund's financial statements. These financial statements are available, without charge, upon request, by calling (617) 346-7646 (collect) or by visiting GMO's website at www.gmo.com. Shares of GMO Flexible Equities Fund are not publicly available for direct purchase.
2. Significant accounting policies
The following is a summary of significant accounting policies followed by the Fund in the preparation of its financial statements. These policies are in conformity with accounting principles generally accepted in the United States of America ("U.S. GAAP") and have been consistently followed by the Fund in preparing its financial statements. The preparation of financial statements in accordance with U.S. GAAP requires management to make estimates and assumptions that affect the reported amounts and disclosures in the financial statements. Actual results could differ from those estimates. The accounting records of the Fund are maintained in U.S. dollars.
Portfolio valuation
Shares of the underlying funds and other mutual funds are generally valued at their net asset value.
Investments held by the underlying funds are valued as follows. Securities listed on a securities exchange for which market quotations are readily available are valued at the last sale price or official closing price on each business day, or if there is no such reported sale or official closing price, at the most recent quoted bid price. Unlisted securities for which market quotations are readily available are generally valued at the most recent quoted bid price. Debt instruments with a remaining maturity of sixty days or less are generally valued at amortized cost, which approximates fair value. Securities for which quotations are not
8
GMO International Equity Allocation Fund
(A Series of GMO Trust)
Notes to Financial Statements — (Continued)
February 28, 2009
readily available or whose values the Manager has determined to be unreliable are valued at fair value as determined in good faith by the Trustees or persons acting at their direction pursuant to procedures approved by the Trustees. By its nature, a fair value price is a good faith estimate of the value of a security at a given point in time and may not reflect the value that would be realized if the security were sold. The difference between a fair value price and the value realized upon a sale could be material. Because many foreign equity securities markets and exchanges close prior to the close of the New York Stock Exchange ("NYSE"), closing prices for foreign securities in those markets or on those exchanges do not reflect the events that occur after that close but before the close of the NYSE. As a result, the Fund generally values foreign equity securities using fair value prices, which are based on adjustments to closin g prices supplied by a third party vendor based on that vendor's proprietary models. As of February 28, 2009, 82.02% of the net assets of the Fund, through investments in the underlying funds, were valued using fair value prices based on models used by a third party vendor.
In September 2006, the Financial Accounting Standards Board ("FASB") issued Statement of Financial Accounting Standards No. 157, Fair Value Measurements ("SFAS 157"). SFAS 157 is effective for the Fund's current fiscal year. While the adoption of SFAS 157 does not have an effect on the Fund's net asset value, it does require additional disclosures about fair value measurements. SFAS 157 establishes a three-level hierarchy for disclosure of fair value measurements. The valuation hierarchy is based upon the reliability of inputs to the valuation of the Fund's investments. The three levels are defined as follows:
Level 1 – Valuations based on quoted prices for identical securities in active markets.
Level 2 – Valuations determined using other significant direct or indirect observable inputs.
Level 3 – Valuations based on inputs that are unobservable and significant.
The inputs or methodology used for valuing securities are not necessarily an indication of the risk associated with investing in those securities.
The following is a summary of the fair valuations according to inputs used as of February 28, 2009 in valuing the Fund's investments:
| Asset Valuation Inputs | Investments in Securities | Other Financial Instruments | |||||||||
| Level 1 - Quoted Prices | $ | 508,210,517 | $ | — | |||||||
| Level 2 - Other Significant Observable Inputs | 11,496,954 | — | |||||||||
| Level 3 - Significant Unobservable Inputs | — | — | |||||||||
| Total | $ | 519,707,471 | $ | — | |||||||
9
GMO International Equity Allocation Fund
(A Series of GMO Trust)
Notes to Financial Statements — (Continued)
February 28, 2009
| Liability Valuation Inputs | Investments in Securities | Other Financial Instruments | |||||||||
| Level 1 - Quoted Prices | $ | — | $ | — | |||||||
| Level 2 - Other Significant Observable Inputs | — | — | |||||||||
| Level 3 - Significant Unobservable Inputs | — | — | |||||||||
| Total | $ | — | $ | — | |||||||
For the underlying fund's summary of valuation inputs please refer to the respective fund's portfolio valuation note.
The Fund held no investments or other financial instruments at either February 29, 2008 or February 28, 2009, whose fair value was determined using Level 3 inputs.
Repurchase agreements
The Fund may enter into repurchase agreements. Under a repurchase agreement the Fund acquires a security for cash and obtains a simultaneous commitment from the seller to repurchase the security at an agreed upon price and date. The Fund, through its custodian, takes possession of securities collateralizing the repurchase agreement. The collateral is marked to market daily to ensure that the market value of the underlying assets is at least equal to the amount owed to the Fund in the event of default by the seller. If the seller of a repurchase agreement defaults or enters into insolvency proceedings and the value of the collateral declines, the Fund's recovery of cash may be delayed or limited. The Fund had no repurchase agreements outstanding at the end of the period.
Taxes and distributions
The Fund intends to qualify each tax year as a regulated investment company under Subchapter M of the Internal Revenue Code of 1986, as amended (the "Code"). The Fund intends to distribute substantially all of its net investment income and all of its net realized short-term and long-term capital gain, if any, after giving effect to any available capital loss carryforwards for U.S. federal income tax purposes. Therefore, no provision for U.S. federal income or excise tax is necessary.
The Fund's policy is to declare and pay distributions from net investment income, if any, semiannually, and from net realized short-term and long-term capital gain, if any, at least annually. All distributions are paid in shares of the Fund, at net asset value, unless the shareholder elects to receive cash distributions. Distributions to shareholders are recorded by the Fund on the ex-dividend date.
Income and capital gain distributions are determined in accordance with U.S. federal income tax regulations, which may differ from U.S. GAAP. Certain capital accounts in the financial statements are periodically adjusted for permanent differences in order to reflect their tax character. These adjustments have no impact on net assets or net asset value per share. Temporary differences that arise from recognizing certain items of income, expense, gain or loss in different periods for financial statement and
10
GMO International Equity Allocation Fund
(A Series of GMO Trust)
Notes to Financial Statements — (Continued)
February 28, 2009
tax purposes will reverse at some time in the future. Distributions in excess of net investment income or net realized gains are temporary over-distributions for financial statement purposes resulting from differences in the recognition or classification of income or distributions for financial statement and tax purposes.
U.S. GAAP and tax accounting differences primarily relate to differing treatment of mutual fund distributions received and losses on wash sale transactions.
The following reclassification represents the amount necessary to report the stated components of net assets on a tax basis, excluding certain temporary differences, as of February 28, 2009. The financial highlights exclude these adjustments.
| Distributions In Excess of Net Investment Income | Accumulated Net Realized Loss | Paid-in Capital | |||||||||
| $ | 733,593 | $ | (733,593 | ) | $ | — | |||||
The tax character of distributions declared to shareholders is as follows:
| 2/28/2009 | 2/29/2008 | ||||||||||
| Ordinary income (including any net short-term capital gain) | $ | 24,217,411 | $ | 42,017,444 | |||||||
| Net long-term capital gain | 163,751,598 | 90,150,512 | |||||||||
| Total distributions | $ | 187,969,009 | $ | 132,167,956 | |||||||
Distributions in excess of tax basis earnings and profits, if significant, are reported in the financial statements as a return of capital for tax purposes.
As of February 28, 2009, the components of distributable earnings on a tax basis consisted of the following:
| Undistributed net long–term capital gain | $ | 9,681,712 | |||||
As of February 28, 2009, the approximate cost for U.S. federal income tax purposes and gross and net unrealized appreciation (depreciation) in value of investments were as follows:
| Aggregate Cost | Gross Unrealized Appreciation | Gross Unrealized (Depreciation) | Net Unrealized Appreciation (Depreciation) | ||||||||||||
| $ | 984,240,368 | $ | — | $ | (464,532,897 | ) | $ | (464,532,897 | ) | ||||||
11
GMO International Equity Allocation Fund
(A Series of GMO Trust)
Notes to Financial Statements — (Continued)
February 28, 2009
The Fund is subject to the provisions of Financial Accounting Standards Board Interpretation No. 48 ("FIN 48"), Accounting for Uncertainty in Income Taxes — an Interpretation of FASB Statement No. 109. FIN 48 sets forth a minimum threshold for financial statement recognition of a tax position taken or expected to be taken in a tax return that could affect the Fund's financial statements. The Fund did not have any unrecognized tax benefits or liabilities at February 28, 2009, nor did it have any increases or decreases in unrecognized tax benefits or liabilities for the period then ended. The Fund is subject to examination prior to the expiration of the statute of limitations by U.S. federal and state tax authorities for tax returns filed.
Security transactions and related investment income
Security transactions in the financial statements are accounted for on the trade date. Income dividends and capital gain distributions from the underlying funds are recorded on the ex-dividend date. Interest income is recorded on the accrual basis. Non-cash dividends, if any, are recorded at the fair market value of the asset received. In determining the net gain or loss on securities sold, the Fund uses the identified cost basis for the purposes of determining the cost basis.
Expenses
The majority of the expenses of the Trust are directly identifiable to an individual fund. Expenses that are not readily identifiable to a specific fund are allocated taking into consideration, among other things, the nature and type of expense and the relative size of the funds. In addition, the Fund incurs fees and expenses indirectly as a shareholder in the underlying funds. Because the underlying funds have different expense and fee levels and the Fund may own different proportions of the underlying funds at different times, the amount of fees and expenses indirectly incurred by the Fund will vary and the Manager has a conflict in allocating among the underlying funds (See Note 3).
State Street Bank and Trust Company ("State Street") serves as custodian, fund accounting agent and transfer agent of the Fund. State Street's fees may be reduced by an earnings allowance calculated on the average daily cash balances the Fund maintains with State Street. The Fund receives the benefit of the earnings allowance. Credit balances or expense reimbursements used to reduce fees, if any, are reported as a reduction of expenses in the Statement of Operations.
Purchases and redemptions of Fund shares
Effective June 30, 2008, the premium on cash purchases and fee on cash redemptions of Fund shares were each changed to 0.17% of the amount invested or redeemed. Effective September 30, 2008, the premium on cash purchases and fee on cash redemptions were each changed to 0.14% of the amount invested or redeemed. Effective October 21, 2008, the premium on cash purchases and fee on cash redemptions were each changed to 0.18% of the amount invested or redeemed. As of February 28, 2009, the premium on cash purchases and fee on cash redemptions were each 0.18% of the amount invested or redeemed. The level of purchase premium and redemption fee for the Fund may be adjusted to account for changes in the Fund's investments (i.e., changes in the percentage of Fund assets allocated to each underlying fund). The
12
GMO International Equity Allocation Fund
(A Series of GMO Trust)
Notes to Financial Statements — (Continued)
February 28, 2009
Fund may impose a new purchase premium and/or redemption fee, or modify or eliminate an existing purchase premium and/or redemption fee, at any time. If the Manager determines that any portion of a cash purchase or redemption is offset by a corresponding cash redemption or purchase on the same day, the Fund will ordinarily waive or reduce the purchase premium or redemption fee with respect to that portion. All or portion of the redemption fees may be waived at the manager's discretion under circumstances in which the Manager deems it equitable to do so, including without limitation in cases where the weighted average of (i) the estimated transaction costs for directly held assets and (ii) the redemption fees, if any, imposed by the underlying funds is less than the Fund's redemption fee. In addition, the Fund may waive or reduce the purchase premium or redemption fee in extraordinary circumstances if the purchase or redemption w ill not cause the Fund to incur transaction costs. All purchase premiums and redemption fees are paid to the Fund and recorded by the Fund as paid-in capital. The Fund will waive or reduce the purchase premium relating to the in-kind portion of a purchase transaction except for estimated or known transaction costs (e.g. stamp duties and transfer taxes) incurred by the Fund as a result of the transfer of the purchasing shareholder's securities to the Fund. In-kind redemption transactions are generally not subject to redemption fees except when they include a cash component. However, when a substantial portion of a Fund is being redeemed, the Fund may charge a redemption fee based on estimated or known transaction costs resulting from those redemptions. The Fund charges no premium for reinvested distributions.
Investment risks
The Fund is subject to the investment risks associated with an investment in the underlying funds, some of which may invest in foreign securities. The Fund is subject to risks involved in investing in foreign securities that are not presented by investments in U.S. securities. These risks may involve adverse political and economic developments, including expropriation and the possible imposition of capital controls or other foreign governmental laws or restrictions. In addition, the securities of some foreign companies and securities markets are less liquid and at times more volatile than securities of comparable U.S. companies and U.S. securities markets. The risks described above apply to an even greater extent to investments in emerging markets. The securities markets of emerging countries are generally smaller, less developed, less liquid, and more volatile than the securities markets of the U.S. and developed foreign market s. Additionally, the investment risks associated with an investment in the underlying funds may be greater to the extent that the underlying funds engage in derivative transactions.
Recently issued accounting pronouncement
In March 2008, FASB issued Statement of Financial Accounting Standards No. 161, Disclosures about Derivative Instruments and Hedging Activities ("SFAS 161"). SFAS 161 is effective for fiscal years and interim periods beginning after November 15, 2008. SFAS 161 requires enhanced disclosures about the Fund's derivative and hedging activities. The Manager is currently evaluating the impact the adoption of SFAS 161 will have on the Fund's financial statement disclosures.
13
GMO International Equity Allocation Fund
(A Series of GMO Trust)
Notes to Financial Statements — (Continued)
February 28, 2009
3. Fees and other transactions with affiliates
The Manager decides how to allocate the assets of the Fund among underlying funds. The Manager does not directly charge the Fund a management fee or shareholder service fee, but it receives varying management and shareholder service fees from the underlying funds in which the Fund invests. Because of that variation the levels of indirect net expenses set forth below are affected by the Manager's asset allocation decisions.
Through at least June 30, 2009, the Manager has contractually agreed to reimburse the Fund for Fund expenses incurred through that date (excluding "Excluded Expenses", as defined below). Excluded Expenses include fees and expenses of the independent Trustees of the Trust, fees and expenses for legal services not approved by the Manager for the Trust, compensation and expenses of the Trust's Chief Compliance Officer ("CCO") (excluding any employee benefits), brokerage commissions, securities lending fees and expenses, interest expense, transfer taxes, and other investment-related costs (including expenses associated with investments in any company that is an investment company or would be an investment company under the 1940 Act, but for the exceptions to the definition of investment company provided in Section 3(c)(1) and 3(c)(7) of the 1940 Act), hedging transaction fees, extraordinary, non-recurring and certain other unusual e xpenses (including taxes).
The Fund incurs fees and expenses indirectly as a shareholder in the underlying funds. For the year ended February 28, 2009, these indirect fees and expenses expressed as an annualized percentage of the Fund's average daily net assets were as follows:
| Indirect Net Expenses (excluding shareholder service fees) | Indirect Shareholder Service Fees | Total Indirect Expenses | |||||||||
| 0.604 | % | 0.084 | % | 0.688 | % | ||||||
The Fund's portion of the fees paid by the Trust to the Trust's independent Trustees and CCO during the year ended February 28, 2009 was $7,893 and $4,946, respectively. The compensation and expenses of the CCO are included in miscellaneous expenses in the Statement of Operations. The Fund paid no remuneration to any other officer of the Trust.
4. Purchases and sales of securities
Cost of purchases and proceeds from sales of securities, excluding short-term investments and class exchanges, for the year ended February 28, 2009 aggregated $489,534,336 and $221,380,102, respectively.
14
GMO International Equity Allocation Fund
(A Series of GMO Trust)
Notes to Financial Statements — (Continued)
February 28, 2009
5. Guarantees
In the normal course of business the Fund enters into contracts with third-party service providers that contain a variety of representations and warranties and that provide general indemnifications. The Fund's maximum exposure under these arrangements is unknown, as it involves future claims that may be made against the Fund that have not yet occurred. Based on experience, management is of the view that the risk of loss in connection with its indemnification obligations is remote; however, there can be no assurance that such obligations will not result in material liabilities that adversely affect the Fund.
6. Principal shareholders and related parties
As of February 28, 2009, 13.54% of the outstanding shares of the Fund were held by one shareholder. On that date, no other shareholder owned more than 10% of the outstanding shares of the Fund. Redemptions from (or investments into) the Fund by or on behalf of this large shareholder may have a material effect on the Fund.
As of February 28, 2009, 0.01% of the Fund's shares were held by senior management of the Manager and GMO Trust officers and none of the Fund's shares were held by accounts for which the Manager had investment discretion.
7. Share transactions
The Declaration of Trust permits the Trust to issue an unlimited number of shares of beneficial interest (without par value). Transactions in Fund shares were as follows:
| Year Ended February 28, 2009 | Year Ended February 29, 2008 | ||||||||||||||||||
| Class III: | Shares | Amount | Shares | Amount | |||||||||||||||
| Shares sold | 31,165,724 | $ | 323,942,000 | 25,844 | $ | 478,479 | |||||||||||||
| Shares issued to shareholders in reinvestment of distributions | 18,335,555 | 179,922,703 | 6,819,633 | 126,019,627 | |||||||||||||||
| Shares repurchased | (11,239,414 | ) | (132,914,722 | ) | (3,144,468 | ) | (60,503,154 | ) | |||||||||||
| Purchase premiums | — | 547,551 | — | 742 | |||||||||||||||
| Redemption fees | — | 178,409 | — | 76,599 | |||||||||||||||
| Net increase (decrease) | 38,261,865 | $ | 371,675,941 | 3,701,009 | $ | 66,072,293 | |||||||||||||
15
GMO International Equity Allocation Fund
(A Series of GMO Trust)
Notes to Financial Statements — (Continued)
February 28, 2009
8. Investments in affiliated issuers
A summary of the Fund's transactions in the shares of other funds of the Trust during the year ended February 28, 2009 is set forth below:
| Affiliate | Value, beginning of period | Purchases | Sales Proceeds | Dividend Income | Distributions of Realized Gains | Value, end of period | |||||||||||||||||||||
| GMO Emerging Countries Fund, Class III | $ | 24,331,147 | $ | 2,177,207 | $ | 22,240,591 | $ | — | $ | 2,177,207 | $ | — | |||||||||||||||
| GMO Emerging Markets Fund, Class VI | 165,596,573 | 113,901,801 | 56,870,215 | 1,667,312 | 32,129,915 | 89,475,333 | |||||||||||||||||||||
| GMO Flexible Equities Fund, Class VI | — | 15,242,929 | 345,770 | 1,479 | — | 11,496,954 | |||||||||||||||||||||
| GMO International Growth Equity Fund, Class IV | 283,913,374 | 173,575,757 | 73,398,372 | 10,443,287 | 10,296,359 | 214,063,176 | |||||||||||||||||||||
| GMO International Intrinsic Value Fund, Class IV | 281,716,937 | 184,636,642 | 68,525,154 | 11,384,940 | 16,355,190 | 204,645,762 | |||||||||||||||||||||
| Totals | $ | 755,558,031 | $ | 489,534,336 | $ | 221,380,102 | $ | 23,497,018 | $ | 60,958,671 | $ | 519,681,225 | |||||||||||||||
16
Report of Independent Registered Public Accounting Firm
To the Trustees of GMO Trust and the Shareholders of
GMO International Equity Allocation Fund:
In our opinion, the accompanying statement of assets and liabilities, including the schedule of investments, and the related statements of operations and of changes in net assets and the financial highlights present fairly, in all material respects, the financial position of GMO International Equity Allocation Fund (the "Fund") at February 28, 2009, the results of its operations for the year then ended, the changes in its net assets for each of the two years in the period then ended and the financial highlights for each of the five years in the period then ended, in conformity with accounting principles generally accepted in the United States of America. These financial statements and financial highlights (hereafter referred to as "financial statements") are the responsibility of the Fund's management. Our responsibility is to express an opinion on these financial statements based on our audits. We conducted our audits of these financial statements in accordance with the standards of the Public Company Accounting Oversight Board (United States). Those standards require that we plan and perform the audit to obtain reasonable assurance about whether the financial statements are free of material misstatement. An audit includes examining, on a test basis, evidence supporting the amounts and disclosures in the financial statements, assessing the accounting principles used and significant estimates made by management, and evaluating the overall financial statement presentation. We believe that our audits, which included confirmation of securities at February 28 2009, by correspondence with the custodian, provide a reasonable basis for our opinion.
PricewaterhouseCoopers LLP
Boston, Massachusetts
April 29, 2009
17
GMO International Equity Allocation Fund
(A Series of GMO Trust)
Fund Expenses
February 28, 2009 (Unaudited)
Expense Examples: The following information is in relation to expenses for the six month period ended February 28, 2009.
As a shareholder of the Fund, you may incur two types of costs: (1) transaction costs, including purchase premiums and redemption fees; and (2) ongoing costs, including indirect management fees, shareholder service fees, and other Fund expenses. This example is intended to help you understand your ongoing costs (in dollars) of investing in the Fund and to compare these costs with the ongoing costs of investing in other mutual funds.
These examples are based on an investment of $1,000 invested at the beginning of the period and held for the entire period, September 1, 2008 through February 28, 2009.
Actual Expenses
The first line of the table below provides information about actual account values and actual expenses. You may use the information in this line, together with the amount you invested, to estimate the expenses that you paid over the period. Simply divide your account value by $1,000 (for example, a $10,000,000 account value divided by $1,000 = 10,000), then multiply the result by the number in the first line under the heading entitled "Net Expense Incurred" to estimate the expenses you paid on your account during this period.
Hypothetical Example for Comparison Purposes
The second line of the table below provides information about hypothetical account values and hypothetical expenses based on the Fund's actual expense ratio and an assumed rate of return of 5% per year before expenses, which is not the Fund's actual return. The hypothetical account values and expenses may not be used to estimate the actual ending account balance or expenses you paid for the period. You may use this information to compare the ongoing costs of investing in the Fund with other funds. To do so, compare this 5% hypothetical example with the 5% hypothetical examples that appear in the shareholder reports of other funds.
Please note that the expenses shown in the table are meant to highlight your ongoing costs only and do not reflect any transactional costs, such as purchase premiums and redemption fees. Therefore, the second line of the table is useful in comparing ongoing costs only, and will not help you determine the relative total costs of owning different funds. In addition, if these transactional costs were included, your costs would have been higher.
| Annualized Net Expense Ratio | Beginning Account Value | Ending Account Value | Net Expense Incurred* | ||||||||||||||||
| Class III | |||||||||||||||||||
| 1) Actual | 0.67 | % | $ | 1,000.00 | $ | 570.70 | $ | 2.61 | |||||||||||
| 2) Hypothetical | 0.67 | % | $ | 1,000.00 | $ | 1,021.47 | $ | 3.36 | |||||||||||
* Expenses are calculated using the Class's annualized expense ratio (including indirect expenses incurred) for the six months ended February 28, 2009, multiplied by the average account value over the period, multiplied by 181 days in the period, divided by 365 days in the year.
18
GMO International Equity Allocation Fund
(A Series of GMO Trust)
Tax Information for the Tax Year Ended February 28, 2009 (Unaudited)
The Fund will notify shareholders of amounts for use in preparing 2009 income tax forms in January 2010.
The Fund's distributions to shareholders include $163,751,598 from long-term capital gains.
For taxable, non-corporate shareholders, 66.32% of the income and short-term capital gains, if any, distributed in the Fund's fiscal year ended February 28, 2009 represents qualified dividend income subject to the 15% rate category.
19
Trustees and Officers (Unaudited)
The following tables list the Trust's Trustees and Officers as of the date of this report; their address and date of birth ("DOB"); their position with the Trust; the length of time holding that position with the Trust; their principal occupation(s) during the past five years; the number of portfolios in the fund complex they oversee; and other directorships they hold in companies subject to registration or reporting requirements of the Securities Exchange Act of 1934 (generally called "public companies") or in registered investment companies. The Trust's Statement of Additional Information ("SAI") includes additional information about the Trust's trustees, including changes subsequent to the date of the report. The SAI is available, without charge, upon request by writing GMO, c/o GMO Trust, 40 Rowes Wharf, Boston, MA 02110.
Independent Trustees:
| Name, Address, and DOB | Position(s) Held with Trust | Term of Office1 and Length of Time Served | Principal Occupation(s) During Past Five Years | Number of Portfolios in Fund Complex Overseen by Trustee | Other Directorships Held by Trustee | ||||||||||||||||||
| Donald W. Glazer, Esq. c/o GMO Trust 40 Rowes Wharf Boston, MA 02110 DOB: 07/26/1944 | Chairman of the Board of Trustees | Chairman of the Board of Trustees since March 2005; Lead Independent Trustee (September 2004 – March 2005); Trustee since December 2000. | Consultant – Law and Business2; Author of Legal Treatises. | 59 | None. | ||||||||||||||||||
1 Each Trustee is elected to serve during the continued lifetime of the Trust until he/she dies, resigns or is removed, or if sooner, until the next meeting of Shareholders called for the purpose of electing Trustees and until the election and qualification of his/her successor.
2 As part of Mr. Glazer's work as a consultant, he provides part-time consulting services to Goodwin Procter LLP ("Goodwin"). Goodwin has provided legal services to Renewable Resources, LLC, an affiliate of GMO; GMO, in connection with its relationship with Renewable Resources; and funds managed by Renewable Resources. Mr. Glazer has represented that he has no financial interest in, and is not involved in the provision of, such legal services. In the calendar years ended December 31, 2007 and December 31, 2008, these entities paid $789,416 and $183,864 respectively, in legal fees and disbursements to Goodwin. In correspondence with the Staff of the Securities and Exchange Commission beginning in August 2006, the Independent Trustees' legal counsel provided the Staff with information regarding Mr. Glazer's relationship with Goodwin and h is other business activities. On September 11, 2007, based on information that had been given to the Staff as of that date, the Staff provided oral no-action assurance consistent with the opinion of the Independent Trustees' legal counsel that Mr. Glazer is not an "interested person" of the Trust.
20
Independent Trustees — (Continued)
| Name, Address, and DOB | Position(s) Held with Trust | Term of Office1 and Length of Time Served | Principal Occupation(s) During Past Five Years | Number of Portfolios in Fund Complex Overseen by Trustee | Other Directorships Held by Trustee | ||||||||||||||||||
| W. Nicholas Thorndike c/o GMO Trust 40 Rowes Wharf Boston, MA 02110 DOB: 03/28/1933 | Trustee | Since March 2005. | Director or trustee of various corporations and charitable organizations, including Courier Corporation (a book publisher and manufacturer) (July 1989 – present); Putnam Funds (December 1992 – June 2004); and Providence Journal (a newspaper publisher) (December 1986 – December 2003). | 59 | Director of Courier Corporation (a book publisher and manufacturer); Member of the Investment Committee of Partners HealthCare System, Inc.3 | ||||||||||||||||||
| Peter Tufano c/o GMO Trust 40 Rowes Wharf Boston, MA 02110 DOB: 04/22/1957 | Trustee | Since December 2008. | Sylvan C. Coleman Professor of Financial Management, Harvard Business School (since 1989). | 59 | Trustee of State Street Navigator Securities Lending Trust (3 Portfolios). | ||||||||||||||||||
1 Each Trustee is elected to serve during the continued lifetime of the Trust until he/she dies, resigns or is removed, or if sooner, until the next meeting of Shareholders called for the purpose of electing Trustees and until the election and qualification of his/her successor.
3 Partners HealthCare System, Inc. is a client of the Manager.
21
Principal Officers:
| Name, Address, and DOB | Position(s) Held with Trust | Term of Office4 and Length of Time Served | Principal Occupation(s) During Past Five Years5 | ||||||||||||
| J.B. Kittredge DOB: 08/22/1954 | President and Chief Executive Officer | Since March 2009. | General Counsel, Grantham, Mayo, Van Otterloo & Co. LLC (October 2005 – Present); Partner, Ropes & Gray LLP. | ||||||||||||
| Sheppard N. Burnett c/o GMO Trust 40 Rowes Wharf Boston, MA 02110 DOB: 10/24/1968 | Treasurer and Chief Financial Officer | Chief Financial Officer since March 2007; Treasurer since November 2006; Assistant Treasurer, September 2004 – November 2006. | Fund Administration Staff, Grantham, Mayo, Van Otterloo & Co. LLC (June 2004 – present); Vice President, Director of Tax, Columbia Management Group (2002 – 2004). | ||||||||||||
| Brent C. Arvidson c/o GMO Trust 40 Rowes Wharf Boston, MA 02110 DOB: 06/26/1969 | Assistant Treasurer | Since August 1998. | Senior Fund Administrator, Grantham, Mayo, Van Otterloo & Co. LLC. | ||||||||||||
| John L. Nasrah c/o GMO Trust 40 Rowes Wharf Boston, MA 02110 DOB: 05/27/1977 | Assistant Treasurer | Since March 2007. | Fund Administrator, Grantham, Mayo, Van Otterloo & Co. LLC (September 2004 – present); Tax Analyst, Bain & Company, Inc. (June 2003 – September 2004). | ||||||||||||
| Mahmoodur Rahman c/o GMO Trust 40 Rowes Wharf Boston, MA 02110 DOB: 11/30/1967 | Assistant Treasurer | Since September 2007. | Fund Administrator, Grantham, Mayo, Van Otterloo & Co. LLC (April 2007 – present); Vice President and Senior Tax Manager, Massachusetts Financial Services Company (January 2000 – April 2007). | ||||||||||||
| Michael E. Gillespie c/o GMO Trust 40 Rowes Wharf Boston, MA 02110 DOB: 02/18/1958 | Chief Compliance Officer | Since March 2005. | Vice President of Compliance (June 2004 – February 2005) and Director of Domestic Compliance (March 2002 – June 2004), Fidelity Investments. | ||||||||||||
4 Each officer is elected to hold such office until his or her successor is duly elected and qualified to carry out the duties and responsibilities of the office, or until he or she resigns or is removed from office.
5 Each of Messrs. Burnett, Arvidson, Bohan, and Pottle serves as an officer and/or director of certain pooled investment vehicles of which GMO or an affiliate of GMO serves as the investment adviser.
22
Principal Officers — (Continued)
| Name, Address, and DOB | Position(s) Held with Trust | Term of Office4 and Length of Time Served | Principal Occupation(s) During Past Five Years5 | ||||||||||||
| Jason B. Harrison c/o GMO Trust 40 Rowes Wharf Boston, MA 02110 DOB: 01/29/1977 | Vice President and Clerk | Vice President since November 2006; Clerk since March 2006. | Legal Counsel, Grantham, Mayo, Van Otterloo & Co. LLC (since February 2006) and Attorney, Ropes & Gray LLP (September 2002 – February 2006). | ||||||||||||
| David L. Bohan c/o GMO Trust 40 Rowes Wharf Boston, MA 02110 DOB: 06/21/1964 | Vice President and Assistant Clerk | Vice President since March 2005; Assistant Clerk since March 2006. | Legal Counsel, Grantham, Mayo, Van Otterloo & Co. LLC. | ||||||||||||
| Gregory L. Pottle c/o GMO Trust 40 Rowes Wharf Boston, MA 02110 DOB: 07/09/1971 | Vice President and Assistant Clerk | Since November 2006. | Legal Counsel, Grantham, Mayo, Van Otterloo & Co. LLC. | ||||||||||||
| Anne K. Trinque c/o GMO Trust 40 Rowes Wharf Boston, MA 02110 DOB: 04/15/1978 | Vice President and Assistant Clerk | Since September 2007. | Legal Counsel, Grantham, Mayo, Van Otterloo & Co. LLC (January 2007 – present); Attorney, Goodwin Procter LLP (September 2003 – January 2007). | ||||||||||||
| Cheryl Wakeham c/o GMO Trust 40 Rowes Wharf Boston, MA 02110 DOB: 10/29/1958 | Vice President and Anti-Money Laundering Officer | Since December 2004. | Manager, Client Service Administration, Grantham, Mayo, Van Otterloo & Co. LLC. | ||||||||||||
4 Each officer is elected to hold such office until his or her successor is duly elected and qualified to carry out the duties and responsibilities of the office, or until he or she resigns or is removed from office.
5 Each of Messrs. Burnett, Arvidson, Bohan, and Pottle serves as an officer and/or director of certain pooled investment vehicles of which GMO or an affiliate of GMO serves as the investment adviser.
23
GMO Real Estate Fund
(A Series of GMO Trust)
Annual Report
February 28, 2009
For a free copy of the Fund's proxy voting guidelines, shareholders may call 1-617-346-7646 (collect) or visit the Securities and Exchange Commission's website at www.sec.gov. Information regarding how the Fund voted proxies relating to portfolio securities during the most recent 12-month period ended June 30 is available on GMO's website at www.gmo.com, or on the Securities and Exchange Commission's website at www.sec.gov.
The Fund files its complete schedule of portfolio holdings with the Securities and Exchange Commission for the first and third quarter of each fiscal year on Form N-Q, which is available on the Commission's website at www.sec.gov. The Fund's Form N-Q may be reviewed and copied at the Commission's Public Reference Room in Washington, D.C. Information on the operation of the Public Reference Room may be obtained by calling 1-800-SEC-0330. The Fund has a policy with respect to disclosure of portfolio holdings under which it may also make available on GMO's website at www.gmo.com a complete schedule of portfolio holdings.
This report is prepared for the general information of shareholders. It is authorized for distribution to prospective investors only when preceded or accompanied by a prospectus for the GMO Trust, which contains a complete discussion of the risks associated with an investment in this Fund and other important information. The GMO Trust prospectus can be obtained at www.gmo.com.
GMO Real Estate Fund
(A Series of GMO Trust)
Portfolio Management
Day-to-day management of the Fund's portfolio is the responsibility of the Quantitative Equity team at Grantham, Mayo, Van Otterloo & Co. LLC.
Management Discussion and Analysis of Fund Performance
The GMO Real Estate Fund returned -54.5% for the fiscal year ended February 28, 2009, as compared to -58.0% for the MSCI U.S. REIT Index. Consistent with the Fund's investment objectives and policies, the Fund was invested substantially in U.S. equity securities throughout the period.
Stock selection added to returns relative to the MSCI U.S. REIT Index. Stock selections within the Specialized, Office, and Retail GICS Sub-Industries added to relative returns while stock selections within the Industrial GICS Sub-Industry detracted. In terms of individual names, underweight positions in General Growth Properties and SL Green Realty Corp. and an overweight in Public Storage added to relative returns. Overweight positions in ProLogis and Kimco Realty and an underweight in Equity Residential detracted.
Sector selection added to returns relative to the MSCI U.S. REIT Index due to the Fund's small cash position. Underweight positions in the GICS Sub-Industry Retail and Office sectors detracted from returns versus the benchmark.
The views expressed herein are exclusively those of Grantham, Mayo, Van Otterloo & Co. LLC Management as of the date of this report and are subject to change. GMO disclaims any responsibility to update such views. They are not meant as investment advice. References to specific securities are not recommendations of such securities and may not be representative of any GMO portfolio's current or future investments.
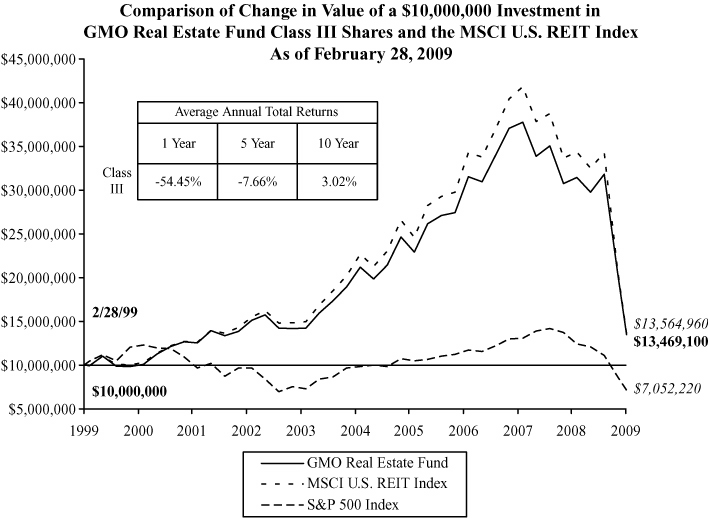
Performance data quoted represents past performance and is not indicative of future results. The investment return and principal value of an investment will fluctuate so that an investor's shares, when redeemed, may be worth more or less than their original cost. Current performance data may be lower or higher than the performance data provided herein. To obtain performance information to the most recent month-end, visit www.gmo.com. Performance shown is net of all fees after reimbursement from the Manager. Returns would have been lower had certain expenses not been reimbursed during the periods shown and do not include the effect of taxes on distributions and redemptions. All information is unaudited.
GMO Real Estate Fund
(A Series of GMO Trust)
Investments Concentration Summary
February 28, 2009 (Unaudited)
| Asset Class Summary | % of Total Net Assets | ||||||
| Real Estate Investments | 97.3 | % | |||||
| Short-Term Investments | 2.8 | ||||||
| Other | (0.1 | ) | |||||
| 100.0 | % | ||||||
| Industry Sector Summary | % of REIT Investments | ||||||
| Health Care | 16.1 | % | |||||
| Apartments | 15.8 | ||||||
| Shopping Centers | 11.3 | ||||||
| Storage | 11.1 | ||||||
| Office Suburban | 10.2 | ||||||
| Diversified | 7.6 | ||||||
| Regional Malls | 7.2 | ||||||
| Office Central Business District | 6.8 | ||||||
| Industrial | 5.0 | ||||||
| Triple Net | 4.1 | ||||||
| Hotels | 3.5 | ||||||
| Manufactured Housing | 0.8 | ||||||
| Outlets | 0.5 | ||||||
| 100.0 | % | ||||||
1
GMO Real Estate Fund
(A Series of GMO Trust)
Schedule of Investments
(showing percentage of total net assets)
February 28, 2009
| Shares | Description | Value ($) | |||||||||||||
| REAL ESTATE INVESTMENTS — 97.3% | |||||||||||||||
| REAL ESTATE INVESTMENT TRUSTS — 97.3% | |||||||||||||||
| Apartments — 15.4% | |||||||||||||||
| 3,900 | American Campus Communities, Inc. | 66,768 | |||||||||||||
| 3,286 | Apartment Investment & Management Co.-Class A | 17,153 | |||||||||||||
| 5,573 | AvalonBay Communities, Inc. | 236,406 | |||||||||||||
| 4,000 | BRE Properties, Inc. | 75,680 | |||||||||||||
| 2,000 | Camden Property Trust | 37,580 | |||||||||||||
| 25,200 | Equity Residential | 443,520 | |||||||||||||
| 2,510 | Essex Property Trust, Inc. | 136,544 | |||||||||||||
| 3,200 | Home Properties, Inc. | 84,928 | |||||||||||||
| 1,300 | Investors Real Estate Trust | 11,882 | |||||||||||||
| 2,200 | Mid-America Apartment Communities, Inc. | 56,870 | |||||||||||||
| 3,700 | Post Properties, Inc. | 35,668 | |||||||||||||
| 9,081 | UDR, Inc. | 71,831 | |||||||||||||
| Total Apartments | 1,274,830 | ||||||||||||||
| Diversified — 7.4% | |||||||||||||||
| 340 | Alexander's, Inc. | 47,736 | |||||||||||||
| 6,400 | Franklin Street Properties Corp. | 67,840 | |||||||||||||
| 12,500 | Vornado Realty Trust | 409,125 | |||||||||||||
| 4,200 | Washington Real Estate Investment Trust | 72,030 | |||||||||||||
| 1,900 | Winthrop Realty Trust | 14,079 | |||||||||||||
| Total Diversified | 610,810 | ||||||||||||||
| Health Care — 15.7% | |||||||||||||||
| 23,000 | HCP, Inc. | 420,210 | |||||||||||||
| 8,800 | Health Care, Inc. | 270,776 | |||||||||||||
| 3,500 | Healthcare Realty Trust, Inc. | 50,715 | |||||||||||||
| 1,200 | LTC Properties, Inc. | 20,472 | |||||||||||||
| 5,000 | Medical Properties Trust, Inc. | 17,450 | |||||||||||||
| 2,200 | National Health Investors, Inc. | 52,470 | |||||||||||||
| 5,900 | Nationwide Health Properties, Inc. | 119,534 | |||||||||||||
| 6,900 | Omega Healthcare Investors, Inc. | 90,597 | |||||||||||||
See accompanying notes to the financial statements.
2
GMO Real Estate Fund
(A Series of GMO Trust)
Schedule of Investments — (Continued)
(showing percentage of total net assets)
February 28, 2009
| Shares | Description | Value ($) | |||||||||||||
| Health Care — continued | |||||||||||||||
| 7,800 | Senior Housing Properties Trust | 98,436 | |||||||||||||
| 7,500 | Ventas, Inc. | 161,775 | |||||||||||||
| Total Health Care | 1,302,435 | ||||||||||||||
| Hotels — 3.4% | |||||||||||||||
| 2,700 | DiamondRock Hospitality Co. | 8,343 | |||||||||||||
| 8,500 | Hospitality Properties Trust | 96,900 | |||||||||||||
| 47,300 | Host Hotels & Resorts, Inc. | 175,010 | |||||||||||||
| 2,600 | Sunstone Hotel Investors, Inc. | 5,694 | |||||||||||||
| Total Hotels | 285,947 | ||||||||||||||
| Industrial — 4.8% | |||||||||||||||
| 7,000 | AMB Property Corp. | 83,370 | |||||||||||||
| 2,500 | DCT Industrial Trust, Inc. | 7,300 | |||||||||||||
| 3,500 | Digital Realty Trust, Inc. | 104,615 | |||||||||||||
| 2,500 | EastGroup Properties, Inc. | 61,475 | |||||||||||||
| 25,138 | ProLogis | 145,549 | |||||||||||||
| Total Industrial | 402,309 | ||||||||||||||
| Manufactured Housing — 0.8% | |||||||||||||||
| 2,000 | Equity Lifestyle Properties, Inc. | 66,660 | |||||||||||||
| Office Central Business District — 6.6% | |||||||||||||||
| 9,600 | BioMed Realty Trust, Inc. | 81,888 | |||||||||||||
| 11,100 | Boston Properties, Inc. | 411,699 | |||||||||||||
| 2,400 | Douglas Emmett, Inc. | 18,048 | |||||||||||||
| 3,123 | SL Green Realty Corp. | 36,289 | |||||||||||||
| Total Office Central Business District | 547,924 | ||||||||||||||
| Office Suburban — 9.9% | |||||||||||||||
| 2,870 | Alexandria Real Estate Equities, Inc. | 114,685 | |||||||||||||
| 1,389 | Brandywine Realty Trust | 6,556 | |||||||||||||
| 3,600 | Corporate Office Properties Trust | 90,000 | |||||||||||||
| 10,900 | Duke Realty Corp. | 75,210 | |||||||||||||
See accompanying notes to the financial statements.
3
GMO Real Estate Fund
(A Series of GMO Trust)
Schedule of Investments — (Continued)
(showing percentage of total net assets)
February 28, 2009
| Shares | Description | Value ($) | |||||||||||||
| Office Suburban — continued | |||||||||||||||
| 3,800 | Highwoods Properties, Inc. | 71,782 | |||||||||||||
| 20,800 | HRPT Properties Trust | 67,184 | |||||||||||||
| 3,000 | Kilroy Realty Corp. | 55,830 | |||||||||||||
| 9,400 | Liberty Property Trust | 171,738 | |||||||||||||
| 7,100 | Mack-Cali Realty Corp. | 121,268 | |||||||||||||
| 1,400 | PS Business Parks, Inc. | 48,160 | |||||||||||||
| Total Office Suburban | 822,413 | ||||||||||||||
| Outlets — 0.5% | |||||||||||||||
| 1,500 | Tanger Factory Outlet Centers, Inc. | 41,400 | |||||||||||||
| Regional Malls — 7.0% | |||||||||||||||
| 8,200 | CBL & Associates Properties, Inc. | 25,420 | |||||||||||||
| 3,400 | General Growth Properties, Inc. | 2,006 | |||||||||||||
| 2,300 | Macerich Co. (The) | 26,266 | |||||||||||||
| 15,300 | Simon Property Group, Inc. | 506,430 | |||||||||||||
| 1,500 | Taubman Centers, Inc. | 23,475 | �� | ||||||||||||
| Total Regional Malls | 583,597 | ||||||||||||||
| Shopping Centers — 11.0% | |||||||||||||||
| 2,284 | Acadia Realty Trust | 22,932 | |||||||||||||
| 4,400 | Cedar Shopping Centers, Inc. | 20,856 | |||||||||||||
| 8,600 | Developers Diversified Realty Corp. | 25,370 | |||||||||||||
| 3,600 | Equity One, Inc. | 40,248 | |||||||||||||
| 3,500 | Federal Realty Investment Trust | 143,955 | |||||||||||||
| 7,600 | Inland Real Estate Corp. | 59,280 | |||||||||||||
| 25,858 | Kimco Realty Corp. | 228,843 | |||||||||||||
| 2,000 | Kite Realty Group Trust | 6,880 | |||||||||||||
| 7,000 | Regency Centers Corp. | 188,860 | |||||||||||||
| 1,400 | Saul Centers, Inc. | 36,078 | |||||||||||||
| 2,300 | Urstadt Biddle Properties, Inc. | 27,853 | |||||||||||||
| 9,600 | Weingarten Realty Investors | 108,384 | |||||||||||||
| Total Shopping Centers | 909,539 | ||||||||||||||
See accompanying notes to the financial statements.
4
GMO Real Estate Fund
(A Series of GMO Trust)
Schedule of Investments — (Continued)
(showing percentage of total net assets)
February 28, 2009
| Shares | Description | Value ($) | |||||||||||||
| Storage — 10.8% | |||||||||||||||
| 5,500 | Extra Space Storage, Inc. | 34,485 | |||||||||||||
| 15,014 | Public Storage | 832,977 | |||||||||||||
| 1,400 | Sovran Self Storage, Inc. | 29,652 | |||||||||||||
| Total Storage | 897,114 | ||||||||||||||
| Triple Net — 4.0% | |||||||||||||||
| 2,400 | Entertainment Properties Trust | 35,784 | |||||||||||||
| 3,000 | Getty Realty Corp. | 49,920 | |||||||||||||
| 4,000 | Lexington Realty Trust | 12,880 | |||||||||||||
| 8,400 | National Retail Properties, Inc. | 120,708 | |||||||||||||
| 6,500 | Realty Income Corp. | 113,945 | |||||||||||||
| Total Triple Net | 333,237 | ||||||||||||||
| TOTAL REAL ESTATE INVESTMENT TRUSTS (COST $20,700,056) | 8,078,215 | ||||||||||||||
| TOTAL REAL ESTATE INVESTMENTS (COST $20,700,056) | 8,078,215 | ||||||||||||||
| SHORT-TERM INVESTMENTS — 2.8% | |||||||||||||||
| Money Market Funds — 2.8% | |||||||||||||||
| 228,948 | State Street Institutional Treasury Money Market Fund-Institutional Class | 228,948 | |||||||||||||
| TOTAL SHORT-TERM INVESTMENTS (COST $228,948) | 228,948 | ||||||||||||||
| TOTAL INVESTMENTS — 100.1% (Cost $20,929,004) | 8,307,163 | ||||||||||||||
| Other Assets and Liabilities (net) — (0.1%) | (7,754 | ) | |||||||||||||
| TOTAL NET ASSETS — 100.0% | $ | 8,299,409 | |||||||||||||
See accompanying notes to the financial statements.
5
GMO Real Estate Fund
(A Series of GMO Trust)
Statement of Assets and Liabilities — February 28, 2009
| Assets: | |||||||
| Investments, at value (cost $20,929,004) (Note 2) | $ | 8,307,163 | |||||
| Dividends and interest receivable | 39,473 | ||||||
| Receivable for expenses reimbursed by Manager (Note 3) | 7,139 | ||||||
| Total assets | 8,353,775 | ||||||
| Liabilities: | |||||||
| Payable to affiliate for (Note 3): | |||||||
| Management fee | 2,435 | ||||||
| Shareholder service fee | 1,107 | ||||||
| Trustees and Chief Compliance Officer of GMO Trust fees | 58 | ||||||
| Accrued expenses | 50,766 | ||||||
| Total liabilities | 54,366 | ||||||
| Net assets | $ | 8,299,409 | |||||
| Net assets consist of: | |||||||
| Paid-in capital | $ | 22,431,309 | |||||
| Accumulated undistributed net investment income | 133,569 | ||||||
| Accumulated net realized loss | (1,643,628 | ) | |||||
| Net unrealized depreciation | (12,621,841 | ) | |||||
| $ | 8,299,409 | ||||||
| Net assets attributable to: | |||||||
| Class III shares | $ | 8,299,409 | |||||
| Shares outstanding: | |||||||
| Class III | 2,483,943 | ||||||
| Net asset value per share: | |||||||
| Class III | $ | 3.34 | |||||
See accompanying notes to the financial statements.
6
GMO Real Estate Fund
(A Series of GMO Trust)
Statement of Operations — Year Ended February 28, 2009
| Investment Income: | |||||||
| Dividends | $ | 841,500 | |||||
| Interest | 4,531 | ||||||
| Total investment income | 846,031 | ||||||
| Expenses: | |||||||
| Management fee (Note 3) | 56,747 | ||||||
| Shareholder service fee – Class III (Note 3) | 25,794 | ||||||
| Custodian, fund accounting agent and transfer agent fees | 7,657 | ||||||
| Audit and tax fees | 56,105 | ||||||
| Legal fees | 339 | ||||||
| Trustees fees and related expenses (Note 3) | 197 | ||||||
| Registration fees | 3,349 | ||||||
| Miscellaneous | 2,590 | ||||||
| Total expenses | 152,778 | ||||||
| Fees and expenses reimbursed by Manager (Note 3) | (69,979 | ) | |||||
| Expense reductions (Note 2) | (6 | ) | |||||
| Net expenses | 82,793 | ||||||
| Net investment income (loss) | 763,238 | ||||||
| Realized and unrealized gain (loss): | |||||||
| Net realized gain (loss) on: | |||||||
| Investments | (1,621,100 | ) | |||||
| Change in net unrealized appreciation (depreciation) on investments | (9,140,643 | ) | |||||
| Net realized and unrealized gain (loss) | (10,761,743 | ) | |||||
| Net increase (decrease) in net assets resulting from operations | $ | (9,998,505 | ) | ||||
See accompanying notes to the financial statements.
7
GMO Real Estate Fund
(A Series of GMO Trust)
Statement of Changes in Net Assets
| Year Ended February 28, 2009 | Year Ended February 29, 2008 | ||||||||||
| Increase (decrease) in net assets: | |||||||||||
| Operations: | |||||||||||
| Net investment income (loss) | $ | 763,238 | $ | 1,085,345 | |||||||
| Net realized gain (loss) | (1,621,100 | ) | 2,263,639 | ||||||||
| Change in net unrealized appreciation (depreciation) | (9,140,643 | ) | (11,549,632 | ) | |||||||
| Net increase (decrease) in net assets from operations | (9,998,505 | ) | (8,200,648 | ) | |||||||
| Distributions to shareholders from: | |||||||||||
| Net investment income | |||||||||||
| Class III | (728,184 | ) | (360,012 | ) | |||||||
| Net realized gains | |||||||||||
| Class III | (312,412 | ) | (5,263,497 | ) | |||||||
| (1,040,596 | ) | (5,623,509 | ) | ||||||||
| Net share transactions (Note 7): | |||||||||||
| Class III | (126,775 | ) | (4,360,814 | ) | |||||||
| Total increase (decrease) in net assets | (11,165,876 | ) | (18,184,971 | ) | |||||||
| Net assets: | |||||||||||
| Beginning of period | 19,465,285 | 37,650,256 | |||||||||
| End of period (including accumulated undistributed net investment income of $133,569 and $319,064, respectively) | $ | 8,299,409 | $ | 19,465,285 | |||||||
See accompanying notes to the financial statements.
8
GMO Real Estate Fund
(A Series of GMO Trust)
Financial Highlights
(For a Class III share outstanding throughout each period)
| Year Ended February 28/29, | |||||||||||||||||||||||
| 2009 | 2008 | 2007 | 2006 | 2005 | |||||||||||||||||||
| Net asset value, beginning of period | $ | 7.85 | $ | 12.87 | $ | 12.27 | $ | 14.54 | $ | 14.65 | |||||||||||||
| Income (loss) from investment operations: | |||||||||||||||||||||||
| Net investment income (loss)† | 0.31 | 0.40 | 0.38 | 0.61 | 0.59 | ||||||||||||||||||
| Net realized and unrealized gain (loss) | (4.40 | ) | (3.29 | ) | 2.72 | 3.24 | 1.55 | ||||||||||||||||
| Total from investment operations | (4.09 | ) | (2.89 | ) | 3.10 | 3.85 | 2.14 | ||||||||||||||||
| Less distributions to shareholders: | |||||||||||||||||||||||
| From net investment income | (0.29 | ) | (0.14 | ) | (0.31 | ) | (0.40 | ) | (0.87 | ) | |||||||||||||
| From net realized gains | (0.13 | ) | (1.99 | ) | (2.19 | ) | (5.72 | ) | (1.38 | ) | |||||||||||||
| Total distributions | (0.42 | ) | (2.13 | ) | (2.50 | ) | (6.12 | ) | (2.25 | ) | |||||||||||||
| Net asset value, end of period | $ | 3.34 | $ | 7.85 | $ | 12.87 | $ | 12.27 | $ | 14.54 | |||||||||||||
| Total Return(a) | (54.45 | )% | (24.04 | )% | 29.76 | % | 28.89 | % | 16.01 | % | |||||||||||||
| Ratios/Supplemental Data: | |||||||||||||||||||||||
| Net assets, end of period (000's) | $ | 8,299 | $ | 19,465 | $ | 37,650 | $ | 41,391 | $ | 235,837 | |||||||||||||
| Net expenses to average daily net assets | 0.48 | %(b) | 0.48 | % | 0.48 | % | 0.48 | % | 0.48 | % | |||||||||||||
| Net investment income to average daily net assets | 4.44 | % | 3.78 | % | 3.24 | % | 3.91 | % | 4.13 | % | |||||||||||||
| Portfolio turnover rate | 29 | % | 49 | % | 43 | % | 52 | % | 134 | % | |||||||||||||
| Fees and expenses reimbursed and/or waived by the Manager to average daily net assets: | 0.41 | % | 0.22 | % | 0.28 | % | 0.25 | % | 0.25 | % | |||||||||||||
(a) The total returns would have been lower had certain expenses not been reimbursed and/or waived during the periods shown and assumes the effect of reinvested distributions.
(b) The net expense ratio does not include the effect of expense reductions.
† Calculated using average shares outstanding throughout the period.
See accompanying notes to the financial statements.
9
GMO Real Estate Fund
(A Series of GMO Trust)
Notes to Financial Statements
February 28, 2009
1. Organization
GMO Real Estate Fund (the "Fund") is a series of GMO Trust (the "Trust"). The Fund is registered under the Investment Company Act of 1940, as amended, as an open-end, non-diversified management investment company. The Fund is advised and managed by Grantham, Mayo, Van Otterloo & Co. LLC (the "Manager" or "GMO"). The Trust was established as a Massachusetts business trust under the laws of The Commonwealth of Massachusetts on June 24, 1985. The Declaration of Trust permits the Trustees of the Trust ("Trustees") to create an unlimited number of series of shares ("Funds") and to subdivide Funds into classes.
The Fund seeks high total return. The Fund seeks to achieve its objective by outperforming the MSCI U.S. REIT Index. The Fund typically makes equity investments in U.S. companies that issue stocks included in the MSCI U.S. REIT Index, and in companies with similar characteristics.
2. Significant accounting policies
The following is a summary of significant accounting policies followed by the Fund in the preparation of its financial statements. These policies are in conformity with accounting principles generally accepted in the United States of America ("U.S. GAAP") and have been consistently followed by the Fund in preparing its financial statements. The preparation of financial statements in accordance with U.S. GAAP requires management to make estimates and assumptions that affect the reported amounts and disclosures in the financial statements. Actual results could differ from those estimates. The accounting records of the Fund are maintained in U.S. dollars.
Portfolio valuation
Securities listed on a securities exchange for which market quotations are readily available are valued at the last sale price or official closing price on each business day, or if there is no such reported sale or official closing price, at the most recent quoted bid price. Unlisted securities for which market quotations are readily available are generally valued at the most recent quoted bid price. Debt instruments with a remaining maturity of sixty days or less are generally valued at amortized cost, which approximates fair value. Shares of investment funds are generally valued at their net asset value. Securities for which quotations are not readily available or whose values the Manager has determined to be unreliable are valued at fair value as determined in good faith by the Trustees or persons acting at their direction pursuant to procedures approved by the Trustees. By its nature, a fair value price is a good faith estim ate of the value of a security at a given point in time and may not reflect the value that would be realized if the security were sold. The difference between a fair value price and the value realized upon a sale could be material.
In September 2006, the Financial Accounting Standards Board ("FASB") issued Statement of Financial Accounting Standards No. 157, Fair Value Measurements ("SFAS 157"). SFAS 157 is effective for the Fund's current fiscal year. While the adoption of SFAS 157 does not have an effect on the Fund's net asset value, it does require additional disclosures about fair value measurements. SFAS 157 establishes a
10
GMO Real Estate Fund
(A Series of GMO Trust)
Notes to Financial Statements — (Continued)
February 28, 2009
three-level hierarchy for disclosure of fair value measurements. The valuation hierarchy is based upon the reliability of inputs to the valuation of the Fund's investments. The three levels are defined as follows:
Level 1 – Valuations based on quoted prices for identical securities in active markets.
Level 2 – Valuations determined using other significant direct or indirect observable inputs.
Level 3 – Valuations based on inputs that are unobservable and significant.
The inputs or methodology used for valuing securities are not necessarily an indication of the risk associated with investing in those securities.
The following is a summary of the fair valuations according to inputs used as of February 28, 2009 in valuing the Fund's investments:
| Asset Valuation Inputs | Investments in Securities | Other Financial Instruments | |||||||||
| Level 1 - Quoted Prices | $ | 8,078,215 | $ | — | |||||||
| Level 2 - Other Significant Observable Inputs | 228,948 | — | |||||||||
| Level 3 - Significant Unobservable Inputs | — | — | |||||||||
| Total | $ | 8,307,163 | $ | — | |||||||
| Liability Valuation Inputs | Investments in Securities | Other Financial Instruments | |||||||||
| Level 1 - Quoted Prices | $ | — | $ | — | |||||||
| Level 2 - Other Significant Observable Inputs | — | — | |||||||||
| Level 3 - Significant Unobservable Inputs | — | — | |||||||||
| Total | $ | — | $ | — | |||||||
The Fund held no investments or other financial instruments at either February 29, 2008 or February 28, 2009, whose fair value was determined using Level 3 inputs.
Futures contracts
The Fund may purchase and sell futures contracts. Upon entering into a futures contract, the Fund is required to deposit cash, U.S. government and agency obligations, or other liquid assets with the futures clearing broker in accordance with the initial margin requirements of the broker or exchange. In addition, the Fund maintains cash or securities in an amount that at least equals the net amount payable in the event the Fund must deliver the full amount of the contract. Futures contracts are marked to market daily and an appropriate payable or receivable for the change in value ("variation margin") is recorded by the Fund. The payable or receivable is settled on the following business day. Gains or losses are recognized but not
11
GMO Real Estate Fund
(A Series of GMO Trust)
Notes to Financial Statements — (Continued)
February 28, 2009
considered realized until the contracts expire or are closed. Futures contracts involve, to varying degrees, risk of loss in excess of the variation margin disclosed in the Statement of Assets and Liabilities. Under some circumstances, futures exchanges may establish daily limits on the amount that the price of a futures contract can vary from the previous day's settlement price, thereby effectively preventing liquidation of unfavorable positions. Losses may arise from changes in the value of the underlying instrument if the Fund is unable to liquidate a futures position due to an illiquid secondary market for the contract or the imposition of price limits, or if counterparties do not perform under the contract terms. Futures contracts are generally valued at the settlement price established each day by the board of trade or exchange on which they are traded. The Fund had no futures contracts outstanding at the end of the period .
Repurchase agreements
The Fund may enter into repurchase agreements. Under a repurchase agreement the Fund acquires a security for cash and obtains a simultaneous commitment from the seller to repurchase the security at an agreed upon price and date. The Fund, through its custodian, takes possession of securities collateralizing the repurchase agreement. The collateral is marked to market daily to ensure that the market value of the underlying assets is at least equal to the amount owed to the Fund in the event of default by the seller. If the seller of a repurchase agreement defaults or enters into insolvency proceedings and the value of the collateral declines, the Fund's recovery of cash may be delayed or limited. The Fund had no repurchase agreements outstanding at the end of the period.
Securities lending
The Fund may lend its securities to qualified brokers. The loans are collateralized with cash or liquid securities with a market value at least equal to the market value of the securities upon entering into the loan. As with other extensions of credit, the Fund may bear the risk of loss with respect to the investment of the collateral, the risk of delay in and/or inability to exercise its rights with respect to the collateral, and the risk of delay in recovery or loss of rights in the loaned securities should the borrower of the securities fail financially. If a loan is collateralized by U.S. government securities, the Fund receives a fee from the borrower. If a loan is collateralized by cash, the Fund typically invests the cash collateral for its own account. For the year from March 1, 2008 through February 28, 2009, the Fund did not participate in securities lending.
Taxes and distributions
The Fund intends to qualify each tax year as a regulated investment company under Subchapter M of the Internal Revenue Code of 1986, as amended (the "Code"). The Fund intends to distribute substantially all of its net investment income and all of its net realized short-term and long-term capital gain, if any, after giving effect to any available capital loss carryforwards for U.S. federal income tax purposes. Therefore, no provision for U.S. federal income or excise tax is necessary.
The Fund's policy is to declare and pay distributions from net investment income, if any, semiannually, and from net realized short-term and long-term capital gain, if any, at least annually. All distributions are paid in shares of the Fund, at net asset value, unless the shareholder elects to receive cash distributions. Distributions to shareholders are recorded by the Fund on the ex-dividend date.
12
GMO Real Estate Fund
(A Series of GMO Trust)
Notes to Financial Statements — (Continued)
February 28, 2009
Income and capital gain distributions are determined in accordance with U.S. federal income tax regulations, which may differ from U.S. GAAP. Certain capital accounts in the financial statements are periodically adjusted for permanent differences in order to reflect their tax character. These adjustments have no impact on net assets or net asset value per share. Temporary differences that arise from recognizing certain items of income, expense, gain or loss in different periods for financial statement and tax purposes will reverse at some time in the future. Distributions in excess of net investment income or net realized gains are temporary over-distributions for financial statement purposes resulting from differences in the recognition or classification of income or distributions for financial statement and tax purposes.
U.S. GAAP and tax accounting differences primarily relate to adjustments related to real estate investment trust holdings, capital loss carryforwards, losses on wash sale transactions and post-October capital losses.
The following reclassification represents the amount necessary to report the stated components of net assets on a tax basis, excluding certain temporary differences, as of February 28, 2009. The financial highlights exclude these adjustments.
| Accumulated Undistributed Net Investment Income | Accumulated Net Realized Loss | Paid-in Capital | |||||||||
| $ | (220,549 | ) | $ | 220,549 | $ | — | |||||
The tax character of distributions declared to shareholders is as follows:
| 2/28/2009 | 2/29/2008 | ||||||||||
| Ordinary income (including any net short-term capital gain) | $ | 748,940 | $ | 725,652 | |||||||
| Net long-term capital gain | 291,656 | 4,897,857 | |||||||||
| Total distributions | $ | 1,040,596 | $ | 5,623,509 | |||||||
Distributions in excess of tax basis earnings and profits, if significant, are reported in the financial statements as a return of capital for tax purposes.
As of February 28, 2009, the components of distributable earnings on a tax basis consisted of the following:
| Undistributed ordinary income (including any net short-term capital gain) | $ | 133,569 | |||||
As of February 28, 2009, the Fund elected to defer to March 1, 2009 post-October capital losses of $730,582.
13
GMO Real Estate Fund
(A Series of GMO Trust)
Notes to Financial Statements — (Continued)
February 28, 2009
As of February 28, 2009, the Fund had capital loss carryforwards available to offset future realized gains if any, to the extent permitted by the Code. Utilization of the capital loss carryforwards could be subject to limitations imposed by the Code related to share ownership activity. Such losses expire as follows:
| 2/28/2017 | $ | (517,045 | ) | ||||
| Total | $ | (517,045 | ) | ||||
As of February 28, 2009, the approximate cost for U.S. federal income tax purposes and gross and net unrealized appreciation (depreciation) in value of investments were as follows:
| Aggregate Cost | Gross Unrealized Appreciation | Gross Unrealized (Depreciation) | Net Unrealized Appreciation (Depreciation) | ||||||||||||
| $ | 21,325,004 | $ | — | $ | (13,017,841 | ) | $ | (13,017,841 | ) | ||||||
The Fund is subject to the provisions of Financial Accounting Standards Board Interpretation No. 48 ("FIN 48"), Accounting for Uncertainty in Income Taxes — an Interpretation of FASB Statement No. 109. FIN 48 sets forth a minimum threshold for financial statement recognition of a tax position taken or expected to be taken in a tax return that could affect the Fund's financial statements. The Fund did not have any unrecognized tax benefits or liabilities at February 28, 2009, nor did it have any increases or decreases in unrecognized tax benefits or liabilities for the period then ended. The Fund is subject to examination prior to the expiration of the statute of limitations by U.S. federal and state tax authorities for tax returns filed.
Security transactions and related investment income
Security transactions in the financial statements are accounted for on the trade date. Dividend income, net of applicable foreign withholding taxes, if any, is recorded on the ex-dividend date or, if later, when the Fund is informed of the ex-dividend date. Interest income is recorded on the accrual basis and is adjusted for the amortization of premiums and accretion of discounts. Principal on inflation indexed securities is adjusted for inflation and any increase or decrease is recorded as interest income or loss. Income is not recognized on securities for which collection is not expected. Non-cash dividends, if any, are recorded at the fair market value of the asset received. Distributions paid by real estate investment trusts ("REITs") in excess of their income are recorded as reductions of the cost of the related investments which increases/decreases the realized gains/losses as applicable. If the Fund no longer owns the app licable securities, any distributions received in excess of income are recorded as realized gains. Dividends representing a return of capital are reflected as a reduction of cost, when the amount of the return of capital is conclusively determined. In determining the net gain or loss on securities sold, the Fund uses the identified cost basis for the purposes of determining the cost basis.
14
GMO Real Estate Fund
(A Series of GMO Trust)
Notes to Financial Statements — (Continued)
February 28, 2009
Expenses
The majority of the expenses of the Trust are directly identifiable to an individual fund. Expenses that are not readily identifiable to a specific fund are allocated taking into consideration, among other things, the nature and type of expense and the relative size of the funds.
State Street Bank and Trust Company ("State Street") serves as custodian, fund accounting agent and transfer agent of the Fund. State Street's fees may be reduced by an earnings allowance calculated on the average daily cash balances the Fund maintains with State Street. The Fund receives the benefit of the earnings allowance. In addition, Goldman Sachs Agency Lending, the Fund's securities lending agent, has agreed to reimburse the Fund for certain transactional expenses related to securities lending activity. Credit balances or expense reimbursements used to reduce fees, if any, are reported as a reduction of expenses in the Statement of Operations.
Investment risks
There are certain additional risks involved in investing in REITs rather than a more diversified portfolio of investments. Since the Fund's investments are concentrated in real-estate related securities, the value of its shares can be expected to change in light of factors affecting the real estate industry, including local or regional economic conditions, changes in zoning laws, changes in real estate value and property taxes, and changes in interest rates. The value of the Fund's shares may fluctuate more widely than the value of shares of a portfolio that invests in a broader range of industries.
Recently issued accounting pronouncement
In March 2008, FASB issued Statement of Financial Accounting Standards No. 161, Disclosures about Derivative Instruments and Hedging Activities ("SFAS 161"). SFAS 161 is effective for fiscal years and interim periods beginning after November 15, 2008. SFAS 161 requires enhanced disclosures about the Fund's derivative and hedging activities. The Manager is currently evaluating the impact the adoption of SFAS 161 will have on the Fund's financial statement disclosures.
3. Fees and other transactions with affiliates
GMO receives a management fee for the services it provides to the Fund. That fee is paid monthly at the annual rate of 0.33% of average daily net assets. The Fund has adopted a Shareholder Service Plan under which the Fund pays GMO a shareholder service fee for client and shareholder service, reporting, and other support. Pursuant to the Shareholder Service Plan, the shareholder service fee is calculated based on average daily net assets at the annual rate of 0.15% for Class III shares.
Through at least June 30, 2009, the Manager has contractually agreed to reimburse the Fund for Fund expenses incurred through that date to the extent the Fund's total annual operating expenses (excluding "Excluded Expenses", as defined below) exceed 0.33% of the Fund's average daily net assets. Excluded Expenses include shareholder service fees, fees and expenses of the independent Trustees of the Trust,
15
GMO Real Estate Fund
(A Series of GMO Trust)
Notes to Financial Statements — (Continued)
February 28, 2009
fees and expenses for legal services not approved by the Manager for the Trust, compensation and expenses of the Trust's Chief Compliance Officer ("CCO") (excluding any employee benefits), brokerage commissions, securities lending fees and expenses, interest expense, transfer taxes, and other investment-related costs (including expenses associated with investments in any company that is an investment company or would be an investment company under the 1940 Act, but for the exceptions to the definition of investment company provided in Section 3(c)(1) and 3(c)(7) of the 1940 Act), hedging transaction fees, extraordinary, non-recurring and certain other unusual expenses (including taxes).
The Fund's portion of the fees paid by the Trust to the Trust's independent Trustees and CCO during the year ended February 28, 2009 was $197 and $28, respectively. The compensation and expenses of the CCO are included in miscellaneous expenses in the Statement of Operations. The Fund paid no remuneration to any other officer of the Trust.
4. Purchases and sales of securities
Cost of purchases and proceeds from sales of securities, excluding short-term investments, for the year ended February 28, 2009 aggregated $5,108,091 and $4,766,837, respectively.
5. Guarantees
In the normal course of business the Fund enters into contracts with third-party service providers that contain a variety of representations and warranties and that provide general indemnifications. The Fund's maximum exposure under these arrangements is unknown, as it involves future claims that may be made against the Fund that have not yet occurred. Based on experience, management is of the view that the risk of loss in connection with its indemnification obligations is remote; however, there can be no assurance that such obligations will not result in material liabilities that adversely affect the Fund.
6. Principal shareholders and related parties
As of February 28, 2009, 85.20% of the outstanding shares of the Fund were held by two shareholders, each holding more than 10% of the Fund's outstanding shares. On that date, no other shareholder owned more than 10% of the outstanding shares of the Fund. Redemptions from (or investments into) the Fund by or on behalf of these large shareholders may have a material effect on the Fund.
As of February 28, 2009, 0.49% of the Fund's shares were held by senior management of the Manager and GMO Trust officers and 74.44% of the Fund's shares were held by accounts for which the Manager had investment discretion.
16
GMO Real Estate Fund
(A Series of GMO Trust)
Notes to Financial Statements — (Continued)
February 28, 2009
7. Share transactions
The Declaration of Trust permits the Trust to issue an unlimited number of shares of beneficial interest (without par value). Transactions in Fund shares were as follows:
| Year Ended February 28, 2009 | Year Ended February 29, 2008 | ||||||||||||||||||
| Class III: | Shares | Amount | Shares | Amount | |||||||||||||||
| Shares sold | 37,799 | $ | 261,394 | 12,826 | $ | 100,698 | |||||||||||||
| Shares issued to shareholders in reinvestment of distributions | 62,656 | 420,430 | 514,775 | 4,830,216 | |||||||||||||||
| Shares repurchased | (96,908 | ) | (808,599 | ) | (973,250 | ) | (9,291,728 | ) | |||||||||||
| Net increase (decrease) | 3,547 | $ | (126,775 | ) | (445,649 | ) | $ | (4,360,814 | ) | ||||||||||
17
Report of Independent Registered Public Accounting Firm
To the Trustees of GMO Trust and the Shareholders of
GMO Real Estate Fund:
In our opinion, the accompanying statement of assets and liabilities, including the schedule of investments, and the related statements of operations and of changes in net assets and the financial highlights present fairly, in all material respects, the financial position of GMO Real Estate Fund (the "Fund") at February 28, 2009, the results of its operations for the year then ended, the changes in its net assets for each of the two years in the period then ended and the financial highlights for each of the five years in the period then ended, in conformity with accounting principles generally accepted in the United States of America. These financial statements and financial highlights (hereafter referred to as "financial statements") are the responsibility of the Fund's management. Our responsibility is to express an opinion on these financial statements based on our audits. We conducted our audits of these financial statements in accordance with the standards of the Public Company Accounting Oversight Board (United States). Those standards require that we plan and perform the audit to obtain reasonable assurance about whether the financial statements are free of material misstatement. An audit includes examining, on a test basis, evidence supporting the amounts and disclosures in the financial statements, assessing the accounting principles used and significant estimates made by management, and evaluating the overall financial statement presentation. We believe that our audits, which included confirmation of securities at February 28, 2009 by correspondence with the custodian, provide a reasonable basis for our opinion.
PricewaterhouseCoopers LLP
Boston, Massachusetts
April 29, 2009
18
GMO Real Estate Fund
(A Series of GMO Trust)
Fund Expenses
February 28, 2009 (Unaudited)
Expense Examples: The following information is in relation to expenses for the six month period ended February 28, 2009.
As a shareholder of the Fund, you may incur two types of costs: (1) transaction costs, and (2) ongoing costs, including management fees, shareholder service fees, and other Fund expenses. This example is intended to help you understand your ongoing costs (in dollars) of investing in the Fund and to compare these costs with the ongoing costs of investing in other mutual funds.
These examples are based on an investment of $1,000 invested at the beginning of the period and held for the entire period, September 1, 2008 through February 28, 2009.
Actual Expenses
The first line of the table below provides information about actual account values and actual expenses. You may use the information in this line, together with the amount you invested, to estimate the expenses that you paid over the period. Simply divide your account value by $1,000 (for example, a $10,000,000 account value divided by $1,000 = 10,000), then multiply the result by the number in the first line under the heading entitled "Net Expense Incurred" to estimate the expenses you paid on your account during this period.
Hypothetical Example for Comparison Purposes
The second line of the table below provides information about hypothetical account values and hypothetical expenses based on the Fund's actual expense ratio and an assumed rate of return of 5% per year before expenses, which is not the Fund's actual return. The hypothetical account values and expenses may not be used to estimate the actual ending account balance or expenses you paid for the period. You may use this information to compare the ongoing costs of investing in the Fund with other funds. To do so, compare this 5% hypothetical example with the 5% hypothetical examples that appear in the shareholder reports of other funds.
Please note that the expenses shown in the table are meant to highlight your ongoing costs only and do not reflect any transactional costs, such as purchase premiums and redemption fees. Therefore, the second line of the table is useful in comparing ongoing costs only, and will not help you determine the relative total costs of owning different funds. In addition, if these transactional costs were included, your costs would have been higher.
| Annualized Net Expense Ratio | Beginning Account Value | Ending Account Value | Net Expense Incurred* | ||||||||||||||||
| Class III | |||||||||||||||||||
| 1) Actual | 0.48 | % | $ | 1,000.00 | $ | 427.10 | $ | 1.70 | |||||||||||
| 2) Hypothetical | 0.48 | % | $ | 1,000.00 | $ | 1,022.41 | $ | 2.41 | |||||||||||
* Expenses are calculated using the Class's annualized expense ratio for the six months ended February 28, 2009, multiplied by the average account value over the period, multiplied by 181 days in the period, divided by 365 days in the year.
19
GMO Real Estate Fund
(A Series of GMO Trust)
Tax Information for the Tax Year Ended February 28, 2009 (Unaudited)
The Fund will notify shareholders of amounts for use in preparing 2009 income tax forms in early 2010.
The Fund's distributions to shareholders include $291,656 from long-term capital gains.
The Fund hereby designates as qualified short-term capital gains with respect to its taxable year ended February 28, 2009, $25,795 or if determined to be different, the qualified short-term capital gains of such year.
20
GMO Real Estate Fund
(A Series of GMO Trust)
Note Concerning Distributions (Unaudited)
The Fund previously reported estimated sources of any dividends, short-term capital gains, and long-term capital gains distributions paid on a per share basis. Pursuant to Rule 19a-1(e) of the Investment Company Act, the following serves as a correction of such estimates. 2.62% of distributions to shareholders declared from net realized gains during the Fund's fiscal year were reclassified to distributions from net investment income and are reflected as such in the Statement of Changes in Net Assets.
21
Trustees and Officers (Unaudited)
The following tables list the Trust's Trustees and Officers as of the date of this report; their address and date of birth ("DOB"); their position with the Trust; the length of time holding that position with the Trust; their principal occupation(s) during the past five years; the number of portfolios in the fund complex they oversee; and other directorships they hold in companies subject to registration or reporting requirements of the Securities Exchange Act of 1934 (generally called "public companies") or in registered investment companies. The Trust's Statement of Additional Information ("SAI") includes additional information about the Trust's trustees, including changes subsequent to the date of the report. The SAI is available, without charge, upon request by writing GMO, c/o GMO Trust, 40 Rowes Wharf, Boston, MA 02110.
Independent Trustees:
| Name, Address, and DOB | Position(s) Held with Trust | Term of Office1 and Length of Time Served | Principal Occupation(s) During Past Five Years | Number of Portfolios in Fund Complex Overseen by Trustee | Other Directorships Held by Trustee | ||||||||||||||||||
| Donald W. Glazer, Esq. c/o GMO Trust 40 Rowes Wharf Boston, MA 02110 DOB: 07/26/1944 | Chairman of the Board of Trustees | Chairman of the Board of Trustees since March 2005; Lead Independent Trustee (September 2004 – March 2005); Trustee since December 2000. | Consultant – Law and Business2; Author of Legal Treatises. | 59 | None. | ||||||||||||||||||
1 Each Trustee is elected to serve during the continued lifetime of the Trust until he/she dies, resigns or is removed, or if sooner, until the next meeting of Shareholders called for the purpose of electing Trustees and until the election and qualification of his/her successor.
2 As part of Mr. Glazer's work as a consultant, he provides part-time consulting services to Goodwin Procter LLP ("Goodwin"). Goodwin has provided legal services to Renewable Resources, LLC, an affiliate of GMO; GMO, in connection with its relationship with Renewable Resources; and funds managed by Renewable Resources. Mr. Glazer has represented that he has no financial interest in, and is not involved in the provision of, such legal services. In the calendar years ended December 31, 2007 and December 31, 2008, these entities paid $789,416 and $183,864 respectively, in legal fees and disbursements to Goodwin. In correspondence with the Staff of the Securities and Exchange Commission beginning in August 2006, the Independent Trustees' legal counsel provided the Staff with information regarding Mr. Glazer's relationship with Goodwin and h is other business activities. On September 11, 2007, based on information that had been given to the Staff as of that date, the Staff provided oral no-action assurance consistent with the opinion of the Independent Trustees' legal counsel that Mr. Glazer is not an "interested person" of the Trust.
22
Independent Trustees — (Continued)
| Name, Address, and DOB | Position(s) Held with Trust | Term of Office1 and Length of Time Served | Principal Occupation(s) During Past Five Years | Number of Portfolios in Fund Complex Overseen by Trustee | Other Directorships Held by Trustee | ||||||||||||||||||
| W. Nicholas Thorndike c/o GMO Trust 40 Rowes Wharf Boston, MA 02110 DOB: 03/28/1933 | Trustee | Since March 2005. | Director or trustee of various corporations and charitable organizations, including Courier Corporation (a book publisher and manufacturer) (July 1989 – present); Putnam Funds (December 1992 – June 2004); and Providence Journal (a newspaper publisher) (December 1986 – December 2003). | 59 | Director of Courier Corporation (a book publisher and manufacturer); Member of the Investment Committee of Partners HealthCare System, Inc.3 | ||||||||||||||||||
| Peter Tufano c/o GMO Trust 40 Rowes Wharf Boston, MA 02110 DOB: 04/22/1957 | Trustee | Since December 2008. | Sylvan C. Coleman Professor of Financial Management, Harvard Business School (since 1989). | 59 | Trustee of State Street Navigator Securities Lending Trust (3 Portfolios). | ||||||||||||||||||
1 Each Trustee is elected to serve during the continued lifetime of the Trust until he/she dies, resigns or is removed, or if sooner, until the next meeting of Shareholders called for the purpose of electing Trustees and until the election and qualification of his/her successor.
3 Partners HealthCare System, Inc. is a client of the Manager.
23
Principal Officers:
| Name, Address, and DOB | Position(s) Held with Trust | Term of Office4 and Length of Time Served | Principal Occupation(s) During Past Five Years5 | ||||||||||||
| J.B. Kittredge DOB: 08/22/1954 | President and Chief Executive Officer | Since March 2009. | General Counsel, Grantham, Mayo, Van Otterloo & Co. LLC (October 2005 – Present); Partner, Ropes & Gray LLP. | ||||||||||||
| Sheppard N. Burnett c/o GMO Trust 40 Rowes Wharf Boston, MA 02110 DOB: 10/24/1968 | Treasurer and Chief Financial Officer | Chief Financial Officer since March 2007; Treasurer since November 2006; Assistant Treasurer, September 2004 – November 2006. | Fund Administration Staff, Grantham, Mayo, Van Otterloo & Co. LLC (June 2004 – present); Vice President, Director of Tax, Columbia Management Group (2002 – 2004). | ||||||||||||
| Brent C. Arvidson c/o GMO Trust 40 Rowes Wharf Boston, MA 02110 DOB: 06/26/1969 | Assistant Treasurer | Since August 1998. | Senior Fund Administrator, Grantham, Mayo, Van Otterloo & Co. LLC. | ||||||||||||
| John L. Nasrah c/o GMO Trust 40 Rowes Wharf Boston, MA 02110 DOB: 05/27/1977 | Assistant Treasurer | Since March 2007. | Fund Administrator, Grantham, Mayo, Van Otterloo & Co. LLC (September 2004 – present); Tax Analyst, Bain & Company, Inc. (June 2003 – September 2004). | ||||||||||||
| Mahmoodur Rahman c/o GMO Trust 40 Rowes Wharf Boston, MA 02110 DOB: 11/30/1967 | Assistant Treasurer | Since September 2007. | Fund Administrator, Grantham, Mayo, Van Otterloo & Co. LLC (April 2007 – present); Vice President and Senior Tax Manager, Massachusetts Financial Services Company (January 2000 – April 2007). | ||||||||||||
| Michael E. Gillespie c/o GMO Trust 40 Rowes Wharf Boston, MA 02110 DOB: 02/18/1958 | Chief Compliance Officer | Since March 2005. | Vice President of Compliance (June 2004 – February 2005) and Director of Domestic Compliance (March 2002 – June 2004), Fidelity Investments. | ||||||||||||
4 Each officer is elected to hold such office until his or her successor is duly elected and qualified to carry out the duties and responsibilities of the office, or until he or she resigns or is removed from office.
5 Each of Messrs. Burnett, Arvidson, Bohan, and Pottle serves as an officer and/or director of certain pooled investment vehicles of which GMO or an affiliate of GMO serves as the investment adviser.
24
Principal Officers — (Continued)
| Name, Address, and DOB | Position(s) Held with Trust | Term of Office4 and Length of Time Served | Principal Occupation(s) During Past Five Years5 | ||||||||||||
| Jason B. Harrison c/o GMO Trust 40 Rowes Wharf Boston, MA 02110 DOB: 01/29/1977 | Vice President and Clerk | Vice President since November 2006; Clerk since March 2006. | Legal Counsel, Grantham, Mayo, Van Otterloo & Co. LLC (since February 2006) and Attorney, Ropes & Gray LLP (September 2002 – February 2006). | ||||||||||||
| David L. Bohan c/o GMO Trust 40 Rowes Wharf Boston, MA 02110 DOB: 06/21/1964 | Vice President and Assistant Clerk | Vice President since March 2005; Assistant Clerk since March 2006. | Legal Counsel, Grantham, Mayo, Van Otterloo & Co. LLC. | ||||||||||||
| Gregory L. Pottle c/o GMO Trust 40 Rowes Wharf Boston, MA 02110 DOB: 07/09/1971 | Vice President and Assistant Clerk | Since November 2006. | Legal Counsel, Grantham, Mayo, Van Otterloo & Co. LLC. | ||||||||||||
| Anne K. Trinque c/o GMO Trust 40 Rowes Wharf Boston, MA 02110 DOB: 04/15/1978 | Vice President and Assistant Clerk | Since September 2007. | Legal Counsel, Grantham, Mayo, Van Otterloo & Co. LLC (January 2007 – present); Attorney, Goodwin Procter LLP (September 2003 – January 2007). | ||||||||||||
| Cheryl Wakeham c/o GMO Trust 40 Rowes Wharf Boston, MA 02110 DOB: 10/29/1958 | Vice President and Anti-Money Laundering Officer | Since December 2004. | Manager, Client Service Administration, Grantham, Mayo, Van Otterloo & Co. LLC. | ||||||||||||
4 Each officer is elected to hold such office until his or her successor is duly elected and qualified to carry out the duties and responsibilities of the office, or until he or she resigns or is removed from office.
5 Each of Messrs. Burnett, Arvidson, Bohan, and Pottle serves as an officer and/or director of certain pooled investment vehicles of which GMO or an affiliate of GMO serves as the investment adviser.
25
GMO U.S. Intrinsic Value Fund
(A Series of GMO Trust)
Annual Report
February 28, 2009
For a free copy of the Fund's proxy voting guidelines, shareholders may call 1-617-346-7646 (collect) or visit the Securities and Exchange Commission's website at www.sec.gov. Information regarding how the Fund voted proxies relating to portfolio securities during the most recent 12-month period ended June 30 is available on GMO's website at www.gmo.com, or on the Securities and Exchange Commission's website at www.sec.gov.
The Fund files its complete schedule of portfolio holdings with the Securities and Exchange Commission for the first and third quarter of each fiscal year on Form N-Q, which is available on the Commission's website at www.sec.gov. The Fund's Form N-Q may be reviewed and copied at the Commission's Public Reference Room in Washington, D.C. Information on the operation of the Public Reference Room may be obtained by calling 1-800-SEC-0330. The Fund has a policy with respect to disclosure of portfolio holdings under which it may also make available on GMO's website at www.gmo.com a complete schedule of portfolio holdings.
This report is prepared for the general information of shareholders. It is authorized for distribution to prospective investors only when preceded or accompanied by a prospectus for the GMO Trust, which contains a complete discussion of the risks associated with an investment in this Fund and other important information. The GMO Trust prospectus can be obtained at www.gmo.com.
GMO U.S. Intrinsic Value Fund
(A Series of GMO Trust)
Portfolio Management
Day-to-day management of the Fund's portfolio is the responsibility of the Quantitative Equity team at Grantham, Mayo, Van Otterloo & Co. LLC.
Management Discussion and Analysis of Fund Performance
The GMO U.S. Intrinsic Value Fund returned -40.8% for the fiscal year ended February 28, 2009, as compared to -47.4% for the Russell 1000 Value Index. Consistent with the Fund's investment objectives and policies, the Fund was invested primarily in U.S. equity securities throughout the period.
Stock selection added to returns relative to the Russell 1000 Value Index. Stock selections within Consumer Discretionary, Information Technology, and Consumer Staples added to relative returns while stock selections within Health Care, Utilities, and Telecommunication Services detracted. An overweight in Wal-Mart Stores and underweight positions in GE and Bank of America were among the individual names adding to relative returns. Underweight positions in AT&T and Verizon Communications and an overweight in AIG were among the detractors.
Sector selection added to returns relative to the Russell 1000 Value Index. Sector weightings positively impacting relative performance included an underweight in Financials and overweight positions in Health Care and Energy. Sector weightings negatively impacting relative performance included underweight positions in Utilities and Telecommunication Services and an overweight in Consumer Discretionary.
The views expressed herein are exclusively those of Grantham, Mayo, Van Otterloo & Co. LLC Management as of the date of this report and are subject to change. GMO disclaims any responsibility to update such views. They are not meant as investment advice. References to specific securities are not recommendations of such securities and may not be representative of any GMO portfolio's current or future investments.
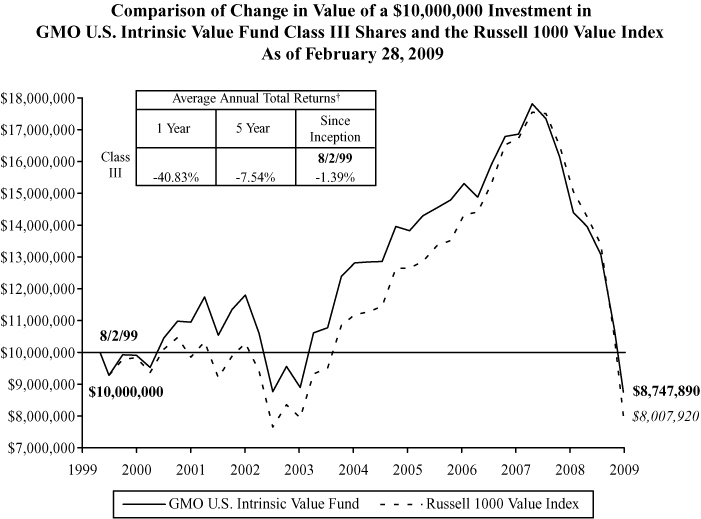
Performance data quoted represents past performance and is not indicative of future results. The investment return and principal value of an investment will fluctuate so that an investor's shares, when redeemed, may be worth more or less than their original cost. Current performance data may be lower or higher than the performance data provided herein. To obtain performance information to the most recent month-end, visit www.gmo.com. Performance shown is net of all fees after reimbursement from the Manager. Returns would have been lower had certain expenses not been reimbursed during the periods shown and do not include the effect of taxes on distributions and redemptions. All information is unaudited.
† The Fund is the successor to the GMO Intrinsic Value Fund, therefore, performance for the periods prior to September 16, 2005 is that of GMO Intrinsic Value Fund.
GMO U.S. Intrinsic Value Fund
(A Series of GMO Trust)
Investments Concentration Summary
February 28, 2009 (Unaudited)
| Asset Class Summary | % of Total Net Assets | ||||||
| Common Stocks | 97.9 | % | |||||
| Short-Term Investments | 2.8 | ||||||
| Rights and Warrants | 0.0 | ||||||
| Futures | (0.1 | ) | |||||
| Other | (0.6 | ) | |||||
| 100.0 | % | ||||||
| Industry Sector Summary | % of Equity Investments | ||||||
| Health Care | 23.2 | % | |||||
| Energy | 22.2 | ||||||
| Consumer Staples | 13.8 | ||||||
| Information Technology | 12.1 | ||||||
| Financials | 10.6 | ||||||
| Consumer Discretionary | 9.4 | ||||||
| Industrials | 5.5 | ||||||
| Telecommunication Services | 1.2 | ||||||
| Materials | 1.2 | ||||||
| Utilities | 0.8 | ||||||
| 100.0 | % | ||||||
1
GMO U.S. Intrinsic Value Fund
(A Series of GMO Trust)
Schedule of Investments
(showing percentage of total net assets)
February 28, 2009
| Shares | Description | Value ($) | |||||||||||||
| COMMON STOCKS — 97.9% | |||||||||||||||
| Consumer Discretionary — 9.2% | |||||||||||||||
| 200 | Abercrombie & Fitch Co.-Class A | 4,398 | |||||||||||||
| 100 | Advance Auto Parts, Inc. | 3,825 | |||||||||||||
| 400 | American Eagle Outfitters, Inc. | 3,904 | |||||||||||||
| 600 | AutoNation, Inc. * | 5,988 | |||||||||||||
| 50 | AutoZone, Inc. * | 7,111 | |||||||||||||
| 700 | Bed Bath & Beyond, Inc. * | 14,910 | |||||||||||||
| 200 | Best Buy Co., Inc. | 5,764 | |||||||||||||
| 100 | Black & Decker Corp. | 2,367 | |||||||||||||
| 300 | Career Education Corp. * | 7,401 | |||||||||||||
| 300 | CBS Corp.-Class B (Non Voting) | 1,281 | |||||||||||||
| 400 | Coach, Inc. * | 5,592 | |||||||||||||
| 3,400 | Comcast Corp.-Class A | 44,404 | |||||||||||||
| 500 | D.R. Horton, Inc. | 4,225 | |||||||||||||
| 100 | Dollar Tree, Inc. * | 3,882 | |||||||||||||
| 300 | Family Dollar Stores, Inc. | 8,232 | |||||||||||||
| 800 | Foot Locker, Inc. | 6,648 | |||||||||||||
| 800 | Gannett Co., Inc. | 2,592 | |||||||||||||
| 200 | Gap (The), Inc. | 2,158 | |||||||||||||
| 200 | Harley-Davidson, Inc. | 2,020 | |||||||||||||
| 100 | Hasbro, Inc. | 2,289 | |||||||||||||
| 5,300 | Home Depot, Inc. | 110,717 | |||||||||||||
| 100 | JC Penney Co., Inc. | 1,533 | |||||||||||||
| 300 | Johnson Controls, Inc. | 3,414 | |||||||||||||
| 600 | Jones Apparel Group, Inc. | 1,614 | |||||||||||||
| 700 | Kohl's Corp. * | 24,598 | |||||||||||||
| 200 | Leggett & Platt, Inc. | 2,286 | |||||||||||||
| 700 | Limited Brands, Inc. | 5,383 | |||||||||||||
| 2,800 | Lowe's Cos., Inc. | 44,352 | |||||||||||||
| 100 | McDonald's Corp. | 5,225 | |||||||||||||
| 100 | Mohawk Industries, Inc. * | 2,259 | |||||||||||||
| 100 | Nordstrom, Inc. | 1,347 | |||||||||||||
| 7 | NVR, Inc. * | 2,329 | |||||||||||||
See accompanying notes to the financial statements.
2
GMO U.S. Intrinsic Value Fund
(A Series of GMO Trust)
Schedule of Investments — (Continued)
(showing percentage of total net assets)
February 28, 2009
| Shares | Description | Value ($) | |||||||||||||
| Consumer Discretionary — continued | |||||||||||||||
| 200 | O'Reilly Automotive, Inc. * | 6,672 | |||||||||||||
| 200 | Omnicom Group, Inc. | 4,806 | |||||||||||||
| 800 | Penske Auto Group, Inc. | 4,528 | |||||||||||||
| 100 | Polo Ralph Lauren Corp. | 3,447 | |||||||||||||
| 200 | RadioShack Corp. | 1,466 | |||||||||||||
| 100 | Sears Holdings Corp. * | 3,676 | |||||||||||||
| 200 | Snap-On, Inc. | 4,718 | |||||||||||||
| 1,700 | Staples, Inc. | 27,115 | |||||||||||||
| 10 | Strayer Education, Inc. | 1,698 | |||||||||||||
| 700 | Target Corp. | 19,817 | |||||||||||||
| 400 | Time Warner Cable, Inc.-Class A * | 7,292 | |||||||||||||
| 200 | Toll Brothers, Inc. * | 3,170 | |||||||||||||
| 600 | Warnaco Group (The), Inc. * | 12,990 | |||||||||||||
| Total Consumer Discretionary | 445,443 | ||||||||||||||
| Consumer Staples — 13.5% | |||||||||||||||
| 3,300 | Altria Group, Inc. | 50,952 | |||||||||||||
| 100 | Avon Products, Inc. | 1,759 | |||||||||||||
| 100 | BJ's Wholesale Club, Inc. * | 2,988 | |||||||||||||
| 100 | Campbell Soup Co. | 2,677 | |||||||||||||
| 1,600 | Coca-Cola Co. (The) | 65,360 | |||||||||||||
| 300 | Colgate-Palmolive Co. | 18,054 | |||||||||||||
| 100 | Costco Wholesale Corp. | 4,234 | |||||||||||||
| 100 | Dean Foods Co. * | 2,045 | |||||||||||||
| 800 | General Mills, Inc. | 41,984 | |||||||||||||
| 100 | Hershey Co. (The) | 3,369 | |||||||||||||
| 100 | HJ Heinz Co. | 3,267 | |||||||||||||
| 100 | JM Smucker Co. (The) | 3,712 | |||||||||||||
| 200 | Kimberly-Clark Corp. | 9,422 | |||||||||||||
| 107 | Kraft Foods, Inc.-Class A | 2,438 | |||||||||||||
| 300 | Kroger Co. (The) | 6,201 | |||||||||||||
| 400 | NBTY, Inc. * | 5,948 | |||||||||||||
| 600 | PepsiAmericas, Inc. | 9,966 | |||||||||||||
| 1,200 | PepsiCo, Inc. | 57,768 | |||||||||||||
See accompanying notes to the financial statements.
3
GMO U.S. Intrinsic Value Fund
(A Series of GMO Trust)
Schedule of Investments — (Continued)
(showing percentage of total net assets)
February 28, 2009
| Shares | Description | Value ($) | |||||||||||||
| Consumer Staples — continued | |||||||||||||||
| 1,300 | Philip Morris International, Inc. | 43,511 | |||||||||||||
| 1,200 | Procter & Gamble Co. (The) | 57,804 | |||||||||||||
| 375 | Supervalu, Inc. | 5,854 | |||||||||||||
| 224 | Tyson Foods, Inc.-Class A | 1,888 | |||||||||||||
| 4,000 | Wal-Mart Stores, Inc. | 196,960 | |||||||||||||
| 2,300 | Walgreen Co. | 54,878 | |||||||||||||
| Total Consumer Staples | 653,039 | ||||||||||||||
| Energy — 21.7% | |||||||||||||||
| 200 | Anadarko Petroleum Corp. | 6,990 | |||||||||||||
| 390 | Apache Corp. | 23,045 | |||||||||||||
| 100 | Baker Hughes, Inc. | 2,931 | |||||||||||||
| 800 | BJ Services Co. | 7,736 | |||||||||||||
| 600 | Chesapeake Energy Corp. | 9,384 | |||||||||||||
| 4,500 | Chevron Corp. | 273,195 | |||||||||||||
| 200 | Cimarex Energy Co. | 3,930 | |||||||||||||
| 100 | Comstock Resources, Inc. * | 3,043 | |||||||||||||
| 4,129 | ConocoPhillips | 154,218 | |||||||||||||
| 300 | Devon Energy Corp. | 13,101 | |||||||||||||
| 200 | ENSCO International, Inc. | 4,916 | |||||||||||||
| 270 | EOG Resources, Inc. | 13,511 | |||||||||||||
| 200 | EXCO Resources, Inc. * | 1,822 | |||||||||||||
| 5,400 | Exxon Mobil Corp. | 366,660 | |||||||||||||
| 100 | Frontier Oil Corp. | 1,365 | |||||||||||||
| 200 | Helmerich & Payne, Inc. | 4,732 | |||||||||||||
| 180 | Hess Corp. | 9,844 | |||||||||||||
| 500 | Nabors Industries Ltd. * | 4,855 | |||||||||||||
| 200 | Newfield Exploration Co. * | 3,866 | |||||||||||||
| 300 | Noble Corp. | 7,377 | |||||||||||||
| 100 | Noble Energy, Inc. | 4,554 | |||||||||||||
| 900 | Occidental Petroleum Corp. | 46,683 | |||||||||||||
| 500 | Oil States International, Inc. * | 6,660 | |||||||||||||
| 500 | Patterson-UTI Energy, Inc. | 4,295 | |||||||||||||
| 300 | Penn Virginia Corp. | 4,155 | |||||||||||||
See accompanying notes to the financial statements.
4
GMO U.S. Intrinsic Value Fund
(A Series of GMO Trust)
Schedule of Investments — (Continued)
(showing percentage of total net assets)
February 28, 2009
| Shares | Description | Value ($) | |||||||||||||
| Energy — continued | |||||||||||||||
| 200 | Pioneer Natural Resources Co. | 2,918 | |||||||||||||
| 200 | Plains Exploration & Production Co. * | 3,828 | |||||||||||||
| 300 | Spectra Energy Corp. | 3,900 | |||||||||||||
| 300 | St. Mary Land & Exploration Co. | 4,074 | |||||||||||||
| 300 | Sunoco, Inc. | 10,035 | |||||||||||||
| 100 | Tidewater, Inc. | 3,532 | |||||||||||||
| 200 | Unit Corp. * | 4,274 | |||||||||||||
| 1,700 | Valero Energy Corp. | 32,946 | |||||||||||||
| 200 | W&T Offshore, Inc. | 1,610 | |||||||||||||
| 100 | Whiting Petroleum Corp. * | 2,330 | |||||||||||||
| Total Energy | 1,052,315 | ||||||||||||||
| Financials — 10.4% | |||||||||||||||
| 2,000 | Allstate Corp. (The) | 33,660 | |||||||||||||
| 200 | American Financial Group, Inc. | 3,112 | |||||||||||||
| 400 | Annaly Capital Management, Inc. REIT | 5,560 | |||||||||||||
| 50 | Apartment Investment & Management Co.-Class A REIT | 261 | |||||||||||||
| 100 | Arch Capital Group Ltd. * | 5,400 | |||||||||||||
| 200 | Associated Banc Corp. | 2,892 | |||||||||||||
| 200 | Assurant, Inc. | 4,080 | |||||||||||||
| 103 | AvalonBay Communities, Inc. REIT | 4,369 | |||||||||||||
| 200 | Axis Capital Holdings Ltd. | 4,476 | |||||||||||||
| 4,110 | Bank of America Corp. | 16,234 | |||||||||||||
| 700 | BB&T Corp. | 11,291 | |||||||||||||
| 70 | BlackRock, Inc. | 6,777 | |||||||||||||
| 200 | Boston Properties, Inc. REIT | 7,418 | |||||||||||||
| 100 | BRE Properties, Inc. REIT | 1,892 | |||||||||||||
| 100 | Capital One Financial Corp. | 1,205 | |||||||||||||
| 1,300 | Chubb Corp. | 50,752 | |||||||||||||
| 300 | Comerica, Inc. | 4,503 | |||||||||||||
| 300 | Endurance Specialty Holdings Ltd. | 6,711 | |||||||||||||
| 600 | Equity Residential REIT | 10,560 | |||||||||||||
| 30 | Essex Property Trust, Inc. REIT | 1,632 | |||||||||||||
| 100 | Everest Re Group Ltd. | 6,513 | |||||||||||||
See accompanying notes to the financial statements.
5
GMO U.S. Intrinsic Value Fund
(A Series of GMO Trust)
Schedule of Investments — (Continued)
(showing percentage of total net assets)
February 28, 2009
| Shares | Description | Value ($) | |||||||||||||
| Financials — continued | |||||||||||||||
| 300 | Fidelity National Title Group, Inc.-Class A | 4,971 | |||||||||||||
| 200 | First American Corp. | 4,634 | |||||||||||||
| 258 | First Horizon National Corp. | 2,366 | |||||||||||||
| 100 | Goldman Sachs Group (The), Inc. | 9,108 | |||||||||||||
| 600 | Hartford Financial Services Group (The), Inc. | 3,660 | |||||||||||||
| 200 | HCC Insurance Holdings, Inc. | 4,390 | |||||||||||||
| 300 | HCP, Inc. REIT | 5,481 | |||||||||||||
| 100 | Health Care REIT, Inc. | 3,077 | |||||||||||||
| 700 | Hudson City Bancorp, Inc. | 7,259 | |||||||||||||
| 200 | JPMorgan Chase & Co. | 4,570 | |||||||||||||
| 500 | KeyCorp. | 3,505 | |||||||||||||
| 100 | Liberty Property Trust REIT | 1,827 | |||||||||||||
| 200 | Mack-Cali Realty Corp. REIT | 3,416 | |||||||||||||
| 1,000 | Marsh & McLennan Cos., Inc. | 17,930 | |||||||||||||
| 300 | Marshall & Ilsley Corp. | 1,374 | |||||||||||||
| 700 | MetLife, Inc. | 12,922 | |||||||||||||
| 500 | Morgan Stanley | 9,770 | |||||||||||||
| 100 | Nationwide Health Properties, Inc. REIT | 2,026 | |||||||||||||
| 575 | Old Republic International Corp. | 5,221 | |||||||||||||
| 100 | PartnerRe Ltd. | 6,190 | |||||||||||||
| 1,600 | Popular, Inc. | 3,600 | |||||||||||||
| 1,600 | Progressive Corp. (The) * | 18,512 | |||||||||||||
| 800 | Protective Life Corp. | 3,024 | |||||||||||||
| 300 | Prudential Financial, Inc. | 4,923 | |||||||||||||
| 300 | Public Storage REIT | 16,644 | |||||||||||||
| 100 | Regency Centers Corp. REIT | 2,698 | |||||||||||||
| 200 | Reinsurance Group of America, Inc. | 5,440 | |||||||||||||
| 100 | RenaissanceRe Holdings Ltd. | 4,503 | |||||||||||||
| 100 | Simon Property Group, Inc. REIT | 3,310 | |||||||||||||
| 200 | StanCorp Financial Group, Inc. | 3,598 | |||||||||||||
| 100 | SunTrust Banks, Inc. | 1,203 | |||||||||||||
| 100 | T. Rowe Price Group, Inc. | 2,274 | |||||||||||||
| 200 | Torchmark Corp. | 4,120 | |||||||||||||
| 2,400 | Travelers Cos. (The), Inc. | 86,760 | |||||||||||||
See accompanying notes to the financial statements.
6
GMO U.S. Intrinsic Value Fund
(A Series of GMO Trust)
Schedule of Investments — (Continued)
(showing percentage of total net assets)
February 28, 2009
| Shares | Description | Value ($) | |||||||||||||
| Financials — continued | |||||||||||||||
| 248 | UDR, Inc. REIT | 1,962 | |||||||||||||
| 300 | Unum Group | 3,054 | |||||||||||||
| 900 | US Bancorp | 12,879 | |||||||||||||
| 200 | Vornado Realty Trust REIT | 6,546 | |||||||||||||
| 700 | W.R. Berkley Corp. | 14,567 | |||||||||||||
| 100 | Wells Fargo & Co. | 1,210 | |||||||||||||
| 100 | Zions Bancorporation | 937 | |||||||||||||
| Total Financials | 504,759 | ||||||||||||||
| Health Care — 22.7% | |||||||||||||||
| 600 | Abbott Laboratories | 28,404 | |||||||||||||
| 800 | AmerisourceBergen Corp. | 25,408 | |||||||||||||
| 2,400 | Amgen, Inc. * | 117,432 | |||||||||||||
| 400 | Biogen Idec, Inc. * | 18,416 | |||||||||||||
| 100 | Bristol-Myers Squibb Co. | 1,841 | |||||||||||||
| 1,100 | Cardinal Health, Inc. | 35,695 | |||||||||||||
| 100 | Covance, Inc. * | 3,798 | |||||||||||||
| 600 | Coventry Health Care, Inc. * | 6,912 | |||||||||||||
| 900 | Eli Lilly & Co. | 26,442 | |||||||||||||
| 300 | Endo Pharmaceuticals Holdings, Inc. * | 5,694 | |||||||||||||
| 300 | Express Scripts, Inc. * | 15,090 | |||||||||||||
| 1,300 | Forest Laboratories, Inc. * | 27,872 | |||||||||||||
| 700 | Gilead Sciences, Inc. * | 31,360 | |||||||||||||
| 100 | Health Net, Inc. * | 1,320 | |||||||||||||
| 100 | Humana, Inc. * | 2,367 | |||||||||||||
| 2,800 | Johnson & Johnson | 140,000 | |||||||||||||
| 1,100 | King Pharmaceuticals, Inc. * | 8,074 | |||||||||||||
| 400 | LifePoint Hospitals, Inc. * | 8,408 | |||||||||||||
| 400 | Lincare Holdings, Inc. * | 8,428 | |||||||||||||
| 1,300 | McKesson Corp. | 53,326 | |||||||||||||
| 200 | Mednax, Inc. * | 5,920 | |||||||||||||
| 600 | Medtronic, Inc. | 17,754 | |||||||||||||
| 700 | Merck & Co., Inc. | 16,940 | |||||||||||||
| 400 | Mylan, Inc. * | 4,972 | |||||||||||||
See accompanying notes to the financial statements.
7
GMO U.S. Intrinsic Value Fund
(A Series of GMO Trust)
Schedule of Investments — (Continued)
(showing percentage of total net assets)
February 28, 2009
| Shares | Description | Value ($) | |||||||||||||
| Health Care — continued | |||||||||||||||
| 100 | Omnicare, Inc. | 2,593 | |||||||||||||
| 100 | Patterson Cos., Inc. * | 1,807 | |||||||||||||
| 12,300 | Pfizer, Inc. | 151,413 | |||||||||||||
| 200 | ResMed, Inc. * | 7,376 | |||||||||||||
| 200 | Stryker Corp. | 6,734 | |||||||||||||
| 6,467 | UnitedHealth Group, Inc. | 127,077 | |||||||||||||
| 200 | Universal Health Services, Inc.-Class B | 7,366 | |||||||||||||
| 2,400 | WellPoint, Inc. * | 81,408 | |||||||||||||
| 1,600 | Wyeth | 65,312 | |||||||||||||
| 1,000 | Zimmer Holdings, Inc. * | 35,020 | |||||||||||||
| Total Health Care | 1,097,979 | ||||||||||||||
| Industrials — 5.4% | |||||||||||||||
| 300 | 3M Co. | 13,638 | |||||||||||||
| 1,700 | Avis Budget Group, Inc. * | 680 | |||||||||||||
| 340 | Burlington Northern Santa Fe Corp. | 19,982 | |||||||||||||
| 100 | CH Robinson Worldwide, Inc. | 4,138 | |||||||||||||
| 100 | Con-way, Inc. | 1,511 | |||||||||||||
| 200 | Copart, Inc. * | 5,404 | |||||||||||||
| 600 | CSX Corp. | 14,808 | |||||||||||||
| 200 | Danaher Corp. | 10,152 | |||||||||||||
| 100 | Fastenal Co. | 3,012 | |||||||||||||
| 700 | General Dynamics Corp. | 30,674 | |||||||||||||
| 1,300 | General Electric Co. | 11,063 | |||||||||||||
| 100 | Kansas City Southern * | 1,769 | |||||||||||||
| 100 | L-3 Communications Holdings, Inc. | 6,765 | |||||||||||||
| 100 | Manpower, Inc. | 2,788 | |||||||||||||
| 400 | Masco Corp. | 2,060 | |||||||||||||
| 700 | Norfolk Southern Corp. | 22,204 | |||||||||||||
| 700 | Owens Corning, Inc. * | 5,845 | |||||||||||||
| 200 | Paccar, Inc. | 5,014 | |||||||||||||
| 250 | Parker-Hannifin Corp. | 8,342 | |||||||||||||
| 100 | Rockwell Collins, Inc. | 3,120 | |||||||||||||
| 100 | Ryder System, Inc. | 2,286 | |||||||||||||
See accompanying notes to the financial statements.
8
GMO U.S. Intrinsic Value Fund
(A Series of GMO Trust)
Schedule of Investments — (Continued)
(showing percentage of total net assets)
February 28, 2009
| Shares | Description | Value ($) | |||||||||||||
| Industrials — continued | |||||||||||||||
| 400 | Southwest Airlines Co. | 2,356 | |||||||||||||
| 300 | Trinity Industries, Inc. | 2,214 | |||||||||||||
| 1,375 | Tyco International Ltd. | 27,569 | |||||||||||||
| 600 | Union Pacific Corp. | 22,512 | |||||||||||||
| 100 | United Parcel Service, Inc.-Class B | 4,118 | |||||||||||||
| 200 | United Technologies Corp. | 8,166 | |||||||||||||
| 100 | Waste Management, Inc. | 2,700 | |||||||||||||
| 300 | Watson Wyatt Worldwide, Inc. | 14,733 | |||||||||||||
| Total Industrials | 259,623 | ||||||||||||||
| Information Technology — 11.8% | |||||||||||||||
| 200 | Accenture Ltd.-Class A | 5,838 | |||||||||||||
| 100 | Affiliated Computer Services, Inc.-Class A * | 4,663 | |||||||||||||
| 6,800 | Cisco Systems, Inc. * | 99,076 | |||||||||||||
| 100 | Citrix Systems, Inc. * | 2,058 | |||||||||||||
| 1,800 | Compuware Corp. * | 10,638 | |||||||||||||
| 700 | Dell, Inc. * | 5,971 | |||||||||||||
| 400 | Diebold, Inc. | 8,848 | |||||||||||||
| 1,300 | eBay, Inc. * | 14,131 | |||||||||||||
| 100 | Fiserv, Inc. * | 3,262 | |||||||||||||
| 300 | Global Payments, Inc. | 9,204 | |||||||||||||
| 30 | Google, Inc.-Class A * | 10,140 | |||||||||||||
| 100 | Hewlett-Packard Co. | 2,903 | |||||||||||||
| 300 | IAC/InterActiveCorp * | 4,479 | |||||||||||||
| 400 | Ingram Micro, Inc.-Class A * | 4,356 | |||||||||||||
| 320 | International Business Machines Corp. | 29,449 | |||||||||||||
| 100 | Lam Research Corp. * | 1,956 | |||||||||||||
| 300 | Lexmark International, Inc. * | 5,142 | |||||||||||||
| 400 | LSI Corp. * | 1,160 | |||||||||||||
| 7,400 | Microsoft Corp. | 119,510 | |||||||||||||
| 700 | NCR Corp. * | 5,544 | |||||||||||||
| 6,200 | Oracle Corp. * | 96,348 | |||||||||||||
| 300 | QLogic Corp. * | 2,766 | |||||||||||||
| 2,800 | Qualcomm, Inc. | 93,604 | |||||||||||||
See accompanying notes to the financial statements.
9
GMO U.S. Intrinsic Value Fund
(A Series of GMO Trust)
Schedule of Investments — (Continued)
(showing percentage of total net assets)
February 28, 2009
| Shares | Description | Value ($) | |||||||||||||
| Information Technology — continued | |||||||||||||||
| 200 | Sybase, Inc. * | 5,436 | |||||||||||||
| 600 | Symantec Corp. * | 8,298 | |||||||||||||
| 700 | �� | Tech Data Corp. * | 12,103 | ||||||||||||
| 400 | Western Digital Corp. * | 5,464 | |||||||||||||
| Total Information Technology | 572,347 | ||||||||||||||
| Materials — 1.2% | |||||||||||||||
| 600 | Cabot Corp. | 6,288 | |||||||||||||
| 800 | Dow Chemical Co. (The) | 5,728 | |||||||||||||
| 100 | FMC Corp. | 4,043 | |||||||||||||
| 500 | Nucor Corp. | 16,825 | |||||||||||||
| 200 | Pactiv Corp. * | 3,166 | |||||||||||||
| 200 | Reliance Steel & Aluminum Co. | 4,758 | |||||||||||||
| 700 | Sealed Air Corp. | 7,812 | |||||||||||||
| 100 | Sigma-Aldrich Corp. | 3,570 | |||||||||||||
| 100 | Vulcan Materials Co. | 4,141 | |||||||||||||
| Total Materials | 56,331 | ||||||||||||||
| Telecommunication Services — 1.2% | |||||||||||||||
| 1,658 | AT&T, Inc. | 39,411 | |||||||||||||
| 652 | Verizon Communications, Inc. | 18,601 | |||||||||||||
| Total Telecommunication Services | 58,012 | ||||||||||||||
| Utilities — 0.8% | |||||||||||||||
| 100 | Dominion Resources, Inc./Virginia | 3,018 | |||||||||||||
| 100 | Energen Corp. | 2,680 | |||||||||||||
| 100 | Exelon Corp. | 4,722 | |||||||||||||
| 300 | FirstEnergy Corp. | 12,768 | |||||||||||||
| 300 | Nicor, Inc. | 9,414 | |||||||||||||
| 100 | PG&E Corp. | 3,822 | |||||||||||||
| 200 | TECO Energy, Inc. | 1,918 | |||||||||||||
| Total Utilities | 38,342 | ||||||||||||||
| TOTAL COMMON STOCKS (COST $7,079,071) | 4,738,190 | ||||||||||||||
See accompanying notes to the financial statements.
10
GMO U.S. Intrinsic Value Fund
(A Series of GMO Trust)
Schedule of Investments — (Continued)
(showing percentage of total net assets)
February 28, 2009
| Shares | Description | Value ($) | |||||||||||||
| RIGHTS AND WARRANTS — 0.0% | |||||||||||||||
| Information Technology — 0.0% | |||||||||||||||
| 800 | Seagate Technology, Inc. Rights (a) (b) * | — | |||||||||||||
| TOTAL RIGHTS AND WARRANTS (COST $0) | — | ||||||||||||||
| SHORT-TERM INVESTMENTS — 2.8% | |||||||||||||||
| Money Market Funds — 2.8% | |||||||||||||||
| 134,429 | State Street Institutional Treasury Money Market Fund-Institutional Class | 134,429 | |||||||||||||
| TOTAL SHORT-TERM INVESTMENTS (COST $134,429) | 134,429 | ||||||||||||||
| TOTAL INVESTMENTS — 100.7% (Cost $7,213,500) | 4,872,619 | ||||||||||||||
| Other Assets and Liabilities (net) — (0.7%) | (34,636 | ) | |||||||||||||
| TOTAL NET ASSETS — 100.0% | $ | 4,837,983 | |||||||||||||
See accompanying notes to the financial statements.
11
GMO U.S. Intrinsic Value Fund
(A Series of GMO Trust)
Schedule of Investments — (Continued)
February 28, 2009
A summary of outstanding financial instruments at February 28, 2009 is as follows:
Futures Contracts
| Number of Contracts | Type | Expiration Date | Contract Value | Net Unrealized Appreciation (Depreciation) | |||||||||||||||
| Buys | |||||||||||||||||||
| 1 | S&P 500 E-Mini Index | March 2009 | $ | 36,710 | $ | (5,162 | ) | ||||||||||||
As of February 28, 2009, for the futures contracts held, the Fund had sufficient cash and/or securities to cover any commitments or margin requirements of the relevant broker or exchange.
Notes to Schedule of Investments:
REIT - Real Estate Investment Trust
* Non-income producing security.
(a) Security valued at fair value using methods determined in good faith by or at the direction of the Trustees of GMO Trust (Note 2).
(b) Bankrupt issuer.
See accompanying notes to the financial statements.
12
GMO U.S. Intrinsic Value Fund
(A Series of GMO Trust)
Statement of Assets and Liabilities — February 28, 2009
| Assets: | |||||||
| Investments, at value (cost $7,213,500) (Note 2) | $ | 4,872,619 | |||||
| Dividends receivable | 18,660 | ||||||
| Receivable for collateral on open futures contracts (Note 2) | 4,950 | ||||||
| Receivable for expenses reimbursed by Manager (Note 3) | 7,874 | ||||||
| Total assets | 4,904,103 | ||||||
| Liabilities: | |||||||
| Payable to affiliate for (Note 3): | |||||||
| Management fee | 1,278 | ||||||
| Shareholder service fee | 617 | ||||||
| Trustees and Chief Compliance Officer of GMO Trust fees | 14 | ||||||
| Payable for variation margin on open futures contracts (Note 2) | 890 | ||||||
| Accrued expenses | 63,321 | ||||||
| Total liabilities | 66,120 | ||||||
| Net assets | $ | 4,837,983 | |||||
| Net assets consist of: | |||||||
| Paid-in capital | $ | 18,707,305 | |||||
| Accumulated undistributed net investment income | 9,338 | ||||||
| Accumulated net realized loss | (11,532,617 | ) | |||||
| Net unrealized depreciation | (2,346,043 | ) | |||||
| $ | 4,837,983 | ||||||
| Net assets attributable to: | |||||||
| Class III shares | $ | 4,837,983 | |||||
| Shares outstanding: | |||||||
| Class III | 1,063,432 | ||||||
| Net asset value per share: | |||||||
| Class III | $ | 4.55 | |||||
See accompanying notes to the financial statements.
13
GMO U.S. Intrinsic Value Fund
(A Series of GMO Trust)
Statement of Operations — Year Ended February 28, 2009
| Investment Income: | |||||||
| Dividends (net of withholding taxes of $26) | $ | 489,816 | |||||
| Interest | 3,285 | ||||||
| Total investment income | 493,101 | ||||||
| Expenses: | |||||||
| Management fee (Note 3) | 63,735 | ||||||
| Shareholder service fee – Class III (Note 3) | 30,839 | ||||||
| Custodian, fund accounting agent and transfer agent fees | 28,756 | ||||||
| Audit and tax fees | 56,133 | ||||||
| Legal fees | 414 | ||||||
| Trustees fees and related expenses (Note 3) | 241 | ||||||
| Miscellaneous | 3,148 | ||||||
| Total expenses | 183,266 | ||||||
| Fees and expenses reimbursed by Manager (Note 3) | (88,251 | ) | |||||
| Expense reductions (Note 2) | (220 | ) | |||||
| Net expenses | 94,795 | ||||||
| Net investment income (loss) | 398,306 | ||||||
| Realized and unrealized gain (loss): | |||||||
| Net realized gain (loss) on: | |||||||
| Investments | (10,616,559 | ) | |||||
| Closed futures contracts | (136,068 | ) | |||||
| Net realized gain (loss) | (10,752,627 | ) | |||||
| Change in net unrealized appreciation (depreciation) on: | |||||||
| Investments | 1,156,559 | ||||||
| Open futures contracts | 39,775 | ||||||
| Net unrealized gain (loss) | 1,196,334 | ||||||
| Net realized and unrealized gain (loss) | (9,556,293 | ) | |||||
| Net increase (decrease) in net assets resulting from operations | $ | (9,157,987 | ) | ||||
See accompanying notes to the financial statements.
14
GMO U.S. Intrinsic Value Fund
(A Series of GMO Trust)
Statement of Changes in Net Assets
| Year Ended February 28, 2009 | Year Ended February 29, 2008 | ||||||||||
| Increase (decrease) in net assets: | |||||||||||
| Operations: | |||||||||||
| Net investment income (loss) | $ | 398,306 | $ | 662,983 | |||||||
| Net realized gain (loss) | (10,752,627 | ) | 606,964 | ||||||||
| Change in net unrealized appreciation (depreciation) | 1,196,334 | (5,075,041 | ) | ||||||||
| Net increase (decrease) in net assets from operations | (9,157,987 | ) | (3,805,094 | ) | |||||||
| Distributions to shareholders from: | |||||||||||
| Net investment income | |||||||||||
| Class III | (435,336 | ) | (613,306 | ) | |||||||
| Net realized gains | |||||||||||
| Class III | — | (2,010,274 | ) | ||||||||
| (435,336 | ) | (2,623,580 | ) | ||||||||
| Net share transactions (Note 7): | |||||||||||
| Class III | (14,926,712 | ) | 60,351 | ||||||||
| Total increase (decrease) in net assets | (24,520,035 | ) | (6,368,323 | ) | |||||||
| Net assets: | |||||||||||
| Beginning of period | 29,358,018 | 35,726,341 | |||||||||
| End of period (including accumulated undistributed net investment income of $9,338 and $49,547, respectively) | $ | 4,837,983 | $ | 29,358,018 | |||||||
See accompanying notes to the financial statements.
15
GMO U.S. Intrinsic Value Fund
(A Series of GMO Trust)
Financial Highlights
(For a Class III share outstanding throughout each period)
| Year Ended February 28/29, | |||||||||||||||||||||||
| 2009 | 2008 | 2007 | 2006 | 2005 | |||||||||||||||||||
| Net asset value, beginning of period | $ | 7.86 | $ | 9.68 | $ | 10.78 | $ | 11.71 | $ | 11.36 | |||||||||||||
| Income (loss) from investment operations: | |||||||||||||||||||||||
| Net investment income (loss)† | 0.14 | 0.18 | 0.21 | 0.26 | 0.20 | ||||||||||||||||||
| Net realized and unrealized gain (loss) | (3.31 | ) | (1.23 | ) | 0.80 | 0.58 | 0.86 | ||||||||||||||||
| Total from investment operations | (3.17 | ) | (1.05 | ) | 1.01 | 0.84 | 1.06 | ||||||||||||||||
| Less distributions to shareholders: | |||||||||||||||||||||||
| From net investment income | (0.14 | ) | (0.18 | ) | (0.23 | ) | (0.28 | ) | (0.19 | ) | |||||||||||||
| From net realized gains | — | (0.59 | ) | (1.88 | ) | (1.49 | ) | (0.52 | ) | ||||||||||||||
| Total distributions | (0.14 | ) | (0.77 | ) | (2.11 | ) | (1.77 | ) | (0.71 | ) | |||||||||||||
| Net asset value, end of period | $ | 4.55 | $ | 7.86 | $ | 9.68 | $ | 10.78 | $ | 11.71 | |||||||||||||
| Total Return(a) | (40.83 | )% | (11.88 | )% | 9.80 | % | 7.73 | % | 9.59 | % | |||||||||||||
| Ratios/Supplemental Data: | |||||||||||||||||||||||
| Net assets, end of period (000's) | $ | 4,838 | $ | 29,358 | $ | 35,726 | $ | 95,605 | $ | 112,411 | |||||||||||||
| Net expenses to average daily net assets | 0.46 | %(b) | 0.46 | % | 0.46 | % | 0.48 | % | 0.48 | % | |||||||||||||
| Net investment income to average daily net assets | 1.94 | % | 1.93 | % | 1.91 | % | 2.31 | % | 1.79 | % | |||||||||||||
| Portfolio turnover rate | 57 | % | 75 | % | 72 | % | 62 | % | 60 | % | |||||||||||||
| Fees and expenses reimbursed by the Manager to average daily net assets: | 0.43 | % | 0.23 | % | 0.13 | % | 0.12 | % | 0.10 | % | |||||||||||||
(a) The total returns would have been lower had certain expenses not been reimbursed during the periods shown and assumes the effect of reinvested distributions.
(b) The net expense ratio does not include the effect of expense reductions.
† Calculated using average shares outstanding throughout the period.
See accompanying notes to the financial statements.
16
GMO U.S. Intrinsic Value Fund
(A Series of GMO Trust)
Notes to Financial Statements
February 28, 2009
1. Organization
GMO U.S. Intrinsic Value Fund (the "Fund") is a series of GMO Trust (the "Trust"). The Fund is registered under the Investment Company Act of 1940, as amended, as an open-end, non-diversified management investment company. The Fund is advised and managed by Grantham, Mayo, Van Otterloo & Co. LLC (the "Manager" or "GMO"). The Trust was established as a Massachusetts business trust under the laws of The Commonwealth of Massachusetts on June 24, 1985. The Declaration of Trust permits the Trustees of the Trust ("Trustees") to create an unlimited number of series of shares ("Funds") and to subdivide Funds into classes.
The Fund seeks long-term capital growth. The Fund seeks to achieve its objective by outperforming the Russell 1000 Value Index. The Fund typically makes equity investments in U.S. companies that issue stocks included in the Russell 1000 Index, and in companies with similar market capitalizations.
2. Significant accounting policies
The following is a summary of significant accounting policies followed by the Fund in the preparation of its financial statements. These policies are in conformity with accounting principles generally accepted in the United States of America ("U.S. GAAP") and have been consistently followed by the Fund in preparing its financial statements. The preparation of financial statements in accordance with U.S. GAAP requires management to make estimates and assumptions that affect the reported amounts and disclosures in the financial statements. Actual results could differ from those estimates. The accounting records of the Fund are maintained in U.S. dollars.
Portfolio valuation
Securities listed on a securities exchange for which market quotations are readily available are valued at the last sale price or official closing price on each business day, or if there is no such reported sale or official closing price, at the most recent quoted bid price. Unlisted securities for which market quotations are readily available are generally valued at the most recent quoted bid price. Debt instruments with a remaining maturity of sixty days or less are generally valued at amortized cost, which approximates fair value. Shares of investment funds are generally valued at their net asset value. Securities for which quotations are not readily available or whose values the Manager has determined to be unreliable are valued at fair value as determined in good faith by the Trustees or persons acting at their direction pursuant to procedures approved by the Trustees. By its nature, a fair value price is a good faith estim ate of the value of a security at a given point in time and may not reflect the value that would be realized if the security were sold. The difference between a fair value price and the value realized upon a sale could be material.
In September 2006, the Financial Accounting Standards Board ("FASB") issued Statement of Financial Accounting Standards No. 157, Fair Value Measurements ("SFAS 157"). SFAS 157 is effective for the Fund's current fiscal year. While the adoption of SFAS 157 does not have an effect on the Fund's net asset value, it
17
GMO U.S. Intrinsic Value Fund
(A Series of GMO Trust)
Notes to Financial Statements — (Continued)
February 28, 2009
does require additional disclosures about fair value measurements. SFAS 157 establishes a three-level hierarchy for disclosure of fair value measurements. The valuation hierarchy is based upon the reliability of inputs to the valuation of the Fund's investments. The three levels are defined as follows:
Level 1 – Valuations based on quoted prices for identical securities in active markets.
Level 2 – Valuations determined using other significant direct or indirect observable inputs.
Level 3 – Valuations based on inputs that are unobservable and significant. The Fund utilized the following fair value techniques on Level 3 investments: The Fund considered certain bankrupt securities to be worthless.
The inputs or methodology used for valuing securities are not necessarily an indication of the risk associated with investing in those securities.
The following is a summary of the fair valuations according to inputs used as of February 28, 2009 in valuing the Fund's investments:
| Asset Valuation Inputs | Investments in Securities | Other Financial Instruments | |||||||||
| Level 1 - Quoted Prices | $ | 4,738,190 | $ | — | |||||||
| Level 2 - Other Significant Observable Inputs | 134,429 | — | |||||||||
| Level 3 - Significant Unobservable Inputs* | — | — | |||||||||
| Total | $ | 4,872,619 | $ | — | |||||||
* Represents the interest in bankrupt securities that have no value at February 28, 2009.
| Liability Valuation Inputs | Investments in Securities | Other Financial Instruments** | |||||||||
| Level 1 - Quoted Prices | $ | — | $ | (5,162 | ) | ||||||
| Level 2 - Other Significant Observable Inputs | — | — | |||||||||
| Level 3 - Significant Unobservable Inputs | — | — | |||||||||
| Total | $ | — | $ | (5,162 | ) | ||||||
** Other financial instruments include futures contracts.
18
GMO U.S. Intrinsic Value Fund
(A Series of GMO Trust)
Notes to Financial Statements — (Continued)
February 28, 2009
The following is a reconciliation of investments in which significant unobservable inputs (Level 3) were used in determining value:
| Investments in Securities | Other Financial Instruments | ||||||||||
| Balance as of February 29, 2008 | $ | 8 | $ | — | |||||||
| Realized gain (loss) | — | — | |||||||||
| Change in unrealized appreciation/depreciation | (8 | ) | — | ||||||||
| Net purchases (sales) | — | — | |||||||||
| Net transfers in and/or out of Level 3 | — | — | |||||||||
| Balance as of February 28, 2009 | $ | — | $ | — | |||||||
Futures contracts
The Fund may purchase and sell futures contracts. Upon entering into a futures contract, the Fund is required to deposit cash, U.S. government and agency obligations, or other liquid assets with the futures clearing broker in accordance with the initial margin requirements of the broker or exchange. In addition, the Fund maintains cash or securities in an amount that at least equals the net amount payable in the event the Fund must deliver the full amount of the contract. Futures contracts are marked to market daily and an appropriate payable or receivable for the change in value ("variation margin") is recorded by the Fund. The payable or receivable is settled on the following business day. Gains or losses are recognized but not considered realized until the contracts expire or are closed. Futures contracts involve, to varying degrees, risk of loss in excess of the variation margin disclosed in the Statement of Assets and Liabi lities. Under some circumstances, futures exchanges may establish daily limits on the amount that the price of a futures contract can vary from the previous day's settlement price, thereby effectively preventing liquidation of unfavorable positions. Losses may arise from changes in the value of the underlying instrument if the Fund is unable to liquidate a futures position due to an illiquid secondary market for the contract or the imposition of price limits, or if counterparties do not perform under the contract terms. Futures contracts are generally valued at the settlement price established each day by the board of trade or exchange on which they are traded. Futures contracts outstanding at the end of the period are listed in the Fund's Schedule of Investments.
Swap agreements
The Fund may enter into various types of swap agreements, including without limitation, interest rate, total return, credit default and variance swap agreements. A swap agreement is an agreement to exchange the return generated by one instrument for the return generated by another instrument. When entering into a swap agreement, the Fund and/or the swap counterparty may post or receive cash or securities as collateral. The party posting the collateral typically receives the interest associated with or payments related to the collateral and has the risk of loss related to the collateral.
19
GMO U.S. Intrinsic Value Fund
(A Series of GMO Trust)
Notes to Financial Statements — (Continued)
February 28, 2009
Interest rate swap agreements involve an exchange by the parties of their respective commitments to pay or right to receive interest, e.g., an exchange of floating rate interest payments for fixed rate interest payments with respect to the notional amount of principal.
Total return swap agreements involve a commitment by one party to pay interest to the other party in exchange for a payment to it from the other party based on the return of a reference instrument (e.g., a security or basket of securities), both based on notional amounts. To the extent the return of the reference instrument exceeds or falls short of the interest payments, one party will receive a payment from or make a payment to the other party.
In a credit default swap agreement, one party makes payments to another party in exchange for the right to receive a specified return if a credit event occurs with respect to a referenced entity or entities. Buying credit default protection reduces the buyer's exposure in the event of an issuer's default (e.g., it reduces risk where a party owns a security issued by or otherwise has exposure to the issuer). Selling credit default protection subjects the seller to exposure to an issuer's default. A seller of credit default protection receives payments in return for its obligation to pay the principal amount of a debt security (or other agreed-upon value) to the other party upon the occurrence of a credit event (e.g., issuer default or similar event). If no credit event occurs, the seller has no payment obligations. For credit default swap agreements on asset-backed securities, a credit event may be triggered by such events as the issuer's failure to pay interest or principal, an agreement of the holders of an asset-backed security to a maturity extension, a rating downgrade on the security or a write-down on the collateral underlying the security. For credit default swap agreements on corporate or sovereign issuers, a credit event may be triggered by such events as the issuer's bankruptcy, failure to pay interest or principal, repudiation/moratorium or restructuring.
Variance swap agreements involve an agreement by two parties to exchange cash flows based on the measured variance (or square of volatility) of a specified underlying asset. One party agrees to exchange a "fixed rate" or strike price payment for the "floating rate" or realized price variance on the underlying asset with respect to the notional amount. At inception, the strike price chosen is generally fixed at a level such that the fair value of the swap is zero. At the expiration date, the amount paid by one party to the other is the difference between the realized price variance of the underlying asset and the strike price multiplied by the notional amount. A receiver of the realized price variance would receive a payment when the realized price variance of the underlying asset is greater than the strike price and would make a payment when that variance is less than the strike price. A payer of the realized price variance woul d make a payment when the realized price variance of the underlying asset is greater than the strike price and would receive a payment when that variance is less than the strike price. This type of agreement is essentially a forward contract on the future realized price variance of the underlying asset.
The Fund prices its swap agreements daily using models that may incorporate quotations from market makers and records the change in value, if any, as unrealized gain or loss in the Statement of Operations.
20
GMO U.S. Intrinsic Value Fund
(A Series of GMO Trust)
Notes to Financial Statements — (Continued)
February 28, 2009
Payments received or made on swap agreements are recorded as realized gain or loss in the Statement of Operations. Gains or losses are realized upon termination of the swap agreements.
Swap agreements often are not actively traded on financial markets. The values assigned to them may differ significantly from the values that would be realized upon termination, and the differences could be material. Entering into swap agreements involves credit, legal, market and documentation risk that is not reflected in the amounts reported in the Statement of Assets and Liabilities. Such risks include the possibility that the party with whom the Fund contracts may default on its obligations to perform or disagree as to the meaning of contractual terms, or that the collateral that party posts may be insufficient or not timely received by the Fund. Credit risk may be particularly acute in an environment where financial services firms are exposed to systemic risks of the type evidenced by the insolvency of Lehman Brothers and subsequent market disruptions. The Fund had no swap agreements outstanding at the end of the period.
Repurchase agreements
The Fund may enter into repurchase agreements. Under a repurchase agreement the Fund acquires a security for cash and obtains a simultaneous commitment from the seller to repurchase the security at an agreed upon price and date. The Fund, through its custodian, takes possession of securities collateralizing the repurchase agreement. The collateral is marked to market daily to ensure that the market value of the underlying assets is at least equal to the amount owed to the Fund in the event of default by the seller. If the seller of a repurchase agreement defaults or enters into insolvency proceedings and the value of the collateral declines, the Fund's recovery of cash may be delayed or limited. The Fund had no repurchase agreements outstanding at the end of the period.
Securities lending
The Fund may lend its securities to qualified brokers. The loans are collateralized with cash or liquid securities with a market value at least equal to the market value of the securities upon entering into the loan. As with other extensions of credit, the Fund may bear the risk of loss with respect to the investment of the collateral, the risk of delay in and/or inability to exercise its rights with respect to the collateral, and the risk of delay in recovery or loss of rights in the loaned securities should the borrower of the securities fail financially. If a loan is collateralized by U.S. government securities, the Fund receives a fee from the borrower. If a loan is collateralized by cash, the Fund typically invests the cash collateral for its own account. For the year from March 1, 2008 through February 28, 2009, the Fund did not participate in securities lending.
Taxes and distributions
The Fund intends to qualify each tax year as a regulated investment company under Subchapter M of the Internal Revenue Code of 1986, as amended (the "Code"). The Fund intends to distribute substantially all of its net investment income and all of its net realized short-term and long-term capital gain, if any, after
21
GMO U.S. Intrinsic Value Fund
(A Series of GMO Trust)
Notes to Financial Statements — (Continued)
February 28, 2009
giving effect to any available capital loss carryforwards for U.S. federal income tax purposes. Therefore, no provision for U.S. federal income or excise tax is necessary.
The Fund's policy is to declare and pay distributions from net investment income, if any, quarterly, and from net realized short-term and long-term capital gain, if any, at least annually. All distributions are paid in shares of the Fund, at net asset value, unless the shareholder elects to receive cash distributions. Distributions to shareholders are recorded by the Fund on the ex-dividend date.
Income and capital gain distributions are determined in accordance with U.S. federal income tax regulations, which may differ from U.S. GAAP. Certain capital accounts in the financial statements are periodically adjusted for permanent differences in order to reflect their tax character. These adjustments have no impact on net assets or net asset value per share. Temporary differences that arise from recognizing certain items of income, expense, gain or loss in different periods for financial statement and tax purposes will reverse at some time in the future. Distributions in excess of net investment income or net realized gains are temporary over-distributions for financial statement purposes resulting from differences in the recognition or classification of income or distributions for financial statement and tax purposes.
U.S. GAAP and tax accounting differences primarily relate to capital loss carryforwards, losses on wash sale transactions and post-October capital losses.
The following reclassification represents the amount necessary to report the stated components of net assets on a tax basis, excluding certain temporary differences, as of February 28, 2009. The financial highlights exclude these adjustments.
| Accumulated Undistributed Net Investment Income | Accumulated Net Realized Loss | Paid-in Capital | |||||||||
| $ | (3,179 | ) | $ | 917,553 | $ | (914,374 | ) | ||||
The tax character of distributions declared to shareholders is as follows:
| 2/28/2009 | 2/29/2008 | ||||||||||
| Ordinary income (including any net short-term capital gain) | $ | 435,336 | $ | 1,421,484 | |||||||
| Net long-term capital gain | — | 1,202,096 | |||||||||
| Total distributions | $ | 435,336 | $ | 2,623,580 | |||||||
Distributions in excess of tax basis earnings and profits, if significant, are reported in the financial statements as a return of capital for tax purposes.
22
GMO U.S. Intrinsic Value Fund
(A Series of GMO Trust)
Notes to Financial Statements — (Continued)
February 28, 2009
As of February 28, 2009, the components of distributable earnings on a tax basis consisted of the following:
| Undistributed ordinary income (including any net short-term capital gain) | $ | 9,338 | |||||
As of February 28, 2009, the Fund elected to defer to March 1, 2009 post-October capital losses of $7,496,232.
As of February 28, 2009, the Fund had capital loss carryforwards available to offset future realized gains if any, to the extent permitted by the Code. Such losses expire as follows:
| 2/28/2017 | $ | (3,433,141 | ) | ||||
| Total | $ | (3,433,141 | ) | ||||
As of February 28, 2009, the approximate cost for U.S. federal income tax purposes and gross and net unrealized appreciation (depreciation) in value of investments were as follows:
| Aggregate Cost | Gross Unrealized Appreciation | Gross Unrealized (Depreciation) | Net Unrealized Appreciation (Depreciation) | ||||||||||||
| $ | 7,821,906 | $ | 21,602 | $ | (2,970,889 | ) | $ | (2,949,287 | ) | ||||||
Utilization of the capital loss carryforwards, post-October capital losses and future losses, if any, realized subsequent to February 28, 2009 could be subject to limitations imposed by the Code related to share ownership activity.
The Fund is subject to the provisions of Financial Accounting Standards Board Interpretation No. 48 ("FIN 48"), Accounting for Uncertainty in Income Taxes — an Interpretation of FASB Statement No. 109. FIN 48 sets forth a minimum threshold for financial statement recognition of a tax position taken or expected to be taken in a tax return that could affect the Fund's financial statements. The Fund did not have any unrecognized tax benefits or liabilities at February 28, 2009, nor did it have any increases or decreases in unrecognized tax benefits or liabilities for the period then ended. The Fund is subject to examination prior to the expiration of the statute of limitations by U.S. federal and state tax authorities for tax returns filed.
Security transactions and related investment income
Security transactions in the financial statements are accounted for on the trade date. Dividend income, net of applicable foreign withholding taxes, if any, is recorded on the ex-dividend date or, if later, when the
23
GMO U.S. Intrinsic Value Fund
(A Series of GMO Trust)
Notes to Financial Statements — (Continued)
February 28, 2009
Fund is informed of the ex-dividend date. Interest income is recorded on the accrual basis and is adjusted for the amortization of premiums and accretion of discounts. Principal on inflation indexed securities, is adjusted for inflation and any increase or decrease is recorded as interest income or loss. Income is not recognized on securities for which collection is not expected. Non-cash dividends, if any, are recorded at the fair market value of the asset received. In determining the net gain or loss on securities sold, the Fund uses the identified cost basis for the purposes of determining the cost basis.
Expenses
The majority of the expenses of the Trust are directly identifiable to an individual fund. Expenses that are not readily identifiable to a specific fund are allocated taking into consideration, among other things, the nature and type of expense and the relative size of the funds.
State Street Bank and Trust Company ("State Street") serves as custodian, fund accounting agent and transfer agent of the Fund. State Street's fees may be reduced by an earnings allowance calculated on the average daily cash balances the Fund maintains with State Street. The Fund receives the benefit of the earnings allowance. In addition, Goldman Sachs Agency Lending, the Fund's securities lending agent, has agreed to reimburse the Fund for certain transactional expenses related to securities lending activity. Credit balances or expense reimbursements used to reduce fees, if any, are reported as a reduction of expenses in the Statement of Operations.
Recently issued accounting pronouncement
In March 2008, FASB issued Statement of Financial Accounting Standards No. 161, Disclosures about Derivative Instruments and Hedging Activities ("SFAS 161"). SFAS 161 is effective for fiscal years and interim periods beginning after November 15, 2008. SFAS 161 requires enhanced disclosures about the Fund's derivative and hedging activities. The Manager is currently evaluating the impact the adoption of SFAS 161 will have on the Fund's financial statement disclosures.
3. Fees and other transactions with affiliates
GMO receives a management fee for the services it provides to the Fund. That fee is paid monthly at the annual rate of 0.31% of average daily net assets. The Fund has adopted a Shareholder Service Plan under which the Fund pays GMO a shareholder service fee for client and shareholder service, reporting, and other support. Pursuant to the Shareholder Service Plan, the shareholder service fee is calculated based on average daily net assets at the annual rate of 0.15% for Class III shares.
Through at least June 30, 2009, the Manager has contractually agreed to reimburse the Fund for Fund expenses incurred through that date to the extent the Fund's total annual operating expenses (excluding "Excluded Expenses", as defined below) exceed 0.31% of the Fund's average daily net assets. Excluded Expenses include shareholder service fees, fees and expenses of the independent Trustees of the Trust, fees and expenses for legal services not approved by the Manager for the Trust, compensation and
24
GMO U.S. Intrinsic Value Fund
(A Series of GMO Trust)
Notes to Financial Statements — (Continued)
February 28, 2009
expenses of the Trust's Chief Compliance Officer ("CCO") (excluding any employee benefits), brokerage commissions, securities lending fees and expenses, interest expense, transfer taxes, and other investment-related costs (including expenses associated with investments in any company that is an investment company or would be an investment company under the 1940 Act, but for the exceptions to the definition of investment company provided in Section 3(c)(1) and 3(c)(7) of the 1940 Act), hedging transaction fees, extraordinary, non-recurring and certain other unusual expenses (including taxes).
The Fund's portion of the fees paid by the Trust to the Trust's independent Trustees and CCO during the year ended February 28, 2009 was $241 and $154, respectively. The compensation and expenses of the CCO are included in miscellaneous expenses in the Statement of Operations. The Fund paid no remuneration to any other officer of the Trust.
4. Purchases and sales of securities
Cost of purchases and proceeds from sales of securities, excluding short-term investments, for the year ended February 28, 2009 aggregated $11,440,737 and $25,465,153, respectively.
5. Guarantees
In the normal course of business the Fund enters into contracts with third-party service providers that contain a variety of representations and warranties and that provide general indemnifications. The Fund's maximum exposure under these arrangements is unknown, as it involves future claims that may be made against the Fund that have not yet occurred. Based on experience, management is of the view that the risk of loss in connection with its indemnification obligations is remote; however, there can be no assurance that such obligations will not result in material liabilities that adversely affect the Fund.
6. Principal shareholders and related parties
As of February 28, 2009, 97.31% of the outstanding shares of the Fund were held by one shareholder. On that date, no other shareholder owned more than 10% of the outstanding shares of the Fund. Redemptions from (or investments into) the Fund or on behalf of this large shareholder may have a material effect on the Fund.
As of February 28, 2009, 0.31% of the Fund's shares were held by senior management of the Manager and GMO Trust officers and 0.48% of the Fund's shares were held by accounts for which the Manager had investment discretion.
25
GMO U.S. Intrinsic Value Fund
(A Series of GMO Trust)
Notes to Financial Statements — (Continued)
February 28, 2009
7. Share transactions
The Declaration of Trust permits the Trust to issue an unlimited number of shares of beneficial interest (without par value). Transactions in Fund shares were as follows:
| Year Ended February 28, 2009 | Year Ended February 29, 2008 | ||||||||||||||||||
| Class III: | Shares | Amount | Shares | Amount | |||||||||||||||
| Shares sold | 3,140 | $ | 16,864 | 183,699 | $ | 1,585,009 | |||||||||||||
| Shares issued to shareholders in reinvestment of distributions | 64,488 | 427,139 | 279,714 | 2,550,763 | |||||||||||||||
| Shares repurchased | (2,738,867 | ) | (15,370,715 | ) | (421,121 | ) | (4,075,421 | ) | |||||||||||
| Net increase (decrease) | (2,671,239 | ) | $ | (14,926,712 | ) | 42,292 | $ | 60,351 | |||||||||||
26
Report of Independent Registered Public Accounting Firm
To the Trustees of GMO Trust and the Shareholders of
GMO U.S. Intrinsic Value Fund:
In our opinion, the accompanying statement of assets and liabilities, including the schedule of investments, and the related statements of operations and of changes in net assets and the financial highlights present fairly, in all material respects, the financial position of GMO U.S. Intrinsic Value Fund (the "Fund") at February 28, 2009, the results of its operations for the year then ended, the changes in its net assets for each of the two years in the period then ended and the financial highlights for each of the five years in the period then ended, in conformity with accounting principles generally accepted in the United States of America. These financial statements and financial highlights (hereafter referred to as "financial statements") are the responsibility of the Fund's management. Our responsibility is to express an opinion on these financial statements based on our audits. We conducted our audits of these financial s tatements in accordance with the standards of the Public Company Accounting Oversight Board (United States). Those standards require that we plan and perform the audit to obtain reasonable assurance about whether the financial statements are free of material misstatement. An audit includes examining, on a test basis, evidence supporting the amounts and disclosures in the financial statements, assessing the accounting principles used and significant estimates made by management, and evaluating the overall financial statement presentation. We believe that our audits, which included confirmation of securities at February 28, 2009 by correspondence with the custodian and brokers, provide a reasonable basis for our opinion.
PricewaterhouseCoopers LLP
Boston, Massachusetts
April 29, 2009
27
GMO U.S. Intrinsic Value Fund
(A Series of GMO Trust)
Fund Expenses
February 28, 2009 (Unaudited)
Expense Examples: The following information is in relation to expenses for the six month period ended February 28, 2009.
As a shareholder of the Fund, you may incur two types of costs: (1) transaction costs, and (2) ongoing costs, including management fees, shareholder service fees, and other Fund expenses. This example is intended to help you understand your ongoing costs (in dollars) of investing in the Fund and to compare these costs with the ongoing costs of investing in other mutual funds.
These examples are based on an investment of $1,000 invested at the beginning of the period and held for the entire period, September 1, 2008 through February 28, 2009.
Actual Expenses
The first line of the table below provides information about actual account values and actual expenses. You may use the information in this line, together with the amount you invested, to estimate the expenses that you paid over the period. Simply divide your account value by $1,000 (for example, a $10,000,000 account value divided by $1,000 = 10,000), then multiply the result by the number in the first line under the heading entitled "Net Expense Incurred" to estimate the expenses you paid on your account during this period.
Hypothetical Example for Comparison Purposes
The second line of the table below provides information about hypothetical account values and hypothetical expenses based on the Fund's actual expense ratio and an assumed rate of return of 5% per year before expenses, which is not the Fund's actual return. The hypothetical account values and expenses may not be used to estimate the actual ending account balance or expenses you paid for the period. You may use this information to compare the ongoing costs of investing in the Fund with other funds. To do so, compare this 5% hypothetical example with the 5% hypothetical examples that appear in the shareholder reports of other funds.
Please note that the expenses shown in the table are meant to highlight your ongoing costs only and do not reflect any transactional costs, such as purchase premiums and redemption fees. Therefore, the second line of the table is useful in comparing ongoing costs only, and will not help you determine the relative total costs of owning different funds. In addition, if these transactional costs were included, your costs would have been higher.
| Annualized Net Expense Ratio | Beginning Account Value | Ending Account Value | Net Expense Incurred* | ||||||||||||||||
| Class III | |||||||||||||||||||
| 1) Actual | 0.46 | % | $ | 1,000.00 | $ | 621.60 | $ | 1.85 | |||||||||||
| 2) Hypothetical | 0.46 | % | $ | 1,000.00 | $ | 1,022.51 | $ | 2.31 | |||||||||||
* Expenses are calculated using the Class's annualized expense ratio for the six months ended February 28, 2009, multiplied by the average account value over the period, multiplied by 181 days in the period, divided by 365 days in the year.
28
GMO U.S. Intrinsic Value Fund
(A Series of GMO Trust)
Tax Information for the Tax Year Ended February 28, 2009 (Unaudited)
The Fund will notify shareholders of amounts for use in preparing 2009 income tax forms in January 2010.
For taxable, non-corporate shareholders, 100.00% of the income and short-term capital gains, if any, distributed in the Fund's fiscal year ended February 28, 2009 represents qualified dividend income subject to the 15% rate category.
For corporate shareholders, 100.00% of the income and short-term capital gains, if any, distributed in the Fund's fiscal year ended February 28, 2009 qualified for the dividends-received deduction.
The Fund hereby designates as qualified interest income with respect to its taxable year ended February 28, 2009, $2,916 or if determined to be different, the qualified interest income of such year.
29
Trustees and Officers (Unaudited)
The following tables list the Trust's Trustees and Officers as of the date of this report; their address and date of birth ("DOB"); their position with the Trust; the length of time holding that position with the Trust; their principal occupation(s) during the past five years; the number of portfolios in the fund complex they oversee; and other directorships they hold in companies subject to registration or reporting requirements of the Securities Exchange Act of 1934 (generally called "public companies") or in registered investment companies. The Trust's Statement of Additional Information ("SAI") includes additional information about the Trust's trustees, including changes subsequent to the date of the report. The SAI is available, without charge, upon request by writing GMO, c/o GMO Trust, 40 Rowes Wharf, Boston, MA 02110.
Independent Trustees:
| Name, Address, and DOB | Position(s) Held with Trust | Term of Office1 and Length of Time Served | Principal Occupation(s) During Past Five Years | Number of Portfolios in Fund Complex Overseen by Trustee | Other Directorships Held by Trustee | ||||||||||||||||||
| Donald W. Glazer, Esq. c/o GMO Trust 40 Rowes Wharf Boston, MA 02110 DOB: 07/26/1944 | Chairman of the Board of Trustees | Chairman of the Board of Trustees since March 2005; Lead Independent Trustee (September 2004 – March 2005); Trustee since December 2000. | Consultant – Law and Business2; Author of Legal Treatises. | 59 | None. | ||||||||||||||||||
1 Each Trustee is elected to serve during the continued lifetime of the Trust until he/she dies, resigns or is removed, or if sooner, until the next meeting of Shareholders called for the purpose of electing Trustees and until the election and qualification of his/her successor.
2 As part of Mr. Glazer's work as a consultant, he provides part-time consulting services to Goodwin Procter LLP ("Goodwin"). Goodwin has provided legal services to Renewable Resources, LLC, an affiliate of GMO; GMO, in connection with its relationship with Renewable Resources; and funds managed by Renewable Resources. Mr. Glazer has represented that he has no financial interest in, and is not involved in the provision of, such legal services. In the calendar years ended December 31, 2007 and December 31, 2008, these entities paid $789,416 and $183,864 respectively, in legal fees and disbursements to Goodwin. In correspondence with the Staff of the Securities and Exchange Commission beginning in August 2006, the Independent Trustees' legal counsel provided the Staff with information regarding Mr. Glazer's relationship with Goodwin and h is other business activities. On September 11, 2007, based on information that had been given to the Staff as of that date, the Staff provided oral no-action assurance consistent with the opinion of the Independent Trustees' legal counsel that Mr. Glazer is not an "interested person" of the Trust.
30
Independent Trustees — (Continued)
| Name, Address, and DOB | Position(s) Held with Trust | Term of Office1 and Length of Time Served | Principal Occupation(s) During Past Five Years | Number of Portfolios in Fund Complex Overseen by Trustee | Other Directorships Held by Trustee | ||||||||||||||||||
| W. Nicholas Thorndike c/o GMO Trust 40 Rowes Wharf Boston, MA 02110 DOB: 03/28/1933 | Trustee | Since March 2005. | Director or trustee of various corporations and charitable organizations, including Courier Corporation (a book publisher and manufacturer) (July 1989 – present); Putnam Funds (December 1992 – June 2004); and Providence Journal (a newspaper publisher) (December 1986 – December 2003). | 59 | Director of Courier Corporation (a book publisher and manufacturer); Member of the Investment Committee of Partners HealthCare System, Inc.3 | ||||||||||||||||||
| Peter Tufano c/o GMO Trust 40 Rowes Wharf Boston, MA 02110 DOB: 04/22/1957 | Trustee | Since December 2008. | Sylvan C. Coleman Professor of Financial Management, Harvard Business School (since 1989). | 59 | Trustee of State Street Navigator Securities Lending Trust (3 Portfolios). | ||||||||||||||||||
1 Each Trustee is elected to serve during the continued lifetime of the Trust until he/she dies, resigns or is removed, or if sooner, until the next meeting of Shareholders called for the purpose of electing Trustees and until the election and qualification of his/her successor.
3 Partners HealthCare System, Inc. is a client of the Manager.
31
Principal Officers:
| Name, Address, and DOB | Position(s) Held with Trust | Term of Office4 and Length of Time Served | Principal Occupation(s) During Past Five Years5 | ||||||||||||
| J.B. Kittredge DOB: 08/22/1954 | President and Chief Executive Officer | Since March 2009. | General Counsel, Grantham, Mayo, Van Otterloo & Co. LLC (October 2005 – Present); Partner, Ropes & Gray LLP. | ||||||||||||
| Sheppard N. Burnett c/o GMO Trust 40 Rowes Wharf Boston, MA 02110 DOB: 10/24/1968 | Treasurer and Chief Financial Officer | Chief Financial Officer since March 2007; Treasurer since November 2006; Assistant Treasurer, September 2004 – November 2006. | Fund Administration Staff, Grantham, Mayo, Van Otterloo & Co. LLC (June 2004 – present); Vice President, Director of Tax, Columbia Management Group (2002 – 2004). | ||||||||||||
| Brent C. Arvidson c/o GMO Trust 40 Rowes Wharf Boston, MA 02110 DOB: 06/26/1969 | Assistant Treasurer | Since August 1998. | Senior Fund Administrator, Grantham, Mayo, Van Otterloo & Co. LLC. | ||||||||||||
| John L. Nasrah c/o GMO Trust 40 Rowes Wharf Boston, MA 02110 DOB: 05/27/1977 | Assistant Treasurer | Since March 2007. | Fund Administrator, Grantham, Mayo, Van Otterloo & Co. LLC (September 2004 – present); Tax Analyst, Bain & Company, Inc. (June 2003 – September 2004). | ||||||||||||
| Mahmoodur Rahman c/o GMO Trust 40 Rowes Wharf Boston, MA 02110 DOB: 11/30/1967 | Assistant Treasurer | Since September 2007. | Fund Administrator, Grantham, Mayo, Van Otterloo & Co. LLC (April 2007 – present); Vice President and Senior Tax Manager, Massachusetts Financial Services Company (January 2000 – April 2007). | ||||||||||||
| Michael E. Gillespie c/o GMO Trust 40 Rowes Wharf Boston, MA 02110 DOB: 02/18/1958 | Chief Compliance Officer | Since March 2005. | Vice President of Compliance (June 2004 – February 2005) and Director of Domestic Compliance (March 2002 – June 2004), Fidelity Investments. | ||||||||||||
4 Each officer is elected to hold such office until his or her successor is duly elected and qualified to carry out the duties and responsibilities of the office, or until he or she resigns or is removed from office.
5 Each of Messrs. Burnett, Arvidson, Bohan, and Pottle serves as an officer and/or director of certain pooled investment vehicles of which GMO or an affiliate of GMO serves as the investment adviser.
32
Principal Officers — (Continued)
| Name, Address, and DOB | Position(s) Held with Trust | Term of Office4 and Length of Time Served | Principal Occupation(s) During Past Five Years5 | ||||||||||||
| Jason B. Harrison c/o GMO Trust 40 Rowes Wharf Boston, MA 02110 DOB: 01/29/1977 | Vice President and Clerk | Vice President since November 2006; Clerk since March 2006. | Legal Counsel, Grantham, Mayo, Van Otterloo & Co. LLC (since February 2006) and Attorney, Ropes & Gray LLP (September 2002 – February 2006). | ||||||||||||
| David L. Bohan c/o GMO Trust 40 Rowes Wharf Boston, MA 02110 DOB: 06/21/1964 | Vice President and Assistant Clerk | Vice President since March 2005; Assistant Clerk since March 2006. | Legal Counsel, Grantham, Mayo, Van Otterloo & Co. LLC. | ||||||||||||
| Gregory L. Pottle c/o GMO Trust 40 Rowes Wharf Boston, MA 02110 DOB: 07/09/1971 | Vice President and Assistant Clerk | Since November 2006. | Legal Counsel, Grantham, Mayo, Van Otterloo & Co. LLC. | ||||||||||||
| Anne K. Trinque c/o GMO Trust 40 Rowes Wharf Boston, MA 02110 DOB: 04/15/1978 | Vice President and Assistant Clerk | Since September 2007. | Legal Counsel, Grantham, Mayo, Van Otterloo & Co. LLC (January 2007 – present); Attorney, Goodwin Procter LLP (September 2003 – January 2007). | ||||||||||||
| Cheryl Wakeham c/o GMO Trust 40 Rowes Wharf Boston, MA 02110 DOB: 10/29/1958 | Vice President and Anti-Money Laundering Officer | Since December 2004. | Manager, Client Service Administration, Grantham, Mayo, Van Otterloo & Co. LLC. | ||||||||||||
4 Each officer is elected to hold such office until his or her successor is duly elected and qualified to carry out the duties and responsibilities of the office, or until he or she resigns or is removed from office.
5 Each of Messrs. Burnett, Arvidson, Bohan, and Pottle serves as an officer and/or director of certain pooled investment vehicles of which GMO or an affiliate of GMO serves as the investment adviser.
33
Item 2. Code of Ethics.
As of February 28, 2009, the registrant has adopted a Code of Ethics that applies to the Principal Executive Officer and Principal Financial Officer pursuant to the Sarbanes-Oxley Act of 2002. During the year ended February 28, 2009, there were no amendments to a provision of the Code of Ethics nor were there any waivers granted from a provision of the Code of Ethics. A copy of the registrant’s Code of Ethics is filed with this Form N-CSR under item 12 (a).
Item 3. Audit Committee Financial Expert.
The registrant’s Board of Trustees has determined that the registrant does not have an “audit committee financial expert” (as such term has been defined in Form N-CSR) serving on its audit committee. The registrant’s Board believes that, although none of its members individually meets all required elements of the definition of an “audit committee financial expert”, the members of the registrant’s audit committee collectively possess the knowledge and experience necessary to execute all of the audit committee’s functions, duties and powers.
Item 4. Principal Accountant Fees and Services. *
(a) AUDIT FEES: The aggregate fees billed to the registrant for professional services rendered by its independent auditors, PricewaterhouseCoopers LLP for the audit of the registrant’s annual financial statements for 2009 and 2008 were $2,305,743 and $2,154,900, respectively.
(b) AUDIT-RELATED FEES: The aggregate fees billed to the registrant in 2009 and 2008 for engagements for audit-related services rendered by PricewaterhouseCoopers LLP that related directly to the operations and financial reporting of the Funds were $21,377 and $64,212, respectively. The aggregate fees billed in 2009 and 2008 to the registrant’s Investment Advisor, and any entity controlling, controlled, or under common control with the Advisor that provides ongoing services to the Funds (each, a “Service Affiliate”) for engagements for audit-related services rendered by PricewaterhouseCoopers LLP that related directly to the operations and financial reporting of the Funds were $528,000 and $250,000, respectively.
(c) TAX FEES: The aggregate fees billed to the registrant in 2009 and 2008 for professional services rendered by PricewaterhouseCoopers LLP for tax compliance, tax advice, and tax planning, including the preparation of Form 1120 RIC, Form 8613 and review of excise tax distribution calculations, were $753,938 and $904,314, respectively. The aggregate fees billed in 2009 and 2008 to the registrant’s Service Affiliates for engagements for tax services rendered by PricewaterhouseCoopers LLP that related directly to the operations and financial reporting of the Funds were $10,680 and $9,800, respectively.
(d) ALL OTHER FEES: No such fees were billed by PricewaterhouseCoopers LLP to the registrant or to the registrant’s Service Affiliates that related directly to the operations and financial reporting of the Funds in 2009 or 2008.
(e) (1) The Audit Committee has adopted an Audit and Non-Audit Services Pre-Approval Policy (the “Policy”), which sets forth the procedures and the conditions pursuant to which services to be performed by the independent auditor are to be preapproved. Under the Policy, the Audit Committee pre-approves, on an annual basis, the following services: (1) the engagement, scope and terms of the annual audit; (2) certain audit-related services; (3) certain tax services that the Committee believes would not impair, and are consistent with the SEC’s rules on, auditor independence; and (4) certain permissible non-audit services that the Committee believes are routine and recurring services and that would not impair, and are consistent with the SEC’s rules, on auditor independence, subject to certain limitations on the projected fees associated with each service. All other types of services not included on the schedule to the policy, or for which the projected fees exceed those provided in the schedule, require the specific pre-approval by the Audit Committee or the Chairperson of the Committee (if timing necessitates that preapproval is required before the Committee’s next regularly scheduled meeting) if they are to be provided by the independent auditor.
(e) (2) None.
(f) Not applicable.
(g) NON-AUDIT FEES: The aggregate fees billed by PricewaterhouseCoopers LLP in 2009 and 2008 for non-audit services rendered to the registrant, the registrant’s Service Affiliates were $1,313,995 and $1,229,726, respectively. For the fiscal year ended February 28, 2009, this amount reflects the amounts disclosed above in Item 4(b),(c),(d), plus $0 in fees billed to the Funds’ Service Affiliates for non-audit services that did not relate directly to the operations and financial reporting of the Funds. For the fiscal year ended February 29, 2008, this amount reflects the amounts disclosed above in Item 4(b),(c),(d), plus $1,400 in fees billed to the Funds’ Service Affiliates for non-audit services that did not relate directly to the operations and financial reporting of the Funds.
(h) The Trust’s Audit Committee has considered whether the provision of non-audit services by registrant’s independent registered public accounting firm to the registrant’s Investment Advisor, and any entity controlling, controlled, or under common control with the Advisor that provided ongoing services to the registrant that were not pre-approved by the Committee (because such services did not relate directly to the operations and financial reporting of the registrant) was compatible with maintaining the independence of the independent registered public accounting firm.
*Includes information regarding all series of GMO Trust.
Item 5. Audit Committee of Listed Registrants.
Not applicable to this filing.
Item 6. Schedule of Investments.
The complete schedule of investments for each series of the registrant is included as part of the annual reports to shareholders filed under Item 1 of this Form N-CSR.
Item 7. Disclosure of Proxy Voting Policies and Procedures for Closed-End Management Investment Companies.
Not applicable to this registrant.
Item 8. Portfolio Managers of Closed-End Management Investment Companies.
Not applicable to this registrant.
Item 9. Purchases of Equity Securities by Closed-End Management Investment Company and Affiliated Purchasers.
Not applicable to this registrant.
Item 10. Submission of Matters to a Vote of Security Holders.
There were no material changes to the procedures by which shareholders may recommend nominees to the registrant’s Board of Trustees.
Item 11. Controls and Procedures.
(a) The registrant’s Principal Executive Officer and Principal Financial Officer have concluded as of a date within 90 days of the filing of this report, based on their evaluation of the registrant’s disclosure controls and procedures (as defined in Rule 30a-3(c) under the Investment Company Act of 1940) that the design and operation of such procedures are effective to provide reasonable assurance that information required to be disclosed by the registrant on Form N-CSR is recorded, processed, summarized, and reported within the time periods specified in the Commission’s rules and forms.
(b) There were no changes in the registrant’s internal control over financial reporting (as defined in Rule 30a-3(d) under the Investment Company Act of 1940) that occurred during the second fiscal quarter of the period covered by this report that has materially affected, or is reasonably likely to materially affect, the registrant’s internal control over financial reporting.
Item 12. Exhibits.
(a)(1) Code of Ethics described in Item 2 is attached hereto as EX-99.CODEETH.
(a)(2) Certifications by the Principal Executive Officer and Principal Financial Officer of the registrant as required by Rule 30a-2(a) under the Investment Company Act of 1940 are attached hereto as EX-99.CERT.
(a)(3) Not applicable to this registrant.
(b) Certifications by the Principal Executive Officer and Principal Financial Officer of the registrant pursuant to Section 906 of the Sarbanes-Oxley Act of 2002 and required by Rule 30a-2(b) under the Investment Company Act of 1940 are attached hereto as EX-99.906CERT.
SIGNATURES
Pursuant to the requirements of the Securities Exchange Act of 1934 and the Investment Company Act of 1940, the registrant has duly caused this report to be signed on its behalf by the undersigned, thereunto duly authorized.
(Registrant) | GMO Trust |
| |
|
|
| |
By (Signature and Title): | /s/ J.B. Kittredge |
| |
| J.B. Kittredge, Chief Executive Officer |
| |
|
|
| |
| Date: | May 6, 2009 |
|
Pursuant to the requirements of the Securities Exchange Act of 1934 and the Investment Company Act of 1940, this report has been signed below by the following persons on behalf of the registrant and in the capacities and on the dates indicated.
By (Signature and Title): | /s/ J.B. Kittredge |
| |
| J.B. Kittredge, Principal Executive Officer |
| |
|
|
| |
| Date: | May 6, 2009 |
|
By (Signature and Title): | /s/ Sheppard N. Burnett |
| |
| Sheppard N. Burnett, Principal Financial Officer |
| |
|
|
| |
| Date: | May 6, 2009 |
|